Source and composition of organic matter in the Bari canyon (Italy): Dense water cascading versus...
19
ARTICLE IN PRESS Source and composition of organic matter in the Bari canyon (Italy): Dense water cascading versus particulate export from the upper ocean T. Tesi a,b, , L. Langone a , M.A. Gon ˜i b , M. Turchetto c , S. Miserocchi a , A. Boldrin c a Istituto Scienze Marine, CNR, Sede di Bologna, Via P. Gobetti 101, 40129 Bologna, Italy b College of Oceanic and Atmospheric Sciences, Oregon State University, Corvallis, OR 97331, USA c Istituto Scienze Marine, CNR, Sede di Venezia, Castello 1364/A, 30122 Venice, Italy article info Article history: Received 28 December 2007 Received in revised form 20 March 2008 Accepted 24 March 2008 Available online 3 April 2008 Keywords: Bari canyon Dense water cascading Organic matter CuO oxidation OC export Lateral advection abstract Recent studies in the southern Adriatic Sea have shown that dense water cascading is an effective off-shelf transport mechanism. In order to evaluate the relative importance of different processes affecting the down-slope transfer of organic matter (OM), a multi- proxy biogeochemical study was carried out in the southern Adriatic. Three sediment traps were deployed on the southern slope in March 2004 for 1 year at 35 m above the seabed. Surficial sediments were collected on the shelf and slope along a shore-normal transect. Suspended material in the water column at different water depths was collected along nine shore-normal transects. Organic carbon (OC), total nitrogen (TN), carbon isotopic composition (d 13 C and D 14 C) and CuO reaction products were used to identify the OM sources and to asses the relative importance of vertical and lateral particulate fluxes. Both sinking particulates from the euphotic zone and advected material from the seafloor were collected by the moored instrumentations. During low-mass fluxes, the trapped material exhibited the highest D 14 C values (from 162.0% to +42.3%) and OC contents (from 1.13% to 2.17%) while the lignin displayed the lowest content (from 0.160 to 0.285 mg 100 mg 1 OC). However, during dense water cascading events, the down-slope particulate flux showed different compositional features. In this period the trapped material displayed the most depleted D 14 C values (from 275.3% to 171.3%), the lowest OC content (from 0.87% to 1.31%), and the highest lignin content (from 0.230 to 379 mg 100 mg 1 OC). Holocene sea-level rise has drastically reduced sediment availability to the Bari canyon, and this in turn has affected the OC composition of the material funneled toward the deep Adriatic Sea. Parameters based on lignin CuO products suggest that the terrestrial material exported down the slope is very different from riverine inputs and inner shelf sediments. This indicates that neither river floods nor sediment resuspension from the inner shelf contributes directly to the down-slope flux. Rather, the material collected in the sediment traps exhibits an OM composition comparable to the surface sediments collected in the southern outer shelf. This correspondence suggests that resuspension of sediments by bottom currents in the southern outer shelf significantly contribute to down-slope OM transfer. Finally, the presence of lignin phenols in all cups indicates that lateral fluxes were constantly active on the slope throughout the deployment. & 2008 Elsevier Ltd. All rights reserved. Contents lists available at ScienceDirect journal homepage: www.elsevier.com/locate/dsri Deep-Sea Research I 0967-0637/$ - see front matter & 2008 Elsevier Ltd. All rights reserved. doi:10.1016/j.dsr.2008.03.007 Corresponding author at: Istituto Scienze Marine, CNR, Sede di Bologna, Via P. Gobetti 101, 40129 Bologna, Italy. E-mail address: [email protected] (T. Tesi). Deep-Sea Research I 55 (2008) 813– 831
-
Upload
independent -
Category
Documents
-
view
0 -
download
0
Transcript of Source and composition of organic matter in the Bari canyon (Italy): Dense water cascading versus...
ARTICLE IN PRESS
Contents lists available at ScienceDirect
Deep-Sea Research I
Deep-Sea Research I 55 (2008) 813– 831
0967-06
doi:10.1
� Cor
E-m
journal homepage: www.elsevier.com/locate/dsri
Source and composition of organic matter in the Bari canyon (Italy):Dense water cascading versus particulate export fromthe upper ocean
T. Tesi a,b,�, L. Langone a, M.A. Goni b, M. Turchetto c, S. Miserocchi a, A. Boldrin c
a Istituto Scienze Marine, CNR, Sede di Bologna, Via P. Gobetti 101, 40129 Bologna, Italyb College of Oceanic and Atmospheric Sciences, Oregon State University, Corvallis, OR 97331, USAc Istituto Scienze Marine, CNR, Sede di Venezia, Castello 1364/A, 30122 Venice, Italy
a r t i c l e i n f o
Article history:
Received 28 December 2007
Received in revised form
20 March 2008
Accepted 24 March 2008Available online 3 April 2008
Keywords:
Bari canyon
Dense water cascading
Organic matter
CuO oxidation
OC export
Lateral advection
37/$ - see front matter & 2008 Elsevier Ltd
016/j.dsr.2008.03.007
responding author at: Istituto Scienze Marin
ail address: [email protected] (T
a b s t r a c t
Recent studies in the southern Adriatic Sea have shown that dense water cascading is an
effective off-shelf transport mechanism. In order to evaluate the relative importance of
different processes affecting the down-slope transfer of organic matter (OM), a multi-
proxy biogeochemical study was carried out in the southern Adriatic. Three sediment
traps were deployed on the southern slope in March 2004 for 1 year at 35 m above the
seabed. Surficial sediments were collected on the shelf and slope along a shore-normal
transect. Suspended material in the water column at different water depths was collected
along nine shore-normal transects. Organic carbon (OC), total nitrogen (TN), carbon
isotopic composition (d13C and D14C) and CuO reaction products were used to identify the
OM sources and to asses the relative importance of vertical and lateral particulate fluxes.
Both sinking particulates from the euphotic zone and advected material from the seafloor
were collected by the moored instrumentations. During low-mass fluxes, the trapped
material exhibited the highest D14C values (from �162.0% to +42.3%) and OC contents
(from 1.13% to 2.17%) while the lignin displayed the lowest content (from 0.160 to
0.285 mg 100 mg�1 OC). However, during dense water cascading events, the down-slope
particulate flux showed different compositional features. In this period the trapped
material displayed the most depleted D14C values (from �275.3% to�171.3%), the lowest
OC content (from 0.87% to 1.31%), and the highest lignin content (from 0.230 to
379 mg 100 mg�1 OC). Holocene sea-level rise has drastically reduced sediment
availability to the Bari canyon, and this in turn has affected the OC composition of the
material funneled toward the deep Adriatic Sea. Parameters based on lignin CuO products
suggest that the terrestrial material exported down the slope is very different from
riverine inputs and inner shelf sediments. This indicates that neither river floods nor
sediment resuspension from the inner shelf contributes directly to the down-slope flux.
Rather, the material collected in the sediment traps exhibits an OM composition
comparable to the surface sediments collected in the southern outer shelf. This
correspondence suggests that resuspension of sediments by bottom currents in the
southern outer shelf significantly contribute to down-slope OM transfer. Finally, the
presence of lignin phenols in all cups indicates that lateral fluxes were constantly active
on the slope throughout the deployment.
& 2008 Elsevier Ltd. All rights reserved.
. All rights reserved.
e, CNR, Sede di Bologna, Via P. Gobetti 101, 40129 Bologna, Italy.
. Tesi).

ARTICLE IN PRESS
T. Tesi et al. / Deep-Sea Research I 55 (2008) 813–831814
1. Introduction
The long-term burial of organic carbon (OC) in theocean is key to understanding the global CO2 cycle(Berner, 1982; Hedges and Keil, 1995). In particular, theremoval of particulate OC from the active global carboncycle acts as an important control on atmospheric CO2
concentrations on the geological scale (Berner, 1982). Fordecades, numerous research projects have been carriedout in different oceanic environments to investigate thefactors controlling carbon sequestration and burial effi-ciency in deltas, shelves, slopes, and deep seas. Severalstudies agree on the limited role of deep-sea burialbecause organic matter (OM) produced in the euphoticzone decomposes before it reaches the seafloor (Emersonand Hedges, 1988; Stahl et al., 2004). However, a survey ofrecent literature reveals a lack of general consensus on theburial efficiency in the deltas, shelves and slopes. Hedgesand Keil (1995), Wollast (1998), and Burdige (2005)estimate that burial in the prodelta and shelf accountsfor over 80% of the OC burial in the ocean. Other studiesindicate that OM is efficiently recycled in shallowenvironments (e.g. Keil et al., 1997; Aller and Blair,2004), and that the role of shelves as sinks for OC islimited as a result of the erosion of shelf deposits duringlow stands in sea-level (de Haas et al., 2002). Conversely,throughout low stands, gravity-driven mechanisms (e.g.turbidity currents, debris flows) dominated sedimenttransport through submarine canyons, funneling largevolumes of OC toward the deep ocean. Although Holocenesea-level rise has drastically reduced the supply ofsediments, submarine canyons have been identified aspreferential conduits for the transfer of particulatematerial from the shelf to the deep environments (Kollaand Perlmutter, 1993; Puig et al., 2003; Canals et al., 2006;Palanques et al., 2006; Trincardi et al., 2007). For thesereasons, other studies have suggested that continentalslopes and deep-sea fans are the main sinks for OC on ageological scale (de Haas et al., 2002; Galy et al., 2007).
In the assessment of the efficiency of slope and deep-sea fans in sequestering OC, an important consideration isthe chemical composition of the particulate material thatis exported from the shelf. Since the OM exhibits aheterogeneous mixture of different compounds, microbialdegradation can significantly transform the sedimentaryOM by preferentially degrading the most labile fractions,in turn affecting burial efficiency. Several studies carriedout in canyons have described the mechanisms control-ling the shelf-slope exchange (Puig et al., 2003; Mullen-bach et al., 2004; Palanques et al., 2005, 2006; Paull et al.,2002, 2003; Trincardi et al., 2007), although the biogeo-chemical features of the transferred material are poorlyunderstood. Many studies have limited their investigationto OC content without characterizing the OC composition,which is necessary to discern between export from theeuphotic zone and lateral advection associated withsediment transport. In this study, we use a suite ofbiomarkers to investigate the OC composition of theparticulate material collected by means of sediment trapsin the Bari canyon. This canyon, located in the southernAdriatic Sea, bisects a relatively steep continental slope
several hundred km away from the nearest major rivermouth (Trincardi et al., 2007). Despite the great distancefrom a direct riverine sediment source, the Bari canyon isstill active because of dense water cascading and bottomcurrents (Trincardi et al., 2007; Turchetto et al., 2007). Thespatial and temporal variability of the mass fluxes in theBari canyon were initially characterized by Turchetto et al.(2007) by means of three moorings equipped withsediment traps and current meters. The authors carriedout bulk isotopic and elemental analyses on the sedimenttraps samples. In order to better resolve the compositionof OC after dense water formation in the Bari canyon,specific samples were selected, based on the previous datasets, among the sediment trap samples, and complimen-tary analyses were carried out (i.e. alkaline CuO oxidationsand 14C analyses). In addition, surficial sediments along ashore-normal transect and particulate material in thewater column have been analysed to better understandthe characteristics of vertical versus lateral fluxes. Thesedatasets were then compared with the biogeochemicaldistributions observed in Adriatic surficial sediments(both the Po prodelta and the Holocene mud-wedge)and riverine sediments to thoroughly evaluate theconnection between coastal systems and the deep-seaenvironment.
2. The Adriatic Sea
2.1. Geological setting
The Adriatic Sea is a narrow epicontinental basin (ca.200�800 km2) situated in the northern portion of theMediterranean Sea. The basin is characterized by a lowlongitudinal gradient in the north (�0.021), and arelatively steep shelf in the center (�0.51) where thewater depth reaches 260 m water depth (Cattaneo et al.,2003) (Fig. 1). The southern Adriatic exhibits a broad shelfjust below the Gargano promontory. Besides this area, thesouthern shelf is relatively narrow. The southern Adriaticreaches a depth of �1200 m and is flanked on the westernside by a steep slope incised by the Bari canyon.
2.2. Oceanographic setting
The Adriatic Sea is characterized by a cyclonic surfacecirculation driven by buoyancy effects and wind patterns(Malanotte Rizzoli and Bergamasco, 1983), which generatea southward flow along the eastern Italian shore known asthe Western Adriatic Coastal Current (WACC; Zavatarelliet al., 2002). Three water masses are characteristic of thewestern margin: Levantine Intermediate Water (LIW),North Adriatic Deep Water (NAdDW) and South AdriaticDeep Water (SADW). The LIW originates in the Levantinebasin (Greece) through evaporation in the summer andcooling in the winter (Lascaratos et al., 1999). This saltywater mass flows into the southern Adriatic through theOtranto Strait on the eastern side and flows out along thecontinental slope on the western side of the basin (Mancaet al., 2002; Fig. 1).

ARTICLE IN PRESS
Fig. 1. (a) Bathymetry of the Adriatic Sea. Arrows display the surficial and deep circulation. The figure shows the locations of rivers and the mud-wedge
extension (Cattaneo et al., 2003); (b) Map of the study area in the southern Adriatic. Cross, open square and triangle indicate the location of the moorings
in the Bari canyon. Open circles display the location of surface sediment samples.
T. Tesi et al. / Deep-Sea Research I 55 (2008) 813–831 815
During the winter, the northern Adriatic is subject tointense cooling associated with local wind forcing (Borawind) (Fig. 1). The resulting water mass, NAdDW, is denseenough to sink and move southward (Manca et al., 2002;Fig. 1). In the early spring, this water mass reaches thevicinity of Bari, where it encounters an offshore orientedcanyon (Bari canyon); once on the shelf-break, because ofits density, the NAdDW sinks along the slope (dense watercascading), simultaneously mixing with surroundingwaters (Mantziafou and Lascaratos, 2004). In particular,NAdDW interacts dynamically with LIW, producing severaldistinct bottom-current sediment features on the southernmargin (i.e. furrows, Trincardi et al., 2007). Further south,NAdDW mixes with SADW, formed by open-ocean verticalconvection (Vilibic and Supic, 2005). The SADW and NAdWtogether form the Adriatic Deep Water (ADW), whichcontributes to the ventilation of deep water in the wholeEastern Mediterranean (Mantziafou and Lascaratos, 2004).
2.3. River inputs and late-Holocene mud-wedge
The western Adriatic is characterized by the presenceof multiple fluvial sources, also known as a line-sourcesystem (Palinkas and Nittrouer, 2007). Among theserivers, the Po river, at 673 km long, is the largest andsupplies �13 MT yr�1 of the sediments to the basin(Syvistski and Kettner, 2007). The Po is characterized bytwo annual floods, associated with rainfall in autumn andsnowmelt in spring. To the south of the Po, an array ofsteep rivers drains the Appennine Mountains along thewestern Adriatic coast. These rivers, characterized byelevated sediment yields, contribute approximately half ofthe sediment supplied to the western Adriatic margin
(Syvistski and Kettner, 2007). In the western Adriatic, aforestepping sigmoid has developed along the coast inlate-Holocene high-stand conditions in response to sedi-ment delivery (Correggiari et al., 2001). This sedimentarydeposit includes a continuous belt of deltaic and shallow-marine sediments: the Po delta system in the northAdriatic, the central Appennine mud-wedge and theGargano subaqueous delta located in the south, distantfrom a direct river source (Cattaneo et al., 2003).
The western Adriatic is characterized by intensesediment transport processes. Rapid accumulation afterthe Po floods (Fox et al., 2004) generates an ephemeraldeposit of sediments that are subsequently remobilized bywaves to form density flows (Traykovski et al., 2007).Furthermore, the sediments travel southward in a series ofwind-induced resuspension events promoted by the Boraand Scirocco winds (Fain et al., 2007). On its waysouthward, the deposit is augmented by material fromthe Appennine rivers (Syvistski and Kettner, 2007). As aresult, along the mud-wedge, the greatest accumulationrates are in the Po prodelta and near the Garganopromontory; the latter due to ‘‘conveyor-belt’’ transport(Frignani et al., 2005; Palinkas and Nittrouer, 2007). Basedon a recent balance between sediment accumulation andriverine sediment supply, �4.6 Tg of sediment leaves thewestern Adriatic margin (Frignani et al., 2005); a portionof this material is thought to be funneled toward the deepocean by the Bari canyon (Turchetto et al., 2007).
2.4. OC source
Terrestrial material is the major OC source in Poprodelta sediments (Miserocchi et al., 2007; Tesi et al.,

ARTICLE IN PRESS
T. Tesi et al. / Deep-Sea Research I 55 (2008) 813–831816
2007, 2008), accounting for over 90% of the OM in theform of woody debris and soil-derived OC (Tesi et al.,2007, 2008). Conversely, the uppermost layer of the watercolumn is dominated by estuarine and marine phyto-plankton (Boldrin et al., 2005; Tesi et al., 2007a). Along thewestern Adriatic shelf, the buoyant discharge plumesupplies land-derived nutrients that promote intensephytoplankton growth in the inshore regions (Pennaet al., 2004; Tesi et al., 2007). However, land-derivedterrigenous material, in the form of soil-derived OC, is stillthe dominant OC source in the surficial Holocene mud-wedge, accounting for over 70% of the OM (Tesi et al.,2007). The terrigenous OM contribution in the surfacesediments decreases in the southern Adriatic as aconsequence of limited river inputs. In this area, theconvection that promotes SADW formation causes heatloss from the surface layer, resulting in overturning of thewater column. This deep mixing brings dissolved nutri-ents into the euphotic zone, which stimulate phytoplank-ton blooms in the early spring (Artegiani et al., 1997a, b;Gacic et al., 2002; Civitarese et al., 2005).
3. Methods
3.1. Sampling
3.1.1. Moorings
Three moorings were deployed in the Bari CanyonSystem from March 2004 to March 2005 (Fig. 1). Eachmooring was equipped with a sequential PPS3 Technicapsediment trap (12 collecting cups) at �35 m above theseafloor and an Anderaa RCM7 current meters at 5 mbelow the sediment trap. Current meters were equippedwith sensors to measure conductivity, pressure andtemperature. All stations were located approximately at600 m water depth (Fig. 1). The first mooring (station A)was deployed as a reference station on the open slope�10 km north of the canyon. The other arrays weredeployed within the canyon, one in each canyon branch,station B in the northern one and station C in the southernone, at a distance of 4.3 km from each other. Only a limitednumber of collecting cups were recovered for the station Cbecause of the loss of mooring due to fish activity. Forfurther details concerning the moored instrumentationsee Turchetto et al. (2007).
3.1.2. Hydrological survey
In July 2004, a hydrological survey was carried outalong nine shore-normal transects located in the southernAdriatic (Fig. 2a). The stations included inner-shelf, outer-shelf and slope. The shallowest station was at 20 m waterdepth. The deepest one was at 1196 m water depth(Table 1). At each station, water samples were collectedat the surface (1 m below the sea surface), bottom (2–3 mabove the seafloor) and intermediate levels within thewater column with Niskin bottles. Water samples werefiltered on pre-combusted 25 mm Whatman GF/F glassfibre filters. Vertical continuous profiles of temperature,conductivity, fluorescence and transmittance were per-formed using a Sea-Bird CTD probe equipped with a
SeaTech fluorometer. Fluorescence is in arbitrary units(a.u.). For specific particulars regarding the hydrologicalsurvey see Turchetto et al. (2007).
3.1.3. Sediment cores
In July 2004, four sediment samples were collectedalong a shore-normal transect by means of a short gravitycorer SW-104 designed to preserve the water–sedimentinterface. The first three stations were located on the shelf,whereas the last one was in the canyon just below themooring C (Fig. 1). All sediment cores were refrigeratedduring transport back to the laboratory.
3.2. Pre-treatment
To prevent OM degradation during deployment, trapsample cups were filled with 5% formaldehyde solutionbuffered in filtered seawater prior to deployment. In thelab, samples were processed after recovery according toHeussner et al. (1990). The main steps of the procedurewere manual removal of swimming organisms under adissecting microscope and subsampling using a precisionwet splitter. Subsamples for total mass flux (TMF)determinations were filtered through pre-weighed0.45 mm Millipore HA filters, rinsed with distilled waterand dried at 60 1C for 24 h, then weighed. For organic OCand nitrogen (N) content, and OC stable isotopes (d13C),samples were filtered through pre-combusted 25 mmWhatman GF/F glass fiber filters, which were stored at�20 1C until analysis. In the laboratory, sediment coreswere sub-sampled every cm for geochronological, biogeo-chemical and sedimentological analyses.
3.3. Analytical methods
3.3.1. Elemental and isotopic analyses
Weighed sediment samples were placed and acidifiedin silver cups. The GF/F filters (suspended material andsediment trap samples) were acidified and placed in tincups. The samples were then analyzed for OC contents(mg C g�1 dry wt sample salt-free) with a FISONS NA2000Elemental Analyzer. Atropina (Carlo Erba Instruments)was used as reference standard. The d13C measurementswere made with a FINNIGAN Delta Plus mass spectro-meter coupled with the Elemental Analyzer through aCONFLO interface. The CO2 produced during the combus-tion of samples was used for the isotopic analysis.Uncertainties were lower than 70.2%, as determinedfrom routine replicate measurements of the IAEA refer-ence sample IAEA-CH7 (polyethylene, �31.8% versusPDB).
3.3.2. CuO oxidation products
Oxidations with CuO were performed on a selectednumber of sediment trap samples and surficial sedimentsamples. The sediment trap samples were chosen toinvestigate the temporal variability during high and lowmass fluxes. The CuO oxidations were carried out accord-ing to Goni and Montgomery (2000). Briefly, about400–500 mg of material was oxidized using CuO under

ARTICLE IN PRESS
Fig. 2. Surficial variability of salinity, fluorescence, TSM, d13C, and POC along nine shore-normal transects in the southern Adriatic Sea (�1 m depth).
T. Tesi et al. / Deep-Sea Research I 55 (2008) 813–831 817
alkaline conditions (2 N NaOH) at 152 1C for 90 min in N2-pressurized Teflon vessels. After the oxidation, knownamounts of trans-cinnamic acid and ethylvanillin wereadded to the solution as recovery standards. The aqueoussolutions were then acidified to pH 1 with concentratedHCl and extracted with ethyl acetate under a continuousN2 stream and redissolved in pyridine. The yields ofindividual lignin and non-lignin oxidation products werequantified by GC–MS using selective ion monitoring.Before GC analyses, the CuO oxidation products werederivatized with bis(trimethylsilyl) trifluoroacetamide+1%trimethylchlorosilane at 60 1C for 10 min. The compoundswere separated chromatographically in a 30 m�250 mmDB1 (0.25-mm thick film) capillary GC column, using aninitial temperature of 100 1C, a temperature ramp of4 1C min�1 and a final temperature of 300 1C. The yieldsof the major lignin phenols were calculated using theindividual response factors derived from periodically
injected mixtures of commercial standards. Non-ligninproducts (for which commercial standards were notavailable) were quantified using the response factor oftrans-cinnamic acid.
Both sediments and sediment trap samples yield acomplex suite of CuO reaction products that include lignin-derived phenols (monomers and dimers), lipid-derivedcarboxylic acids (n-fatty acids and dicarboxylic acids),hydroxy benzoic acids and products from proteins andpolysaccharides. The origins and chemical precursors ofthese products have been discussed in previous publica-tions (Hedges and Mann, 1979a, b; Goni and Hedges, 1992,1995; Goni et al., 1998, 2000; Gordon and Goni, 2003;Dickens et al., 2007) and are listed in Table 2 with allabbreviations. All CuO reaction products are reported ascarbon-normalized yield (mg 100 mg�1 OC). The sum of thelignin phenolic monomers (V+S+C) is lambda (L) and Dimis the sum of the lignin phenolic dimers.

ARTICLE IN PRESS
Table 1Elemental and isotopic composition, fluorescence and physical data collected in the water column along nine shore-normal transects in the southern
Adriatic Sea
Water depth
(m)
Temperature
(1C)
Salinity Fluorometer
(a.u.)
TSM (mg l�1) POC (mg l�1) PTN (mg l�1) OC (%) TN (%) d13C (%) OC:TN
0– 10
Mean 25.56 37.85 0.29 0.59 90.69 15.14 24.32 3.97 �21.3 7.1
St dev 0.93 0.54 0.17 0.54 44.29 7.41 17.22 2.79 0.7 0.7
Max 27.11 38.86 1.36 3.41 211.18 37.20 68.66 10.80 �19.7 8.7
Min 19.38 36.08 0.09 0.12 45.23 6.48 4.50 0.84 �22.7 5.9
10– 50
Mean 18.90 38.59 0.28 0.47 77.45 13.30 16.53 2.89 �21.8 6.7
St dev 3.40 0.41 0.17 0.50 38.99 5.63 13.23 2.27 0.9 0.7
Max 26.32 38.93 1.72 5.04 180.09 26.68 55.04 9.34 �19.7 8.3
Min 14.01 36.86 0.09 0.04 37.74 6.90 3.61 0.64 �23.0 5.8
50– 200
Mean 14.59 38.88 0.32 0.40 46.07 8.50 15.34 2.78 �22.4 6.3
St dev 0.55 0.06 0.30 0.29 17.72 2.98 13.38 2.35 0.8 0.6
Max 15.92 38.96 2.75 4.65 82.37 14.04 50.15 8.65 �20.6 8.4
Min 12.35 38.50 0.04 0.02 16.02 3.37 1.78 0.32 �24.0 5.3
200– 500
Mean 13.86 38.80 0.06 0.44 20.28 3.62 4.49 0.86 �22.1 6.7
St dev 0.16 0.02 0.02 0.14 5.88 1.06 4.06 0.87 1.3 1.9
Max 14.76 38.93 0.24 1.26 29.19 5.44 16.52 3.64 �20.9 13.0
Min 13.19 38.76 0.03 0.21 12.56 2.16 0.70 0.08 �25.5 5.3
500– 1200
Mean 13.50 38.75 0.06 0.47 17.20 3.10 5.75 1.07 �21.9 6.5
St dev 0.18 0.02 0.01 0.15 6.20 0.90 7.18 1.43 1.5 1.08
Max 13.84 38.80 0.28 0.84 30.81 4.83 30.34 6.23 �18.5 8.6
Min 13.16 38.72 0.04 0.25 10.01 1.97 0.41 0.08 �24.6 5.2
T. Tesi et al. / Deep-Sea Research I 55 (2008) 813–831818
3.3.3. 14C analyses
The analyses were performed by National OceanSciences Accelerator Mass Spectrometry Facility (NOSAMS,Woods Hole Oceanographic Institution). Samples of CO2
were obtained by the combustion of bulk OC frompreacidified sediments to remove the inorganic fraction.The CO2 was then purified cryogenically and converted tographite using hydrogen reduction with an iron catalyst.The graphite was pressed into targets, which wereanalyzed on the accelerator along with standards andprocess blanks. Oxalic Acid II (NIST-SRM-4990C) was theprimary standard used for all 14C measurements. Theradiocarbon results are expressed as D14C, fraction modern(Fmod), or as conventional radiocarbon ages (Olsson, 1970;Stuiver and Polach, 1977; Stuiver, 1980).
3.4. Principal component analysis
Principal component analysis (PCA) was used to reducea large number of variables into a smaller number oforthogonal principal components (PCs). This statisticaltechnique allows identification of the similarity amongsamples as well as the specificity of each individualcompound in tracing OM (Fernandes et al., 1999; Goniet al., 2000; Gordon and Goni, 2003; Tesi et al., 2007). APCA was performed on a suite of CuO reaction products
(lignin-derived phenols, fatty acids, dicarboxylic acids,hydroxy benzoic acids, and p-hydroxy benzenes) for boththe sediment trap samples and sediment samples. TheCuO oxidation products from phytoplankton and bacteria(Goni and Hedges, 1995) were added to our dataset asend-member values to investigate their influence on thesamples. For these two OC sources, we assumed theabsence of lignin-derived phenols since lignin is amacromolecule exclusive to vascular plants (Hedges andParker, 1976). Prior to the PCA, the dataset was normalizedby dividing each variable by its standard deviation. A screeplot (of eigenvalues versus component number) wascreated to evaluate the importance of each eigenvalue.The PCA was performed using Matlab 6.5.
4. Results
Physical data (e.g. temperature, salinity, density,currents, total suspended matter, mass fluxes, etc.) fromcurrent meters, hydrological surveys, and sediment trapshave been previously discussed by Turchetto et al. (2007).Throughout the present paper, these data will be used toprovide support for our interpretations. In the nextsection, we will be presenting the biogeochemical datafrom suspended material, sediment traps, and surficialsediments.

ARTICLE IN PRESS
Table 2Depth, OC content, isotopic compositions and CuO oxidation yields for surficial sediment collected along shore-normal transect in the southern Adriatic
Sea
Code ST-04 ST-05 ST-06 ST-C3
Depth (m) 54 77 112 600
OC (%) 0.91 0.80 0.85 0.45
d13C (%) �23.2 �23.3 �23.1 �22.6
D14C (%) �326.8 �289.9 �330.8 �339.0
Sand (%) 4.1 1.7 1.1 38.3
Silt (%) 49.3 45.7 36.9 25.5
Clay (%) 46.6 52.6 62.0 36.2
Fatty acids
Decanoic acid C10FA 0.046 0.048 0.070 0.113
Dodecanoic acid C12FA 0.057 0.081 0.094 0.094
Tetradecanoic acid C14FA 0.067 0.074 0.153 0.154
Hexadecenoic acid C16FA:1 0.000 0.029 0.038 0.033
Hexadecanoic acid C16FA 0.098 0.114 0.203 0.203
Octadecanoic acid C18FA 0.085 0.097 0.141 0.122
Total FA 0.354 0.443 0.700 0.720
Dicarboxylic acids
Butane-1,4-dioic acid C4DA 0.335 0.302 0.940 1.592
2-Butene-1+dioic acid C4DA:1 0.162 0.265 0.535 0.757
Pentane-1,5-dioic acid C5DA 0.033 0.036 0.048 0.061
Hexan-1,6-dioic acid C6DA 0.029 0.031 0.039 0.042
Heptan-1,7-dioic acid C7DA 0.027 0.031 0.037 0.039
Octan-1,8-dioic acid C8DA 0.031 0.033 0.043 0.048
Nonan-1,9-dioic acid C9DA 0.043 0.046 0.069 0.092
Decan-1,10-dioic acid C10DA 0.032 0.036 0.048 0.060
Undecan-1,11-dioic acid C11DA 0.030 0.035 0.046 0.054
C12DA 0.027 0.033 0.040 0.046
Total DA 0.749 0.848 1.844 2.791
p-Hydroxy benzenes
p-Hydroxybenzaldehyde Pl 0.000 0.097 0.108 0.079
p-Hydroxyphenylglyoxylic acid Pg 0.358 0.441 0.174 0.247
p-Hydroxybenzoic acid Pd 0.272 0.343 0.107 0.080
p-Hydroxyacetophenone Pn 0.044 0.048 0.037 0.034
Total P 0.674 0.930 0.425 0.439
Benzoic acids
Benzoic acid Bd 0.137 0.094 0.093 0.183
o-Hydroxybenzoic acid 0-Bd 0.055 0.056 0.059 0.071
m-Hydroxybenzoic acid mBd 0.045 0.052 0.053 0.065
3,5-Dihydroxybenzoic acid 3,5,Bd 0.039 0.044 0.061 0.061
Total B 0.276 0.247 0.267 0.380
Lignin monomers
Vanillin VI 0.281 0.290 0.091 0.051
Acetovanillone Vn 0.108 0.103 0.047 0.036
Vanillic acid Vd 0.124 0.133 0.061 0.046
Syringealdehyde SI 0.188 0.172 0.140 0.087
Acetosyringone Sn 0.089 0.084 0.056 0.041
Syringic acid Sd 0.110 0.108 0.069 0.055
p-Coumaric acid pCd 0.035 0.043 0.054 0.055
Ferulic acid Fd 0.009 0.012 0.015 0.010
Total L 0.943 0.946 0.533 0.381
Lignin dimers
Dehydrodivanillin VI–VI 0.048 0.066 0.043 0.029
Dehydrovanillinacetovanillone VI–Vn 0.038 0.051 0.031 0.027
T. Tesi et al. / Deep-Sea Research I 55 (2008) 813–831 819

ARTICLE IN PRESS
Table 2 (continued )
Code ST-04 ST-05 ST-06 ST-C3
Dehydrodiacetovanillone Vn–Vn 0.027 0.033 0.020 0.011
5-Vanillovanillin Vo5VI 0.031 0.039 0.028 0.022
Dehydrovanillin-vanillic acid VI–Vd 0.032 0.041 0.029 0.025
Dehydroacetovanillone-vanillic acid Vn–Vd 0.028 0.033 0.022 0.021
Dehydrodivanillic acid Vd–Vd 0.027 0.032 0.024 0.020
2-Vanillysyringealdehyde 4-o050-dimers 0.027 0.032 0.022 0.021
5-Vanillovanillic acid Vo5Vd 0.033 0.039 0.028 0.022
Total Dim 0.290 0.365 0.246 0.199
T. Tesi et al. / Deep-Sea Research I 55 (2008) 813–831820
4.1. Water column
The summary statistics for the parameters measured inthe water column are presented in Table 1. The data havebeen grouped according to water depth in order toinvestigate spatial variability (mean, standard deviation,max and min values) of OM components within the watercolumn. The OC content, measured both as mg OC l�1 andweight percent of total particles (mg OC g�1 dry wt),decreased with depth. The highest values were observedwithin the upper 10 m of the water column (90.69mg l�1
and 24.32%), whereas the deeper samples exhibited lowervalues (17.20mg l�1 and 4.49%). The TN values followed thesame trend, displaying higher values at the surface(15.14mg l�1 and 3.97%). The d13C did not exhibit a cleartrend with depth. In general, the heavier isotopiccompositions (��21.5%) were observed within the upper50 m water depth. In comparison, samples from depths450 m were characterized by isotopic compositions onlyslightly more depleted (��22.1%) than those from theupper part of the water column; however there were somesubstantially depleted outliers. The fluorometer valueswere relatively high within the upper 200 m waterdepth (�0.30 a.u.), reaching the highest values around100 m below the sea surface (�2.0 a.u.). Below 200 mwater depth the fluorometer values dropped drastically(�0.06 a.u). The OC:TN ratio exhibited a narrow rangewith no obvious trend within the water column. Thehighest mean value (7.1) was observed for the 0–10 mdepth group, while the deeper water displayed meanvalues of �6.5.
4.2. Surficial sediments
High variability was observed in the surficial sedi-ments (0–1 cm) collected along the shelf-slope transect(Table 2). The highest OC and TN contents were observedon the shelf (ranging from 0.91% to 0.80% and from 0.14%to 0.12% for OC and TN, respectively). The sample collectedon the slope (ST-C) exhibited relatively low contents(0.42% and 0.09% for OC and TN). All shelf samplesdisplayed depleted isotopic compositions (ranging from�23.3% to �23.1%) relative to the slope sample(�22.6%). On the shelf, the OC:TN ratio exhibited alimited range in values (from 6.5 to 6.6); the sample onthe slope displayed a relatively low value (4.9). The D14C
ratios exhibited a narrow range of values throughout theshore-normal transect (from �339.0% to 289.9%). Ligninphenols (the sum of monomers and dimers) dominatedthe products of the CuO oxidations at the shalloweststations (ST-04 and ST-05), accounting for over 30% of thequantified products. The lignin contents (L) were inver-sely related to distance from the coast, such that thelowest content was observed at the deepest station (ST-C,0.381 mg 100 mg�1 OC); lignin values were three timeshigher for the shallowest station (ST-04, 0.943 mg100 mg�1 OC). Compositionally, vanillyl and syringylphenols were the most abundant lignin-derived CuOreaction products, combined accounting for �80–90% ofL yields. The remaining 10% of L yields was constituted ofcinnamyl phenols. In general, the ratio between lignindimers and monomers increased with the water depth(from 0.308 to 0.521). In the deepest stations (ST-06 andST-C), the fatty acids and dicarboxylic acids were themajor CuO products, accounting together for over 60% ofthe quantified compounds. The carbon-normalized con-tent of both fatty and dicarboxylic acids increased alongthe shore-normal transect, with the highest valuesobserved at the deepest station (from 0.354 to0.720 mg 100 mg�1 OC and from 1.102 to 3.427 mg100 mg�1 OC for fatty and dicarboxylic acids, respec-tively). The relative p-hydroxy benzene contributiondecreased with increasing water depth (from 24% to9%), whereas the benzoic acids exhibited a limited spatialvariability and no distinct trend (mean �8%). Thep-hydroxy benzenes showed the highest value in the in-shore region (from 0.425 to 0.674 mg 100 mg�1 OC)whereas the highest content of benzoic acids wasmeasured in the samples collected on the slope (from0.247 to 0.380 mg 100 mg�1 OC).
4.3. Sediment trap samples
All analyses carried out on the sediment trap samplesare listed in Table 3. Mass fluxes, elemental, and isotopiccompositions for these samples have been previouslydiscussed by Turchetto et al. (2007). The D14C ratiosexhibited a wide range of values. Both the highest(�275.3%) and lowest (42.3%) D14C values were detectedat site B. Dicarboxylic acids dominated the CuO productsin all samples, accounting for over 40% of the yields. Thelowest value was measured at site A (1.040 mg 100 mg�1

ARTIC
LEIN
PRESS
Table 3Mass fluxes, OC content, isotopic compositions and CuO oxidation yields for sediment trap samples collected in the southern Adriatic
Cup A B C
A1 01 A1 03 A1 06 A1 11 A1 12 A2 02 A2 08 A2 12 B1 01 B1 03 B1 06 B1 08 B1 11 B1 12 B2 02 B2 04 B2 06 B2 08 B2 09 B2 12 C1 03
Dense water
cascading
C C C C C C C
Trap open date 21/03/
04
11/04/
04
11/05/
04
01/07/
04
10/07/
04
31/08/
04
25/12/
04
27/2/
05
21/03/
04
11/04/
04
11/05/
04
01/06/
04
01/07/
04
10/07/
04
31/08/
04
22/10/
04
23/11/
04
25/12/
04
10/01/
05
27/2/
05
11/04/
04
Trap close date 01/04/
04
21/04/
04
21/05/
04
10/07/
04
20/07/
04
1/10/04 10/1/05 16/6/
05
01/04/
04
21/04/
04
21/05/
04
11/06/
04
10/07/
04
20/07/
04
1/10/04 23/11/
04
9/12/04 10/1/05 26/01/
05
16/6/
05
21/04/
04
Flux (mg m�2 day�1) 6374 6097 1313 709 1553 379 764 6750 6452 15550 2558 2279 1239 2032 669 1107 705 3586 2676 8642 24589
OC (%) 1.16 1.09 1.30 1.76 1.47 2.05 1.47 1.06 1.20 0.87 1.13 1.54 1.59 1.48 2.17 1.52 1.67 1.29 1.34 1.08 0.91
D14C (%) �251.6 �162.0 �171.3 �275.3 �142.1 �17.6 42.3 �219.8 �204.8
d13C (%) �23.2 �23.0 �23.0 �23.5 �23.1 �23.4 �23.4 �23.1 �22.5 �22.4 �22.3 �22.5 �22.1 �22.4 �22.7 �22.5 �22.2 �22.9 �23.4 �23.4 �22.8
Fatty acids
C10FA 0.030 0.038 0.026 0.018 0.032 0.022 0.026 0.042 0.033 0.043 0.024 0.029 0.016 0.024 0.025 0.028 0.020 0.032 0.025 0.036 0.03
C12FA 0.057 0.054 0.069 0.041 0.067 0.035 0.055 0.078 0.049 0.070 0.047 0.061 0.073 0.040 0.046 0.050 0.032 0.064 0.050 0.059 0.076
C14FA 0.100 0.114 0.113 0.090 0.070 0.139 0.073 0.099 0.113 0.155 0.140 0.179 0.088 0.127 0.128 0.099 0.078 0.076 0.094 0.102 0.184
C16FA:1 0.040 0.034 0.045 0.046 0.032 0.033 0.024 0.036 0.044 0.045 0.053 0.057 0.042 0.058 0.030 0.029 0.032 0.025 0.048 0.049 0.067
C16FA 0.116 0.089 0.094 0.075 0.074 0.095 0.074 0.107 0.088 0.131 0.110 0.101 0.068 0.133 0.096 0.083 0.080 0.072 0.100 0.125 0.154
C18FA 0.089 0.066 0.055 0.046 0.064 0.041 0.054 0.078 0.053 0.085 0.068 0.056 0.038 0.089 0.067 0.051 0.042 0.057 0.057 0.080 0.086
Total FA 0.432 0.395 0.402 0.316 0.338 0.365 0.306 0.441 0.379 0.529 0.443 0.484 0.324 0.470 0.392 0.339 0.283 0.327 0.374 0.451 0.597
Dicarboxylic acids
C4DA 0.824 0.790 0.977 0.544 1.065 0.614 0.713 0.969 0.775 1.087 0.953 0.641 0.948 0.904 0.679 1.053 0.585 0.899 1.038 0.957 1.151
C4DA:1 0.453 0.410 0.575 0.286 0.547 0.396 0.430 0.372 0.416 0.512 0.481 0.411 0.565 0.468 0.323 0.678 0.357 0.414 0.619 0.423 0.645
C5DA 0.038 0.038 0.045 0.027 0.049 0.032 0.034 0.045 0.037 0.051 0.041 0.035 0.049 0.045 0.035 0.055 0.028 0.041 0.048 0.044 0.054
C6DA 0.029 0.032 0.039 0.028 0.032 0.020 0.022 0.032 0.026 0.039 0.026 0.027 0.028 0.038 0.021 0.032 0.019 0.028 0.027 0.032 0.036
C7DA 0.025 0.027 0.027 0.018 0.025 0.017 0.019 0.030 0.025 0.035 0.024 0.023 0.028 0.029 0.021 0.032 0.019 0.026 0.026 0.031 0.036
C8DA 0.030 0.032 0.031 0.023 0.029 0.020 0.022 0.033 0.030 0.039 0.020 0.029 0.033 0.034 0.023 0.037 0.023 0.029 0.028 0.033 0.042
C9DA 0.048 0.050 0.049 0.036 0.052 0.037 0.036 0.050 0.051 0.061 0.047 0.051 0.052 0.059 0.041 0.063 0.039 0.045 0.044 0.051 0.064
C10DA 0.033 0.035 0.042 0.030 0.038 0.027 0.029 0.040 0.031 0.046 0.039 0.034 0.042 0.041 0.030 0.048 0.030 0.035 0.040 0.044 0.057
C11DA 0.033 0.035 0.038 0.026 0.034 0.024 0.026 0.035 0.030 0.046 0.036 0.036 0.037 0.043 0.027 0.044 0.025 0.030 0.035 0.037 0.05
C12DA 0.027 0.029 0.029 0.020 0.027 0.018 0.021 0.030 0.026 0.040 0.028 0.033 0.027 0.037 0.021 0.032 0.020 0.027 0.028 0.033 0.041
Total DA 1.541 1.478 1.851 1.040 1.897 1.205 1.352 1.636 1.448 1.956 1.693 1.319 1.810 1.699 1.222 2.074 1.142 1.573 1.931 1.685 2.178
p-Hydroxy benzenes
Pl 0.073 0.077 0.128 0.064 0.094 0.066 0.086 0.074 0.085 0.095 0.078 0.084 0.115 0.066 0.074 0.127 0.053 0.073 0.105 0.085 0.148
Pg 0.316 0.121 0.819 0.467 0.765 0.313 0.089 0.047 0.140 0.277 0.140 0.423 0.807 0.553 0.177 0.965 0.393 0.050 0.685 0.230 0.85
Pd 0.069 0.073 0.103 0.069 0.107 0.060 0.076 0.085 0.073 0.085 0.077 0.077 0.090 0.088 0.071 0.109 0.058 0.075 0.088 0.082 0.118
Pn 0.023 0.026 0.020 0.015 0.020 0.016 0.020 0.032 0.024 0.033 0.018 0.020 0.018 0.026 0.020 0.021 0.014 0.026 0.018 0.030 0.03
Total P 0.481 0.297 1.071 0.615 0.986 0.455 0.272 0.238 0.321 0.490 0.314 0.603 1.030 0.732 0.341 1.222 0.518 0.224 0.896 0.427 1.147
T.Tesi
eta
l./
Deep
-SeaR
esearch
I5
5(2
00
8)
813
–8
318
21

ARTIC
LEIN
PRESS
Table 3 (continued )
Cup A B C
A1 01 A1 03 A1 06 A1 11 A1 12 A2 02 A2 08 A2 12 B1 01 B1 03 B1 06 B1 08 B1 11 B1 12 B2 02 B2 04 B2 06 B2 08 B2 09 B2 12 C1 03
Benzoic acids
Bd 0.103 0.147 0.210 0.072 0.159 0.098 0.161 0.170 0.163 0.146 0.094 0.081 0.069 0.054 0.123 0.127 0.064 0.136 0.198 0.125 0.094
o-Bd 0.036 0.045 0.032 0.021 0.031 0.023 0.029 0.041 0.037 0.056 0.025 0.044 0.024 0.039 0.029 0.035 0.018 0.036 0.033 0.043 0.041
mBd 0.039 0.039 0.047 0.034 0.044 0.031 0.036 0.044 0.036 0.049 0.041 0.038 0.049 0.047 0.033 0.058 0.033 0.039 0.047 0.043 0.065
3,5,Bd 0.038 0.038 0.047 0.027 0.043 0.027 0.034 0.041 0.035 0.052 0.032 0.034 0.048 0.045 0.031 0.063 0.026 0.039 0.050 0.043 0.068
Total B 0.217 0.269 0.336 0.154 0.277 0.179 0.260 0.296 0.271 0.303 0.191 0.197 0.189 0.185 0.215 0.283 0.141 0.250 0.329 0.255 0.268
Lignin monomers
VI 0.038 0.040 0.047 0.020 0.030 0.023 0.035 0.046 0.042 0.054 0.035 0.037 0.039 0.025 0.028 0.038 0.021 0.038 0.040 0.066 0.06
Vn 0.026 0.029 0.022 0.014 0.020 0.015 0.020 0.033 0.027 0.037 0.019 0.022 0.016 0.025 0.019 0.020 0.014 0.027 0.019 0.038 0.033
Vd 0.032 0.032 0.026 0.016 0.025 0.016 0.021 0.036 0.032 0.044 0.023 0.027 0.015 0.030 0.021 0.025 0.018 0.029 0.022 0.043 0.029
SI 0.055 0.053 0.066 0.037 0.047 0.038 0.044 0.058 0.050 0.074 0.067 0.067 0.058 0.050 0.045 0.058 0.038 0.051 0.057 0.066 0.088
Sn 0.029 0.031 0.025 0.019 0.024 0.018 0.021 0.035 0.028 0.043 0.020 0.028 0.021 0.031 0.023 0.027 0.017 0.030 0.025 0.038 0.041
Sd 0.037 0.041 0.035 0.023 0.032 0.022 0.026 0.046 0.036 0.053 0.033 0.034 0.029 0.039 0.029 0.037 0.022 0.038 0.032 0.049 0.051
pCd 0.037 0.043 0.058 0.038 0.047 0.033 0.026 0.038 0.039 0.059 0.060 0.047 0.049 0.057 0.033 0.039 0.025 0.030 0.029 0.039 0.068
Fd 0.007 0.007 0.007 0.005 0.007 0.005 0.005 0.007 0.007 0.010 0.008 0.007 0.004 0.008 0.006 0.007 0.006 0.006 0.007 0.009 0.01
Total L 0.261 0.275 0.285 0.173 0.232 0.171 0.198 0.300 0.260 0.373 0.266 0.269 0.232 0.266 0.204 0.252 0.160 0.249 0.230 0.348 0.379
Lignin dimers
VI–VI 0.021 0.022 0.031 0.015 0.020 0.012 0.015 0.026 0.020 0.029 0.024 0.019 0.028 0.021 0.014 0.024 0.016 0.020 0.014 0.030 0.042
VI–Vn 0.019 0.020 0.014 0.012 0.014 0.011 0.012 0.023 0.018 0.027 0.015 0.016 0.013 0.020 0.014 0.015 0.011 0.018 0.013 0.025 0.027
Vn–Vn 0.014 0.019 0.014 0.011 0.014 0.009 0.012 0.023 0.016 0.025 0.013 0.014 0.012 0.020 0.013 0.015 0.011 0.018 0.013 0.023 0.024
Vo5VI 0.012 0.019 0.014 0.009 0.014 0.008 0.012 0.023 0.016 0.025 0.014 0.014 0.012 0.020 0.013 0.015 0.010 0.018 0.011 0.023 0.026
VI–Vd 0.018 0.019 0.015 0.008 0.014 0.009 0.012 0.023 0.017 0.026 0.014 0.015 0.012 0.020 0.013 0.010 0.009 0.018 0.009 0.024 0.025
Vn–Vd 0.016 0.019 0.014 0.009 0.014 0.011 0.012 0.023 0.016 0.025 0.013 0.014 0.012 0.020 0.013 0.015 0.010 0.018 0.011 0.023 0.024
Vd–Vd 0.017 0.019 0.015 0.008 0.014 0.009 0.012 0.023 0.016 0.025 0.012 0.014 0.012 0.020 0.013 0.015 0.009 0.018 0.013 0.023 0.024
4-o050-dimers 0.016 0.019 0.014 0.009 0.014 0.011 0.012 0.023 0.016 0.025 0.014 0.014 0.012 0.020 0.013 0.015 0.009 0.018 0.013 0.023 0.024
Vo5Vd 0.016 0.019 0.015 0.011 0.014 0.011 0.012 0.023 0.016 0.025 0.013 0.014 0.013 0.020 0.013 0.016 0.010 0.018 0.014 0.023 0.025
Total Dim 0.146 0.179 0.147 0.091 0.129 0.090 0.109 0.209 0.153 0.231 0.131 0.137 0.128 0.179 0.121 0.138 0.093 0.165 0.110 0.217 0.241
C ¼ Cascades of dense water occurred during the collection (see Turchetto et al., 2007).
T.Tesi
eta
l./
Deep
-SeaR
esearch
I5
5(2
00
8)
813
–8
318
22

ARTICLE IN PRESS
T. Tesi et al. / Deep-Sea Research I 55 (2008) 813–831 823
OC), whereas the highest content was observed at site C(2.178 mg 100 mg�1 OC). The p-hydroxy benzenes were thesecond most abundant reaction products, ranging from 7%to 28% of the yields. Both the highest (1.222 mg 100 mg�1
OC) and lowest (0.224 mg 100 mg�1 OC) values weremeasured at site B, without a clear temporal trend. Bothlignin phenols (monomers and dimers combined) and fattyacids accounted on average for �12% of the CuO reactionproducts. Among the CuO reaction products, only the ligninphenols (both monomers and dimers) and fatty acidsexhibited a positive correlation with mass flux. In general,the highest lignin and fatty acid values were observed inApril 2004, when the whole study area was characterizedby high-energy conditions due to dense water cascading(Turchetto et al., 2007). In this period, the highestcarbon-normalized contents were measured at site C(L ¼ 0.379 mg 100 mg�1 OC; Dim ¼ 0.241 mg 100 mg�1
OC; FA ¼ 0.597 mg 100 mg�1). The lowest values of bothlignin and fatty acids were observed during quiescentenergy conditions at site B (L ¼ 0.160 mg 100 mg�1 OC;Dim ¼ 0.093 mg 100 mg�1; FA ¼ 0.283 mg 100 mg�1). Ben-zoic acids were the least abundant compounds among theCuO reaction products, on average accounting for �7% ofthe yields. The lowest benzoic acid value was observed atsite B (0.141 mg 100 mg�1 OC), whereas the highest contentwas measured at site A (0.336 mg 100 mg�1 OC).
5. Discussion
5.1. Vertical versus lateral fluxes
In this study sediment traps were used to collect thematerial funneled by the Bari canyon toward the deep sea viagravity-driven processes. Moored traps have been extensivelyemployed due to their ability to provide long time-serieswith high temporal resolution. However, in the last decadethere have been growing concerns about the accuracy offluxes measured with sediment traps (Gardner et al., 1997;Yu et al., 2001; Fleisher and Anderson, 2003). Besides theerror caused by hydrodynamic effects (e.g. undercollection orovercollection), the major source of imprecision is thought tooccur during sampling, as the sediment traps collect bothvertical and lateral flux. The vertical flux toward the deepocean, known as OC export, occurs in the form of sinkingparticles (e.g. phytoplankton, zooplankton, bacteria, organicaggregates and fecal pellets) from the uppermost layers ofthe water column (i.e. the euphotic zone). Conversely, thelateral flux is driven by physical processes related tosediment transport, including sediment resuspension andgravity-driven flows. As a result, vertical flux exhibits an OCcontent and composition markedly different from the lateralflux. In order to evaluate the contribution of each flux to thesediment trap samples, in the next sections we willseparately discuss the characteristics of OC collected in thewater column versus surficial sediments.
5.1.1. Water column source
Fig. 3 summarizes the main features observed in thewater column. Both shallow and deep stations have beenplotted on the same graph. The uppermost layer, char-
acterized by relatively low salinity and density, exhibitsthe highest OC contents relative to the deeper layers.Elemental, carbon isotopic, and fluorescence values indi-cate particles in this surficial layer are primary biogenic(e.g. phytoplankton) (Table 1). Much of the algal materialexported from the upper mixed layer is remineralised inthe twilight zone (Lee, 2004), with only a small proportionescaping to reach the benthic environment. This is wellreflected in the biogeochemical changes observed duringthe journey toward the seafloor. The sinking particulatematter reaching the bottom layers displays 5 times less OC(�5%) than those in the euphotic zone (�25%). The OC:TNratio also exhibits a general decrease, suggesting thatnitrogen is gained during microbial decay (nitrogen-richmicrobial biomass has an OC:TN of �4 (Hedges et al.,1997). Finally, the isotopic values slightly decrease withthe depth, suggesting both selective preservation ofrefractory algal compounds during degradation (e.g. fattyacids) or the presence of microbial communities on thesinking particles (Boschker et al., 1999; Teece et al., 1999;Fang et al., 2002). With regards to spatial variability, alongthe Italian coast, salinity, fluorescence, and isotopic valuessuggest land-derived nutrients act to stimulate phyto-plankton growth in the inshore regions (Fig. 2), whichexhibit the highest OC contents (up to �60%; Table 1).
5.1.2. Lateral particle advection
The distribution of CuO reaction products in sedimentscollected along the shore-normal transect (Fig. 4) illus-trates the overall predominance of lignin-derived com-pounds in the shallow region relative to the distal stations.Since lignin is a macromolecule uniquely synthesized byvascular plants (Hedges and Parker, 1976; Goni andHedges, 1992), this seaward trend indicates an increaseof lignin-free OM (i.e. phytoplankton and ancient OC), atthe expense of the modern terrigenous OM on the outer-shelf and the slope.
The decay of lignin by terrestrial fungi and otherlignin-degrading organisms has been shown to increasethe acid to aldehyde ratio of vanillyl [Vd:Vl] and syringyl[Sd:Sl] phenols from the original plant values (Goni andHedges, 1992; Opsahl and Benner, 1995). In surficialsediments, the [Vd:Vl] ratio exhibits higher values withincreasing distance from the Italian coast (Table 4); thisseaward trend suggests the preferential deposition ofdegraded material at the distal stations. The ratio betweendimers and monomers of lignin phenols [Dim:L] canprovide additional information about the diagenetic stageof the vascular plants (Goni and Hedges, 1992). The[Dim:L] ratio increases with the water depth, againsuggesting selective preservation of degraded material inthe offshore regions. However, the importance of this ratiois still unclear, and the there is not general consensus onits biogeochemical implications. Opsahl and Benner(1995) and Klap et al. (1999) did not observe any clearincrease in the [Dim:L] ratio during the early diagenesisof fresh vascular plants, suggesting that carbon–carbonand ether bonds are cleaved at similar rates throughoutthe degradation process. Finally, it is worth mentioningthat long-term cultivation of soils can result in significantincrease in lignin monomers at the expense of lignin

ARTICLE IN PRESS
Fig. 3. Variability of POC, fluorescence and density in the water column. POC and fluorenscence have been plotted as grey bubble plot. The bubble position
in the graph identifies the POC whereas the bubble dimension is proportional to the fluorescence.The density has been plotted as scatter graph (black
symbol). The figure displays both shallow and deep stations.
Fig. 4. Distribution of CuO reaction products in surficial sediments
(0–1 cm) along shore-normal transect in the southern Adriatic Sea.
T. Tesi et al. / Deep-Sea Research I 55 (2008) 813–831824
dimers (Schnitzer et al., 2006), and therefore the valuesobserved could also reflect a change in land use withinthe drainage basin during the last century rather thandegradative processes.
The ratio between syringyl and cinnamyl phenols([C:V]) can be used to identify woody versus non-woodysources of lignin (Hedges and Mann, 1979a, b; Hedgeset al., 1986). The early diagenesis of vascular plants hasbeen shown to lower the [C:V] ratio (Benner et al., 1991;Opsahl and Benner, 1995). Counter to what we wouldexpect based on the other lignin parameters, this ratioincreases towards the distal stations (Table 4), whichagain may reflect the impact of land use change.
Finally, Hernes et al. (2007) suggested compositionaltrends in lignin across the continental margin could beentirely due to phase changes and not degradation.According to this study, fractionation of lignin phenolsoccurs during sorption onto a mineral surface from litter,which raises the [C:V], [S:V], [Vd:Vl] and [Sd:Sl] ratios.This new insight may indicate that the spatial variabilityobserved along the shore-normal transect results from thecombined effects of leaching and sorption to differentparticle types. Although the use of parameters based onlignin oxidation products to determine the extent ofdiagenesis is still somewhat controversial, in this studythese ratios will be used as key tracers to understand theprovenance of sediment collected in the sediment traps.
Fatty acids and dicarboxylic acids have been obtainedin high yields from lipid- and protein-rich samples, suchas phytoplankton and bacteria (Goni and Hedges, 1995;

ARTICLE IN PRESS
Table 4Compositional parameters based on CuO reaction products
Parameter Sediment traps Surface sediments
A B ST-04 ST-05 ST-06 ST-C
Bulk o63 mm Bulk o63 mm Bulk o63 mm Bulk
[3,5Bd/V] 0.4670.07 0.4870.14 0.08 0.12 0.08 0.13 0.31 0.45 0.45
[Vd:Vl] 0.7470.10 0.7370.19 0.44 0.48 0.46 0.57 0.66 0.66 0.90
[Sd:Sl] 0.6570.09 0.6370.10 0.58 0.40 0.63 0.44 0.49 0.57 0.63
[C:V] 0.5970.17 0.5770.17 0.09 0.17 0.10 0.13 0.35 0.35 0.48
[S:V] 1.3270.14 1.3770.16 0.75 0.84 0.69 1.02 1.33 1.27 1.37
Fig. 5. Loading of CuO reaction products on PC1 and PC2.
T. Tesi et al. / Deep-Sea Research I 55 (2008) 813–831 825
Goni et al., 1998). The relative contribution of these CuOreaction products increases at the distal stations, suggest-ing a significant contribution of both microbial andmarine OM in the offshore region (Fig. 4; Table 3). Inaddition, CuO oxidation of marine sediments in alkalinesolution produces a suite of non-lignin aromatic com-pounds, such as hydroxy benzoic acids and p-hydroxybenzenes, whose sources are multifold. Some of thesereaction products have been used as tracers of phyto-plankton (Goni and Hedges, 1995; Goni et al., 1998, 2000;Dickens et al., 2007; Tesi et al., 2007), woody material(Goni et al., 2000; Gordon and Goni, 2003) and soil-derived OC (Dittmar and Lara, 2001; Farella et al., 2001;Gordon and Goni, 2003; Otto and Simpson, 2006; Tesi etal., 2007; Dickens et al., 2007) in the ocean. Along theshore-normal transect, each non-lignin aromatic com-pound has a peculiar seaward trend, and this may be asign of a diverse OC source for each biomarker (Table 3).
In the surficial sediments, D14C and d13C did not displaya marked trend (D14C ¼ �321.6721.8% and d13C ¼ �23.170.3%) (Table 3). These carbon isotopic ratios suggestthe sedimentary OM was composed of a mixture ofrelatively old terrestrial and marine OC, as opposed tomodern organic material, which has D14C of 40% due topost-bomb carbon.
5.1.3. Particulate fluxes on the slope
Principal component analysis is a powerful statisticaltool in biogeochemical studies (Yunker et al., 1995;Fernandes et al., 1999; Goni et al., 2000; Gordon andGoni, 2003; Tesi et al., 2007). Through this approach, it ispossible to identify patterns between the CuO reactionproducts and understand the relationship between thesamples. In order to investigate the contribution ofphytoplankton and bacteria to the surface sediments andsediment trap samples, published values for algal andbacterial biomass have been appended to our dataset(Goni and Hedges, 1995).
The first principal component (PC1) and the secondprincipal component (PC2) together account for over 70%of the variance. The highest loadings of PC1 (47% ofvariance) are displayed by compounds commonly ob-tained from CuO oxidation of phytoplankton, such asC16FA:1, C14FA, C16FA, C5DA, C6DA, C7DA, CD9A, and Bd(Goni and Hedges, 1995; Goni et al., 1998, 2000) (Fig. 5; forthe abbreviations see Table 2). Conversely, all lignin-derived phenols exhibited negative loadings in PC1. As
lignin is a known biomarker for terrestrial origin, wededuce that PC1 describes mixing between terrigenousand marine sources. Pl, Pn, Pg, and Pd all display relativelylow loadings for PC1, suggesting both phytoplankton andterrestrial material are sources of p-hydroxy benzenes.The negative loadings for 3,5-Bd and m-Bd indicate aterrestrial origin for these compounds (Fig. 5). This isconsistent with other studies wherein these non-ligninCuO reaction products have been obtained in high yieldsfrom soil samples (Ugolini et al., 1981; Goni and Thomas,2000; Dickens et al., 2007). Concerning PC2 (26% of thevariance), C12FA and Pg displayed the highest loadings,whereas the lowest values were observed for thosecompounds previously described as typical products ofalgal biomass (Fig. 5). C12FA and Pg are common CuOreaction products obtained from bacteria such as Bacillus
subtilis, Pseudomonas fluorescens, Arorobacier vinelandii,and Escherichia coli (Goni and Hedges, 1995). Since alllignin-derived oxidation products display low loadings inPC2, this axes may describe the bacterial abundance onmarine particulates sinking from the euphotic zone.
The spatial dispersion of the samples in the PC1versus PC2 plot provides additional information, and also

ARTICLE IN PRESS
T. Tesi et al. / Deep-Sea Research I 55 (2008) 813–831826
supports the previous interpretations (Fig. 6). The rela-tively lignin-rich surface sediments (ST-04 and ST-05)display on the left-most portion of the plot whereasphytoplankton occupies the opposite side, supporting thehypothesis that PC1 illustrates the mixing of land-derivedmaterial with marine OC. A positive relationship betweenbacterial abundance and phytoplankton has been clearlyshown in aquatic microbial ecology (Li et al., 2004; Sherret al., 2006), and the impact of fresh algal biomass on thegrowth of bacteria on particles sinking from the euphoticzone is also clearly shown in the relationship between PC1and PC2. The scores of the sediment trap samples increaselinearly (r2
¼ 0.93; Fig. 6b), while the surficial sedimentsdisplay similar and low scores relative to PC2 suggesting alow bacterial abundance probably related to the advancedage and degradative stage of the carbon (D14C ¼ �321.6721.8%).
Fig. 6b is a detail of the plot PC1 versus PC2 andprovides a clear description of the biological, physical and
Fig. 6. Scores of surficial sediments and sediment trap samples. In the plot, CuO
1995) were added to our dataset as end-member values to investigate their influ
the sediment traps. Bubble plot displays the particulate mass fluxes.
Fig. 7. (a) Relationship between mass flux and OC content in sediment trap sam
trap samples.
sedimentological processes affecting the temporal varia-bility of OM collected in the sediment traps. During lowenergy conditions, traps deployed both within the canyon(B and C) and on the slope (A) are dominated by verticalflux. The samples collected during these conditionsexhibited the lowest mass fluxes and lignin contents aswell as the highest OC contents (Figs. 6 and 7; Table 3).This material was characterized by particularly freshmarine OC and bacterial biomass, as indicated by thepresence of modern OC (e.g. B2-06, D14C ¼ +42.3%).However, lignin phenols are always present in thesesamples suggesting that, although the current velocity islow (o10 cm s�1; Turchetto et al., 2007), lateral fluxes areconstantly active both on the slope and within the canyon.The highest current velocities were measured during thedense water cascading events (460 cm s�1, April 2004;Turchetto et al., 2007). In these conditions the lateral fluxdominates the vertical one, as shown by the higher massfluxes (2 orders of magnitude relative to the low-energy
oxidation products from phytoplankton and bacteria (Goni and Hedges,
ence in the samples. The linear correlation takes account of samples from
ples. (b) Relationship between mass flux and lignin content in sediment

ARTICLE IN PRESS
T. Tesi et al. / Deep-Sea Research I 55 (2008) 813–831 827
condition). During dense-water cascading, the advectedmaterial exhibits the lowest OC contents and D14Cvalues (e.g. B1-03, D14C ¼ �275.3%) while the lignincontent doubles relative to low energy conditions(Table 3; Fig. 7).
5.2. Provenance of the advected material
A central goal of this biogeochemical study was toassess the provenance of the sediment exported to thedeep sea through the Bari canyon. The PCA providesimportant details on the origin of the material collectedon the slope. In particular, the distance between thesamples mapped into the new coordinate system high-lights similarities and dissimilarities between surficialsediments and sediment trap samples (Fig. 6). In general,none of the sediment trap samples collected during the1-yr deployment display an OM composition similar tothe inshore surficial samples (ST-04 and ST-05). However,the samples characterized by the highest mass fluxes,such as B1-03 and C1-03 (April 2004, dense watercascading event; Turchetto et al., 2007), exhibit composi-tions comparable to those of surficial sediments collectedon the outer shelf and slope (ST-06 and ST-C, respectively).Based on geomorphological, seismo-stratigraphic, sedi-mentological, and biostratigraphic data, Trincardi et al.(2007) found that, during modern highstand conditions,dense water cascading cuts the steep walls and sweepsthe floor of the upper portions of the northern branch(channel B) and the lower portion of the southern branchof the Bari canyon (channel C). Our observations supportthese findings and indicate an important contribution ofsediment from the outer shelf, while excluding majordirect contribution from the inshore region to the slopeduring the year of observation.
Although the fresh material sinking from the euphoticzone can hide the composition of the lateral flux, lignin-phenols are a sensible biomarkers for identifying thecomposition of the advected material. In particular, theparameters based on lignin CuO reaction products providekey details regarding the sediment origin. In Table 4 arelisted the [3,5-Bd:V], [Vd:Vl], [Sd:Sl], [C:V], [S:V] ratios forboth surficial sediments and sediment trap samples(mean values and standard deviation). Among the surfacesediments, only the samples collected on the outer-shelf(ST-06) and on the slope (ST-C) exhibit ratios comparablewith the values observed in sediment trap samples. Thissupports our hypothesis that the shallow region did notdirectly supply material to the slope environment duringthe period of study.
It is worth mentioning that winnowing of fine particlesby wave action and currents in the inshore region couldalso affect the biogeochemical distribution observed inthe sediment traps and surface sediments. In severalstudies, it has been shown that sediment is sorted alongthe sediment dispersal system and generally only the finefraction is transported toward the outer-shelf and slope(Nittrouer and Sternberg, 1981; Nittrouer and Wright,1994). The OM adsorbed on this fine fraction displays adifferent composition relative to the bulk as observed in
other oceanic environments (Goni et al., 1998; Keil et al.,1998). In order to understand the effect of the preferentialmobilization of fine particles, we carried out CuO oxida-tions on the finest and more ‘‘mobile’’ fraction (o63 mm)in the surficial sediments collected on the shelf. However,this fine fraction displays similar values relative to thebulk, probably because of the small amount of coarsematerial (463 mm) in the surface sediments (Tables 2and 4). Although the overall texture of the surfacesediments on the shelf is relatively fine, the clay fractionincreases from 46.6% to 62.0% seaward, suggesting thatthe preferential transport of fine material from the inshoreregion toward the outer shelf might also be taken intoaccount to describe the biogeochemical distributionacross-shelf.
With the aim of reinforcing our conclusions, we mer-ged our data set with lignin and carbon isotopic valuesfrom surface sediments collected in the Italian rivers, inthe Po prodelta area, and along the Holocene mud-wedge(Tesi et al., 2007) (Fig. 8a). None of these sedimentsamples exhibited a composition comparable to thematerial intercepted by sediment traps on the southernAdriatic slope. Thus, over the period studied we excludeany major coupling of riverine inputs (both Po andAppennine rivers) and down-canyon sediment flows,even during the NaADW cascading events. Furthermore,although wave-induced sediment transport is a processactive along the western Adriatic coast, we suggest thatthe resuspension events on the shelf did not cause a rapidtransfer of material from the Adriatic shelf toward the Baricanyon. The largest storm events in the southern Adriaticoccurred in winter 2005 (data source www.apat.gov.it)when the mass fluxes were relatively low (Turchetto et al.,2007). The decoupling between high energy storm eventson the shelf and mass fluxes suggests that the sedimentreaches the outer shelf as a result of numerous resuspen-sion events as observed along the Adriatic mud-wedge(Fain et al., 2007). Indeed, Fig. 8b indicates a relativelyelevated retention time of sediments on the inner shelf,allowing for significant microbial degradation or marinedilution. The terrestrial material that reaches the out-er-shelf and shelf-break is highly degraded, as indicatedby the elevated [3,5-Bd:V] ratio (Prahl et al., 1994; Gordonand Goni, 2003; Otto and Simpson, 2006; Dickenset al., 2007).
5.3. Quantitative assessment of OM contributions
In Fig. 8a, the extrapolation of the correlation line toL ¼ 0 indicates a mean d13C value of �22.1% for lignin-free OM, which includes not only marine sources but alsobedrock-derived kerogen. Indeed, this value is higher thanthe mean value measured in the euphotic zone (�21.3%;Table 1), suggesting that ancient OC contributes to thebulk composition. In order to understand the relativecontribution of soil-derived OC, marine phytoplankton,and kerogen in the sediment trap and sediment samples, athree end-member mixing model has been applied usingL and D14C values. The D14C values for marine OC and thekerogen end-member (D14CMar and D14CAnc) were chosen

ARTICLE IN PRESS
Fig. 8. Biogeochemical distributions of lignin, d13C, [Vd:Vl], and [3,5-Bd:V] ratios in the Adriatic Sea. (a) Displays the different contributions of
phytoplankton, soil-derived OC and kerogen in shallow surficial sediments and in the sediment trap samples collected on the slope. (b) Shows the
degradative stage of the terrestrial material collected in Po prodelta and Holocene mud-wedge and exported through the Bari canyon.
T. Tesi et al. / Deep-Sea Research I 55 (2008) 813–831828
on the basis of published values (Blair et al., 2003; Goniet al., 2005). Since bedrock-derived OC lacks any recogniz-able lignin because of geothermal alteration, the lignincontent of the kerogen end-member (LAnc) was consid-ered a null value (0 mg 100 mg�1 OC). The same null valuewas selected for the marine end-member (LMar), asphytoplankton produces lignin-free biomass (Goni et al.,2003). Mean L and D14C values from a fine-grained flooddeposit in the Po prodelta area were used for the soil end-member (LSoil and D14CSoil) (Tesi et al., 2008). Thequantitative assessment of OM components was madeby means of the following equations:
(1)
LS ¼ FMar�LMar+FSoil�LSoil+FAnc�LAnc(2)
D14CS ¼ FMar�D14CMar+FSoil�D14CSoil+FAnc�D14CAnc(3)
FMar+FSoil+FAnc ¼ 1Fig. 9. Relative abundance of phytoplankton, soil-derived OC and
kerogen in sediment trap samples and surficial sediments (0–1 cm)
collected in the southern Adriatic. The sediment trap samples were
clustered based on the intensity of the mass flux.
The fractions of soil-derived OC (FSoil), marine phyto-plankton (FMar) and kerogen (FAnc) in surficial sedimentsand sediment traps are plotted in Fig. 9. The sediment trapsamples were grouped based on mass flux (high and low).In the inshore region, soil is the primary OC source,accounting for �45% of OC in surface sediments. End-member mixing estimates also indicate that kerogen andmarine OC increase in abundance offshore, at the expenseof soil-derived OC; in this region the marine OC andkerogen contributions are �49% and �29%, respectively.The results of the end-member calculation for thesediment trap samples corroborate our previous conclu-sions. The samples characterized by low mass flux arehighly influenced by marine OC (over 80%); in thesesamples both kerogen and soil-derived OC account for�10% of the OC. Marine OC is still the major OC source inthose sediment trap samples characterized by high massfluxes (over 60%), while kerogen displays relatively high
values (over 20%) and soil-derived OC makes up theremainder (�15%). This supports our hypothesis that theprovenance of the sediment transported down the canyonis not the inner shelf region, where soil-derived OC is themajor OC source (�45%).
ARTICLE IN PRESS
T. Tesi et al. / Deep-Sea Research I 55 (2008) 813–831 829
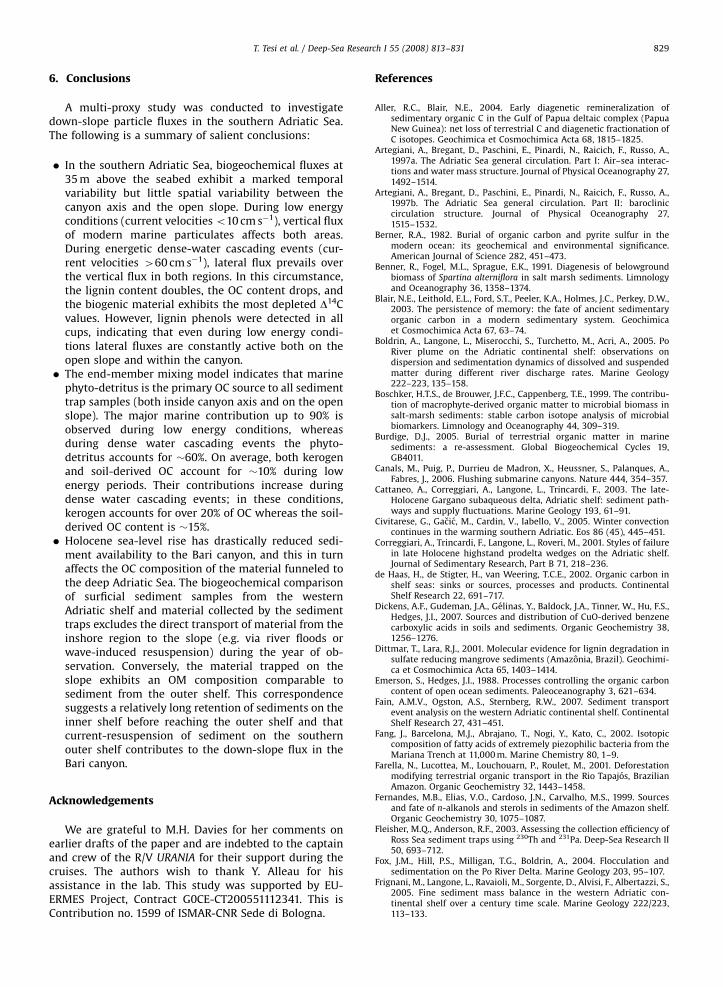
6. Conclusions
A multi-proxy study was conducted to investigatedown-slope particle fluxes in the southern Adriatic Sea.The following is a summary of salient conclusions:
�
In the southern Adriatic Sea, biogeochemical fluxes at35 m above the seabed exhibit a marked temporalvariability but little spatial variability between thecanyon axis and the open slope. During low energyconditions (current velocities o10 cm s�1), vertical fluxof modern marine particulates affects both areas.During energetic dense-water cascading events (cur-rent velocities 460 cm s�1), lateral flux prevails overthe vertical flux in both regions. In this circumstance,the lignin content doubles, the OC content drops, andthe biogenic material exhibits the most depleted D14Cvalues. However, lignin phenols were detected in allcups, indicating that even during low energy condi-tions lateral fluxes are constantly active both on theopen slope and within the canyon. � The end-member mixing model indicates that marinephyto-detritus is the primary OC source to all sedimenttrap samples (both inside canyon axis and on the openslope). The major marine contribution up to 90% isobserved during low energy conditions, whereasduring dense water cascading events the phyto-detritus accounts for �60%. On average, both kerogenand soil-derived OC account for �10% during lowenergy periods. Their contributions increase duringdense water cascading events; in these conditions,kerogen accounts for over 20% of OC whereas the soil-derived OC content is �15%.
� Holocene sea-level rise has drastically reduced sedi-ment availability to the Bari canyon, and this in turnaffects the OC composition of the material funneled tothe deep Adriatic Sea. The biogeochemical comparisonof surficial sediment samples from the westernAdriatic shelf and material collected by the sedimenttraps excludes the direct transport of material from theinshore region to the slope (e.g. via river floods orwave-induced resuspension) during the year of ob-servation. Conversely, the material trapped on theslope exhibits an OM composition comparable tosediment from the outer shelf. This correspondencesuggests a relatively long retention of sediments on theinner shelf before reaching the outer shelf and thatcurrent-resuspension of sediment on the southernouter shelf contributes to the down-slope flux in theBari canyon.
Acknowledgements
We are grateful to M.H. Davies for her comments onearlier drafts of the paper and are indebted to the captainand crew of the R/V URANIA for their support during thecruises. The authors wish to thank Y. Alleau for hisassistance in the lab. This study was supported by EU-ERMES Project, Contract G0CE-CT200551112341. This isContribution no. 1599 of ISMAR-CNR Sede di Bologna.
References
Aller, R.C., Blair, N.E., 2004. Early diagenetic remineralization ofsedimentary organic C in the Gulf of Papua deltaic complex (PapuaNew Guinea): net loss of terrestrial C and diagenetic fractionation ofC isotopes. Geochimica et Cosmochimica Acta 68, 1815–1825.
Artegiani, A., Bregant, D., Paschini, E., Pinardi, N., Raicich, F., Russo, A.,1997a. The Adriatic Sea general circulation. Part I: Air–sea interac-tions and water mass structure. Journal of Physical Oceanography 27,1492–1514.
Artegiani, A., Bregant, D., Paschini, E., Pinardi, N., Raicich, F., Russo, A.,1997b. The Adriatic Sea general circulation. Part II: barocliniccirculation structure. Journal of Physical Oceanography 27,1515–1532.
Berner, R.A., 1982. Burial of organic carbon and pyrite sulfur in themodern ocean: its geochemical and environmental significance.American Journal of Science 282, 451–473.
Benner, R., Fogel, M.L., Sprague, E.K., 1991. Diagenesis of belowgroundbiomass of Spartina alterniflora in salt marsh sediments. Limnologyand Oceanography 36, 1358–1374.
Blair, N.E., Leithold, E.L., Ford, S.T., Peeler, K.A., Holmes, J.C., Perkey, D.W.,2003. The persistence of memory: the fate of ancient sedimentaryorganic carbon in a modern sedimentary system. Geochimicaet Cosmochimica Acta 67, 63–74.
Boldrin, A., Langone, L., Miserocchi, S., Turchetto, M., Acri, A., 2005. PoRiver plume on the Adriatic continental shelf: observations ondispersion and sedimentation dynamics of dissolved and suspendedmatter during different river discharge rates. Marine Geology222–223, 135–158.
Boschker, H.T.S., de Brouwer, J.F.C., Cappenberg, T.E., 1999. The contribu-tion of macrophyte-derived organic matter to microbial biomass insalt-marsh sediments: stable carbon isotope analysis of microbialbiomarkers. Limnology and Oceanography 44, 309–319.
Burdige, D.J., 2005. Burial of terrestrial organic matter in marinesediments: a re-assessment. Global Biogeochemical Cycles 19,GB4011.
Canals, M., Puig, P., Durrieu de Madron, X., Heussner, S., Palanques, A.,Fabres, J., 2006. Flushing submarine canyons. Nature 444, 354–357.
Cattaneo, A., Correggiari, A., Langone, L., Trincardi, F., 2003. The late-Holocene Gargano subaqueous delta, Adriatic shelf: sediment path-ways and supply fluctuations. Marine Geology 193, 61–91.
Civitarese, G., Gacic, M., Cardin, V., Iabello, V., 2005. Winter convectioncontinues in the warming southern Adriatic. Eos 86 (45), 445–451.
Correggiari, A., Trincardi, F., Langone, L., Roveri, M., 2001. Styles of failurein late Holocene highstand prodelta wedges on the Adriatic shelf.Journal of Sedimentary Research, Part B 71, 218–236.
de Haas, H., de Stigter, H., van Weering, T.C.E., 2002. Organic carbon inshelf seas: sinks or sources, processes and products. ContinentalShelf Research 22, 691–717.
Dickens, A.F., Gudeman, J.A., Gelinas, Y., Baldock, J.A., Tinner, W., Hu, F.S.,Hedges, J.I., 2007. Sources and distribution of CuO-derived benzenecarboxylic acids in soils and sediments. Organic Geochemistry 38,1256–1276.
Dittmar, T., Lara, R.J., 2001. Molecular evidence for lignin degradation insulfate reducing mangrove sediments (Amazonia, Brazil). Geochimi-ca et Cosmochimica Acta 65, 1403–1414.
Emerson, S., Hedges, J.I., 1988. Processes controlling the organic carboncontent of open ocean sediments. Paleoceanography 3, 621–634.
Fain, A.M.V., Ogston, A.S., Sternberg, R.W., 2007. Sediment transportevent analysis on the western Adriatic continental shelf. ContinentalShelf Research 27, 431–451.
Fang, J., Barcelona, M.J., Abrajano, T., Nogi, Y., Kato, C., 2002. Isotopiccomposition of fatty acids of extremely piezophilic bacteria from theMariana Trench at 11,000 m. Marine Chemistry 80, 1–9.
Farella, N., Lucottea, M., Louchouarn, P., Roulet, M., 2001. Deforestationmodifying terrestrial organic transport in the Rio Tapajos, BrazilianAmazon. Organic Geochemistry 32, 1443–1458.
Fernandes, M.B., Elias, V.O., Cardoso, J.N., Carvalho, M.S., 1999. Sourcesand fate of n-alkanols and sterols in sediments of the Amazon shelf.Organic Geochemistry 30, 1075–1087.
Fleisher, M.Q., Anderson, R.F., 2003. Assessing the collection efficiency ofRoss Sea sediment traps using 230Th and 231Pa. Deep-Sea Research II50, 693–712.
Fox, J.M., Hill, P.S., Milligan, T.G., Boldrin, A., 2004. Flocculation andsedimentation on the Po River Delta. Marine Geology 203, 95–107.
Frignani, M., Langone, L., Ravaioli, M., Sorgente, D., Alvisi, F., Albertazzi, S.,2005. Fine sediment mass balance in the western Adriatic con-tinental shelf over a century time scale. Marine Geology 222/223,113–133.

ARTICLE IN PRESS
T. Tesi et al. / Deep-Sea Research I 55 (2008) 813–831830
Gacic, M., Civitarese, G., Miserocchi, S., Cardin, V., Crise, A., Mauri, E.,2002. The open ocean convection in the southern Adriatic: acontrolling mechanism of the phytoplankton bloom. ContinentalShelf Research 22, 1897–1908.
Galy, V., France-Lanord, C., Beyssac, O., Faure, P., Kudrass, H., Palhol, F.,2007. Efficient organic carbon burial in the Bengal fan sustained byHimalayan erosional system. Nature 450, 407–411.
Gardner, W.D., Biscaye, P.E., Richardson, M.J., 1997. A sediment trapexperiment in the Vema Channel to evaluate the effect of horizontalparticle fluxes on measured vertical fluxes. Journal of MarineResearch 55, 995–1028.
Goni, M.A., Hedges, J.I., 1992. Lignin dimers: structures, distribution, andpotential geochemical applications. Geochimica et CosmochimicaActa 56, 4025–4043.
Goni, M.A., Hedges, J.I., 1995. Sources and reactivities of marine-derivedorganic matter in coastal sediments as determined by alkaline CuOoxidation. Geochimica et Cosmochimica Acta 59, 2965–2981.
Goni, M.A., Montgomery, S., 2000. Alkaline CuO oxidation with amicrowave digestion system. Lignin analyses of geochemical sam-ples. Analytical Chemistry 72, 3116–3121.
Goni, M.A., Ruttenberg, K.C., Eglinton, T.I., 1998. A reassessment of thesources and importance of land-derived organic matter in surfacesediments from the Gulf of Mexico. Geochimica et CosmochimicaActa 62, 3055–3075.
Goni, M.A., Thomas, K.A., 2000. Sources and transformations of organicmatter in surface soil and sediments from a tidal Estuary (NorthInlet, South Carolina, USA). Estuaries 23, 548–564.
Goni, M.A., Yunker, M.B., Macdonald, R.W., Eglinton, T.I., 2000.Distribution and sources of organic biomarkers in arctic sedimentsfrom the Mackenzie River and Beaufort Shelf. Marine Chemistry 71,23–51.
Goni, M.A., Teixeir, M.J., Perkley, D.W., 2003. Sources and distribution oforganic matter in a river-dominated estuary (Winyah Bay, SC, USA).Estuarine Coastal and Shelf Science 57, 1023–1048.
Goni, M.A., Yunker, M.B., Macdonald, R.W., Eglinton, T.I., 2005. The supplyand preservation of ancient and modern components of organiccarbon in the Canadian Beaufort Shelf of the Arctic Ocean. MarineChemistry 93, 53–73.
Gordon, E.S., Goni, M.A., 2003. Sources and distribution of terrigenousorganic matter delivered by the Atchafalaya River to sediments in thenorthern Gulf of Mexico. Geochimica et Cosmochimica Acta 67,2359–2375.
Hedges, J.I., Keil, R.G., 1995. Sedimentary organic matter preservation: anassessment and speculative synthesis. Marine Chemistry 49, 81–115.
Hedges, J.I., Mann, D.C., 1979a. The characterization of plant tissues bytheir lignin oxidation products. Geochimica et Cosmochimica Acta43, 1803–1807.
Hedges, J.I., Mann, D.C., 1979b. The lignin geochemistry of marinesediments from the southern Washington coast. Geochimicaet Cosmochimica Acta 43, 1809–1818.
Hedges, J.I., Parker, P.L., 1976. Land-derived organic matter in surfacesediments from the Gulf of Mexico. Geochimica et CosmochimicaActa 40, 1019–1029.
Hedges, J.I., Clark, W.A., Quay, P.D., Richey, J.E., Devol, A.H., Santos, U.M.,1986. Compositions and fluxes of particulate organic material in theAmazon river. Limnology and Oceanography 31, 717–738.
Hedges, J.I., Keil, R.G., Benner, R., 1997. What happens toterrestrial organic matter in the ocean? Organic Geochemistry 27,195–212.
Heussner, S., Ratti, C., Carbonne, J., 1990. The PPS 3 time-series sedimenttrap and the trap sample techniques used during the ECOMARGEexperiment. Continental Shelf Research 10, 943–958.
Keil, R.G., Mayer, L.M., Quay, P.D., Richey, J.E., Hedges, J.I., 1997. Loss oforganic matter from riverine particles in deltas. Geochimicaet Cosmochimica Acta 61, 1507–1511.
Keil, R.G., Tsamakis, E., Giddings, J.C., Hedges, J.I., 1998. Biochemicaldistributions (amino acids, neutral sugars, and lignin phenols)among size classes of modern marine sediments from the Washing-ton Coast. Geochimica et Cosmochimica Acta 62, 1347–1364.
Hernes, P.J., Robinson, A.C., Aufdenkampe, A.K., 2007. Fractionation oflignin during leaching and sorption and implications for organicmatter ‘‘freshness’’. Geophysical Research Letter 34, L17401.
Klap, V.A., Louchouarn, P., Boon, J.J., Hemminga, M.A., van Soelen, J., 1999.Decomposition dynamics of six salt marsh halophytes as determinedby cupric oxide oxidation and direct temperature-resolved massspectrometry. Limnology and Oceanography 44, 1458–1476.
Kolla, V., Perlmutter, M.A., 1993. Timing of turbidite sedimentation onthe Mississippi fan. American Association of Petroleum GeologistsBulletin 77, 1129–1141.
Lascaratos, A., Roether, W., Nittis, K., Klein, B., 1999. Recent changes indeep water formation and spreading in the eastern MediterraneanSea: a review. Progress in Oceanography 44, 5–36.
Lee, C., 2004. Transformations in the Twilight Zone and beyond. MarineChemistry 92, 87–90.
Li, W.K.W., Head, J.H., Harrison, W.G., 2004. Macroecological limits ofheterotrophic bacterial abundance in the ocean. Deep-Sea ResearchPart I 51, 1529–1540.
Malanotte Rizzoli, P., Bergamasco, A., 1983. The dynamics of the coastalregion of the Northern Adriatic Sea. Journal of Physical Oceanogra-phy 13, 1105–1130.
Manca, B.B., Kovacevic, V., Gacic, M., Viezzoli, D., 2002. Dense waterformation in the southern Adriatic Sea and spreading into the IonianSea in the period 1997–1999. Journal of Marine Systems 33–34,133–154.
Mantziafou, A., Lascaratos, A., 2004. An eddy resolving numerical studyof the general circulation and deep-water formation in the AdriaticSea. Deep-Sea Research I 51, 921–952.
Miserocchi, S., Langone, L., Tesi, T., 2007. Content and isotopic composi-tion of organic carbon within a flood layer in the Po River prodelta(Adriatic Sea). Continental Shelf Research 27, 338–358.
Mullenbach, B.L., Nittrouer, C.A., Puig, P., Orange, D.L., 2004. Sedimentdeposition in a modern submarine canyon: Eel Canyon, northernCalifornia. Marine Geology 211, 101–119.
Nittrouer, C.A., Sternberg, R.W., 1981. The formation of sedimentarystrata in an allochthonous shelf environment: the Washingtoncontinental shelf. Marine Geology 42, 201–232.
Nittrouer, C.A., Wright, L.D., 1994. Transport of particles acrosscontinental shelves. Reviews of Geophysics 32, 85–113.
Olsson, I.U., 1970. The use of oxalic acid as a standard. In: Olsson, I.U.(Ed.), 12th Proceedings of the Radiocarbon Variations and AbsoluteChronology, Nobel Symposium. Wiley, New York, p. 17.
Opsahl, S., Benner, R., 1995. Early diagenesis of vascular plant tissues:lignin and cutin decomposition and biogeochemical implications.Geochimica et Cosmochimica Acta 59, 4889–4904.
Otto, A., Simpson, M.J., 2006. Evaluation of CuO oxidation parameters fordetermining the source and stage of lignin degradation in soil.Biogeochemistry 80, 121–142.
Palanques, A., El Khatab, M., Puig, P., Masque, P., Sanchez-Cabeza, J.A.,Isla, E., 2005. Downward particle fluxes in the Guadiaro submarinecanyon depositional system (north-western Alboran Sea), a riverflood dominated system. Marine Geology 220, 23–40.
Palanques, A., Durrieu de Madron, X., Puig, P., Fabres, J., Guillen, J., Calafat,A., Canals, M., Heussner, S., Bonnin, J., 2006. Suspended sedimentfluxes and transport processes in the Gulf of Lions submarinecanyons. The role of storms and dense water cascading. MarineGeology 234, 43–61.
Palinkas, C.M., Nittrouer, C.A., 2007. Modern sediment accumulation onthe Po shelf, Adriatic Sea. Continental Shelf Research 27, 489–505.
Paull, C.K., Greene, H.G., Ussler III., W., Mitts, P.J., 2002. Pesticides astracers of sediment transport through Monterey Canyon. Geo-MarineLetters 22, 121–126.
Paull, C.K., Ussler III., W., Greene, H.G., Mitts, P., Keaten, R., Barry, J., 2003.Caught in the act: 20 December 2001 gravity flow event in MontereyCanyon. Geo-Marine Letters 22, 227–232.
Penna, N., Capellacci, S., Ricci, F., 2004. The influence of the Po Riverdischarge on phytoplankton bloom dynamics along the coastline ofPesaro (Italy) in the Adriatic Sea. Marine Pollution Bulletin 48,321–326.
Prahl, F.G., Ertel, J.R., Goni, M.A., Sparrow, M.A., Eversmeyer, B., 1994.Terrestrial organic carbon contributions to sediments on theWashington margin. Geochimica et Cosmochimica Acta 58,3035–3048.
Puig, P., Ogston, A.S., Mullenbach, B.L., Nittrouer, C.A., Sternberg, R.W., 2003.Shelf-to-canyon sediment-transport processes on the Eel continentalmargin (northern California). Marine Geology 193, 129–149.
Schnitzer, M., McArthur, D.F.E., Schulten, H.-R., Kozak, L.M., Huang, P.M.,2006. Long-term cultivation effects on the quantity and quality oforganic matter in selected Canadian prairie soils. Geoderma 130,141–156.
Sherr, E.B., Sherr, B.F., Longnecker, K., 2006. Distribution of bacterialabundance and cell-specific nucleic acid content in the NortheastPacific Ocean. Deep-Sea Research I 53, 713–725.
Syvistski, J.P.M., Kettner, A.J., 2007. On the flux of water and sedimentinto the Northern Adriatic Sea. Continental Shelf Research 27,296–308.
Stahl, H., Tengberg, A., Brunnegard, J., Hall, P.O.J., 2004. Recycling andburial of organic carbon in sediments of the Porcupine Abyssal Plain,NE Atlantic. Deep-Sea Research I 51, 777–791.

ARTICLE IN PRESS
T. Tesi et al. / Deep-Sea Research I 55 (2008) 813–831 831
Stuiver, M., 1980. Workshop on 14C data reporting. Radiocarbon 22,964–966.
Stuiver, M., Polach, H.A., 1977. Discussion: reporting of 14C data.Radiocarbon 19, 355–363.
Teece, M.A., Fogel, M.L., Dollhopf, M.E., Nealson, K.H., 1999. Isotopicfractionation associated with biosynthesis of fatty acids by a marinebacterium under oxic and anoxic conditions. Organic Geochemistry30, 1571–1579.
Tesi, T., Miserocchi, S., Goni, M.A., Langone, L., Boldrin, A., Turchetto, M.,2007. Organic matter origin and distribution in suspended particu-late materials and surficial sediments, from the western Adriatic Sea(Italy). Estuarine, Coastal and Shelf Science 73, 431–446.
Tesi, T., Langone, L., Goni, M.A., Miserocchi, S., Bertasi, F., 2008. Changesin the composition of organic matter from prodeltaic sediments aftera large flood event (Po River, Italy). Geochimica et CosmochimicaActa 72, 2100–2114.
Traykovski, P., Wiberg, P.L., Geyer, W.R., 2007. Observations and modelingof wave induced fluid-mud gravity flows on the Po prodelta.Continental Shelf Research 27, 375–399.
Trincardi, F., Foglini, F., Verdicchio, G., Asioli, A., Correggiari, A., Minisini,D., Piva, A., Remia, A., Ridente, D., Taviani, M., 2007. The impact ofcascading currents on the Bari Canyon System, SWAdriatic margin(Central Mediterranean). Marine Geology 246, 208–230.
Turchetto, M., Boldrin, A., Langone, L., Miserocchi, S., Tesi, T., Foglini, F.,2007. Particle transport in the Bari Canyon (southern Adriatic Sea).Marine Geology 246, 231–247.
Ugolini, F.C., Reanier, R.E., Rau, G.H., Hedges, J.I., 1981. Pedological,isotopic, and geochemical investigations of the soils at the borealforest and alpine tundra transition in northern Alaska. Soil Science131, 359–374.
Vilibic, I., Supic, N., 2005. Dense water generation on a shelf: the case ofthe Adriatic Sea. Ocean Dynamics 55, 403–415.
Wollast, R., 1998. Evaluation and comparison of the global carbon cyclein the coastal zone and the open ocean. In: Brink, K.H., Robinson, A.R.(Eds.), The Sea. Wiley, New York.
Yu, E.F., Francois, R., Bacon, M.P., Honjo, S., Fleer, A.P., Manganini, S.J.,Rutgers van der Loeff, M.M., Ittekot, V., 2001. Trapping efficiency ofbottom-tethered sediment traps estimated from the interceptedfluxes of 230Th and 231Pa. Deep-Sea Research I 48, 865–889.
Yunker, M.B., Macdonald, R.W., Veltkamp, D.J., Cretney, W.J., 1995.Terrestrial and marine biomarkers in a seasonally icecoveredArctic estuary-integration of multivariate and biomarker approaches.Marine Chemistry 49, 1–50.
Zavatarelli, M., Pinardi, N., Kourafalou, V.H., Maggiore, A., 2002. Diagnosticand prognostic model studies of the Adriatic Sea general circulation:seasonal variability. Journal of Geophysical Research 107 (C1), 3004.