Human Interindividual Variability in Susceptibility to Airborne Particles
50
HUMAN INTERINDIVIDUAL VARIABILITY IN SUSCEPTIBILITY TO AIRBORNE PARTICLES Dale Hattis 1 , Abel Russ 1 , Robert Goble 1 , Prerna Banati 1 and Margaret Chu 2 Submitted to Risk Analysis Short Title: Susceptibility to Respiratory Responses 1 Marsh Institute, 950 Main Street, Clark University 01610. Tel: 508-751-4603; FAX: 508-751-4600; Email: [email protected] 2 National Center for Environmental Assessment, U. S. Environmental Protection Agency
Transcript of Human Interindividual Variability in Susceptibility to Airborne Particles

HUMAN INTERINDIVIDUAL VARIABILITY INSUSCEPTIBILITY TO AIRBORNE PARTICLES
Dale Hattis1, Abel Russ1, Robert Goble1, Prerna Banati1 andMargaret Chu2
Submitted to Risk Analysis
Short Title: Susceptibility to Respiratory Responses
1 Marsh Institute, 950 Main Street, Clark University 01610. Tel:508-751-4603; FAX: 508-751-4600; Email: [email protected]
2National Center for Environmental Assessment, U. S. Environmental Protection Agency

ABSTRACTPart of the explanation for the persistent epidemiological
findings of associations between mortality and morbidity with relatively modest ambient exposures to airborne particles may be that some people are very much more susceptible to particle-induced responses than others. This study assembles a database of quantitative observations of interindividual variability in pharmacokinetic and pharmacodynamic parameters likely to affect particle response. The pharmacodynamic responses studied includedata drawn from epidemiologic studies of the doses of methacholine, flour dust, and some other agents inducing acute changes in lung function in different people. In general, the amount of interindividual variability in several of these pharmacodynamic response parameters is greater than the variability in pharmacokinetic (breathing rate, deposition and clearance) parameters.
Quantitatively the results to date indicate human interindividual variability of breathing rates and the major pharmacokinetic parameters--total deposition, and tracheobronchial clearance are generally in the region of Log(GSD) = 0.1 to 0.2. Deposition to the deep lung (alveolar region) appears to be somewhat more variable [Log(GSD) of about 0.3]. Among pharmacodynamic parameters, changes in FEV1 in response to ozone and metabisulfite (an agent that is said to actprimarily on neural receptors in the lung) are in the region of Log(GSD) of 0.2 to 0.4. However similar responses to methacholine, an agent that acts on smooth muscle, seem to have still more variability (0.4 to somewhat over 1.0 depending on the
2

type of population studied). Similarly high values are suggestedfor particulate allergens. Central estimates of this kind of variability, and the close correspondence of the data to lognormal distributions, indicate that 99.9th percentile individuals are likely to respond at doses that are 150-450 less than would be needed in median individuals. It seems plausible that acute responses with this amount of variability could form part of the mechanistic basis for epidemiological observations ofenhanced mortality in relation to ambient exposures to fine particles.
Key words: Interindividual variability, particles, pharmacokinetics, pharmacodynamics
3

1. Significance of the Problem, Current National Research Efforts, and ApproachOne of the more important puzzles in contemporary
environmental science is the mechanism(s) underlying persistent
findings of excess mortality(1,2,3) and morbidity(4) in relation
to ambient environmental exposures to small airborne particulates. Multiple studies indicate relationships with mortality both for short term(5,6,7) (within the last few days)
and long term measures of particle exposures. (8,9,10) Morbidity and mortality effects appear to be more strongly related to smaller (<2.5 µm) predominatly combustion-related particles rather than more coarse particles (2.5-10 µm) that are primarily crustal in origin, and the effects seem to be concentrated among respiratory and cardiovascular causes of death.(11)
Part of the explanation for the persistent epidemiological findings of associations between mortality and morbidity with relatively modest exposures to airborne particles is that some people may be very much more susceptible to particle-induce responses than others. Therefore one part of the long term national research program(12) devoted to further assessment of
health effects of particulates is directed toward defining “susceptible subgroups” and quantitatively assessing the extent of variability in susceptibility in our diverse human population.
This paper assembles a database of quantitative observationsof interindividual variability in pharmacokinetic and pharmacodynamic parameters likely to affect responses to both particles and other agents delivered via the respiratory system.
4

Broadly, the presentation is divided into categories of breathingrates/activity patterns, local pharmacokinetics (deposition and clearance from the respiratory system), and local pharmacodynamics (differences in external exposures or internal doses needed to produce some degree of physiological parameter change or some defined incidence of a quantal response). This breakdown and the basic techniques for analysis are similar to those used in earlier work focusing on variability in general forboth systemic and local toxic effects. (13,14) As with that work,
we are committed to open dissemination of the underlying basic data and analyses (in the form of Excel spreadsheets) via email requests to the first author or via our web site (www.clarku.edu/~dhattis).
2. A Quantitative Map for Variability InformationBefore beginning the detailed presentation of methodology
and results, it is helpful to give the reader a general roadmap for the meaning of the variability numbers that are derived, and the general trend of the results. Briefly, we summarize the variability data in terms of a lognormal distribution statistic—the standard deviation of the logarithms to base 10 of the valuesof each parameter studied--abbreviated log(GSD) for the log10(Geometric Standard Deviation). One can think of a log(GSD)
as the fraction of an order of magnitude (factor of 10) traversedby one standard deviation of a lognormal population distribution.Table 1, reprinted from earlier
5

Table 1A Scale For Understanding Lognormal Variability--Fold Differences Between Particular
Percentiles of Lognormal DistributionsLog
10(GSD) Ln(GSD) Geometric Standard
Deviation (GSD)5%-95% Range (3.3geometric standard
deviations)0.1 0.23 1.26 2.1 fold0.2 0.46 1.58 4.5 fold0.3 0.69 2.0 10 fold0.4 0.92 2.5 21 fold0.5 1.15 3.2 44 fold0.6 1.38 4.0 94 fold0.7 1.61 5.0 200 fold0.8 1.84 6.3 430 fold0.9 2.07 7.9 910 fold1 2.30 10.0 1,900 fold1.1 2.53 12.6 4,200 fold1.2 2.76 15.8 8,900 fold
work,(14) allows the reader to translate between specific amounts of variability expressed as Log(GSD) values and a few other formsfor expression that different researchers may find more familiar or intuitively clear. The fourth column of Table 1 shows a translation into “range factors” (commonly used in engineering and radiation risk assessment)—the ratio of the 95th percentile to 5th percentile.(15) As discussed earlier, (14) this column
provides a crude indicator of the amount of dosage reduction thatwould be required to go from an incidence level that is not inconsistent with a NOAEL (approximately 5%) and an incidence of somewhat less than 1 in a million, making the extreme assumption
6

that a single unimodal lognormal distribution characterizes the population variability out to the extreme tail of the underlying distribution.
Foreshadowing the presentation of the detailed results below, the human interindividual variability of breathing rates and the major pharmacokinetic parameters--total deposition, and tracheobronchial clearance are each generally in the region of Log(GSD) of 0.1 to 0.2, although variability in deposition to thedeep lung (alveolar region) appears to be higher—in the area of 0.3. Turning to pharmacodynamics, changes in FEV1 in response toozone and metabisulfite (another agent that is said to act primarily on neural receptors in the lung) are also in the regionof 0.2 to 0.4, whereas FEV1 changes in response to methacholine—an agent that acts on smooth muscle, seems to have more variability with observations ranging all the way from 0.4 to somewhat over 1.0, depending on the type of population studied. Similar high values are also suggested for such agents as wheat flour dust for occupationally exposed bakers.
3.Breakdown of Variability Information by Causal StepsOur principal observations appear in this section.
Subsections 3.1-3.3 provide key information on pharmacokinetic variability--inhalation rates in 3.1, deposition in 3.2, and clearance in 3.3. In this paper we do not address a fourth pharmocokinetic phenomenon – uptake and delivery of toxic components of inhaled particles to other organs. Our focus in this paper is on implications for respiratory health and we concentrate on exposures to various parts of the respiratory
7

system. Subsections 3.4-3.5 then continue with information aboutpharmacodynamic variability--acute respiratory responses in 3.4 and chronic respiratory responses in 3.5.
3.1. Activity Patterns/Inhalation Rates
Two approaches are currently used in estimating inhalation rates. One due to Layton(16) is based on metabolic rates. A
second is based on measurements made at controlled activity levels, followed by estimation of patterns of activity for different people in specific population groups. The two approaches appear to differ in their predicted average magnitudesfor breathing rate; however, the concern within this paper is with variability, which this does not depend on absolute average magnitude.
We draw our breathing rate variability estimate from activity pattern studies. Figure 1(13) shows probability plots for distributions of estimated breathing rates (adjusted for bodyweight) in children and adolescents/adults from one-day records of activity patterns as analyzed by the
8

Figure 1
3210-1-2-32.0
2.2
2.4
2.6
2.8
3.0
Children ≤ 12 YrsAdolescents and Adults
Lognormal Distributions of Cal-EPA Estimated1-Day Activity-Based Breathing Rates
Z-Score
Log(L/kg Body Weight) EstimatedActivity-Based Ventilation Rates
y = 2.66 + .0618x R^2 = 0.983y = 2.36 + 0.117x R^2 = 0.940
Data Source: California Environmental Protection Agency(17)
California Environmental Protection Agency. (17) In this kind of
plot the slope of the regression line is an estimate of the log(GSD) and the adherence of the points to the regression line provides a quick qualitative indicator of the fit of the data to the underlying (in this case, lognormal) distribution.(18,19) It
can be seen that the log(GSD) for the children’s activity-estimated breathing rates--approximately 0.06--is considerably less than the corresponding measure of variability for the adults’ breathing rates--approximately 0.12--indicating that children are apparently more uniform (less variable) than adolescents/adults. This can be understood by noting that the children’s line, in addition to having a shallower slope, is alsolocated considerably above the line for adolescents/adults.
9

Children evidently tend to have relatively uniform high levels ofactivity, but the group of adolescents/adults contains appreciable numbers of individuals whose activity levels (and corresponding breathing rates) have considerably slowed from the time they were younger.
3.2. Deposition at Various Locations in the Respiratory System
The deposition of particles at different locations in the respiratory system can have very different implications for health. Thus the total fraction of particles deposited does not carry the full information needed for assessing effects. Yet theavailable information on deposition in particular regions is quite incomplete; furthermore deposition in one region of the lung depends on what happens in other regions. Accordingly we have developed a two-pronged approach to estimating variability in both total and regional deposition. One portion of the analysis is based directly on available deposition studies. The second involves simulations using the ICRP model for the respiratory system(20) which we relate to the direct deposition
analysis.We have assembled a substantial data set of deposition
observations from several investigators. Deposition is affected by particle size, breathing rates and anatomical dimensions. Ninestudies were found that provided complete individual data (Table 2)—covering a total of over 800 subject-observations, ages 3 to 68. Particle sizes range from 0.02 to 7.9 µm. Breathing was spontaneous in seven of these studies and controlled at differentcombinations of tidal
10

Table 2Basic Characteristics of Human Experimental Studies of Deposition
and Its VariabilityData Source No. of
subjects
AgeRange
(years)
Particle Size(micron
s)
Breathing Characteristics
Regions of Deposition
Comments
Lippmann and Albert,
1969(21)
32 21-68
1.3-7.9 spontaneous Vt(tidal volume); T (breaths/min) = 14
mouth, pharynx/larynx, trachea/bronchi, alveoli
Total deposition results were close to 100%and particle size varied —excluded fromcombined estimate of variability
Giacomelli-Maltoni et
al., 1972(22)
25 24-47
0.25-1.8
nasal breathing, spontaneous + controlled at various levels
total Used for combined estimate of variability
Anderson et al
1990(23)
5 31-59
0.02-0.24
T = 12 total Used for variability estimate for controlled breathing only
Heyder et al
1982(24)
20 Adult
1-7 spontaneous total Used for combined estimate of variability
Tarroni et
al., 1980(25)
6 31-45
0.3-1.5 Vt = 1 L, T = 15
total Used for variability estimate for controlled breathing only
Bennett et
al., 1985(26)
5 21-25
2.6 spontaneous total and lung
Used for combined estimate of variability
Bennett and Smaldone,
1987(27)
10 20-33
2.6 spontaneous total Used for combined estimate of variability
11

Schiller-Scotland et
al. 1994(28)
29 3-14 1.0-3.0 spontaneous + controlled
total Used for combined estimate of variability
Bennett and
Zeman, 1998(29)
39 7-35 2 spontaneous total Used for combined estimate of variability
12

volume and breath frequency in four (two studies tested both
arrangements). Lippman and Albert(21) provide a rich data set
which we used selectively. Their total deposition results were
high (mean of 93%); this might indicate measurement error, and in
any event such high fractional deposition creates problems with
the 1-hit transformation described below. We therefore excluded
these data from our combined estimate of variability. We did use
this data set as a possible indicator of relative variability
among respiratory regions and to estimate clearance variability.
Because deposition is naturally limited to 100% it cannot be
expected to behave as a lognormal variable in itself. However
one can imagine that people have multiplicative differences in
various characteristics that lead to lognormal variability in an
underlying tendency toward deposition (Dt), where deposition is
represented as a Poisson process characterized by mean
“deposition hits” per particle. Particles that come into contact
with the moist surface of an airway and stick to it are unlikely
to be reentrained into the airstream. Therefore we model the
fraction of particles that are deposited as the fraction that
receive one or more deposition “hits” or encounters with the
airway walls as:
13

fraction deposited = fraction with 1 or more "deposition hits" = 1 - fraction with 0 "deposition hits"= 1 - e-Dt where Dt is the number of "deposition hits" per particle
rearranging,Dt = "deposition hits"/particle = -ln(1 - fraction deposited)
Dt, so defined, is unbounded and, we find, can be represented with ordinary lognormal distribution statistics. [Figure 2 showsa typical probability plot. The example is a set of
14

Figure 2Probability Plot Showing Lognormal Fit of a Typical Set of
Transformed Deposition Data Particles by Giacomelli-Maltoni etal., 1972)
15
Object 2

measurements by Giacomelli-Maltoni et al. (1972) (22) of total deposition in 21 adults spontaneously breathing 0.5 µm particles;the logarithms of the inferred deposition tendencies for each subject are plotted against their z-scores showing a reasonably good fit to a lognormal distribution.]
Log(GSD) results for controlled breathing studies are shown in Table 3. Similar distributions are found for studies using spontaneous breathing, summarized in Table 4. It can be seen that controlling the pattern of breathing reduces variability in deposition, and therefore that some of the variability during spontaneous breathing is attributable to differences in breathingpattern.
As indicated in Table 2, there are only limited data on deposition in particular regions of the respiratory system. Moststudies show total deposition to be less variable than at least one region, and not more variable than any region, but the relative variabilities between regions are not consistent among studies. In the data of Lippman and Albert(21) for example (these are shown in Table 5 below), regional deposition variability is clearly greater than total deposition variability at all particle sizes. Data from Pritchard et al.(30) (not
shown) also show extrathoracic and tracheobronchial deposition variability to be substantially greater than total or alveolar deposition; alveolar deposition was only slightly more variable than total deposition. Data from Kim and Hu(31) (also not shown)
show variability in upper airway deposition to be substantially greater than total deposition variability, and tracheobronchial variability to be slightly greater than total variability. Total
16

and alveolar variability were similar in this case. Bennett et al.,(26) on the other hand, show very similar variability in totaldeposition and retention at 24 hours, a commonly used proxy for deposition in the non-ciliated airways.
Because individual measurements of regional deposition are sparse, we developed an alternative, model-based, approach to assessing interindividual variability for deposition in particular regions of the lung. Our starting point was the lung model developed by the International Commission on Radiological Protection (ICRP).
17

Table 3Interindividual Variability in Total Respiratory Deposition in
Studies with Controlled Breathing
Source Particlesize
(microns)
TidalVolume(Vt)liters
Breaths/min. (t)
Meandepositio
nfraction(Df) (forvariousparticlesizes,
experimental
protocols)
Number ofsubjects
Log(GSD)of [-
ln(1-Df)]
Anderson et al 1990 (23)
.02-0.24 Notstated
12 39-54% 5 0.071
Giacomelli-Maltoniet al 1972 (22)
0.25-1.8 0.75-2.0 6-20 18-72% 25 0.134
Schiller-Scotland et al 1994 (28)
1.0-3.1 0.5 30 17-71% 20 0.132
Tarroni et al 1980 (25)
0.3-1.5 1.0 15 12-29% 6 0.149
Combined estimate of variability Log(GSD)
56 0.131
18

Table 4Interindividual Variability in Total Respiratory Deposition in
Studies with Spontaneous Breathing
Source Particle size(microns)
Meandeposition
fraction (Df)(for variousparticlesizes,
experimentalprotocols)
Number ofsubjects
Log(GSD) of [-ln(1-Df)]
Bennett et al 1985(26)
2.6 30% 5 0.334
Bennett and Smaldone 1987(27)
2.6 25% 10 0.334
Bennett and Zeman 1998(29)
2.0 21% 39 0.150
Giacomelli-Maltoni et al 1972(22)
0.25-1.2 21-48% 25 0.137
Heyder et al 1982(24)
0.33-1.1 11-79% 20 0.130
Schiller-Scotland et al1994(28)
1.0-3.1 18-63% 29 0.162
Combined estimate of variability Log(GSD)
128 0.178
19

The ICRP published its first dosimetric lung model in 1960. It assumed that 50% of inhaled particles would deposit in the upper airways, 25% would deposit in the respiratory regions of the lung, and 25% would be exhaled.(32) Since then, theoretical
and experimental information has increased dramatically and the most recent model(20) is much more complex. Results presented inan appendix of the 1994 report include regional and total deposition fractions for 19 particle sizes between 0.0006 and 20 m, for males and females between the ages of 3 months and ‘adult’, and for a few different levels of exertion, from sleeping to heavy exercise. The predictions for total depositionare generally consistent with the (rather broad) range of values shown in Table 2. For characterizing deposition in specific regions, the respiratory tract is modeled as a series of seven filters, each with its own efficiency for removing particles. The regions are ET1 = extrathoracic – nasal, ET2 = extrathoracic – mouth and pharyngeal, BB = tracheobronchic, bb = bronchiole, and A1 = alveolar-interstitial. In addition to deposition, the ICRP model treats uptake of toxic substances from each region of the lung and clearance. All of the filters except the alveoli are passed twice, once during inhalation and once during exhalation. The structure of the model is shown in Figure 3.
Figure 3
The Structure of the ICRP Respiratory Model, Represented as aSeries of Filters
20

ET1 ET2 BB bb Al ET1ET2BBbb
inhaledair
exhaledair
The model incorporates empirically and theoretically derivedparameters for regional lung volumes, breathing patterns, airway dimensions, and 66 other characteristics. The model predictions do not explicitly include inter-subject variability within the subgroups (e.g. variability among sleeping 15 year-old girls) although the publication does give suggestions on including random terms for what it calls “stochastic uncertainty”. “Stochastic uncertainty” in this sense incorporates what we interpret as inter-individual variability together with intra-intervidual variability. These “uncertainties” have been extensively reviewed in a thesis by Huston.(32)
Our approach to representing variability in deposition in each region was to treat each stage of the filter (Figure 3) as aPoisson process with a deposition tendency (as defined earlier) and to assume that the deposition tendencies could each be represented by a lognormal distribution. While the combined distribution is no longer analytically the same as one represented by a lognormally distributed total deposition tendency (as in Figure 2), the differences are not distinguishable for the values of the parameters that we use to fit the data in this analysis. Such a representation of regionalvariability has more parameters than can be fit with the existingdata: there are the magnitudes and variability of each region’s deposition tendency and the possibility of correlations among them. Therefore, we ran Monte Carlo simulations (using Crystal
21

Ball®(33) software) for several scenarios intended to illustrate
reasonable possibilities for regional deposition that are consistent with the existing data on total deposition and the very limited information on regional deposition. Thus each respiratory region (filter) was assigned a particle trapping efficiency based on the total deposition results presented in theICRP tables. Based on these ICRP central tendency estimates, a median deposition tendency was then derived. In the model, the deposition tendency for each filter was represented by a lognormal distribution with these medians and variabilities needed to correspond to the total deposition variability derived in Table 4. The lognormal distributions for deposition tendency for each filter were sampled randomly, and used to generate predictions of the variability in deposition in each lung region that would be consistent with the observed variability in total deposition.
A further issue was the possibility of correlation among thevarious filters. Such correlation reflects a situation in which the regions of the respiratory tract might vary together, so thatsome people retain relatively less inhaled matter for all filters/regions and some retain systematically more. An assumption of no correlation reflects a situation in which the regions vary independently. (Of course negative correlations canalso be imagined.) The ICRP publication suggests that the regions are in fact independent and should therefore not be correlated. In this case, since smaller deposition rates in one region automatically provide more particles for deposition elsewhere, regional deposition variability can be expected to be
22

greater than total deposition variability. (At the opposite extreme, if there is perfect positive correlation among the efficiencies in all of the regional filters, the regional variabilities will be essentially the same as total deposition variability—modified only by the alteration of distributional shape caused by the fact that a sum of lognormal distributions isnot itself perfectly lognormal.).
Our initial round of simulations tested the outcome (total and regional deposited fractions) assuming that all filters had the same variability in their regional deposition tendencies, andthere were no correlations among them. In this way we developed estimates of how much variability in the efficiency of regional filters produces simulated total deposition variability close to what is observable in the experimental data. Our combined analysis of experimental data indicates that the distribution of total deposition tendency should show a log(GSD) of approximately0.18 (Table 4). The studies used in deriving this estimate used particles 1-3 microns in diameter and had subjects in a resting mode. We ran the model for resting adult males inhaling 2-micronparticles. To create a distribution of total Dt that had a log(GSD) of 0.18, we had to define the distributions of regional Dt with log(GSD)s of 0.30. The distinguishing assumption for this first analysis is that variability is similar in magnitude among filters; other combinations of regional variabilities couldalso predict the same total deposition variability.
As an experiment with a non-uniform application of variability to regions, we next tried to recreate the variabilityseen in the Lippman and Albert data. (21) One reason that this
23

rich set of data was left out of our combined analysis was that particle size wasn’t controlled among tests. It was recorded, however, and we segregated the deposition data into particle sizeranges for this experiment. The 2-3 micron particle tests (n=6) showed a total Dt log(GSD) of 0.15 and an alveolar Dt log(GSD) of0.20. The 3-4 micron tests (n=20) showed a total log(GSD) of 0.13 and an alveolar log(GSD) of 0.32. This subset of their dataset is in rough agreement with the modeled and observed variability assumptions. For our model analysis we combined the variability observed for the two size ranges. If the regional filtering efficiencies are sampled from input distributions with log(GSD)s of 0.29 (extrathoracic), 0.11 (tracheobronchial and bronchiolar) and 0.28 (alveolar), the predicted regional deposition variabilities are distributed as shown in Table 5:
Table 5Regional Deposition Variability Comparing Simulations with
Measurements
Region FittedOutput
log(GSD)s
Measured log(GSD)s (21)
Extrathoracic 0.30 0.31Trachea/bronchi/bronchioles
0.16-0.18 0.19
Alveoli 0.30 0.30total 0.17 0.13
The correspondence is satisfactory; however, it shows only that avariety of variability assumptions will represent the limited data now available. The qualitative result that greater
24

variability is to be expected in particular regions seems well supported.
The lesson from these exercises is that if health effects are linked to deposition in specific regions, then total deposition variability values may significantly underestimate region-specific variability. Specifically, we can tentatively conclude that alveolar deposition can be described with a log(GSD) of approximately 0.3, which implies approximately a 10 fold difference between the 5th and 95th percentiles of the human population (see Table 1).
3.3. Clearance
Particulate clearance is another key exposure factor whose variability can be estimated, albeit with limited data. Clearance data can be found in a subset of the papers providing deposition data and in a few separate studies. These data are reviewed in ICRP 66.(20) As a crude summary of a number of complex processes with as yet uncertain dynamical behavior, particle clearance can be considered as occurring through two basic mechanisms which have quite different time scales: mucociliary clearance, which has a time scale measured in minutesor hours and which occurs primarily in transport regions (extra-thoracic and tracheobronchial), and clearance by phagocytes whichoccurs from deeper in the lungs and is measured over weeks and years. There are very few available data on clearance in humans extending over times longer than a year.(20) However, five of the deposition studies discussed above provide individual short-term clearance data (Table 6). In a weighted multiple regression
25

analysis using the Log[log(GSD)] as the dependent variable it wasfound that particle size and time at clearance measurement were not significant factors in predicted clearance variability. A dummy variable indicator of health status of the subjects was wassignificantly associated with greater variability, however, so
1 J. M. Samet, S. L. Zeger, and K. Berhane, “The Association of Mortality and Particulate Air Pollution,” in Particulate Air Pollution and daily Mortality—Replication and Validation of Selected Studies—The Phase I Report of the Particle Epidemiology Evaluation Project, Health Effects Institute, Cambridge,MA, August, 1995.
2 J. M. Samet, S. L. Zeger, J. E. Kelsall, J. Xu, and L. S. Kalkstein, “Air Pollution, weather, and Mortality in Philadelphia 1973-1988,” in Particulate Air Pollution and Daily Mortality—Analyses of the Effects of Weather and Multiple Air Pollutants—The Phase I.B Report of the Particle Epidemiology Evaluation Project, Health Effects Institute, Cambridge, MA, August, 1995.
3 C. A. Pope 3rd, “Mortality and Air Pollution: Associations Persist with Continued Advances in Research Methodology,” Environmental Health Perspectives 107, 613-614 (1999).
4 C. A. Pope 3rd, D. V. Bates, and M. E. Raizenne, “Health Effects of Particulate Air Pollution: Time for Reassessment?” Environmental Health Perspectives 103, 472-480 (1995).
5 J. Schwartz, “Air Pollution and Daily Mortality. A Review and Meta-Analysis,” Environmental Research 64, 36-52.
6 J. Schwartz, and D. W. Dockery, “Increased Mortality in Philadelphia Associated with Daily Air Pollution Concentrations, American Review of Respiratory Diseases 145, 600-604 (1992).
7 D. W. Dockery, J. Schwartz, and J. D. Spengler, “Air Pollution and daily Mortality: Associations with Particulates and Acid Aerosols,” Environmental Research 59, 362-373 (1992).
8 D. E. Abbey, N. Nishing, W. F. McDonnell, R. J. Burchette, S. F. Knutsen, W. L. Beeson, and J. X. Yang, “Long-Term Inhalable Particles and Other Air Pollutants Related to Mortality in Nonsmokers,” Am. J. Respir. Crit. Care Med. 159, 373-382 (2000).
26

results for healthy subjects and subjects with lung disease are reported separately.
Our analysis of variability in short-term clearance followedthe same approach as the analysis of deposition. Given the limited data, short-term clearance can reasonably be treated as asingle Poisson process and lognormal variability in a “clearance tendency” assessed. The log(GSD)s found are in the same range asthose for deposition. Clearance appears to be more variable in the infirm than in health subjects. Three studies(34,35,36) have a combined population of 89 patients suffering from asthma, bronchitis, and other obstructive lung conditions. The log GSD for this group is 0.34. By contrast, available studies of 43 normal healthy subjects(26,29,34) indicate a combined Log(GSD) for clearance of 0.21 (Table 6).
3.4 Acute Responses
We have been able to gather data for two kinds of acute responses to inhalation exposures of particles and other
9 D. W. Dockery, C. A. Pope III, X. Xu, J. D. Spengler, J. H. Ware, M. E. Fay,B. G. Ferris Jr., and F. E. Speizer, “An Association Between Air Pollution andMortality in Six U. S. Cities,” N. Engl. J. Med. 329, 1753-1759 (1993).
10 C. A. Pope III, M. J. Thun, M. M. Namboodiri, D. W. Dockery, J. S. Evans, F. E. Speizer, and C. W. Heath Jr., “Particulate Air Pollution as a Predictor of Mortality in a Prospective Study of U. S. Adults,” Am. J. Respir. Crit. Care Med. 151, 669-674 (1995).
11 J. Schwartz, D. W. Dockery, and L. M. Neas, “Is Daily Mortality Associated Specifically with Fine Particles?” J. Air Waste Mangement Assoc. 46, 927-939 (1996).
12 National Research Council, Research Priorities for Airborne Particulate Matter: 1. Immediate Priorities and a Long-Range research Portfolio, National Academy Press, Washington, D. C.,1998.
27

irritants—(a) short term reversible changes of specified percentages in baseline lung function (usually FEV1, or corresponding changes in specific airway resistence); (b) reportsof irritation, smell perception or other responses measured on a quantal basis. These are treated in turn below.
15 R. M. Cooke, Experts in Uncertainty Oxford University Press, New York, 1991, p. 282.
16 D. W. Layton, “Metabolically Consistent Breathing Rates For Use In Dose Assessments,” Health Physics 64, 23-36 (1993).
17 Office of Environmental Health Hazard Assessment (OEHHA), Technical Support Document for Exposure Assessment and Stochastic Analysis (Technical Review Draft, California Environmental Protection Agency, Berkeley, Calif., December 1996, available on the web at www.calepa.cahwnet.gov/oehha).
18 K. M. Thompson, “Developing Univariate Distributions from Data for Risk Analysis,” Human and Ecological Risk Assessment 5, 755-783 (1999).
19 D. Hattis and D. E. Burmaster, “Assessment of Variability and Uncertainty Distributions for Practical Risk Analyses,” Risk Analysis 14, 713-730 (1994).
20 ICRP. Human Respiratory Tract Model for Radiological Protection. International Commission on Radiation Protection. NTIS, ICRP 66 (1994).
28

Table 6Interindividual Variability in Particle Clearance
SourceNumber of subjects
Age range (years)
Time (hrs) clearancewas measured
Conditions of subjects(number in subgroup)
Particle size (microns)
Mean clearance
logGS
D
Bennett et al 1985(26) 5 21-
25
2.5, 24 Normal 2.6
13%, 28% 0.076
Laube et al 1986(34)
14Not stated
1.5Normal (6),asthmatics (8)
1.16%, 14%
0.361, 0.370
Lippmann andAlbert (1969) (29)
32 21-68
10, 24 Normal 1.3-7.971%, 78% 0.192
Lourenco et al (1972)(35)
14 24-65
24 bronchiectasis
2.0 73% 0.413
Matthys et al (1983) (36)
67
(all)
5610,
6111
1Chronic bronchitis (30), bronchial carcinoma (37)
Not
stated
15,
20%
0.360
0.296
Combined estimate, subjects with lung disease only
89
0.343Combined estimate, normal subjects only
43
0.213
29

3.4.1 Reversible Changes of Specific Percentages in BaselineLung FunctionData of the first type are by far the most extensive,
particularly for methacholine and histamine as challenge agents. This is because the doses of these materials that provoke specific quantitative percentage changes in lung function (usually FEV1) has been used to define “bronchial responsiveness”in long term epidemiological studies of the consequences of asthma and related inflammatory processes for survival and cardiovascular disease.
The basic observations are summarized by agent in Table 7. It can be seen that overall, the amount of variability indicated is substantial—approximately Log(GSD) = 0.7 when all data are combined, with observations in some large populations of as much as Log(GSD) = 1.3.
The data in Table 7 allow some analysis of acute response variability for different agents. Testing with the agents used inthe largest studies (methacholine and histamine) gives similar estimates of variability [overall Log(GSD) = 0.7 – 0.9]; and thatvariability in turn is broadly comparable to the variability seen
30 J. N. Pritchard, S. J. Jefferies, and A. Black, “Regional Deposition of 2.5to 5.0 m Polystyrene microspheres Inhaled by Women,” Ann Occup Hyg 32 suppl.1,939-946 (1988).
31 C. S. Kim and S. C. Hu, “Regional Deposition of Inhaled Particles in Human Lungs: Comparison Between Men and Women,” J Appl Physiol 84, 1834-1844 (1998).
32Huston, T. Quantifying Uncertainties in Lung Dosimetry with Application to Plutonium Oxide Aerosols. Ph.D. Thesis, University of Florida (1995).
33 Decisioneering, Inc. Crystal Ball Version 4.0, Decisioneering, Inc. Denver,Colorado, 1996.
30

in the more limited data sets for specific allergens. The two agents that appear to lead to appreciably lower estimates of interindividual variability [Log(GSD) of about 0.3] are ozone and metabisulfite. Current understanding is that both of these agents act primarily on neural receptors, rather than on smooth muscle.(37) This tentative mechanistic association warrants
exploration in future delliberately designed comparative studies.The large datasets available in these bronchial challenge
studies allow us to juxtapose the observed threshold distributions with expectations of lognormal models from simple probability plots. Figures 4-9 show these comparisons for the largest datasets in our series (with the exception of the data ofPaoletti et al.(40) where only two dose points were used--making acomparison with a linear plot uninformative). The data for theseplots are generally in the form of the cumulative number of people who have response thresholds at or below a series of exposure concentrations or doses where tests were done. The number of concentrations used is
31

Table 7Observations of Human Interindividual Variability in ExternalConcentrations Needed to Produce Defined Short Term Changes in
Respiratory ParametersA. Observations with Methacholine as the Challenge AgentResponse and Reference Type of
Populationlog(GSD) 5%-95%
Log(GSD)conf.limits
StatisticalWeight =1/variance
ofLog[log(GSD)
]100% increase in baseline
specific airway resistence(38)
66 Healthy athletic adults, 18-50
0.421 .39-.46 1986
PC20-- 20% decrease in FEV1(39) 5733 smokers,
mild/ moderateobstruction
0.642 .59-.70 2157
10%, 15%, and 20% decreases in
FEV1 (40)
748 Females--general population
0.740 .59-.93 276
10%, 15%, and 20% decreases in
FEV1(40)
810 Males--general population
0.998 .80-1.25 280
PC20-- 20% decrease in FEV1(41) 813 nine year
old New Zealand children
1.128 .88-1.45 225
PC20-- 20% decrease in FEV1(42) 490 Norwegian
adults, Age 18-73
0.974 .81-1.17 434
PC20-- 20% decrease in FEV1(43) 15 Allergic
asthmatic patients
0.599 .44-.82 149
PC20-- 20% decrease in FEV1(44) 468 Male veterans
1.088 .92-1.32 440
Summary, All Methacholine Data 0.704 .67-.74 5947
B. Observations with Histamine as the Challenge AgentResponse and Reference Type of
Populationlog(GSD) 5%-95%
conf. forlog(GSD)
StatisticalWeight =1/variance
ofLog[log(GSD)
]PD20-- 20% increase in
individual baseline FEV1(45)
17 Atopic subjects
0.574 .43-.77 170
32

PD20-- 20% increase in
individual baseline FEV1 (46)
876 General rural adult population--Australia
1.331 1.19-1.49 1067
PC10—concentration causing 10%
change in FEV1(47)
1892 general adult population—Holland (afterexcluding 13 who responded to distilled water)
0.536 .49-.58 2126
FEV1/Specific Airway
Resistance—PC20(37)
17 Nonsmoking adults, mild asthma
0.589 .44-.79 170
Summary, All Histamine Data 0.861 .81-.92 3560
33

Table 7, ContinuedObservations of Human Interindividual Variability in ExternalConcentrations Needed to Produce Defined Short Term Changes in
Respiratory Parameters
C. Observations with AllergensResponse and Reference Agent Type of
Populationlog(GSD) 5%-95%
conf.for
log(GSD)
StatisticalWeight =
1/variance ofLog[log(GSD)]
PC15, 15% decrease in FEV1, mean with and
without ozone(43)
Grass allergen
9 Allergic asthmatic patients
0.507 .34-.76 85
PC15, 15% decrease in FEV1--mean with and
without ozone(43)
Ragweedallergen
6 Allergic asthmatic patients
0.780 .46-1.31 53
PC20-- 20% decrease in
FEV1(45)
Ragweedallergen
Atopic subjects
0.764 .55-1.07 127
FEV1/Specific Airway
Resistance--PC50(48)
Wheat flour dust
34 Bakers— occupationally exposed
1.329 .30-5.84 7
FEV1/Specific Airway
Resistance--PC50(48)
Wheat flour extract
34 Bakers--occupationally exposed
1.109 .28-4.36 8
Summary, All Specific Allergen Data
0.731 .58-92 280
D. Observations with Other AgentsParameter Agent Type of
Populationlog(GSD) 5%-95%
conf.for
log(GSD)
StatisticalWeight =
1/variance ofLog[log(GSD)]
FEV1 change in relationto CXT of ozone exposure (5, 10, 15%)(49,50)
Ozone Experimentalsubjects
0.321 .28-.37 761
Maximal FEV1 Increase by Antiasthmatic(51)
Salbutamol
14 Asthmatics
0.431 .31-.61 120
FEV1/Specific Airway
Resistance—PC20(37)
Meta-bisulphite
18 Nonsmoking adults with mild asthma
0.275 .21-.36 180
Summary, All Data for 0.328 .29-.37 1062
34

Other Agents
Combined Data, All Short Term Lung Function Changes for All Agents
0.733 .71-76 10695
35

reflected in the number of data points on each plot. [As in prior work,(14) where data were presented in histogram or cumulative distribution form, the central log(GSD) estimates and confidence ranges presented in Table 7 were derived using a spreadsheet based likelihood estimation procedure published by Haas.(52) This is why the slopes in Figures 4-9—derived by
ordinary unweighted least squares estimates from the data points—differ slightly from the central log(GSD) estimates in Table 7].
In general lognormal distributions, represented by the fitted lines in Figures 4-9, provide a reasonably good description of the available data. The slopes of the lines covera considerable range, presumably reflecting differences in the populations studied (as well as possible differences in measurement errors in the different surveys). Nevertheless, the absence of any apparent pattern of systematic departures from lognormal expectations in these substantial data sets tends to support the use of this simple distributional model form for riskprojections.
3.4.2 Exposure Levels Associated with Reports of Irritation,Smell Perception or Other Responses Measured on a Quantal BasisObservations of these types are summarized in Table 8. It
can be seen that these data sets are generally from much more limited numbers of people than those in Table 7 for defined percentage changes in lung function. A further concern is that these data are derived from the incidence of subjective reports of symptoms. Despite these limitations, the aggregate log(GSD)
36

derived from these data is similar to that indicated for lung function-based studies at about 0.7.
3.5 Variability in Chronic Responses
There are only very limited data at present bearing on the interindividual variability of chronic respiratory responses to particulate exposures. In previous work, we used data from
37
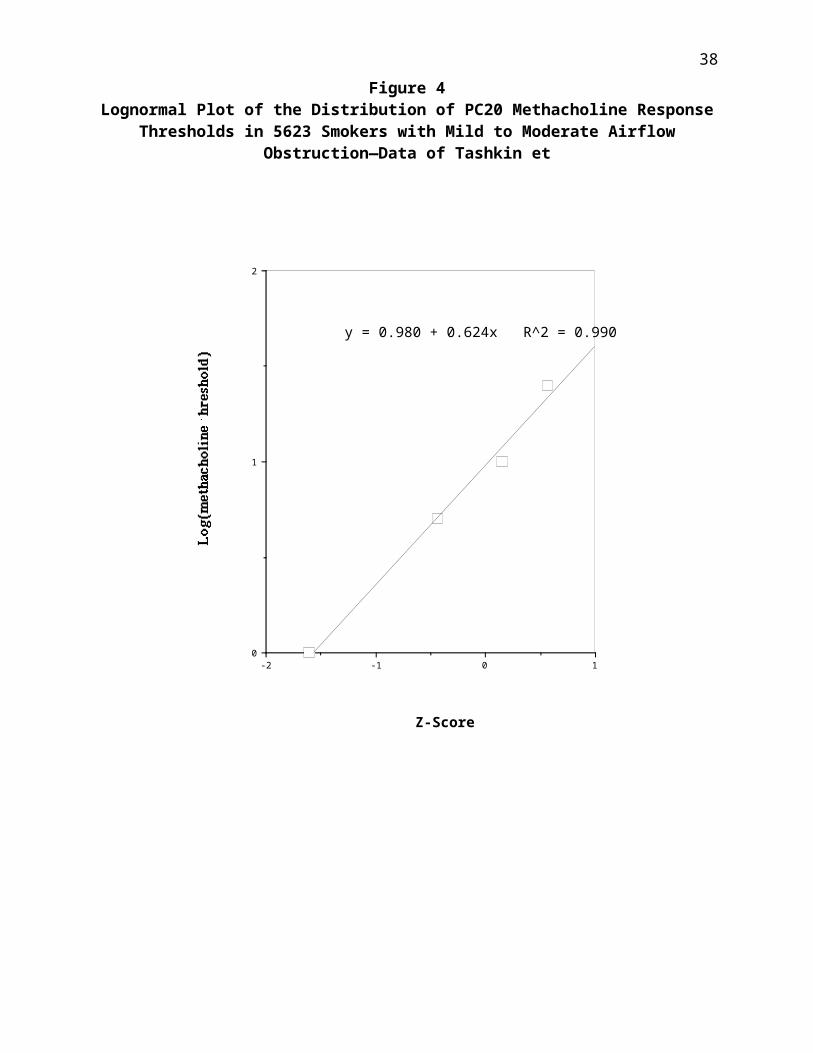
Figure 4Lognormal Plot of the Distribution of PC20 Methacholine Response
Thresholds in 5623 Smokers with Mild to Moderate AirflowObstruction—Data of Tashkin et
38
10-1-20
1
2
Z-Score
Log(methacholine threshold)
y = 0.980 + 0.624x R^2 = 0.990

Figure 5Lognormal Plot of the Distribution of PC10 Histamine ResponseThresholds in 1892 Randomly Selected Adults from Two Dutch
Communities (13 Who Responded to Distilled Water Were Excluded)—Data of Rijcken et al. (1987)(47)
39
0-1-2-30
1
2
Z-Score
log(PC10 Histamine Concentration mg/ml)
y = 1.62 + 0.600x R^2 = 0.991

Figure 6Lognormal Plot of the distribution of Histamine PC20 Response
Thresholds in 876 Rural Australian Adults—Data of Woolcock et al.(1987)(46)
40
0-1-2-30
1
2
Z-Score
log(PC10 Histamine Concentration mg/ml)
y = 1.62 + 0.600x R^2 = 0.991

Figure 7
Lognormal Plot ofr the Distribution of PC20 MethacholineResponse Thresholds of 813 New Zealand Nine Year Old Children—
Data of Sears et al. (1986)(41) 41
0-1-2-3-1
0
1
2
Z-Score
log(methacholine threshold)
y = 2.33 + 1.16x R^2 = 0.998

Figure 8Lognormal Plot of Methacholine PC20 Response Thresholds—Data of
Bakke et al. (1991),(42) Ages 18-73, Both Sexes
42
-0.8-1.0-1.2-1.4-1.6-1.8-2.0-2.20.0
0.5
1.0
1.5
2.0
Z-Score
Log(Methacholine PC20 g/L)
y = 2.39 + 1.004x R^2 = 0.992

Figure 9Lognormal Plot of Methacholine PC20 Response Thresholds---Data of
O’Connor et al (1987)(44) for 465 Men Participating in theVeterans Administration Normative Aging Study
43
0-1-2-3-1
0
1
2
Z-Score
log(µmole Methacholine PD20)
y = 2.14 + 0.994x R^2 = 0.991

Table 8Observations of Respiratory Pharmacodynamic Variability At Sitesof Direct Contact—Variability in the Inhalation Exposure LevelsNeeded to Cause a Given Reported Response in Different People
Parameter Agent Type of Population
log(GSD) 5%-95%conf.for
log(GSD))
StatisticalWeight =
1/variance ofLog[log(GSD)]
Nasal Dryness(53) Ammonia 10 adult
subjects0.340 .18-.64 36
Throat
Irritation(53)
Ammonia 10 adult subjects
0.156 .10-.25 67
Olfactory cognition--air concentrations needed to produce 3 levels of smell
perception (54)
Diallyl-amine
6-8 young adult volunteer subjects
0.369 .27-.51 142
Nose irritation--slight or
moderate(54)
Diallyl-amine
6-7 young adult volunteer subjects
0.803 .49-1.33 57
Nose irritation--slight or
moderate(54)
Monoallyl-amine
10-14 young adult volunteer subjects
0.459 .26-.82 42
Nose irritation--slight or
moderate(54)
Triallyl-amine
7-17 young adult volunteer subjects
0.735 .59-.91 310
Pulmonary discomfort--"slight"and "moderate" or
more(54)
Triallyl-amine
7-17 young adult volunteer subjects
1.038 .78-1.38 180
Sum, all respiratoryresponses to all agents
0.719 .63-.82 432
44

large population studies(55,56) on the increasing spread of FEV1
levels corrected for confounders in relation to pack years smoking to make estimates of the variability of chronic lung function responses to smoking. The final estimate indicated a modest amount of variability—a log(GSD) of 0.28 with a 95% confidence range of 0.25 – 0.31. Similar analyses are now likelyto be possible based on NHANES III data.(57) This, and similar
studies with fibrinogen, will be pursued in further work.
4. ConclusionsQuantitatively the results to date indicate human
interindividual variability of breathing rates and the major pharmacokinetic parameters--total deposition, and tracheobronchial clearance are generally in the region of Log(GSD) = 0.1 to 0.2. Deposition to the deep lung (alveolar region) appears to be somewhat more variable [Log(GSD) of about 0.3].
Considerable quantitative data indicate that some types of acute pharmacodynamic responses show large enough interindividualvariability that the doses inducing similar responses in different people are spread out over considerably more than one order of magnitude. Central estimates of log(GSD)s for methacholine, histamine, and various allergens are all in the range of 0.70-0.86, corresponding to geometric standard deviations of 5 – 7. At these values, and given the relatively close correspondence between the data and lognormal distributions, people at the 99.9th percentile of sensitivity
45

would be expected to respond at doses that are 53 –73 = 150 – 450times smaller than the dose that would produce similar responses in median (50th percentile) individuals. For studies of variability in short term changes in respiratory parameters in some substantial populations (20% increase in baseline FEV1 of 876 general population rural adults in Australia exposed to histamine, and 813 nine year old New Zealand children exposed to methacholline) observed log(GSD)’s of 1.1 – 1.3 would indicate 99.9th percentile responses at doses 3,000 to over 10,000 times smaller than the doses producing responses in median people. It seems plausible that acute responses with this amount of variability could form part of the mechanistic basis for epidemiological observations of enhanced mortality in relation toambient exposures to fine particles.
AcknowledgmentThis research is supported by a cooperative agreement with
the US Environmental Protection Agency--Assistance Order # CR 827023-01. However, any opinions, findings, and conclusions or recommendations expressed in this paper are those of the authors and do not necessarily reflect the views of the US Environmental Protection Agency.
References
46

47

48

49

50