Psychometric Properties of Three New National Survey of Student Engagement Based Engagement Scales:...
45
MEASURING STUDENT ENGAGEMENT 1 Running Head: MEASURING STUDENT ENGAGEMENT Title: Psychometric properties of three new National Survey of Student Engagement based engagement scales: An item response theory analysis Adam C. Carle, Ph.D. Department of Psychology University of North Florida Jacksonville, FL, USA David Jaffee, Ph.D. Academic Affairs University of North Florida Jacksonville, FL, USA Neil Vaughan Department of Psychology University of North Florida Jacksonville, FL, USA Douglas Eder, Ph.D. Institutional Effectiveness University of North Florida Jacksonville, FL, USA Corresponding Author Address: Adam C. Carle Ph.D. Department of Psychology University of North Florida 1 UNF Drive Jacksonville, FL, 32224 Phone: 904-620-3573 Fax: 904-620-3814 e-mail: [email protected]
Transcript of Psychometric Properties of Three New National Survey of Student Engagement Based Engagement Scales:...

MEASURING STUDENT ENGAGEMENT 1
Running Head: MEASURING STUDENT ENGAGEMENT
Title: Psychometric properties of three new National Survey of Student Engagement based
engagement scales: An item response theory analysis
Adam C. Carle, Ph.D.
Department of Psychology
University of North Florida
Jacksonville, FL, USA
David Jaffee, Ph.D.
Academic Affairs
University of North Florida
Jacksonville, FL, USA
Neil Vaughan
Department of Psychology
University of North Florida
Jacksonville, FL, USA
Douglas Eder, Ph.D.
Institutional Effectiveness
University of North Florida
Jacksonville, FL, USA
Corresponding Author Address:
Adam C. Carle Ph.D.
Department of Psychology
University of North Florida
1 UNF Drive
Jacksonville, FL, 32224
Phone: 904-620-3573
Fax: 904-620-3814
e-mail: [email protected]
MEASURING STUDENT ENGAGEMENT 2
Title: Psychometric properties of three new National Survey of Student Engagement based
engagement scales: An item response theory analysis
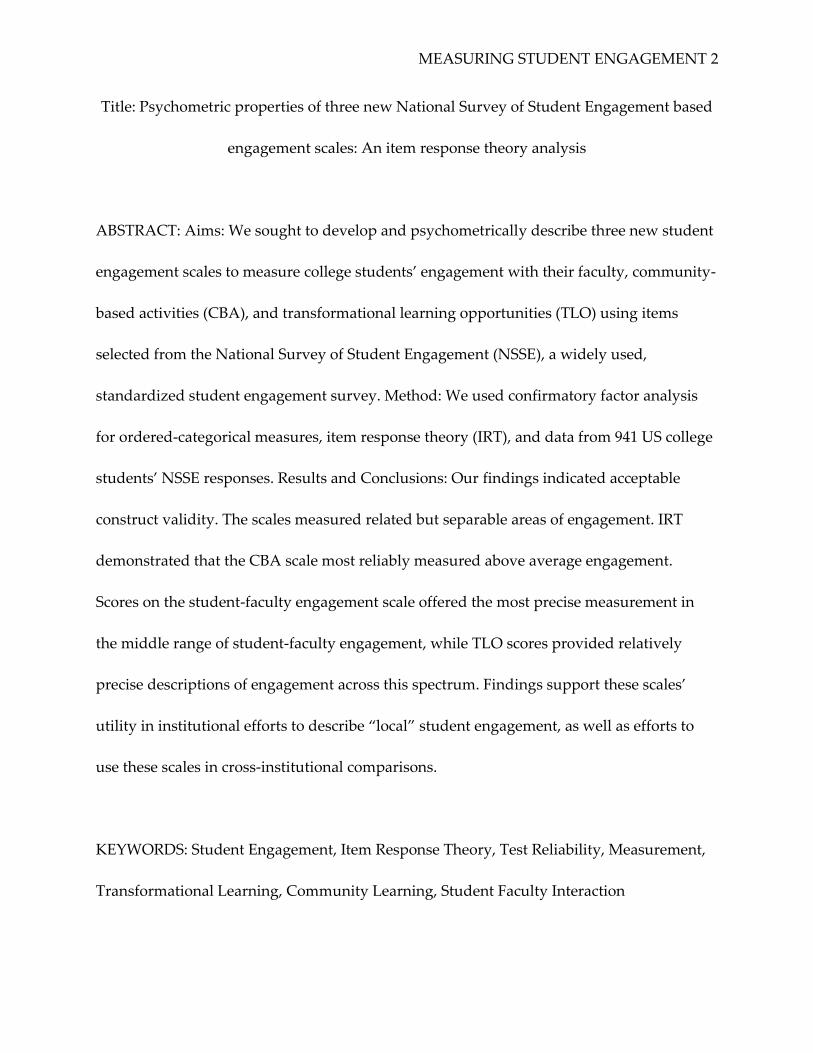
ABSTRACT: Aims: We sought to develop and psychometrically describe three new student
engagement scales to measure college students’ engagement with their faculty, community-
based activities (CBA), and transformational learning opportunities (TLO) using items
selected from the National Survey of Student Engagement (NSSE), a widely used,
standardized student engagement survey. Method: We used confirmatory factor analysis
for ordered-categorical measures, item response theory (IRT), and data from 941 US college
students’ NSSE responses. Results and Conclusions: Our findings indicated acceptable
construct validity. The scales measured related but separable areas of engagement. IRT
demonstrated that the CBA scale most reliably measured above average engagement.
Scores on the student-faculty engagement scale offered the most precise measurement in
the middle range of student-faculty engagement, while TLO scores provided relatively
precise descriptions of engagement across this spectrum. Findings support these scales’
utility in institutional efforts to describe ‚local‛ student engagement, as well as efforts to
use these scales in cross-institutional comparisons.
KEYWORDS: Student Engagement, Item Response Theory, Test Reliability, Measurement,
Transformational Learning, Community Learning, Student Faculty Interaction

MEASURING STUDENT ENGAGEMENT 3
Psychometric properties of three new National Survey of Student Engagement based
engagement scales: An item response theory analysis
Do students engage with their community or with high-impact, transformational
learning opportunities? Do they engage with their faculty? Standardized assessments offer
a tool to answer these seemingly fundamental questions. Among other things, standardized
assessments allow comparisons of student engagement across universities and they permit
investigations of student activities and engagement within specific campus settings. Recent
years have seen the US federal and state governments pushing for empirical evidence that
colleges impact students’ lives and deliver educationally relevant experiences (Klein, Kuh,
Chun, 2005). To address this push requires accurate and informed measurement. As a
result, universities need psychometrically sound and substantively meaningful measures of
student activities and engagement. Despite this need, too few standardized assessments of
student engagement exist, and, for those that do, too little information about the
measurement (psychometric) properties of the scales occurs (Gordon, et al, 2008). This is
especially problematic given that a large and growing body of literature demonstrates a
relationship between student engagement, ‚the time and energy students devote to
educationally sound activities inside and outside of the classroom‛ (p. 25; Kuh, 2003), and
positive educational outcomes (Pascarella & Terenzini 1991; Astin, 1993). Among other
things, this literature suggests that more deeply engaged students demonstrate high
graduation rates, better grades, and report greater levels of educational satisfaction (Astin
& Sax, 1998; Astin, Vogelgesang, Ikeda, & Yee, 2000; Kuh, Kinzie, Schuh, Whitt, &

MEASURING STUDENT ENGAGEMENT 4
Associates, 2005). Thus, it would seem essential to measure student engagement well. With
sound measurement, universities could confidently evaluate the extent to which their
students engage in different activities and the extent to which new policy affected student
engagement. They could also compare local outcomes to outcomes at other institutions.
To begin to address these concerns and better understand the connection between
student engagement and institutional structure, as well as provide institutions with the
information they need to demonstrate effectiveness, Kuh (2001) developed the National
Survey of Student Engagement (NSSE). Based on Pace’s (1984) discussions of student effort
and Chickering and Gamson’s (1987) ‚Seven Principles of Good Practice in Undergraduate
Education, ‛ the NSSE uses a rigorous, standardized format to provide universities with a
wealth of student reported information about students’ levels of engagement in
educationally relevant activities inside and outside the classroom. As a function of its
widespread use and standardized administration (Kuh, 2001, 2003; 2005; Kuh, et al., 2005),
the NSSE provides universities with an excellent mechanism to compare local findings to
universities throughout the nation and evaluate the effects of local policy. Additionally, a
number of universities and investigators have capitalized on the wide range of the NSSE
items to develop scales measuring specific engagement concepts (Pike, 2006a; 2006b; Kinzie
& Evenbeck 2008; Kuh, Gonyea, Nelson, Laird, & Kinzie, 2008).
Sadly, given its possibilities and widespread use, too few investigations have
examined the reliability and validity of the NSSE or NSSE based scales (Gordon, et al.,
2008). Although some studies have addressed whether the NSSE benchmarks correspond to

MEASURING STUDENT ENGAGEMENT 5
learning outcomes (Carini, Kuh, & Klein, 2006; Gordon, et al., 2008), an informed discussion
of the relationship between the NSSE based engagement estimates and learning outcomes
requires psychometric information addressing the reliability and construct validity of the
NSSE items and scales. Without this information, it remains unclear whether the concepts
measured by the NSSE actually correspond to learning outcomes and institutional
effectiveness, or whether findings reflect measurement error. For example, a lack of
correspondence between the NSSE measurement and outcomes could reflect unreliable
measures, inappropriately assembled scales based on the NSSE items, or other
psychometric problems rather than poor institutional effectiveness. Likewise, observed
relationships, or failures to observe strong relationships, may reflect measurement error
(e.g., lack of reliability) rather than true relationships. Thus, institutions and investigators
need studies addressing the psychometric properties of scales based on the NSSE items to
answer seemingly fundamental questions about institutional effectiveness and the
relationship between student engagement and academic success. When authors conclude
based on the NSSE results that students highly engaged in high-impact, transformational
learning opportunities tend to experience better educational outcomes and subsequently
recommend that universities expend resources to insure that all students can experience at
least one of these experiences before they graduate (Kuh, et al., 2008), institutions need to
know how whether these findings represent true relationships or measurement error.
Moreover, institutions need to know how well the NSSE provides information on their local
efforts to provide high-impact experiences.

MEASURING STUDENT ENGAGEMENT 6
Unfortunately, our literature review uncovered only two peer-reviewed empirical
studies that directly addressed the psychometric properties of any of the NSSE items or
scales. In these two studies, Pike (2006a; 2006b) used generalizability theory to describe the
psychometric properties of and the convergent and discriminant validity of the NSSE based
scalelets. Generally, he used four to five NSSE items to develop focused measures of
student learning based on the NSSE items and showed that universities can dependably use
the scalelets with 20-50 students. These two studies reinforce that for some topics, the NSSE
provides dependable measurement, but the studies do not address the psychometric
properties of several important engagement topics that have emerged in the literature:
high-impact or transformational experiences, community based learning experiences, and
student-faculty interactions. This leaves relatively unclear how well the NSSE measures
these concepts. It leaves unclear what items universities might use to create scales to assess
these concepts, if they can at all. And, it leaves unresolved whether findings describing the
importance of engagement in transformational learning opportunities (Kinzie & Evenbeck
2008; Kuh, Gonyea, Nelson, Laird, & Kinzie, 2008), community based activities (Kinzie &
Evenbeck 2008; Kuh, Gonyea, Nelson, Laird, & Kinzie, 2008), and student-faculty
interactions (Astin, 1993; Kuh, et al., 2005; Pascarella and Terenzini 1991) reflect true
findings or measurement error.
Our study sought to address this concern. Given widespread interest in the research
field and an institutionally based need, we sought to use item response theory (IRT) and
confirmatory factor analysis (CFA) to empirically establish the psychometric properties of

MEASURING STUDENT ENGAGEMENT 7
three new scales areas based on three sets of items selected from the NSSE measuring the
extent to which students engaged in: transformational learning opportunity experiences,
community based learning experiences, and student-faculty interactions. First, we sought to
investigate the construct validity of the newly developed NSSE based scales. We asked, ‚do
the NSSE items addressing transformational learning experiences, community based
learning, and student-faculty interactions form conceptually relevant, separable scales?‛
Second, based on our findings, we sought to describe the measurement properties of the
NSSE based scales measuring transformational learning experiences, community based
learning, and student-faculty interactions. We asked, ‚do the items and scales provide
reliable measurement? And, if so, at what levels of engagement do they provide their best
measurement?‛ Finally, based on our findings, we sought to provide examples of how
universities might use the psychometric information resulting from our study to evaluate
program efforts at their local institution and compare themselves to other institutions.
Summarily, our study intends to inform universities wishing to use the NSSE to evaluate
the extent to which their students engage in transformational learning experiences,
community based learning, and student-faculty interactions. No other published studies yet
address the psychometric properties of these concepts using IRT or CFA. We intend to
allow institutions that use the NSSE to provide psychometrically informed, empirically
based answers to questions concerning the extent to which their students engage with the
community, transformational learning opportunities, and faculty.
Methods

MEASURING STUDENT ENGAGEMENT 8
Participants: Participants (n = 373 freshman; n = 567 seniors) came from our university’s 2006
administration of the NSSE. At this midsized, urban, comprehensive, southeastern, public
institution totaling 13,410 undergraduates, the students primarily indicated their ethnicity
as Caucasian (76%), though noteworthy diversity existed: African-American (10%),
Hispanic (6%), Asian/Pacific Islander (5%), American Indian/Alaskan Native (1%), other
(2%). Males comprise approximately 42% of the students. The sample used here reflected
these distributions.
Procedures: Our university worked directly with the NSSE at the University of Indiana,
Bloomington to administer the survey. Our university provided the NSSE with a complete
list of all first-year and senior students. From this, the NSSE selected a random sample of
students (½ first years, ½ seniors) and mailed each student a letter from our institution
inviting them to participate in the NSSE administration. Students also received either a
copy of the survey (return postage paid) or an electronic invitation to complete a Web
version. This resulted in response rates of 18% and 27% for first-year freshmen and seniors
respectively, somewhat below the national response rates (33% and 36% respectively).
Although Kuh, Hayek, Carini, Ouimet, Gonyea, and Kennedy (2001) and McInnis (2006)
address non-response and minimize some generalizability concerns, we suggest some
caution when generalizing the results of our findings across all students.
Scale: As noted earlier, the entire set of items used in these scales comes from the NSSE.
Here, we describe our method of item selection and we describe which NSSE items we
used. We refer the reader to Kuh (2001) for a detailed description of the entire NSSE. At the

MEASURING STUDENT ENGAGEMENT 9
study’s start, we identified three student engagement areas for scale development:
community-based learning activities (CBA), transformational learning opportunities (TLO),
and student-faculty engagements (SFE). We choose these content areas based first on our
University’s interest in measuring these activities as a way to gauge institutional
effectiveness and, second, on the larger need for standardized, empirically established
measurement of these activities in the post-secondary education research field more
generally. Following content area identification, the authors independently reviewed the
entire set of NSSE items and identified items for inclusion in each scale based on item face
validity. We included all identified items for scale development given our intention to
empirically examine the construct validity of the item sets.
Community Based Activities (CBA) Engagement Scale: We intended the Community
Based Activities Engagement scale (CBA) to measure the extent to which students engage
with the community, as part of their program or not. From the NSSE, we selected four items
to measure CBA. Using a four point polytomy (1 = ‘Never ‘, 2 = ‘Sometimes’, 3 = ‘Often’, 4 =
‘Very Often‘), one item examined the extent to which students participated in community
based projects as part of a regular course. On a different four point polytomy (1 = ‚Have not
Decided‛, 2 = ‚Do not plan to‛, 3 = ‚Plan to do‛, & 4 = ‚Done‛) two items asked about
students’ intentions to conduct 1) community or volunteer service1 or 2) practicums,
internships, etc. A fourth item used a four point polytomy (1 = ‘Very Little’, 2 = ‘Some’, 3 =
1 The item did not differentiate course or non-course service.

MEASURING STUDENT ENGAGEMENT 10
‘Quite a bit’, 4 = ‘Very Much ‘) to ask how frequently students contributed to the welfare of
their community.
Transformational Learning Opportunities (TLO) Engagement Scale: To measure the
extent to which students engaged in transformational learning opportunities, we selected
six NSSE items. Using the four point polytomy (1 = ‚Have not Decided‛ to, 4 = ‚Done‛),
five items examined the extent to which students planned to or had: 1) studied abroad, 2)
worked on a research project with a faculty member outside course or program
requirements, 3) engaged in a practicum, internship, co-op, etc.), 4) engaged in a
culminating senior experience (e.g., capstone course, senior thesis, etc., or 5) engaged in
independent study or self-designed major. A sixth item used the four point polytomy (1 =
‘Never ‘ to 4 = ‘Very Often‘) to examine the extent to which students participated in
community-based projects as part of a regular course.
Student-Faculty Engagement (SFE) Scale: For the student-faculty engagement (SFE)
scale, we selected five items to measure the extent to which students engaged with faculty.
Using the four point polytomy (1 = ‘Never ‘ to 4 = ‘Very Often‘), students indicated the
extent to which they had engaged in each of the following forms of interaction with
professors: 1) used email for communication, 2) talked about career plans, 3) discussed
grades or assignments, 4) discussed class ideas or readings outside of class, and 5) worked
on activities other than coursework.
Analytical Plan

MEASURING STUDENT ENGAGEMENT 11
First, we used IRT to empirically establish the ordinal nature of several items’ categories
given that most statistical procedures require at least ordinal measures. Second, based on
our first step results, we used confirmatory factor analyses for ordered-categorical measures
(CFA-OCM) and tested the fit of a three-factor measurement model (described in detail
below) to establish the underlying measurement model, examine the inter-relationships
among the constructs measured by the scales, and evaluate IRT assumptions. Third, based
on the CFA-OCM results, we fit a graded response model (Samejima, 1969), item response
theory (IRT) family model, for each scale independently to establish each scale’s
psychometric properties. This set of analyses addresses the construct validity of the scales
(e.g., do the items appear to measure their intended constructs and do the scales measure
separable constructs) and provides the psychometric information necessary to evaluate the
veracity of previous studies using these items, as well as the psychometric information
universities need for program evaluations.
Model Estimation and Fit
Item Response Theory (IRT): We conducted all IRT analyses using Mplus (Mplus 5.1;
Muthén & Muthén, 2007) and Multilog (Thissen, 2002). Mplus evaluated model fit for the
GRM models and MULTILOG estimated the IRT parameters. A priori, we adopted
preferred goodness-of-fit indices (GFIs) levels suggested by Hu and Bentler (1998; 1999). Fit
assessment focused on the set. We considered root mean square error of approximation
(RMSEA) values less than 0.05 ideal and values less than 0.08 acceptable. We preferred
comparative fit index (CFI) and Tucker-Lewis Index (TLI) values greater than 0.95, but

MEASURING STUDENT ENGAGEMENT 12
considered values greater than 0.90 acceptable. We sought Gamma Hat values greater than
0.95, and McDonald’s noncentrality index (NCI) values greater than 0.90. We also used
graphical summaries based on the S-X2 (Orlando & Thissen, 2000, 2003), S-G2 (Orlando &
Thissen, 2000, 2003), and G2* (Stone, 2000a, 2000b, 2003) that included 95% confidence
intervals to evaluate item fit (Bjorner, Smith, Stone, & Sun, 2007; Hambleton &
Swaminathan, 1985). Essentially, the S-X2 and G2* approach to fit compared expected and
observed proportions of item category responses across various levels engagement. As
described by Bjorner et al. (2007), we divided the engagement scale into intervals and
estimated the proportion of individuals expected to respond in each category for each
interval level. Then, we plotted the observed (actual) proportion of individuals responding
in that category for each item. Large differences between the expected and observed
proportions suggested poor fit. Small differences suggested better fit. To better describe
‚large,‛ we estimated 95% confidence intervals for the expected proportions. The more that
the observed proportions fall within the confidence interval, the more confidence one has in
the model’s fit. We considered an item misfitting if majority of CIs indicated large
differences between observed and expected response. Finally, consistent with calls for more
stringent error control in modeling (Crane, et al., 2006; Green & Babyak, 1997; Thissen,
Steinberg, & Wainer, 1993; Jones, 2006), analyses used a Bonferroni adjusted omnibus
model (Jones, 2006) and a Benjamini and Hochberg (B-H; 1995) sequential adjustment to
control for inflated Type I error when making model modifications (Crane, et al, 2006).

MEASURING STUDENT ENGAGEMENT 13
Confirmatory Factor Analyses for Ordered-Categorical Measures (CFA-OCM): We
conducted all factor analyses using Mplus and its theta parameterization and robust
weighted least squares (WLSMV) estimator. A priori, we adopted the GFI levels described
above. Likewise, to control for inflated Type I error (Crane, et al., 2006; Green & Babyak,
1997; Thissen, Steinberg, & Wainer, 1993; Jones, 2006), analyses used a B-H sequential
adjustment to control for inflated Type I error when making model modifications (Crane, et
al, 2006).
Results
Ordinal Response Investigation Results
We used Bock’s Nominal Response Model (NRM: Bock, 1972) to empirically
establish what, if any, natural order existed for the categories associated with the six items
using the 1 = ‚Have not Decided‛ through 4 = ‚Done‛ polytomous response scale. To our
knowledge, all previous studies have treated the entire set of NSSE item response
categories as if they represent ordered categories without question. However, a priori, it did
not seem apparent that ‚Do not plan to do‛ (i.e., ‚2‛) should represent more engagement
than ‚Have not decided‛ (i.e., ‚1‛). For example, perhaps students have not conducted an
internship not because they have no interest (2 = ‛Do not plan‛), but because they remain
undecided about whether they have the time to conduct an internship (1 = ‛Have not
decided‛). In this case, one might expect ‚Have not decided‛ to represent more engagement
rather than less, but the category’s numbers do not reflect this. The NRM allowed us to
empirically examine this (Chang & Reeve, 2002; Embretson & Reise, 2001; Panter & Reeve,

MEASURING STUDENT ENGAGEMENT 14
2002). Like most IRT models, the NRM assumes that a single continuous latent variable
underlies item responses. However, the NRM does not assume that the categories have an
ordering. Rather, it estimates the probability of choosing one category as opposed to
another as a function of the latent variable’s levels. For example, as applied to the
internship item, the NRM estimates what level of engagement exists for students to endorse
that they do not plan to conduct an internship. It estimates what level of engagement exists
when students endorse that they have not decided to conduct an internship, and so on. By
examining the rank order of the slope (‚a‛) parameters associated with each categorical
response, one can determine what, if any, ordering exists (Chang & Reeve, 2002; Embretson
& Reise, 2001; Panter & Reeve, 2002). Categories with the smallest a values represent
categories endorsed by those low on the latent trait. Categories with larger a values
represent categories endorsed by those high on the latent trait. The relative distance
between each a value indicates the extent to which the categories provide distinct
information. If the rank ordering corresponds to the rank ordering of the numbers assigned
to the categories, one can treat the polytomous responses as ordinal measures and fit IRT
and factor models that treat the categories as ordinal.
The NRM fit the data well.2 None of the GFIs’ graphs indicated misfit (i.e., no given
index consistently displayed predicted values well outside the confidence intervals).
Inspecting the rank ordering of the slopes indicated that the categories associated with the
2 Given the likelihood that time constraints (i.e., graduation) would systematically influence seniors’
ability to complete activities irrespective of engagement, we examined ordering among first-year students
only.

MEASURING STUDENT ENGAGEMENT 15
four point polytomy followed an ordinal progression. For each item, 1 (i.e., ‚Have not
Decided‛) represented the least engagement, followed by 2 (‚Do not plan to do‛), 3 (‚Plan
to do‛, and 4 (‚Done‛).3 These findings supported treating the items and their categories as
ordinal and including them in the subsequent statistical models that required ordinal level
measures. As we discuss later, this supports the legitimacy of treating the ‚1‛, ‚2‛, ‚3‛, and
‚4‛ responses as ordinal and lends credence to interpreting ‚1‛ as less than ‚2‛, and so on.
Confirmatory Factor Analyses for Ordered-Categorical Measures (CFA-OCM) Results
Given that the NRM results empirically supported treating the item categories as an
ordered polytomy, we next sought to establish a general measurement model describing
how each item related to its underlying engagement construct. This allowed us to explore
whether the items sets formed empirically supported scales and it allowed us to examine
the extent to which the engagement constructs measured by the scales correlated with each
other. Additionally, it allowed us to assess the tenability of IRT assumptions (e.g.,
unidimensionality). Our general measurement model included three engagement factors
(i.e., latent traits or latent variables) corresponding to the three item sets: TLO, CBA, and
SFE. Other than the item addressing the extent to which students engaged in community
based projects as part of a regular course, which we selected to measure both CBA and
TLO, each item loaded on one and only factor and each factor corresponded to the
underlying engagement construct we expected the items to measure. Thus, other than the
community item, the TLO items set loaded only on the TLO factor, the CBA set loaded only
3 We will gladly provide the details of these parameters upon request.

MEASURING STUDENT ENGAGEMENT 16
on the CBA factor, and the SFE item set loaded only on the SFE factor. We allowed the
factors to correlate, but we did not allow correlations among the error terms. This model fit
the data acceptably, but not ideally: RMSEA = 0.08; McDonald’s NCI = 0.88, Gamma Hat =
0.96, TLI = 0.93, CFI = 0.91, 2 = 292.32, 44, n = 941, p < 0.01. Parameter level investigations
using the modification indices (MIs), which represent each constraint’s contribution to the
2, and the B-H alpha suggested that allowing the error terms associated with the ‚used
email to communicate‛ and ‚discussed grades‛ items resulted in the majority of misfit.
Thus, we fit a model that allowed the error term associated with these two items to
correlate. This model, which included only the single change, fit the data well: RMSEA =
0.05; McDonald’s NCI = 0.94, Gamma Hat = 0.98, TLI = 0.96, CFI = 0.96, 2 = 166.40, 44, n =
941, p < 0.01). The correlations among the factors supported the hypothesis that scales
measured separable but related engagement domains (r TLO/SFE = 0.50; r TLO/CBA = 0.43; r CBA/SFE
= 0.74). The fact that the model fit well when constraining nearly all items to load on one
and only one factor supported the tenability of IRT assumptions. Thus, we moved to
establishing the psychometric properties of the scales using IRT.
Item Response Theory (IRT) Results:
Given that our CFA-OCM results supported the tenability of IRT assumptions, we fit
a GRM to each scale independently. This allowed us to evaluate the fit of the IRT model for
each scale and establish each scale’s psychometric properties. Here, we present each scale’s
fit and psychometric properties. We discuss interpretation and implications in the

MEASURING STUDENT ENGAGEMENT 17
Discussion. For detailed descriptions of the GRM and IRT models in general, the interested
reader should consult Embretson and Reise (2000).
Transformational Learning Opportunities (TLO) Engagement Scale: The GRM fit the data
well: RMSEA = 0.07, McDonald’s NCI = 0.98, Gamma Hat = 0.99, TLI = 0.93, CFI = 0.94, 2 =
46.95, 9, n = 940, p < 0.01. Likewise, none of the GFIs graphs indicated misfit. For example,
take the ‚Research‛ item. As Figure 1 shows, all of the predicted values fell within the 95%
confidence limits. This pattern held for all items.4 Table 1 presents the TLO scale’s item
parameter estimates and the maximal item and test information values. The location
parameters ranged from -2.58 to 5.41 (M = 0.86; SD = 2.18). The discrimination parameters
ranged from 0.63 to 1.46 (M = 1.1; SD = 1.22). Maximal item information locations ranged
from -0.25 to 2.75 standard deviations above the mean engagement level. Maximal test
information occurred 1.5 standard deviations above the mean and corresponded to a
Cronbach’s alpha of 0.58 at this level of the latent trait. Figures 2 and 3 present a
representative item characteristic curve (ICC) and the item information function (IIF) for the
‚Independent Study” item. For each scale, we give a representative example. We will gladly
share the entire set with the interested reader. Figure 4 presents the test information
function (TIF).
INSERT TABLE ONE ABOUT HERE
INSERT FIGURES 1 THROUGH 4 ABOUT HERE
4 We will gladly share the entire set upon request.

MEASURING STUDENT ENGAGEMENT 18
Student-Faculty Engagement (SFE) Scale: The GRM fit the data well: RMSEA = 0.06;
McDonald’s NCI = 0.99, Gamma Hat = 0.99, TLI = 0.99, CFI = 0.99, 2 = 17.49, 4, n = 940, p <
0.01. Again, none of the graphs indicated misfit. For example, as Figure 5 shows, all of the
predicted values for the ‚Worked with Faculty on Non-Course Projects‛ fell within the 95%
confidence limits. This pattern held across representations. Table 1 presents the TLO scale’s
item parameter estimates, as well as the maximal item and test information locations. The
location parameters ranged from -3.67 to 3.26 (M = 0.26; SD = 1.78). The discrimination
parameters ranged from 1.12 to 1.98 (M =1.62; SD = 1.60). Maximal item information
occurred at 1.0 standard deviation above the mean engagement level for each item.
Maximal test information occurred 0.5 standard deviation above the mean and
corresponded to a Cronbach’s alpha of 0.73 at this level of the latent trait. Figures 6 and 7
present a representative ICC and IIF for the ‚Discussed Ideas Outside Class‛ item. Figure 8
presents the TIF.
INSERT FIGURES 5 THROUGH 8 ABOUT HERE
Community Based Activities (CBA) Engagement Scale: The GRM fit the data adequately:
RMSEA = 0.11; McDonald’s NCI = 0.99, Gamma Hat = 0.99, TLI = 0.91, CFI = 0.97, 2 = 23.26,
2, n = 940, p < 0.01. Likewise, none of the GFIs graphs indicated misfit. For example, as
Figure 9 shows for the ‚Practicum‛ item, all of the predicted values fell within the 95%

MEASURING STUDENT ENGAGEMENT 19
confidence limits, a pattern upheld for each item. Table 1 presents the CBA scale’s
psychometric properties. The location parameters ranged from -2.58 to 2.07 (M = -0.09; SD =
1.51) and the discrimination parameters ranged from 0.88 to 2.78 (M = 1.53; SD = 1.22).
Maximal item information ranged from -1.0 to 1.5 standard deviations above the mean
engagement level. Maximal test information occurred 0.5 standard deviations above the
mean and corresponded to a Cronbach’s alpha of 0.68. Figures 10 and 11 present a
representative ICC and IIF for the ‚Community Project” item. Figure 12 presents the TIF.
INSERT FIGURES 9 THROUGH 12 ABOUT HERE
Discussion
Do students engage with their community? Their faculty? Do they engage in
transformational learning opportunities? Despite widespread interest in these areas of
engagement, no psychometrically established (i.e., peer-reviewed and published),
standardized measures of these activities exist. In this study, we sought to develop and
psychometrically describe three new scales based on three item sets selected from the
National Survey of Student Engagement (NSSE: Kuh, 2001) in independent data to help
investigators better understand students’ community, faculty, and learning engagement.
We selected four NSSE items to measure community based learning (CBA) engagement, six
to examine student-faculty engagement (SFI), and five to assess transformational learning
opportunity (TLO) engagement. CFA-OCM demonstrated the internal consistency and

MEASURING STUDENT ENGAGEMENT 20
separability of the three scales and IRT richly described the items’ and scales’ psychometric
properties.
CFA-OCM analyses revealed that a three factor model that allowed correlations
among the scales and only a single cross-loading item fit the data well. The correlations
among the factors indicated that the constructs related to each other, but the size of the
correlations, which ranged from 0.42 to 0.75, showed that the scales measured separable
constructs. The fact that all but one item loaded on one and only one engagement factor
provided evidence for the internal consistency of the scales. The items for the three scales
did a good job of measuring their expected construct and only that construct. This also
provided evidence for each scale’s unidimensionality, which supported our use of IRT to
psychometrically describe the scales.
For each scale, we successfully fit Samejima’s (1969) graded response model (GRM),
which allowed us to better understand how each and item scale measure student
engagement. Generally, the GRM describes the probability of an individual endorsing an
item through a single discrimination parameter and several location parameters.
Substantively, location parameters describe how much of the underlying engagement
construct occurs before a student endorses a category. They address how much a student
engages with their community, faculty, or transformational learning opportunities generally
before they endorse a specific item category. High values reflect categories corresponding
to high engagement levels. Low values reflect the opposite. The discrimination parameters
indicate the degree to which an item differentiates among individuals at different levels of

MEASURING STUDENT ENGAGEMENT 21
engagement. It directly relates to reliability. High values discriminate well at a given
engagement level; low values do not discriminate well at any given level. ICCs graphically
describe these parameters for each item, while the item information function (IIF) and test
information function (TIF) graphically address the reliability of each item and scale. The
GRM explicitly acknowledges that a scale or item may provide more accurate measurement
(i.e., more information) at different engagement levels. For example, a scale may do a
particularly good job of discriminating between highly and averagely engaged students but
not discriminate well among disengaged students. The IIF and TIF graphically display this.
The curves’ peaks correspond to the most precisely measured engagement levels. Thus, the
item parameters, ICCs, IIFs, and TIFs associated with each scale provide extensive
psychometric information and inform researchers’ and institutions’ efforts to measure
variation in students’ engagement.
First, consider the SFE scale. For this scale, five items assessed whether students: 1)
emailed, 2) talked about career plans, 3) discussed grades, 4) discussed ideas outside of
class, or 5) worked non-coursework activities with faculty. The TIF associated with this
scale suggests that it does a particularly good job of discriminating among students at
average levels of student-faculty engagement. It does not do as well discriminating among
students too far above or below the mean. At the item level, the item parameters indicate
that the item addressing the extent to which students discuss ideas outside of class with
their faculty does a particularly good job of discriminating among more engaged students.
It has a relatively large discrimination parameter, α = 1.65, and the location parameters

MEASURING STUDENT ENGAGEMENT 22
generally fall at higher levels of student-faculty engagement (β1 = -0.45, β2 = 1.1, β3 = 2.28).
The IIF also reflects this (see Figure 7). It peaks about a half SD below the mean and then
remains relatively flat across higher levels. The item assessing the extent to which students
emailed their professor demonstrates a reversed pattern. It discriminates well (α = 1.47)
among students who don’t engage much with their professors (β1 = -3.67, β2 = -1.2, β3 = 0.16).
Its parameters show that even minimally engaged students (i.e., students less than a
standard deviation below mean student-faculty engagement levels) often email their
professors (β2 = -1.2). Taken together, the SFE results suggest that institutions and others
wishing to evaluate students’ engagement with faculty using this SFE item set will best
measure students falling within average ranges of engagement. If institutions wish to
evaluate changes in engagement among the unengaged, they should focus on the ‚email‛
item. If they wish to identify the students most engaged with their professors, they should
focus on the ‚ideas‛ item.
These results underscore the importance of IRT applications. The psychometric
information shows that the scale provides its best, most precise measurement at average
levels of student-faculty engagement. When accuracy and reliability weigh highly in
decision making, universities should focus on the scale and acknowledge that it does not
discriminate as well among highly engaged or minimally engaged students. However,
when decisions about specific levels of engagement weigh more highly, institutions can use
the IRT parameters to evaluate change at specific engagement ‚locations‛ (i.e., levels), while
acknowledging that a single item does not provide as much precision as a full set. In this
MEASURING STUDENT ENGAGEMENT 23
way, IRT substantially adds to users’ understanding of what and how well this and the
others scales described shortly measure.
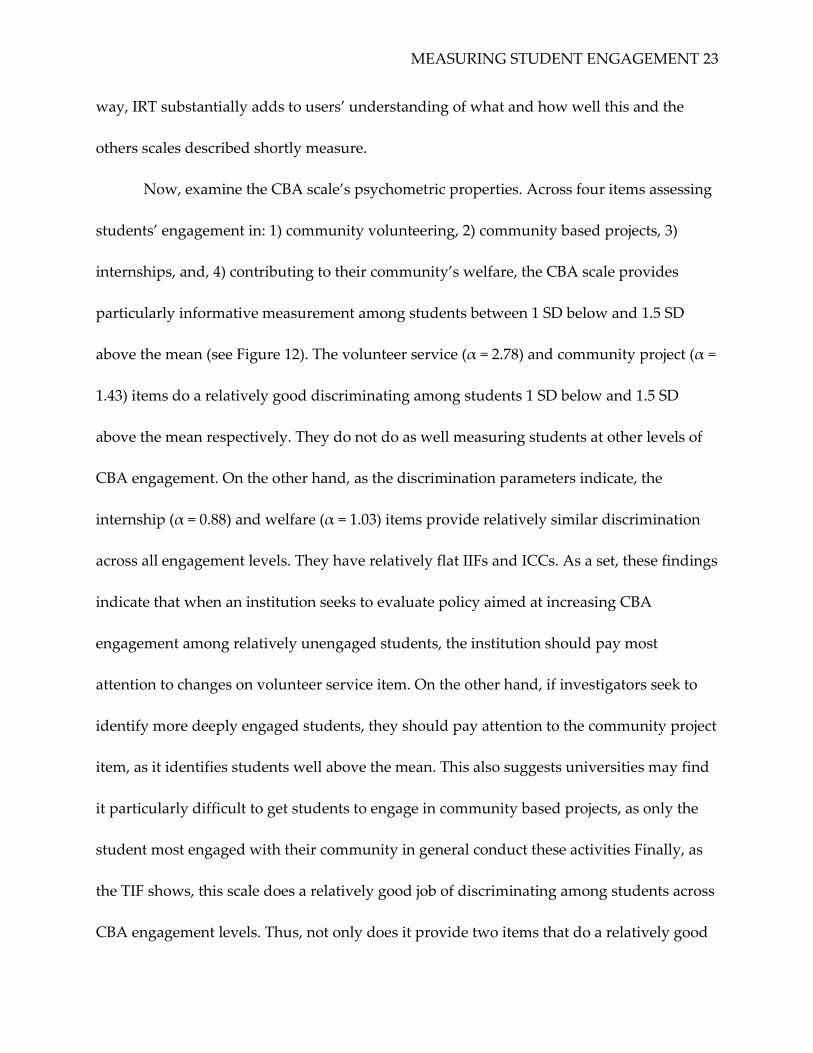
Now, examine the CBA scale’s psychometric properties. Across four items assessing
students’ engagement in: 1) community volunteering, 2) community based projects, 3)
internships, and, 4) contributing to their community’s welfare, the CBA scale provides
particularly informative measurement among students between 1 SD below and 1.5 SD
above the mean (see Figure 12). The volunteer service (α = 2.78) and community project (α =
1.43) items do a relatively good discriminating among students 1 SD below and 1.5 SD
above the mean respectively. They do not do as well measuring students at other levels of
CBA engagement. On the other hand, as the discrimination parameters indicate, the
internship (α = 0.88) and welfare (α = 1.03) items provide relatively similar discrimination
across all engagement levels. They have relatively flat IIFs and ICCs. As a set, these findings
indicate that when an institution seeks to evaluate policy aimed at increasing CBA
engagement among relatively unengaged students, the institution should pay most
attention to changes on volunteer service item. On the other hand, if investigators seek to
identify more deeply engaged students, they should pay attention to the community project
item, as it identifies students well above the mean. This also suggests universities may find
it particularly difficult to get students to engage in community based projects, as only the
student most engaged with their community in general conduct these activities Finally, as
the TIF shows, this scale does a relatively good job of discriminating among students across
CBA engagement levels. Thus, not only does it provide two items that do a relatively good

MEASURING STUDENT ENGAGEMENT 24
job of identifying students below and above the mean, scores based on the item set will
capture variability across CBA engagement levels.
Next, turn to the psychometric information associated with the TLO scale. It
included items addressing the extent to which students planned to or had: 1) studied
abroad, 2) worked on a research project with faculty outside course requirements, 3)
engaged in internships, 4) engaged in a culminating senior experience, 5) engaged in
independent study, or 6) engaged in community or volunteer service. The bimodal TIF (see
Figure 8) associated with this scale suggests that it provides the best discrimination at two
different levels of TLO engagement, two SD below, and one and half SD above, the mean.
Thus, this scale discriminates well among students who often engage with transformational
learning opportunities (the high TIF peak) and it discriminates well among students who
rarely engage in transformational learning opportunities (the low TIF peak). It also does a
relatively good job of discriminating among students in between these two points. At the
item level, the community project, internship, and study abroad items do not provide much
discrimination among students at any specific level of engagement, α’s of 0.63, 0.87, and
0.48 respectively. However, the remaining three items better capture variability across the
spectrum of engagement as indicated by the combination of discrimination and location
parameters. This suggests that institutions wishing to evaluate change or describe students’
engagement with transformational learning opportunities should focus more on the
internship, culminating senior experience, or independent study items, as they provide
more reliable indicators. Moreover, as the TIF shows, combining these items into a scale

MEASURING STUDENT ENGAGEMENT 25
provides an even better indicator of students’ engagement. Even simple summary scores, as
opposed to scores based on IRT parameters, should well capture variability in students’
engagement.
Finally, we note an additional important finding. To our knowledge, all previous
studies have treated the entire set of NSSE item responses options as if they offer ordinal
measurement. However, for several NSSE items, this a priori expectation seemed doubtful.
For example, it does not seem apparent that ‚Have not Decided‛(1) should equal less
engagement than ‚Do not plan to do‛(2). Because most statistics require at least ordinal
measurement (e.g., sums, averages, reliability analyses, etc.) one needs to empirically
establish the ordinal properties of the scale points. To our knowledge, no previous studies
addressed this issue. We used Bock’s NRM (Bock, 1972) to empirically explore the category
ordering of the items included in our scales. Our NRM results indicated that for all six
items, the four point polytomy provided ordinal measurement. This lends credence to
previous analyses that have treated these items as if they offer ordinal measurement, and it
suggests that the remaining items on the NSSE that use these response options may
similarly provide ordinal measurement. Future studies should examine the response option
ordering for the remaining items that use these options.
Before concluding, the study’s limits and strengths deserve review. First, our
findings come from a sample of students at a mid-sized, comprehensive, urban university.
It remains unclear whether these item sets would have similar psychometric properties
among different student populations. However, the NSSE’s strong methodology minimizes

MEASURING STUDENT ENGAGEMENT 26
concerns that the our sample fails to represent students from other mid-sized,
comprehensive, urban universities. Moreover, IRT parameter estimates are not sample
dependent (Hambleton & Swaminathan, 1985), which suggests that these findings should
generalize to other similar universities. Nevertheless, future studies should collect
additional data at other universities to explore the findings’ generalizability to other
institutional settings. Second, our item sets may not represent the full spectrum of possible
activities in which students could demonstrate their engagement. For example, students
may demonstrate their community engagement through paid public service jobs (e.g.,
government jobs). As a result, these item sets may not fully capture variability in student
engagement. Because we sought to develop scales based on a widely available, nationally
administered survey, we had a limited item set from which to draw. We felt the strengths of
building from a widely administered survey outweighed this concern, as it allowed all
universities using the NSSE to immediately use these scales. Nevertheless, we caution users
to reflect on the engagement opportunities available at their campus and community and
evaluate whether the NSSE items successfully capture the engagement opportunities
available to their students. Despite these boundaries, the study’s strengths prevail over its
weaknesses. The study presents users with a wealth of psychometric data based on a
commonly administered, standardized, rigorous national (to the US) survey and, in doing
so, it fills a gap in institutional and post-secondary evaluations seeing to empirically
describe their students’ community, faculty, and learning transformational opportunity
engagement.

MEASURING STUDENT ENGAGEMENT 27
In sum, these findings have several implications for institutions seeking to use these
scales to measure student engagement outcomes. First, the findings indicate that these
scales have adequate construct validity and measure related but separable constructs.
Second, the results show that the scales provide differentially reliable measurement across
the spectrums of their respective constructs. The TLO scale provides relatively precise
measurement across the TLO spectrum. The CBA provides the most reliable measurement
at CBA levels above the mean, and the SFI scale offers the most precise measurement for
students falling between one standard deviation above and one standard deviation below
the mean. Users should keep these considerations in mind when trying to evaluate change
outside the ranges within which the scales provide their most reliable estimates. Third, each
scale includes items that provide particularly precise measurement at different locations on
the latent trait. Thus, institutions seeking to bring about change among students high or
low on a particular engagement trait should pay most attention to the items that provide
their best measurement at these locations. In conclusion, these scales and their
psychometric properties should provide institutions with the empirical information they
need to evaluate the state of their students’ engagement using items from a nationally
administered, standardized scale. We hope that others use the rich data provided by the
NSSE to develop and establish other scales of interest.

MEASURING STUDENT ENGAGEMENT 28
REFERENCES
Astin, A. W. (1993). What Matters in College: Four Critical Years Revisited. Jossey-Bass, San
Francisco.
Benjamini, Y., & Hochberg, Y. (1995). Controlling the false discovery rate: a practical and
powerful approach to multiple testing. Journal of the Royal Statistical Society, Series B,
57, 289–300.
Bjorner, J. B., Smith, K. J., Stone, C., & Sun, X. (2007). IRTFIT: A Macro for Item Fit and Local
Dependence Tests under IRT Models. QualityMetric Incorporated: School of Education,
University of Pittsburgh.
Bock, R.D. (1972). Estimating item parameters and latent ability when responses are scored
in two or more nominal categories. Psychometrika, 37, 29-51.
Carini, R. M., Kuh, G. D., & Klein, S. P. (2006). Student engagement and student learning:
Testing the linkages. Research in Higher Education, 47, 1-32.
Chang, C., & Reeve, B. B. (2005) Item Response Theory and its Applications to Patient-
Reported Outcomes. Evaluation and the Health Profession, 28, 264-282.
Chickering, A. W., and Gamson, Z. F. (1987). Seven principles for good practice in
undergraduate education. AAHE Bulletin, 39, 3–7.
Crane, P. K., Gibbons, L. E., Jolley, L., & van Belle, G. (2006). Differential Item Functioning
Analysis With Ordinal Logistic Regression Techniques: DIFdetect and difwithpar.
Medical Care , 44, S115-S123.
Embretson, S., & Reise, S. P. (2000). Item response theory for psychologists.
MEASURING STUDENT ENGAGEMENT 29
Gonyea, R. M., Kinzie, J., Kuh, G. D., & Nelson Laird, T. F. (2008). High impact activities:
What they are, why they work, and who benefits. Program presented at the American
Association for Colleges and Universities annual meeting. Washington, DC.
Gordon, J., Ludlum, J., & Hoey, J. (2008). Validating NSSE Against Student Outcomes: Are
They Related? Research in Higher Education, 49, 19–39.
Green, S. B., & Babyak, M. A. (1997). Control of type I errors with multiple tests of
constraints in structural equation modeling. Multivariate Behavioral Research, 32(1), 39-51.
Hambleton, R. K. (1985). Item response theory. Boston, MA: Kluwer.
Hu, L., & Bentler, P. M. (1998). Fit indices in covariance structure modeling: Sensitivity to
underparameterized model misspecification. Psychological Methods, 3(4), 424-453.
Hu, L., & Bentler, P. M. (1999). Cutoff criteria for fit indexes in covariance structure
analysis: Conventional criteria versus new alternatives. Structural Equation Modeling,
6(1), 1-55.
Jones, R. (2006). Identification of Measurement Differences Between English and Spanish
Language Versions of the Mini-Mental State Examination: Detecting Differential Item
Functioning Using MIMIC Modeling. Medical Care, 44, S124-S133.
Kinzie, J. & Evenbeck, S. (2008). Assessing Student Engagement in High-Impact Practices.
Program presented at the NASPA IARC Conference. Scottsdale, AZ.
Kuh, G. D. (2001). The National Survey of Student Engagement: Conceptual framework and
overview of psychometric properties. Bloomington, IN: Indiana University, Center for
Postsecondary Research.

MEASURING STUDENT ENGAGEMENT 30
Kuh, G. D., Hayek, J. C., Carini, R. M., Ouimet, J. A., Gonyea, R. M., and Kennedy, J. (2001).
NSSE Technical and Norms Report, Indiana University Center for Postsecondary Research
and Planning, Bloomington, IN.
Kuh, G. D. (2003). What we’re learning about student engagement from NSSE. Change, 35,
24-32.
Kuh, G. D. (2005). 7 steps for taking student learning seriously. Trusteeship, 13, 20-24.
Kuh, G. D., Kinzie, J., Schuh, J. H., Whitt, E. J., & Associates. (2005). Student success in college:
Creating conditions that matter. San Francisco: Jossey-Bass.
McInnis, E. D. (2006). Nonresponse Bias in Student Assessment Surveys: A Comparison of
Respondents and Non-Respondents of the National Survey of Student Engagement at an
Independent Comprehensive Catholic University. Unpublished doctoral dissertation,
Marywood University.
Muthén, L. K., & Muthén, B. O. (1998-2007). Mplus User’s guide. fourth edition. Los Angeles,
CA: Muthén & Muthén.
Orlando, M., & Thissen, D. (2000). Likelihood-based item-fit indices for dichotomous item
response theory models. Applied Psychological Measurement, 24(1), 50-64.
Orlando, M., & Thissen, D. (2003). Further investigation of the performance of S-X²: An item
fit index for use with dichotomous item response theory models. Applied Psychological
Measurement, 27(4), 289-298.
Ostini, R., & Nering, M. L. (2005). Polytomous Item Response Theory Models. Sage: New York.

MEASURING STUDENT ENGAGEMENT 31
Pace, C. R. (1984). Measuring the quality of college student experiences. Los Angeles: Center for
the Study of Evaluation, University of California Los Angeles.
Pascarella, E. T., and Terenzini, P. T. (1991). How College Affects Students. Jossey-Bass, San
Francisco.
Panter, A. T., & Reeve, B. B. (2002). Assessing tobacco beliefs among youth using item
response theory models. Drug and Alcohol Dependence, 68, S21-239.
Pike, G. R. (2006a). The Convergent and Discriminant Validity of NSSE Scalelet Scores
Journal of College Student Development, 47, 551-564.
Pike, G. R. (2006b). The dependability of NSSE Scalelets for college- and department-level
assessment. Research in Higher Education, 47, 177-195.
Samejima, F. (1969). Estimation of latent ability using a response pattern of graded scores.
Psychometrika Monograph Supplement, 34(4, Pt. 2), 100.
Stone, C. A. (2000). Monte carlo based null distribution for an alternative goodness-of-fit
test statistic in IRT models. Journal of Educational Measurement, 37(1), 58-75.
Stone, C. A. (2003). Empirical power and type I error rates for an IRT fit statistic that
considers the precision of ability estimates. Educational and Psychological Measurement,
63(4), 566-583.
Stone, C. A., & Zhang, B. (2003). Assessing goodness of fit of item response theory models:
A comparison of traditional and alternative procedures. Journal of Educational
Measurement, 40(4), 331-352.

MEASURING STUDENT ENGAGEMENT 32
Thissen, D., Chen, W., & Bock, D. (2002). MULTILOG 7. Scientific Software International,
Chicago.
Thissen, D., Steinberg, L., & Wainer, H. (1993). Differential item functioning In P. W. Holland
(Ed.), Detection of differential item functioning using the parameters of item response models
(pp. 67-113). Hillsdale, NJ: Lawrence Erlbaum Associates.
MEASURING STUDENT ENGAGEMENT 33
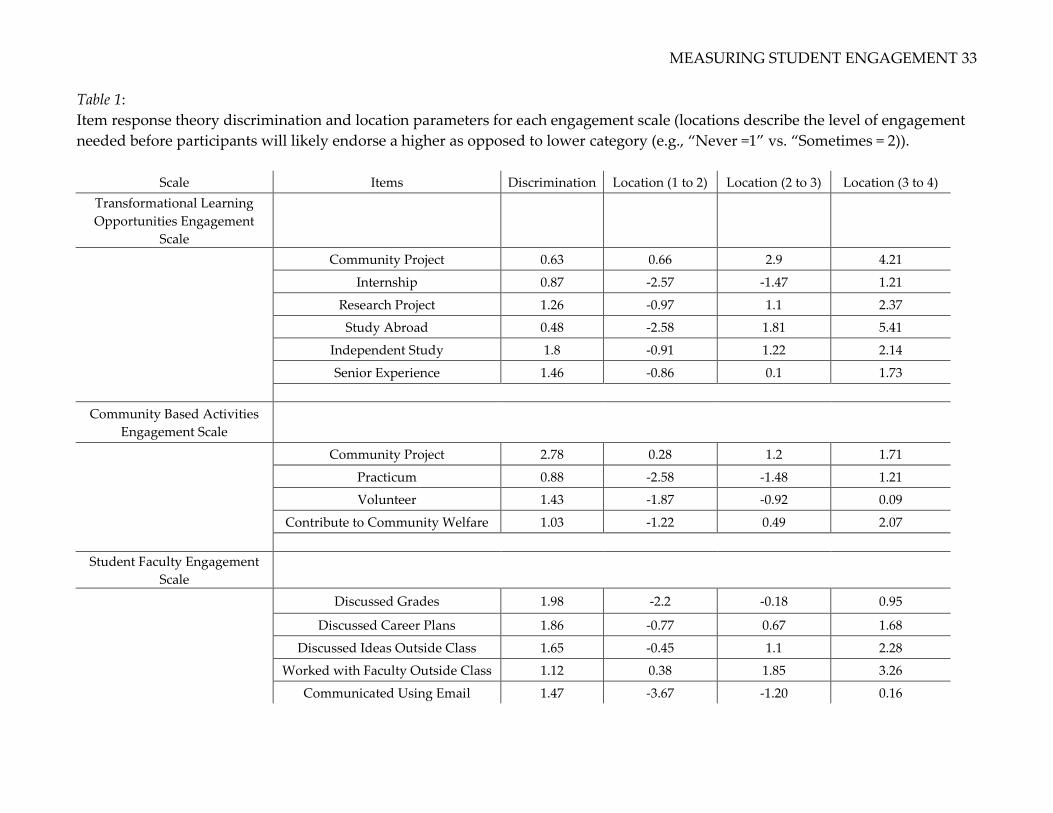
Table 1:
Item response theory discrimination and location parameters for each engagement scale (locations describe the level of engagement
needed before participants will likely endorse a higher as opposed to lower category (e.g., ‚Never =1‛ vs. ‚Sometimes = 2)).
Scale Items Discrimination Location (1 to 2) Location (2 to 3) Location (3 to 4)
Transformational Learning
Opportunities Engagement
Scale
Community Project 0.63 0.66 2.9 4.21
Internship 0.87 -2.57 -1.47 1.21
Research Project 1.26 -0.97 1.1 2.37
Study Abroad 0.48 -2.58 1.81 5.41
Independent Study 1.8 -0.91 1.22 2.14
Senior Experience 1.46 -0.86 0.1 1.73
Community Based Activities
Engagement Scale
Community Project 2.78 0.28 1.2 1.71
Practicum 0.88 -2.58 -1.48 1.21
Volunteer 1.43 -1.87 -0.92 0.09
Contribute to Community Welfare 1.03 -1.22 0.49 2.07
Student Faculty Engagement
Scale
Discussed Grades 1.98 -2.2 -0.18 0.95
Discussed Career Plans 1.86 -0.77 0.67 1.68
Discussed Ideas Outside Class 1.65 -0.45 1.1 2.28
Worked with Faculty Outside Class 1.12 0.38 1.85 3.26
Communicated Using Email 1.47 -3.67 -1.20 0.16

MEASURING STUDENT ENGAGEMENT 34
Figure 1:
Graphical summary of the ‚Outside of Class Research‛ item’s S-X2 IRT fit. The y axis give the
probability of response. The x axis gives the interval level. The dots represent observed
proportions. The three lines show the expected proportions. The outside, dashed lines
indicate the 95% confidence intervals for the expected proportions given by the center, solid
line. Dots falling close to the center line and within the set of three lines indicate good fit.

MEASURING STUDENT ENGAGEMENT 35
Figure 2:
‚Independent Study‛ item characteristic curve (ICC). The y axis gives the probability of
response (large value correspond to increasing response probabilities). The x axis represents
engagement levels. The solid line corresponds to the ‚Have not decided‛ category. The
small dashes line corresponds to the ‚Do not plan to do‛ category. The large dashes line
indicates the ‚Plan to do‛ category. The dashed and dotted line represents the ‚Done"
category.
0.0
0.2
0.4
0.6
0.8
1.0
-3 -2 -1 0 1 2 3
Pro
bab
ility
of
Re
spo
nse
Engagement Level

MEASURING STUDENT ENGAGEMENT 36
Figure 3:
‚Independent Study” item information function (IIF). The x axis gives levels of engagement
in standard normal units. The y axis gives the item information. High values on y indicate
relatively more reliable (i.e., informative) engagement measurement levels.
0
0.1
0.2
0.3
0.4
0.5
0.6
0.7
0.8
0.9
-3 -2 -1 0 1 2 3
Item
In
form
atio
n
Engagement Level

MEASURING STUDENT ENGAGEMENT 37
Figure 4:
Transformational Learning Opportunities Engagement scale test information function (TIF).
The x axis gives levels of engagement in standard normal units. The y axis gives the test
information. High values on y indicate relatively more reliable (i.e., informative)
engagement measurement levels.
0
0.5
1
1.5
2
2.5
3
-3 -2 -1 0 1 2 3
Tes
t In
form
atio
n
Engagement Level

MEASURING STUDENT ENGAGEMENT 38
Figure 5:
Graphical summary of the ‚Worked with Faculty on Non-Course Projects‛ item’s S-X2 IRT fit.
The y axis give the probability of response. The x axis gives the interval level. The dots
represent observed proportions. The three lines show the expected proportions. The
outside, dashed lines indicate the 95% confidence intervals for the expected proportions
given by the center, solid line. Dots falling close to the center line and within the set of three
lines indicate good fit.
MEASURING STUDENT ENGAGEMENT 39
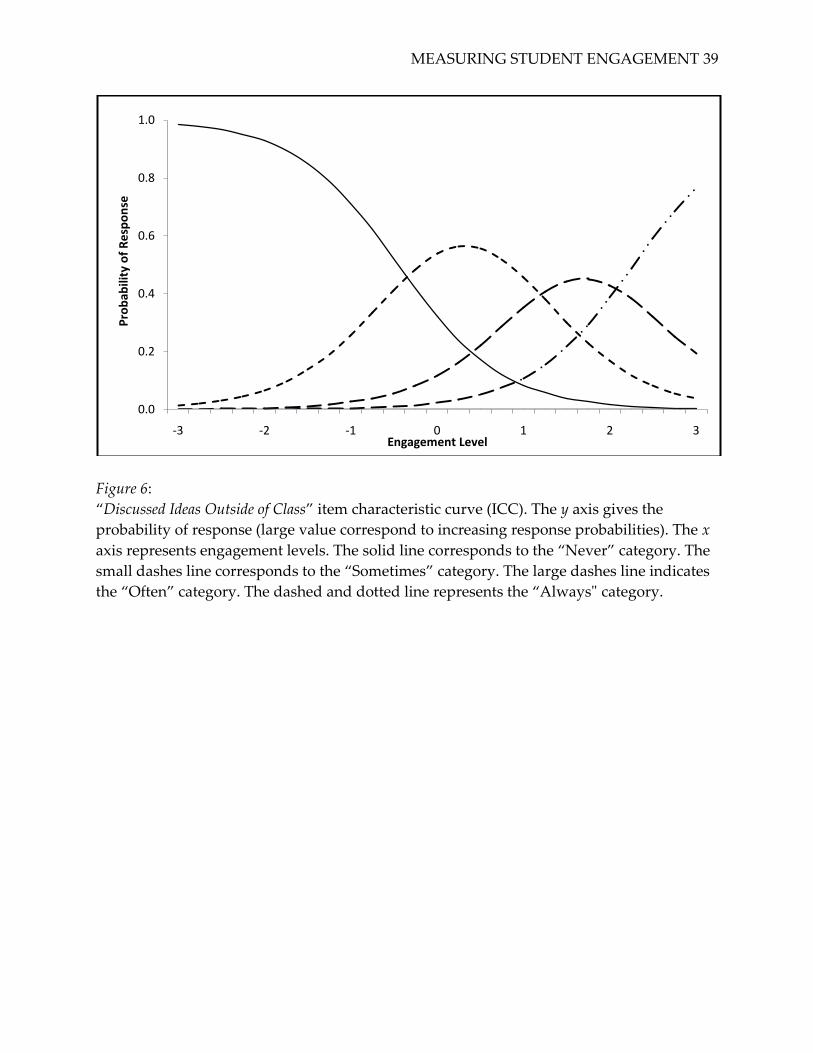
Figure 6:
‚Discussed Ideas Outside of Class‛ item characteristic curve (ICC). The y axis gives the
probability of response (large value correspond to increasing response probabilities). The x
axis represents engagement levels. The solid line corresponds to the ‚Never‛ category. The
small dashes line corresponds to the ‚Sometimes‛ category. The large dashes line indicates
the ‚Often‛ category. The dashed and dotted line represents the ‚Always" category.
0.0
0.2
0.4
0.6
0.8
1.0
-3 -2 -1 0 1 2 3
Pro
bab
ility
of
Re
spo
nse
Engagement Level

MEASURING STUDENT ENGAGEMENT 40
Figure 7:
‚Discussed Ideas Outside of Class‛ item characteristic curve (ICC). The y axis gives the
probability of response (large value correspond to increasing response probabilities). The x
axis represents engagement levels. The solid line corresponds to the ‚Never‛ category. The
small dashes line corresponds to the ‚Sometimes‛ category. The large dashes line indicates
the ‚Often‛ category. The dashed and dotted line represents the ‚Always" category.
0.0
0.2
0.4
0.6
0.8
1.0
-3 -2 -1 0 1 2 3
Pro
bab
ility
of
Re
spo
nse
Engagement Level
MEASURING STUDENT ENGAGEMENT 41
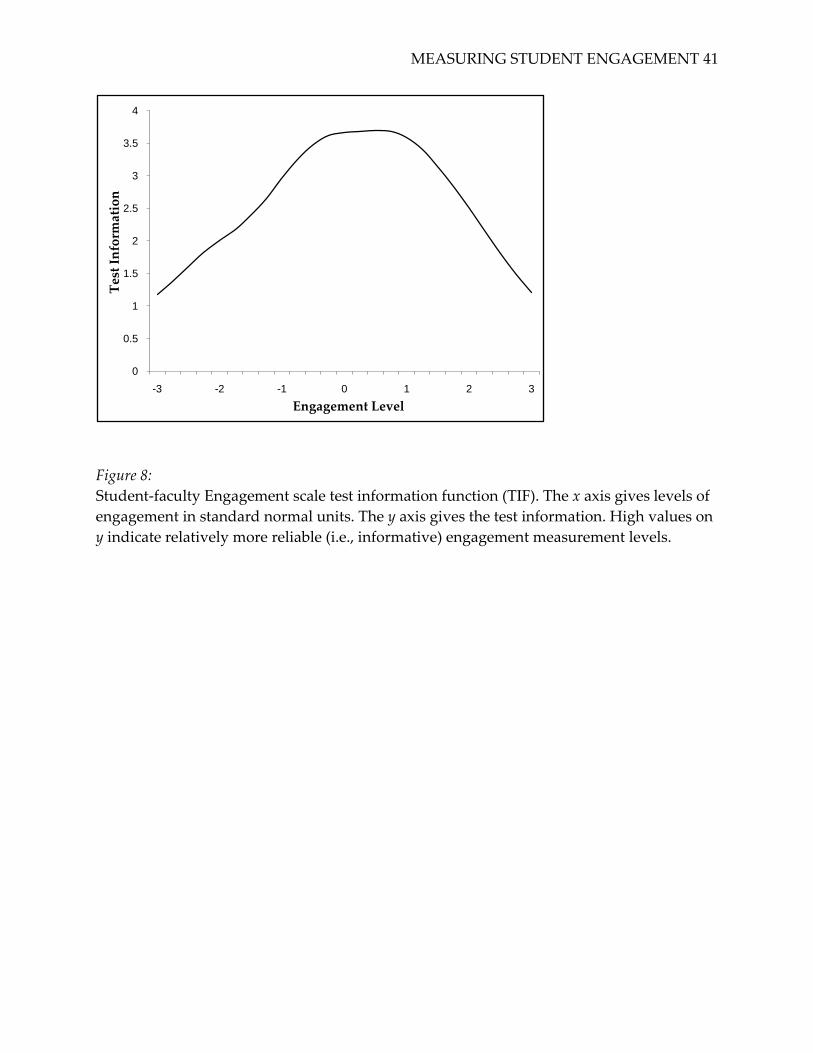
Figure 8:
Student-faculty Engagement scale test information function (TIF). The x axis gives levels of
engagement in standard normal units. The y axis gives the test information. High values on
y indicate relatively more reliable (i.e., informative) engagement measurement levels.
0
0.5
1
1.5
2
2.5
3
3.5
4
-3 -2 -1 0 1 2 3
Tes
t In
form
atio
n
Engagement Level

MEASURING STUDENT ENGAGEMENT 42
Figure 9:
Graphical summary of the ‚Internship‛ item’s S-X2 IRT fit. The y axis give the probability of
response. The x axis gives the interval level. The dots represent observed proportions. The
three lines show the expected proportions. The outside, dashed lines indicate the 95%
confidence intervals for the expected proportions given by the center, solid line. Dots falling
close to the center line and within the set of three lines indicate good fit.

MEASURING STUDENT ENGAGEMENT 43
Figure 10:
‚Community Project‛ item characteristic curve (ICC). The y axis gives the probability of
response (large value correspond to increasing response probabilities). The x axis represents
engagement levels. The solid line corresponds to the ‚Never‛ category. The small dashes
line corresponds to the ‚Sometimes‛ category. The large dashes line indicates the ‚Often‛
category. The dashed and dotted line represents the ‚Always" category.
0.0
0.2
0.4
0.6
0.8
1.0
-3 -2 -1 0 1 2 3
Pro
bab
ility
of
Re
spo
nse
Engagement Level

MEASURING STUDENT ENGAGEMENT 44
Figure 11:
‚Community Project” item information function (IIF). The x axis gives levels of engagement
in standard normal units. The y axis gives the item information. High values on y indicate
relatively more reliable (i.e., informative) engagement measurement levels.
0
0.5
1
1.5
2
2.5
-3 -2 -1 0 1 2 3
Item
In
form
atio
n
Engagement Level

MEASURING STUDENT ENGAGEMENT 45
Figure 12:
Community Based Activities Engagement scale test information function (TIF). The x axis
gives levels of engagement in standard normal units. The y axis gives the test information.
High values on y indicate relatively more reliable (i.e., informative) engagement
measurement levels.
0
0.5
1
1.5
2
2.5
3
3.5
-3 -2 -1 0 1 2 3
Tes
t In
form
atio
n
Engagement Level