,PRS ReportIIIIIIII - DTIC
39
JPRS-CST-91-019 18 OCTOBER 1991 A N N I V E R S A RY 1941 - 1991 ,PRS ReportIIIIIIII Science & Te chnoloy China High-Power Lasers & Laser Fusion Research DTIlC QUALLIT11 19980203 290 REPRODUCED BY U.S. DEPARTMENT OF COMMERCE NATIONAL TECHNICAL INFORMATION SERVICE SPRINGFIELD, VA 22161
-
Upload
khangminh22 -
Category
Documents
-
view
1 -
download
0
Transcript of ,PRS ReportIIIIIIII - DTIC

JPRS-CST-91-01918 OCTOBER 1991
A N N I V E R S A RY1941 -1991
,PRS ReportIIIIIIII
Science &
Te chnoloy
ChinaHigh-Power Lasers & Laser Fusion Research
DTIlC QUALLIT11
19980203 290
REPRODUCED BYU.S. DEPARTMENT OF COMMERCE
NATIONAL TECHNICALINFORMATION SERVICESPRINGFIELD, VA 22161
Science & TechnologyChina
High-Power Lasers & Laser Fusion Research
JPRS-CST-91-019 CONTENTS 18 October 1991
LF-I Laser Apparatus Passes Technical Appraisal[Xie Ping, Liu Jianguo; QIANG JIG UANG YU LIZI SHU, Nov 90] ......................................................... 1
Experimental Research on X-Ray Radiation From Hohlraum Targets Irradiated With Two Beams[Sun Kexi, Xu Heping, et al; QIANG JIGUANG YU LIZI SHU, Nov 90] ............................................... 3
Energy Measurements for 3/2oo, 2coo Harmonic Waves Emitted by Laser-Irradiated Targets[Xie Ping, Zhao Jiawei, et al; QIANG JIGUANG YU LIZI SHU, Feb 91] ................................................ 9
High-Efficiency Frequency-Doubling System for LF- 11 Laser Apparatus Used for ICF Experiment[Wei Xiaofeng, Zhang Xiaomin; QIANG JIG UANG YU LIZI SHU, Feb 91] ......................................... 14
Picosecond Soft X-Ray Streak Camera Described[Gu Boxun; QIANG JIGUANG YU LIZI SHU, Feb 91] ......................................................................... 22
ICF, X-Ray Laser Experiments With LF- 12 (Shen Guang) Apparatus Described[Xiao Guan'gen, RENMIN RIBAO, 3 May 91] ......................................... 23
Additional Note on LF-12 Apparatus [RENMIN RIBAO, 3 May ..........................9.......................... 24High-Power Nd:YAG Laser With Variable Pulsewidth
[Lin Lihuang, Ouyang Bin, et al; GUANGXUE XUEBAO, May 91] ....................................................... 24Absolute Measurement of Laser Energy for 'Shen Guang' High-Power Laser Facility
[Lin Kangchun, Shen Liqing; GUANGXUE XUEBAO, May 91] ............................................................ 28Inhomogeneous Distribution of Electron Density, Strong X-Ray Emission by Laser Irradiated
Segmented Planar Target [Feng Xianping, Xu Zhizhan, et al; ZHONGGUO JIGUANG, May 91] ....... 31Automatic Tuning Picosecond Parametric Laser
[He Huijuan, Lu Yutian, et al; GUANGXUE XUEBAO, Jun 91] ........................................................... 31Additional Details on Domestically Developed 10 kW CO 2 Laser Revealed
[Ji Zhong; ZHONGGUO JIGUANG, Jun 91] ............................................................................................ 35Broadband Frequency-Doubled Nd:Glass Laser Built at SIOFM
[Shang Guang; ZHONGGUO KEXUE BAO, 5 Jul 91] ........................................................................... 36Soft X-Ray Picosecond Framing Camera Developed
[Wang Baizhan; ZHONGGUO KEXUE BAO, 19 Jul 91] ....................................................................... 36
JPRS-CST-91-019 118 October 1991
LF-11 Laser Apparatus Passes Technical •Appraisal - - -
91FEO588A Chengdu QIANG JIGUANG YU LIZI SHU[HIGH-POWER LASER AND PARTICLE BEAMS] "•b.• .in Chinese Vol 2 No 4, Nov 90 p 513 [inside back cover] t..
[Article by Xie Ping [6200 1627] and Liu Jianguo [04911696 0948]: "LF-I I Laser Apparatus Passes TechnicalAppraisal"]
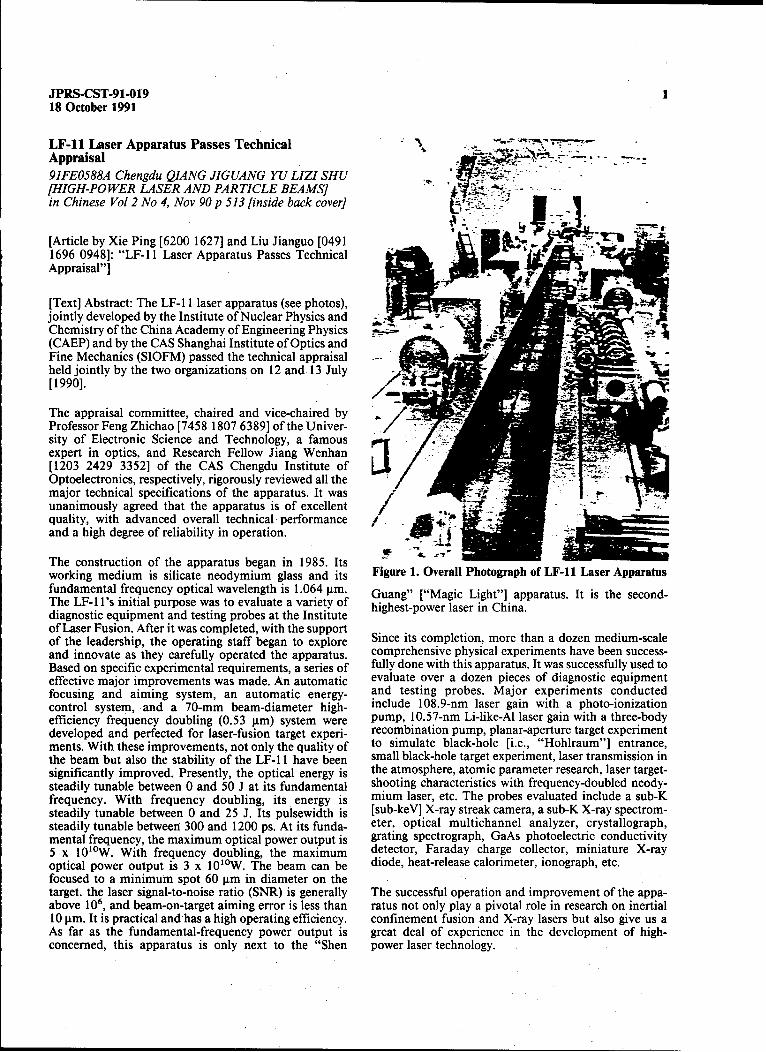
[Text] Abstract: The LF- 11 laser apparatus (see photos),jointly developed by the Institute of Nuclear Physics and .Chemistry of the China Academy of Engineering Physics A(CAEP) and by the CAS Shanghai Institute of Optics andFine Mechanics (SIOFM) passed the technical appraisalheld jointly by the two organizations on 12 and 13 July[1990].
The appraisal committee, chaired and vice-chaired byProfessor Feng Zhichao [7458 1807 6389] of the Univer-sity of Electronic Science and Technology, a famousexpert in optics, and Research Fellow Jiang Wenhan[1203 2429 3352] of the CAS Chengdu Institute ofOptoelectronics, respectively, rigorously reviewed all themajor technical specifications of the apparatus. It was -
unanimously agreed that the apparatus is of excellentquality, with advanced overall technical performance / -and a high degree of reliability in operation. " .
The construction of the apparatus began in 1985. Itsworking medium is silicate neodymium glass and its Figure 1. Overall Photograph of LF-11 Laser Apparatusfundamental frequency optical wavelength is 1.064 pim. Guang" ["Magic Light"] apparatus. It is the second-The LF-1 's initial purpose was to evaluate a variety of highest-power laser in China.diagnostic equipment and testing probes at the Instituteof Laser Fusion. After it was completed, with the supportof the leadership, the operating staff began to explore Since its completion, more than a dozen medium-scaleand innovate as they carefully operated the apparatus, comprehensive physical experiments have been success-Based on specific experimental requirements, a series of fully done with this apparatus. It was successfully used toeffective major improvements was made. An automatic evaluate over a dozen pieces of diagnostic equipmentfocusing and aiming system, an automatic energy- and testing probes. Major experiments conductedcontrol system, and a 70-mm beam-diameter high- include 108.9-nm laser gain with a photo-ionizationefficiency frequency doubling (0.53 jim) system were pump, 10.57-nm Li-like-Al laser gain with a three-bodydeveloped and perfected for laser-fusion target experi- recombination pump, planar-aperture target experimentments. With these improvements, not only the quality of to simulate black-hole [i.e., "Hohlraum"] entrance,the beam but also the stability of the LF- 11 have been small black-hole target experiment, laser transmission insignificantly improved. Presently, the optical energy is the atmosphere, atomic parameter research, laser target-steadily tunable between 0 and 50 J at its fundamental shooting characteristics with frequency-doubled neody-frequency. With frequency doubling, its energy is mium laser, etc. The probes evaluated include a sub-Ksteadily tunable between 0 and 25 J. Its pulsewidth is [sub-keV] X-ray streak camera, a sub-K X-ray spectrom-steadily tunable between 300 and 1200 ps. At its funda- eter, optical multichannel analyzer, crystallograph,mental frequency, the maximum optical power output is grating spectrograph, GaAs photoelectric conductivity5 x 10"0 W. With frequency doubling, the maximum detector, Faraday charge collector, miniature X-rayoptical power output is 3 x 1 WW. The beam can be diode, heat-release calorimeter, ionograph, etc.focused to a minimum spot 60 gtm in diameter on thetarget. the laser signal-to-noise ratio (SNR) is generally The successful operation and improvement of the appa-above 106, and beam-on-target aiming error is less than ratus not only play a pivotal role in research on inertial10 gim. It is practical and has a high operating efficiency. confinement fusion and X-ray lasers but also give us aAs far as the fundamental-frequency power output is great deal of experience in the development of high-concerned, this apparatus is only next to the "Shen power laser technology.
2 JPRS-CST-91-01918 October 1991
AA
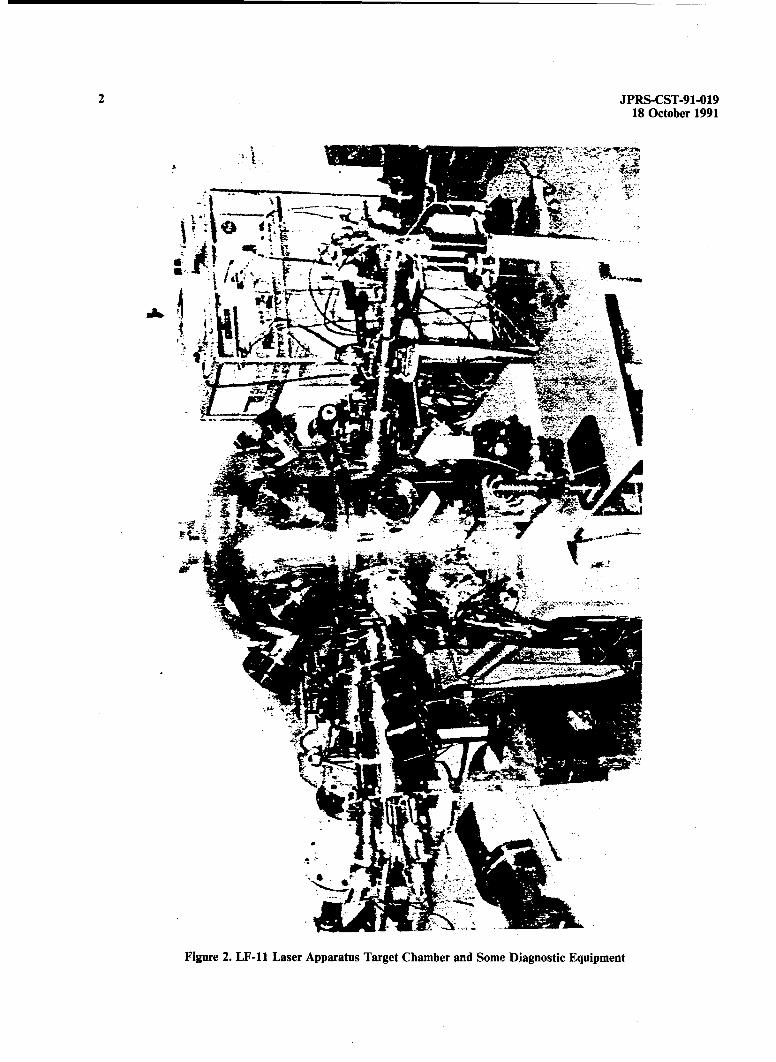
Figure 2. LF-11 Laser Apparatus Target Chamber and Some Diagnostic Equipment
JPRS-CST-91-019 318 October 1991
Experimental Research on X-Ray Radiation From transfer period, and b ranges from 3 to 10. By differen-Hohlraum Targets Irradiated With Two Beams tiating equation (2), an expression for the transfer rate x91FEO588B Chengdu QIANG JIG UANG YU LIZI SHU can be obtained:[HIGH-POWER LASER AND PARTICLE BEAMS]in Chinese Vol 2 No 4, Nov 90 pp 401-408 [MS received 39 Apr 90, revised 30 Jun 90] - 31RC 4aTR (3)
b pcvx[Article by Sun Kexi [1327 0668 3556], Xu Heping [1776
0735 1627], Tang Yongjiang [0781 3075 0256], ZhengZhijian [6774 1807 1017], and Yang Jianguo [2799 1696 This equation shows that the transfer rate is proportional0948] of the Southwest Institute of Nuclear Physics and to TR4 6 and inversely proportional to the distance.Chemistry (SINPC): "Experimental Research on X-Ray Based on the transfer rate, we know the X-ray flux isRadiation From Hohlraum Targets Irradiated With TwoBeams"] I
F = -kVTa = '---c V aT (4)[Text] Abstract: Experimental results of radiation prop- 3erties of Hohlraum targets irradiated by two laser beamsin the Shen Guang apparatus are described. Two sub-keV X-ray spectrometers with time-correlation devices This equation shows that the radiation energy transfer(Dante) were used to monitor the X-ray spectra of the flux is proportional to TR5 -7 . From these two equations,absorption and conversion region and the implosion it is obvious that TR is a key physical parameter inregion. The X-ray pulse waveforms, radiation energy indirect-drive ICF experiments. In order to attain a goodspectra, radiation temperature, radiation time spectra, drive field environment to ultimately raise the radiationand radiation temperature versus time were measured. temperature in the implosion region, we must investigateIn addition, many hosts with different types of Hohl- the laser-to-X-ray conversion mechanism and the radia-raum targets were taken to study the relation between tion transport process. Therefore, it is of significantradiation temperature in the conversion region and the importance to study the effect of Hohlraum geometryinput laser surface energy density. In this work, for the and size on X-ray conversion and radiation transport.2 'first time, measurements were made with a grazingincidence grating in the sub-keV X-ray spectrometer and II. Experimental Conditionsthe results obtained were excellent.
I. Introduction 1. Layout of Dual-Base Experiment
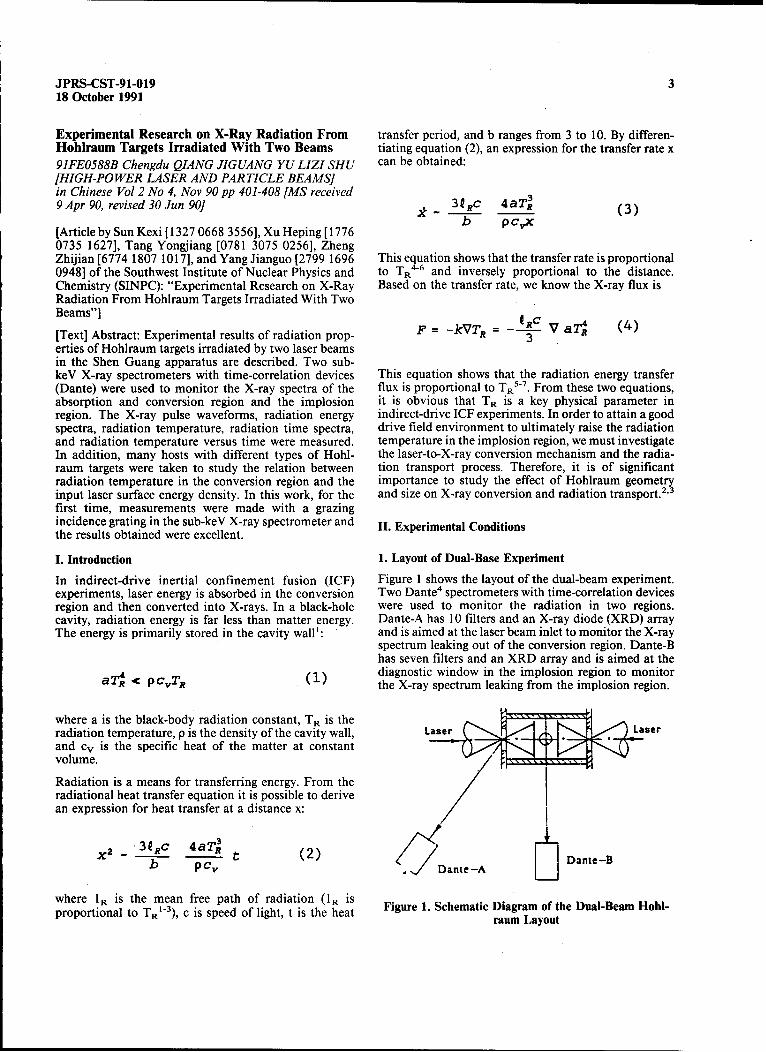
In indirect-drive inertial confinement fusion (ICF) Figure 1 shows the layout of the dual-beam experiment.experiments, laser energy is absorbed in the conversion Two Dante4 spectrometers with time-correlation devicesregion and then converted into X-rays. In a black-hole were used to monitor the radiation in two regions.cavity, radiation energy is far less than matter energy. Dante-A has 10 filters and an X-ray diode (XRD) arrayThe energy is primarily stored in the cavity wall1: and is aimed at the laser beam inlet to monitor the X-ray
spectrum leaking out of the conversion region. Dante-Bhas seven filters and an XRD array and is aimed at the
a Tdiagnostic window in the implosion region to monitoraT c p CvTR the X-ray spectrum leaking from the implosion region.
where a is the black-body radiation constant, TR is theradiation temperature, p is the density of the cavity wall, L Laseand cv is the specific heat of the matter at constantvolume.
Radiation is a means for transferring energy. From theradiational heat transfer equation it is possible to derivean expression for heat transfer at a distance x:
3X2 - 3fRC 4aTR (2) IIb PCV Dante-A
where 1R is the mean free path of radiation (1R isproportional to TR- 3 ), c is speed of light, t is the heat Figure 1. Schematic Diagram of the Dual-Beam Hohl-raum Layout
4 JPRS-CST-91-01918 October 1991
Experiments were done under a variety of conditionswith different. Hohiraum targets (of different sizes). TheGrznexperimental layout is essentially to that of the dual- angle Ibeam black-hole experiment. XRD
Light
Fle
2. Spectrometer Improvements source .
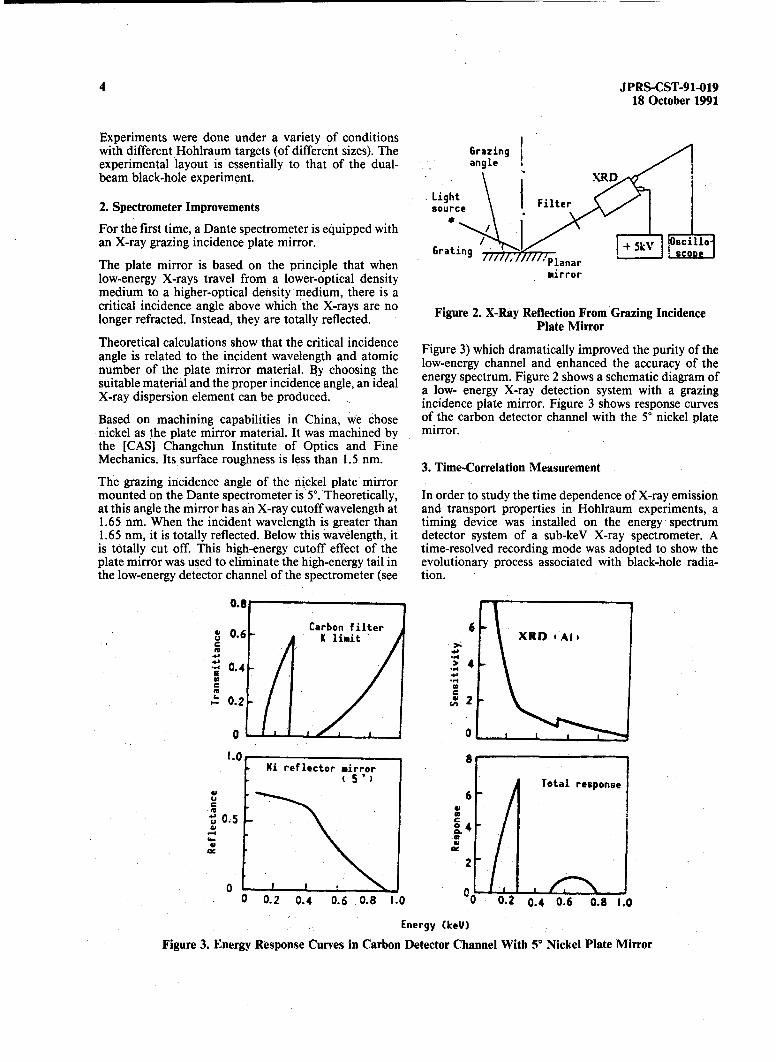
For the first time, a Dante spectrometer is equipped withan X-ray grazing incidence plate mirror. +5~ 0clo
The plate mirror is based on the principle that when G'lanar I s- e
low-energy X-rays travel from a lower-optical density mirrormedium to a higher-optical density medium, there is acritical incidence angle above which the X-rays are no Figure 2. X-Ray Reflection From Grazing Incidencelonger refracted. Instead, they are totally reflected. Plate Mirror
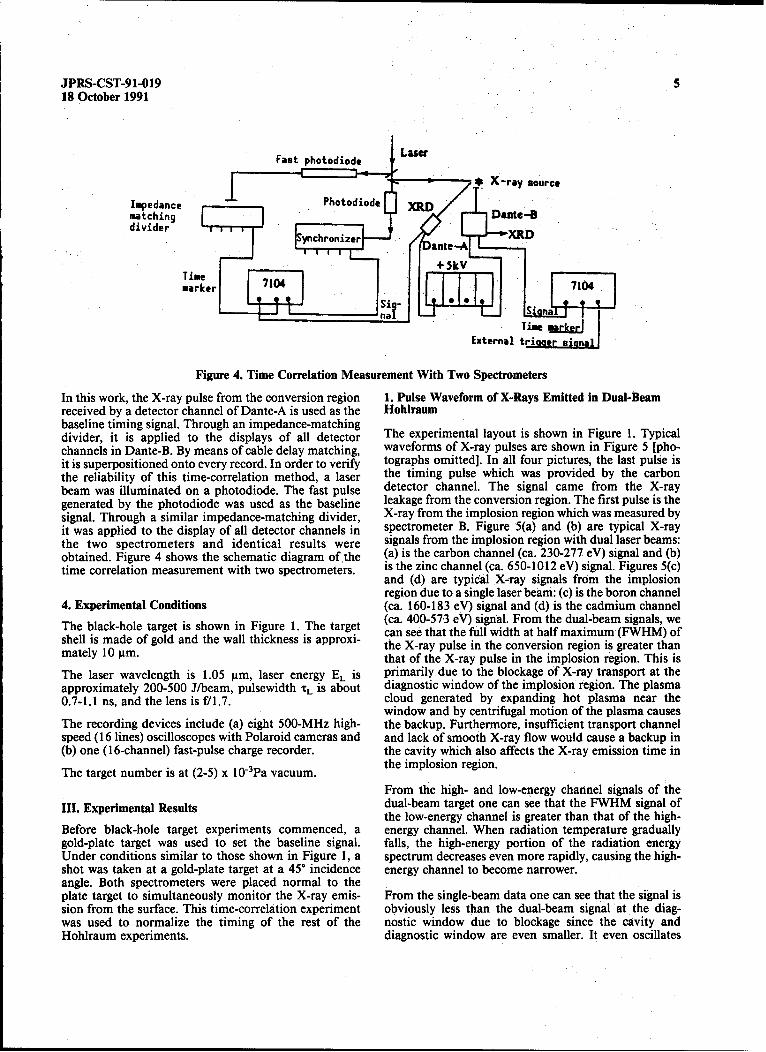
Theoretical calculations show that the critical incidenceangle is related to the incident wavelength and atomic Fi-eegur 3whchane adramatiallnmpoed the pcuraty of thenumber of the plate mirror material. By choosing the low-energy channel and enhanced the accuracy of thesuitable material and the proper incidence angle, an ideal a low- energy X-ray detection system with a grazingX-ray dispersion element can be produced. incidence plate mirror. Figure 3 shows response curves
Based on machining capabilities in China, we chose of the carbon detector channel with the 50 nickel platenickel as the plate mirror material. It was machined by mirror.the [CAS] Changchun Institute of Optics and FineMechanics. Its surface roughness is less than 1.5 nm. 3. Time-Correlation Measurement
The grazing incidence angle of the nickel plate mirrormounted on the Dante spectrometer is 5Y. Theoretically, In order to study the time dependence of X-ray emissionat this angle the mirror has an X-ray cutoff wavelength at and transport properties in Hohlraum experiments, a1.65 nm. When the incident wavelength is greater than timing device was installed on the energy spectrum1.65 nm, it is totally reflected. Below this wavelength, it detector system of a sub-keV X-ray spectrometer. Ais totally cut off. This high-energy cutoff effect of the time-resolved recording mode was adopted to show theplate mirror was used to eliminate the high-energy tail in evolutionary process associated with black-hole radia-the low-energy detector channel of the spectrometer (see tion.
0.8SCarbon filter 6
S0.6 •K limit XRD 'Al)
. 0.4 , 40 •
-• 0.2
0 0
1.0 8Ni reflector mirror
( 5) Total responseGE
S0.5 1
0 1N0 0.2 0.4 0.6 0.8 1.0 0 0.2 0.4 0.6 0.8 1.0
Energy (keU)
Figure 3. Energy Response Curves in Carbon Detector Channel With 5' Nickel Plate Mirror
JPRS-CST-91-019 518 October 1991
Fast photodiode Lae
l • •• S.X-ray source
Impedance Photodiode XRDmatching Da" te-divider
Etchrn"nera- tRD
""arkerl o u a te o u 7104
External tris er s ianF e y
Figure 4. Time Correlation Measurement With Two Spectrometers
In this work, the X-ray pulse from the conversion region 1. Pulse Waveform of X-Rays Emitted in Dual-Beamreceived by a detector channel of Dante-A is used as the Hohlraumbaseline timing signal. Through an impedance-matchingdivider, it is applied to the displays of all detector The experimental layout is shown in Figure 1. Typicalchannels in Dante-B. By means of cable delay matching, waveforms of X-ray pulses are shown in Figure 5 [pho-it is superpositioned onto every record. In order to verify tographs omitted). In all four pictures, the last pulse isthe reliability of this time-correlation method, a laser the timing pulse which was provided by the carbonbeam was illuminated on a photodiode. The fast pulse detector channel. The signal came from the X-raygenerated by the photodiode was used as the baseline leakage from the conversion region. The first pulse is thesignal. Through a similar impedance-matching divider, X-ray from the implosion region which was measured by
it was applied to the display of all detector channels in spectrometer B. Figure 5(a) and (b) are typical X-raythe two spectrometers and identical results were signals from the implosion region with dual laser beams:obtained. Figure 4 shows the schematic diagram ofgthe (a) is the carbon channel (ca. 230-277 eV) signal and (b)time correlation measurement with two spectrometersx is the zinc channel (ca. 650-1012 eV) signal. Figures 5(c)
and (d) are typical XXray signals from the implosionregion due to a single laser beam: (c) is the boron channel
4. Experimental Conditions (ca. 160-183 eV) signal and (d) is the cadmium channel
The black-hole target is shown in Figure 1. The target (ca. 400-573 eV) signal. From the dual-beam signals, we
speed (16 lines osolloscophes willthPolaridc ameras andr - can see that of s th at half maximum (FWHM) of
b 1lely is made fastue carg rcordesr, the X-ray pulse in the conversion region is greater thanthat of the X-ray pulse in the implosion region. This is
The laser wavelength is 1.05 tm, laser energy E, is primarily due to the blockage of X-ray transport at theapproximately 200-500 J/beam, pulsewidth T[L is about diagnostic window of the implosion region. The plasma
0.7-1.1 ns, and the lens is f/1.7 cloud generated by expanding hot plasma near thewindow and by centrifugal motion of the plasma causes
The recording devices include (a) eight 500-MHz high- the backup. Furthermore, insufficient transport channelspeed (c6 lines) oscilloscopes with Polaroid cameras and and lack of smooth X-ray flow would cause a backup in(b) one ( 6-channel) fast-pulse charge recordera the cavity which also affects the X-ray emission time inThe target number is at (2-5) x 10"3Pa vacuum.thimlsoreon
From the high- and low-energy channel signals of theIII. Experimental Results dual-beam target one can see that the FWHM signal of
the low-energy channel is greater than that of the high-
Before black-hole target experiments commenced, a energy channel. When radiation temperature graduallygold-plate target was used to set the baseline signalt falls, the high-energy portion of the radiation energyUnder conditions similar to those shown in Figure 1, a spectrum decreases even more rapidly, causing the high-shot was taken at a gold-plate target at a 45* incidence energy channel to become narrower.angle. Both spectrometers were placed normal to theplate target to simultaneously monitor the X-ray emis- From the single-beam data one can see that the signal ission from the surface. This time-correlation experiment obviously less than the dual-beam signal at the diag-was used to normalize the timing of the rest of the nostic window due to blockage since the cavity andHohlraum experiments. diagnostic window are even smaller. It even oscillates
JPRS-CST-91-01918 October 1991
.a A- 10 -
r-
10"-
0 0.2 0.4 0.6 0.8 1.0 :.2 0.4 0.6 0.3 1.0 1.2
Energy NkeV) Energy (keV)
(a) X-ray spectrum in conversion region (b) X-ray spectrum in implosion region
Figure 6. Typical Sub-keV X-Ray Spectra in Dual-Beam Experiment 890531-01
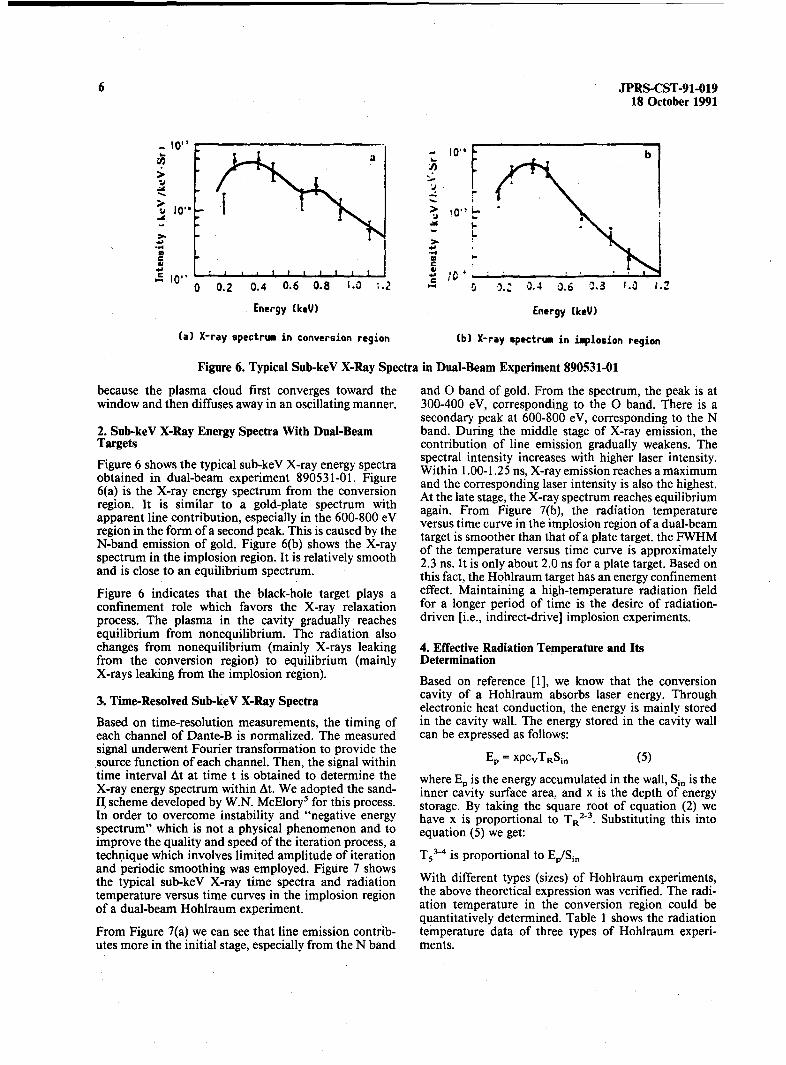
because the plasma cloud first converges toward the and 0 band of gold. From the spectrum, the peak is atwindow and then diffuses away in an oscillating manner. 300-400 eV, corresponding to the 0 band. There is a
secondary peak at 600-800 eV, corresponding to the N2. Sub-keV X-Ray Energy Spectra With Dual-Beam band. During the middle stage of X-ray emission, theTargets contribution of line emission gradually weakens. TheFigure 6 shows the typical sub-keV X-ray energy spectra spectral intensity increases with higher laser intensity.Fined in showsleam expiealsum-ent 890531-. en gypetr Within 1.00-1.25 ns, X-ray emission reaches a maximumobtained in dual-beam experiment 890531-01. Figure and the corresponding laser intensity is also the highest.6(a) is the X-ray energy spectrum from the conversion At the late stage, the X-ray spectrum reaches equilibriumregion. It is similar to a gold-plate spectrum with aan rmFgr () h aito eprtr
apparent line contribution, especially in the 600-800 eV again. From Figure 7(b), the radiation temperatureregion in the form of a second peak. This is caused by the versus time curve in the implosion region of a dual-beam
N-bad eissin o gol. Fgur 6(b shws te Xray target is smoother than that of a plate target. the FWHMN-band emission of gold. Figure 6(b) shows the X-ray of the temperature versus time curve is approximatelyspectrum in the implosion region. It is relatively smooth 2.3 ns. It is only about 2.0 ns for a plate target. Based onand is close to an equilibrium spectrum. this fact, the Hohlraum target has an energy confinement
Figure 6 indicates that the black-hole target plays a effect. Maintaining a high-temperature radiation fieldconfinement role which favors the X-ray relaxation for a longer period of time is the desire of radiation-process. The plasma in the cavity gradually reaches driven [i.e., indirect-drive] implosion experiments.equilibrium from nonequilibrium. The radiation alsochanges from nonequilibrium (mainly X-rays leaking 4. Effective Radiation Temperature and Itsfrom the conversion region) to equilibrium (mainly DeterminationX-rays leaking from the implosion region). Based on reference [1], we know that the conversion
cavity of a Hohlraum absorbs laser energy. Through3. Time-Resolved Sub-keV X-Ray Spectra electronic heat conduction, the energy is mainly storedBased on time-resolution measurements, the timing of in the cavity wall. The energy stored in the cavity walleach channel of Dante-B is normalized. The measured can be expressed as follows:signal underwent Fourier transformation to provide thesource function of each channel. Then, the signal within = xpcVTRSin (5)time interval At at time t is obtained to determine the where Ep is the energy accumulated in the wall, Sin is theX-ray energy spectrum within At. We adopted the sand- inner cavity surface area, and x is the depth of energy11 scheme developed by W.N. McElory5 for this process, storage. By taking the square root of equation (2) weIn order to overcome instability and "negative energy have x is proportional to TR2"3 . Substituting this intospectrum" which is not a physical phenomenon and to equation (5) we get:improve the quality and speed of the iteration process, atechnique which involves limited amplitude of iteration T5
3"4 is proportional to Ep/Sinand periodic smoothing was employed. Figure 7 showsthe typical sub-keV X-ray time spectra and radiation With different types (sizes) of Hohlraum experiments,temperature versus time curves in the implosion region the above theoretical expression was verified. The radi-of a dual-beam Hohlraum experiment. ation temperature in the conversion region could be
quantitatively determined. Table 1 shows the radiationFrom Figure 7(a) we can see that line emission contrib- temperature data of three types of Hohlraum experi-utes more in the initial stage, especially from the N band ments.

JPRS-CST-91-019 718 October 1991
-4> ' 50-
1 0 - OF
0.0 0.5 1.0 i.5 50Energy NO) Time ns)
Figure 7. Time-Resolved Spectra of Typical Dual-Beam Experiment 890531-01
Table 1. Experimental Data of Three Types of Hohlraum Experiments
Target Laser energy (J) Pulse width (ns) Conversion region Implosion regionTRI(eV) TR2(eV)
Dual-beam target (large cavity) 427 1.12 148 137
415 0.98
Leaky target (medium cavity) 442 0.84 170 -
Single-beam target (small cavity) 434 0.78 176 110
Based on the curve in Figure 8, through linear regression,2.25 *, the following equation can be derived:
- ( ,= 6)S0.0
T where TR1 is the conversion-region radiation tempera-o/ *" • ture, in eV. EL/Sin is in units of 10 4 J/cm2 , which is the
. " quantity determined by Hohlraum experiments. It ist analogous to the theoretical result derived from equation
2.15 (5).0.6 0.7 0.8 0.9 1.0 1.1
Surface energy density, From Table 1, one also finds that single-beam targetso g y dhave higher radiation temperature in the conversion
log (EL /S,) region compared to dual-beam targets. However, the
Figure 8. Logarithmic Plot of Conversion-Zone Radia- radiation temperature in the implosion region is muchtion Temperature Vs. Incident Laser Surface Energy lower than that of a dual-beam target. This is dependent
Density. EL/Sinexpressed in units of 104J/cm2 and TR upon the X-ray transport situation. Because the cavity isin eV. small, its transport channel is also limited. The amount
of energy delivered into the implosion region is low;From Table 1, under almost identical conditions, the thus, the temperature of the radiation field formed isdifferent targets have different conversion-region radia- also low. Conversely, a dual-beam target has a largertion temperature, dependent upon the surface area of the transport channel -which delivers more energy to thecavity. A large cavity has a larger inner surface area and implosion region. Therefore, its radiation temperature islower temperature. Conversely, a small inner cavity also higher.surface area has a higher temperature. Based on the data,the relation between conversion region temperature andaverage laser energy density per unit surface area is 5. Investigation of Radiation Transport Time
obtained. Figure 8 shows a logarithmic relation between Another objective of the time-correlation experiment isradiation temperature and mean surface laser energy to observe the X-ray transport time. On the basis of thedensity. time-correlated X-ray signals emitted from the two
8 JPRS-CST-91-01918 October 1991
regions of a black-hole target shown in Figure 5, using a not fully ionized under the experimental conditionplate target signal for time normalization, the time delay (approximately 130-170 eV in plasma radiation temper-between the X-ray pulses emitted from the implosion ature). Most transition lines occurred in fourth or fifthregion and that from the conversion region was mea- shells.sured. This time is the X-ray transport time. The resultsnot only did not reveal any transport time but also The time spectra also revealed the X-ray relaxationshowed that the X-rays from the implosion region are process. In the initial stage (within 1.0 ns), although
X-ray intensity rises with increasing laser intensity, lineFurthermore, this amount increases as the diagnostic emission gradually weakens from a dominant position.window gets smaller. Moreover, this amount is larger for After 1.0 ns, X-ray emission reaches equilibrium. This islower-energy channels. An analysis showed that this is a the X-ray relaxation process and the relaxation time isfalse impression due to a bottleneck. The trailing edge of approximately 1.0-1.5 ns.the real pulse is absorbed by the ion cloud which createsthe false impression that the peak of the pulse is shiftedforward. The bottleneck effect occurs even earlier when Use of a 50 nickel-plate mirror could improve the puritythe diagnostic window is small. (The ion cloud gathers at of a low- energy channel from 50 percent to above 90the center of the diagnostic window faster.) Even the real percent. Only a very small portion of the high-energy tailpulse peak is absorbed, as shown in Figure 5(c) and (d) is still contributing to the signal. In order to furtherwith a single-beam target. At this time, when the ion improve the purity of the low-energy channel signal, it iscloud emits, X-rays can pass through the window again, necessary to develop plate mirrors made of lighter mate-This creates the oscillation patterns shown in Figure 5(c) rials (such as carbon, beryllium, etc.) to completelyand (d). eliminate the high energy tail.
This result qualitatively indicates that the X-ray trans-port time is relatively small. Otherwise, the forward shift Acknowledgement(impression) of the X-ray pulse created by the diagnosticwindow of the implosion region would not be so The authors wish to express their gratitude to the targetapparent. It is estimated to be less than 0.1 ns. fabrication group, Laboratory 209, SINPC, for providing
a large number of different targets; to Laboratory 210IV. Conclusions and to Shanghai Joint Laser Laboratory for operating the
laser; to the leadership of the institutes involved for theirDual-beam Hohlraum experiments revealed that laser support; and to Chang Fuhua [1603 1381 5478] ofabsorption and X-ray conversion might be more efficient Laboratory 204 for making a large number of filters.when the conversion cavity is large and the mean surfacedensity of injected laser energy is low. However, it isdifficult to establish a high-temperature field which Referenceshinders the transport speed and X-ray flux. Neverthe-less, from the radiation temperatures for different cavi- 1. Yu Min [0060 2404], "Outlook for Inertial Confine-ties shown in Table 1, dual-beam targets have larger ment Fusion," China Academy of Engineering Physics,conversion cavities and transport windows. The trans- CAEP-000l, HL-000l, Jan 1988.port channels are wide open and the energy delivered tothe implosion region is also high. The radiation temper-ature established is higher than that of a small-cavity 2. Zhang Yun [1776 6874], et al., "Study of Laser X-Raysingle-beam target. Different outcomes were obtained Conversion in Cylindrical Cavity Targets and Relatedwith similar targets of various transport windows. This Physical Problems," Symposium of Annual High-Powerresult also explains the same effect from another view- Laser Technology Conference (2), Apr 1988.point.
In conclusion, conditions that affect conversion, radia- 3. Chang Tieqiang [1603 6993 1730], et al., "Physicaltion transport, and radiation temperature are mutually Processes in High- Gain, Indirect-Drive Inertial Con-constraining. It is impossible to pursue one condition finement Fusion," QIANG JIGUANG YU LIZI SHUwhile neglecting others. All factors must be considered in [HIGH-POWER LASER AND PARTICLE BEAMS],the design in order to obtain the optimum radiation- Vol 1 No 3, 1989.drive environment.
4. Sun Kexi, et al., "Diagnosis of Laser Plasma UsingSub-keV X-ray energy and time spectra of dual-beam S bk V X R y E eg p cr m "Ii . o o1Hohlraum experiments show that there was a great deal 1990.of line radiation in the X-ray conversion process, espe-cially in the initial stage. In the 300-400 eV and 600-800eV ranges, the contribution of line radiation is more 5. W.N. McElroy, et al., "A Computer-Automated Iter-prominent. It corresponds to the 0 band and N band ative Method for Neutron Flux Spectral Determinationemission of gold. This indicates that the gold plasma was by Foil Activation II, Sand II," New Mexico, 1967.
JPRS-CST-91-019 918 October 1991
Energy Measurements for 3 / 2wo, 2 o)o Harmonic 1.0Waves Emitted by Laser-Irradiated Targets91FE0588C Chengdu QIANG JIG UANG YU LIZISHU [HIGH-POWER LASER AND PARTICLEBEAMS] in Chinese Vol 3 No 1, Feb 91 pp 50-56 [MSreceived 11 Apr 90, revised 10 Sep 90] " 0.6
[Article by Xie Ping [6200 1627], Zhao Jiawei [6392 0.40857 0251], Yang Xiangdong [2799 0686 2639], Zhang "Haiying [1728 3189 5391], and Guo Su [6753 4790] ofSINPC: "Energy Measurements for 3/2 w0 and 2 0)0 0.2Harmonic Waves Emitted by Laser-Irradiated Targets"]
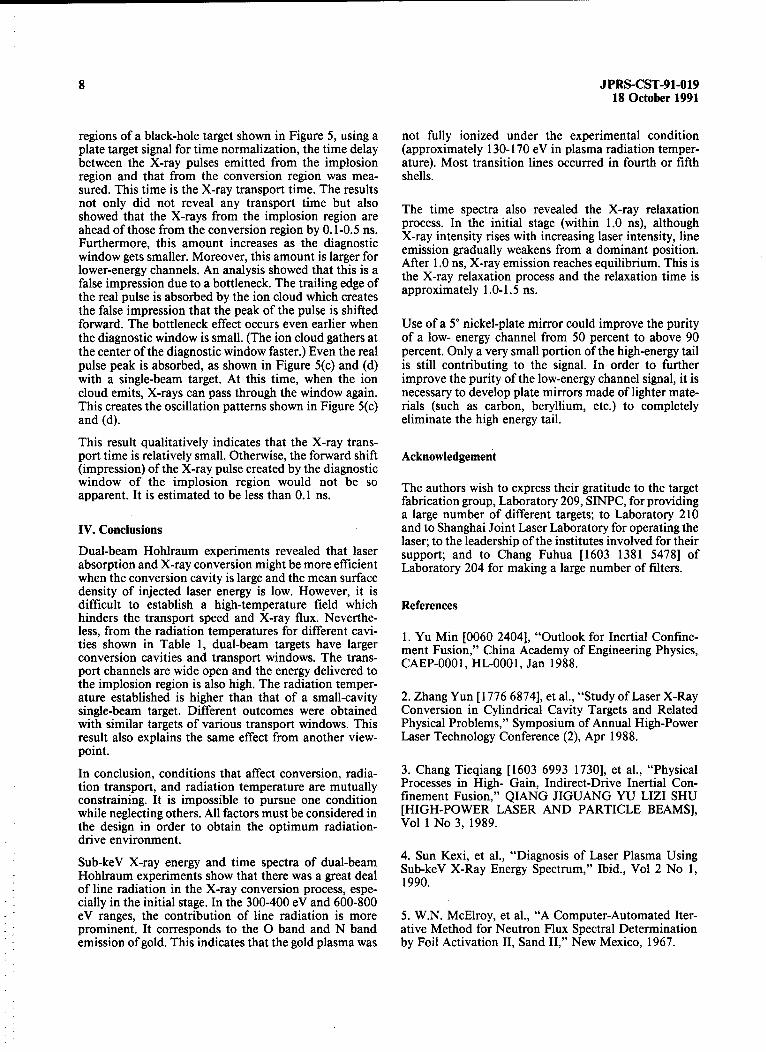
[Text] Abstract: The principle and method of energy 0.4 0.6 0.8 1.0 1.2measurement for the 3/2 w0o and 2 0)0 harmonic wavesemitted by planar and Hohlraum targets irradiated withthe fundamental-frequency (X = 1.053 gtm) "Shen Figure 1. Spectral Response Curve of Silicon Photo-Guang" Nd-glass laser are described. Experimental dioderesults are presented. In addition, a brief analysis anddiscussion are also provided. high-power lasers. We assumed that the energy of eitherthe 3/2o)o or 2wo0 harmonic waves is lower than that of
I. Introduction Raman, at below 10.6.
In laser-fusion experiments, superthermal electrons are Under the circumstance that the excited Brillouin scat-an important issue. A large number of experiments tering background is seriously present, it is relativelyconducted in recent years show that the temperature and difficult to accurately determine the amounts of energynumber of superthermal electrons generated by irradi- associated with 3/2%0 and 2%0 . Nevertheless, we man-ating Hohlraum targets are much higher than the tem- aged to maintain a sufficient SNR by using bandpassperature and number of superthermal electrons gener- filters and neutral density filters and by adjusting theated by planar targets under identical conditions. This sensitivity of the recording system we obtained veryeffect has seriously threatened our future work on laser- good data.induced fusion. In order to suppress superthermal elec-trons and minimize the deleterious effect, it is impera- II. Probe Structure and Sensitivity Determinationtive for us to understand its generation mechanism. With fundamental frequency irradiation, the character-Based on theory,' under conditions relevant to the Shen istic wavelengths of the 3/2i 0 and 2ion harmonic wavesGuang apparatus, superthermal electrons might be gen- ar e o7 t32 and 25goharmonic wave serated in a Hohlraum target from excited Raman scat- are 0.71 wtim and 0.53 ittm, respectively. Both wavelengthstering or resonant absorption. However, it is difficult to are within the sensitivity range of the silicon photodiode.determine which one is the dominant mechanism, or Therefore, silicon photodiodes with filters are used towhether there are other important mechanisms, based on measure the energy of 3/2%0 and 2w% harmonic waves attheory alone. We have to depend upon experimental various points in space. Furthermore, the total energydata to reach a decision. To this end, we installed probes emitted by harmonic waves in space is estimated basedspecifically designed to measure 3/2woo and 2woo (w0o is the on the angular distribution curve thus measured.fundamental frequency) harmonic waves in order to Probes are made of PIN silicon photodiodes togetherobserve the energy associated with products of the duo- with bandpass filters and multiple layers of neutralplasma decay process at 3/2%0 and the energy associated density filters. Figure 1 shows the spectral responsewith products of the resonant absorption process at 2w0o. curve of the silicon photodiode (provided by the manu-
There are only a few reports published in other countries facturer Chengdu Radio Plant No. 3). Figures 2 and 3on the measurement of characteristics of 3/2%0 and 2w0 show the typical transmittance curves with band filtersharmonic waves emitted by a planar target irradiated at for 3/2 0oo and 2w0 , respectively.the fundamental frequency. 2,3,4 The measurement of In order to ensure sufficient SNR, comprehensive con-characteristics of 3/2%0 and 2w0o harmonic waves sideration has been given to the composite filters for theemitted by a Hohlraum target irradiated at the funda- probes. The SNR of the 3/2%0 and 2%0 harmonic wavemental frequency has not been reported at all. Prior to probes is better than 50 with respect to scattered 1 0this experiment, we had no idea about the amounts of light. The 3/2 w% probe has an SNR of over 100 withenergy associated with the 3/2%0 and 2w0 harmonic respect to 2w0 harmonic waves and Raman scattering.waves for planar and Hohlraum target irradiated by the The 2w0 probe also has an SNR of over 100 with respect"Shen Guang." In order to ensure a high SNR, to set a to 3/2%0 harmonic waves and Raman scattering.reasonable measurement range for the data recordingsystem and to prepare the proper filters for the probes, The FWHM (AX) of the bandpass filter is chosen basedwe examined a great deal of target data 4 obtained with on the planar target data given in Reference [4]. The
10 JPRS-CST-91-01918 October 1991
0.70 0.70
0.60 - 0.60
0.50 0. o0
0.40 0.40 4
0.30 0.30
0. 20 -0.20 -
0.10 0.10 0
0.00 0.000.66 0.68 0.70 0.72 0.74 0.50 0.52 0.54 0.56 0.58
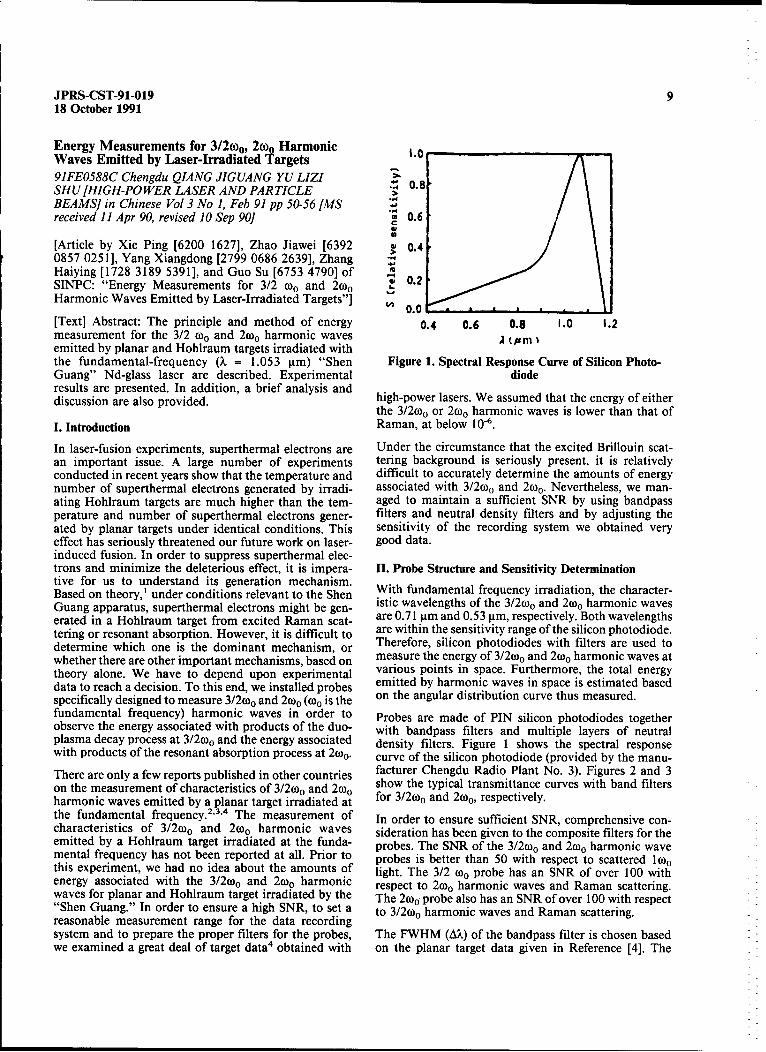
S(prm) ;. (pom)Figure 3. Transmittance of Bandpass Filter on 2w0o
Figure 2. Transmittance Curve for Bandpass Filter on
3/2(o0 Probe together with the curve shown in Figure 1 and thetransmittance of the filter, the sensitivity of the 3/2w0opassband FWHM of the filter is slightly larger than the probe can be determined.
overall width of the harmonic wave to be measured.III. Experimental Conditions and Method
Before the experiment, a 50-mm diameter frequency- The experiment was carried out on the "Shen Guang"doubled beam from the LF- 11 laser was used to calibrate apparatus. For ease of comparison, gold Hohlraum tar-the sensitivity of the 2co0 probe. A 70-mm diameter gets, gold planar targets, and aluminum planar targetswere irradiated under essentially identical conditions asfundamental frequency beam and a frequency-doubled shown in Table 1. In Table 1, EL, TL, 0, SNR, P, and D/fbeam from LF-I 1 were used to calibrate the sensitivities are incident laser energy, laser pulsewidth, laser focalof the silicon photodiode of the 3/2%0 harmonic wave spot, laser signal-to-noise ratio, target vacuum, and rel-probe at 1%0 and 2c00. Based on the calibration data, ative aperture of target lens, respectively.
Table 1. Irradiation Parameters of "Shen Guang" ApparatusEL (J) L (ps) a (Rm) SN p (Pa) D/f
142-442 620-940 ca. 200 107 1.33 x 10⁻³ f/1.7
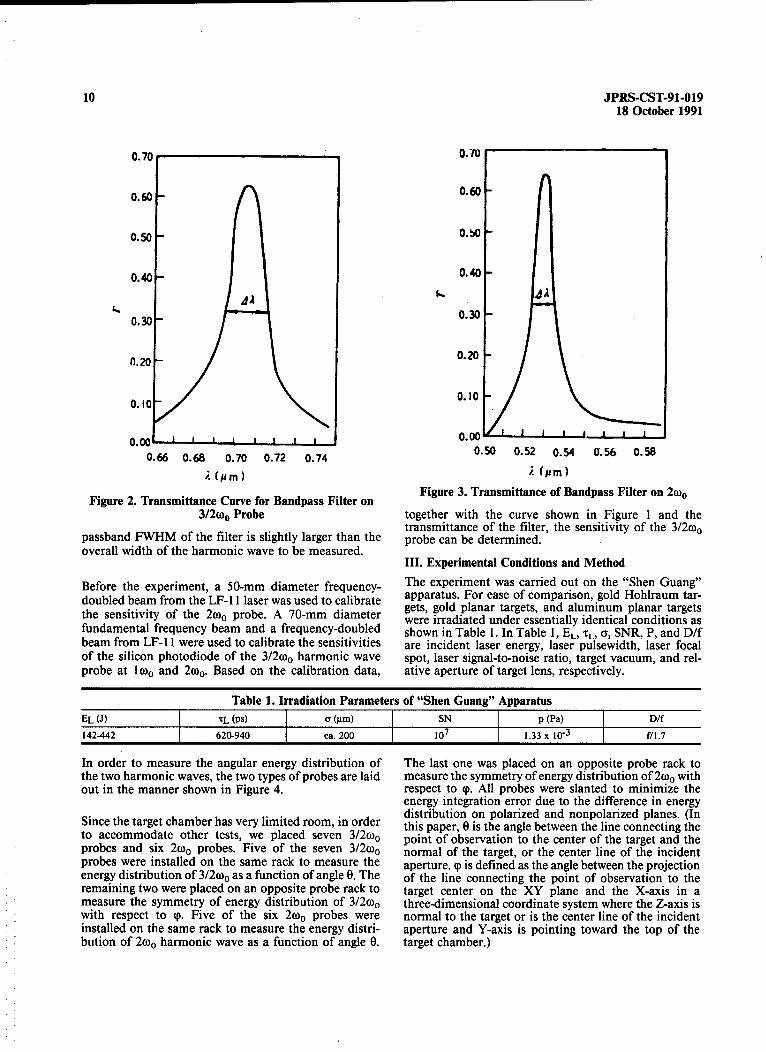
In order to measure the angular energy distribution of The last one was placed on an opposite probe rack tothe two harmonic waves, the two types of probes are laid measure the symmetry of energy distribution of 2%0 without in the manner shown in Figure 4. respect to p. All probes were slanted to minimize the
energy integration error due to the difference in energydistribution on polarized and nonpolarized planes. (In
Since the target chamber has very limited room, in order this paper, 0 is the angle between the line connecting theto accommodate other tests, we placed seven 3/2%0 point of observation to the center of the target and theprobes and six 2%0 probes. Five of the seven 3/2%0 normal of the target, or the center line of the incidentprobes were installed on the same rack to measure the aperture. (p is defined as the angle between the projectionenergy distribution of 3/2w0o as a function of angle 0. The of the line connecting the point of observation to theremaining two were placed on an opposite probe rack to target center on the XY plane and the X-axis in ameasure the symmetry of energy distribution of 3/2%0 three-dimensional coordinate system where the Z-axis iswith respect to p. Five of the six 2%0 probes were normal to the target or is the center line of the incidentinstalled on the same rack to measure the energy distri- aperture and Y-axis is pointing toward the top of thebution of 2%0 harmonic wave as a function of angle 0. target chamber.)
JPRS-CST-91-019 =I
18 October 1991
Laser *lg
b... ~ 2 ,-o \1C.
Figure 4. Layout of Harmonic Wave Probes ("A" is 3/2o0) probe and "0" is 2o0) probe)
IV. Experimental Results
1. Angular Distribution of Energy 89061902
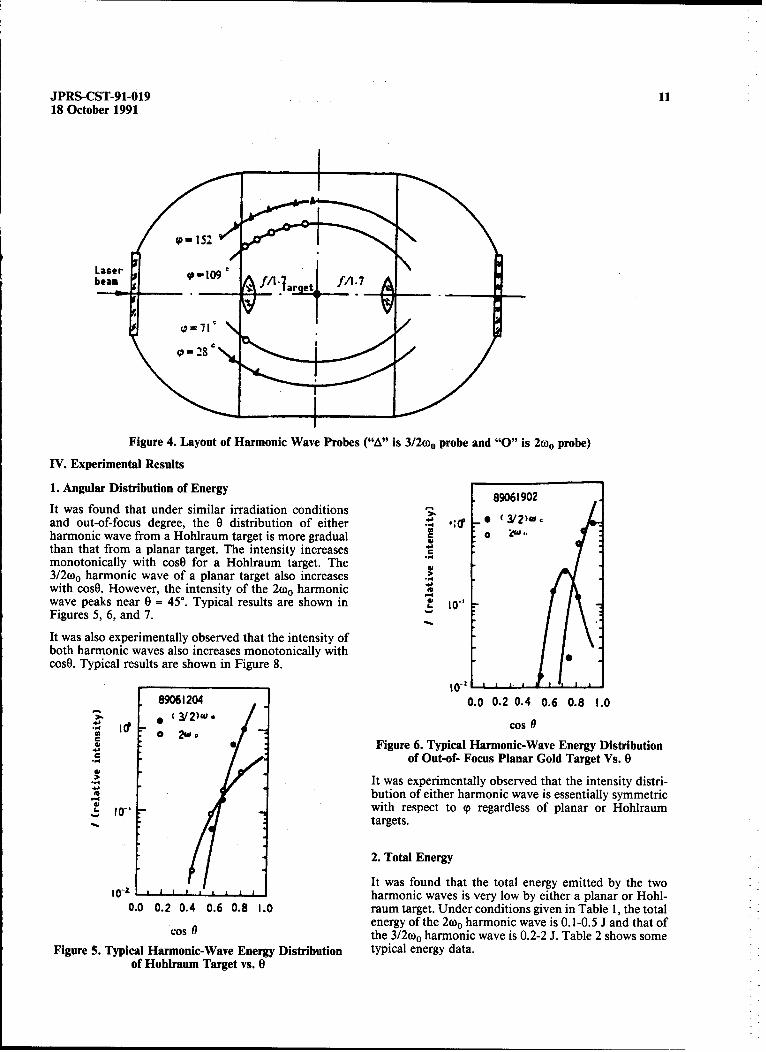
It was found that under similar irradiation conditionsand out-of-focus degree, the 0 distribution of either e..0 * (3/21--harmonic wave from a Hohlraum target is more gradual C "'
than that from a planar target. The intensity increasesmonotonically with cosO for a Hohlraum target. The3/2c0o harmonic wave of a planar target also increaseswith cosO. However, the intensity of the 2 0)0 harmonicwave peaks near 0 = 45*. Typical results are shown in 24 10Figures 5, 6, and 7.
It was also experimentally observed that the intensity ofboth harmonic waves also increases monotonically withcos0. Typical results are shown in Figure 8.
lO-89061204 0.0 0.2 0.4 0.6 0.8 1.0
* 3/2)w'• Cos 0C Figure 6. Typical Harmonic-Wave Energy Distribution
of Out-of- Focus Planar Gold Target Vs. 0
It was experimentally observed that the intensity distri-bution of either harmonic wave is essentially symmetric
D - with respect to (p regardless of planar or Hohlraum.~10-,
targets.
2. Total Energy
It was found that the total energy emitted by the twoIO- 'harmonic waves is very low by either a planar or Hohl-
0.0 0.2 0.4 0.6 0.8 1.0 raum target. Under conditions given in Table 1, the totalenergy of the 2 0)0 harmonic wave is 0.1-0.5 J and that of
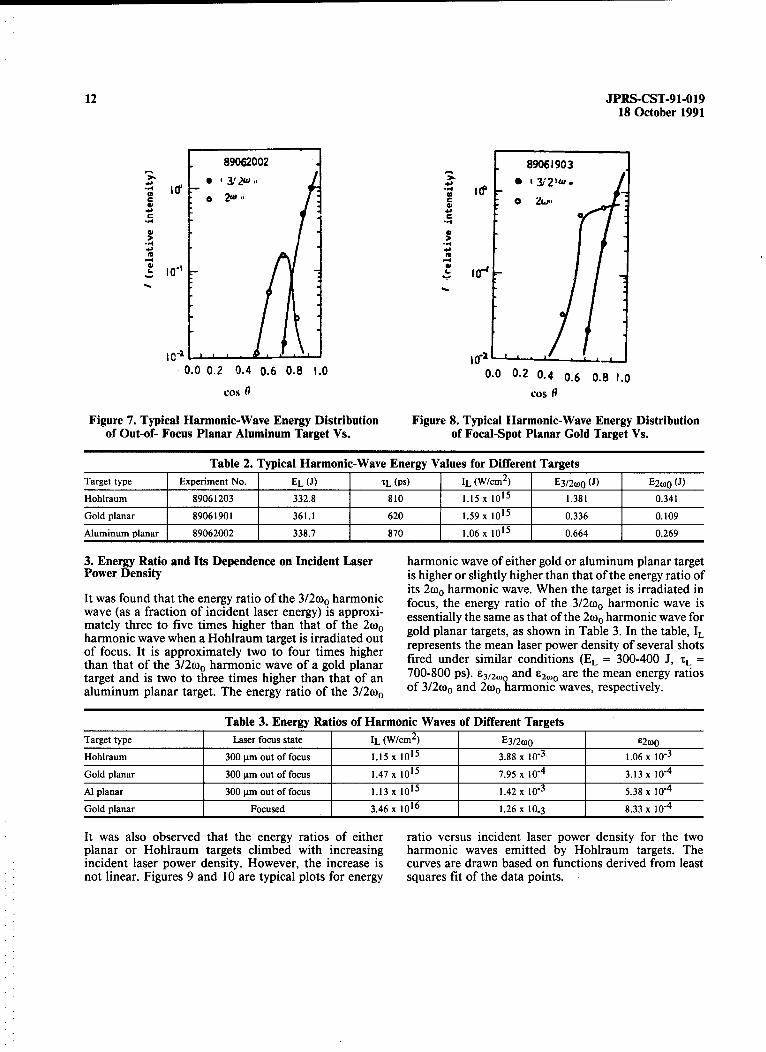
Cos 0 the 3/2w0) harmonic wave is 0.2-2 J. Table 2 shows someFigure 5. Typical Harmonic-Wave Energy Distribution typical energy data.
of Hohlraum Target vs. 0
12 JPRS-CST-91-01918 October 1991
89062002 89061903
C 2-
.=.0
to-.4
S10"- - I a-a
0.0 0.2 0.4 0.6 0.8 1.0 0.0 0.2 0.4 0.6 0.8 1.0
cos 0 cos 0
Figure 7. Typical Harmonic-Wave Energy Distribution Figure 8. Typical Harmonic-Wave Energy Distributionof Out-of- Focus Planar Aluminum Target Vs. of Focal-Spot Planar Gold Target Vs.
Table 2. Typical Harmonic-Wave Energy Values for Different TargetsTarget type Experiment No. EL (M) TL (ps) IL (W/cm
2) E3/2co (3) E2o0 (M)
Hohlraum 89061203 332.8 810 1.15 x 101 5
1.381 0.341
Gold planar 89061901 361.1 620 1.59 x 10¹⁵ 0.336 0.109
Aluminum planar 89062002 338.7 870 1.06 x 10¹⁵ 0.664 0.269
3. Energy Ratio and Its Dependence on Incident Laser harmonic wave of either gold or aluminum planar targetPower Density is higher or slightly higher than that of the energy ratio of
its 2%0 harmonic wave. When the target is irradiated inIt was found that the energy ratio of the 3/2c0o harmonic focus, the energy ratio of the 3/2%0 harmonic wave iswave (as a fraction of incident laser energy) is approxi- essentially the same as that of the 2%0 harmonic wave formately three to five times higher than that of the 2 0o0 gold planar targets, as shown in Table 3. In the table, Ixharmonic wave when a Hohlraum target is irradiated outof focus. It is approximately two to four times higher represents the mean laser power density of several shotsthan that of the 3/2woo harmonic wave of a gold planar fired under similar conditions (EL = 300-400 J, tL =target and is two to three times higher than that of an 700-800 ps). 83/2,00 and 82oo are the mean energy ratiosaluminum planar target. The energy ratio of the 3/2%0 of 3/2 0co and 2%0 harmonic waves, respectively.
Table 3. Energy Ratios of Harmonic Waves of Different TargetsTarget type Laser focus state IL (W/cm 2
) E3 /2o0 Q2co0
Hohlraum 300 gim out of focus 1.15 x 10¹⁵ 3.88 x 10⁻³ 1.06 x 10⁻³
Gold planar 300 jim out of focus 1.47 x 10¹⁵ 7.95 x 10⁻⁴ 3.13 x 10⁻⁴
Al planar 300 lim out of focus 1.13 x 10¹⁵ 1.42 x 10⁻³ 5.38 x 10⁻⁴
Gold planar Focused 3.46 x 10¹⁶ 1.26 x 10.3 8.33 x 10⁻⁴
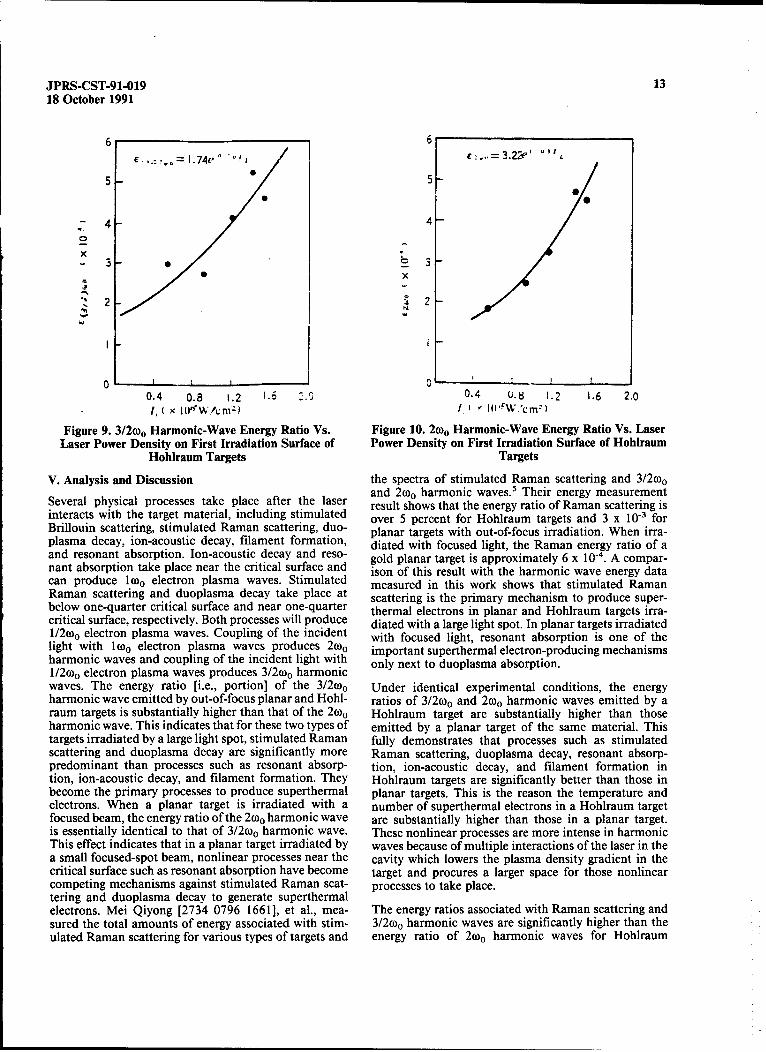
It was also observed that the energy ratios of either ratio versus incident laser power density for the twoplanar or Hohlraum targets climbed with increasing harmonic waves emitted by Hohlraum targets. Theincident laser power density. However, the increase is curves are drawn based on functions derived from leastnot linear. Figures 9 and 10 are typical plots for energy squares fit of the data points.
JPRS-CST-91-019 1318 October 1991
E , 0 1.74t "
4-
E
x -4-
S x
2: 2w-.a
0 0 I 0t I0.4 0.8 1.2 1.6 1.0 0.4 U.8 1.2 1.6 2.0
/, ( x I(J'WŽ'cn') I %v l2cW 'cmMI
Figure 9. 3/2(o0 Harmonic-Wave Energy Ratio Vs. Figure 10. 2 000 Harmonic-Wave Energy Ratio Vs. LaserLaser Power Density on First Irradiation Surface of Power Density on First Irradiation Surface of Hohlraum
Hohiraum Targets Targets
V. Analysis and Discussion the spectra of stimulated Raman scattering and 3/2wo0and 2 0)o harmonic waves.5 Their energy measurement
Several physical processes take place after the laser result shows that the energy ratio of Raman scattering isinteracts with the target material, including stimulated over 5 percent for Hohlraum targets and 3 x 10⁻³ forBrillouin scattering, stimulated Raman scattering, duo- planar targets with out-of-focus irradiation. When irra-plasma decay, ion-acoustic decay, filament formation, diated with focused light, the Raman energy ratio of aand resonant absorption. Ion-acoustic decay and reso- gold planar target is approximately 6 x 1 4. A compar-nant absorption take place near the critical surface and ison of this result with the harmonic wave energy datacan produce 1 wo electron plasma waves. Stimulated measured in this work shows that stimulated RamanRaman scattering and duoplasma decay take place at scattering is the primary mechanism to produce super-below one-quarter critical surface and near one-quarter thermal electrons in planar and Hohlraum targets irra-critical surface, respectively. Both processes will produce diated with a large light spot. In planar targets irradiated1/2 0)o electron plasma waves. Coupling of the incident with focused light, resonant absorption is one of thelight with 10)o electron plasma waves produces 2 0co important superthermal electron-producing mechanismsharmonic waves and coupling of the incident light with only next to duoplasma absorption.1/2 0)o electron plasma waves produces 3/2c0o harmonicwaves. The energy ratio [i.e., portion] of the 3/2%0 Under identical experimental conditions, the energyharmonic wave emitted by out-of-focus planar and Hohl- ratios of 3/2 0(o and 2 0)0 harmonic waves emitted by araum targets is substantially higher than that of the 2 0)o Hohlraum target are substantially higher than thoseharmonic wave. This indicates that for these two types of emitted by a planar target of the same material. Thistargets irradiated by a large light spot, stimulated Raman fully demonstrates that processes such as stimulatedscattering and duoplasma decay are significantly more Raman scattering, duoplasma decay, resonant absorp-predominant than processes such as resonant absorp- tion, ion-acoustic decay, and filament formation intion, ion-acoustic decay, and filament formation. They Hohlraum targets are significantly better than those inbecome the primary processes to produce superthermal planar targets. This is the reason the temperature andelectrons. When a planar target is irradiated with a number of superthermal electrons in a Hohlraum targetfocused beam, the energy ratio of the 2 0co harmonic wave are substantially higher than those in a planar target.is essentially identical to that of 3/2%0 harmonic wave. These nonlinear processes are more intense in harmonicThis effect indicates that in a planar target irradiated by waves because of multiple interactions of the laser in thea small focused-spot beam, nonlinear processes near the cavity which lowers the plasma density gradient in thecritical surface such as resonant absorption have become target and procures a larger space for those nonlinearcompeting mechanisms against stimulated Raman scat- processes to take place.tering and duoplasma decay to generate superthermalelectrons. Mei Qiyong [2734 0796 1661], et al., mea- The energy ratios associated with Raman scattering andsured the total amounts of energy associated with stim- 3/2%0 harmonic waves are significantly higher than theulated Raman scattering for various types of targets and energy ratio of 2 0)o harmonic waves for Hohlraum
14 JPRS-CST-91-01918 October 1991
targets. This indicates that Hohlraum targets have a The authors wish to thank Zheng Zhijian [6774 1807relatively abundant amount of dilute plasma. It also 1017] and Jin Genzhi [6855 2704 5347] for their assis-indicates that the critical density region in a Hohlraum tance as well as the people involved in the operation andtarget is much narrower than the quarter critical density target fabrication for the LF-1 1 and "Shen Guang"region and that of the region below one-quarter critical facilities.density.
ReferencesThe energy ratios of the two harmonic waves for goldplanar targets are substantially lower than those of 1. Liu Chenghai [0491 2052 3189], et al., "Superthermalaluminum planar targets because gold has a higher Electrons in Black-Hole Targets," internal report ofplasma-collision frequency due to its high atomic Beijing Institute of Applied Physics and Computationalnumber (vei is proportional to z). This higher plasma- Mathematics, Apr 1987.collision frequency suppresses the progress of various 2. S.S. Glaros, V.C. Rupert, and S.R. Gunn, "Energycollective interactions. Balance Measurements for Shiva," Physics and
With similar energy and pulsewidth, the energy ratios of Astronomy Classification Scheme Number 52.
harmonic waves for a planar target irradiated by a 3. D.M. Woodall and B. Yaakobi, "Emission of Laserfocused beam are significantly higher than those for a Harmonics," Laser- Induced Fusion and X-Ray Laserplanar target irradiated by an out-of-focus beam. This Studies, pp 191-218.indicates that various nonlinear processes are closelydependent upon the laser power density on the target 4. R.L. Turner, "3/2 0)o Emission at 1 oo and 2wo0 ," Lasersurface. Program Annual Report, 1981, pp 6-27.
The effect that the energy ratio of harmonic wave 5. Mei Qiyong, et al., "Experimental Study of Stimulatedemitted by a Hohlraum target increases nonlinearly with Raman Scattering," internal report, SINPC, Jan 1990.the laser power density on the first incident surface iscaused by the fact that electron plasma waves at different High-Efficiency Frequency-Doubling System forfrequencies increase nonlinearly with rising laser power LF-11 Laser Apparatus Used for ICF Experimentdensity. 91FE0588D Chengdu QIANG JIGUANG YU LIZI
SHU [HIGH-POWER LASER AND PARTICLEThe 2 0(o harmonic wave of a planar target irradiated by BEAMS] in Chinese Vol 3 No 1, Feb 91 pp 85-94 [MSan out-of-focus beam is most intense at 0 = 45*. This received 9 Apr 90, revised 27 Jun 90]indicates that nonlinear processes such as resonantabsorption are especially active at 0 = 45*. The 2owo [Article by Wei Xiaofeng [7614 2556 1496], Zhangharmonic wave for a Hohlraum target is most intense at Xiaomin [1728 1420 3046], Yuan Xiaodong [5913 25560 = 0'. This is because most 2woo photons tend to move 2639], Ye Jinxiang [0673 6855 4382], and Sui Zhantoward the center of the aperture as they escape. [7131 1455] of China Academy of Engineering Physics
Before this work began, it was observed with the naked (CAEP): "High-Efficiency Frequency-Doubling Systemeye that the green light emitted by Hohlraum targets was for LF- 11 Laser Apparatus"]much stronger than that from planar targets. This obser- [Text] Abstract: The design principle and structure of avation was confirmed by experimental data. The data high-efficiency frequency- doubling system for the LF- 11also showed that the 3/2woo harmonic wave for a Hohl- laser apparatus, as well as various technical approachesraum target is substantially stronger than the 2woo har- to achieving high-efficiency frequency-doubling, aremonic wave. This effect was not noticed by the naked eye described. The frequency-doubling conversion effi-because the response to the 3/2woo light is much lower ciency, the tuning half width of the crystal, the far-fieldthan the response to the 2woo by the human eye. divergence angle of the fundamental-frequency laser and
frequency-doubled laser, the near-field intensity distri-The angular distribution data for both harmonic waves bution, and the time profile were measured. The systemmeasured in this work is found to be in good agreement was used to perform 0.53-jim wavelength inertial-with the corresponding spectral intensity distribution confinement fusion (ICF) experiments.data obtained by Mei Qiyong.
The experimental error in this work includes probe 1 Introduction
calibration error, probe photodiode spectral-response Experimental laser plasma physics studies continue tocurve error, probe-positioning error, filter transmittance demonstrate the superiority of using a short-wavelength,error, recording system error, and data processing error, high-power laser to irradiate targets because it can sig-These errors are estimated to be +/-10, +/-5, +/-3, +/-5, nificantly reduce the number of deleterious high-energy+/-4, and +/-7 percent, respectively. Therefore, the rela- electrons produced. This allows us to concentrate ontive errors for the measurement of total energy of 3/2w0 fluid dynamics and radiation propagation and not worryand 2wo0 harmonic waves are +/- 15 and +/-14 percent, about the effect of thermal electrons. Moreover, it canrespectively, substantially raise the absorption of the laser beam,
JPRS-CST-91-019 1518 October 1991
improve X-ray conversion efficiency, and effectively and the pulsewidth is 200-800 ps. Based on these basicreduce back-scattering of the laser, parameters, a frequency-doubling system is mainly com-
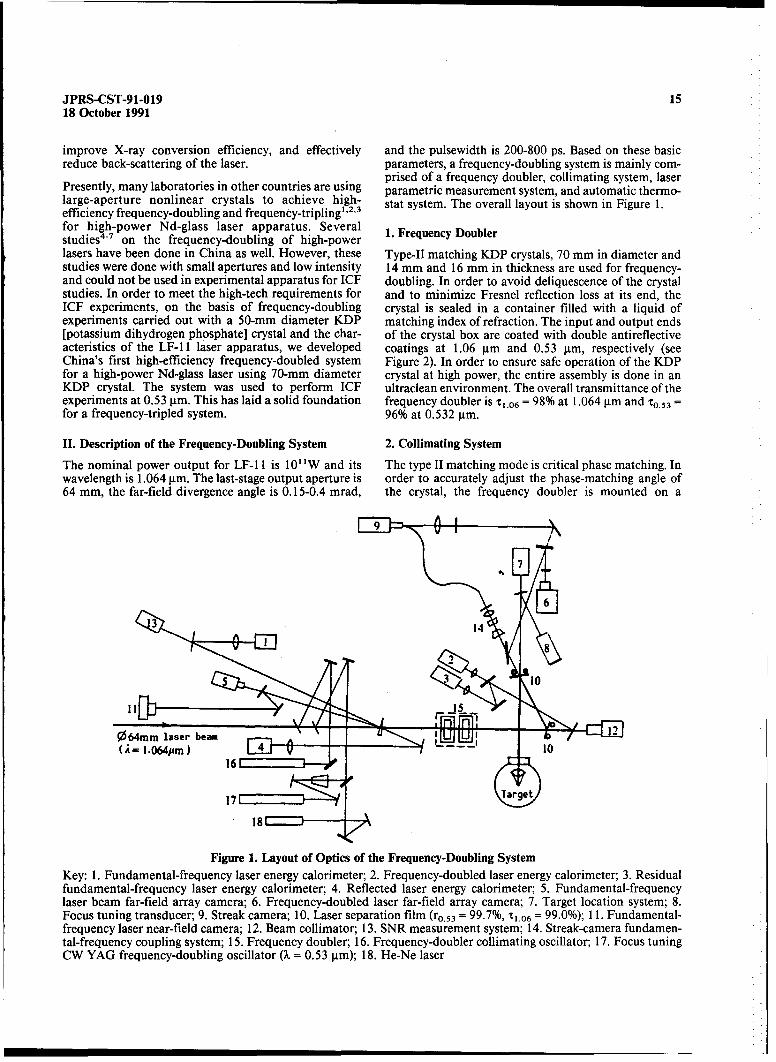
prised of a frequency doubler, collimating system, laserPresently, many laboratories in other countries are using parametric measurement system, and automatic thermo-large-aperture nonlinear crystals to achieve high- stat system. The overall layout is shown in Figure 1.efficiency frequency-doubling and frequency-tripling" 2 '3
for high-power Nd-glass laser apparatus. Severalstudies4`7 on the frequency-doubling of high-powerlasers have been done in China as well. However, these Type-IL matching KDP crystals, 70 mm in diameter andstudies were done with small apertures and low intensity 14 mm and 16 mm in thickness are used for frequency-and could not be used in experimental apparatus for ICF doubling. In order to avoid deliquescence of the crystalstudies. In order to meet the high-tech requirements for and to minimize Fresnel reflection loss at its end, theICF experiments, on the basis of frequency-doubling crystal is sealed in a container filled with a liquid ofexperiments carried out with a 50-mm diameter KDP matching index of refraction. The input and output ends[potassium dihydrogen phosphate] crystal and the char- of the crystal box are coated with double antireflectiveacteristics of the LF- 11 laser apparatus, we developed coatings at 1.06 gim and 0.53 gim, respectively (seeChina's first high-efficiency frequency-doubled system Figure 2). In order to ensure safe operation of the KDPfor a high-power Nd-glass laser using 70-mm diameter crystal at high power, the entire assembly is done in anKDP crystal. The system was used to perform ICF ultraclean environment. The overall transmittance of theexperiments at 0.53 gim. This has laid a solid foundation frequency doubler is -T.0 6 = 98% at 1.064 gim and r. 53 =for a frequency-tripled system. 96% at 0.532 gim.
IL Description of the Frequency-Doubling System 2. Collimating System
The nominal power output for LF- 11 is 10' "W and its The type II matching mode is critical phase matching. Inwavelength is 1.064 gim. The last-stage output aperture is order to accurately adjust the phase-matching angle of64 mm, the far-field divergence angle is 0.15-0.4 mrad, the crystal, the frequency doubler is mounted on a
Figure 1. Layout of Optics of the Frequency-Doubling SystemKey: 1. Fundamental-frequency laser energy calorimeter; 2. Frequency-doubled laser energy calorimeter; 3. Residualfundamental-frequency laser energy calorimeter; 4. Reflected laser energy calorimeter; 5. Fundamental-frequencylaser beam far-field array camera; 6. Frequency-doubled laser far-field array camera; 7. Target location system; 8.Focus tuning transducer; 9. Streak camera; 10. Laser separation film (ro0 s3 = 99.7%, t,.o6 = 99.0%); 11. Fundamental-frequency laser near-field camera; 12. Beam collimator; 13. SNR measurement system; 14. Streak-camera fundamen-tal-frequency coupling system; 15. Frequency doubler; 16. Frequency-doubler collimating oscillator; 17. Focus tuningCW YAG frequency-doubling oscillator (. -- 0.53 jim); 18. He-Ne laser
I9 II7\
16 JPRS-CST-91-01918 October 1991
Crystal phase matching of the crystal is achieved by adjustingb Index-of-refraction the phase-matching angle of the crystal and using thematching solution light- intensity (I2,JIJ,) comparison method with the
r •high-precision two-dimensional servo rack and the opti-Window KOP crystal mization control system.
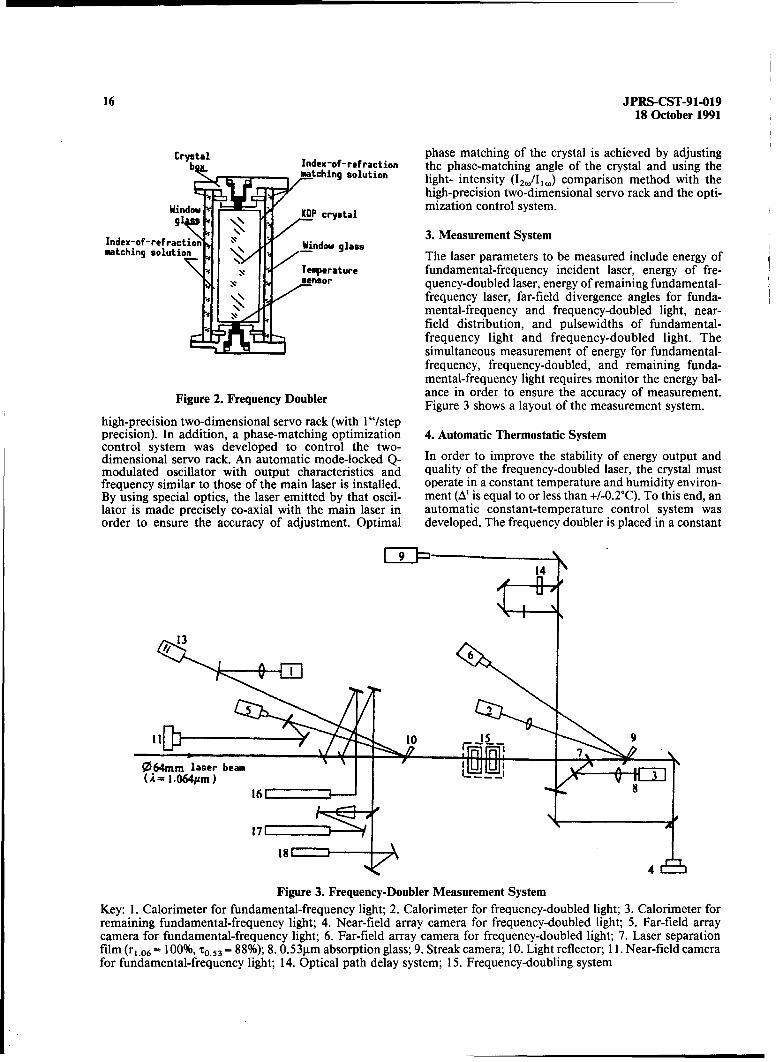
SWidwg3. Measurement Systemmatcning o-dwt ionWmatchin olution / s The laser parameters to be measured include energy of
Temperature fundamental-frequency incident laser, energy of fre-sensor quency-doubled laser, energy of remaining fundamental-
frequency laser, far-field divergence angles for funda-mental-frequency and frequency-doubled light, near-field distribution, and pulsewidths of fundamental-frequency light and frequency-doubled light. Thesimultaneous measurement of energy for fundamental-frequency, frequency-doubled, and remaining funda-mental-frequency light requires monitor the energy bal-
Figure 2. Frequency Doubler ance in order to ensure the accuracy of measurement.Figure 3 shows a layout of the measurement system.
high-precision two-dimensional servo rack (with 1 "/stepprecision). In addition, a phase-matching optimization 4. Automatic Thermostatic Systemcontrol system was developed to control the two-dimensional servo rack. An automatic mode-locked Q- In order to improve the stability of energy output andmodulated oscillator with output characteristics and quality of the frequency-doubled laser, the crystal mustfrequency similar to those of the main laser is installed, operate in a constant temperature and humidity environ-By using special optics, the laser emitted by that oscil- ment (At is equal to or less than +/-0.2°C). To this end, anlator is made precisely co-axial with the main laser in automatic constant-temperature control system wasorder to ensure the accuracy of adjustment. Optimal developed. The frequency doubler is placed in a constant
14
064mm laser beamG 2= 1.064Am ) •..16 1 8- - "
171
Figure 3. Frequency-Doubler Measurement SystemKey: 1. Calorimeter for fundamental-frequency light; 2. Calorimeter for frequency-doubled light; 3. Calorimeter forremaining fundamental-frequency light; 4. Near-field array camera for frequency-doubled light; 5. Far-field arraycamera for fundamental-frequency light; 6. Far-field array camera for frequency-doubled light; 7. Laser separationfilm (r,.06 = 100%, ro.53 = 88%); 8. 0.53gtm absorption glass; 9. Streak camera; 10. Light reflector; 11. Near-field camerafor fundamental-frequency light; 14. Optical path delay system; 15. Frequency-doubling system
JPRS-CST-91-019 1718 October 1991
Table 1. Results of Matching Fluids
Absorption Matching fluid FL ZP-F"
coertjxLent 2c- e irn_. 1.390 G3__FL- G5"1.385 1.280Wavelength -
266 (nrn) 0.0364 0.1583 0.2275
355 (rnm) 0.0036 0.0117 0.0264
532 (rn)m 0.0052 0.0389 0.0036
1064 (nm) 0.015A 0.02-7 0.0048
temperature box and heated by infrared lamps. The Absorption coefficient 1.06 urm, a= 2 x 10- 2cm'l
temperature on the surface of the crystal is measured by 0.53 grm, a = 4 x 10"4
cm"1
a thermistor (see Figure 2). Heating is controlled by acontroller to maintain the crystal at approximately 4°C 0.35 grm, a - 1 x 10"3cm"1
above room temperature. Temperature fluctuation is Axis fixing error (phase matching <5"kept equal to or less than +/-2°C to ensure stability, precision)
Machining precision of optics N = V.2, AN = Xi/4, (X - 5320
III. Technical Issues Concerning the Development of Angstroms)the Frequency-Doubling System
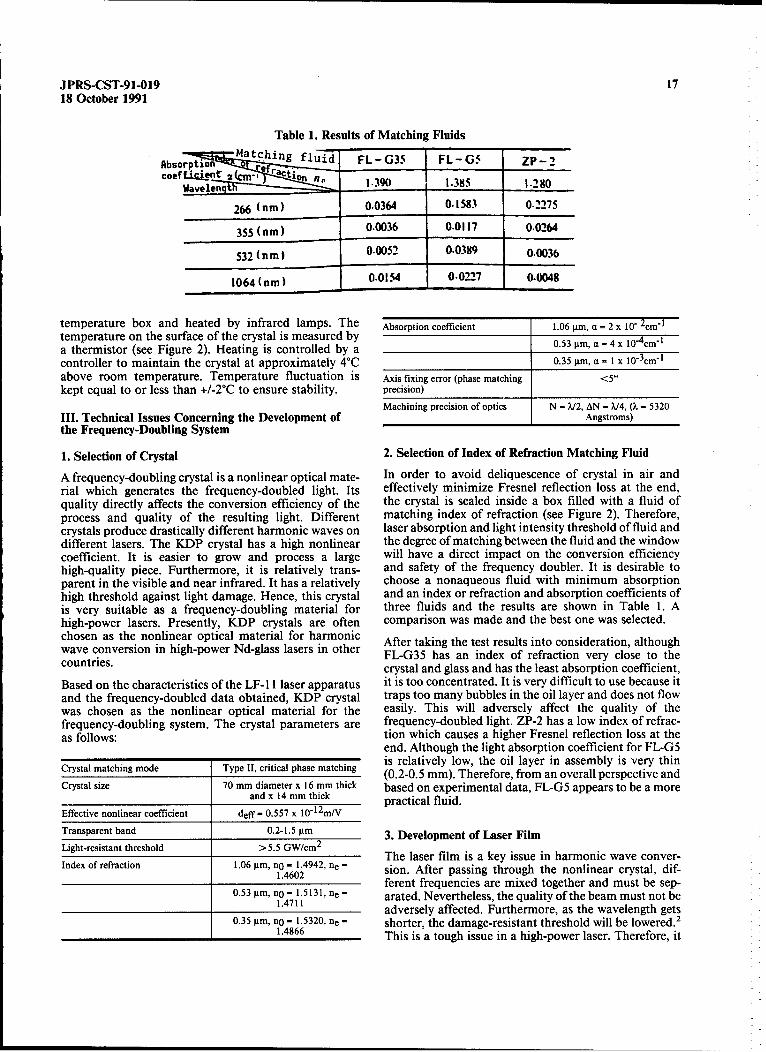
1. Selection of Crystal 2. Selection of Index of Refraction Matching Fluid
A frequency-doubling crystal is a nonlinear optical mate- In order to avoid deliquescence of crystal in air andrial which generates the frequency-doubled light. Its effectively minimize Fresnel reflection loss at the end,quality directly affects the conversion efficiency of the the crystal is sealed inside a box filled with a fluid ofprocess and quality of the resulting light. Different matching index of refraction (see Figure 2). Therefore,crystals produce drastically different harmonic waves on laser absorption and light intensity threshold of fluid anddifferent lasers. The KDP crystal has a high nonlinear the degree of matching between the fluid and the windowcoefficient. It is easier to grow and process a large will have a direct impact on the conversion efficiencyhigh-quality piece. Furthermore, it is relatively trans- and safety of the frequency doubler. It is desirable toparent in the visible and near infrared. It has a relatively choose a nonaqueous fluid with minimum absorptionhigh threshold against light damage. Hence, this crystal and an index or refraction and absorption coefficients ofis very suitable as a frequency-doubling material for three fluids and the results are shown in Table 1. Ahigh-power lasers. Presently, KDP crystals are often comparison was made and the best one was selected.chosen as the nonlinear optical material for harmonic After takin the test results into consideration, althoughwave conversion in high-power Nd-glass lasers in other AFter taking th e x ts rest octonsiera alo toughcountries. FL-G35 has an index of refraction very close to the
crystal and glass and has the least absorption coefficient,Based on the characteristics of the LF- 11 laser apparatus it is too concentrated. It is very difficult to use because itand the frequency-doubled data obtained, KDP crystal traps too many bubbles in the oil layer and does not flowwas chosen as the nonlinear optical material for the easily. This will adversely affect the quality of thefrequency-doubling system. The crystal parameters are frequency-doubled light. ZP-2 has a low index of refrac-as follows: tion which causes a higher Fresnel reflection loss at the
end. Although the light absorption coefficient for FL-G5
gmode Type II, critical phase matching is relatively low, the oil layer in assembly is very thinCrystal matching o(0.2-0.5 mm). Therefore, from an overall perspective andCrystal size 70 mm diameter x 16 mm thick based on experimental data, FL-G5 appears to be a more
and x 14 mm thick practical fluid.Effective nonlinear coefficient deff- 0.557 x 10r12m/V
Transparent band 0.2-1.5 gm 3. Development of Laser FilmLight-resistant threshold > 5.5 GW/cm
2
The laser film is a key issue in harmonic wave conver-Index of refraction 1.06 gm, no - 1.4942, ne - sion. After passing through the nonlinear crystal, dif-
1.4602 ferent frequencies are mixed together and must be sep-
0.53 gtm, no - 1.5131, ne - arated. Nevertheless, the quality of the beam must not be1.4711 adversely affected. Furthermore, as the wavelength gets
0.35 I~m, no - 1.5320, ne - shorter, the damage-resistant threshold will be lowered.21.4866 This is a tough issue in a high-power laser. Therefore, it
18 JPRS-CST-91-01918 October 1991
is of vital importance to develop high-intensity, high- Institute of Optoelectronic Technology. The films' lightquality laser separation films for frequency doubling, damage-resistance thresholds were tested and the resultsBased on our specifications and experimental needs, a are shown in Table 2. Basically, the requirements forseries of laser films was jointly developed with the CAS frequency-doubling experiments have been met.
Table 2. Measured Laser Damage-Resistance ThresholdsNumber Film Film system Number of layers Wavelength (m) Damage threshold
(GW/cm)
2 0.53 ira HR Ti 30 5 + SiO2 17 0.53 3.17
3 0.53 gm HR HfO2 + SiO2 19 0.53 18.20
6 1.06 grm HR Ti 30 5 + SiO2 18 1.064 17.11
9 1.06 gim HT A12 0 3 + MgF2 2 1.064 16.20
11 0.53 gim HT ZrO2 + HgF2 2 0.53 14.60
7 1.06 g±m HR Ti3 0 5 + SiO2 20 0.53 2.50
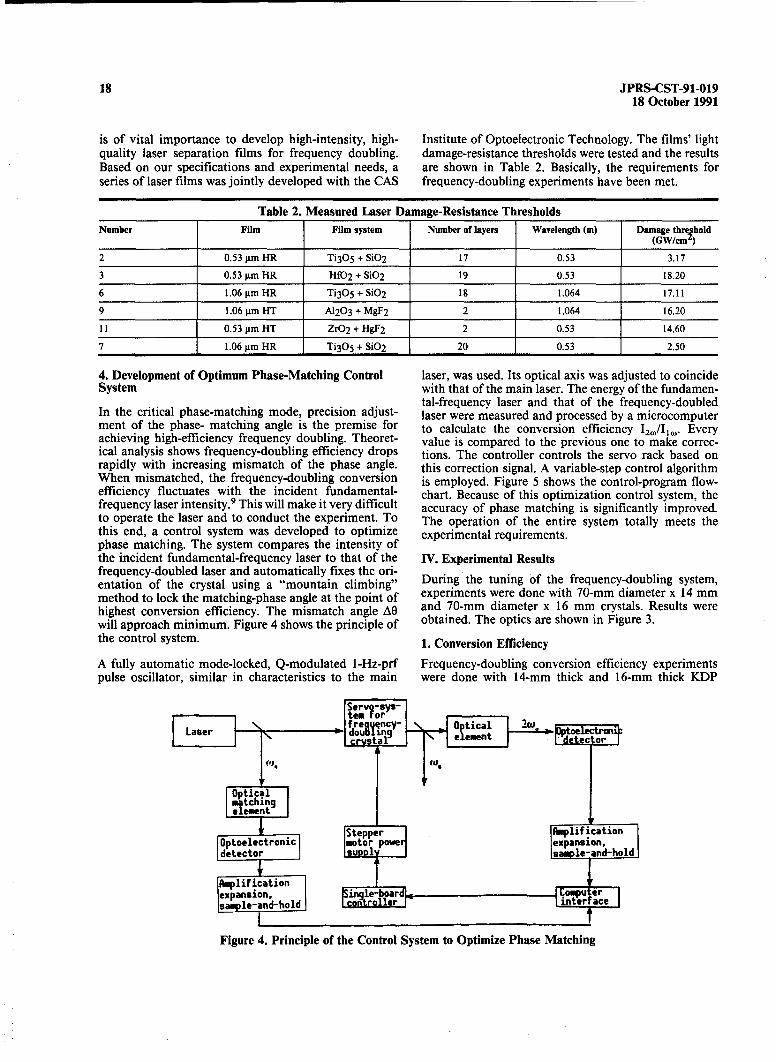
4. Development of Optimum Phase-Matching Control laser, was used. Its optical axis was adjusted to coincideSystem with that of the main laser. The energy of the fundamen-
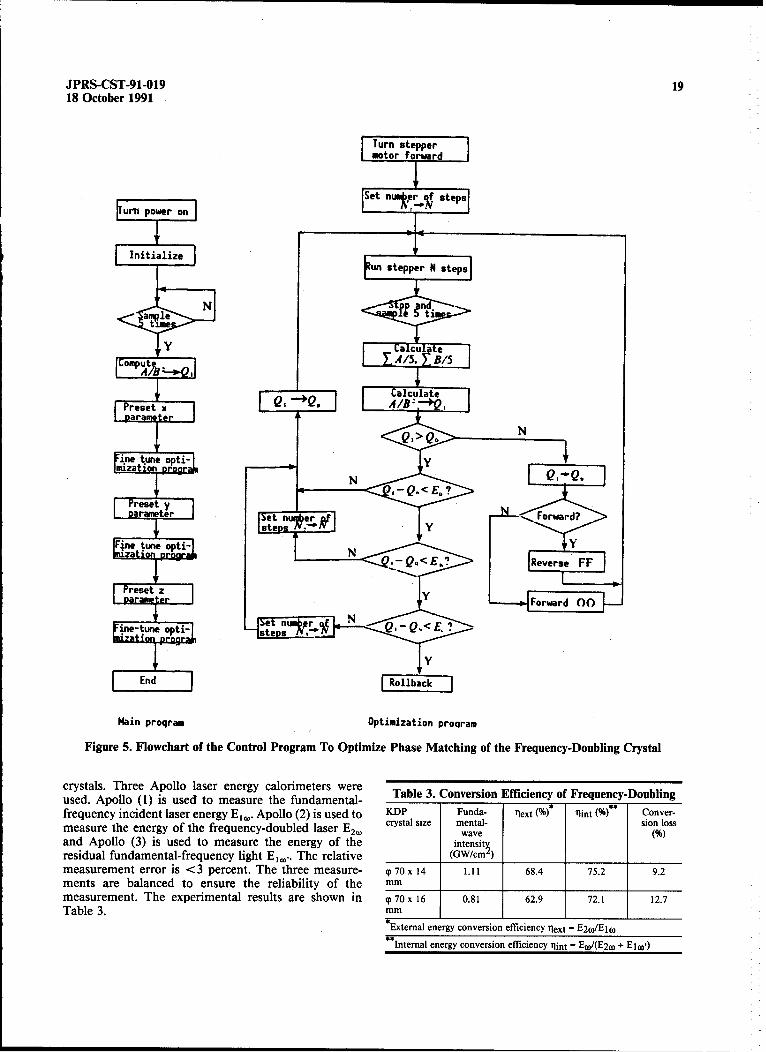
tal-frequency laser and that of the frequency-doubledIn the critical phase-matching mode, precision adjust- laser were measured and processed by a microcomputerment of the phase- matching angle is the premise for to calculate the conversion efficiency I2 jI/1,. Everyachieving high-efficiency frequency doubling. Theoret- value is compared to the previous one to make correc-ical analysis shows frequency-doubling efficiency drops tions. The controller controls the servo rack based onrapidly with increasing mismatch of the phase angle. this correction signal. A variable-step control algorithmWhen mismatched, the frequency-doubling conversion is employed. Figure 5 shows the control-program flow-efficiency fluctuates with the incident fundamental- chart. Because of this optimization control system, thefrequency laser intensity.9 This will make it very difficult accuracy of phase matching is significantly improved.to operate the laser and to conduct the experiment. To The operation of the entire system totally meets thethis end, a control system was developed to optimize experimental requirements.phase matching. The system compares the intensity ofthe incident fundamental-frequency laser to that of the IV. Experimental Resultsfrequency-doubled laser and automatically fixes the ori-entation of the crystal using a "mountain climbing" During the tuning of the frequency-doubling system,method to lock the matching-phase angle at the point of experiments were done with 70-mm diameter x 14 mmhighest conversion efficiency. The mismatch angle A0 and 70-mm diameter x 16 mm crystals. Results werewill approach minimum. Figure 4 shows the principle of obtained. The optics are shown in Figure 3.the control system. 1. Conversion Efficiency
A fully automatic mode-locked, Q-modulated 1-Hz-prf Frequency-doubling conversion efficiency experimentspulse oscillator, similar in characteristics to the main were done with 14-mm thick and 16-mm thick KDP
Fiervg yst-
Laser .- n dou-0l n9cIerys! elwn /dteor1
matchingelement7
; Steppr |[pi i'c on
Optoelectronic emo poe1epansion, Idetector IsIz sample-and-hold]
[Amplification rr
leXpansion, [ile-board I eopurI[spe-and-hold s[ol intlerface
;tlFigure 4. Principle of the Control System to Optimize Phase Matching
JPRS-CST-91-019 1918 October 1991
Turn stepper
motor Forward
Set numbe~ steps
Iurn power on Iro
nt eun stepper N steps
N dfa mtplem
Dompute L BIS
A~~n 1Bu opti-W 0,--*,,Preset y xparam~
istueopti-
[ reseter r't nuer'-f-y-r--d
araneter
Fine tune opti- [
Preset Zr P_. Forward 00•-
in-tune opti-Q. .
End FR ollback ]
Main proqram Optimization proqram
Figure 5. Flowchart of the Control Program To Optimize Phase Matching of the Frequency-Doubling Crystal
crystals. Three Apollo laser energy calorimeters wereused. Apollo (1) is used to measure the fundamental- Table 3. Conversion Efficiency of Frequency-Doublingfrequency incident laser energy E1l,. Apollo (2) is used to KDP Funda- 1lext %* nt (%)** Conver-
crystl sie metal-sion lossmeasure the energy of the frequency-doubled laser E2 crystal size mental- Nand Apollo (3) is used to measure the energy of the intensitresidual fundamental-frequency light E,.,. The relative (Gw/cm_ )measurement error is <3 percent. The three measure- p 70 x 14 1.11 68.4 75.2 9.2ments are balanced to ensure the reliability of the mmmeasurement. The experimental results are shown in (p 70 x 16 0.81 62.9 72.1 12.7Table 3. mm
*External energy conversion efficiency 'lext - E2o0/Elto**Internal energy conversion efficiency ilint - Ew/(E2wo + El•')
20 JPRS-CST-91-01918 October 1991
EIE,. (%) EIE,. (%)
100 [ICC90 90
S0030
5C ý0 20
:.c0. 0•.4 0.6 0.8 ,.0 .2 1.4 1.6 1.8 2.0 0.0 0.2 0.4, 0.6 0.8 ,0 .2 ,.4 ,.6 .'8 2.0
40 (W/cm-) , (GW/cm)
(a) L = 14ram. D=7Omm (b) L = 16mm, D=70mm
Figure 6. Characteristic Curves for KDP Crystals (Type II)
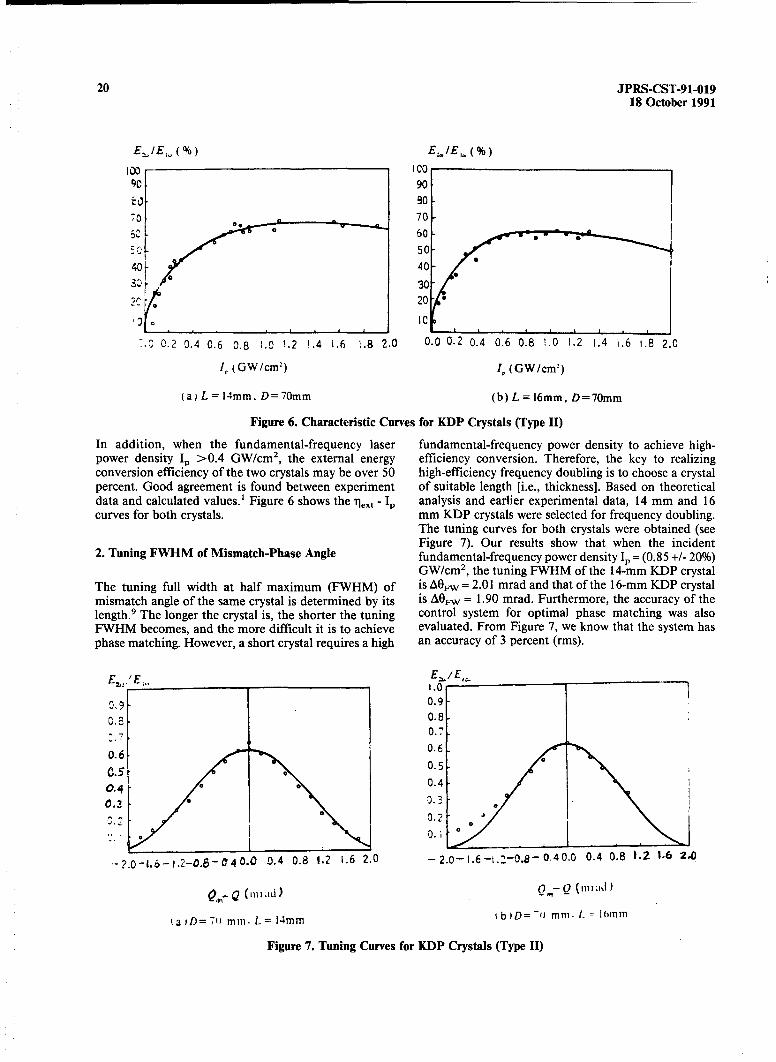
In addition, when the fundamental-frequency laser fundamental-frequency power density to achieve high-power density Ip >0.4 GW/cm2 , the external energy efficiency conversion. Therefore, the key to realizingconversion efficiency of the two crystals may be over 50 high-efficiency frequency doubling is to choose a crystalpercent. Good agreement is found between experiment of suitable length [i.e., thickness]. Based on theoreticaldata and calculated values.' Figure 6 shows the lext - I, analysis and earlier experimental data, 14 mm and 16curves for both crystals. mm KDP crystals were selected for frequency doubling.
The tuning curves for both crystals were obtained (seeFigure 7). Our results show that when the incident
2. Tuning FWHM of Mismatch-Phase Angle fundamental-frequency power density Ip = (0.85 +/- 20%)GW/cm 2, the tuning FWHM of the 14-mm KDP crystal
The tuning full width at half maximum (FWHM) of is AOFw = 2.01 mrad and that of the 16-mm KDP crystalmismatch angle of the same crystal is determined by its is A0,w = 1.90 mrad. Furthermore, the accuracy of thelength.9 The longer the crystal is, the shorter the tuning control system for optimal phase matching was alsoFWHM becomes, and the more difficult it is to achieve evaluated. From Figure 7, we know that the system hasphase matching. However, a short crystal requires a high an accuracy of 3 percent (rms).
. EEE,,.1.0
0.9 - 0.9g I 0.8
0.7
.60.6
0.5 0.5
0.4 * 0.40.3 4.3
,. , *0.2 I?. 0.0
•?-.0-16-1.2.-O.&-40.0 0.4 0.8 1.2 1.6 2.0 - 2.0-1.6-t.2-0.8- 0.40.0 0.4 0.8 1.Z 1.6 2.0
L•.. Q ,,,,d} ,,, _Q (11,•,ak)
IalD=T7 , mm.L=14mm b b)D= -0 mm. L = (6mirm
Figure 7. Tuning Curves for KDP Crystals (Type II)
JPRS-CST-91-019 2118 October 1991
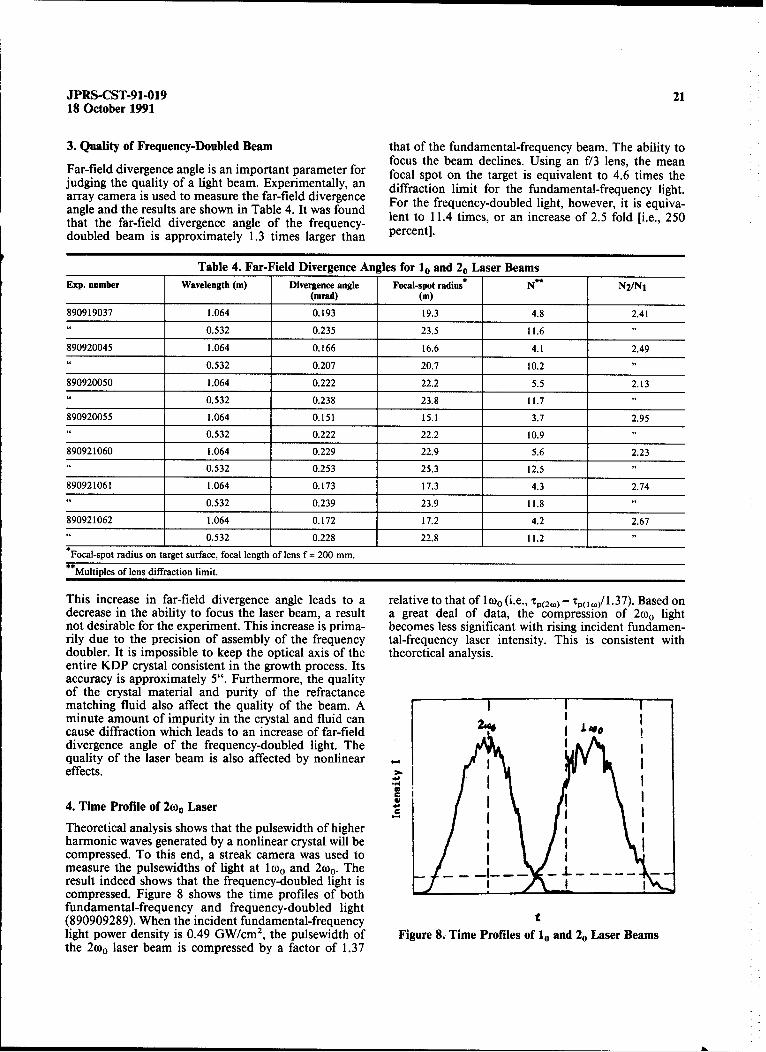
3. Quality of Frequency-Doubled Beam that of the fundamental-frequency beam. The ability tofocus the beam declines. Using an f/3 lens, the mean
Far-field divergence angle is an important parameter for focal spot on the target is equivalent to 4.6 times thejudging the quality of a light beam. Experimentally, an diffraction limit for the fundamental-frequency light.array camera is used to measure the far-field divergence For the frequency-doubled light, however, it is equiva-angle and the results are shown in Table 4. It was foundthat the far-field divergence angle of the frequency- lent to 11.4 times, or an increase of 2.5 fold [i.e., 250doubled beam is approximately 1.3 times larger than percent].
Table 4. Far-Field Divergence Angles for 10 and 20 Laser BeamsExp. number Wavelength (m) Divergence angle Focal-spot radius* N N2/Nl
(mrad) (m)
890919037 1.064 0.193 19.3 4.8 2.41
" 0.532 0.235 23.5 11.6 "
890920045 1.064 0.166 16.6 4.1 2.49
"0.532 0.207 20.7 10.2
890920050 1.064 0.222 22.2 5.5 2.13" 0.532 0.238 23.8 11.7 "
890920055 1.064 0.151 15.1 3.7 2.95
"0.532 0.222 22.2 10.9
890921060 1.064 0.229 22.9 5.6 2.23
0.532 0.253 25.3 12.5
890921061 1.064 0.173 17.3 4.3 2.74
"0.532 0.239 23.9 11.8
890921062 1.064 0.172 17.2 4.2 2.67
0.532 0.228 22.8 11.2
Focal-spot radius on target surface, focal length of lens f = 200 mm.
Multiples of lens diffraction limit.
This increase in far-field divergence angle leads to a relative to that of 10o(i.e., tp(2 ,) = jp(1-o)/1.37). Based ondecrease in the ability to focus the laser beam, a result a great deal of data, the compression of 2coo lightnot desirable for the experiment. This increase is prima- becomes less significant with rising incident fundamen-rily due to the precision of assembly of the frequency tal-frequency laser intensity. This is consistent withdoubler. It is impossible to keep the optical axis of the theoretical analysis.entire KDP crystal consistent in the growth process. Itsaccuracy is approximately 5". Furthermore, the qualityof the crystal material and purity of the refractancematching fluid also affect the quality of the beam. A ]minute amount of impurity in the crystal and fluid can 2cause diffraction which leads to an increase of far-field I *divergence angle of the frequency-doubled light. Thequality of the laser beam is also affected by nonlineareffects.
4. Time Profile of 2 0oo Laser ITheoretical analysis shows that the pulsewidth of higherharmonic waves generated by a nonlinear crystal will becompressed. To this end, a streak camera was used tomeasure the pulsewidths of light at loo and 2coo. Theresult indeed shows that the frequency-doubled light iscompressed. Figure 8 shows the time profiles of bothfundamental-frequency and frequency-doubled light(890909289). When the incident fundamental-frequency tlight power density is 0.49 GW/cm2 , the pulsewidth of Figure 8. Time Profiles of 10 and 20 Laser Beamsthe 2woo laser beam is compressed by a factor of 1.37
22 JPRS-CST-91-01918 October 1991
References camera capable of recording instantaneous X-ray spec-trum. Together with an X-ray pinhole camera, it is
1. W. Sekes, et al., IEEE J. QUANTUM ELECTRON, possible to determine one- dimensional spatial resolu-QE-17, No 9, 1981, p 1689. tion as a function of time.
2. J.S. Hetelum, et al., LLNL, Laser Program Annual This camera is primarily comprised of an X-ray scanningReport, 1 (2-8), 1980, pp 2-225. image-converter tube, scan control circuit, image
3. Takatomo Sasaki, et al., translated by Lu Qiaoqing enhancer and its power supply, and image recording[0712 0829 7230], GUOWAI JIGUANG [FOREIGN system. The substrate of the narrow cathode of the
image-converter tube is made of 1000 angstrom C8H8LASERS], No 1, 1988, p 21. thin film which is highly transmissive to soft X-rays. The
4. Cai Xijie [5591 1585 3381], et al., GUANGXUE cathode is made of gold or cesium iodide with a conduc-XUEBAO [ACTA OPTICA SINICA], Vol 6 No 12, tive base. The image-converter tube is a flat cathode1986, p 1898. plane grid image converter. The image enhancer is an
inverted image electronic enhancer with microchannels.5. You Chenhua [1429 2525 5478], Lu Zukang [7120 The contact camera puts the film immediately against4371 1660], et al., Ibid., Vol 6 No 5, 1986, p 413. the fiber-optic output window of the image enhancer to
6. Fan Qikang [5400 3823 5478], et al., JIGUANG record the event.
[LASER], Vol 6 No 3, 1979, p 14. Major Specifications of the Camera
7. Cai Xijie, et al., GUANGXUE XUEBAO [ACTA • Limiting time resolution: The full width half max-OPTICA SINICA], Vol 5 No 11, 1985, p 975. imum (FWHM) of the X-ray streak image determined
using an X-ray filter method and the FWHM of the8. Wei Xiaofeng, Zhang Xiaomin, et al., "Experimental streak image obtained using 8-ps laser pulses are bothStudy of Large- Aperture High-Efficiency Frequency- under 50 ps.Doubling With KDP Crystals," to be published. • Scanning resolution of the camera: Greater than 8 line
9. Edited by Central China Polytechnical College, "Laser pairs/mm.Technology," Hunan Science and Technology Pub- * Static spatial resolution: 20 line pairs/mm.
l Wavelength response: 0.1-10 keV.lishing House, 1981, p 226. • Effective dimensions of slit cathode: 30 gm x 12 mm,
50•gm x 12 mm, and 100 gm x 12 mm.Picosecond Soft X-Ray Streak Camera Described • Scanning rate: 76 ps/mm, 100 ps/mm, 200 ps/mm,91FE0588E Chengdu QIANG JIG UANG YU LIZI SHU and 360 ps/mm.[HIGH-POWER LASER AND PARTICLE BEAMS] • Dynamic range of the camera: Greater than 30.in Chinese Vol 3 No 1, Feb 91 p 127 • Delay time: 15.35 ns.
i Trigger flutter: +/-150 ps.
• Scan linearity: less than 8 percent.[Article by Gu Boxun [7357 0130 8113]: "PicosecondSoft X-Ray Image- Converter Tube Scanning Camera"] The Xian Institute of Optics and Fine Mechanics of the
Chinese Academy of Sciences developed this soft X-ray[Text] Abstract: In laser nuclear fusion studies, the picosecond image-converter tube scanning camera inspectrum emitted by the high- temperature, high-density 1986 by combining advanced technologies such asplasma produced by the imploded target is mainly in the modern physics, optoelectronics, fine mechanics, andsoft X-ray region. The study of these soft X-rays involves electronics. It was then further improved to become ana variety of plasma-related parameters including elec- instrument. In 1989-1990, it was officially used to mea-tron temperature, electron energy distribution, and dif- sure the X-ray spectra of plasmas generated by laser-ferent unstable states as a function of time. Nevertheless, irradiated targets at the joint laboratory of SIOFM andthe process of X-ray production is of the order of CAEP. In addition, various performance characteristicspicoseconds and the diameter of the target irradiated by of the camera were experimentally evaluated. It has beenlaser is merely 100 microns or so. Therefore, it is proven that the camera has excellent reliability andnecessary to have X-ray diagnostic means with pico- reproducibility. Various characteristics such as overallsecond time resolution and micron-level spatial resolu- interference resistance, image quality, trigger flutter, andtion. A soft X-ray picosecond image-converter tube dynamic spatial resolution are at the same advancedscanning camera was developed to meet this need. It is level as those of similar [foreign-made] instrumentsan X-ray band detector/analyzer with the highest time made in the 1980's. It has played an important role in theresolution. Moreover, it has a very high spatial resolu- exploration of physical phenomena in the leading edge oftion. In conjunction with an X-ray spectrometer, it is a science and has yielded a number of good results.
JPRS-CST-91-019 2318 October 1991
4 •-
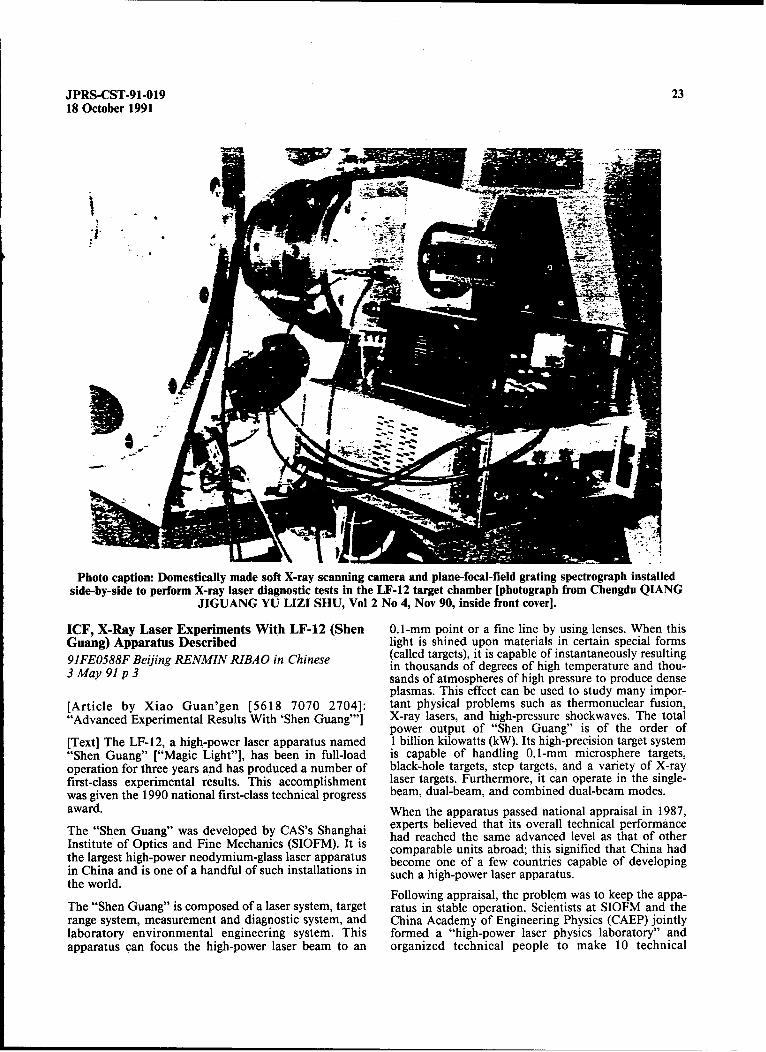
Photo caption: Domestically made soft X-ray scanning camera and plane-focal-field grating spectrograph installedside-by-side to perform X-ray laser diagnostic tests in the LF-12 target chamber [photograph from Chengdu QIANG
JIGUANG YU LIZI SHU, Vol 2 No 4, Nov 90, inside front cover.
ICF, X-Ray Laser Experiments With LF-12 (Shen 0. 1-mm point or a fine line by using lenses. When thisGuang) Apparatus Described light is shined upon materials in certain special forms9IFEOS88F Beijing RENMIN RIBAO in Chinese (called targets), it is capable of instantaneously resulting3 May,~ 91 p3 in thousands of degrees of high temperature and thou-
~'~-'sands of atmospheres of high pressure to produce denseplasmas. This effect can be used to study many impor-
[Article by Xiao Guan'gen [5618 7070 2704]: tant physical problems such as thermonuclear fusion,"Advanced Experimental Results With 'Shen Guang"']. X-ray lasers, and high-pressure shockwaves. The total
power output of "Shen Guang" is of the order of[Text] The LF- 12, a high-power laser apparatus named 1 billion kilowatts (kW). Its high-precision target system"ýShen Guang" ["Magic Light"], has been in full-load is capable of handling 0.1-mm microsphere targets,operation for three years and has produced a number of black-hole targets, step targets, and a variety of X-rayfirst-class experimental results. Thi 's accomplishment laser targets. Furthermore, it can operate in the single-was given the 1990 national first-class technical progress beam, dual-beam, and combined dual-beam modes.award. When the apparatus passed national appraisal in 1987,
The "Shen Guang" was developed by CAS's Shanghai experts believed that its overall technical performanceInsttut ofOptcs nd ine echnic (SOFM. I is had reached the same advanced level as that of otherInsttut ofOptcs nd ine echnic (SOFM. I is comparable units abroad; this signified that China had
the largest high-power neodymium-glass laser apparatus become one of a few countries capable of developingin China and is one of a handful of such installations in such a high-power laser apparatus.the world.
Following appraisal, the problem was to keep the appa-The "Shen Guang" is composed of a laser system, target ratus in stable operation. Scientists at SIOFM and therange system, measurement and diagnostic system, and China Academy of Engineering Physics (CAEP) jointlylaboratory environmental engineering system. This formed a "high-power laser physics laboratory" andapparatus can focus the high-power laser beam to an organized technical people to make 10 technical
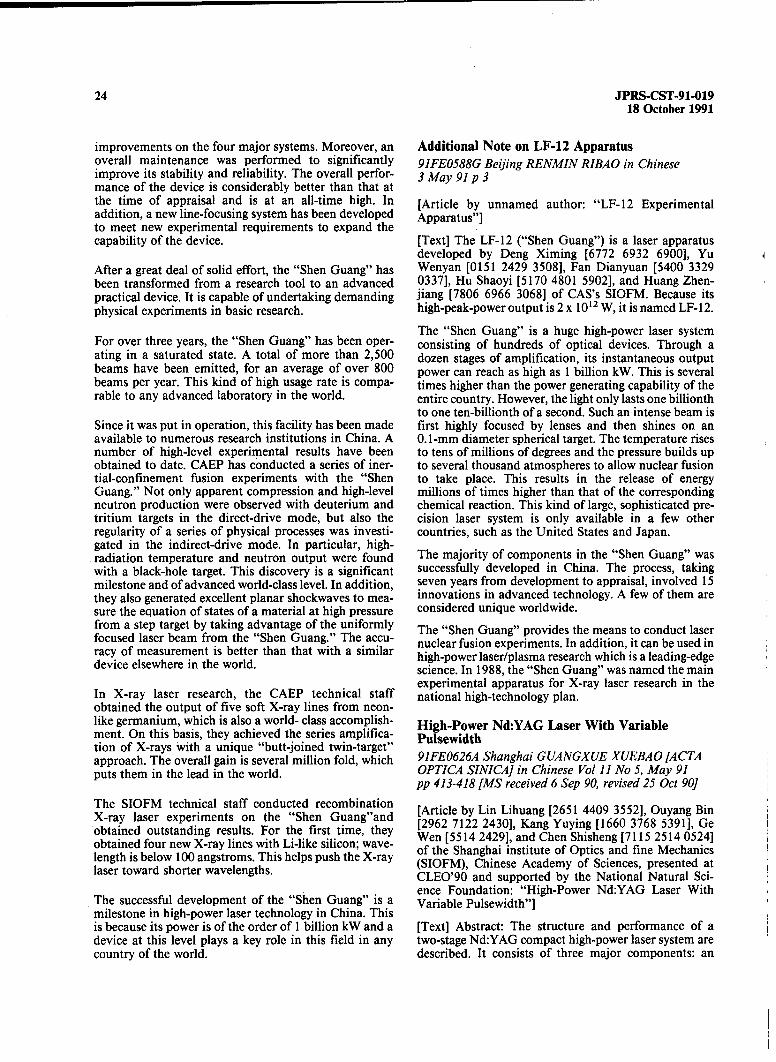
24 JPRS-CST-91-01918 October 1991
improvements on the four major systems. Moreover, an Additional Note on LF-12 Apparatusoverall maintenance was performed to significantly 91FE0588G Beijing RENMIN RIBAO in Chineseimprove its stability and reliability. The overall perfor- 3 May 91 p 3mance of the device is considerably better than that atthe time of appraisal and is at an all-time high. In [Article by unnamed author: "LF-12 Experimentaladdition, a new line-focusing system has been developed Apparatus"]to meet new experimental requirements to expand thecapability of the device. [Text] The LF-1 2 ("Shen Guang") is a laser apparatus
developed by Deng Ximing [6772 6932 6900], YuAfter a great deal of solid effort, the "Shen Guang" has Wenyan [0151 2429 3508], Fan Dianyuan [5400 3329been transformed from a research tool to an advanced 0337], Hu Shaoyi [5170 4801 5902], and Huang Zhen-practical device. It is capable of undertaking demanding jiang [7806 6966 3068] of CAS's SIOFM. Because itsphysical experiments in basic research. high-peak-power output is 2 x 10¹² W, it is named LF- 12.
The "Shen Guang" is a huge high-power laser systemFor over three years, the "Shen Guang" has been oper- consisting of hundreds of optical devices. Through aating in a saturated state. A total of more than 2,500 dozen stages of amplification, its instantaneous outputbeams have been emitted, for an average of over 800 power can reach as high as 1 billion kW. This is severalbeams per year. This kind of high usage rate is compa- times higher than the power generating capability of therable to any advanced laboratory in the world, entire country. However, the light only lasts one billionth
to one ten-billionth of a second. Such an intense beam isSince it was put in operation, this facility has been made first highly focused by lenses and then shines on anavailable to numerous research institutions in China. A 0.1-mm diameter spherical target. The temperature risesnumber of high-level experimental results have been to tens of millions of degrees and the pressure builds upobtained to date. CAEP has conducted a series of iner- to several thousand atmospheres to allow nuclear fusiontial-confinement fusion experiments with the "Shen to take place. This results in the release of energyGuang." Not only apparent compression and high-level millions of times higher than that of the correspondingneutron production were observed with deuterium and chemical reaction. This kind of large, sophisticated pre-tritium targets in the direct-drive mode, but also the cision laser system is only available in a few otherregularity of a series of physical processes was investi- countries, such as the United States and Japan.gated in the indirect-drive mode. In particular, high-radiation temperature and neutron output were found The majority of components in the "Shen Guang" waswith a black-hole target. This discovery is a significant successfully developed in China. The process, takingmilestone and of advanced world-class level. In addition, seven years from development to appraisal, involved 15they also generated excellent planar shockwaves to mea- innovations in advanced technology. A few of them aresure the equation of states of a material at high pressure considered unique worldwide.from a step target by taking advantage of the uniformly The "Shen Guang" provides the means to conduct laserfocused laser beam from the "Shen Guang." The accu- nuclear fusion experiments. In addition, it can be used inracy of measurement is better than that with a similar high-power laser/plasma research which is a leading-edgedevice elsewhere in the world, science. In 1988, the "Shen Guang" was named the main
experimental apparatus for X-ray laser research in theIn X-ray laser research, the CAEP technical staff national high-technology plan.obtained the output of five soft X-ray lines from neon-like germanium, which is also a world- class accomplish- High-Power Nd:YAG Laser With Variablement. On this basis, they achieved the series amplifica- Pulsewidthtion of X-rays With a unique "butt-joined twin-target"approach. The overall gain is several million fold, which 91FE0626A Shanghai GUANGXUE XUEBAO [ACTAputs them in the lead in the world. OPTICA SINICA] in Chinese Vol 11 No 5, May 91
pp 413-418 [MS received 6 Sep 90, revised 25 Oct 90]
The SIOFM technical staff conducted recombination [Article by Lin Lihuang [2651 4409 3552], Ouyang BinX-ray laser experiments on the "Shen Guang"andobtained outstanding results. For the first time, they [2962 7122 2430], Kang Yuying [1660 3768 5391], Ge
obtained four new X-ray lines with Li-like silicon; wave- Wen [5514 2429], and Chen Shisheng [7115 2514 0524]length is below 100 angstroms. This helps push the X-ray of the Shanghai institute of Optics and fine Mechanicslaser toward shorter wavelengths. (SIOFM), Chinese Academy of Sciences, presented at
CLEO'90 and supported by the National Natural Sci-
ence Foundation: "High-Power Nd:YAG Laser WithThe successful development of the "Shen Guang" is a Variable Pulsewidth"]milestone in high-power laser technology in China. Thisis because its power is of the order of 1 billion kW and a [Text] Abstract: The structure and performance of adevice at this level plays a key role in this field in any two-stage Nd:YAG compact high-power laser system arecountry of the world, described. It consists of three major components: an

JPRS-CST-91-019 2518 October 1991
active-passive colliding-pulse mode-locked (CPM) oscil- M5 A QP P2 PC P1 outputlator, a single-pulse selector, and a four-pass amplifier.The oscillator generates a train of mode-locked pulseswith an envelope fluctuation of < +/- 4 percent. The ! M2pulsewidth can be conveniently adjusted over a wide M M6range (20 ps - 2.5 ns). For a single 0.1 mJ, 200 ps pulse,the four-pass filter can achieve an amplification factor of7 x 102. M3 BS Nd:YAG AOM Ml BT M44
I. Introduction Figure 1. Schematic of the Laser SystemIn the study of mutual interaction between lasers and
materials, laser- induced nuclear fusion and X-ray lasers, The dotted block in Figure 1 shows an active-passivethe laser pulsewidth is required to vary from picoseconds CPM laser. It is driven at 50 MHz (RF). An AOM madeto nanoseconds due to different target requirements. of fused quartz (using lithium tungstate as the trans-Laser pulses spanning such a wide range are traditionally ducer) is located near the output mirror Ml to provideprovided by several laser oscillators operating in dif- active amplitude modulation. The output cavity mirrorferent modes (such as mode-locked, Q-modulated, pulse- is a concave mirror (with a radius of curvature of 10 mshaped, etc.). and a 50 percent reflectance at 1064 nm). Its flat side has
an antireflective (AR) coating. The beam splitter, BS, ofThis paper reports the structure and output characteris- the antiresonant ring has a near 50/50 reflection-tics of a compact high-power Nd:YAG laser system. It to-transmission ratio for s-polarized component at 45*consists of active-passive CPM Nd:YAG laser, a single- incidence. The working medium is a 4-mm diameter,pulse selector (Pockels electrooptical switch), and a 65-mm long Nd:YAG rod. Both ends have an ARNd:YAG amplifier. The amplifier and a few optical coating. It is placed in a double-ellipse cavity and iselements form a four-pass amplifier. The oscillator has a pumped with two straight xenon lamps. The saturablevery high output stability. The envelope fluctuation of absorber, SA, is located at the center of the antiresonantthe mode-locked train of pulses is < +/- 4 percent. ring.Furthermore, based on demand, the pulsewidth can beconveniently varied over a range of 20 ps to 2.5 ns. The Different saturable absorbers (with different relaxationfour-pass filter can effectively amplify the chosen small times) of different transmissivities have been used in thissignal. work, including dichloroethane solution of pentameth-
ylidyne (circulating), BDN dye film (polyester film withII. Laser System and Output Characteristics BDN), Cr:Nd:YAG crystal and LiF:2-crystal. The mode-
locked pulses generated by these absorbers have a pulse-width range from 20 ps - 2.5 ns (not continuous). Specific
1. Active-Passive CPM Laser saturable absorbers may be tested, labeled, and cali-
Siegman' first presented the use of a laser cavity within brated for optical path and then secured on a specialan antiresonant ring in a solid-state laser to achieve CPM mechanical structure to make it convenient to replaceoperation. Since then, a great deal of significant progress them rapidly in the antiresonant ring in order to be ablehas been made. A study done by the authors2 shows that to switch to a train of pulses with predetermined pulse-colliding pulse mode-locking is a better passive mode- width.locking way of operation. It can establish an instanta-neous particle distribution grating3 in a saturable After the train of pulses is captured by a fast photodiode,absorber and has a stabilizing and pulse-compressing it is displayed on a high-speed oscilloscope. The single-effect. However, the amplitude stability of a CPM solid- pulse selector picks a pulse and its full width at halfstate laser is still much lower than that of an active- maximum (FWHM) is measured with a streak camera.passive mode-locked solid-state laser4 and cannot meet Considering the fact that the spectral response of the
certain requirements in use. streak camera in the laboratory is between ultravioletand visible, the 1064-nm visible, the 1064-nm light
In the CPM Nd:YAG laser used in this experiment, an pulses first pass a KDP-crystal frequency doubler toacousto-optic modulator (AOM) was added to achieve become 532-nm pulses before entering the slit of theactive-passive CPM operation. Experimental results streak camera. From the shape and half width of theshow this mode of operation has the advantages of both 532-nm pulse measured with the streak camera, it ismode-locking methods mentioned above. In particular, possible to obtain the actual FWHM of the 532-nmphotochemically stable saturable absorbers that are dif- pulse, At%, by subtracting the intrinsic time expansion officult for mode locking because of long relaxation time, the camera from the measured value. Then, the actualsuch as BDN dye (nickel di(4-dimethyl dithio FWHM of the 1064-nm pulse, At, can be derived.diacetophenone))5 and color-center crystals (such as spe- Assuming the pulse shape is Gaussian, At = (2)"12At.. Incially doped YAG crystals like Cr:Nd:YAG, 6 and order to ensure that the factor (2)i/2 is correct, it islithium fluoride crystals like LiF:F2-7 ), are able to required that the 1064-nm pulses be small signals inoperate stably to provide mode-locked output. order to avoid other nonlinear effects. Moreover, the
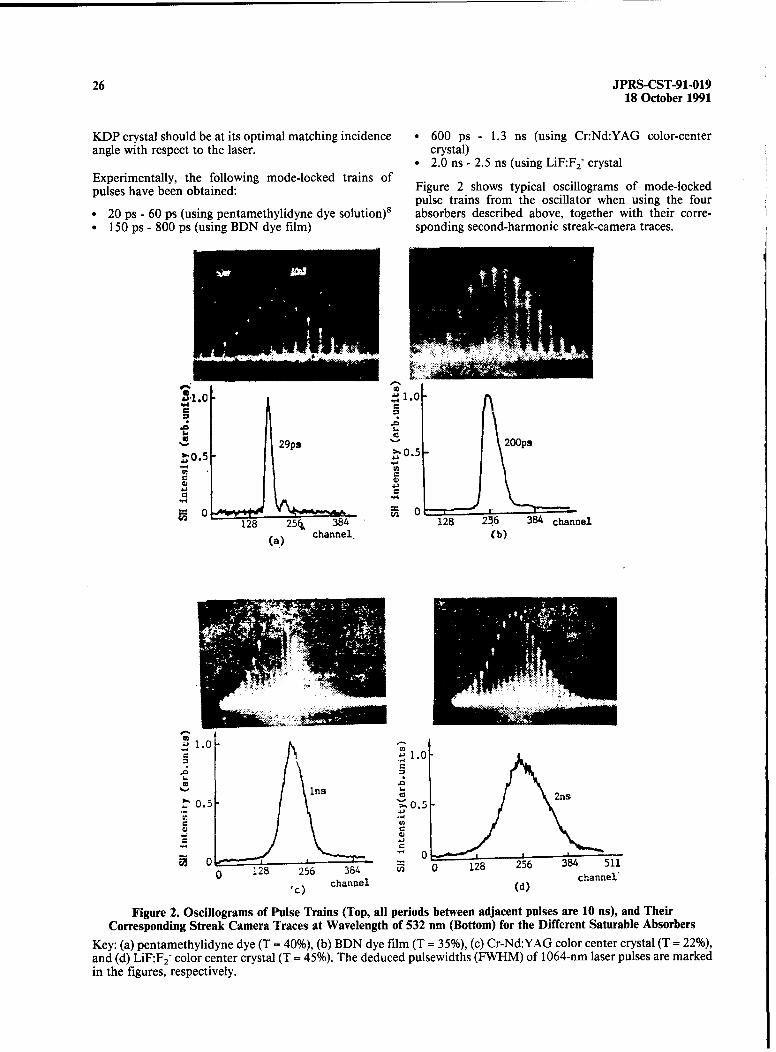
26 JPRS-CST-91-01918 October 1991
KDP crystal should be at its optimal matching incidence • 600 ps - 1.3 ns (using Cr:Nd:YAG color-centerangle with respect to the laser, crystal)
. 2.0 ns - 2.5 ns (using LiF:F 2 crystal
Experimentally, the following mode-locked trains ofpulses have been obtained: Figure 2 shows typical oscillograms of mode-locked
pulse trains from the oscillator when using the four• 20 ps - 60 ps (using pentamethylidyne dye solution)' absorbers described above, together with their corre-0 150 ps - 800 ps (using BDN dye film) sponding second-harmonic streak-camera traces.
0..00
128 25k, 384 -- 128 25.6 3B4 channel(a) channel. (b)
0 A1.0S... 1. o
a ns
S0.5 -• 0. 5 2n
J .1n 0Av
0
0 128 256 384 0 128 26ca( o) channel (d) channel'
Figure 2. Oscillograms of Pulse Trains (Top, all periods between adjacent pulses are 10 ns), and TheirCorresponding Streak Camera Traces at Wavelength of 532 nm (Bottom) for the Different Saturable Absorbers
Key: (a) pentamethylidyne dye (T = 40%), (b) BDN dye film (T = 35%), (c) Cr-Nd:YAG color center crystal (T = 22%),and (d) LiF:F2" color center crystal (T = 45%). The deduced pulsewidths (FWHM) of 1064-nm laser pulses are markedin the figures, respectively.
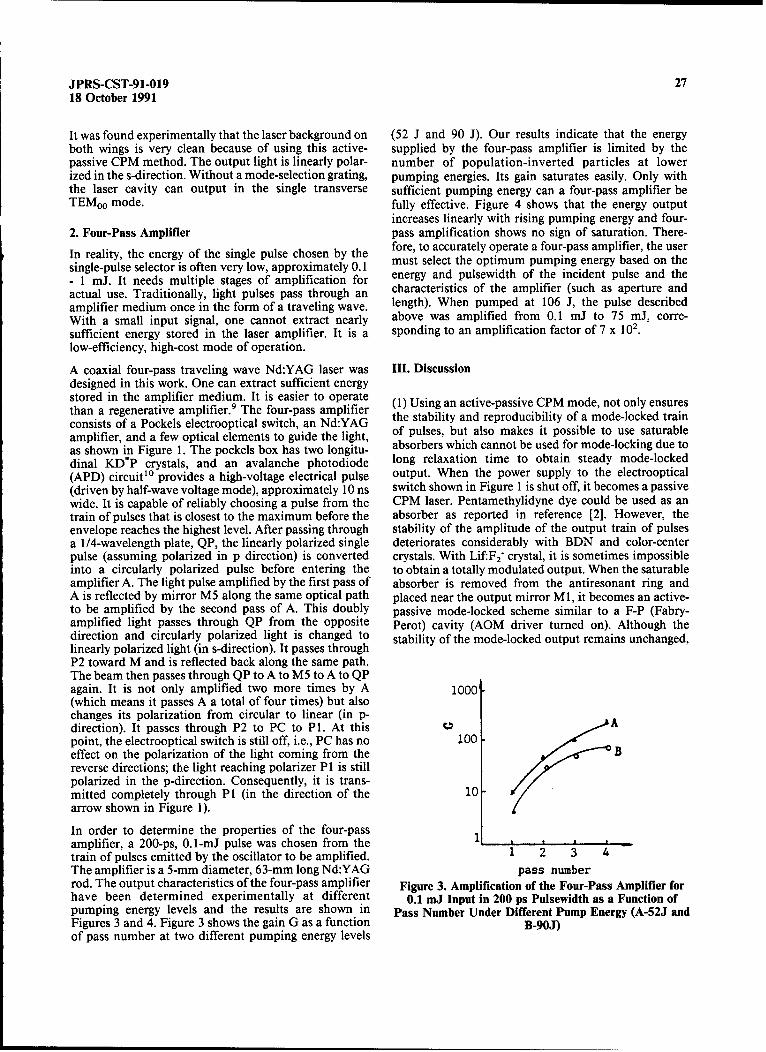
JPRS-CST-91-019 2718 October 1991
It was found experimentally that the laser background on (52 J and 90 J). Our results indicate that the energyboth wings is very clean because of using this active- supplied by the four-pass amplifier is limited by thepassive CPM method. The output light is linearly polar- number of population-inverted particles at lowerized in the s-direction. Without a mode-selection grating, pumping energies. Its gain saturates easily. Only withthe laser cavity can output in the single transverse sufficient pumping energy can a four-pass amplifier beTEMoo mode. fully effective. Figure 4 shows that the energy output
increases linearly with rising pumping energy and four-2. Four-Pass Amplifier pass amplification shows no sign of saturation. There-In reality, the energy of the single pulse chosen by the fore, to accurately operate a four-pass amplifier, the user
single-pulse selector is often very low, approximately 0.1 must select the optimum pumping energy based on the
- 1 mJ. It needs multiple stages of amplification for energy and pulsewidth of the incident pulse and the
actual use. Traditionally, light pulses pass through an characteristics of the amplifier (such as aperture and
amplifier medium once in the form of a traveling wave. length). When pumped at 106 J, the pulse describedWith a small input signal, one cannot extract nearly above was amplified from 0.1 mJ to 75 mJ, corre-sufficient energy stored in the laser amplifier. It is a sponding to an amplification factor of 7 x 102.low-efficiency, high-cost mode of operation.
A coaxial four-pass traveling wave Nd:YAG laser was III. Discussiondesigned in this work. One can extract sufficient energystored in the amplifier medium. It is easier to operate (1) Using an active-passive CPM mode, not only ensuresthan a regenerative amplifier.9 The four-pass amplifier the stability and reproducibility of a mode-locked trainconsists of a Pockels electrooptical switch, an Nd:YAG oh e but and r e siit os a use trainamplifier, and a few optical elements to guide the light, of pulses, but also makes it possible to use saturableas shown in Figure 1. The pockels box has two longitu- absorbers which cannot be used for mode-locking due to
dinal KD*P crystals, and an avalanche photodiode long relaxation time to obtain steady mode-locked(APD) circuit1" provides a high-voltage electrical pulse output. When the power supply to the electrooptical(driven by half-wave voltage mode), approximately 10 ns switch shown in Figure 1 is shut off, it becomes a passivewide. It is capable of reliably choosing a pulse from the CPM laser. Pentamethylidyne dye could be used as antrain of pulses that is closest to the maximum before the absorber as reported in reference [2]. However, theenvelope reaches the highest level. After passing through stability of the amplitude of the output train of pulsesa 1/4-wavelength plate, QP, the linearly polarized single deteriorates considerably with BDN and color-centerpulse (assuming polarized in p direction) is converted crystals. With Lif:F 2 " crystal, it is sometimes impossibleinto a circularly polarized pulse before entering the to obtain a totally modulated output. When the saturableamplifier A. The light pulse amplified by the first pass of absorber is removed from the antiresonant ring andA is reflected by mirror M5 along the same optical path placed near the output mirror Ml, it becomes an active-to be amplified by the second pass of A. This doubly passive mode-locked scheme similar to a F-P (Fabry-amplified light passes through QP from the opposite Perot) cavity (AOM driver turned on). Although thedirection and circularly polarized light is changed to stability of the mode-locked output remains unchanged,linearly polarized light (in s-direction). It passes throughP2 toward M and is reflected back along the same path.The beam then passes through QP to A to M5 to A to QPagain. It is not only amplified two more times by A 1000-(which means it passes A a total of four times) but alsochanges its polarization from circular to linear (in p-direction). It passes through P2 to PC to P1. At this A Apoint, the electrooptical switch is still off, i.e., PC has no 100effect on the polarization of the light coming from the Breverse directions; the light reaching polarizer P1 is stillpolarized in the p-direction. Consequently, it is trans-mitted completely through P1 (in the direction of the 10arrow shown in Figure 1).
In order to determine the properties of the four-passamplifier, a 200-ps, 0. l-mJ pulse was chosen from the 1 1 .
train of pulses emitted by the oscillator to be amplified. 1 2 3 4The amplifier is a 5-mm diameter, 63-mm long Nd:YAG pass numberrod. The output characteristics of the four-pass amplifier Figure 3. Amplification of the Four-Pass Amplifier forhave been determined experimentally at different 0.1 mJ Input in 200 ps Pulsewidth as a Function ofpumping energy levels and the results are shown in Pass Number Under Different Pump Energy (A-52J andFigures 3 and 4. Figure 3 shows the gain G as a function B-90J)of pass number at two different pumping energy levels
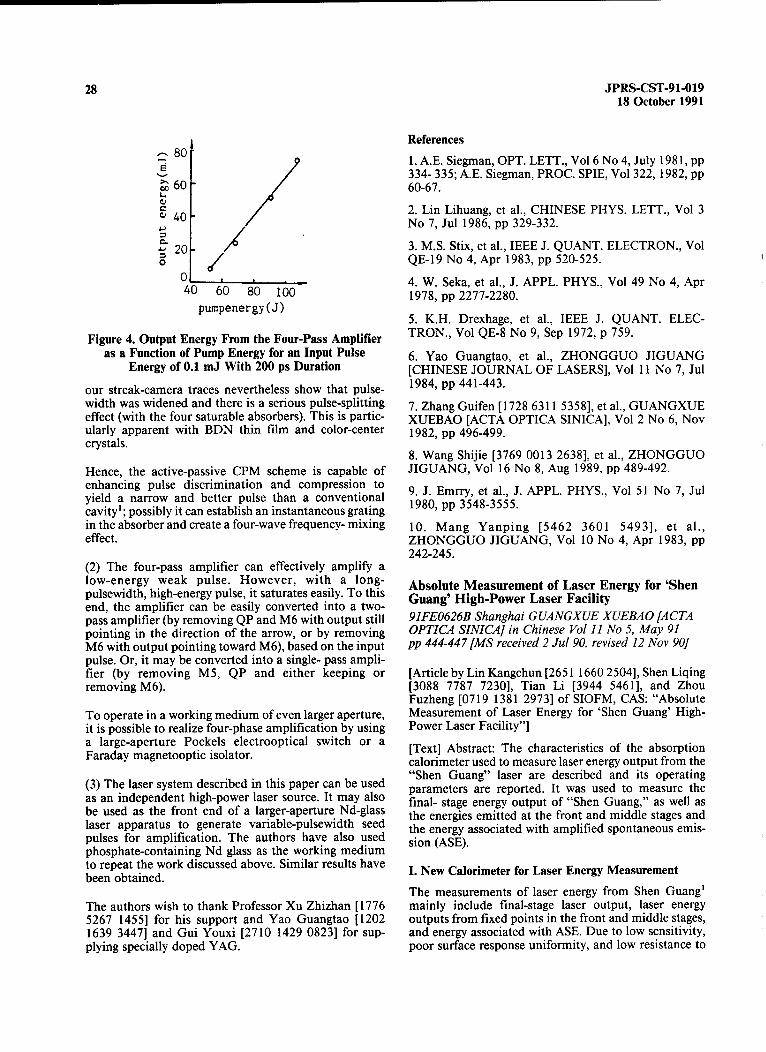
28 JPRS-CST-91-01918 October 1991
References--- 80
1. A.E. Siegman, OPT. LETT., Vol 6 No 4, July 1981, ppE 334- 335; A.E. Siegman, PROC. SPIE, Vol 322, 1982, ppS60 60-67.
" 402. Lin Lihuang, et al., CHINESE PHYS. LETT., Vol 3/40 No 7, Jul 1986, pp 329-332.
S20 3. M.S. Stix, et al., IEEE J. QUANT. ELECTRON., Vol
/ QE-19 No 4, Apr 1983, pp 520-525.
0 60 8'0 1_0- 4. W. Seka, et al., J. APPL. PHYS., Vol 49 No 4, Apr40 60 80 100 19 7 8 , pp 2 2 7 7 -2 2 8 0 .
purnpenergy(J) 5. K.H. Drexhage, et al., IEEE J. QUANT. ELEC-
Figure 4. Output Energy From the Four-Pass Amplifier TRON., Vol QE-8 No 9, Sep 1972, p 759.
as a Function of Pump Energy for an Input Pulse 6. Yao Guangtao, et al., ZHONGGUO JIGUANGEnergy of 0.1 mJ With 200 ps Duration [CHINESE JOURNAL OF LASERS], Vol 11 No 7, Jul
our streak-camera traces nevertheless show that pulse- 1984, pp 441-443.
width was widened and there is a serious pulse-splitting 7. Zhang Guifen [1728 6311 5358], et al., GUANGXUEeffect (with the four saturable absorbers). This is partic- XUEBAO [ACTA OPTICA SINICA], Vol 2 No 6, Novularly apparent with BDN thin film and color-center 1982, pp 496-499.crystals. 8. Wang Shijie [3769 0013 2638], et al., ZHONGGUO
Hence, the active-passive CPM scheme is capable of JIGUANG, Vol 16 No 8, Aug 1989, pp 489-492.enhancing pulse discrimination and compression toyield a narrow and better pulse than a conventional 9. J. Emrry, et al., J. APPL. PHYS., Vol 51 No 7, Julcavity'; possibly it can establish an instantaneous grating 1980, pp 3548-3555.in the absorber and create a four-wave frequency- mixing 10. Mang Yanping [5462 3601 5493], et al.,effect. ZHONGGUO JIGUANG, Vol 10 No 4, Apr 1983, pp
242-245.(2) The four-pass amplifier can effectively amplify alow-energy weak pulse. However, with a long- Absolute Measurement of Laser Energy for 'Shenpulsewidth, high-energy pulse, it saturates easily. To this Guang' High-Power Laser Facilityend, the amplifier can be easily converted into a two-pass amplifier (by removing QP and M6 with output still 91FE0626B Shanghai GUANGXUE XUEBAO [ACTApointing in the direction of the arrow, or by removing OPTICA SINICA] in Chinese Vol 11 No 5, May 91
M6 with output pointing toward M6), based on the input pp 444-447 [MS received 2 Jul 90, revised 12 Nov 90]
pulse. Or, it may be converted into a single- pass ampli-fier (by removing M5, QP and either keeping or [Article by Lin Kangchun [2651 1660 2504], Shen Liqingremoving M6). [3088 7787 7230], Tian Li [3944 5461], and Zhou
Fuzheng [0719 1381 2973] of SIOFM, CAS: "Absolute
To operate in a working medium of even larger aperture, Measurement of Laser Energy for 'Shen Guang' High-it is possible to realize four-phase amplification by using Power Laser Facility"]a large-aperture Pockels electrooptical switch or a [Text] Abstract: The characteristics of the absorptionFaraday magnetooptic isolator, calorimeter used to measure laser energy output from the
"Shen Guang" laser are described and its operating(3) The laser system described in this paper can be used parameters are reported. It was used to measure theas an independent high-power laser source. It may also final- stage energy output of "Shen Guang," as well asbe used as the front end of a larger-aperture Nd-glass the energies emitted at the front and middle stages andlaser apparatus to generate variable-pulsewidth seed the energy associated with amplified spontaneous emis-pulses for amplification. The authors have also used sion (ASE).phosphate-containing Nd glass as the working mediumto repeat the work discussed above. Similar results have 1. New Calorimeter for Laser Energy Measurementbeen obtained.
The measurements of laser energy from Shen Guang'The authors wish to thank Professor Xu Zhizhan [1776 mainly include final-stage laser output, laser energy5267 1455] for his support and Yao Guangtao [1202 outputs from fixed points in the front and middle stages,1639 3447] and Gui Youxi [2710 1429 0823] for sup- and energy associated with ASE. Due to low sensitivity,plying specially doped YAG. poor surface response uniformity, and low resistance to
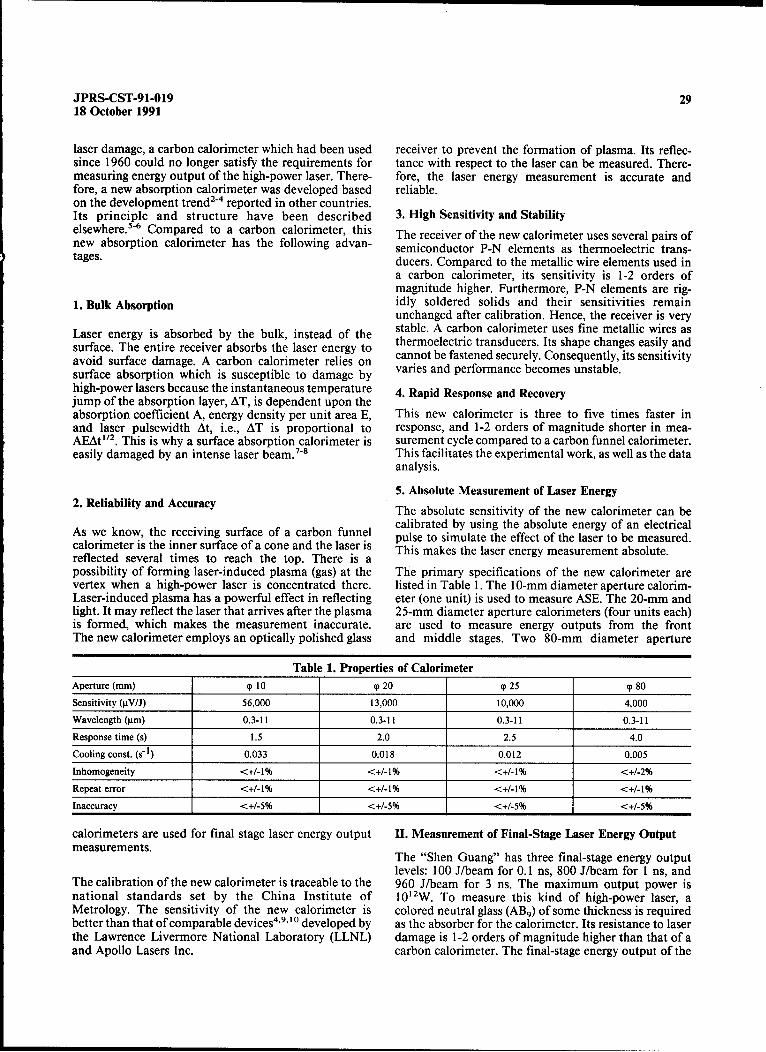
JPRS-CST-91-019 2918 October 1991
laser damage, a carbon calorimeter which had been used receiver to prevent the formation of plasma. Its reflec-since 1960 could no longer satisfy the requirements for tance with respect to the laser can be measured. There-measuring energy output of the high-power laser. There- fore, the laser energy measurement is accurate andfore, a new absorption calorimeter was developed based reliable.on the development trend2`4 reported in other countries.Its principle and structure have been described 3. High Sensitivity and Stabilityelsewhere. 5"6 Compared to a carbon calorimeter, this The receiver of the new calorimeter uses several pairs ofnew absorption calorimeter has the following advan- semiconductor P-N elements as thermoelectric trans-tages. ducers. Compared to the metallic wire elements used in
a carbon calorimeter, its sensitivity is 1-2 orders ofmagnitude higher. Furthermore, P-N elements are rig-
1. Bulk Absorption idly soldered solids and their sensitivities remainunchanged after calibration. Hence, the receiver is very
Laser energy is absorbed by the bulk, instead of the stable. A carbon calorimeter uses fine metallic wires asLurfaser The energy isr absorbe y the bulk r instea g the thermoelectric transducers. Its shape changes easily andsurface. The entire receiver absorbs the laser energy to cannot be fastened securely. Consequently, its sensitivity
avoid surface damage. A carbon calorimeter relies onsurface absorption which is susceptible to damage by varies and performance becomes unstable.high-power lasers because the instantaneous temperature 4. Rapid Response and Recoveryjump of the absorption layer, AT, is dependent upon theabsorption coefficient A, energy density per unit area E, This new calorimeter is three to five times faster inand laser pulsewidth At, i.e., AT is proportional to response, and 1-2 orders of magnitude shorter in mea-AEAt" 2 . This is why a surface absorption calorimeter is surement cycle compared to a carbon funnel calorimeter.easily damaged by an intense laser beam. 7 8 This facilitates the experimental work, as well as the data
analysis.
5. Absolute Measurement of Laser Energy2. Reliability and Accuracy The absolute sensitivity of the new calorimeter can be
calibrated by using the absolute energy of an electricalAs we know, the receiving surface of a carbon funnel pulse to simulate the effect of the laser to be measured.calorimeter is the inner surface of a cone and the laser is This makes the laser energy measurement absolute.reflected several times to reach the top. There is apossibility of forming laser-induced plasma (gas) at the The primary specifications of the new calorimeter arevertex when a high-power laser is concentrated there, listed in Table 1. The 10-mm diameter aperture calorim-Laser-induced plasma has a powerful effect in reflecting eter (one unit) is used to measure ASE. The 20-mm andlight. It may reflect the laser that arrives after the plasma 25-mm diameter aperture calorimeters (four units each)is formed, which makes the measurement inaccurate, are used to measure energy outputs from the frontThe new calorimeter employs an optically polished glass and middle stages. Two 80-mm diameter aperture
Table 1. Properties of CalorimeterAperture (mm) P 10 (p 20 (p 25 (p 80
Sensitivity (jiV/J) 56,000 13,000 10,000 4,000
Wavelength (jim) 0.3-11 0.3-11 0.3-11 0.3-11
Response time (s) 1.5 2.0 2.5 4.0
Cooling const. (WI) 0.033 0.018 0.012 0.005
Inhomogeneity <+/-1% <+/-1% <+/-1% <+/-2%
Repeat error <+/-1% <+/-1% <+/-1% <+/-1%
Inaccuracy <+/-5% <+1-5% <+/-5% <+/-5%
calorimeters are used for final stage laser energy output II. Measurement of Final-Stage Laser Energy Outputmeasurements. The "Shen Guang" has three final-stage energy output
levels: 100 J/beam for 0.1 ns, 800 J/beam for 1 ns, andThe calibration of the new calorimeter is traceable to the 960 J/beam for 3 ns. The maximum output power isnational standards set by the China Institute of 10"2 W. To measure this kind of high-power laser, aMetrology. The sensitivity of the new calorimeter is colored neutral glass (AB 9) of some thickness is requiredbetter than that of comparable devices 4' 9' developed by as the absorber for the calorimeter. Its resistance to laserthe Lawrence Livermore National Laboratory (LLNL) damage is 1-2 orders of magnitude higher than that of aand Apollo Lasers Inc. carbon calorimeter. The final-stage energy output of the

30 JPRS-CST-91-01918 October 1991
"Shen Guang" measured 803 J (goal is 800 J) using a be consistent with the original calibration. This indicatessplit-beam method in the national appraisal process. A that it is safe and reliable to use an 80-mm diametercalculation shows that this corresponds to a power load aperture calorimeter for the measurement of final stagedensity of 1.2 x 10⁹W/cm 2. The receiver of the calorim- laser energy output from "Shen Guang." Table 2 showseter was inspected and found to be intact. After one year some results of final-stage energy outputs of the southof use, the calorimeter was sent to the China Institute of and north beams during target-irradiation experiments.Metrology for inspection. Its performance was found to
Table 2. Measured Energies of South and North Beam in Independent RunNo. 1 2 3 4 5 6 7 8 9 10
South beam (J) 351 400 434 405 475 502 511 503 490 539
North beam (J) 137 330 304 473 553 520 500 490 530 450
III. Measurement of Front and Middle Stage adjust the front and middle stage amplifier voltage levelsFixed-Point Laser Energy of the south and north beam to achieve an ideal balance
and uniform illumination compression when both beamsThe purpose of setting a few points to measure laser are synchronized for the same target. Table 3 shows thatenergy at the front and middle stage includes (1) to check the maximum deviation in energy between the south andthe stability of energy outputs at the front and middle north beam is approximately 15 percent. Nevertheless, ifstage to determine the source of instability in order toeliminate it in time during laser-fusion experiments, (2) we can carefully adjust the ratio of the light sourceto consciously adjust the amplifier voltage for optical voltages at the front and middle stages, the energy
pumping to control the final-stage energy output in order imbalance can be reduced to 10 percent or less to obtainto satisfy various experimental requirements, and (3) to very satisfactory experimental data.
Table 3. Unbalances of Beam Energies in Counter Direction With SynchronizationNo. 1 2 3 4 5 6 7 8 9 10
South beam (J) 25.9 55.0 151.7 99.9 61.7 37.4 49.7 58.8 58.5 73.2
North beam (J) 21.2 52.0 159.1 113.9 63.2 33.9 54.2 63.2 64.0 76.0
Unbalance (%) 13 1 11 20 9 4 15 13 15 10
IV. ASE Measurement Fengchi [0491 7364 5041], Huang Guanlong [7806 70707893], Dai Dazhi [2071 6671 2535], Wu Fengchun [0702
The amplified spontaneous emission (ASE) of a laser 6646 2504], and Cai Xijie [5591 1585 3381] for theirsystem is the energy emitted without the oscillator while assistance and to Lin Zunqi [2651 1415 3825] forother amplifiers are turned on for a normal run. The ASE reviewing this manuscript.output pulse is of the same order as the optical pumppulsewidth. The front portion is the "leading laser" thatreaches the target surface. This ASE "leading laser" is Referencesfocused on the target by a lens. Although it is very small,it is nonetheless deleterious to the fusion experiment if it 1. Yu Wenyan [0151 2429 3508] and Lei Shizhan [7191exceeds a certain value. During the appraisal of "Shen 0099 3277], ZIRAN ZAZHI [NATURE], Vol 11 No 5,Guang", ASE energy was found to be within 0.7-0.8 mJ May 1988, p 352.in either the north or south beam. It is much lower thanthe original target of 2 mJ. However, it still burned 2. R.L. Smith, et al., IEEET, Vol IM-21 No 2, Nov 1972,through an 0.2-gm thick aluminum foil placed at the p 434.target point. Even at 0.4 mJ, it is capable of leaving aburn mark on an aluminum target and additional isola- 3. G.E. Chamberlain, et al., Ibid., Vol IM-27 No 1, Martion is required. Only when ASE is reduced to below 0.1 1978, p 81.mJ can a 80-jim diameter hollow glass target with an0.5-gm thick wall be free from destruction. This indi- 4. S.R. Gunn, LLNL report UCID-17308, 1976.cates that ASE must be reduced to this level to satisfy therequirements for laser-induced fusion experiments. The 5. Lin Kangchun, Zhou Fuzheng, et al., ZHONGGUOmeasurement of such minute energy at 0.1 mJ level can JIGUANG [CHINESE JOURNAL OF LASERS], Volonly be done accurately with a high-sensitivity, high- 10 No 3, Mar 1983, p 186.resolution calorimeter with a 10-mm diameter aperture. 6. Ibid., HE JUBIAN YU DENGLIZITI WULI
The authors wish to express their gratitude to Ge Luyan [NUCLEAR FUSION AND PLASMA PHYSICS], Vol 3[5514 7216 5333], Zhang Honglin [1728 3163 2651], Liu No 1, Mar 1983, p 41.
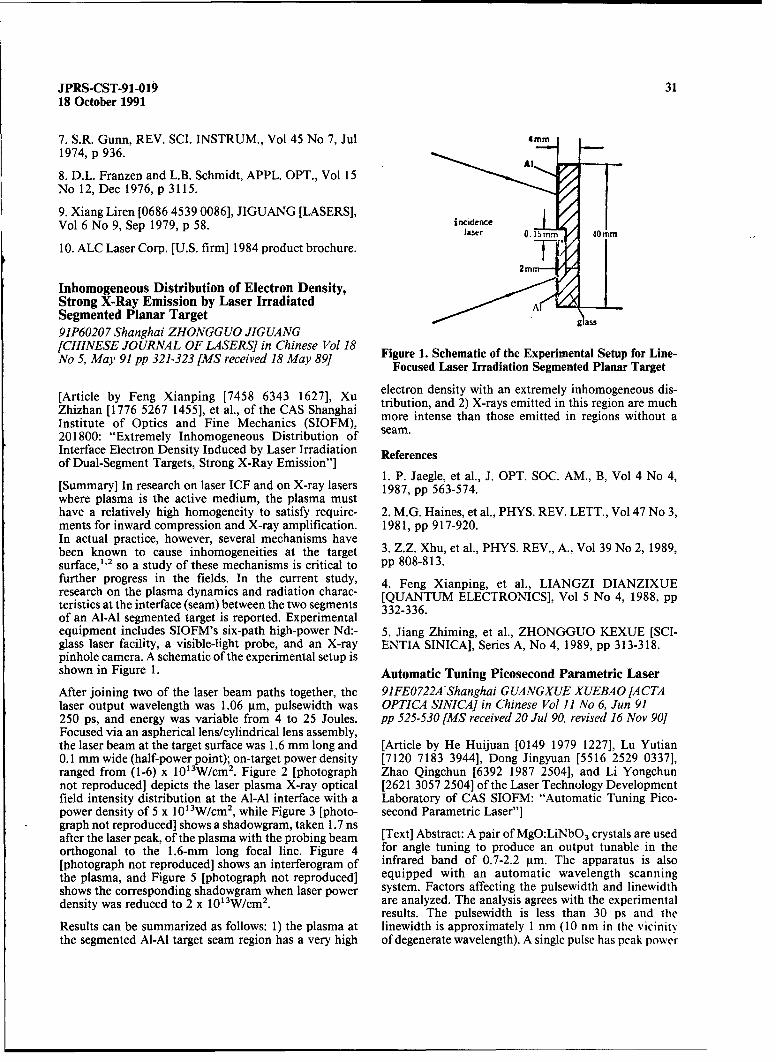
JPRS-CST-91-019 3118 October 1991
7. S.R. Gunn, REV. SCI. INSTRUM., Vol 45 No 7, Jul am1974, p 936. A "
8. D.L. Franzen and L.B. Schmidt, APPL. OPT., Vol 15
No 12, Dec 1976, p 3115.
9. Xiang Liren [0686 4539 0086], JIGUANG [LASERS],Vol 6 No 9, Sep 1979, p 58. incidence
laser ". 15i 40MM
10. ALC Laser Corp. [U.S. firm] 1984 product brochure. T2mrnr---
Inhomogeneous Distribution of Electron Density,Strong X-Ray Emission by Laser IrradiatedSegmented Planar Target A]
91P60207 Shanghai ZHONGGUO JIGUANG
[CHINESE JOURNAL OF LASERS] in Chinese Vol 18 Figure 1. Schematic of the Experimental Setup for Line-No 5, May 91 pp 32 1-323 [MS received 18 May 89] Focused Laser Irradiation Segmented Planar Target
[Article by Feng Xianping [7458 6343 1627], Xu electron density with an extremely inhomogeneous dis-
Zhizhan [1776 5267 1455], et al., of the CAS Shanghai tribution, and 2) X-rays emitted in this region are much
Institute of Optics and Fine Mechanics (SIOFM), more intense than those emitted in regions without a
201800: "Extremely Inhomogeneous Distribution of seam.
Interface Electron Density Induced by Laser Irradiation Referencesof Dual-Segment Targets, Strong X-Ray Emission"]
1. P. Jaegle, et al., J. OPT. SOC. AM., B, Vol 4 No 4,[Summary] In research on laser ICF and on X-ray lasers 1987, pp 563-574.where plasma is the active medium, the plasma musthave a relatively high homogeneity to satisfy require- 2. M.G. Haines, et al., PHYS. REV. LETT., Vol 47 No 3,ments for inward compression and X-ray amplification. 1981, pp 917-920.In actual practice, however, several mechanisms havebeen known to cause inhomogeneities at the target 3. Z.Z. Xhu, et al., PHYS. REV., A., Vol 39 No 2, 1989,surface, ", 2 so a study of these mechanisms is critical to pp 808-813.further progress in the fields. In the current study, 4. Feng Xianping, et al., LIANGZI DIANZIXUEresearch on the plasma dynamics and radiation charac- [QUANTUM ELECTRONICS], Vol 5 No 4, 1988, ppteristics at the interface (seam) between the two segments 332-336.of an Al-Al segmented target is reported. Experimentalequipment includes SIOFM's six-path high-power Nd:- 5. Jiang Zhiming, et al., ZHONGGUO KEXUE [SCI-glass laser facility, a visible-light probe, and an X-ray ENTIA SINICA], Series A, No 4, 1989, pp 313-318.pinhole camera. A schematic of the experimental setup isshown in Figure 1. Automatic Tuning Picosecond Parametric Laser
After joining two of the laser beam paths together, the 91FE0722A Shanghai GUANGXUE XUEBAO [ACTAlaser output wavelength was 1.06 itm, pulsewidth was OPTICA SINICA] in Chinese Vol 11 No 6, Jun 91250 ps, and energy was variable from 4 to 25 Joules. pp 525-530 [MS received 20 Jul 90, revised 16 Nov 90]Focused via an aspherical lens/cylindrical lens assembly,the laser beam at the target surface was 1.6 mm long and [Article by He Huijuan [0149 1979 1227], Lu Yutian0.1 mm wide (half-powerpoint); on-target power density [7120 7183 3944], Dong Jingyuan [5516 2529 0337],ranged from (1-6) x 1013W/cm 2. Figure 2 [photograph Zhao Qingchun [6392 1987 2504], and Li Yongchunnot reproduced] depicts the laser plasma X-ray optical [2621 3057 2504] of the Laser Technology Developmentfield intensity distribution at the Al-Al interface with a Laboratory of CAS SIOFM: "Automatic Tuning Pico-power density of 5 x 10 3W/cm2 , while Figure 3 [photo- second Parametric Laser"]graph not reproduced] shows a shadowgram, taken 1.7 nsafter the laser peak, of the plasma with the probing beam [Text] Abstract: A pair of MgO:LiNbO 3 crystals are usedorthogonal to the 1.6-mm long focal line. Figure 4 for angle tuning to produce an output tunable in the[photograph not reproduced] shows an interferogram of infrared band of 0.7-2.2 gim. The apparatus is alsothe plasma, and Figure 5 [photograph not reproduced] equipped with an automatic wavelength scanningshows the corresponding shadowgram when laser power system. Factors affecting the pulsewidth and linewidthdensity was reduced to 2 x 10¹³W/cm 2. are analyzed. The analysis agrees with the experimental
results. The pulsewidth is less than 30 ps and theResults can be summarized as follows: 1) the plasma at linewidth is approximately 1 nm (10 nm in the vicinitythe segmented Al-Al target seam region has a very high of degenerate wavelength). A single pulse has peak power
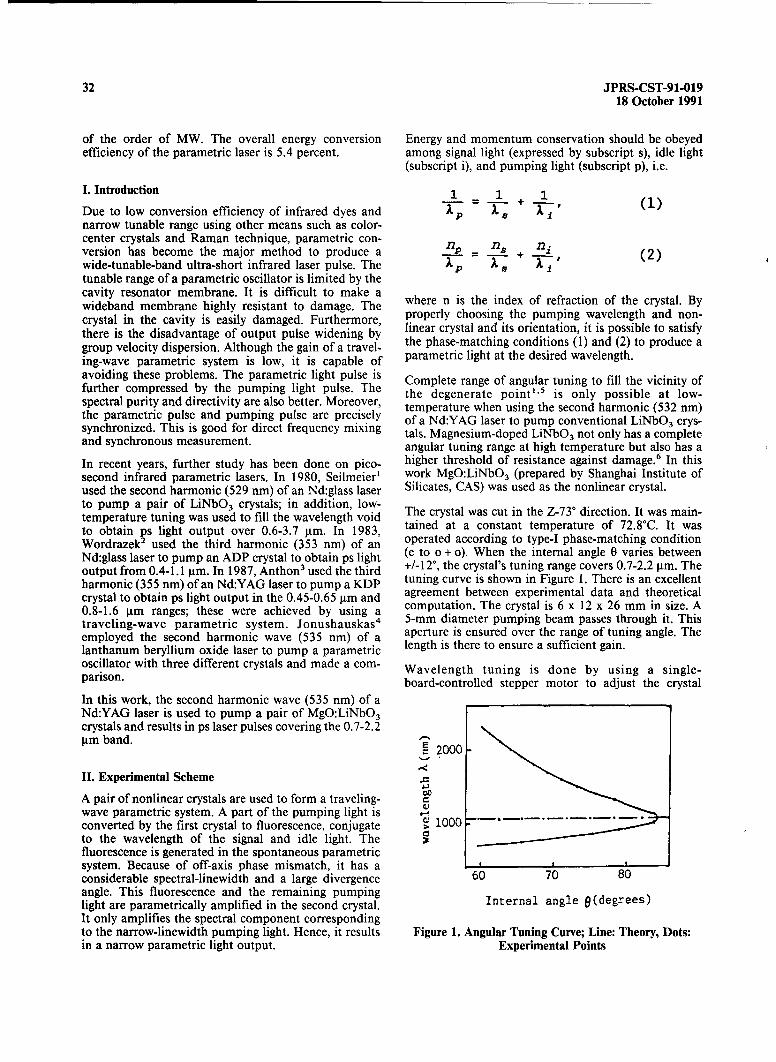
32 JPRS-CST-91-01918 October 1991
of the order of MW. The overall energy conversion Energy and momentum conservation should be obeyedefficiency of the parametric laser is 5.4 percent. among signal light (expressed by subscript s), idle light
(subscript i), and pumping light (subscript p), i.e.
I. Introduction 1 1 1
Due to low conversion efficiency of infrared dyes and P (1)narrow tunable range using other means such as color-center crystals and Raman technique, parametric con-version has become the major method to produce a n + n- n2+ (2)wide-tunable-band ultra-short infrared laser pulse. The A TAtunable range of a parametric oscillator is limited by thecavity resonator membrane. It is difficult to make a where n is the index of refraction of the crystal. Bywideband membrane highly resistant to damage. The where n hisinde ofmrefra velength and nycrystal in the cavity is easily damaged. Furthermore, properly choosing the pumping wavelength and non-there is the disadvantage of output pulse widening by linear crystal and its orientation, it is possible to satisfygroup velocity dispersion. Although the gain of a travel- the phase-matching conditions (1) and (2) to produce aing-wave parametric system is low, it is capable of parametric light at the desired wavelength.avoiding these problems. The parametric light pulse is Complete range of angular tuning to fill the vicinity offurther compressed by the pumping light pulse. The the degenerate point"'5 is only possible at low-spectral purity and directivity are also better. Moreover, temperature when using the second harmonic (532 nm)the parametric pulse and pumping pulse are precisely of a Nd:YAG laser to pump conventional LiNbc 3 crys-synchronized. This is good for direct frequency mixing tals. Magnesium-doped LiNbO 3 not only has a completeand synchronous measurement. angular tuning range at high temperature but also has a
In recent years, further study has been done on pico- higher threshold of resistance against damage. 6 In thissecond infrared parametric lasers. In 1980, Seilmeier' work MgO:LiNbO 3 (prepared by Shanghai Institute ofused the second harmonic (529 nm) of an Nd:glass laser Silicates, CAS) was used as the nonlinear crystal.to pump a pair of LiNbO 3 crystals; in addition, low-temperature tuning was used to fill the wavelength void The crystal was cut in the Z-73° direction. It was main-to obtain ps light output over 0.6-3.7 pgm. In 1983, trated at a constant temperature of 72.8°C. It wasWordrazek2 used the third harmonic (353 nm) of an operated according to type-I phase-matching conditionNd:glass laser to pump an ADP crystal to obtain ps light (e to o + o). When the internal angle 0 varies betweenoutput from 0.4-1.1 pgm. In 1987, Anthon3 used the third +/-12o, the crystal's tuning range covers 0.7-2.2 iim. Theharmonic (355 nm) of an Nd:YAG laser to pump a KDP tuning curve is shown in Figure 1. There is an excellentcrystal to obtain ps light output in the 0.45-0.65 gim and agreement between experimental data and theoretical0.8-1.6 4im ranges; these were achieved by using a computation. The crystal is 6 x 12 x 26 mm in size. Atraveling-wave parametric system. Jonushauskas4 5-mm diameter pumping beam passes through it. Thisemployed the second harmonic wave (535 nm) of a aperture is ensured over the range of tuning angle. Thelanthanum beryllium oxide laser to pump a parametric length is there to ensure a sufficient gain.oscillator with three different crystals and made a com- Wavelength tuning is done by using a single-parison. board-controlled stepper motor to adjust the crystal
In this work, the second harmonic wave (535 nm) of aNd:YAG laser is used to pump a pair of MgO:LiNbO3crystals and results in ps laser pulses covering the 0.7-2.2gtm band.
2000-
II. Experimental Scheme
A pair of nonlinear crystals are used to form a traveling-wave parametric system. A part of the pumping light isconverted by the first crystal to fluorescence, conjugate • 1000 --
to the wavelength of the signal and idle light. Thefluorescence is generated in the spontaneous parametricsystem. Because of off-axis phase mismatch, it has aconsiderable spectral-linewidth and a large divergence 60 70 80angle. This fluorescence and the remaining pumpinglight are parametrically amplified in the second crystal. Internal angle 0(degrees)It only amplifies the spectral component correspondingto the narrow-linewidth pumping light. Hence, it results Figure 1. Angular Tuning Curve; Line: Theory, Dots:in a narrow parametric light output. Experimental Points
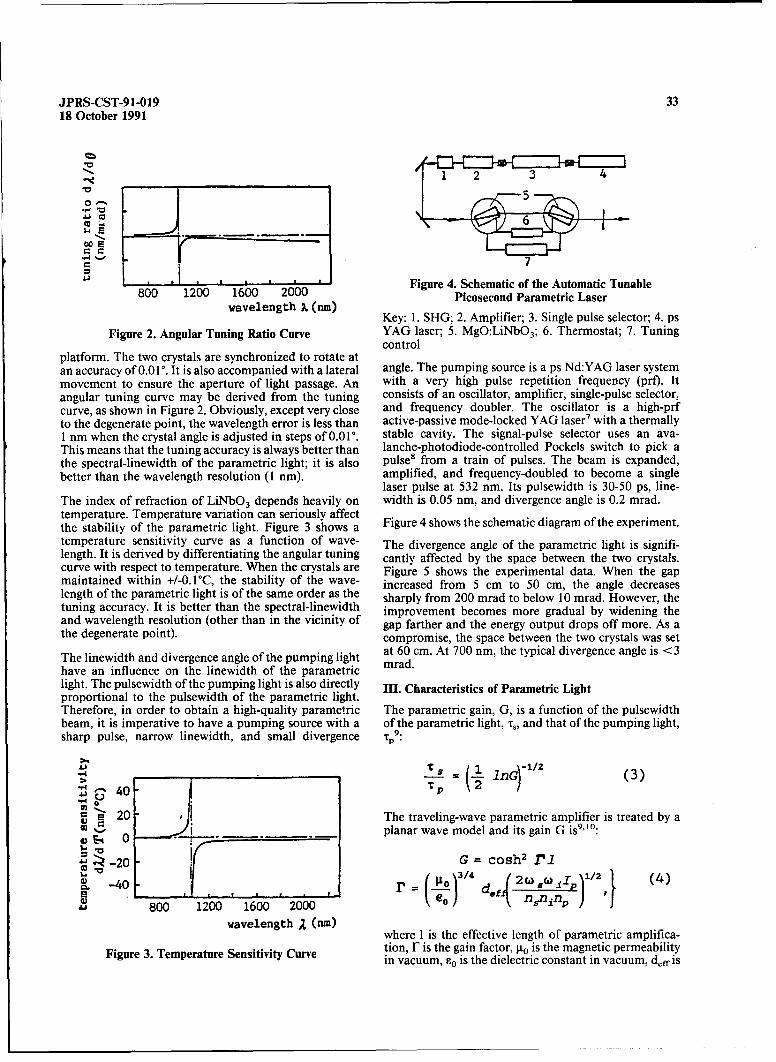
JPRS-CST-91-019 3318 October 1991
,- 7,
o -i0 8)
.200 A60 20Figure 4. Schematic of the Automatic Tunablew ln 1200 1600 2000Picosecond Parametric Laser
Key: 1. SHG; 2. Amplifier; 3. Single pulse selector; 4. psFigure 2. Angular Tuning Ratio Curve YAG laser; 5. MgO:LiNbO 3; 6. Thermostat; 7. Tuning
controlplatform. The two crystals are synchronized to rotate atan accuracy of 0.01°. It is also accompanied with a lateral angle. The pumping source is a ps Nd:YAG laser systemmovement to ensure the aperture of light passage. An with a very high pulse repetition frequency (prO. Itangular tuning curve may be derived from the tuning consists of an oscillator, amplifier, single-pulse selector,curve, as shown in Figure 2. Obviously, except very close and frequency doubler. The oscillator is a high-prfto the degenerate point, the wavelength error is less than active-passive mode-locked YAG laser" with a thermally1 nm when the crystal angle is adjusted in steps of 0.010. stable cavity. The signal-pulse selector uses an ava-This means that the tuning accuracy is always better than lanche-photodiode-controlled Pockels switch to pick athe spectral-linewidth of the parametric light; it is also pulse' from a train of pulses. The beam is expanded,better than the wavelength resolution (1 nm). amplified, and frequency-doubled to become a single
laser pulse at 532 nm. Its pulsewidth is 30-50 ps, line-The index of refraction of LiNbO 3 depends heavily on width is 0.05 nm, and divergence angle is 0.2 mrad.temperature. Temperature variation can seriously affectthe stability of the parametric light. Figure 3 shows a Figure 4 shows the schematic diagram of the experiment.temperature sensitivity curve as a function of wave- The divergence angle of the parametric light is signifi-length. It is derived by differentiating the angular tuning cantly affected by the space between the two crystals.curve with respect to temperature. When the crystals are Figure 5 shows the experimental data. When the gapmaintained within +1-0.1°C, the stability of the wave- increased from 5 cm to 50 cm, the angle decreaseslength of the parametric light is of the same order as the sharply from 200 mrad to below 10 mrad. However, thetuning accuracy. It is better than the spectral-linewidth improvement becomes more gradual by widening theand wavelength resolution (other than in the vicinity of gap farther and the energy output drops off more. As athe degenerate point). compromise, the space between the two crystals was set
p light at 60 cm. At 700 nm, the typical divergence angle is <3The linewidth and divergence angle of the pumping lgt mrad.
have an influence on the linewidth of the parametriclight. The pulsewidth of the pumping light is also directly III. Characteristics of Parametric Lightproportional to the pulsewidth of the parametric light.Therefore, in order to obtain a high-quality parametric The parametric gain, G, is a function of the pulsewidthbeam, it is imperative to have a pumping source with a of the parametric light, ts, and that of the pumping light,sharp pulse, narrow linewidth, and small divergence v9:
s- 1n7 (3)>p 21 40
S 20 The traveling-wave parametric amplifier is treated by a* ~,5 ~ - planar wave model and its gain G is9" 0:
-20G = cosh~r
0 -40, r -- de o,(
800 200 1600 2000wavelengt~h •1 (run) where 1 is the effective length of parametric amplifica-
Figure 3. Temperature Sensitivity Curve tion, F is the gain factor, go is the magnetic permeabilityin vacuum, so is the dielectric constant in vacuum, doff is
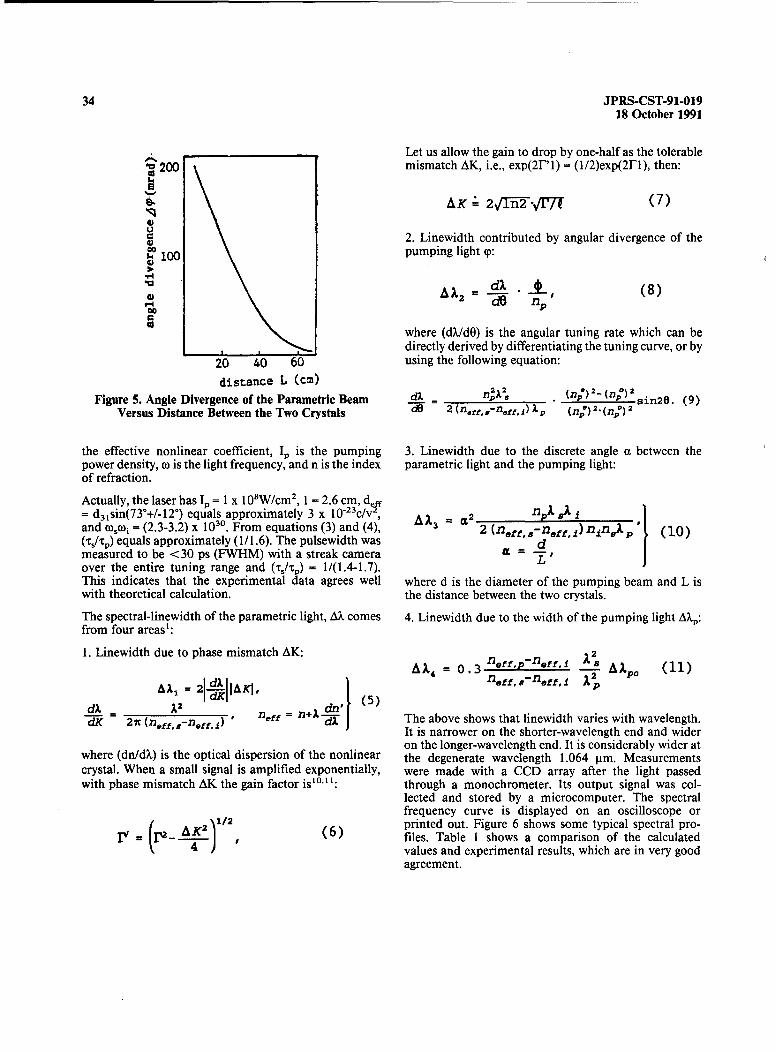
34 JPRS-CST-91-01918 October 1991
_ _ _Let us allow the gain to drop by one-half as the tolerable.1200 mismatch AK, i.e., exp(2F'1) = (1/2)exp(2F 1), then:1.
SAK -. 2V•l-n2-oVMr (7)
2. Linewidth contributed by angular divergence of the•0 pumping light p:
• - dX .(8)G AX2 = n100
where (d./dO) is the angular tuning rate which can bedirectly derived by differentiating the tuning curve, or by
20 40 60 using the following equation:
distance L (cm) 12 (n2
Figure 5. Angle Divergence of the Parametric Beam dl n 2 (a;) 2 (n;) 2 sin20. (9)Versus Distance Between the Two Crystals "2U 2 (nflff,.-n.ff,i) ;L (na) 2 .(n-) 2
the effective nonlinear coefficient, Ip is the pumping 3. Linewidth due to the discrete angle a between thepower density, o) is the light frequency, and n is the index parametric light and the pumping light:of refraction.
Actually, the laser has Ip- = 1 X 10W/cm2 , I = 2.6 cm, de= d31sin(730+/-12°) equals approximately 3 x 10-23c/v, np_. A 1and cosoi = (2.3-3.2) x 1030. From equations (3) and (4), AX 2 3 2 (nff_,-neff, i) nin1pi" (10)('r,/tp) equals approximately (1/1.6). The pulsewidth was dmeasured to be <30 ps (FWHM) with a streak camera Lover the entire tuning range and (,t,/'rp) = 1/(1.4-1.7).This indicates that the experimental data agrees well where d is the diameter of the pumping beam and L iswith theoretical calculation. the distance between the two crystals.
The spectral-linewidth of the parametric light, AX comes 4. Linewidth due to the width of the pumping light AX,:from four areas':
1. Linewidth due to phase mismatch AK: 12
A1 4 = 0.3- eff,P~neff,1 . A (I1)neff, s-neff,, %2
ci.Al., = 2I-"IIAKI, Ple,,~e~ ~
dK - 2n (nff,a-nf,, ) ' nWf = The above shows that linewidth varies with wavelength.It is narrower on the shorter-wavelength end and wideron the longer-wavelength end. It is considerably wider at
where (dn/dX) is the optical dispersion of the nonlinear the degenerate wavelength 1.064 jgm. Measurementscrystal. When a small signal is amplified exponentially, were made with a CCD array after the light passedwith phase mismatch AK the gain factor is' 0"': through a monochrometer. Its output signal was col-
lected and stored by a microcomputer. The spectralfrequency curve is displayed on an oscilloscope or( A2\/2 printed out. Figure 6 shows some typical spectral pro-p2 = i 22K (6) files. Table 1 shows a comparison of the calculatedvalues and experimental results, which are in very good
agreement.
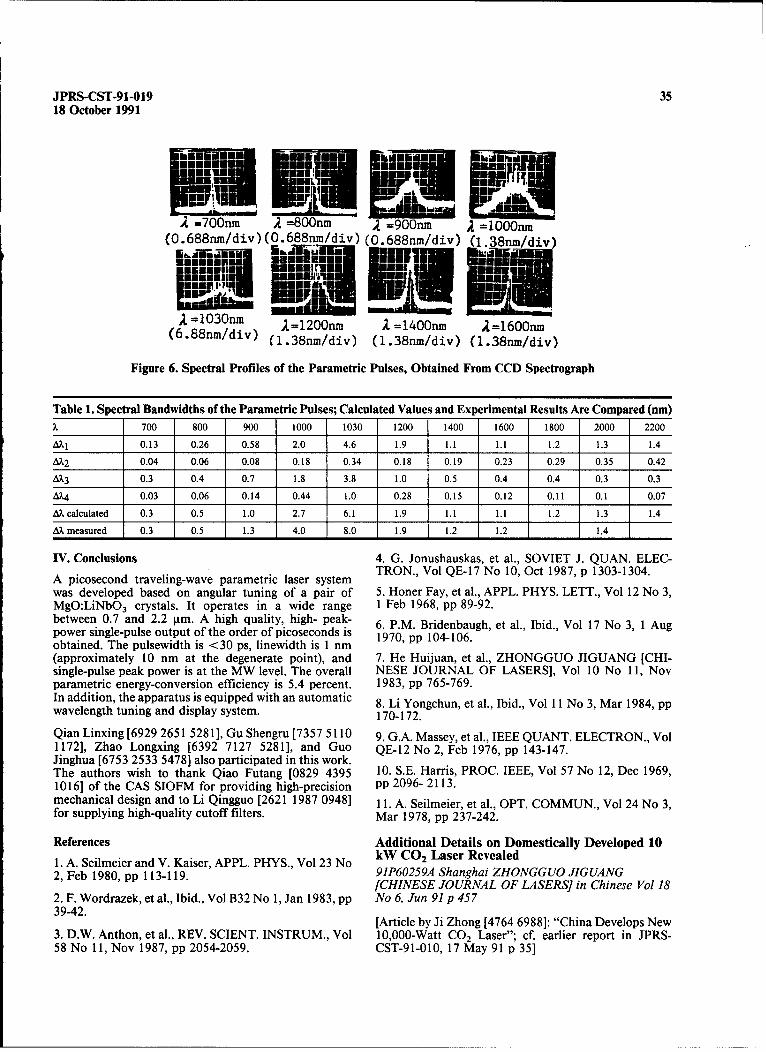
JPRS-CST-91-019 3518 October 1991
""L¶ E 0 MmmollsE IE UE
=700nm 2 =800nm A =900nm -=lOo0on(0.688nm/div) (O.688nm/div) (0.688nm/div) (1. 38r/div)
wan.in l .m in E mmiiEi v
a USRI *mmmii&1m...... ,,..i oo IlkllIll [t[ Bllal
AnilOOnmi i mmi
8=1030nm A=1200nm A =1400nm 2=1600nm(6.88nm/div) (1.38nm/div) (1.38nm/div) (1.38nm/div)
Figure 6. Spectral Profiles of the Parametric Pulses, Obtained From CCD Spectrograph
Table 1. Spectral Bandwidths of the Parametric Pulses; Calculated Values and Experimental Results Are Compared (nm)X 700 800 900 1000 1030 1200 1400 1600 1800 2000 2200
AXI 0.13 0.26 0.58 2.0 4.6 1.9 1.1 1.1 1.2 1.3 1.4
AX2 0.04 0.06 0.08 0.18 0.34 0.18 0.19 0.23 0.29 0.35 0.42
AX3 0.3 0.4 0.7 1.8 3.8 1.0 0.5 0.4 0.4 0.3 0.3
AX4 0.03 0.06 0.14 0.44 1.0 0.28 0.15 0.12 0.11 0.1 0.07
AX calculated 0.3 0.5 1.0 2.7 6.1 1.9 1.1 1.1 1.2 1.3 1.4
AX measured 0.3 0.5 1.3 4.0 8.0 1.9 1.2 1.2 1.4
IV. Conclusions 4. G. Jonushauskas, et al., SOVIET J. QUAN. ELEC-
A picosecond traveling-wave parametric laser system TRON., Vol QE-17 No 10, Oct 1987, p 1303-1304.
was developed based on angular tuning of a pair of 5. Honer Fay, et al., APPL. PHYS. LETT., Vol 12 No 3,MgO:LiNbO 3 crystals. It operates in a wide range 1 Feb 1968, pp 89-92.between 0.7 and 2.2 gtm. A high quality, high- peak- 6. P.M. Bridenbaugh, et al., Ibid., Vol 17 No 3, 1 Augpower single-pulse output of the order of picoseconds is 1970, pp 104-106.obtained. The pulsewidth is <30 ps, linewidth is 1 nm(approximately 10 nm at the degenerate point), and 7. He Huijuan, et al., ZHONGGUO JIGUANG [CHI-single-pulse peak power is at the MW level. The overall NESE JOURNAL OF LASERS], Vol 10 No 11, Novparametric energy-conversion efficiency is 5.4 percent. 1983, pp 765-769.In addition, the apparatus is equipped with an automatic 8. Li Yongchun, et al., Ibid., Vol 11 No 3, Mar 1984, ppwavelength tuning and display system. 170-172.
Qian Linxing [6929 2651 5281], Gu Shengru [7357 5110 9. G.A. Massey, et al., IEEE QUANT. ELECTRON., Vol1172], Zhao Longxing [6392 7127 5281], and Guo QE-12 No 2, Feb 1976, pp 143-147.Jinghua [6753 2533 5478] also participated in this work.The authors wish to thank Qiao Futang [0829 4395 10. S.E. Harris, PROC. IEEE, Vol 57 No 12, Dec 1969,1016] of the CAS SIOFM for providing high-precision pp 2096- 2113.mechanical design and to Li Qingguo [2621 1987 0948] 11. A. Seilmeier, et al., OPT. COMMUN., Vol 24 No 3,for supplying high-quality cutoff filters. Mar 1978, pp 237-242.
References Additional Details on Domestically Developed 10
1. A. Seilmeier and V. Kaiser, APPL. PHYS., Vol 23 No kW CO2 Laser Revealed2, Feb 1980, pp 113-119. 91P60259A Shanghai ZHONGGUO JIGUANG
[CHINESE JOURNAL OF LASERS] in Chinese Vol 182. F. Wordrazek, et al., Ibid., Vol B32 No 1,Jan 1983, pp No 6, Jun 91p 45739-42.
[Article by Ji Zhong [4764 6988]: "China Develops New3. D.W. Anthon, et al., REV. SCIENT. INSTRUM., Vol 10,000-Watt CO 2 Laser"; cf. earlier report in JPRS-58 No 11, Nov 1987, pp 2054-2059. CST-91-010, 17 May 91 p 35]
36 JPRS-CST-91-01918 October 1991
[Summary] The CAS Shanghai Institute of Optics & Fine The development of this new laser apparatus indicatesMechanics [SIOFM] has developed a new 10 kW trans- that SIOFM has overcome problems such as broadbandverse-flow CO 2 laser with dimensions of 2 m x 2 m x 2.5 three-wave nonlinear wave coupling in a Q-switchedm. The expert appraisal group has certified that this laser, suppression of nonlinear effects, and the require-state-of-the-art CO 2 laser has the following specifica- ment for directionality of the frequency-doubled lasertions: multimode running-time output power is over 10 beam to be superior to the directionality of the funda-kW, with an electrooptical conversion efficiency of 14 mental-frequency beam. The completion of this appa-percent; low- order-mode running-time output power is ratus represents a major improvement to SIOFM's LF 126 kW, with an electrooptical conversion efficiency of 8.3 laser fusion facility, and will provide a valuable researchpercent; beam divergence angle (full angle) is 2.2 millira- tool in developing even larger-scale laser fusion equip-dians; and single-gas-filling CW operation is 8 hours at a ment.10 kW-plus power level.
Soft X-Ray Picosecond Framing CameraBroadband Frequency-Doubled Nd:Glass Laser DevelopedBuilt at SIOFM 91P60269F Beijing ZHONGGUO KEXUE BAO91P60269A Beijing ZHONGGUO KEXUE BAO [CHINESE SCIENCE NEWS] in Chinese 19 Jul 91 p I[CHINESE SCIENCE NEWS] in Chinese 5 Jul 91 p 2
[Article by Wang Baizhan [3769 4102 2069]: "Soft[Article by Shang Guang [1424 0342]: "Broadband Fre- X-Ray Picosecond Framing Camera Unveiled"]quency-Doubled Neodymium:Glass Laser ApparatusCompleted"] [Summary] Xian (ZHONGGUO KEXUE BAO wire
report)-A soft X-ray picosecond (ps) framing camera[Summary] Shanghai (ZHONGGUO KEXUE BAO wire recently developed by the [CAS] Xian Institute of Opticsreport)-The broadband frequency-doubled Nd:glass & Fine Mechanics (XIOFM) has passed CAS-levellaser apparatus developed in a 10-year effort by appraisal. The experts have certified that this state-researchers from the CAS Shanghai of Optics & Fine of-the-art apparatus will provide a powerful diagnosticMechanics (SIOFM) passed CAS-level technical tool for domestic research in inertial confinement fusionappraisal on 10 June. This high-power apparatus, used in and X-ray lasers. Only France, the United States, Greatlaser fusion research to implement high-density target Britain, Japan, the Soviet Union, and now China havecompression via laser direct drive has been developed developed this advanced equipment. The XIOFM-only by a small number of other nations, including the developed apparatus has a 250-ps exposure time and aUnited States and Japan. dynamic spatial resolution of five lines per millimeter.
i /
This is a U.S. Government publication. Its contents in no way represent thepolicies, views, or attitudes of the U.S. Government. Users of this publication maycite FBIS or JPRS provided they do so in a manner clearly identifying them as thesecondary source.
Foreign Broadcast Information Service (FBIS) and Joint Publications Research Service (JPRS)publications contain political, military, economic, environmental, and sociological news, commentary,and other information, as well as scientific and technical data and reports. All information has beenobtained from foreign radio and television broadcasts, news agency transmissions, newspapers, books,and periodicals. Items generally are processed from the first or best available sources. It should not beinferred that they have been disseminated only in the medium, in the language, or to the area indicated.Items from foreign language sources are translated; those from English-language sources are tran-scribed. Except for excluding certain diacritics, FBIS renders personal and place-names in accordancewith the romanization systems approved for U.S. Government publications by the U.S. Board ofGeographic Names.
Headlines, editorial reports, and material enclosed in brackets [] are supplied by FBIS/JPRS.Processing indicators such as [Text] or [Excerpts] in the first line of each item indicate how theinformation was processed from the original. Unfamiliar names rendered phonetically are enclosed inparentheses. Words or names preceded by a question mark and enclosed in parentheses were not clearfrom the original source but have been supplied as appropriate to the context. Other unattributedparenthetical notes within the body of an item originate with the source. Times within items are as givenby the source. Passages in boldface or italics are as published.
SUBSCRIPTION/PROCUREMENT INFORMATIONThe FBIS DAILY REPORT contains current news provided by NTIS upon request. Subscriptions are
and information and is published Monday through available outside the United States from NTIS orFriday in eight volumes: China, East Europe, Soviet appointed foreign dealers. New subscribers shouldUnion, East Asia, Near East & South Asia, Sub- expect a 30-day delay in receipt of the first issue.Saharan Africa, Latin America, and West Europe.Supplements to the DAILY REPORTs may also be U.S. Government offices may obtain subscrip-available periodically and will be distributed to regular tions to the DAILY REPORTs or JPRS publicationsDAILY REPORT subscribers. JPRS publications, which (hardcover or microfiche) at no charge through theirinclude approximately 50 regional, worldwide, and sponsoring organizations. For additional informationtopical reports, generally contain less time-sensitive or assistance, call FBIS, (202) 338-6735,or writeinformation and are published periodically, to P.O. Box 2604, Washington, D.C. 20013.
Department of Defense consumers are required toCurrent DAILY REPORTs and JPRS publications are submit requests through appropriate command val-
listed in Government Reports Announcements issued idation channels to DIA, RTS-2C, Washington, D.C.semimonthly by the National Technical Information 20301. (Telephone: (202) 373-3771, Autovon:Service (NTIS), 5285 Port Royal Road, Springfield, 243-3771.)Virginia 22161 and the Monthly Catalog of U.S. Gov-ernment Publications issued by the Superintendent of Back issues or single copies of the DAILYDocuments, U.S. Government Printing Office, Wash- REPORTs and JPRS publications are not available.ington, D.C. 20402. Both the DAILY REPORTs and the JPRS publications
are on file for public reference at the Library ofThe public may subscribe to either hardcover or Congress and at many Federal Depository Libraries.
microfiche versions of the DAILY REPORTs and JPRS Reference copies may also be seen at many publicpublications through NTIS at the above address or by and university libraries throughout the Unitedcalling (703) 487-4630. Subscription rates will be States.