Proteomic Analysis of the Intestinal Adaptation Response Reveals Altered Expression of Fatty Acid...
13
Proteomic Analysis of the Intestinal Adaptation Response Reveals Altered Expression of Fatty Acid Binding Proteins Following Massive Small Bowel Resection Andrew N. Stephens,* ,†,# Prue M. Pereira-Fantini,* ,‡,# Guineva Wilson, § Russell G. Taylor, § Adam Rainczuk, † Katie L. Meehan, † Magdy Sourial, § Peter J. Fuller, † Peter G. Stanton, † David M. Robertson, † and Julie E. Bines ‡,|,⊥ Prince Henry’s Institute of Medical Research, Monash Medical Centre, Clayton, Murdoch Children’s Research Institute, Departments of Surgery and Gastroenterology and Clinical Nutrition, Royal Children’s Hospital, and Department of Paediatrics, University of Melbourne, Parkville, Victoria, Australia Received October 28, 2009 Intestinal adaptation in response to the loss of the small intestine is essential to restore enteral autonomy in patients who have undergone massive small bowel resection (MSBR). In a proportion of patients, intestinal function is not restored, resulting in chronic intestinal failure (IF). Early referral of such patients for transplant provides the best prognosis; however, the molecular mechanisms underlying intestinal adaptation remain elusive and there is currently no convenient marker to predict whether patients will develop IF. We have investigated the adaptation response in a well-characterized porcine model of intestinal adaptation. 2D DIGE analysis of ileal epithelium from piglets recovering from massive small bowel resection (MSBR) identified over 60 proteins that changed specifically in MSBR animals relative to nonoperational or sham-operated controls. Three fatty acid binding proteins (L-FABP, FABP-6, and I-FABP) showed changes in MSBR animals. The expression changes and localization of each FABP were validated by immunoblotting and immunohistochemical analysis. FABP expression changes in MSBR animals occurred concurrently with altered triglyceride and bile acid metabolism as well as weight gain. The observed FABP expression changes in the ileal epithelium occur as part of the intestinal adaptation response and could provide a clinically useful marker to evaluate adaptation following MSBR. Keywords: 2D-PAGE • DIGE • intestinal failure • MSBR • adaptation • short bowel syndrome • fatty acid binding protein • FABPL • FABP6 • FABPI Introduction Short bowel syndrome (SBS) is a state of malabsorption and malnutrition, arising from either congenital disease or massive small bowel resection (MSBR), that results in a significant loss of functional intestinal length. 1-3 In newborns and infants, the mortality associated with SBS can reach 90%, making it one of the most lethal conditions in infancy and early childhood. 3-9 In a small number of SBS patients, the remaining functional bowel is unable to supply sufficient energy and nutrition requirements to maintain growthsa state known as intestinal failure (IF)sand the patient becomes dependent on long-term parenteral nutrition (PN) for survival. 2,10 However, complica- tions arising from the chronic administration of PN, such as bacterial sepsis and parenteral nutrition-associated liver disease (PNALD), are implicated in up to 5% of annual, nondisease related mortality and make long-term PN undesirable. 2,3,7,11-13 Chronic PN also significantly alters quality of life and has high associated health-care costs. 3,14 Bowel transplantation has been proposed as a preferred treatment for patients with IF, 14-18 but the long-term requirements for immunosuppression coupled with a 5-year survival rate similar to chronic PN currently make transplantation unsuitable for most IF patients. 3,15,16,19 Following a significant loss of mucosal surface after MSBR, the remaining intestine must undergo compensatory physi- ological and morphological changes to increase its absorptive capacity. 10,20 This process of intestinal adaptation, involving compensatory growth and the dilation, thickening, and length- ening of remaining intestine, can be detected almost im- mediately and may last for a period of months to years. 3,10,20,21 The adapting intestine undergoes prominent hyperplasia and hypertrophy in all layers of the bowel wall, a process primarily driven by intestinal epithelial stem cells within the intestinal crypts. 22 Increased epithelial cell proliferation and migration along the crypt-villus axis results in lengthening of the villi, * To whom correspondence should be addressed. Dr. Andrew N. Stephens, Level 4, Prince Henry’s Institute of Medical Research, PO Box 5152, Clayton VIC 3168, Australia. Phone +613 95947912. Fax +613 9594 7909. E-mail [email protected]. Dr. Prue Pereira-Fantini, Murdoch Children’s Research Institute, Parkville VIC 3052, Australia. Phone +613 8341- 6452. Fax +613 8341-6449. E-mail [email protected]. † Prince Henry’s Institute of Medical Research. ‡ Murdoch Children’s Research Institute. § Department of Surgery, Royal Children’s Hospital. | Departments of Gastroenterology and Clinical Nutrition, Royal Children’s Hospital. ⊥ Department of Paediatrics, University of Melbourne. # These authors contributed equally to the manuscript. 10.1021/pr900976f 2010 American Chemical Society Journal of Proteome Research 2010, 9, 1437–1449 1437 Published on Web 11/30/2009
-
Upload
independent -
Category
Documents
-
view
0 -
download
0
Transcript of Proteomic Analysis of the Intestinal Adaptation Response Reveals Altered Expression of Fatty Acid...
Proteomic Analysis of the Intestinal Adaptation Response Reveals
Altered Expression of Fatty Acid Binding Proteins Following Massive
Small Bowel Resection
Andrew N. Stephens,*,†,# Prue M. Pereira-Fantini,*,‡,# Guineva Wilson,§ Russell G. Taylor,§
Adam Rainczuk,† Katie L. Meehan,† Magdy Sourial,§ Peter J. Fuller,† Peter G. Stanton,†
David M. Robertson,† and Julie E. Bines‡,|,⊥
Prince Henry’s Institute of Medical Research, Monash Medical Centre, Clayton, Murdoch Children’s ResearchInstitute, Departments of Surgery and Gastroenterology and Clinical Nutrition, Royal Children’s Hospital, and
Department of Paediatrics, University of Melbourne, Parkville, Victoria, Australia
Received October 28, 2009
Intestinal adaptation in response to the loss of the small intestine is essential to restore enteral autonomyin patients who have undergone massive small bowel resection (MSBR). In a proportion of patients,intestinal function is not restored, resulting in chronic intestinal failure (IF). Early referral of such patientsfor transplant provides the best prognosis; however, the molecular mechanisms underlying intestinaladaptation remain elusive and there is currently no convenient marker to predict whether patients willdevelop IF. We have investigated the adaptation response in a well-characterized porcine model ofintestinal adaptation. 2D DIGE analysis of ileal epithelium from piglets recovering from massive smallbowel resection (MSBR) identified over 60 proteins that changed specifically in MSBR animals relativeto nonoperational or sham-operated controls. Three fatty acid binding proteins (L-FABP, FABP-6, andI-FABP) showed changes in MSBR animals. The expression changes and localization of each FABPwere validated by immunoblotting and immunohistochemical analysis. FABP expression changes inMSBR animals occurred concurrently with altered triglyceride and bile acid metabolism as well as weightgain. The observed FABP expression changes in the ileal epithelium occur as part of the intestinaladaptation response and could provide a clinically useful marker to evaluate adaptation following MSBR.
Keywords: 2D-PAGE • DIGE • intestinal failure • MSBR • adaptation • short bowel syndrome • fatty acidbinding protein • FABPL • FABP6 • FABPI
Introduction
Short bowel syndrome (SBS) is a state of malabsorption andmalnutrition, arising from either congenital disease or massivesmall bowel resection (MSBR), that results in a significant lossof functional intestinal length.1-3 In newborns and infants, themortality associated with SBS can reach 90%, making it one ofthe most lethal conditions in infancy and early childhood.3-9
In a small number of SBS patients, the remaining functionalbowel is unable to supply sufficient energy and nutritionrequirements to maintain growthsa state known as intestinalfailure (IF)sand the patient becomes dependent on long-term
parenteral nutrition (PN) for survival.2,10 However, complica-tions arising from the chronic administration of PN, such asbacterial sepsis and parenteral nutrition-associated liver disease(PNALD), are implicated in up to 5% of annual, nondiseaserelated mortality and make long-term PN undesirable.2,3,7,11-13
Chronic PN also significantly alters quality of life and has highassociated health-care costs.3,14 Bowel transplantation has beenproposed as a preferred treatment for patients with IF,14-18
but the long-term requirements for immunosuppression coupledwith a 5-year survival rate similar to chronic PN currently maketransplantation unsuitable for most IF patients.3,15,16,19
Following a significant loss of mucosal surface after MSBR,the remaining intestine must undergo compensatory physi-ological and morphological changes to increase its absorptivecapacity.10,20 This process of intestinal adaptation, involvingcompensatory growth and the dilation, thickening, and length-ening of remaining intestine, can be detected almost im-mediately and may last for a period of months to years.3,10,20,21
The adapting intestine undergoes prominent hyperplasia andhypertrophy in all layers of the bowel wall, a process primarilydriven by intestinal epithelial stem cells within the intestinalcrypts.22 Increased epithelial cell proliferation and migrationalong the crypt-villus axis results in lengthening of the villi,
* To whom correspondence should be addressed. Dr. Andrew N. Stephens,Level 4, Prince Henry’s Institute of Medical Research, PO Box 5152, ClaytonVIC 3168, Australia. Phone +613 95947912. Fax +613 9594 7909. [email protected]. Dr. Prue Pereira-Fantini, MurdochChildren’s Research Institute, Parkville VIC 3052, Australia. Phone +613 8341-6452. Fax +613 8341-6449. E-mail [email protected].
† Prince Henry’s Institute of Medical Research.‡ Murdoch Children’s Research Institute.§ Department of Surgery, Royal Children’s Hospital.| Departments of Gastroenterology and Clinical Nutrition, Royal Children’s
Hospital.⊥ Department of Paediatrics, University of Melbourne.# These authors contributed equally to the manuscript.
10.1021/pr900976f 2010 American Chemical Society Journal of Proteome Research 2010, 9, 1437–1449 1437Published on Web 11/30/2009
deepening of the crypts and thickening of the mucosa.10,11,23-26
This is accompanied by alterations in the rate of apoptosis andan increase in cellular DNA, RNA and protein content.3,10,20
Concomitant changes in nutrient uptake, ion transport anddigestive capacity ideally lead to increased absorption ofcarbohydrate, protein, water and electrolytes per unit lengthin the small intestine,3,11,25,26 although absorption per cell isdecreased due to a lack of mature cells in the villi.10 Thesechanges are most prominent in the ileum and are directlyproportional to the amount of bowel remaining.3,10 The successof the adaptive response directly determines whether a patientwill regain enteral autonomy or progress to a state of intestinalfailure. In those patients where IF is irreversible and long-termdependence on PN is considered life-threatening, intestinaltransplantation is indicated as the most appropriate -treatment.2,14-18 The key to successful transplantation lies withearly referral, prior to the development of life-threateningcomplications and the requirement for simultaneous multio-rgan transplant.2,17-19 It is therefore imperative that patientswho will not achieve enteral autonomy are distinguished assoon as possible, to facilitate the best long-term managementand patient prognosis.3,11 However, to date there is no clinicallyuseful marker with sufficient accuracy to predict at an earlystage whether patients will develop IF.
A number of factors are known to influence the success ofintestinal adaptation and have been extensively reviewed; theseinclude the composition of luminal nutrients, pancreatico-biliary secretions, secreted hormones and requirement forpeptide growth factors.2,3,8,10,13,27-30 Several studies have at-tempted to characterize gene expression following MSBR toanalyze mechanisms of intestinal adaptation,11,20,21,31 or tocharacterize the developmental progression of proliferatingcells migrating along the crypt-villus axis.32 However themechanisms underlying the successful intestinal adaptationresponse, including the molecular signals that initiate, maintainand ultimately terminate the adaptation process, remain poorlyunderstood.20,21,31 A marker of intestinal adaptation would beof significant clinical use, aiding in the evaluation of patientresponse to therapeutic interventions that may promote in-testinal adaptation as well as allowing for earlier referral ofpatients for transplantation who will not achieve ultimateenteral autonomy.
We have applied a proteomic strategy to analyze proteinexpression in a well-established porcine model of intestinaladaptation33 following MSBR. This is the first study describingthe application of proteomic technology to investigate thechanges in protein expression that occur during adaptation ofthe intestinal lumen as a result of SBS.
Experimental Section
Animals. All experiments were conducted according to theguidelines of the National Health and Medical ResearchCouncil, and with prior ethics approval from the Animal EthicsCommittee of the Murdoch Children’s Research Institute(Melbourne, Australia). Weaned 3-week old Landrace/LargeWhite Cross piglets (Victorian Institute of Agricultural Science,Werribee, Australia) were acclimatized at the Royal Children’sHospital Animal Research Laboratory (Melbourne, Australia)at a constant temperature of 22 °C with a 12 h light cycle forone week prior to surgery. Surgical procedures have beendescribed previously.33-36 In brief, 4-week old piglets under-went either a 75% proximal small bowel resection (MSBR),transection and reanastomosis (SHAM), or no operation (NOC).
Small bowel resection included removal of the small bowelfrom 1 m distal to the ligament of Treitz to 2.5 m proximal tothe ileocecal valve. The SHAM operation group were transectedand reanastomosed 2.5 m proximal to the ileocecal valve.
Following surgery all animals (both control and treatmentgroups) received identical peri- and postoperative care. Animalswere maintained in individual cages to accurately measure dietconsumption. Weight was measured weekly prior to the morn-ing feed. Serum required for fasting bile acid, cholesterol andtriglyceride measurements was collected 24 h prior to operationand at 2, 4, and 6 weeks postoperatively. Samples wereevaluated in the Department of Laboratory Medicine (RoyalChildren’s Hospital, Parkville, Australia) using establishedmethodology. After sacrifice ileal tissue was harvested, andeither placed in 10% neutral buffered formalin (AustralianBiostain Pty. Ltd., Australia) for paraffin embedding or im-mediately snap frozen. Prior to protein extraction the ilealmucosa was manually separated from the underlying muscle.
Expression Analysis and Protein Identification. Proteinextraction from snap-frozen ileal tissue, fluorescent proteinlabeling using CyDyes and two-dimensional polyacrylamide gelelectrophoresis (2D DIGE) were as described.37 Labeling wasperformed using 50 µg protein as recommended by themanufacturer. Isoelectric focusing was carried out using bothpH 3-10 and pH 5-8 gradients according to the followingparameters; 60 µA per strip, 100 V/90 min, 300 V/90 min, 500V/3 h, gradient to 1000 V/4 h, gradient to 8000 V/3 h, constant8000 V until reaching 60 000 Vh. Differential expression analysisbased on normalized spot volumes was carried out using PG240Same Spots software (Nonlinear Dynamics, Newcastle-upon-Tyne, UK). All proteomic analysis was carried out on individualanimal samples in each group. Reciprocal labeling experimentswere also carried out using a pooled protein sample, and anyproteins showing differential labeling effects specific to the useof the Cy3/Cy5 dyes were eliminated from the analysis.
Protein spots of interest were excised using a ProPicII roboticspot picker (Genomic Solutions, MI) based on the X-Ycoordinates exported directly from PG240 SameSpots. Proteinidentification by MALDI-TOF MS and MS/MS was also asdescribed.37 Monoisotopic peak masses were automaticallyextracted using GPS Explorer software (v 3.0 build 311; AppliedBiosystems, CA) and peak lists searched against the nonredun-dant UniProtKB/Swiss-Prot database (release 57.3; 468851sequence entries; http://www.uniprot.org) using the MASCOTsearch engine (updated 03-01-2007; http://www.matrix-science.com). Species was restricted to mammalian, carbony-lamide-cysteine (CAM - fixed modification) and oxidation ofmethionine (variable modification) were taken into account, aparent ion mass tolerance of 0.1 Da and 1 missed cleavage(enzyme specificity trypsin) was allowed. Up to fifteen of themost intense peptides detected in each MS scan were auto-matically selected for MS/MS analysis. Peak lists were extractedusing Data Analysis software version 3.4 (Bruker Diagnostics,Germany). The parameters used to create the peak lists wereas follows: mass range 100 to 3000 Da; signal-to-noise thresholdof 5; minimum compounds length of 10 spectra. Combinedpeptide mass (MS) and fragmentation (MS/MS) data weresearched using in-house MASCOT search engine (version 1.1,Matrix Science) against the UniProtKB/Swiss-Prot database asabove, with fragment mass tolerance of 0.1 Da. The followingcriteria were used to evaluate the search; MOWSE score (e44for PMF data; g 72 for combined MS/MS data), number ofpeptides matched (g6 for PMF data; g2 for combined MS/MS
research articles Stephens et al.
1438 Journal of Proteome Research • Vol. 9, No. 3, 2010
data); and the estimated molecular mass and pI as determinedfrom the 2D gel.
Statistical Analysis. All statistical analyses of proteomicexpression data were performed automatically by the PG240SameSpots software. Expression data are given as meannormalized spot volume ( standard deviation. Hierarchicalclustering and protein expression heat maps were generatedusing open source R software (http://www.r-project.org/).Statistical analysis of immunoblotting and immunohistochem-istry results was carried out using SigmaPlot software (SystateSoftware Inc., Chicago, IL) with data expressed as mean (standard error of the mean (SEM).
Immunoblotting. Total protein was extracted from snap-frozen, unfixed ileal tissue using TRIzol reagent (Invitrogen, CA)according to the manufacturer’s instructions. Protein pelletswere resuspended in 0.1% SDS (w/v) and protein contentdetermined using the bicinchononic acid (BCA) protein assaykit (Pierce Biotechnology, IL). A 10 µg aliquot of protein fromeach specimen was separated in a 10% SDS PAGE tris-glycinegel, and transferred to nitrocellulose membrane (GE, Uppsala,Sweden). Proteins were detected using polyclonal antibodiesdirected against FABP-6 (1:2000; R&D Systems, Minneapolis,MN), I-FABP (1:3000; R&D Systems, Minneapolis, MN) andL-FABP (1:10 000; Abcam, Cambridge UK) or �-actin (SigmaAldrich, USA) and a secondary HRP-conjugated antibodydirected against either goat or rabbit as required. ECL reagent(GE Healthcare) was used to visualize protein detection, andimages were analyzed using ImageJ software. All quantitationwas performed relative to a �-actin control.
Immunohistochemical Staining. Immunohistochemical stain-ing was carried out on paraffin-embedded, formalin-fixedsections of ileal tissue. Monoclonal antibodies directed againstFABP-6 (1:50; R&D Systems, Minneapolis, MN), I-FABP (1:100;R&D Systems, Minneapolis, MN) and L-FABP (1:100; Abcam,Cambridge UK) were used to visualize protein localization.Sections were photographed and the number of positivelystained cells in either the crypt or villus quantitated usingImageJ software (v1.34s; http://rsb.info.nih/gov/ij). All imageanalysis was performed by an experienced histologist.
Biological Enrichment and Pathway Analysis. Proteinsidentified as differentially expressed following MSBR, relativeto both SHAM and NOC controls, were further analyzed forenrichment of specific biological processes and pathways usingGeneGO pathway analysis software (Version 4.3, Build 9311;http://www.GeneGO.com). For each identified protein, theappropriate human homologue was first located in the Uni-ProtKB/Swiss-Prot database using the online Protein IdentifierCross-Reference Service (http://www.ebi.ac.uk/Tools/picr/search.do).38 The accession numbers of these human homo-
logues were then uploaded into the GeneGO environmentalong with specific proteomic fold change data. Pathwayanalysis and GO ontologies were determined using the manu-ally curated MetaCore database. Ranking of relevant pathwaysand GeneGO processes was based on hypergeometric distribu-tion p values as performed by the software, with a p value ofe10-6 considered significant.
Results
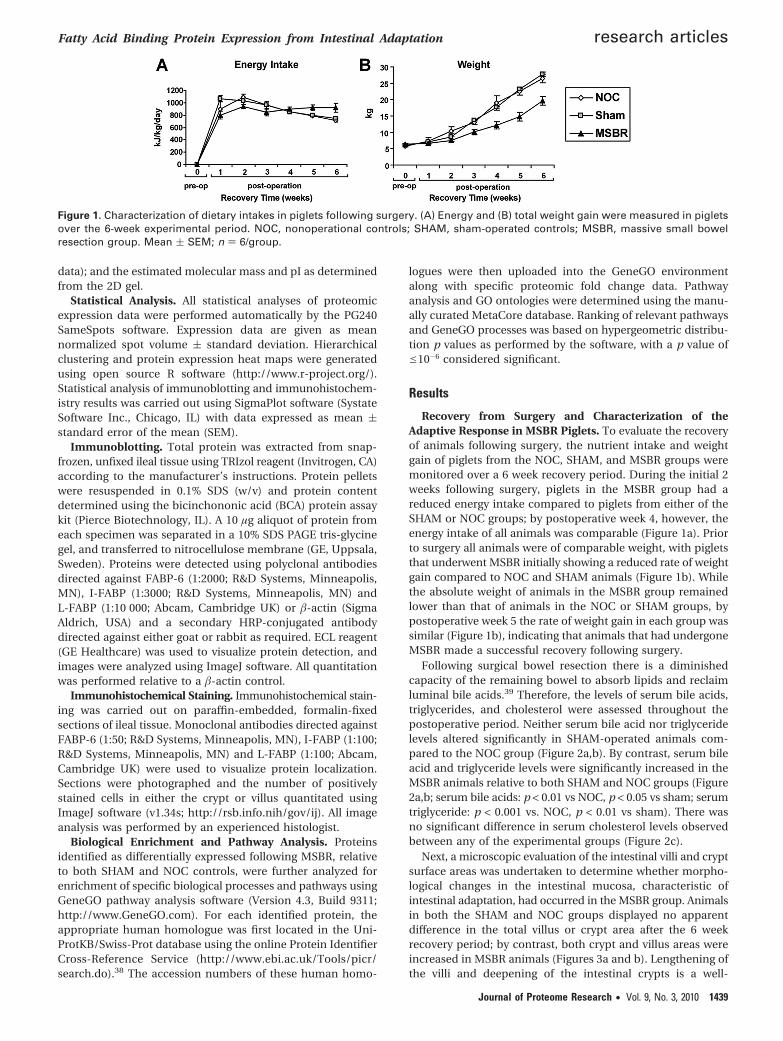
Recovery from Surgery and Characterization of theAdaptive Response in MSBR Piglets. To evaluate the recoveryof animals following surgery, the nutrient intake and weightgain of piglets from the NOC, SHAM, and MSBR groups weremonitored over a 6 week recovery period. During the initial 2weeks following surgery, piglets in the MSBR group had areduced energy intake compared to piglets from either of theSHAM or NOC groups; by postoperative week 4, however, theenergy intake of all animals was comparable (Figure 1a). Priorto surgery all animals were of comparable weight, with pigletsthat underwent MSBR initially showing a reduced rate of weightgain compared to NOC and SHAM animals (Figure 1b). Whilethe absolute weight of animals in the MSBR group remainedlower than that of animals in the NOC or SHAM groups, bypostoperative week 5 the rate of weight gain in each group wassimilar (Figure 1b), indicating that animals that had undergoneMSBR made a successful recovery following surgery.
Following surgical bowel resection there is a diminishedcapacity of the remaining bowel to absorb lipids and reclaimluminal bile acids.39 Therefore, the levels of serum bile acids,triglycerides, and cholesterol were assessed throughout thepostoperative period. Neither serum bile acid nor triglyceridelevels altered significantly in SHAM-operated animals com-pared to the NOC group (Figure 2a,b). By contrast, serum bileacid and triglyceride levels were significantly increased in theMSBR animals relative to both SHAM and NOC groups (Figure2a,b; serum bile acids: p < 0.01 vs NOC, p < 0.05 vs sham; serumtriglyceride: p < 0.001 vs. NOC, p < 0.01 vs sham). There wasno significant difference in serum cholesterol levels observedbetween any of the experimental groups (Figure 2c).
Next, a microscopic evaluation of the intestinal villi and cryptsurface areas was undertaken to determine whether morpho-logical changes in the intestinal mucosa, characteristic ofintestinal adaptation, had occurred in the MSBR group. Animalsin both the SHAM and NOC groups displayed no apparentdifference in the total villus or crypt area after the 6 weekrecovery period; by contrast, both crypt and villus areas wereincreased in MSBR animals (Figures 3a and b). Lengthening ofthe villi and deepening of the intestinal crypts is a well-
Figure 1. Characterization of dietary intakes in piglets following surgery. (A) Energy and (B) total weight gain were measured in pigletsover the 6-week experimental period. NOC, nonoperational controls; SHAM, sham-operated controls; MSBR, massive small bowelresection group. Mean ( SEM; n ) 6/group.
Fatty Acid Binding Protein Expression from Intestinal Adaptation research articles
Journal of Proteome Research • Vol. 9, No. 3, 2010 1439
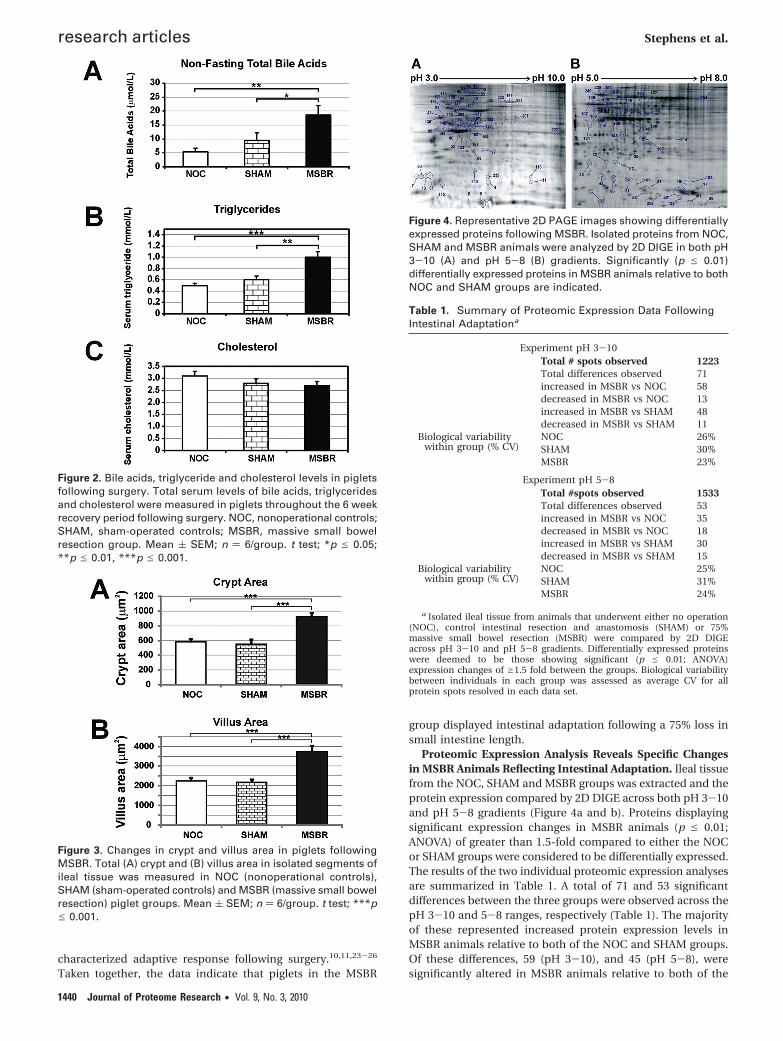
characterized adaptive response following surgery.10,11,23-26
Taken together, the data indicate that piglets in the MSBR
group displayed intestinal adaptation following a 75% loss insmall intestine length.
Proteomic Expression Analysis Reveals Specific Changesin MSBR Animals Reflecting Intestinal Adaptation. Ileal tissuefrom the NOC, SHAM and MSBR groups was extracted and theprotein expression compared by 2D DIGE across both pH 3-10and pH 5-8 gradients (Figure 4a and b). Proteins displayingsignificant expression changes in MSBR animals (p e 0.01;ANOVA) of greater than 1.5-fold compared to either the NOCor SHAM groups were considered to be differentially expressed.The results of the two individual proteomic expression analysesare summarized in Table 1. A total of 71 and 53 significantdifferences between the three groups were observed across thepH 3-10 and 5-8 ranges, respectively (Table 1). The majorityof these represented increased protein expression levels inMSBR animals relative to both of the NOC and SHAM groups.Of these differences, 59 (pH 3-10), and 45 (pH 5-8), weresignificantly altered in MSBR animals relative to both of the
Figure 2. Bile acids, triglyceride and cholesterol levels in pigletsfollowing surgery. Total serum levels of bile acids, triglyceridesand cholesterol were measured in piglets throughout the 6 weekrecovery period following surgery. NOC, nonoperational controls;SHAM, sham-operated controls; MSBR, massive small bowelresection group. Mean ( SEM; n ) 6/group. t test; *p e 0.05;**p e 0.01, ***p e 0.001.
Figure 3. Changes in crypt and villus area in piglets followingMSBR. Total (A) crypt and (B) villus area in isolated segments ofileal tissue was measured in NOC (nonoperational controls),SHAM (sham-operated controls) and MSBR (massive small bowelresection) piglet groups. Mean ( SEM; n ) 6/group. t test; ***pe 0.001.
Figure 4. Representative 2D PAGE images showing differentiallyexpressed proteins following MSBR. Isolated proteins from NOC,SHAM and MSBR animals were analyzed by 2D DIGE in both pH3-10 (A) and pH 5-8 (B) gradients. Significantly (p e 0.01)differentially expressed proteins in MSBR animals relative to bothNOC and SHAM groups are indicated.
Table 1. Summary of Proteomic Expression Data FollowingIntestinal Adaptationa
Experiment pH 3-10Total # spots observed 1223Total differences observed 71increased in MSBR vs NOC 58decreased in MSBR vs NOC 13increased in MSBR vs SHAM 48decreased in MSBR vs SHAM 11
Biological variabilitywithin group (% CV)
NOC 26%SHAM 30%MSBR 23%
Experiment pH 5-8Total #spots observed 1533Total differences observed 53increased in MSBR vs NOC 35decreased in MSBR vs NOC 18increased in MSBR vs SHAM 30decreased in MSBR vs SHAM 15
Biological variabilitywithin group (% CV)
NOC 25%SHAM 31%MSBR 24%
a Isolated ileal tissue from animals that underwent either no operation(NOC), control intestinal resection and anastomosis (SHAM) or 75%massive small bowel resection (MSBR) were compared by 2D DIGEacross pH 3-10 and pH 5-8 gradients. Differentially expressed proteinswere deemed to be those showing significant (p e 0.01; ANOVA)expression changes of g1.5 fold between the groups. Biological variabilitybetween individuals in each group was assessed as average CV for allprotein spots resolved in each data set.
research articles Stephens et al.
1440 Journal of Proteome Research • Vol. 9, No. 3, 2010
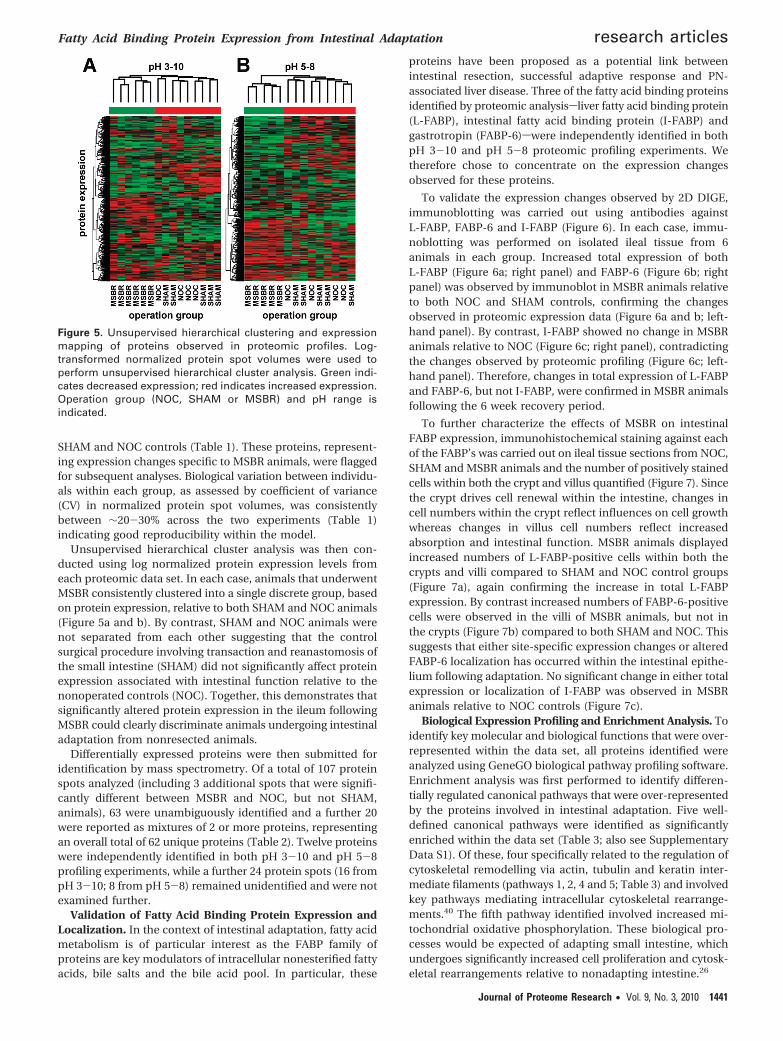
SHAM and NOC controls (Table 1). These proteins, represent-ing expression changes specific to MSBR animals, were flaggedfor subsequent analyses. Biological variation between individu-als within each group, as assessed by coefficient of variance(CV) in normalized protein spot volumes, was consistentlybetween ∼20-30% across the two experiments (Table 1)indicating good reproducibility within the model.
Unsupervised hierarchical cluster analysis was then con-ducted using log normalized protein expression levels fromeach proteomic data set. In each case, animals that underwentMSBR consistently clustered into a single discrete group, basedon protein expression, relative to both SHAM and NOC animals(Figure 5a and b). By contrast, SHAM and NOC animals werenot separated from each other suggesting that the controlsurgical procedure involving transaction and reanastomosis ofthe small intestine (SHAM) did not significantly affect proteinexpression associated with intestinal function relative to thenonoperated controls (NOC). Together, this demonstrates thatsignificantly altered protein expression in the ileum followingMSBR could clearly discriminate animals undergoing intestinaladaptation from nonresected animals.
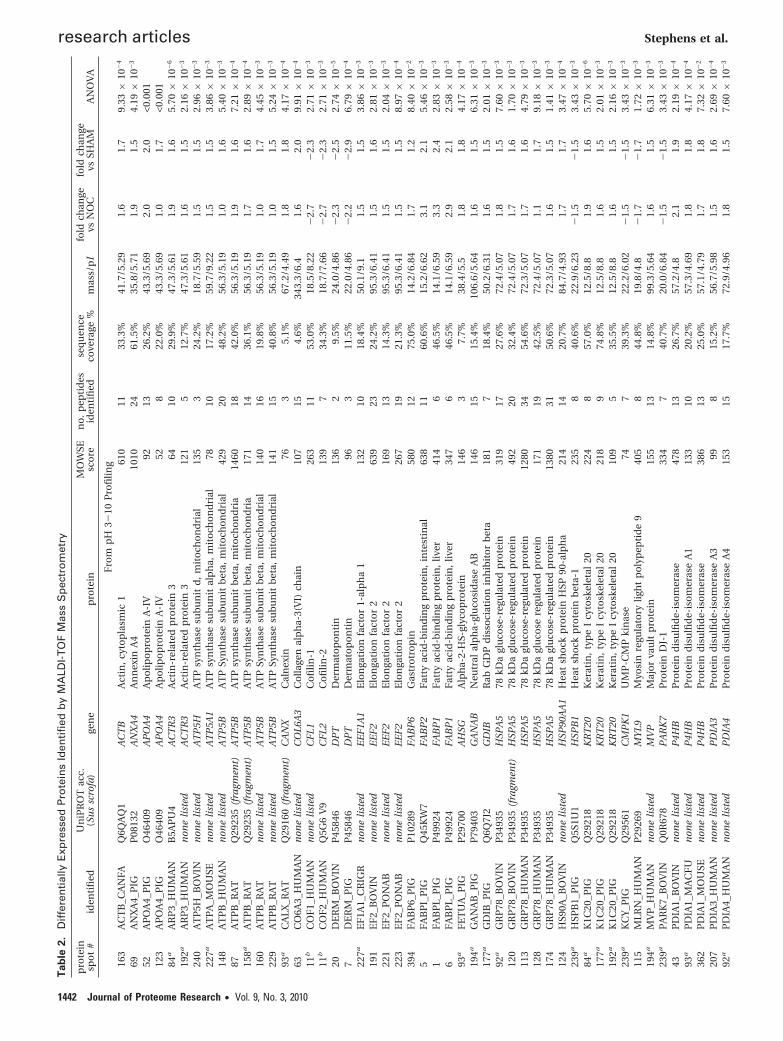
Differentially expressed proteins were then submitted foridentification by mass spectrometry. Of a total of 107 proteinspots analyzed (including 3 additional spots that were signifi-cantly different between MSBR and NOC, but not SHAM,animals), 63 were unambiguously identified and a further 20were reported as mixtures of 2 or more proteins, representingan overall total of 62 unique proteins (Table 2). Twelve proteinswere independently identified in both pH 3-10 and pH 5-8profiling experiments, while a further 24 protein spots (16 frompH 3-10; 8 from pH 5-8) remained unidentified and were notexamined further.
Validation of Fatty Acid Binding Protein Expression andLocalization. In the context of intestinal adaptation, fatty acidmetabolism is of particular interest as the FABP family ofproteins are key modulators of intracellular nonesterified fattyacids, bile salts and the bile acid pool. In particular, these
proteins have been proposed as a potential link betweenintestinal resection, successful adaptive response and PN-associated liver disease. Three of the fatty acid binding proteinsidentified by proteomic analysissliver fatty acid binding protein(L-FABP), intestinal fatty acid binding protein (I-FABP) andgastrotropin (FABP-6)swere independently identified in bothpH 3-10 and pH 5-8 proteomic profiling experiments. Wetherefore chose to concentrate on the expression changesobserved for these proteins.
To validate the expression changes observed by 2D DIGE,immunoblotting was carried out using antibodies againstL-FABP, FABP-6 and I-FABP (Figure 6). In each case, immu-noblotting was performed on isolated ileal tissue from 6animals in each group. Increased total expression of bothL-FABP (Figure 6a; right panel) and FABP-6 (Figure 6b; rightpanel) was observed by immunoblot in MSBR animals relativeto both NOC and SHAM controls, confirming the changesobserved in proteomic expression data (Figure 6a and b; left-hand panel). By contrast, I-FABP showed no change in MSBRanimals relative to NOC (Figure 6c; right panel), contradictingthe changes observed by proteomic profiling (Figure 6c; left-hand panel). Therefore, changes in total expression of L-FABPand FABP-6, but not I-FABP, were confirmed in MSBR animalsfollowing the 6 week recovery period.
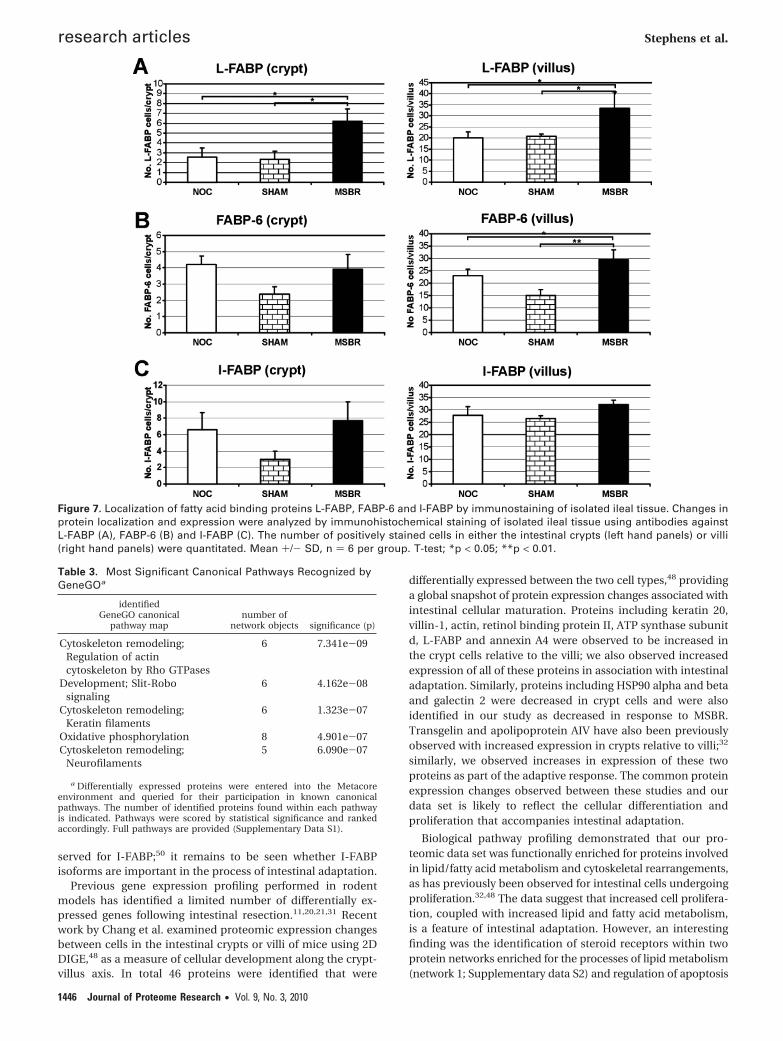
To further characterize the effects of MSBR on intestinalFABP expression, immunohistochemical staining against eachof the FABP’s was carried out on ileal tissue sections from NOC,SHAM and MSBR animals and the number of positively stainedcells within both the crypt and villus quantified (Figure 7). Sincethe crypt drives cell renewal within the intestine, changes incell numbers within the crypt reflect influences on cell growthwhereas changes in villus cell numbers reflect increasedabsorption and intestinal function. MSBR animals displayedincreased numbers of L-FABP-positive cells within both thecrypts and villi compared to SHAM and NOC control groups(Figure 7a), again confirming the increase in total L-FABPexpression. By contrast increased numbers of FABP-6-positivecells were observed in the villi of MSBR animals, but not inthe crypts (Figure 7b) compared to both SHAM and NOC. Thissuggests that either site-specific expression changes or alteredFABP-6 localization has occurred within the intestinal epithe-lium following adaptation. No significant change in either totalexpression or localization of I-FABP was observed in MSBRanimals relative to NOC controls (Figure 7c).
Biological Expression Profiling and Enrichment Analysis. Toidentify key molecular and biological functions that were over-represented within the data set, all proteins identified wereanalyzed using GeneGO biological pathway profiling software.Enrichment analysis was first performed to identify differen-tially regulated canonical pathways that were over-representedby the proteins involved in intestinal adaptation. Five well-defined canonical pathways were identified as significantlyenriched within the data set (Table 3; also see SupplementaryData S1). Of these, four specifically related to the regulation ofcytoskeletal remodelling via actin, tubulin and keratin inter-mediate filaments (pathways 1, 2, 4 and 5; Table 3) and involvedkey pathways mediating intracellular cytoskeletal rearrange-ments.40 The fifth pathway identified involved increased mi-tochondrial oxidative phosphorylation. These biological pro-cesses would be expected of adapting small intestine, whichundergoes significantly increased cell proliferation and cytosk-eletal rearrangements relative to nonadapting intestine.26
Figure 5. Unsupervised hierarchical clustering and expressionmapping of proteins observed in proteomic profiles. Log-transformed normalized protein spot volumes were used toperform unsupervised hierarchical cluster analysis. Green indi-cates decreased expression; red indicates increased expression.Operation group (NOC, SHAM or MSBR) and pH range isindicated.
Fatty Acid Binding Protein Expression from Intestinal Adaptation research articles
Journal of Proteome Research • Vol. 9, No. 3, 2010 1441
Tab
le2.
Dif
fere
nti
ally
Exp
ress
edP
rote
ins
Iden
tifi
edb
yM
ALD
I-T
OF
Mas
sS
pec
tro
met
ry
pro
tein
spo
t#
iden
tifi
edU
niP
RO
Tac
c.(S
us
scro
fa)
gen
ep
rote
inM
OW
SEsc
ore
no
.p
epti
des
iden
tifi
edse
qu
ence
cove
rage
%m
ass/
pI
fold
chan
gevs
NO
Cfo
ldch
ange
vsSH
AM
AN
OV
A
Fro
mp
H3-
10P
rofi
ling
163
AC
TB
_CA
NF
AQ
6QA
Q1
AC
TB
Act
in,
cyto
pla
smic
161
011
33.3
%41
.7/5
.29
1.6
1.7
9.33
×10
-4
69A
NX
A4_
PIG
P08
132
AN
XA
4A
nn
exin
A4
1010
2461
.5%
35.8
/5.7
11.
91.
54.
19×
10-
3
52A
PO
A4_
PIG
O46
409
AP
OA
4A
po
lipo
pro
tein
A-I
V92
1326
.2%
43.3
/5.6
92.
02.
0<0
.001
123
AP
OA
4_P
IGO
4640
9A
PO
A4
Ap
olip
op
rote
inA
-IV
528
22.0
%43
.3/5
.69
1.0
1.7
<0.0
0184
aA
RP
3_H
UM
AN
B5A
PU
4A
CT
R3
Act
in-r
elat
edp
rote
in3
6410
29.9
%47
.3/5
.61
1.9
1.6
5.70
×10
-6
192a
AR
P3_
HU
MA
Nn
one
list
edA
CT
R3
Act
in-r
elat
edp
rote
in3
121
512
.7%
47.3
/5.6
11.
61.
52.
16×
10-
3
240
AT
P5H
_BO
VIN
non
eli
sted
AT
P5H
AT
Psy
nth
ase
sub
un
itd
,m
ito
cho
nd
rial
135
324
.2%
18.7
/5.5
91.
51.
52.
96×
10-
3
227a
AT
PA
_MO
USE
non
eli
sted
AT
P5A
1A
TP
syn
thas
esu
bu
nit
alp
ha,
mit
och
on
dri
al78
1017
.2%
59.7
/9.2
21.
51.
53.
86×
10-
3
148
AT
PB
_HU
MA
Nn
one
list
edA
TP
5BA
TP
Syn
thas
esu
bu
nit
bet
a,m
ito
cho
nd
rial
429
2048
.2%
56.3
/5.1
91.
01.
65.
40×
10-
3
87A
TP
B_R
AT
Q29
235
(fra
gmen
t)A
TP
5BA
TP
syn
thas
esu
bu
nit
bet
a,m
ito
cho
nd
ria
1460
1842
.0%
56.3
/5.1
91.
91.
67.
21×
10-
4
158a
AT
PB
_RA
TQ
2923
5(f
ragm
ent)
AT
P5B
AT
Psy
nth
ase
sub
un
itb
eta,
mit
och
on
dri
a17
114
36.1
%56
.3/5
.19
1.7
1.6
2.89
×10
-4
160
AT
PB
_RA
Tn
one
list
edA
TP
5BA
TP
Syn
thas
esu
bu
nit
bet
a,m
ito
cho
nd
rial
140
1619
.8%
56.3
/5.1
91.
01.
74.
45×
10-
3
229
AT
PB
_RA
Tn
one
list
edA
TP
5BA
TP
Syn
thas
esu
bu
nit
bet
a,m
ito
cho
nd
rial
141
1540
.8%
56.3
/5.1
91.
01.
55.
24×
10-
3
93a
CA
LX_R
AT
Q29
160
(fra
gmen
t)C
AN
XC
aln
exin
763
5.1%
67.2
/4.4
91.
81.
84.
17×
10-
4
63C
O6A
3_H
UM
AN
non
eli
sted
CO
L6A
3C
olla
gen
alp
ha-
3(V
I)ch
ain
107
154.
6%34
3.3/
6.4
1.6
2.0
9.91
×10
-4
11b
CO
F1_
HU
MA
Nn
one
list
edC
FL1
Co
filin
-126
311
53.0
%18
.5/8
.22
-2.
7-
2.3
2.71
×10
-3
11b
CO
F2_
HU
MA
NQ
5G6
V9
CF
L2C
ofi
lin-2
139
734
.3%
18.7
/7.6
6-
2.7
-2.
32.
71×
10-
3
20D
ER
M_B
OV
INP
4584
6D
PT
Der
mat
op
on
tin
136
29.
5%24
.0/4
.86
-2.
3-
2.5
2.74
×10
-5
7D
ER
M_P
IGP
4584
6D
PT
Der
mat
op
on
tin
963
11.5
%22
.0/4
.86
-2.
2-
2.9
6.79
×10
-4
227a
EF
1A1_
CR
IGR
non
eli
sted
EE
F1A
1E
lon
gati
on
fact
or
1-al
ph
a1
132
1018
.4%
50.1
/9.1
1.5
1.5
3.86
×10
-3
191
EF
2_B
OV
INn
one
list
edE
EF
2E
lon
gati
on
fact
or
263
923
24.2
%95
.3/6
.41
1.5
1.6
2.81
×10
-3
221
EF
2_P
ON
AB
non
eli
sted
EE
F2
Elo
nga
tio
nfa
cto
r2
169
1314
.3%
95.3
/6.4
11.
51.
52.
04×
10-
3
223
EF
2_P
ON
AB
non
eli
sted
EE
F2
Elo
nga
tio
nfa
cto
r2
267
1921
.3%
95.3
/6.4
11.
51.
58.
97×
10-
4
394
FA
BP
6_P
IGP
1028
9F
AB
P6
Gas
tro
tro
pin
580
1275
.0%
14.2
/6.8
41.
71.
28.
40×
10-
2
5F
AB
PI_
PIG
Q45
KW
7F
AB
P2
Fat
tyac
id-b
ind
ing
pro
tein
,in
test
inal
638
1160
.6%
15.2
/6.6
23.
12.
15.
46×
10-
3
1F
AB
PL_
PIG
P49
924
FA
BP
1F
atty
acid
-bin
din
gp
rote
in,
liver
414
646
.5%
14.1
/6.5
93.
32.
42.
83×
10-
3
6F
AB
PL_
PIG
P49
924
FA
BP
1F
atty
acid
-bin
din
gp
rote
in,
liver
347
646
.5%
14.1
/6.5
92.
92.
12.
58×
10-
3
93a
FE
TU
A_P
IGP
2970
0A
HSG
Alp
ha-
2-H
S-gl
yco
pro
tein
146
37.
7%38
.4/5
.51.
81.
84.
17×
10-
4
194a
GA
NA
B_P
IGP
7940
3G
AN
AB
Neu
tral
alp
ha-
glu
cosi
das
eA
B14
615
15.4
%10
6.6/
5.64
1.6
1.5
6.31
×10
-3
177a
GD
IB_P
IGQ
6Q7J
2G
DIB
Rab
GD
Pd
isso
ciat
ion
inh
ibit
or
bet
a18
17
18.4
%50
.2/6
.31
1.6
1.5
2.01
×10
-3
92a
GR
P78
_BO
VIN
P34
935
HSP
A5
78kD
agl
uco
se-r
egu
late
dp
rote
in31
917
27.6
%72
.4/5
.07
1.8
1.5
7.60
×10
-3
120
GR
P78
_BO
VIN
P34
935
(fra
gmen
t)H
SPA
578
kDa
glu
cose
-reg
ula
ted
pro
tein
492
2032
.4%
72.4
/5.0
71.
71.
61.
70×
10-
3
113
GR
P78
_HU
MA
NP
3493
5H
SPA
578
kDa
glu
cose
-reg
ula
ted
pro
tein
1280
3454
.6%
72.3
/5.0
71.
71.
64.
79×
10-
3
128
GR
P78
_HU
MA
NP
3493
5H
SPA
578
kDa
glu
cose
regu
late
dp
rote
in17
119
42.5
%72
.4/5
.07
1.1
1.7
9.18
×10
-3
174
GR
P78
_HU
MA
NP
3493
5H
SPA
578
kDa
glu
cose
-reg
ula
ted
pro
tein
1380
3150
.6%
72.3
/5.0
71.
61.
51.
41×
10-
3
124
HS9
0A_B
OV
INn
one
list
edH
SP90
AA
1H
eat
sho
ckp
rote
inH
SP90
-alp
ha
214
1420
.7%
84.7
/4.9
31.
71.
73.
47×
10-
4
239a
HSP
B1_
PIG
Q5S
1U1
HSP
B1
Hea
tsh
ock
pro
tein
bet
a-1
235
840
.6%
22.9
/6.2
3-
1.5
-1.
53.
43×
10-
3
84a
K1C
20_P
IGQ
2921
8K
RT
20K
erat
in,
typ
eI
cyto
skel
etal
2022
48
57.0
%12
.5/8
.81.
91.
65.
70×
10-
6
177a
K1C
20_P
IGQ
2921
8K
RT
20K
erat
in,
typ
eI
cyto
skel
etal
2021
89
74.8
%12
.5/8
.81.
61.
52.
01×
10-
3
192a
K1C
20_P
IGQ
2921
8K
RT
20K
erat
in,
typ
eI
cyto
skel
etal
2010
95
35.5
%12
.5/8
.81.
61.
52.
16×
10-
3
239a
KC
Y_P
IGQ
2956
1C
MP
K1
UM
P-C
MP
kin
ase
747
39.3
%22
.2/6
.02
-1.
5-
1.5
3.43
×10
-3
115
MLR
N_H
UM
AN
P29
269
MY
L9M
yosi
nre
gula
tory
ligh
tp
oly
pep
tid
e9
405
844
.8%
19.8
/4.8
-1.
7-
1.7
1.72
×10
-3
194a
MV
P_H
UM
AN
non
eli
sted
MV
PM
ajo
rva
ult
pro
tein
155
1314
.8%
99.3
/5.6
41.
61.
56.
31×
10-
3
239a
PA
RK
7_B
OV
INQ
0R67
8P
AR
K7
Pro
tein
DJ-
133
47
40.7
%20
.0/6
.84
-1.
5-
1.5
3.43
×10
-3
43P
DIA
1_B
OV
INn
one
list
edP
4HB
Pro
tein
dis
ulfi
de-
iso
mer
ase
478
1326
.7%
57.2
/4.8
2.1
1.9
2.19
×10
-4
93a
PD
IA1_
MA
CF
Un
one
list
edP
4HB
Pro
tein
dis
ulfi
de-
iso
mer
ase
A1
133
1020
.2%
57.3
/4.6
91.
81.
84.
17×
10-
4
362
PD
IA1_
MO
USE
non
eli
sted
P4H
BP
rote
ind
isu
lfid
e-is
om
eras
e38
613
25.0
%57
.1/4
.79
1.7
1.8
7.32
×10
-2
207
PD
IA3_
HU
MA
Nn
one
list
edP
DIA
3P
rote
ind
isu
lfid
e-is
om
eras
eA
399
815
.2%
56.7
/5.9
81.
51.
62.
69×
10-
4
92a
PD
IA4_
HU
MA
Nn
one
list
edP
DIA
4P
rote
ind
isu
lfid
e-is
om
eras
eA
415
315
17.7
%72
.9/4
.96
1.8
1.5
7.60
×10
-3
research articles Stephens et al.
1442 Journal of Proteome Research • Vol. 9, No. 3, 2010

Tab
le2.
Co
nti
nu
ed
pro
tein
spo
t#
iden
tifi
edU
niP
RO
Tac
c.(S
us
scro
fa)
gen
ep
rote
inM
OW
SEsc
ore
no
.p
epti
des
iden
tifi
edse
qu
ence
cove
rage
%m
ass/
pI
fold
chan
gevs
NO
Cfo
ldch
ange
vsSH
AM
AN
OV
A
158a
PD
IA6_
PO
NA
Bn
one
list
edP
DIA
6P
rote
ind
isu
lfid
e-is
om
eras
eA
650
28
18.9
%48
.1/4
.88
1.7
1.6
2.89
×10
-4
116a
PE
BP
1_M
AC
FA
non
eli
sted
PE
BP
1P
ho
sph
atid
ylet
han
ola
min
e-b
ind
ing
pro
tein
135
94
26.7
%20
.9/7
.01
-1.
6-
1.7
4.77
×10
-3
70a
QC
R1_
HU
MA
Nn
one
list
edU
QC
RC
1C
yto
chro
me
b-c1
com
ple
xsu
bu
nit
1,m
ito
cho
nd
rial
803
4.4%
52.6
/5.9
41.
91.
65.
68×
10-
3
116a
RA
C2_
MO
USE
non
eli
sted
RA
C2
Ras
-rel
ated
C3
bo
tulin
um
toxi
nsu
bst
rate
272
314
.6%
21.4
/7.5
2-
1.6
-1.
74.
77×
10-
3
239a
RB
11A
_CA
NF
AQ
52N
J1R
AB
11A
Ras
-rel
ated
pro
tein
Rab
-11A
303
836
.1%
24.4
/6.1
2-
1.5
-1.
53.
43×
10-
3
4T
AG
L_B
OV
INn
one
list
edT
AG
LNT
ran
sgel
in61
116
58.2
%22
.6/8
.87
-3.
1-
2.5
7.50
×10
-5
70a
TB
A1C
_HU
MA
Nn
one
list
edT
UB
A1C
Tu
bu
linal
ph
a-1C
chai
n51
412
35.9
%49
.9/4
.96
1.9
1.6
5.68
×10
-3
217a
TC
PA
_CR
IGR
non
eli
sted
CC
T1
T-c
om
ple
xp
rote
in1
sub
un
ital
ph
a14
17
13.8
%60
.3/5
.71
1.5
1.5
4.14
×10
-4
217a
TC
PE
_MO
USE
non
eli
sted
CC
T5
T-c
om
ple
xp
rote
in1
sub
un
itep
silo
n17
310
13.9
%59
.6/5
.72
1.5
1.5
4.14
×10
-4
13T
CT
P_P
IGP
6128
8T
PT
1T
ran
slat
ion
ally
con
tro
lled
tum
or
pro
tein
7310
40%
19.7
/4.8
41.
2-
2.2
<0.0
0145
TE
RA
_HU
MA
NP
0397
4V
CP
Tra
nsi
tio
nal
end
op
lasm
icre
ticu
lum
AT
Pas
e15
515
15.0
%89
.3/5
.14
-1.
8-
2.1
9.74
×10
-3
177a
TX
ND
5_H
UM
AN
non
eli
sted
TX
ND
C5
Th
iore
do
xin
do
mai
n-c
on
tain
ing
pro
tein
511
07
12.0
%47
.6/5
.63
1.6
1.5
2.01
×10
-3
19V
ILI_
PIG
Q29
261
VIL
1V
illin
-1(f
ragm
ent)
742
16.8
%92
.7/5
.99
2.5
1.9
5.81
×10
-3
Fro
mp
H5-
8P
rofi
ling
167
AN
XA
4_P
IGP
0813
2A
NX
A4
An
nex
inA
444
725
%36
.0/5
.71
1.7
1.5
2.95
×10
-3
214
AN
XA
4_P
IGP
0813
2A
NX
A4
An
nex
inA
439
416
47.6
%35
.8/5
.71
1.6
1.5
1.30
×10
-2
104
AP
OA
4_P
IGO
4640
9A
PO
A4
Ap
olip
op
rote
inA
-IV
6815
35%
43.3
/5.6
92.
01.
81.
12×
10-
3
215
AT
PB
_HU
MA
Nn
one
list
edA
TP
5BA
TP
Syn
thas
esu
bu
nit
bet
a,m
ito
cho
nd
rial
107
1230
.2%
56.3
/5.1
91.
51.
62.
09×
10-
3
229a
AT
PB
_MO
USE
non
eli
sted
AT
P5B
AT
Psy
nth
ase
sub
un
itb
eta,
mit
och
on
dri
a39
713
33.1
%56
.3/5
.19
1.6
1.5
3.00
×10
-3
186
AT
PB
_RA
Tn
one
list
edA
TP
5BA
TP
Syn
thas
esu
bu
nit
bet
a,m
ito
cho
nd
rial
146
1438
.2%
56.3
/5.1
91.
51.
79.
39×
10-
4
107
CA
LR_P
IGP
2849
1C
ALR
Cal
reti
culin
481
960
.0%
11.9
/5.6
2.0
2.0
5.96
×10
-4
135a
CA
LR_P
IGP
2849
1C
ALR
Cal
reti
culin
192
853
.3%
12.0
/5.6
1.9
1.9
5.79
×10
-4
136
DE
SM_P
IGP
0254
0D
ES
Des
min
770
2759
.0%
53.6
/5.2
11.
91.
93.
66×
10-
3
140
DE
SM_P
IGP
0254
0D
ES
Des
min
1140
3066
.0%
53.6
/5.2
11.
91.
71.
23×
10-
2
166
DE
SM_P
IGP
0254
0D
ES
Des
min
694
2450
.5%
53.6
/5.2
11.
71.
73.
66×
10-
3
219
DE
SM_P
IGP
0254
0D
ES
Des
min
608
2343
.9%
53.6
/5.2
11.
61.
61.
10×
10-
2
229a
DE
SM_P
IGP
0254
0D
ES
Des
min
737
2343
.9%
53.6
/5.2
11.
61.
53.
00×
10-
3
229a
DE
SM_P
IGP
0254
0D
ES
Des
min
110
1324
.8%
53.6
/5.2
11.
61.
53.
00×
10-
3
264
EF
2_B
OV
INn
one
list
edE
EF
2E
lon
gati
on
fact
or
274
523
25.1
%95
.3/6
.41
1.5
1.5
1.45
×10
-2
169a
FA
BP
4_P
IGO
9778
8F
AB
P4
Fat
tyac
id-b
ind
ing
pro
tein
,ad
ipo
cyte
205
639
.4%
14.7
/6.2
9-
1.7
-1.
71.
49×
10-
2
17F
AB
P6_
PIG
P10
289
FA
BP
6G
astr
otr
op
in42
910
53.9
%14
.2/6
.84
3.2
2.4
2.57
×10
-3
41F
AB
PH
_PIG
O02
772
FA
BP
3F
atty
acid
-bin
din
gp
rote
in,
hea
rt43
17
42.1
%14
.7/6
.11
-2.
6-
2.5
3.12
×10
-4
169a
FA
BP
I_P
IGQ
45K
W7
FA
BP
2F
atty
acid
-bin
din
gp
rote
in,
inte
stin
al15
76
40.2
%15
.2/6
.62
-1.
7-
1.7
1.49
×10
-2
53F
AB
PL_
PIG
P49
924
FA
BP
1F
atty
acid
-bin
din
gp
rote
in,
liver
474
863
.8%
14.1
/6.5
92.
42.
02.
18×
10-
3
257
GR
P78
_BO
VIN
P34
935
HSP
A5
78kD
agl
uco
sere
gula
ted
pro
tein
7212
22.9
%72
.4/5
.07
1.5
1.5
1.74
×10
-3
261
GR
P78
_BO
VIN
P34
935
HSP
A5
78kD
agl
uco
sere
gula
ted
pro
tein
114
1428
.1%
72.4
/5.0
71.
51.
59.
04×
10-
3
238
GR
P78
_HU
MA
NP
3493
5H
SPA
578
kDa
glu
cose
regu
late
dp
rote
in68
1126
.9%
72.4
/5.0
71.
51.
52.
00×
10-
3
249
GR
P78
_HU
MA
NP
3493
5H
SPA
578
kDa
glu
cose
-reg
ula
ted
pro
tein
1460
3453
.8%
72.3
/5.0
71.
51.
58.
69×
10-
3
21H
2B1B
_MO
USE
non
eli
sted
His
t1h
2bb
His
ton
eH
2Bty
pe
1-B
278
958
.7%
13.9
/10.
313.
01.
52.
83×
10-
4
20H
4_H
UM
AN
P62
802
H4
His
ton
eH
490
438
.8%
11.4
/11.
363.
02.
13.
51×
10-
3
122a
H4_
HU
MA
NP
6280
2H
4H
isto
ne
H4
180
438
.8%
11.4
/11.
36-
1.9
-2.
09.
97×
10-
3
381
HB
B_P
IGP
0206
7H
BB
Hem
ogl
ob
insu
bu
nit
bet
a82
69
63.9
%16
.2/7
.12.
01.
46.
23×
10-
2
44IF
5A1_
HU
MA
Nn
one
list
edE
IF5A
Eu
kary
oti
ctr
ansl
atio
nin
itia
tio
nfa
cto
r5A
-121
56
39.0
%16
.8/5
.08
-2.
5-
2.5
1.24
×10
-2
35K
1C19
_BO
VIN
non
eli
sted
KR
T19
Ker
atin
,ty
pe
Icy
tosk
elet
al19
410
1326
.3%
43.9
/4.9
22.
72.
11.
00×
10-
2
95a
K1C
20_P
IGQ
2921
8K
RT
20K
erat
in,
typ
eI
cyto
skel
etal
2013
39
71.0
%12
.5/8
.82.
11.
98.
98×
10-
5
95a
K2C
8_B
OV
INn
one
list
edK
RT
8K
erat
in,
typ
eII
cyto
skel
etal
863
219
34.1
%53
.6/5
.62.
11.
98.
98×
10-
5
145
K2C
8_B
OV
INn
one
list
edK
RT
8K
erat
in,
typ
eII
cyto
skel
etal
873
821
32.4
%53
.6/5
.61.
81.
76.
21×
10-
3
157
K2C
8_B
OV
INn
one
list
edK
RT
8K
erat
in,
typ
eII
cyto
skel
etal
892
125
46.0
%53
.6/5
.61.
81.
55.
02×
10-
3
Fatty Acid Binding Protein Expression from Intestinal Adaptation research articles
Journal of Proteome Research • Vol. 9, No. 3, 2010 1443

Identified proteins were then used as core molecules togenerate biological networks, based on known molecularinteractions in the Metacore database. The five most signifi-cantly ranked networks are shown in Table 4 (also seeSupplementary Data S2). The two top-ranked networks identi-fied were highly enriched for processes involved in the regula-tion of lipid transport and metabolism,41 while the remainingthree were enriched for general processes of cell proliferationand growth and included central foci around p53 (Network 3;Supplementary Data S2) and the focal adhesion kinase FAK(network 5; Supplementary Data S2). These relationshipspresumably reflect the increased cell proliferation that char-acterizes the intestinal adaptation response.26 Taken together,the biological pathways identified suggest an important linkbetween fatty acid metabolism and regulation of cell growthin the adapting intestinal epithelium.
Discussion
In this study, we report the use of a proteomic approach toinvestigate the intestinal adaptation response in small intestinethat follows massive small bowel resection. Over 60 proteinswere identified by 2D DIGE profiling of ileal tissue from aporcine model, providing a comprehensive map of proteinexpression changes for subsequent studies of intestinal adapta-tion. Of particular interest were the observed expressionchanges in the fatty acid binding proteins, L-FABP, FABP-6 andI-FABP. These proteins are known to play important roles inthe modulation of nonesterified fatty acid concentration;indeed, we observed a significant increase in triglyceride andbile acid levels observed following MSBR, and also identifiedlipid metabolism via pathway analysis as significantly over-represented by proteins within our data set. We subsequentlychose to concentrate on the three identified fatty acid bindingproteins (L-FABP, FABP6 and I-FABP) in the context of intes-tinal adaptation.
L-FABP expression increased in MSBR animals postsurgery,and was paralleled by an increase in villus surface area andthe number of L-FABP positive cells within the crypts and villi.As the cells within the crypt are known to drive villus renewalthis may be suggestive of a coordinated relationship betweenL-FABP expression and villus expansion. L-FABP expression haspreviously been shown to be associated with the enterocyteslocated along the duodenal-to-ileal axis of the gut.42 Prolifera-tion leading to expansion of the villi surface area is a wellcharacterized adaptive response; therefore, L-FABP may provea useful marker of increasing villus surface area duringadaptation.
Total FABP-6 protein expression was also increased post-surgery in MSBR animals, concurrent with an increase in thenumber of positively stained cells in the villi. Interestingly, anearly increase in FABP-6 protein levels at 2 weeks postsurgery(see Supplementary Data Figure SF1) occurred concomitantwith increased crypt area, while immunohistochemistry studiesrevealed a significant increase in the number of FABP-6 stainedcells within the villus by week 6. The significance of thisdiscovery may be 2-fold. In the first instance, FABP-6 has beenshown in other model systems to act as a mediator of cellgrowth with the induction of FABP-6 within the crypts of infantmice followed by expression of FABP-6 within the villus.43
FABP-6 may therefore be involved in modulation of themorphological changes commonly associated with the adapta-tion response, such as increased villus height. Second theconcurrent increase in FABP-6 protein expression and serumT
ab
le2.
Co
nti
nu
ed
pro
tein
spo
t#
iden
tifi
edU
niP
RO
Tac
c.(S
us
scro
fa)
gen
ep
rote
inM
OW
SEsc
ore
no
.p
epti
des
iden
tifi
edse
qu
ence
cove
rage
%m
ass/
pI
fold
chan
gevs
NO
Cfo
ldch
ange
vsSH
AM
AN
OV
A
168a
K2C
8_B
OV
INn
one
list
edK
RT
8K
erat
in,
typ
eII
cyto
skel
etal
871
325
45.8
%53
.6/5
.61.
71.
64.
32×
10-
4
122a
LEG
1_P
IGQ
49I3
5LG
ALS
1G
alec
tin
-122
94
29.6
%14
.7/4
.99
-1.
9-
2.0
9.97
×10
-3
10LE
G2_
PIG
Q29
373
LGA
LS2
Gal
ecti
n-2
205
426
.0%
13.8
/6.9
3.6
2.8
2.04
×10
-3
33a
MLR
M_P
ON
AB
non
eli
sted
MY
L12A
Myo
sin
regu
lato
rylig
ht
chai
n12
A24
77
44.4
%19
.8/4
.67
-2.
7-
2.2
1.74
×10
-3
33a
MLR
N_P
IGP
2926
9M
YL9
Myo
sin
regu
lato
rylig
ht
po
lyp
epti
de
945
78
44.8
%19
.7/4
.8-
2.7
-2.
21.
74×
10-
3
135a
PD
IA1_
BO
VIN
non
eli
sted
P4H
BP
rote
ind
isu
lfid
e-is
om
eras
e40
912
23.9
%57
.2/4
.81.
91.
95.
79×
10-
4
96R
ET
2_P
IGP
5012
1R
BP
2R
etin
ol-
bin
din
gp
rote
in2
232
745
.5%
15.6
/5.1
12.
11.
55.
15×
10-
4
148
SFR
S1_H
UM
AN
Q3Y
LA6
SFR
S1Sp
lici
ng
fact
or,
argi
nin
e/se
rin
e-ri
ch1
244
1029
.4%
27.7
/10.
37-
1.8
-1.
65.
61×
10-
3
72SO
RC
N_P
ON
AB
non
eli
sted
SRI
Sorc
in21
07
33.8
%21
.7/5
.32
-1.
8-
2.3
4.57
×10
-3
168a
TB
A1C
_CR
IGR
non
eli
sted
TU
BA
1CT
ub
ulin
alp
ha-
1Cch
ain
151
613
.1%
49.9
/4.9
61.
71.
64.
32×
10-
4
131
TP
M3_
PIG
A1X
QV
4T
PM
3T
rop
om
yosi
nal
ph
a-3
chai
n34
19
22.2
%33
.0/4
.73
-1.
9-
1.7
7.19
×10
-3
183
UB
E2N
_HU
MA
Nn
one
list
edU
BE
2NU
biq
uit
in-c
on
juga
tin
gen
zym
eE
2N
222
736
.2%
17.1
/6.2
3-
1.5
-1.
71.
49×
10-
2
aD
eno
tes
spo
tsid
enti
fied
asco
nta
inin
ga
mix
ture
of
2o
rm
ore
pro
tein
s.b
Den
ote
sa
spo
tw
her
eu
nam
big
uo
us
assi
gnm
ent
of
ap
arti
cula
rp
rote
inis
ofo
rmis
no
tp
oss
ible
.
research articles Stephens et al.
1444 Journal of Proteome Research • Vol. 9, No. 3, 2010
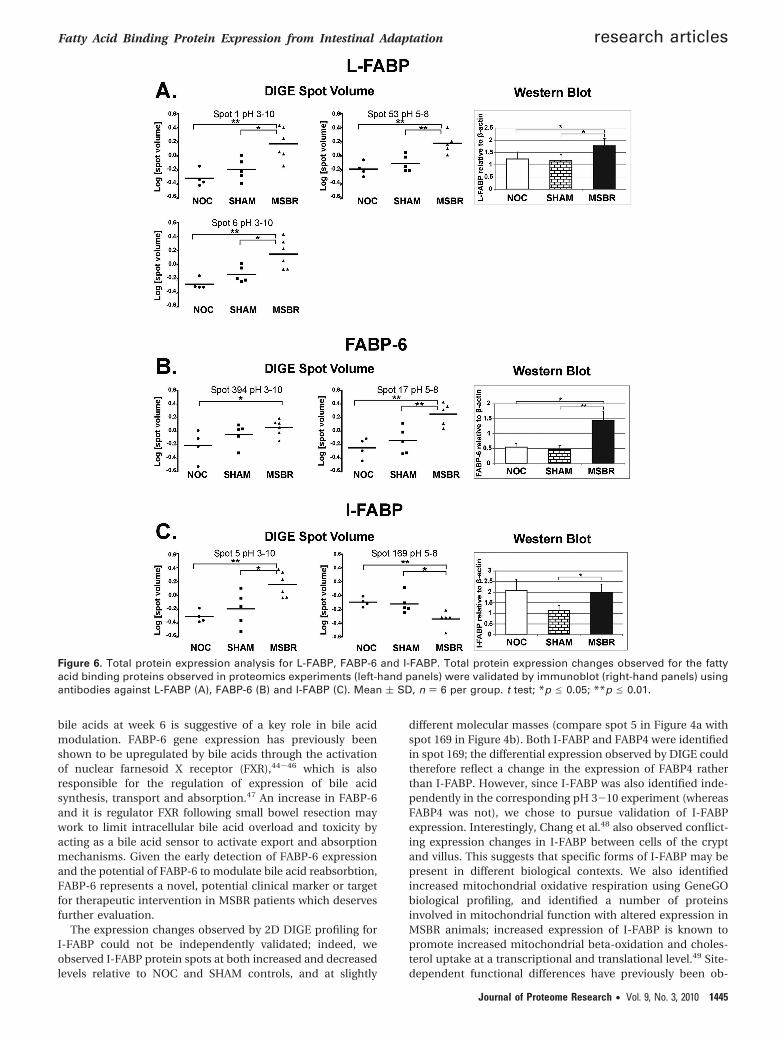
bile acids at week 6 is suggestive of a key role in bile acidmodulation. FABP-6 gene expression has previously beenshown to be upregulated by bile acids through the activationof nuclear farnesoid X receptor (FXR),44-46 which is alsoresponsible for the regulation of expression of bile acidsynthesis, transport and absorption.47 An increase in FABP-6and it is regulator FXR following small bowel resection maywork to limit intracellular bile acid overload and toxicity byacting as a bile acid sensor to activate export and absorptionmechanisms. Given the early detection of FABP-6 expressionand the potential of FABP-6 to modulate bile acid reabsorbtion,FABP-6 represents a novel, potential clinical marker or targetfor therapeutic intervention in MSBR patients which deservesfurther evaluation.
The expression changes observed by 2D DIGE profiling forI-FABP could not be independently validated; indeed, weobserved I-FABP protein spots at both increased and decreasedlevels relative to NOC and SHAM controls, and at slightly
different molecular masses (compare spot 5 in Figure 4a withspot 169 in Figure 4b). Both I-FABP and FABP4 were identifiedin spot 169; the differential expression observed by DIGE couldtherefore reflect a change in the expression of FABP4 ratherthan I-FABP. However, since I-FABP was also identified inde-pendently in the corresponding pH 3-10 experiment (whereasFABP4 was not), we chose to pursue validation of I-FABPexpression. Interestingly, Chang et al.48 also observed conflict-ing expression changes in I-FABP between cells of the cryptand villus. This suggests that specific forms of I-FABP may bepresent in different biological contexts. We also identifiedincreased mitochondrial oxidative respiration using GeneGObiological profiling, and identified a number of proteinsinvolved in mitochondrial function with altered expression inMSBR animals; increased expression of I-FABP is known topromote increased mitochondrial beta-oxidation and choles-terol uptake at a transcriptional and translational level.49 Site-dependent functional differences have previously been ob-
Figure 6. Total protein expression analysis for L-FABP, FABP-6 and I-FABP. Total protein expression changes observed for the fattyacid binding proteins observed in proteomics experiments (left-hand panels) were validated by immunoblot (right-hand panels) usingantibodies against L-FABP (A), FABP-6 (B) and I-FABP (C). Mean ( SD, n ) 6 per group. t test; *p e 0.05; **p e 0.01.
Fatty Acid Binding Protein Expression from Intestinal Adaptation research articles
Journal of Proteome Research • Vol. 9, No. 3, 2010 1445
served for I-FABP;50 it remains to be seen whether I-FABPisoforms are important in the process of intestinal adaptation.
Previous gene expression profiling performed in rodentmodels has identified a limited number of differentially ex-pressed genes following intestinal resection.11,20,21,31 Recentwork by Chang et al. examined proteomic expression changesbetween cells in the intestinal crypts or villi of mice using 2DDIGE,48 as a measure of cellular development along the crypt-villus axis. In total 46 proteins were identified that were
differentially expressed between the two cell types,48 providinga global snapshot of protein expression changes associated withintestinal cellular maturation. Proteins including keratin 20,villin-1, actin, retinol binding protein II, ATP synthase subunitd, L-FABP and annexin A4 were observed to be increased inthe crypt cells relative to the villi; we also observed increasedexpression of all of these proteins in association with intestinaladaptation. Similarly, proteins including HSP90 alpha and betaand galectin 2 were decreased in crypt cells and were alsoidentified in our study as decreased in response to MSBR.Transgelin and apolipoprotein AIV have also been previouslyobserved with increased expression in crypts relative to villi;32
similarly, we observed increases in expression of these twoproteins as part of the adaptive response. The common proteinexpression changes observed between these studies and ourdata set is likely to reflect the cellular differentiation andproliferation that accompanies intestinal adaptation.
Biological pathway profiling demonstrated that our pro-teomic data set was functionally enriched for proteins involvedin lipid/fatty acid metabolism and cytoskeletal rearrangements,as has previously been observed for intestinal cells undergoingproliferation.32,48 The data suggest that increased cell prolifera-tion, coupled with increased lipid and fatty acid metabolism,is a feature of intestinal adaptation. However, an interestingfinding was the identification of steroid receptors within twoprotein networks enriched for the processes of lipid metabolism(network 1; Supplementary data S2) and regulation of apoptosis
Figure 7. Localization of fatty acid binding proteins L-FABP, FABP-6 and I-FABP by immunostaining of isolated ileal tissue. Changes inprotein localization and expression were analyzed by immunohistochemical staining of isolated ileal tissue using antibodies againstL-FABP (A), FABP-6 (B) and I-FABP (C). The number of positively stained cells in either the intestinal crypts (left hand panels) or villi(right hand panels) were quantitated. Mean +/- SD, n ) 6 per group. T-test; *p < 0.05; **p < 0.01.
Table 3. Most Significant Canonical Pathways Recognized byGeneGOa
identifiedGeneGO canonical
pathway mapnumber of
network objects significance (p)
Cytoskeleton remodeling;Regulation of actincytoskeleton by Rho GTPases
6 7.341e-09
Development; Slit-Robosignaling
6 4.162e-08
Cytoskeleton remodeling;Keratin filaments
6 1.323e-07
Oxidative phosphorylation 8 4.901e-07Cytoskeleton remodeling;
Neurofilaments5 6.090e-07
a Differentially expressed proteins were entered into the Metacoreenvironment and queried for their participation in known canonicalpathways. The number of identified proteins found within each pathwayis indicated. Pathways were scored by statistical significance and rankedaccordingly. Full pathways are provided (Supplementary Data S1).
research articles Stephens et al.
1446 Journal of Proteome Research • Vol. 9, No. 3, 2010

(Network 4; Supplementary data S2) and containing commonfatty acid binding proteins. Previous evidence has suggestedthat the expression of I-FABP may be controlled in a tissue-specific and hormonally regulated manner.51 Androgen deple-tion has also been shown to inhibit intestinal adaptationfollowing MSBR, with testosterone stimulating intestinalgrowth;52 in addition, FABP-6 possesses an estrogen receptorbinding site.53 Both the androgen and estrogen-1 receptorswere predicted to be focal elements within the enriched proteinnetworks. In addition we identified the protein DJ-1 (PARK7)at decreased expression levels in MSBR animals. DJ-1 acts as aregulator of androgen receptor-dependent transcription andas a sensor of oxidative stress,54,55 suggesting an intimate linkbetween steroid metabolism, the cellular proliferation and lipidmetabolism in adapting intestine.
Conclusion
Treatment of short bowel syndrome, arising from eithercongenital defect or massive small bowel resection, continuesto present a clinical challenge in terms of patient management,long-term prognosis and economic cost. This is the first studyto apply proteomic methods to examine the intestinal adapta-tion process, necessary for patients to achieve good long-termprognosis after significant loss of intestinal surface area. Theidentification and characterization of intestinally expressedfatty acid binding proteins in the present study is promisingand provides new insight into mechanisms associated withintestinal adaptation. Whether similar expression changesassociated with these proteins can be detected in biologicalsamples such as blood, faeces or bile secretions remains to bedetermined; if successful, these may be useful in the searchfor a dynamic, clinically valuable marker of the adaptiveresponse following MSBR.
Acknowledgment. Dr. Andrew Stephens is supportedby an Ovarian Cancer Research Foundation fellowship. DrPrue Pereira-Fantini is supported on a grant provided by theMurdoch Children’s Research Institute. Professor PeterFuller and Associate Professor David Robertson are
supported by career fellowships from the National Healthand Medical Research Council of Australia.
Supporting Information Available: SupplementaryFigure SF1 showing data for changes in villus area, crypt area,and protein expression over time; supplementary data sectionsS1 and S2 showing biological pathway profiling data; supple-mentary data section S3 showing matched peptides and MSspectra for each identified protein. This material is availablefree of charge via the Internet at http://pubs.acs.org.
References(1) Buchman, A. L. Etiology and initial management of short bowel
syndrome. Gastroenterology 2006, 130 (2 Suppl 1), S5–15.(2) Duro, D.; Kamin, D.; Duggan, C. Overview of pediatric short
bowel syndrome. J. Pediatr. Gastroenterol. Nutr. 2008, 47 (Suppl1), S33–6.
(3) Pereira, P. M.; Bines, J. E. New growth factor therapies aimed atimproving intestinal adaptation in short bowel syndrome. J.Gastroenterol. Hepatol. 2006, 21 (6), 932–40.
(4) Cole, C. R.; Hansen, N. I.; Higgins, R. D.; Ziegler, T. R.; Stoll, B. J.Very low birth weight preterm infants with surgical short bowelsyndrome: incidence, morbidity and mortality, and growth out-comes at 18 to 22 months. Pediatrics 2008, 122 (3), e573-82.
(5) Goulet, O.; Baglin-Gobet, S.; Talbotec, C.; Fourcade, L.; Colomb,V.; Sauvat, F.; Jais, J. P.; Michel, J. L.; Jan, D.; Ricour, C. Outcomeand long-term growth after extensive small bowel resection in theneonatal period: a survey of 87 children. Eur. J. Pediatr. Surg. 2005,15 (2), 95–101.
(6) Goulet, O.; Ruemmele, F.; Lacaille, F.; Colomb, V. Irreversibleintestinal failure. J. Pediatr. Gastroenterol. Nutr. 2004, 38 (3), 250–69.
(7) Quiros-Tejeira, R. E.; Ament, M. E.; Reyen, L.; Herzog, F.; Merja-nian, M.; Olivares-Serrano, N.; Vargas, J. H. Long-term parenteralnutritional support and intestinal adaptation in children with shortbowel syndrome: a 25-year experience. J. Pediatr. 2004, 145 (2),157–63.
(8) Sondheimer, J. M.; Cadnapaphornchai, M.; Sontag, M.; Zerbe, G. O.Predicting the duration of dependence on parenteral nutrition afterneonatal intestinal resection. J. Pediatr. 1998, 132 (1), 80–4.
(9) Wallander, J.; Ewald, U.; Lackgren, G.; Tufveson, G.; Wahlberg, J.;Meurling, S. Extreme short bowel syndrome in neonates: anindication for small bowel transplantation. Transplant Proc. 1992,24 (3), 1230–5.
(10) Welters, C. F.; Dejong, C. H.; Deutz, N. E.; Heineman, E. Intestinaladaptation in short bowel syndrome. ANZ J. Surg. 2002, 72 (3),229–36.
Table 4. Top 5 Significant Protein Networks Predicted by GeneGOa
networkranking GO processes key network objects
totalnodes
rootnodes pathways p-value z-score
1 lipid transport (27.3%), lipoprotein particleclearance (15.9%), lipoprotein catabolicprocess (13.6%), cholesterol homeostasis(15.9%), sterol homeostasis (15.9%)
Fatty acid-binding protein,Actin cytoskeletal, DJ-1,Fetuin-A, Transgelin
50 13 0 6.56e-26 45.52
2 small GTPase mediated signal transduction(18.6%), intracellular signaling cascade(34.9%), localization (53.5%), negativeregulation of biological process (39.5%),mitotic spindle organization (7.0%)
GDI2, eEF1A1, Calnexin,Actin, ACTB
50 12 0 2.14e-23 41.56
3 T cell activation (20.0%), lymphocyte activation(22.2%), leukocyte activation (22.2%),multiorganism process (31.1%), regulation ofresponse to stimulus (24.4%)
PDIA3, Calnexin, GRP78,HSP70, Keratin 8
50 12 0 2.81e-23 41.14
4 negative regulation of apoptosis (34.6%),negative regulation of programmed cell death(34.6%), steroid metabolic process (26.9%),response to chemical stimulus (57.7%),cholesterol transport (15.4%)
Gastrotropin, HDL,L-FABP, HSP27, Keratin8/18
50 9 4 7.56e-17 32.11
5 anatomical structure formation (62.5%), cellularcomponent assembly (56.2%), cellularcomponent biogenesis (56.2%), cytoskeletonorganization (35.4%), cellular componentorganization (64.6%)
Actin cytoskeletal, DJ-1,TCP1, Arp2/3, SFRS1(SF2)
50 9 14 1.71e-16 30.78
a Differentially expressed proteins were entered into the Metacore environment and analyzed biological networks generated using the “AnalyzeNetworks” (AN) algorithm. Networks were scored by statistical significance and ranked accordingly. Full networks are provided (Supplementary Data S2).
Fatty Acid Binding Protein Expression from Intestinal Adaptation research articles
Journal of Proteome Research • Vol. 9, No. 3, 2010 1447
(11) Stern, L. E.; Erwin, C. R.; Falcone, R. A.; Huang, F. S.; Kemp,C. J.; Williams, J. L.; Warner, B. W. cDNA microarray analysisof adapting bowel after intestinal resection. J. Pediatr. Surg.2001, 36 (1), 190–5.
(12) Colomb, V.; Fabeiro, M.; Dabbas, M.; Goulet, O.; Merckx, J.; Ricour,C. Central venous catheter-related infections in children on long-term home parenteral nutrition: incidence and risk factors. Clin.Nutr. 2000, 19 (5), 355–9.
(13) Andorsky, D. J.; Lund, D. P.; Lillehei, C. W.; Jaksic, T.; Dicanzio, J.;Richardson, D. S.; Collier, S. B.; Lo, C.; Duggan, C. Nutritional andother postoperative management of neonates with short bowelsyndrome correlates with clinical outcomes. J. Pediatr. 2001, 139(1), 27–33.
(14) Sudan, D. Cost and quality of life after intestinal transplantation.Gastroenterology 2006, 130 (2 Suppl 1), S158–62.
(15) Abu-Elmagd, K. M. Intestinal transplantation for short bowelsyndrome and gastrointestinal failure: current consensus, reward-ing outcomes, and practical guidelines. Gastroenterology 2006, 130(2 Suppl 1), S132–7.
(16) Ruiz, P.; Kato, T.; Tzakis, A. Current status of transplantation ofthe small intestine. Transplantation 2007, 83 (1), 1–6.
(17) Goulet, O.; Ruemmele, F. Causes and management of intestinalfailure in children. Gastroenterology 2006, 130 (2 Suppl 1), S16–28.
(18) Goulet, O.; Sauvat, F. Short bowel syndrome and intestinaltransplantation in children. Curr. Opin. Clin. Nutr. Metab. Care2006, 9 (3), 304–13.
(19) Vianna, R. M.; Mangus, R. S.; Tector, A. J. Current status of smallbowel and multivisceral transplantation. Adv. Surg. 2008, 42, 129–50.
(20) Otterburn, D. M.; Arthur, L. G.; Timmapuri, S. J.; McCahan, S. M.;Schwartz, M. Z. Proteasome gene upregulation: a possible mech-anism for intestinal adaptation. J. Pediatr. Surg. 2005, 40 (2), 377–80.
(21) Erwin, C. R.; Falcone, R. A., Jr.; Stern, L. E.; Kemp, C. J.; Warner,B. W. Analysis of intestinal adaptation gene expression by cDNAexpression arrays. JPEN J. Parenter. Enteral. Nutr. 2000, 24 (6),311–6.
(22) Marshman, E.; Booth, C.; Potten, C. S. The intestinal epithelial stemcell. Bioessays 2002, 24 (1), 91–8.
(23) Williamson, R. C. Intestinal adaptation (first of two parts). Struc-tural, functional and cytokinetic changes. N. Engl. J. Med. 1978,298 (25), 1393–402.
(24) Williamson, R. C. Intestinal adaptation (second of two parts).Mechanisms of control. N. Engl. J. Med. 1978, 298 (26), 1444–50.
(25) Falcone, R. A., Jr.; Shin, C. E.; Stern, L. E.; Wang, Z.; Erwin, C. R.;Soleimani, M.; Warner, B. W. Differential expression of ileal Na(+)/H(+) exchanger isoforms after enterectomy. J. Surg. Res. 1999, 86(2), 192–7.
(26) Helmrath, M. A.; VanderKolk, W. E.; Can, G.; Erwin, C. R.; Warner,B. W. Intestinal adaptation following massive small bowel resectionin the mouse. J. Am. Coll. Surg. 1996, 183 (5), 441–9.
(27) Kaufman, S. S.; Vanderhoof, J. A.; Young, R.; Perry, D.; Raynor,S. C.; Mack, D. R. Gastroenteric inflammation in children withulcerative colitis. Am. J. Gastroenterol. 1997, 92 (7), 1209–12.
(28) Modi, B. P.; Langer, M.; Ching, Y. A.; Valim, C.; Waterford, S. D.;Iglesias, J.; Duro, D.; Lo, C.; Jaksic, T.; Duggan, C. Improved survivalin a multidisciplinary short bowel syndrome program. J. Pediatr.Surg. 2008, 43 (1), 20–4.
(29) Haxhija, E. Q.; Yang, H.; Spencer, A. U.; Sun, X.; Teitelbaum, D. H.Intestinal epithelial cell proliferation is dependent on the site ofmassive small bowel resection. Pediatr. Surg. Int. 2007, 23 (5), 379–90.
(30) Sukhotnik, I.; Siplovich, L.; Krausz, M. M.; Shiloni, E. Peptidegrowth factors and intestinal adaptation in short bowel syndrome.Isr. Med. Assoc. J. 2003, 5 (3), 184–7.
(31) Erwin, C. R.; Jarboe, M. D.; Sartor, M. A.; Medvedovic, M.; Stringer,K. F.; Warner, B. W.; Bates, M. D. Developmental characteristicsof adapting mouse small intestine crypt cells. Gastroenterology2006, 130 (4), 1324–32.
(32) Mariadason, J. M.; Nicholas, C.; L’Italien, K. E.; Zhuang, M.; Smartt,H. J.; Heerdt, B. G.; Yang, W.; Corner, G. A.; Wilson, A. J.; Klampfer,L.; Arango, D.; Augenlicht, L. H. Gene expression profiling ofintestinal epithelial cell maturation along the crypt-villus axis.Gastroenterology 2005, 128 (4), 1081–8.
(33) Pereira-Fantini, P. M.; Nagy, E. S.; Thomas, S. L.; Taylor, R. G.;Sourial, M.; Paris, M. C.; Holst, J. J.; Fuller, P. J.; Bines, J. E. GLP-2administration results in increased proliferation but paradoxicallyan adverse outcome in a juvenile piglet model of short bowelsyndrome. J. Pediatr. Gastroenterol. Nutr. 2008, 46 (1), 20–8.
(34) Nagy, E. S.; Paris, M. C.; Taylor, R. G.; Fuller, P. J.; Sourial, M.;Justice, F.; Bines, J. E. Colostrum protein concentrate enhancesintestinal adaptation after massive small bowel resection injuvenile pigs. J. Pediatr. Gastroenterol. Nutr. 2004, 39 (5), 487–92.
(35) Paris, M. C.; Fuller, P. J.; Carstensen, B.; Nagy, E.; Taylor, R. G.;Sourial, M.; Holst, J. J.; Hartmann, B.; Binesm, J. E. Plasma GLP-2levels and intestinal markers in the juvenile pig during intestinaladaptation: effects of different diet regimens. Dig. Dis. Sci. 2004,49 (10), 1688–95.
(36) Pereira-Fantini, P. M.; Thomas, S. L.; Taylor, R. G.; Nagy, E.; Sourial,M.; Fuller, P. J.; Bines, J. E. Colostrum supplementation restoresinsulin-like growth factor-1 levels and alters muscle morphologyfollowing massive small bowel resection. JPEN J. Parenter. Enteral.Nutr. 2008, 32 (3), 266–75.
(37) Chen, J.; Hannan, N.; Mak, Y.; Nicholls, P.; Zhang, J.; Rainczuk,A.; Stanton, P.; Robertson, D.; Salamonsen, L.; Stephens, A.Proteomic Characterization of Mid-Proliferative and Mid-SecretoryHuman Endometrium. J. Proteome Res. 2009, 8, 2032–44.
(38) Cote, R. G.; Jones, P.; Martens, L.; Kerrien, S.; Reisinger, F.; Lin,Q.; Leinonen, R.; Apweiler, R.; Hermjakob, H. The Protein IdentifierCross-Referencing (PICR) service: reconciling protein identifiersacross multiple source databases. BMC Bioinformatics 2007, 8, 401.
(39) Alrefai, W. A.; Gill, R. K. Bile acid transporters: structure, function,regulation and pathophysiological implications. Pharm. Res. 2007,24 (10), 1803–23.
(40) Wong, K.; Ren, X. R.; Huang, Y. Z.; Xie, Y.; Liu, G.; Saito, H.; Tang,H.; Wen, L.; Brady-Kalnay, S. M.; Mei, L.; Wu, J. Y.; Xiong, W. C.;Rao, Y. Signal transduction in neuronal migration: roles of GTPaseactivating proteins and the small GTPase Cdc42 in the Slit-Robopathway. Cell 2001, 107 (2), 209–21.
(41) Wang, X. X.; Jiang, T.; Shen, Y.; Adorini, L.; Pruzanski, M.; Gonzalez,F. J.; Scherzer, P.; Lewis, L.; Miyazaki-Anzai, S.; Levi, M. FarnesoidX Receptor Modulates Renal Lipid Metabolism and Diet-InducedRenal Inflammation, Fibrosis, and Proteinuria. Am. J. Physiol. RenalPhysiol. 2009.
(42) Simon, T. C.; Roth, K. A.; Gordon, J. I. Use of transgenic mice tomap cis-acting elements in the liver fatty acid-binding protein gene(Fabpl) that regulate its cell lineage-specific, differentiation-dependent, and spatial patterns of expression in the gut epitheliumand in the liver acinus. J. Biol. Chem. 1993, 268 (24), 18345–58.
(43) Crossman, M. W.; Hauft, S. M.; Gordon, J. I. The mouse ileal lipid-binding protein gene: a model for studying axial patterning duringgut morphogenesis. J. Cell Biol. 1994, 126 (6), 1547–64.
(44) Fujii, H.; Nomura, M.; Kanda, T.; Amano, O.; Iseki, S.; Hatakeyama,K.; Ono, T. Cloning of a cDNA encoding rat intestinal 15 kDaprotein and its tissue distribution. Biochem. Biophys. Res. Com-mun. 1993, 190 (1), 175–80.
(45) Grober, J.; Zaghini, I.; Fujii, H.; Jones, S. A.; Kliewer, S. A.; Willson,T. M.; Ono, T.; Besnard, P. Identification of a bile acid-responsiveelement in the human ileal bile acid-binding protein gene.Involvement of the farnesoid X receptor/9-cis-retinoic acid recep-tor heterodimer. J. Biol. Chem. 1999, 274 (42), 29749–54.
(46) Kanda, T.; Foucand, L.; Nakamura, Y.; Niot, I.; Besnard, P.; Fujita,M.; Sakai, Y.; Hatakeyama, K.; Ono, T.; Fujii, H. Regulation ofexpression of human intestinal bile acid-binding protein in Caco-2cells. Biochem. J. 1998, 330 (Pt 1), 261–5.
(47) Capello, A.; Moons, L. M.; Van de Winkel, A.; Siersema, P. D.; vanDekken, H.; Kuipers, E. J.; Kusters, J. G. Bile acid-stimulatedexpression of the farnesoid X receptor enhances the immuneresponse in Barrett esophagus. Am. J. Gastroenterol. 2008, 103 (6),1510–6.
(48) Chang, J.; Chance, M. R.; Nicholas, C.; Ahmed, N.; Guilmeau, S.;Flandez, M.; Wang, D.; Byun, D. S.; Nasser, S.; Albanese, J. M.;Corner, G. A.; Heerdt, B. G.; Wilson, A. J.; Augenlicht, L. H.;Mariadason, J. M. Proteomic changes during intestinal cell matu-ration in vivo. J. Proteomics 2008, 71 (5), 530–46.
(49) Montoudis, A.; Seidman, E.; Boudreau, F.; Beaulieu, J. F.; Menard,D.; Elchebly, M.; Mailhot, G.; Sane, A. T.; Lambert, M.; Delvin, E.;Levy, E. Intestinal fatty acid binding protein regulates mitochon-drion beta-oxidation and cholesterol uptake. J. Lipid Res. 2008,49 (5), 961–72.
(50) Iiizumi, G.; Sadoya, Y.; Hino, S.; Shibuya, N.; Kawabata, H.Proteomic characterization of the site-dependent functional dif-ference in the rat small intestine. Biochim. Biophys. Acta 2007,1774 (10), 1289–98.
(51) Sato, E.; Fujii, H.; Fujita, M.; Kanda, T.; Iseki, S.; Hatakeyama, K.;Tanaka, T.; Ono, T. Tissue-specific regulation of the expression ofrat intestinal bile acid-binding protein. FEBS Lett. 1995, 374 (2),184–6.
(52) Sukhotnik, I.; Shiloni, E.; Mogilner, J.; Lurie, M.; Hirsh, M.; Coran,A. G.; Krausz, M. M. Effect of sex and sex hormones on structural
research articles Stephens et al.
1448 Journal of Proteome Research • Vol. 9, No. 3, 2010

intestinal adaptation after massive small bowel resection in rats.J. Pediatr. Surg. 2005, 40 (3), 489–95.
(53) Lin, C. Y.; Vega, V. B.; Thomsen, J. S.; Zhang, T.; Kong, S. L.; Xie,M.; Chiu, K. P.; Lipovich, L.; Barnett, D. H.; Stossi, F.; Yeo, A.;George, J.; Kuznetsov, V. A.; Lee, Y. K.; Charn, T. H.; Palanisamy,N.; Miller, L. D.; Cheung, E.; Katzenellenbogen, B. S.; Ruan, Y.;Bourque, G.; Wei, C. L.; Liu, E. T. Whole-genome cartography ofestrogen receptor alpha binding sites. PLoS Genet. 2007, 3 (6), e87.
(54) Shendelman, S.; Jonason, A.; Martinat, C.; Leete, T.; Abeliovich,A. DJ-1 is a redox-dependent molecular chaperone that inhibitsalpha-synuclein aggregate formation. PLoS Biol. 2004, 2 (11), e362.
(55) Takahashi, K.; Taira, T.; Niki, T.; Seino, C.; Iguchi-Ariga, S. M.; Ariga,H. DJ-1 positively regulates the androgen receptor by impairingthe binding of PIASx alpha to the receptor. J. Biol. Chem. 2001,276 (40), 37556–63.
PR900976F
Fatty Acid Binding Protein Expression from Intestinal Adaptation research articles
Journal of Proteome Research • Vol. 9, No. 3, 2010 1449