Proteomic analysis of serum of workers occupationally exposed to arsenic, cadmium, and lead for...
8
Proteomic analysis of serum of workers occupationally exposed to arsenic, cadmium, and lead for biomarker research: A preliminary study Barbara Kossowska a, ⁎, Ilona Dudka b , Gabriela Bugla-Płoskońska c , Anna Szymańska-Chabowska d , Włodzimierz Doroszkiewicz c , Roman Gancarz b , Ryszard Andrzejak d , Jolanta Antonowicz-Juchniewicz d a Department of Chemistry and Immunochemistry, Wroclaw Medical University, Bujwida 44a, 50-345 Wrocław, Poland b Medicinal Chemistry and Microbiology Group, Department of Chemistry, Wroclaw University of Technology, Wybrzeże Wyspiańskiego 27, 50-370 Wroclaw, Poland c Department of Microbiology, Institute of Genetics and Microbiology, University of Wroclaw, Przybyszewskiego 63/77, 51-148 Wroclaw, Poland d Department of Internal and Occupational Medicine, Wroclaw Medical University, Wybrzeże L. Pasteura 4, 50-367 Wroclaw, Poland abstract article info Article history: Received 17 February 2010 Received in revised form 21 July 2010 Accepted 30 July 2010 Keywords: Biomarkers Proteomic profiles Metal mixture exposure Two-dimensional gel electrophoresis Mathematical analysis The main factor of environmental contamination is the presence of the heavy metals lead, cadmium, and arsenic. The aim of serum protein profile analysis of people chronically exposed to heavy metals is to find protein markers of early pathological changes. The study was conducted in a group of 389 healthy men working in copper foundry and 45 age-matched non-exposed healthy men. Toxicological test samples included whole blood, serum, and urine. Thirty-seven clinical parameters were measured. Based on the parameters values of the healthy volunteers, the centroid in 37-dimensional space was calculated. The individuals in the metal-exposed and control groups were ordered based on the Euclidean distance from the centroid defined by the first component according to Principal Component Analysis (PCA). Serum samples of two individuals, one from the control and one from the metal-exposed group, were chosen for proteomic analysis. In optimized conditions of two-dimensional gel electrophoresis (2-DE), two protein maps were obtained representing both groups. Twenty-eight corresponding protein spots from both protein maps were chosen and identified based on PDQuest analysis and the SWISS-2DPAGE database. From a panel of six proteins with differences in expression greater than a factor of two, three potential markers with the highest differences were selected: hemoglobin-spot 26 (pI 7.05, Mw 10.53), unidentified protein-spot 27 (pI 6.73, Mw 10.17), and unidentified protein-spot 25 (pI 5.75, Mw 12.07). Further studies are required to prove so far obtained results. Identified proteins could serve as potential markers of preclinical changes and could be in the future included in biomonitoring of people exposed to heavy metals. © 2010 Elsevier B.V. All rights reserved. 1. Introduction The main factor of environment contamination is the presence of the heavy metals lead, cadmium, and arsenic. They are widespread in the human environment, in the atmosphere (Were et al., 2008), water (Hegedus et al., 2008), soil (Patra et al., 2008), and food (Patra et al., 2008; Sirot et al., 2008), and could be of natural and anthropogenic origin, especially industry (Zhai et al., 2005; Szymańska-Chabowska et al., 2007; Poręba et al., 2010). It should be pointed out that active and passive exposure to cigarette smoke is an important source of heavy metal exposure, especially cadmium (Chlebda et al., 2004; Raveendran et al., 2005; Lantz et al., 2007; Eum et al., 2008; Talio et al., 2010). Arsenic (As) is classified as a group 1 carcinogen by the International Agency for Research on Cancer (Hegedus et al., 2008). Arsenic carcinogenicity refers mainly to inhalation exposure and brings about the development mostly of lung and skin cancers (squamous cell cancer and basalioma). However, cancers of the bladder, liver and kidney were also reported (Jones et al., 2007; Szymańska-Chabowska et al., 2007). The mechanisms involved in arsenic carcinogenesis are still unknown. There is hypothesis that reactive oxygen species (ROS) may play an important role in arsenic carcinogenesis (Szymańska-Chabowska et al., 2009; De Vizcaya-Ruiza et al., 2009). The main source of As ingestion is through naturally contaminated drinking water and occupations such as gold and uranium mining and copper smelting can also result in high As exposure (Zhai et al., 2005; Hegedus et al., 2008). Lead (Pb) is part of organic as well as inorganic compounds and can be found in plants, soil, pigments and industrial chemicals. Lead Science of the Total Environment 408 (2010) 5317–5324 Abbreviations: PCA, Principle Component Analysis; IEF, isoelectric focusing; 2-DE, two-dimensional gel electrophoresis; pI, isoelectric point; Mw, molecular weight. ⁎ Corresponding author. Tel.: +48 071 328 26 95; fax: +48 071 328 16 49. E-mail addresses: [email protected] (B. Kossowska), [email protected] (I. Dudka), [email protected] (G. Bugla2Płoskońska), [email protected] (A. Szymańska2Chabowska), [email protected] (W. Doroszkiewicz), [email protected] (R. Gancarz), [email protected] (R. Andrzejak), [email protected] (J. Antonowicz2Juchniewicz). 0048-9697/$ – see front matter © 2010 Elsevier B.V. All rights reserved. doi:10.1016/j.scitotenv.2010.07.080 Contents lists available at ScienceDirect Science of the Total Environment journal homepage: www.elsevier.com/locate/scitotenv
-
Upload
independent -
Category
Documents
-
view
0 -
download
0
Transcript of Proteomic analysis of serum of workers occupationally exposed to arsenic, cadmium, and lead for...
Science of the Total Environment 408 (2010) 5317–5324
Contents lists available at ScienceDirect
Science of the Total Environment
j ourna l homepage: www.e lsev ie r.com/ locate /sc i totenv
Proteomic analysis of serum of workers occupationally exposed to arsenic, cadmium,and lead for biomarker research: A preliminary study
Barbara Kossowska a,⁎, Ilona Dudka b, Gabriela Bugla-Płoskońska c, Anna Szymańska-Chabowska d,Włodzimierz Doroszkiewicz c, Roman Gancarz b, Ryszard Andrzejak d, Jolanta Antonowicz-Juchniewicz d
a Department of Chemistry and Immunochemistry, Wroclaw Medical University, Bujwida 44a, 50-345 Wrocław, Polandb Medicinal Chemistry and Microbiology Group, Department of Chemistry, Wroclaw University of Technology, Wybrzeże Wyspiańskiego 27, 50-370 Wroclaw, Polandc Department of Microbiology, Institute of Genetics and Microbiology, University of Wroclaw, Przybyszewskiego 63/77, 51-148 Wroclaw, Polandd Department of Internal and Occupational Medicine, Wroclaw Medical University, Wybrzeże L. Pasteura 4, 50-367 Wroclaw, Poland
Abbreviations: PCA, Principle Component Analysis;two-dimensional gel electrophoresis; pI, isoelectric poin⁎ Corresponding author. Tel.: +48 071 328 26 95; fax
E-mail addresses: [email protected] ([email protected] (I. Dudka), gabriela.bugla-p(G. Bugla2Płoskońska), [email protected] (A. Szymań[email protected] (W. [email protected] (R. Gancarz), ryszard@[email protected] (J. Antonowicz2Juchniewicz).
0048-9697/$ – see front matter © 2010 Elsevier B.V. Aldoi:10.1016/j.scitotenv.2010.07.080
a b s t r a c t
a r t i c l e i n f oArticle history:Received 17 February 2010Received in revised form 21 July 2010Accepted 30 July 2010
Keywords:BiomarkersProteomic profilesMetal mixture exposureTwo-dimensional gel electrophoresisMathematical analysis
The main factor of environmental contamination is the presence of the heavy metals lead, cadmium, andarsenic. The aim of serum protein profile analysis of people chronically exposed to heavy metals is to findprotein markers of early pathological changes. The study was conducted in a group of 389 healthy menworking in copper foundry and 45 age-matched non-exposed healthy men. Toxicological test samplesincluded whole blood, serum, and urine. Thirty-seven clinical parameters were measured. Based on theparameters values of the healthy volunteers, the centroid in 37-dimensional space was calculated. Theindividuals in the metal-exposed and control groups were ordered based on the Euclidean distance from thecentroid defined by the first component according to Principal Component Analysis (PCA). Serum samples oftwo individuals, one from the control and one from the metal-exposed group, were chosen for proteomicanalysis. In optimized conditions of two-dimensional gel electrophoresis (2-DE), two protein maps wereobtained representing both groups. Twenty-eight corresponding protein spots from both protein maps werechosen and identified based on PDQuest analysis and the SWISS-2DPAGE database. From a panel of sixproteins with differences in expression greater than a factor of two, three potential markers with the highestdifferences were selected: hemoglobin-spot 26 (pI 7.05, Mw 10.53), unidentified protein-spot 27 (pI 6.73,Mw 10.17), and unidentified protein-spot 25 (pI 5.75, Mw 12.07). Further studies are required to prove so farobtained results. Identified proteins could serve as potential markers of preclinical changes and could be inthe future included in biomonitoring of people exposed to heavy metals.
IEF, isoelectric focusing; 2-DE,t; Mw, molecular weight.: +48 071 328 16 49.. Kossowska),[email protected]),roszkiewicz),w.am.wroc.pl (R. Andrzejak),
l rights reserved.
© 2010 Elsevier B.V. All rights reserved.
1. Introduction
The main factor of environment contamination is the presence ofthe heavy metals lead, cadmium, and arsenic. They are widespread inthe human environment, in the atmosphere (Were et al., 2008), water(Hegedus et al., 2008), soil (Patra et al., 2008), and food (Patra et al.,2008; Sirot et al., 2008), and could be of natural and anthropogenicorigin, especially industry (Zhai et al., 2005; Szymańska-Chabowskaet al., 2007; Poręba et al., 2010). It should be pointed out that activeand passive exposure to cigarette smoke is an important source of
heavy metal exposure, especially cadmium (Chlebda et al., 2004;Raveendran et al., 2005; Lantz et al., 2007; Eum et al., 2008; Talio et al.,2010).
Arsenic (As) is classified as a group 1 carcinogen by theInternational Agency for Research on Cancer (Hegedus et al., 2008).Arsenic carcinogenicity refers mainly to inhalation exposure andbrings about the development mostly of lung and skin cancers(squamous cell cancer and basalioma). However, cancers of thebladder, liver and kidney were also reported (Jones et al., 2007;Szymańska-Chabowska et al., 2007). The mechanisms involved inarsenic carcinogenesis are still unknown. There is hypothesis thatreactive oxygen species (ROS) may play an important role in arseniccarcinogenesis (Szymańska-Chabowska et al., 2009; De Vizcaya-Ruizaet al., 2009). The main source of As ingestion is through naturallycontaminated drinking water and occupations such as gold anduranium mining and copper smelting can also result in high Asexposure (Zhai et al., 2005; Hegedus et al., 2008).
Lead (Pb) is part of organic as well as inorganic compounds and canbe found in plants, soil, pigments and industrial chemicals. Lead
5318 B. Kossowska et al. / Science of the Total Environment 408 (2010) 5317–5324
intoxication has great influence on the haemoglobin synthesis, leadingto anemia. Many organ systems are also affected, in particular kidney,leading to renal insufficiently and hypertension (Ghezel-Ahmadi et al.,2010). Several authors suggest that exposure to lead may explainvariation in population as far as cardiovascular disease rates areconcerned (Ghezel-Ahmadi et al., 2010; Poręba et al., 2010).
Cadmium (Cd) is a toxic nonessential transition metal. Sources ofhuman exposure to cadmium include employment in metal industries,production of certain batteries, some electroplating processes andconsumption of tobacco products (Arita and Costa, 2009). Cadmium,especially cadmiumoxide, is a human carcinogen. There is evidence of itcausing lung, prostate and kidney cancers in humans. In additioncadmium is a cumulative nephrotoxicant (Ghezel-Ahmadi et al., 2010).
Humans are frequently exposed to mixtures of As and Pb, but littleis known about the expression of biomarkers resulting from suchmixed exposure (Zhai et al., 2005). There is a need to develop newhuman biomarkers for metal exposure. It is important to establishbiomarkers for early toxic responses, in particular to chronic exposureto heavy metals (Bower et al., 2005).
The goal of biomonitoring is to quantitatively assess environmentalor occupational chemical exposure by measuring either the parentchemical or its metabolite in various specimen samples (Pearson et al.,2009). To evaluate exposures to heavy metals and other contaminantsfrom study participants are routinely collected samples of urine(Hegedus et al., 2008; Sirot et al., 2008; Pearson et al., 2009; Talioet al., 2010), and blood (Zhai et al., 2005; Szymańska-Chabowska et al.,2007, 2009; Poręba et al., 2010). Samples of human nails (Vinceti et al.,2007; Were et al., 2008), germ cells (Angenard et al., 2010) and saliva(Talio et al., 2010) are also examined.
Studies in own research group are concentrated on observation ofthe interaction between occupational and environmental exposition toheavy metals and human health. In own two year observation study(2001–2003) the relationship between arsenic, cadmium and leadconcentration and the levels of cancer markers: TPA (tissue polipeptideantigen), TPS (tissue polypeptide specific antigen) and CYFRA 21-1 wasinvestigated. All examined cancerogenic, or potentially cancerogenicmetals (As, Cd, and Pb) belong to the group of factors which impactserum TPS and/or TPA concentration in exposed workers. Reportedstrong positive correlation between blood concentration of Cd and CEA,the marker of abnormal cellular differentiation, may reflect neoplastictransformation of normal cells stimulated by some cancerogenic(Szymańska-Chabowska et al., 2007). Results of own other study(Szymańska-Chabowska et al., 2009) suggested that chronic mixedexposure to arsenic, cadmium and lead may result in oxidative DNAdamage in humans, determined by elevated serum level 8-hydroxy-2′-deoxyguanosine (8-OHdG). Poręba et al. (2010) concluded thatendothelial function assessed by the flow-mediated dilatation wasimpaired in workers occupationally exposed to lead. Results of ourprevious studies indicate the strong impact of occupational expositionto heavy metals to human health. Biomonitoring of those changesimplicate the need to develop human biomarkers for metal exposurewith high sensitivity and specificity.
The emerging field of proteomics presents an attractive opportu-nity to discover candidate biomarkers as it measures and analyzes alarge number of proteins simultaneously (Harezlak et al., 2008).Proteomic analysis is a powerful technology developed recently toenhance research on the diagnosis, treatment, and prevention ofhuman diseases (Röcken et al., 2004). The technique has been usedsuccessfully to identify proteomic biomarkers in cancer (Kennedy,2001; Steel et al., 2003; Okano et al., 2006; Vydra et al., 2008; Hűtteret al., 2009; Pietrowska et al., 2009; Rodríguez-Piñeiro et al., 2010),neurodegenerative disorders (Prabakaran et al., 2007; Caudle et al.,2008; Schwarz and Bahn, 2008; Thambisetty et al., 2008; Zellner et al.,2009), prenatal tests diagnosis of Down's syndrome (Tsangaris et al.,2006; Nagalla et al., 2007) and it enables assessment of the influenceof environmental contamination on the immunological system (Joo
et al., 2004; Raveendran et al., 2005; Lantz et al., 2007). Proteomicshas a large potential value for occupational and environmental healthresearch because the environment is known to influence manyprocesses in human organism and therefore this method is likely toprovide valuable information (Zhai et al., 2005; Vlandreen et al.,2010). Two-dimensional gel electrophoresis (2-DE) is a widely usedmethod in proteomic analysis. It enables separation of the proteins ofa proteome and their detection in a large concentration (Grant et al.,2007; Hűtter et al., 2009; Kanamoto et al., 2009; Kossowska et al.,2009).
The objective of the present preliminary study was to apply two-dimensional gel electrophoresis to explore potential proteomicbiomarkers in workers occupationally exposed to an arsenic andlead mixture and environmentally to cadmium.
2. Materials and methods
2.1. Study population
The study was conducted in two groups: a metal-exposed group of389menworking in the copper foundry and a control group of 45 age-matched non-exposed healthy men, who had no previous history ofoccupational exposure to metals.
Blood and urine samples were collected within the framework ofroutine occupational health surveillance of people chronically exposedto heavy metal mixtures. The evaluation of toxicological status andcancer risk assessment was an important part of medical care of copperfoundryworkers. Investigationswere carried out byphysicians from theDepartment of Internal and Occupational Medicine, Wroclaw MedicalUniversity. Each participant underwent physical examination accordingto standard survey. Information on sociodemographic characteristics,medical history, alcohol consumption, smoking cigarettes and occupa-tional historywas obtained by structured questionnaire. All participantsgave written, informed consent to the study. The study protocol wasapprovedby the Bioethic Committee of theWroclawMedical University(no. KB 487/2008).
The method of individual measurement (dosimetry) was used inorder to establish the noxious factors at the work place. The results ofthemeasurements showed that the air concentrations of Pbwas in therange between 0.05 and 3.97 of the highest acceptable concentration(HAC) for lead in the environment of the work place, for arsenicbetween 0.0 and 4.64 of HAC, and for Cu it ranged between 0.01 and0.82 of HAC.
For all subjects, blood samples were collected in the morningbefore going to work and urine samples after day shift. A bloodsamples for morphology, measurements of Pb, Cd, and FEP werecollected by venipuncture into tubes using an aspiration-vacuum setwith EDTA-K2 (SARSTEDT), frozen at −20 °C, and stored at −80 °Cuntil analysis. Blood samples for measurements of Mg, Ca, Cu, Zn, Fe,glucose, creatinine, total iron binding capacity, unsaturated ironbinding capacity, transferrin saturation, transferrin, ferritine, TotalProstate-Specific Antigen, and Free Prostate-Specific Antigen in serumwere collected by venipuncture into tubes using an aspiration-vacuum set with serum clotting activator (SARSTEDT) and spun at2500 rpm at 4 °C for 10 min, then frozen at −20 °C, and stored at−80 °C until analysis. Protein concentration in the serum wasmeasured by the Lowry et al. method (1951). Subjects were askedto wash their hands before supplying the urine, in order to reducecontamination. All urine samples were collected to containerscontaining liquid nitric acid and then frozen at −20 °C until analysis.
2.2. Laboratory analysis
Blood lead and cadmium concentrations were measured byflameless atomic absorption spectrometry bymeasuring the absorbanceat 283.3 nm and 228.8 wave, respectively, with Zeeman background
Table 1Characteristics of the study subjects in control (A) and metal-exposed groups (B).
Clinical parametersa Controlgroup
Metal-exposedgroup
p-value
n=42 n=359
Magnesium in serum (μg/mL) 20.3±1.7 20.7±1.6 0.23Calcium in serum (μg/mL) 99.3±4.1 90.4±7.3 8.31E−14⁎⁎
Copper in serum (μg%) 99.7±12.1 104.5±15.1 0.05⁎
Zinc in serum (μg%) 98.1±10.1 99.4±19.5 0.68Lead in whole blood (μg/L) 37.9±27.1 201.2±112.5 5.49E−19⁎⁎
Cadmium in whole blood (μg/L) 0.9±0.8 1.2±1.7 0.27Cadmium in urine (μg/g CREA) 0.5±0.7 0.8±0.9 0.07Arsenic in urine (μg/g CREA) 3.5±3.0 18.9±22.2 8.48E−6⁎⁎
Free erythrocyte protoporphyrinin erythrocytes (μg/100 mL eryt.)
28.5±9.4 40.5±39.4 0.05⁎
White blood cell count (K/μL) 6.8±1.6 7.2±1.8 0.18Neutrophil count (K/μL) 4.0±1.2 3.8±3.1 0.80Lymphocyte count (K/μL) 2.2±0.6 2.7±1.7 0.04⁎
Monocyte count (K/μL) 0.4±0.2 0.6±0.4 0.008Eosinophil count (K/μL) 0.2±0.2 0.2±0.2 0.06Basophil count (K/μL) 0.06±0.02 0.1±0.06 0.05⁎
Red blood cell count (M/μL) 5.1±0.4 5.1±0.3 0.26Hemoglobin (g/dL) 15.3±1.1 15.2±0.9 0.79Hematocrit (%) 44.4±3.0 44.0±2.6 0.64Mean cell volume of red bloodcells (fL)
86.5±2.4 87.1±3.5 0.21
Mean cell hemoglobin (pg) 29.8±0.9 30.1±1.4 0.17Mean cell hemoglobinconcentration (g/dL)
34.4±0.5 34.5±0.6 0.52
Red blood cell distribution width (%) 14.5±0.8 14.6±1.0 0.52Platelets count (K/L) 214.6±37.6 207.6±43.2 0.31Mean platelet volume (fL) 8.2±1.3 8.7±1.4 0.01⁎
Glucose in serum (mg%) 83.7±12.4 83.7±19.3 0.99Creatinine in serum (mg%) 0.9±0.1 0.9±0.1 0.39Creatinine in urine (μmol/L) 80.4±9.2 82.0±12.2 0.40Iron in serum (μmol/L) 23.7±8.3 18.4±6.1 6.43E−6⁎⁎
Total iron binding capacity in serum(μmol/L)
63.2±5.5 60.5±7.7 0.03⁎
Unsaturated iron binding capacityin serum (μmol/L)
39.5±11.0 42.1±9.2 0.097
Transferrin saturation in serum (%) 38.0±14.9 30.7±10.4 0.00005⁎⁎
Transferrin in serum (g/L) 2.5±0.3 2.5±0.3 0.10Ferritine in serum (ng/mL) 143.1±98.4 127.5±97.2 0.33Total prostate-specific antigenin serum (ng/mL)
0.8±0.5 0.9±0.7 0.58
Free prostate-specific antigenin serum (ng/mL)
0.2±0.1 0.2±0.2 0.29
PSA complete/PSA free in serum 0.2±0.1 0.2±0.1 0.40Glycated hemoglobin A1c inblood (%)
5.7±0.4 5.7±0.3 0.56
Data are expressed as mean±standard deviation.a Compared using independent sample t-test.⁎ Pb0.05.⁎⁎ Pb0.001.
5319B. Kossowska et al. / Science of the Total Environment 408 (2010) 5317–5324
correction. The examination was done with an SAA SOLAAR M6 of theThermoElementalCompany. Certifiedmaterials (BCR-194, -195, -196byIRMM, UE) were used as patterns. Arsenic concentrationwasmeasuredin acidic (concentrated HNO3) urine. The investigation was done withthe SAA SOLAAR M6 with the PU 9360 Philips system for hydridegeneration. A 193.7-nmwave, deuteriumbackground correction, and anelectrically heated quartz atomization chamber were applied. Patternsolutions, i.e. Single-Element Arsenic Standard 1000 μg/mL, certified byCPI International, were used.
All measurements were carried out at the Laboratory of theDepartment of Internal and Occupational Medicine following astandardized protocol (Atomic Absorption Spectrometry-MethodsMannual 949923024011 Issue 3 010101).
2.3. Mathematical analysis
For 37 measured clinical parameters of all subjects with completeclinical tests from metal-exposed group (359 smelter workers) andcontrol group (42 healthy men) mean and standard deviation werecalculated (Table 1).
Mathematical analysis was applied to select serum samples forproteomic analysis. The analysis was based on data for the body fluidparameters (37 clinical parameters) obtained from the individualsexposed to metals and the control group. Only data of persons withcomplete clinical tests were analyzed. The outliers in the controlgroup were eliminated by the Q-Dixon test. Finally, the analysis wasperformed for 359 persons with metal exposure in their history and32 persons in the control group. Since 37 clinical parameters wereanalyzed, the data set spanned 37-dimensional space. Every individ-ual from the control and patient groups is represented by a singlepoint in such 37-dimensional space. Considering only the controlgroup, the centroid of the data was defined as the center of gravity inthis 37-dimensional space. This centroid was considered the standardphysiological stage of homeostasis. For every person in the controland metal-exposed groups, the Euclidean distance from the centroidto the single point representing the selected person was calculated.The obtained distance expresses the deviation from homeostasis. TheEuclidean distance was also calculated according to PrincipalComponent Analysis (PCA) in the space defined by the firstcomponent, which accounts for 14% and 25% of the variability of thedata in the metal-exposed and control groups, respectively.
2.4. 2-D electrophoresis
2.4.1. Serum sample preparationA sample mixture containing 5 μL of human serum and 12 μL of a
solution containing 2% (wt/vol) SDS and 2.3% (wt/vol) DTT in 20 mMTris, pH 8.0, was heated at 95 °C for 5 min. After cooling, the samplewas diluted with a 90 μL solution containing 7 mol/L urea, 4% (wt/vol)CHAPS, 1.2% (vol/vol) Nonidet, 1% (wt/vol) DTT, and 2% (vol/vol)ampholytes (100% stock) pH 3–10 in 20 mM Tris, pH 8.0. The serumsample mixture was incubated at room temperature for 1 h(Yamagiwa et al., 2003; Kim and Kim, 2007).
2.4.2. Two-dimensional gel electrophoresisBefore first-dimension isoelectric focusing (IEF) the gel was
polymerized in eight capillaries, each containing 140 μL of a solutioncontaining 8 mol/L urea, 4.1% (wt/vol) acrylamid, 0.3% (wt/vol) CHAPS,and0.2% (vol/vol) Nonidet. The reactionwas initiated by adding 8.7 μL ofampholytes pH 3–10 and 1 μL of 10% (wt/vol) ammonium persulfate to140 μL of the mixture. Polymerization was carried out at roomtemperature for 1 h. Onto the top of the gel (with a length of 10.5 cmin a capillary), 15 μL of buffer containing 3% urea, 0.25% ampholytes pH3–10, 0.2%Nonidet, and0.77%DTTwas loaded. Afterfilling the reservoirsof the standard 2D apparatus for IEF (Kucharczyk-Techniki Elektrofor-etyczne) with anode buffer (0.1 mol/L phosphoric acid) and cathode
buffer (de-aerated with 0.1 mol/L NaOH), prefocusing of eight gels wasperformed at room temperature in three steps: 200 V (50 V h), 300 V(150 V h), and 400 V (200 V h) (Encarnación et al., 2005).
Then 100 μg of the serum sample mixture was loaded onto the topof each gel. Together with the analyzed serum samples, isoelectricfocusing of 50 μg of standard proteins (IEFMarkers 3–10 SERVA LiquidMix): cytochrome C (pI 10.7), ribonuclease A (pI 9.5), lectin (c. pI 8.3),lectin (m. pI 8.0), lectin (a. pI 7.8), myoglobin (c. pI 7.4), myoglobin(a. pI 6.9), carbonic anhydrase ( pI 6.0), β-lactoglobin (c. pI 5.3),β-lactoglobin (a. pI 5.2), trypsin inhibitor (pI 4.5), glucose oxidase(pI 4.2), and amyloglucosidase (pI 3.5) was performed. Isoelectricfocusing was performed at room temperature in two steps: 400 V(7500 V h) and 800 V (800 V h). After IEF, the gels were moved tobuffer containing 6 mol/L urea, 2.5% (wt/vol) SDS, and 25% glycerolin 50 mM Tris, pH 6.8, and then stored at −80 °C.
Before electrophoresis in the second dimension, the gels werethawed and equilibrated in two steps. In the first step the gels wereequilibrated in 5 mL buffer containing 6 mol/L urea, 2.5% (wt/vol)
5320 B. Kossowska et al. / Science of the Total Environment 408 (2010) 5317–5324
SDS, and 25% glycerol (wt/vol) and additionally 2.5% (wt/vol) DTT in50 mM Tris buffer, pH 6.8, at room temperature for 15 min and in thesecond step in 2 mL of buffer containing 6 mol/L urea, 2.5% (wt/vol)SDS, and 25% (wt/vol) glycerol and additionally 2.5% (wt/vol) ofiodoacetamide in 50 mM Tris buffer, pH 6.8, at room temperature for15 min (Rantalainen et al., 2006). The equilibrated gel with proteinsseparated by the pH gradient was transferred to the top of a stackinggel containing 1% SDS in 0.125 M Tris buffer, pH 6.8, and held inposition with molten 0.5% (wt/vol) agarose in running buffercontaining a trace of bromophenol blue. Concurrently, 3 μL of astandard protein solution (Protein Test Mixture 6 for SDS-PAGE;SERVA Electrophoresis) containing phosphorylase B (97,400 Da),albumin bovine (67,000 Da), albumin egg (45,000 Da), carbonicanhydrase (29,000 Da), trypsin inhibitor (soybean, 21,000 Da),cytochrome C (12,500 Da), and trypsin inhibitor (bovine lung,(6500 Da) was loaded on the gel.
The second dimension was performed in 12% gels in a vertical slabgel apparatus (Labconco/Buchler Instruments, Kansas City, MO, USA)with Tris/glycine/SDS (0.025 M Tris–base, 0.19 M glycine, 0.1% SDS)running buffer as recommended by Leammli (1970). Proteins wereseparated in the gel measuring 15.5 cm in width, 17 cm in length, and1.5 mm thick. The gels were run at 3 W (920 V h) at room temperatureuntil the bromophenol blue front reached the bottom of the gel. Theproteins were visualized using a silver staining procedure compatiblewith mass spectrometry analysis (Gromova and Celis, 2006).
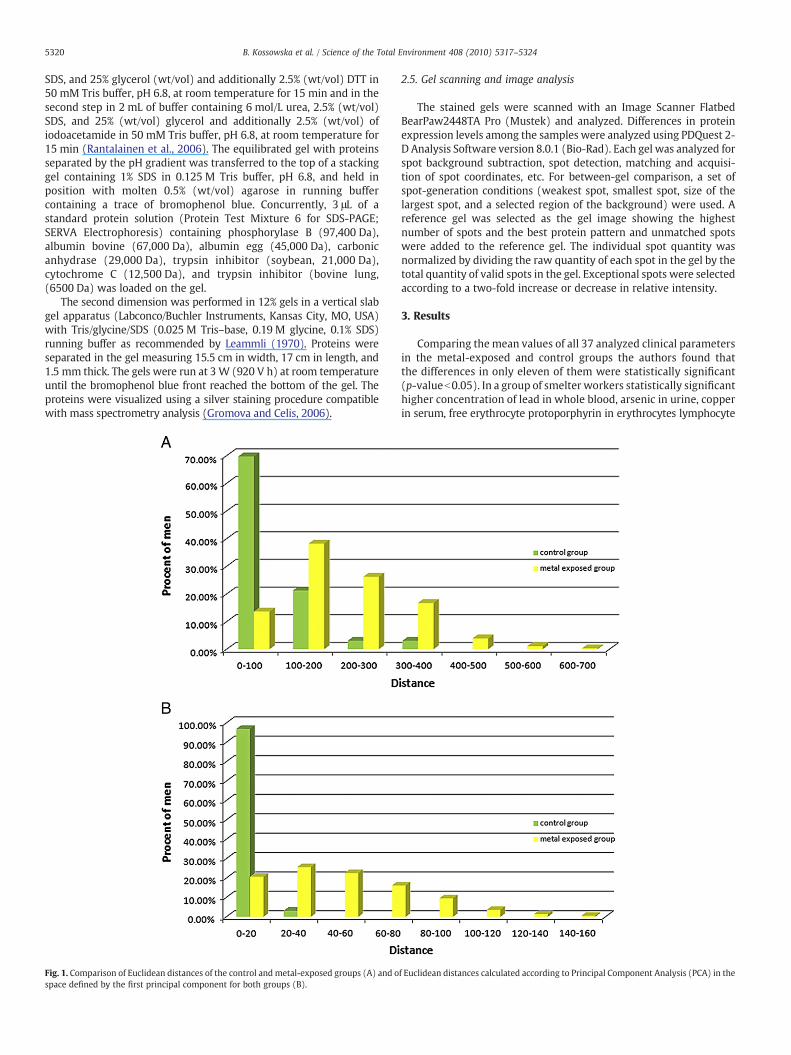
Fig. 1. Comparison of Euclidean distances of the control and metal-exposed groups (A) and ospace defined by the first principal component for both groups (B).
2.5. Gel scanning and image analysis
The stained gels were scanned with an Image Scanner FlatbedBearPaw2448TA Pro (Mustek) and analyzed. Differences in proteinexpression levels among the samples were analyzed using PDQuest 2-D Analysis Software version 8.0.1 (Bio-Rad). Each gel was analyzed forspot background subtraction, spot detection, matching and acquisi-tion of spot coordinates, etc. For between-gel comparison, a set ofspot-generation conditions (weakest spot, smallest spot, size of thelargest spot, and a selected region of the background) were used. Areference gel was selected as the gel image showing the highestnumber of spots and the best protein pattern and unmatched spotswere added to the reference gel. The individual spot quantity wasnormalized by dividing the raw quantity of each spot in the gel by thetotal quantity of valid spots in the gel. Exceptional spots were selectedaccording to a two-fold increase or decrease in relative intensity.
3. Results
Comparing the mean values of all 37 analyzed clinical parametersin the metal-exposed and control groups the authors found thatthe differences in only eleven of them were statistically significant(p-valueb0.05). In a group of smelter workers statistically significanthigher concentration of lead in whole blood, arsenic in urine, copperin serum, free erythrocyte protoporphyrin in erythrocytes lymphocyte
f Euclidean distances calculated according to Principal Component Analysis (PCA) in the
5321B. Kossowska et al. / Science of the Total Environment 408 (2010) 5317–5324
count, basophil count, and mean platelet volume was observed. In thatgroup statistically significant lower concentration of calcium in serum,iron in serum, transferrin saturation in serum and total iron-bindingcapacity in serumwasnoted (Table 1). Themathematical analysis basedon body fluid parameters (37 clinical parameters) obtained for thepersons of the control group and the group of metal-exposed workersallowed evaluation of the serum samples and selecting two of them forpreliminary proteomic analysis.
The Euclidean distances for the metal-exposed group were found tobe in the range of 38–600.Most of workers (38%)were characterized bydistances of 100–200. There were also many workers with distances of200–300 (26%) and 300–400 (17%); one person was defined by adistance above 600 (0.28%). For the control group the distances were inthe range of 31–308. However, most persons in that group (70%) werecharacterized by a distance lower than 100 (Fig. 1A).
Distances calculated in the space defined by the first PC for themetal-exposed group were in the range of 4–154, with most of theworkers characterized by distances in the ranges of 20–40 (26%) and40–60 (23%) and some in the range of 140–160 (0.6%). Thecorresponding data for the control group were grouped in a narrowinterval, 97% of the individuals defined by distances in the range of
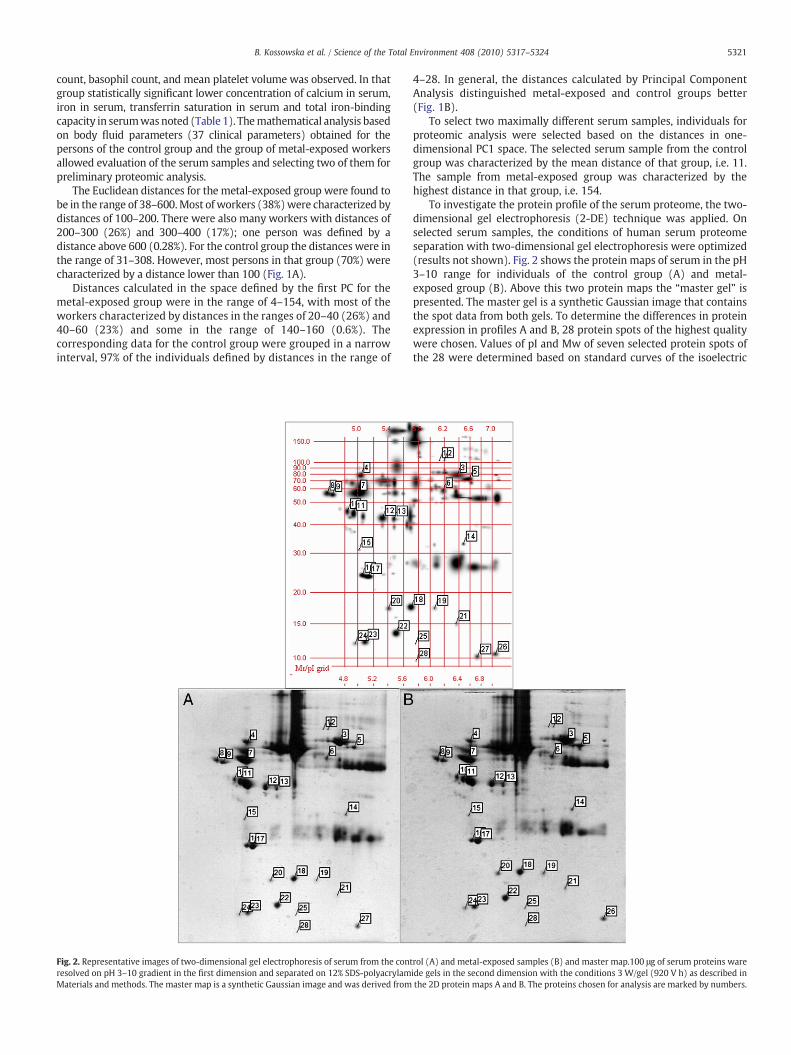
Fig. 2. Representative images of two-dimensional gel electrophoresis of serum from the contresolved on pH 3–10 gradient in the first dimension and separated on 12% SDS-polyacrylamMaterials and methods. The master map is a synthetic Gaussian image and was derived from
4–28. In general, the distances calculated by Principal ComponentAnalysis distinguished metal-exposed and control groups better(Fig. 1B).
To select two maximally different serum samples, individuals forproteomic analysis were selected based on the distances in one-dimensional PC1 space. The selected serum sample from the controlgroup was characterized by the mean distance of that group, i.e. 11.The sample from metal-exposed group was characterized by thehighest distance in that group, i.e. 154.
To investigate the protein profile of the serum proteome, the two-dimensional gel electrophoresis (2-DE) technique was applied. Onselected serum samples, the conditions of human serum proteomeseparation with two-dimensional gel electrophoresis were optimized(results not shown). Fig. 2 shows the protein maps of serum in the pH3–10 range for individuals of the control group (A) and metal-exposed group (B). Above this two protein maps the “master gel” ispresented. The master gel is a synthetic Gaussian image that containsthe spot data from both gels. To determine the differences in proteinexpression in profiles A and B, 28 protein spots of the highest qualitywere chosen. Values of pI and Mw of seven selected protein spots ofthe 28 were determined based on standard curves of the isoelectric
rol (A) and metal-exposed samples (B) and master map.100 μg of serum proteins wareide gels in the second dimension with the conditions 3 W/gel (920 V h) as described inthe 2D protein maps A and B. The proteins chosen for analysis are marked by numbers.
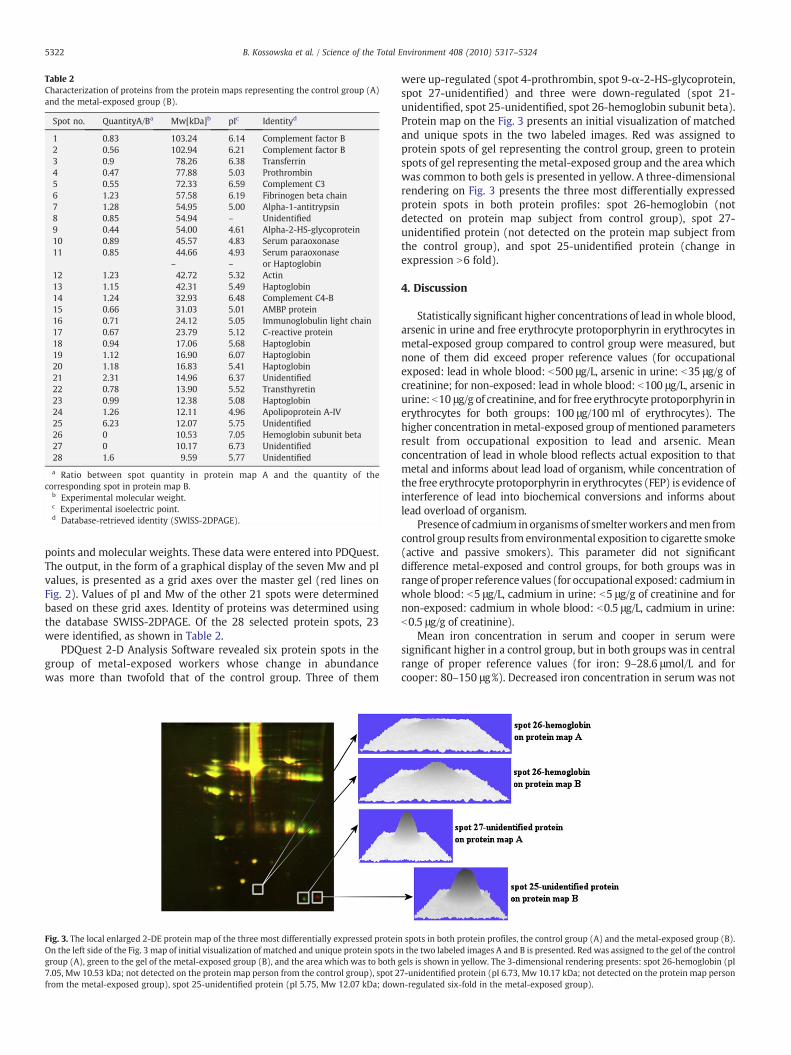
Table 2Characterization of proteins from the protein maps representing the control group (A)and the metal-exposed group (B).
Spot no. QuantityA/Ba Mw[kDa]b pIc Identityd
1 0.83 103.24 6.14 Complement factor B2 0.56 102.94 6.21 Complement factor B3 0.9 78.26 6.38 Transferrin4 0.47 77.88 5.03 Prothrombin5 0.55 72.33 6.59 Complement C36 1.23 57.58 6.19 Fibrinogen beta chain7 1.28 54.95 5.00 Alpha-1-antitrypsin8 0.85 54.94 – Unidentified9 0.44 54.00 4.61 Alpha-2-HS-glycoprotein10 0.89 45.57 4.83 Serum paraoxonase11 0.85 44.66 4.93 Serum paraoxonase
– – or Haptoglobin12 1.23 42.72 5.32 Actin13 1.15 42.31 5.49 Haptoglobin14 1.24 32.93 6.48 Complement C4-B15 0.66 31.03 5.01 AMBP protein16 0.71 24.12 5.05 Immunoglobulin light chain17 0.67 23.79 5.12 C-reactive protein18 0.94 17.06 5.68 Haptoglobin19 1.12 16.90 6.07 Haptoglobin20 1.18 16.83 5.41 Haptoglobin21 2.31 14.96 6.37 Unidentified22 0.78 13.90 5.52 Transthyretin23 0.99 12.38 5.08 Haptoglobin24 1.26 12.11 4.96 Apolipoprotein A-IV25 6.23 12.07 5.75 Unidentified26 0 10.53 7.05 Hemoglobin subunit beta27 0 10.17 6.73 Unidentified28 1.6 9.59 5.77 Unidentified
a Ratio between spot quantity in protein map A and the quantity of thecorresponding spot in protein map B.
b Experimental molecular weight.c Experimental isoelectric point.d Database-retrieved identity (SWISS-2DPAGE).
5322 B. Kossowska et al. / Science of the Total Environment 408 (2010) 5317–5324
points and molecular weights. These data were entered into PDQuest.The output, in the form of a graphical display of the seven Mw and pIvalues, is presented as a grid axes over the master gel (red lines onFig. 2). Values of pI and Mw of the other 21 spots were determinedbased on these grid axes. Identity of proteins was determined usingthe database SWISS-2DPAGE. Of the 28 selected protein spots, 23were identified, as shown in Table 2.
PDQuest 2-D Analysis Software revealed six protein spots in thegroup of metal-exposed workers whose change in abundancewas more than twofold that of the control group. Three of them
Fig. 3. The local enlarged 2-DE protein map of the three most differentially expressed proteinOn the left side of the Fig. 3 map of initial visualization of matched and unique protein spots igroup (A), green to the gel of the metal-exposed group (B), and the area which was to both7.05, Mw 10.53 kDa; not detected on the protein map person from the control group), spot 2from the metal-exposed group), spot 25-unidentified protein (pI 5.75, Mw 12.07 kDa; dow
were up-regulated (spot 4-prothrombin, spot 9-α-2-HS-glycoprotein,spot 27-unidentified) and three were down-regulated (spot 21-unidentified, spot 25-unidentified, spot 26-hemoglobin subunit beta).Protein map on the Fig. 3 presents an initial visualization of matchedand unique spots in the two labeled images. Red was assigned toprotein spots of gel representing the control group, green to proteinspots of gel representing the metal-exposed group and the area whichwas common to both gels is presented in yellow. A three-dimensionalrendering on Fig. 3 presents the three most differentially expressedprotein spots in both protein profiles: spot 26-hemoglobin (notdetected on protein map subject from control group), spot 27-unidentified protein (not detected on the protein map subject fromthe control group), and spot 25-unidentified protein (change inexpression N6 fold).
4. Discussion
Statistically significant higher concentrations of lead inwhole blood,arsenic in urine and free erythrocyte protoporphyrin in erythrocytes inmetal-exposed group compared to control group were measured, butnone of them did exceed proper reference values (for occupationalexposed: lead in whole blood: b500 μg/L, arsenic in urine: b35 μg/g ofcreatinine; for non-exposed: lead in whole blood: b100 μg/L, arsenic inurine: b10 μg/g of creatinine, and for free erythrocyte protoporphyrin inerythrocytes for both groups: 100 μg/100 ml of erythrocytes). Thehigher concentration inmetal-exposed group of mentioned parametersresult from occupational exposition to lead and arsenic. Meanconcentration of lead in whole blood reflects actual exposition to thatmetal and informs about lead load of organism, while concentration ofthe free erythrocyte protoporphyrin in erythrocytes (FEP) is evidence ofinterference of lead into biochemical conversions and informs aboutlead overload of organism.
Presence of cadmium in organisms of smelterworkers andmen fromcontrol group results from environmental exposition to cigarette smoke(active and passive smokers). This parameter did not significantdifference metal-exposed and control groups, for both groups was inrangeof proper referencevalues (for occupational exposed: cadmium inwhole blood: b5 μg/L, cadmium in urine: b5 μg/g of creatinine and fornon-exposed: cadmium in whole blood: b0.5 μg/L, cadmium in urine:b0.5 μg/g of creatinine).
Mean iron concentration in serum and cooper in serum weresignificant higher in a control group, but in both groups was in centralrange of proper reference values (for iron: 9–28.6 μmol/L and forcooper: 80–150 μg%). Decreased iron concentration in serum was not
spots in both protein profiles, the control group (A) and the metal-exposed group (B).n the two labeled images A and B is presented. Red was assigned to the gel of the controlgels is shown in yellow. The 3-dimensional rendering presents: spot 26-hemoglobin (pI7-unidentified protein (pI 6.73, Mw 10.17 kDa; not detected on the protein map personn-regulated six-fold in the metal-exposed group).
5323B. Kossowska et al. / Science of the Total Environment 408 (2010) 5317–5324
found in any person in both study groups, as well as anaemia.Inversely, mean calcium concentration in serumwas significant lowerin a metal-exposed group, but it was in central range of referencevalues (80–105 μg/mL) in both groups. Also, calcium concentration inserumwas not lower than the lowest reference value for all persons inboth study groups.
Own preliminary research was concentrated on searching forbiomarkers of preclinical changes in people working in a heavy-metalenvironment. The applied mathematical analysis based on clinicalparameters could reflect an underlying pathological state in theorganisms of people chronically exposed to the heavy metals lead,cadmium, and arsenic and allows estimating the degree of deviationfromhomeostasis (Fig. 1). Based on that analysis representative for bothstudy groups samples were selected for proteomic analysis. The firststep of own proteomic study was an optimization method of proteinseparation by the 2-DE technique. Fig. 2 shows the serum protein mapsof the control group (A) and the metal-exposed workers (B) made byoptimized two-dimensional gel electrophoresis. Silver-stainedmethodsare widely used to visualization of protein spots in proteomic analysis(Chen et al., 2007; Vydra et al., 2008; Hűtter et al., 2009; Rodríguez-Piñeiro et al., 2010). The method developed by Gromova and Celis(2006) was applied to visualize the proteins in silver-stained gel. Thismethod is characterized by high sensitivity and the possibility of furtheridentification of single protein spots by mass spectrometry. The silverstaining method of protein spot visualization allowed us to analyzedifferences in the expressions of proteins of high and low abundance.
Confirmatory evidence for the identity of protein spots was soughtby comparing the predicted isoelectric point and molecular weightfrom SWISS-2DPAGE database and those obtained by 2-DE. Compar-ison of the locations and volumes of protein spots between the metal-exposed and control groups, enabled obtaining information aboutdifferentially expressed proteins in serum, which provides a founda-tion for the discovery of serum associated biomarkers. From the panelof six selected proteins for which the changes in protein expressionwere greater than twofold, three potential markers with the highestdifferences were selected: hemoglobin-spot 26, unidentified protein-spot 27, unidentified protein-spot 25. The three selected proteinsbelonging to the group of low-abundance proteins of the humanserum proteome seem to be potential markers in the preclinicaldiagnosis of workers exposed to a mixed heavy-metal environment.
Zhai et al. (2005) analyzed serum proteomic profiles aimed atidentifying protein biomarkers in a group of smelter workers exposedto a mixture of As and Pb. Their study, combining SELDI Protein-Chiptechnology with a machine-learning algorithm, led to the identifica-tion of a panel of five discriminatory biomarkers (2097 Da, 2953 Da,3941 Da, 5338 Da, and 5639 Da) which belong to the low-abundanceserum proteome fraction. The results of our preliminary study andthose of Zhai et al. (2005) emphasize the significance of the low-abundance fraction of the serum proteome as a potential source ofbiomarkers of preclinical changes in healthy people chronicallyexposed to heavy metals. Proteins of that fraction play importantroles in biological processes and as such they could be valuablediagnostic biomarkers (Harper et al., 2004; Veenstra et al., 2005;Zheng et al., 2006; Luque-Garcia and Neubert, 2007; Yu et al., 2007;Pietrowska et al., 2009; Rodríguez-Piñeiro et al., 2010).
The successful implementation of proteomics biomarkers inoccupational and environmental health, similar to other biomarkersof exposure, requires appropriate study designs, thorough validationof markers, and careful interpretation of study results (Vlandreenet al., 2010). The results of this preliminary study show that the two-dimensional gel electrophoresis technique could be proper formonitoring preclinical changes in people exposed to heavy metalsin comparison with a control group and for searching for proteinmarkers. Limitation of own study is based on the fact that only twoserum proteomes were analyzed by two-dimensional gel electropho-resis. The two-dimensional gel electrophoresis is very sensitive
technique, but does not allow analysis of many samples simulta-neously (Yu et al., 2007; Rodríguez-Piñeiro et al., 2010). However,despite of that, in authors' opinion selected samples based on appliedmathematical analysis were enough representative for both groups.Differential protein spots between control group and metal-exposedgroup should be further identified with mass spectrometry analysis.This could demonstrate the reproducibility of the analysis techniqueand confirm that such early changes in spot intensity are notexperimental artifacts. Therefore larger proteomic study is urgentlyneeded to strengthen own pilot observations and to determine whatimpact heavy metals exposure might have on human serumproteome. The authors are planning to continue their research onthe low-molecular-weight fraction of the serum proteome. This couldincrease the probability of obtaining a group of proteins differenti-ating the studied protein profiles. It should be pointed out thatproteomic technology in combination with bioinformatics could allowobtaining a protein panel with higher sensitivity and specificity thansingle markers and thus more effective in the detection and diagnosisof early heavy-metal intoxication. Combining the results fromproteomic and metabonomic analyses is being planned in the future,similar to (Craig et al., 2006; Rantalainen et al., 2006; Vilasi et al.,2007). The application of pattern recognition in the analysis of thesedata should enable discriminating both groups and obtaining a panelof new markers with high sensitivity and specificity (Eriksson et al.,2004; Yizhak et al., 2010).
5. Conclusions
Results of own previous studies indicate the strong impact ofoccupational exposition to heavy metals to human health. The appliedmathematical analysis based on clinical parameters could reflect anunderlying pathological state in the organisms of people chronicallyexposed to the heavy metals lead, cadmium, and arsenic and allowsestimating the degree of deviation from homeostasis. It also allowedselecting serum samples for proteomic analysis by two-dimensional gelelectrophoresis from a large population. Proteomic profiling of serumsamples, one representing the metal-exposed group and the other acontrol group, revealed three potential protein markers of preclinicalchanges in persons chronically exposed to a mixture of heavy metals.Further studies are required to prove the results obtained so far and alsoto increase the panel of potential proteinmarkers and the identificationof single proteins using mass spectrometry. The identified proteinscould serve as potential markers of preclinical changes and could be inthe future included in biomonitoring of people exposed toheavymetals.They could also help to understand the biological roles of these proteinsin pathogenesis after exposure to metal mixtures.
References
Angenard G, Muczynski V, Coffigny H, Pairault C, Duquenne C, Frydman R, et al.Cadmium increases human fetal germ cell apoptosis. Environ Health Perspect2010;118:331–7.
Arita A, Costa M. Epigenetics in metal carcinogenesis: nickel, arsenic, chromium andcadmium. Metallomics 2009;1:222–8.
Bower JJ, Leonard SS, Shi X. Conference overview: molecular mechanisms of metaltoxicity and carcinogenesis. Mol Cell Biochem 2005;279(1–2):3-15.
CaudleWM, Pan S, Shi M, Quinn T, Hoekstra J, Beyer RP, et al. Proteomic identification ofproteins in the human brain: towards a more comprehensive understanding ofneurodegenerative disease. Proteomics Clin Appl 2008;2:1484–97.
Chen B, Dong JQ, Chen YJ, Wang JM, Tian J, Wang CB. Two-dimensional electrophoresisfor comparative proteomic analysis of human bile. Hepatobiliary Pancreat Dis Int2007;6:402–6.
Chlebda E, Antonowicz-Juchniewicz J, Andrzejak R. Wpływ ekspozycji zawodowej naołów i arsen na stężenie karotenoidów w surowicy u pracowników huty miedzi.Med Pr 2004;555:389–401.
Craig A, Sidaway J, Holmes E, Orton T, Jackson D, Rowlinson R, et al. Systems toxicology:integrated genomic, proteomic and metabonomic analysis of methapyrileneinduced hepatotoxicity in the rat. J Proteome Res 2006;5:1586–601.
De Vizcaya-Ruiza A, Barbiera O, Ruiz-Ramosb R, Cebrian ME. Biomarkers of oxidativestress and damage in human populations exposed to arsenic. Mutat Res 2009;674:85–92.

5324 B. Kossowska et al. / Science of the Total Environment 408 (2010) 5317–5324
Encarnación S, Hernández M, Martínez-Batallar G, Contreras S, del Carmen Vargas M,Mora J. Comparative proteomics using 2-D gel electrophoresis and massspectrometry as tools to dissect stimulons and regulons in bacteria with sequencedor partially sequenced genomes. Biol Proced 2005;7(1):117–35.
Eriksson L, Antti H, Gottfries J, Holmes E, Johansson E, Lindgren F, et al. Usingchemometrics for navigating in the large data sets of genomics, proteomics, andmetabonomics (gpm). Anal Bioanal Chem 2004;380:419–29.
Eum KD, Lee MS, Paek D. Cadmium in blood and hypertension. Sci Total Environ2008;407:147–53.
Ghezel-Ahmadi D, Engel A, Weidemann J, Budnik LT, Baur X, Frick U, et al. Heavy metalexposure in patients suffering from electromagnetic hypersensitivity. Sci TotalEnviron 2010;408:774–8.
Grant MM, Mistry N, Lunec J, Griffiths HR. Dose-dependent modulation of the T cellproteome by ascorbic acid. Br J Nutr 2007;97:19–26.
Gromova I, Celis JE. Protein detection in gels by silver staining: a procedure compatiblewith mass-spectrometry. In: Celis JE, Carter N, Hunter T, Simons K, Shotton D, SmallJV, editors. Cell biology. A laboratory handbook. San Diego: Academic Press; 2006.p. 219–23.
Harezlak J, WuMC, Wang M, Schwartzman A, Christiani DC, Lin X. Biomarker discoveryfor arsenic exposure using functional data. Analysis and feature learning of massspectrometry proteomic data. J Proteome Res 2008;7:217–24.
Harper RG, Workman SR, Schuetzner S, Timperman AT, Sutton JN. Low molecular-weight human serum proteome using ultrafiltration, isoelectric focusing, and massspectrometry. Electrophoresis 2004;25:1299–306.
Hegedus CM, Skibola CF, Warner M, Skibola DR, Alexander D, Lim S, et al. Decreasedurinary beta-defensis-1 expression as a biomarker of response to arsenic. ToxicolSci 2008;106(106):74–82.
Hűtter G, Letsch A, Nowak D, Poland J, Sinha P, Thiel E. High correlation of the proteomepatterns in bone marrow and peripheral blood blast cells in patients with acutemyeloid leukemia. J Transl Med 2009;7:7-14.
Jones SR, Atkin P, Holroyd C, Lutman E, Batlle JV, Wakeford R, et al. Lung cancermortality at UK tin smelter. Occup Med 2007;57(4):238–45.
Joo WA, Sul D, Lee DY, Lee E, Kim ChW. Proteomic analysis of plasma proteins ofworkers exposed to benzene. Mutat Res 2004;558:35–44.
Kanamoto T, Souchelnytskyi N, Kiuchi Y. Functional proteomics of failed filtering blebs.Mol Vis 2009;15:2762–70.
Kennedy S. Proteomic profiling from human samples: the body fluid alternative. ToxicolLett 2001;120:379–84.
Kim MR, Kim CW. Human blood plasma preparation for two-dimensional gelelectrophoresis. J Chromatogr B 2007;849:203–10.
Kossowska B, Dudka I, Gancarz R, Antonowicz-Juchniewicz J. Proteomic analysis ofprotein profiles in some pathological stages of the human organism. Postepy HigMed Dosw 2009;63:549–63.
Lantz CR, Lynch JB, Boitano S, Poplin GS, Littau S, Tsaprailis G, et al. Pulmonarybiomarkers based on alterations in protein expression after exposure to arsenic.Environ Health Perspect 2007;4:586–91.
Leammli UK. Cleavage of structural proteins during the assembly of the head ofbacteriophage T4. Nature 1970;227:680–5.
Lowry OH, Rosebrough NJ, Farr A, Randall RJ. Protein measurements with the folinphenol reagent. J Biol Chem 1951;193:265–75.
Luque-Garcia JL, Neubert TA. Sample preparation for serum/plasma profiling andbiomarker identification by mass spectrometry. J Chromatogr A 2007;1153:259–76.
Nagalla SR, Canick JA, Jacob T, Schneider KA, Reddy AP, Thomas A, et al. Proteomicanalysis of maternal serum in Down syndrome: identification of novel proteinbiomarkers. J Proteome Res 2007;6:1245–57.
Okano T, Kando T, Kakisaka T, Fujii K, Yamada M, Kato H, et al. Plasma proteomics oflung cancer by a linkage of multidimensional liquid chromatography and two-dimensional difference gel electrophoresis. Proteomics 2006;6:3938–48.
Patra RC, Swarup D, Kumar P, Nandi D, Naresh R, Ali SL. Milk trace elements in lactatingcows environmentally expose to higher level of lead and cadmium around differentindustrial units. Sci Total Environ 2008;404:36–43.
Pearson MA, Lu C, Schmotzer BJ, Waller LA, Riederer AM. Evaluation of physiologicalmeasures for correcting variation in urinary output: Implications for assessingenvironmental chemical exposure in children. J Expo Anal Environ Epidemiol2009;19:336–42.
Pietrowska M, Marczak L, Polanska J, Behrendt K, Nowicka E, Walaszczyk A, et al. Massspectrometry-based serum proteome pattern analysis in molecular diagnostics ofearly breast cancer. J Transl Med 2009;7:60–73.
Poręba R, Poręba M, Gać P, Pilecki W, Andrzejak R. Impaired endothelial functionassessed by flow-mediated vasodilatation in workers occupationally exposed tolead. Environ Toxicol Pharmacol 2010;29:266–70.
Prabakaran S, Wengenroth M, Lockstone HE, Lilley K, Leweke FM, Bahn S. 2-D DIGEanalysis of liver and red blood cells provides further evidence for oxidative stress inschizophrenia. J Proteome Res 2007;6:141–9.
Rantalainen M, Cloarec O, Beckonert O, Wilson ID, Jackson D, Tonge R, et al. Statisticallyintegrated metabonomic–proteomic studies on a human prostate cancer xenograftmodel in mice. J Proteome Res 2006;5:2642–55.
Raveendran M, Senthil D, Utama B, Shen Y, Wang J, Zhang Y, et al. Effect of water-soluble fraction of cigarette smoke on human aortic endothelial cells— a proteomicapproach. Cell Biol Toxicol 2005;21(1):27–40.
Röcken C, Ebert MP, Roessner A. Proteomics in pathology, research and practice. PatholRes Pract 2004;200(2):69–82.
Rodríguez-Piñeiro AM, Blanco-Prieto S, Sánchez-Otero N, Rodríguez-Berrocal FJ, Páezde la Cadena M. On the identification of biomarkers for non-small cell lung cancerin serum and pleural effusion. J Proteomics 2010;73:1511–22.
Schwarz E, Bahn S. Biomarker discovery in psychiatric disorders. Electrophoresis2008;29:2884–90.
Sirot V, Samieri C, Volatier JC, Leblanc JC. Cadmium dietary intake and biomarker data inFrench high seafood consumers. J Expo Sci Environ Epidemiol 2008;18:400–9.
Steel LF, Shumpert D, Trotter M, Seeholzer SH, Evans AA, LondonWT. A strategy for thecomparative analysis of serum proteomes for the discovery of biomarkers forhepatocellular carcinoma. Proteomics 2003;3:601–9.
Szymańska-Chabowska A, Antonowicz-Juchniewicz J, Andrzejak R. The concentrationof selected cancer markers (TPA, TPS, CYFRA 21-1, CEA) in workers occupationallyexposed to arsenic (As) and some heavy metals (Pb, Cd) during a two-yearobservation study. Int J Occup Med Environ Health 2007;21(3):1-11.
Szymańska-Chabowska A, Beck A, Poręba R, Andrzejak R, Antonowicz-Juchniewicz J.Evaluation of DNA damage in people occupationally expose to arsenic and someheavy metals. Polish J Environ Stud 2009;18(6):1131–9.
Talio MC, Luconi MO, Masi AN, Fernández LP. Cadmium monitoring in saliva and urineas indicator of smoking addiction. Sci Total Environ 2010;408:3125–32.
Thambisetty M, Hye A, Foy C, Daly E, Glover A, Cooper A, et al. Proteome-basedidentification of plasma proteins associated with hippocampal metabolism in earlyAlzheimer's disease. J Neurol 2008;255:1712–20.
Tsangaris GT, Karamessinis P, Kolialexi A, Garbis SD, Antsaklis A, Mavrou A, et al.Proteomic analysis of amniotic fluid in pregnancies with Down syndrome.Proteomics 2006;6:4410–9.
Veenstra TD, Conrads TP, Hood BL, Avellino AM, Ellenbogen RG, Morrison RS, et al.Biomarkers: mining the biofluid proteome. Mol Cell Proteomics 2005;4:409–18.
Vilasi A, Cutillas PR, Maher AD, Zirah SFM, Capasso G, Norden AWG, et al. Combinedproteomic and metabonomic studies in three genetic forms of the renal Fanconisyndrome. Am J Physiol Renal Physiol 2007;293:F456–67.
Vinceti M, Veturelli M, Sighinolfi C, Trerotoli P, Bonvicini F, Ferrari A, et al. Case–controlof toenail cadmium and prostate risk in Italy. Sci Total Environ 2007;373:77–81.
Vlandreen J, Moore LE, Smith MT, Lan Q, Zhang L, Skibola CF, et al. Application of OMICStechnologies in occupational and environmental health research; current statusand projections. Occup Environ Med 2010;67:136–43.
Vydra J, Selicharová I, Smutná K, Šanda M, Matoušková E, Buršíkova, et al. Two-dimensional electrophoretic comparison of metastatic and non-metastatic humanbreast tumors using in vitro cultured epithelial cells derived from the cancertissues. BMC Cancer 2008;8:107–20.
Were FH, Njue W, Murungi J, Wanjau R. Use of human nails as bio-indicator of heavymetals environmental exposure among school age children in Kenya. Sci TotalEnviron 2008;393:376–84.
Yamagiwa H, Sarkar G, Charlesworth C, McCormick DJ. Two-dimensional gelelectrophoresis of synovial fluid: method for detecting candidate protein markersfor osteoarthritis. J Orthop Sci 2003;8:482–90.
Yizhak K, Benyamini T, Liebermeister W, Ruppin E, Shlomi T. Integrating quantitativeproteomics and metabolomics with a genome-scale metabolic network model.Bioinformatics 2010;26:i255–60.
Yu M, Wang X, Zhang F, Shang Y, Du Y, Chen H, et al. Proteomic analysis of the serum inpatients with idiopathic pulmonary arterial hypertension. J Zhejiang Univ Sci B2007;8(4):221–7.
Zellner M, Veitinger M, Umlauf E. The role of proteomics in dementia and Alzheimer'sdisease. Acta Neuropathol 2009;118:181–95.
Zhai R, Su S, Lu X, Liao R, Ge X, He M, et al. Proteomic profiling in the sera of workersoccupationally exposed to arsenic and lead: identification of potential biomarkers.Biometals 2005;18:603–13.
Zheng X, Baker H, HancockWS. Analysis of the lowmolecular weight serum peptidomeusing ultrafiltration and a hybrid ion trap-Fourier transform mass spectrometer.J Chromatogr A 2006;1120:173–84.