Cloning and Expression of a Hexose Transporter Gene Expressed during the Ripening of Grape Berry
Proteomic Analysis of Grape Berry Cell Cultures Revealsthat Developmentally Regulated Ripening RelatedProcesses Can Be Studied Using Cultured CellsRamaschandra G. Sharathchandra1, Charmaine Stander1, Dan Jacobson1, Bongani Ndimba2, Melane A.
Vivier1*
1 Department of Viticulture and Oenology, Institute for Wine Biotechnology, Stellenbosch University, Stellenbosch, South Africa, 2 Proteomics Research Laboratory,
Department of Biotechnology, University of Western Cape, Bellville, South Africa
Abstract
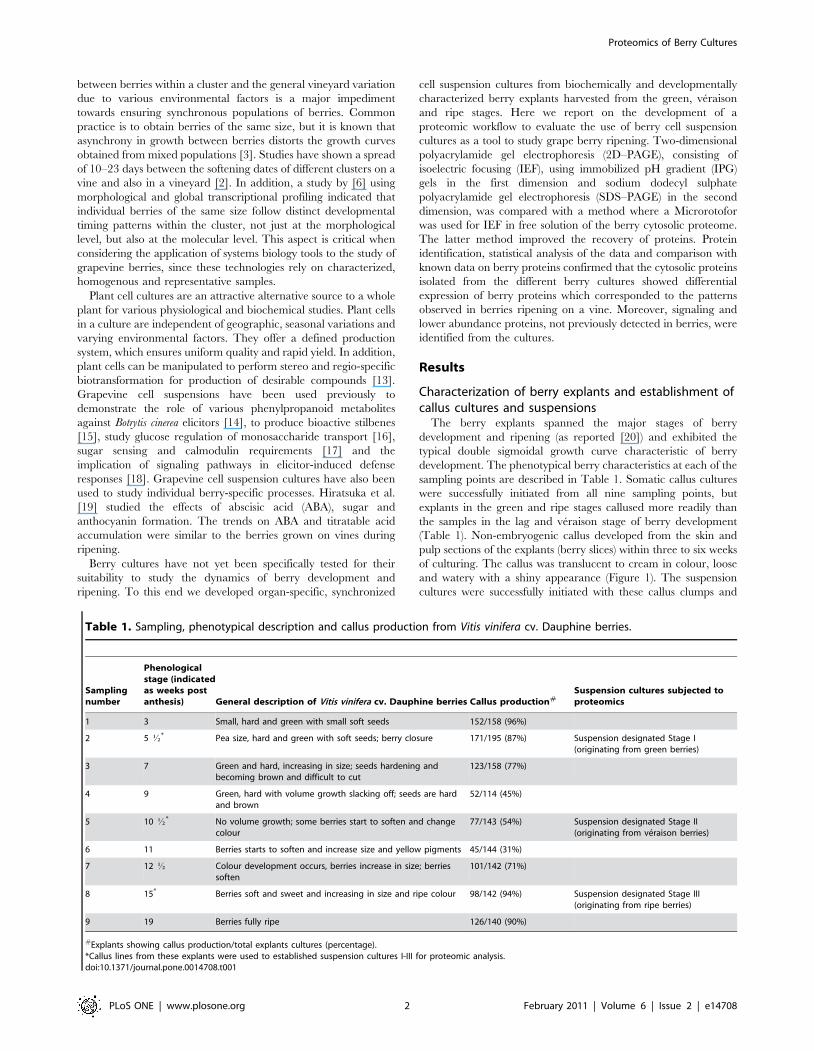
Background: This work describes a proteomics profiling method, optimized and applied to berry cell suspensions toevaluate organ-specific cultures as a platform to study grape berry ripening. Variations in berry ripening within a cluster(s)on a vine and in a vineyard are a major impediment towards complete understanding of the functional processes thatcontrol ripening, specifically when a characterized and homogenous sample is required. Berry cell suspensions couldovercome some of these problems, but their suitability as a model system for berry development and ripening needs to beestablished first.
Methodology/Principal Findings: In this study we report on the proteomic evaluation of the cytosolic proteins obtainedfrom synchronized cell suspension cultures that were established from callus lines originating from green, veraison and ripeVitis vinifera berry explants. The proteins were separated using liquid phase IEF in a Microrotofor cell and SDS PAGE. Thismethod proved superior to gel-based 2DE. Principal component analysis confirmed that biological and technical repeatsgrouped tightly and importantly, showed that the proteomes of berry cultures originating from the different growth/ripening stages were distinct. A total of twenty six common bands were selected after band matching between differentgrowth stages and twenty two of these bands were positively identified. Thirty two % of the identified proteins are currentlyannotated as hypothetical. The differential expression profile of the identified proteins, when compared with publishedliterature on grape berry ripening, suggested common trends in terms of relative abundance in the different developmentalstages between real berries and cell suspensions.
Conclusions: The advantages of having suspension cultures that accurately mimic specific developmental stages areprofound and could significantly contribute to the study of the intricate regulatory and signaling networks responsible forberry development and ripening.
Citation: Sharathchandra RG, Stander C, Jacobson D, Ndimba B, Vivier MA (2011) Proteomic Analysis of Grape Berry Cell Cultures Reveals that DevelopmentallyRegulated Ripening Related Processes Can Be Studied Using Cultured Cells. PLoS ONE 6(2): e14708. doi:10.1371/journal.pone.0014708
Editor: Hany A. El-Shemy, Cairo University, Egypt
Received July 8, 2010; Accepted January 4, 2011; Published February 17, 2011
Copyright: � 2011 Sharathchandra et al. This is an open-access article distributed under the terms of the Creative Commons Attribution License, which permitsunrestricted use, distribution, and reproduction in any medium, provided the original author and source are credited.
Funding: The work was financially supported by the Wine Industry Network of Expertise and Technology (Winetech) and the Table Grape Industry (SATI), theNational Research Foundation of South Africa, the South African Technology and Human Resources for Industry Programme (THRIP) and the Claude LeonFoundation. Winetech and SATI are the official overarching coordinators of all research funding of the Wine Industry and Table Grape Industry respectively. Noneof the funders had any role in the study design, data collection and analysis, or the decision to publish, or the preparation of the manuscript.
Competing Interests: The authors have declared that no competing interests exist.
* E-mail: [email protected]
Introduction
Grapes are among the most widely cultivated fruit crops in the
world. Grape berries like other non-climacteric fruits undergo a
complex set of dynamic, physical, physiological and biochemical
changes during development, which can be divided into three
major phases. The double sigmoidal pattern of berry development
begins with a first growth phase characterized by berry size
increases due to frequent cell division and subsequent cell
expansion. The initial growth stage is followed by a short lag
phase characterized by a lack of cell expansion and low
biochemical activity. The end of the lag phase is termed veraison
and is an important stage of molecular and metabolic switching
[1,2]. The second period of sigmoidal growth follows; in this
ripening phase acid levels decrease and sugars begin to accumulate
while the berry softens and produces ripening pigments and aroma
compounds [3].
Recently a number of investigations have been carried out to
understand the complex changes in gene and protein expression,
as well as metabolite profiles that occur during berry development.
Results obtained using ESTs (expressed sequence tags) [4];
Affymetrix Vitis Gene-Chips [5,6], metabolite analysis [7], two
dimensional gel electrophoresis [8,9,10,11] and isobaric tags for
relative and absolute quantification (iTRAQ) [12] demonstrated
dynamic changes in the transcriptome and proteome during berry
ripening.
The investigations mentioned have either harvested berries at
single time points or throughout berry development. Variations
PLoS ONE | www.plosone.org 1 February 2011 | Volume 6 | Issue 2 | e14708
between berries within a cluster and the general vineyard variation
due to various environmental factors is a major impediment
towards ensuring synchronous populations of berries. Common
practice is to obtain berries of the same size, but it is known that
asynchrony in growth between berries distorts the growth curves
obtained from mixed populations [3]. Studies have shown a spread
of 10–23 days between the softening dates of different clusters on a
vine and also in a vineyard [2]. In addition, a study by [6] using
morphological and global transcriptional profiling indicated that
individual berries of the same size follow distinct developmental
timing patterns within the cluster, not just at the morphological
level, but also at the molecular level. This aspect is critical when
considering the application of systems biology tools to the study of
grapevine berries, since these technologies rely on characterized,
homogenous and representative samples.
Plant cell cultures are an attractive alternative source to a whole
plant for various physiological and biochemical studies. Plant cells
in a culture are independent of geographic, seasonal variations and
varying environmental factors. They offer a defined production
system, which ensures uniform quality and rapid yield. In addition,
plant cells can be manipulated to perform stereo and regio-specific
biotransformation for production of desirable compounds [13].
Grapevine cell suspensions have been used previously to
demonstrate the role of various phenylpropanoid metabolites
against Botrytis cinerea elicitors [14], to produce bioactive stilbenes
[15], study glucose regulation of monosaccharide transport [16],
sugar sensing and calmodulin requirements [17] and the
implication of signaling pathways in elicitor-induced defense
responses [18]. Grapevine cell suspension cultures have also been
used to study individual berry-specific processes. Hiratsuka et al.
[19] studied the effects of abscisic acid (ABA), sugar and
anthocyanin formation. The trends on ABA and titratable acid
accumulation were similar to the berries grown on vines during
ripening.
Berry cultures have not yet been specifically tested for their
suitability to study the dynamics of berry development and
ripening. To this end we developed organ-specific, synchronized
cell suspension cultures from biochemically and developmentally
characterized berry explants harvested from the green, veraison
and ripe stages. Here we report on the development of a
proteomic workflow to evaluate the use of berry cell suspension
cultures as a tool to study grape berry ripening. Two-dimensional
polyacrylamide gel electrophoresis (2D–PAGE), consisting of
isoelectric focusing (IEF), using immobilized pH gradient (IPG)
gels in the first dimension and sodium dodecyl sulphate
polyacrylamide gel electrophoresis (SDS–PAGE) in the second
dimension, was compared with a method where a Microrotofor
was used for IEF in free solution of the berry cytosolic proteome.
The latter method improved the recovery of proteins. Protein
identification, statistical analysis of the data and comparison with
known data on berry proteins confirmed that the cytosolic proteins
isolated from the different berry cultures showed differential
expression of berry proteins which corresponded to the patterns
observed in berries ripening on a vine. Moreover, signaling and
lower abundance proteins, not previously detected in berries, were
identified from the cultures.
Results
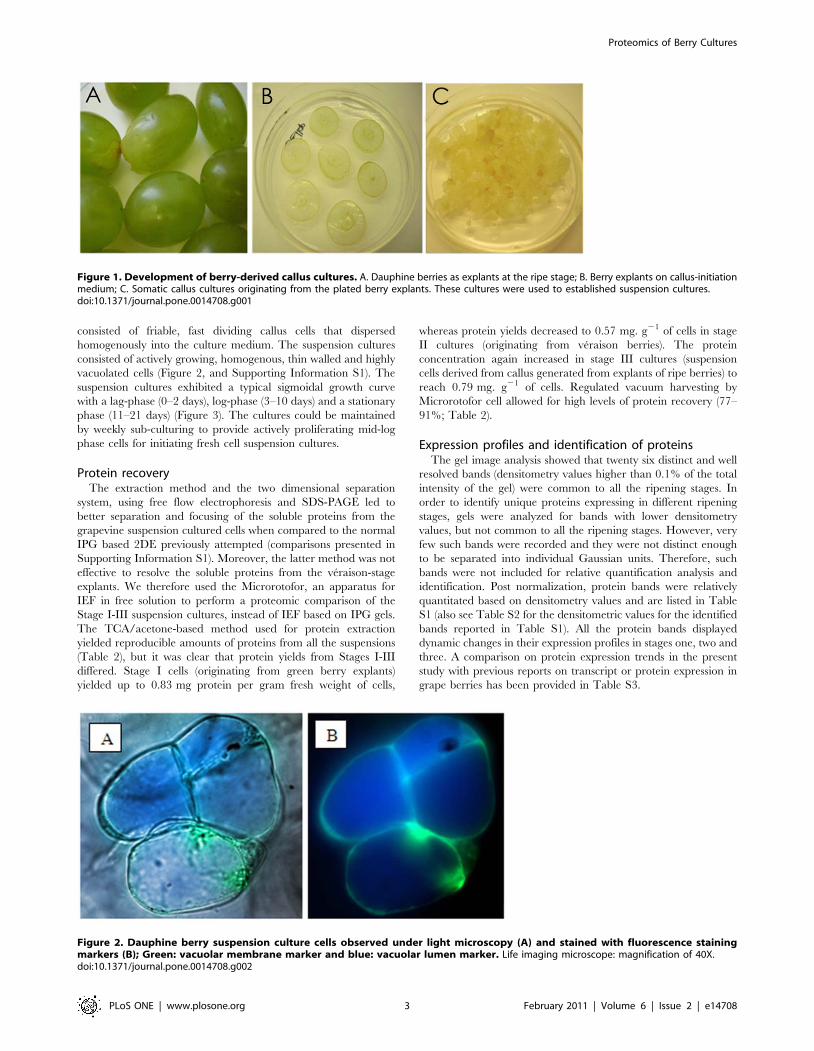
Characterization of berry explants and establishment ofcallus cultures and suspensions
The berry explants spanned the major stages of berry
development and ripening (as reported [20]) and exhibited the
typical double sigmoidal growth curve characteristic of berry
development. The phenotypical berry characteristics at each of the
sampling points are described in Table 1. Somatic callus cultures
were successfully initiated from all nine sampling points, but
explants in the green and ripe stages callused more readily than
the samples in the lag and veraison stage of berry development
(Table 1). Non-embryogenic callus developed from the skin and
pulp sections of the explants (berry slices) within three to six weeks
of culturing. The callus was translucent to cream in colour, loose
and watery with a shiny appearance (Figure 1). The suspension
cultures were successfully initiated with these callus clumps and
Table 1. Sampling, phenotypical description and callus production from Vitis vinifera cv. Dauphine berries.
Samplingnumber
Phenologicalstage (indicatedas weeks postanthesis) General description of Vitis vinifera cv. Dauphine berries Callus production#
Suspension cultures subjected toproteomics
1 3 Small, hard and green with small soft seeds 152/158 (96%)
2 5 K* Pea size, hard and green with soft seeds; berry closure 171/195 (87%) Suspension designated Stage I(originating from green berries)
3 7 Green and hard, increasing in size; seeds hardening andbecoming brown and difficult to cut
123/158 (77%)
4 9 Green, hard with volume growth slacking off; seeds are hardand brown
52/114 (45%)
5 10 K* No volume growth; some berries start to soften and changecolour
77/143 (54%) Suspension designated Stage II(originating from veraison berries)
6 11 Berries starts to soften and increase size and yellow pigments 45/144 (31%)
7 12 K Colour development occurs, berries increase in size; berriessoften
101/142 (71%)
8 15* Berries soft and sweet and increasing in size and ripe colour 98/142 (94%) Suspension designated Stage III(originating from ripe berries)
9 19 Berries fully ripe 126/140 (90%)
#Explants showing callus production/total explants cultures (percentage).*Callus lines from these explants were used to established suspension cultures I-III for proteomic analysis.doi:10.1371/journal.pone.0014708.t001
Proteomics of Berry Cultures
PLoS ONE | www.plosone.org 2 February 2011 | Volume 6 | Issue 2 | e14708
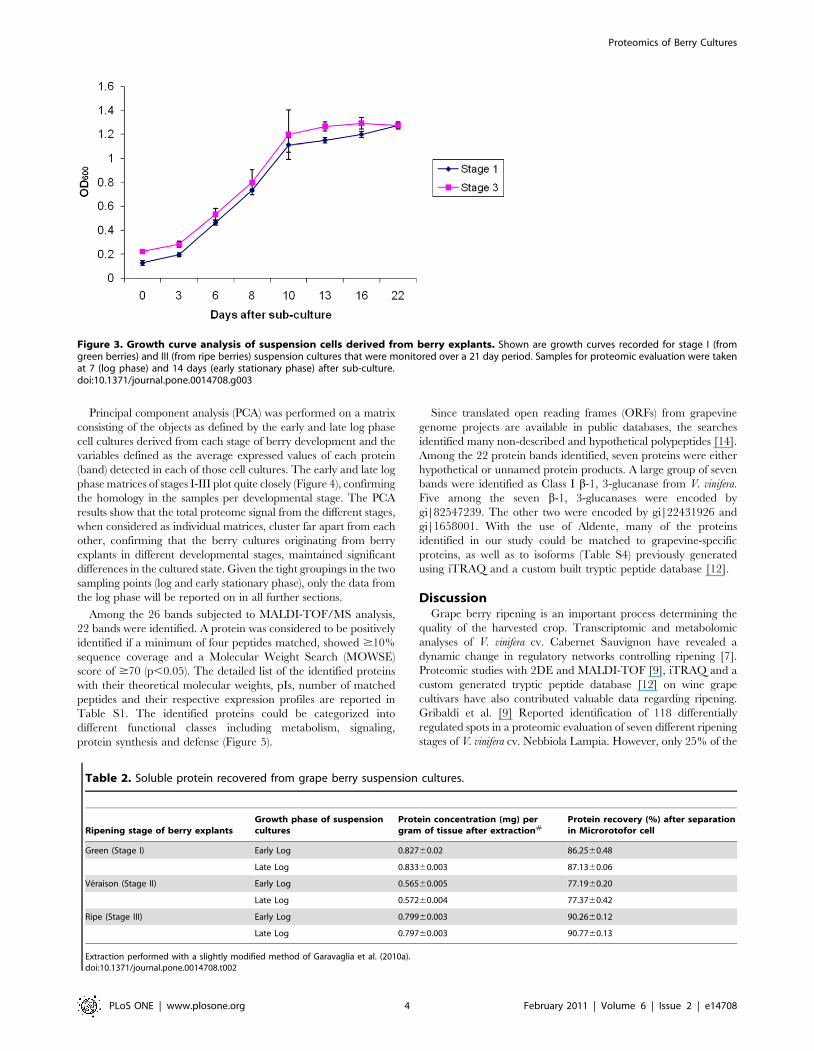
consisted of friable, fast dividing callus cells that dispersed
homogenously into the culture medium. The suspension cultures
consisted of actively growing, homogenous, thin walled and highly
vacuolated cells (Figure 2, and Supporting Information S1). The
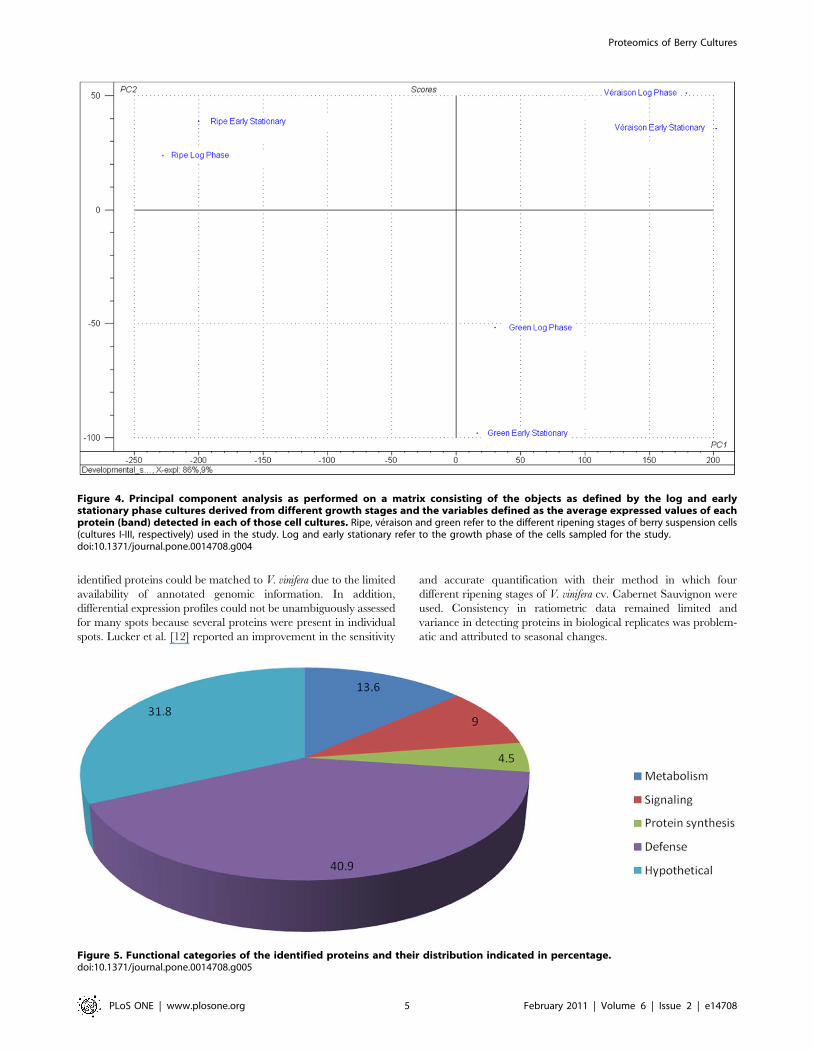
suspension cultures exhibited a typical sigmoidal growth curve
with a lag-phase (0–2 days), log-phase (3–10 days) and a stationary
phase (11–21 days) (Figure 3). The cultures could be maintained
by weekly sub-culturing to provide actively proliferating mid-log
phase cells for initiating fresh cell suspension cultures.
Protein recoveryThe extraction method and the two dimensional separation
system, using free flow electrophoresis and SDS-PAGE led to
better separation and focusing of the soluble proteins from the
grapevine suspension cultured cells when compared to the normal
IPG based 2DE previously attempted (comparisons presented in
Supporting Information S1). Moreover, the latter method was not
effective to resolve the soluble proteins from the veraison-stage
explants. We therefore used the Microrotofor, an apparatus for
IEF in free solution to perform a proteomic comparison of the
Stage I-III suspension cultures, instead of IEF based on IPG gels.
The TCA/acetone-based method used for protein extraction
yielded reproducible amounts of proteins from all the suspensions
(Table 2), but it was clear that protein yields from Stages I-III
differed. Stage I cells (originating from green berry explants)
yielded up to 0.83 mg protein per gram fresh weight of cells,
whereas protein yields decreased to 0.57 mg. g21 of cells in stage
II cultures (originating from veraison berries). The protein
concentration again increased in stage III cultures (suspension
cells derived from callus generated from explants of ripe berries) to
reach 0.79 mg. g21 of cells. Regulated vacuum harvesting by
Microrotofor cell allowed for high levels of protein recovery (77–
91%; Table 2).
Expression profiles and identification of proteinsThe gel image analysis showed that twenty six distinct and well
resolved bands (densitometry values higher than 0.1% of the total
intensity of the gel) were common to all the ripening stages. In
order to identify unique proteins expressing in different ripening
stages, gels were analyzed for bands with lower densitometry
values, but not common to all the ripening stages. However, very
few such bands were recorded and they were not distinct enough
to be separated into individual Gaussian units. Therefore, such
bands were not included for relative quantification analysis and
identification. Post normalization, protein bands were relatively
quantitated based on densitometry values and are listed in Table
S1 (also see Table S2 for the densitometric values for the identified
bands reported in Table S1). All the protein bands displayed
dynamic changes in their expression profiles in stages one, two and
three. A comparison on protein expression trends in the present
study with previous reports on transcript or protein expression in
grape berries has been provided in Table S3.
Figure 2. Dauphine berry suspension culture cells observed under light microscopy (A) and stained with fluorescence stainingmarkers (B); Green: vacuolar membrane marker and blue: vacuolar lumen marker. Life imaging microscope: magnification of 40X.doi:10.1371/journal.pone.0014708.g002
Figure 1. Development of berry-derived callus cultures. A. Dauphine berries as explants at the ripe stage; B. Berry explants on callus-initiationmedium; C. Somatic callus cultures originating from the plated berry explants. These cultures were used to established suspension cultures.doi:10.1371/journal.pone.0014708.g001
Proteomics of Berry Cultures
PLoS ONE | www.plosone.org 3 February 2011 | Volume 6 | Issue 2 | e14708
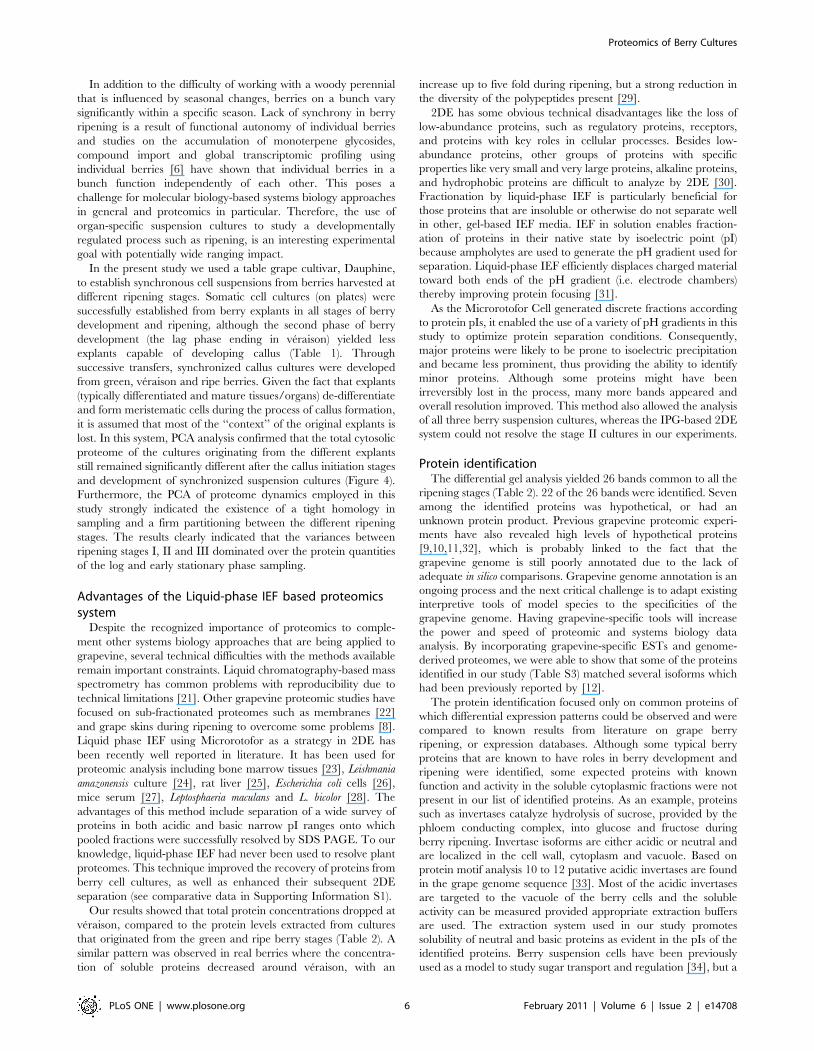
Principal component analysis (PCA) was performed on a matrix
consisting of the objects as defined by the early and late log phase
cell cultures derived from each stage of berry development and the
variables defined as the average expressed values of each protein
(band) detected in each of those cell cultures. The early and late log
phase matrices of stages I-III plot quite closely (Figure 4), confirming
the homology in the samples per developmental stage. The PCA
results show that the total proteome signal from the different stages,
when considered as individual matrices, cluster far apart from each
other, confirming that the berry cultures originating from berry
explants in different developmental stages, maintained significant
differences in the cultured state. Given the tight groupings in the two
sampling points (log and early stationary phase), only the data from
the log phase will be reported on in all further sections.
Among the 26 bands subjected to MALDI-TOF/MS analysis,
22 bands were identified. A protein was considered to be positively
identified if a minimum of four peptides matched, showed $10%
sequence coverage and a Molecular Weight Search (MOWSE)
score of $70 (p,0.05). The detailed list of the identified proteins
with their theoretical molecular weights, pIs, number of matched
peptides and their respective expression profiles are reported in
Table S1. The identified proteins could be categorized into
different functional classes including metabolism, signaling,
protein synthesis and defense (Figure 5).
Since translated open reading frames (ORFs) from grapevine
genome projects are available in public databases, the searches
identified many non-described and hypothetical polypeptides [14].
Among the 22 protein bands identified, seven proteins were either
hypothetical or unnamed protein products. A large group of seven
bands were identified as Class I b-1, 3-glucanase from V. vinifera.
Five among the seven b-1, 3-glucanases were encoded by
gi|82547239. The other two were encoded by gi|22431926 and
gi|1658001. With the use of Aldente, many of the proteins
identified in our study could be matched to grapevine-specific
proteins, as well as to isoforms (Table S4) previously generated
using iTRAQ and a custom built tryptic peptide database [12].
DiscussionGrape berry ripening is an important process determining the
quality of the harvested crop. Transcriptomic and metabolomic
analyses of V. vinifera cv. Cabernet Sauvignon have revealed a
dynamic change in regulatory networks controlling ripening [7].
Proteomic studies with 2DE and MALDI-TOF [9], iTRAQ and a
custom generated tryptic peptide database [12] on wine grape
cultivars have also contributed valuable data regarding ripening.
Gribaldi et al. [9] Reported identification of 118 differentially
regulated spots in a proteomic evaluation of seven different ripening
stages of V. vinifera cv. Nebbiola Lampia. However, only 25% of the
Table 2. Soluble protein recovered from grape berry suspension cultures.
Ripening stage of berry explantsGrowth phase of suspensioncultures
Protein concentration (mg) pergram of tissue after extraction#
Protein recovery (%) after separationin Microrotofor cell
Green (Stage I) Early Log 0.82760.02 86.2560.48
Late Log 0.83360.003 87.1360.06
Veraison (Stage II) Early Log 0.56560.005 77.1960.20
Late Log 0.57260.004 77.3760.42
Ripe (Stage III) Early Log 0.79960.003 90.2660.12
Late Log 0.79760.003 90.7760.13
Extraction performed with a slightly modified method of Garavaglia et al. (2010a).doi:10.1371/journal.pone.0014708.t002
Figure 3. Growth curve analysis of suspension cells derived from berry explants. Shown are growth curves recorded for stage I (fromgreen berries) and III (from ripe berries) suspension cultures that were monitored over a 21 day period. Samples for proteomic evaluation were takenat 7 (log phase) and 14 days (early stationary phase) after sub-culture.doi:10.1371/journal.pone.0014708.g003
Proteomics of Berry Cultures
PLoS ONE | www.plosone.org 4 February 2011 | Volume 6 | Issue 2 | e14708
identified proteins could be matched to V. vinifera due to the limited
availability of annotated genomic information. In addition,
differential expression profiles could not be unambiguously assessed
for many spots because several proteins were present in individual
spots. Lucker et al. [12] reported an improvement in the sensitivity
and accurate quantification with their method in which four
different ripening stages of V. vinifera cv. Cabernet Sauvignon were
used. Consistency in ratiometric data remained limited and
variance in detecting proteins in biological replicates was problem-
atic and attributed to seasonal changes.
Figure 4. Principal component analysis as performed on a matrix consisting of the objects as defined by the log and earlystationary phase cultures derived from different growth stages and the variables defined as the average expressed values of eachprotein (band) detected in each of those cell cultures. Ripe, veraison and green refer to the different ripening stages of berry suspension cells(cultures I-III, respectively) used in the study. Log and early stationary refer to the growth phase of the cells sampled for the study.doi:10.1371/journal.pone.0014708.g004
Figure 5. Functional categories of the identified proteins and their distribution indicated in percentage.doi:10.1371/journal.pone.0014708.g005
Proteomics of Berry Cultures
PLoS ONE | www.plosone.org 5 February 2011 | Volume 6 | Issue 2 | e14708
In addition to the difficulty of working with a woody perennial
that is influenced by seasonal changes, berries on a bunch vary
significantly within a specific season. Lack of synchrony in berry
ripening is a result of functional autonomy of individual berries
and studies on the accumulation of monoterpene glycosides,
compound import and global transcriptomic profiling using
individual berries [6] have shown that individual berries in a
bunch function independently of each other. This poses a
challenge for molecular biology-based systems biology approaches
in general and proteomics in particular. Therefore, the use of
organ-specific suspension cultures to study a developmentally
regulated process such as ripening, is an interesting experimental
goal with potentially wide ranging impact.
In the present study we used a table grape cultivar, Dauphine,
to establish synchronous cell suspensions from berries harvested at
different ripening stages. Somatic cell cultures (on plates) were
successfully established from berry explants in all stages of berry
development and ripening, although the second phase of berry
development (the lag phase ending in veraison) yielded less
explants capable of developing callus (Table 1). Through
successive transfers, synchronized callus cultures were developed
from green, veraison and ripe berries. Given the fact that explants
(typically differentiated and mature tissues/organs) de-differentiate
and form meristematic cells during the process of callus formation,
it is assumed that most of the ‘‘context’’ of the original explants is
lost. In this system, PCA analysis confirmed that the total cytosolic
proteome of the cultures originating from the different explants
still remained significantly different after the callus initiation stages
and development of synchronized suspension cultures (Figure 4).
Furthermore, the PCA of proteome dynamics employed in this
study strongly indicated the existence of a tight homology in
sampling and a firm partitioning between the different ripening
stages. The results clearly indicated that the variances between
ripening stages I, II and III dominated over the protein quantities
of the log and early stationary phase sampling.
Advantages of the Liquid-phase IEF based proteomicssystem
Despite the recognized importance of proteomics to comple-
ment other systems biology approaches that are being applied to
grapevine, several technical difficulties with the methods available
remain important constraints. Liquid chromatography-based mass
spectrometry has common problems with reproducibility due to
technical limitations [21]. Other grapevine proteomic studies have
focused on sub-fractionated proteomes such as membranes [22]
and grape skins during ripening to overcome some problems [8].
Liquid phase IEF using Microrotofor as a strategy in 2DE has
been recently well reported in literature. It has been used for
proteomic analysis including bone marrow tissues [23], Leishmania
amazonensis culture [24], rat liver [25], Escherichia coli cells [26],
mice serum [27], Leptosphaeria maculans and L. bicolor [28]. The
advantages of this method include separation of a wide survey of
proteins in both acidic and basic narrow pI ranges onto which
pooled fractions were successfully resolved by SDS PAGE. To our
knowledge, liquid-phase IEF had never been used to resolve plant
proteomes. This technique improved the recovery of proteins from
berry cell cultures, as well as enhanced their subsequent 2DE
separation (see comparative data in Supporting Information S1).
Our results showed that total protein concentrations dropped at
veraison, compared to the protein levels extracted from cultures
that originated from the green and ripe berry stages (Table 2). A
similar pattern was observed in real berries where the concentra-
tion of soluble proteins decreased around veraison, with an
increase up to five fold during ripening, but a strong reduction in
the diversity of the polypeptides present [29].
2DE has some obvious technical disadvantages like the loss of
low-abundance proteins, such as regulatory proteins, receptors,
and proteins with key roles in cellular processes. Besides low-
abundance proteins, other groups of proteins with specific
properties like very small and very large proteins, alkaline proteins,
and hydrophobic proteins are difficult to analyze by 2DE [30].
Fractionation by liquid-phase IEF is particularly beneficial for
those proteins that are insoluble or otherwise do not separate well
in other, gel-based IEF media. IEF in solution enables fraction-
ation of proteins in their native state by isoelectric point (pI)
because ampholytes are used to generate the pH gradient used for
separation. Liquid-phase IEF efficiently displaces charged material
toward both ends of the pH gradient (i.e. electrode chambers)
thereby improving protein focusing [31].
As the Microrotofor Cell generated discrete fractions according
to protein pIs, it enabled the use of a variety of pH gradients in this
study to optimize protein separation conditions. Consequently,
major proteins were likely to be prone to isoelectric precipitation
and became less prominent, thus providing the ability to identify
minor proteins. Although some proteins might have been
irreversibly lost in the process, many more bands appeared and
overall resolution improved. This method also allowed the analysis
of all three berry suspension cultures, whereas the IPG-based 2DE
system could not resolve the stage II cultures in our experiments.
Protein identificationThe differential gel analysis yielded 26 bands common to all the
ripening stages (Table 2). 22 of the 26 bands were identified. Seven
among the identified proteins was hypothetical, or had an
unknown protein product. Previous grapevine proteomic experi-
ments have also revealed high levels of hypothetical proteins
[9,10,11,32], which is probably linked to the fact that the
grapevine genome is still poorly annotated due to the lack of
adequate in silico comparisons. Grapevine genome annotation is an
ongoing process and the next critical challenge is to adapt existing
interpretive tools of model species to the specificities of the
grapevine genome. Having grapevine-specific tools will increase
the power and speed of proteomic and systems biology data
analysis. By incorporating grapevine-specific ESTs and genome-
derived proteomes, we were able to show that some of the proteins
identified in our study (Table S3) matched several isoforms which
had been previously reported by [12].
The protein identification focused only on common proteins of
which differential expression patterns could be observed and were
compared to known results from literature on grape berry
ripening, or expression databases. Although some typical berry
proteins that are known to have roles in berry development and
ripening were identified, some expected proteins with known
function and activity in the soluble cytoplasmic fractions were not
present in our list of identified proteins. As an example, proteins
such as invertases catalyze hydrolysis of sucrose, provided by the
phloem conducting complex, into glucose and fructose during
berry ripening. Invertase isoforms are either acidic or neutral and
are localized in the cell wall, cytoplasm and vacuole. Based on
protein motif analysis 10 to 12 putative acidic invertases are found
in the grape genome sequence [33]. Most of the acidic invertases
are targeted to the vacuole of the berry cells and the soluble
activity can be measured provided appropriate extraction buffers
are used. The extraction system used in our study promotes
solubility of neutral and basic proteins as evident in the pIs of the
identified proteins. Berry suspension cells have been previously
used as a model to study sugar transport and regulation [34], but a
Proteomics of Berry Cultures
PLoS ONE | www.plosone.org 6 February 2011 | Volume 6 | Issue 2 | e14708
more detailed investigation using modified extraction systems
would be necessary to enrich for other proteins including
invertases with different properties in a model cell suspension
culture. In addition, sub-cellular fractionation of the cell walls
would also be essential in order to understand the role of cell wall
invertases as they constitute 4% of the total invertase activity [35].
The proportion of proteins involved in stress responses was
higher in our list of identified proteins, if compared to the
functional distributions previously observed in the proteome of
whole berries [9] and isolated mesocarp tissues [36] in which these
proteins ranged from 8% to 19% of the identified spots. Our
results however paralleled a recent large-scale mRNA expression
analysis on the three main berry tissues [32], as well as the skin
proteome analysis of cultivar Cabernet Sauvignon where most of
the proteins over-expressed at maturity were involved in pathogen
response [8].
Proteins identified in V. viniferaCytoplasmic malate dehydrogenase (MDH) identified in our
study is the principal enzyme responsible for malate metabolism.
Malate is actively synthesized and accumulates until veraison in
the grape berry, while it becomes a preferential substrate for
respiration at the onset of ripening. The cytoplasmic malate
dehydrogenase (MDH) is thought to be responsible for malate
catabolism and the mitochondrial isoform to be involved in malate
synthesis [37]. Cytosolic NADP-dependent malic enzyme (ME)
activity, which converts malate into pyruvate and CO2, is already
high before veraison and is unlikely to control malate breakdown
[38]. In our study the MDH expression is low at stage I, increases
at stage II and is slightly higher in stage III. This corresponds with
previously reported enzyme assays and proteomic expression
profiles (Table S3).
Levels of glutamate dehydrogenase (GDH) from V. vinifera
identified in our study were very high at stage I, decreased sharply
in stage II and remained constant thereafter. The role of GDH in
plants is still unclear; it is thought to play a role in glutamate
degradation and metabolic recycling of ammonia, but it could also
have an accessory role in ammonia assimilation. In grape berries,
GDH activity peaks before veraison and the protein expression
data confirmed the trend seen by [9]. Although the function of
GDH in the cytosol is still unknown, it is possible that when it is
induced in this cellular compartment, it plays an important role in
the recycling of carbon and nitrogen molecules in source organs
and/or at specific stages of plant development. GDH protein was
also visualized in multivesicular bodies present in the cytosol of the
senescing flower receptacle. The appearance of GDH in the
cytosol at late stages of flower development was concomitant with
the induction of both the enzyme activity and the amount of
protein prior to the formation of the berries [39].
The most abundant class of proteins identified in our study is
devoted to defense. Among the defense proteins Class I b-1, 3-
glucanase comprises the biggest group. Seven identified protein
isoforms were encoded by three different genes. All the identified
b-1, 3-glucanases were similar in terms of expression profiles.
These proteins recorded low expression at stage I, increased levels
at stage II with a slight decrease during ripening. b-1, 3-glucanases
belong to a group of proteins called pathogenesis-related (PR)
proteins. They are synthesized in healthy grape berries in a
developmentally dependent manner as a normal part of the
ripening process, with veraison apparently being the trigger for PR
gene expression [40]. In addition, to the development-dependent
synthesis and accumulation of PR proteins, these proteins can also
be induced in leaves and pre-veraison berries as part of an induced
defense response against wounding, chemical elicitors, pathogen
attack, or abiotic stress. The majority of the b-1, 3 glucanases have
a role in response to microbial pathogens and developmental
responses. b-1, 3 glucanases are present in multiple structural
isoforms that differ in size, pI, primary structure, cellular
localization and pattern of regulation [41,42]. In other proteomic
studies on grape berry ripening b-1, 3-glucanase demonstrated
differential expression profiles but was mostly found to decrease or
was undetectable during ripening (Table S3).
Ras-related GTP-binding protein identified in this study has a
signaling role. The Ras super family comprises a large group of
structurally and functionally conserved small GTP-binding
proteins that function as two-state molecular ‘switches’ in
numerous signaling pathways. Small GTP-binding proteins
regulate diverse intracellular pathways, and include receptor-
mediated signaling. The small GTP-binding proteins are activated
by GTP binding, and inactivated by hydrolysis of GTP to GDP.
They coordinate numerous downstream processes in plants such
as hormone responses, cell growth and differentiation, pathogen
defense and other abiotic stress responses [43]. In other plant
species, it is involved in the phytochrome-mediated signal
transduction as an auxin signal transducer in stems and seedlings.
These proteins are further involved in protein transport, probably
in vesicular traffic and eventually in the prenylation of proteins
[44]. From our data, the expression is higher at stage I followed by
a decrease at stage II and a slight increase later in stage III. In
grape berries they have been reported to be involved in protein
transport and prenylation with expression peaks at ripening, which
conforms to our study (Table S3).
Proteins identified in other plantsSeveral proteins identified in the present study belonged to
different plant species. Ferredoxin NADP+ oxidoreductase (Triti-
cum aestivum) identified in the present study is mainly metabolic in
its function. Ferredoxin NADP+ oxidoreductase (FNR, EC
1.18.1.2) is a ubiquitous enzyme belonging to a large family of
flavoproteins found in higher plants, eukaryotic algae, photosyn-
thetic bacteria, and animals. This protein records a constant lower
expression at green and veraison stages with a sharp increase at the
ripening stage. In plants, this enzyme exists in two distinct forms as
a photosynthetic (pFNR) and as a heterotrophic (hFNR) form.
These two isoforms are encoded by different genes, linked to
different metabolic pathways and are regulated by different factors
[45]. Traditionally, pFNR has been considered to catalyze the
final step in the photosynthetic electron transport chain. By
contrast, a role for hFNR has been characterized for supplying
reducing power in non-photosynthetic tissue to a variety of
metabolic processes including nitrate assimilation. Multiple FNR
forms are regulated independently and can interact and provide
added flexibility to allow the plant to adapt to a changing
metabolic environment [46]. Ferredoxin-NADP+ oxidoreductase
(FNR) mediates the final step of photosynthetic electron flow by
transferring electrons from ferredoxin to NADP+. The reducing
power (NADPH) is used for a number of different reactions, such
as carbon fixation, nitrogen metabolism, and lipid and chlorophyll
biosynthesis, as well as for stromal redox regulation [47]. Electrons
may also be abstracted directly from ferredoxin for the reduction
of distinct components that play a role in the reducing reactions
mentioned above [48]. Grapevines and berries have a complex
system for nitrogen mobilization and partitioning. Since grape
berries are only photosynthetically active for the period before
veraison, hFNR may also actively work in controlling nitrate
metabolism. However, its exact role in grape berries has to be
clearly elucidated.
Proteomics of Berry Cultures
PLoS ONE | www.plosone.org 7 February 2011 | Volume 6 | Issue 2 | e14708
Ribosomal S2 protein identified in the current study was found
to decrease in concentration in stage II and increased in stage III.
Ribosomal S2 proteins take part in ribosomal biogenesis and
protein synthesis. It has been shown to belong to a family that
includes 40S ribosomal subunit 40 kDa proteins, putative laminin-
binding proteins, NAB-1 protein and a 29.3 kDa protein from
Haloarcula marismortui. The laminin proteins are predicted to be the
eukaryotic homologue of the eubacterial S2 ribosomal proteins
[49] and are said to have unrelated activities such as cell adhesion
and ribosomal biogenesis. In berries during ripening these proteins
might be involved in enhanced protein synthesis as it has been
reported that protein concentration increases during complete
maturation of the berries [29].
Our study also identified proteins involved in signaling
responses. Kinases with ankyrin repeats (Zea mays) were identified
for the first time in grape berry ripening related processes.
However, this particular protein was found to match an ATP-
dependent clp protease in the grapevine proteome. In our study
the protein was expressed lowly at stage I, increased during stage
II and showed a modest decrease in stage III. Other signaling
proteins identified with a role in defense were the TIR NBS TIR
protein and a LysM domain-containing receptor-like kinase (LysM
RLK). In our study, the TIR NBS TIR protein had lower activities
at both stage I and II with a sharp increase in stage III. To date,
five principal classes of Resistance-genes have been identified,
based upon conserved protein domains. The most abundant class
is the cytoplasmic nucleotide-binding site-leucine-rich repeat
(NBS-LRR) proteins. The NBS domain is important for ATP
binding and hydrolysis and is believed to be involved in signal
transduction, triggered by the presence of the pathogen. The TIR
NBS subfamily of R proteins display homology between the N-
terminal amino acid motif and the receptor domain in Drosophila
Toll and basal mammalian Interleukin (IL) 1 immunity factors in
animals [50].
A LysM domain-containing receptor-like kinase (LysM RLKs)
was also identified for the first time during grape berry ripening.
The expression of this protein dropped at veraison but increased
again during ripening. LysM receptor kinases are involved in
symbiotic signaling and defence against fungi. LysM domains are
found in a variety of peptidoglycan and chitin binding proteins. In
the plant kingdom, LysM domains are found in receptors of
chitooligosaccharide and related compounds. It has been reported
that these receptors are involved in the interaction between plants
and microbes. Chitin is involved in inducing defence responses in
both monocots and dicots [51]. Recently it has been reported that
Arabidopsis CERK1 a receptor-like kinase with three LysMs also
plays a key role in fungal perception by the plant [52]. It has been
demonstrated that CEBiP (A LysM motif-containing plasma
membrane kinase) directly binds to chitin oligosaccharides and
plays an essential role in the perception of chitin and the induction
of immunity. CEBiP of Oryza sativa contains two LysMs and is a
glycoprotein with high affinity for chitin oligosaccharides. Knock-
down of CEBiP resulted in suppression of chitin-induced defence
response [53].
The proteins identified in non V. vinifera plant species need to be
evaluated further in berries using molecular and bioinformatic
tools but the berry cultures might provide excellent systems to
study these proteins and their regulation.
In conclusion, the results presented in this study using berry
suspension cells, combined with the liquid-phase IEF based
proteomic experiments and multivariate data analysis show that
berry cell cultures are suitable to study grape berry ripening. The
fact that berry cultures derived from berry explants in different
stages of development yielded protein expression patterns that
could be matched to expression profiles found in berries provide
an excellent platform for further studies, also on the metabolite
level. Our results indicate that this type of suspension cultures
could be used to model a range of protein activities found in
developing berries. The advantages of having suspension cultures
that accurately mimic specific developmental stages are profound
and could significantly contribute to the study of the intricate
regulatory and signaling networks responsible for berry develop-
ment and ripening. We were able to identify proteins with a wide
range of theoretical pI and molecular weights mainly due to
improvements in the first dimension focusing with microrotofor
and the expression trends for some of the identified proteins
matched with those in literature. Further, to obtain a tissue specific
understanding of ripening processes in the berry cell cultures it is
important to delve deeper by further sub-cellular fractionation
focusing on the cell wall and the secretome. Nonetheless, the
results presented here establish that organ-specific berry cell
cultures can be developed from all stages of berry development
and that these cultures characteristically differ from each other.
The observed proteins and their expression patterns that could be
matched to patterns previously seen in berries provide further
motivation to use these cultures to study berry development and
ripening-related aspects of grapevine.
Materials and Methods
Plant materialVitis vinifera L. cv. Dauphine grape berries were sampled during
the 2007–2008 growing season from the Irene farm in the Paarl
valley, South Africa. Berries were collected at nine time points
during the berry development season (spanning the period three to
19 weeks post anthesis), with 10–14 day intervals. For each time
point, berries from three bunches were collected and their
diameters recorded. Harvested berries were randomly divided
into two batches. The one batch was immediately flash-frozen in
liquid nitrogen and the other was kept on ice for callus initiation
purposes. The frozen material was further processed by removing
the seeds, while keeping the material frozen, and homogenized in
an IKA A11 basic analytical mill (Sigma-Aldrich Z341789CH).
The frozen tissue was subsequently analyzed for sugar, organic
acid and pigment (chlorophyll and carotenoid) content (as
reported in [20]) to characterize the berry development and
ripening stages of the nine different sampling points.
Establishing somatic callus lines from the different berrysamples
Somatic callus lines were established as described by [54].
Harvested berries were washed in distilled water, and then
agitated in a 7% (w/v) Calcium hypo-chloride solution for 15
minutes [55]. Subsequently the berries were rinsed three times in
distilled water and de-seeded. The berries were sliced thinly (1–
3 mm) and placed on solidified media containing 0.2 mg. l21
kinetin and 0.1 mg. l21 a-naphthalene acetic acid (NAA), 2% (w/
v) sucrose, 250 mg. l21 casein hydrolysate [54]. The medium was
solidified with 3 g. l21 phytagel (Sigma cat # P8169) and the pH
was adjusted to 5.9. The numbers of berry explants developing
callus were recorded and compared. The cultures were maintained
at 25uC in the dark and were sub-cultured by transferring three to
four grams of the developing callus masses onto fresh media every
four weeks. To synchronize the cultures on the plate, sub-culturing
and selection of similar callus continued until homogenous and
prolific callus cultures were obtained.
Cell suspensions were initiated from callus cultures that
originated from berry explants harvested at six, 11 and 15 weeks
Proteomics of Berry Cultures
PLoS ONE | www.plosone.org 8 February 2011 | Volume 6 | Issue 2 | e14708
post-anthesis according to the method described by [54]. These
time points corresponded to green, veraison and ripe berries and the
suspensions were designated Stage I to III respectively. Four to five
grams of sub-cultured callus, was transferred to a 250 ml
Erlenmeyer flask, containing 100 ml of the callus initiation medium
(without phytagel) and incubated on a rotary shaker (110 rpm) at
25uC in the dark. Cell suspensions were maintained by transferring
20 ml of a seven day-old culture into 80 ml of fresh medium. After
three successive rounds of sub-culturing the cell suspensions were
homogenous and synchronized. The growth curves of the cell lines
were determined by measuring the OD600 of samples of the
suspension cultures over a 21 day period. Three biological repeats
and three technical repeats of each biological repeat were used.
Somatic cells developing in the suspension cultures were also
microscopically viewed, using an Olympus CellH system attached to
an IX-81 inverted fluorescence microscope equipped with a F-view-
II cooled CCD camera (Soft Imaging Systems). From the
suspension cultures, cells in the log phase and the early stationary
phases were harvested for proteomic evaluation.
Protein extraction from suspension cellsCytocolic proteins were extracted according to a method of [56],
with modifications. In brief, suspension cells generated from green,
veraison and ripe berries (designated stages I-III) in their log and
early stationary phases were separated from the growth medium
using Mira cloth and ground in liquid nitrogen. Three grams (g) of
each growth stage was used for extraction and three independent
extractions were carried out for each growth stage. The cells were
suspended in 10 ml of 12.5% (w/v) trichloroacetic acid (TCA) in
80% (v/v) acetone containing 2% (w/v) dithiothreitol (DTT) and
8 mM phenylmethanesulphonylfluoride (PMSF). The solution was
left in a vortex shaker for approximately two hours and subsequently
stored at 220uC overnight. Protein precipitate was separated by
centrifugation (10, 000 rpm) at 4uC for 20 minutes. The protein
pellet was washed thrice in ice cold acetone containing 2% DTT
and 8 mM PMSF. The protein pellet was dissolved in 3 ml urea
buffer containing 7 M urea, 2 M thiourea, 5 mM DTT, 4% (w/v)
CHAPS (3-(3-Cholamidopropyl)dimethylammonio)-1-Propanesul-
fonic Acid), and 2% (v/v) Pharmalyte, pH 3–10 and constantly
shaken for approximately 4 hours.
Protein separation in the first dimension using free flowin-solution electrophoresis
The liquid phase IEF in the Microrotofor cell was conducted
according to [31]. The protein samples (3 ml) were injected into
the focusing chamber of the Microrotofor cell (Bio-Rad Labora-
tories Inc, Hercules, CA) using a 3 ml syringe until all ten
compartments were equally loaded. The ion-exchange mem-
branes, separating the electrode reservoirs and the focusing
chamber, were equilibrated overnight in respectively 0.1 M
H3PO4 (for a cation-exchange membrane) and 0.1 M NaOH
(for an anion-exchange membrane). Both the loading and
collection apertures on the opposite sides of the focusing
compartments were sealed with adhesive tape. The focusing
assembly was positioned in the cooling block and gently rocked
with the use of a oscillating motor. The separation was conducted
according to the manufacturer’s instructions at a constant power of
1 W at 20uC. The separation typically occurred for 2.5 hours and
was terminated 25 minutes after the current stopped decreasing.
Protein fractions from each compartment (200 ml) were
collected with the use of a vacuum and the pH of the individual
fractions was measured with a precision digital pH meter. Equal
volumes (200 ml) of 20% (w/v) TCA were added to each of the
fractions. Protein precipitates were collected by centrifugation at
10, 000 rpm for 10 min at room temperature. 500 ml of 80% (v/v)
cold acetone was added to the precipitates, with subsequent
vortexing, and centrifugation at 10, 000 rpm for 10 min at 2uC,
after which the supernatant was carefully removed. This washing
step was repeated twice to remove remaining TCA in the
precipitates. These were air-dried and dissolved in urea buffer.
The protein content of the total soluble protein was estimated by a
modified Bradford assay using bovine serum albumin (BSA) as a
standard [56].
Second dimension separation and imagingThe separated fractions were further fractionated in the 2nd
dimension by SDS-PAGE. All gels were run in triplicate. Each
individual fraction was loaded from left-right in a SDS gel, with
the farthest left lane containing the most acidic-fraction. 50 mg of
protein was loaded into each lane and the run was conducted at
70 V for 30 minutes, followed by 100 V for 2 hours. The gels were
stained overnight in modified Coomassie Blue stain, destained and
imaged using a Molecular Imager Pharos FX plus system (Bio-Rad
Laboratories Inc., Hercules, CA). Digitized images at 100 mm
resolution were analyzed using Quantity One analysis software
(Bio-Rad Laboratories Inc., Hercules, CA). The gels correspond-
ing to the different ripening stages were compared in order to
attribute common band identities for the same band in each lane
from different gel images. Before band detection and matching,
images were aligned in relation to the gel set as a reference. Band
detection and matching was carried out using the band matching
tool, but was refined by manual band editing where needed.
Protein bands were modeled as Gaussian distributions and their
relative densitometry values (band densitometry values over the
total densitometry values) and the relative front of the band was
used for band matching. Relative quantitative analysis was
performed on bands which were resolved well enough to be
considered as two separate Gaussian units.
Quantification and expression profilingDensitometry values of the individual bands obtained from each
replicate obtained were normalized against total densitometry
signal (i.e. total protein content) present on the gel for each of the
three repeats from three independent extractions. Values from
replicates were averaged and the standard deviation for each band
calculated. T-tests were done comparing each band derived from
green, veraison or ripe cell cultures to determine if the differences
seen were statistically significant. Principal component analysis
was performed on a matrix consisting of the objects as defined by
the early and late log phase cell cultures derived from each stage of
berry development and the variables defined as the average
expressed values of each protein (band) detected in each of those
cell cultures. Developmental differential protein profiles were
created by the log2 transform of each band value divided by the
value obtained from the tissue cultures derived from green berries.
All numeric calculations and transformations of the data were
done via custom built perl programmes.
Identification of proteins using Matrix-assisted laserdesorption/ionization time-of-flight (MALDI-TOF) massspectrometry (MS)
Bands of interest were identified by MALDI-TOF/MS using
the protocol of [57] with slight modifications. Briefly, bands were
excised manually and transferred into sterile micro centrifuge
tubes. The gel pieces were washed twice with 50 mM ammonium
bicarbonate for 5 min each and a third wash for 30 min, with
occasional vortexing. The gel pieces were then destained twice
Proteomics of Berry Cultures
PLoS ONE | www.plosone.org 9 February 2011 | Volume 6 | Issue 2 | e14708
with 50% (v/v) 50 mM ammonium bicarbonate and 50% (v/v)
acetonitrile for 30 min, vortexing occasionally. The gel pieces were
dehydrated with 100 mL acetonitrile for 5 min, and then
completely dessicated using the Speed Vac SC100 (ThermoSa-
vant, Waltham, MA). Proteins were in-gel digested with
approximately 120 ng sequencing grade modified trypsin (Pro-
mega, Madison, WI) dissolved overnight in 25 mM ammonium
bicarbonate at 37uC. The protein digestion was terminated by
adding 50–100 mL of 1% (v/v) trifluoroacetic acid (TFA) and
incubating the mixture 2–4 h at room temperature before storing
the samples at 4uC until further analysis. Prior to identification, the
samples were cleaned-up by reverse-phase chromatography using
ZipTipC18TM columns (Millipore, Billerica, MA) pre-equilibrated
in 100% (v/v) acetonitrile and then in 0.1% (v/v) TFA and eluted
out with 50% (v/v) acetonitrile. One microlitre from each sample
was mixed with the same volume of a-cynahydroxy-cinnamic acid
(CHCA) matrix and spotted onto a MALDI target plate for
analysis using a MALDI-TOF mass spectrometer (Voyager DE
Pro Biospectrometry workstation (Applied Biosystems, Forster
City, CA) to generate a peptide mass fingerprint. All MALDI
spectra were calibrated using the sequazyme calibration mixture II
(Applied Biosystems, Forster City, CA) containing angiotensin I,
ACTH (1–17 clip, 1296.6853 daltons (Da)), ACTH (18–39 clip,
2093. 0867 Da), ACTH (7–38 clip 2465.1989 Da) and bovine
insulin (3657.9294 Da). This instrument has a 337 nm Nitrogen
Laser and is operated in the positive ion reflectron mode at 20 kV
accelerating voltage. 0.5 mL of peptide extract was used for the
MALDI-TOF/MS analysis and co-crystallized in the matrix a-
cyano-4-hydroxycinnamic acid.
Monoisotopic peptide masses were assigned and used for
databases research. The NCBI and MSDB peptide mass databases
were searched using MASCOT Matrix Science, London, UK
http://www.matrixscience.com/search_form_select.html). The
searches were carried out against plant species. One missed
cleavage per peptide was allowed, a mass tolerance of 100 ppm
was used and some variable modifications were taken into
account, such as carbamidomethylation for cysteine and oxidation
for methionine. The identification of proteins was based on a
positive result using MASCOT’s ‘‘Probability Based MOWSE
Score’’. In addition, grapevine-specific proteome tryptic digest
databases were created from both the translation of coding regions
found within the Vitis vinifera genome sequence [58], as well as the
EST-derived protein set utilized by [12]. Aldente [59] was used to
compare the mass peptide fingerprints generated by MALDI-
TOF/MS to these grapevine-specific proteomes.
Supporting Information
Supporting Information S1 Macro-and microscopic view of
the suspension cultures (Figure S1); IPG-based 2DE of total
soluble proteins from suspension cultures I (green) and III (ripe)
(Figure S2); and SDS PAGE of total soluble proteins from
suspensions I-III representing different ripening stages of the
explants and separated by liquid phase IEF in a microrotofor cell
(Figure S3).
Found at: doi:10.1371/journal.pone.0014708.s001 (2.14 MB
DOC)
Table S1 MALDI-TOF identification of proteins after band
matching to compare their relative expression profiles.
Found at: doi:10.1371/journal.pone.0014708.s002 (0.08 MB
DOC)
Table S2 The densitometry values for each of the individually
identified proteins supports the expression levels reported in Table
S1, as well as the PCA analysis in Figure 4.
Found at: doi:10.1371/journal.pone.0014708.s003 (0.03 MB
XLS)
Table S3 Proteomic studies on grape berry ripening and
expression profile comparison of proteins identified in our study
with the published literature.
Found at: doi:10.1371/journal.pone.0014708.s004 (0.07 MB
DOC)
Table S4 Further identification of proteins in grapevine-specific
databases.
Found at: doi:10.1371/journal.pone.0014708.s005 (0.02 MB
XLS)
Acknowledgments
1. Benjamin Loos at the Life Cell Imaging Facility, Stellenbosch University
for microscopical analysis of the suspension cultures.
2. Phillip R. Young and Erik Alexandersson for critically reading the
manuscript.
Author Contributions
Conceived and designed the experiments: RGS CS BN MAV. Performed
the experiments: RGS CS. Analyzed the data: RGS CS DJ MAV.
Contributed reagents/materials/analysis tools: BN MAV. Wrote the
paper: RGS CS DJ BN MAV.
References
1. Coombe BG, McCarthy MG (2000) Dynamics of grape berry growth and
physiology of ripening. Aus J Grape Wine Res 6: 131–135.
2. Robinson SP, Davies C (2000) Molecular biology of grape berry ripening.
Aus J Grape Wine Res 6: 175–188.
3. Coombe BG (1992) Research on the development and ripening of grape berry.
Am J Enol Vitic 43: 101–110.
4. Moser C, Segala C, Fontana P, Salakhudtinov I, Gatto P, et al. (2005)
Comparative analysis of expressed sequence tags from different organs of Vitis
vinifera L. Fun Int Genomics 5: 208–217.
5. Terrier N, Glissant D, Grimplet J, Barrieu F, Abbal P, et al. (2005) Isogene
specific oligo arrays reveal multifaceted changes in gene expression during grape
berry (Vitis vinifera L.) development. Planta 222: 832–847.
6. Lund ST, Peng YF, Nayar T, Reid KE, Schlosser J (2008) Gene expression
analyses in individual grape (Vitis vinifera L.) berries during ripening initiation
reveal that pigmentation intensity is a valid indicator of developmental staging
within the cluster. Plant Mol Biol 68: 301–315.
7. Deluc LG, Grimplet J, Wheatley MD, Tillet RL, Qulici DR, et al. (2007)
Transcriptomic and metabolomic analysis of Cabernet Sauvignon grape berry
development. BMC Genomics 8: 429.
8. Deytieux C, Geny L, Lapaillerie D, Claverol S, Bonneu M, et al. (2007)
Proteome analysis of grape skins during ripening. J Exp Bot 58: 1851–1862.
9. Gribaldi M, Perugini I, Sauvage F-X, Schubert A (2007) Analysis of protein
changes during grape berry ripening by 2-DE and MALDI-TOF. Proteomics 7:
3154–3170.
10. Negri AS, Prinsi B, Rossoni M, Failla O, Scienza A, et al. (2008) Proteome
changes in the skin of the grape cultivar Barbera among different stages of
ripening. BMC Genomics 9: 378.
11. Zhang J, Ma H, Feng J, Zeng L, Wang Z, et al. (2008) Grape berry plasma
membrane proteome analysis and its differential expression during ripening.
J Exp Bot 59: 2979–2990.
12. Lucker J, Laszczak M, Smith D, Lund ST (2009) Generation of a predicted protein
database from EST data and application to iTRAQ analyses in grape (Vitis vinifera
cv. Cabernet Sauvignon) berries at ripening initiation. BMC Genomics 10: 50.
13. Rao R, Ravishankar GA (2002) Plant cell cultures: Chemical factories of
secondary metabolites. Biotec Adv 20: 101–153.
14. Martinez-Esteo MJ, Selles-Marchant S, Vera-Urbina JC, Pedreno MA, Bru-
Martinez R (2009) Changes of defense proteins in the extracellular proteome of
grapevine (Vitis vinifera cv.gamay) cell cultures in response to elicitors.
J Proteomics 73: 31–41.
15. Ferri M, Tassoni A, Frceshetti M, Righetti L, Naldrett MJ, et al. (2009) Chitosan
treatment induces changes of protein expression profile and stilbene distribution
in Vitis vinifera cell suspensions. Proteomics 9: 610–624.
Proteomics of Berry Cultures
PLoS ONE | www.plosone.org 10 February 2011 | Volume 6 | Issue 2 | e14708

16. Conde C, Agasse A, Glissant D, Tavares R (2006) Pathways of glucose
regulation of monosaccharide transport in grape cells. Plant Phys 141:1563–1578.
17. Vitrac X, Larronde F, Krisa S, Decendit A, Merillon J-M (2000) Sugar sensing
and Ca2+ calmodulin requirement in Vitis vinifera cells producing anthocyanins.Phytochem 63: 659–665.
18. Faurie B, Cluzet S, Merillon J-M (2009) Implication of signaling pathwaysinvolving calcium, phosphorylation and active oxygen species in methyl
jasmonate-induced defense responses in grapevine cell cultures. J Plant Phys
166: 1863–1877.19. Hiratsuka S, Onodera H, Kawai Y, Kubo T, Itoh H, et al. (2001) ABA and
sugar effects on anthocyanin formation in grape berry cultured in vitro. Sci Hort90: 121–130.
20. Lashbrooke JG, Young PR, Strever AE, Stander C, Vivier MA (2010) Thedevelopment of a method for the extraction of carotenoids and chlorophylls from
grapevine leaves and berries for HPLC profiling. Aus J Grape Wine Res 16:
349–360.21. Thelen JJ, Peck SC (2007) Quantitative proteomics in plants: Choices in
abundance. Plant Cell 19: 3339–3348.22. Zhang J, Ma H, Feng J, Zeng L, Wang Z, Chen S (2008) Grape berry plasma
membrane proteome analysis and its differential expression during ripening.
J Exp Bot 59: 2979–2990.23. Seshi B (2007) Proteomics strategy based on liquid-phase IEF and 2-D DIGE:
Application to bone marrow mesenchymal progenitor cells. Proteomics 7:1984–1999.
24. Brobey RK, Soong L (2007) Establishing a liquid-phase IEF in combination with2-DE for the analysis of Leishmania proteins. Proteomics 7: 116–120.
25. Gazzana G, Boriak J (2007) Improved Method for Proteome Mapping of the
Liver by 2-DE MALDI-TOF MS. J Proteome Res 6: 3143–3151.26. Zuo X, Speicher DW (2000) A method for global Analysis of complex proteomes
using sample prefractionation by Solution isoelectrofocusing prior to two-dimensional electrophoresis. Anal Biochem 284: 266–278.
27. Mechin V, Balliau T, Chateau-Joubert S, Davanture M, Langella O, et al.
(2004) A two-dimensional proteome map of maize endosperm. Phytochem 65:1609–1618.
28. Vincent D, Balesdent M-H, Gibon J, Claverol S, Lomenech DL, et al. (2009)Hunting down fungal secretomes using liquid-phase IEF prior to high resolution
2-DE. Electrophoresis 30: 4118–4136.29. Monteiro S, Picarra-Perrira MA, Loureiro VB, Teixeira AR, Ferreira RB (2007)
The diversity of pathogenesis–related proteins decreases during maturation.
Phytochem 68: 416–425.30. Vincent D, Wheatley MD, Cramer GR (2007) Optimization of protein
extraction and solubilization of mature grape berry clusters. Electrophoresis27: 1853–1865.
31. Hey J, Poasch A, Cohen A, Liu N, Harbers A (2008) Fractionation of complex
protein mixtures by liquid-phase isoelectrofocusing. In 2D PAGE: Samplepreparation and Fractionation. Methods in Molecular Biology, Edited by Posch
A. Totowa, NJ: Humana Press. 424: 225–239.32. Grimplet J, Deluc LG, Tillet RL, Wheatley MD, Schlauch KA, et al. (2007)
Tissue-specific mRNA expression profiling in grape berry tissues. BMCGenomics 8: 187.
33. Agasse A, Vignault C, Kappel C, Conde C, Geros H, et al. (2009) Sugar
transport and sensing in grape. In Grapevine molecular physiology andbiotechnology, Edited by Roublekais-Anglekais KA. NY: Springer science +Buissness media. pp 105–139.
34. Conde C, Agasse A, Glissant D, Tavares R (2006) Pathways of glucose
regulation of monosaccharide transport in grape cells. Plant Phys 141:
1563–1578.35. Davies C, Robinson SP (2000) Differential Screening Indicates a Dramatic
Change in mRNA Profiles during Grape Berry Ripening. Cloning andCharacterization of cDNAs Encoding Putative Cell Wall and Stress Response
Proteins. Plant Phys 122: 803–812.
36. Sarry JE, Sommerer N, Sauvage FX, Bergoin A, Rossignol M, et al. (2004)Grape berry biochemistry revisited upon proteomic analysis of the mesocarp.
Proteomics 4: 201–215.37. Taureilles-Saurel C, Romieu C, Robin JP, Flanzy C (1995) Grape (Vitis vinifera
L.) Malate dehydrogenase 11. Characterization of the major mitochondrial andcytosolic isoforms and their role in ripening. Am J Enol Vitic 46: 29–36.
38. Sweetman C, Deluc LG, Cramer GR, Ford CM, Soole KL (2009) Regulation of
malate metabolism in grape berry and other developing fruits. Phytochem 70:1329–1344.
39. Ghisi R, Iannini B, Passera C (1984) Changes in the activities of enzymes
involved in nitrogen and sulphur assimilation during leaf and berry developmentof Vitis vinifera. Vitis 23: 257–267.
40. Wang W, Bianchi L, Scali M, Liu L, Bini L, Cresti M (2009) Proteomic analysisof b-1,3-glucanase in grape berry tissues. Acta Physiolgia Plantarum 31:
597–604.
41. Metzger GH, Meins F (2000) Functions and regulation of plant b-1,3-glucanases. In Datta SK, Muthukrishnan S, eds. Pathogenesis Related proteins
in plants. Boca Raton, Florida, CRC Press. pp 48–75.42. Buchner P, Rochat C, Williams S, Boutiny JP (2002) Characterization of a
tissue-specific and developmentally regulated b-1,3-glucanase gene in pea (Pisum
sativum). Plant Mol Biol 49: 171–186.
43. Sormo CG, Leiros I, Brembu T, Winge P, Vibeke O, et al. (2006) The crystal
structure of Arabidopsis thaliana RAC7/ROP9: The first RAS superfamilyGTPase from the plant kingdom. Phytochem 67: 332–2340.
44. Yuksel B, Memon AR (2008) Comparative phylogenetic analysis of small GTP-binding genes of model legume plants and assessment of their roles in root
nodules. J Exp Bot 59: 3831–3844.
45. Gummadova JO, Moolna A, Hanke GT, Hase T, Bowsher CG (2007)Expression of multiple forms of ferredoxin NADP+ oxidoreductase in wheat
leaves. J Exp Bot 58: 3971–3985.46. Hanke GT, Okutani S, Satomi Y, Takao T, Suzuki A, et al. (2005) Multiple iso-
proteins of FNR in Arabidopsis: evidence for different contributions to chloroplastfunction and nitrogen assimilation. Plant Cell Env 28: 1146–1157.
47. Lintala M, Allahverdiyeva Y, Lehtima N, Rintama E, Eva-Mari A, et al. (2009)
Comparative analysis of leaf-type ferredoxin-NADP+ oxidoreductase isoforms inArabidopsis thaliana. The Plant J 57: 1103–1115.
48. Takabayashi A, Kishine M, Asada K, Endo T, Sato F (2005) Differential use oftwo cyclic electron flows around photosystem I for driving CO2-concentration
mechanism in C4 photosynthesis. Proc Nat Acad Sci USA 102: 16898–16903.
49. Rogalski M, Schottler MA, Thiele W, Schulze WX, Bock R (2008) Rpl33, anonessential plastid-encoded ribosomal protein in tobacco is required under cold
stress conditions. Plant Cell 20: 2221–22237.50. Miller RNG, Bertioli DJ, Baurens FC, Santos CMR, Alves PC, et al. (2008)
Analysis of non-TIR NBS-LRR resistance gene analogs in Musa acuminata Colla:Isolation, RFLP marker development, and physical mapping. BMC Plant
Biology 8: 15.
51. Buist G, Steen A, Kok J, Kuipers OP (2008) LysM, a widely distributed proteinmotif for binding to (peptido) glycans. Mol Micro 68: 838–847.
52. Lizasa E, Mitsutomi M, Nagano Y (2009) Direct Binding of a Plant LysMReceptor-like Kinase, LysM RLK1/CERK1, to Chitin in vitro. The J Bio Chem
280: 2996–3004.
53. Wan J, Zhang C, Findley S, Wan J, Neece D, et al. (2008) LysM Receptor-LikeKinase Plays a critical role in chitin signaling and fungal resistance in Arabidopsis.
Plant Cell 20: 471–481.54. Calderon AA, Zapata JM, Barcelo AR (1994) Differential expression of a cell
wall-localized peroxidase isoenzyme capable of oxidizing 4-hydroxystilbenesduring the cell culture of grapevine (Vitis vinifera cv. Airen and Monastrell). Plant
cell, tissue and organ culture 37: 121–127.
55. Hawker JS, Downton WJS, Wiskich D, Mullins MG (1973) Callus and cellculture from grape berries. Hortsci 8(5): 398–399.
56. Garavaglia BS, Thomas L, Zimaro T, Gottig N, Daurelio LD, Ndimba B,Orellano EG, Ottado J, Gehring C (2010) A plant natriuretic peptide-like
molecule of the pathogen Xanthomonas axonopodis pv. Citri causes rapid changes in
the proteome of its citrus host. BMC Plant Biology 10: 51.57. Garavaglia BS, Thomas L, Zimaro T, Gottig N, Daurelio LD, Ndimba B,
Orellano EG, Ottado J, Gehring C (2010) A eukaryotic-acquired gene by abiotrophic phytopathogen allows prolonged survival on the host by counteract-
ing the shut-down of plant photosynthesis. PLoS ONE 5: e8950.
58. Jaillon O, Aury J-M, Noel B, Policriti A, Clepet C, et al. (2007) The grapevinegenome sequence suggests ancestral hexaploidization in major angiosperm
phyla. Nature 449: 463–467.59. Gasteiger E, Hoogland C, Gattiker A, Duvaud S, Wilkins MR, et al. (2005)
Protein Identification and Analysis Tools on the ExPASy Server. In Walker J,ed. The Proteomics Protocols Handbook. NJ: Humana Press. pp 571–607.
Proteomics of Berry Cultures
PLoS ONE | www.plosone.org 11 February 2011 | Volume 6 | Issue 2 | e14708
Copyright © 2022 FDOKUMEN