Glasslike Arrest in Spinodal Decomposition as a Route to Colloidal Gelation
Upload
independentCategory
view
1download
0
ORIGINAL PAPER
Protein Subunit Composition Effects on the ThermalDenaturation at Different Stages During the Soy Protein IsolateProcessing and Gelation Profiles of Soy Protein Isolates
Eduarda M. Bainy Æ Susan M. Tosh ÆMilena Corredig Æ Lorna Woodrow ÆVaino Poysa
Received: 25 December 2007 / Revised: 14 March 2008 / Accepted: 3 April 2008 / Published online: 6 May 2008
� Her Majesty the Queen in Right of Canada 2008
Abstract This study focussed on the evaluation of ther-
mal denaturation at three different stages during soy
protein isolation and the effect of subunit composition on
the formation of heat-induced soy protein gels. Soy protein
isolates (SPI) were prepared from 12 high protein lines,
Harovinton variety and 11 derived null-lines which lacked
specific glycinin (11S) and b-conglycinin (7S) protein
subunits. Protein denaturation during SPI processing was
monitored by differential scanning calorimetry (DSC). The
results showed that hexane extraction of oil from soybean
flours at 23 �C or 105 �C did cause changes in protein
conformation. Rheological measurements showed that
lines with different subunit compositions and 11S:7S ratio
had distinctive gelation temperatures and resulted in gels
with different network structures. All lines formed partic-
ulate gels at 11% protein. The 11S:7S ratio was not
correlated to final stiffness, measured as the storage mod-
ulus G0, of SPI gels. Lower gelation temperatures were
usually observed for 7S-rich lines. The absence of A3 and
the combination of A1, A2 and A4 subunits of 11S fraction
may suggest the formation of stiffer gels. A more detailed
study of the frequency dependence of G0 for the various
networks formed also indicated that differences in subunit
composition influenced the network structures.
Keywords Soybean � Soy protein isolates � DSC �Gel � Gelation
Introduction
Soybeans are known for their high nutritional value with a
‘‘complete protein’’ composition, high polyunsaturated
fatty acid content, and high content of beneficial bioactive
components. In recent years, increased health conscious-
ness has lead to increased demand for soy-containing food
products.
Soybeans are rich in protein, averaging 40% of total
dry matter. The major storage proteins are b-conglycinin
and glycinin, also called 7S and 11S, respectively.
b-Conglycinin is composed of a0, a and b subunits.
Glycinin is composed of an acidic peptide linked by a
single disulphide bond with a basic peptide [1]. Based on
subunit sequence homology, the subunits are classified
into two main groups, group I (A1aB1b, A2B1a, A1bB2)
and group II (A5A4B3, A3B4) [2]. Group II is subdivided
on the basis of genetic analysis in group IIa (A5A4B3)
and group IIb (A3B4) [3]. 11S:7S protein ratios range
from 0.5 to 1.7 among soybean cultivars [4]. It has been
reported that the ratio of 11S to 7S strongly affects the
types of gels formed, and that glycinin forms more
elastic, stiffer and harder heat-induced gels than
b-conglycinin, mostly because of the higher number of
disulphide bridges formed in glycinin gels [5–6]. This
characteristic reflects the requirement of protein denatur-
ation and formation of intermolecular bonds for gel
formation. At neutral pH and no salt added, glycinin has a
E. M. Bainy � S. M. Tosh (&)
Guelph Food Research Centre,
Agriculture and Agri-Food Canada,
N1G 5C9 Guelph, ON, Canada
e-mail: [email protected]
E. M. Bainy � M. Corredig
Department of Food Science, University of Guelph,
N1G 2W1 Guelph, ON, Canada
e-mail: [email protected]
L. Woodrow � V. Poysa
Harrow Research Centre, Agriculture and Agri-Food Canada,
N0R 1G0 Harrow, ON, Canada
123
J Am Oil Chem Soc (2008) 85:581–590
DOI 10.1007/s11746-008-1238-6
higher onset denaturation temperature (*80 �C) than
b-conglycinin (*70 �C) [7]; therefore glycinin is more
heat stable than b-conglycinin under the same conditions
of ionic strength and pH [8].
The functional characteristics of SPI reported in the
literature are frequently very different from what is found
in commercially prepared SPI. Industrially produced SPI
usually has much lower solubility and poor gel forming
ability caused by denaturation and aggregation during
processing (unpublished data). Commercially, throughout
the world, soybean oil is extracted from flaked soybeans
using hexane. Residual hexane is removed using super-
heated hexane at 135–175 �C followed by direct heating or
steam. Protein is extracted from the resulting ‘‘white flake’’
preparation to make defatted flours and grits and protein
concentrates and isolates [9] Exposure to non-polar solvent
(hexane) at high temperatures and pressures is thought to
be the cause of this change in functional properties.
Therefore, it may be possible to make improvements to the
processing conditions which will enhance the gelling
ability of SPI.
This research focused on an established Canadian tofu-
type variety, Harovinton; and 11 derived soybean null-lines
which have high protein content differing in 7S and 11S
subunit composition. Previously published work has
focussed on the effect of protein subunit composition
effects on tofu quality of these lines [10] and amino acid
composition [11]. Very little is known about the changes in
heat-induced gelation properties when breeding soybeans
with varying protein subunits. Further studies need to be
performed, however, to understand how the changes in
protein composition affect the protein functionality of
soybean lines during processing. Therefore, investigating
the processing functionalities of these lines will assist in
the breeding of new soybean varieties with specific food
uses. Furthermore, an understanding of the changes in
protein denaturation during three different stages of SPI
processing—before defatting (full fat flour), after defatting
(defatted flour) and after soy protein isolation (SPI)—is
still lacking in the current literature.
The first objective of this study was to evaluate differ-
ences in the thermal denaturation of Harovinton and 11
null-lines at three different stages during SPI processing. In
commercially available SPI, a reduction in protein solu-
bility and functionality is frequently observed. Hexane
extraction of oil at the increased temperatures and pres-
sures commonly used in industry may contribute to this
loss of functionality by causing denaturation. To investi-
gate whether the high temperature and pressure was a
factor, two different defatting treatments were performed.
The oil was extracted both at high pressure (6.67 MPa,
105 �C) and also at ambient pressure and temperature
(23 �C) to evaluate whether hexane-extraction was causing
any losses in protein functionality. Soy protein isolates
(SPI) were the final products analyzed. The second objec-
tive was to evaluate the effect of subunit composition on
the heat-induced gels formed with SPI prepared from the
12 soybean lines.
Materials and Methods
Materials
The soybean lines used in this study included the estab-
lished Canadian tofu type variety, Harovinton, and 11 lines
which lacked specific glycinin and b-conglycinin protein
subunits (null-lines; Table 1). These lines were developed
by crossing and backcrossing Harovinton with a Japanese
line lacking all glycinin subunits and the a0 subunit of
b-conglycinin. Seeds of Harovinton and the 11 lines were
grown at the Greenhouse and Processing Crops Research
Centre (GPCRC), Harrow, Ontario in 2005. Full-fat soy-
bean flours, soybean flour defatted at high pressure
(6.67 MPa, 105 �C) and soybean flour defatted at ambient
pressure and temperature (23 �C) were prepared at
GPCRC. These two sets of extraction conditions were
chosen as the effect of extraction temperature on the pro-
tein denaturation is of interest for manufacturing SPI with
desirable functional properties. Soybean flour defatted at
23 �C to prevent heat denaturation of soy proteins, was the
starting material to prepare SPI from the 12 soybean lines.
Fat Extraction
Soybean seeds (30–35 g) were ground to a fine powder
before defatting using a Knifetec Mill (Foss, Eden Praire,
MN), water-cooled grinder equipped with a sharp blade,
which prevents samples from being heat degraded. Defat-
ting at high temperature followed the Dionex Application
Note No. 325 (Extraction of oils from oilseeds by accel-
erated solvent extraction, ASE). Briefly, 10–12 g ground
soybean flour was loaded in the Dionex ASE 200 (Dionex
Corp., Sunnyvale, CA) per sample cell. Three sequential
extractions of 10 min each 6.67 MPa were performed
using hexane as solvent. The increase in pressure caused
the temperature to rise to 105 �C. Safety precautions
specified by the manufacturer of the extractor were
followed.
For defatting at low temperature (23 �C), the ground
sample (10 g) was mixed with 100 ml hexane using a
orbital shaker (DS-500, VWR, Scientific) at 70 rpm for 1 h
in a fume hood. Hexane was decanted, discarded and the
previous operation was performed two more times. Defat-
ted flours were dried in the fumehood overnight and
refrigerated.
582 J Am Oil Chem Soc (2008) 85:581–590
123
Preparation of Soy Protein Isolate
SPI was prepared in the laboratory by Tris–HCl solubili-
sation followed by acid precipitation based on previously
published methods [12] with slight modifications. Flours
defatted at room temperature (23 �C) were suspended in a
100 mM Tris–HCl buffer of pH 8.0 in a 1:10 ratio (w/v),
and stirred at room temperature for 1 h. The insoluble
fraction was removed by centrifugation (12,000 g, 30 min,
10 �C) using a Beckman Coulter Model J2-21 (Follerton,
CA) and recovered using porcelain filter with a filter paper
(Qualitative P8, Fisher Scientific, Pittsburgh, PA). The
supernatant, which contains mostly dissolved protein, was
adjusted to pH 4.8 with 2 M HCl to induce protein pre-
cipitation. After 2 h at 4 �C, the dispersion was centrifuged
as described above. The precipitate was resuspended with
10 mM sodium acetate buffer of pH 4.8 in a 1:8 ratio (w/v)
and recentrifuged (as above) to remove any entrapped
soluble materials. The final precipitate (SPI) was sus-
pended with ultrapure water, adjusted to pH 7.5 with
1 M NaOH, dialysed overnight and freeze dried. Isolates
were stored at -20 �C until used. Protein content of SPI
was determined by the Dumas combustion method (Leco
FP-528 Mississauga, ON) using conversion factor 6.25 for
protein (approved method 46-30 AACC, 2000).
Gel Electrophoresis
The protein compositions of the parent variety, Harovinton,
and its 11 derived lines were identified using sodium
dodecyl sulphate polyacrylamide gel electrophoresis (SDS-
PAGE). SDS-PAGE was performed with 12.5% (v/v) bis-
acrylamide gel with 4% (v/v) stacking gel in a BioRad
mini-Protein electrophoresis (BioRad Laboratories, Her-
cules, CA). The electrophoresis buffer was 125 mM Tris,
5 M urea at pH 6.8, 0.2% (v/v) SDS, 20% (v/v) glycerol,
and 0.01% (w/v) bromophenol blue. Defatted soybean flour
(6 mg) was mixed with 420 ll extraction buffer composed
of 50 mM Tris, 5 M urea at pH 8.0, 0.2% (v/v) SDS, 2%
(w/v) 2-mercaptoethanol and incubated for 1 h. The sam-
ples were then mixed with 420 ll electrophoresis buffer.
This solution was heated at 95 �C for 5 min with constant
shaking. Aliquots of 6 ll of prepared sample were loaded
into each well. The electrophoretic separation was con-
ducted at 200 V for 50 min. The gels were stained with
Coomassie blue solution for 30 min with constant shaking,
and then destained twice with 45% (v/v) ultrapure water,
45% (v/v) methanol and 10% (v/v) acetic acid solution for
1 h and once with 22.5% (v/v) methanol and 5% (v/v)
acetic acid solution for 12 h. The gels were scanned (Sharp
JX-330 scanner, Amersham Biosciences, Quebec), and the
integrated intensities of electrophoresis protein bands were
analyzed with Image Master ID Elite software (VersionTa
ble
1P
rote
insu
bu
nit
pro
file
of
par
ent
var
iety
Har
ov
into
nan
d1
1so
yb
ean
lin
esla
ckin
gv
ario
us
b-co
ngly
cinin
and
gly
cinin
subunit
s
Nam
eS
oy
bea
ng
eno
typ
es
Cu
ltiv
arn
ames
Su
bu
nit
s%
Pro
tein
%1
1S
b%
7S
bR
atio
b-C
on
gly
cin
inG
lyci
nin
Gen
oty
pe
des
ign
atio
nA
bse
nt
sub
un
its
Pre
sen
tsu
bu
nit
s1
1S
/7S
%(a
+a0
)b%
(b)b
%(A
3)b
%(A
1,
A2
,A
4)b
%(B
asic
)b
Har
ov
into
na
Har
ov
into
n–
–4
3.5
40
.40
31
.13
1.2
95
24
.02
7.1
15
.21
15
.73
17
.93
Lin
e2
SQ
98-0
11
0-3
-1A
3a,
a0,b,
A1
A2
,A
44
1.5
32
.64
37
.78
0.8
65
29
.62
8.1
70
.86
13
.81
16
.35
Lin
e3
SQ
97-0
26
3-5
4-1
-5a0
,A
4a,
b,
A1
A2,
A3
44
.63
8.8
53
3.0
41
.18
02
0.1
01
2.9
45
.12
14
.02
18
.38
Lin
e4
SQ
98-0
10
5-6
-1a0
,A
3a,
b,
A1
A2,
A4
44
.44
2.3
62
8.3
51
.49
51
9.6
18
.73
2.4
41
8.8
51
8.3
2
Lin
e5
SQ
97-0
26
3-7
1-1
-3A
1A
2,
A4
a,a0
,b,
A3
41
.92
2.8
14
7.1
50
.48
53
8.8
48
.30
6.8
02
.59
12
.36
Lin
e6
SQ
98-0
10
5-1
-1b
A3
,A
4a,
a0,b,
A1
A2
43
.32
0.5
24
4.3
80
.46
53
6.5
77
.81
1.4
16
.54
11
.01
Lin
e7
SQ
97-0
26
3_
21
-7-2
a0,
A3
,A
4a,
b,
A1
A2
43
.03
0.5
34
0.2
10
.76
02
9.3
51
0.8
62
.71
11
.73
15
.37
Lin
e8
SQ
97-0
26
3_
3-1
0-1
a0,
A1
A2
,A
3a,
b,
A4
45
.42
8.3
73
8.9
70
.73
02
7.6
51
1.3
11
.67
12
.83
10
.99
Lin
e9
SQ
970
25
2_
S17
-2-1
A1
A2
,A
3,
A4
a,a0
,b
42
.91
1.7
05
6.7
60
.20
54
3.8
81
2.8
81
.31
2.5
06
.08
Lin
e1
0S
Q9
70
25
2_
S17
-2-3
A1
A2
,A
3,
A4
a,a0
,b
42
.01
4.9
25
5.4
40
.27
04
3.5
91
1.8
52
.49
3.3
97
.08
Lin
e1
1S
Q9
7-0
26
3_
3-1
aa0
,A
1A
2,
A3
,A
4a,
b4
2.7
12
.87
48
.83
0.2
65
34
.00
14
.83
0.9
71
.64
9.3
1
Lin
e1
2S
Q9
8-0
11
2-S
7-1
A1
A2
a,a0
,b,
A3
,A
44
5.5
28
.20
43
.28
0.6
50
33
.73
9.5
54
.67
10
.97
8.9
6
aP
aren
tli
ne
bP
erce
nta
ge
of
tota
lpro
tein
J Am Oil Chem Soc (2008) 85:581–590 583
123
2.0, Amersham Biosciences). The protein composition was
calculated by dividing the area of the individual peaks by
the sum of the areas under all of the peaks including non-
storage proteins (for example lectins and lipoxygenase).
11S/7S ratio was calculated by dividing the sum of the
areas from the densitometer scan of the electrophoresis
results for 11S proteins divided by the sum of the areas for
the 7S proteins.
Differential Scanning Calorimetry
Full-fat flour, flour defatted at 105 �C, flour defatted at
23 �C and SPI of the 12 lines were analyzed for differences
in their thermal denaturation using differential scanning
calorimetry (2920 modulated DSC, TA Instrument, New
Castle, DE). Samples of aqueous dispersions (*60 mg)
were placed in sealed aluminum pans and analyzed at 2 �C/
min from 30 to 115 �C; an empty aluminum pan was used
as a reference. Denaturation temperature (TD in �C) and
thermal denaturation enthalpies (DH in Joules per gram of
protein) were calculated from the endothermic curves. TD
is the intercept of the extrapolated slope of the peak and the
baseline; DH is the area under the endothermic curve using
the Universal Analysis 2000 software supplied by TA
Instruments. Determinations were performed in triplicate.
Rheological Measurements
Gel formation was followed by dynamic rheological
measurements in a stress controlled rheometer (AR 2000,
TA instruments, UK) to determine differences in the
viscoelastic properties of the isolates during heating,
cooling and holding. The geometry used was an alumin-
ium standard-size recessed end concentric cylinder
(15 mm 9 14 mm 9 42 mm) with a gap of 4 mm. To
induce gelation, samples of 11% protein (volume was
8 ml) were heated at 1 �C/min from 25 to 90 �C, kept at
90 �C for 30 min, and then cooled to 25 �C at 1 �C/min.
An angular frequency (x) of 6.3 rad/s (1 Hz) and a
constant maximum strain of 0.01 were kept within the
temperature ramps. Frequency sweep tests were carried out
after the temperature ramp from 10 to 0.01 Hz with a
constant applied strain of 0.01 at 25 �C. Stress sweep tests
were conducted after frequency sweeps from 0.001 to
300 Pa with a constant applied frequency of 1 Hz
confirming that measurements were within the linear vis-
coelastic range. Frequency dependence of the storage
modulus (G0) and loss modulus (G00) were determined by
the slope of log G0 and log G00 respectively as a function of
log x to evaluate differences in the mechanical properties
of gels. A thin layer of mineral oil (approximately 0.5 ml)
was used on top of the samples to prevent evaporation.
Determinations were performed in triplicate.
Statistical Analysis
Statistical evaluation was conducted using SAS (Version
8.0, Cary, NC). General Linear Model (GLM) and Least
Squares Means (LSMEANS) procedures were carried out
to determine significant differences among the 12 soybean
lines. GLM was also conducted to determine significant
differences among four different products (full-fat flour,
flours defatted at 105 �C, flours defatted at 23 �C and SPI).
Results and Discussion
Characterisation of Soybean Lines
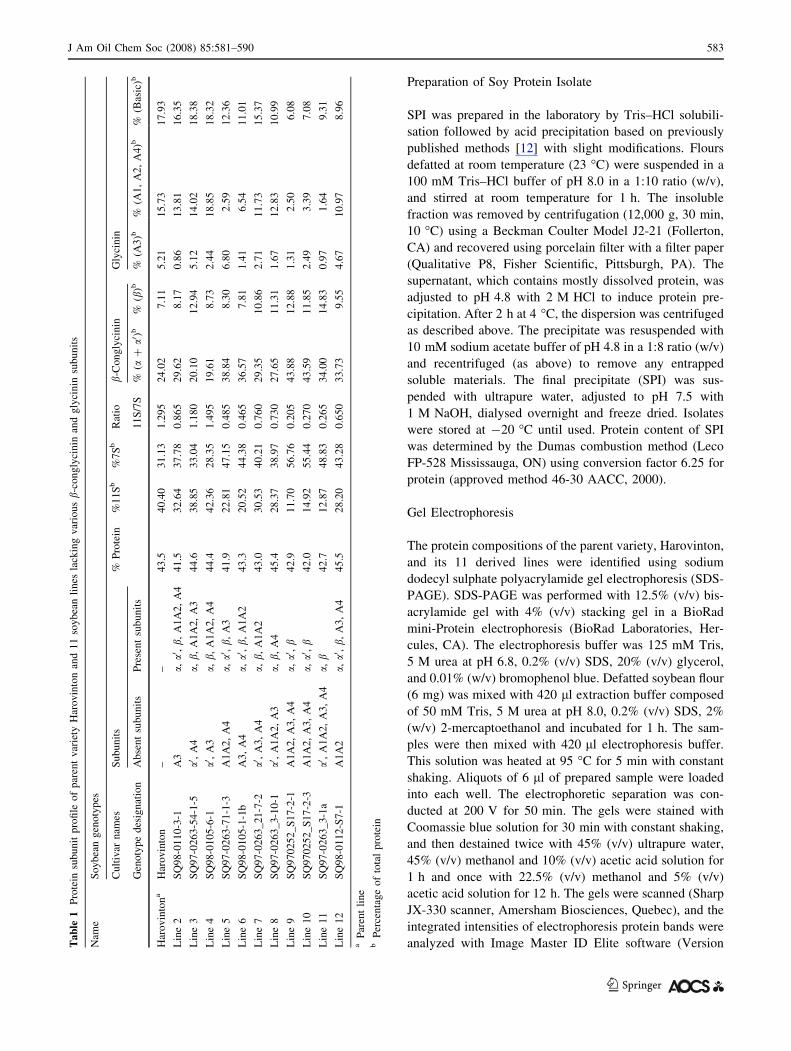
The protein composition of the 12 soybean lines was
characterised using SDS-PAGE gel electrophoresis and
results are shown in Fig. 1. Genotype designation, 11S:7S
ratio and percentage protein composition are shown in
Table 1. It was confirmed that Harovinton contains all the
b-conglycinin and glycinin subunits. The 11S:7S ratio
calculated from the electrophoresis gels ranged from 0.2 to
1.5, with the 11S null-lines showing just trace amounts of
11S subunits. Lines 9, 10 and 11 are the 11S null-lines.
Line 11 also lacks the a0 subunit of 7S. Lines 3, 4, 7 and 8
lack the b-conglycinin subunit a0, and also some glycinin
subunits. Lines 2, 5, 6 and 12 have the subunit a0, but some
11S subunits are absent. The 11S null-lines and line 3 have
the highest content in b-subunit of 7S (*13%). The 7S (aand a0-subunits) content is the highest (*41%) for lines 5,
6, 9 and 10. The basic subunit of glycinin averages *15%
for all lines except for 11S-null lines and line 12, which
have the lowest content (*8%). Harovinton and lines 3, 5
and 12 had the highest content of 11S (A3) with about 5%.
11S (A1, A2, A4) average *14% for Harovinton and lines
2, 3, 4, 7, 8 and 12, while the other lines have only *3%.
Although the quantity of different protein subunits in the
null lines was greatly suppressed none of them were
eliminated. This would suggest that the genetic variation
acted at the level of protein expression or post-translational
modifications rather than sequence which codes for the
protein. The result is that the 12 varieties used in this work
provided a wide spectrum in variation of subunit
composition.
Thermal Denaturation
To evaluate how different protein subunits were affected
by SPI processing, full-fat flours (with minimal process-
ing), flours defatted at ambient and moderate (6.67 MPa)
pressures which resulted in different extraction tempera-
tures (23 and 105 �C, respectively) and SPI were analyzed
using DSC. DSC was used to identify changes in
584 J Am Oil Chem Soc (2008) 85:581–590
123
functionality with processing that may affect the applica-
bility of these products in the food industry.
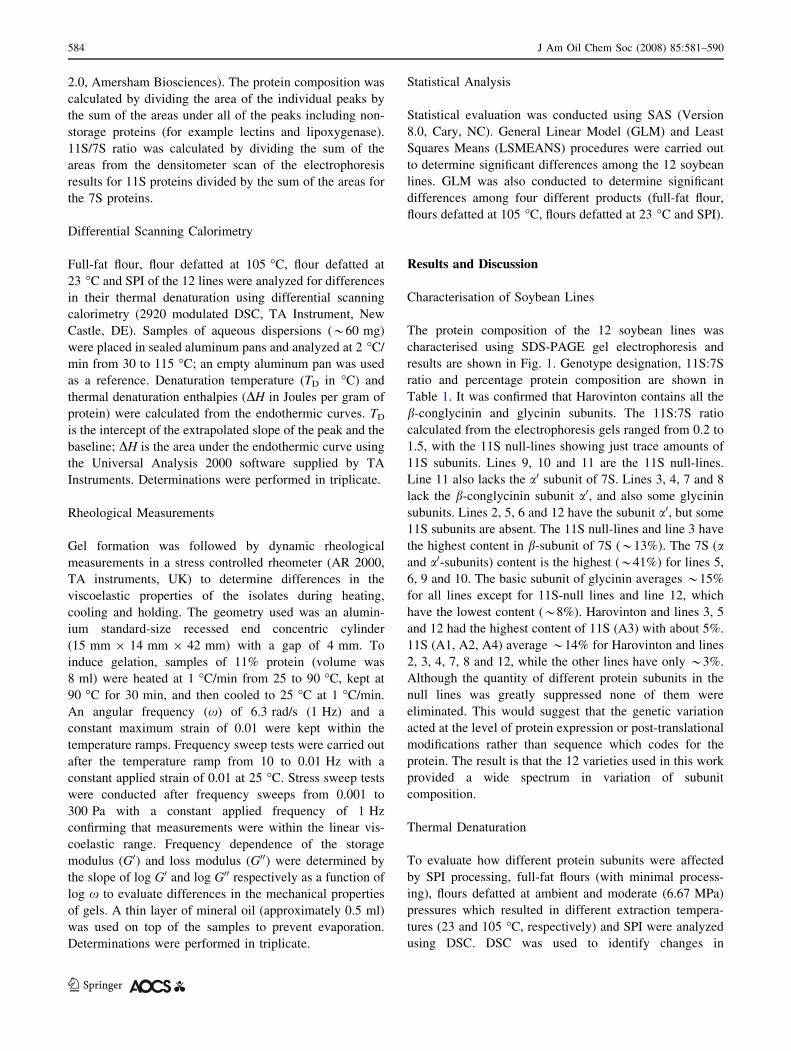
DSC-thermograms of full-fat flours of the parent variety
Harovinton and an 11S null-line (Line 9) are shown in
Fig. 2. Two endothermic peaks caused by heat denatur-
ation were observed for lines containing b-conglycinin and
glycinin. A single endothermic peak was obtained for 11S
null-lines because the glycinin content was too low to be
detected by the DSC.
Enthalpies of denaturation (DH) and denaturation tem-
peratures (TD) are shown in Tables 2 and 3, respectively.
Statistical analysis showed that within lines, the values of
DH and TD were significantly different (P \ 0.01) among
the four processing conditions studied (i.e. flour, flour
defatted at low and high temperature, SPI). DH was also
highly significantly different (P \ 0.0001) among the 12
lines in all conditions (Table 2). These variations found in
the denaturation temperatures and enthalpies among the
lines are most likely caused by the differences in heat
stability given by particular subunits present in these lines.
Lines 5–12, which contain lower 11S:7S ratio, had
higher DH7S. The enthalpy was corrected for protein con-
tent in the sample and represents the amount of energy
required to denature a gram of protein. For instance, line 9
had the highest 7S content and this was reflected in the
higher enthalpies of denaturation of 7S compared to other
lines. The enthalpies of denaturation range from 0.2 to
3.0 J/g protein for 7S and from 0.2 to 6.0 J/g protein for
11S. These results indicate that 11S is more heat stable
than 7S, as previously reported [7].
Denaturation temperature of 7S protein (TD-7S) in the
full-fat flours are not significantly different (P [ 0.05)
between lines (Table 3). However, the 11S denaturation
temperatures (TD-11S) are significantly different between
the lines, shown in Table 3. This indicates that the varia-
tion in the subunit composition of 11S strongly affects the
temperature of denaturation, while the subunit composition
of 7S did not affect it, at least for the subunit combinations
(with or without a0) used in this work. A previous study
[13] indicated that the b-subunit of 7S had a stronger effect
on the temperature of denaturation than did the a0 subunit.
TD-7S ranged from 72 to 76 �C and TD-11S varied from 90 to
99 �C for the three different stages during SPI processing.
Table 3 shows that isolates generally had a lower dena-
turation temperature for both 7S and 11S, but they usually
had higher enthalpy of denaturation than the other condi-
tions. The DH11S of SPI-line 6 was the only line that did
not follow this behaviour. Although the enthalpy changes
may be mostly caused by the differences in the protein
amounts in the various materials, these results indicate that
other components (e.g. fat, carbohydrates) present in dif-
ferent content among the four processed samples or
differences in the way the proteins are assembled into
larger structures may affect the temperature of denaturation
of the samples.
Tables 2 and 3 show that, for most lines, there is an
increase in the denaturation temperatures and enthalpies of
denaturation of 7S protein. Denaturation temperatures and
enthalpies for 7S in flours defatted at high temperature are
significantly different from those defatted at room tem-
perature (P \ 0.001). The DH7S of the flours defatted at
Fig. 1 SDS-PAGE profiles of 12 soybean lines with various b-
conglycinin (7S) and glycinin (11S) polypeptide compositions. Parent
variety Harovinton is identified as an H and derived 11 null-lines
are identified as number 2–12. The major storage polypeptides are
indicated and labelled at the left of the gel: b-conglycinin polypep-
tides (a0,a and b) and glycinin polypeptides (A: acidic and B: basic).
The other band identified is lipoxygenase
Fig. 2 DSC-thermogram of the parent variety Harovinton (full line)
and Line 9 which is a 11S null-line (broken line). Denaturation
temperatures (TD-7S) and enthalpy of denaturation (DH7S) are shown
in the first endothermic peak. 11S denaturation temperature (TD-11S)
and enthalpy of denaturation (DH11S) are shown in the second
endothermic peak. 11S null-lines lack the second endothermic peak as
shown
J Am Oil Chem Soc (2008) 85:581–590 585
123
23 �C are higher than the ones defatted at 105 �C
(Table 2). This behaviour was not seen for the TD11S and
DH11S as denaturation temperatures and enthalpies for 11S
in flours defatted at high temperature are not significantly
different from those defatted at room temperature
(P [ 0.05). These results are a clear indication of confor-
mational change of the 7S storage proteins.
Relationships between the enthalpies of denaturation of
7S and 11S globulins versus 11S:7S ratios were observed as
expected. The 11S:7S ratio increased with and increase in the
enthalpy of 11S denaturation and decreased with an increase
in the enthalpy of 7S denaturation for the four conditions.
Although conformational changes in the protein were
observed during the processing of SPI, neither the high
temperature nor the low temperature hexane extractions
can account for the degree of denaturation found in
industrially produced SPI. Commercially available SPI
frequently has no measurable DSC peak which would
indicate extensive denaturation (data not shown). The other
major difference between the process used here and com-
mercial processing is the drying method. Freeze drying was
used for these samples, whereas industrial processes use
heat to dry the SPI. An investigation of the effect of drying
methods on SPI solubility and functionality may be useful
for improving SPI quality.
Gelling Properties of Soy Protein Isolates
To determine the changes in viscoelastic behaviour of the
SPI during gel formation, the storage (G0) and loss (G00)
moduli were measured during heating. A typical example
of a heat-induced gel curve of SPI dispersions at pH 7.0 as
a function of time is shown in Fig. 3. The elastic modulus
of the gels (G0), increases with heating, and continues to
increase during cooling as previously reported [14].
Unfolding of the proteins during heating allows for the
formation of intermolecular disulphide bonds between
cystine residues. A further increase in the G0 occurs during
the cooling step of soy protein gels, as the proteins
rearrange and further associate through non-covalent
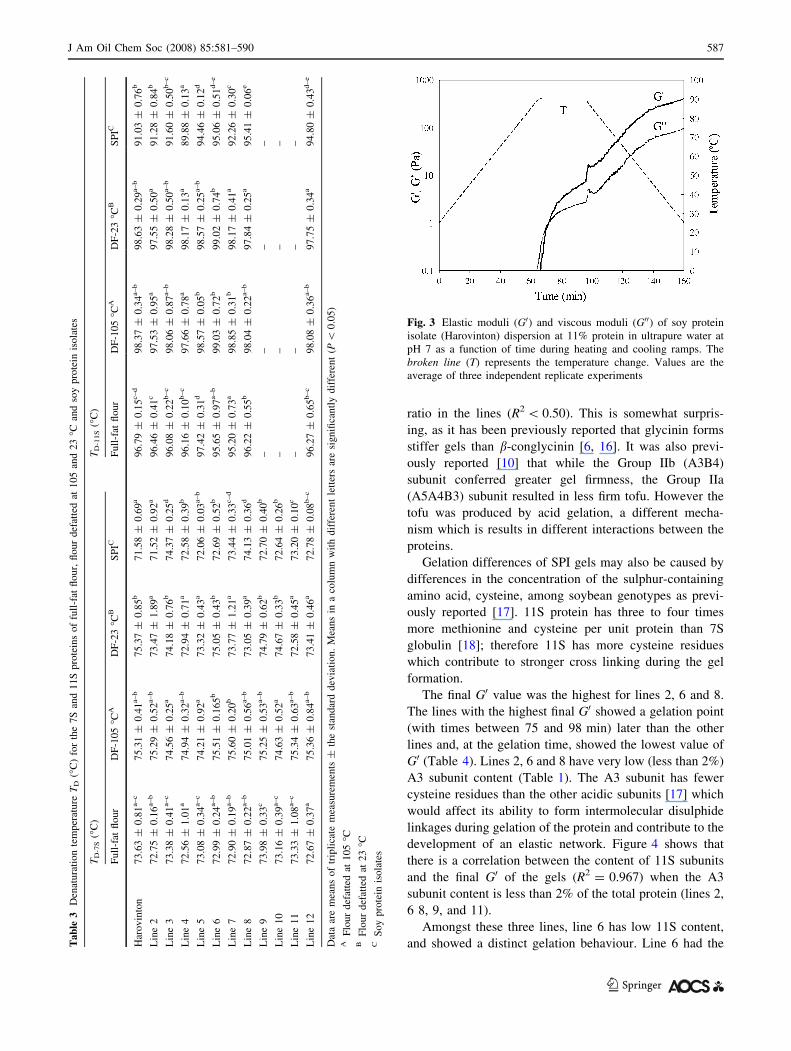
interactions [14]. Figure 3 shows that for the Harovinton
line, the gelation cross point, which was defined as the
point when the loss tangent (tan d = G00/G0) equals 1 at a
frequency of 1 Hz, was reached at 90 �C (t = 72 min).
This temperature coincides with the TD-11S of Harovinton
SPI at *91 �C, the temperature at which the 11S begins to
unfold.
Protein denaturation is a prerequisite for gelation of
globulins [15] which leads to the association of unfolded
proteins with exposed reactive residues, and subsequent
formation of a gel network. Consequently, it is possible to
predict that, since 7S denatures at a lower temperature than
11S, 7S will form a gel at a lower temperature (*75 �C)
than 11S (*90 �C). This postulation agrees with the
results reported in Table 4; for instance, line 5 (containing
a high % of 7S) showed an earlier gel point, at a lower
temperature, than lines containing high 11S content. This
was also shown in the 11S null-lines (lines 9, 10 and 11).
The storage modulus (G0) at the end of the heating and
cooling experiment was not correlated with the 11S:7S
Table 2 Enthalpy of denaturation DH (J/g protein) for the 7S and 11S proteins of full-fat flour, flour defatted at 105 and 23 �C and soy protein
isolates
DH7S (J/g protein) DH11S (J/g protein)
Full-fat flour DF-105 �CA DF-23 �CB SPIC Full-fat flour DF-105 �CA DF-23 �CB SPIC
Harovinton 0.38 ± 0.04c 0.29 ± 0.02a 0.70 ± 0.05b 0.87 ± 0.12a 1.50 ± 0.08e 2.18 ± 0.05c 1.99 ± 0.40d 5.96 ± 0.37f
Line 2 0.31 ± 0.01b 0.17 ± 0.14a 0.53 ± 0.06a 0.99 ± 0.13a 0.92 ± 0.03d 1.38 ± 0.25b 1.24 ± 0.22c 4.75 ± 0.47e
Line 3 0.34 ± 0.05b–c 0.31 ± 0.10a 0.65 ± 0.08b 0.81 ± 0.08a 1.38 ± 0.12e 1.55 ± 0.47b 2.06 ± 0.11d 4.94 ± 0.28e
Line 4 0.18 ± 0.03a 0.32 ± 0.07a 0.50 ± 0.05a 0.93 ± 0.05a 1.45 ± 0.07e 2.54 ± 0.17d 2.20 ± 0.02d 4.97 ± 0.07e
Line 5 0.38 ± 0.01c 0.69 ± 0.07b–c 1.01 ± 0.13d 2.39 ± 0.12d 0.25 ± 0.04a 0.58 ± 0.05a 0.47 ± 0.05a 2.16 ± 0.08c
Line 6 0.56 ± 0.02d 0.84 ± 0.14c–d 1.12 ± 0.18d–e 2.75 ± 0.20e 0.48 ± 0.02b 0.63 ± 0.10a 0.62 ± 0.08a–b 0.26 ± 0.04a
Line 7 0.35 ± 0.01b–c 0.63 ± 0.13b 0.84 ± 0.05c 1.35 ± 0.09b 0.90 ± 0.09c–d 1.38 ± 0.08b 1.27 ± 0.10c 3.84 ± 0.40d
Line 8 0.53 ± 0.09d 0.79 ± 0.14c–d 0.86 ± 0.01c 2.38 ± 0.15d 0.41 ± 0.07b 0.76 ± 0.03a 0.87 ± 0.05b 1.55 ± 0.11b
Line 9 0.67 ± 0.07e 1.21 ± 0.18f 1.30 ± 0.12f 3.36 ± 0.18f – – – –
Line 10 0.50 ± 0.02d 0.94 ± 0.07d–e 1.14 ± 0.08d–e 1.98 ± 0.17c – – – –
Line 11 0.74 ± 0.04f 0.99 ± 0.03e 1.18 ± 0.02e–f 2.69 ± 0.16e – – – –
Line 12 0.55 ± 0.05d 0.61 ± 0.18b 0.75 ± 0.04b–c 2.19 ± 0.24c–d 0.79 ± 0.02c 0.91 ± 0.11a 0.87 ± 0.18b 2.71 ± 0.53c
Data are means of triplicate measurements ± the standard deviation. Means in a column with different letters are significantly different
(P \ 0.05)A Flour defatted at 105 �CB Flour defatted at 23 �CC Soy protein isolates
586 J Am Oil Chem Soc (2008) 85:581–590
123
ratio in the lines (R2 \ 0.50). This is somewhat surpris-
ing, as it has been previously reported that glycinin forms
stiffer gels than b-conglycinin [6, 16]. It was also previ-
ously reported [10] that while the Group IIb (A3B4)
subunit conferred greater gel firmness, the Group IIa
(A5A4B3) subunit resulted in less firm tofu. However the
tofu was produced by acid gelation, a different mecha-
nism which is results in different interactions between the
proteins.
Gelation differences of SPI gels may also be caused by
differences in the concentration of the sulphur-containing
amino acid, cysteine, among soybean genotypes as previ-
ously reported [17]. 11S protein has three to four times
more methionine and cysteine per unit protein than 7S
globulin [18]; therefore 11S has more cysteine residues
which contribute to stronger cross linking during the gel
formation.
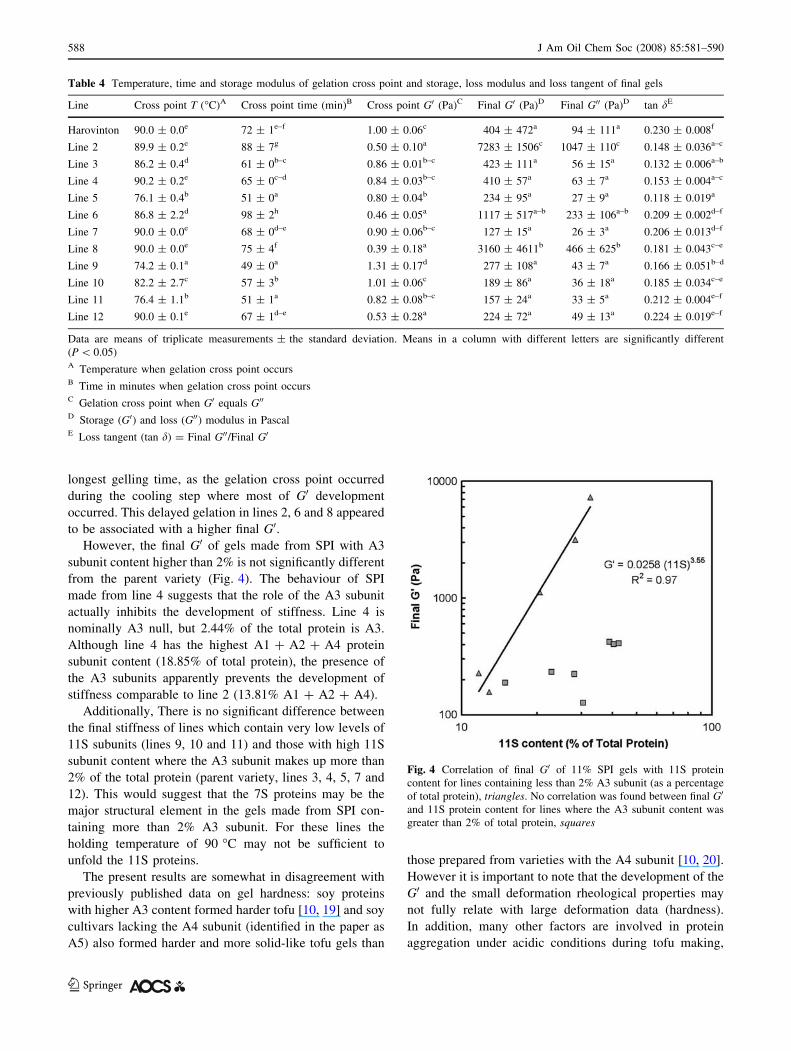
The final G0 value was the highest for lines 2, 6 and 8.
The lines with the highest final G0 showed a gelation point
(with times between 75 and 98 min) later than the other
lines and, at the gelation time, showed the lowest value of
G0 (Table 4). Lines 2, 6 and 8 have very low (less than 2%)
A3 subunit content (Table 1). The A3 subunit has fewer
cysteine residues than the other acidic subunits [17] which
would affect its ability to form intermolecular disulphide
linkages during gelation of the protein and contribute to the
development of an elastic network. Figure 4 shows that
there is a correlation between the content of 11S subunits
and the final G0 of the gels (R2 = 0.967) when the A3
subunit content is less than 2% of the total protein (lines 2,
6 8, 9, and 11).
Amongst these three lines, line 6 has low 11S content,
and showed a distinct gelation behaviour. Line 6 had theTab
le3
Den
atura
tio
nte
mp
erat
ure
TD
(�C
)fo
rth
e7
San
d1
1S
pro
tein
so
ffu
ll-f
atfl
ou
r,fl
our
def
atte
dat
10
5an
d2
3�C
and
soy
pro
tein
isola
tes
TD
-7S
(�C
)T
D-1
1S
(�C
)
Fu
ll-f
atfl
our
DF
-105
�CA
DF
-23
�CB
SP
ICF
ull
-fat
flo
ur
DF
-10
5�C
AD
F-2
3�C
BS
PIC
Har
ov
into
n7
3.6
3±
0.8
1a–c
75
.31
±0
.41
a–b
75
.37
±0
.85
b7
1.5
8±
0.6
9a
96
.79
±0
.15
c–d
98
.37
±0
.34
a–b
98
.63
±0
.29
a–b
91
.03
±0
.76
b
Lin
e2
72
.75
±0
.16
a–b
75
.29
±0
.52
a–b
73
.47
±1
.89
a7
1.5
2±
0.9
2a
96
.46
±0
.41
c9
7.5
3±
0.9
5a
97
.55
±0
.50
a9
1.2
8±
0.8
4b
Lin
e3
73
.38
±0
.41
a–c
74
.56
±0
.25
a7
4.1
8±
0.7
6b
74
.37
±0
.25
d9
6.0
8±
0.2
2b–c
98
.06
±0
.87
a–b
98
.28
±0
.50
a–b
91
.60
±0
.50
b–c
Lin
e4
72
.56
±1
.01
a7
4.9
4±
0.3
2a–b
72
.94
±0
.71
a7
2.5
8±
0.3
9b
96
.16
±0
.10
b–c
97
.66
±0
.78
a9
8.1
7±
0.1
3a
89
.88
±0
.13
a
Lin
e5
73
.08
±0
.34
a–c
74
.21
±0
.92
a7
3.3
2±
0.4
3a
72
.06
±0
.03
a–b
97
.42
±0
.31
d9
8.5
7±
0.0
5b
98
.57
±0
.25
a–b
94
.46
±0
.12
d
Lin
e6
72
.99
±0
.24
a–b
75
.51
±0
.165
b7
5.0
5±
0.4
3b
72
.69
±0
.52
b9
5.6
5±
0.9
7a–b
99
.03
±0
.72
b9
9.0
2±
0.7
4b
95
.06
±0
.51
d–e
Lin
e7
72
.90
±0
.19
a–b
75
.60
±0
.20
b7
3.7
7±
1.2
1a
73
.44
±0
.33
c–d
95
.20
±0
.73
a9
8.8
5±
0.3
1b
98
.17
±0
.41
a9
2.2
6±
0.3
0c
Lin
e8
72
.87
±0
.22
a–b
75
.01
±0
.56
a–b
73
.05
±0
.39
a7
4.1
3±
0.3
6d
96
.22
±0
.55
b9
8.0
4±
0.2
2a–b
97
.84
±0
.25
a9
5.4
1±
0.0
6e
Lin
e9
73
.98
±0
.33
c7
5.2
5±
0.5
3a–b
74
.79
±0
.62
b7
2.7
0±
0.4
0b
––
––
Lin
e1
07
3.1
6±
0.3
9a–c
74
.63
±0
.52
a7
4.6
7±
0.3
3b
72
.64
±0
.26
b–
––
–
Lin
e1
17
3.3
3±
1.0
8a–c
75
.34
±0
.63
a–b
72
.58
±0
.45
a7
3.2
0±
0.1
0c
––
––
Lin
e1
27
2.6
7±
0.3
7a
75
.36
±0
.84
a–b
73
.41
±0
.46
a7
2.7
8±
0.0
8b–c
96
.27
±0
.65
b–c
98
.08
±0
.36
a–b
97
.75
±0
.34
a9
4.8
0±
0.4
3d–e
Dat
aar
em
eans
of
trip
lica
tem
easu
rem
ents
±th
est
andar
dd
evia
tio
n.
Mea
ns
ina
colu
mn
wit
hd
iffe
ren
tle
tter
sar
esi
gn
ifica
ntl
yd
iffe
ren
t(P
\0
.05)
AF
lou
rd
efat
ted
at1
05
�CB
Flo
ur
def
atte
dat
23
�CC
So
yp
rote
inis
ola
tes
Fig. 3 Elastic moduli (G0) and viscous moduli (G00) of soy protein
isolate (Harovinton) dispersion at 11% protein in ultrapure water at
pH 7 as a function of time during heating and cooling ramps. The
broken line (T) represents the temperature change. Values are the
average of three independent replicate experiments
J Am Oil Chem Soc (2008) 85:581–590 587
123
longest gelling time, as the gelation cross point occurred
during the cooling step where most of G0 development
occurred. This delayed gelation in lines 2, 6 and 8 appeared
to be associated with a higher final G0.However, the final G0 of gels made from SPI with A3
subunit content higher than 2% is not significantly different
from the parent variety (Fig. 4). The behaviour of SPI
made from line 4 suggests that the role of the A3 subunit
actually inhibits the development of stiffness. Line 4 is
nominally A3 null, but 2.44% of the total protein is A3.
Although line 4 has the highest A1 + A2 + A4 protein
subunit content (18.85% of total protein), the presence of
the A3 subunits apparently prevents the development of
stiffness comparable to line 2 (13.81% A1 + A2 + A4).
Additionally, There is no significant difference between
the final stiffness of lines which contain very low levels of
11S subunits (lines 9, 10 and 11) and those with high 11S
subunit content where the A3 subunit makes up more than
2% of the total protein (parent variety, lines 3, 4, 5, 7 and
12). This would suggest that the 7S proteins may be the
major structural element in the gels made from SPI con-
taining more than 2% A3 subunit. For these lines the
holding temperature of 90 �C may not be sufficient to
unfold the 11S proteins.
The present results are somewhat in disagreement with
previously published data on gel hardness: soy proteins
with higher A3 content formed harder tofu [10, 19] and soy
cultivars lacking the A4 subunit (identified in the paper as
A5) also formed harder and more solid-like tofu gels than
those prepared from varieties with the A4 subunit [10, 20].
However it is important to note that the development of the
G0 and the small deformation rheological properties may
not fully relate with large deformation data (hardness).
In addition, many other factors are involved in protein
aggregation under acidic conditions during tofu making,
Table 4 Temperature, time and storage modulus of gelation cross point and storage, loss modulus and loss tangent of final gels
Line Cross point T (�C)A Cross point time (min)B Cross point G0 (Pa)C Final G0 (Pa)D Final G00 (Pa)D tan dE
Harovinton 90.0 ± 0.0e 72 ± 1e–f 1.00 ± 0.06c 404 ± 472a 94 ± 111a 0.230 ± 0.008f
Line 2 89.9 ± 0.2e 88 ± 7g 0.50 ± 0.10a 7283 ± 1506c 1047 ± 110c 0.148 ± 0.036a–c
Line 3 86.2 ± 0.4d 61 ± 0b–c 0.86 ± 0.01b–c 423 ± 111a 56 ± 15a 0.132 ± 0.006a–b
Line 4 90.2 ± 0.2e 65 ± 0c–d 0.84 ± 0.03b–c 410 ± 57a 63 ± 7a 0.153 ± 0.004a–c
Line 5 76.1 ± 0.4b 51 ± 0a 0.80 ± 0.04b 234 ± 95a 27 ± 9a 0.118 ± 0.019a
Line 6 86.8 ± 2.2d 98 ± 2h 0.46 ± 0.05a 1117 ± 517a–b 233 ± 106a–b 0.209 ± 0.002d–f
Line 7 90.0 ± 0.0e 68 ± 0d–e 0.90 ± 0.06b–c 127 ± 15a 26 ± 3a 0.206 ± 0.013d–f
Line 8 90.0 ± 0.0e 75 ± 4f 0.39 ± 0.18a 3160 ± 4611b 466 ± 625b 0.181 ± 0.043c–e
Line 9 74.2 ± 0.1a 49 ± 0a 1.31 ± 0.17d 277 ± 108a 43 ± 7a 0.166 ± 0.051b–d
Line 10 82.2 ± 2.7c 57 ± 3b 1.01 ± 0.06c 189 ± 86a 36 ± 18a 0.185 ± 0.034c–e
Line 11 76.4 ± 1.1b 51 ± 1a 0.82 ± 0.08b–c 157 ± 24a 33 ± 5a 0.212 ± 0.004e–f
Line 12 90.0 ± 0.1e 67 ± 1d–e 0.53 ± 0.28a 224 ± 72a 49 ± 13a 0.224 ± 0.019e–f
Data are means of triplicate measurements ± the standard deviation. Means in a column with different letters are significantly different
(P \ 0.05)A Temperature when gelation cross point occursB Time in minutes when gelation cross point occursC Gelation cross point when G0 equals G00
D Storage (G0) and loss (G00) modulus in PascalE Loss tangent (tan d) = Final G00/Final G0
Fig. 4 Correlation of final G0 of 11% SPI gels with 11S protein
content for lines containing less than 2% A3 subunit (as a percentage
of total protein), triangles. No correlation was found between final G0
and 11S protein content for lines where the A3 subunit content was
greater than 2% of total protein, squares
588 J Am Oil Chem Soc (2008) 85:581–590
123
which are different from the present study which dealt with
heat-induced aggregation of soy proteins.
Line 9, containing the highest 7S content, showed the
highest G0 at the crossover point and a low temperature of
gelation (Table 4). This is a clear indication that in lines
containing high 7S, the 7S contributed to the gel structure.
Line 4, with the highest 11S:7S ratio showed an interme-
diate crossover point value when compared to the other
lines.
Lines 1, 3 and 4 had similar 11S:7S ratio and the final G0
values ranged over about 400 Pa. Although line 7 has a
similar protein composition to line 8, it has a very distinct
gelation profile from that of line 8. The gelation time and
the value of G0 at the crossover point were significantly
different between the two lines. The development of
stiffness was a lot slower in line 8 than in line 7 the final G00
was much higher in line 8. While line 8 has A4, line 7 lacks
A4 and has higher content of A3 than line 8. Once again,
the content of A3 and A4 subunits seems to influence
network formation.
The loss tangent (tan d) describes the viscoelastic nature
of the gel networks formed. tan d is much lower for an
elastic network than for a particulate or weak network. The
values of tan d summarised in Table 4 range from 0.118 to
0.20 and show that at 11% protein the gel formed contained
a significant viscous (energy loss) component. This again
suggests a particulate or weak network structure.
Viscoelastic Properties of SPI Gels
Frequency sweep tests were performed immediately after
the temperature ramps. In all the samples G0 was higher
than G00 throughout the range of the frequency sweep
indicating that a gel network had formed in all of the
solutions. G0 showed some degree of frequency dependent
with lower G0 values being measured at low frequency than
at high frequency, because at longer experimental time
scales more protein-protein bonds have time relax during
the periodic deformation.
The viscoelastic characteristics of final SPI gels can be
mathematically represented by using the power-type model
(G0 = Kxn) correlating the elastic modulus (G0) and fre-
quency (x). K and n are regression coefficients relating G0
and x (Table 5). The storage modulus dependency with
frequency was significantly different (P \ 0.05) among
lines as the slope of the plot of log G0 as a function of log
frequency (which corresponds to n value in the power law
model). The values calculated for n ranged from 0.062 to
0.152 for the different lines. From a structural point of
view, perfectly elastic gel networks (independent of the
frequency of oscillation) are identified by a zero slope for
G0, whereas particulate gels show positive slopes [21]. The
positive slopes of the SPI gels again demonstrate that the
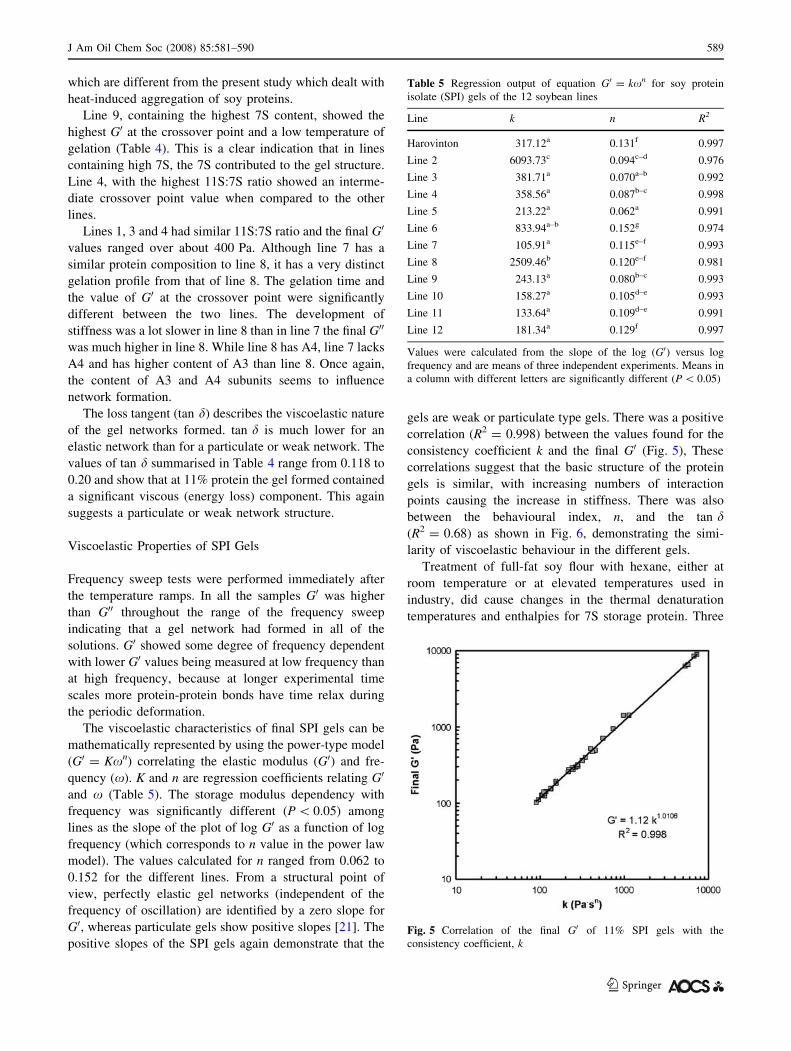
gels are weak or particulate type gels. There was a positive
correlation (R2 = 0.998) between the values found for the
consistency coefficient k and the final G0 (Fig. 5), These
correlations suggest that the basic structure of the protein
gels is similar, with increasing numbers of interaction
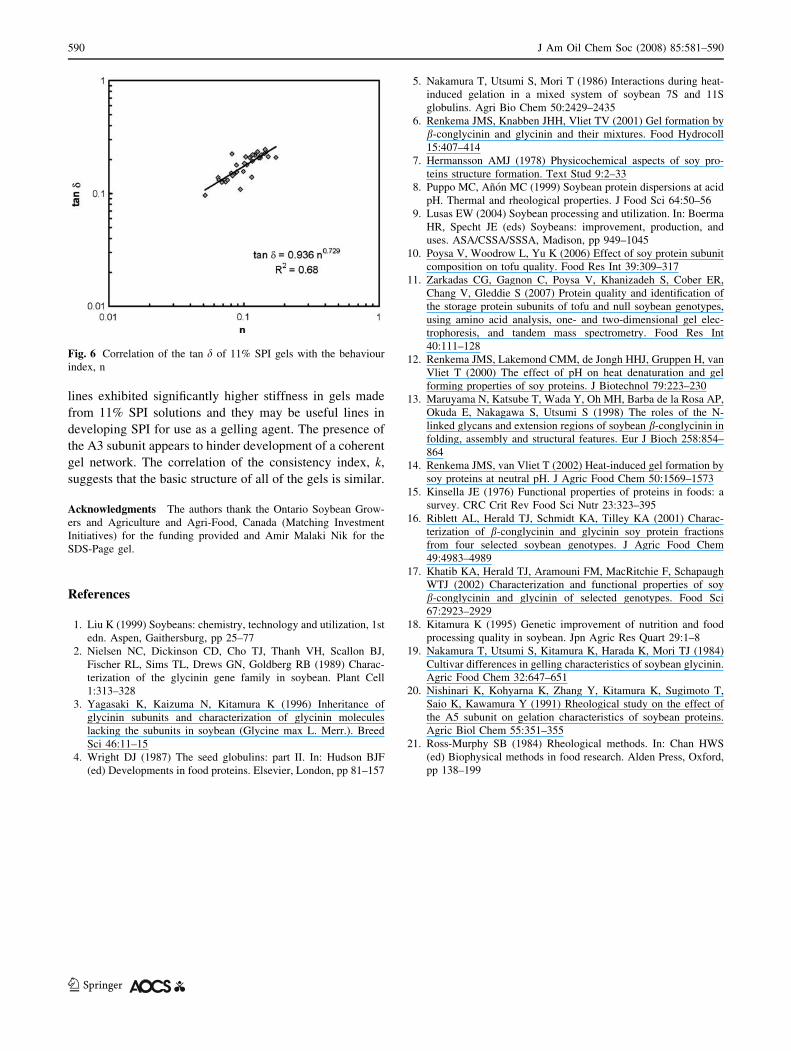
points causing the increase in stiffness. There was also
between the behavioural index, n, and the tan d(R2 = 0.68) as shown in Fig. 6, demonstrating the simi-
larity of viscoelastic behaviour in the different gels.
Treatment of full-fat soy flour with hexane, either at
room temperature or at elevated temperatures used in
industry, did cause changes in the thermal denaturation
temperatures and enthalpies for 7S storage protein. Three
Table 5 Regression output of equation G0 = kxn for soy protein
isolate (SPI) gels of the 12 soybean lines
Line k n R2
Harovinton 317.12a 0.131f 0.997
Line 2 6093.73c 0.094c–d 0.976
Line 3 381.71a 0.070a–b 0.992
Line 4 358.56a 0.087b–c 0.998
Line 5 213.22a 0.062a 0.991
Line 6 833.94a–b 0.152g 0.974
Line 7 105.91a 0.115e–f 0.993
Line 8 2509.46b 0.120e–f 0.981
Line 9 243.13a 0.080b–c 0.993
Line 10 158.27a 0.105d–e 0.993
Line 11 133.64a 0.109d–e 0.991
Line 12 181.34a 0.129f 0.997
Values were calculated from the slope of the log (G0) versus log
frequency and are means of three independent experiments. Means in
a column with different letters are significantly different (P \ 0.05)
Fig. 5 Correlation of the final G0 of 11% SPI gels with the
consistency coefficient, k
J Am Oil Chem Soc (2008) 85:581–590 589
123
lines exhibited significantly higher stiffness in gels made
from 11% SPI solutions and they may be useful lines in
developing SPI for use as a gelling agent. The presence of
the A3 subunit appears to hinder development of a coherent
gel network. The correlation of the consistency index, k,
suggests that the basic structure of all of the gels is similar.
Acknowledgments The authors thank the Ontario Soybean Grow-
ers and Agriculture and Agri-Food, Canada (Matching Investment
Initiatives) for the funding provided and Amir Malaki Nik for the
SDS-Page gel.
References
1. Liu K (1999) Soybeans: chemistry, technology and utilization, 1st
edn. Aspen, Gaithersburg, pp 25–77
2. Nielsen NC, Dickinson CD, Cho TJ, Thanh VH, Scallon BJ,
Fischer RL, Sims TL, Drews GN, Goldberg RB (1989) Charac-
terization of the glycinin gene family in soybean. Plant Cell
1:313–328
3. Yagasaki K, Kaizuma N, Kitamura K (1996) Inheritance of
glycinin subunits and characterization of glycinin molecules
lacking the subunits in soybean (Glycine max L. Merr.). Breed
Sci 46:11–15
4. Wright DJ (1987) The seed globulins: part II. In: Hudson BJF
(ed) Developments in food proteins. Elsevier, London, pp 81–157
5. Nakamura T, Utsumi S, Mori T (1986) Interactions during heat-
induced gelation in a mixed system of soybean 7S and 11S
globulins. Agri Bio Chem 50:2429–2435
6. Renkema JMS, Knabben JHH, Vliet TV (2001) Gel formation by
b-conglycinin and glycinin and their mixtures. Food Hydrocoll
15:407–414
7. Hermansson AMJ (1978) Physicochemical aspects of soy pro-
teins structure formation. Text Stud 9:2–33
8. Puppo MC, Anon MC (1999) Soybean protein dispersions at acid
pH. Thermal and rheological properties. J Food Sci 64:50–56
9. Lusas EW (2004) Soybean processing and utilization. In: Boerma
HR, Specht JE (eds) Soybeans: improvement, production, and
uses. ASA/CSSA/SSSA, Madison, pp 949–1045
10. Poysa V, Woodrow L, Yu K (2006) Effect of soy protein subunit
composition on tofu quality. Food Res Int 39:309–317
11. Zarkadas CG, Gagnon C, Poysa V, Khanizadeh S, Cober ER,
Chang V, Gleddie S (2007) Protein quality and identification of
the storage protein subunits of tofu and null soybean genotypes,
using amino acid analysis, one- and two-dimensional gel elec-
trophoresis, and tandem mass spectrometry. Food Res Int
40:111–128
12. Renkema JMS, Lakemond CMM, de Jongh HHJ, Gruppen H, van
Vliet T (2000) The effect of pH on heat denaturation and gel
forming properties of soy proteins. J Biotechnol 79:223–230
13. Maruyama N, Katsube T, Wada Y, Oh MH, Barba de la Rosa AP,
Okuda E, Nakagawa S, Utsumi S (1998) The roles of the N-
linked glycans and extension regions of soybean b-conglycinin in
folding, assembly and structural features. Eur J Bioch 258:854–
864
14. Renkema JMS, van Vliet T (2002) Heat-induced gel formation by
soy proteins at neutral pH. J Agric Food Chem 50:1569–1573
15. Kinsella JE (1976) Functional properties of proteins in foods: a
survey. CRC Crit Rev Food Sci Nutr 23:323–395
16. Riblett AL, Herald TJ, Schmidt KA, Tilley KA (2001) Charac-
terization of b-conglycinin and glycinin soy protein fractions
from four selected soybean genotypes. J Agric Food Chem
49:4983–4989
17. Khatib KA, Herald TJ, Aramouni FM, MacRitchie F, Schapaugh
WTJ (2002) Characterization and functional properties of soy
b-conglycinin and glycinin of selected genotypes. Food Sci
67:2923–2929
18. Kitamura K (1995) Genetic improvement of nutrition and food
processing quality in soybean. Jpn Agric Res Quart 29:1–8
19. Nakamura T, Utsumi S, Kitamura K, Harada K, Mori TJ (1984)
Cultivar differences in gelling characteristics of soybean glycinin.
Agric Food Chem 32:647–651
20. Nishinari K, Kohyarna K, Zhang Y, Kitamura K, Sugimoto T,
Saio K, Kawamura Y (1991) Rheological study on the effect of
the A5 subunit on gelation characteristics of soybean proteins.
Agric Biol Chem 55:351–355
21. Ross-Murphy SB (1984) Rheological methods. In: Chan HWS
(ed) Biophysical methods in food research. Alden Press, Oxford,
pp 138–199
Fig. 6 Correlation of the tan d of 11% SPI gels with the behaviour
index, n
590 J Am Oil Chem Soc (2008) 85:581–590
123
Copyright © 2022 FDOKUMEN