EFFECTS OF SOY PROTEIN ISOLATES ON QUALITY OF CHOCOLATES DURING STORAGE
13
EFFECTS OF SOY PROTEIN ISOLATES ON QUALITY OF CHOCOLATES DURING STORAGE J. SELAMAT, N. HUSSIN, A. MOHD ZAIN and Y.B. CHE MAN Faculty of Food Science and Biotechnology Universiti Putra Malaysia 43400 UPM Serdang, Selangor, Malaysia Accepted for Publication December 19, 1997 ABSTRACT The efect of soy protein isolate (SPI) on oxidation rate, changes in color and hardness, and microbiological aspect of chocolates during storage were studied. The Peroxide Value (PV) of the control and 5% showed SPI were highest in week 3 and decreased at the following week, while 10% SPI showed the lowest PV in week 10 as compared to the others. The Anisidine Value (A V) of all chocolates showed an increasing pattern during I0 weeks of storage. The Total Oxidation Value (TV) of all chocolates was found to be highest at week 3 and lowest at week 10 when 10% SPI was used. During storage, all chocolates slightly increased in hardnesjr and turned darker in color. The Total Plate Count (TPC) of the control and SPI chocolates was less than I, 000 coloniedg. INTRODUCTION Soy protein has many applications in candy and confectionery products but they are not widely used in foods such as dairy and meat product. Decloedt (1982) reported the utilization of soy protein isolates (SPI) in chocolate, confectionery and bakery. The incorportion of SPI for developing high protein chocolates by reducing the amount of full cream milk formulation was reported by Norma et al. (1996). Besides SPI, refined soy flour had also been used in Chocolate (Weber 1985) arid sugar confectioneries (Riedel 1990). Inclusion of soy protein can increase the protein content of chocolates. According to Hansen (1986), oxidative rancidity is not a problem in cocoa solid because it contains natural antioxidants. He further described that rancidity in chocolate could be decreased by addition of soy lecithin which was used to decrease chocolate viscosity. Cherry et al. (1 98 1) reported that lecithin could slow 'To whom correspondence should be addressed: Tel: +603-9486101 extension 3423, Fax: +603- 9423552, Email: [email protected] Journal of Food Processing and Preservation 22 (1998) 185-197. All Rights Reserved. OCopyright I998 by Food & Nutrition Press, Inc., Trumbull, Connecticut. 185
Transcript of EFFECTS OF SOY PROTEIN ISOLATES ON QUALITY OF CHOCOLATES DURING STORAGE
EFFECTS OF SOY PROTEIN ISOLATES ON QUALITY OF CHOCOLATES DURING STORAGE
J. SELAMAT, N. HUSSIN, A. MOHD ZAIN and Y.B. CHE MAN
Faculty of Food Science and Biotechnology Universiti Putra Malaysia
43400 UPM Serdang, Selangor, Malaysia
Accepted for Publication December 19, 1997
ABSTRACT
The efect of soy protein isolate (SPI) on oxidation rate, changes in color and hardness, and microbiological aspect of chocolates during storage were studied. The Peroxide Value (PV) of the control and 5% showed SPI were highest in week 3 and decreased at the following week, while 10% SPI showed the lowest PV in week 10 as compared to the others. The Anisidine Value (A V ) of all chocolates showed an increasing pattern during I0 weeks of storage. The Total Oxidation Value (TV) of all chocolates was found to be highest at week 3 and lowest at week 10 when 10% SPI was used. During storage, all chocolates slightly increased in hardnesjr and turned darker in color. The Total Plate Count (TPC) of the control and SPI chocolates was less than I , 000 coloniedg.
INTRODUCTION
Soy protein has many applications in candy and confectionery products but they are not widely used in foods such as dairy and meat product. Decloedt (1982) reported the utilization of soy protein isolates (SPI) in chocolate, confectionery and bakery. The incorportion of SPI for developing high protein chocolates by reducing the amount of full cream milk formulation was reported by Norma et al. (1996). Besides SPI, refined soy flour had also been used in Chocolate (Weber 1985) arid sugar confectioneries (Riedel 1990).
Inclusion of soy protein can increase the protein content of chocolates. According to Hansen (1986), oxidative rancidity is not a problem in cocoa solid because it contains natural antioxidants. He further described that rancidity in chocolate could be decreased by addition of soy lecithin which was used to decrease chocolate viscosity. Cherry et al. (1 98 1) reported that lecithin could slow
'To whom correspondence should be addressed: Tel: +603-9486101 extension 3423, Fax: +603- 9423552, Email: [email protected]
Journal of Food Processing and Preservation 22 (1998) 185-197. Al l Rights Reserved. OCopyright I998 by Food & Nutrition Press, Inc., Trumbull, Connecticut. 185
186 J. SELAMAT, N. HUSSIN, A. MOHN ZAIN, and Y.B. CHE MAN
the autoxidation and enzyme hydrolysis of fat. Riedel(l990) described that refmed soy flour has a natural antioxidant which can be added to sweets to prevent spoilage. High amount of SPI in chocolates could harden chocolates texture and decrease the snap ability (Norma et al. 1996). Oxidation of lipids can cause formation of volatile odoriferous and color compounds, changes in textural properties, decrease in nutritive value and oxidation of cholesterol (Erikson 1982).
This study was conducted to determine the effect of SPI on oxidation rate, changes in color and hardness, and microbiological aspect of chocolates during storage.
MATERIALS AND METHODS
Sample Procurement and Preparation
Natural cocoa liquor and cocoa butter were purchased from the KLK-Kepong Cocoa Product Sdn. Bhd., soy protein isolates (SPI) from Markaids Sdn, Bhd., soy lecithin from Damah Trading, whereas full cream milk (FCM), vanillin, sucrose and salt were from a local supplier.
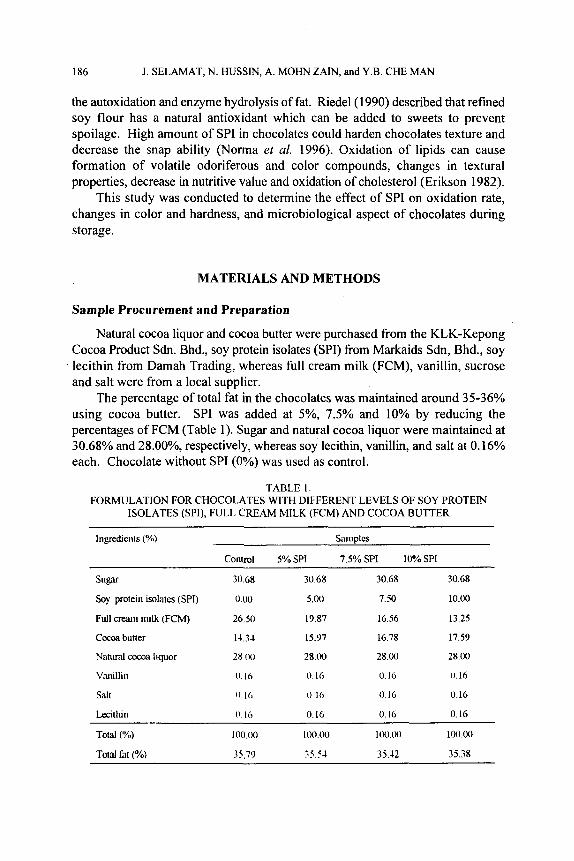
The percentage of total fat in the chocolates was maintained around 35-36% using cocoa butter. SPI was added at 5%, 7.5% and 10% by reducing the percentages of FCM (Table 1). Sugar and natural cocoa liquor were maintained at 30.68% and 28.00%, respectively, whereas soy lecithin, vanillin, and salt at 0.16% each. Chocolate without SPI (0%) was used as control.
TABLE 1. FORMULATION FOR CHOCOLATES WITH DIFFERENT LEVELS OF SOY PROTEIN
ISOLATES (SPI), FULL CREAM MILK (FCM) AND COCOA BUTTER
Ingredients (YO) Snlnplcs
Coiitrol 5%" SPI 7.5% SPI 10% SPI
Supr 30.68 30.68 30.68 30.68
Soy protein isolates (SPI) 0.00 5 . 0 7.50 10.00
FdI cm%n inik (FCM) 26.50 19.87 16.56 13.25
Coca1 butter 14.34 15.97 16.78 17.59
Natural cocoa liquor 28 00 28.00 28.00 28.00
Vaiilliii 0 16 0.16 0. I6 0.16
salt 0 16 0 16 0 . I6 0.16
Lecithin 0 16 0.16 0.16 0.16
100.00 IO().OU IOWI) 100.00
35.70 >? 54 35.42 35.38 _ I -
SOY PROTEIN ISOLATES 187
Cocoa liquor and one half of cocoa butter were melted in a microwave oven before mixing with the other ingredients in a bowl mixer. The chocolates were refined with roller refiner (Pascal) until the averages particle size were 25-30 micron. The refmed paste was conched by runner mill (Pascal) for 12 h at 65C and then tempered manually on a marble slab. The tempered chocolate liquor were poured into molds, shaken gently to remove air bubbles and then placed in a humidity chamber (Kato) which was set at 12C and 65% relative humidity for 15 min. After demolding, the chocolates were packed and sealed in plastic containers.
Storage Study of Chocolates
The chocolates were stored at 21C for 10 weeks. The Peroxide Value (PV), Anisidine Value (PV) and Totox Values (TV), texture, color and microbiology tests were conducted weekly.
Cocoa Butter Extraction
Fat was extracted from chocolate samples using petroleum ether (b.p. 30-60C) for 8 h in Soxhlet apparatus. The petroleum ether was then removed using rotary evaporator (Heidolph) at 60C. The fat was dried in an oven at 105C for 30 min before transferred into a bottle of further analysis.
Chemical Analysis
PV, AV and TV were determined according to the the method described by Cocks and Van Rede (1 966), Paquots (1 979) and Patterson (1 989), respectively.
Determination of Texture
The molded chocolate samples were cut into 2.0 x 2.5 x I .O cm3. The texture was measured using a V blade shear and load cell ranges of 5 to 50 kg on the Instrom Universal Testing Machine at 18C.
Determination of Color The tempered chocolate samples were molded in petri dish, stored at 2 1 C for
24 h before L, a and b values were measued using Color Difference Meter (Hunterlab, model 25D-2).
Microbiological Test
All !steps were carried out aseptically. A 90 mL of peptone water (1.5%) was poured into the stomacher bag containing 10 g chocolate samples. The mixture was mixed stomacher blender (Lab Blender 400) for 5 min. Chocolate dilution ranging lkom 10- 1 to 10-6 were prepared and 0.1 mL were spread onto PCA plates
188 J . SELAMAT, N. HUSSIN, A. MOHN ZAM, and Y.B. CHE MAN
using sterile glass hockey stick. The plates were incubated at 37C and the colonies were counted according to the method of Messer et al. (1984) at 24 and 48 h incubation.
Statistical Analysis
The results were statistically analyzed using SAS (1 994). The significance amongst the means was determined using the Least Significance Difference (LSD) at p<0.05.
RESULTS AND DISCUSSION
Quality of Chocolates During Storage
Changes in Peroxide Values (PV)
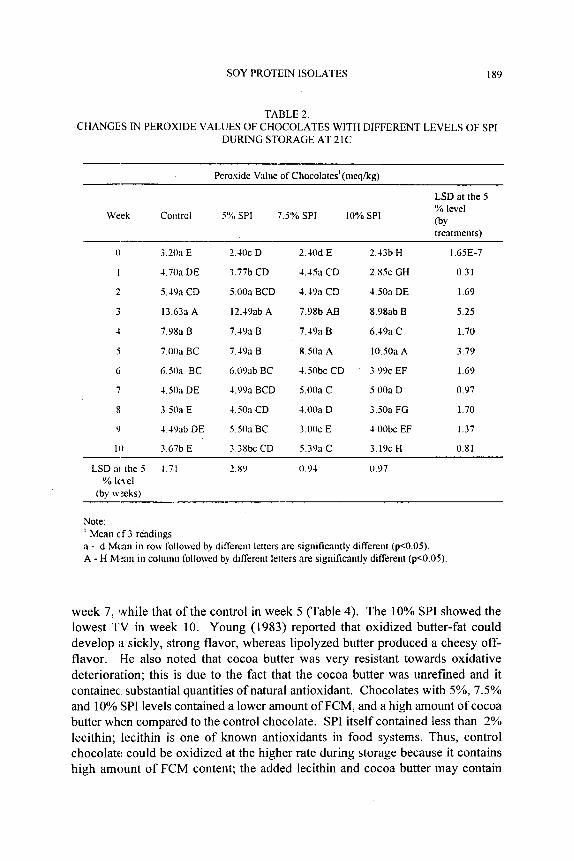
The changes in Peroxide Value (PV) of chocolate samples during 10 weeks of storage are given in Table 2. All chocolates showed significant increase (p<0.05) in PV starting from week 0 to 3. The PV values of the control (13.63 meq/kg) and those containing 5% SPI (12.49 meqkg) were high in week 3; thereafter the values significantly decreased (p<0.05). The decrease could be due to the lack of oxygen present in the chocolates. Since the chocolates were wrapped with aluminium foil, they were not exposed to excessive air or oxygen from the environment. The study also indicated that SPI have significant @<0.05) effect on the PVs (Table 2). Lecithin have been shown to slow down the auto-oxidation and enzyme hydrolysis of fat (Lees 1990). Therefore the addition of SPI in chocolate formulation might reduce the rancitdity of chocolate during storage.
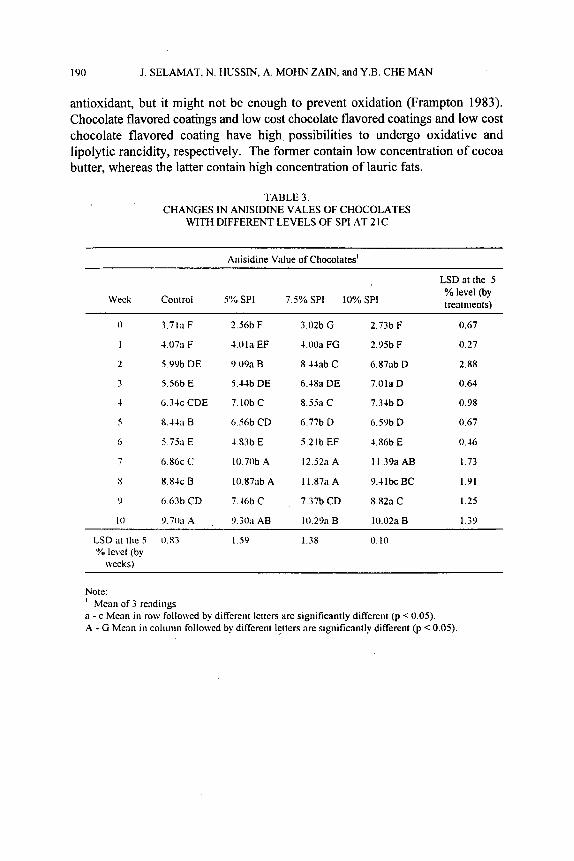
Changes in Anisidine Values (AV)
Generally, the Anisidine Value (AV) values of all chocolates increased significantly (P>0.05) upon storage (Table 3). However, the values were not significantly different (p>0.05) in the control and chocolate samples containing 5%, 7.5% and 10% SPIs at 10 weeks. Oxidation of triglycerides might occur due to the presence of oxygen with the assistance of light energy and catalysts; bacterial or plant enzymes can also induce the oxidation process (Patterson 1989).
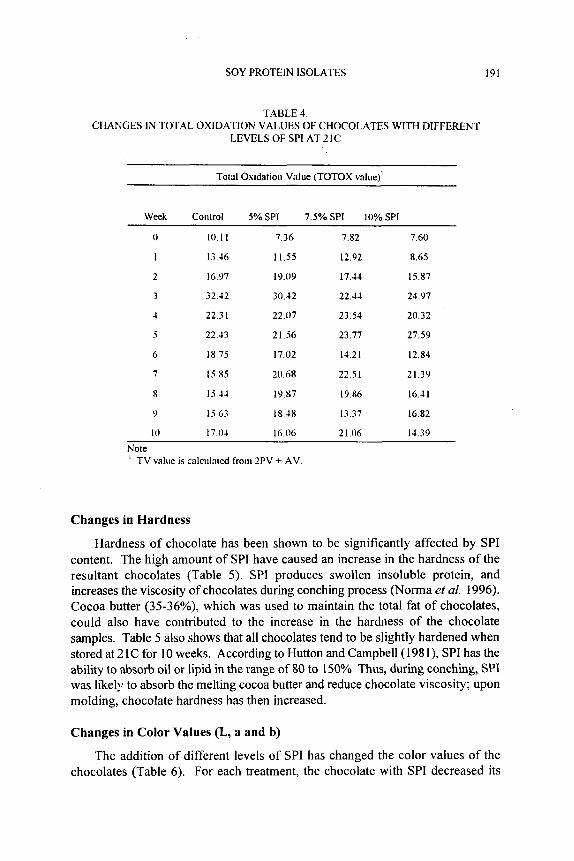
Changes in Total Oxidation Value (TV)
The Total oxidation Value (TV) of chocolates containing 7.5% SPI were found to be low in week 0, 1 ,3 and 6 , and of those containing 5% and 10% SPI, in week 4 and 10, respectively. The TV of chocolates containing SPI started to decrease in
SOY PROTEIN ISOLATES 189
TABLE 2. CHANGES IN PEROXIDE VALUES OF CHOCOLATES WITH DIFFERENT LEVELS OF SPI
DURING STORAGE AT 2 1C
Pero.<ide Value of Chocolates'(nieq/kg)
LSD at the 5 % level
treatments) (by
Week Control 5% SPI 7.5% SPI 10% SPI
0
I
2
3
4
5
6
7
8
9
10
5.20:i E
4.70a DE
5.4% CD
13.632 A
7.98a B
7.00a BC
6.50a BC
4.5Oa DE
3.50a E
4.49nb DE
3.67b E
2 4Oc D
3.7% CD
5.OOn BCD
12.49ab A
7.493 B
7.49a B
6.09;ib BC
4.99a BCD
4.50a CD
5.5Oa BC
3 .3Sbc CD
2.4Od E
4.45a CD
4.4% CD
7.98b AB
7.49a B
8.508 A
4.5Obc CD
5.0On C
1.00a D
3 . 0 0 ~ E
5.39a C
2 4 i b H
2 85c GH
4 50a DE
8 98ab B
6 19a C
i n 5oa A
3 9% EF
5 OOa D
3 50a FG
4 00bc EF
3 l 9cH
1.6SE-7
0.3 I
1.69
5.25
1.70
3.79
1.69
0.97
1.70
1.37
0.81
LSD :ii the 5 1.71 2.89 0 94 0.97 % level
(by uzeks)
Note: ' Mean of 3 readings a - d Mean in row followed by ditrerenr letters are significantly different (p<O.05). A - H Mean i n coluinn followed by dirercnt letters are significantly different (p<O.O5).
week 7, while that of the control in week 5 (Table 4). The 10% SPI showed the lowest TV in week 10. Young (1983) reported that oxidized butter-fat could develop a sickly, strong flavor, whereas lipolyzed butter produced a cheesy off- flavor. He also noted that cocoa butter was very resistant towards oxidative deterioration; this is due to the fact that the cocoa butter was unrefined and it contained1 substantial quantities of natural antioxidant. Chocolates with 5%, 7.5% and 10% SPI levels contained a lower amount of FCM, and a high amount of cocoa butter when compared to the control chocolate. SPI itself contained less than 2% lecithin; lecithin is one of known antioxidants in food systems. Thus, control chocolate: could be oxidized at the higher rate during storage because it contains high amount of FCM content; the added lecithin and cocoa butter may contain
190 J . SELAMAT, N. HUSSIN, A. MOHN ZAIN, and Y.B. CHE MAN
antioxidant, but it might not be enough to prevent oxidation (Frampton 1983). Chocolate flavored coatings and low cost chocolate flavored coatings and low cost chocolate flavored coating have high possibilities to undergo oxidative and lipolytic rancidity, respectively. The former contain low concentration of cocoa butter, whereas the latter contain high concentration of lauric fats.
TABLE 3. CHANGES IN ANISIDINE VALES OF CHOCOLATES
WITH DIFFERENT LEVELS OF SPI AT 21C
Anisidine Value of Chocolates'
Weck Control 5% SPI 7.5% SPI 10% SPI
LSD at the 5 % level (by treatnients)
0 3.71n F 2.56b F 3.02b G 2.73b F 0.67
I 4.07a F 4.Ola EF 4.OOa FG 2.95b F 0.27
2 5.99b DE 9.09a B 8.44ab C 6.87ab D 2.88
3 536b E 5 . U b DE 6.18a DE 7.01a D 0.64
4 6 . 3 4 ~ CDE 7.10b C 8 3 a C 7.34b D 0.98
5 8.44a B 6.56b CD 6.77b D 6.59b D 0.67
6 5 753 E 4.83b E J.21b EF 1.86b E 0.46
7 6 . 8 6 ~ C 10.70b A 12.52a A 11.3% AE3 1.73
8 8.8-k B l0.87ab A 11.87a A 9.JlbcBC 1.91
9 6.63b CD 7.46b C 7.37b CD 8.82a C 1.25
I 0 9.70;i A 9.30;1 AB IO.29a B 10.02a B 1.39
LSD ;it the 5 0.43 I 5 9 l..?S 0.10 'YO levcl (by
weeks)
Note: ' Mean of 3 readings a - c Mean i n row followed by direrent letters are significantly different (p < 0.05). A - G Mean i n coliinin followed by different letters are significantly different (p < 0.05)
SOY PROTEIN ISOLATES 191
TABLE 4. CHANGES IN TOTAL OXIDATION VALUES OF CHOCOLATES WITH DIFFERENT
LEVELS OF SPI AT 21C
Total Oxidation Value (TOTOX value)'
Week Control 5%SPI 7.5%SPI 10%SPI
0 10. I 1 7.36 7.82 7.60
1 13.46 11.55 12.92 8.65
2 16.97 19.09 17.44 15.87
3 32.42 30.42 22.44 24.97
4 22.3 I 22.07 23.54 20.32
5 22.43 21.56 23.77 27.59
6 18.75 17.02 14.21 12.84
7 15.85 20.68 22.51 21.39
8 15.44 19.87 19.86 16.41
9 15.63 18.48 13.37 16.82
I 0 17.04 16.06 2 1.06 14.39 Note ' TV value is calciilnled from 2PV + AV.
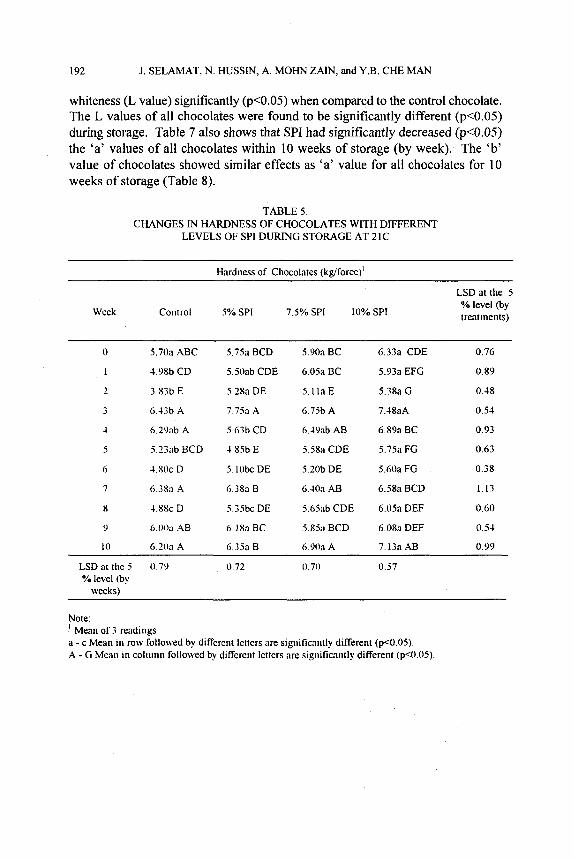
Changes in Hardness
Hardness of chocolate has been shown to be significantly affected by SPI content. The high amount of SPI have caused an increase in the hardness of the resultant chocolates (Table 5). SPI produces swollen insoluble protein, and increases the viscosity of chocolates during conching process (Norma et al. 1996). Cocoa butter (35-36%), which was used to maintain the total fat of chocolates, could also have contributed to the increase in the hardness of the chocolate samples. Table 5 also shows that all chocolates tend to be slightly hardened when stored at 2 1C for 10 weeks. According to Hutton and Campbell (1 98 l), SPI has the ability to absorb oil or lipid in the range of 80 to 150% Thus, during conching, SPI was likely to absorb the melting cocoa butter and reduce chocolate viscosity; upon molding, chocolate hardness has then increased.
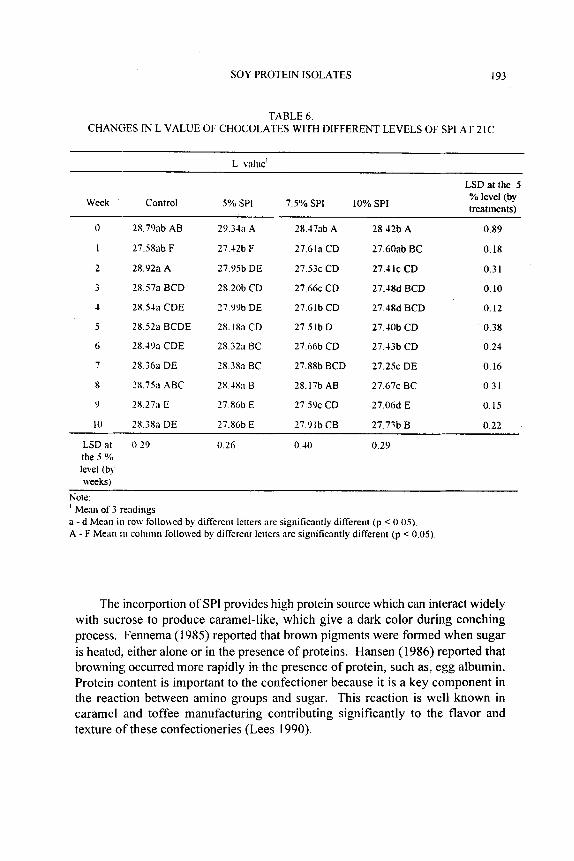
Changes in Color Values (L, a and b)
The addition of different levels of SPI has changed the color values of the chocolates (Table 6). For each treatment, the chocolate with SPI decreased its
192 J . SELAMAT. N. HUSSIN, A. MOHN ZAIN, and Y.B. CHE MAN
whiteness (L value) significantly (p<0.05) when compared to the control chocolate. The L values of all chocolates were found to be significantly different (p<0.05) during storage. Table 7 also shows that SPI had significantly decreased (p<0.05) the ‘a’ values of all chocolates within 10 weeks of storage (by week). The ‘b’ value of chocolates showed similar effects as ‘a’ value for all chocolates for 10 weeks of storage (Table 8).
TABLE 5. CHANGES IN HARDNESS OF CHOCOLATES WITH DIFFERENT
LEVELS OF SPI DURING STORAGE AT 21C
~
Hardness of Chocolates (kdforce)’
Week Control 5% SPI 7.5% SPI 10% SPI
LSD at the 5 % level (by treatments)
0
I
2
3
4
5
6
7
8
9
1 0
5.70a ABC
1.98b CD
3.83b E
6.43b A
6.29nb A
5.23:ib BCD
4 . 8 0 ~ D
6.3S;i A
4 . 8 8 ~ D
6.OO;i AB
6.2O;i A
5.7521 BCD
5.5Oab CDE
5.28a DE
7.75a A
5.65b CD
4 S5b E
5 . lObc DE
6.3Sn B
5.35bc DE
6.1% BC
6..75a B
5.90a BC
6.05a BC
5 . l l a E
6.75b A
6.49ab AB
5.58a CDE
5.20b DE
6.4Oa AB
5 65:ib CDE
5.85:i BCD
6.90a A
6.33a CDE
5.93a EFG
5.38a G
7.18aA
6.8% BC
5.75a FG
5.60a FG
6.58n BCD
6.053 DEF 6.08a DEF
7.15s AB
0.76
0 89
0.48
0.54
0.93
0.63
0.38
1.13
0.60
0.54
0.99
LSD at the 5 0.79 0.72 0.70 0.57 % level (by
weeks)
Note: ‘ Mean of 3 readings a - c Mean in row followed by different letters are sigiiificaiitly different (p<O.05). A - G Mean in coluinn followed by different letters are significantly different (p<O.O5).
SOY PROTEIN ISOLATES 193
TABLE 6. CHANGES IN L VALUE OF CHOCOLATES WITH DIFFERENT LEVELS OF SPI AT 2 IC
L value'
LSD at the 5 % level (by treatments) Week Control 5% SPI 7 5% SPI 10% SPI
0 28.79ab AB 29.31a A 28.47ab A 28.42b A 0.89
I 27.5nZ1b F 27.42b F 27.61a CD 27.60ab BC 0. i n
2 28.92a A 27.95b DE 2 7 . 5 3 ~ CD 2 7 . 1 1 ~ CD 0.31
3 2 n . m BCD 28.20b CD 27.66~ CD 27.18d BCD 0.10
1 28.54, CDE 27 OBb DE 27.61b CD 27.48d BCD 0.12
5 28.52, BCDE 28.18a CD 27.5lb D 27.40b CD 0.38
6 28.493 CDE 2n.32a BC 27.66b CD 27.43b CD 0.24
7 28.36, DE 28.382 BC 27.nsb BCD 2 7 . 2 5 ~ DE 0.16
8 2X.75:1 ABC 2X.4X;i B 28.17b AB 2 7 . 6 7 ~ BC 0.3 I
'1 28.273 E 27.%6b E 27 .59~ CD 27.06d E 0.15
10 28 .?8a DE 27.Y6b E 27.9lbCB 27.73b B 0.22
LSDat 0 2 9 0.26 0.40 0.29 the 5 % level (b? weeks)
Note: ' Mean of 3 readings a - d Mean i n row followed by different lctters are significniitly different (p < 0.05). A - F Meaii 111 coliti~iii followed by dilferent IeIters are significantly different (p < 0.05)
The incorportion of SPI provides high protein source which can interact widely with sucrose to produce caramel-like, which give a dark color during conching process. Fennema (1985) reported that brown pigments were formed when sugar is heated, either alone or in the presence of proteins. Hansen (1986) reported that browning; occurred more rapidly in the presence of protein, such as, egg albumin. Protein content is important to the confectioner because it is a key component in the reaction between amino groups and sugar. This reaction is well known in caramel and toffee manufacturing contributing significantly to the flavor and texture of these confectioneries (Lees 1990).
194 J. SELAMAT, N. HUSSIN, A. MOHN ZAIN, and Y.B. CHE MAN
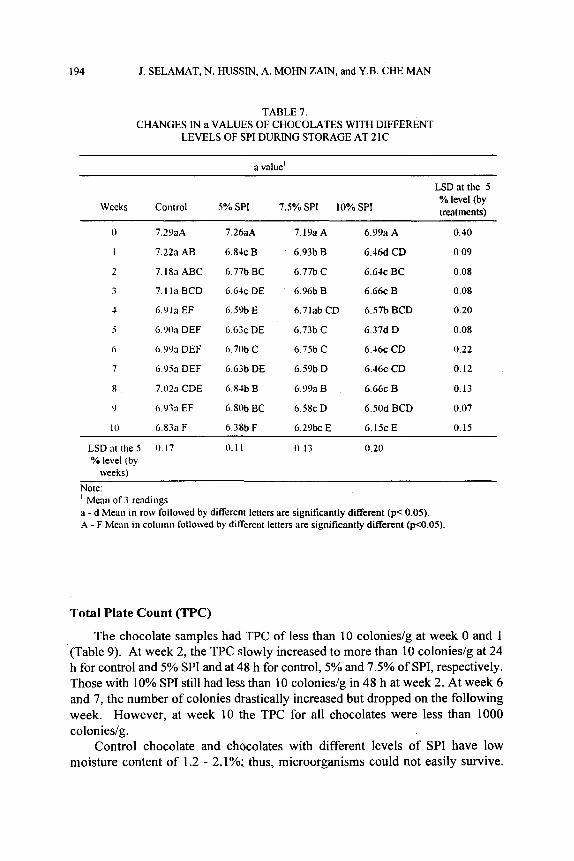
TABLE I. CHANGES IN a VALUES OF CHOCOLATES WITH DIFFERENT
LEVELS OF SPI DURING STORAGE AT 21C
a value'
LSD at the 5 YO level (by
Weeks Control 5% SPI 7.5% SPI 10% SPI treatments)
0 7.29aA 7.26aA 7.1% A 6.9% A 0.40
I 7.22a AB
2 7.18n ABC
3 7.11a BCD
4 6.9la EF
5 6 9On DEF
6 6.99n DEF
7 6.952 DEF
8 7 . 0 2 ~ CDE
9 6.Na EF
I 0 6.83a F
6 . 8 4 ~ B
6.77b BC
6 . 6 4 ~ DE
6.59b E
6 . 6 3 ~ DE
6.70b C
6.63b DE
6.841, B
6.80b BC
6.38b F
6.93b B
6.77b C
6.96b E
6.71ab CD
6.73b C
6.75b C
6.59b D
6.9% B
6 . 5 8 ~ D
6.29bc E
6.46d CD
6 . 6 4 ~ BC
6 . 6 6 ~ B
6.5% BCD
6.37d D
6 . 4 6 ~ CD
6 . 4 6 ~ CD
6 . 6 6 ~ B
6.50d BCD
6.1% E
0.09
0.08
0.08
0.20
0.08
0.22
0.12
0.13
0.07
0.15
LSD at the 5 0. 17 0. I 1 0.13 0.20 % level (by
weeks) Note: ' Menn of 3 readings a - d Meail i n row followed by different letters are significantly different (p< 0.05). A - F Menn i n coluinn followed by different letters are significantly different (FO.05).
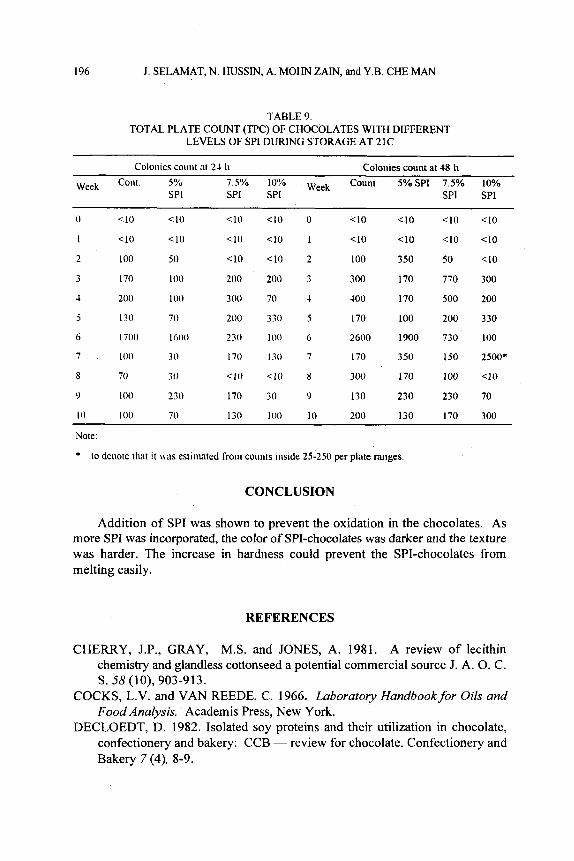
Total Plate Count (TPC)
The chocolate samples had TPC of less than 10 colonies/g at week 0 and 1 (Table 9). At week 2, the TPC slowly increased to more than 10 colonieslg at 24 h for control and 5% SPI and at 48 h for control, 5% and 7.5% of SPI, respectively. Those with 10% SPI still had less than 10 colonieslg in 48 h at week 2. At week 6 and 7, the number of colonies drastically increased but dropped on the following week. However, at week 10 the TPC for all chocolates were less than 1000 colonieslg.
Control chocolate and chocolates with different levels of SPI have low moisture content of 1.2 - 2.1%; thus, microorganisms could not easily survive.
SOY PROTEIN ISOLATES 195
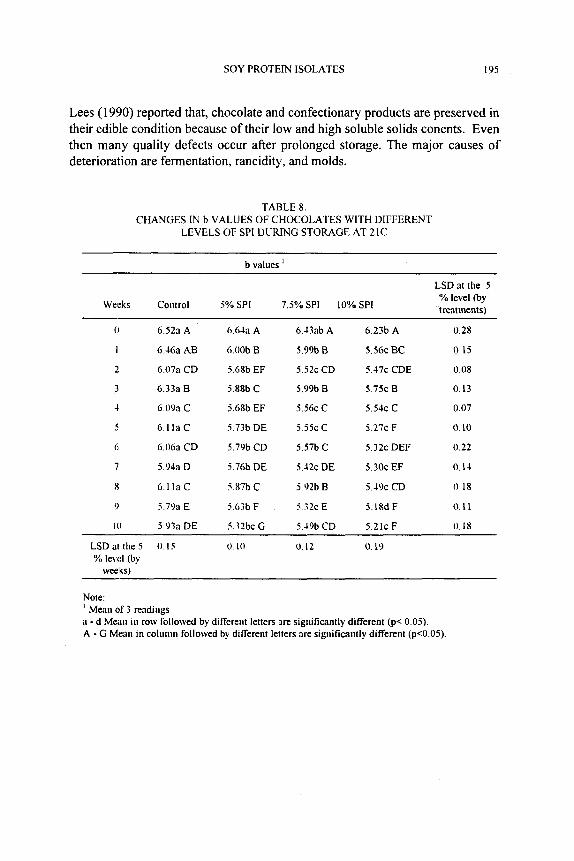
Lees (1 990) reported that, chocolate and confectionary products are preserved in their edible condition because of their low and high soluble solids conents. Even then many quality defects occur after prolonged storage. The major causes of deterioration are fermentation, rancidity, and molds.
TABLE 8. CHANGES IN b VALUES OF CHOCOLATES WITH DIFFERENT
LEVELS OF SPI DURING STORAGE AT 21C
b values ' LSD at the 5 % level (by treatments) Weeks Control 5% SPI 7.5% SPI 10% SPI
(I
1
?
3
4
5
6
7
8
9
10
6.523 A
6.46a AB
6.07~1 CD
6.33~1 B
6.09a C
6.11aC
6.06a CD
5.91a D
6 . 1 l a C
i 7 9 a E
5 . O h DE
6 . 6 h A
6.00b B
5.68b EF
5.88b C
5.68b EF
5.73b DE
5.7')b CD
5.76b DE
i 8 7 b C
5.63b F
5..;2bc G
6.43ab A
5.99b B
5 . 5 2 ~ CD
5.99b B
5 . 5 6 ~ C
5 55cC
537b C
5 . 4 2 ~ DE
5 92b B
5 32cE
5 49b CD
6.23b A
5 . 5 6 ~ BC
5 . 1 7 ~ CDE
5.75c B
5.54c C
5 . 2 7 ~ F
5 . 3 2 ~ DEF
5.30~ EF
5.49c CD
5.18d F
5 . 2 1 ~ F
0.28
0.15
0.08
0.13
0.07
0.10
0.22
0.14
0. I8
0. I 1
0.18
LSD at the 5 0. IS !I. I0 0.12 0. 19 '%, levd (by
weeks)
Note: ' Mean of 3 readings a - d Mean i n row followed by different letters are significantly different (p< 0.05). A - G Mean in coluinn followed by direrent letters are significantly different (p<O.OS).
196 J. SELAMAT, N. HUSSIN, A. MOHN ZAIN, and Y.B. CHE MAN
TABLE 9. TOTAL PLATE COUNT (TPC) OF CHOCOLATES WITH DIFFERENT
LEVELS OF SPI DURING STORAGE AT 21C
Colonies coiiiit :it 24 11 Colonies count at 48 h Week COllt. 5% 7.5% 10% Week Count 5%SPI 7.5% 10%
SPI SPI SPI SPI SPI
0 <I0 < I 0 < I 0 < I 0 0 <I0 <I0 <I0 <I0
I <I0 <I0 <I0 <I0 I <I0 <I0 <I0 <I0
2 100 50 <I0 <I0 2 100 350 50 <I0
3 I70 I00 200 200 3 3 00 170 770 300
4 200 I 0 0 300 70 4 400 170 500 200
5 1.30 70 200 330 5 I70 100 200 330
6 I700 I600 230 100 6 2600 1900 730 100
7 100 3 0 170 1 3 0 7 I70 350 150 2500*
8 70 .30 <I0 < I 0 8 300 170 100 4 0
9 I00 230 170 3 0 9 130 230 230 70
I 0 I00 70 170 I 0 0 10 200 130 170 300
Note * 10 denote that i t wis estiiiinted froni coiints inside 25-250 per plate nnges
CONCLUSION
Addition of SPI was shown to prevent the oxidation in the chocolates. As more SPI was incorporated, the color of SPI-chocolates was darker and the texture was harder. The increase in hardness could prevent the SPI-chocolates from melting easily.
REFERENCES
CHERRY, J.P., GRAY, M.S. and JONES, A. 1981. A review of lecithin chemistry and glandless cottonseed a potential commercial source J. A. 0. C.
COCKS, L.V. and VAN REEDE, C. 1966. Laboratoly Handbook for Oils and Food Analysis. Academis Press, New York.
DECLOEDT, D. 1982. Isolated soy proteins and their utilization in chocolate, confectionery and bakery: CCB - review for chocolate. Confectionery and Bakery 7(4), 8-9.
S. 58 (lo), 903-913.
SOY PROTEIN ISOLATES 197
ERIKSON, C.F. 1982. Lipid oxidation catalysts and inhibitors in raw materials
FENNEMA, O.W. 1985. Food Chemistry, 2nd Ed. Marcel Dekker, New York. FRAMPTON, A. 1983. Prevention of rancidity in food. In Rancidity in Food, (J.C.
Allen and R.J. Hamilton, eds.) Applied Sciences Pub., London. HANSE:N, T.J. 1986. Candy and sugar confectionery. In Handbook of Food and
Beverage Stability, Chemical, Microbiological and Nutritional Aspects, (C. George, ed.) pp. 423-465, Academic Press, Orlando.
HUTTON, C.W. and CAMPBELL, A.M. 1981. Water and fat absorption. In Pratein Functionality in Foods, (J.P.Cherry, ed.) American Chemical Society, Washington. D.C.
LEES, R. 1990. Milk products and chocolate crumb. Confectionery Production
MESSER. J.W., PEELER, J.T. and GILCHRIST, B.E. 1984. Aerobic plate count. In Bacteriological Anaktical Manual of the Division of Microbiological Center for Food Safety and Applied Nutrition, 6th Ed. U.S. Food and Drug Administration.
NORMA, H., ASIAH, M.Z. and JINAP, S. 1996. Effect of soy protein isolates on quality of chocolates. ASEAN J. Sci. Tech. Dev. 13 (l) , 51-64.
PAQUOTS, C. 1979. Standard methods for the analysis of oils. In Fats and Derivatives, 6th Ed. IUPAC, Pergamon Press, Oxford.
PATTERSON, H.B.W. 1989. Handling and Storage of Oilseeds, Oils, Fats and Meal. Elsevier Applied Science, London.
RIEDEI,, H.R. 1990. Applications of nurupan in chocolates and sugar confections. Confectionery Productions 56 (lo), 722-723.
SAS. 1987. Statistical Analysis System, Release 6.04. SAS Institute, USA. WEBEK, H. 1985. Nurupan in chocolate. Kakao und Zucker 37 (12), 10. YOUNG, C.C. 1983. Rancidity in confectionery products. In Rancidity in Foods.
(J.C. Allen and R.J. Hamilton, eds.) pp. 179-191, Applied Sci. Pub., London.
and processed foods. Food Cheni. 9,3- 19.
56 r( 1 l), 804-8 15.