Blood Pressure Regulation Evolved from Basic Homeostatic ...
Upload
independentCategory
view
1download
0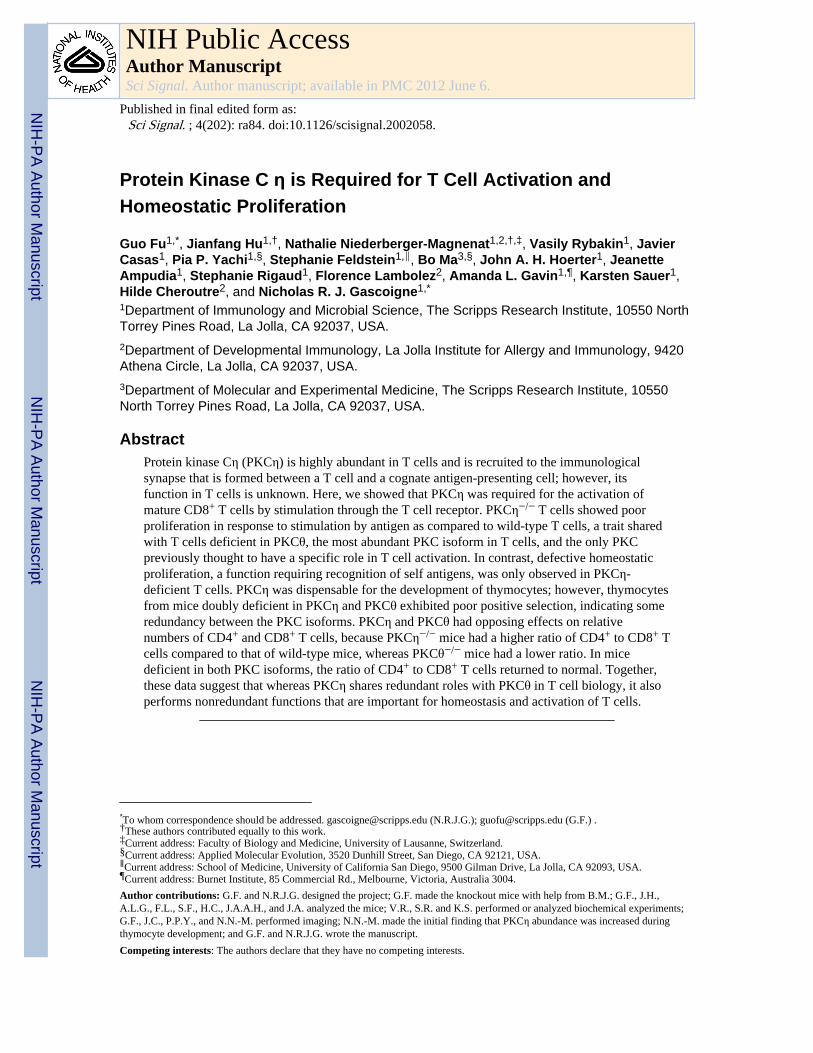
Protein Kinase C η is Required for T Cell Activation andHomeostatic Proliferation
Guo Fu1,*, Jianfang Hu1,†, Nathalie Niederberger-Magnenat1,2,†,‡, Vasily Rybakin1, JavierCasas1, Pia P. Yachi1,§, Stephanie Feldstein1,∥, Bo Ma3,§, John A. H. Hoerter1, JeanetteAmpudia1, Stephanie Rigaud1, Florence Lambolez2, Amanda L. Gavin1,¶, Karsten Sauer1,Hilde Cheroutre2, and Nicholas R. J. Gascoigne1,*
1Department of Immunology and Microbial Science, The Scripps Research Institute, 10550 NorthTorrey Pines Road, La Jolla, CA 92037, USA.2Department of Developmental Immunology, La Jolla Institute for Allergy and Immunology, 9420Athena Circle, La Jolla, CA 92037, USA.3Department of Molecular and Experimental Medicine, The Scripps Research Institute, 10550North Torrey Pines Road, La Jolla, CA 92037, USA.
AbstractProtein kinase Cη (PKCη) is highly abundant in T cells and is recruited to the immunologicalsynapse that is formed between a T cell and a cognate antigen-presenting cell; however, itsfunction in T cells is unknown. Here, we showed that PKCη was required for the activation ofmature CD8+ T cells by stimulation through the T cell receptor. PKCη−/− T cells showed poorproliferation in response to stimulation by antigen as compared to wild-type T cells, a trait sharedwith T cells deficient in PKCθ, the most abundant PKC isoform in T cells, and the only PKCpreviously thought to have a specific role in T cell activation. In contrast, defective homeostaticproliferation, a function requiring recognition of self antigens, was only observed in PKCη-deficient T cells. PKCη was dispensable for the development of thymocytes; however, thymocytesfrom mice doubly deficient in PKCη and PKCθ exhibited poor positive selection, indicating someredundancy between the PKC isoforms. PKCη and PKCθ had opposing effects on relativenumbers of CD4+ and CD8+ T cells, because PKCη−/− mice had a higher ratio of CD4+ to CD8+ Tcells compared to that of wild-type mice, whereas PKCθ−/− mice had a lower ratio. In micedeficient in both PKC isoforms, the ratio of CD4+ to CD8+ T cells returned to normal. Together,these data suggest that whereas PKCη shares redundant roles with PKCθ in T cell biology, it alsoperforms nonredundant functions that are important for homeostasis and activation of T cells.
*To whom correspondence should be addressed. [email protected] (N.R.J.G.); [email protected] (G.F.) .†These authors contributed equally to this work.‡Current address: Faculty of Biology and Medicine, University of Lausanne, Switzerland.§Current address: Applied Molecular Evolution, 3520 Dunhill Street, San Diego, CA 92121, USA.∥Current address: School of Medicine, University of California San Diego, 9500 Gilman Drive, La Jolla, CA 92093, USA.¶Current address: Burnet Institute, 85 Commercial Rd., Melbourne, Victoria, Australia 3004.Author contributions: G.F. and N.R.J.G. designed the project; G.F. made the knockout mice with help from B.M.; G.F., J.H.,A.L.G., F.L., S.F., H.C., J.A.A.H., and J.A. analyzed the mice; V.R., S.R. and K.S. performed or analyzed biochemical experiments;G.F., J.C., P.P.Y., and N.N.-M. performed imaging; N.N.-M. made the initial finding that PKCη abundance was increased duringthymocyte development; and G.F. and N.R.J.G. wrote the manuscript.Competing interests: The authors declare that they have no competing interests.
NIH Public AccessAuthor ManuscriptSci Signal. Author manuscript; available in PMC 2012 June 6.
Published in final edited form as:Sci Signal. ; 4(202): ra84. doi:10.1126/scisignal.2002058.
NIH
-PA Author Manuscript
NIH
-PA Author Manuscript
NIH
-PA Author Manuscript
INTRODUCTIONThe protein kinase C (PKC) family of serine and threonine kinases includes 10 isoforms inhuman and mouse, which play important roles in signal transduction in different cellularsystems, including regulating differentiation, cell motility, secretion, growth and death (1).Of the PKC isoforms found in T cells (α, δ, ε, η, and θ), only PKCθ is thought to have animportant and specific role in T cell biology, where it is involved in costimulation of signaltransduction in response to antigen recognition, leading to activation of transcription factorsincluding NF-κB and to changes in gene transcription resulting in responses such asincreased IL-2 secretion (2-5). However, PKCη gene expression is increased during positiveselection (6, 7), and gene expression profiling has shown that PKCη messenger RNA(mRNA) abundance, like that of PKCθ, is higher in T cells than in other mouse or humancell types and organs (http://biogps.org/#goto=genereport&id=18755; gnf1m00727 andU133A 206099_at) which suggests that PKCη may play a role in T cell biology. Although aPKCη-deficient mouse exists, no immunological studies of these mice have been reported(8).
PKCθ is recruited to the immunological synapse, the area of contact that is formed betweenmature T cells and antigen-presenting cells (APCs), where it concentrates in the centralregion (9-11). In addition, PKCθ associates with the coreceptor CD28 in microclusters thatcontain the T cell antigen receptor (TCR), which move centripetally into the immunologicalsynapse and are thought to be important in the costimulation of T cells (12). A fusion proteinof PKCη and green fluorescent protein (GFP) is also recruited to the immunological synapseupon TCR stimulation, where it is localized diffusely over the whole region (13). Studieswith PKCθ−/− mice revealed the involvement of PKCθ in multiple signaling pathwaysdownstream of TCR stimulation (14-20). Given the importance of PKCθ in mature T cells, itwas surprising that initial studies showed no defect in T cell development in PKCθ−/− mice(14, 16); however, another study found that PKCθ is indeed involved in thymocytedevelopment, with PKCθ−/− mice showing a mild defect in positive selection (21).Redundancy between different PKC isoforms may obscure the importance of any individualPKC in T cell development and function in vivo.
Here, we confirmed that the abundance of PKCη mRNA is increased during the positiveselection of thymocytes, and we found that PKCη, similar to PKCθ, was recruited to theimmunological synapse. To further investigate the specific role of PKCη and the potentialredundancy between PKCη and PKCθ in T cell development and mature T cell function, wegenerated mice deficient in Prkch, the gene encoding PKCη (PKCη−/− mice), and micedoubly deficient in Prkch and Prckq, which encodes PKCθ, to generate PKCη−/−PKCθ−/−
double knockout (DKO) mice. We found that although PKCη shared redundant functionswith PKCθ during T cell development, PKCη was required for normal functions of mature Tcells, because PKCη−/− T cells were less well able to proliferate in response to antigen or toundergo homeostatic proliferation than were wild-type mice, which was likely a result ofimpaired intracellular calcium (Ca2+) signaling and nuclear translocation of the transcriptionfactor nuclear factor κB (NF-κB), defects similar to those found in PKCθ−/− mice. Incontrast to PKCη−/− and PKCθ−/− mice, DKO mice had a more severe defect in T celldevelopment and more profound functional defects in mature T cells, as was revealed inmultiple assays. Together, our data suggest that in addition to sharing redundant roles withPKCθ, PKCη has its own specific functions in T cell biology.
Fu et al. Page 2
Sci Signal. Author manuscript; available in PMC 2012 June 6.
NIH
-PA Author Manuscript
NIH
-PA Author Manuscript
NIH
-PA Author Manuscript
RESULTSThe abundance of PKCη mRNA is increased during positive selection of thymocytes
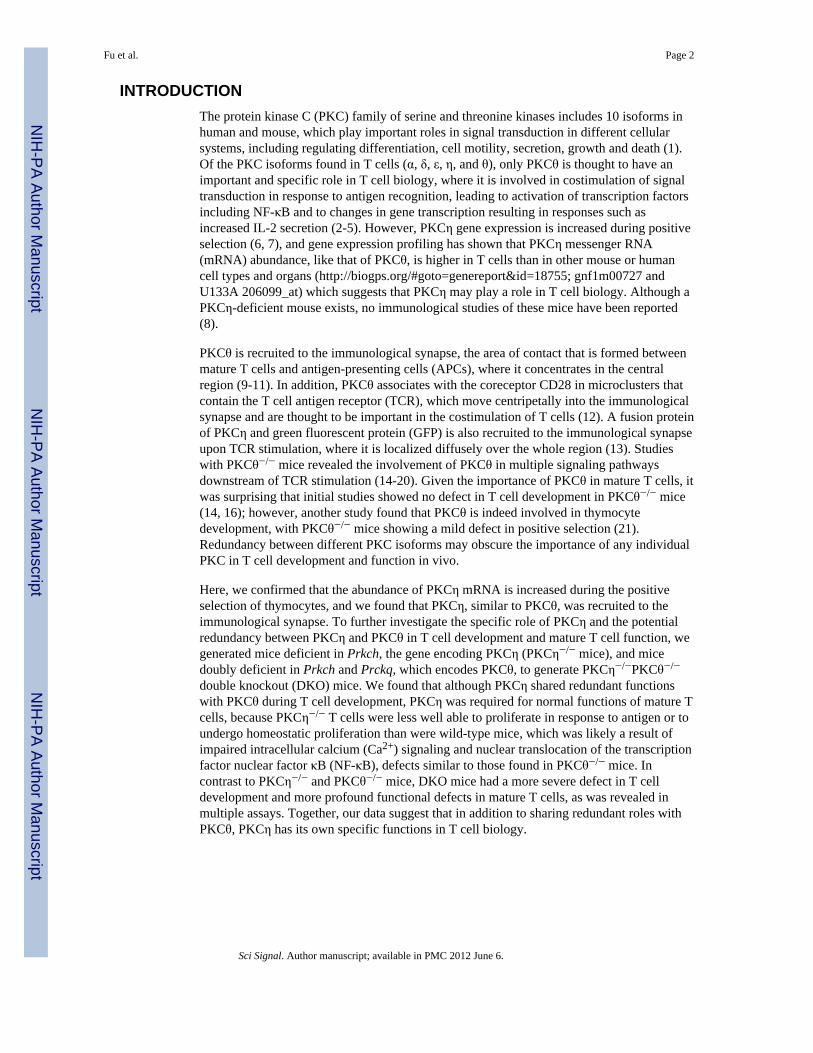
In a previous study, we showed that the abundance of PKCη mRNA is increased in pre-selection thymocytes when stimulated with an antibody against the Vβ chain of TCR (7).Independently, Hogquist and colleagues also found that PKCη mRNA abundance isincreased during positive selection (6). Given the requirement for PKCθ for antigenicstimulation in mature T cells (9, 10, 14, 16), it was surprising that PKCη rather than PKCθmRNA abundance was increased during positive selection (7). To investigate whether PKCηwas involved in thymocyte positive selection in vivo, and to test whether PKCη mightcompensate for the loss of PKCθ, we measured PKCη mRNA amounts by real-time reversetranscription polymerase chain reaction (RT-PCR) assay. We found that PKCη mRNA wasincreased in abundance in late-stage CD4+ and CD8+ double-positive (DP) cells and inCD4+ single-positive (SP) and CD8+ SP cells, that is, in cells that had undergone positiveselection (Fig. 1A, left). DP cells with a high abundance of TCR as assessed by flowcytometry (TCRhi DP cells) showed about a four-fold increase in PKCη mRNA abundancecompared to that in TCRlo DPs, and this abundance stayed high in the SP cells. BecausePKCθ is found in earlier developmental stages in thymocytes than PKCη, if there wasredundancy between the PKCθ and PKCη isoforms, we would expect that PKCη would beproduced earlier in cells in the absence of PKCθ. Indeed, we found that expression of thegene encoding PKCη was induced earlier and to a greater extent than normal in cells beforepositive selection (TCRlo DP cells) (Fig. 1A, right). These results suggested that PKCηmight play a role in thymocyte development.
PKCη is recruited to the immunological synapseBecause the gene encoding PKCη was induced during normal positive selection and becauseit was expressed earlier and to a greater extent in PKCθ−/− thymocytes than in wild-typethymocytes, we tested whether PKCη, like PKCθ, was recruited to the immunologicalsynapse in thymocytes. The recruitment of PKCθ to the synapse is important in signaltransduction and is a hallmark of recognition of antigenic peptide presented by majorhistocompatibility complex (MHC). To avoid the possibility of cross-reaction betweenantibodies against PKCη and PKCθ, we first isolated thymocytes and mature T cells fromPKCθ−/− mice and activated them with APCs that presented the superantigensstaphylococcal enterotoxin A (SEA) and SEB, which react with more than 40% of the Vβrepertoire of TCRs in B6 mice (22). Superantigens like SEA and SEB bind to MHC class IImolecules and are then able to activate T cells by binding to the TCR through recognition ofVβ sequences. PKCη was recruited to the immunological synapse in thymocytes and inmature T cells upon stimulation with SEA and SEB (Fig. 1B). In PKCθ-sufficientthymocytes, PKCθ, but not PKCη, was present at the immunological synapse of DP cellsbefore selection (PKCη is not yet present in these cells) (fig. S1). In SP cells, both PKCθand PKCη were found at the immunological synapse. In PKCθ−/− thymocytes, PKCηmRNA was detected in less mature DP cells than in wild-type thymus (Fig. 1A), andconsequently PKCη was present in the immunological synapses of DP cells (fig. S2).
To visualize the recruitment of PKCη to the immunological synapse in live cells, wetransfected OT-I hybridoma cells (23), that have a TCR that recognizes a peptide fromovalbumin (OVA) presented on the MHC class I-molecule H2-Kb, with plasmids encodingmouse PKCη fused to red fluorescent protein (PKCη-RFP) or PKCθ-RFP. We stimulatedthese cells with EL4 cells that had been incubated (“pulsed”) with different peptides. Whenthe stimulatory OVA peptide was presented to the OT-I cells, both PKCη and PKCθ wererecruited to the immunological synapse; however, when the nonstimulatory vesicularstomatitis virus (VSV) peptide was presented, no such recruitment took place, which
Fu et al. Page 3
Sci Signal. Author manuscript; available in PMC 2012 June 6.
NIH
-PA Author Manuscript
NIH
-PA Author Manuscript
NIH
-PA Author Manuscript
demonstrated that the recruitment of PKCη to the immunological synapse was antigen-specific (Fig. 1C). Genes for GFP tagged human PKCη, θ and α proteins were transfectedinto human Jurkat T cells (fig. S3A). PKCη and θ, but not PKCα, were recruited to theimmunological synapse during recognition of a superantigen ligand. Similarly, stimulationof an MHC class II-restricted T cell hybridoma with antigenic peptide-pulsed APC, resultedin concentration of transgenic fluorescent-tagged PKCη and θ, but not PKCδ at the synapse(fig. S3B). To compare the recruitment of PKCη and PKCθ directly, we cotransfected OT-Icells with plasmids encoding PKCη-RFP and PKCθ-GFP and imaged the fluorescentproteins during antigen recognition (fig. S4). Both PKCη and PKCθ were recruited to theimmunological synapse; however, whereas PKCη remained in a diffuse pattern over thewhole area of the synapse (Fig. 1, B and C), which was consistent with an earlier study (13),PKCθ was more centrally concentrated at the immunological synapse (Fig. 1, B and C), aswas expected from previous work (9, 10).
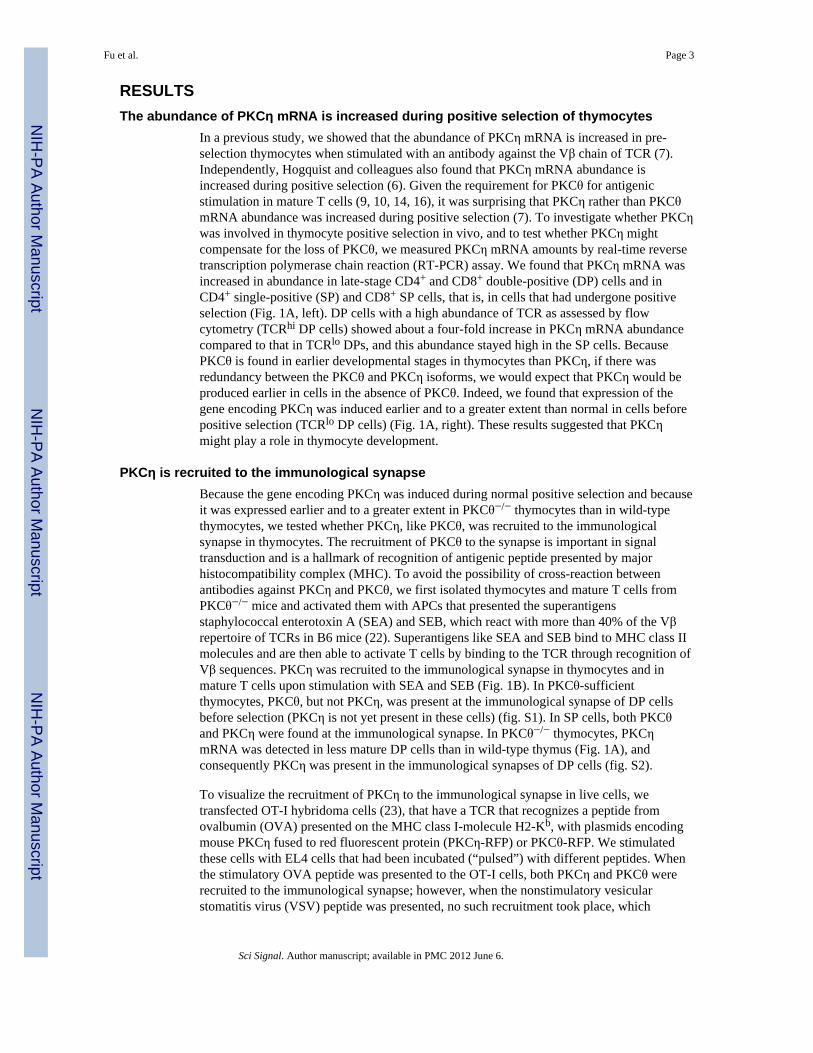
PKCη is not required for positive or negative selection of thymocytesTo investigate the role of PKCη in a broader manner, we generated Prkch-deficient(PKCη−/−) mice (fig. S5). The thymi of PKCη−/− mice contained ~20% fewer cells than didthe thymi of wild-type mice. When we analyzed thymocyte subsets in the thymi of PKCη−/−
mice, we found that the numbers of double-negative (DN1) and DN4 cells were reducedcompared to those in thymi from wild-type mice; however, the numbers of DN2 and DN3cells were not altered (Fig. 2A). DN4 cells develop into CD4+CD8+ DP cells, after whichthey are subjected to positive and negative selection to generate self-MHC–restricted, self-antigen–tolerant mature T cells (24). The proportions of DP, CD4+ SP, and CD8+ SP subsetswere similar in the thymi of PKCη−/− and wild-type mice, with slightly reduced cellnumbers of DP subsets in the PKCη−/− mice (Fig. 2B). These results suggested that PKCηwas not required for the positive selection of thymocytes.
To investigate the role of PKCη in negative selection, we used a superantigen-mediateddeletion model. Mouse mammary tumor proviruses encode superantigens (Mtv) that arepresented by the MHC class II molecule I-E to T cells, resulting in the intrathymic deletionof cells bearing Vβ elements recognized by particular Mtv superantigens (22, 25). BecauseB6 (MHC haplotype H-2b) mice do not express I-E, we crossed the B6 PKCη−/− mice toB10.D2 (H-2d) mice, producing F1 H-2b/d mice that express I-Ed. In combination with theendogenous superantigens Mtv-8 and Mtv-9, which are carried by both B6 and B10.D2cells, I-E causes the deletion of thymocytes that express the Vβ5, Vβ11, and Vβ12 chains ofthe TCR on their surface (22, 25). When we compared H-2b/b mice with H-2b/d PKCη+/+
mice, we found that a substantial number of T cells expressing Vβ5, Vβ11, and Vβ12 TCRswere deleted in the H-2b/d, I-E expressing F1 mice (Fig. 2C). Vβ7+ T cells do not recognizeMtv-8 and Mtv-9 superantigens and thus were not deleted in either mouse. Superantigen-mediated negative selection was as efficient in the H-2b/d PKCη−/− as PKCη+/+ mice,indicating that PKCη was dispensable for superantigen-mediated negative selection.
Increased number of memory phenotype T cells in PKCη-deficient miceWe observed that the lymph nodes of PKCη−/− mice were larger than those of wild-typemice (Fig. 3A). In the cervical area there were more and larger readily identifiable lymphnodes in PKCη−/− mice than in wild-type mice (Fig. 3A, left). When we isolated the axillar,brachial, and inguinal lymph nodes, we found that they were larger in PKCη−/− mice than inwild-type mice (Fig. 3A, right). Consistent with this finding, the number of lymph node cellswas increased in the PKCη−/− mice compared to that in the wild-type mice (Fig. 3B). Thesedata suggested that PKCη−/− mice may have a general over-production of lymphocytesrather than swollen lymph nodes (lymphadenopathy); however, the number of lymphocytesin the spleens of PKCη−/− mice was less than that of wild-type mice (Fig. 3B). In the lymph
Fu et al. Page 4
Sci Signal. Author manuscript; available in PMC 2012 June 6.
NIH
-PA Author Manuscript
NIH
-PA Author Manuscript
NIH
-PA Author Manuscript

nodes, although there were only minor changes in the proportions of T cells or B cells or inthe T cell subpopulations [CD8+, CD4+CD25− conventional CD4+ cells, or CD4+CD25+
regulatory T cells (Tregs)] (Fig. 3C), the absolute number of each cell type was substantiallyincreased in the PKCη−/− mice compared to those in wild-type mice (Fig. 3D), whereas thenumbers of each cell type were lower in the spleens of PKCη−/− mice than in those of wild-type mice. The proportion of cells with a memory or activated phenotype within theconventional CD4+CD25− population (CD44+) of cells was increased in the lymph nodesand the spleens of PKCη−/− mice compared to those in wild-type mice (Fig. 3, C and D).We obtained similar results when we used the transcription factor Foxp3, rather than thesurface marker CD25, to define Tregs (fig. S6, A and B). The total numbers of lymph nodeand splenic lymphocyte subsets were very similar in wild type and PKCη−/− mice, whichsuggested that the lymphocytes of PKCη-deficient mice might preferentially home to thelymph nodes rather than to the spleen. The exception to this conservation in totallymphocyte number in the secondary lymphoid tissues was the decrease in the total numberof naïve CD4+CD25− and the increase in the number of CD4+CD25− memory phenotype Tcells in the PKCη−/− mice compared to those of wild-type mice, suggesting that theknockout cells may have responded to more self-stimulation in the periphery than the wild-type cells (26).
PKCη-deficient T cells show impaired proliferationTo test the proliferative response of PKCη−/− T cells, we purified naïve CD4+ or CD8+ Tcells from lymph nodes, stimulated them through the TCR with various concentrations ofantibody against CD3, and measured their proliferative responses. Naïve CD4+ and CD8+ Tcells from PKCη−/− mice proliferated less well than did naïve CD4+ and CD8+ T cells fromwild-type mice (Fig. 4A). Unlike PKCθ−/− CD8+ T cells whose proliferation wascompletely abrogated by loss of PKCθ, the proliferation of PKCη−/− CD8+ T cells was onlymoderately reduced by 30 to 50% (Fig. 4A). So that both cell types could experience anidentical cytokine environment, we determined cell division by measuring the dilution of thecytoplasmic dye carboxyfluorescein succinimidyl ester (CFSE) with a mixture of PKCη−/−
T cells (which had the surface marker CD45.2) and PKCη+/+ T cells (which had the surfacemarker CD45.1). CD8+ T cells from PKCη−/− mice proliferated less well than did PKCη+/+
cells in response to stimulation by antibody against CD3 or by crosslinking of T cell surfaceglycoproteins with the lectin concanavalin A (ConA) (Fig. 4B). We then performed a similarexperiment with MHC class I–restricted OT-I TCR transgenic T cells that responded todifferent concentrations of OVA peptide presented by splenic APCs. In these experiments,PKCη−/− or PKCθ−/− T cells (which had the surface marker Thy1.2) were mixed withPKCη+/+ T cells (which had the surface marker Thy1.1). The PKCη−/− T cells proliferatedmore weakly than did the PKCη+/+ cells, but more strongly than did the PKCθ−/− cells (Fig.4C).
To investigate the proliferation of PKCη−/− T cells under more physiological conditions, westimulated OT-I TCR transgenic PKCη−/− T cells in vivo with bone marrow–deriveddendritic cells (BMDCs) that were loaded with OVA peptide. We purified wild-type(Thy1.1+CD45.2+) and PKCη−/− (Thy1.2+CD45.2+) OT-I T cells from lymph nodes, mixedthe cells at a 1:1 ratio, and injected them into recipient mice that had been immunized withOVA-loaded BMDCs one day before the experiment (Fig. 4D). The proportionalcontribution of each donor cell type to the total population of cells was determined atvarious time points by flow cytometric analysis (Fig. 4D). Both types of donor cellproliferated in the recipient mice, reaching their peak numbers on day 4, after which theydeclined (Fig. 4E). However, although both types of donor cells proliferated with similarkinetics, their respective proliferative capacities were quite different. The proportions ofPKCη+/+ and PKCη−/− T cells within the donor population started to diverge on day 1 (Fig.
Fu et al. Page 5
Sci Signal. Author manuscript; available in PMC 2012 June 6.
NIH
-PA Author Manuscript
NIH
-PA Author Manuscript
NIH
-PA Author Manuscript
4F). This difference in proportions increased over time, peaking at day 3, at which point thepercentages of wild-type and PKCη−/− T cells were 69 versus 30%. This difference incellular proportions was maintained until the end of the experiment. The differences in theproportion of PKCη+/+ T cells to PKCη−/− T cells could have occurred because ofdifferential cell death between the populations. To test this possibility, we incubated donorcells with labeled Annexin V to detect cell surface phosphatidylserine (present on earlyapoptotic cells) and the DNA-intercalating dye 7-AAD to distinguish viable from dyingcells. Both PKCη+/+ and PKCη−/− T cells had a small and roughly equal subset of dyingcells (fig. S7), which suggested that differential cell death was unlikely to contribute to thedifference in cellular proportions observed earlier (Fig. 4F). Collectively, these data indicatethat the PKCη−/− CD8+ T cells had a defect in the proliferative response to TCRstimulation, although the defect that was observed in assays in vitro was milder than thatseen in PKCθ−/− T cells.
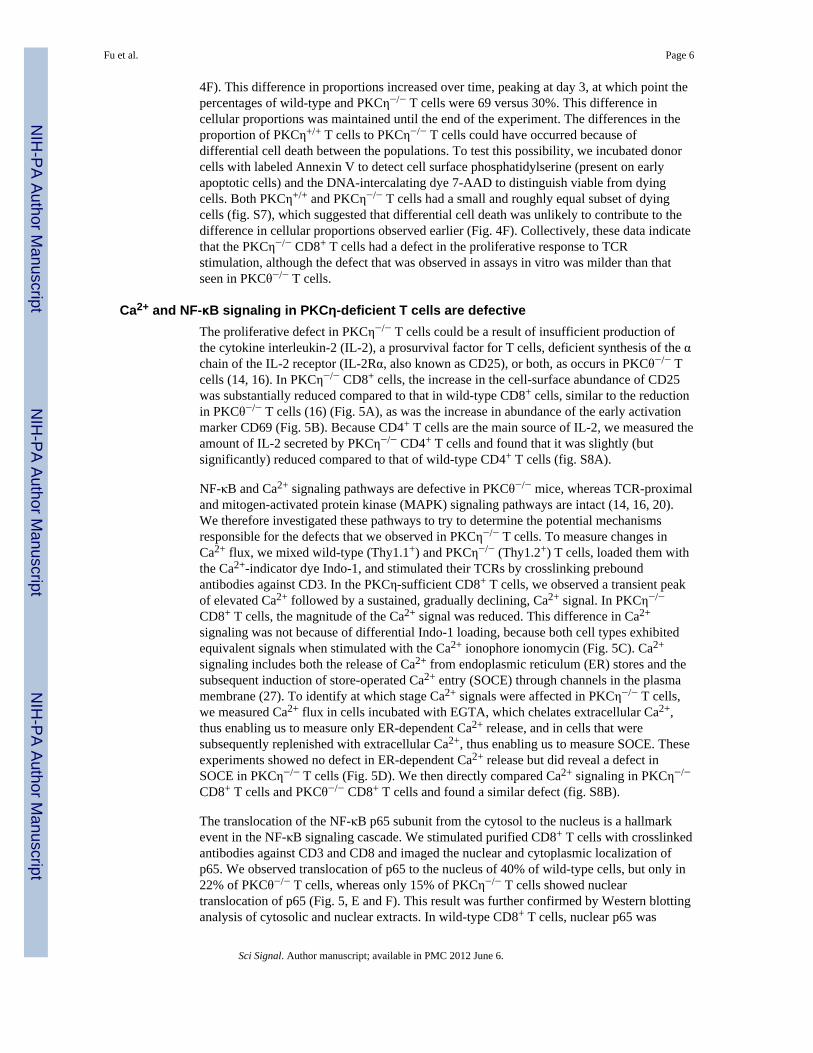
Ca2+ and NF-κB signaling in PKCη-deficient T cells are defectiveThe proliferative defect in PKCη−/− T cells could be a result of insufficient production ofthe cytokine interleukin-2 (IL-2), a prosurvival factor for T cells, deficient synthesis of the αchain of the IL-2 receptor (IL-2Rα, also known as CD25), or both, as occurs in PKCθ−/− Tcells (14, 16). In PKCη−/− CD8+ cells, the increase in the cell-surface abundance of CD25was substantially reduced compared to that in wild-type CD8+ cells, similar to the reductionin PKCθ−/− T cells (16) (Fig. 5A), as was the increase in abundance of the early activationmarker CD69 (Fig. 5B). Because CD4+ T cells are the main source of IL-2, we measured theamount of IL-2 secreted by PKCη−/− CD4+ T cells and found that it was slightly (butsignificantly) reduced compared to that of wild-type CD4+ T cells (fig. S8A).
NF-κB and Ca2+ signaling pathways are defective in PKCθ−/− mice, whereas TCR-proximaland mitogen-activated protein kinase (MAPK) signaling pathways are intact (14, 16, 20).We therefore investigated these pathways to try to determine the potential mechanismsresponsible for the defects that we observed in PKCη−/− T cells. To measure changes inCa2+ flux, we mixed wild-type (Thy1.1+) and PKCη−/− (Thy1.2+) T cells, loaded them withthe Ca2+-indicator dye Indo-1, and stimulated their TCRs by crosslinking preboundantibodies against CD3. In the PKCη-sufficient CD8+ T cells, we observed a transient peakof elevated Ca2+ followed by a sustained, gradually declining, Ca2+ signal. In PKCη−/−
CD8+ T cells, the magnitude of the Ca2+ signal was reduced. This difference in Ca2+
signaling was not because of differential Indo-1 loading, because both cell types exhibitedequivalent signals when stimulated with the Ca2+ ionophore ionomycin (Fig. 5C). Ca2+
signaling includes both the release of Ca2+ from endoplasmic reticulum (ER) stores and thesubsequent induction of store-operated Ca2+ entry (SOCE) through channels in the plasmamembrane (27). To identify at which stage Ca2+ signals were affected in PKCη−/− T cells,we measured Ca2+ flux in cells incubated with EGTA, which chelates extracellular Ca2+,thus enabling us to measure only ER-dependent Ca2+ release, and in cells that weresubsequently replenished with extracellular Ca2+, thus enabling us to measure SOCE. Theseexperiments showed no defect in ER-dependent Ca2+ release but did reveal a defect inSOCE in PKCη−/− T cells (Fig. 5D). We then directly compared Ca2+ signaling in PKCη−/−
CD8+ T cells and PKCθ−/− CD8+ T cells and found a similar defect (fig. S8B).
The translocation of the NF-κB p65 subunit from the cytosol to the nucleus is a hallmarkevent in the NF-κB signaling cascade. We stimulated purified CD8+ T cells with crosslinkedantibodies against CD3 and CD8 and imaged the nuclear and cytoplasmic localization ofp65. We observed translocation of p65 to the nucleus of 40% of wild-type cells, but only in22% of PKCθ−/− T cells, whereas only 15% of PKCη−/− T cells showed nucleartranslocation of p65 (Fig. 5, E and F). This result was further confirmed by Western blottinganalysis of cytosolic and nuclear extracts. In wild-type CD8+ T cells, nuclear p65 was
Fu et al. Page 6
Sci Signal. Author manuscript; available in PMC 2012 June 6.
NIH
-PA Author Manuscript
NIH
-PA Author Manuscript
NIH
-PA Author Manuscript

increased in abundance for at least 60 min after stimulation, but in PKCη−/− T cells, theincrease in the abundance of nuclear p65 ceased 20 min after stimulation (Fig. 5, G and H).The total amount of cellular p65 was not altered in PKCη−/− T cells (fig. S8C). Together,these results demonstrated that the NF-κB pathway was disrupted in the absence of PKCη atleast as much as in the absence of PKCθ. TCR-proximal signaling and MAPK signalingpathways were normal in PKCη−/− T cells (fig. S8, D and E). Collectively, these resultsshowed that PKCη−/− T cells were defective for Ca2+ and NF-κB signaling, which were alsoadversely affected in PKCθ−/− T cells.
DKO mice reveal isoform-specific and redundant roles for PKCη and PKCθThe normal T cell development, but the defective Ca2+ and NF-κB signaling pathways, seenin PKCη−/− and PKCθ−/− mice, prompted us to investigate possible redundancy betweenPKCη and PKCθ in T cell development and function. To do this, we bred Prkcq−/−,Prckh−/− double knockout (DKO) mice. In the thymus, DKO mice had a more substantialreduction in the numbers of DN1 and DN4 thymocytes than were observed in either of thesingle knockout mice (Fig. 6, A and D). At the mature SP stage, although PKCθ−/− miceshowed a mild defect in positive selection, the DKO mice had the most marked defect (Fig.6, B and E). Thus, comparing the PKCθ−/− and DKO mice revealed a redundant role forPKCη in positive selection. This finding was confirmed when we analyzed the most maturepopulation of cells in the thymus, the CD5hiTCRhi cells (Fig. 6C). No difference was notedbetween PKCη−/− and wild-type B6 mice, but the minor defect in thymocyte development inPKCθ−/− mice (21), was exacerbated by concomitant loss of PKCη (Fig. 6, C and F).Collectively, these findings demonstrated redundancy between PKCη and PKCθ; PKCηcould substitute for PKCθ during positive selection, as was initially suggested by theincreased abundance of PKCη and its recruitment to the immunological synapse in PKCθ−/−
thymocytes (Fig. 1).
We performed a comprehensive analysis of the lymph nodes and spleens of B6 mice and thevarious PKC knockout strains (fig. S9). Although redundancy between PKCη and PKCθwas apparent in thymocyte development, we observed an isoform-specific phenotype inmature T cells in the lymph nodes. For example, DKO mice and normal B6 mice had thesame total number of T cells, as well as similar numbers of CD4+ and CD8+ T cell subsets.In contrast, PKCη−/− and PKCθ−/− mice had the highest and lowest number of thesesubsets, respectively (fig. S9B). More evidence supporting an isoform-specific role forPKCη in the biology of peripheral T cells came from analysis of the ratio of CD4+ to CD8+
cells in wild-type B6 mice and PKC-deficient strains of mice (fig. S9E). The CD4:CD8 Tcell ratio was highest in PKCη−/− mice (lymph nodes: 1.69 ± 0.29; spleen: 2.39 ± 0.47) andlowest in PKCθ−/− mice (lymph nodes: 1.04 ± 0.12; spleen: 1.31 ± 0.21), with wild-typemice exhibiting intermediate ratios (lymph nodes: 1.44 ± 0.31; spleen: 1.87 ± 0.53). Thebiased CD4:CD8 ratios seen in single PKC knockout mice were “corrected” in DKO mice(lymph nodes: 1.53 ± 0.34; spleen: 1.88 ± 0.39). Together, these results strengthen thenotion that PKCη and PKCθ have both redundant and isoform-specific roles in T celldevelopment.
To determine whether the redundancy between PKCη and PKCθ was also manifested in Tcell function, we measured the ability of T cells from the various PKC knockout mice toundergo homeostatic proliferation in vivo. T cell homeostatic proliferation occurs inresponse to a lymphopenic environment and is driven by TCR signaling (26). We sortednaïve T cells from wild-type (Thy1.1+) and the different PKC knockout mice (all Thy1.2+),mixed them at a 1:1 ratio, labeled them with CFSE, and injected them into sublethallyirradiated recipient mice. One week later, we determined the CFSE staining of donor T cellsby flow cytometry. We found that PKCη−/− CD8+ cells proliferated less well than did wild-type cells, with the most severe proliferation defect seen in DKO cells. PKCθ−/− cells
Fu et al. Page 7
Sci Signal. Author manuscript; available in PMC 2012 June 6.
NIH
-PA Author Manuscript
NIH
-PA Author Manuscript
NIH
-PA Author Manuscript
showed no noticeable defect in proliferation compared to that of wild-type cells (Fig. 7A).That the homeostatic proliferation of DKO T cells was not completely abolished and thatPKCη−/−, but not PKCθ−/−, CD8+ T cells had a noticeable proliferative defect wassurprising. It was possible that the use of polyclonal donor T cells in these experimentsobscured a defect in the PKC-deficient cells. Therefore, we repeated this experiment withMHC class I–restricted OT-I TCR transgenic T cells as the donor cells. The DKO cellsproliferated very poorly compared to the wild-type cells in recipient mice (Fig. 7B, left). Wealso observed a proliferative defect in the PKCη−/− cells, but not in the PKCθ−/− cells,consistent with the earlier experiments. We also analyzed the proportions of wild type andPKC-deficient donor cells present in the recipient mice after one week. Although all of thecell combinations started at a 1:1 ratio, the proliferation of DKO cells was clearly outpacedby that of wild-type T cells (Fig. 7B, right). PKCη−/− cells also represented a reducedproportion of the cell population after a week, but the proportion of PKCθ−/− cells wassimilar to that of the wild-type cells. These changes matched the data from the CFSE-labeling experiments, demonstrating that PKCη, not PKCθ, played a major role in thehomeostatic proliferation of CD8+ T cells. In addition to TCR signaling, cytokines such asIL-7 and IL-15 can also promote homeostatic proliferation; however, altered responsivenessto these cytokines during homeostatic proliferation seems unlikely in the case of PKCη−/−
and DKO T cells, because the amounts of IL-7Rα (CD127) and IL-15R (CD122) on thesurface of these cells was comparable to those of wild-type T cells (fig. S10).
DISCUSSIONThe finding that the abundance of PKCη mRNA was increased during the positive selectionof thymocytes (6, 7) was surprising given the widely accepted importance of PKCθ in T cellbiology, in particular that PKCθ is recruited to the central region of the immunologicalsynapse (9, 10). PKCη was also recruited to the immunological synapse during thymocytedevelopment and in mature T cells. PKCη formed a diffuse pattern at the immunologicalsynapse, such that although PKCη and PKCθ were co-recruited to the immunologicalsynapse, PKCθ is concentrated at the central synapse, PKCη was not. Such differentlocalization patterns might lead to different functions. This suggestion is consistent with ourdata showing that T cell activation involving immunological synapse formation (antigen-specific proliferation in response to APCs) was more severely affected in cells lackingPKCη than were responses that did not involve an immunological synapse, such asstimulation with antibody against CD3 or with a combination of PMA and ionomycin.
Knockout mice have been powerful tools in immunological studies, as evidenced by thestudies of PKCθ in T cell biology (14, 16). In contrast, studies on PKCη have lagged behind.The first study of a PKCη knockout mouse was published several years ago, but lacked anyimmunological analysis (8). Until now, there has been no follow-up study of this or anyother PKCη knockout mouse. In Table 1, we summarize the similarities and differencesbetween PKCη−/−, PKCθ−/−, and the DKO mice based on this study and work from others(14, 16, 20, 21). That thymocyte development was normal in PKCη−/− mice was notunexpected. Initial reports on PKCθ−/− mice did not identify any defects in thymocytedevelopment despite showing severely impaired mature T cell function (14, 16); however, astudy reexamining thymocyte development in PKCθ−/− mice showed a rather milddeficiency (21), which is also in agreement with our observations here. Therefore, it ispossible that the lack of obvious developmental or functional defects in any single PKCknockout mouse strain results from a redundancy between PKC isoforms, especially thosemembers within the same subfamily. This is evidenced in our PKCη−/− PKCθ−/− DKOmice, in which positive selection was more severely impaired than in either single knockoutmouse.
Fu et al. Page 8
Sci Signal. Author manuscript; available in PMC 2012 June 6.
NIH
-PA Author Manuscript
NIH
-PA Author Manuscript
NIH
-PA Author Manuscript
Although redundancy between different PKC isoforms obscures some roles of individualPKC isoforms, we did find clear individual roles for PKCη in this study. For example, areduced homeostatic proliferation of CD8+ T cells (either polyclonal or OT-I TCRtransgenic T cells) was seen only in PKCη−/− cells, but not in PKCθ−/− cells. Also,PKCη−/− mice had a higher ratio of CD4+ T cells to CD8+ T cells than did wild-type mice,whereas PKCθ−/− mice had a lower ratio. Knockout of both PKC isoforms resulted in aCD4:CD8 T cell ratio that was similar to that of wild-type mice. Previous work has shownthat the ratio of CD4+ to CD8+ T cells is influenced by a number of factors duringdevelopment (28-30); however, the effect of PKC knockout that we observed appeared tooccur post-thymically, because SP thymocytes from the knockout mice did not show alteredratios of CD4+ to CD8+ T cells. Together, these results demonstrate PKCη-specific roles inT cells.
The enlarged lymph nodes seen in PKCη−/− mice relative to those of wild-type mice werealso noted in PKCδ−/− animals (31), but were not observed in PKCθ−/− mice (14, 16). InPKCδ−/− mice, lymphadenopathy was associated with increased numbers of B cells as wellas a marked increase in the ratio of B cells to T cells (31). However, the situation inPKCη−/− mice was more complicated. In the lymph nodes, the relative proportions of Bcells and T cells were barely different (~4% difference), and thus were unlikely to accountfor the substantially increased cell numbers (40 to 50%) in the lymph nodes of the PKCη−/−
mice compared to those of normal mice. In contrast, in the spleens of PKCη−/− mice, thenumbers of B cells and T cells were reduced compared to those in spleens from wild-typemice. We speculate that the differences in lymphocyte numbers between the lymph nodesand spleens of the PKCη−/− mice may reflect altered lymphocyte homing, homeostasis, orboth, and are worth further investigation. We found that Ca2+ flux and NF-κB translocationwere impaired in PKCη−/− T cells, but that TCR-proximal tyrosine phosphorylation eventsand MAPK signaling pathways were intact. These signaling defects are similar to those ofPKCθ−/− T cells. Unlike PKCθ, about which there are many in-depth studies on themolecular signaling machinery (15, 18-20), the investigation of PKCη is still at an earlystage.
One puzzle raised in this and other studies is that there is an apparent discrepancy betweenthe severe defect seen in PKCθ−/− T cells in studies in vitro and the mostly mild (if any)defect observed in studies in vivo. For example, the absence of PKCθ impairs thedifferentiation of T helper type 2 (TH2) cells but not that of TH1 cells, which results inreduced immune responses against Leishmania major (32). Similarly, PKCθ-deficiencyresults in impaired responses to Listeria monocytogenes infection (33), but not to impairedantiviral immune responses (34, 35). As we showed here, PKCθ−/− CD8+ T cells showednormal homeostatic proliferation, whereas this was impaired in PKCη−/− CD8+ T cells.Thus, the deficiencies seen in PKCη−/− T cells in vivo were more striking than those ofPKCθ−/− T cells. It will be interesting to determine how PKCη−/− and DKO T cells behavein vivo in response to viral and bacterial infections.
We have demonstrated that PKCη has specific, as well as redundant (with PKCθ), functionsin T cell biology, which are separated by developmental stage. Although redundant during Tcell development, specific roles for PKCη in the responsiveness of CD8+ T cells wereapparent in the periphery. Deficiencies in CD8+ T cell responses to pMHC may cause theincreased CD4:CD8 T cell ratio in peripheral T cells that we observed in the PKCη−/− mice.In addition, PKCη was required to balance the distribution of lymphocytes between differentlymphoid organs. Together, these factors point to the importance of PKCη in T cell biology.
Fu et al. Page 9
Sci Signal. Author manuscript; available in PMC 2012 June 6.
NIH
-PA Author Manuscript
NIH
-PA Author Manuscript
NIH
-PA Author Manuscript

MATERIALS AND METHODSMice
B6.PL-Thy1a/CyJ (Thy1.1+CD45.2+) and B6.SJL-Ptprca Pepcb/BoyJ (Thy1.2+CD45.1+)mice were purchased from Jackson Laboratories. C57BL/6 (Thy1.2+CD45.2+) mice werebred at The Scripps Research Institute (TSRI). OT-I and OT-I Tap−/− animals were obtainedfrom S. Jameson and K. Hogquist (University of Minnesota, Minneapolis, MN), andPrkcq−/− mice (14) and OT-I Prkcq−/− were provided by A. Altman (La Jolla Institute forAllergy and Immunology). Prkch−/− mice were generated in this study. All experimentswere performed in accordance with the guidelines of the Animal Care and Use Committeeof TSRI.
Antibodies, cytokines, and reagentsAntibodies against CD3 (145-2C11), CD4 (RM4.4, RM4.5, GK1.5), CD8α (53-6.7), CD25(PC61.5), CD62L (MEL14), CD44 (IM7), Vβ5 (MR9-6), Vβ6 (RR4-7), Vβ11 (CTVB11),and Vβ12 (CTVB12b), were obtained from eBioscience, Biolegend, or BD Biosciences.Antibodies against phosphorylated ERK1/2 (T202/Y204, clone 197G2), phosphorylated p38MAPK (Thr180/Tyr182, clone 3DT), α-tubulin, and β-actin were from Cell SignalingTechnology. Antibodies against p65, PKCη, and PKCθ were obtained from Santa CruzBiotechnology. Recombinant IL-3, IL-6, and stem cell factor (SCF) were obtained fromPeproTech. Granulocyte macrophage colony–stimulating factor (GM-CSF) was generated asdescribed previously (36). Streptavidin was obtained from Jackson ImmunoResearchLaboratories. The GeneJammer transfection reagent was from Stratagene. The AmiconUltracentrifugal filter device (UFC810024) was obtained from Millipore. EasySep Mouse total Tcell, CD4+, and CD8+ T Cell Negative Enrichment Kits were from StemCell Technologies.Indo-1 AM and CFDA-SE (CFSE) were from Molecular Probes (Invitrogen).
Real time RT-PCRTotal RNA from the thymi of 4- to 8-week old OT-I mice or from sorted subpopulations wasisolated with the RNeasy Mini Kit (Qiagen). The RNA was treated with deoxyribonuclease I(DNAse I, Invitrogen) for 15 min at room temperature. The reaction was stopped by theaddition of 25 mM EDTA, and the DNAse was inactivated by incubating the samples at65°C for 10 min. RNA samples were used as templates to synthesize complementary DNA(cDNA) with the Superscript First Strand Synthesis System for RT-PCR (Invitrogen)according to the manufacturer’s recommendations. Oligonucleotide primers were designedwith Primer Express 1.5 software (PE Applied Biosystems). The primer sequences are asfollows: PKCη 5′ primer: 5′-CTCCAGACCGTCTGTTCTTTGTC-3′; 3′ primer: 5′-ATCTCCGCGGCGTAGAAA-3′, GenBank accession # D90242. Ribosomal protein 5′primer: 5′-AGATGCAGCAGATCCGCAT-3′; 3′ primer: 5′-GGATGGCCTTGCGCA-3′,GenBank accession # BC011106. Real-time PCR reactions were performed on the ABIPrism 7700 Sequence Detection System with SYBR Green PCR Master Mix (PE AppliedBiosystems). The PCR mix was optimized for SYBR Green reactions and contained SYBRGreen 1 dye, AmpliTaqGold DNA polymerase, and dNTPs with dUTP. Each reaction wasperformed in a final volume of 25 μl and contained the SYBR Green PCR Master Mix,cDNA, and 150 nM of each primer. Two independent experiments were performed, and allreactions were performed in duplicate. A standard curve with a two-fold serial dilution ofthe standard cDNA was generated for the target gene as well as for the housekeeping generibosomal protein. cDNAs (20 ng/reaction) from the different cell populations were used astemplates for real-time PCR. The standard curves were used to determine the relativeconcentrations of amplified transcripts. The amounts of PKCη mRNA were first normalizedto those of the ribosomal protein mRNA. The normalized sample values were finally divided
Fu et al. Page 10
Sci Signal. Author manuscript; available in PMC 2012 June 6.
NIH
-PA Author Manuscript
NIH
-PA Author Manuscript
NIH
-PA Author Manuscript

by the normalized amounts of PKCη mRNA in samples from OT-I TCRlo DP cells to obtainthe fold-change in mRNA abundance between the different populations of DP thymocytes.
Generation of PKCη−/− miceThe strategy for generating PKCη knockout mice was as described previously (fig. S5) (37),except that all cloning materials, embryonic stem (ES) cell line (Bruce4), and founder miceused for breeding were on a B6 background. PKCθ knockout mice were describedpreviously (14) and were maintained in TSRI animal facility by further breeding onto the B6background. DKO mice were generated by breeding PKCη−/− and PKCθ−/− mice together.
T cell activation and proliferation assaysPurified naïve CD8+ T cells from mice were used in experiments as indicated in the text.Purification was performed with biotinylated antibodies in conjunction with magnetic beadsconjugated with antibodies against biotin (BD Bioscience) or else cells were sorted with aflow cytometer. Cells were stimulated with plate-bound or soluble antibody against CD3 asindicated in the figures, and cells were incubated with antibodies against CD69, CD25, CD4,and CD8 for flow cytometric analysis. Thymidine incorporation assays were performed asdescribed (14). For proliferation assays involving CFSE dilution, lymphocytes wereincubated with CFSE (0.2 μM) at 37°C for 10 min, which was stopped by the addition of 10volumes of cRPMI. After washing, cells were cultured with or without antibody againstCD3 in cRPMI for 48 hours, or in the presence of irradiated B6.SJL-Ptprca Pepcb/BoyJ(CD45.1) splenocytes that had been pulsed with the indicated concentration of OVApeptide. T cell proliferation was determined by measuring the dilution of CFSE in cells byflow cytometry. To measure IL-2 production, CD4+ T cells were purified from lymph nodeswith the EasySep Mouse CD4+ T Cell Enrichment Kit (StemCell), and 2 × 10⁵ cells wereseeded per well in a BioCoat T-Cell Activation Plate, which was pre-coated with antibodyagainst CD3 (BD Biosciences). To stimulate cells, soluble antibody against CD28 wasadded to the cell culture medium to a final concentration of 1 μg/ml, and cells wereincubated at 37°C in 5% CO2 for 48 hours. Culture supernatants were removed, and theconcentration of IL-2 produced by the cells was measured with the mouse IL-2 enyme-linked immunosorbent assay (ELISA) Ready-SET-Go kit (eBioscience) according to themanufacturer’s instructions.
Ca2+ signalingCa2+ flux was performed as described previously (37, 38). Briefly, lymphocytes wereisolated from wild-type mice (Thy1.1+ or Thy1.2+) and PKCη−/− mice (Thy1.2+). Cellsfrom different genotypes were mixed at a 1:1 ratio. Cells were suspended at 2 to 5 × 10⁶/mlin cRPMI [RPMI medium supplemented with 10% fetal calf serum (FCS), penicillin (100 U/ml), streptomycin (10 μg/ml), glutamine (292 μg/ml), 50 μM 2-mercaptoethanol, and 25mM Hepes (pH 7.2-7.5)] and were incubated with 2 μM Indo-1 AM for 30 min at 37°C in5% CO2. Cells were washed twice with cRPMI and resuspended in 0.5 ml of cRPMI orcHBSS [Hanks’ balanced salt solution (HBSS) supplemented with 1% FCS, 1 mM EGTA, 1mM MgCl2, and 10 mM Hepes (pH 7.2-7.5)]. Cells were pre-warmed to 37°C beforeanalysis and were kept at 37°C during event collection on a Becton-Dickinson LSR-II flowcytometer. To stimulate cells, reagents were added during the analysis as indicated in thefigures, and maximal Ca2+ flux was obtained by adding ionomycin (500 ng/ml,Calbiochem). The mean fluorescence ratio was calculated with FlowJo software (TreeStar).
Western blotting analysisCD8+ T cells were stimulated with crosslinking antibodies against CD3 and CD8 for thetimes indicated in the figures. Cell lysates were prepared, resolved by SDS-polyacrylamide
Fu et al. Page 11
Sci Signal. Author manuscript; available in PMC 2012 June 6.
NIH
-PA Author Manuscript
NIH
-PA Author Manuscript
NIH
-PA Author Manuscript

gel electrophoresis (SDS-PAGE), and analyzed by Western blotting with the indicatedantibodies, as described previously (37). To measure the nuclear translocation of NF-κBp65, cells were stimulated as described earlier, chilled on ice, and fractionated with the NE-PER kit (Pierce). Western blotting analysis of samples was performed with the Li-CorOdyssey infrared imaging system. Normalization and calculation of fraction purity and theratios of nuclear to cytosolic p65 abundance were performed according to Li-Cor protocolswith p65, total protein, actin, and tubulin signals.
In vivo proliferation assaysProliferation of OT-I TCR transgenic cells in response to stimulation with OVA peptide invivo was measured as described previously (39). Briefly, OT-I TCR CD8+ T cells werepurified with a CD8+ T cell Negative Enrichment kit (StemCell). Wild-type(Thy1.1+CD45.2+) and PKCη−/− (Thy1.2+CD45.2+) cells were mixed at a 1:1 ratio, andtransferred into recipient B6.SJL mice (Thy1.2+CD45.1+). The recipient mice wereintravenously injected with BMDCs that had been pulsed with OVA257-264 peptide one daybefore transfer of the T cells. At various time points, cells from the lymph nodes and spleensof recipient mice were collected, and the proportions and absolute cell numbers of donorcells were determined by flow cytometry. BMDC were cultured and induced to maturationas described previously (36, 39, 40). Briefly, on day 7 of BMDC culture, lipopolysaccharide(LPS, 100 ng/ml) was added overnight to induce maturation. BMDC maturity andphenotype were confirmed by flow cytometric analysis of the surface expression of CD11c,CD86, CD80, and MHC-II. The resultant cell population contained >90% CD11c+ MHC-IIhi
BMDCs.
Homeostatic proliferation assaysNaïve T cells (CD62L+CD44−) were sorted from mice (all of whom were CD45.2+, butwere either Thy1.1+ or Thy1.2+). Thy1.1+ or Thy1.2+ sorted cells were mixed in a 1:1 ratio,labeled with CFSE, and injected intravenously into recipient B6.SJL mice(Thy1.2+CD45.1+), which were sublethally irradiated (5.5 Gy) with a Gammacell 40 (MDSNordion) before cell transfer. One week later, cells from the lymph nodes and spleens ofrecipient mice were collected and analyzed by flow cytometry.
MicroscopyTo visualize the recruitment of PKC to the immunological synapse in live cells, wetransfected T cell hybridomas with plasmid encoding fusion proteins of PKC isoforms andfluorescent proteins, as indicated in the text. The form of red fluorescent protein (RFP) usedwas tDimer2(12) (41). APCs were loaded with peptides or superantigens as indicated in thefigures. T cell hybridomas and APCs were mixed together for various time points and werefixed before imaging. For time-lapse imaging of T cell–APC conjugates (fig. S4), T cellhybridomas and APCs were sequentially loaded into an FCS2 flow chamber FCS2(Bioptechs) that was heated to 37°C. To visualize the recruitment of PKC to theimmunological synapse in live primary T cells, we incubated 1 × 10⁷ thymocytes with 2 ×10⁷ EL4 cells that were pulsed with OVA peptide (10 mM) or with 2 × 10⁷ LK35 B cell(class II+) tumor cells presenting the superantigens SEA (50 ng/ml) and SEB (10 μg/ml,Toxin Technology) in 96-well, round-bottomed plates for 30 or 60 min at 37°C. Thymocyteswere then fixed with 4% paraformaldehyde (PFA) for 12 min at room temperature. To detectcell-surface markers, thymocytes were incubated with biotinylated antibodies against CD4,CD8, or LFA-1 (BD Bioscience), after which they were incubated with Alexa Fluor 488–conjugated streptavidin (Molecular Probes). For intracellular staining, cells werepermeabilized with 0.2% saponin for 15 min at room temperature. Cells were then incubatedwith rabbit antibodies against the appropriate PKC isoform, after which they were incubatedwith Alexa Fluor 568– or Alexa Fluor 680–conjugated antibodies against rabbit antibodies
Fu et al. Page 12
Sci Signal. Author manuscript; available in PMC 2012 June 6.
NIH
-PA Author Manuscript
NIH
-PA Author Manuscript
NIH
-PA Author Manuscript
(Molecular Probes). To visualize the nuclear translocation of NF-κB in primary T cells, wepurified 2 × 10⁶ CD8+ T cells from lymph nodes by magnetic negative selection and platedthe cells on Lab-Tek II chambered cover glass coated with poly-D-lysine (Sigma). The cellswere then stimulated with crosslinking antibodies against CD3 and CD8 for the timesindicated in the figures. T cells were then fixed with 4% PFA for 12 min at roomtemperature. Cells were permeabilized with 0.3% Triton X-100 for 3 min at roomtemperature. Cells were then incubated with rabbit antibody against p65 (1 μg/ml), afterwhich they were incubated with Alexa Fluor 488–conjugated secondary antibody againstrabbit antibody (Molecular Probes). Nuclei were counterstained with the DNA-binding dye4′,6-diamidino-2-phenylindole (DAPI; Invitrogen). All images were captured with a ZeissAxiovert 200 M inverted microscope. SlideBook software (Intelligent Imaging Innovation)was used for the capture as well as for deconvolution and image analysis, and ImageJ wasused for image presentation.
Statistical analysisStatistical differences were calculated with the mean difference hypothesis of Student’s twotailed t test assuming different variances and a confidence level of 95%. Calculations wereperformed with Microsoft Excel.
Supplementary MaterialRefer to Web version on PubMed Central for supplementary material.
AcknowledgmentsWe thank A. Altman (La Jolla Institute for Allergy and Immunology), K. Hogquist and S. Jameson (University ofMinnesota, Minneapolis), and D. Littman (Skirball Institute, New York) for mice and reagents, and the TSRIMouse Genetics Core for help in making the knockout mice.
Funding: This work was supported by grants from NIH (GM048002 and GM065230 to N.R.J.G., OD006433 toH.C., and AI070845 to K.S.). N.N.-M. was supported by a fellowship from the Swiss National Science Foundation;J.C. was supported by a fellowship from the Spanish Ministerio de Innovacion y Ciencia (MICIIN); P.P.Y. wassupported by NIH training grant T32HL07195; J.A.H.H. was supported by the Irving S. Sigal Fellowship of theAmerican Chemical Society and by NIH training grant T32AI07244; and K.S. was supported by The Leukemia &Lymphoma Society Scholar Award 1440-11. The content of this work is solely the responsibility of the authors anddoes not necessarily represent the official views of the National Institute of General Medicine or the NationalInstitutes of Health. This is manuscript number 20858 from The Scripps Research Institute.
REFERENCES AND NOTES1. Dempsey EC, Newton AC, Mochly-Rosen D, Fields AP, Reyland ME, Insel PA, Messing RO.
Protein kinase C isozymes and the regulation of diverse cell responses. Am J Physiol Lung Cell MolPhysiol. 2000; 279:L429–438. [PubMed: 10956616]
2. Isakov N, Altman A. Protein kinase Cθ in T cell activation. Annu Rev Immunol. 2002; 20:761–794.[PubMed: 11861617]
3. Baier G. The PKC gene module: molecular biosystematics to resolve its T cell functions. ImmunolRev. 2003; 192:64–79. [PubMed: 12670396]
4. Hayashi K, Altman A. Protein kinase C θ (PKCθ): a key player in T cell life and death. PharmacolRes. 2007; 55:537–544. [PubMed: 17544292]
5. Manicassamy S, Gupta S, Sun Z. Selective function of PKC-θ in T cells. Cell Mol Immunol. 2006;3:263–270. [PubMed: 16978534]
6. Mick VE, Starr TK, McCaughtry TM, McNeil LK, Hogquist KA. The regulated expression of adiverse set of genes during thymocyte positive selection in vivo. J Immunol. 2004; 173:5434–5444.[PubMed: 15494490]
Fu et al. Page 13
Sci Signal. Author manuscript; available in PMC 2012 June 6.
NIH
-PA Author Manuscript
NIH
-PA Author Manuscript
NIH
-PA Author Manuscript

7. Niederberger N, Buehler LK, Ampudia J, Gascoigne NRJ. Thymocyte stimulation by anti-TCR-β,but not by anti-TCR-α, leads to induction of developmental transcription program. J Leukoc Biol.2005; 77:830–841. [PubMed: 15661827]
8. Chida K, Hara T, Hirai T, Konishi C, Nakamura K, Nakao K, Aiba A, Katsuki M, Kuroki T.Disruption of protein kinase Cη results in impairment of wound healing and enhancement of tumorformation in mouse skin carcinogenesis. Cancer Res. 2003; 63:2404–2408. [PubMed: 12750259]
9. Monks CRF, Kupfer H, Tamir I, Barlow A, Kupfer A. Selective modulation of protein kinase C-θduring T-cell activation. Nature. 1997; 385:83–86. [PubMed: 8985252]
10. Monks CRF, Freiberg BA, Kupfer H, Sciaky N, Kupfer A. Three-dimensional segregation ofsupramolecular activation clusters in T cells. Nature. 1998; 395:82–86. [PubMed: 9738502]
11. Grakoui A, Bromley SK, Sumen C, Davis MM, Shaw AS, Allen PM, Dustin ML. Theimmunological synapse: a molecular machine controlling T cell activation. Science. 1999;285:221–227. [PubMed: 10398592]
12. Yokosuka T, Kobayashi W, Sakata-Sogawa K, Takamatsu M, Hashimoto-Tane A, Dustin ML,Tokunaga M, Saito T. Spatiotemporal regulation of T cell costimulation by TCR-CD28microclusters and protein kinase C θ translocation. Immunity. 2008; 29:589–601. [PubMed:18848472]
13. Singleton KL, Roybal KT, Sun Y, Fu G, Gascoigne NRJ, van Oers NS, Wulfing C. Spatiotemporalpatterning during T cell activation is highly diverse. Sci Signal. 2009; 2:ra15. [PubMed:19351954]
14. Sun Z, Arendt CW, Ellmeier W, Schaeffer EM, Sunshine MJ, Gandhi L, Annes J, Petrzilka D,Kupfer A, Schwartzberg PL, Littman DR. PKC-θ is required for TCR-induced NF-kB activation inmature but not immature T lymphocytes. Nature. 2000; 404:402–407. [PubMed: 10746729]
15. Egawa T, Albrecht B, Favier B, Sunshine MJ, Mirchandani K, O’Brien W, Thome M, Littman DR.Requirement for CARMA1 in antigen receptor-induced NF-κB activation and lymphocyteproliferation. Curr Biol. 2003; 13:1252–1258. [PubMed: 12867038]
16. Pfeifhofer C, Kofler K, Gruber T, Tabrizi NG, Lutz C, Maly K, Leitges M, Baier G. Protein kinaseCθ affects Ca2+ mobilization and NFAT cell activation in primary mouse T cells. J Exp Med.2003; 197:1525–1535. [PubMed: 12782715]
17. Hara H, Bakal C, Wada T, Bouchard D, Rottapel R, Saito T, Penninger JM. The molecular adapterCarma1 controls entry of IκB kinase into the central immune synapse. J Exp Med. 2004;200:1167–1177. [PubMed: 15520247]
18. Wang D, Matsumoto R, You Y, Che T, Lin XY, Gaffen SL, Lin X. CD3/CD28 costimulation-induced NF-κB activation is mediated by recruitment of protein kinase C-θ, Bcl10, and IκB kinaseβ to the immunological synapse through CARMA1. Mol Cell Biol. 2004; 24:164–171. [PubMed:14673152]
19. Roose JP, Mollenauer M, Gupta VA, Stone J, Weiss A. A diacylglycerol-protein kinase C-RasGRP1 pathway directs Ras activation upon antigen receptor stimulation of T cells. Mol CellBiol. 2005; 25:4426–4441. [PubMed: 15899849]
20. Manicassamy S, Sadim M, Ye RD, Sun Z. Differential roles of PKC-θ in the regulation ofintracellular calcium concentration in primary T cells. J Mol Biol. 2006; 355:347–359. [PubMed:16309697]
21. Morley SC, Weber KS, Kao H, Allen PM. Protein kinase C-θ is required for efficient positiveselection. J Immunol. 2008; 181:4696–4708. [PubMed: 18802072]
22. Irwin MJ, Gascoigne NRJ. Interplay between superantigens and the immune system. J. LeukocyteBiol. 1993; 54:495–503. [PubMed: 8228628]
23. Yachi PP, Ampudia J, Gascoigne NRJ, Zal T. Nonstimulatory peptides contribute to antigen-induced CD8-T cell receptor interaction at the immunological synapse. Nat Immunol. 2005;6:785–792. [PubMed: 15980863]
24. Starr TK, Jameson SC, Hogquist KA. Positive and negative selection of T cells. Annu RevImmunol. 2003; 21:139–176. [PubMed: 12414722]
25. Scherer MT, Ignatowicz L, Winslow GM, Kappler JW, Marrack P. Superantigens: Bacterial andviral proteins that manipulate the immune system. Annu. Rev. Cell Biol. 1993; 9:101–128.[PubMed: 7506550]
Fu et al. Page 14
Sci Signal. Author manuscript; available in PMC 2012 June 6.
NIH
-PA Author Manuscript
NIH
-PA Author Manuscript
NIH
-PA Author Manuscript
26. Sprent J, Surh CD. Normal T cell homeostasis: the conversion of naive cells into memory-phenotype cells. Nat Immunol. 2011; 12:478–484. [PubMed: 21739670]
27. Liu KQ, Bunnell SC, Gurniak CB, Berg LJ. T cell receptor-initiated calcium release is uncoupledfrom capacitative calcium entry in Itk-deficient T cells. J. Exp. Med. 1998; 187:1721–1727.[PubMed: 9584150]
28. Suzuki H, Punt JA, Granger LG, Singer A. Asymmetric signaling requirements for thymocytecommitment to the CD4+ versus CD8+ T cell lineages: a new perspective on thymic commitmentand selection. Immunity. 1995; 2:413–425. [PubMed: 7719943]
29. Corbella P, Moskophidis D, Spanopoulou E, Mamalaki C, Tolaini M, Itano A, Lans D, BaltimoreD, Robey E, Kioussis D. Functional commitment to helper T cell lineage precedes positiveselection and is independent of T cell receptor MHC specificity. Immunity. 1994; 1:269–276.[PubMed: 7889414]
30. Sim B-C, Aftahi N, Reilly C, Bogen B, Schwartz RH, Gascoigne NRJ, Lo D. Thymic skewing ofthe CD4/CD8 ratio maps with the T-cell receptor α-chain locus. Curr. Biol. 1998; 8:701–704.[PubMed: 9637921]
31. Mecklenbrauker I, Saijo K, Zheng NY, Leitges M, Tarakhovsky A. Protein kinase Cδ controls self-antigen-induced B-cell tolerance. Nature. 2002; 416:860–865. [PubMed: 11976686]
32. Marsland BJ, Soos TJ, Spath G, Littman DR, Kopf M. Protein kinase Cθ is critical for thedevelopment of in vivo T helper (Th)2 cell but not Th1 cell responses. J Exp Med. 2004; 200:181–189. [PubMed: 15263025]
33. Sakowicz-Burkiewicz M, Nishanth G, Helmuth U, Drogemuller K, Busch DH, Utermohlen O,Naumann M, Deckert M, Schluter D. Protein kinase C-θ critically regulates the proliferation andsurvival of pathogen-specific T cells in murine listeriosis. J Immunol. 2008; 180:5601–5612.[PubMed: 18390745]
34. Berg-Brown NN, Gronski MA, Jones RG, Elford AR, Deenick EK, Odermatt B, Littman DR,Ohashi PS. PKCθ signals activation versus tolerance in vivo. J Exp Med. 2004; 199:743–752.[PubMed: 15024044]
35. Marsland BJ, Nembrini C, Schmitz N, Abel B, Krautwald S, Bachmann MF, Kopf M. Innatesignals compensate for the absence of PKC-θ during in vivo CD8+ T cell effector and memoryresponses. Proc Natl Acad Sci U S A. 2005; 102:14374–14379. [PubMed: 16186501]
36. Fu G, Wijburg OL, Cameron PU, Price JD, Strugnell RA. Salmonella enterica SerovarTyphimurium infection of dendritic cells leads to functionally increased expression of themacrophage-derived chemokine. Infect Immun. 2005; 73:1714–1722. [PubMed: 15731072]
37. Fu G, Vallee S, Rybakin V, McGuire MV, Ampudia J, Brockmeyer C, Salek M, Fallen PR,Hoerter JAH, Munshi A, Huang YH, Hu J, Fox HS, Sauer K, Acuto O, Gascoigne NRJ. Themiscontrols thymocyte selection through regulation of T cell antigen receptor-mediated signaling. NatImmunol. 2009; 10:848–856. [PubMed: 19597499]
38. Fu G, Gascoigne NRJ. Multiplexed labeling of samples with cell tracking dyes facilitates rapid andaccurate internally controlled calcium flux measurement by flow cytometry. J Immunol Methods.2009; 350:194–199. [PubMed: 19647745]
39. Krieg C, Boyman O, Fu YX, Kaye J. B and T lymphocyte attenuator regulates CD8+ T cell-intrinsic homeostasis and memory cell generation. Nat Immunol. 2007; 8:162–171. [PubMed:17206146]
40. Lutz MB, Kukutsch N, Ogilvie AL, Rossner S, Koch F, Romani N, Schuler G. An advancedculture method for generating large quantities of highly pure dendritic cells from mouse bonemarrow. J Immunol Methods. 1999; 223:77–92. [PubMed: 10037236]
41. Campbell RE, Tour O, Palmer AE, Steinbach PA, Baird GS, Zacharias DA, Tsien RY. Amonomeric red fluorescent protein. Proc. Natl. Acad. Sci. USA. 2002; 99:7877–7882. [PubMed:12060735]
Fu et al. Page 15
Sci Signal. Author manuscript; available in PMC 2012 June 6.
NIH
-PA Author Manuscript
NIH
-PA Author Manuscript
NIH
-PA Author Manuscript

Fig. 1.Analysis of PKCη abundance and localization. (A) PKCη mRNA is increased in abundanceduring positive selection. PKCη mRNA abundance was determined by real-time RT-PCR.Results are shown as fold change compared to the amount of PKCη mRNA in OT-I TCRlo
cells. Data are representative of two experiments, each performed in duplicate. (B) PKCηrecruitment to the immunological synapse in the absence of PKCθ. To avoid potential crossreactivity of PKC-specific antibodies, we used thymocytes and mature T cells fromPKCθ−/− mice. After activation with superantigen-loaded LK35 cells, T cells or thymocyteswere incubated with antibodies against LFA-1 and the PKC isoforms (anti-PKCθ and anti-PKCη), after which they were incubated with antisera against rabbit immunoglobulin (Ig). Inthe merged image panel, LFA-1 staining is shown in green, whereas PKC staining is in red.The larger cells are LK35 cells and the smaller cells are T cells. Top and middle panelsshow thymocytes and the bottom panels show mature T cells, with corresponding en faceviews shown on the right. Data are representative of at least 50 cell-cell conjugates of each
Fu et al. Page 16
Sci Signal. Author manuscript; available in PMC 2012 June 6.
NIH
-PA Author Manuscript
NIH
-PA Author Manuscript
NIH
-PA Author Manuscript
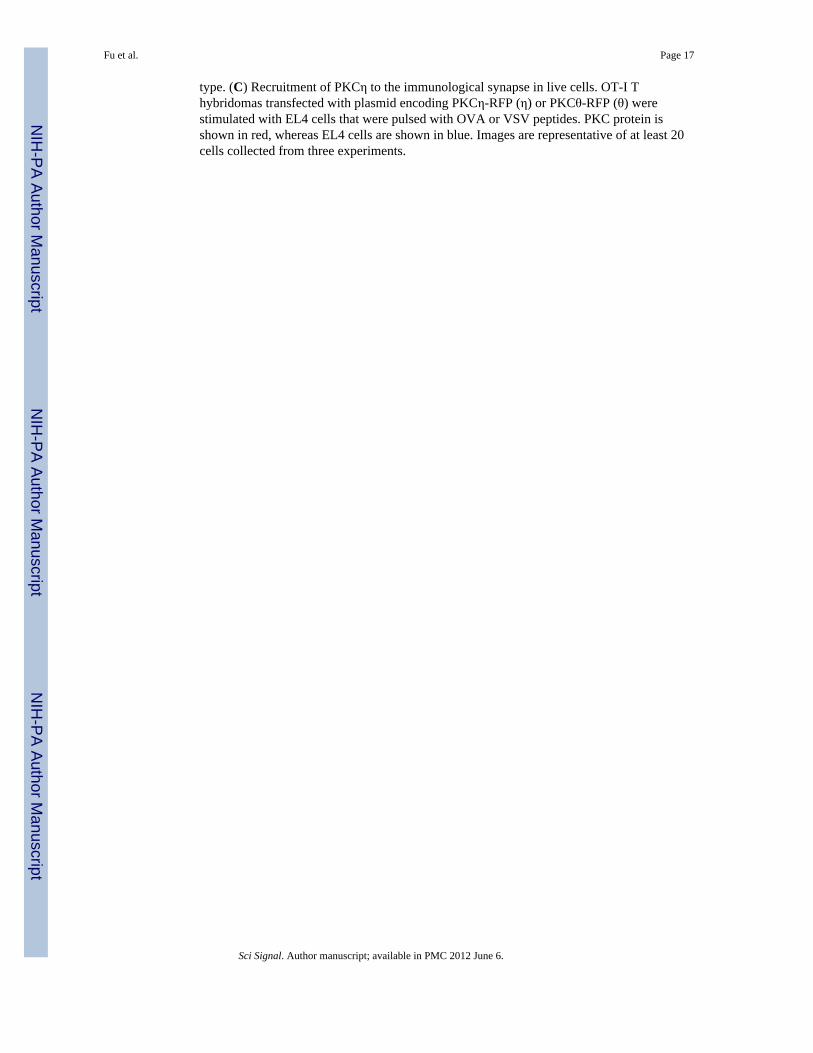
type. (C) Recruitment of PKCη to the immunological synapse in live cells. OT-I Thybridomas transfected with plasmid encoding PKCη-RFP (η) or PKCθ-RFP (θ) werestimulated with EL4 cells that were pulsed with OVA or VSV peptides. PKC protein isshown in red, whereas EL4 cells are shown in blue. Images are representative of at least 20cells collected from three experiments.
Fu et al. Page 17
Sci Signal. Author manuscript; available in PMC 2012 June 6.
NIH
-PA Author Manuscript
NIH
-PA Author Manuscript
NIH
-PA Author Manuscript

Fig. 2.Thymocyte development in PKCη−/− mice is normal. Thymocytes from age- and sex-matched wild-type (WT) (n = 8 mice) and PKCη−/− mice (ηKO, n = 8 mice) were analyzedfor the presence of (A) CD4−CD8− (DN) subsets, (B) CD4+ and CD8+ (DP, SP) and DNsubsets. Left: representative flow cytometry plots showing the mean percentages of eachsubset ± the standard deviation (SD). Right: mean total numbers of cells ± SD for eachsubset. P values were calculated by Student’s t test. *P ≤ 0.05; ***P ≤ 0.001. (C) Negativeselection of PKCη−/− thymocytes is normal. T cells expressing Vβ5, Vβ11, or Vβ12, but notVβ7, were deleted by endogenous mouse mammary tumor virus-encoded superantigens inmice that express I-E (H-2b/d) but not in mice lacking I-E (H-2b/b). PKCη−/− thymocytesbearing Vβ5, Vβ11, or Vβ12 were deleted similarly to wild-type thymocytes. Each dotrepresents a single mouse.
Fu et al. Page 18
Sci Signal. Author manuscript; available in PMC 2012 June 6.
NIH
-PA Author Manuscript
NIH
-PA Author Manuscript
NIH
-PA Author Manuscript

Fig. 3.PKCη−/− mice have enlarged lymph nodes. The mice analyzed in Fig. 2 were examined todetermine the phenotype of their peripheral T cells. (A) Lymph nodes from the cervical areawere photographed and are shown on the left; arrows indicate readily identifiable lymphnodes. On the right are axillar, brachial, and inguinal lymph nodes that were isolated frommice and aligned for comparison. (B) Total lymphocyte numbers from six pooled axillar,brachial, and inguinal lymph nodes are shown on the left, whereas total lymphocyte numbersfrom spleens are shown on the right. (C) Representative flow cytometry plots of lymphnodes (LNs) and spleens are shown with the proportion of each cell type listed as the mean ±SD. (D) Absolute cell numbers of the indicated subsets are listed for lymph nodes andspleen. For cell numbers, P values calculated by Student’s t test are shown as: *P ≤ 0.05;**P ≤ 0.01; ***P ≤ 0.001; NS, not significant, n=8 mice. Representative of 3 experiments.
Fu et al. Page 19
Sci Signal. Author manuscript; available in PMC 2012 June 6.
NIH
-PA Author Manuscript
NIH
-PA Author Manuscript
NIH
-PA Author Manuscript

Fig. 4.Proliferation of PKCη−/− mature T cells is impaired. (A) Naïve T cells were stimulated withantibody against CD3 or with PMA and ionomycin (P+I) for 64 hours, and 3H-thymidinewas added to the culture medium for the last 16 hours. Graph shows proliferation as meancounts per minute (CPM) of 3H incorporated into DNA ± SD of replicates (n ≥ 3). (B)Lymph node cells from WT (CD45.1+) and PKCη KO (CD45.2+) mice were mixed, labeledwith CFSE, and stimulated as indicated for 48 hours. Dilution of CFSE was analyzed byflow cytometry after gating for CD45 allotype and CD8. (C) OTI TCR Tg WT(CD45.2+Thy1.1+) and PKCη−/− or PKCθ−/− (both CD45.2+Thy1.2+) naïve T cells werepurified, mixed in a 1:1 ratio, labeled with CFSE, and stimulated with irradiated splenocytes(CD45.1+) that were pulsed with OVA peptide. After 48 hours, CFSE dilution was analyzedby flow cytometry. The percentages of undivided cells are indicated for two independentexperiments. (D) Antigen-specific proliferation of PKCη−/− T cells is impaired in vivo.Experiments were designed as depicted in the cartoon. Flow cytometry plots show theproportions of WT and KO donor cells that were present at the indicated times. (E)Proportions of WT and PKCη KO donor cells per recipient mouse spleen. (F) Proportions ofWT and PKCη KO cells within donor cell population. Each dot in (E) and (F) represents anindividual mouse. *P ≤ 0.05. Data are representative of three (A) or four (B) and (D to F)independent experiments.
Fu et al. Page 20
Sci Signal. Author manuscript; available in PMC 2012 June 6.
NIH
-PA Author Manuscript
NIH
-PA Author Manuscript
NIH
-PA Author Manuscript

Fig. 5.Impaired signaling in mature PKCη−/− T cells. (A, B) Increased abundance of activationmarkers. Lymph node cells were activated by stimulation with antibody against CD3 for 16hours, and the surface abundance of (A) CD25 and (B) CD69 was analyzed on CD8+ cellsby flow cytometry. The gray line indicates the basal abundance of these markers onnonstimulated cells, whereas the color-hatched region represents stimulated cells. CD25+
and CD69+ cell populations are marked and the mean percentages ± SD are shown. Theasterisk indicates statistically significant difference (by t test) between KO and WT mice (n= 3 mice); P = 0.05 for CD25 and P < 0.05 for CD69. (C and D) Analysis of Ca2+ signaling.Cells from WT (Thy1.1+) and PKCηKO (Thy1.2+) mice were mixed, loaded with Indo-1,and stimulated by crosslinking biotinylated antibody against CD3 (αCD3) with streptavidin(S.Av). Ca2+ flux was recorded by flow cytometry. (E and F) Imaging of the nucleartranslocation of NF-κB p65 protein. Purified CD8+ T cells were stimulated with antibodiesagainst CD3 (αCD3) and CD8 (αCD8) for 60 min, and the nuclear translocation of p65 wasdetermined by microscopy as shown in (E), and summarized in (F). (G and H) Examinationof the nuclear translocation of p65 by Western blotting analysis. Cells were stimulated asshown in (E and F), after which, cytosolic and nuclear extracts were prepared and subjectedto Western blotting analysis (G). Normalized data are shown (H). Data are representative oftwo (A, B, G, and H) or 4 (C to F) experiments.
Fu et al. Page 21
Sci Signal. Author manuscript; available in PMC 2012 June 6.
NIH
-PA Author Manuscript
NIH
-PA Author Manuscript
NIH
-PA Author Manuscript
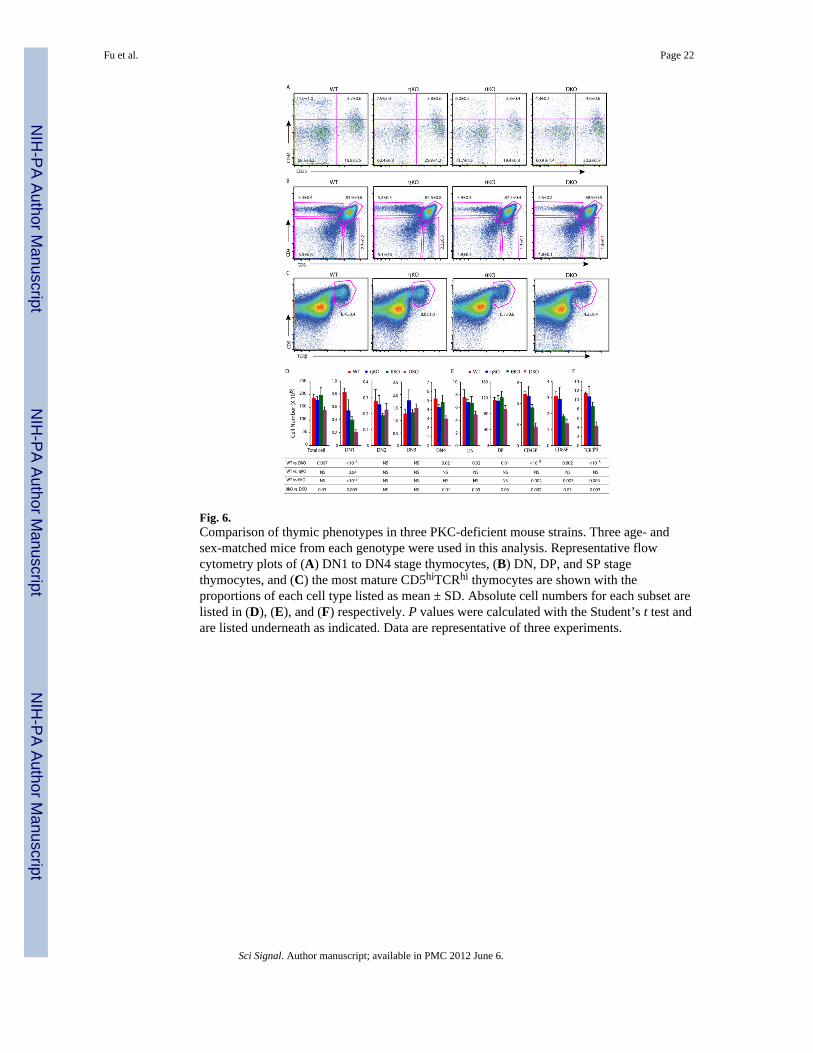
Fig. 6.Comparison of thymic phenotypes in three PKC-deficient mouse strains. Three age- andsex-matched mice from each genotype were used in this analysis. Representative flowcytometry plots of (A) DN1 to DN4 stage thymocytes, (B) DN, DP, and SP stagethymocytes, and (C) the most mature CD5hiTCRhi thymocytes are shown with theproportions of each cell type listed as mean ± SD. Absolute cell numbers for each subset arelisted in (D), (E), and (F) respectively. P values were calculated with the Student’s t test andare listed underneath as indicated. Data are representative of three experiments.
Fu et al. Page 22
Sci Signal. Author manuscript; available in PMC 2012 June 6.
NIH
-PA Author Manuscript
NIH
-PA Author Manuscript
NIH
-PA Author Manuscript
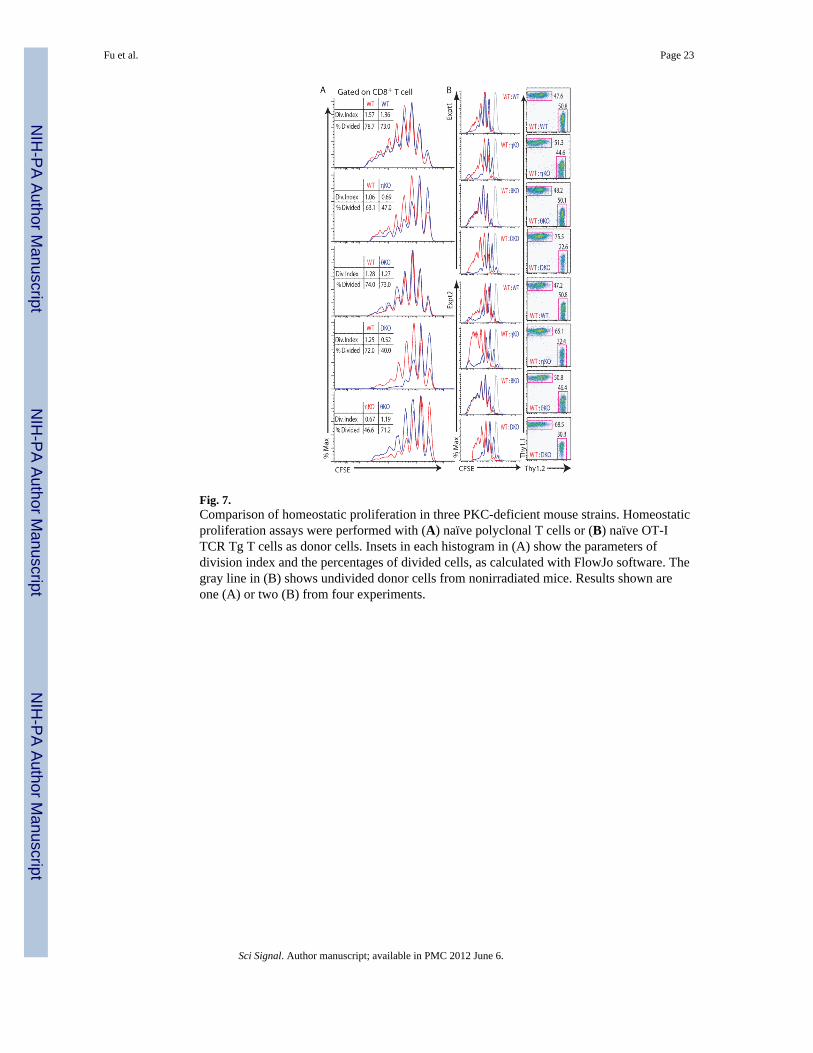
Fig. 7.Comparison of homeostatic proliferation in three PKC-deficient mouse strains. Homeostaticproliferation assays were performed with (A) naïve polyclonal T cells or (B) naïve OT-ITCR Tg T cells as donor cells. Insets in each histogram in (A) show the parameters ofdivision index and the percentages of divided cells, as calculated with FlowJo software. Thegray line in (B) shows undivided donor cells from nonirradiated mice. Results shown areone (A) or two (B) from four experiments.
Fu et al. Page 23
Sci Signal. Author manuscript; available in PMC 2012 June 6.
NIH
-PA Author Manuscript
NIH
-PA Author Manuscript
NIH
-PA Author Manuscript
NIH
-PA Author Manuscript
NIH
-PA Author Manuscript
NIH
-PA Author Manuscript
Fu et al. Page 24
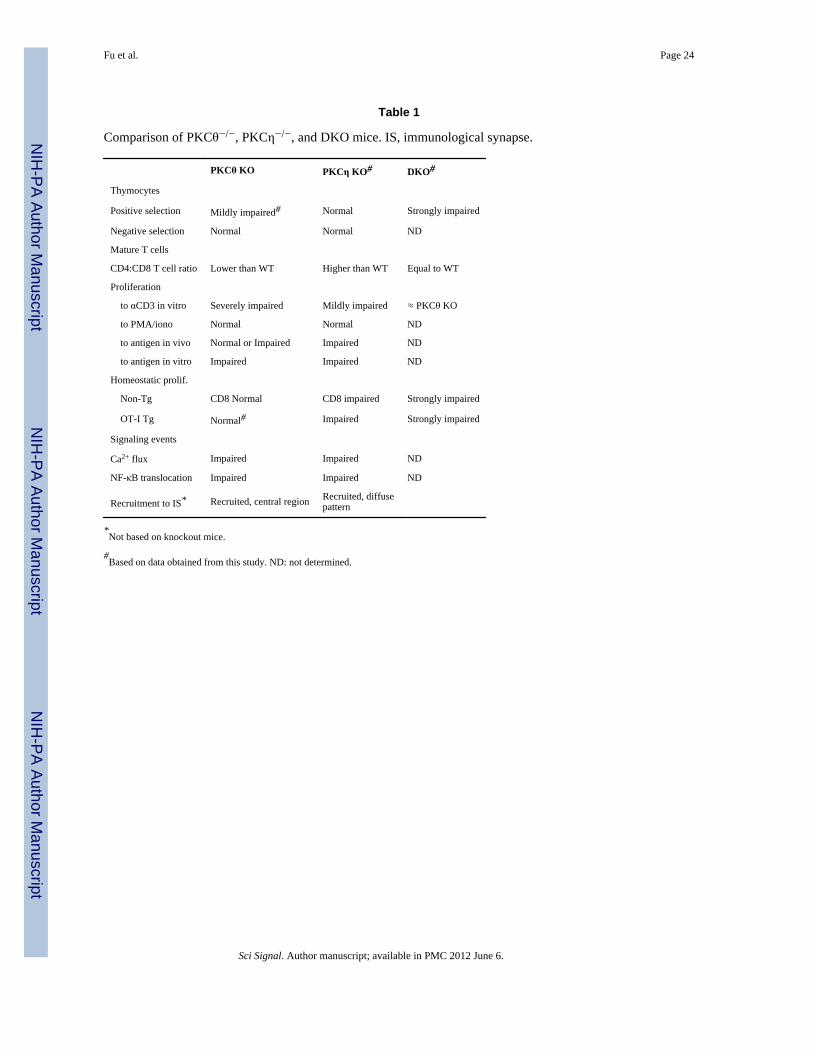
Table 1
Comparison of PKCθ−/−, PKCη−/−, and DKO mice. IS, immunological synapse.
PKCθ KO PKCη KO# DKO#
Thymocytes
Positive selection Mildly impaired# Normal Strongly impaired
Negative selection Normal Normal ND
Mature T cells
CD4:CD8 T cell ratio Lower than WT Higher than WT Equal to WT
Proliferation
to αCD3 in vitro Severely impaired Mildly impaired ≈ PKCθ KO
to PMA/iono Normal Normal ND
to antigen in vivo Normal or Impaired Impaired ND
to antigen in vitro Impaired Impaired ND
Homeostatic prolif.
Non-Tg CD8 Normal CD8 impaired Strongly impaired
OT-I Tg Normal# Impaired Strongly impaired
Signaling events
Ca2+ flux Impaired Impaired ND
NF-κB translocation Impaired Impaired ND
Recruitment to IS* Recruited, central region Recruited, diffusepattern
*Not based on knockout mice.
#Based on data obtained from this study. ND: not determined.
Sci Signal. Author manuscript; available in PMC 2012 June 6.
Copyright © 2022 FDOKUMEN