Protein coalitions in a core mammalian biochemical network linked by rapidly evolving proteins
13
RESEARCH ARTICLE Open Access Protein coalitions in a core mammalian biochemical network linked by rapidly evolving proteins Chrysanthi Ainali 1 , Michelle Simon 2 , Shiri Freilich 3 , Octavio Espinosa 2,4,5 , Lee Hazelwood 2 , Sophia Tsoka 1 , Christos A Ouzounis 1,6* and John M Hancock 2* Abstract Background: Cellular ATP levels are generated by glucose-stimulated mitochondrial metabolism and determine metabolic responses, such as glucose-stimulated insulin secretion (GSIS) from the b-cells of pancreatic islets. We describe an analysis of the evolutionary processes affecting the core enzymes involved in glucose-stimulated insulin secretion in mammals. The proteins involved in this system belong to ancient enzymatic pathways: glycolysis, the TCA cycle and oxidative phosphorylation. Results: We identify two sets of proteins, or protein coalitions, in this group of 77 enzymes with distinct evolutionary patterns. Members of the glycolysis, TCA cycle, metabolite transport, pyruvate and NADH shuttles have low rates of protein sequence evolution, as inferred from a human-mouse comparison, and relatively high rates of evolutionary gene duplication. Respiratory chain and glutathione pathway proteins evolve faster, exhibiting lower rates of gene duplication. A small number of proteins in the system evolve significantly faster than co-pathway members and may serve as rapidly evolving adapters, linking groups of co-evolving genes. Conclusions: Our results provide insights into the evolution of the involved proteins. We find evidence for two coalitions of proteins and the role of co-adaptation in protein evolution is identified and could be used in future research within a functional context. Background Eukaryotic organisms make use of complex biochemical pathways to maintain homeostatic processes in response to changes in their environment. These responses can be broadly divided into gene regulatory responses, whereby changes in an environmental condition give rise to changes in gene expression, and metabolic responses, which result from the responses of metabolic networks to environmental changes. Many metabolic adaptations to environmental changes are mediated by genetic regulation. Pancreatic b-cells are the cells responsible for insulin secretion in vertebrates and therefore play a key role in glucose homeostasis. It has been suggested that glucose homeostasis evolved to protect brains from hypo- and hyperglycaemic effects [1]. However, Diptera secrete insu- lin-like proteins and there is evidence for conservation of insulin signalling pathways [2] and a role in regulating glucose and trehalose levels in the haemolymph [3,4], sug- gesting that the insulin secretion and signalling pathways pre-date the origin of chordates and their complex, glu- cose-dependent brain physiology. The evolution of the pancreas and its b-cells is well studied and has been reviewed elsewhere [5]. Hagfish and lampreys have a pan- creas made up almost entirely of b-cells and the cell type itself is present in Amphioxus, a Cephalochordate, where it is associated with the intestinal tissue in a dispersed manner. Glucose-stimulated insulin secretion (GSIS) from the b-cells of pancreatic islets is a metabolic response that is critically dependent on cellular ATP levels gener- ated by glucose-stimulated mitochondrial metabolism. In * Correspondence: [email protected]; [email protected] 1 Centre for Bioinformatics, Department of Informatics, School of Natural and Mathematical Sciences, King’s College London, Strand, London WC2R 2LS, UK 2 Bioinformatics Group, MRC Harwell, Harwell Science and Innovation Campus, Oxfordshire OX11 0RD, UK Full list of author information is available at the end of the article Ainali et al. BMC Evolutionary Biology 2011, 11:142 http://www.biomedcentral.com/1471-2148/11/142 © 2011 Ainali et al; licensee BioMed Central Ltd. This is an Open Access article distributed under the terms of the Creative Commons Attribution License (http://creativecommons.org/licenses/by/2.0), which permits unrestricted use, distribution, and reproduction in any medium, provided the original work is properly cited.
Transcript of Protein coalitions in a core mammalian biochemical network linked by rapidly evolving proteins

RESEARCH ARTICLE Open Access
Protein coalitions in a core mammalianbiochemical network linked by rapidly evolvingproteinsChrysanthi Ainali1, Michelle Simon2, Shiri Freilich3, Octavio Espinosa2,4,5, Lee Hazelwood2, Sophia Tsoka1,Christos A Ouzounis1,6* and John M Hancock2*
Abstract
Background: Cellular ATP levels are generated by glucose-stimulated mitochondrial metabolism and determinemetabolic responses, such as glucose-stimulated insulin secretion (GSIS) from the b-cells of pancreatic islets. Wedescribe an analysis of the evolutionary processes affecting the core enzymes involved in glucose-stimulatedinsulin secretion in mammals. The proteins involved in this system belong to ancient enzymatic pathways:glycolysis, the TCA cycle and oxidative phosphorylation.
Results: We identify two sets of proteins, or protein coalitions, in this group of 77 enzymes with distinctevolutionary patterns. Members of the glycolysis, TCA cycle, metabolite transport, pyruvate and NADH shuttles havelow rates of protein sequence evolution, as inferred from a human-mouse comparison, and relatively high rates ofevolutionary gene duplication. Respiratory chain and glutathione pathway proteins evolve faster, exhibiting lowerrates of gene duplication. A small number of proteins in the system evolve significantly faster than co-pathwaymembers and may serve as rapidly evolving adapters, linking groups of co-evolving genes.
Conclusions: Our results provide insights into the evolution of the involved proteins. We find evidence for twocoalitions of proteins and the role of co-adaptation in protein evolution is identified and could be used in futureresearch within a functional context.
BackgroundEukaryotic organisms make use of complex biochemicalpathways to maintain homeostatic processes in responseto changes in their environment. These responses can bebroadly divided into gene regulatory responses, wherebychanges in an environmental condition give rise tochanges in gene expression, and metabolic responses,which result from the responses of metabolic networks toenvironmental changes. Many metabolic adaptations toenvironmental changes are mediated by genetic regulation.Pancreatic b-cells are the cells responsible for insulin
secretion in vertebrates and therefore play a key role in
glucose homeostasis. It has been suggested that glucosehomeostasis evolved to protect brains from hypo- andhyperglycaemic effects [1]. However, Diptera secrete insu-lin-like proteins and there is evidence for conservation ofinsulin signalling pathways [2] and a role in regulatingglucose and trehalose levels in the haemolymph [3,4], sug-gesting that the insulin secretion and signalling pathwayspre-date the origin of chordates and their complex, glu-cose-dependent brain physiology. The evolution of thepancreas and its b-cells is well studied and has beenreviewed elsewhere [5]. Hagfish and lampreys have a pan-creas made up almost entirely of b-cells and the cell typeitself is present in Amphioxus, a Cephalochordate, where itis associated with the intestinal tissue in a dispersedmanner.Glucose-stimulated insulin secretion (GSIS) from
the b-cells of pancreatic islets is a metabolic responsethat is critically dependent on cellular ATP levels gener-ated by glucose-stimulated mitochondrial metabolism. In
* Correspondence: [email protected]; [email protected] for Bioinformatics, Department of Informatics, School of Natural andMathematical Sciences, King’s College London, Strand, London WC2R 2LS,UK2Bioinformatics Group, MRC Harwell, Harwell Science and InnovationCampus, Oxfordshire OX11 0RD, UKFull list of author information is available at the end of the article
Ainali et al. BMC Evolutionary Biology 2011, 11:142http://www.biomedcentral.com/1471-2148/11/142
© 2011 Ainali et al; licensee BioMed Central Ltd. This is an Open Access article distributed under the terms of the Creative CommonsAttribution License (http://creativecommons.org/licenses/by/2.0), which permits unrestricted use, distribution, and reproduction inany medium, provided the original work is properly cited.

pancreatic b-cells, ATP production is proportional to glu-cose uptake by the cell, which in turn is proportional tothe glucose concentration in the surrounding body fluids[6]. A complex network of reactions in both the cytoplasmand the mitochondrion modulates ATP production. Werecently described a kinetic model of the biochemical pro-cesses leading from glucose uptake to ATP production inthis cell type [7]. Many of the components in this bio-chemical network are ancient enzymes with evolutionaryorigins in bacteria and therefore predate the invention ofpancreatic b-cells. Here we consider the evolution of thecomponents of this system as an example of an element ofcore cellular biochemistry that is also used for a cell-type-specific function.There have been evolutionary studies of certain indivi-
dual components of the GSIS system. Phylogenetic ana-lysis of metabolic evolution [8,9] suggests that the TCAcycle may have evolved in at least two steps: an initialphase, in which the synthesis of oxaloacetate from oxo-glutarate occurred but in which the cycle was notclosed, followed by closure of the cycle after the accu-mulation of atmospheric oxygen. Linkage of glycolysisto the TCA cycle took place at approximately the sametime as completion of the cycle itself. It has been sug-gested that many bacterial genomes lack a completeTCA cycle, which in turn might suggest the use of alter-native pathways in different lineages [10]. Glycolysis hasbeen well studied, most recently in the context of wholegenome duplications [11]. In that context, duplicationswere identified at the root of the vertebrate tree formost of the glycolytic enzymes. The exceptions to thiswere triosephosphate isomerase and phosphoglucoseisomerase, which only showed evidence of duplication infish [11]. Another study has considered the evolution of78 nuclearly encoded oxidative phosphorylation genesand demonstrated that gene duplicates were relativelyrare in these gene families [12]. Despite these studies,no integrated study of this system has been carried out.Numerous forces can act on the evolution of meta-
bolic pathways such as the GSIS network, includingpressures affecting evolutionary rate in a systematicmanner, gene duplication, positive and purifying selec-tion, or gene expression [13]. Additionally, genes can becategorized by phylogenetic age, corresponding to theevolutionary distance over which homologues can bedetected [14]. Here, we consider the effects of these var-ious influences on the recent evolution of the entireGSIS system, allowing us to consider differences andsimilarities between its component parts. We find evi-dence for two coalitions of proteins, corresponding togroups of biochemical pathways, which appear to havecoevolved both in divergence rate and duplication his-tory. We also identify some rapidly evolving proteinswhich appear to form the interfaces between the
detected protein coalitions, perhaps acting as evolution-ary “adapters”.
ResultsThe 48 reactions identified in the GSIS model of core pan-creatic b-cell biochemistry are catalysed by a minimum of77 protein components based on current biochemicalknowledge [7]. This biochemical network includes a num-ber of large macromolecular complexes including thecytochrome c oxidase complex (complex IV; 10 compo-nents) and the NADH:ubiquinone oxidoreductase com-plex (complex I; 9 components). On the other hand, forsome of the reactions in the network we were unable toidentify corresponding proteins. Most of these unidentifiedproteins are involved in metabolite transport across themitochondrial membrane and are likely to be unidentifiedmembrane proteins. In total, we were able to identify 69GSIS protein components whose evolution we couldstudy.
Antiquity of GSIS core genesTo characterise the evolutionary dynamics of the GSISsystem, we first considered the antiquity of the individualgenes that comprise it. Antiquity is defined as the taxo-nomic distance over which homologues of the mammaliangenes could be detected searching the COGENT database[15]. Using this process, we assigned each enzyme gene toone of four phylogenetic groups: Universal (U), Eukaryote-specific (E), Metazoan-specific (M) and Vertebrate-specific(V) [16]. Of the 69 enzyme genes assigned to phylogeneticcategories (Figure 1), 77% were classified as Universal, 17%as Eukaryotic, 3% as Metazoan and 3% as Vertebrate.
Figure 1 Phylogenetic classification of GSIS genes . Theproportions of genes in individual sub-pathways of the GSIS modelare compared with the proportions seen for all human proteins.Blue = Universal; Red = Eukaryotic; Green = Metazoan; Purple =Vertebrate.
Ainali et al. BMC Evolutionary Biology 2011, 11:142http://www.biomedcentral.com/1471-2148/11/142
Page 2 of 13

Comparison of the relative proportions of U, E, M and Vgenes in the GSIS network to the whole metabolic com-plement of the human genome (56%, 20%, 5%, 19%respectively - [17], Table 1) indicates that the GSIS systemcontains a higher proportion of U genes and fewer Vgenes. This difference is statistically significant, with a P-value < 0.002 (chi-squared, df = 3). When the assignmentof proteins to pathways is considered, there appear to beclear differences for different pathways. Most pathways arepredominantly Universal. However the respiratory chaincontains a mix of genes of different phylogenetic cate-gories and relatively few Universal ones (Figure 1).
The construction of phylogenetic profiles also allowedthe identification of human proteins that share homolo-gues in other genomes, indicating a history of ancientgene duplication. This analysis identified six protein clus-ters. The largest of these comprised the four isocitratedehydrogenases (IDHa, IDHg, IDHcp, IDHcc), whichshared 31 homologues in other genomes. Other groupsalso consisted of functionally related proteins: pyruvatedehydrogenase complex subunits (PDCc & PDCa; 207shared homologues), other dehydrogenases (MDH,LDHa, LDHb; 89 shared homologues), and superoxidedismutases (SOD2 m & SOD2e; 80 shared homologues).
Table 1 Proteins considered in this analysis
Protein (Abbreviation) PID (Hs)1 Path-way2 Class3 H-M4
Glucokinase (GK) P35557 G U 98.3
6-phosphofructokinase (F6P) P17858 G U 97.0
fructose-bisphosphate aldolase (A) (FBa) P04075 G U 98.9
fructose-bisphosphate aldolase (B) (FBb) P05062 G U 99.7
fructose-bisphosphate aldolase (C) (FBc) P09972 G U 98.6
glyceraldehyde 3-phosphate dehydrogenase (GAPD) P04406 G U 97.0
bisphosphoglycerate phosphatase (1) (PGP1) P18669 G U 99.6
bisphosphoglycerate phosphatase (2) (PGP2) P15259 G U 95.2
Pyruvate kinase (PK) P30613 G U 95.5
Lactate dehydrogenase A (LDHa) P00338 G U 97.6
Lactate dehydrogenase B (LDHb) P07195 G U 99.1
Pyruvate Dehydrogenase Complex A (PDCa) P08559 T U 99.5
Pyruvate Dehydrogenase Complex B (PDCb) P11177 T U 97.5
Pyruvate Dehydrogenase Complex C (PDCc) P29803 T U 87.2
Citrate Synthase (CS) O75390 T, P U 97.4
Aconitase (ACO) Q99798 T, P U 98.8
Isocitrate Dehydrogenase (NAD+) (A) (IDHa) P50213 T, P U 98.6
Isocitrate Dehydrogenase (NAD+) (G) (IDHg) P51553 T, P U 97.2
Oxoglutarate Dehydrogenase Complex (OGDC) Q02218 T U 94.1
Succinyl-CoA synthetase A (SCSa) P53597 T U 97.0
Succinyl-CoA synthetase B (SCSb) Q96I99 T U 96.1
Succinate Dehydrogenase A (SDHa) P31040 T U 94.0
Succinate Dehydrogenase B (SDHb) P21912 T U 97.0
Fumarase (FM) P07954 T, N U 95.3
Malate Dehydrogenase (mitochondrion & cytosol) (MDH) P40926 T, N U 97.6
Alanine Transaminase (AlaTA) P24298 N U 92.5
Aspartate Transaminase (AspTA) P00505 N U 98.4
Nucleoside Diphosphate Kinase (NDK) O00746 T U 87.8
NADH: Ubiquinone oxidoreductase 1 (MT-ND1) O15239 R E 92.9
NADH: Ubiquinone oxidoreductase 2 (MT-ND2) O43678 R E 93.9
NADH: Ubiquinone oxidoreductase 3 (MT-ND3) O95167 R E 88.1
NADH: Ubiquinone oxidoreductase 4 (MT-ND4) O00483 R E 92.7
NADH: Ubiquinone oxidoreductase 5 (MT-ND5) Q16718 R U 91.3
NADH: Ubiquinone oxidoreductase 6 (MT-ND6) P56556 R U 90.8
NADH: Ubiquinone oxidoreductase 7 (MT-ND7) O95182 R E 95.5
NADH: Ubiquinone oxidoreductase 8 (MT-ND8) P51970 R U 94.7
NADH: Ubiquinone oxidoreductase 9 (MT-ND9) Q16795 R U 87.3
Ubiquinol: Cytochrome c Oxidoreductase H (UQCRH) P08574 R U 92.3
Ainali et al. BMC Evolutionary Biology 2011, 11:142http://www.biomedcentral.com/1471-2148/11/142
Page 3 of 13

Two weaker linkages were also detected between lessobviously related proteins: ETF:Q oxidoreductase (ETF-QO) and glutathione reductase (GSSGR) (7 sharedhomologues) and pyruvate dehydrogenase subunit B(PDCb) and cytochrome c oxidase subunit 5A (Cox5A)(2 shared homologues). Searches of the Pfam database[18] identified common domain compositions underlyingmost of these relationships. IDHs all contain the Iso_dhdomain (PF00180), PDCs (a and c) contain the E1_dhdomain (PF00676), MDH and LDHs share two domains,Ldh_1_N (PF00056) and Ldh_1_C (PF02866) and theSODs share the Sod_Cu domain (PF00080). Structuralrelationships between the more weakly linked proteinswere less clear. ETF-QO and GSSGR both containdomains classified as part of the FAD/NAD(P)-bindingRossmann fold superfamily (CL0063) but no shared
domains were identified between PDCb and Cox5A,most likely indicating a false positive observation.
Sequence conservationThe preceding analysis indicates that a high proportionof GSIS proteins have been conserved over long periodsof evolutionary time. We therefore investigated whetherthis was reflected in their level of sequence conservation.We did this by measuring conservation between humanand mouse orthologues, as a proxy for the overall level ofevolutionary conservation. We used this pair of speciesbecause of the quality of their genome sequences andbecause their divergence time (c. 90 MYA) is shortenough that they will show relatively little mutationalsaturation. Of 77 enzyme genes for which we searchedfor human and mouse orthologues, we could identify 69
Table 1 Proteins considered in this analysis (Continued)
Ubiquinol: Cytochrome c Oxidoreductase I (UQCRI) P47985 R U 94.5
Ubiquinol: Cytochrome c Oxidoreductase Q (UQCRQ) O14949 R E 85.2
Ubiquinol: Cytochrome c Oxidoreductase R1 (UQCRR1) O14957 R M 92.7
Ubiquinol: Cytochrome c Oxidoreductase C2 (UQCRC2) P22695 R U 93.2
Cytochrome c Oxidase 6B1 (Cox6B1) P14854 R E 96.5
Cytochrome c Oxidase 2* (Cox2) P00403 R U 86.8
Cytochrome c Oxidase 8a (Cox8a) P10176 R V 85.5
Cytochrome c Oxidase 5A (Cox5a) P20674 R U 88.0
Cytochrome c Oxidase 4A (Cox4a) P13073 R E 89.9
Cytochrome c Oxidase 6C (Cox6c) P09669 R M 86.7
Cytochrome c Oxidase 7B (Cox7b) P24311 R V 88.8
Cytochrome c Oxidase 1* (Cox1) P00395 R U 95.5
Cytochrome c Oxidase 7R (Cox7r) O14548 R E 93.0
Cytochrome c Oxidase 7C (Cox7c) P15954 R E 88.9
Oxoglutarate Carrier (OGC) Q02978 N, P E 97.8
Citrate Carrier (CIC) P53007 M E 96.5
Nicotinamide nucleotide transhydrogenase (NNT) Q13423 S U 96.2
Glutathione reductase (GSSGR) P00390 S U 89.3
Glutathione peroxidase (GSSGP) P07203 S U 90.6
Glycerol-3-phosphate dehydrogenase (FAD dependent) (GUT2P) P43304 N U 97.0
Glycerol-3-phosphate dehydrogenase (NAD+) (G3PD) P21695 N U 96.8
Malate Dehydrogenase (oxaloacetate-decarboxylating) (NADP+) X (MEx) P48163 P U 94.9
Malate Dehydrogenase (oxaloacetate-decarboxylating)(NADP+) N (Men) Q16798 P U 96.4
ATP/ADP Carrier 2 (AAC) P05141 M U 99.3
cytosolic Isocitrate Dehydrogenase (NADP+) P (IDHcp) P48735 P U 82.0
cytosolic Isocitrate Dehydrogenase (NADP+) C (IDHcc) O75874 P U 97.8
Pyruvate Carboxylase (PC) P11498 T, P U 98.6
ETF:Q oxidoreductase (ETF-QO) Q16134 N U 95.8
Manganese-dependent superoxide dismutase 2 C (SOD2c) P00441 S U 88.9
Manganese-dependent superoxide dismutase 2 M (SOD2 m) P04179 S U 91.9
Manganese-dependent superoxide dismutase 2 E (SOD2e) P08294 S U 75.21 Uniprot Accession ID for the human protein.2 Pathway designation: G = glycolysis, T = TCA cycle, R = respiratory chain, N = NADH shuttle, P = pyruvate cycle, M = metabolite transport, S = glutathionepathway.3 Phylogenetic class.4 Human-mouse sequence similarity (%).
Ainali et al. BMC Evolutionary Biology 2011, 11:142http://www.biomedcentral.com/1471-2148/11/142
Page 4 of 13

orthologue pairs in the two species. As mentioned, themissing genes primarily reflect absence of knowledge ofthe identity of some membrane transporters in the sys-tem (see also Materials & Methods).We determined sequence similarity between these
orthologs at the protein level, as this is the most relevantmeasure for identifying functional conservation. Individualvalues for protein sequence similarity for each enzyme are
presented in Table 1 and summarised graphically in Figure2. Details of the GSIS biochemical network are given in [7]and the Additional File 1. The mean human-mouse con-servation across these proteins was 93.7% (standard devia-tion 4.9%), which is considerably greater than the widelyaccepted average of 85% [19], but there was significantvariability - the lowest conservation observed was 75.2%for Manganese-dependent superoxide dismutase 2E, while
Figure 2 Schematic representation of protein conservation in the GSIS biochemical network. Proteins are represented as circles withshading representing their level of sequence similarity between human and mouse (see Table 1). Darkly shaded proteins are most similar andlightly shaded proteins least similar. Five shades of grey are used to represent the five quintiles of the sequence similarity distribution. Proteinsare separated between cytoplasm, mitochondrial membrane and mitochondrial matrix, grouped together into sub-pathways and co-localised togive an approximate representation of their functional relationships.
Ainali et al. BMC Evolutionary Biology 2011, 11:142http://www.biomedcentral.com/1471-2148/11/142
Page 5 of 13
five proteins showed conservation of > 99%. Careful exam-ination of the alignments of the less conserved proteinsconfirmed that the low levels of conservation observed inthese proteins were not alignment artifacts. Three of thefive very highly conserved proteins, bisphosphoglyceratephosphatase (1), fructose-bisphosphate aldolase (A) andlactate dehydrogenase B, are components of the cytoplas-mic glycolysis pathway, which computational analysis sug-gests plays a critical role in controlling the activity of theGSIS network [7]. The other two, ATP/ADP carrier 2 andPyruvate Dehydrogenase Complex A, are proteins of themetabolite transport and TCA cycle pathways, which takeplace in mitochondria. The two mitochondrially encodedoxidative phosphorylation genes analysed here (Cox 1 &Cox 2) did not show lower conservation than the othergenes considered (mean 91.15%), consistent with previousobservations [20].To further characterise the distribution of conservation
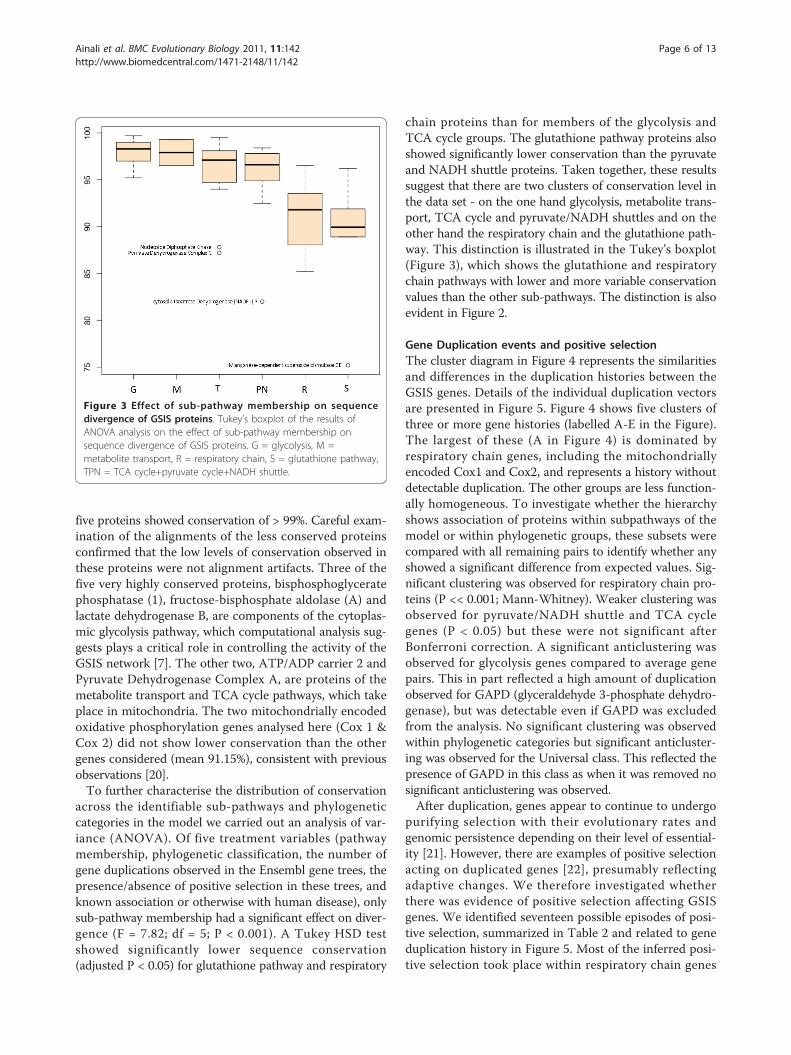
across the identifiable sub-pathways and phylogeneticcategories in the model we carried out an analysis of var-iance (ANOVA). Of five treatment variables (pathwaymembership, phylogenetic classification, the number ofgene duplications observed in the Ensembl gene trees, thepresence/absence of positive selection in these trees, andknown association or otherwise with human disease), onlysub-pathway membership had a significant effect on diver-gence (F = 7.82; df = 5; P < 0.001). A Tukey HSD testshowed significantly lower sequence conservation(adjusted P < 0.05) for glutathione pathway and respiratory
chain proteins than for members of the glycolysis andTCA cycle groups. The glutathione pathway proteins alsoshowed significantly lower conservation than the pyruvateand NADH shuttle proteins. Taken together, these resultssuggest that there are two clusters of conservation level inthe data set - on the one hand glycolysis, metabolite trans-port, TCA cycle and pyruvate/NADH shuttles and on theother hand the respiratory chain and the glutathione path-way. This distinction is illustrated in the Tukey’s boxplot(Figure 3), which shows the glutathione and respiratorychain pathways with lower and more variable conservationvalues than the other sub-pathways. The distinction is alsoevident in Figure 2.
Gene Duplication events and positive selectionThe cluster diagram in Figure 4 represents the similaritiesand differences in the duplication histories between theGSIS genes. Details of the individual duplication vectorsare presented in Figure 5. Figure 4 shows five clusters ofthree or more gene histories (labelled A-E in the Figure).The largest of these (A in Figure 4) is dominated byrespiratory chain genes, including the mitochondriallyencoded Cox1 and Cox2, and represents a history withoutdetectable duplication. The other groups are less function-ally homogeneous. To investigate whether the hierarchyshows association of proteins within subpathways of themodel or within phylogenetic groups, these subsets werecompared with all remaining pairs to identify whether anyshowed a significant difference from expected values. Sig-nificant clustering was observed for respiratory chain pro-teins (P << 0.001; Mann-Whitney). Weaker clustering wasobserved for pyruvate/NADH shuttle and TCA cyclegenes (P < 0.05) but these were not significant afterBonferroni correction. A significant anticlustering wasobserved for glycolysis genes compared to average genepairs. This in part reflected a high amount of duplicationobserved for GAPD (glyceraldehyde 3-phosphate dehydro-genase), but was detectable even if GAPD was excludedfrom the analysis. No significant clustering was observedwithin phylogenetic categories but significant anticluster-ing was observed for the Universal class. This reflected thepresence of GAPD in this class as when it was removed nosignificant anticlustering was observed.After duplication, genes appear to continue to undergo
purifying selection with their evolutionary rates andgenomic persistence depending on their level of essential-ity [21]. However, there are examples of positive selectionacting on duplicated genes [22], presumably reflectingadaptive changes. We therefore investigated whetherthere was evidence of positive selection affecting GSISgenes. We identified seventeen possible episodes of posi-tive selection, summarized in Table 2 and related to geneduplication history in Figure 5. Most of the inferred posi-tive selection took place within respiratory chain genes
Figure 3 Effect of sub-pathway membership on sequencedivergence of GSIS proteins. Tukey’s boxplot of the results ofANOVA analysis on the effect of sub-pathway membership onsequence divergence of GSIS proteins. G = glycolysis, M =metabolite transport, R = respiratory chain, S = glutathione pathway,TPN = TCA cycle+pyruvate cycle+NADH shuttle.
Ainali et al. BMC Evolutionary Biology 2011, 11:142http://www.biomedcentral.com/1471-2148/11/142
Page 6 of 13

and none within the glycolysis, TCA cycle and glu-tathione pathways. One respiratory chain gene, Cox4a,showed five inferred episodes of positive selection andalso underwent two inferred gene duplication eventswhich coincided approximately with one of these periodsof positive selection, being placed at the root of the Eute-leostomi c. 420 MYA. A second respiratory chain Coxgene, Cox7R, also showed coincident duplication andpositive selection, in this case at the root of the Catar-rhini 31 MYA (Table 2). To test the relationship betweenpurifying selection and gene duplication we carried outrank correlation analysis of divergence rate versus num-ber of duplications. This showed a significant positivecorrelation (r = 0.339; P = 0.004; 2-tailed) indicating thatin this system as elsewhere genes that are more con-served tend to have undergone more duplication [23].
Disease Association24 of the genes analysed here are associated with Men-delian diseases in the OMIM database (Table 3). Wefound no relationship between pathway membership,phylogenetic category and disease involvement in theANOVA analysis. We did however identify a deficit ofgenes that had undergone positive selection in the dis-ease class (P = 0.01, Chi squared, 1 DOF).
DiscussionThis study reveals a highly significant relationshipbetween pathway membership and human-mouse diver-gence in the GSIS system. The analysis indicated twocross-pathway clusters of divergence - a higher conser-vation cluster spanning glycolysis, the TCA cycle plusmetabolite transport and the components of the NADH
Figure 4 Similarity of gene duplication histories in the GSIS system. The cluster diagram is constructed from Euclidian distances betweenvectors of gene duplication history as described in the Materials and Methods. Gene names are coloured according to their phylogeneticclassification (red = Metazoan, orange = Universal, brown = Eukaryotic, green = Vertebrate). Coloured dots represent pathway membership asshown in the key. Red stars indicate genes inferred to have undergone at least one episode of positive selection, according to the Selectomedatabase (see Table 2 for more detail).
Ainali et al. BMC Evolutionary Biology 2011, 11:142http://www.biomedcentral.com/1471-2148/11/142
Page 7 of 13

shuttle and pyruvate cycle, and a lower conservationcluster comprising respiratory chain proteins and com-ponents of the glutathione pathway. All the genes con-sidered, with the exceptions of the mitochondriallyencoded Cox1 and Cox2 in Complex IV of the respira-tory chain, are encoded by the nuclear genome, so agenome effect did not play a role in this result. It shouldbe noted that, as we have considered protein similarityin these analyses, they cannot be used to directly inferdifferences of evolutionary rate at the DNA level as they
also include the influence of selection on proteinsequences.The results are consistent with those of Vinogradov
[13], who showed that the strongest predictor of thehuman-mouse divergence of a given protein was the evo-lutionary rate of coexpressed genes or members of thesame pathway. In the context of the metabolic processesstudied here, the two coevolving sets of proteins (or coa-litions [13]) we have observed correspond to the corebiochemistry of the system and the membrane-basedATP synthesis machinery, respectively. Previous workcomparing 12 Drosophila genomes has also suggestedthat core metabolic enzymes tend to evolve slowly [24].The similar rates of evolution in the glutathione pathwayand the ATP synthesis machinery may reflect coevolutionof these pathways. This would be explicable as the role ofthe glutathione pathway is to detoxify peroxide radicalsproduced by oxidative phosphorylation.We also observed a second, weaker coevolutionary
pattern than that of gene divergence within pathways.This was of evolutionary duplication within at leastsome of the pathways. Gene duplication is a classicmechanism of gene diversification which can be fol-lowed by functional diversification processes such assubfunctionalisation, neofunctionalisation and micro-functionalisation [25-27]. Thus, common patterns ofpreserved duplication during evolution may indicateresponses to common evolutionary pressures. The clus-ter diagram (Figure 4) shows five clusters of size n > 3with identical duplication histories. The largest of these,with 15 members (labelled A in Figure 4), predomi-nantly contains respiratory chain proteins from Com-plexes I and IV and includes Cox1 and Cox2. The other
Figure 5 Matrix of inferred gene duplications in the 69 GSISgenes. Events are taken from the Ensembl gene tree displays andbinned according to the taxonomic and date information giventhere. Bins with one or more inferred duplication are shaded, andnumbers of inferred duplications at a given taxonomic level aregiven. These values were included in the calculation of the clusterdiagram in Figure 4.
Table 2 Positive selection within GSIS
Protein Sub-Pathway Inferred node (approximate date)
MT-ND4 R Percomorpha (190 MYA)
MT-ND6 R Percomorpha
Catarrhini (31MYA)
MT-ND8 R Eutheria (102 MYA)
Tetrapoda (359 MYA)
UQCRC2 R Theria (166 MYA)
Tetrapoda
Clupeocephala (320 MYA)
Cox8A R Eutheria
Cox4A R Theria
Murinae (37 MYA)
Clupeocephala*
Euteleostomi (420 MYA)†
Cox7R R Catarrhini†
CIC M Eutheria
ETF-QO N Percomorpha
* Two episodes inferred; † Coincides with a duplication
Ainali et al. BMC Evolutionary Biology 2011, 11:142http://www.biomedcentral.com/1471-2148/11/142
Page 8 of 13

two large groups B and C (with seven and six memberseach, respectively) show less homogeneous composi-tions. Group A contains genes which show no identifi-able gene duplications as far back as the root of theirrespective gene family tree. This coincides with theobservation that oxidative phosphorylation genes tendto show an under-representation of gene duplication[12]. The second largest group, with 7 members,(labelled B in Figure 4) corresponds to genes whichunderwent a duplication at or around the origin of theEuteleostomi but have not undergone a duplication
since. Finally, the 6-member group (labelled C in Figure4) represents another group showing little duplication,this time since around the origin of the Bilateria (c. 580MYA). 40% of the GSIS proteins therefore show one ofthree common patterns of evolutionary duplication his-tory involving either no detectable duplication or a sin-gle duplication deep in the evolutionary past. Beyondthe presence of numerous respiratory chain proteins inthe large cluster, visual inspection does not reveal signif-icant clustering of pathway members or phylogeneticclass members in this cluster diagram. Statistical analysissupported this conclusion but did however show signifi-cant anticlustering of glycolysis proteins, i.e. glycolysisproteins show a more diverse pattern of clustering his-tory than average and this effect can be observed even ifglyceraldehyde-3-phosphate dehydrogenase (GAPD) isexcluded.GAPD showed very high frequencies of gene duplica-
tion throughout its recent evolutionary history, leadingto it being an outlier in Figure 4. Indeed, GAPD hasbeen identified with an exceedingly high number of pro-cessed pseudogenes in vertebrates and possibly it is thiswhich is reflected in its inferred duplication history [28];certainly Ensembl identified 75 duplicates of GAPD inrat and 16 in mouse, consistent with the over 300 pseu-dogenes identified in these species [28]. The reasons forthis high level of retrotransposition are not known, butmay reflect the wider non-glycolytic role of GAPD orsome as yet unidentified sequence feature of the GAPDcDNA sequence [28]. It has been suggested that non-pseudogene paralogs have been retained because of arole for GAPD in the bundling of microtubules andother cellular functions as well as functional diversifica-tion into testis- and muscle-specific forms [11].Gene duplication is usually considered to be followed
by a period of relaxed selection followed by the continua-tion of a regime of purifying selection [29]. The co-occur-rence of gene duplication with episodes of positiveselection would therefore be of interest in interpretingthe functional evolution of a gene. We observed two suchapparent co-occurrences: in Cox4A and Cox7R - bothcomponents of Complex IV of the respiratory chain.Cox4A is a transmembrane protein which binds ATPand mediates respiratory control by inhibiting cyto-chrome c oxidase activity at high intramitochondrialATP concentrations [30]. Cox4A showed both duplica-tion and positive selection at the base of the Euteleostomic. 420 MYA but also additional positive selection, in theabsence of gene duplication, on three separate occasions:in the fish lineage at the base of the Clupeocephala c. 320MYA and in the land vertebrates at the origin of Theria(c. 166 MYA) and murinae (c. 37 MYA). This rich historyof gene duplication suggests an important adaptive rolefor this gene. Cox7R, about which less is known but is
Table 3 GSIS genes with disease associations
Gene OMIMCode
Disease
GCK 125851 MODY, type II,
125853 Insulin resistance, susceptibility to,
602485 Hyperinsulinemic hypoglycemia, familial, 3
606176 Diabetes, permanent neonatal
FBa 229600 Fructose intolerance
FBc 611881 Glycogen storage disease XII
PGP2 261670 Glycogen storage disease X
PK 102900 Adenosine triphosphate, elevated, of erythrocytes
266200 Pyruvate kinase deficiency
PDCa 308930 Leigh syndrome, X-linked
312170 Pyruvate dehydrogenase deficiency
PDCb 312170 Pyruvate dehydrogenase deficiency
OGDC 203740 Alpha-ketoglutarate dehydrogenase deficiency
SCSa 245400 Lactic acidosis, fatal infantile
SDHa 115310 Paraganglioma, familial chromaffin, 4
171300 Pheochromocytoma, modifier of
606864 Paraganglioma and gastric stromal sarcoma
612359 Cowden-like syndrome
SDHb 252011 Mitochondrial respiratory chain complex IIdeficiency
256000 Leigh syndrome, due to Cox deficiency
FM 150800 Multiple cutaneous and uterine leiomyomata
605839 Leiomyomatosis and renal cell cancer
606812 Fumarase deficiency
MT-ND1
252010 Mitochondrial complex I deficiency
MT-ND2
256000 Leigh syndrome, due to Cox deficiency
UQCRQ 124000 Mitochondrial complex III deficiency
Cox6B1 220110 Mitochondrial complex IV deficiency
Cox2 220110 Mitochondrial complex IV deficiency
Cox1 220110 Mitochondrial complex IV deficiency
GUT2P 125853 Insulin resistance, susceptibility to
IDHcc 137800 Glioblastoma, susceptibility to
PC 266150 Pyruvate carboxylase deficiency
ETF-QO 231680 Glutaricaciduria, type IIC
SOD2c 105400 Amyotrophic lateral sclerosis, susceptibility to
SOD2m
612634 Microvascular complications of diabetes,susceptibility to
Ainali et al. BMC Evolutionary Biology 2011, 11:142http://www.biomedcentral.com/1471-2148/11/142
Page 9 of 13

also likely to be a regulatory subunit [30], underwentthree duplications including one near to the origin of theCatarrhini (c. 31 MYA) which was also accompanied byan episode of positive selection.These observations present us with two opposing views
of the evolution of GSIS proteins: high conservation ofcore biochemical pathways with higher divergence of therespiratory chain, but also restricted duplication ofrespiratory chain genes compared to core biochemistryproteins, especially glycolytic enzymes which show thehighest conservation. A correlation analysis showed a sig-nificant negative correlation between evolutionary diver-gence and numbers of gene duplications, although thisonly accounted for 11% of variance.It has been suggested that “older” genes tend to evolve
more slowly than “younger” ones [31] and there is evi-dence that newly-born duplicates evolve more rapidlythan unduplicated genes [29,32]. Vinogradov [13] alsoidentified gene age as an important correlate of diver-gence rate. In this analysis, we use phylogenetic categoryas a measure of gene age. Taken as a whole, the GSISnetwork is enriched in Universal genes that is, genes withdetectable homologues in bacteria, compared to thewhole metabolic complement of the human genome.This is consistent with the ancient nature of the bio-chemical pathways making up the system and with theslow evolution of the genes they contain. The glycolysispathway, which is most conserved at the sequence levelin human-mouse comparisons is, along with the glu-tathione pathway, also the richest in Universal genes. Therespiratory chain, which is the most rapidly evolving set,has a much higher content of “younger” genes. Therefore,a close relationship appears to exist between gene ageand evolutionary rate, with older genes evolving moreslowly, as suggested elsewhere [31]. However, as ancientbut rapidly evolving genes may be difficult or impossibleto detect by BLAST-based methods [33], the phyloge-netic categorization of genes used here may be stronglyinfluenced by the rates of evolution of individual genes,which would explain the association of Universal geneswith low human-mouse divergence. An additional possi-ble confounding effect is inhomogeneity in evolutionaryrate within proteins. Proteins which contain highly con-served cores interspersed with or flanked by highly vari-able sequences might show lower average conservationthan proteins accepting substitutions evenly throughouttheir length but remain detectable by BLAST because oftheir conserved core. This should not affect alignment-based measures of sequence similarity where the distribu-tion of conserved and non-conserved sites is immaterialbut could affect these BLAST-based methods and shouldbe investigated further.Unlike Vinogradov [13], we did not find any significant
relationship in ANOVA between phylogenetic category
and either human-mouse divergence (P = 0.46) or num-ber of gene duplications (P = 0.83) after accounting forpathway effects. This could reflect the smaller number ofcategories used in this analysis compared to the 12 usedby Vinogradov [13] or the smaller number of pathwaysstudied. Also, Vinogradov’s categorization is based onClusters of Orthologous Groups (COGs; [34]), which,although they are BLAST-based, make use of proteinrather than DNA BLASTs. We conclude that we cannotexclude influences of gene age on evolutionary ratealthough it does not provide a significant signal in thisanalysis.It has been suggested that disease genes tend to be
“ancient” [35]. Of the 24 disease genes in the GSIS sys-tem 20 are Universal, but the proportion of Universalgenes is not disproportionately high compared to theentire set of GSIS proteins (P = 0.68, Chi-square). Simi-larly, although disease genes in the GSIS system are onaverage more conserved than other genes (95.1% human-mouse similarity vs 93.1%), this difference is not statisti-cally significant (P = 0.07; t-test). Thus, while we cannotexclude the hypothesis that disease genes tend to be old,we cannot find strong support for it in our data set. Oneproperty that was observed in this set of disease geneswas a deficit of genes with a history of positive selection.This may be consistent with the suggestion that diseasegenes tend to be conserved as, by implication, theyshould also not have undergone accelerated evolution.Although the main feature of Figure 3 is the pathway-
dependent divergence of the GSIS proteins, it also identi-fies four clear outliers from three of the pathways: NDKand PDCc from the TCA cycle, IDHcp from the pyruvatecycle and SOD2e from the glutathione pathway. Threeand perhaps all of these lie at the points of interactionbetween subpathways of the GSIS network (see Addi-tional File 1 and Figure 2). NDK links to the output ofthe GSIS system, ATP production. It is activated byincreasing levels of ADP, which in turn up-regulates theTCA cycle. PDCc is found at a clear intersection betweenglycolysis and the TCA cycle and is involved in the pro-duction of Acetyl-CoA, regulated by NAD+ and CoA.The IDHcp intersection is less clear, but is one step inlinking the TCA cycle to glycolysis, and appears to beinvolved in regulating the pyruvate-malate equilibrium inthe cytosol. SOD2e is at a key step in the detoxificationof reactive oxygen species generated by the respiratorychain and creates the intersection with the glutathionepathway by converting O2
- to H2O2.Taken together, the picture we obtain from these ana-
lyses is that the GSIS system consists of two evolutionarycoalitions, each evolving in a concerted manner. Thesoluble enzymes carrying out core metabolic processes,particularly glycolysis and the TCA cycle, evolve slowlyat the sequence level but undergo a relatively high rate of
Ainali et al. BMC Evolutionary Biology 2011, 11:142http://www.biomedcentral.com/1471-2148/11/142
Page 10 of 13

gene duplication compared to the respiratory chain andglutathione pathway proteins, which evolve more rapidlybut undergo relatively little gene duplication. The glyco-lysis pathway, although highly conserved at the sequencelevel, displays a wider range of duplication histories thanother pathways. Steinke et al [11] analysed the patternsof gene duplication within the glycolysis pathway in somedetail and concluded that some of the pattern of duplica-tion seen in this pathway could be explained by diversifi-cation of tissues and the evolution of tissue-specificpatterns of expression following on from two suggestedgene duplication events (three in fish). However tissue-specific expression could not explain the complex patternof gene duplication and retention/loss in its entirety. Thehigh frequency of fixed duplications in the glycolysispathway may reflect the fact that it is the only cytoplas-mic pathway in the system. It may therefore need toadapt to a wider range of changes in other, interlinkedpathways than, for example, the TCA cycle, which maybe relatively protected from such pressures. In particular,glycolysis acts as the source of ATP in anaerobic respira-tion and so may adapt to the external availability of oxy-gen. It also appears to be used to drive DNA replicationand cell division as it is less damaging to DNA as it doesnot produce reactive oxygen species [36].Although our sample of positive selection may be
biased, most positive selection episodes appear to havetaken place in respiratory chain genes. The reason for themore rapid evolution of the respiratory chain genes isunknown, but it is worth noting that most of the proteinshere are nuclearly encoded proteins involved in the regu-lation of the function of the respiratory chain [30]. It maytherefore be that their rapid evolution reflects therequirement for fast adaptation of regulation of therespiratory chain in response to organismal pressures orto variations in the availability of oxygen. Some proteinsin the network show particularly high rates of evolutionand these tend to lie at the interfaces between recogniz-able pathways. These proteins may act as “adapters”,facilitating the interactions between different pathwayswhich may themselves evolve as units without coevolu-tion between pathways. Adapters may then need toevolve rapidly to accommodate the divergence betweenthe linked pathways.Most of the functions of the component pathways of
the GSIS network seem likely to have been conservedduring evolution. Despite this the system has accommo-dated changes through sequence evolution and geneduplication. While it will require more extensive func-tional analysis to characterise the pressures driving theevolution of this system, it appears that these pressureshave been accommodated in different ways by differentparts of the system, as detailed above.
ConclusionsThe GSIS system consists of two evolutionary coalitions,each evolving in a concerted manner. The solubleenzymes carrying out core metabolic processes evolveslowly at the sequence level but undergo a relativelyhigh rate of gene duplication compared to the respira-tory chain and glutathione pathway proteins, whichevolve more rapidly but undergo relatively little geneduplication. A small number of rapidly evolving proteinsmay represent evolutionary adapters, which mediate thedifferent evolutionary trajectories of the different sub-pathways.The comparative analysis of the GSIS network pro-
vides key insights into the evolution of the involved pro-teins that might be used in future research within afunctional context, by simulating the function of theentire network in health and disease [7]. Elements of thesystem undergoing positive selection, rapid evolutionmore broadly, or gene duplication should be investigatedfor functional differences between humans and modelorganisms.
MethodsData CollectionThe analysis is based on the components of a mathemati-cal model of the core biochemistry of mouse glucose-sti-mulated insulin secretion published previously [7],consisting of 77 enzymes. Of the 55 protein identifiers(IDs) listed in that model, 50 were included and theirhuman orthologues retrieved. The five remaining mouseproteins not considered here are: pyruvate carrier(Q4A5HQ1), isocitrate dehydrogenase NAD+ beta(O43837), phosphate carrier (Q00325), aspartate/gluta-mate carrier (Q59GB0) and ATP/ADP carrier (P12236).This set was then augmented by an additional 19 humanproteins, NADH:Ubiquinone oxidoreductase (9 compo-nents), ubiquinol:cytochrome c oxidoreductase (4 compo-nents), manganese-dependent superoxide dismutase 2(3 components), nicotinamide nucleotide transhydrogen-ase (Q13423), glutathione peroxidase (P07203) and ATP/ADP Carrier 2 (P05141). The resulting 69 mouse-humanorthologue pairs corresponding to components of the sys-tem were unambiguously identified using the Ensembldatabase (V52) [37]. As many of these are members ofgene families, they were curated manually to ensure thatthe correct gene was being analyzed. Orthologous pairs ofsequences were extracted from Swiss-Prot [38] based onunique identifiers (IDs) obtained from Ensembl. The set of69 proteins analysed is summarised in Table 1. Sequencepairs from human and mouse were aligned using EMBL-EBI Align using the Needleman-Wunsch global alignmentalgorithm [39] and the BLOSUM62 transition matrix [40].
Ainali et al. BMC Evolutionary Biology 2011, 11:142http://www.biomedcentral.com/1471-2148/11/142
Page 11 of 13

Pairwise sequence similarity values were then determinedand analysed.
Phylogenetic AssignmentPhylogenetic profiles [14] of human protein sequencesinvolved in GSIS were estimated using BLAST searches[41] against 243 fully sequenced genomes from theCOGENT database [42,43], including 197 Bacteria, 22Archaea and 24 Eukaryota species, using an E-value cut-off of 10 (12,083 hits, of which 11,925 hits, or 98.7% ofthe total, had an E-value < 1). The classification processwas non-hierarchical: proteins with hits to more than fiveprokaryote species are classified as universal [U]; theremaining proteins with at least a single hit to non-metazoan eukaryotes are classified as eukaryote-specific[E]; proteins with at least a single hit to non-mammalianmetazoa are classified as metazoan-specific [M]; and,finally, proteins recognizing only other vertebrate pro-teins are classified as vertebrate-specific [V]. All proteinswere classified into one of the above taxonomy classesusing the last update of this analysis in COGENT. Pro-files were also used to identify proteins with commonancestors in other genomes. These protein clusters werefurther analysed with reference to the Pfam database [44].
Duplication History and Divergence Time EstimatesGene trees obtained from Ensembl were screenedvisually for duplication events and used to constructduplication vectors for each gene. These vectors con-sisted of the number of duplications falling at nodeslabelled with particular times and taxon names inEnsembl (e.g. Clupeocephala, 320 MYA). Vectors wereonly extended to the point at which a duplication cre-ated a new gene family, to avoid confusion with selectiveforces acting on proteins with different functions, andnon-vertebrate duplications were excluded. Vectors weresubjected to hierarchical clustering using the R dist andhclust functions and Euclidian distances [45]. Euclidiandistances between subpathway members and betweenproteins classified into particular phylogenetic categorieswere compared with distances for all other pairwisecomparisons to identify groups differing significantlyfrom average in their degree of clustering, using theMann-Whitney test.
Selection Forces and Disease AssociationLineages showing evidence of positive selection wereidentified from the Selectome database [46] and con-firmed using the Codeml program in the Paml (Phyloge-netic Analysis by Maximum Likelihood) package [47].Disease associations of GSIS genes were determined byreference to the OMIM (Online Mendelian Inheritancein Man) database [48]. Statistical analysis was carriedout using the R environment [45].
Additional material
Additional file 1: Overview of the GSIS network. Reactions arerepresented as arrows (which may be uni- or bidirectional) and labelledin green v1 to v53 according to [7] which also provides a key toabbreviations. Metabolites are labelled in black. Enzymes catalysingreactions are labelled in brown.
AcknowledgementsThe authors thank EU-funded Enfin Network of Excellence (contract noLSHG-CT-2005-518254) and the UK Medical Research Council for financialsupport.
Author details1Centre for Bioinformatics, Department of Informatics, School of Natural andMathematical Sciences, King’s College London, Strand, London WC2R 2LS,UK. 2Bioinformatics Group, MRC Harwell, Harwell Science and InnovationCampus, Oxfordshire OX11 0RD, UK. 3The Blavatnik School of ComputerSciences & Sackler School of Medicine, Tel Aviv University, Ramat Aviv 69978,Israel. 4Department of Biochemistry, University of Oxford, UK, South ParksRoad, Oxford, OX1 3QU, UK. 5Institute of Cancer Research, Chester BeattieLaboratories, London SW3 6JB, UK. 6Computational Genomics Unit, Instituteof Agrobiotechnology, Centre for Research & Technology Hellas (CERTH), GR-57001 Thessalonica, Greece.
Authors’ contributionsCA and JMH designed the research and outlined the manuscript. CA, MS, SF,OE and LH performed the computational analysis. CA, MS, LH and JMHinterpreted the data. ST and CAO provided feedback on the results andcontributed in drafting the manuscript. CA and JMH wrote the paper. Allauthors read and approved the final manuscript.
Received: 16 December 2010 Accepted: 25 May 2011Published: 25 May 2011
References1. Rashidi A, Kirkwood TBL, Shanley DP: Metabolic evolution suggests an
explanation for the weakness of antioxidant defences in beta-cells. MechAgeing Dev 2009, 130:216-221.
2. Garofalo RS: Genetic analysis of insulin signaling in Drosophila. TrendsEndocrinol Metabolism 2002, 13:156-162.
3. Rulifson EJ, Kim SK, Nusse R: Ablation of insulin-producing neurons inflies: growth and diabetic phenotypes. Science 2002, 296:1118-1120.
4. Wu Q, Brown MR: Signaling and function of insulin-like peptides ininsects. Annu Rev Entomol 2006, 51:1-24.
5. Pieler T, Chen Y: Forgotten and novel aspects in pancreas development.Biol Cell 2006, 98:79-88.
6. Ashcroft F, Rorsman P: Type 2 diabetes mellitus: not quite excitingenough? Hum Mol Genet 2004, 13:R21-R31.
7. Jiang N, Cox RD, Hancock JM: A kinetic core model of the glucose-stimulated insulin secretion network of pancreatic beta cells. MammGenome 2007, 18:508-520.
8. Cunchillos C, Lecointre G: Integrating the universal metabolism into aphylogenetic analysis. Mol Biol Evol 2005, 22:1-11.
9. Cunchillos C, Lecointre G: Ordering events of biochemical evolution.Biochimie 2007, 89:555-573.
10. Huynen MA, Dandekar T, Bork P: Variation and evolution of the citric-acidcycle: a genomic perspective. Trends Microbiol 1999, 7:281-291.
11. Steinke D, Hoegg S, Brinkmann H, Meyer A: Three rounds (1R/2R/3R) ofgenome duplications and the evolution of the glycolytic pathway invertebrates. BMC Biology 2006, 4:16.
12. De Grassi A, Caggese C, D’Elia D, Lanave C, Pesole G, Saccone C: Evolution ofnuclearly encoded mitochondrial genes in Metazoa. Gene 2005, 354:181-188.
13. Vinogradov AE: Systemic factors dominate mammal protein evolution.Proc R Soc B 2010, 277:1403-1408.
14. Pellegrini M, Marcotte EM, Thompson MJ, Eisenberg D, Yeates TO:Assigning protein functions by comparative genome analysis: proteinphylogenetic profiles. Proc Natl Acad Sci USA 1999, 96:4285-4288.
Ainali et al. BMC Evolutionary Biology 2011, 11:142http://www.biomedcentral.com/1471-2148/11/142
Page 12 of 13

15. Janssen P, Enright AJ, Audit B, Cases I, Goldovsky L, Harte N, Kunin V,Ouzounis CA: COmplete GENome Tracking (COGENT): a flexible dataenvironment for computational genomics. Bioinformatics 2003,19:1451-1452.
16. Peregrin-Alvarez JM, Tsoka S, Ouzounis CA: The phylogenetic extent ofmetabolic enzymes and pathways. Genome Res 2003, 13:422-427.
17. Freilich S, Goldovsky L, Ouzounis CA, Thornton JM: Metabolic innovationstowards the human lineage. BMC Evol Biol 2008, 8:247.
18. Finn RD, Mistry J, Tate J, Coggill P, Heger A, Pollington JE, Gavin OL,Gunasekaran P, Ceric G, Forslund K, et al: The Pfam protein familiesdatabase. Nucleic Acids Res 2010, 38:D211-222.
19. Makalowski W, Zhang J, Boguski MS: Comparative analysis of 1196orthologous mouse and human full-length mRNA and proteinsequences. Genome Res 1996, 6:846-857.
20. Mueller RL: Evolutionary rates, divergence dates, and the performance ofmitochondrial genes in Bayesian phylogenetic analysis. Syst Biol 2006,55:289-300.
21. Shakhnovich BE, Koonin EV: Origins and impact of constraints inevolution of gene families. Genome Res 2006, 16:1529-1536.
22. Kondrashov FA, Kondrashov AS: Role of selection in fixation of geneduplications. J Theor Biol 2006, 239:141-151.
23. Jordan IK, Wolf YI, Koonin EV: Duplicated genes evolve slower thansingletons despite the initial rate increase. BMC Evol Biol 2004, 4:22.
24. Greenberg AJ, Stockwell SR, Clark AG: Evolutionary constraint andadaptation in the metabolic network of Drosophila. Mol Biol Evol 2008,25:2537-2546.
25. Hancock JM: Gene factories, microfunctionalization and the evolution ofgene families. Trends Genet 2005, 21:591-595.
26. Lynch M, Force A: The probability of duplicate gene preservation bysubfunctionalization. Genetics 2000, 154:459-473.
27. Lynch M, O’Hely M, Walsh B, Force A: The probability of preservation of anewly arisen gene duplicate. Genetics 2001, 159:1789-1804.
28. Liu YJ, Zheng D, Balasubramanian S, Carriero N, Khurana E, Robilotto R,Gerstein MB: Comprehensive analysis of the pseudogenes of glycolyticenzymes in vertebrates: the anomalously high number of GAPDHpseudogenes highlights a recent burst of retrotrans-positional activity.BMC Genomics 2009, 10:480.
29. Kondrashov FA, Rogozin IB, Wolf YI, Koonin EV: Selection in the evolutionof gene duplications. Genome Biol 2002, 3:RESEARCH0008.
30. Kadenbach B, Huttemann M, Arnold S, Lee I, Bender E: Mitochondrialenergy metabolism is regulated via nuclear-coded subunits ofcytochrome c oxidase. Free Radic Biol Med 2000, 29:211-221.
31. Alba MM, Castresana J: Inverse relationship between evolutionary rateand age of mammalian genes. Mol Biol Evol 2005, 22:598-606.
32. Lynch M, Conery JS: The evolutionary fate and consequences ofduplicate genes. Science 2000, 290:1151-1155.
33. Elhaik E, Sabath N, Graur D: The “inverse relationship betweenevolutionary rate and age of mammalian genes” is an artifact ofincreased genetic distance with rate of evolution and time ofdivergence. Mol Biol Evol 2006, 23:1-3.
34. Tatusov RL, Fedorova ND, Jackson JD, Jacobs AR, Kiryutin B, Koonin EV,Krylov DM, Mazumder R, Mekhedov SL, Nikolskaya AN, et al: The COGdatabase: an updated version includes eukaryotes. BMC Bioinformatics2003, 4:41.
35. Domazet-Loso T, Tautz D: An ancient evolutionary origin of genesassociated with human genetic diseases. Mol Biol Evol 2008, 25:2699-2707.
36. Chen Z, Odstrcil EA, Tu BP, McKnight SL: Restriction of DNA replication tothe reductive phase of the metabolic cycle protects genome integrity.Science 2007, 316:1916-1919.
37. Flicek P, Aken BL, Ballester B, Beal K, Bragin E, Brent S, Chen Y, Clapham P,Coates G, Fairley S, et al: Ensembl’s 10th year. Nucleic Acids Res 2010, 38:D557-562.
38. Uniprot Consortium: The Universal Protein Resource (UniProt) in 2010.Nucleic Acids Res 2010, 38:D142-148.
39. Needleman SB, Wunsch CD: A general method applicable to the searchfor similarities in the amino acid sequence of two proteins. J Mol Biol1970, 48:443-453.
40. Henikoff S, Henikoff JG: Performance evaluation of amino acidsubstitution matrices. Proteins 1993, 17:49-61.
41. Altschul SF, Gish W, Miller W, Myers EW, Lipman DJ: Basic local alignmentsearch tool. J Mol Biol 1990, 215:403-410.
42. Janssen P, Audit B, Cases I, Darzentas N, Goldovsky L, Kunin V, Lopez-Bigas N, Peregrin-Alvarez JM, Pereira-Leal JB, Tsoka S, et al: Beyond 100genomes. Genome Biol 2003, 4:402.
43. Goldovsky L, Janssen P, Ahren D, Audit B, Cases I, Darzentas N, Enright AJ,Lopez-Bigas N, Peregrin-Alvarez JM, Smith M, et al: CoGenT++: anextensive and extensible data environment for computational genomics.Bioinformatics 2005, 21:3806-3810.
44. Finn RD, Mistry J, Tate J, Coggill P, Heger A, Pollington JE, Gavin OL,Gunasekaran P, Ceric G, Forslund K, et al: The Pfam protein familiesdatabase. Nucleic Acids Res 2010, 38:D211-222.
45. R Development Core Team: R: A language and environment for statisticalcomputing. Vienna, Austria: R Foundation for Statistical Computing; 2005.
46. Proux E, Studer RA, Moretti S, Robinson-Rechavi M: Selectome: a databaseof positive selection. Nucleic Acids Res 2009, 37:D404-407.
47. Yang Z: PAML 4: phylogenetic analysis by maximum likelihood. Mol BiolEvol 2007, 24:1586-1591.
48. Amberger J, Bocchini CA, Scott AF, Hamosh A: McKusick’s OnlineMendelian Inheritance in Man (OMIM). Nucleic Acids Res 2009, 37:D793-796.
doi:10.1186/1471-2148-11-142Cite this article as: Ainali et al.: Protein coalitions in a core mammalianbiochemical network linked by rapidly evolving proteins. BMCEvolutionary Biology 2011 11:142.
Submit your next manuscript to BioMed Centraland take full advantage of:
• Convenient online submission
• Thorough peer review
• No space constraints or color figure charges
• Immediate publication on acceptance
• Inclusion in PubMed, CAS, Scopus and Google Scholar
• Research which is freely available for redistribution
Submit your manuscript at www.biomedcentral.com/submit
Ainali et al. BMC Evolutionary Biology 2011, 11:142http://www.biomedcentral.com/1471-2148/11/142
Page 13 of 13