Proposed Rules - Govinfo.gov
25
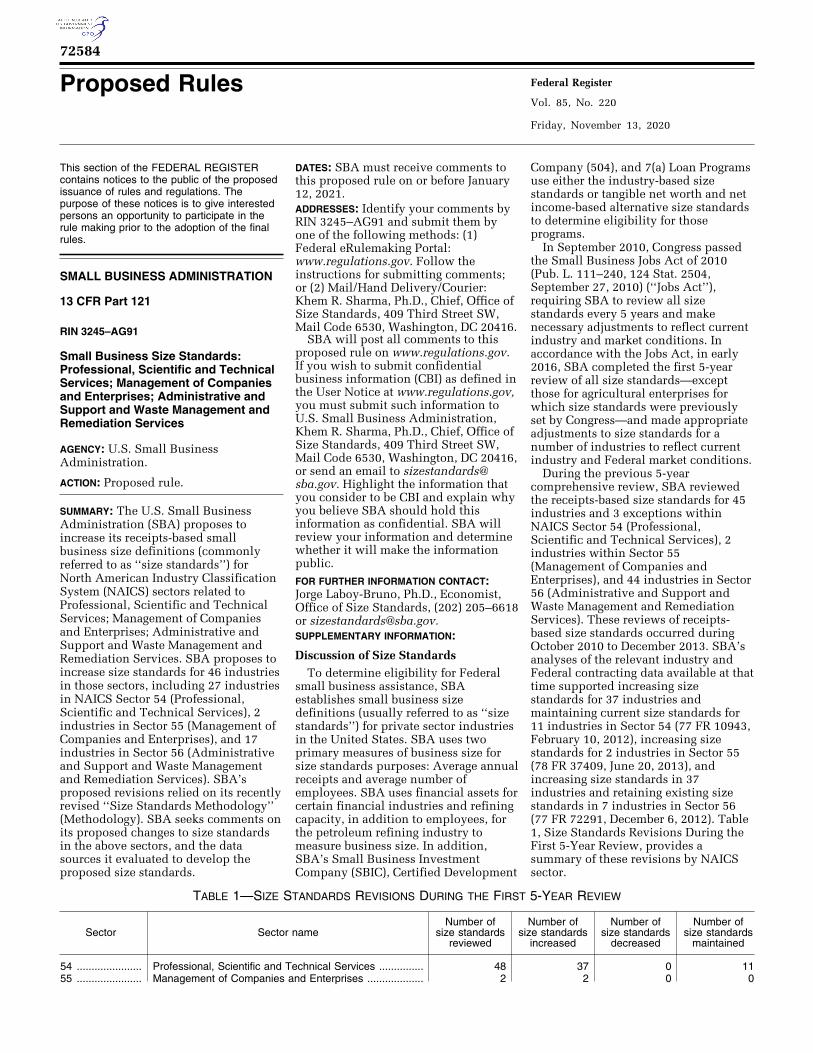
This section of the FEDERAL REGISTER contains notices to the public of the proposed issuance of rules and regulations. The purpose of these notices is to give interested persons an opportunity to participate in the rule making prior to the adoption of the final rules. Proposed Rules Federal Register 72584 Vol. 85, No. 220 Friday, November 13, 2020 SMALL BUSINESS ADMINISTRATION 13 CFR Part 121 RIN 3245–AG91 Small Business Size Standards: Professional, Scientific and Technical Services; Management of Companies and Enterprises; Administrative and Support and Waste Management and Remediation Services AGENCY: U.S. Small Business Administration. ACTION: Proposed rule. SUMMARY: The U.S. Small Business Administration (SBA) proposes to increase its receipts-based small business size definitions (commonly referred to as ‘‘size standards’’) for North American Industry Classification System (NAICS) sectors related to Professional, Scientific and Technical Services; Management of Companies and Enterprises; Administrative and Support and Waste Management and Remediation Services. SBA proposes to increase size standards for 46 industries in those sectors, including 27 industries in NAICS Sector 54 (Professional, Scientific and Technical Services), 2 industries in Sector 55 (Management of Companies and Enterprises), and 17 industries in Sector 56 (Administrative and Support and Waste Management and Remediation Services). SBA’s proposed revisions relied on its recently revised ‘‘Size Standards Methodology’’ (Methodology). SBA seeks comments on its proposed changes to size standards in the above sectors, and the data sources it evaluated to develop the proposed size standards. DATES: SBA must receive comments to this proposed rule on or before January 12, 2021. ADDRESSES: Identify your comments by RIN 3245–AG91 and submit them by one of the following methods: (1) Federal eRulemaking Portal: www.regulations.gov. Follow the instructions for submitting comments; or (2) Mail/Hand Delivery/Courier: Khem R. Sharma, Ph.D., Chief, Office of Size Standards, 409 Third Street SW, Mail Code 6530, Washington, DC 20416. SBA will post all comments to this proposed rule on www.regulations.gov. If you wish to submit confidential business information (CBI) as defined in the User Notice at www.regulations.gov, you must submit such information to U.S. Small Business Administration, Khem R. Sharma, Ph.D., Chief, Office of Size Standards, 409 Third Street SW, Mail Code 6530, Washington, DC 20416, or send an email to sizestandards@ sba.gov. Highlight the information that you consider to be CBI and explain why you believe SBA should hold this information as confidential. SBA will review your information and determine whether it will make the information public. FOR FURTHER INFORMATION CONTACT: Jorge Laboy-Bruno, Ph.D., Economist, Office of Size Standards, (202) 205–6618 or [email protected]. SUPPLEMENTARY INFORMATION: Discussion of Size Standards To determine eligibility for Federal small business assistance, SBA establishes small business size definitions (usually referred to as ‘‘size standards’’) for private sector industries in the United States. SBA uses two primary measures of business size for size standards purposes: Average annual receipts and average number of employees. SBA uses financial assets for certain financial industries and refining capacity, in addition to employees, for the petroleum refining industry to measure business size. In addition, SBA’s Small Business Investment Company (SBIC), Certified Development Company (504), and 7(a) Loan Programs use either the industry-based size standards or tangible net worth and net income-based alternative size standards to determine eligibility for those programs. In September 2010, Congress passed the Small Business Jobs Act of 2010 (Pub. L. 111–240, 124 Stat. 2504, September 27, 2010) (‘‘Jobs Act’’), requiring SBA to review all size standards every 5 years and make necessary adjustments to reflect current industry and market conditions. In accordance with the Jobs Act, in early 2016, SBA completed the first 5-year review of all size standards—except those for agricultural enterprises for which size standards were previously set by Congress—and made appropriate adjustments to size standards for a number of industries to reflect current industry and Federal market conditions. During the previous 5-year comprehensive review, SBA reviewed the receipts-based size standards for 45 industries and 3 exceptions within NAICS Sector 54 (Professional, Scientific and Technical Services), 2 industries within Sector 55 (Management of Companies and Enterprises), and 44 industries in Sector 56 (Administrative and Support and Waste Management and Remediation Services). These reviews of receipts- based size standards occurred during October 2010 to December 2013. SBA’s analyses of the relevant industry and Federal contracting data available at that time supported increasing size standards for 37 industries and maintaining current size standards for 11 industries in Sector 54 (77 FR 10943, February 10, 2012), increasing size standards for 2 industries in Sector 55 (78 FR 37409, June 20, 2013), and increasing size standards in 37 industries and retaining existing size standards in 7 industries in Sector 56 (77 FR 72291, December 6, 2012). Table 1, Size Standards Revisions During the First 5-Year Review, provides a summary of these revisions by NAICS sector. TABLE 1—SIZE STANDARDS REVISIONS DURING THE FIRST 5-YEAR REVIEW Sector Sector name Number of size standards reviewed Number of size standards increased Number of size standards decreased Number of size standards maintained 54 ...................... Professional, Scientific and Technical Services ............... 48 37 0 11 55 ...................... Management of Companies and Enterprises ................... 2 2 0 0 VerDate Sep<11>2014 16:23 Nov 12, 2020 Jkt 253001 PO 00000 Frm 00001 Fmt 4702 Sfmt 4702 E:\FR\FM\13NOP1.SGM 13NOP1 jbell on DSKJLSW7X2PROD with PROPOSALS
-
Upload
khangminh22 -
Category
Documents
-
view
0 -
download
0
Transcript of Proposed Rules - Govinfo.gov
This section of the FEDERAL REGISTERcontains notices to the public of the proposedissuance of rules and regulations. Thepurpose of these notices is to give interestedpersons an opportunity to participate in therule making prior to the adoption of the finalrules.
Proposed Rules Federal Register
72584
Vol. 85, No. 220
Friday, November 13, 2020
SMALL BUSINESS ADMINISTRATION
13 CFR Part 121
RIN 3245–AG91
Small Business Size Standards: Professional, Scientific and Technical Services; Management of Companies and Enterprises; Administrative and Support and Waste Management and Remediation Services
AGENCY: U.S. Small Business Administration.
ACTION: Proposed rule.
SUMMARY: The U.S. Small Business Administration (SBA) proposes to increase its receipts-based small business size definitions (commonly referred to as ‘‘size standards’’) for North American Industry Classification System (NAICS) sectors related to Professional, Scientific and Technical Services; Management of Companies and Enterprises; Administrative and Support and Waste Management and Remediation Services. SBA proposes to increase size standards for 46 industries in those sectors, including 27 industries in NAICS Sector 54 (Professional, Scientific and Technical Services), 2 industries in Sector 55 (Management of Companies and Enterprises), and 17 industries in Sector 56 (Administrative and Support and Waste Management and Remediation Services). SBA’s proposed revisions relied on its recently revised ‘‘Size Standards Methodology’’ (Methodology). SBA seeks comments on its proposed changes to size standards in the above sectors, and the data sources it evaluated to develop the proposed size standards.
DATES: SBA must receive comments to this proposed rule on or before January 12, 2021. ADDRESSES: Identify your comments by RIN 3245–AG91 and submit them by one of the following methods: (1) Federal eRulemaking Portal: www.regulations.gov. Follow the instructions for submitting comments; or (2) Mail/Hand Delivery/Courier: Khem R. Sharma, Ph.D., Chief, Office of Size Standards, 409 Third Street SW, Mail Code 6530, Washington, DC 20416.
SBA will post all comments to this proposed rule on www.regulations.gov. If you wish to submit confidential business information (CBI) as defined in the User Notice at www.regulations.gov, you must submit such information to U.S. Small Business Administration, Khem R. Sharma, Ph.D., Chief, Office of Size Standards, 409 Third Street SW, Mail Code 6530, Washington, DC 20416, or send an email to [email protected]. Highlight the information that you consider to be CBI and explain why you believe SBA should hold this information as confidential. SBA will review your information and determine whether it will make the information public. FOR FURTHER INFORMATION CONTACT: Jorge Laboy-Bruno, Ph.D., Economist, Office of Size Standards, (202) 205–6618 or [email protected]. SUPPLEMENTARY INFORMATION:
Discussion of Size Standards To determine eligibility for Federal
small business assistance, SBA establishes small business size definitions (usually referred to as ‘‘size standards’’) for private sector industries in the United States. SBA uses two primary measures of business size for size standards purposes: Average annual receipts and average number of employees. SBA uses financial assets for certain financial industries and refining capacity, in addition to employees, for the petroleum refining industry to measure business size. In addition, SBA’s Small Business Investment Company (SBIC), Certified Development
Company (504), and 7(a) Loan Programs use either the industry-based size standards or tangible net worth and net income-based alternative size standards to determine eligibility for those programs.
In September 2010, Congress passed the Small Business Jobs Act of 2010 (Pub. L. 111–240, 124 Stat. 2504, September 27, 2010) (‘‘Jobs Act’’), requiring SBA to review all size standards every 5 years and make necessary adjustments to reflect current industry and market conditions. In accordance with the Jobs Act, in early 2016, SBA completed the first 5-year review of all size standards—except those for agricultural enterprises for which size standards were previously set by Congress—and made appropriate adjustments to size standards for a number of industries to reflect current industry and Federal market conditions.
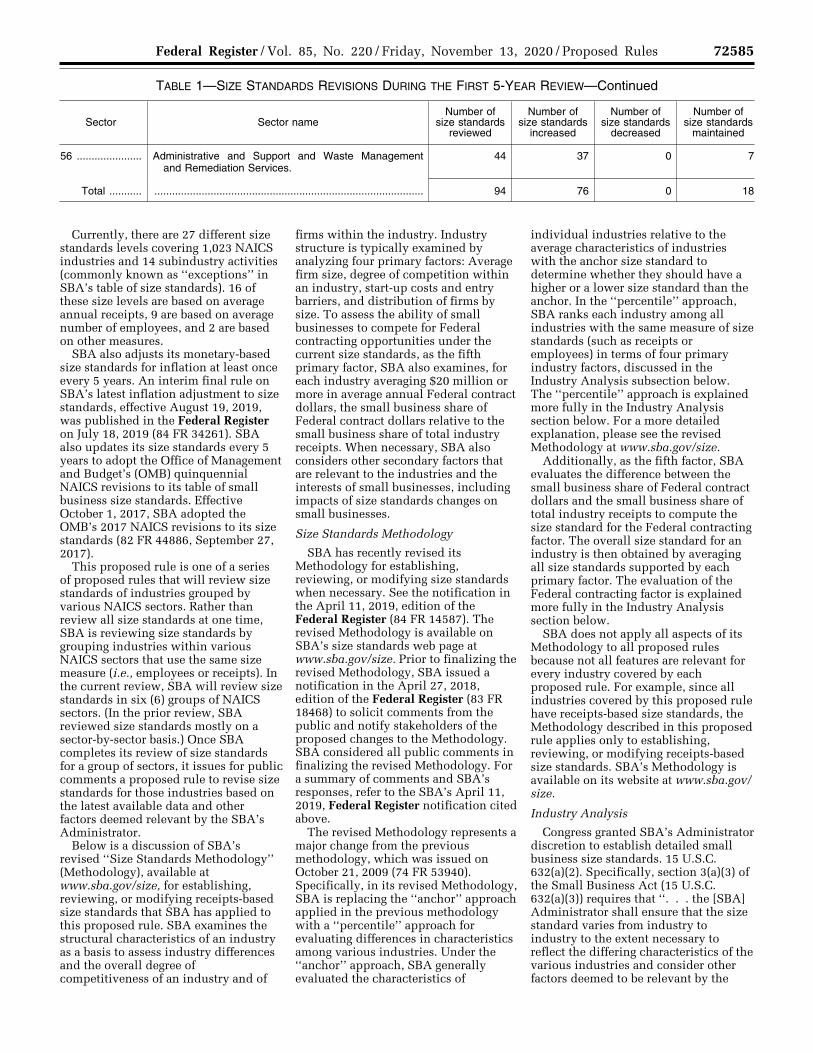
During the previous 5-year comprehensive review, SBA reviewed the receipts-based size standards for 45 industries and 3 exceptions within NAICS Sector 54 (Professional, Scientific and Technical Services), 2 industries within Sector 55 (Management of Companies and Enterprises), and 44 industries in Sector 56 (Administrative and Support and Waste Management and Remediation Services). These reviews of receipts- based size standards occurred during October 2010 to December 2013. SBA’s analyses of the relevant industry and Federal contracting data available at that time supported increasing size standards for 37 industries and maintaining current size standards for 11 industries in Sector 54 (77 FR 10943, February 10, 2012), increasing size standards for 2 industries in Sector 55 (78 FR 37409, June 20, 2013), and increasing size standards in 37 industries and retaining existing size standards in 7 industries in Sector 56 (77 FR 72291, December 6, 2012). Table 1, Size Standards Revisions During the First 5-Year Review, provides a summary of these revisions by NAICS sector.
TABLE 1—SIZE STANDARDS REVISIONS DURING THE FIRST 5-YEAR REVIEW
Sector Sector name Number of
size standards reviewed
Number of size standards
increased
Number of size standards
decreased
Number of size standards
maintained
54 ...................... Professional, Scientific and Technical Services ............... 48 37 0 11 55 ...................... Management of Companies and Enterprises ................... 2 2 0 0
VerDate Sep<11>2014 16:23 Nov 12, 2020 Jkt 253001 PO 00000 Frm 00001 Fmt 4702 Sfmt 4702 E:\FR\FM\13NOP1.SGM 13NOP1jbel
l on
DS
KJL
SW
7X2P
RO
D w
ith P
RO
PO
SA
LS
72585 Federal Register / Vol. 85, No. 220 / Friday, November 13, 2020 / Proposed Rules
TABLE 1—SIZE STANDARDS REVISIONS DURING THE FIRST 5-YEAR REVIEW—Continued
Sector Sector name Number of
size standards reviewed
Number of size standards
increased
Number of size standards
decreased
Number of size standards
maintained
56 ...................... Administrative and Support and Waste Management and Remediation Services.
44 37 0 7
Total ........... ........................................................................................... 94 76 0 18
Currently, there are 27 different size standards levels covering 1,023 NAICS industries and 14 subindustry activities (commonly known as ‘‘exceptions’’ in SBA’s table of size standards). 16 of these size levels are based on average annual receipts, 9 are based on average number of employees, and 2 are based on other measures.
SBA also adjusts its monetary-based size standards for inflation at least once every 5 years. An interim final rule on SBA’s latest inflation adjustment to size standards, effective August 19, 2019, was published in the Federal Register on July 18, 2019 (84 FR 34261). SBA also updates its size standards every 5 years to adopt the Office of Management and Budget’s (OMB) quinquennial NAICS revisions to its table of small business size standards. Effective October 1, 2017, SBA adopted the OMB’s 2017 NAICS revisions to its size standards (82 FR 44886, September 27, 2017).
This proposed rule is one of a series of proposed rules that will review size standards of industries grouped by various NAICS sectors. Rather than review all size standards at one time, SBA is reviewing size standards by grouping industries within various NAICS sectors that use the same size measure (i.e., employees or receipts). In the current review, SBA will review size standards in six (6) groups of NAICS sectors. (In the prior review, SBA reviewed size standards mostly on a sector-by-sector basis.) Once SBA completes its review of size standards for a group of sectors, it issues for public comments a proposed rule to revise size standards for those industries based on the latest available data and other factors deemed relevant by the SBA’s Administrator.
Below is a discussion of SBA’s revised ‘‘Size Standards Methodology’’ (Methodology), available at www.sba.gov/size, for establishing, reviewing, or modifying receipts-based size standards that SBA has applied to this proposed rule. SBA examines the structural characteristics of an industry as a basis to assess industry differences and the overall degree of competitiveness of an industry and of
firms within the industry. Industry structure is typically examined by analyzing four primary factors: Average firm size, degree of competition within an industry, start-up costs and entry barriers, and distribution of firms by size. To assess the ability of small businesses to compete for Federal contracting opportunities under the current size standards, as the fifth primary factor, SBA also examines, for each industry averaging $20 million or more in average annual Federal contract dollars, the small business share of Federal contract dollars relative to the small business share of total industry receipts. When necessary, SBA also considers other secondary factors that are relevant to the industries and the interests of small businesses, including impacts of size standards changes on small businesses.
Size Standards Methodology
SBA has recently revised its Methodology for establishing, reviewing, or modifying size standards when necessary. See the notification in the April 11, 2019, edition of the Federal Register (84 FR 14587). The revised Methodology is available on SBA’s size standards web page at www.sba.gov/size. Prior to finalizing the revised Methodology, SBA issued a notification in the April 27, 2018, edition of the Federal Register (83 FR 18468) to solicit comments from the public and notify stakeholders of the proposed changes to the Methodology. SBA considered all public comments in finalizing the revised Methodology. For a summary of comments and SBA’s responses, refer to the SBA’s April 11, 2019, Federal Register notification cited above.
The revised Methodology represents a major change from the previous methodology, which was issued on October 21, 2009 (74 FR 53940). Specifically, in its revised Methodology, SBA is replacing the ‘‘anchor’’ approach applied in the previous methodology with a ‘‘percentile’’ approach for evaluating differences in characteristics among various industries. Under the ‘‘anchor’’ approach, SBA generally evaluated the characteristics of
individual industries relative to the average characteristics of industries with the anchor size standard to determine whether they should have a higher or a lower size standard than the anchor. In the ‘‘percentile’’ approach, SBA ranks each industry among all industries with the same measure of size standards (such as receipts or employees) in terms of four primary industry factors, discussed in the Industry Analysis subsection below. The ‘‘percentile’’ approach is explained more fully in the Industry Analysis section below. For a more detailed explanation, please see the revised Methodology at www.sba.gov/size.
Additionally, as the fifth factor, SBA evaluates the difference between the small business share of Federal contract dollars and the small business share of total industry receipts to compute the size standard for the Federal contracting factor. The overall size standard for an industry is then obtained by averaging all size standards supported by each primary factor. The evaluation of the Federal contracting factor is explained more fully in the Industry Analysis section below.
SBA does not apply all aspects of its Methodology to all proposed rules because not all features are relevant for every industry covered by each proposed rule. For example, since all industries covered by this proposed rule have receipts-based size standards, the Methodology described in this proposed rule applies only to establishing, reviewing, or modifying receipts-based size standards. SBA’s Methodology is available on its website at www.sba.gov/ size.
Industry Analysis
Congress granted SBA’s Administrator discretion to establish detailed small business size standards. 15 U.S.C. 632(a)(2). Specifically, section 3(a)(3) of the Small Business Act (15 U.S.C. 632(a)(3)) requires that ‘‘. . . the [SBA] Administrator shall ensure that the size standard varies from industry to industry to the extent necessary to reflect the differing characteristics of the various industries and consider other factors deemed to be relevant by the
VerDate Sep<11>2014 16:23 Nov 12, 2020 Jkt 253001 PO 00000 Frm 00002 Fmt 4702 Sfmt 4702 E:\FR\FM\13NOP1.SGM 13NOP1jbel
l on
DS
KJL
SW
7X2P
RO
D w
ith P
RO
PO
SA
LS
72586 Federal Register / Vol. 85, No. 220 / Friday, November 13, 2020 / Proposed Rules
Administrator.’’ Accordingly, the economic structure of an industry is the basis for establishing, reviewing, or modifying small business size standards. In addition, SBA considers current economic conditions, its mission and program objectives, the Administration’s current policies, impacts on small businesses under current size and proposed or revised size standards, suggestions from industry groups and Federal agencies, and public comments on the proposed rule. SBA also examines whether a size standard based on industry and other relevant data successfully excludes businesses that are dominant in the industry.
The goal of SBA’s size standards review is to determine whether its existing small business size standards reflect the current industry structure and Federal market conditions and revise them when the latest available data suggest that revisions are warranted. In the past, SBA compared the characteristics of each industry with the average characteristics of a group of industries associated with the ‘‘anchor’’ size standard. For example, in the first 5-year comprehensive review of size standards under the Jobs Act, $7.0 million (now $8.0 million due to the inflation adjustment in 2019; see 84 FR 34261, July 18, 2019) was considered the ‘‘anchor’’ for receipts-based size standards and 500 employees was the ‘‘anchor’’ for employee-based size standards. If the characteristics of a specific industry under review were similar to the average characteristics of industries in the anchor group, SBA generally adopted the anchor size standard for that industry. If the specific industry’s characteristics were significantly different from those in the anchor group, SBA assigned a size standard that was higher or lower than the anchor. To determine a size standard above or below the anchor size standard, SBA evaluated the characteristics of a second comparison group of industries with higher size standards. For industries with receipts- based standards, the second comparison group consisted of industries with size standards between $23.0 million and $35.5 million, with the weighted average size standard for the group equaling $29.0 million. For manufacturing industries and other industries with employee-based size standards (except for Wholesale Trade and Retail Trade), the second comparison group included industries with a size standard of 1,000 employees or 1,500 employees, with the weighted average size standard of 1,323
employees. Using the anchor size standard and average size standard for the second comparison group, SBA computed a size standard for an industry’s characteristic (factor) based on the industry’s position for that factor relative to the average values of the same factor for industries in the anchor and second comparison groups.
Under the ‘‘percentile’’ approach, for each industry factor, an industry is ranked and compared with the 20th percentile and 80th percentile values of that factor among the industries sharing the same measure of size standards (i.e., receipts or employees). Combining that result with the 20th percentile and 80th percentile values of size standards among the industries with the same measure of size standards, SBA computes a size standard supported by each industry factor for each industry. In the previous Methodology, comparison industry groups were predetermined independent of the data, while in the revised Methodology they are established using the actual data. A more detailed description of the percentile method is provided in SBA’s Methodology, available at www.sba.gov/ size.
The primary factors that SBA evaluates to examine industry structure include average firm size, startup costs and entry barriers, industry competition, and distribution of firms by size. SBA also evaluates, as an additional primary factor, small business success in receiving Federal contracting assistance under the current size standards. Specifically, for the Federal contracting factor, SBA examines the small business share of Federal contract dollars relative to small business share of total receipts within an industry. These are, generally, the five most important factors SBA examines when establishing, reviewing, or revising a size standard for an industry. However, SBA will also consider and evaluate other secondary factors that it believes are relevant to a particular industry (such as technological changes, growth trends, SBA financial assistance, and other program factors). SBA also considers possible impacts of size standard revisions on eligibility for Federal small business assistance, current economic conditions, the Administration’s policies, and suggestions from industry groups and Federal agencies. Public comments on proposed rules also provide important additional information. SBA thoroughly reviews all public comments before making a final decision on its proposed revisions to size standards. Below are brief descriptions of each of the five primary
factors that SBA has evaluated for each industry being reviewed in this proposed rule. A more detailed description of this analysis is provided in the SBA’s Methodology, available at www.sba.gov/size.
1. Average Firm Size SBA computes two measures of
average firm size: Simple average and weighted average. For industries with receipts-based size standards, the simple average is the total receipts of the industry divided by the total number of firms in the industry. The weighted average firm size is the summation of all the receipts of the firms in an industry multiplied by their share of receipts in the industry. The simple average weighs all firms within an industry equally regardless of their size. The weighted average overcomes that limitation by giving more weight to larger firms. The size standard supported by average firm size is obtained by averaging size standards supported by simple average firm size and weighted average firm size.
If the average firm size of an industry is higher than the average firm size for most other industries, this would generally support a size standard higher than the size standards for other industries. Conversely, if the industry’s average firm size is lower than that of most other industries, it would provide a basis to assign a lower size standard as compared to size standards for most other industries.
2. Startup Costs and Entry Barriers Startup costs reflect a firm’s initial
size in an industry. New entrants to an industry must have sufficient capital and other assets to start and maintain a viable business. If firms entering an industry under review have greater capital requirements than firms in most other industries, all other factors remaining the same, this would be a basis for a higher size standard. Conversely, if the industry has smaller capital needs compared to most other industries, a lower size standard would be considered appropriate.
Given the lack of actual data on startup costs and entry barriers by industry, SBA uses average assets as a proxy for startup costs and entry barriers. To calculate average assets, SBA begins with the sales to total assets ratio for an industry from the Risk Management Association’s Annual Statement Studies, available at https:// rmau.org. SBA then applies these ratios to the average receipts of firms in that industry obtained from the Economic Census tabulation. An industry with average assets that are significantly
VerDate Sep<11>2014 16:23 Nov 12, 2020 Jkt 253001 PO 00000 Frm 00003 Fmt 4702 Sfmt 4702 E:\FR\FM\13NOP1.SGM 13NOP1jbel
l on
DS
KJL
SW
7X2P
RO
D w
ith P
RO
PO
SA
LS
72587 Federal Register / Vol. 85, No. 220 / Friday, November 13, 2020 / Proposed Rules
higher than most other industries is likely to have higher startup costs; this in turn will support a higher size standard. Conversely, an industry with average assets that are similar to or lower than most other industries is likely to have lower startup costs; this will support either lowering or maintaining the size standard.
3. Industry Competition Industry competition is generally
measured by the share of total industry receipts generated by the largest firms in an industry. SBA generally evaluates the share of industry receipts generated by the four largest firms in each industry. This is referred to as the ‘‘4-firm concentration ratio,’’ a commonly used economic measure of market competition. Using the 4-firm concentration ratio, SBA compares the degree of concentration within an industry to the degree of concentration of the other industries with the same measure of size standards. If a significantly higher share of economic activity within an industry is concentrated among the four largest firms compared to most other industries, all else being equal, SBA would set a size standard that is relatively higher than for most other industries. Conversely, if the market share of the four largest firms in an industry is appreciably lower than the similar share for most other industries, the industry will be assigned a size standard that is lower than for most other industries.
4. Distribution of Firms by Size SBA examines the shares of industry
total receipts accounted for by firms of different receipts and employment sizes in an industry. This is an additional factor SBA considers in assessing competition within an industry besides the 4-firm concentration ratio. If the preponderance of an industry’s economic activity is attributable to smaller firms, this generally indicates that small businesses are competitive in that industry, which would support adopting a smaller size standard. A higher size standard would be supported for an industry in which the distribution of firms indicates that most of the economic activity is concentrated among the larger firms.
Concentration is a measure of inequality of distribution. To determine the degree of inequality of distribution in an industry, SBA computes the Gini coefficient, using the Lorenz curve. The Lorenz curve presents the cumulative percentages of units (firms) along the horizontal axis and the cumulative percentages of receipts (or other
measures of size) along the vertical axis. (For further detail, see SBA’s Methodology on its website at www.sba.gov/size.) Gini coefficient values vary from zero to one. If receipts are distributed equally among all the firms in an industry, the value of the Gini coefficient will equal zero. If an industry’s total receipts are attributable to a single firm, the Gini coefficient will equal one.
SBA compares the degree of inequality of distribution for an industry under review with other industries with the same type of size standards. If an industry shows a higher degree of inequality of distribution (hence a higher Gini coefficient value) compared to most other industries in the group, this would, all else being equal, warrant a size standard that is higher than the size standards assigned to most other industries. Conversely, an industry with lower degree of inequality (i.e., a lower Gini coefficient value) than most others will be assigned a lower size standard relative to others.
5. Federal Contracting As the fifth factor, SBA examines the
success small businesses are having in winning Federal contracts under the current size standard as well as the possible impact a size standard change may have on Federal small business contracting opportunities. The Small Business Act requires the Federal Government to ensure that small businesses receive a ‘‘fair proportion’’ of Federal contracts. The legislative history also discusses the importance of size standards in Federal contracting. To incorporate the Federal contracting factor in the size standards analysis, SBA evaluates small business participation in Federal contracting in terms of the share of total Federal contract dollars awarded to small businesses relative to the small business share of total receipts within an industry. In general, if the share of Federal contract dollars awarded to small businesses in an industry is significantly smaller than the small business share of total industry receipts, all else remaining the same, a justification would exist for considering a size standard higher than the current size standard. In cases where small business share of the Federal market is already appreciably high relative to the small business share of the overall market, SBA generally assumes that the existing size standard is adequate with respect to the Federal contracting factor.
The disparity between the small business Federal market share and industry-wide small business share may be due to various factors, such as
extensive administrative and compliance requirements associated with Federal contracts, the different skill set required to perform Federal contracts as compared to typical commercial contracting work, and the size of Federal contracts. These, as well as other factors, are likely to influence the type of firms within an industry that compete for Federal contracts. By comparing the small business Federal contracting share with the industry- wide small business share, SBA includes in its size standards analysis the latest Federal market conditions. Besides the impact on Federal contracting, SBA also examines impacts on SBA’s loan programs both under the current and revised size standards.
Sources of Industry and Program Data SBA’s primary source of industry data
used in this proposed rule for evaluating industry characteristics and developing size standards is a special tabulation of the Economic Census from the U.S. Census Bureau (www.census.gov/econ/ census). The tabulation based on the 2012 Economic Census is the latest available. The special tabulation provides industry data on the number of firms, number of establishments, number of employees, annual payroll, and annual receipts of companies by Industry (6-digit level), Industry Group (4-digit level), Subsector (3-digit level), and Sector (2-digit level). These data are arrayed by various classes of firms’ size based on the overall number of employees and receipts of the entire enterprise (all establishments and affiliated firms) from all industries. The special tabulation also contains information for different levels of NAICS categories on average and median firm size in terms of both receipts and employment, total receipts generated by the four and eight largest firms, the Herfindahl-Hirschman Index (HHI), the Gini coefficient, and size distributions of firms by various receipts and employment size groupings.
In some cases where data were not available due to disclosure prohibitions in the Census Bureau’s tabulation, SBA either estimated missing values using available relevant data or examined data at a higher level of industry aggregation, such as at the NAICS Sector (2-digit), Subsector (3-digit), or Industry Group (4-digit) level. In some instances, SBA’s analysis was based only on those factors for which data were available or estimates of missing values were possible.
To evaluate some industries that are not covered by the Economic Census, SBA used a similar special tabulation of the latest County Business Patterns
VerDate Sep<11>2014 16:23 Nov 12, 2020 Jkt 253001 PO 00000 Frm 00004 Fmt 4702 Sfmt 4702 E:\FR\FM\13NOP1.SGM 13NOP1jbel
l on
DS
KJL
SW
7X2P
RO
D w
ith P
RO
PO
SA
LS

72588 Federal Register / Vol. 85, No. 220 / Friday, November 13, 2020 / Proposed Rules
(CBP) published by the U.S. Census Bureau (www.census.gov/programs- surveys/cbp.html). Similarly, to evaluate industries in NAICS Sector 11 that are also not covered by the Economic Census and CBP, SBA evaluated a similar special tabulation based on the 2012 Census of Agriculture (www.nass.usda.gov) from the National Agricultural Statistics Service (NASS). Besides the Economic Census, Agricultural Census and CBP tabulations, SBA also evaluates relevant industry data from other sources when necessary, especially for industries that are not covered by the Economic Census or CBP. These include the Quarterly Census of Employment and Wages (QCEW, also known as ES–202 data) (www.bls.gov/cew/) and Business Employment Dynamics (BED) data (www.bls.gov/bdm/) from the U.S. Bureau of Labor Statistics. Similarly, to evaluate certain financial industries that have asset-based size standards, SBA examines the data from the Statistics on Depository Institutions (SDI) database (www5.fdic.gov/sdi/main.asp) of the Federal Depository Insurance Corporation (FDIC) data. Finally, to evaluate the capacity component of the Petroleum Refiners (NAICS 324110) size standard, SBA evaluates the petroleum production data from the Energy Information Administration (www.eia.gov).
To calculate average assets, SBA used sales to total assets ratios from the Risk Management Association’s Annual eStatement Studies, 2016–2018 (https:// rmau.org). To evaluate Federal contracting trends and evaluate two exceptions in Sector 11 and one exception in Sector 23, SBA examined the data on Federal prime contract awards from the Federal Procurement Data System—Next Generation (FPDS– NG) (www.fpds.gov) for fiscal years 2016–2018. To assess the impact on financial assistance to small businesses, SBA examined its internal data on 7(a) and 504 loan programs for fiscal years 2016–2018. For some portion of impact analysis, SBA also evaluated the data from the System of Award Management (SAM) (www.sam.gov).
Data sources and estimation procedures SBA uses in its size standards analysis are documented in detail in SBA’s Methodology, which is available at www.sba.gov/size.
Dominance in Field of Operation Section 3(a) of the Small Business Act
(15 U.S.C. 632(a)) defines a small business concern as one that is: (1) Independently owned and operated; (2) not dominant in its field of operation; and (3) within a specific small business
definition or size standard established by the SBA Administrator. SBA considers as part of its evaluation whether a business concern at a proposed size standard would be dominant in its field of operation. For this, SBA generally examines the industry’s market share of firms at the proposed or revised size standard as well as the distribution of firms by size. Market share and size distribution may indicate whether a firm can exercise a major controlling influence on a national basis in an industry where a significant number of business concerns are engaged. If a contemplated size standard includes a dominant firm, SBA will consider a lower size standard to exclude the dominant firm from being defined as small.
Selection of Size Standards In the 2009 Methodology, which SBA
applied to the first 5-year comprehensive review of size standards, SBA adopted a fixed number of size standards levels as part of its effort to simplify size standards. In response to public comments to the 2009 Methodology white paper, and the 2013 amendment to the Small Business Act (section 3(a)(8)) under section 1661 of the National Defense Authorization Act for Fiscal Year 2013 (‘‘NDAA 2013’’) (Pub. L. 112–239, January 2, 2013), in the revised Methodology, SBA has relaxed the limitation on the number of small business size standards. Specifically, section 1661 of NDAA 2013 states, ‘‘SBA cannot limit the number of size standards, and shall assign the appropriate size standard to each industry identified by NAICS.’’
In the revised Methodology, SBA calculates a separate size standard for each NAICS industry. However, to account for errors and limitations associated with various data that SBA evaluates in the size standards analysis, SBA rounds the calculated size standard value for a receipts-based size standard to the nearest $500,000, except for agricultural industries in Subsectors 111 and 112 for which the calculated size standards will be rounded to the nearest $250,000. This rounding procedure is applied both in calculating a size standard for each of the five primary factors and in calculating the overall size standard for the industry.
As a policy decision, SBA continues to maintain the minimum and maximum levels for both receipts and employee-based size standards. Accordingly, SBA will not generally propose or adopt a size standard that is either below the minimum level or above the maximum, even though the calculations yield values below the
minimum or above the maximum. The minimum size standard reflects the size an established small business should be to have adequate capabilities and resources to be able to compete for and perform Federal contracts (but does not account for small businesses that are newly formed or just starting operations). On the other hand, the maximum size standard represents the level above which businesses, if qualified as small, would outcompete much smaller businesses when accessing Federal assistance.
With respect to receipts-based size standards, SBA has established $6.0 million and $41.5 million, respectively, as the minimum and maximum size standard levels (except for most agricultural industries in NAICS Subsectors 111 and 112). These levels reflect the current minimum of $6.0 million and the current maximum of $41.5 million in SBA’s existing size standards. The industry data suggests that $6.0 million minimum and $41.5 million maximum size standards would be too high for agricultural industries. Accordingly, SBA has established $1.0 million as the minimum size standard and $5.0 million as the maximum size standard for industries in Subsector 111 (Crop Production) and Subsector 112 (Animal Production and Aquaculture).
Evaluation of Industry Factors As mentioned earlier, to assess the
appropriateness of the current size standards, SBA evaluates the structure of each industry in terms of four economic characteristics or factors: Average firm size, average assets size as a proxy for startup costs and entry barriers, the 4-firm concentration ratio as a measure of industry competition, and size distribution of firms using the Gini coefficient. For each size standard type (i.e., receipts-based or employee- based), SBA ranks industries both in terms of each of the four industry factors and in terms of the existing size standard and computes the 20th percentile and 80th percentile values for both. SBA then evaluates each industry by comparing its value for each industry factor to the 20th percentile and 80th percentile values for the corresponding factor for industries under a particular type of size standard.
If the characteristics of an industry under review within a particular size standard type are similar to the average characteristics of industries within the same size standard type in the 20th percentile, SBA will consider adopting as an appropriate size standard for that industry the 20th percentile value of size standards for those industries. For each size standard type, if the industry’s
VerDate Sep<11>2014 16:23 Nov 12, 2020 Jkt 253001 PO 00000 Frm 00005 Fmt 4702 Sfmt 4702 E:\FR\FM\13NOP1.SGM 13NOP1jbel
l on
DS
KJL
SW
7X2P
RO
D w
ith P
RO
PO
SA
LS
72589 Federal Register / Vol. 85, No. 220 / Friday, November 13, 2020 / Proposed Rules
characteristics are similar to the average characteristics of industries in the 80th percentile, SBA will assign a size standard that corresponds to the 80th percentile in the size standard rankings of industries. A separate size standard is established for each factor based on the amount of differences between the factor value for an industry under a particular size standard type and 20th percentile and 80th percentile values for the corresponding factor for all industries in the same type.
Specifically, the actual level of the new size standard for each industry factor is derived by a linear interpolation using the 20th percentile and 80th percentile values of that factor and corresponding percentiles of size standards. Each calculated size standard is bounded between the minimum and maximum size standards levels, as discussed before. As noted earlier, the calculated value for a receipts-based size standard for each industry factor is rounded to the nearest $500,000, except for
industries in Subsectors 111 and 112 for which a calculated size standard is rounded to the nearest $250,000.
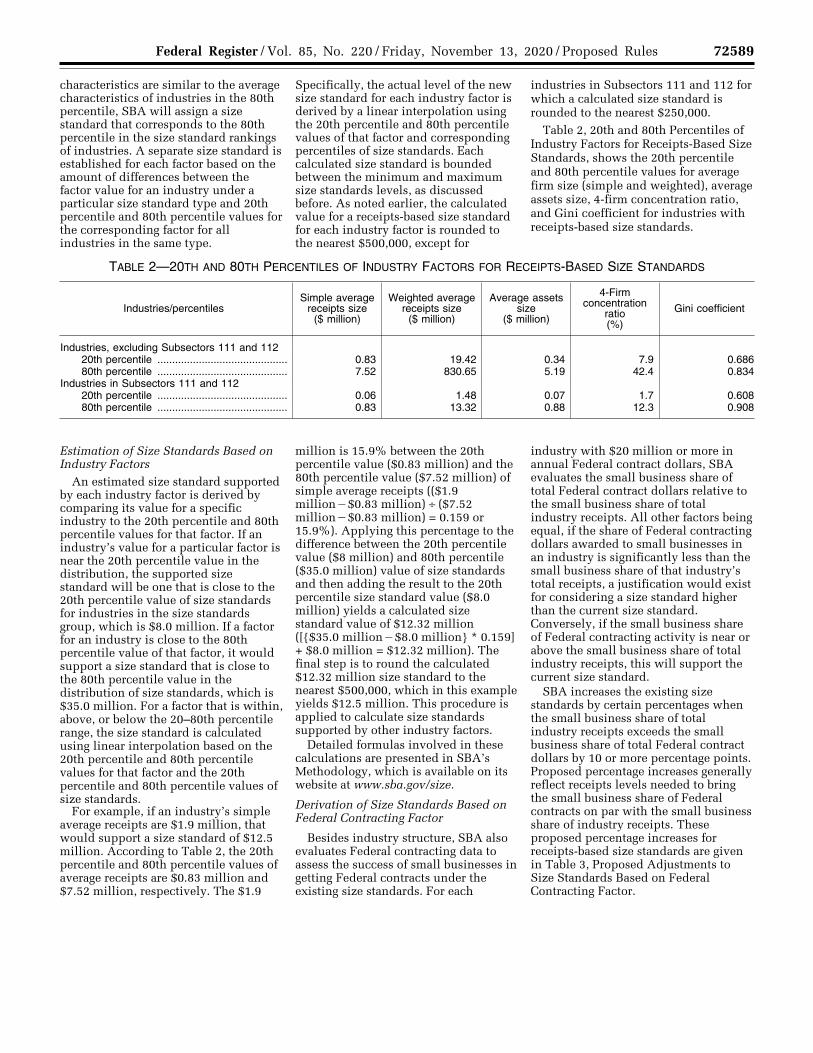
Table 2, 20th and 80th Percentiles of Industry Factors for Receipts-Based Size Standards, shows the 20th percentile and 80th percentile values for average firm size (simple and weighted), average assets size, 4-firm concentration ratio, and Gini coefficient for industries with receipts-based size standards.
TABLE 2—20TH AND 80TH PERCENTILES OF INDUSTRY FACTORS FOR RECEIPTS-BASED SIZE STANDARDS
Industries/percentiles Simple average
receipts size ($ million)
Weighted average receipts size
($ million)
Average assets size
($ million)
4-Firm concentration
ratio (%)
Gini coefficient
Industries, excluding Subsectors 111 and 112 20th percentile ............................................ 0.83 19.42 0.34 7.9 0.686 80th percentile ............................................ 7.52 830.65 5.19 42.4 0.834
Industries in Subsectors 111 and 112 20th percentile ............................................ 0.06 1.48 0.07 1.7 0.608 80th percentile ............................................ 0.83 13.32 0.88 12.3 0.908
Estimation of Size Standards Based on Industry Factors
An estimated size standard supported by each industry factor is derived by comparing its value for a specific industry to the 20th percentile and 80th percentile values for that factor. If an industry’s value for a particular factor is near the 20th percentile value in the distribution, the supported size standard will be one that is close to the 20th percentile value of size standards for industries in the size standards group, which is $8.0 million. If a factor for an industry is close to the 80th percentile value of that factor, it would support a size standard that is close to the 80th percentile value in the distribution of size standards, which is $35.0 million. For a factor that is within, above, or below the 20–80th percentile range, the size standard is calculated using linear interpolation based on the 20th percentile and 80th percentile values for that factor and the 20th percentile and 80th percentile values of size standards.
For example, if an industry’s simple average receipts are $1.9 million, that would support a size standard of $12.5 million. According to Table 2, the 20th percentile and 80th percentile values of average receipts are $0.83 million and $7.52 million, respectively. The $1.9
million is 15.9% between the 20th percentile value ($0.83 million) and the 80th percentile value ($7.52 million) of simple average receipts (($1.9 million¥$0.83 million) ÷ ($7.52 million¥$0.83 million) = 0.159 or 15.9%). Applying this percentage to the difference between the 20th percentile value ($8 million) and 80th percentile ($35.0 million) value of size standards and then adding the result to the 20th percentile size standard value ($8.0 million) yields a calculated size standard value of $12.32 million ([{$35.0 million¥$8.0 million} * 0.159] + $8.0 million = $12.32 million). The final step is to round the calculated $12.32 million size standard to the nearest $500,000, which in this example yields $12.5 million. This procedure is applied to calculate size standards supported by other industry factors.
Detailed formulas involved in these calculations are presented in SBA’s Methodology, which is available on its website at www.sba.gov/size.
Derivation of Size Standards Based on Federal Contracting Factor
Besides industry structure, SBA also evaluates Federal contracting data to assess the success of small businesses in getting Federal contracts under the existing size standards. For each
industry with $20 million or more in annual Federal contract dollars, SBA evaluates the small business share of total Federal contract dollars relative to the small business share of total industry receipts. All other factors being equal, if the share of Federal contracting dollars awarded to small businesses in an industry is significantly less than the small business share of that industry’s total receipts, a justification would exist for considering a size standard higher than the current size standard. Conversely, if the small business share of Federal contracting activity is near or above the small business share of total industry receipts, this will support the current size standard.
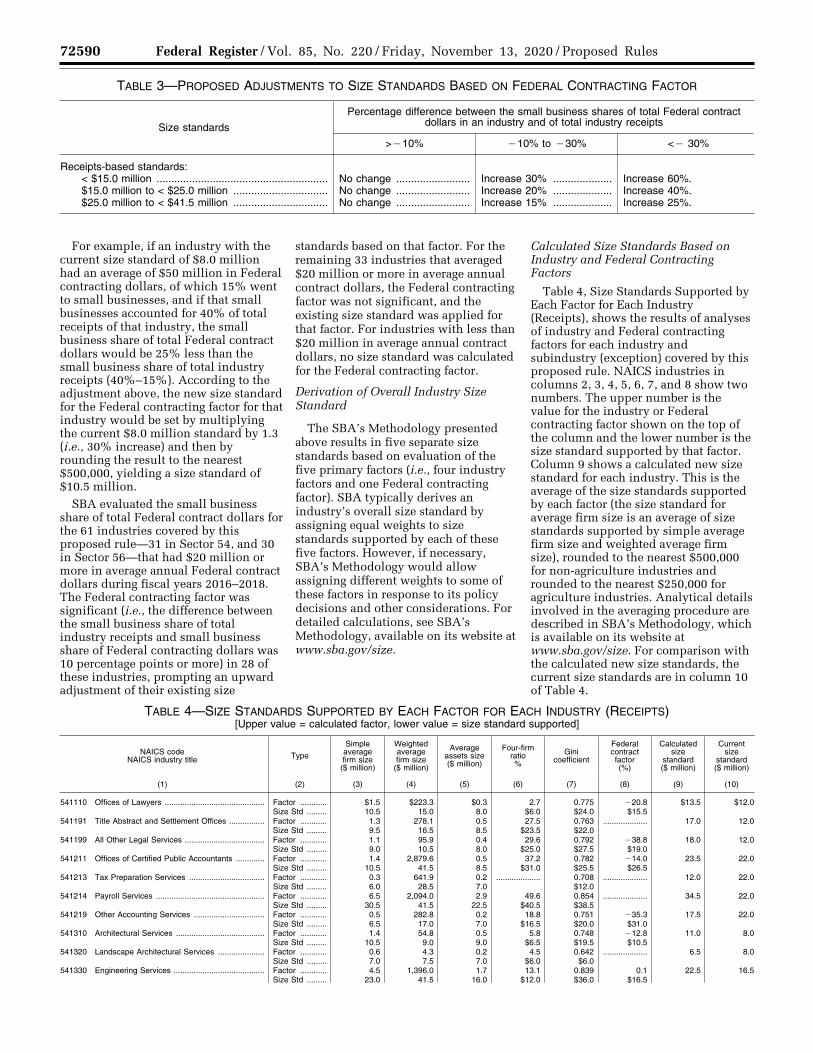
SBA increases the existing size standards by certain percentages when the small business share of total industry receipts exceeds the small business share of total Federal contract dollars by 10 or more percentage points. Proposed percentage increases generally reflect receipts levels needed to bring the small business share of Federal contracts on par with the small business share of industry receipts. These proposed percentage increases for receipts-based size standards are given in Table 3, Proposed Adjustments to Size Standards Based on Federal Contracting Factor.
VerDate Sep<11>2014 16:23 Nov 12, 2020 Jkt 253001 PO 00000 Frm 00006 Fmt 4702 Sfmt 4702 E:\FR\FM\13NOP1.SGM 13NOP1jbel
l on
DS
KJL
SW
7X2P
RO
D w
ith P
RO
PO
SA
LS
72590 Federal Register / Vol. 85, No. 220 / Friday, November 13, 2020 / Proposed Rules
TABLE 3—PROPOSED ADJUSTMENTS TO SIZE STANDARDS BASED ON FEDERAL CONTRACTING FACTOR
Size standards
Percentage difference between the small business shares of total Federal contract dollars in an industry and of total industry receipts
>¥10% ¥10% to ¥30% <¥ 30%
Receipts-based standards: < $15.0 million .......................................................... No change ......................... Increase 30% .................... Increase 60%. $15.0 million to < $25.0 million ................................ No change ......................... Increase 20% .................... Increase 40%. $25.0 million to < $41.5 million ................................ No change ......................... Increase 15% .................... Increase 25%.
For example, if an industry with the current size standard of $8.0 million had an average of $50 million in Federal contracting dollars, of which 15% went to small businesses, and if that small businesses accounted for 40% of total receipts of that industry, the small business share of total Federal contract dollars would be 25% less than the small business share of total industry receipts (40%–15%). According to the adjustment above, the new size standard for the Federal contracting factor for that industry would be set by multiplying the current $8.0 million standard by 1.3 (i.e., 30% increase) and then by rounding the result to the nearest $500,000, yielding a size standard of $10.5 million.
SBA evaluated the small business share of total Federal contract dollars for the 61 industries covered by this proposed rule—31 in Sector 54, and 30 in Sector 56—that had $20 million or more in average annual Federal contract dollars during fiscal years 2016–2018. The Federal contracting factor was significant (i.e., the difference between the small business share of total industry receipts and small business share of Federal contracting dollars was 10 percentage points or more) in 28 of these industries, prompting an upward adjustment of their existing size
standards based on that factor. For the remaining 33 industries that averaged $20 million or more in average annual contract dollars, the Federal contracting factor was not significant, and the existing size standard was applied for that factor. For industries with less than $20 million in average annual contract dollars, no size standard was calculated for the Federal contracting factor.
Derivation of Overall Industry Size Standard
The SBA’s Methodology presented above results in five separate size standards based on evaluation of the five primary factors (i.e., four industry factors and one Federal contracting factor). SBA typically derives an industry’s overall size standard by assigning equal weights to size standards supported by each of these five factors. However, if necessary, SBA’s Methodology would allow assigning different weights to some of these factors in response to its policy decisions and other considerations. For detailed calculations, see SBA’s Methodology, available on its website at www.sba.gov/size.
Calculated Size Standards Based on Industry and Federal Contracting Factors
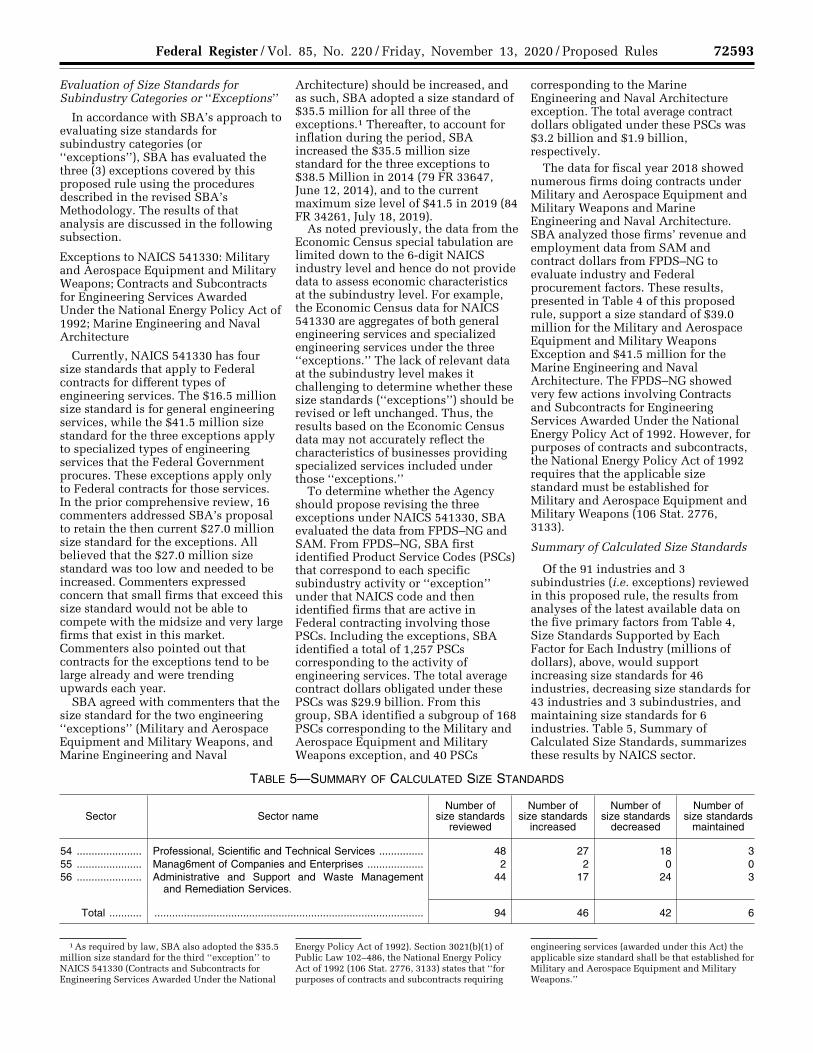
Table 4, Size Standards Supported by Each Factor for Each Industry (Receipts), shows the results of analyses of industry and Federal contracting factors for each industry and subindustry (exception) covered by this proposed rule. NAICS industries in columns 2, 3, 4, 5, 6, 7, and 8 show two numbers. The upper number is the value for the industry or Federal contracting factor shown on the top of the column and the lower number is the size standard supported by that factor. Column 9 shows a calculated new size standard for each industry. This is the average of the size standards supported by each factor (the size standard for average firm size is an average of size standards supported by simple average firm size and weighted average firm size), rounded to the nearest $500,000 for non-agriculture industries and rounded to the nearest $250,000 for agriculture industries. Analytical details involved in the averaging procedure are described in SBA’s Methodology, which is available on its website at www.sba.gov/size. For comparison with the calculated new size standards, the current size standards are in column 10 of Table 4.
TABLE 4—SIZE STANDARDS SUPPORTED BY EACH FACTOR FOR EACH INDUSTRY (RECEIPTS) [Upper value = calculated factor, lower value = size standard supported]
NAICS code NAICS industry title Type
Simple average firm size
($ million)
Weighted average firm size
($ million)
Average assets size ($ million)
Four-firm ratio %
Gini coefficient
Federal contract factor (%)
Calculated size
standard ($ million)
Current size
standard ($ million)
(1) (2) (3) (4) (5) (6) (7) (8) (9) (10)
541110 Offices of Lawyers ............................................. Factor ............Size Std .........
$1.5 10.5
$223.3 15.0
$0.3 8.0
2.7 $6.0
0.775 $24.0
¥20.8 $15.5
$13.5 $12.0
541191 Title Abstract and Settlement Offices ................ Factor ............Size Std .........
1.3 9.5
278.1 16.5
0.5 8.5
27.5 $23.5
0.763 $22.0
.................... 17.0 12.0
541199 All Other Legal Services .................................... Factor ............Size Std .........
1.1 9.0
95.9 10.5
0.4 8.0
29.6 $25.0
0.792 $27.5
¥38.8 $19.0
18.0 12.0
541211 Offices of Certified Public Accountants ............. Factor ............Size Std .........
1.4 10.5
2,879.6 41.5
0.5 8.5
37.2 $31.0
0.782 $25.5
¥14.0 $26.5
23.5 22.0
541213 Tax Preparation Services .................................. Factor ............Size Std .........
0.3 6.0
641.9 28.5
0.2 7.0
.................... 0.708 $12.0
.................... 12.0 22.0
541214 Payroll Services ................................................. Factor ............Size Std .........
6.5 30.5
2,094.0 41.5
2.9 22.5
49.6 $40.5
0.854 $38.5
.................... 34.5 22.0
541219 Other Accounting Services ................................ Factor ............Size Std .........
0.5 6.5
282.8 17.0
0.2 7.0
18.8 $16.5
0.751 $20.0
¥35.3 $31.0
17.5 22.0
541310 Architectural Services ........................................ Factor ............Size Std .........
1.4 10.5
54.8 9.0
0.5 9.0
5.8 $6.5
0.748 $19.5
¥12.8 $10.5
11.0 8.0
541320 Landscape Architectural Services ..................... Factor ............Size Std .........
0.6 7.0
4.3 7.5
0.2 7.0
4.5 $6.0
0.642 $6.0
.................... 6.5 8.0
541330 Engineering Services ......................................... Factor ............Size Std .........
4.5 23.0
1,396.0 41.5
1.7 16.0
13.1 $12.0
0.839 $36.0
0.1 $16.5
22.5 16.5
VerDate Sep<11>2014 16:23 Nov 12, 2020 Jkt 253001 PO 00000 Frm 00007 Fmt 4702 Sfmt 4702 E:\FR\FM\13NOP1.SGM 13NOP1jbel
l on
DS
KJL
SW
7X2P
RO
D w
ith P
RO
PO
SA
LS

72591 Federal Register / Vol. 85, No. 220 / Friday, November 13, 2020 / Proposed Rules
TABLE 4—SIZE STANDARDS SUPPORTED BY EACH FACTOR FOR EACH INDUSTRY (RECEIPTS)—Continued [Upper value = calculated factor, lower value = size standard supported]
NAICS code NAICS industry title Type
Simple average firm size
($ million)
Weighted average firm size
($ million)
Average assets size ($ million)
Four-firm ratio %
Gini coefficient
Federal contract factor (%)
Calculated size
standard ($ million)
Current size
standard ($ million)
(1) (2) (3) (4) (5) (6) (7) (8) (9) (10)
Except Military and Aerospace Equipment and Military Weapons.
Factor ............Size Std .........
3,225.7 41.5
70,551.0 41.5
1,271.8 41.5
35.7 $30.0
0.883 $41.5
12.6 $41.5
39.0 41.5
Except Contracts and Subcontracts for Engineering Services Awarded Under the National Energy Policy Act of 1992.
Factor ............Size Std .........
.................... .................... .................... .................... .................... .................... 39.0 41.5
Except Marine Engineering and Naval Architecture ...... Factor ............Size Std .........
2,639.7 41.5
73,130 41.5
1,055.9 41.5
52.5 $41.5
0.882 $41.5
3.4 $41.5
41.5 41.5
541340 Drafting Services ............................................... Factor ............Size Std .........
0.4 6.0
2.9 7.5
0.1 7.0
7.2 $7.5
0.673 $6.0
.................... 7.0 8.0
541350 Building Inspection Services ............................. Factor ............Size Std .........
0.4 6.0
18.1 8.0
0.1 7.0
12.5 $11.5
0.702 $11.0
¥65.2 $13.0
10.0 8.0
541360 Geophysical Surveying and Mapping Services Factor ............Size Std .........
4.5 22.5
201.6 14.0
1.7 15.5
43.2 $35.5
0.861 $40.0
¥3.5 $16.5
25.0 16.5
541370 Surveying and Mapping (except Geophysical) Services.
Factor ............Size Std .........
0.7 7.5
57.4 9.5
0.3 7.5
16.6 $15.0
0.730 $16.0
¥42.3 $23.0
14.0 16.5
541380 Testing Laboratories .......................................... Factor ............Size Std .........
3.0 16.5
111.5 11.0
1.3 13.5
13.2 $12.0
0.766 $22.5
¥16.8 $20.0
16.5 16.5
541410 Interior Design Services .................................... Factor ............Size Std .........
0.7 7.5
4.6 7.5
0.2 7.0
2.4 $6.0
0.640 $6.0
.................... 6.5 8.0
541420 Industrial Design Services ................................. Factor ............Size Std .........
1.2 9.5
37.4 8.5
0.5 8.5
24.3 $21.0
0.756 $21.0
.................... 15.0 8.0
541430 Graphic Design Services ................................... Factor ............Size Std .........
0.5 6.5
6.7 7.5
0.2 7.0
3.5 $6.0
0.688 $8.5
16.5 $8.0
7.5 8.0
541490 Other Specialized Design Services ................... Factor ............Size Std .........
0.8 8.0
14.7 8.0
0.3 7.5
15.3 $14.0
0.741 $18.0
.................... 12.0 8.0
541511 Custom Computer Programming Services ........ Factor ............Size Std .........
2.0 12.5
616.8 28.0
0.7 9.5
11.8 $11.0
0.813 $31.0
¥7.3 $30.0
20.5 30.0
541512 Computer Systems Design Services ................. Factor ............Size Std .........
4.3 22.0
3,438.4 41.5
1.3 13.0
24.4 $21.0
0.859 $39.5
8.0 $30.0
27.0 30.0
541513 Computer Facilities Management Services ....... Factor ............Size Std .........
5.8 28.0
7,617.4 41.5
1.7 15.5
59.2 $41.5
0.866 $40.5
27.1 $30.0
32.5 30.0
541519 Other Computer Related Services .................... Factor ............Size Std .........
1.9 12.0
268.0 16.5
0.5 9.0
20.1 $17.5
0.829 $34.0
11.6 $30.0
21.0 30.0
541611 Administrative Management and General Man-agement Consulting Services.
Factor ............Size Std .........
1.6 11.0
2,532.2 41.5
0.5 9.0
27.9 $23.5
0.824 $33.0
4.8 $16.5
21.5 16.5
541612 Human Resources Consulting Services ............ Factor ............Size Std .........
2.6 15.0
1,154.7 41.5
0.7 10.0
42.7 $35.0
0.843 $36.5
20.8 $16.5
25.5 16.5
541613 Marketing Consulting Services .......................... Factor ............Size Std .........
1.1 9.0
95.4 10.5
0.4 8.0
8.1 $8.0
0.781 $25.5
¥28.1 $20.0
14.5 16.5
541614 Process, Physical Distribution, and Logistics Consulting Services.
Factor ............Size Std .........
2.0 12.5
113.9 11.0
0.7 10.0
15.3 $13.5
0.814 $31.0
¥11.2 $20.0
17.5 16.5
541618 Other Management Consulting Services .......... Factor ............Size Std .........
0.6 7.5
17.8 8.0
0.2 7.5
9.8 $9.5
0.735 $17.0
¥42.9 $23.0
13.0 16.5
541620 Environmental Consulting Services ................... Factor ............Size Std .........
1.5 11.0
51.8 9.0
0.6 9.5
8.4 $8.5
0.773 $24.0
3.2 $16.5
13.5 16.5
541690 Other Scientific and Technical Consulting Serv-ices.
Factor ............Size Std .........
1.2 9.5
135.7 12.0
0.4 8.5
11.6 $11.0
0.787 $26.5
¥22.9 $20.0
15.5 16.5
541720 Research and Development in the Social Sciences and Humanities.
Factor ............Size Std .........
3.5 19.0
208.8 14.5
2.4 19.0
31.9 $26.5
0.830 $34.0
¥21.7 $26.5
24.5 22.0
541810 Advertising Agencies ......................................... Factor ............Size Std .........
2.9 16.0
896.3 37.0
0.9 11.0
30.1 $25.5
0.801 $29.0
¥20.8 $20.0
22.5 16.5
541820 Public Relations Agencies ................................. Factor ............Size Std .........
1.3 10.0
137.2 12.0
0.4 8.0
21.6 $18.5
0.757 $21.0
5.6 $16.5
15.0 16.5
541830 Media Buying Agencies ..................................... Factor ............Size Std .........
8.4 38.5
283.3 17.0
2.6 20.5
35.7 $30.0
0.838 $35.5
.................... 28.5 16.5
541840 Media Representatives ...................................... Factor ............Size Std .........
2.3 14.0
79.4 10.0
0.8 10.5
26.0 $22.0
0.807 $30.0
.................... 18.5 16.5
541850 Outdoor Advertising ........................................... Factor ............Size Std .........
3.3 18.0
622.5 28.0
2.8 21.5
54.8 $41.5
0.842 $36.5
.................... 30.5 16.5
541860 Direct Mail Advertising ....................................... Factor ............Size Std .........
3.8 20.0
265.8 16.0
1.4 14.0
24.4 $21.0
0.781 $25.5
.................... 19.5 16.5
541870 Advertising Material Distribution Services ......... Factor ............Size Std .........
3.8 20.0
156.6 12.5
1.5 14.0
41.4 $34.0
0.839 $36.0
.................... 25.0 16.5
541890 Other Services Related to Advertising .............. Factor ............Size Std .........
1.8 12.0
89.4 10.5
0.6 9.0
13.1 $12.0
0.780 $25.0
¥42.3 $23.0
16.0 16.5
541910 Marketing Research and Public Opinion Polling Factor ............Size Std .........
3.6 19.5
339.8 18.5
1.3 13.5
21.6 $18.5
0.815 $31.5
11.4 $16.5
20.0 16.5
541921 Photography Studios, Portrait ........................... Factor ............Size Std .........
0.4 6.5
129.9 11.5
0.2 7.0
28.3 $24.0
0.727 $15.5
.................... 14.0 8.0
541922 Commercial Photography .................................. Factor ............Size Std .........
0.5 6.5
5.4 7.5
0.2 7.0
7.9 $8.0
0.674 $6.0
¥50.2 $13.0
8.0 8.0
541930 Translation and Interpretation Services ............ Factor ............Size Std .........
1.9 12.0
218.3 14.5
0.6 9.5
39.3 $32.5
0.840 $36.0
1.3 $8.0
20.0 8.0
541940 Veterinary Services ........................................... Factor ............Size Std .........
1.1 9.0
106.9 11.0
0.3 7.5
9.2 $9.0
0.529 $6.0
¥64.5 $13.0
9.0 8.0
541990 All Other Professional, Scientific and Technical Services.
Factor ............Size Std .........
1.0 8.5
194.6 14.0
0.3 8.0
19.1 $17.0
0.784 $26.0
¥34.1 $23.0
17.0 16.5
551111 Offices of Bank Holding Companies ................. Factor ............Size Std .........
10.1 41.5
402.8 21.0
5.9 39.0
.................... 0.818 $32.0
.................... 34.0 22.0
551112 Offices of Other Holding Companies ................ Factor ............Size Std .........
10.8 41.5
2,312.4 41.5
13.5 41.5
.................... 0.848 $37.5
.................... 40.0 22.0
561110 Office Administrative Services ........................... Factor ............Size Std .........
1.5 10.5
25.7 8.0
0.6 9.5
2.1 $6.0
0.761 $21.5
32.7 $8.0
11.0 8.0
561210 Facilities Support Services ................................ Factor ............Size Std .........
13.8 41.5
665.1 29.5
3.8 27.5
25.6 $22.0
0.841 $36.0
¥5.2 $41.5
32.5 41.5
561311 Employment Placement Agencies ..................... Factor ............Size Std .........
2.0 12.5
242.2 15.5
0.4 8.0
23.7 $20.5
0.797 $28.0
¥21.8 $34.5
21.0 30.0
VerDate Sep<11>2014 16:23 Nov 12, 2020 Jkt 253001 PO 00000 Frm 00008 Fmt 4702 Sfmt 4702 E:\FR\FM\13NOP1.SGM 13NOP1jbel
l on
DS
KJL
SW
7X2P
RO
D w
ith P
RO
PO
SA
LS

72592 Federal Register / Vol. 85, No. 220 / Friday, November 13, 2020 / Proposed Rules
TABLE 4—SIZE STANDARDS SUPPORTED BY EACH FACTOR FOR EACH INDUSTRY (RECEIPTS)—Continued [Upper value = calculated factor, lower value = size standard supported]
NAICS code NAICS industry title Type
Simple average firm size
($ million)
Weighted average firm size
($ million)
Average assets size ($ million)
Four-firm ratio %
Gini coefficient
Federal contract factor (%)
Calculated size
standard ($ million)
Current size
standard ($ million)
(1) (2) (3) (4) (5) (6) (7) (8) (9) (10)
561312 Executive Search Services ................................ Factor ............Size Std .........
1.0 8.5
61.7 9.5
0.2 7.0
17.9 $16.0
0.726 $15.5
.................... 12.0 30.0
561320 Temporary Help Services .................................. Factor ............Size Std .........
9.0 41.0
1,130.0 41.5
1.7 15.5
14.0 $13.0
0.819 $32.0
48.5 $30.0
26.5 30.0
561330 Professional Employer Organizations ............... Factor ............Size Std .........
30.7 41.5
5,898.1 41.5
4.9 33.5
43.6 $36.0
0.865 $40.5
80.2 $30.0
36.5 30.0
561410 Document Preparation Services ........................ Factor ............Size Std .........
0.8 8.0
74.8 10.0
0.3 7.5
26.6 $22.5
0.790 $27.0
40.9 $16.5
16.5 16.5
561421 Telephone Answering Services ......................... Factor ............Size Std .........
1.5 10.5
42.7 9.0
0.7 9.5
24.0 $20.5
0.740 $18.0
.................... 14.5 16.5
561422 Telemarketing Bureaus and Other Contact Centers.
Factor ............Size Std .........
6.1 29.5
312.0 17.5
2.0 17.0
21.2 $18.5
0.827 $33.5
¥19.9 $20.0
22.5 16.5
561431 Private Mail Centers .......................................... Factor ............Size Std .........
0.5 6.5
15.1 8.0
0.2 7.0
13.5 $12.5
0.526 $6.0
.................... 8.5 16.5
561439 Other Business Service Centers (including Copy Shops).
Factor ............Size Std .........
2.1 13.5
452.9 22.5
0.7 10.0
43.0 $35.5
0.805 $29.5
.................... 23.5 16.5
561440 Collection Agencies ........................................... Factor ............Size Std .........
3.1 17.0
123.3 11.5
1.1 12.0
15.2 $13.5
0.792 $27.5
43.6 $16.5
17.0 16.5
561450 Credit Bureaus ................................................... Factor ............Size Std .........
19.3 41.5
824.1 35.0
6.7 41.5
59.9 $41.5
0.878 $41.5
22.4 $16.5
36.0 16.5
561491 Repossession Services ..................................... Factor ............Size Std .........
0.8 8.0
7.6 7.5
0.2 7.0
17.1 $15.0
0.663 $6.0
.................... 9.0 16.5
561492 Court Reporting and Stenotype Services .......... Factor ............Size Std .........
0.6 7.0
35.1 8.5
0.2 7.5
22.5 $19.5
0.743 $18.5
27.3 $16.5
14.0 16.5
561499 All Other Business Support Services ................ Factor ............Size Std .........
2.3 14.0
138.8 12.0
1.0 11.5
23.7 $20.5
0.810 $30.5
¥17.6 $20.0
19.0 16.5
561510 Travel Agencies ................................................. Factor ............Size Std .........
1.4 10.5
303.8 17.5
0.5 8.5
25.8 $22.0
0.798 $28.5
10.4 $22.0
19.0 22.0
561520 Tour Operators .................................................. Factor ............Size Std .........
2.0 13.0
52.5 9.0
0.9 11.0
15.4 $14.0
0.741 $18.0
.................... 13.5 22.0
561591 Convention and Visitors Bureaus ...................... Factor ............Size Std .........
1.7 11.5
28.5 8.5
0.5 9.0
19.3 $17.0
0.745 $18.5
.................... 13.5 22.0
561599 All Other Travel Arrangement and Reservation Services.
Factor ............Size Std .........
8.6 39.5
469.4 23.0
3.7 27.0
31.9 $26.5
0.840 $36.0
67.1 $22.0
28.5 22.0
561611 Investigation Services ........................................ Factor ............Size Std .........
1.1 9.0
318.4 18.0
0.3 7.5
36.2 $30.0
0.810 $30.5
¥27.2 $26.5
21.5 22.0
561612 Security Guards and Patrol Services ................ Factor ............Size Std .........
3.8 20.0
908.2 37.5
0.8 10.5
35.1 $29.5
0.845 $37.0
1.3 $22.0
25.5 22.0
561613 Armored Car Services ....................................... Factor ............Size Std .........
22.7 41.5
509.9 24.5
5.1 35.0
89.6 $41.5
0.871 $41.5
.................... 38.0 22.0
561621 Security Systems Services (except Locksmiths) Factor ............Size Std .........
2.7 15.5
479.5 23.5
1.2 12.5
23.9 $20.5
0.797 $28.0
0.2 $22.0
20.5 22.0
561622 Locksmiths ......................................................... Factor ............Size Std .........
0.5 6.5
5.0 7.5
0.2 7.0
8.3 $8.5
0.603 $6.0
.................... 7.0 22.0
561710 Exterminating and Pest Control Services ......... Factor ............Size Std .........
0.9 8.5
328.1 18.5
0.3 7.5
28.1 $24.0
0.752 $20.0
21.5 $12.0
15.5 12.0
561720 Janitorial Services ............................................. Factor ............Size Std .........
0.7 7.5
201.8 14.0
0.2 7.0
11.2 $10.5
0.785 $26.0
26.6 $19.5
15.0 19.5
561730 Landscaping Services ....................................... Factor ............Size Std .........
0.6 7.0
168.6 13.0
0.2 7.0
9.6 $9.5
0.688 $8.5
11.3 $8.0
8.5 8.0
561740 Carpet and Upholstery Cleaning Services ........ Factor ............Size Std .........
0.4 6.5
14.3 8.0
0.1 7.0
9.4 $9.0
0.673 $6.0
.................... 7.5 6.0
561790 Other Services to Buildings and Dwellings ....... Factor ............Size Std .........
0.5 6.5
13.0 8.0
0.2 7.0
7.1 $7.5
0.645 $6.0
¥46.7 $13.0
8.0 8.0
561910 Packaging and Labeling Services ..................... Factor ............Size Std .........
4.0 21.0
59.3 9.5
1.5 14.5
14.0 $13.0
0.781 $25.5
¥13.8 $15.5
17.0 12.0
561920 Convention and Trade Show Organizers .......... Factor ............Size Std .........
2.6 15.5
287.8 17.0
0.9 11.0
24.0 $20.5
0.800 $28.5
46.7 $12.0
17.5 12.0
561990 All Other Support Services ................................ Factor ............Size Std .........
1.7 11.5
119.3 11.5
0.8 10.5
10.9 $10.5
0.779 $25.0
¥28.2 $15.5
14.5 12.0
562111 Solid Waste Collection ...................................... Factor ............Size Std .........
5.4 26.5
3,163.1 41.5
3.2 23.5
46.6 $38.5
0.821 $32.5
38.2 $41.5
34.0 41.5
562112 Hazardous Waste Collection ............................. Factor ............Size Std .........
7.0 33.0
129.9 11.5
4.1 29.0
43.5 $36.0
0.789 $27.0
33.3 $41.5
31.0 41.5
562119 Other Waste Collection ..................................... Factor ............Size Std .........
2.1 13.0
103.4 11.0
1.2 13.0
41.4 $34.0
0.779 $25.0
¥26.1 $41.5
25.0 41.5
562211 Hazardous Waste Treatment and Disposal ...... Factor ............Size Std .........
15.6 41.5
569.0 26.5
10.4 41.5
49.9 $41.0
0.840 $36.0
¥10.2 $41.5
39.0 41.5
562212 Solid Waste Landfill ........................................... Factor ............Size Std .........
7.5 35.0
834.7 35.0
6.8 41.5
64.6 $41.5
0.845 $37.0
.................... 39.0 41.5
562213 Solid Waste Combustors and Incinerators ........ Factor ............Size Std .........
56.6 41.5
1,040.3 41.5
43.5 41.5
92.5 $41.5
0.863 $40.0
.................... 41.0 41.5
562219 Other Nonhazardous Waste Treatment and Disposal.
Factor ............Size Std .........
3.4 18.5
29.0 8.5
2.8 21.5
40.2 $33.5
0.711 $12.5
¥22.5 $41.5
24.5 41.5
562910 Remediation Services ........................................ Factor ............Size Std .........
4.3 22.0
128.5 11.5
2.0 17.0
13.3 $12.0
0.774 $24.0
¥8.3 $22.0
18.5 22.0
562920 Materials Recovery Facilities ............................. Factor ............Size Std .........
5.2 25.5
276.0 16.5
2.5 20.0
28.8 $24.5
0.753 $20.5
.................... 21.5 22.0
562991 Septic Tank and Related Services .................... Factor ............Size Std .........
0.8 8.0
16.1 8.0
0.4 8.0
11.4 $10.5
0.642 $6.0
9.2 $8.0
8.0 8.0
562998 All Other Miscellaneous Waste Management Services.
Factor ............Size Std .........
1.7 11.5
45.4 9.0
0.9 11.0
26.2 $22.5
0.714 $13.0
.................... 14.5 8.0
VerDate Sep<11>2014 16:23 Nov 12, 2020 Jkt 253001 PO 00000 Frm 00009 Fmt 4702 Sfmt 4702 E:\FR\FM\13NOP1.SGM 13NOP1jbel
l on
DS
KJL
SW
7X2P
RO
D w
ith P
RO
PO
SA
LS
72593 Federal Register / Vol. 85, No. 220 / Friday, November 13, 2020 / Proposed Rules
1 As required by law, SBA also adopted the $35.5 million size standard for the third ‘‘exception’’ to NAICS 541330 (Contracts and Subcontracts for Engineering Services Awarded Under the National
Energy Policy Act of 1992). Section 3021(b)(1) of Public Law 102–486, the National Energy Policy Act of 1992 (106 Stat. 2776, 3133) states that ‘‘for purposes of contracts and subcontracts requiring
engineering services (awarded under this Act) the applicable size standard shall be that established for Military and Aerospace Equipment and Military Weapons.’’
Evaluation of Size Standards for Subindustry Categories or ‘‘Exceptions’’
In accordance with SBA’s approach to evaluating size standards for subindustry categories (or ‘‘exceptions’’), SBA has evaluated the three (3) exceptions covered by this proposed rule using the procedures described in the revised SBA’s Methodology. The results of that analysis are discussed in the following subsection.
Exceptions to NAICS 541330: Military and Aerospace Equipment and Military Weapons; Contracts and Subcontracts for Engineering Services Awarded Under the National Energy Policy Act of 1992; Marine Engineering and Naval Architecture
Currently, NAICS 541330 has four size standards that apply to Federal contracts for different types of engineering services. The $16.5 million size standard is for general engineering services, while the $41.5 million size standard for the three exceptions apply to specialized types of engineering services that the Federal Government procures. These exceptions apply only to Federal contracts for those services. In the prior comprehensive review, 16 commenters addressed SBA’s proposal to retain the then current $27.0 million size standard for the exceptions. All believed that the $27.0 million size standard was too low and needed to be increased. Commenters expressed concern that small firms that exceed this size standard would not be able to compete with the midsize and very large firms that exist in this market. Commenters also pointed out that contracts for the exceptions tend to be large already and were trending upwards each year.
SBA agreed with commenters that the size standard for the two engineering ‘‘exceptions’’ (Military and Aerospace Equipment and Military Weapons, and Marine Engineering and Naval
Architecture) should be increased, and as such, SBA adopted a size standard of $35.5 million for all three of the exceptions.1 Thereafter, to account for inflation during the period, SBA increased the $35.5 million size standard for the three exceptions to $38.5 Million in 2014 (79 FR 33647, June 12, 2014), and to the current maximum size level of $41.5 in 2019 (84 FR 34261, July 18, 2019).
As noted previously, the data from the Economic Census special tabulation are limited down to the 6-digit NAICS industry level and hence do not provide data to assess economic characteristics at the subindustry level. For example, the Economic Census data for NAICS 541330 are aggregates of both general engineering services and specialized engineering services under the three ‘‘exceptions.’’ The lack of relevant data at the subindustry level makes it challenging to determine whether these size standards (‘‘exceptions’’) should be revised or left unchanged. Thus, the results based on the Economic Census data may not accurately reflect the characteristics of businesses providing specialized services included under those ‘‘exceptions.’’
To determine whether the Agency should propose revising the three exceptions under NAICS 541330, SBA evaluated the data from FPDS–NG and SAM. From FPDS–NG, SBA first identified Product Service Codes (PSCs) that correspond to each specific subindustry activity or ‘‘exception’’ under that NAICS code and then identified firms that are active in Federal contracting involving those PSCs. Including the exceptions, SBA identified a total of 1,257 PSCs corresponding to the activity of engineering services. The total average contract dollars obligated under these PSCs was $29.9 billion. From this group, SBA identified a subgroup of 168 PSCs corresponding to the Military and Aerospace Equipment and Military Weapons exception, and 40 PSCs
corresponding to the Marine Engineering and Naval Architecture exception. The total average contract dollars obligated under these PSCs was $3.2 billion and $1.9 billion, respectively.
The data for fiscal year 2018 showed numerous firms doing contracts under Military and Aerospace Equipment and Military Weapons and Marine Engineering and Naval Architecture. SBA analyzed those firms’ revenue and employment data from SAM and contract dollars from FPDS–NG to evaluate industry and Federal procurement factors. These results, presented in Table 4 of this proposed rule, support a size standard of $39.0 million for the Military and Aerospace Equipment and Military Weapons Exception and $41.5 million for the Marine Engineering and Naval Architecture. The FPDS–NG showed very few actions involving Contracts and Subcontracts for Engineering Services Awarded Under the National Energy Policy Act of 1992. However, for purposes of contracts and subcontracts, the National Energy Policy Act of 1992 requires that the applicable size standard must be established for Military and Aerospace Equipment and Military Weapons (106 Stat. 2776, 3133).
Summary of Calculated Size Standards
Of the 91 industries and 3 subindustries (i.e. exceptions) reviewed in this proposed rule, the results from analyses of the latest available data on the five primary factors from Table 4, Size Standards Supported by Each Factor for Each Industry (millions of dollars), above, would support increasing size standards for 46 industries, decreasing size standards for 43 industries and 3 subindustries, and maintaining size standards for 6 industries. Table 5, Summary of Calculated Size Standards, summarizes these results by NAICS sector.
TABLE 5—SUMMARY OF CALCULATED SIZE STANDARDS
Sector Sector name Number of
size standards reviewed
Number of size standards
increased
Number of size standards
decreased
Number of size standards
maintained
54 ...................... Professional, Scientific and Technical Services ............... 48 27 18 3 55 ...................... Manag6ment of Companies and Enterprises ................... 2 2 0 0 56 ...................... Administrative and Support and Waste Management
and Remediation Services.44 17 24 3
Total ........... ........................................................................................... 94 46 42 6
VerDate Sep<11>2014 16:23 Nov 12, 2020 Jkt 253001 PO 00000 Frm 00010 Fmt 4702 Sfmt 4702 E:\FR\FM\13NOP1.SGM 13NOP1jbel
l on
DS
KJL
SW
7X2P
RO
D w
ith P
RO
PO
SA
LS
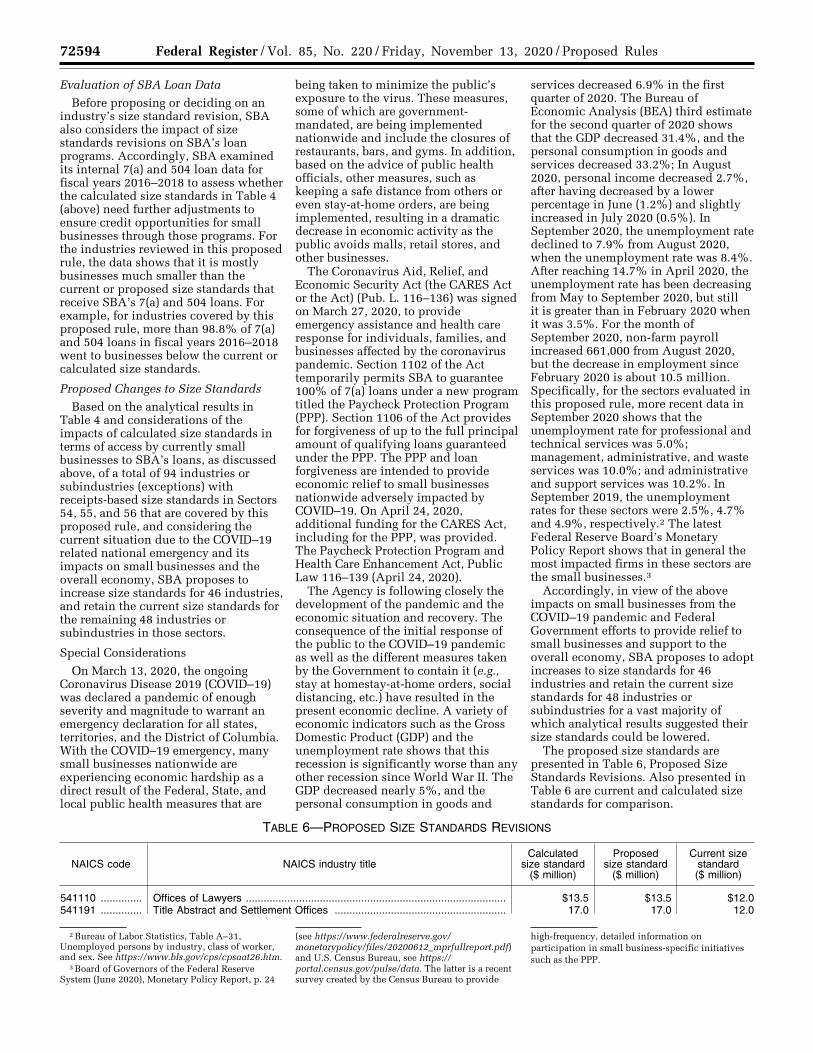
72594 Federal Register / Vol. 85, No. 220 / Friday, November 13, 2020 / Proposed Rules
2 Bureau of Labor Statistics, Table A–31, Unemployed persons by industry, class of worker, and sex. See https://www.bls.gov/cps/cpsaat26.htm.
3 Board of Governors of the Federal Reserve System (June 2020), Monetary Policy Report, p. 24
(see https://www.federalreserve.gov/ monetarypolicy/files/20200612_mprfullreport.pdf) and U.S. Census Bureau, see https://portal.census.gov/pulse/data. The latter is a recent survey created by the Census Bureau to provide
high-frequency, detailed information on participation in small business-specific initiatives such as the PPP.
Evaluation of SBA Loan Data
Before proposing or deciding on an industry’s size standard revision, SBA also considers the impact of size standards revisions on SBA’s loan programs. Accordingly, SBA examined its internal 7(a) and 504 loan data for fiscal years 2016–2018 to assess whether the calculated size standards in Table 4 (above) need further adjustments to ensure credit opportunities for small businesses through those programs. For the industries reviewed in this proposed rule, the data shows that it is mostly businesses much smaller than the current or proposed size standards that receive SBA’s 7(a) and 504 loans. For example, for industries covered by this proposed rule, more than 98.8% of 7(a) and 504 loans in fiscal years 2016–2018 went to businesses below the current or calculated size standards.
Proposed Changes to Size Standards
Based on the analytical results in Table 4 and considerations of the impacts of calculated size standards in terms of access by currently small businesses to SBA’s loans, as discussed above, of a total of 94 industries or subindustries (exceptions) with receipts-based size standards in Sectors 54, 55, and 56 that are covered by this proposed rule, and considering the current situation due to the COVID–19 related national emergency and its impacts on small businesses and the overall economy, SBA proposes to increase size standards for 46 industries, and retain the current size standards for the remaining 48 industries or subindustries in those sectors.
Special Considerations
On March 13, 2020, the ongoing Coronavirus Disease 2019 (COVID–19) was declared a pandemic of enough severity and magnitude to warrant an emergency declaration for all states, territories, and the District of Columbia. With the COVID–19 emergency, many small businesses nationwide are experiencing economic hardship as a direct result of the Federal, State, and local public health measures that are
being taken to minimize the public’s exposure to the virus. These measures, some of which are government- mandated, are being implemented nationwide and include the closures of restaurants, bars, and gyms. In addition, based on the advice of public health officials, other measures, such as keeping a safe distance from others or even stay-at-home orders, are being implemented, resulting in a dramatic decrease in economic activity as the public avoids malls, retail stores, and other businesses.
The Coronavirus Aid, Relief, and Economic Security Act (the CARES Act or the Act) (Pub. L. 116–136) was signed on March 27, 2020, to provide emergency assistance and health care response for individuals, families, and businesses affected by the coronavirus pandemic. Section 1102 of the Act temporarily permits SBA to guarantee 100% of 7(a) loans under a new program titled the Paycheck Protection Program (PPP). Section 1106 of the Act provides for forgiveness of up to the full principal amount of qualifying loans guaranteed under the PPP. The PPP and loan forgiveness are intended to provide economic relief to small businesses nationwide adversely impacted by COVID–19. On April 24, 2020, additional funding for the CARES Act, including for the PPP, was provided. The Paycheck Protection Program and Health Care Enhancement Act, Public Law 116–139 (April 24, 2020).
The Agency is following closely the development of the pandemic and the economic situation and recovery. The consequence of the initial response of the public to the COVID–19 pandemic as well as the different measures taken by the Government to contain it (e.g., stay at homestay-at-home orders, social distancing, etc.) have resulted in the present economic decline. A variety of economic indicators such as the Gross Domestic Product (GDP) and the unemployment rate shows that this recession is significantly worse than any other recession since World War II. The GDP decreased nearly 5%, and the personal consumption in goods and
services decreased 6.9% in the first quarter of 2020. The Bureau of Economic Analysis (BEA) third estimate for the second quarter of 2020 shows that the GDP decreased 31.4%, and the personal consumption in goods and services decreased 33.2%; In August 2020, personal income decreased 2.7%, after having decreased by a lower percentage in June (1.2%) and slightly increased in July 2020 (0.5%). In September 2020, the unemployment rate declined to 7.9% from August 2020, when the unemployment rate was 8.4%. After reaching 14.7% in April 2020, the unemployment rate has been decreasing from May to September 2020, but still it is greater than in February 2020 when it was 3.5%. For the month of September 2020, non-farm payroll increased 661,000 from August 2020, but the decrease in employment since February 2020 is about 10.5 million. Specifically, for the sectors evaluated in this proposed rule, more recent data in September 2020 shows that the unemployment rate for professional and technical services was 5.0%; management, administrative, and waste services was 10.0%; and administrative and support services was 10.2%. In September 2019, the unemployment rates for these sectors were 2.5%, 4.7% and 4.9%, respectively.2 The latest Federal Reserve Board’s Monetary Policy Report shows that in general the most impacted firms in these sectors are the small businesses.3
Accordingly, in view of the above impacts on small businesses from the COVID–19 pandemic and Federal Government efforts to provide relief to small businesses and support to the overall economy, SBA proposes to adopt increases to size standards for 46 industries and retain the current size standards for 48 industries or subindustries for a vast majority of which analytical results suggested their size standards could be lowered.
The proposed size standards are presented in Table 6, Proposed Size Standards Revisions. Also presented in Table 6 are current and calculated size standards for comparison.
TABLE 6—PROPOSED SIZE STANDARDS REVISIONS
NAICS code NAICS industry title Calculated
size standard ($ million)
Proposed size standard
($ million)
Current size standard ($ million)
541110 .............. Offices of Lawyers ........................................................................................ $13.5 $13.5 $12.0 541191 .............. Title Abstract and Settlement Offices .......................................................... 17.0 17.0 12.0
VerDate Sep<11>2014 16:23 Nov 12, 2020 Jkt 253001 PO 00000 Frm 00011 Fmt 4702 Sfmt 4702 E:\FR\FM\13NOP1.SGM 13NOP1jbel
l on
DS
KJL
SW
7X2P
RO
D w
ith P
RO
PO
SA
LS
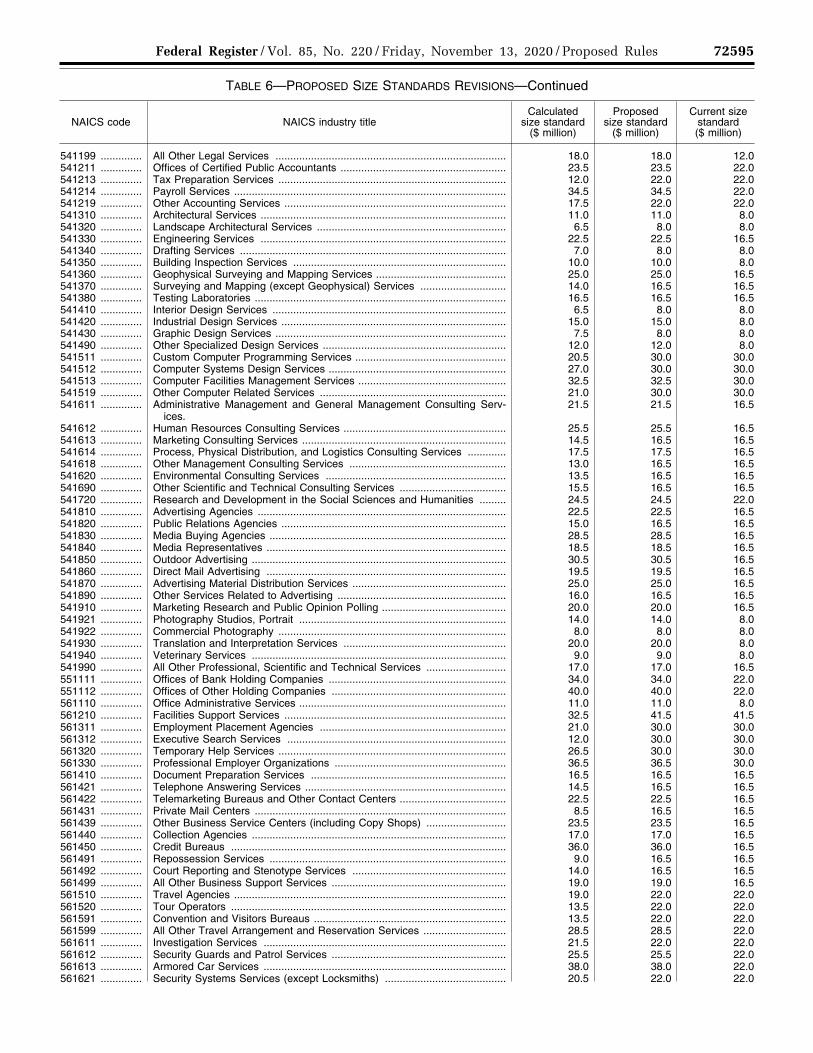
72595 Federal Register / Vol. 85, No. 220 / Friday, November 13, 2020 / Proposed Rules
TABLE 6—PROPOSED SIZE STANDARDS REVISIONS—Continued
NAICS code NAICS industry title Calculated
size standard ($ million)
Proposed size standard
($ million)
Current size standard ($ million)
541199 .............. All Other Legal Services .............................................................................. 18.0 18.0 12.0 541211 .............. Offices of Certified Public Accountants ........................................................ 23.5 23.5 22.0 541213 .............. Tax Preparation Services ............................................................................. 12.0 22.0 22.0 541214 .............. Payroll Services ............................................................................................ 34.5 34.5 22.0 541219 .............. Other Accounting Services ........................................................................... 17.5 22.0 22.0 541310 .............. Architectural Services ................................................................................... 11.0 11.0 8.0 541320 .............. Landscape Architectural Services ................................................................ 6.5 8.0 8.0 541330 .............. Engineering Services ................................................................................... 22.5 22.5 16.5 541340 .............. Drafting Services .......................................................................................... 7.0 8.0 8.0 541350 .............. Building Inspection Services ........................................................................ 10.0 10.0 8.0 541360 .............. Geophysical Surveying and Mapping Services ............................................ 25.0 25.0 16.5 541370 .............. Surveying and Mapping (except Geophysical) Services ............................. 14.0 16.5 16.5 541380 .............. Testing Laboratories ..................................................................................... 16.5 16.5 16.5 541410 .............. Interior Design Services ............................................................................... 6.5 8.0 8.0 541420 .............. Industrial Design Services ............................................................................ 15.0 15.0 8.0 541430 .............. Graphic Design Services .............................................................................. 7.5 8.0 8.0 541490 .............. Other Specialized Design Services .............................................................. 12.0 12.0 8.0 541511 .............. Custom Computer Programming Services ................................................... 20.5 30.0 30.0 541512 .............. Computer Systems Design Services ............................................................ 27.0 30.0 30.0 541513 .............. Computer Facilities Management Services .................................................. 32.5 32.5 30.0 541519 .............. Other Computer Related Services ............................................................... 21.0 30.0 30.0 541611 .............. Administrative Management and General Management Consulting Serv-
ices.21.5 21.5 16.5
541612 .............. Human Resources Consulting Services ....................................................... 25.5 25.5 16.5 541613 .............. Marketing Consulting Services ..................................................................... 14.5 16.5 16.5 541614 .............. Process, Physical Distribution, and Logistics Consulting Services ............. 17.5 17.5 16.5 541618 .............. Other Management Consulting Services ..................................................... 13.0 16.5 16.5 541620 .............. Environmental Consulting Services ............................................................. 13.5 16.5 16.5 541690 .............. Other Scientific and Technical Consulting Services .................................... 15.5 16.5 16.5 541720 .............. Research and Development in the Social Sciences and Humanities ......... 24.5 24.5 22.0 541810 .............. Advertising Agencies .................................................................................... 22.5 22.5 16.5 541820 .............. Public Relations Agencies ............................................................................ 15.0 16.5 16.5 541830 .............. Media Buying Agencies ................................................................................ 28.5 28.5 16.5 541840 .............. Media Representatives ................................................................................. 18.5 18.5 16.5 541850 .............. Outdoor Advertising ...................................................................................... 30.5 30.5 16.5 541860 .............. Direct Mail Advertising ................................................................................. 19.5 19.5 16.5 541870 .............. Advertising Material Distribution Services .................................................... 25.0 25.0 16.5 541890 .............. Other Services Related to Advertising ......................................................... 16.0 16.5 16.5 541910 .............. Marketing Research and Public Opinion Polling .......................................... 20.0 20.0 16.5 541921 .............. Photography Studios, Portrait ...................................................................... 14.0 14.0 8.0 541922 .............. Commercial Photography ............................................................................. 8.0 8.0 8.0 541930 .............. Translation and Interpretation Services ....................................................... 20.0 20.0 8.0 541940 .............. Veterinary Services ...................................................................................... 9.0 9.0 8.0 541990 .............. All Other Professional, Scientific and Technical Services ........................... 17.0 17.0 16.5 551111 .............. Offices of Bank Holding Companies ............................................................ 34.0 34.0 22.0 551112 .............. Offices of Other Holding Companies ........................................................... 40.0 40.0 22.0 561110 .............. Office Administrative Services ...................................................................... 11.0 11.0 8.0 561210 .............. Facilities Support Services ........................................................................... 32.5 41.5 41.5 561311 .............. Employment Placement Agencies ............................................................... 21.0 30.0 30.0 561312 .............. Executive Search Services .......................................................................... 12.0 30.0 30.0 561320 .............. Temporary Help Services ............................................................................. 26.5 30.0 30.0 561330 .............. Professional Employer Organizations .......................................................... 36.5 36.5 30.0 561410 .............. Document Preparation Services .................................................................. 16.5 16.5 16.5 561421 .............. Telephone Answering Services .................................................................... 14.5 16.5 16.5 561422 .............. Telemarketing Bureaus and Other Contact Centers .................................... 22.5 22.5 16.5 561431 .............. Private Mail Centers ..................................................................................... 8.5 16.5 16.5 561439 .............. Other Business Service Centers (including Copy Shops) ........................... 23.5 23.5 16.5 561440 .............. Collection Agencies ...................................................................................... 17.0 17.0 16.5 561450 .............. Credit Bureaus ............................................................................................. 36.0 36.0 16.5 561491 .............. Repossession Services ................................................................................ 9.0 16.5 16.5 561492 .............. Court Reporting and Stenotype Services .................................................... 14.0 16.5 16.5 561499 .............. All Other Business Support Services ........................................................... 19.0 19.0 16.5 561510 .............. Travel Agencies ............................................................................................ 19.0 22.0 22.0 561520 .............. Tour Operators ............................................................................................. 13.5 22.0 22.0 561591 .............. Convention and Visitors Bureaus ................................................................. 13.5 22.0 22.0 561599 .............. All Other Travel Arrangement and Reservation Services ............................ 28.5 28.5 22.0 561611 .............. Investigation Services .................................................................................. 21.5 22.0 22.0 561612 .............. Security Guards and Patrol Services ........................................................... 25.5 25.5 22.0 561613 .............. Armored Car Services .................................................................................. 38.0 38.0 22.0 561621 .............. Security Systems Services (except Locksmiths) ......................................... 20.5 22.0 22.0
VerDate Sep<11>2014 16:23 Nov 12, 2020 Jkt 253001 PO 00000 Frm 00012 Fmt 4702 Sfmt 4702 E:\FR\FM\13NOP1.SGM 13NOP1jbel
l on
DS
KJL
SW
7X2P
RO
D w
ith P
RO
PO
SA
LS
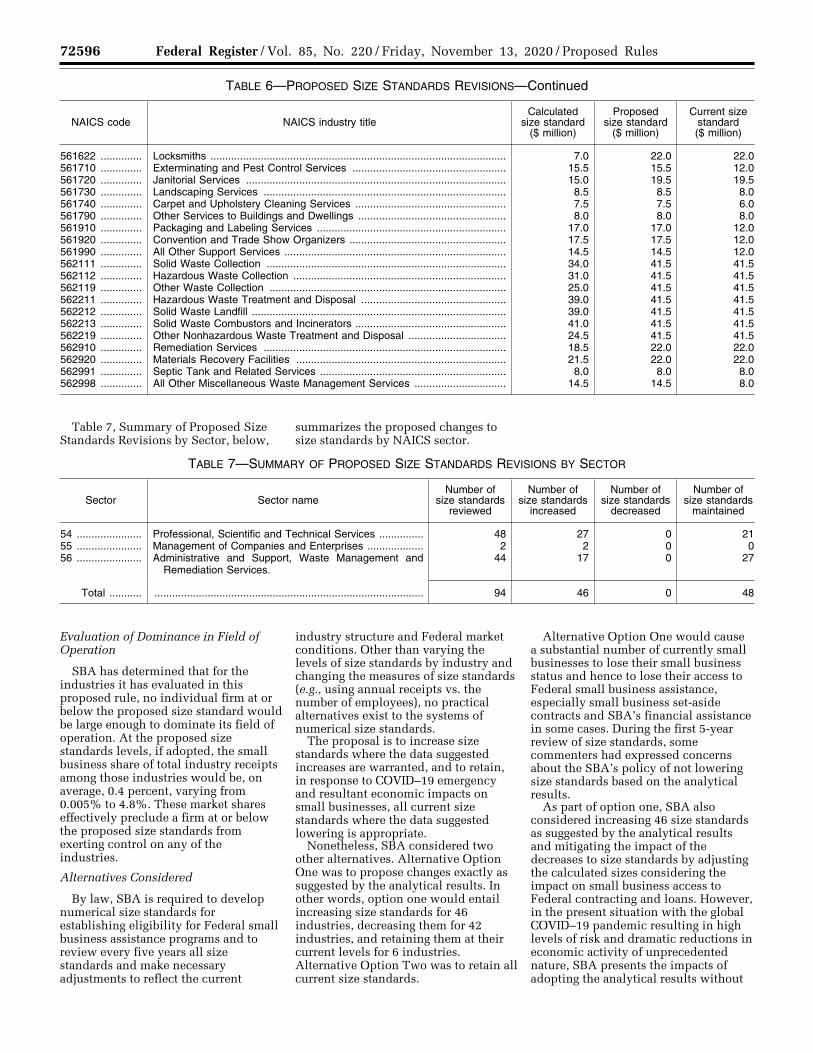
72596 Federal Register / Vol. 85, No. 220 / Friday, November 13, 2020 / Proposed Rules
TABLE 6—PROPOSED SIZE STANDARDS REVISIONS—Continued
NAICS code NAICS industry title Calculated
size standard ($ million)
Proposed size standard
($ million)
Current size standard ($ million)
561622 .............. Locksmiths .................................................................................................... 7.0 22.0 22.0 561710 .............. Exterminating and Pest Control Services .................................................... 15.5 15.5 12.0 561720 .............. Janitorial Services ........................................................................................ 15.0 19.5 19.5 561730 .............. Landscaping Services .................................................................................. 8.5 8.5 8.0 561740 .............. Carpet and Upholstery Cleaning Services ................................................... 7.5 7.5 6.0 561790 .............. Other Services to Buildings and Dwellings .................................................. 8.0 8.0 8.0 561910 .............. Packaging and Labeling Services ................................................................ 17.0 17.0 12.0 561920 .............. Convention and Trade Show Organizers ..................................................... 17.5 17.5 12.0 561990 .............. All Other Support Services ........................................................................... 14.5 14.5 12.0 562111 .............. Solid Waste Collection ................................................................................. 34.0 41.5 41.5 562112 .............. Hazardous Waste Collection ........................................................................ 31.0 41.5 41.5 562119 .............. Other Waste Collection ................................................................................ 25.0 41.5 41.5 562211 .............. Hazardous Waste Treatment and Disposal ................................................. 39.0 41.5 41.5 562212 .............. Solid Waste Landfill ...................................................................................... 39.0 41.5 41.5 562213 .............. Solid Waste Combustors and Incinerators ................................................... 41.0 41.5 41.5 562219 .............. Other Nonhazardous Waste Treatment and Disposal ................................. 24.5 41.5 41.5 562910 .............. Remediation Services .................................................................................. 18.5 22.0 22.0 562920 .............. Materials Recovery Facilities ....................................................................... 21.5 22.0 22.0 562991 .............. Septic Tank and Related Services ............................................................... 8.0 8.0 8.0 562998 .............. All Other Miscellaneous Waste Management Services ............................... 14.5 14.5 8.0
Table 7, Summary of Proposed Size Standards Revisions by Sector, below,
summarizes the proposed changes to size standards by NAICS sector.
TABLE 7—SUMMARY OF PROPOSED SIZE STANDARDS REVISIONS BY SECTOR
Sector Sector name Number of
size standards reviewed
Number of size standards
increased
Number of size standards
decreased
Number of size standards
maintained
54 ...................... Professional, Scientific and Technical Services ............... 48 27 0 21 55 ...................... Management of Companies and Enterprises ................... 2 2 0 0 56 ...................... Administrative and Support, Waste Management and
Remediation Services.44 17 0 27
Total ........... ........................................................................................... 94 46 0 48
Evaluation of Dominance in Field of Operation
SBA has determined that for the industries it has evaluated in this proposed rule, no individual firm at or below the proposed size standard would be large enough to dominate its field of operation. At the proposed size standards levels, if adopted, the small business share of total industry receipts among those industries would be, on average, 0.4 percent, varying from 0.005% to 4.8%. These market shares effectively preclude a firm at or below the proposed size standards from exerting control on any of the industries.
Alternatives Considered
By law, SBA is required to develop numerical size standards for establishing eligibility for Federal small business assistance programs and to review every five years all size standards and make necessary adjustments to reflect the current
industry structure and Federal market conditions. Other than varying the levels of size standards by industry and changing the measures of size standards (e.g., using annual receipts vs. the number of employees), no practical alternatives exist to the systems of numerical size standards.
The proposal is to increase size standards where the data suggested increases are warranted, and to retain, in response to COVID–19 emergency and resultant economic impacts on small businesses, all current size standards where the data suggested lowering is appropriate.
Nonetheless, SBA considered two other alternatives. Alternative Option One was to propose changes exactly as suggested by the analytical results. In other words, option one would entail increasing size standards for 46 industries, decreasing them for 42 industries, and retaining them at their current levels for 6 industries. Alternative Option Two was to retain all current size standards.
Alternative Option One would cause a substantial number of currently small businesses to lose their small business status and hence to lose their access to Federal small business assistance, especially small business set-aside contracts and SBA’s financial assistance in some cases. During the first 5-year review of size standards, some commenters had expressed concerns about the SBA’s policy of not lowering size standards based on the analytical results.
As part of option one, SBA also considered increasing 46 size standards as suggested by the analytical results and mitigating the impact of the decreases to size standards by adjusting the calculated sizes considering the impact on small business access to Federal contracting and loans. However, in the present situation with the global COVID–19 pandemic resulting in high levels of risk and dramatic reductions in economic activity of unprecedented nature, SBA presents the impacts of adopting the analytical results without
VerDate Sep<11>2014 16:23 Nov 12, 2020 Jkt 253001 PO 00000 Frm 00013 Fmt 4702 Sfmt 4702 E:\FR\FM\13NOP1.SGM 13NOP1jbel
l on
DS
KJL
SW
7X2P
RO
D w
ith P
RO
PO
SA
LS
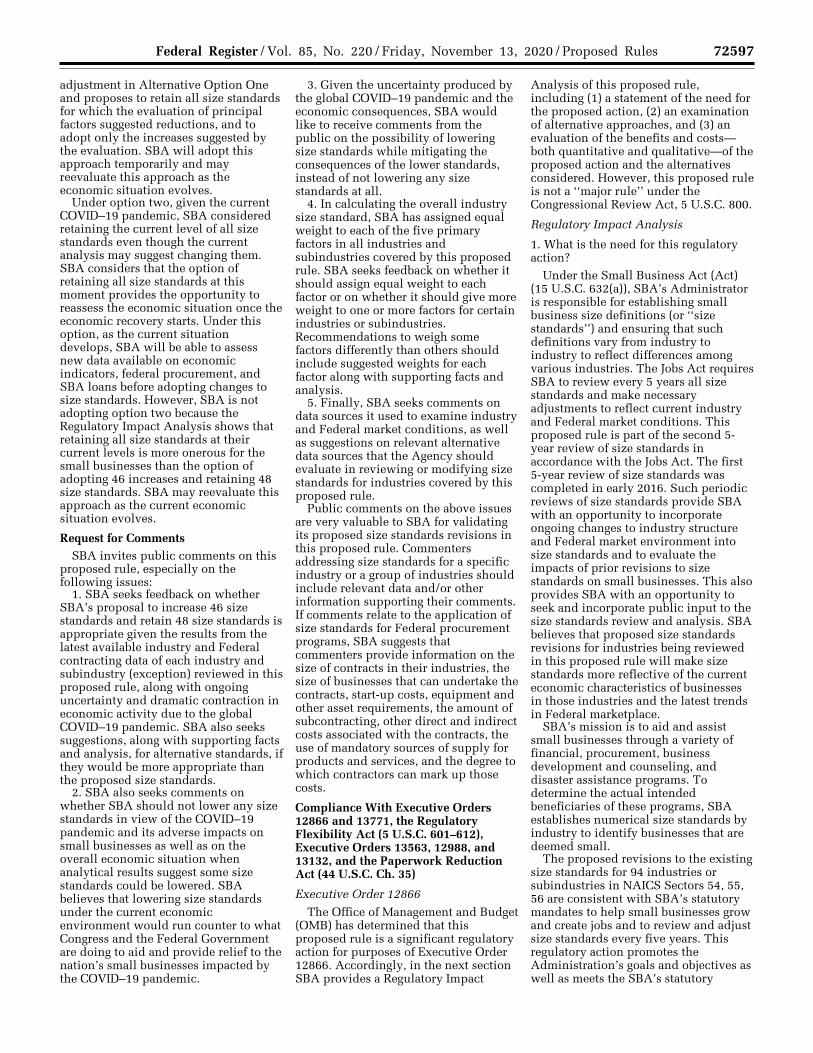
72597 Federal Register / Vol. 85, No. 220 / Friday, November 13, 2020 / Proposed Rules
adjustment in Alternative Option One and proposes to retain all size standards for which the evaluation of principal factors suggested reductions, and to adopt only the increases suggested by the evaluation. SBA will adopt this approach temporarily and may reevaluate this approach as the economic situation evolves.
Under option two, given the current COVID–19 pandemic, SBA considered retaining the current level of all size standards even though the current analysis may suggest changing them. SBA considers that the option of retaining all size standards at this moment provides the opportunity to reassess the economic situation once the economic recovery starts. Under this option, as the current situation develops, SBA will be able to assess new data available on economic indicators, federal procurement, and SBA loans before adopting changes to size standards. However, SBA is not adopting option two because the Regulatory Impact Analysis shows that retaining all size standards at their current levels is more onerous for the small businesses than the option of adopting 46 increases and retaining 48 size standards. SBA may reevaluate this approach as the current economic situation evolves.
Request for Comments SBA invites public comments on this
proposed rule, especially on the following issues:
1. SBA seeks feedback on whether SBA’s proposal to increase 46 size standards and retain 48 size standards is appropriate given the results from the latest available industry and Federal contracting data of each industry and subindustry (exception) reviewed in this proposed rule, along with ongoing uncertainty and dramatic contraction in economic activity due to the global COVID–19 pandemic. SBA also seeks suggestions, along with supporting facts and analysis, for alternative standards, if they would be more appropriate than the proposed size standards.
2. SBA also seeks comments on whether SBA should not lower any size standards in view of the COVID–19 pandemic and its adverse impacts on small businesses as well as on the overall economic situation when analytical results suggest some size standards could be lowered. SBA believes that lowering size standards under the current economic environment would run counter to what Congress and the Federal Government are doing to aid and provide relief to the nation’s small businesses impacted by the COVID–19 pandemic.
3. Given the uncertainty produced by the global COVID–19 pandemic and the economic consequences, SBA would like to receive comments from the public on the possibility of lowering size standards while mitigating the consequences of the lower standards, instead of not lowering any size standards at all.
4. In calculating the overall industry size standard, SBA has assigned equal weight to each of the five primary factors in all industries and subindustries covered by this proposed rule. SBA seeks feedback on whether it should assign equal weight to each factor or on whether it should give more weight to one or more factors for certain industries or subindustries. Recommendations to weigh some factors differently than others should include suggested weights for each factor along with supporting facts and analysis.
5. Finally, SBA seeks comments on data sources it used to examine industry and Federal market conditions, as well as suggestions on relevant alternative data sources that the Agency should evaluate in reviewing or modifying size standards for industries covered by this proposed rule.
Public comments on the above issues are very valuable to SBA for validating its proposed size standards revisions in this proposed rule. Commenters addressing size standards for a specific industry or a group of industries should include relevant data and/or other information supporting their comments. If comments relate to the application of size standards for Federal procurement programs, SBA suggests that commenters provide information on the size of contracts in their industries, the size of businesses that can undertake the contracts, start-up costs, equipment and other asset requirements, the amount of subcontracting, other direct and indirect costs associated with the contracts, the use of mandatory sources of supply for products and services, and the degree to which contractors can mark up those costs.
Compliance With Executive Orders 12866 and 13771, the Regulatory Flexibility Act (5 U.S.C. 601–612), Executive Orders 13563, 12988, and 13132, and the Paperwork Reduction Act (44 U.S.C. Ch. 35)
Executive Order 12866
The Office of Management and Budget (OMB) has determined that this proposed rule is a significant regulatory action for purposes of Executive Order 12866. Accordingly, in the next section SBA provides a Regulatory Impact
Analysis of this proposed rule, including (1) a statement of the need for the proposed action, (2) an examination of alternative approaches, and (3) an evaluation of the benefits and costs— both quantitative and qualitative—of the proposed action and the alternatives considered. However, this proposed rule is not a ‘‘major rule’’ under the Congressional Review Act, 5 U.S.C. 800.
Regulatory Impact Analysis
1. What is the need for this regulatory action?
Under the Small Business Act (Act) (15 U.S.C. 632(a)), SBA’s Administrator is responsible for establishing small business size definitions (or ‘‘size standards’’) and ensuring that such definitions vary from industry to industry to reflect differences among various industries. The Jobs Act requires SBA to review every 5 years all size standards and make necessary adjustments to reflect current industry and Federal market conditions. This proposed rule is part of the second 5- year review of size standards in accordance with the Jobs Act. The first 5-year review of size standards was completed in early 2016. Such periodic reviews of size standards provide SBA with an opportunity to incorporate ongoing changes to industry structure and Federal market environment into size standards and to evaluate the impacts of prior revisions to size standards on small businesses. This also provides SBA with an opportunity to seek and incorporate public input to the size standards review and analysis. SBA believes that proposed size standards revisions for industries being reviewed in this proposed rule will make size standards more reflective of the current economic characteristics of businesses in those industries and the latest trends in Federal marketplace.
SBA’s mission is to aid and assist small businesses through a variety of financial, procurement, business development and counseling, and disaster assistance programs. To determine the actual intended beneficiaries of these programs, SBA establishes numerical size standards by industry to identify businesses that are deemed small.
The proposed revisions to the existing size standards for 94 industries or subindustries in NAICS Sectors 54, 55, 56 are consistent with SBA’s statutory mandates to help small businesses grow and create jobs and to review and adjust size standards every five years. This regulatory action promotes the Administration’s goals and objectives as well as meets the SBA’s statutory
VerDate Sep<11>2014 16:23 Nov 12, 2020 Jkt 253001 PO 00000 Frm 00014 Fmt 4702 Sfmt 4702 E:\FR\FM\13NOP1.SGM 13NOP1jbel
l on
DS
KJL
SW
7X2P
RO
D w
ith P
RO
PO
SA
LS
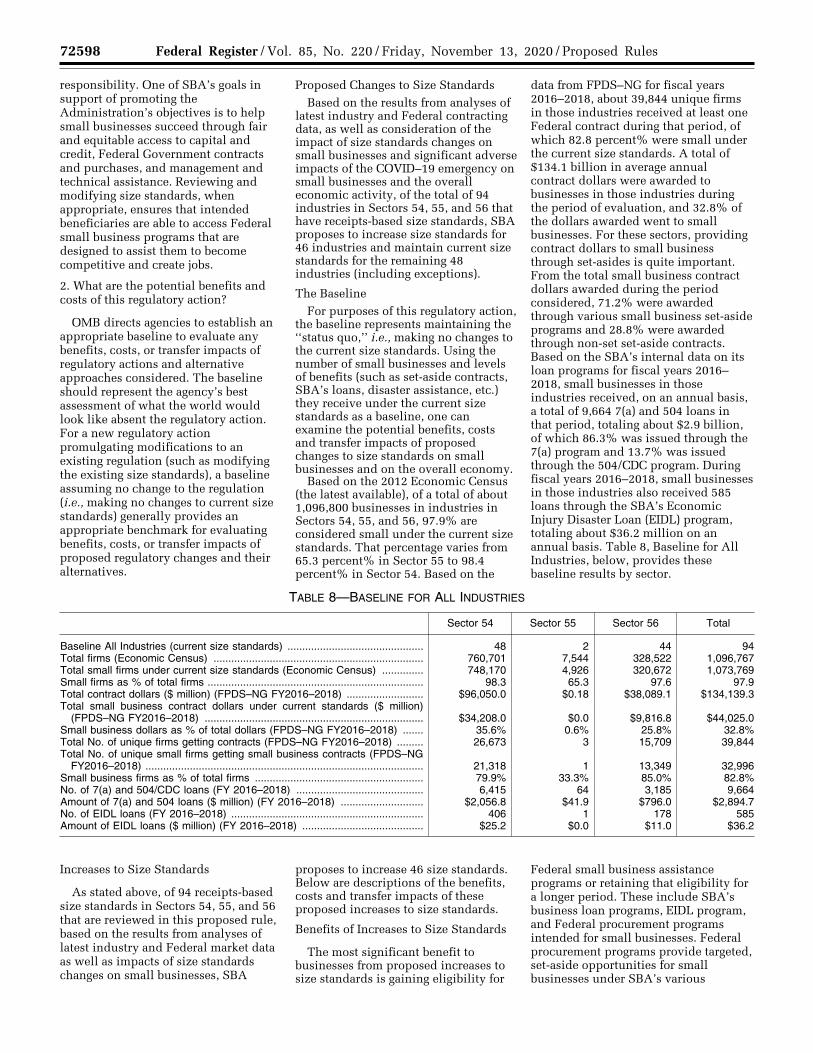
72598 Federal Register / Vol. 85, No. 220 / Friday, November 13, 2020 / Proposed Rules
responsibility. One of SBA’s goals in support of promoting the Administration’s objectives is to help small businesses succeed through fair and equitable access to capital and credit, Federal Government contracts and purchases, and management and technical assistance. Reviewing and modifying size standards, when appropriate, ensures that intended beneficiaries are able to access Federal small business programs that are designed to assist them to become competitive and create jobs.
2. What are the potential benefits and costs of this regulatory action?
OMB directs agencies to establish an appropriate baseline to evaluate any benefits, costs, or transfer impacts of regulatory actions and alternative approaches considered. The baseline should represent the agency’s best assessment of what the world would look like absent the regulatory action. For a new regulatory action promulgating modifications to an existing regulation (such as modifying the existing size standards), a baseline assuming no change to the regulation (i.e., making no changes to current size standards) generally provides an appropriate benchmark for evaluating benefits, costs, or transfer impacts of proposed regulatory changes and their alternatives.
Proposed Changes to Size Standards Based on the results from analyses of
latest industry and Federal contracting data, as well as consideration of the impact of size standards changes on small businesses and significant adverse impacts of the COVID–19 emergency on small businesses and the overall economic activity, of the total of 94 industries in Sectors 54, 55, and 56 that have receipts-based size standards, SBA proposes to increase size standards for 46 industries and maintain current size standards for the remaining 48 industries (including exceptions).
The Baseline For purposes of this regulatory action,
the baseline represents maintaining the ‘‘status quo,’’ i.e., making no changes to the current size standards. Using the number of small businesses and levels of benefits (such as set-aside contracts, SBA’s loans, disaster assistance, etc.) they receive under the current size standards as a baseline, one can examine the potential benefits, costs and transfer impacts of proposed changes to size standards on small businesses and on the overall economy.
Based on the 2012 Economic Census (the latest available), of a total of about 1,096,800 businesses in industries in Sectors 54, 55, and 56, 97.9% are considered small under the current size standards. That percentage varies from 65.3 percent% in Sector 55 to 98.4 percent% in Sector 54. Based on the
data from FPDS–NG for fiscal years 2016–2018, about 39,844 unique firms in those industries received at least one Federal contract during that period, of which 82.8 percent% were small under the current size standards. A total of $134.1 billion in average annual contract dollars were awarded to businesses in those industries during the period of evaluation, and 32.8% of the dollars awarded went to small businesses. For these sectors, providing contract dollars to small business through set-asides is quite important. From the total small business contract dollars awarded during the period considered, 71.2% were awarded through various small business set-aside programs and 28.8% were awarded through non-set set-aside contracts. Based on the SBA’s internal data on its loan programs for fiscal years 2016– 2018, small businesses in those industries received, on an annual basis, a total of 9,664 7(a) and 504 loans in that period, totaling about $2.9 billion, of which 86.3% was issued through the 7(a) program and 13.7% was issued through the 504/CDC program. During fiscal years 2016–2018, small businesses in those industries also received 585 loans through the SBA’s Economic Injury Disaster Loan (EIDL) program, totaling about $36.2 million on an annual basis. Table 8, Baseline for All Industries, below, provides these baseline results by sector.
TABLE 8—BASELINE FOR ALL INDUSTRIES
Sector 54 Sector 55 Sector 56 Total
Baseline All Industries (current size standards) .............................................. 48 2 44 94 Total firms (Economic Census) ....................................................................... 760,701 7,544 328,522 1,096,767 Total small firms under current size standards (Economic Census) .............. 748,170 4,926 320,672 1,073,769 Small firms as % of total firms ......................................................................... 98.3 65.3 97.6 97.9 Total contract dollars ($ million) (FPDS–NG FY2016–2018) .......................... $96,050.0 $0.18 $38,089.1 $134,139.3 Total small business contract dollars under current standards ($ million)
(FPDS–NG FY2016–2018) .......................................................................... $34,208.0 $0.0 $9,816.8 $44,025.0 Small business dollars as % of total dollars (FPDS–NG FY2016–2018) ....... 35.6% 0.6% 25.8% 32.8% Total No. of unique firms getting contracts (FPDS–NG FY2016–2018) ......... 26,673 3 15,709 39,844 Total No. of unique small firms getting small business contracts (FPDS–NG
FY2016–2018) .............................................................................................. 21,318 1 13,349 32,996 Small business firms as % of total firms ......................................................... 79.9% 33.3% 85.0% 82.8% No. of 7(a) and 504/CDC loans (FY 2016–2018) ........................................... 6,415 64 3,185 9,664 Amount of 7(a) and 504 loans ($ million) (FY 2016–2018) ............................ $2,056.8 $41.9 $796.0 $2,894.7 No. of EIDL loans (FY 2016–2018) ................................................................. 406 1 178 585 Amount of EIDL loans ($ million) (FY 2016–2018) ......................................... $25.2 $0.0 $11.0 $36.2
Increases to Size Standards
As stated above, of 94 receipts-based size standards in Sectors 54, 55, and 56 that are reviewed in this proposed rule, based on the results from analyses of latest industry and Federal market data as well as impacts of size standards changes on small businesses, SBA
proposes to increase 46 size standards. Below are descriptions of the benefits, costs and transfer impacts of these proposed increases to size standards.
Benefits of Increases to Size Standards
The most significant benefit to businesses from proposed increases to size standards is gaining eligibility for
Federal small business assistance programs or retaining that eligibility for a longer period. These include SBA’s business loan programs, EIDL program, and Federal procurement programs intended for small businesses. Federal procurement programs provide targeted, set-aside opportunities for small businesses under SBA’s various
VerDate Sep<11>2014 16:23 Nov 12, 2020 Jkt 253001 PO 00000 Frm 00015 Fmt 4702 Sfmt 4702 E:\FR\FM\13NOP1.SGM 13NOP1jbel
l on
DS
KJL
SW
7X2P
RO
D w
ith P
RO
PO
SA
LS
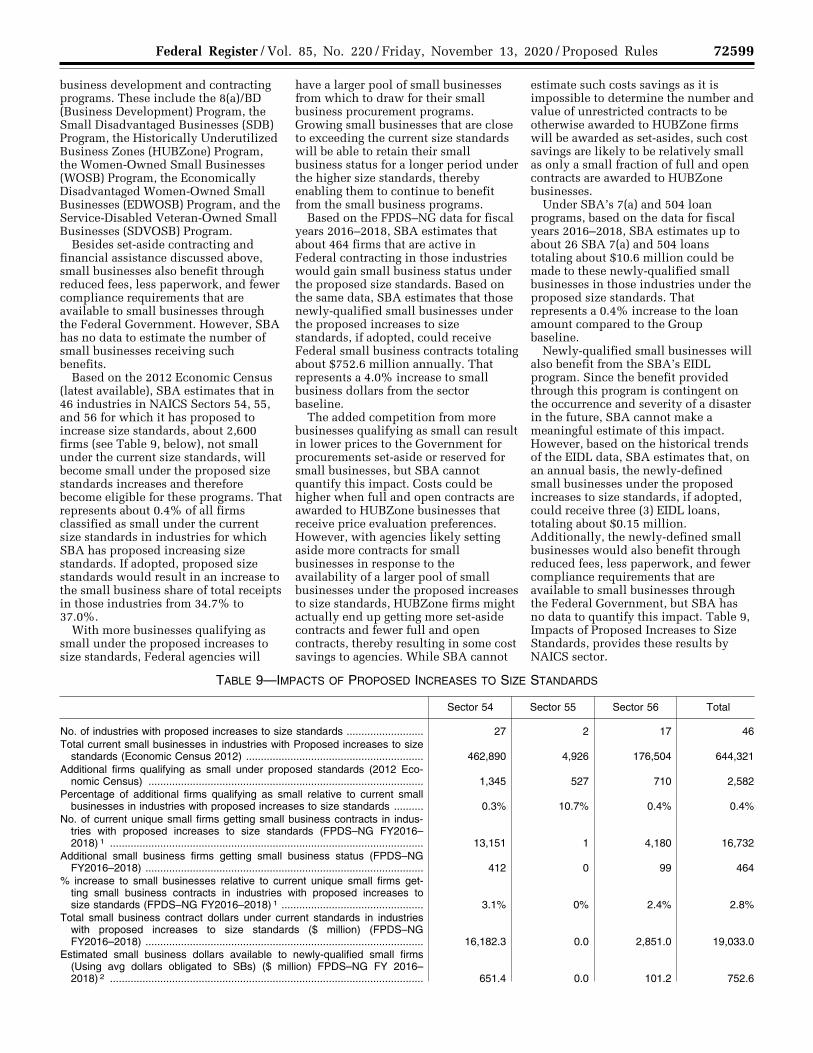
72599 Federal Register / Vol. 85, No. 220 / Friday, November 13, 2020 / Proposed Rules
business development and contracting programs. These include the 8(a)/BD (Business Development) Program, the Small Disadvantaged Businesses (SDB) Program, the Historically Underutilized Business Zones (HUBZone) Program, the Women-Owned Small Businesses (WOSB) Program, the Economically Disadvantaged Women-Owned Small Businesses (EDWOSB) Program, and the Service-Disabled Veteran-Owned Small Businesses (SDVOSB) Program.
Besides set-aside contracting and financial assistance discussed above, small businesses also benefit through reduced fees, less paperwork, and fewer compliance requirements that are available to small businesses through the Federal Government. However, SBA has no data to estimate the number of small businesses receiving such benefits.
Based on the 2012 Economic Census (latest available), SBA estimates that in 46 industries in NAICS Sectors 54, 55, and 56 for which it has proposed to increase size standards, about 2,600 firms (see Table 9, below), not small under the current size standards, will become small under the proposed size standards increases and therefore become eligible for these programs. That represents about 0.4% of all firms classified as small under the current size standards in industries for which SBA has proposed increasing size standards. If adopted, proposed size standards would result in an increase to the small business share of total receipts in those industries from 34.7% to 37.0%.
With more businesses qualifying as small under the proposed increases to size standards, Federal agencies will
have a larger pool of small businesses from which to draw for their small business procurement programs. Growing small businesses that are close to exceeding the current size standards will be able to retain their small business status for a longer period under the higher size standards, thereby enabling them to continue to benefit from the small business programs.
Based on the FPDS–NG data for fiscal years 2016–2018, SBA estimates that about 464 firms that are active in Federal contracting in those industries would gain small business status under the proposed size standards. Based on the same data, SBA estimates that those newly-qualified small businesses under the proposed increases to size standards, if adopted, could receive Federal small business contracts totaling about $752.6 million annually. That represents a 4.0% increase to small business dollars from the sector baseline.
The added competition from more businesses qualifying as small can result in lower prices to the Government for procurements set-aside or reserved for small businesses, but SBA cannot quantify this impact. Costs could be higher when full and open contracts are awarded to HUBZone businesses that receive price evaluation preferences. However, with agencies likely setting aside more contracts for small businesses in response to the availability of a larger pool of small businesses under the proposed increases to size standards, HUBZone firms might actually end up getting more set-aside contracts and fewer full and open contracts, thereby resulting in some cost savings to agencies. While SBA cannot
estimate such costs savings as it is impossible to determine the number and value of unrestricted contracts to be otherwise awarded to HUBZone firms will be awarded as set-asides, such cost savings are likely to be relatively small as only a small fraction of full and open contracts are awarded to HUBZone businesses.
Under SBA’s 7(a) and 504 loan programs, based on the data for fiscal years 2016–2018, SBA estimates up to about 26 SBA 7(a) and 504 loans totaling about $10.6 million could be made to these newly-qualified small businesses in those industries under the proposed size standards. That represents a 0.4% increase to the loan amount compared to the Group baseline.
Newly-qualified small businesses will also benefit from the SBA’s EIDL program. Since the benefit provided through this program is contingent on the occurrence and severity of a disaster in the future, SBA cannot make a meaningful estimate of this impact. However, based on the historical trends of the EIDL data, SBA estimates that, on an annual basis, the newly-defined small businesses under the proposed increases to size standards, if adopted, could receive three (3) EIDL loans, totaling about $0.15 million. Additionally, the newly-defined small businesses would also benefit through reduced fees, less paperwork, and fewer compliance requirements that are available to small businesses through the Federal Government, but SBA has no data to quantify this impact. Table 9, Impacts of Proposed Increases to Size Standards, provides these results by NAICS sector.
TABLE 9—IMPACTS OF PROPOSED INCREASES TO SIZE STANDARDS
Sector 54 Sector 55 Sector 56 Total
No. of industries with proposed increases to size standards .......................... 27 2 17 46 Total current small businesses in industries with Proposed increases to size
standards (Economic Census 2012) ............................................................ 462,890 4,926 176,504 644,321 Additional firms qualifying as small under proposed standards (2012 Eco-
nomic Census) ............................................................................................. 1,345 527 710 2,582 Percentage of additional firms qualifying as small relative to current small
businesses in industries with proposed increases to size standards .......... 0.3% 10.7% 0.4% 0.4% No. of current unique small firms getting small business contracts in indus-
tries with proposed increases to size standards (FPDS–NG FY2016– 2018) 1 .......................................................................................................... 13,151 1 4,180 16,732
Additional small business firms getting small business status (FPDS–NG FY2016–2018) .............................................................................................. 412 0 99 464
% increase to small businesses relative to current unique small firms get-ting small business contracts in industries with proposed increases to size standards (FPDS–NG FY2016–2018) 1 ................................................ 3.1% 0% 2.4% 2.8%
Total small business contract dollars under current standards in industries with proposed increases to size standards ($ million) (FPDS–NG FY2016–2018) .............................................................................................. 16,182.3 0.0 2,851.0 19,033.0
Estimated small business dollars available to newly-qualified small firms (Using avg dollars obligated to SBs) ($ million) FPDS–NG FY 2016– 2018) 2 .......................................................................................................... 651.4 0.0 101.2 752.6
VerDate Sep<11>2014 16:23 Nov 12, 2020 Jkt 253001 PO 00000 Frm 00016 Fmt 4702 Sfmt 4702 E:\FR\FM\13NOP1.SGM 13NOP1jbel
l on
DS
KJL
SW
7X2P
RO
D w
ith P
RO
PO
SA
LS
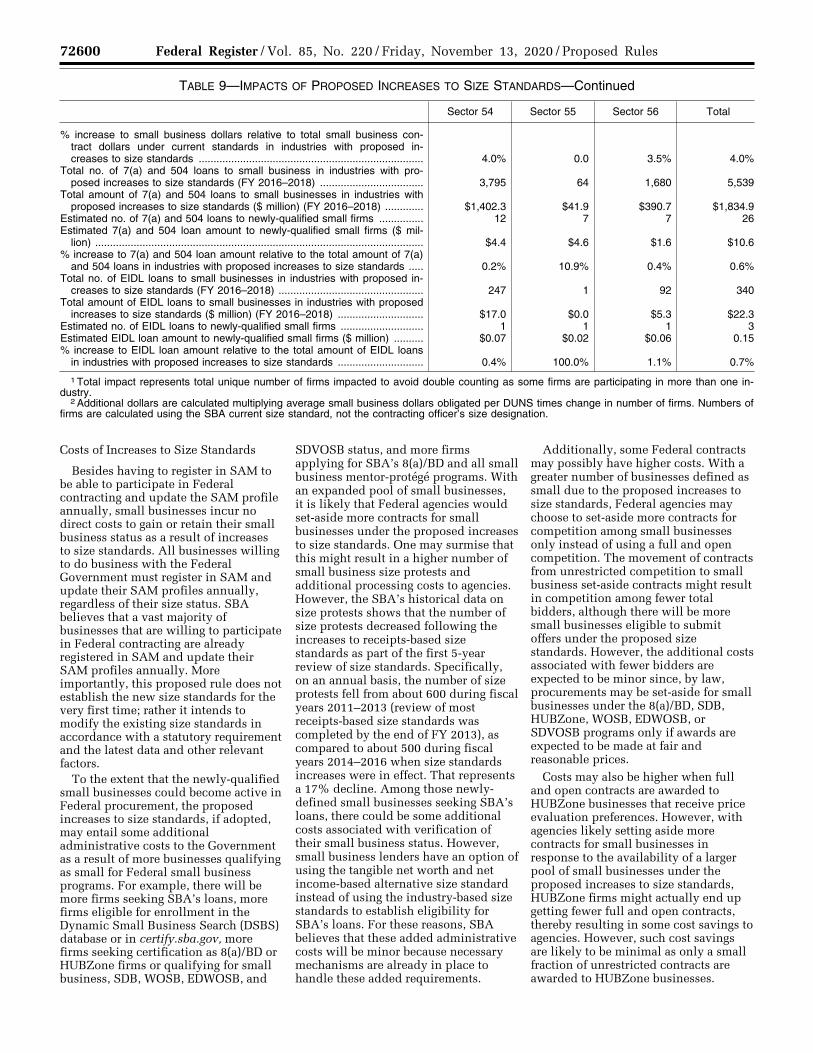
72600 Federal Register / Vol. 85, No. 220 / Friday, November 13, 2020 / Proposed Rules
TABLE 9—IMPACTS OF PROPOSED INCREASES TO SIZE STANDARDS—Continued
Sector 54 Sector 55 Sector 56 Total
% increase to small business dollars relative to total small business con-tract dollars under current standards in industries with proposed in-creases to size standards ............................................................................ 4.0% 0.0 3.5% 4.0%
Total no. of 7(a) and 504 loans to small business in industries with pro-posed increases to size standards (FY 2016–2018) ................................... 3,795 64 1,680 5,539
Total amount of 7(a) and 504 loans to small businesses in industries with proposed increases to size standards ($ million) (FY 2016–2018) ............. $1,402.3 $41.9 $390.7 $1,834.9
Estimated no. of 7(a) and 504 loans to newly-qualified small firms ............... 12 7 7 26 Estimated 7(a) and 504 loan amount to newly-qualified small firms ($ mil-
lion) ............................................................................................................... $4.4 $4.6 $1.6 $10.6 % increase to 7(a) and 504 loan amount relative to the total amount of 7(a)
and 504 loans in industries with proposed increases to size standards ..... 0.2% 10.9% 0.4% 0.6% Total no. of EIDL loans to small businesses in industries with proposed in-
creases to size standards (FY 2016–2018) ................................................. 247 1 92 340 Total amount of EIDL loans to small businesses in industries with proposed
increases to size standards ($ million) (FY 2016–2018) ............................. $17.0 $0.0 $5.3 $22.3 Estimated no. of EIDL loans to newly-qualified small firms ............................ 1 1 1 3 Estimated EIDL loan amount to newly-qualified small firms ($ million) .......... $0.07 $0.02 $0.06 0.15 % increase to EIDL loan amount relative to the total amount of EIDL loans
in industries with proposed increases to size standards ............................. 0.4% 100.0% 1.1% 0.7%
1 Total impact represents total unique number of firms impacted to avoid double counting as some firms are participating in more than one in-dustry.
2 Additional dollars are calculated multiplying average small business dollars obligated per DUNS times change in number of firms. Numbers of firms are calculated using the SBA current size standard, not the contracting officer’s size designation.
Costs of Increases to Size Standards
Besides having to register in SAM to be able to participate in Federal contracting and update the SAM profile annually, small businesses incur no direct costs to gain or retain their small business status as a result of increases to size standards. All businesses willing to do business with the Federal Government must register in SAM and update their SAM profiles annually, regardless of their size status. SBA believes that a vast majority of businesses that are willing to participate in Federal contracting are already registered in SAM and update their SAM profiles annually. More importantly, this proposed rule does not establish the new size standards for the very first time; rather it intends to modify the existing size standards in accordance with a statutory requirement and the latest data and other relevant factors.
To the extent that the newly-qualified small businesses could become active in Federal procurement, the proposed increases to size standards, if adopted, may entail some additional administrative costs to the Government as a result of more businesses qualifying as small for Federal small business programs. For example, there will be more firms seeking SBA’s loans, more firms eligible for enrollment in the Dynamic Small Business Search (DSBS) database or in certify.sba.gov, more firms seeking certification as 8(a)/BD or HUBZone firms or qualifying for small business, SDB, WOSB, EDWOSB, and
SDVOSB status, and more firms applying for SBA’s 8(a)/BD and all small business mentor-protege programs. With an expanded pool of small businesses, it is likely that Federal agencies would set-aside more contracts for small businesses under the proposed increases to size standards. One may surmise that this might result in a higher number of small business size protests and additional processing costs to agencies. However, the SBA’s historical data on size protests shows that the number of size protests decreased following the increases to receipts-based size standards as part of the first 5-year review of size standards. Specifically, on an annual basis, the number of size protests fell from about 600 during fiscal years 2011–2013 (review of most receipts-based size standards was completed by the end of FY 2013), as compared to about 500 during fiscal years 2014–2016 when size standards increases were in effect. That represents a 17% decline. Among those newly- defined small businesses seeking SBA’s loans, there could be some additional costs associated with verification of their small business status. However, small business lenders have an option of using the tangible net worth and net income-based alternative size standard instead of using the industry-based size standards to establish eligibility for SBA’s loans. For these reasons, SBA believes that these added administrative costs will be minor because necessary mechanisms are already in place to handle these added requirements.
Additionally, some Federal contracts may possibly have higher costs. With a greater number of businesses defined as small due to the proposed increases to size standards, Federal agencies may choose to set-aside more contracts for competition among small businesses only instead of using a full and open competition. The movement of contracts from unrestricted competition to small business set-aside contracts might result in competition among fewer total bidders, although there will be more small businesses eligible to submit offers under the proposed size standards. However, the additional costs associated with fewer bidders are expected to be minor since, by law, procurements may be set-aside for small businesses under the 8(a)/BD, SDB, HUBZone, WOSB, EDWOSB, or SDVOSB programs only if awards are expected to be made at fair and reasonable prices.
Costs may also be higher when full and open contracts are awarded to HUBZone businesses that receive price evaluation preferences. However, with agencies likely setting aside more contracts for small businesses in response to the availability of a larger pool of small businesses under the proposed increases to size standards, HUBZone firms might actually end up getting fewer full and open contracts, thereby resulting in some cost savings to agencies. However, such cost savings are likely to be minimal as only a small fraction of unrestricted contracts are awarded to HUBZone businesses.
VerDate Sep<11>2014 16:23 Nov 12, 2020 Jkt 253001 PO 00000 Frm 00017 Fmt 4702 Sfmt 4702 E:\FR\FM\13NOP1.SGM 13NOP1jbel
l on
DS
KJL
SW
7X2P
RO
D w
ith P
RO
PO
SA
LS

72601 Federal Register / Vol. 85, No. 220 / Friday, November 13, 2020 / Proposed Rules
Transfer Impacts of Increases to Size Standards
The proposed increases to size standards, if adopted, may result in some redistribution of Federal contracts between the newly-qualified small businesses and large businesses and between the newly-qualified small businesses and small businesses under the current standards. However, it would have no impact on the overall economic activity since total Federal contract dollars available for businesses to compete for will not change with changes to size standards. While SBA cannot quantify with certainty the actual outcome of the gains and losses from the redistribution contracts among different groups of businesses, it can identify several probable impacts in qualitative terms. With the availability of a larger pool of small businesses under the proposed increases to size standards, some unrestricted Federal contracts that would otherwise be awarded to large businesses may be set- aside for small businesses. As a result, large businesses may lose some Federal contracting opportunities. Similarly, some small businesses under the current size standards may obtain fewer set- aside contracts due to the increased competition from larger businesses qualifying as small under the proposed increases to size standards. This impact may be offset by a greater number of procurements being set-aside for all small businesses. With larger businesses qualifying as small under the higher size standards, smaller small businesses could face some disadvantage in competing for set-aside contracts against their larger counterparts. However, SBA cannot quantify these impacts.
3. What alternatives have been considered?
Under OMB Circular A–4, SBA is required to consider regulatory alternatives to the proposed changes in the proposed rule. In this section, SBA describes and analyzes two such alternatives to the proposed rule. Alternative Option One to the proposed rule, a more stringent alternative to the proposed rule, would propose adopting size standards based solely on the analytical results. In other words, the size standards of 46 industries for which the analytical results suggest raising size standards would be raised. However, the size standards of 42 industries or subindustries for which the analytical results suggest lowering size standards would be lowered. For the 6 remaining industries or subindustries, size standards would be maintained at their current levels. Alternative Option Two
would propose retaining all size standards for all industries, given the uncertainty generated by the ongoing COVID–19 pandemic. Below, SBA discusses and presents the net impacts of each option.
Alternative Option One: Consider Adopting All Calculated Size Standards
As discussed at the beginning of this section in this proposed rule, Alternative Option One would cause a substantial number of currently small businesses to lose their small business status and hence to lose their access to Federal small business assistance, especially small business set-aside contracts and SBA’s financial assistance in some cases. These consequences could be mitigated. For example, in response to the 2008 Financial Crisis and economic conditions that followed, SBA adopted a general policy in the first 5-year comprehensive size standards review to not lower any size standard (except to exclude one or more dominant firms) even when the analytical results suggested the size standard should be lowered. Currently, because of the economic challenges presented by the COVID–19 pandemic and the measures taken to protect public health, SBA has decided to propose the same general policy of not lowering size standards in the ongoing second 5-year comprehensive size standards review as well.
The primary benefit of adopting this alternative is that SBA’s procurement, management, technical and financial assistance resources would be targeted to the most appropriate beneficiaries of such programs according to the analytical results. Adopting the size standards suggested by the analytical results would also promote consistency with analytical results in SBA’s exercise of its authority to determine size standards. SBA seeks public comment on the impact of adopting the size standard as suggested by the analytical results.
As explained in the Size Standards Methodology White Paper, in addition to adopting all results of the primary analysis, SBA evaluates other relevant factors as needed such as the impact of the reductions or increases of size standards on the distribution of contracts awarded to small businesses, and may adopt different results with the intention of mitigating potential negative impacts.
We have discussed already the benefits and costs of increasing 46 size standards. Below we discuss the benefits and costs of decreasing 42 size standards.
Benefits of Decreases to Size Standards
The most significant benefit to businesses from decreases to size standards when SBA’s analysis suggests such decreases is to ensure that size standards are more reflective of latest industry structure and Federal market trends and that Federal small business assistance is more effectively targeted to its intended beneficiaries. These include SBA’s loan programs, EIDL program, and Federal procurement programs intended for small businesses. Federal procurement programs provide targeted, set-aside opportunities for small businesses under SBA’s business development programs, such as small business, 8(a)/BD, HUBZone, WOSB, EDWOSB, and SDVOSB programs. The adoption of smaller size standards when the results support them diminishes the risk of awarding contracts to firms that are not small anymore.
Decreasing size standards may reduce the administrative costs of the Government, because the risk of awarding contracts to other than small businesses may diminish when the size standards reflect better the structure of the market. The risks of providing SBA’s loans to firms that are not needing them the most, or allowing firms that are not eligible for small business set-asides or to participate on the SBA procurement programs will provide for a better chance for smaller firms to grow and benefit from the opportunities available on the Federal market, and strengthen the small business industrial base for the Federal Government.
Costs of Decreases to Size Standards
With fewer businesses qualifying as small under the decreases to size standards, Federal agencies will have a smaller pool of small businesses from which to draw for their small business procurement programs. For example, in Option One, during fiscal years 2016– 2018, agencies awarded, on an annual basis, about $24,762 million in small business contracts in those 42 industries for which this Option considered decreasing size standards. Table 10, Impacts of Decreases to Size Standards Under Alternative Option Option One, below shows that lowering size standards in 42 industries and subindustries would reduce Federal contract dollars awarded to small businesses by $1,027 million or about 4.1 percent % relative to the baseline level. Because of the importance of these sectors for the Federal procurement, SBA may adopt mitigating measures to reduce the negative impact under the assumptions of Option One. SBA could adopt one or more of the
VerDate Sep<11>2014 16:23 Nov 12, 2020 Jkt 253001 PO 00000 Frm 00018 Fmt 4702 Sfmt 4702 E:\FR\FM\13NOP1.SGM 13NOP1jbel
l on
DS
KJL
SW
7X2P
RO
D w
ith P
RO
PO
SA
LS
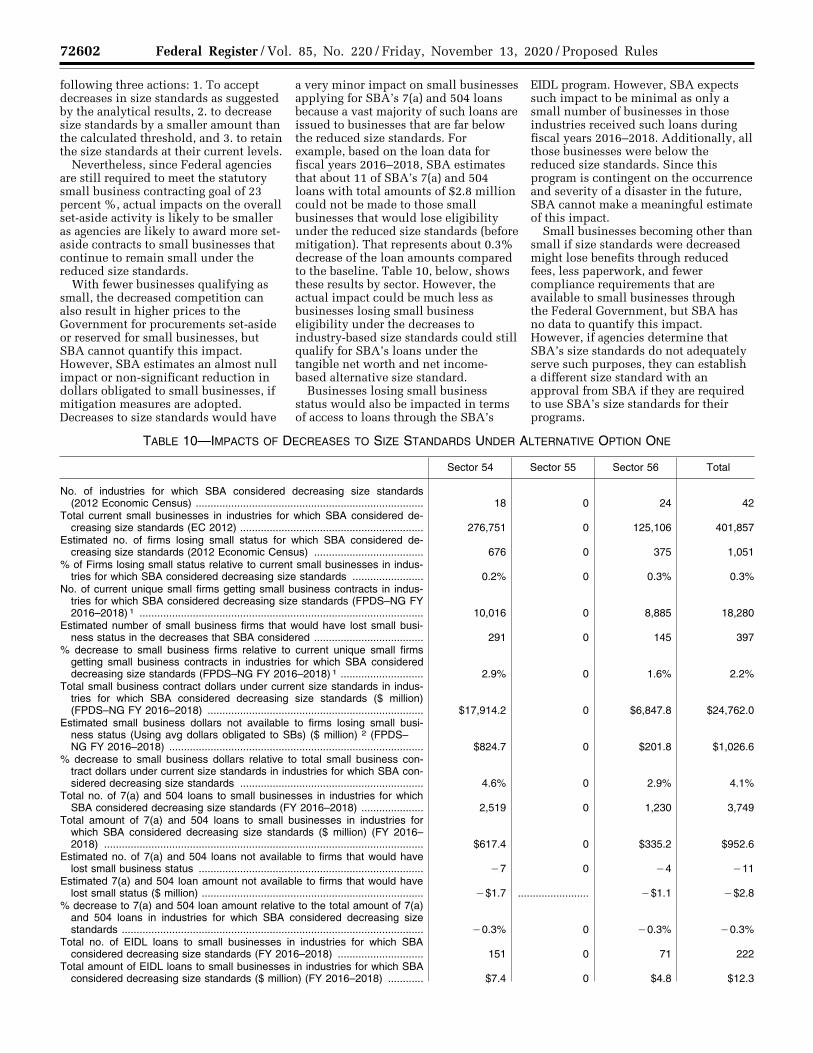
72602 Federal Register / Vol. 85, No. 220 / Friday, November 13, 2020 / Proposed Rules
following three actions: 1. To accept decreases in size standards as suggested by the analytical results, 2. to decrease size standards by a smaller amount than the calculated threshold, and 3. to retain the size standards at their current levels.
Nevertheless, since Federal agencies are still required to meet the statutory small business contracting goal of 23 percent %, actual impacts on the overall set-aside activity is likely to be smaller as agencies are likely to award more set- aside contracts to small businesses that continue to remain small under the reduced size standards.
With fewer businesses qualifying as small, the decreased competition can also result in higher prices to the Government for procurements set-aside or reserved for small businesses, but SBA cannot quantify this impact. However, SBA estimates an almost null impact or non-significant reduction in dollars obligated to small businesses, if mitigation measures are adopted. Decreases to size standards would have
a very minor impact on small businesses applying for SBA’s 7(a) and 504 loans because a vast majority of such loans are issued to businesses that are far below the reduced size standards. For example, based on the loan data for fiscal years 2016–2018, SBA estimates that about 11 of SBA’s 7(a) and 504 loans with total amounts of $2.8 million could not be made to those small businesses that would lose eligibility under the reduced size standards (before mitigation). That represents about 0.3% decrease of the loan amounts compared to the baseline. Table 10, below, shows these results by sector. However, the actual impact could be much less as businesses losing small business eligibility under the decreases to industry-based size standards could still qualify for SBA’s loans under the tangible net worth and net income- based alternative size standard.
Businesses losing small business status would also be impacted in terms of access to loans through the SBA’s
EIDL program. However, SBA expects such impact to be minimal as only a small number of businesses in those industries received such loans during fiscal years 2016–2018. Additionally, all those businesses were below the reduced size standards. Since this program is contingent on the occurrence and severity of a disaster in the future, SBA cannot make a meaningful estimate of this impact.
Small businesses becoming other than small if size standards were decreased might lose benefits through reduced fees, less paperwork, and fewer compliance requirements that are available to small businesses through the Federal Government, but SBA has no data to quantify this impact. However, if agencies determine that SBA’s size standards do not adequately serve such purposes, they can establish a different size standard with an approval from SBA if they are required to use SBA’s size standards for their programs.
TABLE 10—IMPACTS OF DECREASES TO SIZE STANDARDS UNDER ALTERNATIVE OPTION ONE
Sector 54 Sector 55 Sector 56 Total
No. of industries for which SBA considered decreasing size standards (2012 Economic Census) ............................................................................. 18 0 24 42
Total current small businesses in industries for which SBA considered de-creasing size standards (EC 2012) .............................................................. 276,751 0 125,106 401,857
Estimated no. of firms losing small status for which SBA considered de-creasing size standards (2012 Economic Census) ..................................... 676 0 375 1,051
% of Firms losing small status relative to current small businesses in indus-tries for which SBA considered decreasing size standards ........................ 0.2% 0 0.3% 0.3%
No. of current unique small firms getting small business contracts in indus-tries for which SBA considered decreasing size standards (FPDS–NG FY 2016–2018) 1 ................................................................................................ 10,016 0 8,885 18,280
Estimated number of small business firms that would have lost small busi-ness status in the decreases that SBA considered ..................................... 291 0 145 397
% decrease to small business firms relative to current unique small firms getting small business contracts in industries for which SBA considered decreasing size standards (FPDS–NG FY 2016–2018) 1 ............................ 2.9% 0 1.6% 2.2%
Total small business contract dollars under current size standards in indus-tries for which SBA considered decreasing size standards ($ million) (FPDS–NG FY 2016–2018) ......................................................................... $17,914.2 0 $6,847.8 $24,762.0
Estimated small business dollars not available to firms losing small busi-ness status (Using avg dollars obligated to SBs) ($ million) 2 (FPDS– NG FY 2016–2018) ...................................................................................... $824.7 0 $201.8 $1,026.6
% decrease to small business dollars relative to total small business con-tract dollars under current size standards in industries for which SBA con-sidered decreasing size standards .............................................................. 4.6% 0 2.9% 4.1%
Total no. of 7(a) and 504 loans to small businesses in industries for which SBA considered decreasing size standards (FY 2016–2018) ..................... 2,519 0 1,230 3,749
Total amount of 7(a) and 504 loans to small businesses in industries for which SBA considered decreasing size standards ($ million) (FY 2016– 2018) ............................................................................................................ $617.4 0 $335.2 $952.6
Estimated no. of 7(a) and 504 loans not available to firms that would have lost small business status ............................................................................ ¥7 0 ¥4 ¥11
Estimated 7(a) and 504 loan amount not available to firms that would have lost small status ($ million) ........................................................................... ¥$1.7 ........................ ¥$1.1 ¥$2.8
% decrease to 7(a) and 504 loan amount relative to the total amount of 7(a) and 504 loans in industries for which SBA considered decreasing size standards ...................................................................................................... ¥0.3% 0 ¥0.3% ¥0.3%
Total no. of EIDL loans to small businesses in industries for which SBA considered decreasing size standards (FY 2016–2018) ............................. 151 0 71 222
Total amount of EIDL loans to small businesses in industries for which SBA considered decreasing size standards ($ million) (FY 2016–2018) ............ $7.4 0 $4.8 $12.3
VerDate Sep<11>2014 16:23 Nov 12, 2020 Jkt 253001 PO 00000 Frm 00019 Fmt 4702 Sfmt 4702 E:\FR\FM\13NOP1.SGM 13NOP1jbel
l on
DS
KJL
SW
7X2P
RO
D w
ith P
RO
PO
SA
LS
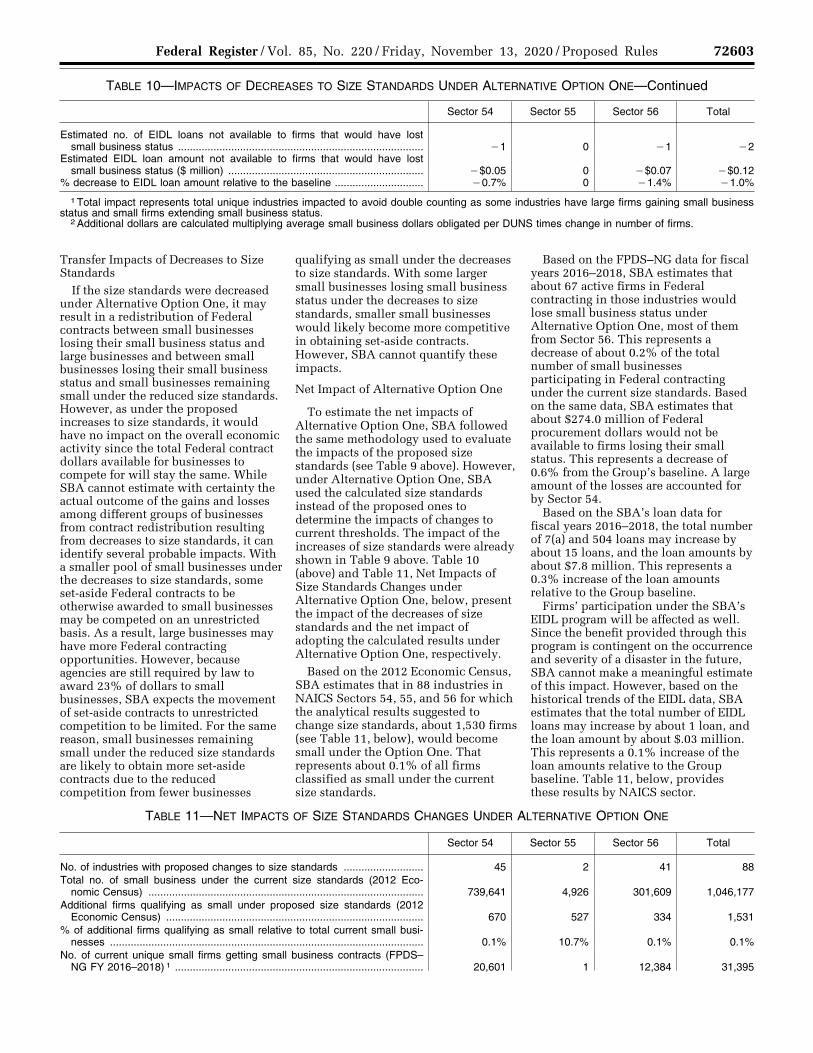
72603 Federal Register / Vol. 85, No. 220 / Friday, November 13, 2020 / Proposed Rules
TABLE 10—IMPACTS OF DECREASES TO SIZE STANDARDS UNDER ALTERNATIVE OPTION ONE—Continued
Sector 54 Sector 55 Sector 56 Total
Estimated no. of EIDL loans not available to firms that would have lost small business status ................................................................................... ¥1 0 ¥1 ¥2
Estimated EIDL loan amount not available to firms that would have lost small business status ($ million) .................................................................. ¥$0.05 0 ¥$0.07 ¥$0.12
% decrease to EIDL loan amount relative to the baseline .............................. ¥0.7% 0 ¥1.4% ¥1.0%
1 Total impact represents total unique industries impacted to avoid double counting as some industries have large firms gaining small business status and small firms extending small business status.
2 Additional dollars are calculated multiplying average small business dollars obligated per DUNS times change in number of firms.
Transfer Impacts of Decreases to Size Standards
If the size standards were decreased under Alternative Option One, it may result in a redistribution of Federal contracts between small businesses losing their small business status and large businesses and between small businesses losing their small business status and small businesses remaining small under the reduced size standards. However, as under the proposed increases to size standards, it would have no impact on the overall economic activity since the total Federal contract dollars available for businesses to compete for will stay the same. While SBA cannot estimate with certainty the actual outcome of the gains and losses among different groups of businesses from contract redistribution resulting from decreases to size standards, it can identify several probable impacts. With a smaller pool of small businesses under the decreases to size standards, some set-aside Federal contracts to be otherwise awarded to small businesses may be competed on an unrestricted basis. As a result, large businesses may have more Federal contracting opportunities. However, because agencies are still required by law to award 23% of dollars to small businesses, SBA expects the movement of set-aside contracts to unrestricted competition to be limited. For the same reason, small businesses remaining small under the reduced size standards are likely to obtain more set-aside contracts due to the reduced competition from fewer businesses
qualifying as small under the decreases to size standards. With some larger small businesses losing small business status under the decreases to size standards, smaller small businesses would likely become more competitive in obtaining set-aside contracts. However, SBA cannot quantify these impacts.
Net Impact of Alternative Option One
To estimate the net impacts of Alternative Option One, SBA followed the same methodology used to evaluate the impacts of the proposed size standards (see Table 9 above). However, under Alternative Option One, SBA used the calculated size standards instead of the proposed ones to determine the impacts of changes to current thresholds. The impact of the increases of size standards were already shown in Table 9 above. Table 10 (above) and Table 11, Net Impacts of Size Standards Changes under Alternative Option One, below, present the impact of the decreases of size standards and the net impact of adopting the calculated results under Alternative Option One, respectively.
Based on the 2012 Economic Census, SBA estimates that in 88 industries in NAICS Sectors 54, 55, and 56 for which the analytical results suggested to change size standards, about 1,530 firms (see Table 11, below), would become small under the Option One. That represents about 0.1% of all firms classified as small under the current size standards.
Based on the FPDS–NG data for fiscal years 2016–2018, SBA estimates that about 67 active firms in Federal contracting in those industries would lose small business status under Alternative Option One, most of them from Sector 56. This represents a decrease of about 0.2% of the total number of small businesses participating in Federal contracting under the current size standards. Based on the same data, SBA estimates that about $274.0 million of Federal procurement dollars would not be available to firms losing their small status. This represents a decrease of 0.6% from the Group’s baseline. A large amount of the losses are accounted for by Sector 54.
Based on the SBA’s loan data for fiscal years 2016–2018, the total number of 7(a) and 504 loans may increase by about 15 loans, and the loan amounts by about $7.8 million. This represents a 0.3% increase of the loan amounts relative to the Group baseline.
Firms’ participation under the SBA’s EIDL program will be affected as well. Since the benefit provided through this program is contingent on the occurrence and severity of a disaster in the future, SBA cannot make a meaningful estimate of this impact. However, based on the historical trends of the EIDL data, SBA estimates that the total number of EIDL loans may increase by about 1 loan, and the loan amount by about $.03 million. This represents a 0.1% increase of the loan amounts relative to the Group baseline. Table 11, below, provides these results by NAICS sector.
TABLE 11—NET IMPACTS OF SIZE STANDARDS CHANGES UNDER ALTERNATIVE OPTION ONE
Sector 54 Sector 55 Sector 56 Total
No. of industries with proposed changes to size standards ........................... 45 2 41 88 Total no. of small business under the current size standards (2012 Eco-
nomic Census) ............................................................................................. 739,641 4,926 301,609 1,046,177 Additional firms qualifying as small under proposed size standards (2012
Economic Census) ....................................................................................... 670 527 334 1,531 % of additional firms qualifying as small relative to total current small busi-
nesses .......................................................................................................... 0.1% 10.7% 0.1% 0.1% No. of current unique small firms getting small business contracts (FPDS–
NG FY 2016–2018) 1 .................................................................................... 20,601 1 12,384 31,395
VerDate Sep<11>2014 16:23 Nov 12, 2020 Jkt 253001 PO 00000 Frm 00020 Fmt 4702 Sfmt 4702 E:\FR\FM\13NOP1.SGM 13NOP1jbel
l on
DS
KJL
SW
7X2P
RO
D w
ith P
RO
PO
SA
LS
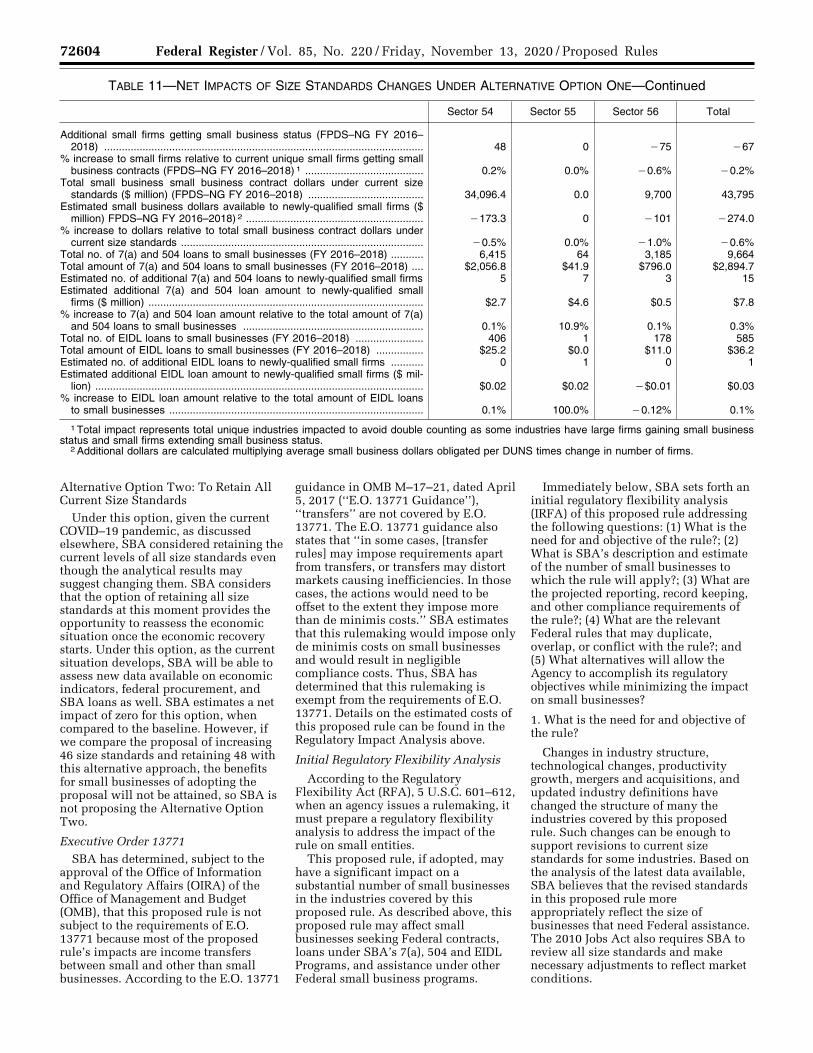
72604 Federal Register / Vol. 85, No. 220 / Friday, November 13, 2020 / Proposed Rules
TABLE 11—NET IMPACTS OF SIZE STANDARDS CHANGES UNDER ALTERNATIVE OPTION ONE—Continued
Sector 54 Sector 55 Sector 56 Total
Additional small firms getting small business status (FPDS–NG FY 2016– 2018) ............................................................................................................ 48 0 ¥75 ¥67
% increase to small firms relative to current unique small firms getting small business contracts (FPDS–NG FY 2016–2018) 1 ........................................ 0.2% 0.0% ¥0.6% ¥0.2%
Total small business small business contract dollars under current size standards ($ million) (FPDS–NG FY 2016–2018) ....................................... 34,096.4 0.0 9,700 43,795
Estimated small business dollars available to newly-qualified small firms ($ million) FPDS–NG FY 2016–2018) 2 ............................................................ ¥173.3 0 ¥101 ¥274.0
% increase to dollars relative to total small business contract dollars under current size standards .................................................................................. ¥0.5% 0.0% ¥1.0% ¥0.6%
Total no. of 7(a) and 504 loans to small businesses (FY 2016–2018) ........... 6,415 64 3,185 9,664 Total amount of 7(a) and 504 loans to small businesses (FY 2016–2018) .... $2,056.8 $41.9 $796.0 $2,894.7 Estimated no. of additional 7(a) and 504 loans to newly-qualified small firms 5 7 3 15 Estimated additional 7(a) and 504 loan amount to newly-qualified small
firms ($ million) ............................................................................................. $2.7 $4.6 $0.5 $7.8 % increase to 7(a) and 504 loan amount relative to the total amount of 7(a)
and 504 loans to small businesses ............................................................. 0.1% 10.9% 0.1% 0.3% Total no. of EIDL loans to small businesses (FY 2016–2018) ....................... 406 1 178 585 Total amount of EIDL loans to small businesses (FY 2016–2018) ................ $25.2 $0.0 $11.0 $36.2 Estimated no. of additional EIDL loans to newly-qualified small firms ........... 0 1 0 1 Estimated additional EIDL loan amount to newly-qualified small firms ($ mil-
lion) ............................................................................................................... $0.02 $0.02 ¥$0.01 $0.03 % increase to EIDL loan amount relative to the total amount of EIDL loans
to small businesses ...................................................................................... 0.1% 100.0% ¥0.12% 0.1%
1 Total impact represents total unique industries impacted to avoid double counting as some industries have large firms gaining small business status and small firms extending small business status.
2 Additional dollars are calculated multiplying average small business dollars obligated per DUNS times change in number of firms.
Alternative Option Two: To Retain All Current Size Standards
Under this option, given the current COVID–19 pandemic, as discussed elsewhere, SBA considered retaining the current levels of all size standards even though the analytical results may suggest changing them. SBA considers that the option of retaining all size standards at this moment provides the opportunity to reassess the economic situation once the economic recovery starts. Under this option, as the current situation develops, SBA will be able to assess new data available on economic indicators, federal procurement, and SBA loans as well. SBA estimates a net impact of zero for this option, when compared to the baseline. However, if we compare the proposal of increasing 46 size standards and retaining 48 with this alternative approach, the benefits for small businesses of adopting the proposal will not be attained, so SBA is not proposing the Alternative Option Two.
Executive Order 13771 SBA has determined, subject to the
approval of the Office of Information and Regulatory Affairs (OIRA) of the Office of Management and Budget (OMB), that this proposed rule is not subject to the requirements of E.O. 13771 because most of the proposed rule’s impacts are income transfers between small and other than small businesses. According to the E.O. 13771
guidance in OMB M–17–21, dated April 5, 2017 (‘‘E.O. 13771 Guidance’’), ‘‘transfers’’ are not covered by E.O. 13771. The E.O. 13771 guidance also states that ‘‘in some cases, [transfer rules] may impose requirements apart from transfers, or transfers may distort markets causing inefficiencies. In those cases, the actions would need to be offset to the extent they impose more than de minimis costs.’’ SBA estimates that this rulemaking would impose only de minimis costs on small businesses and would result in negligible compliance costs. Thus, SBA has determined that this rulemaking is exempt from the requirements of E.O. 13771. Details on the estimated costs of this proposed rule can be found in the Regulatory Impact Analysis above.
Initial Regulatory Flexibility Analysis
According to the Regulatory Flexibility Act (RFA), 5 U.S.C. 601–612, when an agency issues a rulemaking, it must prepare a regulatory flexibility analysis to address the impact of the rule on small entities.
This proposed rule, if adopted, may have a significant impact on a substantial number of small businesses in the industries covered by this proposed rule. As described above, this proposed rule may affect small businesses seeking Federal contracts, loans under SBA’s 7(a), 504 and EIDL Programs, and assistance under other Federal small business programs.
Immediately below, SBA sets forth an initial regulatory flexibility analysis (IRFA) of this proposed rule addressing the following questions: (1) What is the need for and objective of the rule?; (2) What is SBA’s description and estimate of the number of small businesses to which the rule will apply?; (3) What are the projected reporting, record keeping, and other compliance requirements of the rule?; (4) What are the relevant Federal rules that may duplicate, overlap, or conflict with the rule?; and (5) What alternatives will allow the Agency to accomplish its regulatory objectives while minimizing the impact on small businesses?
1. What is the need for and objective of the rule?
Changes in industry structure, technological changes, productivity growth, mergers and acquisitions, and updated industry definitions have changed the structure of many the industries covered by this proposed rule. Such changes can be enough to support revisions to current size standards for some industries. Based on the analysis of the latest data available, SBA believes that the revised standards in this proposed rule more appropriately reflect the size of businesses that need Federal assistance. The 2010 Jobs Act also requires SBA to review all size standards and make necessary adjustments to reflect market conditions.
VerDate Sep<11>2014 16:23 Nov 12, 2020 Jkt 253001 PO 00000 Frm 00021 Fmt 4702 Sfmt 4702 E:\FR\FM\13NOP1.SGM 13NOP1jbel
l on
DS
KJL
SW
7X2P
RO
D w
ith P
RO
PO
SA
LS

72605 Federal Register / Vol. 85, No. 220 / Friday, November 13, 2020 / Proposed Rules
2. What is SBA’s description and estimate of the number of small businesses to which the rule will apply?
Based on data from the 2012 Economic Census, SBA estimates that there are about 1.05 million small firms covered by this rulemaking under industries with proposed changes to size standards. If the proposed rule is adopted in its present form, SBA estimates that an additional 1,530 businesses will be defined as small.
3. What are the projected reporting, record keeping and other compliance requirements of the rule?
The proposed size standard changes impose no additional reporting or record keeping requirements on small businesses. However, qualifying for Federal procurement and a number of other programs requires that businesses register in SAM and self-certify that they are small at least once annually. Therefore, businesses opting to participate in those programs must comply with SAM requirements. Changes in small business size standards do not result in additional costs associated with SAM registration or certification. Changing size standards alters the access to SBA’s programs that assist small businesses but does not impose a regulatory burden because they neither regulate nor control business behavior.
4. What are the relevant Federal rules that may duplicate, overlap or conflict with the rule?
Under section 3(a)(2)(C) of the Small Business Act, 15 U.S.C. 632(a)(2)(c), Federal agencies must use SBA’s size standards to define a small business, unless specifically authorized by statute to do otherwise. In 1995, SBA published in the Federal Register a list of statutory and regulatory size standards that identified the application of SBA’s size standards as well as other size standards used by Federal agencies (60 FR 57988 (November 24, 1995)). SBA is not aware of any Federal rule that would duplicate or conflict with establishing size standards.
However, the Small Business Act and SBA’s regulations allow Federal agencies to develop different size standards if they believe that SBA’s size standards are not appropriate for their programs, with the approval of SBA’s Administrator (13 CFR 121.903). The Regulatory Flexibility Act authorizes an Agency to establish an alternative small business definition, after consultation with the Office of Advocacy of the U.S. Small Business Administration (5 U.S.C. 601(3)).
5. What alternatives will allow the Agency to accomplish its regulatory objectives while minimizing the impact on small entities?
By law, SBA is required to develop numerical size standards for establishing eligibility for Federal small business assistance programs. Other than varying size standards by industry and changing the size measures, no practical alternative exists to the systems of numerical size standards.
However, SBA considered two alternatives to its proposal to increase 46 size standards and maintain 48 size standards at their current levels. The first alternative SBA considered was adopting size standards based solely on the analytical results. In other words, the size standards of 46 industries for which the analytical results suggest raising size standards would be raised. However, the size standards of 42 industries for which the analytical results suggest lowering size standards would be lowered. This would cause a significant number of small businesses to lose their small business status, particularly in sectors 54 and 56 (please see table 10). Under the second alternative, in view of the COVID–19 pandemic, SBA considered retaining all size standards at the current levels, even though the analytical results may suggest increasing 46 size standards and decreasing 42. Retaining all size standards at their current levels would be more onerous for small businesses than the option of adopting 46 increases and retaining the rest of the size standards.
Executive Order 13563
Executive Order 13563 emphasizes the importance of quantifying both costs and benefits, reducing costs, harmonizing rules, and promoting flexibility. A description of the need for this regulatory action and benefits and costs associated with this action, including possible distributional impacts that relate to Executive Order 13563, is included above in the Regulatory Impact Analysis under Executive Order 12866. Additionally, Executive Order 13563, section 6, calls for retrospective analyses of existing rules.
The review of size standards in the industries covered by this proposed rule is consistent with section 6 of Executive Order 13563 and the 2010 Jobs Act, which requires SBA to review all size standards and make necessary adjustments to reflect market conditions. Specifically, the 2010 Jobs Act requires SBA to review at least one- third of all size standards during every
18-month period from the date of its enactment (September 27, 2010) and to review all size standards not less frequently than once every 5 years, thereafter. SBA had already launched a comprehensive review of size standards in 2007. In accordance with the Jobs Act, SBA completed the comprehensive review of the small business size standard for each industry, except those for agricultural enterprises previously set by Congress, and made appropriate adjustments to size standards for a number of industries to reflect current Federal and industry market conditions. The first comprehensive review was completed in 2015. Prior to 2007, the last time SBA conducted a comprehensive review of all size standards was during the late 1970s and early 1980s.
SBA issued a White Paper entitled ‘‘Size Standards Methodology’’ and published a notice in the April 11, 2019, edition of the Federal Register (84 FR 14587) to advise the public that the document is available for public review and comments. The ‘‘Size Standards Methodology’’ White Paper explains how SBA establishes, reviews, and modifies its receipts-based and employee-based small business size standards. SBA gave appropriate consideration to all input, suggestions, recommendations, and relevant information obtained from industry groups, individual businesses, and Federal agencies in developing size standards for those industries covered by this proposed rule.
Executive Order 12988 This action meets applicable
standards set forth in sections 3(a) and 3(b)(2) of Executive Order 12988, Civil Justice Reform, to minimize litigation, eliminate ambiguity, and reduce burden. The action does not have retroactive or preemptive effect.
Executive Order 13132 For purposes of Executive Order
13132, SBA has determined that this proposed rule will not have substantial, direct effects on the States, on the relationship between the National Government and the States, or on the distribution of power and responsibilities among the various levels of government. Therefore, SBA has determined that this proposed rule has no federalism implications warranting preparation of a federalism assessment.
Paperwork Reduction Act For the purpose of the Paperwork
Reduction Act, 44 U.S.C. Ch. 35, SBA has determined that this proposed rule
VerDate Sep<11>2014 16:23 Nov 12, 2020 Jkt 253001 PO 00000 Frm 00022 Fmt 4702 Sfmt 4702 E:\FR\FM\13NOP1.SGM 13NOP1jbel
l on
DS
KJL
SW
7X2P
RO
D w
ith P
RO
PO
SA
LS
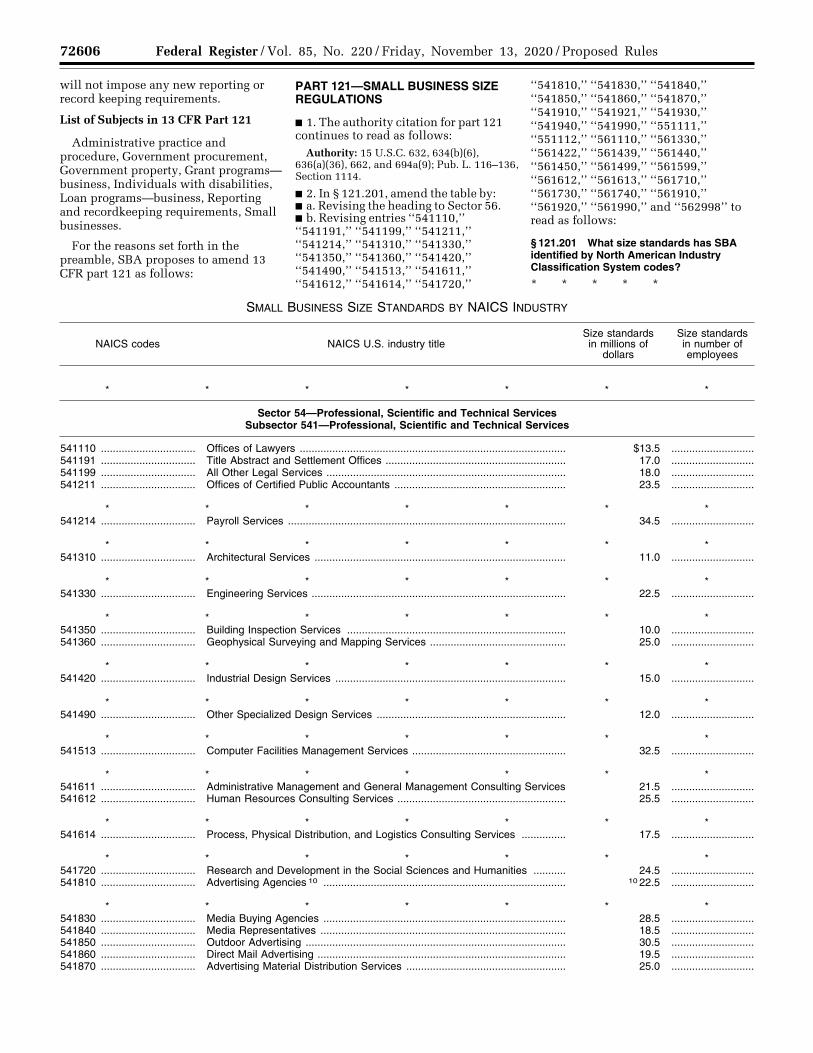
72606 Federal Register / Vol. 85, No. 220 / Friday, November 13, 2020 / Proposed Rules
will not impose any new reporting or record keeping requirements.
List of Subjects in 13 CFR Part 121
Administrative practice and procedure, Government procurement, Government property, Grant programs— business, Individuals with disabilities, Loan programs—business, Reporting and recordkeeping requirements, Small businesses.
For the reasons set forth in the preamble, SBA proposes to amend 13 CFR part 121 as follows:
PART 121—SMALL BUSINESS SIZE REGULATIONS
■ 1. The authority citation for part 121 continues to read as follows:
Authority: 15 U.S.C. 632, 634(b)(6), 636(a)(36), 662, and 694a(9); Pub. L. 116–136, Section 1114.
■ 2. In § 121.201, amend the table by: ■ a. Revising the heading to Sector 56. ■ b. Revising entries ‘‘541110,’’ ‘‘541191,’’ ‘‘541199,’’ ‘‘541211,’’ ‘‘541214,’’ ‘‘541310,’’ ‘‘541330,’’ ‘‘541350,’’ ‘‘541360,’’ ‘‘541420,’’ ‘‘541490,’’ ‘‘541513,’’ ‘‘541611,’’ ‘‘541612,’’ ‘‘541614,’’ ‘‘541720,’’
‘‘541810,’’ ‘‘541830,’’ ‘‘541840,’’ ‘‘541850,’’ ‘‘541860,’’ ‘‘541870,’’ ‘‘541910,’’ ‘‘541921,’’ ‘‘541930,’’ ‘‘541940,’’ ‘‘541990,’’ ‘‘551111,’’ ‘‘551112,’’ ‘‘561110,’’ ‘‘561330,’’ ‘‘561422,’’ ‘‘561439,’’ ‘‘561440,’’ ‘‘561450,’’ ‘‘561499,’’ ‘‘561599,’’ ‘‘561612,’’ ‘‘561613,’’ ‘‘561710,’’ ‘‘561730,’’ ‘‘561740,’’ ‘‘561910,’’ ‘‘561920,’’ ‘‘561990,’’ and ‘‘562998’’ to read as follows:
§ 121.201 What size standards has SBA identified by North American Industry Classification System codes?
* * * * *
SMALL BUSINESS SIZE STANDARDS BY NAICS INDUSTRY
NAICS codes NAICS U.S. industry title Size standards in millions of
dollars
Size standards in number of employees
* * * * * * *
Sector 54—Professional, Scientific and Technical Services Subsector 541—Professional, Scientific and Technical Services
541110 ................................ Offices of Lawyers .......................................................................................... $13.5 ............................541191 ................................ Title Abstract and Settlement Offices ............................................................. 17.0 ............................541199 ................................ All Other Legal Services ................................................................................. 18.0 ............................541211 ................................ Offices of Certified Public Accountants .......................................................... 23.5 ............................
* * * * * * * 541214 ................................ Payroll Services .............................................................................................. 34.5 ............................
* * * * * * * 541310 ................................ Architectural Services ..................................................................................... 11.0 ............................
* * * * * * * 541330 ................................ Engineering Services ...................................................................................... 22.5 ............................
* * * * * * * 541350 ................................ Building Inspection Services .......................................................................... 10.0 ............................541360 ................................ Geophysical Surveying and Mapping Services .............................................. 25.0 ............................
* * * * * * * 541420 ................................ Industrial Design Services .............................................................................. 15.0 ............................
* * * * * * * 541490 ................................ Other Specialized Design Services ................................................................ 12.0 ............................
* * * * * * * 541513 ................................ Computer Facilities Management Services .................................................... 32.5 ............................
* * * * * * * 541611 ................................ Administrative Management and General Management Consulting Services 21.5 ............................541612 ................................ Human Resources Consulting Services ......................................................... 25.5 ............................
* * * * * * * 541614 ................................ Process, Physical Distribution, and Logistics Consulting Services ............... 17.5 ............................
* * * * * * * 541720 ................................ Research and Development in the Social Sciences and Humanities ........... 24.5 ............................541810 ................................ Advertising Agencies 10 .................................................................................. 10 22.5 ............................
* * * * * * * 541830 ................................ Media Buying Agencies .................................................................................. 28.5 ............................541840 ................................ Media Representatives ................................................................................... 18.5 ............................541850 ................................ Outdoor Advertising ........................................................................................ 30.5 ............................541860 ................................ Direct Mail Advertising .................................................................................... 19.5 ............................541870 ................................ Advertising Material Distribution Services ...................................................... 25.0 ............................
VerDate Sep<11>2014 16:23 Nov 12, 2020 Jkt 253001 PO 00000 Frm 00023 Fmt 4702 Sfmt 4702 E:\FR\FM\13NOP1.SGM 13NOP1jbel
l on
DS
KJL
SW
7X2P
RO
D w
ith P
RO
PO
SA
LS
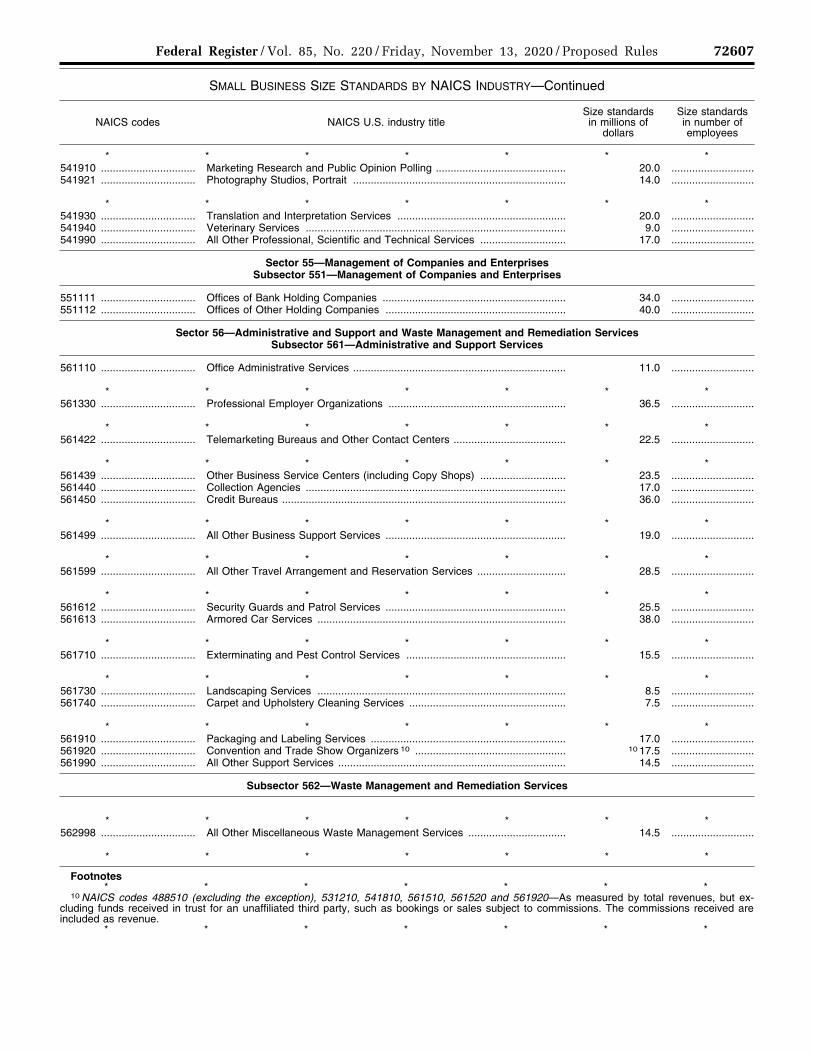
72607 Federal Register / Vol. 85, No. 220 / Friday, November 13, 2020 / Proposed Rules
SMALL BUSINESS SIZE STANDARDS BY NAICS INDUSTRY—Continued
NAICS codes NAICS U.S. industry title Size standards in millions of
dollars
Size standards in number of employees
* * * * * * * 541910 ................................ Marketing Research and Public Opinion Polling ............................................ 20.0 ............................541921 ................................ Photography Studios, Portrait ........................................................................ 14.0 ............................
* * * * * * * 541930 ................................ Translation and Interpretation Services ......................................................... 20.0 ............................541940 ................................ Veterinary Services ........................................................................................ 9.0 ............................541990 ................................ All Other Professional, Scientific and Technical Services ............................. 17.0 ............................
Sector 55—Management of Companies and Enterprises Subsector 551—Management of Companies and Enterprises
551111 ................................ Offices of Bank Holding Companies .............................................................. 34.0 ............................551112 ................................ Offices of Other Holding Companies ............................................................. 40.0 ............................
Sector 56—Administrative and Support and Waste Management and Remediation Services Subsector 561—Administrative and Support Services
561110 ................................ Office Administrative Services ........................................................................ 11.0 ............................
* * * * * * * 561330 ................................ Professional Employer Organizations ............................................................ 36.5 ............................
* * * * * * * 561422 ................................ Telemarketing Bureaus and Other Contact Centers ...................................... 22.5 ............................
* * * * * * * 561439 ................................ Other Business Service Centers (including Copy Shops) ............................. 23.5 ............................561440 ................................ Collection Agencies ........................................................................................ 17.0 ............................561450 ................................ Credit Bureaus ................................................................................................ 36.0 ............................
* * * * * * * 561499 ................................ All Other Business Support Services ............................................................. 19.0 ............................
* * * * * * * 561599 ................................ All Other Travel Arrangement and Reservation Services .............................. 28.5 ............................
* * * * * * * 561612 ................................ Security Guards and Patrol Services ............................................................. 25.5 ............................561613 ................................ Armored Car Services .................................................................................... 38.0 ............................
* * * * * * * 561710 ................................ Exterminating and Pest Control Services ...................................................... 15.5 ............................
* * * * * * * 561730 ................................ Landscaping Services .................................................................................... 8.5 ............................561740 ................................ Carpet and Upholstery Cleaning Services ..................................................... 7.5 ............................
* * * * * * * 561910 ................................ Packaging and Labeling Services .................................................................. 17.0 ............................561920 ................................ Convention and Trade Show Organizers 10 ................................................... 10 17.5 ............................561990 ................................ All Other Support Services ............................................................................. 14.5 ............................
Subsector 562—Waste Management and Remediation Services
* * * * * * * 562998 ................................ All Other Miscellaneous Waste Management Services ................................. 14.5 ............................
* * * * * * *
Footnotes * * * * * * *
10 NAICS codes 488510 (excluding the exception), 531210, 541810, 561510, 561520 and 561920—As measured by total revenues, but ex-cluding funds received in trust for an unaffiliated third party, such as bookings or sales subject to commissions. The commissions received are included as revenue.
* * * * * * *
VerDate Sep<11>2014 16:23 Nov 12, 2020 Jkt 253001 PO 00000 Frm 00024 Fmt 4702 Sfmt 4702 E:\FR\FM\13NOP1.SGM 13NOP1jbel
l on
DS
KJL
SW
7X2P
RO
D w
ith P
RO
PO
SA
LS
72608 Federal Register / Vol. 85, No. 220 / Friday, November 13, 2020 / Proposed Rules
Jovita Carranza, Administrator. [FR Doc. 2020–24903 Filed 11–12–20; 8:45 am]
BILLING CODE 8026–03–P
DEPARTMENT OF TRANSPORTATION
Federal Aviation Administration
14 CFR Part 39
[Docket No. FAA–2020–1025; Project Identifier MCAI–2020–00757–E]
RIN 2120–AA64
Airworthiness Directives; Rolls-Royce Deutschland Ltd. & Co KG (Type Certificate Previously Held by BMW Rolls-Royce GmbH and BMW Rolls- Royce Aero Engines) Turbofan Engines
AGENCY: Federal Aviation Administration (FAA), DOT. ACTION: Notice of proposed rulemaking (NPRM).
SUMMARY: The FAA proposes to adopt a new airworthiness directive (AD) for certain Rolls-Royce Deutschland Ltd. & Co KG (RRD) BR700–715A1–30, BR700– 715B1–30, and BR700–715C1–30 model turbofan engines. This proposed AD was prompted by reports of HPT stage 1 blades failing in service due to sulphidation and subsequent crack initiation. This proposed AD would require removal and replacement of the HPT stage 1 blade and HPT stage 1 blade damper. The FAA is proposing this AD to address the unsafe condition on these products. DATES: The FAA must receive comments on this proposed AD by December 28, 2020. ADDRESSES: You may send comments, using the procedures found in 14 CFR 11.43 and 11.45, by any of the following methods:
• Federal eRulemaking Portal: Go to https://www.regulations.gov. Follow the instructions for submitting comments.
• Fax: (202) 493–2251. • Mail: U.S. Department of
Transportation, Docket Operations, M– 30, West Building Ground Floor, Room W12 140, 1200 New Jersey Avenue SE, Washington, DC 20590.
• Hand Delivery: Deliver to Mail address above between 9 a.m. and 5 p.m., Monday through Friday, except Federal holidays.
For service information identified in this NPRM, contact Rolls-Royce Deutschland Ltd. & Co KG, Eschenweg 11, 15827 Blankenfelde-Mahlow, Germany; phone: +49 (0) 33 708 6 0; website: https://www.rolls-royce.com/
contact-us.aspx. You may view this service information at the FAA, Airworthiness Products Section, Operational Safety Branch, 1200 District Avenue, Burlington, MA 01803. For information on the availability of this material at the FAA, call (781) 238– 7759.
Examining the AD Docket You may examine the AD docket at
https://www.regulations.gov by searching for and locating Docket No. FAA–2020–1025; or in person at Docket Operations between 9 a.m. and 5 p.m., Monday through Friday, except Federal holidays. The AD docket contains this NPRM, the mandatory continuing airworthiness information (MCAI), any comments received, and other information. The street address for Docket Operations is listed above. FOR FURTHER INFORMATION CONTACT: Barbara Caufield, Aviation Safety Engineer, ECO Branch, FAA, 1200 District Avenue, Burlington, MA 01803; phone: (781) 238–7146; fax: (781) 238– 7199; email: [email protected]. SUPPLEMENTARY INFORMATION:
Comments Invited The FAA invites you to send any
written relevant data, views, or arguments about this proposal AD. Send your comments to an address listed under ADDRESSES. Include ‘‘Docket No. FAA–2020–1025; Project Identifier MCAI–2020–00757–E’’ at the beginning of your comments. The most helpful comments reference a specific portion of the proposal, explain the reason for any recommended change, and include supporting data. The FAA will consider all comments received by the closing date and may amend this NPRM because of those comments.
Except for Confidential Business Information (CBI) as described in the following paragraph, and other information as described in 14 CFR 11.35, the FAA will post all comments received, without change, to https://www.regulations.gov, including any personal information you provide. The agency will also post a report summarizing each substantive verbal contact received about this proposal.
Confidential Business Information CBI is commercial or financial
information that is both customarily and actually treated as private by its owner. Under the Freedom of Information Act (FOIA) (5 U.S.C. 552), CBI is exempt from public disclosure. If your comments responsive to this NPRM contain commercial or financial information that is customarily treated as private, that you actually treat as
private, and that is relevant or responsive to this NPRM, it is important that you clearly designate the submitted comments as CBI. Please mark each page of your submission containing CBI as ‘‘PROPIN.’’ The FAA will treat such marked submissions as confidential under the FOIA, and they will not be placed in the public docket of this NPRM. Submissions containing CBI should be sent to Barbara Caufield, Aviation Safety Engineer, ECO Branch, FAA, 1200 District Avenue, Burlington, MA 01803. Any commentary that the FAA receives which is not specifically designated as CBI will be placed in the public docket for this rulemaking.
Background
The European Aviation Safety Agency (EASA), which is the Technical Agent for the Member States of the European Community, has issued EASA AD 2018– 0194, dated September 4, 2018 (referred to after this as ‘‘the MCAI’’), to address the unsafe condition on these products. The MCAI states:
Occurrences have been reported on RRD BR700–715 engines where certain HP turbine stage 1 blades failed in service. Investigation of these events showed that these were caused by sulphidation and subsequent crack initiation, due to contamination of the blade shank passing by the blade damper.
This condition, if not corrected, could lead to further HP turbine stage 1 blade failures, possibly resulting in engine in-flight shut- down and consequent reduced control of the aeroplane.
To address this potential unsafe condition, RRD published the NMSB to provide instructions to replace the affected assembly. For the reasons described above, this [EASA] AD requires determination of the engine configuration and, depending on findings, removal of the engine from service to replace the affected assembly.
You may obtain further information by examining the MCAI in the AD docket at https://www.regulations.gov by searching for and locating Docket No. FAA–2020–1025.
FAA’s Determination
This product has been approved by EASA and is approved for operation in the United States. Pursuant to our bilateral agreement with the European Community, EASA has notified us of the unsafe condition described in the MCAI. The FAA is issuing this NPRM because the agency evaluated all the relevant information provided by EASA and has determined that the unsafe condition described previously is likely to exist or develop in other products of the same type design.
VerDate Sep<11>2014 16:23 Nov 12, 2020 Jkt 253001 PO 00000 Frm 00025 Fmt 4702 Sfmt 4702 E:\FR\FM\13NOP1.SGM 13NOP1jbel
l on
DS
KJL
SW
7X2P
RO
D w
ith P
RO
PO
SA
LS