
Propenomy of Iskandar Malaysia update September 2014
55
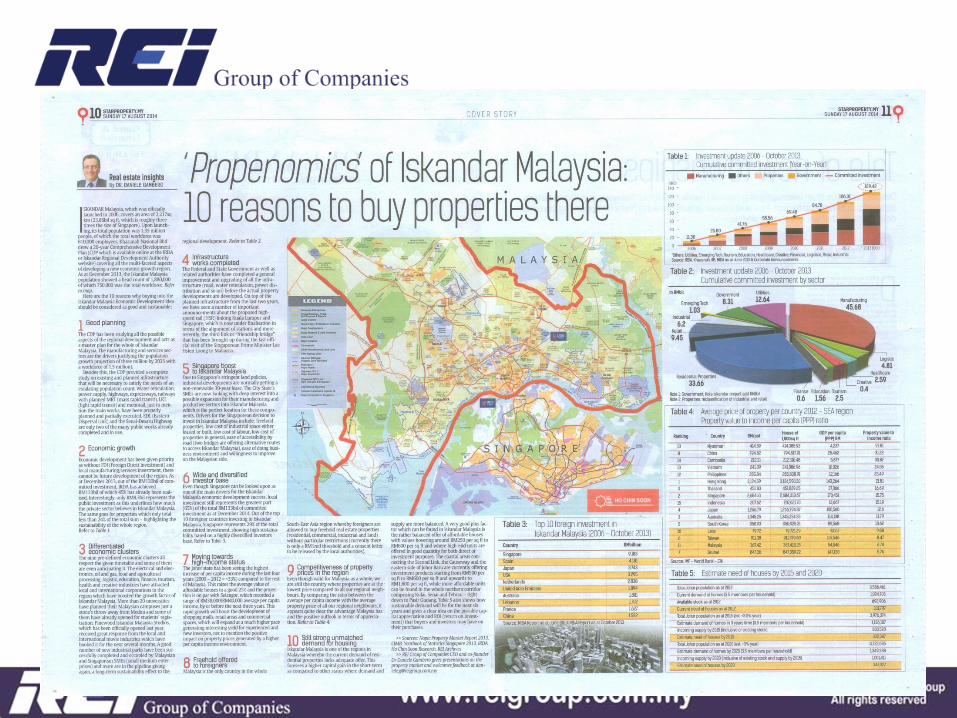
Malaysian Property Market PROPENOMICS OF ISKANDAR MALAYSIA AND THE WAY FORWARD TO 2025 FOR A SUSTAINABLE PROPERTY INVESTMENT Connecting the …… dots between economy, demographic trends and new housing concepts Presentation by Dr. Daniele Gambero
-
Upload
independent -
Category
Documents
-
view
3 -
download
0
Transcript of Propenomy of Iskandar Malaysia update September 2014
Malaysian Property Market
PROPENOMICS OF ISKANDAR MALAYSIA AND THE WAY FORWARD
TO 2025 FOR A SUSTAINABLE PROPERTY INVESTMENT
Connecting the …… dots between economy, demographic trends and new housing concepts
Presentation by Dr. Daniele Gambero

CONSULTANCY
- Strategic Marketing Consultancies: design, concept, pricing, branding
- Property Market Surveys: defining the best product for each specific area
- Property Market Reporting: give developers an independent platform to take strategic decision on future development
- Property Market Analysis: research and definition of new development products based on existing market situation
- Branding: adding value by endorsement of project, branding of new development areas, defining and creating catalyzer for future development
- Creative: converting ideas in fact and having fun
…………What we do


Organizations that have invited Dr. Daniele Gambero as speaker to their events are: Rehda KL, Rehda JB, Rehda Malacca and Rehda Penang Sheda Kuching Asian Strategic Leadership Institute (ASLI) FIABCI Malaysian Chapter iProperty, PropertyGuru Malaysia and Singapore and EG Expos Malaysian Property Incorporated University Malaya KL Wealth Mastery Academy, Comfori and Starfish Special Property Market Outlook presentation to the Bod of: Encorp Bhd Hatten Group UEM Sunrise


Organizations that have invited Dr. Daniele Gambero as speaker to their events are: Rehda KL, Rehda JB, Rehda Malacca and Rehda Penang Sheda Kuching Asian Strategic Leadership Institute (ASLI) FIABCI Malaysian Chapter iProperty, PropertyGuru Malaysia and Singapore and EG Expos Malaysian Property Incorporated University Malaya KL Wealth Mastery Academy, Comfori and Starfish Special Property Market Outlook presentation to the Bod of: Encorp Bhd Hatten Group UEM Sunrise

Regular columnist for several newspapers and specialized magazine such as: The Star Malaysian Reserve Malay Mail PropertyTimes The Sun The Edge Real Estate Malaysia Property Hunter Property Insight Property King
Regular columnist for several newspapers and specialized magazine such as: The Star Malaysian Reserve Malay Mail PropertyTimes The Sun The Edge Real Estate Malaysia Property Hunter Property Insight Property King
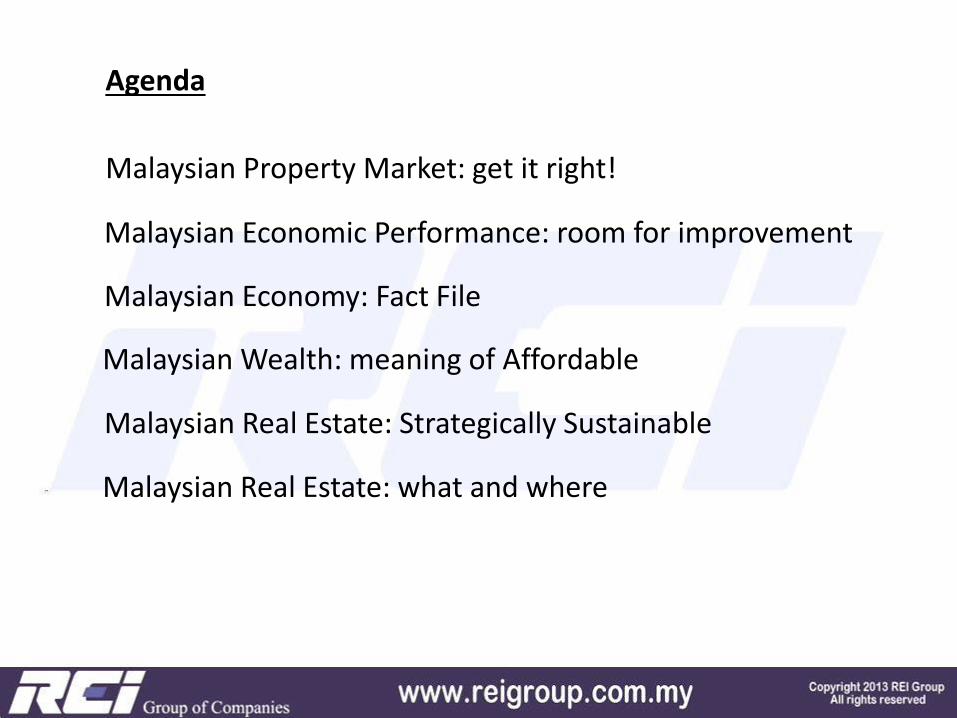
Agenda
Malaysian Economic Performance: room for improvement
Malaysian Economy: Fact File
Malaysian Wealth: meaning of Affordable
Malaysian Real Estate: Strategically Sustainable
Malaysian Real Estate: what and where
Malaysian Property Market: get it right!
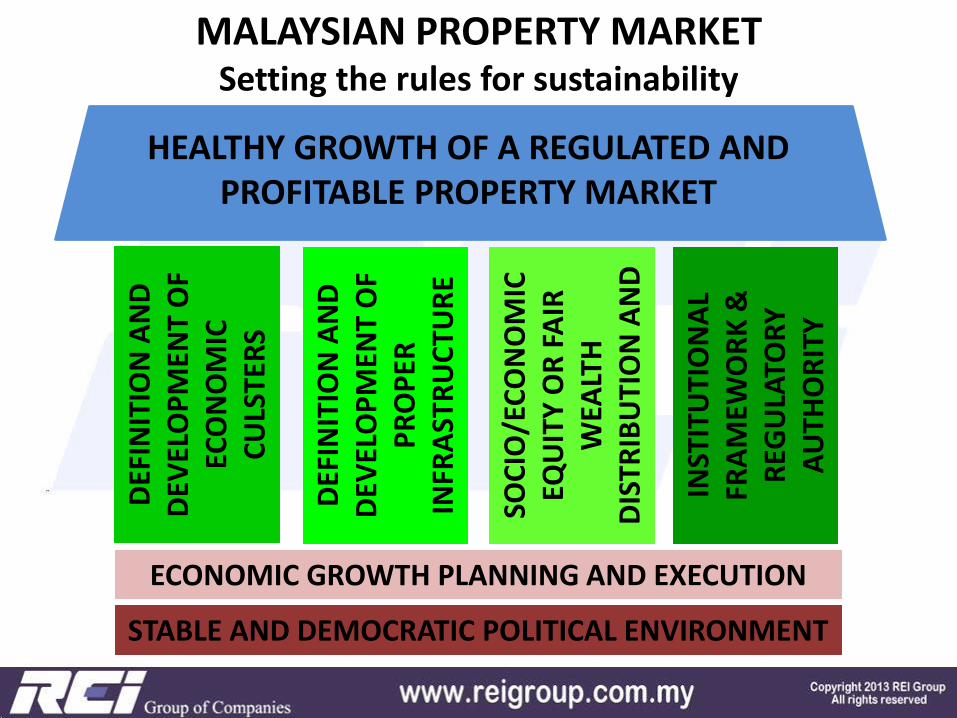
MALAYSIAN PROPERTY MARKET Setting the rules for sustainability
STABLE AND DEMOCRATIC POLITICAL ENVIRONMENT
ECONOMIC GROWTH PLANNING AND EXECUTION
DEF
INIT
ION
AN
D
DEV
ELO
PM
ENT
OF
ECO
NO
MIC
C
ULS
TER
S
DEF
INIT
ION
AN
D
DEV
ELO
PM
ENT
OF
PR
OP
ER
INFR
AST
RU
CTU
RE
SOC
IO/E
CO
NO
MIC
EQ
UIT
Y O
R F
AIR
W
EALT
H
DIS
TRIB
UTI
ON
AN
D
INST
ITU
TIO
NA
L FR
AM
EWO
RK
&
REG
ULA
TOR
Y
AU
THO
RIT
Y
HEALTHY GROWTH OF A REGULATED AND PROFITABLE PROPERTY MARKET
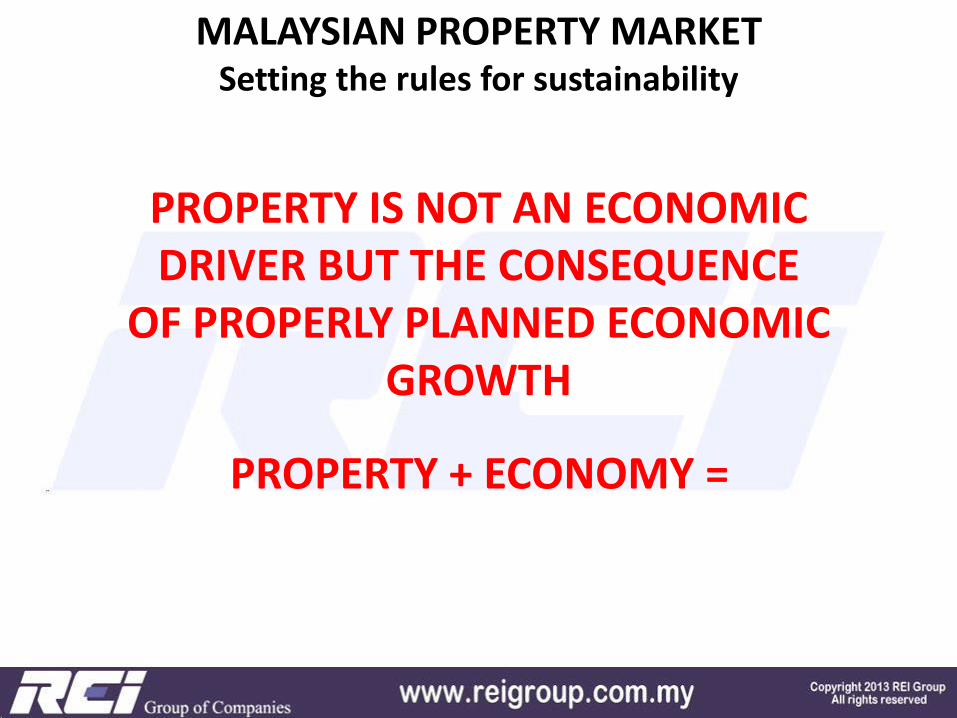
MALAYSIAN PROPERTY MARKET Setting the rules for sustainability
PROPERTY IS NOT AN ECONOMIC DRIVER BUT THE CONSEQUENCE
OF PROPERLY PLANNED ECONOMIC GROWTH
PROPERTY + ECONOMY =

MALAYSIAN PROPERTY MARKET Setting the rules for sustainability
PROPERTY + ECONOMY =
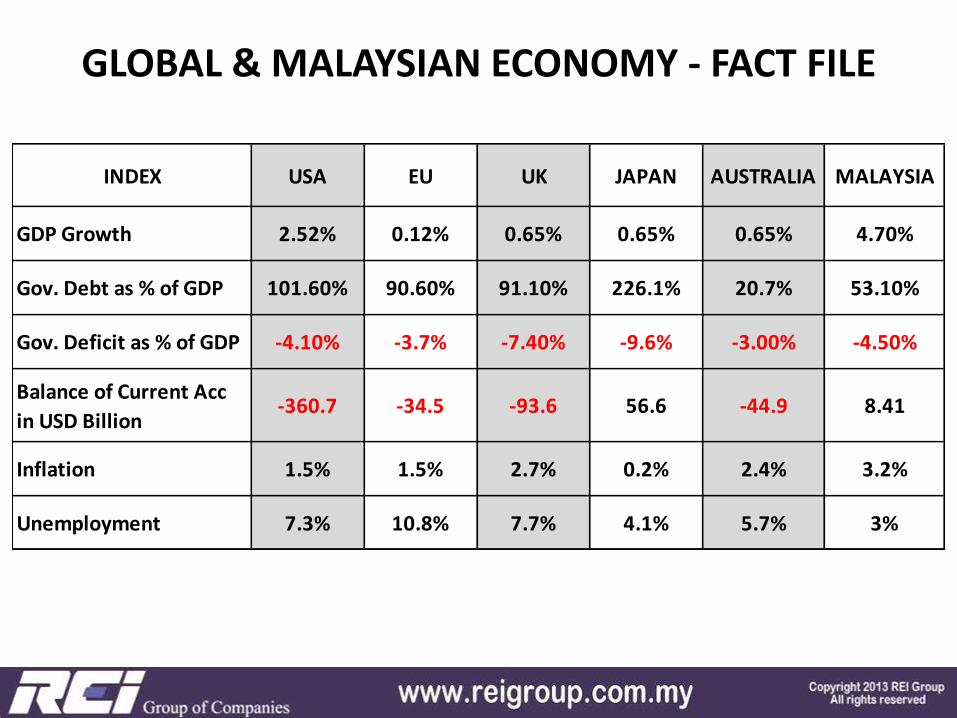
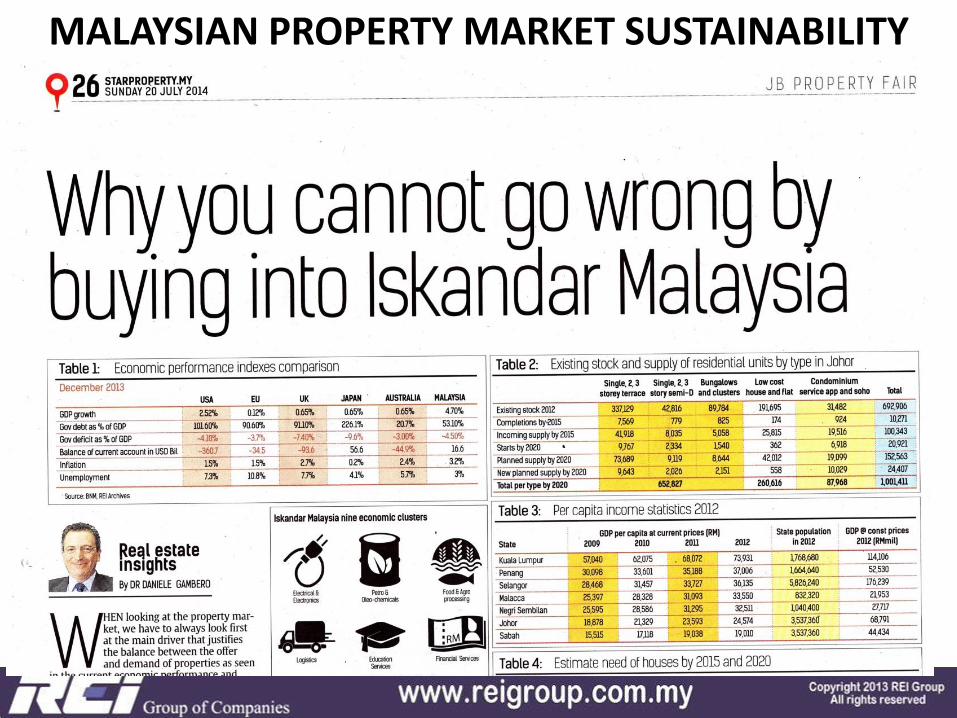
GLOBAL & MALAYSIAN ECONOMY - FACT FILE
INDEX USA EU UK JAPAN AUSTRALIA MALAYSIA
GDP Growth 2.52% 0.12% 0.65% 0.65% 0.65% 4.70%
Gov. Debt as % of GDP 101.60% 90.60% 91.10% 226.1% 20.7% 53.10%
Gov. Deficit as % of GDP -4.10% -3.7% -7.40% -9.6% -3.00% -4.50%
Balance of Current Acc
in USD Billion-360.7 -34.5 -93.6 56.6 -44.9 8.41
Inflation 1.5% 1.5% 2.7% 0.2% 2.4% 3.2%
Unemployment 7.3% 10.8% 7.7% 4.1% 5.7% 3%

SEA REGION & MALAYSIAN ECONOMY - FACT FILE INDEX VIETNAM INDONESIA THAILAND MALAYSIA AUSTRALIA SINGAPORE
GDP Growth 5.54% 5.72% 0.60% 4.70% 0.65% 5.50%
Gov. Debt as % of GDP 37.30% 23.6% 44.30% 53.10% 20.7% 97.90%
Gov. Deficit as % of GDP -6.90% -1.77% -4.10% -4.50% -3.00% 1.3%
Balance of Current Acc
in USD Billion-0.55 -0.43 -2.5 8.41 -44.9 3.4
Inflation 4.65% 7.75% 1.22% 3.2% 2.4% 2.25%
Unemployment 2.22% 6.25% 0.62% 3% 5.7% 1.8%
Population (Million) 88.78 245.90 66.79 29.62 22.79 5.31
Global competitivnes
index (WEF 2013-2014)70 38 37 24 21 2
Stage of development
(WEF 2013-2014)
Stage 1
Factor
Driven
Stage 2
Efficiency
Driven
Stage 2
Efficiency
Driven
Stage 2 to 3
Efficiency
to
Innovation
Stage 3
Innovation
Driven
Stage 3
Innovation
Driven
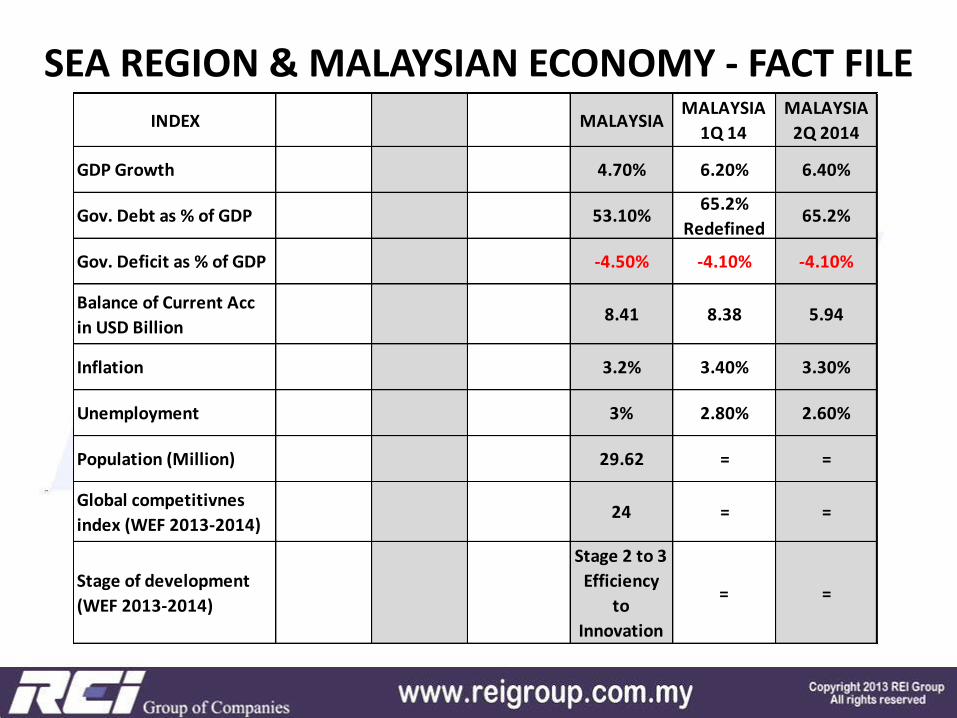
INDEX MALAYSIAMALAYSIA
1Q 14
MALAYSIA
2Q 2014
GDP Growth 4.70% 6.20% 6.40%
Gov. Debt as % of GDP 53.10%65.2%
Redefined65.2%
Gov. Deficit as % of GDP -4.50% -4.10% -4.10%
Balance of Current Acc
in USD Billion8.41 8.38 5.94
Inflation 3.2% 3.40% 3.30%
Unemployment 3% 2.80% 2.60%
Population (Million) 29.62 = =
Global competitivnes
index (WEF 2013-2014)24 = =
Stage of development
(WEF 2013-2014)
Stage 2 to 3
Efficiency
to
Innovation
= =
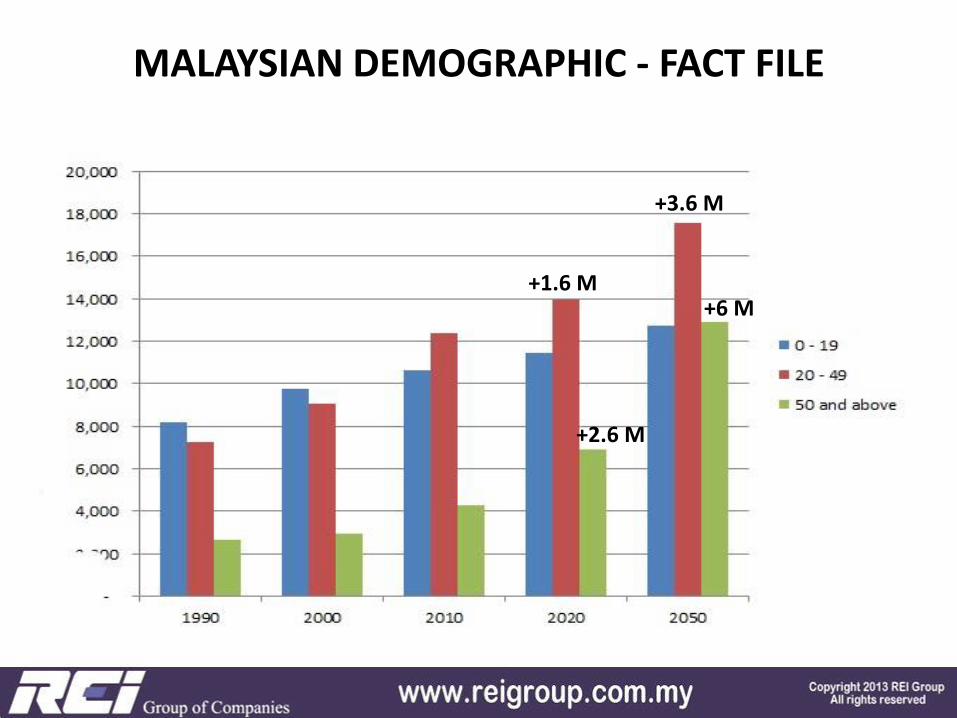
MALAYSIAN DEMOGRAPHIC - FACT FILE
+1.6 M
+3.6 M
+2.6 M
+6 M
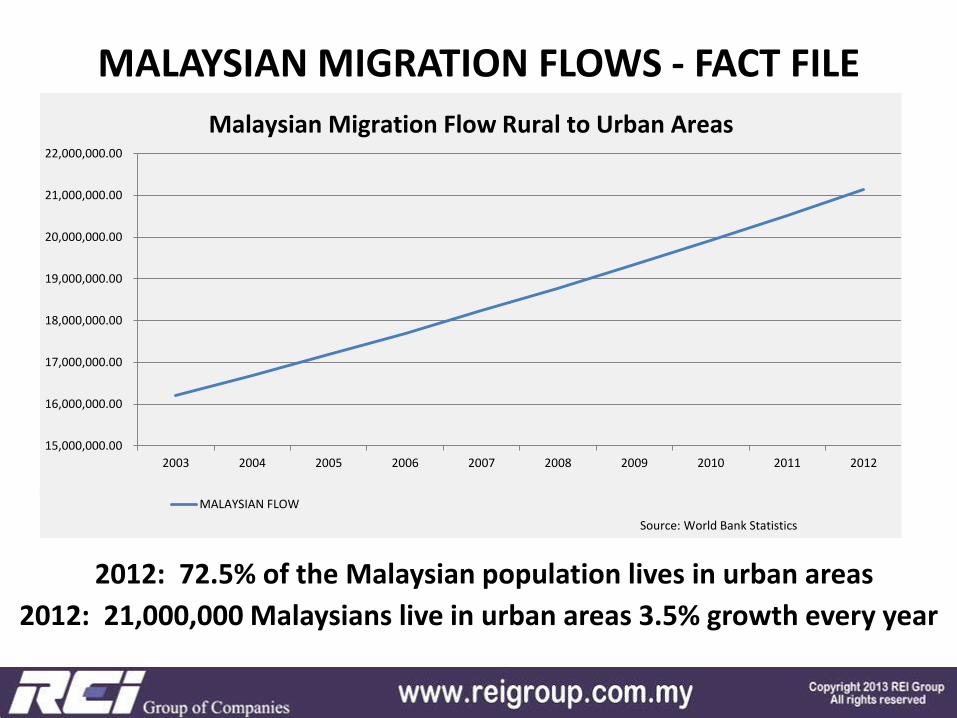
MALAYSIAN MIGRATION FLOWS - FACT FILE
2012: 21,000,000 Malaysians live in urban areas 3.5% growth every year
2012: 72.5% of the Malaysian population lives in urban areas
15,000,000.00
16,000,000.00
17,000,000.00
18,000,000.00
19,000,000.00
20,000,000.00
21,000,000.00
22,000,000.00
2003 2004 2005 2006 2007 2008 2009 2010 2011 2012
MALAYSIAN FLOW
Malaysian Migration Flow Rural to Urban Areas
Source: World Bank Statistics
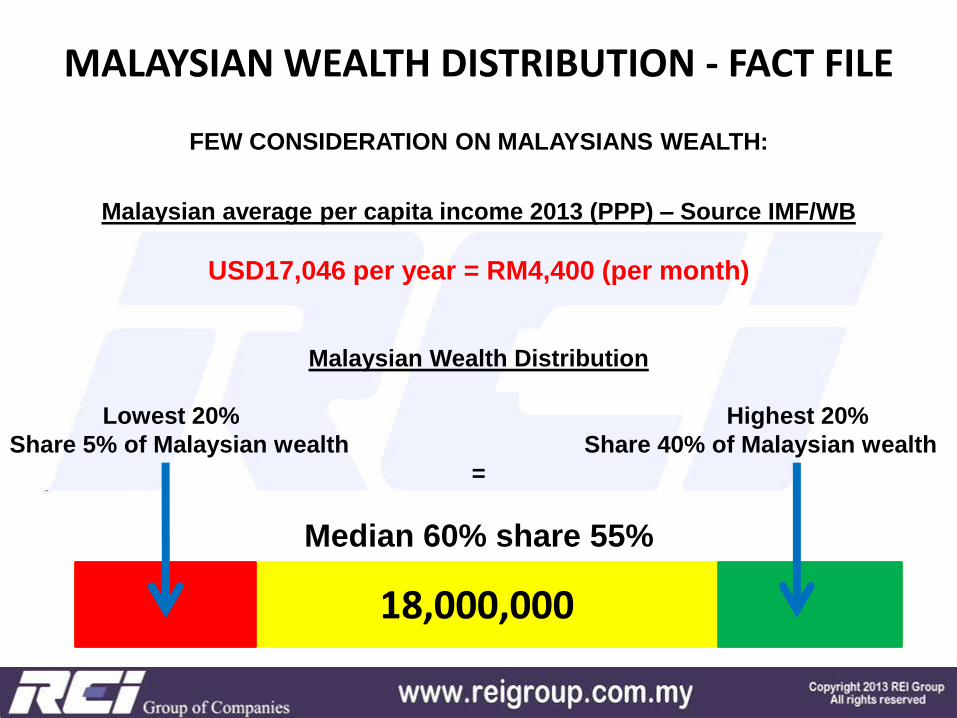
FEW CONSIDERATION ON MALAYSIANS WEALTH:
Malaysian average per capita income 2013 (PPP) – Source IMF/WB
USD17,046 per year = RM4,400 (per month)
Malaysian Wealth Distribution
Lowest 20% Highest 20%
Share 5% of Malaysian wealth Share 40% of Malaysian wealth
=
Median 60% share 55%
MALAYSIAN WEALTH DISTRIBUTION - FACT FILE
18,000,000
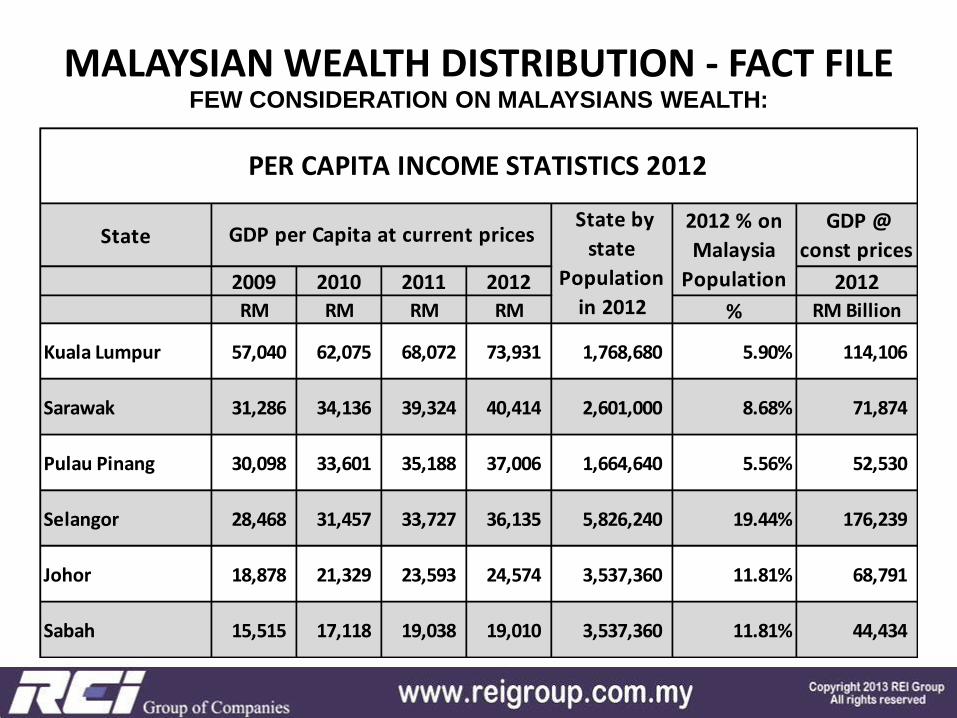
FEW CONSIDERATION ON MALAYSIANS WEALTH:
MALAYSIAN WEALTH DISTRIBUTION - FACT FILE
State GDP @
const prices
2009 2010 2011 2012 2012
RM RM RM RM % RM Billion
Kuala Lumpur 57,040 62,075 68,072 73,931 1,768,680 5.90% 114,106
Sarawak 31,286 34,136 39,324 40,414 2,601,000 8.68% 71,874
Pulau Pinang 30,098 33,601 35,188 37,006 1,664,640 5.56% 52,530
Selangor 28,468 31,457 33,727 36,135 5,826,240 19.44% 176,239
Johor 18,878 21,329 23,593 24,574 3,537,360 11.81% 68,791
Sabah 15,515 17,118 19,038 19,010 3,537,360 11.81% 44,434
2012 % on
Malaysia
Population
PER CAPITA INCOME STATISTICS 2012
GDP per Capita at current prices State by
state
Population
in 2012

MALAYSIAN HOUSEHOLD DEBT - FACT FILE
80.7% of the Malaysian Household debt is financed by the Banking System
Household NPL ratios, as per BN and MBB reports, have been falling dramatically over the past few years from 7.5% in 2006 to just 1.4% mid 2013 and is now at 1.2%
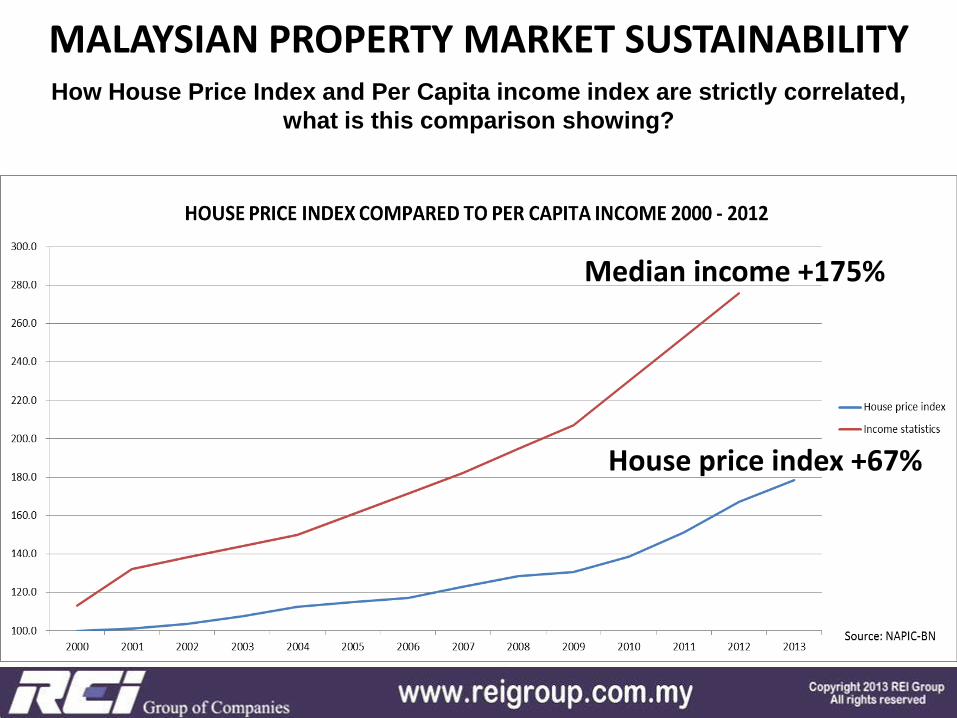
MALAYSIAN PROPERTY MARKET SUSTAINABILITY
House - Income trend 2000 2001 2002 2003 2004 2005 2006 2007 2008 2009 2010 2011 2012 2013
House price index 100.0 101.1 103.5 107.5 112.4 115.0 117.2 123.1 128.6 130.5 138.8 151.2 167.2 178.4
Income statistics 213.0 232.1 238.2 244.2 250.0 260.8 271.5 282.2 294.6 307.0 330.0 352.9 375.8
How House Price Index and Per Capita income index are strictly correlated,
what is this comparison showing?
House price index +67%
Median income +175%
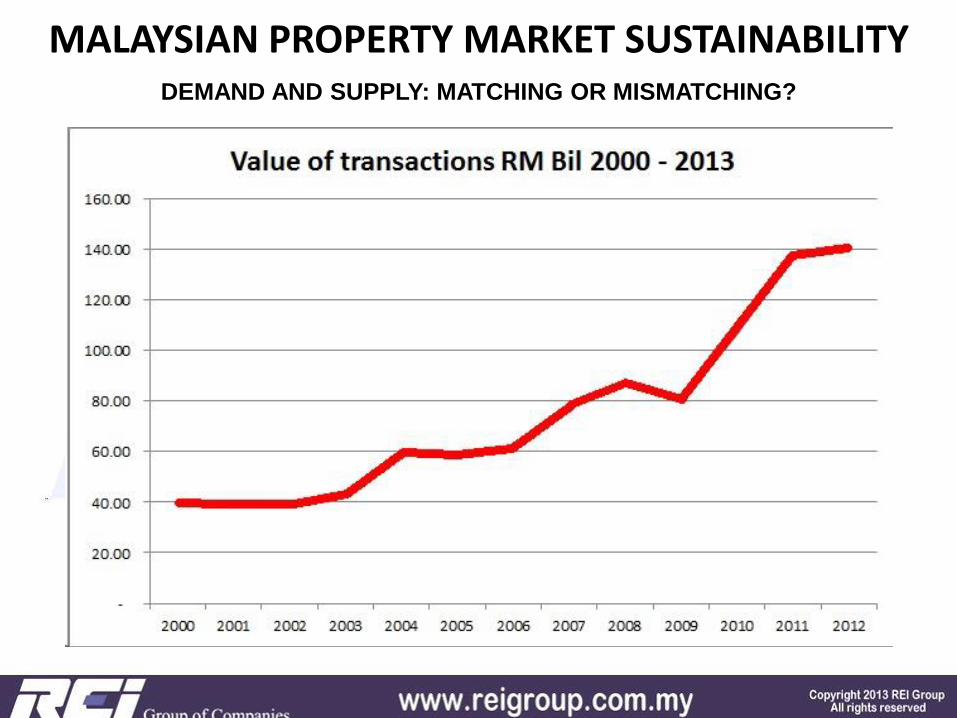
MALAYSIAN PROPERTY MARKET SUSTAINABILITY DEMAND AND SUPPLY: MATCHING OR MISMATCHING?
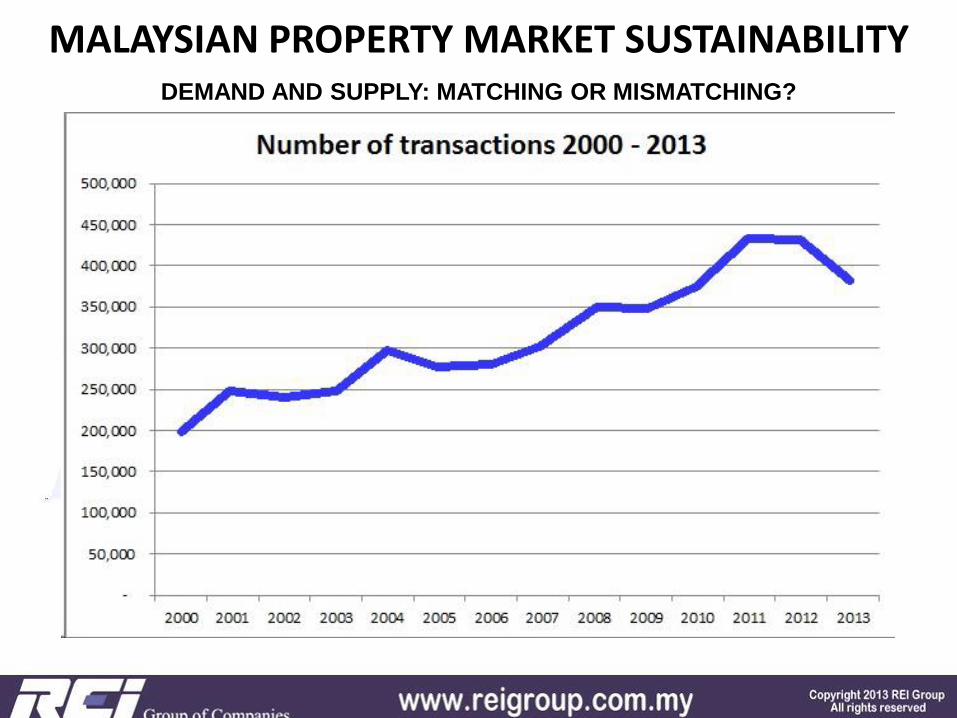
MALAYSIAN PROPERTY MARKET SUSTAINABILITY DEMAND AND SUPPLY: MATCHING OR MISMATCHING?
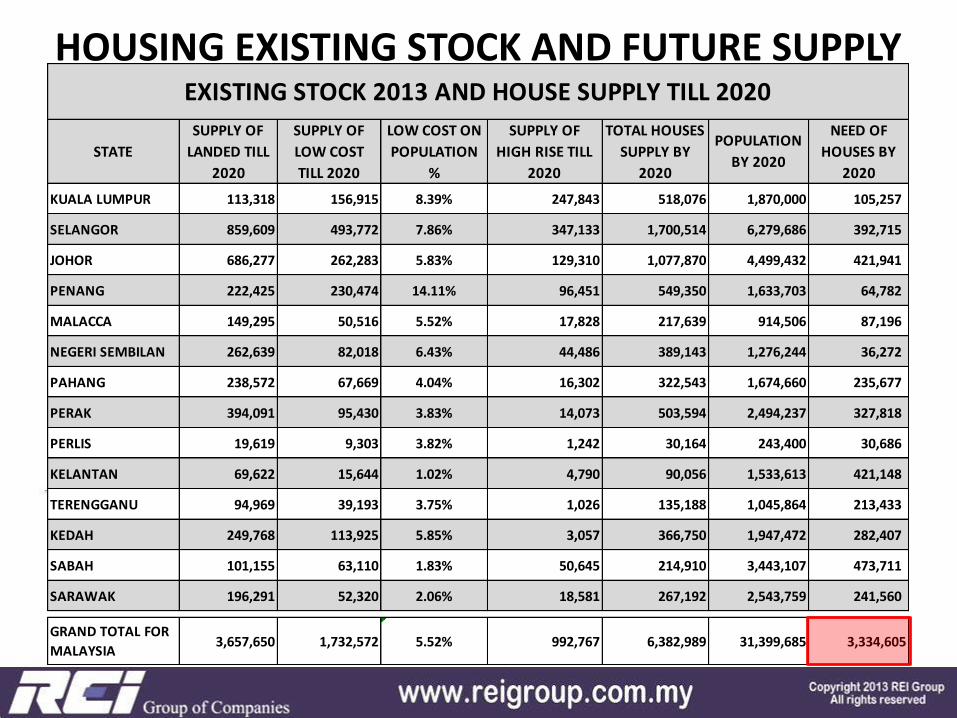
HOUSING EXISTING STOCK AND FUTURE SUPPLY
STATE
SUPPLY OF
LANDED TILL
2020
SUPPLY OF
LOW COST
TILL 2020
LOW COST ON
POPULATION
%
SUPPLY OF
HIGH RISE TILL
2020
TOTAL HOUSES
SUPPLY BY
2020
POPULATION
BY 2020
NEED OF
HOUSES BY
2020
KUALA LUMPUR 113,318 156,915 8.39% 247,843 518,076 1,870,000 105,257
SELANGOR 859,609 493,772 7.86% 347,133 1,700,514 6,279,686 392,715
JOHOR 686,277 262,283 5.83% 129,310 1,077,870 4,499,432 421,941
PENANG 222,425 230,474 14.11% 96,451 549,350 1,633,703 64,782
MALACCA 149,295 50,516 5.52% 17,828 217,639 914,506 87,196
NEGERI SEMBILAN 262,639 82,018 6.43% 44,486 389,143 1,276,244 36,272
PAHANG 238,572 67,669 4.04% 16,302 322,543 1,674,660 235,677
PERAK 394,091 95,430 3.83% 14,073 503,594 2,494,237 327,818
PERLIS 19,619 9,303 3.82% 1,242 30,164 243,400 30,686
KELANTAN 69,622 15,644 1.02% 4,790 90,056 1,533,613 421,148
TERENGGANU 94,969 39,193 3.75% 1,026 135,188 1,045,864 213,433
KEDAH 249,768 113,925 5.85% 3,057 366,750 1,947,472 282,407
SABAH 101,155 63,110 1.83% 50,645 214,910 3,443,107 473,711
SARAWAK 196,291 52,320 2.06% 18,581 267,192 2,543,759 241,560
GRAND TOTAL FOR
MALAYSIA3,657,650 1,732,572 5.52% 992,767 6,382,989 31,399,685 3,334,605
EXISTING STOCK 2013 AND HOUSE SUPPLY TILL 2020
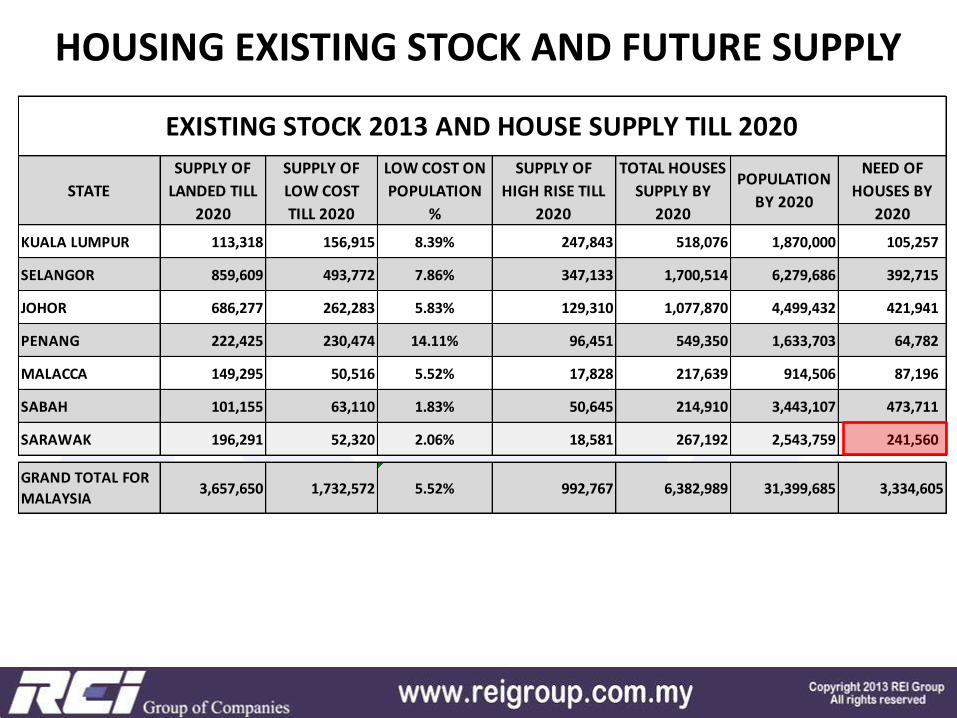
HOUSING EXISTING STOCK AND FUTURE SUPPLY
STATE
SUPPLY OF
LANDED TILL
2020
SUPPLY OF
LOW COST
TILL 2020
LOW COST ON
POPULATION
%
SUPPLY OF
HIGH RISE TILL
2020
TOTAL HOUSES
SUPPLY BY
2020
POPULATION
BY 2020
NEED OF
HOUSES BY
2020
KUALA LUMPUR 113,318 156,915 8.39% 247,843 518,076 1,870,000 105,257
SELANGOR 859,609 493,772 7.86% 347,133 1,700,514 6,279,686 392,715
JOHOR 686,277 262,283 5.83% 129,310 1,077,870 4,499,432 421,941
PENANG 222,425 230,474 14.11% 96,451 549,350 1,633,703 64,782
MALACCA 149,295 50,516 5.52% 17,828 217,639 914,506 87,196
SABAH 101,155 63,110 1.83% 50,645 214,910 3,443,107 473,711
SARAWAK 196,291 52,320 2.06% 18,581 267,192 2,543,759 241,560
GRAND TOTAL FOR
MALAYSIA3,657,650 1,732,572 5.52% 992,767 6,382,989 31,399,685 3,334,605
EXISTING STOCK 2013 AND HOUSE SUPPLY TILL 2020
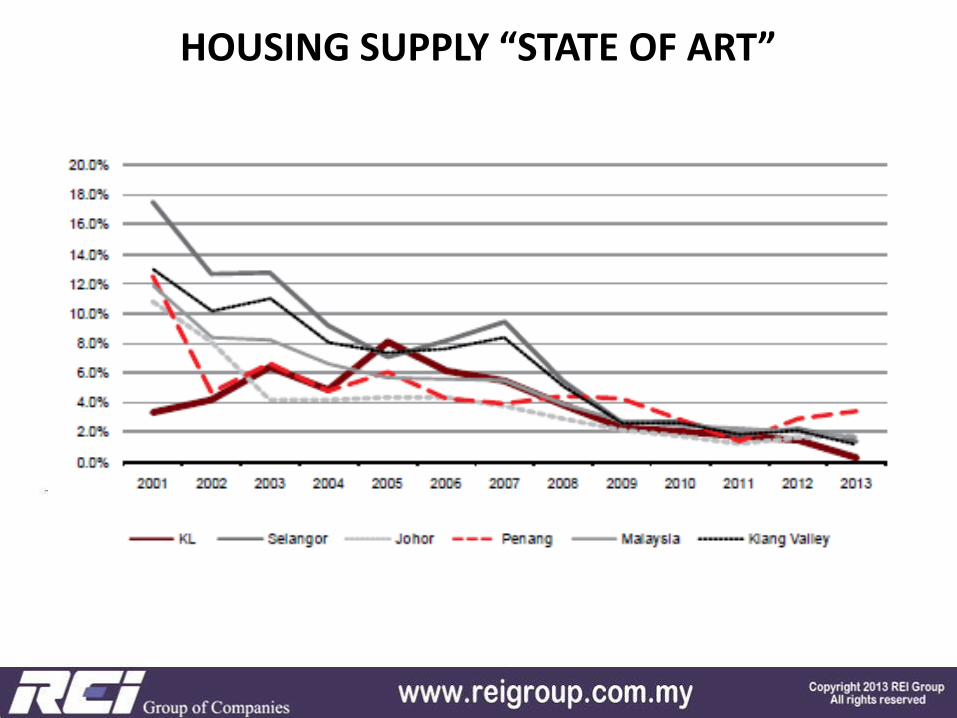
HOUSING SUPPLY “STATE OF ART”
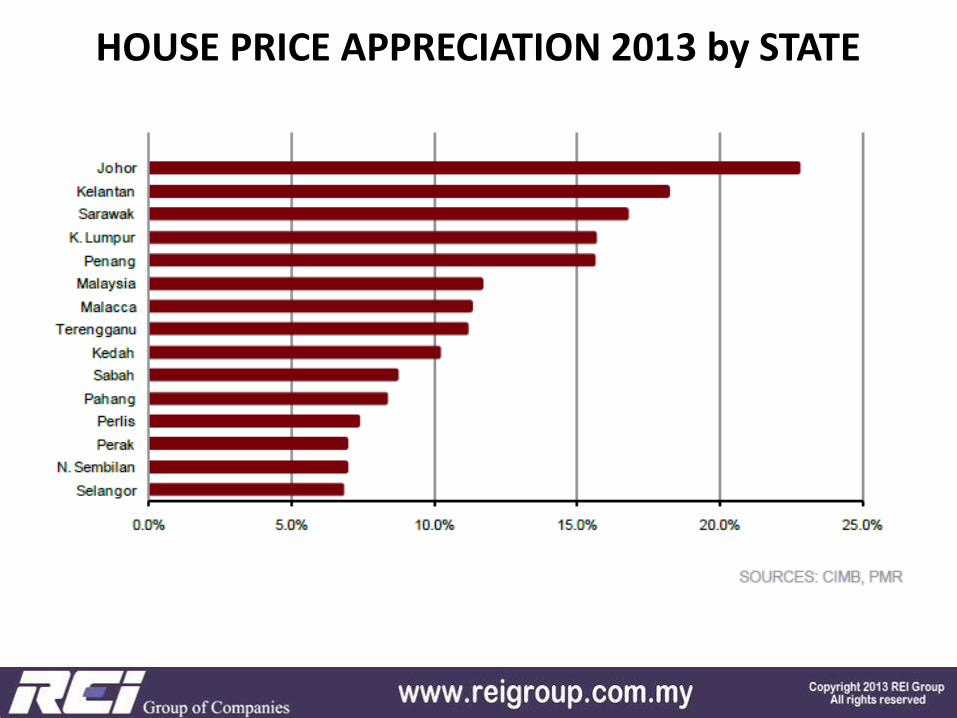
HOUSE PRICE APPRECIATION 2013 by STATE
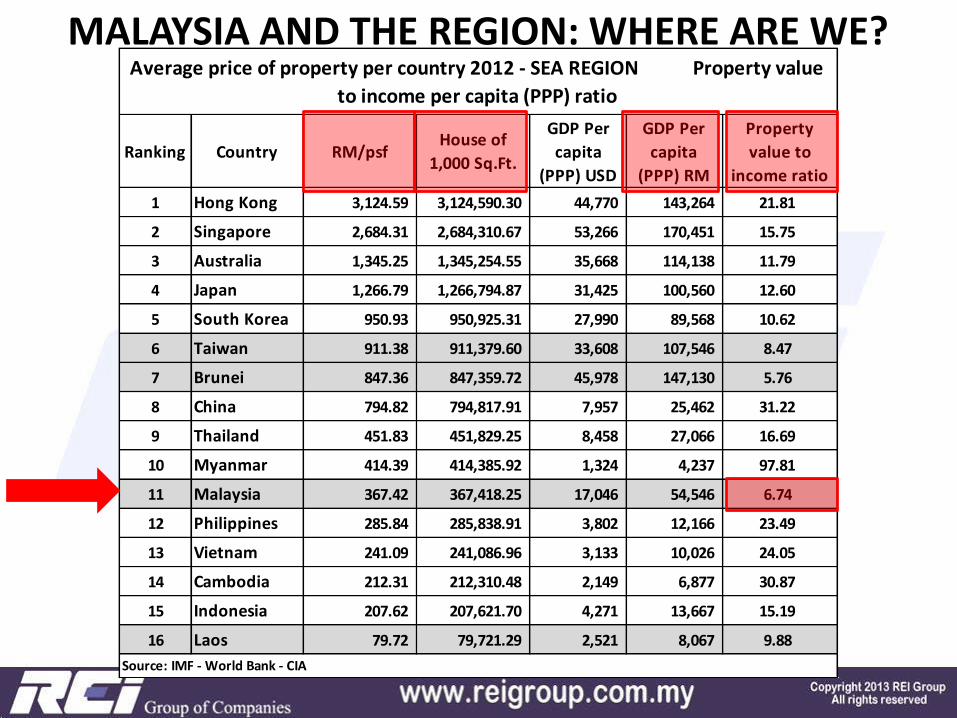
MALAYSIA AND THE REGION: WHERE ARE WE?
Ranking Country RM/psfHouse of
1,000 Sq.Ft.
GDP Per
capita
(PPP) USD
GDP Per
capita
(PPP) RM
Property
value to
income ratio
1 Hong Kong 3,124.59 3,124,590.30 44,770 143,264 21.81
2 Singapore 2,684.31 2,684,310.67 53,266 170,451 15.75
3 Australia 1,345.25 1,345,254.55 35,668 114,138 11.79
4 Japan 1,266.79 1,266,794.87 31,425 100,560 12.60
5 South Korea 950.93 950,925.31 27,990 89,568 10.62
6 Taiwan 911.38 911,379.60 33,608 107,546 8.47
7 Brunei 847.36 847,359.72 45,978 147,130 5.76
8 China 794.82 794,817.91 7,957 25,462 31.22
9 Thailand 451.83 451,829.25 8,458 27,066 16.69
10 Myanmar 414.39 414,385.92 1,324 4,237 97.81
11 Malaysia 367.42 367,418.25 17,046 54,546 6.74
12 Philippines 285.84 285,838.91 3,802 12,166 23.49
13 Vietnam 241.09 241,086.96 3,133 10,026 24.05
14 Cambodia 212.31 212,310.48 2,149 6,877 30.87
15 Indonesia 207.62 207,621.70 4,271 13,667 15.19
16 Laos 79.72 79,721.29 2,521 8,067 9.88
Source: IMF - World Bank - CIA
Average price of property per country 2012 - SEA REGION Property value
to income per capita (PPP) ratio
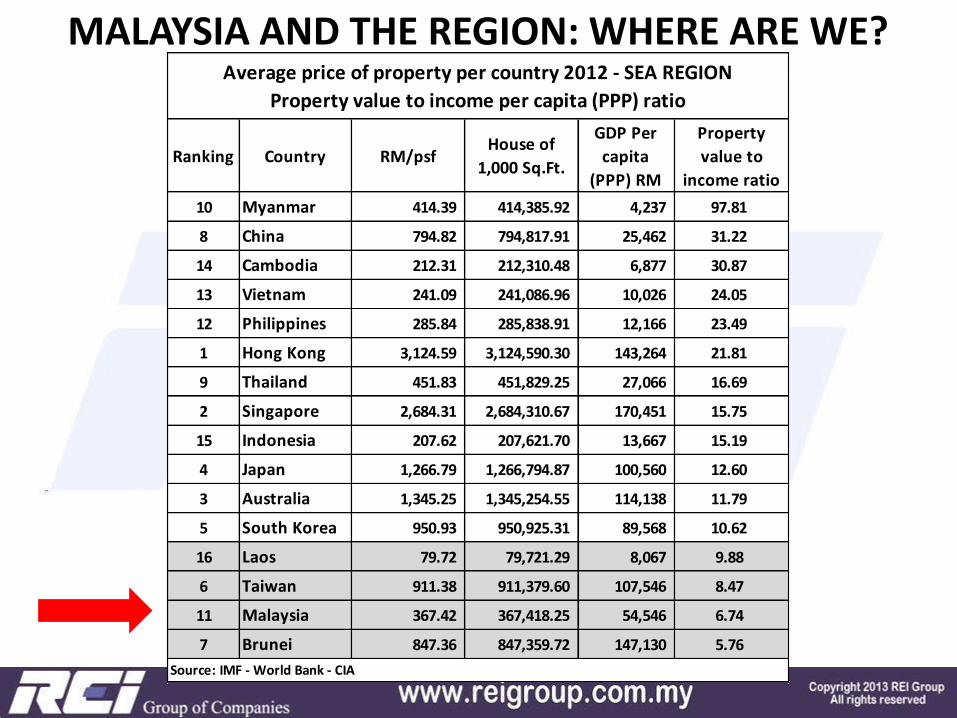
MALAYSIA AND THE REGION: WHERE ARE WE?
Ranking Country RM/psfHouse of
1,000 Sq.Ft.
GDP Per
capita
(PPP) RM
Property
value to
income ratio
10 Myanmar 414.39 414,385.92 4,237 97.81
8 China 794.82 794,817.91 25,462 31.22
14 Cambodia 212.31 212,310.48 6,877 30.87
13 Vietnam 241.09 241,086.96 10,026 24.05
12 Philippines 285.84 285,838.91 12,166 23.49
1 Hong Kong 3,124.59 3,124,590.30 143,264 21.81
9 Thailand 451.83 451,829.25 27,066 16.69
2 Singapore 2,684.31 2,684,310.67 170,451 15.75
15 Indonesia 207.62 207,621.70 13,667 15.19
4 Japan 1,266.79 1,266,794.87 100,560 12.60
3 Australia 1,345.25 1,345,254.55 114,138 11.79
5 South Korea 950.93 950,925.31 89,568 10.62
16 Laos 79.72 79,721.29 8,067 9.88
6 Taiwan 911.38 911,379.60 107,546 8.47
11 Malaysia 367.42 367,418.25 54,546 6.74
7 Brunei 847.36 847,359.72 147,130 5.76
Average price of property per country 2012 - SEA REGION
Property value to income per capita (PPP) ratio
Source: IMF - World Bank - CIA
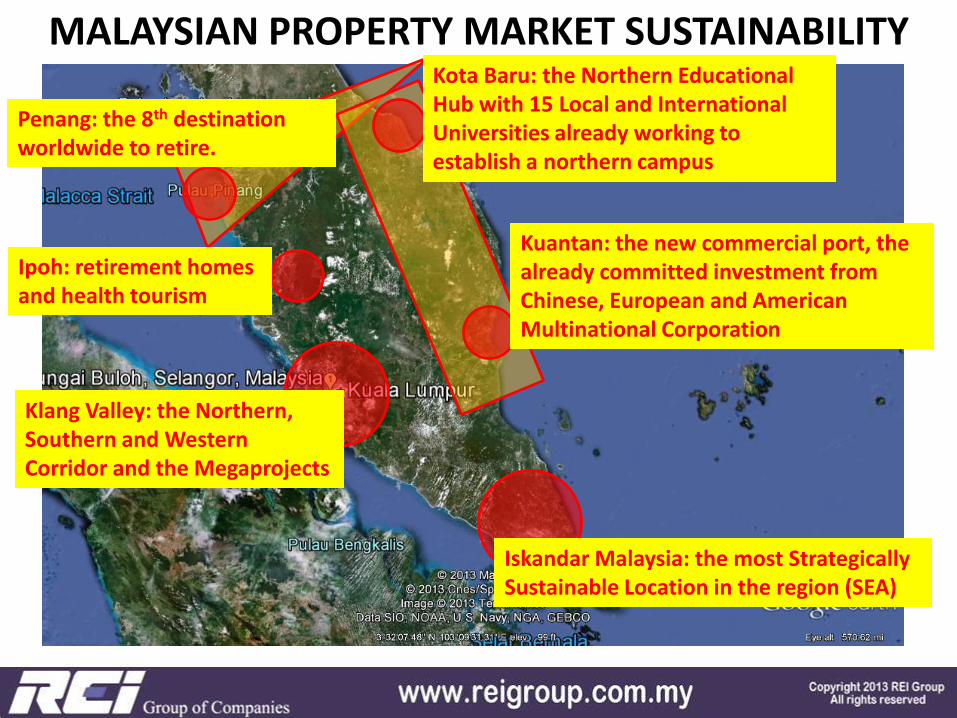
MALAYSIAN PROPERTY MARKET SUSTAINABILITY
Kuantan: the new commercial port, the already committed investment from Chinese, European and American Multinational Corporation
Kota Baru: the Northern Educational Hub with 15 Local and International Universities already working to establish a northern campus
Penang: the 8th destination worldwide to retire.
Ipoh: retirement homes and health tourism
Klang Valley: the Northern, Southern and Western Corridor and the Megaprojects
Iskandar Malaysia: the most Strategically Sustainable Location in the region (SEA)
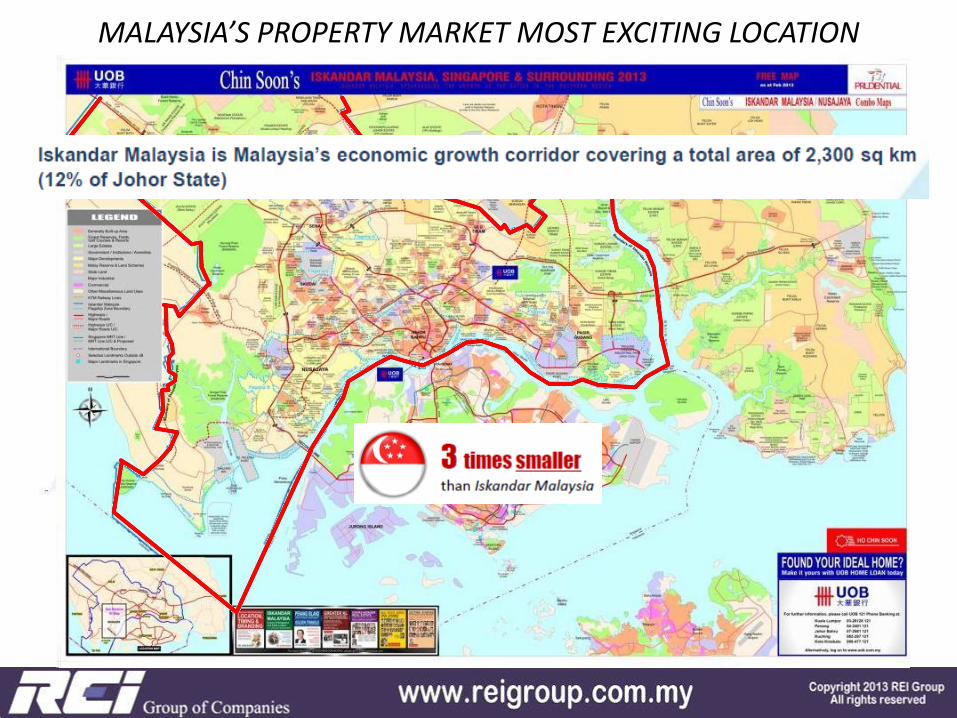
MALAYSIA’S PROPERTY MARKET MOST EXCITING LOCATION
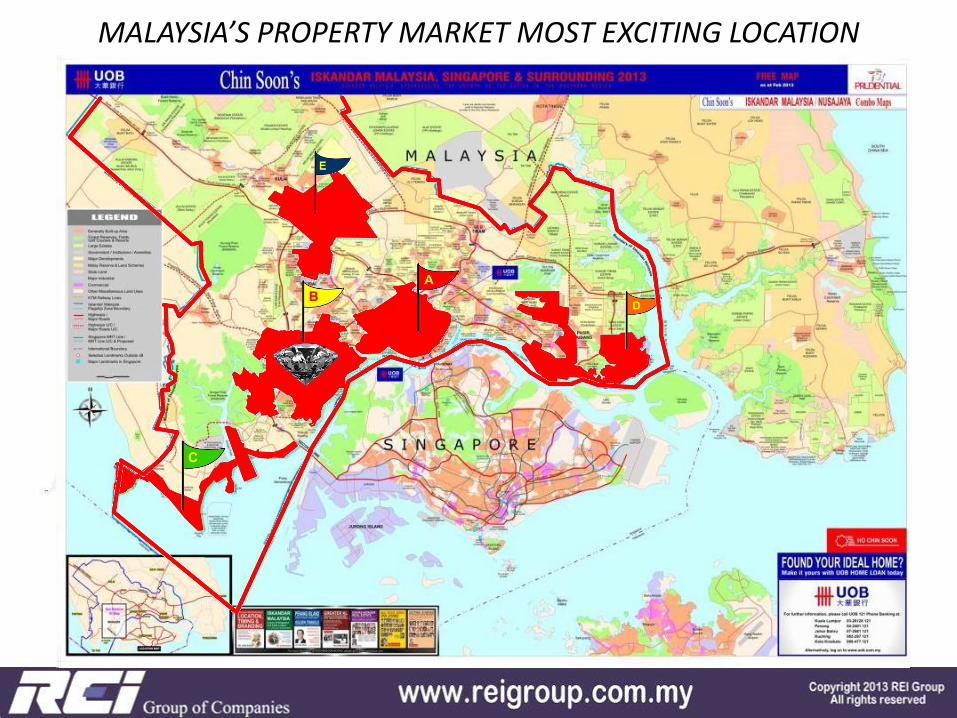
MALAYSIA’S PROPERTY MARKET MOST EXCITING LOCATION

Malaysian Property Market – 2014 Outlook Iskandar Malaysia – Strategically Sustainable
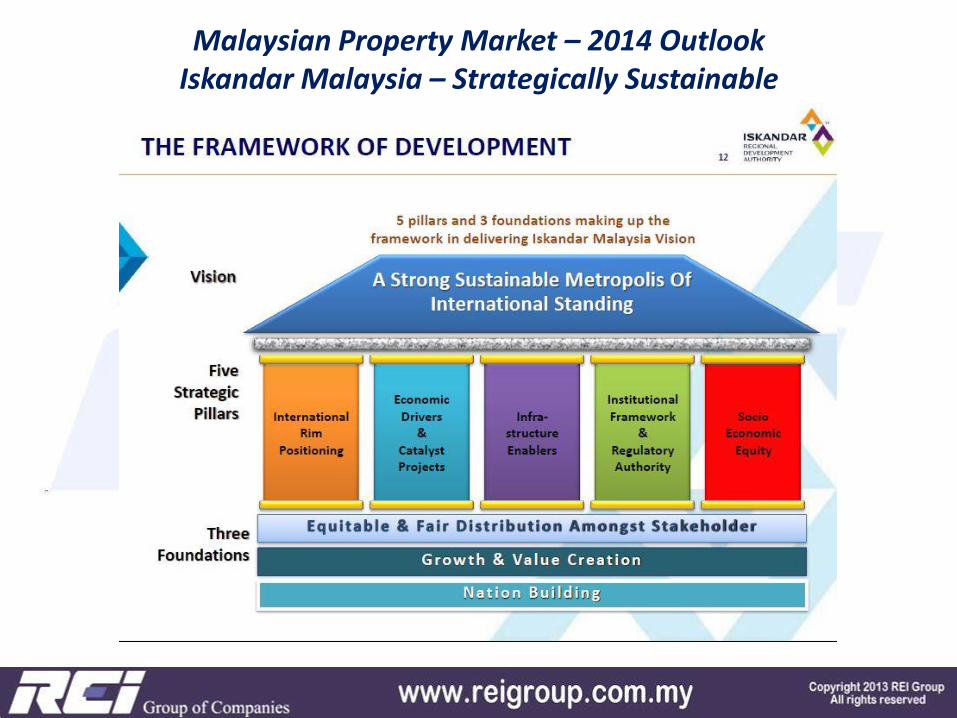
Malaysian Property Market – 2014 Outlook Iskandar Malaysia – Strategically Sustainable
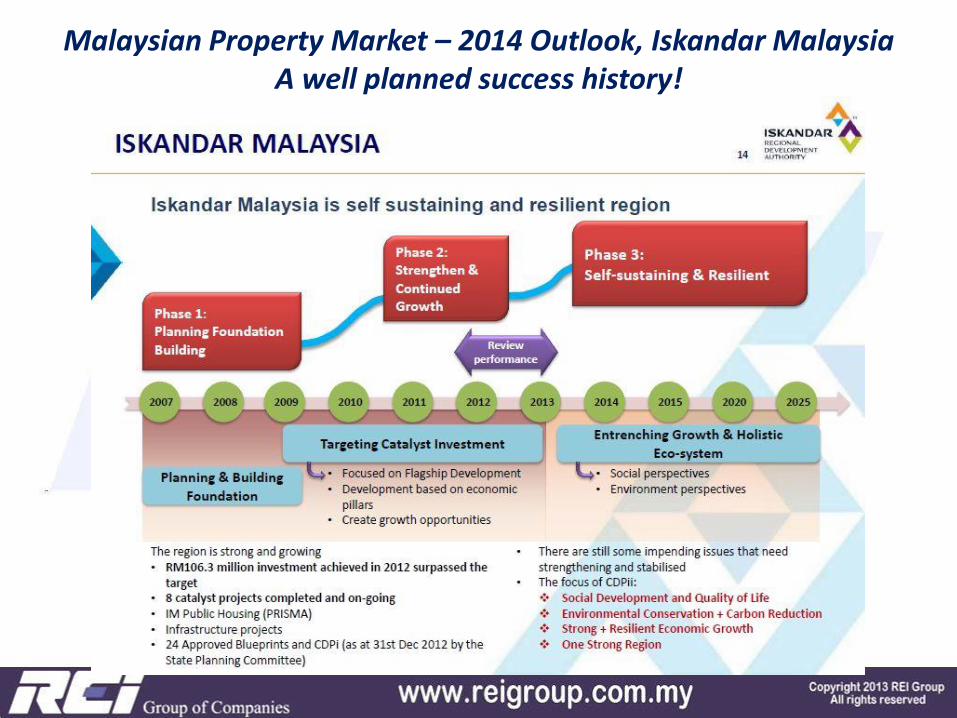
Malaysian Property Market – 2014 Outlook, Iskandar Malaysia A well planned success history!
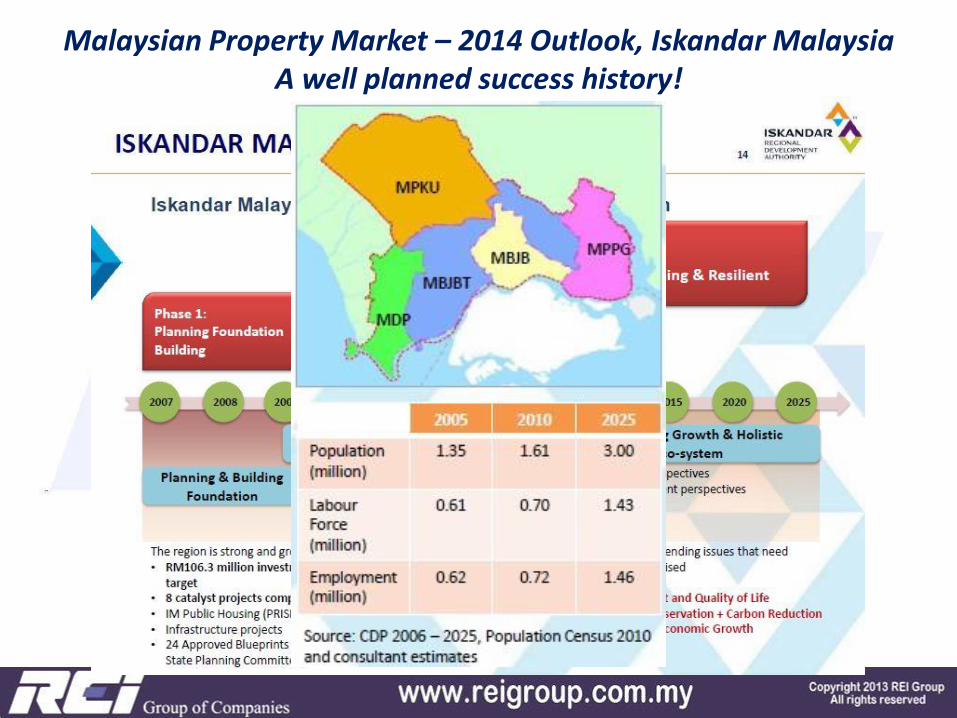
Malaysian Property Market – 2014 Outlook, Iskandar Malaysia A well planned success history!
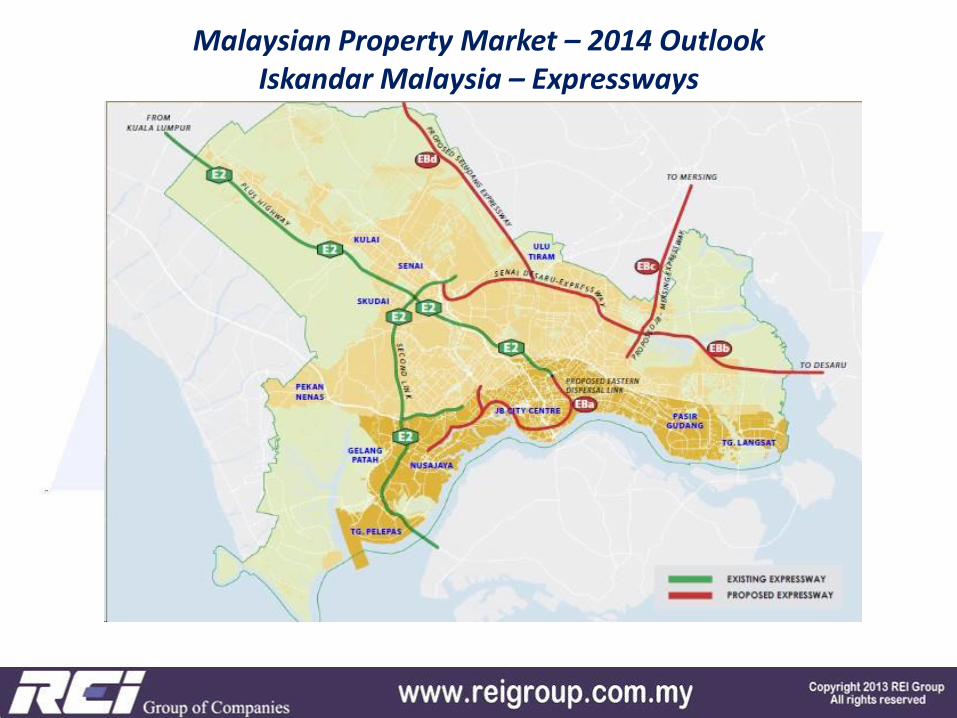
Malaysian Property Market – 2014 Outlook Iskandar Malaysia – Expressways
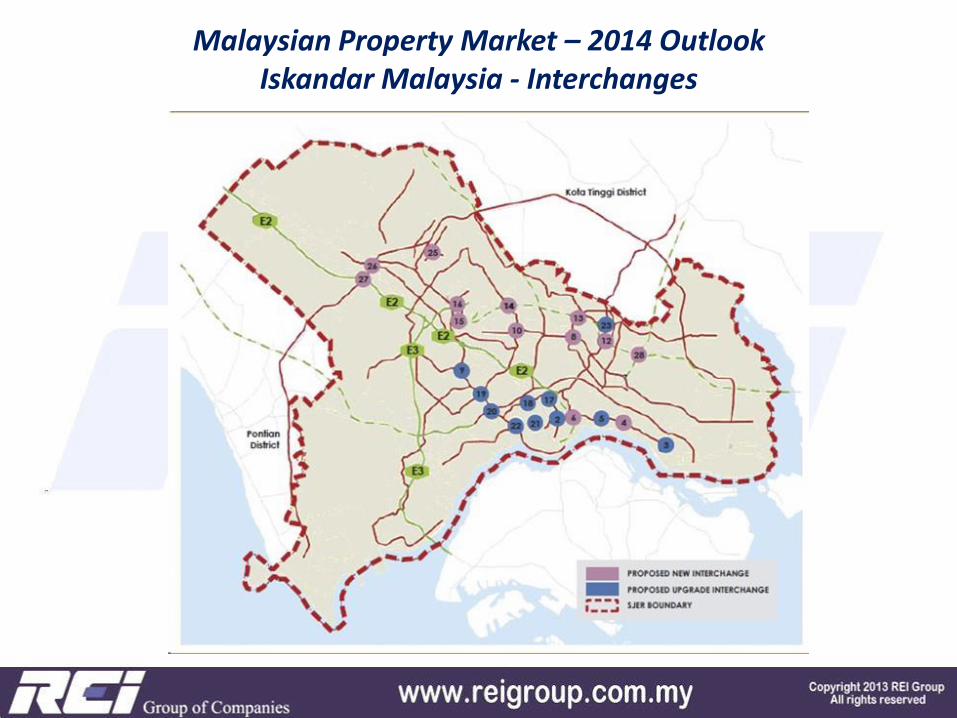
Malaysian Property Market – 2014 Outlook Iskandar Malaysia - Interchanges
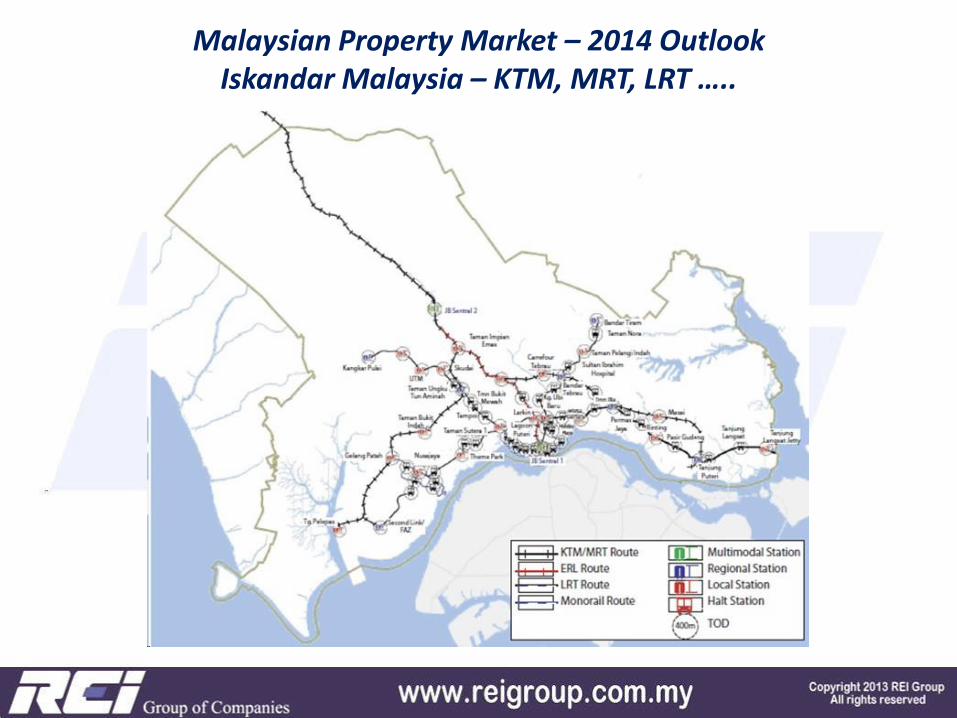
Malaysian Property Market – 2014 Outlook Iskandar Malaysia – KTM, MRT, LRT …..
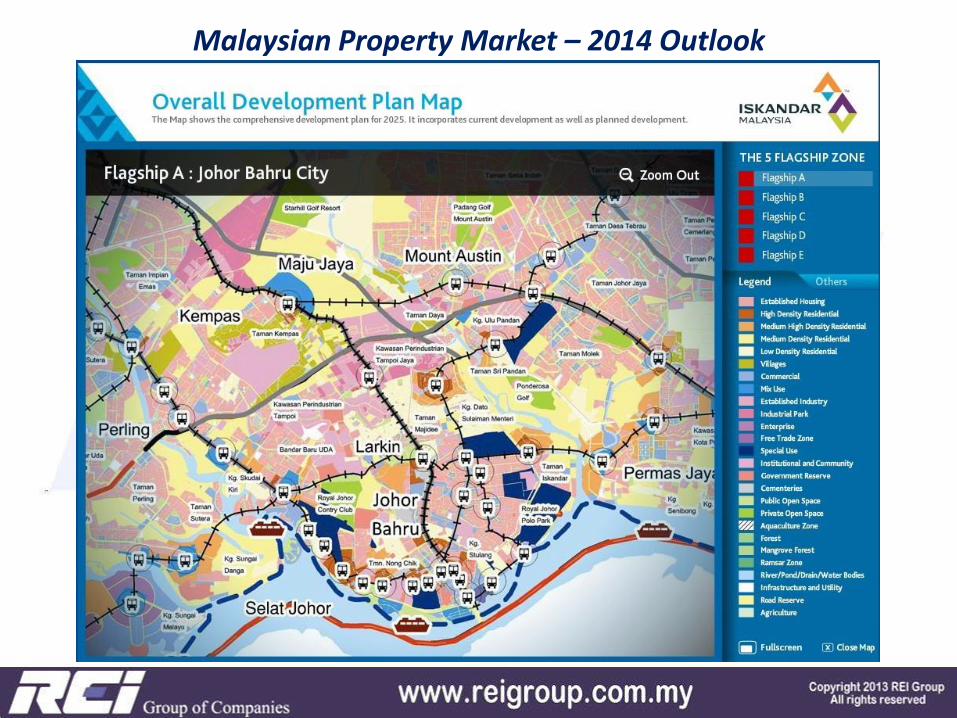
Malaysian Property Market – 2014 Outlook Iskandar Malaysia
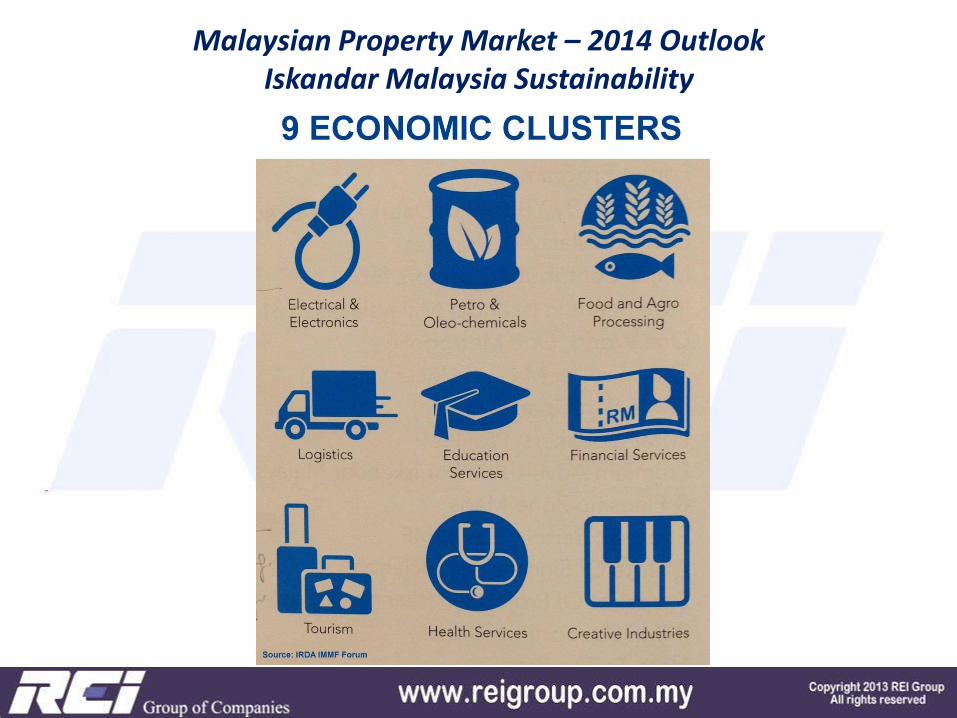
Malaysian Property Market – 2014 Outlook Iskandar Malaysia Sustainability
Malaysian Property Market – 2014 Outlook Iskandar Malaysia Sustainability
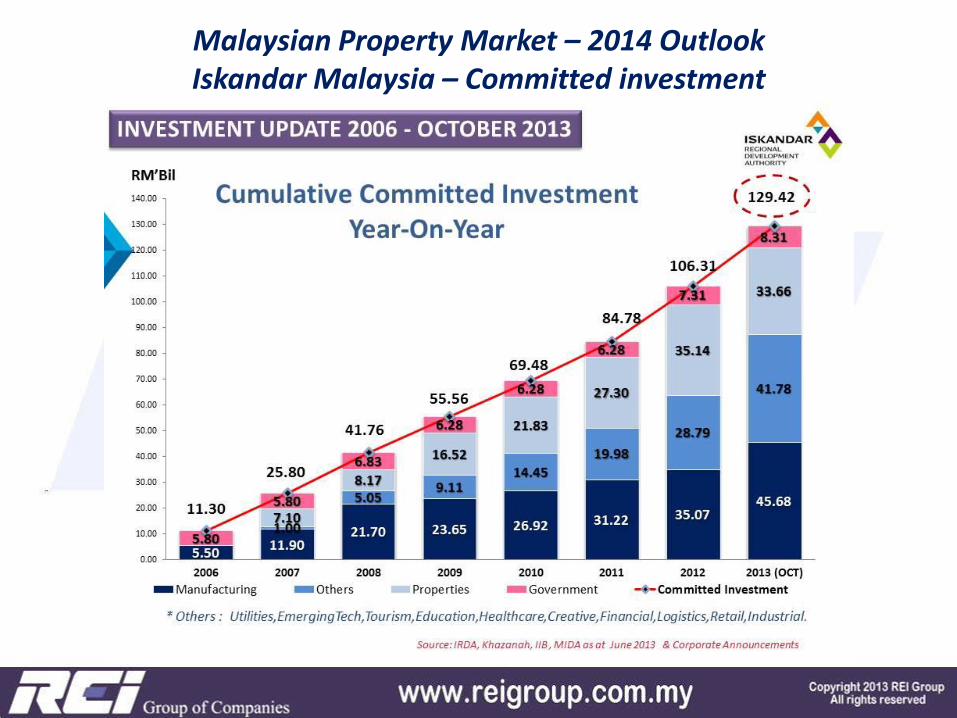
Malaysian Property Market – 2014 Outlook Iskandar Malaysia – Committed investment
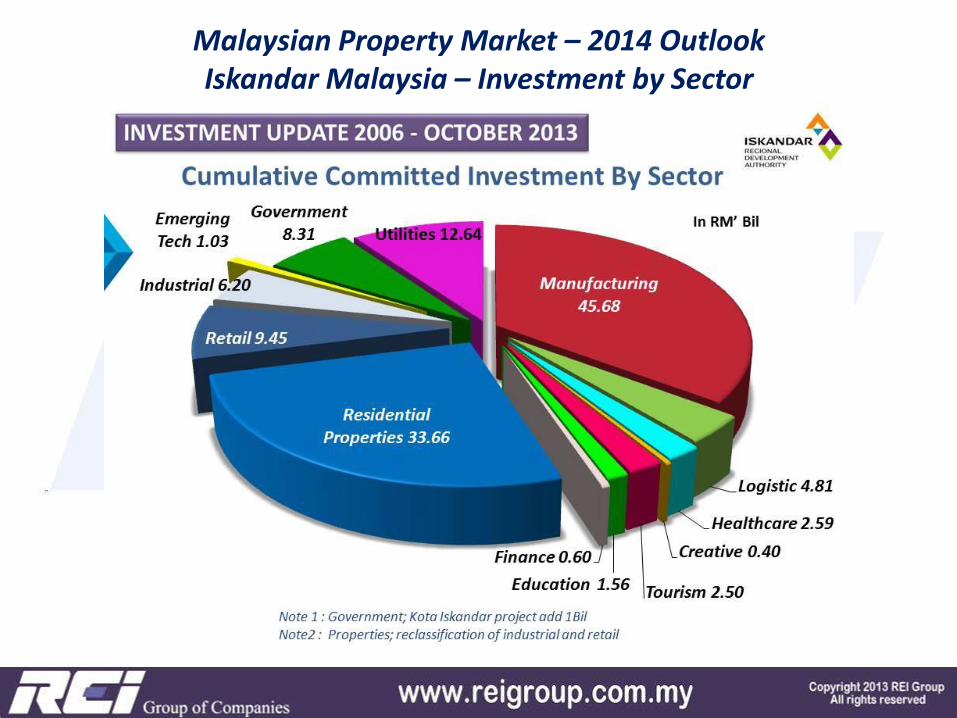
Malaysian Property Market – 2014 Outlook Iskandar Malaysia – Investment by Sector
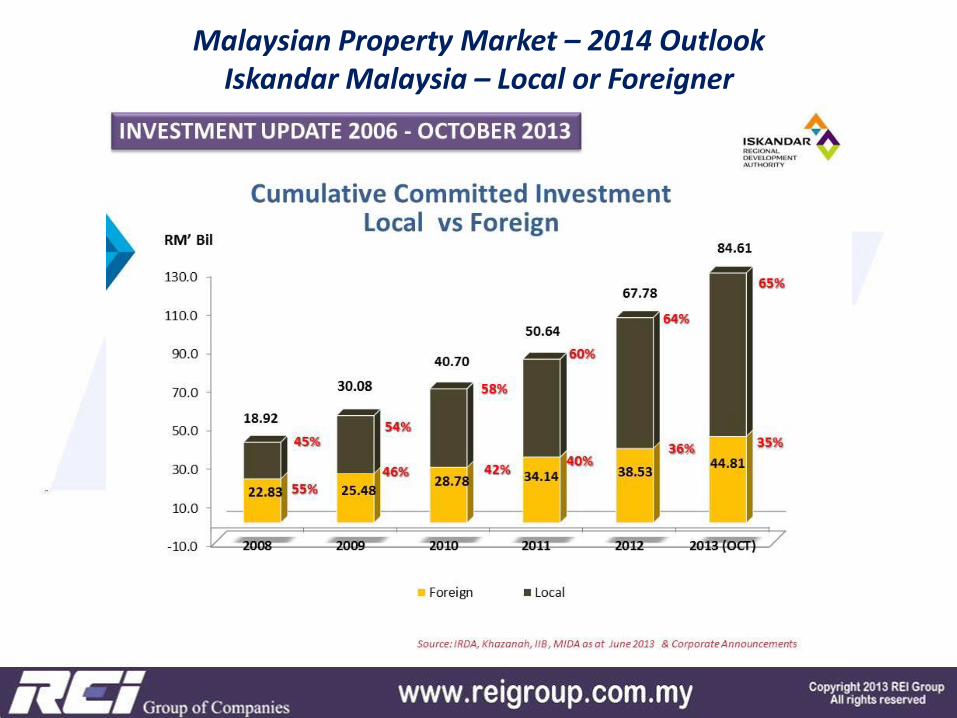
Malaysian Property Market – 2014 Outlook Iskandar Malaysia – Local or Foreigner
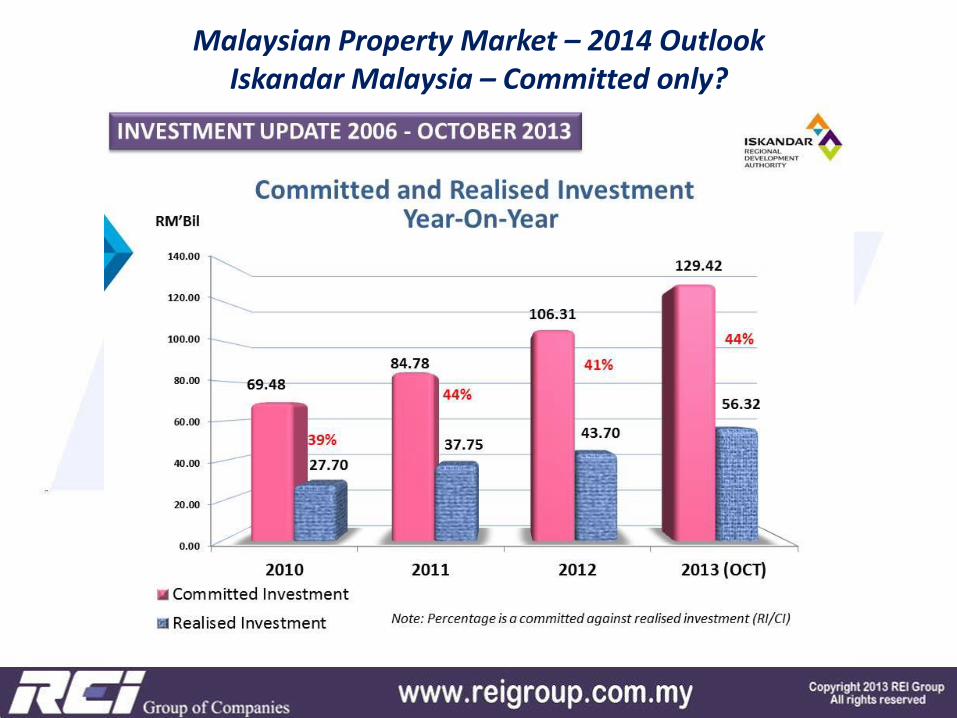
Malaysian Property Market – 2014 Outlook Iskandar Malaysia – Committed only?
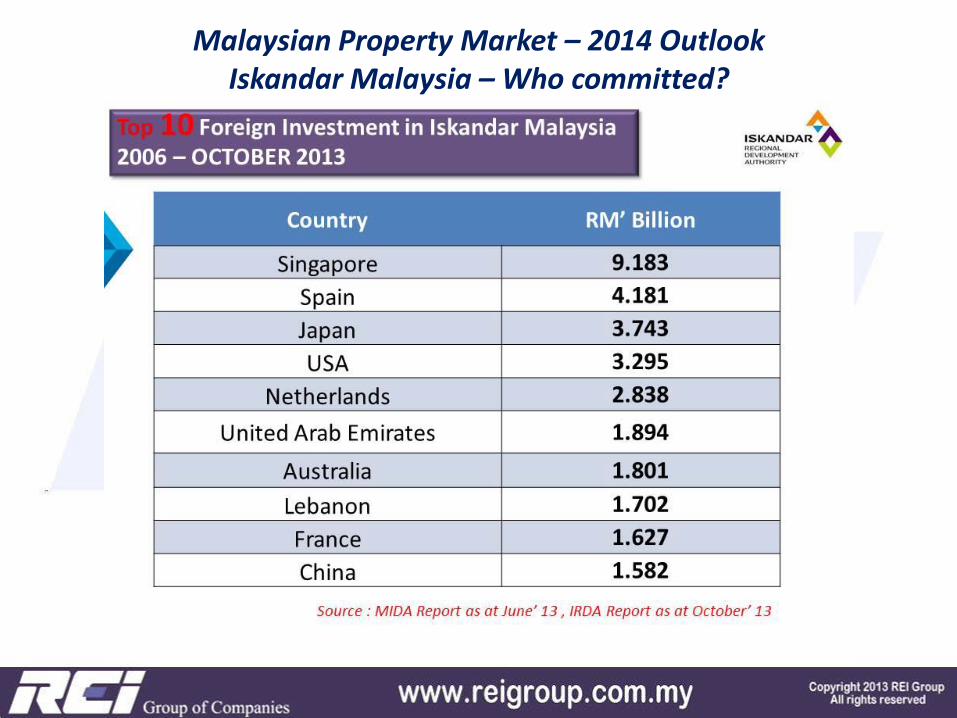
Malaysian Property Market – 2014 Outlook Iskandar Malaysia – Who committed?
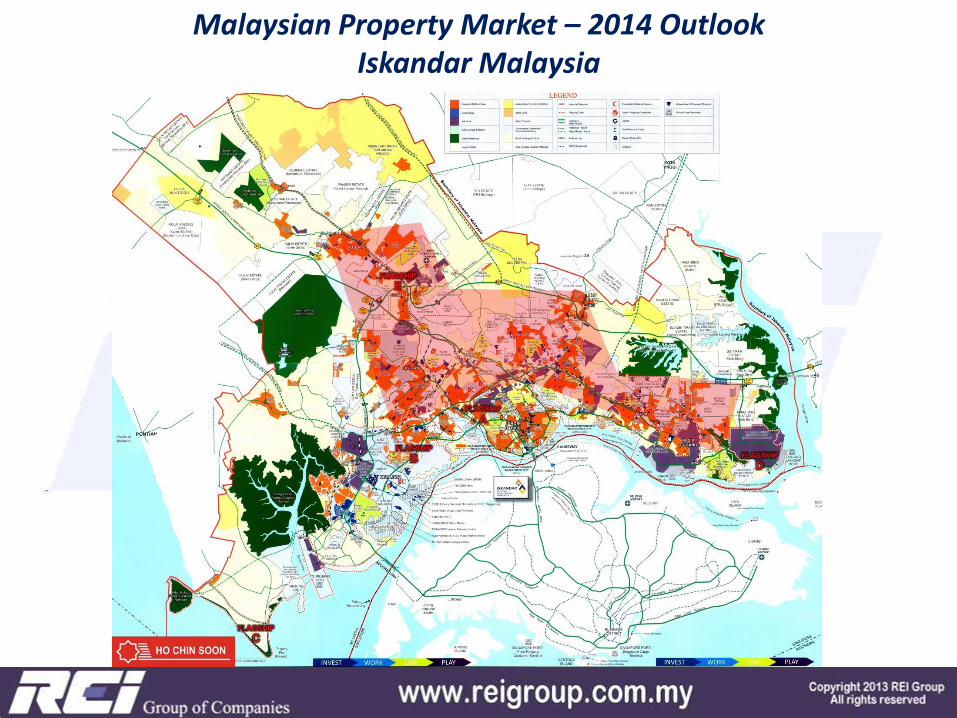
Malaysian Property Market – 2014 Outlook Iskandar Malaysia
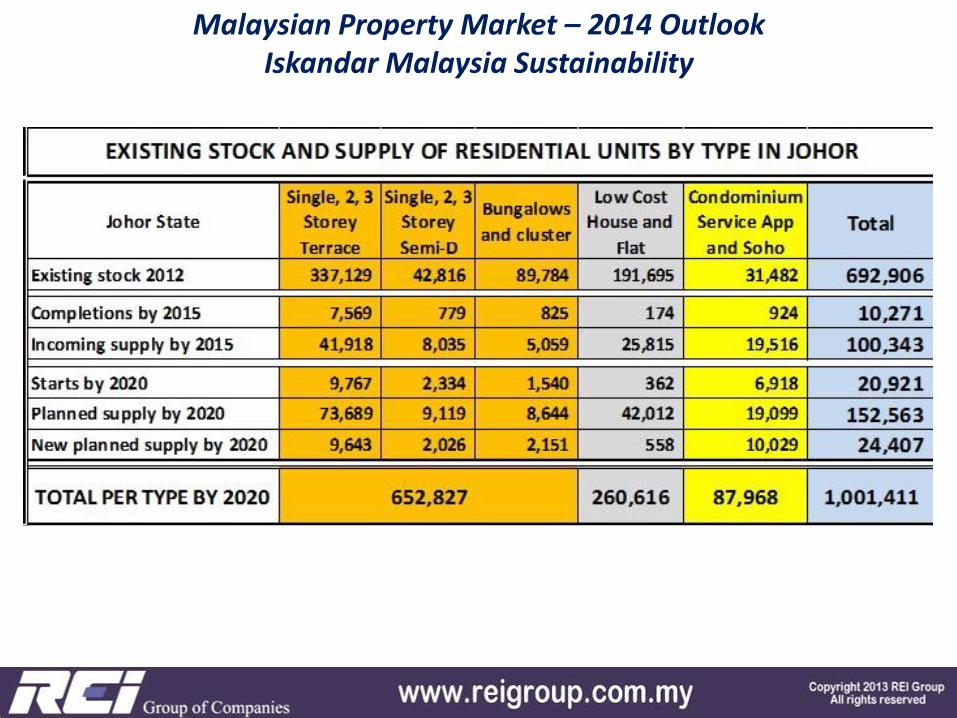
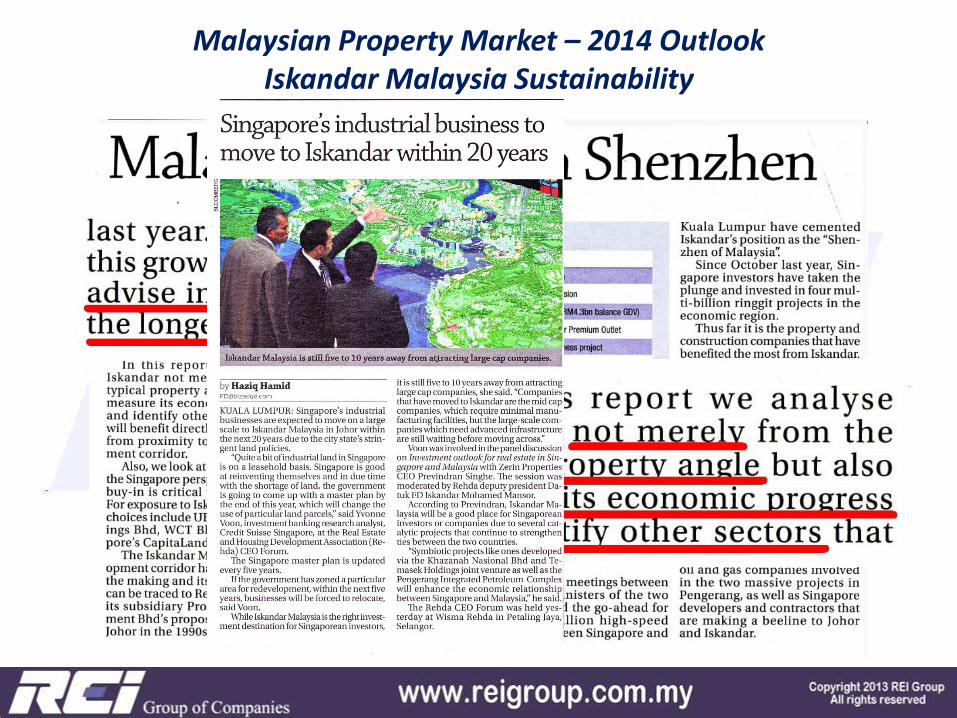
Malaysian Property Market – 2014 Outlook Iskandar Malaysia Sustainability
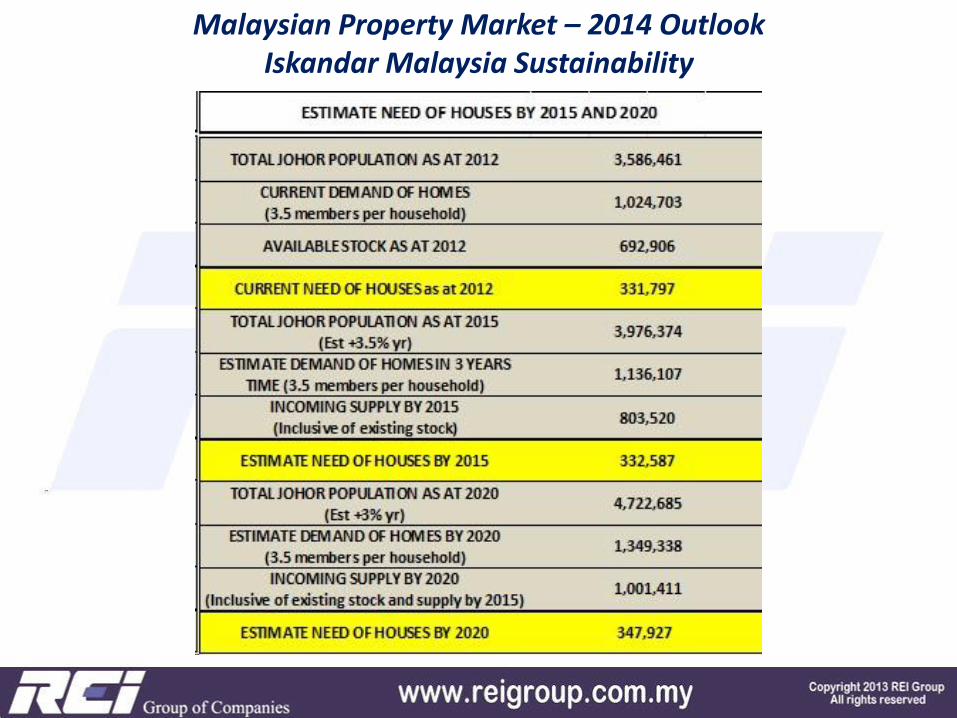
Malaysian Property Market – 2014 Outlook Iskandar Malaysia Sustainability

MALAYSIAN REAL ESTATE: HOW
Learn how to be a wise smart investor

MALAYSIAN REAL ESTATE: HOW
Learn how to be a wise smart investor