Proof-Spatial access to residential care resources
12
Dear Author Here are the proofs of your article. ·You can submit your corrections online, or via e-mail. · For online submission please insert your corrections in the online correction form. Always indicate the line number to which the correction refers. · You can also insert your corrections in the proof PDF and email the annotated PDF. · Remember to note the journal title, manuscript number , and your name when sending your response via e-mail. · Check any questions that have arisen during copy editing or typesetting and insert your answers/corrections. ·Check that the text is complete and that all figures, tables and their legends are included. Also check the accuracy of special characters, equations, and additional files if applicable. Substantial changes in content, e.g., new results, corrected values, title and authorship are not allowed without the approval of the responsible editor. In such a case, please contact us for futher advice. · If we do not receive your corrections within 48 hours, we will send you a reminder. · The final versions of your article will be published around one week after receipt of your corrected proofs.
Transcript of Proof-Spatial access to residential care resources

Dear AuthorHere are the proofs of your article.
·You can submit your corrections online, or via e-mail. · For online submission please insert your corrections in the online correction form. Always indicate the line number to which the correction refers.
· You can also insert your corrections in the proof PDF and email the annotated PDF.
· Remember to note the journal title, manuscript number, and your name when sending your response via e-mail.
· Check any questions that have arisen during copy editing or typesetting and insert your answers/corrections.
·Check that the text is complete and that all figures, tables and their legends are included. Also check the accuracy of special characters, equations, and additional files if applicable. Substantial changes in content, e.g., new results, corrected values, title and authorship are not allowed without the approval of the responsible editor. In such a case, please contact us for futher advice.
· If we do not receive your corrections within 48 hours, we will send you a reminder.
· The final versions of your article will be published around one week after receipt of your corrected proofs.
1 RESEARCH Open Access
2 Spatial access to residential care resources in3 Beijing, China4 Yang Cheng1*, Jiaoe Wang2 and Mark W Rosenberg3
5 Abstract
6 Background: As the population is ageing rapidly in Beijing, the residential care sector is in a fast expansion process7 with the support of the municipal government. Understanding spatial accessibility to residential care resources by8 older people supports the need for rational allocation of care resources in future planning.
9 Methods: Based on population data and data on residential care resources, this study uses two Geographic10 Information System (GIS) based methods – shortest path analysis and a two-step floating catchment area (2SFCA)11 method to analyse spatial accessibility to residential care resources.
12 Results: Spatial accessibility varies as the methods and considered factors change. When only time distance is13 considered, residential care resources are more accessible in the central city than in suburban and exurban areas. If14 care resources are considered in addition to time distance, spatial accessibility is relatively poor in the central city15 compared to the northeast to southeast side of the suburban and exurban areas. The resources in the northwest to16 southwest side of the city are the least accessible, even though several hotspots of residential care resources are17 located in these areas.
18 Conclusions: For policy making, it may require combining various methods for a comprehensive analysis. The19 methods used in this study provide tools for identifying underserved areas in order to improve equity in access to20 and efficiency in allocation of residential care resources in future planning.
21 Keywords: Spatial accessibility, Residential care, Shortest path analysis, Two-step floating catchment area method,22 Planning
23 Background24 Residential care refers to long-term care given to older25 population (aged 60 and over in this research) in a resi-26 dential setting rather than at their homes. The settings27 include retirement homes, assisted living facilities, rest28 homes, and so on. Residential care as an alternative op-29 tion for elder care has rapidly developed in Beijing in re-30 cent years. Demographic changes have been one of the31 major factors for the expansion of residential care ser-32 vices. The population aged 60 and over increased from33 1.70 million in 2000 (12.5% of the total population) to34 2.35 million in 2010 in Beijing (18.7% of the total popu-35 lation). Meanwhile, the oldest-old (aged 80 and over)36 increased from 132,928 in 2000 (0.98% of the total popu-37 lation) to 351,000 in 2010 (2.8% of the total population)
38[1,2]. The population aged 60 and over is expected to be394.15 million (30% of the total population) in 2025 [3].40Increases in the older population are generating de-41mand for a wide range of health and elder care services,42including residential care. A second major factor gener-43ating demand is an official policy to support the devel-44opment of residential care services. The Beijing45Municipal Government aims to create a city – district46(county) – subdistrict (township) multi-level residential47care system and provide available residential care ser-48vices for four per cent of the older population by 2020.49The number of beds offered by residential care facilities50(RCFs) almost doubled from 34,354 in 2006 to 67,018 in512010 [1,4]. In order to meet the demand for four per52cent of the older population, the number of beds will53need to increase by 10,000 beds per year from 2010 to542020 [5].* Correspondence: [email protected]
1School of Geography, Beijing Normal University, 19 Xinjiekouwai Avenue,Beijing 100875, ChinaFull list of author information is available at the end of the article
INTERNATIONAL JOURNAL OF HEALTH GEOGRAPHICS
© 2012 Cheng et al.; licensee BioMed Central Ltd. This is an Open Access article distributed under the terms of the CreativeCommons Attribution License (http://creativecommons.org/licenses/by/2.0), which permits unrestricted use, distribution, andreproduction in any medium, provided the original work is properly cited.
Cheng et al. International Journal of Health Geographics 2012, 11:32http://www.ij-healthgeographics.com/content/11/1/32
55 With the rapid growth of residential care resources,56 governments need to make greater efforts to ensure57 equal access to residential care services according to the58 geographic distribution of older people and the variety59 of demands they generate. From a geographic perspec-60 tive, how to allocate residential care resources rationally61 and use knowledge-based planning for the future62 requires a better understanding of the distribution pat-63 tern of supply, demand, and spatial accessibility to64 resources by the older population. Availability of more65 and better data and the development of GIS technolo-66 gies enable better measurement of spatial access to67 health care and social services and allows for the identi-68 fication of underserved areas.69 This study aims to measure spatial access to residential70 care resources in Beijing by using two GIS-based meth-71 ods: shortest path analysis and a two-step floating catch-72 ment area (2SFCA) method. The specific research73 questions analysed are:
74 1) What are the distribution patterns of RCF service75 areas?76 2) How do various factors affect spatial accessibility to77 residential care resources?
78 The second part of the paper systematically reviews79 the existing literature on the concept of access to health80 care and social services, geographic distribution and pol-81 icy implications for residential care, and the application82 of GIS-based measurements of spatial access to health83 care and social services in English-speaking countries84 and China. In the third part, the data sources are85 described and the two methods are explained in detail86 that were used to measure service areas and spatial ac-87 cessibility to residential care resources. The results sec-88 tion presents the travel times to RCF service, service89 areas of each RCF and the availability of residential care90 resources at the subdistrict (township) level, as well as91 spatial accessibility to residential care resources taking92 into account distance and size of RCFs. The paper ends93 with a discussion of the policy implications of the study94 methods and results. Limitations of the study are also95 addressed.
96 Literature review97 An extensive literature on access to health care services98 and location-allocation problems exists. With regard to99 the concept of access, researchers have defined access100 from various aspects. Rosenberg interpreted access as101 two components: economic and physical access [6]. The102 former is the ability to purchase health care services,103 whereas the latter is the ability to overcome the cost of104 distance for using health care services. Economic access105 is thought to be the prime important factor in the study
106of health care delivery. Joseph and Phillips divided acces-107sibility into locational accessibility (physical distance)108and effective accessibility (e.g., whether a facility is al-109ways available or open, and whether it is socially or fi-110nancially accessible) [7]. In addition, Andersen’s revised111Behavioral Model of Health Services Use divides access112into four components: potential access (enabling113resources), realized access (actual use of health service),114equitable access (occurring when resources meet the115needs of the population with various demographic char-116acteristics), and inequitable access (occurring when so-117cial structure, health beliefs, and enabling resources118determine who gets medical care) [8]. The definitions119share a common concept of access as multi-dimensional120and emphasize the interaction of geographical, eco-121nomic, social, and cultural factors in the process of ac-122cess to health care services.123With regard to residential care, a great deal of litera-124ture in the U.K. focused on the policy implications of125the development of residential care services and vari-126ation in the spatial distribution of RCFs. For example,127Phillips et al. studied the spatial concentration of resi-128dential homes for the elderly in the U.K. [9]. Smith and129Ford analysed the changes in the spatial distribution of130public and private RCFs between 1988 and 1993 [10].131Both of the studies focused on the spatial distribution132and expansion of residential homes at the national and133regional scales. Bartlett and Phillips [11] and Andrews134and Phillips [12-14] analysed the impacts of policy135changes on the development of residential care in the U.136K. during the 1980s and 1990s. In the 1980s, private137residential care enjoyed substantial state financed sup-138port and expanded rapidly. However, since the imple-139mentation of the 1990 National Health Service and Care140in the Community Act in 1993, the withdrawal of guar-141anteed state support and intense market competition142had negative impacts on many RCFs, which implies a143market failure in the social care sector.144With the development of GIS techniques, researchers145have applied spatial analysis models to access to health146care services. Even though researchers are aware of the147importance of both spatial and nonspatial factors in148affecting health care access, the earlier research studied149the two types of factors separately. For example, Radke150and Mu developed the spatial decomposition method151(also called the 2SFCA method) to measure access to so-152cial services for each household which can help adjust153and better accommodate underserved regions [15]. Luo154and Wang modified the 2SFCA method developed by155Radke and Mu and the gravity-based method to assess156the variations in spatial accessibility to primary care in157the Chicago region, U.S. [16]. Comparing the two meth-158ods, Luo and Wang recommended the 2SFCA method159as simpler and more practical for planning and policy
Cheng et al. International Journal of Health Geographics 2012, 11:32 Page 2 of 11http://www.ij-healthgeographics.com/content/11/1/32
160 making. Later, based on the earlier studies, Wang and161 Luo took into account geographical and socio-162 demographic factors [17]. They used an integrated ap-163 proach to measure accessibility to primary healthcare in164 Illinois, U.S., which included the 2SFCA method to165 measure spatial accessibility and factor analysis to meas-166 ure various socio-demographic factors.167 The 2SFCA method, however, has been criticized for168 its limitations and many improvements have been pro-169 posed [18]. For example, Luo and Qi developed an170 enhanced 2SFCA method (E2SFCA) to address the171 problem of uniform access within the catchment by ap-172 plying weights to different travel time zones to account173 for distance decay [19]. Based on E2SFCA, Luo and174 Whippo proposed the Variable 2SFCA method175 (V2SFCA), which adds two more steps to determine the176 catchment sizes by increasing the catchment until a base177 population and a physician-to-population ratio met with178 predefined thresholds [20]. They also used sensitivity179 analysis to test various thresholds and find out the dif-180 ferences in urban centers and rural areas. The improved181 method addressed the issue of fixed catchment size and182 offers a way of determining the proper catchment sizes183 for both physician and population locations.184 The shortest path approach [21], the gravity-based185 method [22-24] and the 2SFCA method [25] have been186 most frequently applied to analyse accessibility to health187 care services in various regions of China. Yin and Xu188 considered factors such as gender, age and income in a189 study of accessibility and equity to parks in Shanghai190 [26]. Cheng conducted a study of residential care in191 China [27]. She showed that access to residential care is192 an interconnected process affected by geographical, eco-193 nomic and socio-cultural factors. With regards to geo-194 graphical access, the study drew a qualitative conclusion195 that the location of a RCF, convenience of public trans-196 portation, the time-distance for families’ and friends’ vis-197 its, and access to health care play important roles in198 choosing a specific RCF. Quantitative methods have199 been used to analyze health care services, but there is200 lack of quantitative studies on residential care. More201 studies using GIS-based methods to analyse accessibility202 to residential care are urgently needed to contribute to203 knowledge for future planning and policy making.
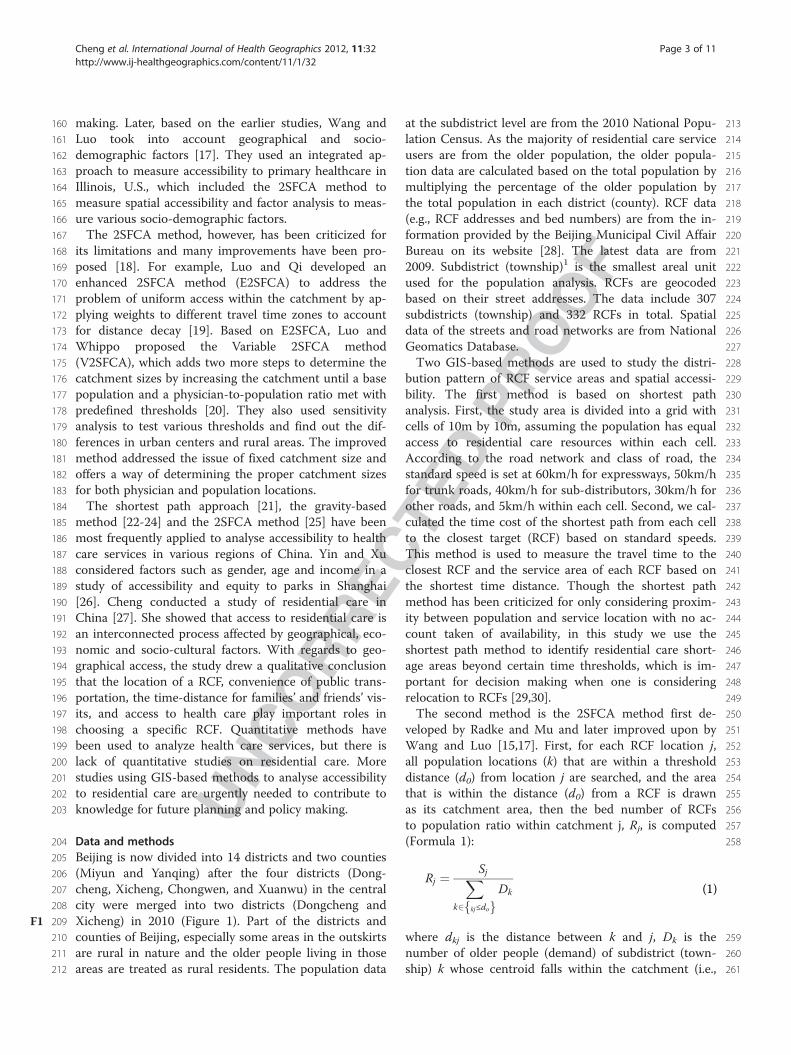
204 Data and methods205 Beijing is now divided into 14 districts and two counties206 (Miyun and Yanqing) after the four districts (Dong-207 cheng, Xicheng, Chongwen, and Xuanwu) in the central208 city were merged into two districts (Dongcheng and209 Xicheng) in 2010 (FigureF1 1). Part of the districts and210 counties of Beijing, especially some areas in the outskirts211 are rural in nature and the older people living in those212 areas are treated as rural residents. The population data
213at the subdistrict level are from the 2010 National Popu-214lation Census. As the majority of residential care service215users are from the older population, the older popula-216tion data are calculated based on the total population by217multiplying the percentage of the older population by218the total population in each district (county). RCF data219(e.g., RCF addresses and bed numbers) are from the in-220formation provided by the Beijing Municipal Civil Affair221Bureau on its website [28]. The latest data are from2222009. Subdistrict (township)1 is the smallest areal unit223used for the population analysis. RCFs are geocoded224based on their street addresses. The data include 307225subdistricts (township) and 332 RCFs in total. Spatial226data of the streets and road networks are from National227Geomatics Database.228Two GIS-based methods are used to study the distri-229bution pattern of RCF service areas and spatial accessi-230bility. The first method is based on shortest path231analysis. First, the study area is divided into a grid with232cells of 10m by 10m, assuming the population has equal233access to residential care resources within each cell.234According to the road network and class of road, the235standard speed is set at 60km/h for expressways, 50km/h236for trunk roads, 40km/h for sub-distributors, 30km/h for237other roads, and 5km/h within each cell. Second, we cal-238culated the time cost of the shortest path from each cell239to the closest target (RCF) based on standard speeds.240This method is used to measure the travel time to the241closest RCF and the service area of each RCF based on242the shortest time distance. Though the shortest path243method has been criticized for only considering proxim-244ity between population and service location with no ac-245count taken of availability, in this study we use the246shortest path method to identify residential care short-247age areas beyond certain time thresholds, which is im-248portant for decision making when one is considering249relocation to RCFs [29,30].250The second method is the 2SFCA method first de-251veloped by Radke and Mu and later improved upon by252Wang and Luo [15,17]. First, for each RCF location j,253all population locations (k) that are within a threshold254distance (d0) from location j are searched, and the area255that is within the distance (d0) from a RCF is drawn256as its catchment area, then the bed number of RCFs257to population ratio within catchment j, Rj, is computed258(Formula 1):
Rj ¼ SjXk2 kj≤dof g
Dk
259where dkj is the distance between k and j, Dk is the260number of older people (demand) of subdistrict (town-261ship) k whose centroid falls within the catchment (i.e.,
(1)
Cheng et al. International Journal of Health Geographics 2012, 11:32 Page 3 of 11http://www.ij-healthgeographics.com/content/11/1/32
262 dkj≤ d0), and Sj is the number of beds of the RCF at263 location j.264 Next, for each population location i, we searched all265 RCF locations (j) (supply) that are within the threshold266 distance (d0) from location i (i.e., catchment area i), and267 sum up the number of beds to population ratio Rj at268 these locations as accessibility AF
i (Formula 2):
AFi ¼
Xj2fdij≤d0 Rj
¼X
j2fdij≤d0
SjXk2fdkj≤d0
Dk
0BB@
1CCA
269 where AFi represents the accessibility at population loca-
270 tion i based on the 2SFCA method, dij is the distance271 between i and j, and Rj is the number of beds to popula-272 tion ratio at RCF location j whose centroid falls within273 the catchment area centered at i (i.e., dij≤ d0) where the274 larger a value of AF
i indicates better accessibility to resi-275 dential care resources at a population location.
276This study is unable to calculate population-weighted277centroids of each subdistrict because population data at a278smaller scale than the subdistrict (township) level are not279available. Therefore, simple geographic centriods of each280subdistrict are used instead of population-weighted cen-281troids in the spatial analysis. To simplify the calculation,282the distance between any RCF and population location is283measured by the straight-line distance instead of time dis-284tance. The average distance between any population loca-285tion and its closest RCF is used as a reference for a286reasonable threshold distance (d0= 3.3km). Straight line287distance is frequently used as a proxy measure for travel288times and there are studies showing that the observed cor-289relations of travel time and straight-line distance are quite290high[31,32]. The first step of the 2SFCA method is to291measure the availability of residential care resources for292the supply location (RCF), and the second step sums up293the initial ratios in the overlapped service areas to meas-294ure spatial accessibility for a demand location (population295location), where residents have access to multiple RCF296locations. The 2SFCA method overcomes some of the
Figure 1 The 14 districts and two counties of Beijing.
(2)
Cheng et al. International Journal of Health Geographics 2012, 11:32 Page 4 of 11http://www.ij-healthgeographics.com/content/11/1/32

297 limitations of the shortest path analysis. Instead of only298 taking into account the RCF within the shortest time dis-299 tance of any population location, the 2SFCA method con-300 siders the potential options of RCFs within a distance301 threshold, as well as the size of the RCFs.302 The two spatial analysis methods used in this study303 are implemented in ArcGIS 9.3 software. “Reclass”,304 “Raster Calculator”, “Cost Distance”, “Cost Allocation”305 functions in “Analysis Tools” of ArcGIS9.3 are used for306 shortest path analysis, and “Proximity”, “Point Distance307 Tool” functions are used for 2SFCA analysis.
308 Results309 The spatial distribution of the older population better310 reveals the distribution pattern of residential care de-311 mand than that of total population, as the majority of312 service users of residential care are older population. As313 FigureF2 2 shows, the older population density is relatively314 high in the central city and it shows a declining pattern315 of the older population from the city centre outwards.316 The highest older population density is 5542.17 older
317persons per km2 in a subdistrict of Dongcheng District318at the city centre, while the lowest older population319density is only 1.42 older persons per km2 in a township320of Huairou District. Generally speaking, the older popu-321lation density in the city centre is higher than 1000 older322persons per km2, and is lower than 50 older persons per323km2 in the majority of suburban and exurban areas. The324huge variation in the older population density is a strong325prima facie argument for the reasonable allocation of326care resources.327The shortest path analysis is used to map the travel328time to the nearest RCF at various thresholds (Figure F33).329The time distance between population locations and330RCFs is highly related to the road network and standard331speeds assumed. If only time distance is considered, ac-332cessibility to RCFs is better in central districts than in333suburban and exurban areas. The time distance from the334population locations to their closest RCFs is less than 30335minutes in most areas of the central districts. In the ma-336jority of the suburban and exurban areas, the time dis-337tance is between 30 minutes and two hours. The spatial
Figure 2 The spatial distribution of older population density at subdistrict level in Beijing in 2010.
Cheng et al. International Journal of Health Geographics 2012, 11:32 Page 5 of 11http://www.ij-healthgeographics.com/content/11/1/32

338 accessibility to RCFs is better in the northeast and339 southeast areas of Beijing than in the northwest and340 southwest areas.341 The results from the shortest path analysis are also342 used to divide the service area of each RCF which is pre-343 sented in FigureF4 4. In the areas with a relatively high344 density of RCFs, the service area of each RCF is rela-345 tively small. In other words, when only time distance is346 considered, spatial accessibility to residential care347 resources is relatively high in the areas with a high dens-348 ity of RCFs. As Figure 4 shows, the service areas of RCFs349 in the central city are relatively small compared to the350 service areas of RCFs on the outskirts of Beijing, espe-351 cially in the north and west parts of Beijing.352 The spatial distribution of available residential care353 resources in each subdistrict (township) is mapped by354 using the indicator “bed number per older person” (Fig-355 ureF5 5). The spatial distribution of residential care356 resources is uneven. Different from time distance acces-357 sibility, care resources per older person is relatively lim-358 ited in the central districts, whereas it is relatively
359abundant in the north and west outskirts of Beijing, es-360pecially in the areas near some natural resorts such as361the Miyun reservoir (e.g., Shicheng, Miyun), the Ming-362tomb reservoir (e.g., Changling, Shisanling, Nanshao,363Baishan, Xiaotangshan), the Guanting reservoir (e.g.,364Zhangshanying), the Fenghuangling area (e.g., Liucun,365Yangfang, Sujiatuo), the Xiangshan area (Xiangshan),366and Puwa village. The limitation of this indicator is that367it assumes older people only access residential care re-368sources in the subdistrict (township) where they live. In369reality, older people do not necessarily utilize the care370resources offered by the RCF nearest to their homes.371They may choose a RCF from several RCFs nearby, or372even a RCF in other neighbourhoods considering various373factors other than proximity [27].374The results show significant variation in spatial acces-375sibility to residential care resources on the left and right376sides of a northeast-southwest line (Figure F66). The resi-377dential care resources on the right side of the line are378generally more accessible than those of the left side.379The distribution of residential care resources is more
Figure 3 The spatial distribution of travel time to the nearest RCF in Beijing.
Cheng et al. International Journal of Health Geographics 2012, 11:32 Page 6 of 11http://www.ij-healthgeographics.com/content/11/1/32
380 geographically uneven on the left side than the right side381 of the northeast-southwest division. The residential care382 resources are generally more accessible in the central383 city than the majority of outskirts on the left side of the384 northeast-southwest division. However, several hotspots385 of RCFs are located in the left side areas, such as the386 Miyun reservoir, the Ming-tomb reservoir, and Xiang-387 shan area, which can be clearly indentified in Figure 6.
388 Discussion389 This study analyses the spatial accessibility of RCFs390 based on population and residential care resources using391 shortest path analysis and the 2SFCA method. The392 results from the two methods show different distribution393 patterns of spatial accessibility to RCFs. Considering394 time distance, the results from the shortest path analysis395 show that the spatial accessibility to RCFs is better in396 the central city (the majority of areas are within 30 min-397 utes distance to the closest RCF) than the outskirts of398 Beijing (the majority of areas are within two hours dis-399 tance from the closest RCF). Spatial accessibility400 decreases as distance from main streets increases. Resi-401 dential care resources are more spatially accessible in402 the northeast and southeast areas of the city than the
403northwest and southwest areas. With regard to RCF care404resources, the number of beds per older person is higher405in suburban and exurban areas than the central city, and406resources in the northwest and southwest areas are more407abundant than in the northeast and southeast areas of408the city. The 2SFCA method considers geographical dis-409tance, older population and number of beds of RCFs.410The results show that spatial accessibility to RCFs is411relatively poor in the central city, but when compared to412the resources in the northwest and west outskirts of the413city, the RCF resources in the central city are more414spatially accessible. The spatial accessibility to residential415care resources in the northeast to southeast side of the416city is generally better than that in the northwest to417southwest areas, but several hotspots of residential care418resources are located in the northwest to southwest419outskirts.420The results from both methods are helpful for421knowledge-based policy making. Shortest path analysis is422able to identify the service areas at certain time thresh-423olds, as well as underserved areas. The qualitative study424conducted by Cheng in Beijing found that older people425and their family member prefer choosing a RCF within426the time distance of one to one and a half hours from
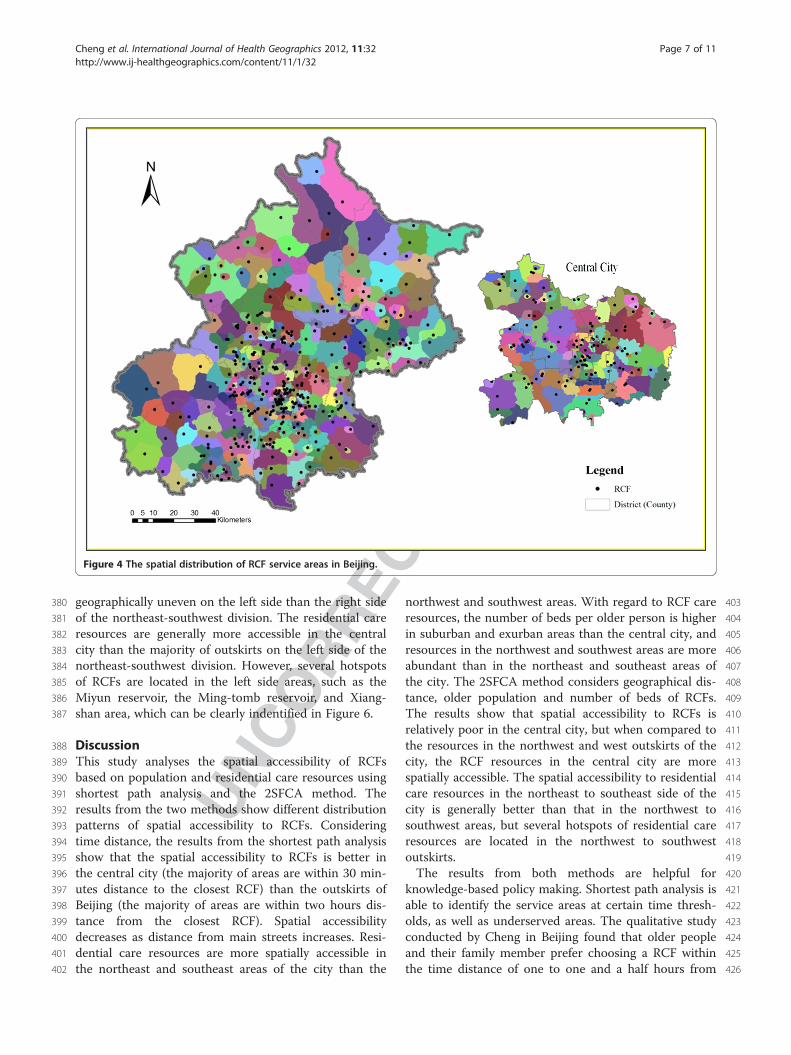
Figure 4 The spatial distribution of RCF service areas in Beijing.
Cheng et al. International Journal of Health Geographics 2012, 11:32 Page 7 of 11http://www.ij-healthgeographics.com/content/11/1/32
427 their homes [27]. The underserved areas at a certain428 time threshold (e.g., one and a half hours) are poten-429 tial areas for allocating more resources. In addition to430 identifying underserved areas, the 2SFCA method helps431 provide suggestions for creating a city – district (county) –432 subdistrict (township) multi-level RCF system based on433 variation in spatial accessibility to RCFs. For example,434 the RCFs located in the hotspots with high spatial ac-435 cessibility scores and those with a large number of beds436 might be classified as city-level RCFs2.437 With regard to the data sources, the difference be-438 tween the two methods is that shortest path analysis is439 based on raster data and the 2SFCA method is based on440 vector data in this study. The shortest path analysis only441 considers the factor of distance. The 2SFCA method442 considers interaction between demand and supply based443 on distance, and it calculates the accessibility across ad-444 ministrative border (subdistrict/township border in this445 case), which reflects service utilization behaviour in real446 world.
447The gravity model is another widely used method to448measure accessibility, and it considers a nearby supplier449more accessible than a remote one and discounts a sup-450plier’s availability by a gravity-based potential measure451[16]. The 2SFCA method is a special case of the gravity-452based method. The difference in the two is that distance453impedance is dichotomous in the 2SFCA method but454continuous in the gravity-based method. For government455planning purposes, Luo and Wang suggest that the4562SFCA method is a better choice because the travel fric-457tion coefficient in a gravity model varies as the study458area changes and defining the coefficient makes the459method more complicated [16].460Several limitations of this study should be addressed.461First, the quality of geographic information is essential462for spatial analysis. In this study, population data are not463available at a smaller scale than the subdistrict level. If464better quality data were available, then population-465weighted centroids instead of simple geographic cen-466troids to represent population locations more accurately
Figure 5 RCF bed number per older person at the subdistrict (township) level in Beijing.
Cheng et al. International Journal of Health Geographics 2012, 11:32 Page 8 of 11http://www.ij-healthgeographics.com/content/11/1/32
467 would be possible. Second, to simplify the analysis,468 straight-line distance instead of time distance is used in469 the 2SFCA method, but existing studies have shown the470 correlation of straight-line distance and time distance is471 high. Third, the results need to be interpreted with cau-472 tion because in this study an arbitrary distance threshold473 was set in the 2SFCA method, but in reality, older peo-474 ple may utilize residential care resources at a greater dis-475 tance than the distance threshold. A sensitivity analysis476 of the distance threshold was not conducted. Existing re-477 search shows that the distance threshold/catchment is a478 critical parameter as it determines the smoothness of the479 result [16,33-35]. The results of a sensitivity analysis480 conducted by Luo and Wang show that a larger travel-481 time threshold generates stronger spatial smoothing and482 reduces variability of accessibility across space using the483 2SFCA method [16]. The smoothing effect of a large484 catchment size shows that the population to physician485 ratio of a particular census tract eventually converges to486 one value as the catchment increases [34]. In a recent487 study, Shi et al. suggest that different functional forms
488for determining distance decay weights in the second489step of 2SFCA do not significantly impact the spatial pat-490tern of the estimation results [35]. Fourth, the decision491making process of relocation is affected by various fac-492tors in addition to geographical factors [27]. It is, how-493ever, very challenging to examine various factors in the494model, although the study conducted by Wang and Luo495provides an example of considering both spatial and496nonspatial factors in analysing accessibility to primary497health care [17]. Access to residential care resources is a498complicated process and different from access to other499types of health care services because decisions are often500not made only by the user (i.e., the older person) but501also by other family members and/or friends. Their502needs must be taken into account as well.
503Conclusions504In summary from this study, three conclusions can be505drawn. First, in terms of time distance, the distribution506of RCF service areas is highly related to the road net-507work. The central city has better spatial accessibility than
Figure 6 Spatial accessibility to RCF in Beijing by 2SFCA method.
Cheng et al. International Journal of Health Geographics 2012, 11:32 Page 9 of 11http://www.ij-healthgeographics.com/content/11/1/32
508 the suburban and exurban areas. The RCF resources in509 the northeast and southeast areas are more spatially ac-510 cessible than those in the northwest and southwest areas.511 In terms of residential care resources, the distribution512 pattern is opposite of the time distance accessibility pat-513 tern, suburban and exurban areas have relatively more514 abundant resources than the central city. Northwest and515 southwest areas have more resources per older person516 than the northeast and southeast areas. Second, consider-517 ing time distance, older population and RCF resources,518 the distribution pattern of spatial accessibility to RCFs is519 more uneven in the northwest and southwest areas than520 the northeast and southeast areas. The central city has521 relatively low spatial accessibility, but it is better than the522 northwest and west outskirts of the city. The results of523 spatial accessibility vary by using different methods.524 Whether a method is efficient depends on the research525 question that one aims to answer. For policy making, it526 may require combining various methods for a compre-527 hensive analysis. Third, the results provide evidence for528 future planning of residential care resources, especially a529 multi-level residential care system. Indeed, with the rapid530 expansion of residential care services as planned for the531 next decade, knowledge-based planning is necessary for532 improving equitable access and the efficient allocation of533 resources. This study provides valuable information for534 planning and sheds light on future research by using two535 GIS-based spatial analysis methods.
536 Endnotes537 1. Currently, the constitution of China provides for538 five levels of local governments: the province, prefecture539 (city), county (district), township (subdistrict), and vil-540 lage (neighbourhood). Township is a rural administrative541 unit under the county and subdistrict is an urban ad-542 ministrative unit under the district.543 2. City-level RCFs refer to the RCFs which provide544 various types of service for older people living in Beijing545 and they are usually large in size. They are different546 from district-level RCFs or community-level RCFs for547 older people living in the district or community where548 the RCF locates.
549 Abbreviations550 GIS: Geographic Information System; 2SFCA: Two-step floating catchment551 area; RCF: Residential care facility.
552 Competing interests553 All authors declare that they have no competing of interest.
554 Authors’ contributions555 YC and JEW contributed to the design and analysis of the study and writing556 of the manuscript. MWR contributed to drafting the manuscript and revising557 it. All authors read and approved the final manuscript.
558 Acknowledgements559 All the authors gratefully thank the reviewers and editor for their insightful560 and constructive comments, and the financial support from Ministry of
561Education China (Grant No.104-16711301), Chinese Academy of Sciences562Visiting Professorship for Senior International Scientists (Grant No.5632010T1Z02), National Natural Science Foundation of China (Grant No.56441001082) and Programme of Bingwei Excellent Young Scientists of the565Institute of Geographic Sciences and Natural Resources Research, Chinese566Academy of Sciences (Grant No. 2011RC201).
567Author details5681School of Geography, Beijing Normal University, 19 Xinjiekouwai Avenue,569Beijing 100875, China. 2Key Laboratory of Regional Sustainable Development570Modeling, Institute of Geographic Sciences and Natural Resources Research,571Chinese Academy of Sciences, 11A Datun Road, Chaoyang District, Beijing572100101, China. 3Department of Geography, Queen’s University, Kingston, ON573K7L 3N6, Canada.
574Received: 10 May 2012 Accepted: 5 August 2012575Published: 9 August 2012
576References1. 577Committee on Ageing of Beijing: Report on elderly population information
578and development of elder care of Beijing in 2010. Beijing, China. 2010. In579Chinese. http://zhengwu.beijing.gov.cn/tjxx/tjgb/t1205592.htm.
2. 580National Bureau of Statistics of China: China’s 2000 Census Data at County581Level. Beijing: China Statistics Press; 2003.
3. 582Beijing Municipal Bureau of Statistics: The Future 50 Years of Beijing583Municipality. Beijing, China: Electronics press; 2000. In Chinese.
4. 584Committee on Ageing of Beijing: Report on elderly population information585and development of elder care of Beijing in 2006. Beijing, China: 2007. In586Chinese. http://zhengwu.beijing.gov.cn/tjxx/tjgb/t892710.htm.
5. 587Beijing Civil Affairs Bureau: Beijing Municipal Commission of Development and588Reform, Beijing Municipal Commission of Urban Planning, Beijing Municipal589Bureau of Finance and Beijing Municipal Bureau of Land and Resources: Notice590on accelerating the development of residential care facilities. In Chinese.591[http://www.bjmzj.gov.cn/templet/mzj/ShowArticle.jsp?id=100921].
6. 592Rosenberg MW: Accessibility to health care: A North American593perspective. Progress in Human Geography 1983, 7:78–87.
7. 594Joseph AE, Phillips DR: Accessibility and utilization: Geographical perspectives595on health care delivery. New York, NY: Harper & Row; 1984.
8. 596Andersen RM: Revising the Behavioral Model and access to medical care:597Does it matter? J Health Soc Behav 1995, 36:1–10.
9. 598Phillips DR, Vincent J, Blacksell S: Spatial concentration of residential599homes for the elderly: Planning responses and dilemmas. Trans Inst Br600Geogr 1987, 12:73–83.
10. 601Smith G, Ford R: Geographical change in residential care provision for602the elderly in England 1988–1993. Health Place 1998, 4:15–31.
11. 603Bartlett HP, Phillips DR: Policy issues in the private health sector:604Examples from long-term care in the U.K. Soc Sci Med 1996, 43:731–737.
12. 605Andrews GJ, Phillips DR: Moral dilemmas and the management of private606residential homes: The impact of care in the community reforms in the607UK. Aging & Society 2000, 20:599–622.
13. 608Andrews GJ, Phillips DR: Private residential care and older persons: Local609impact of care in the community reforms in England and Wales. Social610Policy & Administration 2000, 34:206–222.
14. 611Andrews GJ, Phillips DR: Changing local geographies of private residential612care for older people 1983–1999: Lessons for social policy in England613and Wales. Soc Sci Med 2002, 55:63–78.
15. 614Radke J, Mu L: Spatial decomposition, modeling and mapping service615regions to predict access to social programs. Geographic Information616Sciences 2000, 6:105–112.
16. 617Luo W, Wang F: Measures of spatial accessibility to healthcare in a GIS618environment: synthesis and a case study in Chicago region. Environment619and Planning B: Planning and Design 2003, 30:865–884.
17. 620Wang F-H, Luo W: Assessing spatial and nonspatial factors for healthcare621access: Towards an integrated approach to defining health professional622shortage areas. Health Place 2005, 11:131–146.
18. 623Wang F-H: Measurement, optimization, and impact of health care624accessibility: A methodological review. Annals of the Association of625American Geographers 2012. doi:10.1080/00045608.2012.657146.
19. 626Luo W, Qi Y: An enhanced two-step floating catchment area (E2SFCA)627method for measuring spatial accessibility to primary care physicians.628Helath & Place 2009, 15:1100–1107.
Cheng et al. International Journal of Health Geographics 2012, 11:32 Page 10 of 11http://www.ij-healthgeographics.com/content/11/1/32

20.629 Luo W, Whippo T: Variable catchment sizes for the two-step floating630 catchment area (2SFCA) method. Health Place 2012, 18:789–795.
21.631 Zhang L, Lu Y-L, Zhao Y-Z: Accessibility assessment and planning of632 hospital: A case study on Yizheng City. Human Geography 2008,633 23:60–66. In Chinese.
22.634 Song Z-N, Chen W, Che Q-J: Measurement of spatial accessibility to635 health care facilities and defining health professional shortage areas636 based on improved potential model: A case study of Rudong Country in637 Jiangsu Province. Scientia Geographica Sinica 2010, 30:213–219. In Chinese.
23.638 Tao H-Y, Xu Y: Research on fairness of public health service in Haizhu639 District of Guangzhou. Disease Surveillance 2007, 22:408–411. In Chinese.
24.640 Wu J-J, Kong Y-F, Li B: The spatial accessibility analysis of rural medical641 facilities based on GIS: A case study of Lankou Country, Henan Province.642 Human Geography 2008, 23:37–42. In Chinese.
25.643 Liu Z, Guo S-Q, Jin H-H, Xie J, Wu X, Zhu X-D: The application of GIS-based644 two-step floating catchment area method in assessment of spatial645 accessibility to health care service in Beijing. Science of Surveying and646 Mapping 2007, 32:61–63. In Chinese.
26.647 Yin H-W, Xu J-G: Spatial accessibility and equity of parks in Shanghai.648 Urban Studies 2009, 16:71–76. In Chinese.
27.649 Cheng Y: Residential Care for Elderly People in Beijing, China: A study of650 the relationship between health and place. PhD thesis. Queen’s University:651 Department of Geography; 2010.
28.652 Beijing Municipal Civil Affair Bureau: The list of residential care facilities in653 Beijing; In Chinese. [http://www.bjmzj.gov.cn/templet/mzj/mzhy.jsp?654 CLASS_ID=mzhy&bljgType=bjs&NODE_ID=root&CLASS_ID=mzhy&655 class_num=8].
29.656 Cheng Y, Rosenberg MR, Wang W-Y, Yang LS, Li HR: Access to residential657 care in Beijing, China: Making the decision to relocate to a residential658 care facility. Ageing & Society 2011. doi:10.1017/S0144686X11000870.
30.659 McGrail MR, Humphreys JS: Measuring spatial accessibility to primary care660 in rural areas: Improving the effectiveness of the two-step floating661 catchment area method. Applied Geography 2009, 29:533–541.
31.662 Garnick DW, Lichtenberg E, Phibbs CS, Luft HS, Peltzman DJ, McPhee SJ:663 The sensitivity of conditional choice models for hospital care to664 estimation technique. J Health Econ 1989, 8:377–397.
32.665 Phibbs CS, Luft HS: Correlation of travel time on roads versus straight line666 distance. Medical Care Research and Review 1995, 52:532–542.
33.667 Shi X: Selection of bandwidth type and adjustment side in kernel density668 estimation over inhomogeneous backgrounds. International Journal of669 Geographical Information Sciences 2010, 24:643–660.
34.670 Luo W: Using a GIS-based floating catchment method to assess areas671 with shortage of physicians. Health Place 2004, 10:1–11.
35.672 Shi X, Alford-Teaster J, Onega T, Wang D: Spatial access and local demand673 for major cancer care facilities in the United States. Annals of the674 Association of American Geographers 2012. doi:10.1080/675 00045608.2012.657498.
676 doi:10.1186/1476-072X-11-32677 Cite this article as: Cheng et al.: Spatial access to residential care678 resources in Beijing, China. International Journal of Health Geographics679 2012 11:32.
Submit your next manuscript to BioMed Centraland take full advantage of:
• Convenient online submission
• Thorough peer review
• No space constraints or color figure charges
• Immediate publication on acceptance
• Inclusion in PubMed, CAS, Scopus and Google Scholar
• Research which is freely available for redistribution
Submit your manuscript at www.biomedcentral.com/submit
Cheng et al. International Journal of Health Geographics 2012, 11:32 Page 11 of 11http://www.ij-healthgeographics.com/content/11/1/32


![48216 Baack Final Proof [FM]](https://static.fdokumen.com/doc/165x107/631bfe5b3e8acd997705b218/48216-baack-final-proof-fm.jpg)