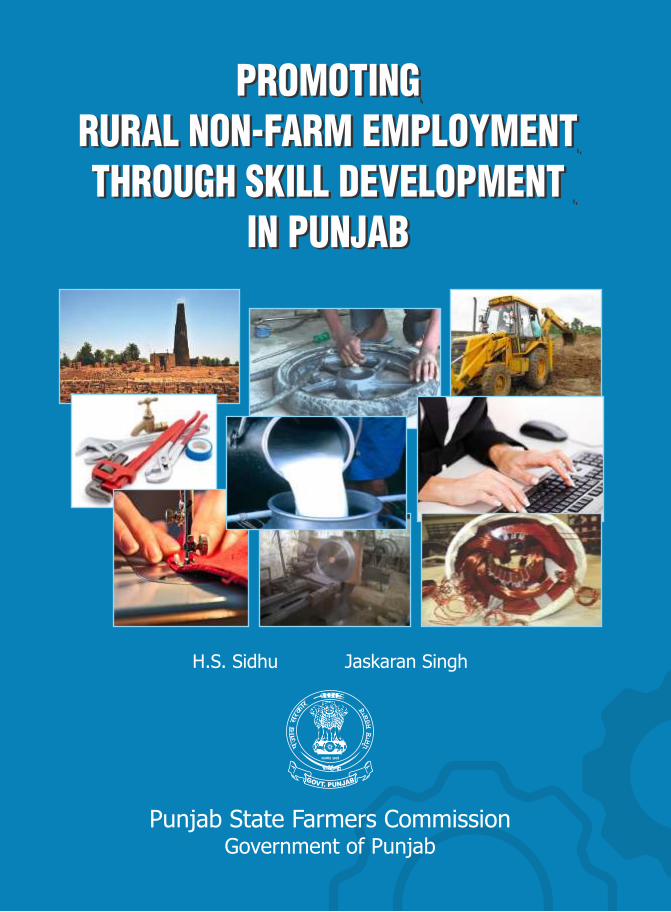
Promoting Rural Non-Farm Employment Through Skill ...
98
Punjab State Farmers Commission Government of Punjab PROMOTING RURAL NON-FARM EMPLOYMENT THROUGH SKILL DEVELOPMENT IN PUNJAB PROMOTING RURAL NON-FARM EMPLOYMENT THROUGH SKILL DEVELOPMENT IN PUNJAB H.S. Sidhu Jaskaran Singh
-
Upload
khangminh22 -
Category
Documents
-
view
5 -
download
0
Transcript of Promoting Rural Non-Farm Employment Through Skill ...
Punjab State Farmers CommissionGovernment of Punjab
PROMOTINGRURAL NON-FARM EMPLOYMENTTHROUGH SKILL DEVELOPMENT
IN PUNJAB
PROMOTINGRURAL NON-FARM EMPLOYMENTTHROUGH SKILL DEVELOPMENT
IN PUNJAB
H.S. Sidhu Jaskaran Singh

PROMOTING RURAL
NON-FARM EMPLOYMENT
THROUGH
SKILL DEVELOPMENT
IN
PUNJAB
H.S. SidhuJaskaran Singh
Punjab State Farmers CommissionGovernment of Punjab
2015

Published by:The Punjab State Farmers CommissionPunjab Mandi Bhawan, Phase-11 (Sector 65-A), Mohali (Punjab)Ph.: 0172-2232092 Telefax: 091-172-2232093e-mail: [email protected]
FOREWORD
Policy makers in developing countries are convinced that providing
gainful employment to every able bodied person in rural areas is necessary to
eradicate poverty and achieve balanced rural development. But because of
the declining land man ratio and increasing mechanisation of most farm
operations necessitated by the demands of intensive agriculture to handle
double cropping and ensure timeliness of farm operations for achieving high
yield, Punjab agriculture is not able to absorb any more additional labour
force. Infact it is shedding some of those already employed by it. Nor Punjab's
urban industry is able to create very many additional job opportunities for the
youth partly because of the nature of technology used by these industries and
partly because the industry itself does not grow at a fast enough pace.
The Punjab State Farmers Commission is obviously concerned at
widening gap between the opportunities being provided by the two traditional
major sectors of the economy i.e., organised industry and agriculture and the
aspirations of state's rural youth leading to large scale unemployment and
under employment with all the negative consequences.
In this scenario the only option which is being looked up to by the
policy makers is the development of rural non-farm sector which can perform
the task which was historically performed by the industrial sector in western
industrialised countries i.e. absorbing surplus labour force released by the
agriculture sector. Under the dictates of market forces Punjab already has a
fairly well developed non-farm sector but to cope with the present situation
its development has to be further accelerated. Along with the development of
existing non-farm sector it would also require imparting training in various
skills to the state's unemployed and underemployed youth to make them
capable of taking up non-farm jobs and/ or set-up their own non-farm
enterprises. But we did not have any authentic study throwing light on the
condition of those presently involved in the state's rural non-farm sector and
its capacity to generate employment and income or the kind of skills which
need to be taught to the present and prospective participants of the rural non-
farm activities to make them capable of taking up the challenge. It was in this
context that we commissioned this study to suggest measures to further
promote the rural non-farm sector through skilling the rural youth.
The study finds that those presently involved in the state's non-farm
activities and enterprises are fully employed in terms of time as well as income
criterion. Infact the earnings of rural households which are involved in rural
non-farm activities are more than that of an average farmer who owns 5-6
acres of land and they have more facilities in their homes compared to an
average Punjabi household. This is achieved largely on the strength of their
earnings from the non-farm sector only as 70 percent of them do not own
agricultural land and a majority of them do not have any prior training-formal
or informal before joining the non-farm activity. If rural youth are given
training in the identified skills and are supported by appropriate government
policy initiatives, the rural non-farm sector can throw up lacs of new
opportunities with decent incomes and levels of living.
(G.S. Kalkat)
Chairman
Punjab State Farmers Commission
ACKNOWLEDGEMENT
The idea of this project on 'Promoting Rural Non-Farm Employment
Through Skill Development in Punjab' is the brain child of Dr. G.S. Kalkat,
Chairman Punjab State Farmers Commission, who entrusted me the
responsibility of carrying out this study. Throughout the course of this study
he has been a constant source of inspiration and encouragement. Whenever
in doubt I always turned to him for his sagacious advice. I am grateful to him
for giving me the opportunity to work with him.
I am extremely thankful to Dr. B.S. Sidhu, Commissioner
Agriculture, Punjab, and Secretary, Punjab State Farmers Commission for his
keen interest in the present study. Dr. Sidhu gave some very useful practical
suggestions, which have been incorporated in the present study.
I benefitted immensely from my discussions with my senior
colleagues in the Commission; Dr. P.S. Rangi, Dr. S.S. Bains and Dr. Anil Kaura.
I would like to record my sincere thanks to them all.
Dr. Jasdeep Singh Toor, Associate Professor, Deptt. of Economics,
Punjabi University, Patiala was associated with me from the very beginning of
the present study. He not only helped me in organizing and conducting
primary survey but also contributed in the analysis of data. His contribution is
sincerely acknowledged.
My thanks are due to my co-researcher Mr. Jaskaran Singh,
Research Associate with the Punjab State Farmers Commission, who not only
supervised field survey, tabulated data and carried out computer analysis but
also diligently typed the manuscript of the report. He did an excellent job of it.
I also thank field investigators namely Sh. Sanjeev Kumar, Sh.
Ganesh Kanwar, Sh. Navpreet Singh, Sh. Parmjit Singh, Sh. Naresh Kumar and
Sh. Bhinder Singh who carried out this task with great care and diligence.
I also place on record my sincere thanks to Sh. R.S. Tiwana,
Administrative Officer of the Commission who saw to it that I am provided
with all the facilities and comforts required to complete this study. Also the co-
operation received from all the members of the office staff of the Commission
is appreciated and thanked.
H.S. Sidhu
(Consultant, PSFC Mohali)
CONTENTS
Forward
Acknowledgement
List of Tables
List of Figures
Executive Summary I-X
Chapters
1 Need for Developing Rural Non-Farm Activities in 1-4
Punjab
2 Size and Structure of Rural Non-Farm Sector 5-13
in Punjab
3 Profile of Participants Working in Rural Non-Farm 14-29
Sector in Punjab
4 Earnings and Levels of Living of Sample Households 43
Working in the Rural Non-Farm Sector in Punjab
5 Employment Generated, Capital Invested and 44-50
Labour Productivity in Rural Non-Farm Enterprises
6 Identifying Skills and Rural Non-Farm Activities 51-68
Which Need to be Promoted
7 Summary of Main Findings and Policy 69-76
Recommendations
2.1 Rural Workers Engaged in Non-Farm Activities 6
(as per Census 2011)
2.2 Number of Persons in Non- Farm Employment according 9
to Industrial Divisions/ Groups in Punjab
2.3 Development of Rural Non-farm Sector in Punjab Compared 12
with other Major States (2011)
3.1 Demographic and Work Category-wise Composition of 15
the Sample
3.2 Caste Composition of Respondents 17
3.3 Age- wise Composition of Respondents 18
3.4 Education Level of the Respondents 20
3.5 Levels of Training of those Working in the Rural 22
Non-Farm Sector
3.6 Landed and Non-landed Assets Owned by Households 24-25
Working in the Rural Non-Farm Sector
3.7 Intensity of Employment of those Working in the 28
Rural Non-Farm Sector
4.1 Composition of Income of Rural Non-Farm Households 32
4.2 Economic, Social, Educational, Training and family 37
Background of high and low earning Respondents working
in the Rural Non-Farm Sector
4.3 Living Condition of Sampled Households 40-41
5.1 Employment Generated and Capital Invested in 45
Rural Non-farm Enterprises
5.2 Labour Productivity in Rural Non-Farm Enterprises 48
6.1 List of Activities in which Punjab’s Rural Youth should 53
be Trained
6.2 List of Enterprises which have Good Scope of Development 56
in Future
LIST OF TABLES
2.1 Size and Structure of Rural Non-Farm Sector in Punjab 6-7
2.2 Persons in Non- Farm Employment according to Industrial 11
Divisions/ Groups in Punjab
3.1 Composition of Sample Households working in RNFA 16
3.2 Caste Composition 17
3.3 Age-wise Composition 19
3.4 Education Level 20
3.5 Levels of Training 23
4.1 Income Composition 33
4.2 Socio-Economic and Educational Background of 36
Top 5% Earners
4.3 Socio-Economic and Educational Background of 38
Bottom 25% Earners
4.4 Comparative Position of Facilities in the Homes of Our 42
Sample RNFA Participants and Punjab (urban+ rural) 2011
5.1 Capital Invested Per Enterprise 45
5.2 Capital Invested per Worker Employment 46
5.3 Value Added Generated per Enterprise 49
5.4 Labour Productivity 49
LIST OF FIGURES
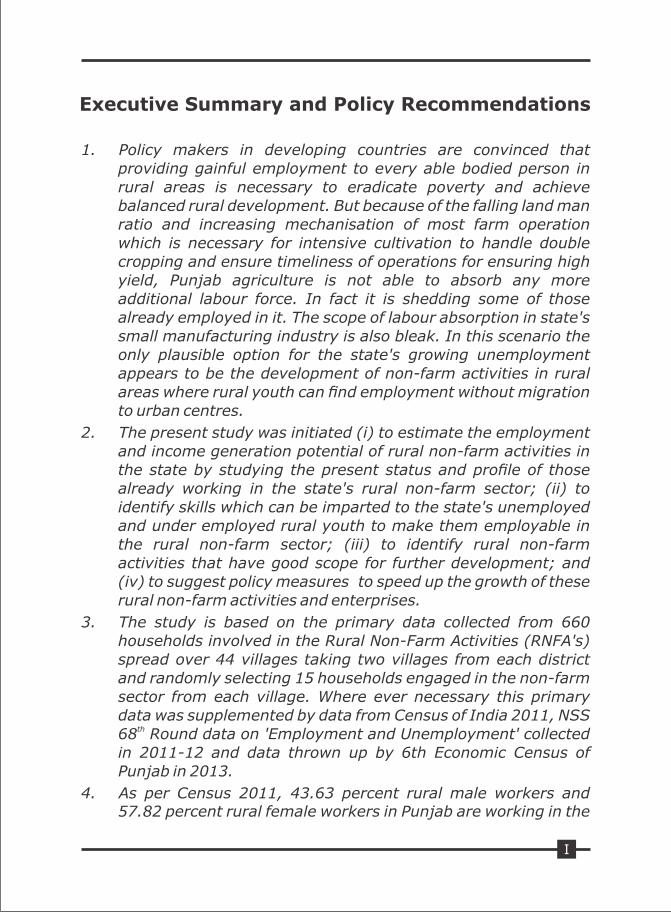
Executive Summary and Policy Recommendations
1. Policy makers in developing countries are convinced that providing gainful employment to every able bodied person in rural areas is necessary to eradicate poverty and achieve balanced rural development. But because of the falling land man ratio and increasing mechanisation of most farm operation which is necessary for intensive cultivation to handle double cropping and ensure timeliness of operations for ensuring high yield, Punjab agriculture is not able to absorb any more additional labour force. In fact it is shedding some of those already employed in it. The scope of labour absorption in state's small manufacturing industry is also bleak. In this scenario the only plausible option for the state's growing unemployment appears to be the development of non-farm activities in rural areas where rural youth can nd employment without migration to urban centres.
2. The present study was initiated (i) to estimate the employment and income generation potential of rural non-farm activities in the state by studying the present status and prole of those already working in the state's rural non-farm sector; (ii) to identify skills which can be imparted to the state's unemployed and under employed rural youth to make them employable in the rural non-farm sector; (iii) to identify rural non-farm activities that have good scope for further development; and (iv) to suggest policy measures to speed up the growth of these rural non-farm activities and enterprises.
3. The study is based on the primary data collected from 660 households involved in the Rural Non-Farm Activities (RNFA's) spread over 44 villages taking two villages from each district and randomly selecting 15 households engaged in the non-farm sector from each village. Where ever necessary this primary data was supplemented by data from Census of India 2011, NSS
th68 Round data on 'Employment and Unemployment' collected in 2011-12 and data thrown up by 6th Economic Census of Punjab in 2013.
4. As per Census 2011, 43.63 percent rural male workers and 57.82 percent rural female workers in Punjab are working in the
I
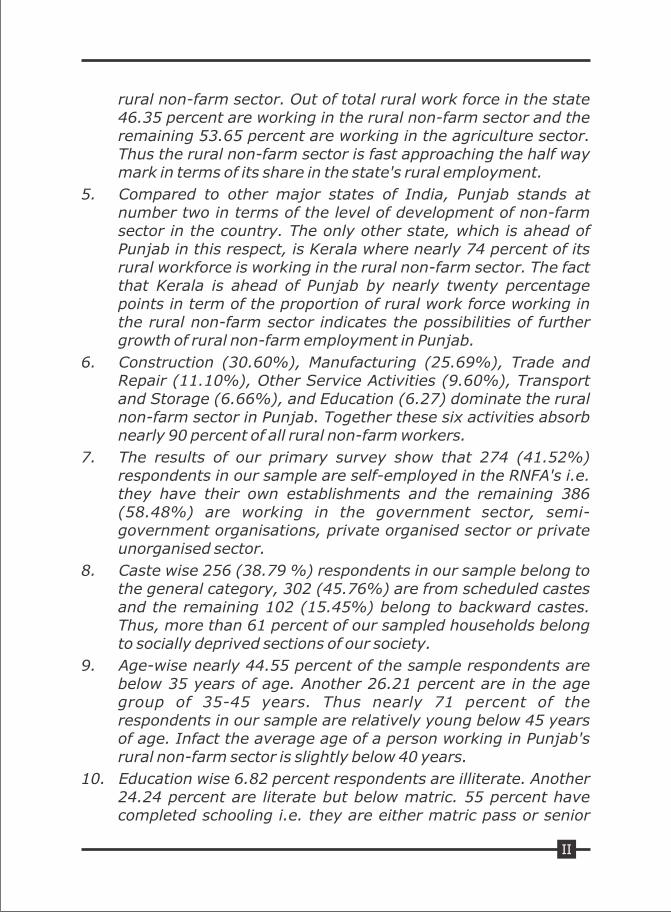
rural non-farm sector. Out of total rural work force in the state 46.35 percent are working in the rural non-farm sector and the remaining 53.65 percent are working in the agriculture sector. Thus the rural non-farm sector is fast approaching the half way mark in terms of its share in the state's rural employment.
5. Compared to other major states of India, Punjab stands at number two in terms of the level of development of non-farm sector in the country. The only other state, which is ahead of Punjab in this respect, is Kerala where nearly 74 percent of its rural workforce is working in the rural non-farm sector. The fact that Kerala is ahead of Punjab by nearly twenty percentage points in term of the proportion of rural work force working in the rural non-farm sector indicates the possibilities of further growth of rural non-farm employment in Punjab.
6. Construction (30.60%), Manufacturing (25.69%), Trade and Repair (11.10%), Other Service Activities (9.60%), Transport and Storage (6.66%), and Education (6.27) dominate the rural non-farm sector in Punjab. Together these six activities absorb nearly 90 percent of all rural non-farm workers.
7. The results of our primary survey show that 274 (41.52%) respondents in our sample are self-employed in the RNFA's i.e. they have their own establishments and the remaining 386 (58.48%) are working in the government sector, semi-government organisations, private organised sector or private unorganised sector.
8. Caste wise 256 (38.79 %) respondents in our sample belong to the general category, 302 (45.76%) are from scheduled castes and the remaining 102 (15.45%) belong to backward castes. Thus, more than 61 percent of our sampled households belong to socially deprived sections of our society.
9. Age-wise nearly 44.55 percent of the sample respondents are below 35 years of age. Another 26.21 percent are in the age group of 35-45 years. Thus nearly 71 percent of the respondents in our sample are relatively young below 45 years of age. Infact the average age of a person working in Punjab's rural non-farm sector is slightly below 40 years.
10. Education wise 6.82 percent respondents are illiterate. Another 24.24 percent are literate but below matric. 55 percent have completed schooling i.e. they are either matric pass or senior
II
secondary pass. Only 13.93 percent are graduates and above.
11. It is not only formal education which is important but training both formal and informal also matters. Our study shows that only 11.67 percent respondents in our sample had any kind of formal training before joining the non-farm sector. Another 34.85 percent had some kind of training through the informal channels by working as apprentice with knowledgeable persons. Thus, a majority of the workers presently working in the rural non-farm sector of Punjab are without any kind of formal or even informal training.
12. Out of 660 respondents in our sample 207 (31.36%) own some land. The percentage of those from 'self employed' and 'service' category who own land is roughly the same being 30.65 percent among the 'self-employed' and 31.86 percent among the 'service' category. The richest respondents in terms of landed and other assets amongst self employed are those in 'Miscellaneous Enterprises'. Similarly, in the 'service' category the best placed in terms of assets are Government employees. However, the poorest in terms of landed assets are 93 (14 %) households who are doing job in the un-organised private sector mostly as personal servants. Infact this section of respondents is the most deprived not only economically but also socially and educationally as more than 81 percent of them come from the SC/ BC background and most of them are matric or below.
13. To see how well employed these workers working in the rural non-farm sector of the state are we also looked at their intensity of employment. Our results show that on an average a worker engaged in the rural non-farm work in Punjab works for 9.32 hours in a day and 26.67 days in a month. Thus in terms of the time criterion they are fully employed and are not casual workers.
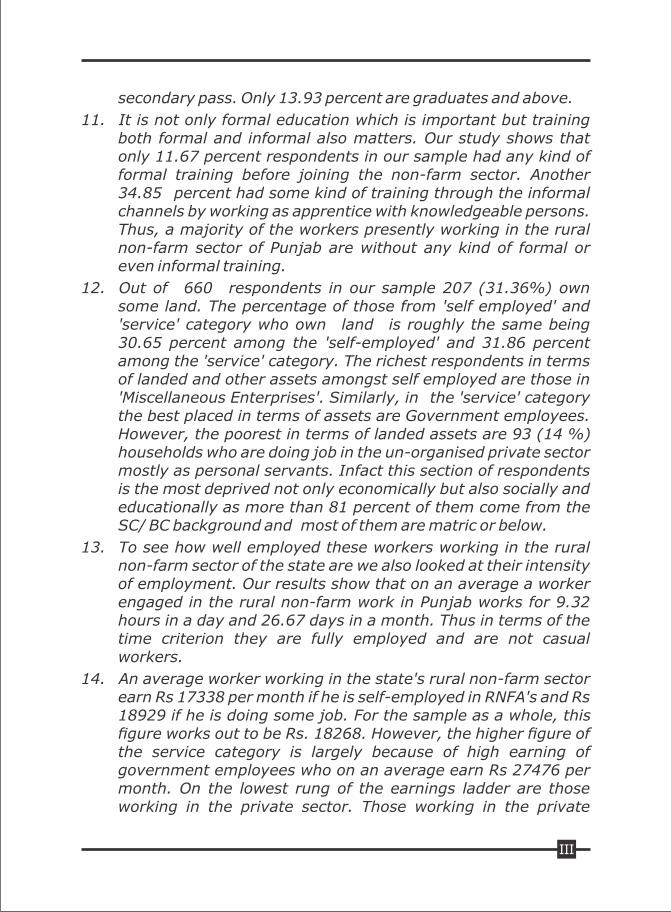
14. An average worker working in the state's rural non-farm sector earn Rs 17338 per month if he is self-employed in RNFA's and Rs 18929 if he is doing some job. For the sample as a whole, this gure works out to be Rs. 18268. However, the higher gure of the service category is largely because of high earning of government employees who on an average earn Rs 27476 per month. On the lowest rung of the earnings ladder are those working in the private sector. Those working in the private
III
organized sector are earning Rs. 9932 per month and those doing jobs with the private individuals as personal servant etc earn Rs. 7014 only.
15. Nearly 58 percent of the monthly household income of these households is contributed by the earnings of the main respondent who is working in the rural non-farm sector. Another 16 percent household income is contributed by the earnings of other family members. Income from land constitutes around 12 percent and income from dairying constitutes slightly more than 5 percent of the total household income.
16. An average household whose principal activity is in RNFA's earns Rs. 31458 per month or Rs. 377496 per annum which is certainly more than what an efcient farmer in Punjab who owns 5-6 acres of land and who goes for the most protable and least risky crop combination of wheat and rice, earns. Thus even in terms of income criterion they are decently employed and are better off compared to the small and marginal farmers of the state.
17. However our study also shows that the monthly earnings of the participants in the rural non-farm activities are not independent of their economic and social background or educational and training attainments. Most of the top 5 percent earners in our sample hail from land owning agriculturist high caste families with relatively higher educational qualications with one third having some formal training while 75 percent of those in the bottom quartile of monthly earnings belong to SC/ BC category and hail from labour class background with no or very little land ownership with educational qualication of matric or below and with hardly any training. Their capacity to earn is thus a function of their social and economic background and their educational and training attainments.
18. An average household in our sample belonging to those working in the rural non-farm sector of the state has more facilities in his home compared to an average Punjab household as per Census 2011.Thus, whether we look at their monthly income or levels of living those working in the state's rural non-farm sector are on an average better off than most agriculturalist households in the state. And this is despite the fact that less than 12 percent of them had any formal training before joining RNFA's. If training is
IV
imparted to them it can substantially improve their incomes and levels of living.
19. On an average a non-farm enterprise in rural Punjab has capital investment of Rs. 126344 and it employs 2.13 workers including the entrepreneur who is running the enterprise, thus creating a job with a capital investment of Rs. 59175 only. Thus these rural non-farm enterprises are perhaps the least capital intensive source of job creation and therefore should be the core of state's employment generation strategy in rural areas. Presently 8.18 lakh rural non-farm enterprises operating in Punjab together have invested capital of Rs. 10344 crores.
20. An average worker engaged in these rural non-farm enterprises of the state makes a contribution of Rs. 136305 per annum to the state's income. With nearly 17 lakh workers presently working in the state's rural non-farm enterprises, the total annual contribution of these enterprises alone to the state's NSDP works out to be more than Rs. 23000 crores. Besides this nearly 11.60 lakh workers from state's rural work force are also engaged in various other non-farm jobs in the government sector, semi- government sector, organized private sector and unorganized private sector. Thus the total contribution of rural non farm sector to the state's NSDP is quite substantial.
21. We have identied 89 skills in which training should be imparted to make Punjab's unemployed and under employed youth employable (list attached pp. viii-ix).In the present scenario when Punjab's organised industry in urban areas and agriculture in rural areas is not able to absorb any more additional labour force, training youth to make them capable of participating in the state's emerging rural non-farm sector is perhaps the only option available at the moment.
22. We have also identied 27 rural non-farm activities which have good scope for development in future in rural areas of the state (list attached p. x). To develop these RNFA's, perspective entrepreneurs will have to be given relevant technical skills, managerial ability and support to mobilize required amount of capital. For this to happen a systematic policy intervention is required at the government level to overcome this technical, managerial and nancial barrier.
Recommendations for Policy Intervention
(1) The government should set up Skill and Entrepreneurial
V
Development Centres in each block where rural youth is imparted training in various identied skills. After giving them basic training in these centres they should be attached to an actual functioning enterprise in the nearby town to get on the job training may be for a few months. While the trainees should be given some stipend during these 'hands on' training period the employers participating in this apprenticeship programmes should be given some nancial incentives to accept these trainees.
(2) This skill and training programme should not only be conned to the unemployed / underemployed rural youth or prospective rural entrepreneurs only but it should also include the owner- operator of existing enterprises because it is observed that most of the existing rural entrepreneurs have started their enterprise without any formal training . At best they have got some experience before starting these enterprises only through informal channels. Their training will not only help improve the quality of their product and /or service but will also improve their earnings.
(3) The rural youth presently engaged in the state's farm sector but who are interested in moving to the non-farm jobs and enterprises should also be given training in the non-farm skills. For them the training programme should be made exible and dovetailed as per their availability so that they are able to take advantage of this programme without disrupting their present jobs. We know, in Punjab most of the farm work is concentrated in two peaks of relatively short duration and in between there are two lean seasons from December to mid April and then from July to mid October. The training for such youth should be scheduled in such a manner that in one lean season they are given theoretical knowledge and the other lean season is utilised for practical or hands on training. In this way, they can be trained in these skills without disrupting their present work schedule in the farm sector.
(4) At present most of the existing Rural Non-farm Enterprises are running with funds provided by entrepreneur himself or herself and/or with money borrowed from friends and/or relatives. The share of institutional nance is almost negligible. On an average an existing RNFA in our sample has a capital investment of Rs.
VI
126344 only but most youth who may be interested in setting up such enterprises may not have even this small amount of capital. The government should intervene and make sure that any rural youth who after getting proper training from the proposed Skill and Entrepreneurial Development Centres is interested in setting up his or her own enterprise gets bank loan at low interest rate with easy repayment schedule and on the collateral of the enterprise itself. This step will help speed up the growth of rural non-farm enterprises both in number as well as in scale.
(5) Besides these rural Skill and Entrepreneurial Development Centres the government should ask the associations of existing major industries in the state to start industry specic Training Institutes. These institutes can then give training to both rural and urban youth in the skills required for work force in these industries. Industry Specic Associations should be persuaded to start such institutes under the Corporate Social Responsibility and give training and stipends to the trainees. This will not only make the local educated youth employable but will also provide trained local workforce for the existing industries.
(6) Our study shows that more than 61 percent of those working in Punjab's rural non-farm sector are from SC/BC background and nearly 70 percent of them are from landless families. They are handicapped in starting small rural non-farm enterprises not only because of lack of training and shortage of capital but also because they do not have required space in the village for setting up their own enterprise. Government should come out with a policy to provide plots at reasonable rates to such young men and women who after getting training in the required skills may want to start the non-farm enterprises. The common land owned by village panchayats can be used for this purposes or government can buy some land close to the village preferably touching the circular road of the village, and develop it into small plots to be given to prospective rural entrepreneurs from landless families.
Our estimate is that even if half of the identied rural enterprises come up in each of the nearly 12000 villages of the state during the next few years and if each one of these non-farm enterprises generate employment for 2-3 persons, the
VII
non-farm enterprises alone have the potential of creating several lakh jobs in the next few years in the state. Besides a large number of skill trained rural youth will get absorbed within the rural areas as also in nearby towns where the demand for these skilled workers exists and is expanding over time. In the long run the promotion of rural non-farm sector through skill development may prove to be a turning point in channelizing the energies of Punjab's rural youth towards productive uses and usher in an era of economic development and prosperity in rural Punjab.
List of Activities in Which Punjab's Rural Youth Should be Trained
(Category A)
(Availability of jobs with the following skills is more in towns than in villages. So the youth from villages which are situated within a radius of 10-12 km from the town should be preferred for training in these skills. They can commute daily to the town and come back to their place of residence in the evening.)
VIII
Category- B
(Availability of work for these skills is in both villages as well as towns.
Therefore the training in these skills should be open to all irrespective of the
location of their residence.)
Category- C(Skills for Girls)
IX
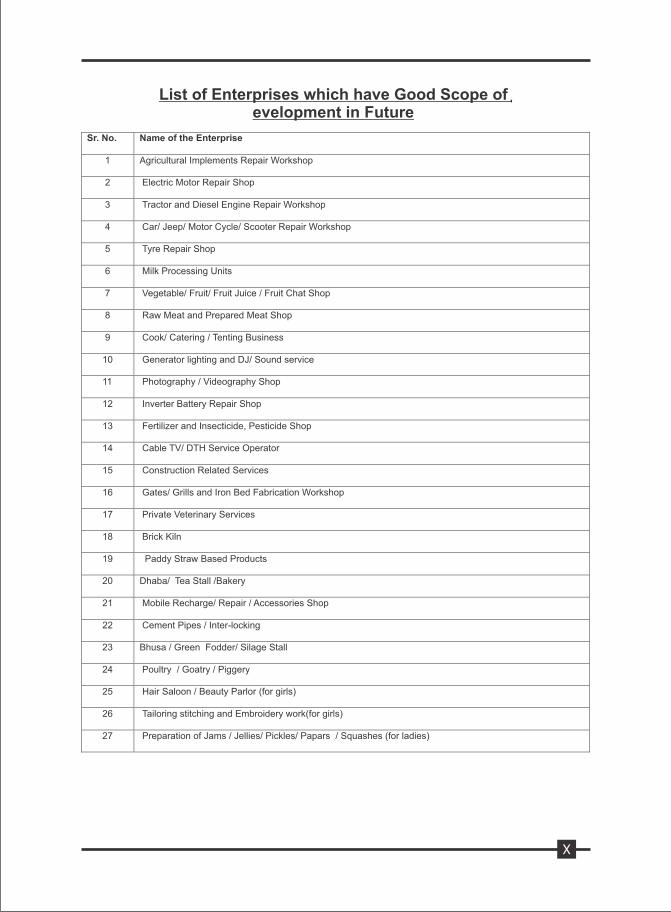
List of Enterprises which have Good Scope of evelopment in Future
X
Chapter -1
Need for Developing Rural Non-Farm Activities in Punjab
Policy makers in developing countries are convinced that providing
gainful employment to every able bodied person in rural areas holds the key to
poverty alleviation and general development of rural areas. But it is now
becoming fairly evident that in agrarian economies typically characterised by
the continuing population pressure, ever declining land-man ratio, highly
iniquitous land distribution structure and ever increasing labour saving farm
production technologies, agriculture alone cannot provide the ultimate
answer to rural employment.
Historically this task of absorbing surplus labour from rural areas
was performed by organised industrial and service sectors causing a sectoral
shift in the employment pattern of the economy away from agriculture and
primary activities towards secondary and tertiary sectors. However, this path
of development which was followed by the developed western economies is
unlikely to be repeated in case of presently industrialising countries. In any
case the employment in the organised industrial sector in developing
economies is not growing fast enough partly because of the capital intensive
nature of the technology being used and partly because industrial sector has
not been growing at a fast enough rate. Thus, the onus of employing all the
surplus labour in rural areas in such economics falls back on agriculture.
However, in the case of Punjab agriculture sector's capacity to employ
additional labour force is almost nil. Infact agriculture in Punjab, is shedding
some of the labour force already employment by it. Thus it is clear that the
agriculture and the organised industrial sectors in the state are simply not in a
position to generate the much needed employment opportunities. Therefore,
the only policy option available in this scenario for mitigating the problem of
unemployment and underemployment is promoting non-agricultural
employment in rural areas. Many of these people may eventually move to
urban areas in search of better life but their acquisition of skills and experience
1
2
gathered in rural non-farm activities can act as an important determinant of
their future success in urban sector jobs. For the time being they will have to
be absorbed within the rural non-farm sector only.
Development of non-farm sector is also recommended because of
its more egalitarian income distributional implications. Most empirical studies
suggested that income distribution is much less unequal in areas where a wide
network of non-farm avenues of employment exists because the lower strata
of the society participate more intensely in non-farm activities. Thus, while the
distribution of agricultural income roughly follows the same pattern as land
distribution, there is an inverse relationship between farm size and off farm or
non-farm incomes. Even the empirical evidence from Punjab confirms the fact
that landless households received the largest proportion of non-farm income
to total family income and they continue to receive larger share of it overtime.
Development of non-farm activities in rural areas also empowers
women particularly from the lower classes. The employment in the organised
sector requires certain minimum qualifications and most of the educated
women are drawn from middle classes and richer sections of the society. Very
few women from lower classes would get a chance in these jobs. The situation
is different in unorganised sector. They do get some work in the rural non-
farm sector generally on contract basis. Although they are poorly paid yet it is
better to have some income than not having any work at all .
The success of rural non-farm activities is also tacitly viewed as an
alternative to any radical redistributive land reforms. It is now being
increasingly acknowledged that any radical land reform is not a realistic option
even where government proclaim to be pro-poor . Since development of rural
non-farm activities does not threaten the well-entrenched landed interests in
rural areas they generally do not encounter any such opposition which have
tended to defeat agrarian reform measures. Indeed, since these rural non-
farm interventions constitute a non-zerosum game and even the rich are likely
to gain from them, thus making their success all the more probable.
The rural non-agricultural enterprises also provide easy and less
risky opportunities for budding rural entrepreneurs to get organisational
training and also have basic capital accumulation without leaving their
3
families and villages. For a person not born in one of the few traditional
entrepreneurial castes, it is very difficult and risky to start even a small
enterprise in the urban sector. The difficulty and risks further multiply for a
person coming from rural background. Thus, the rural non-agricultural
enterprises provide an easy and less-risky mechanism for talented rural
people to start an independent enterprise.
The development of rural non-agricultural enterprises also helps in
mobilising local savings and locally available raw materials for production of
goods and services. These locally available raw materials are cheap but also
perishable and generally available in small lots which cannot be profitably
exported to urban sector for use in production in big factories. If these locally
available raw materials are not used locally these would in all probability go
waste. The development of non-agricultural enterprises in rural areas can
help in the use of such raw materials. It will also generate some income for the
owners and supplies of these raw materials. Thus the rural non-farm activities
could utilise the local slack resources which are not capable of being used in
urban modern industry. The social cost of such raw materials is extremely low
and the benefits are quite high.
Lastly, the rural non-farm sector is also promoted because it acts as
a counter magnet to unhealthy growth of urban centres. In the absence of
work opportunities in rural areas surplus labour start moving from rural to
urban areas in search of jobs and other economic opportunities. This leads to
unwieldy growth of cities and urban slums. Ultimately these people have to be
provided with all kind of services such as roads, transport, schools, health
services, electricity, water, sanitation and other necessary civic amenities.
Providing these services in urban areas for this continuous influx of migrants
from rural areas is a very costly affair and generally beyond the capacity of
most municipal bodies. By promoting rural non-farm sector, an attempt is
made to take work opportunities to rural areas instead of rural labour coming
to urban centres in search of jobs. Thus, development of rural non-farm
activities is generally viewed as an alternative less costly policy option of
providing gainful employment to rural labour by spatial diversification of
economic activities without encountering problems of urban congestion and
urban slums.
To sum up we can say that the development of rural non-farm
enterprises help in providing non-farm employment to surplus rural workers
at their door steps. These help in skill formation and entrepreneurial training,
reduce income inequalities in rural areas, help empowering rural women, use
locally available raw materials that otherwise go waste, mobilize rural savings,
provide goods and services to rural people at their place of residence, use
slack resources which are not capable of being used in urban modern industry
and help in checking the movement of rural poor to urban areas in search of
work leading to urban slums. Thus, it is not only a less costly option of
generating jobs but it is also a less costly and more acceptable policy option
for combating rural poverty and bringing down income inequalities in rural
areas.
4
Chapter -2
Size and Structure of Rural Non-Farm Sector in Punjab
The Census of India divides all rural workers into four broad
categories i.e. cultivators, agricultural labourers, those employed in
household industries and others. Those employed as cultivators and
agricultural labourers are considered as constituting farm employment. Those
employed in household industries and other workers together are counted as
being in the non-farm employment. In section-I of this chapter, we shall
discuss the structure of non- farm sector in Punjab by taking Census 2011 as
the basis. To study the industry wise break up of non-farm sector in the state, thwe have used National Sample Survey (NSS) 68 Round which was also
conducted in 2011-2012 to arrive at the industry group wise figures of rural
non-farm employment in Punjab. This is discussed in section-II. In section-III,
the level of development of rural non-form sector in Punjab is discussed by
comparing Punjab's position with other major states of India.
Section-I
Size of Rural Non-Farm Sector
The distribution of rural work force between non-farm activities and
agricultural and allied activities in Punjab as per Census 2011 is given in table
2.1. The table shows that there were 61.79 lakh rural workers in Punjab in
2011. Out of this 49.96 lakh (80.85%) were male workers and 11.83 lakh
(19.15%) were female workers. Out of the 49.96 lakh male workers 21.80
lakh (43.63%) were employed in non-form activities and the remaining 28.16
lakh (56.37%) were engaged in agriculture and allied activities. Similarly out
of 11.83 lakh female rural workers in the state 6.84 lakh, (57.82%) were
engaged in non-farm employment, whereas the remaining 4.99 lakh
(42.18%) were engaged in agriculture and allied activities. Thus, contrary to
the general impression a large proportion (infact majority) of the female rural
5
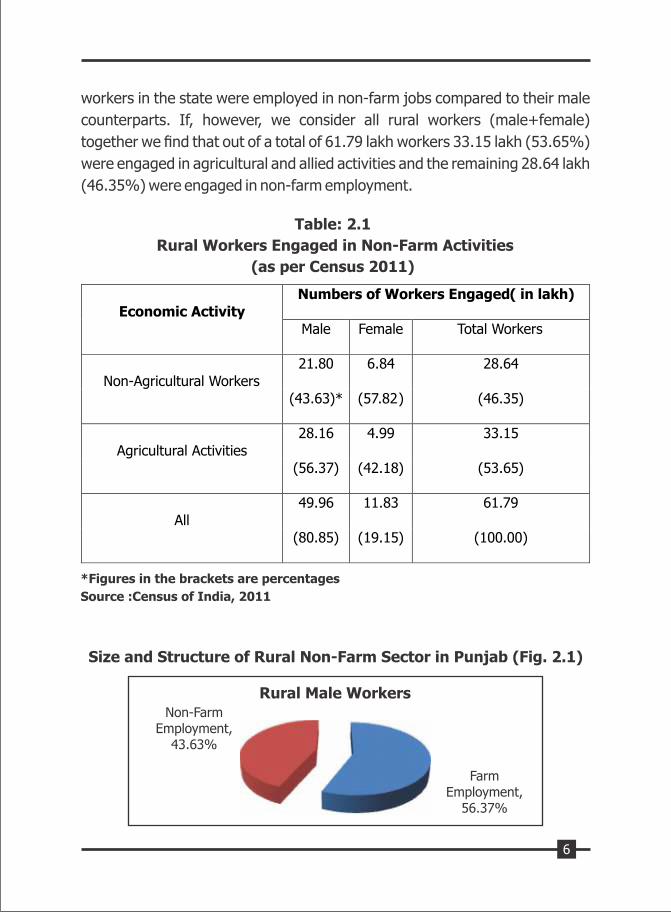
workers in the state were employed in non-farm jobs compared to their male
counterparts. If, however, we consider all rural workers (male+female)
together we find that out of a total of 61.79 lakh workers 33.15 lakh (53.65%)
were engaged in agricultural and allied activities and the remaining 28.64 lakh
(46.35%) were engaged in non-farm employment.
Table: 2.1
Rural Workers Engaged in Non-Farm Activities
(as per Census 2011)
*Figures in the brackets are percentages
Source :Census of India, 2011
Size and Structure of Rural Non-Farm Sector in Punjab (Fig. 2.1)
Rural Male WorkersNon-Farm
Employment,43.63%
FarmEmployment,
56.37%
6
Rural Female WorkersNon-Farm
Employment,57.82%
FarmEmployment,
42.18%
All Rural WorkersNon-Farm
Employment,46.35%
FarmEmployment,
53.65%
Section-II
Structure of Rural Non-Farm Sector
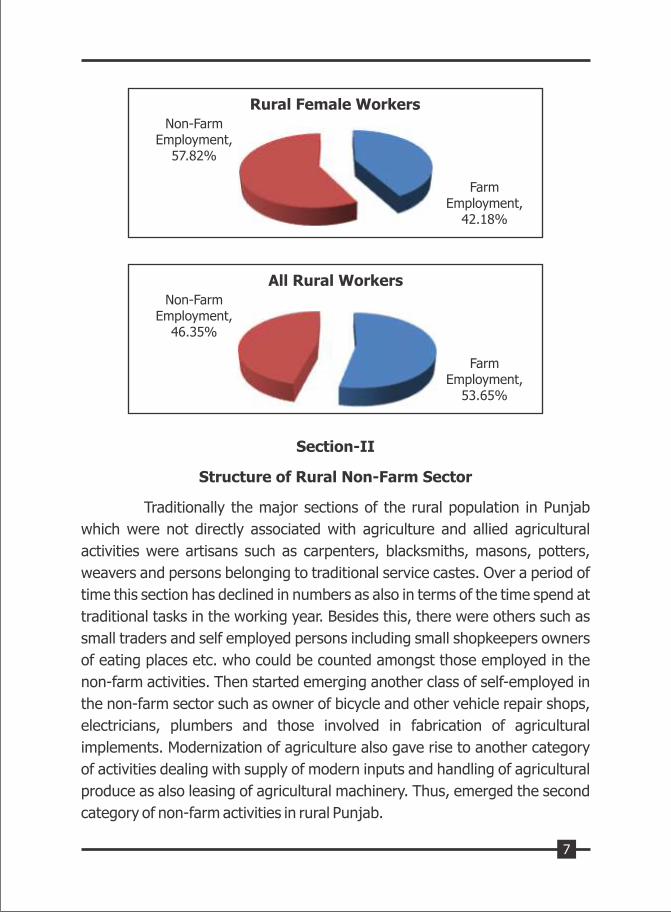
Traditionally the major sections of the rural population in Punjab
which were not directly associated with agriculture and allied agricultural
activities were artisans such as carpenters, blacksmiths, masons, potters,
weavers and persons belonging to traditional service castes. Over a period of
time this section has declined in numbers as also in terms of the time spend at
traditional tasks in the working year. Besides this, there were others such as
small traders and self employed persons including small shopkeepers owners
of eating places etc. who could be counted amongst those employed in the
non-farm activities. Then started emerging another class of self-employed in
the non-farm sector such as owner of bicycle and other vehicle repair shops,
electricians, plumbers and those involved in fabrication of agricultural
implements. Modernization of agriculture also gave rise to another category
of activities dealing with supply of modern inputs and handling of agricultural
produce as also leasing of agricultural machinery. Thus, emerged the second
category of non-farm activities in rural Punjab.
7
Thirdly, there is a salaried middle class section in the villages. These
can be salaried persons in the state sector such as teachers, doctors,
engineers and persons in police and other security forces as also quasi-
government employees in entities such as boards, corporations and co-
operative institutions. There are also persons working in the non-state
salaried jobs both in the private organized as well a unorganized sectors
including personal services such as maids, cooks, helpers, personal security
guards, drivers, and gate keepers, etc.
Fourthly there is a section of rural workers who are not regular
government. employees but are working on contract basis in various
government schemes such as Integrated Child Development Scheme, mid-
day meal program and some programs of the National Rural Health
Mission(NHRM) such as ASHA workers.
Lastly there is a section in rural areas that is made up of rural rich,
who gained in recent times both in wealth and power and are generally
involved in small and medium enterprises in construction, agro-processing,
hotels and marriage palaces, brick kilns, transport, construction, trade and
services etc. Some of them are also in the business of commission agents and
money lending. They generally wield lot of influence in rural areas and are
major beneficiaries of government policies, contracts and concessions.
Thus we find that non-farm activities in rural areas are quite a
heterogeneous lot consisting of a very large number of different activities
ranging from domestic servants employed by richer rural households on the
one extreme and capitalist entrepreneurs owning floor mills, rice mills, bricks
kilns, dhabas and marriage palaces, transport companies and trade and
service activities on the other.
The NSS employment/unemployment survey categories the large
number of heterogeneous rural non-farm activities into 19 broad industry
groups such as 'manufacturing', 'construction', 'trade, repair and other
services', 'transport, storage and communication', 'education', 'public
administration' and 'social security' and 'social and personal services' etc. We th
have used 68 round of NSS which was conducted in 2011 to divide the total
8
rural non-farm workers of Punjab as per Census 2011 into various categories.
The results are presented in table 2.2.
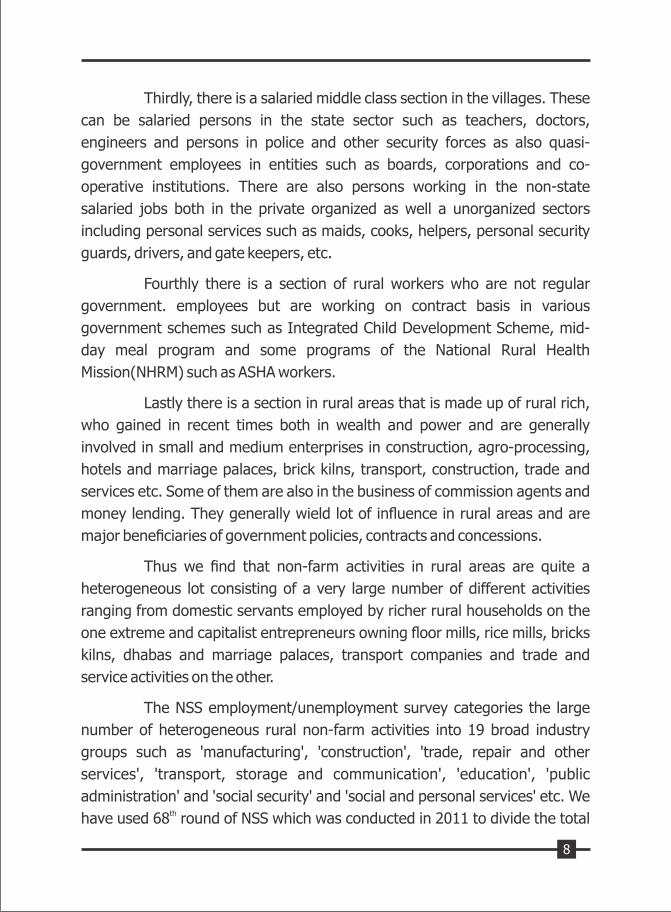
Table:2.2Number of Persons in Non- Farm Employment according to
Industrial Divisions/ Groups in Punjab
9
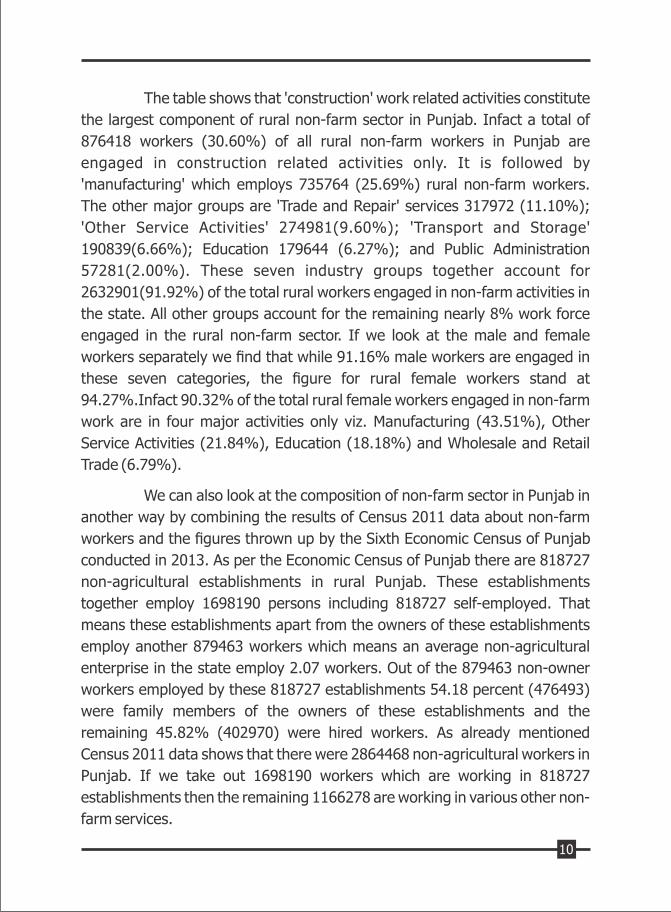
The table shows that 'construction' work related activities constitute
the largest component of rural non-farm sector in Punjab. Infact a total of
876418 workers (30.60%) of all rural non-farm workers in Punjab are
engaged in construction related activities only. It is followed by
'manufacturing' which employs 735764 (25.69%) rural non-farm workers.
The other major groups are 'Trade and Repair' services 317972 (11.10%);
'Other Service Activities' 274981(9.60%); 'Transport and Storage'
190839(6.66%); Education 179644 (6.27%); and Public Administration
57281(2.00%). These seven industry groups together account for
2632901(91.92%) of the total rural workers engaged in non-farm activities in
the state. All other groups account for the remaining nearly 8% work force
engaged in the rural non-farm sector. If we look at the male and female
workers separately we find that while 91.16% male workers are engaged in
these seven categories, the figure for rural female workers stand at
94.27%.Infact 90.32% of the total rural female workers engaged in non-farm
work are in four major activities only viz. Manufacturing (43.51%), Other
Service Activities (21.84%), Education (18.18%) and Wholesale and Retail
Trade (6.79%).
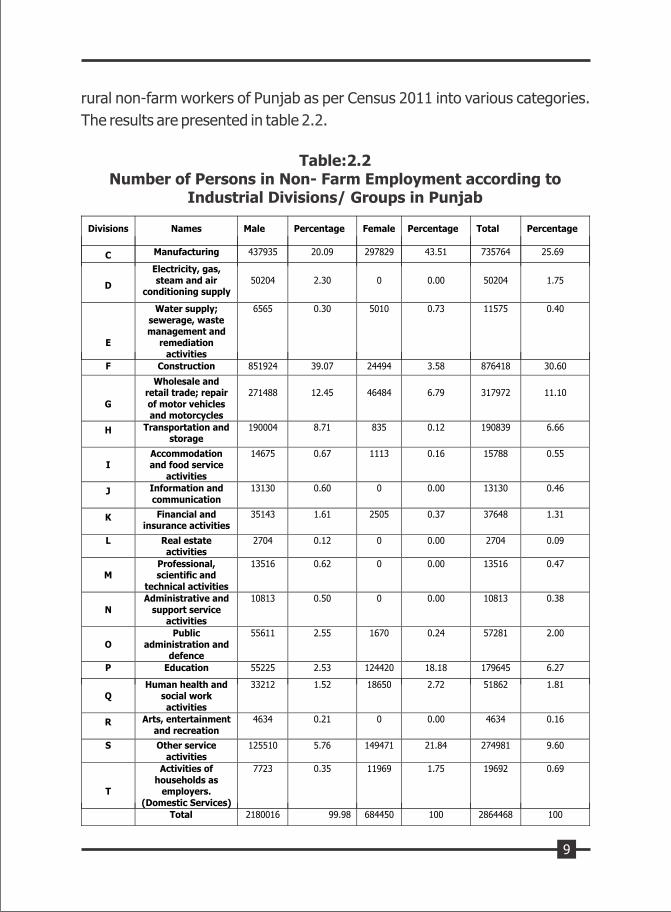
We can also look at the composition of non-farm sector in Punjab in
another way by combining the results of Census 2011 data about non-farm
workers and the figures thrown up by the Sixth Economic Census of Punjab
conducted in 2013. As per the Economic Census of Punjab there are 818727
non-agricultural establishments in rural Punjab. These establishments
together employ 1698190 persons including 818727 self-employed. That
means these establishments apart from the owners of these establishments
employ another 879463 workers which means an average non-agricultural
enterprise in the state employ 2.07 workers. Out of the 879463 non-owner
workers employed by these 818727 establishments 54.18 percent (476493)
were family members of the owners of these establishments and the
remaining 45.82% (402970) were hired workers. As already mentioned
Census 2011 data shows that there were 2864468 non-agricultural workers in
Punjab. If we take out 1698190 workers which are working in 818727
establishments then the remaining 1166278 are working in various other non-
farm services.
10
Persons in Non- Farm Employment according to IndustrialDivisions/Groups in Punjab (Fig.2.2)
Administrative and supportservice activities, 0.38
Public administration anddefence, compulsory socialsecurity, 2.00
Professional, scientific andtechnical activities, 0.47
Real estate activities, 0.09
Financial and insuranceactivities, 1.31
Information andcommunication, 0.46
Accommodation and Foodservice activities, 0.55
Wholesale and retail trade;repair of motor vehiclesand motorcycle, 11.10
Construction, 30.60
Water supply,sewerage, wastemanagement and
remediation activities, 0.40
Manufacturing, 25.69
Electricity, gas, steam andair conditioning
supply, 1.75
Activities of households asemployers. (Domestic
Services), 0.69
Arts, entertainment andrecreation, 0.16
Human health and socialwork activities, 1.81
Other serviceactivities, 9.60
Education, 6.27
Transportation andstorage, 6.66
Section-III
Level of Development of Rural Non-Farm Sector in Punjab
Compared to Other States
The non-farm sector in rural areas of Punjab is fairly well developed
in comparison to other major states of India. Table 2.3 contains information
regarding share of non-farm sector in rural employment for 20 major states of nd
India as per Census 2011. The table shows that Punjab ranks 2 amongst the
twenty major states of India. 46.36% of Punjab's rural work force is engaged
in non-farm employment. It stands next only to Kerala where a whopping
73.67% rural work force is in the non-farm sector. Punjab is closely followed
by Jammu and Kashmir (46.07%) and Assam (43.74%). The other major
states which have relatively more developed non-farm sector compared to the
all India figure of (27.72%) are: West Bengal (38.56%), Haryana (36.62%),
Tamil Nadu (34.82%), Uttarakhand (33.06%), Himachal (32.54%), Orissa
(29.49%) and Karnataka (29.32%). Among the states which have below
11
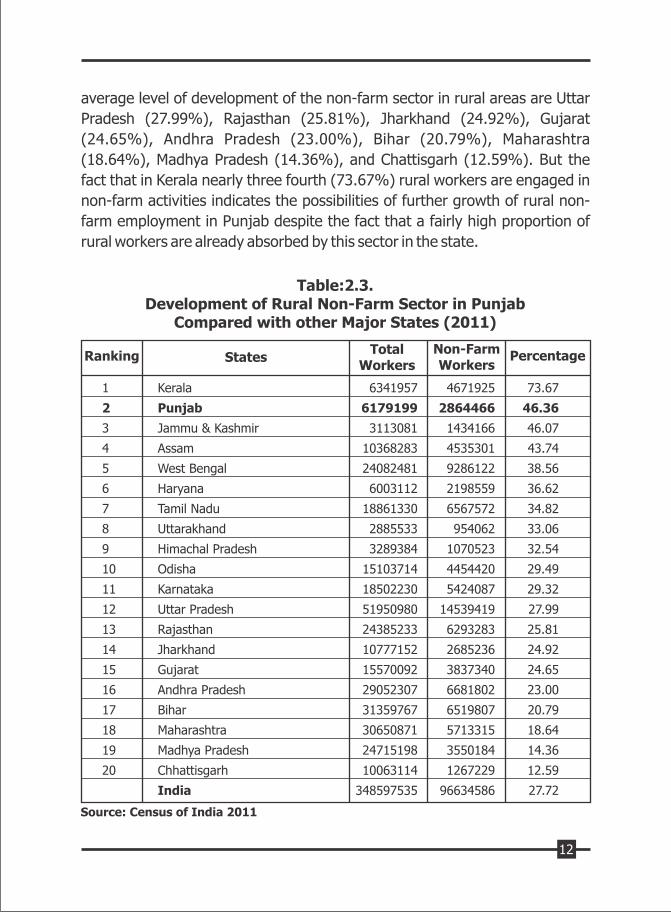
average level of development of the non-farm sector in rural areas are Uttar
Pradesh (27.99%), Rajasthan (25.81%), Jharkhand (24.92%), Gujarat
(24.65%), Andhra Pradesh (23.00%), Bihar (20.79%), Maharashtra
(18.64%), Madhya Pradesh (14.36%), and Chattisgarh (12.59%). But the
fact that in Kerala nearly three fourth (73.67%) rural workers are engaged in
non-farm activities indicates the possibilities of further growth of rural non-
farm employment in Punjab despite the fact that a fairly high proportion of
rural workers are already absorbed by this sector in the state.
Table:2.3. Development of Rural Non-Farm Sector in Punjab
Compared with other Major States (2011)
Ranking StatesTotal
WorkersNon-FarmWorkers
Percentage
1 Kerala 6341957 4671925 73.67
2 Punjab 6179199 2864466 46.36
3 Jammu & Kashmir 3113081 1434166 46.07
4 Assam 10368283 4535301 43.74
5 West Bengal 24082481 9286122 38.56
6 Haryana 6003112 2198559 36.62
7 Tamil Nadu 18861330 6567572 34.82
8 Uttarakhand 2885533 954062 33.06
9 Himachal Pradesh 3289384 1070523 32.54
10 Odisha 15103714 4454420 29.49
11 Karnataka 18502230 5424087 29.32
12 Uttar Pradesh 51950980 14539419 27.99
13 Rajasthan 24385233 6293283 25.81
14 Jharkhand 10777152 2685236 24.92
15 Gujarat 15570092 3837340 24.65
16 Andhra Pradesh 29052307 6681802 23.00
17 Bihar 31359767 6519807 20.79
18 Maharashtra 30650871 5713315 18.64
19 Madhya Pradesh 24715198 3550184 14.36
20 Chhattisgarh 10063114 1267229 12.59
India 348597535 96634586 27.72
Source: Census of India 2011
12
To sum up we can say that rural non-farm sector in Punjab is fairly large. The
Construction, Manufacturing, Trade and Repair Services, Other Service
Activities, Transport and Storage and Education dominate the rural non-farm
sector in Punjab. Together these six activities absorb nearly 90 percent
(89.91% to be exact) of all rural workers in this sector. In terms of level of rural
non-farm sector Punjab stands at number two among the major states of the
country next only to Kerala which has a substantially higher percentage of
rural workers working in the non-farm sector. The large gap between Kerala
(73.67%) and Punjab (46.36%) shows that there is enough scope for this
sector in Punjab to grow further.
13
Chapter -3
Profile of Participants Working in Rural Non-Farm
Sector in Punjab
To know the background of those who are involved in RNFA's, their
economic background, their educational qualifications, their earnings and
their level of living etc. we conducted a primary survey of 660 households
spread over 44 villages, two villages from each districts. We randomly
selected 15 households involved in rural non-farm activities from each one of
the 44 selected villages. Table 3.1 shows that out of 660 respondents in our
sample 274 (41.51%) are self-employed i.e. they have their own
establishments. The remaining 386 (58.49%) are doing some job in the rural
non-farm sector. Gender –wise 265 (96.71%) self-employed are males and
the remaining 9 (3.29%) are females. Out of 274 establishments 50 are the
cottage industry and craft type enterprises , 41 establishments are involved in
construction/ building work related activities, 51 establishments are shops
selling goods of various types, 47 are repair / installation/ fabrication /
production workshops and the remaining 85 establishments are of
miscellaneous type. Altogether these 274 establishments employ 585 workers
i.e. 274 respondents who own these establishments, 70 other workers are
their family members and the remaining 241 are hired workers. Thus on an
average an establishment in our sample employ 2.13 workers.
Of the 386 respondents in our sample who are working on wages or
salaries for others in the government or private sector jobs in manufacturing,
trading, or service activities, 345 respondents are males and the remaining
41 (10.63%) are females. More than half of these respondents are in
government jobs. Another about 4 percent are in semi-government
organisations. Nearly two fifth of them are working in the organised private
sector or unorganised private sector as personal servants of rich households
or individuals. If we consider the entire sample of 660 respondents together
we find that 50(7.57%) respondents in our sample are self-employed in some
14
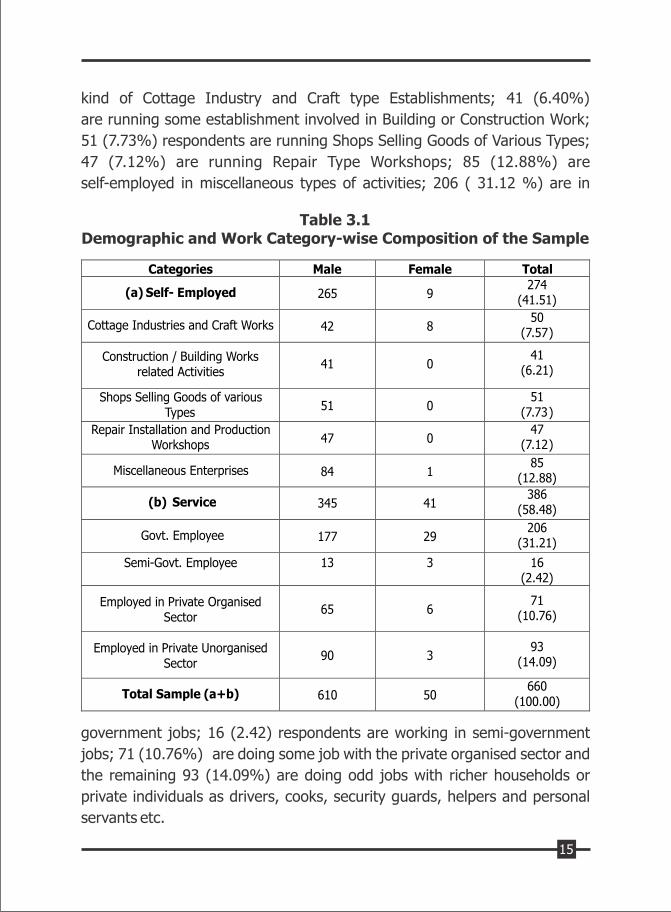
kind of Cottage Industry and Craft type Establishments; 41 (6.40%)
are running some establishment involved in Building or Construction Work;
51 (7.73%) respondents are running Shops Selling Goods of Various Types;
47 (7.12%) are running Repair Type Workshops; 85 (12.88%) are
self-employed in miscellaneous types of activities; 206 ( 31.12 %) are in
Table 3.1Demographic and Work Category-wise Composition of the Sample
government jobs; 16 (2.42) respondents are working in semi-government
jobs; 71 (10.76%) are doing some job with the private organised sector and
the remaining 93 (14.09%) are doing odd jobs with richer households or
private individuals as drivers, cooks, security guards, helpers and personal
servants etc.
15
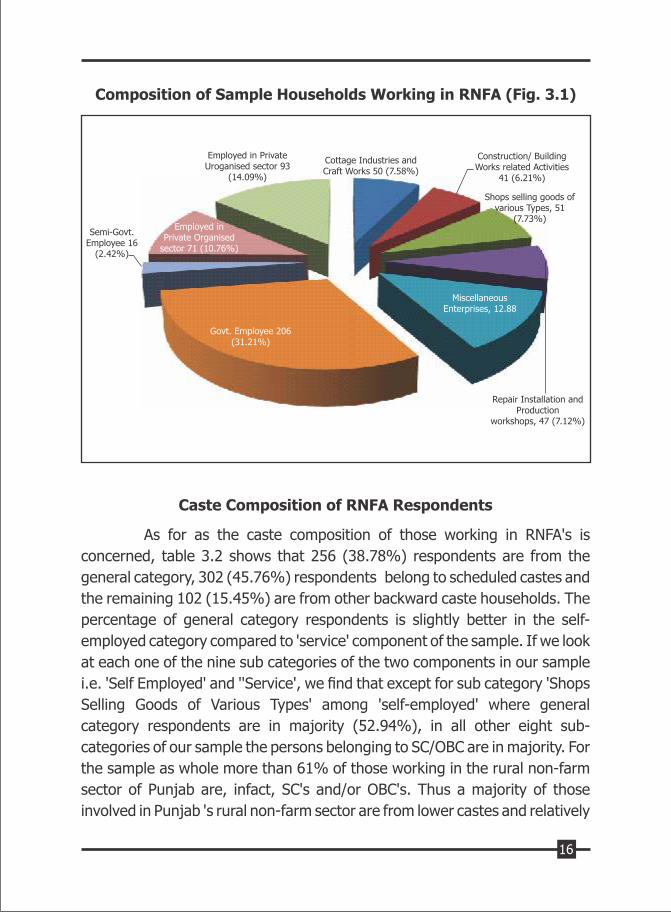
Composition of Sample Households Working in RNFA (Fig. 3.1)
Employed in PrivateUroganised sector 93
(14.09%)
Cottage Industries andCraft Works 50 (7.58%)
Construction/ BuildingWorks related Activities
41 (6.21%)
Shops selling goods ofvarious Types, 51
(7.73%)
MiscellaneousEnterprises, 12.88
Repair Installation andProduction
workshops, 47 (7.12%)
Govt. Employee 206(31.21%)
Semi-Govt.Employee 16
(2.42%)
Employed inPrivate Organised
sector 71 (10.76%)
Caste Composition of RNFA Respondents
As for as the caste composition of those working in RNFA's is
concerned, table 3.2 shows that 256 (38.78%) respondents are from the
general category, 302 (45.76%) respondents belong to scheduled castes and
the remaining 102 (15.45%) are from other backward caste households. The
percentage of general category respondents is slightly better in the self-
employed category compared to 'service' component of the sample. If we look
at each one of the nine sub categories of the two components in our sample
i.e. 'Self Employed' and ''Service', we find that except for sub category 'Shops
Selling Goods of Various Types' among 'self-employed' where general
category respondents are in majority (52.94%), in all other eight sub-
categories of our sample the persons belonging to SC/OBC are in majority. For
the sample as whole more than 61% of those working in the rural non-farm
sector of Punjab are, infact, SC's and/or OBC's. Thus a majority of those
involved in Punjab 's rural non-farm sector are from lower castes and relatively
16
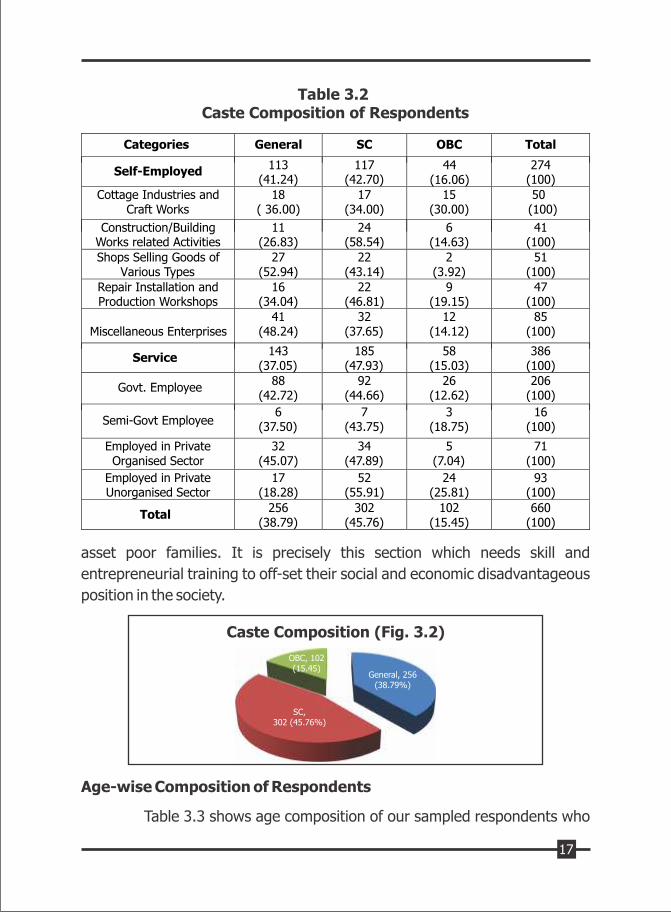
Caste Composition (Fig. 3.2)
OBC, 102(15.45)
General, 256(38.79%)
SC,302 (45.76%)
Table 3.2 Caste Composition of Respondents
asset poor families. It is precisely this section which needs skill and
entrepreneurial training to off-set their social and economic disadvantageous
position in the society.
Age-wise Composition of Respondents
Table 3.3 shows age composition of our sampled respondents who
17
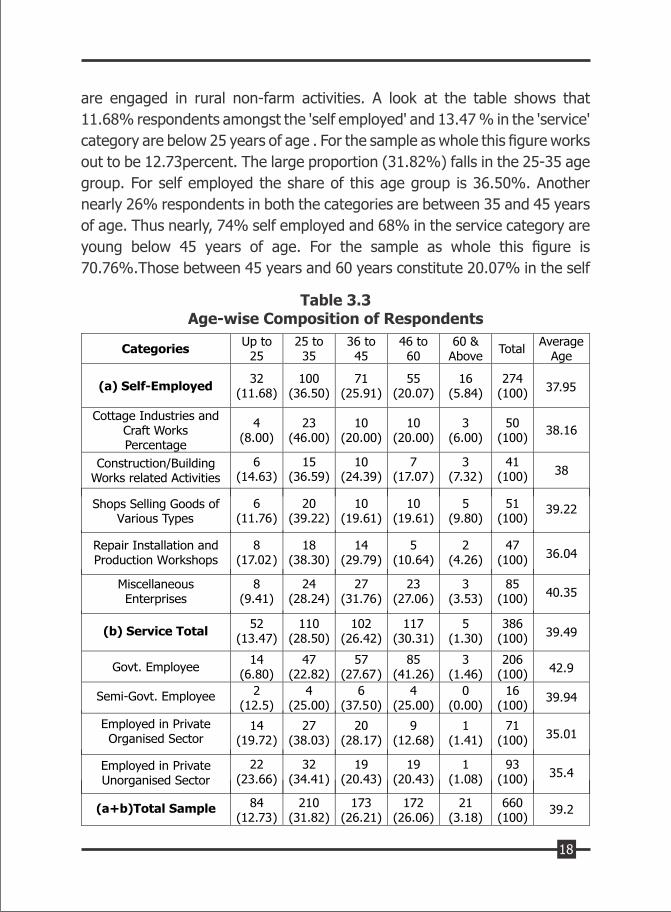
Table 3.3Age-wise Composition of Respondents
are engaged in rural non-farm activities. A look at the table shows that
11.68% respondents amongst the 'self employed' and 13.47 % in the 'service'
category are below 25 years of age . For the sample as whole this figure works
out to be 12.73percent. The large proportion (31.82%) falls in the 25-35 age
group. For self employed the share of this age group is 36.50%. Another
nearly 26% respondents in both the categories are between 35 and 45 years
of age. Thus nearly, 74% self employed and 68% in the service category are
young below 45 years of age. For the sample as whole this figure is
70.76%.Those between 45 years and 60 years constitute 20.07% in the self
18
employed and 30.31 % in the service category. Only 3.8 percent of the
respondents are above 60 years of age. Most of the respondents in above 60
years age group are self-employed .Thus we find that nearly 70% of those
employed in rural non-farm activities in Punjab are relatively young below 45
years of age. The last column of the table shows the average age of
respondents working in various categories of the self-employed in RNFA as
well as those doing some job. We find that the average age of a person
working as self employed in rural non-form sector is 37.95 years where as the
average age of respondents in the 'service' category is slightly higher i.e.
40.35 years. For the sample as a whole average age of respondents in our
sample works out to be 39.20 years only. Within the self employed the
youngest persons are those who are working in the Repair and Production
Workshops whereas in the service category those working in private
organised sector happen to be the youngest with average age being 35 years
only. Thus a majority of those working in Punjab's rural non-farm sector are
relatively young with average age being less than 40 years.
Up to 25 25 to 35 36 to 45 46 to 60 60 % Above
Age-wise Composition (Fig. 3.3)
172 (26.06%)
173 (26.21%)
210 (31.82%)
21 (18.18%) 84 (12.73%)
Education Level of the Respondents
Education is normally an important determinant of the type of
activity one can go in for as also the earning capacity of a person. Table 3.5
gives us information about the levels of education of the respondents in our
sample working in the state's rural non-farm sector.
19
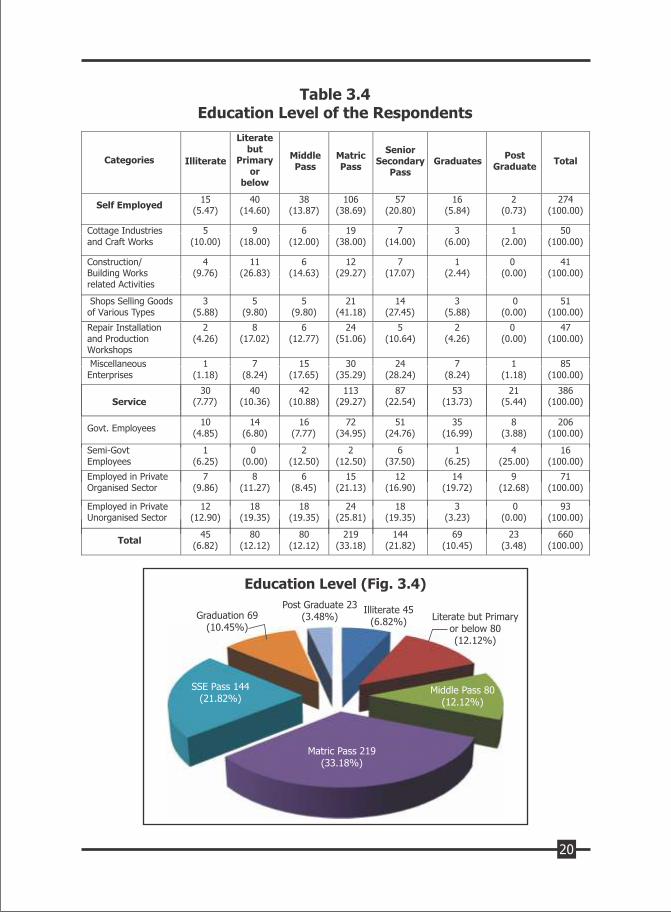
Table 3.4Education Level of the Respondents
Education Level (Fig. 3.4)
Graduation 69(10.45%)
Post Graduate 23(3.48%)
Illiterate 45(6.82%)
Literate but Primaryor below 80(12.12%)
Middle Pass 80(12.12%)
Matric Pass 219(33.18%)
SSE Pass 144(21.82%)
20
A look at the table shows that 6.82% of all the sampled respondents are infact
illiterates. Another 12.12% have studied up-to primary level only. An equal
number (12.12%) are middle pass. Thus if we put all these three categories
together we find that more than 31% of the respondents are below matric.
Infact slightly less than one fourth of the respondents are school drop-outs.
Another 33.18% are matriculates. Altogether more than 64% of the
respondents working in Punjab's rural non-farm sector have education level of
matric or below. Another 21.82% have completed senior secondary level
education. Only 13.93% are graduates and above and they are mainly in the
services component of the rural non-farm sector. Among the self- employed
graduate and above constitute 6.57% only. In the context of imparting any
kind of skill training to the work force presently working in the state's rural
non-farm sector it is extremely important to keep in mind that nearly one third
of them are below matric and only a very rudimentary training can be given to
them and they can at best be made semi-skilled workers. The next component
of nearly 55% who are either matric pass or have completed senior secondary
level education can be trained in various kind of skills. This should be the
target group. Some of them can even be given entrepreneurial training so that
they become self-employed entrepreneurs. The most educated ones with
graduation or above level of education, of course, can be given training as
skilled workers and /or entrepreneurs. They have better chances of becoming
successful entrepreneurs because they come from relatively better off section
of the society, have access to their own capital as also institutional loans
because they will have something to give as collateral to raise loans.
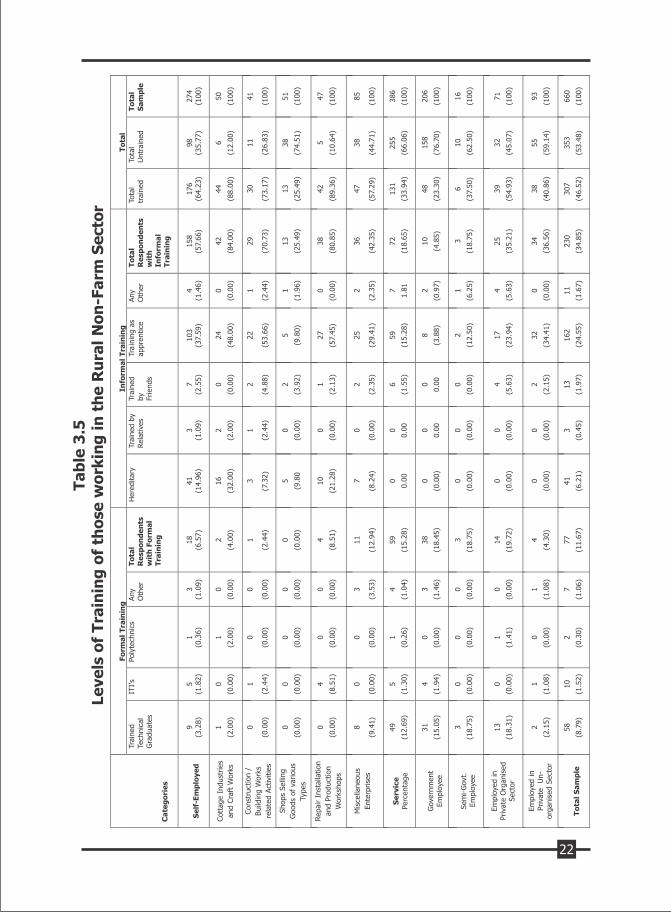
Levels of Training
It is not only the formal education which matters but training
whether formal or informal also helps in not only getting work in non-farm
sector but to a large extent it also determines their success and their earning
capacity. Table 3.7 contains the information about the training received before
joining job both formal and informal training. A look at the table shows that
only 18 (6.5%) respondents out of 274 in the self-employed category had any
formal training before joining RNFA's. Nine of them are trained technical
graduates mostly B.Tech. Another five had attended ITI. One is a diploma
holder from Polytechnic and three others have some other training. Thus only
21
Ta
ble
3.5
Le
ve
ls o
f T
rain
ing
of
tho
se
wo
rkin
g i
n t
he
Ru
ral
No
n-F
arm
Se
cto
r
22
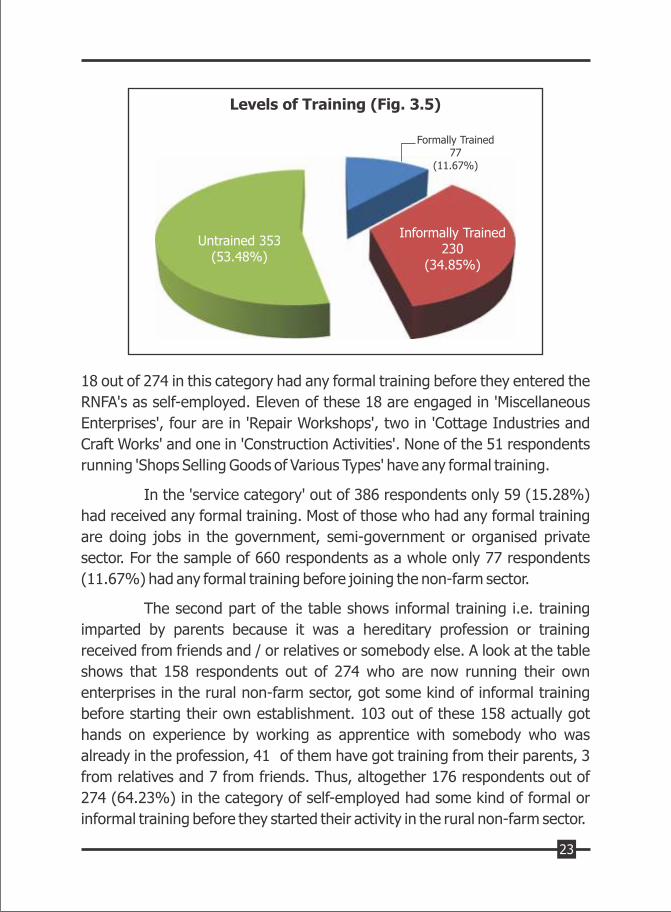
Levels of Training (Fig. 3.5)
Formally Trained77
(11.67%)
Informally Trained230
(34.85%)
Untrained 353(53.48%)
18 out of 274 in this category had any formal training before they entered the
RNFA's as self-employed. Eleven of these 18 are engaged in 'Miscellaneous
Enterprises', four are in 'Repair Workshops', two in 'Cottage Industries and
Craft Works' and one in 'Construction Activities'. None of the 51 respondents
running 'Shops Selling Goods of Various Types' have any formal training.
In the 'service category' out of 386 respondents only 59 (15.28%)
had received any formal training. Most of those who had any formal training
are doing jobs in the government, semi-government or organised private
sector. For the sample of 660 respondents as a whole only 77 respondents
(11.67%) had any formal training before joining the non-farm sector.
The second part of the table shows informal training i.e. training
imparted by parents because it was a hereditary profession or training
received from friends and / or relatives or somebody else. A look at the table
shows that 158 respondents out of 274 who are now running their own
enterprises in the rural non-farm sector, got some kind of informal training
before starting their own establishment. 103 out of these 158 actually got
hands on experience by working as apprentice with somebody who was
already in the profession, 41 of them have got training from their parents, 3
from relatives and 7 from friends. Thus, altogether 176 respondents out of
274 (64.23%) in the category of self-employed had some kind of formal or
informal training before they started their activity in the rural non-farm sector.
23
In the second category of those doing jobs only 72 respondents got
some kind of informal training. Altogether 230 respondents out of 660 in our
sample got some kind of informal training. Thus 11.67% had formal training
before entering non-farm sector, 34.85% had some kind of informal training
and the remaining 353 (53.45%) did not have any training before they started
working in the rural non-formal sector of the state.
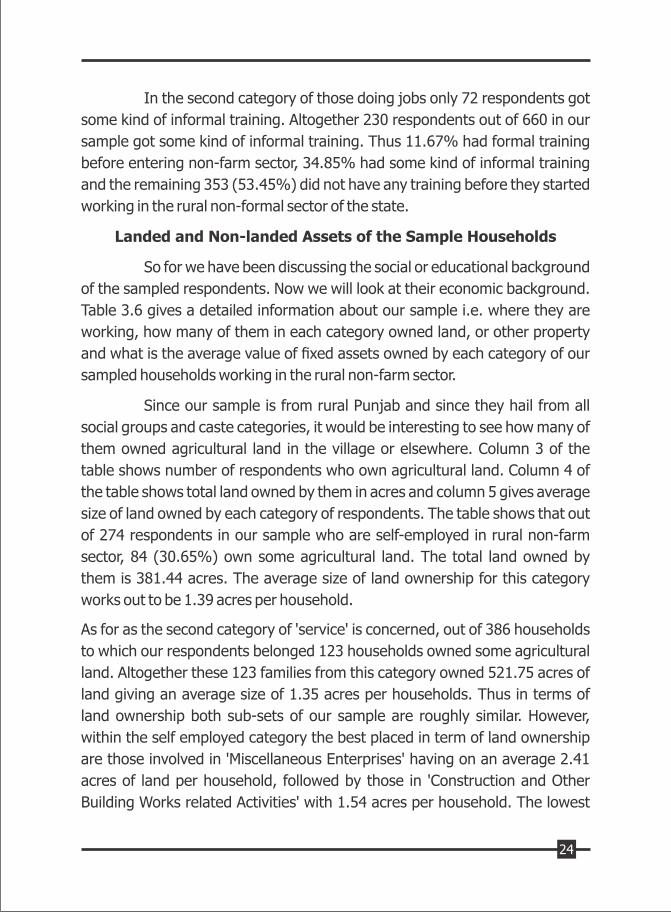
Landed and Non-landed Assets of the Sample Households
So for we have been discussing the social or educational background
of the sampled respondents. Now we will look at their economic background.
Table 3.6 gives a detailed information about our sample i.e. where they are
working, how many of them in each category owned land, or other property
and what is the average value of fixed assets owned by each category of our
sampled households working in the rural non-farm sector.
Since our sample is from rural Punjab and since they hail from all
social groups and caste categories, it would be interesting to see how many of
them owned agricultural land in the village or elsewhere. Column 3 of the
table shows number of respondents who own agricultural land. Column 4 of
the table shows total land owned by them in acres and column 5 gives average
size of land owned by each category of respondents. The table shows that out
of 274 respondents in our sample who are self-employed in rural non-farm
sector, 84 (30.65%) own some agricultural land. The total land owned by
them is 381.44 acres. The average size of land ownership for this category
works out to be 1.39 acres per household.
As for as the second category of 'service' is concerned, out of 386 households
to which our respondents belonged 123 households owned some agricultural
land. Altogether these 123 families from this category owned 521.75 acres of
land giving an average size of 1.35 acres per households. Thus in terms of
land ownership both sub-sets of our sample are roughly similar. However,
within the self employed category the best placed in term of land ownership
are those involved in 'Miscellaneous Enterprises' having on an average 2.41
acres of land per household, followed by those in 'Construction and Other
Building Works related Activities' with 1.54 acres per household. The lowest
24
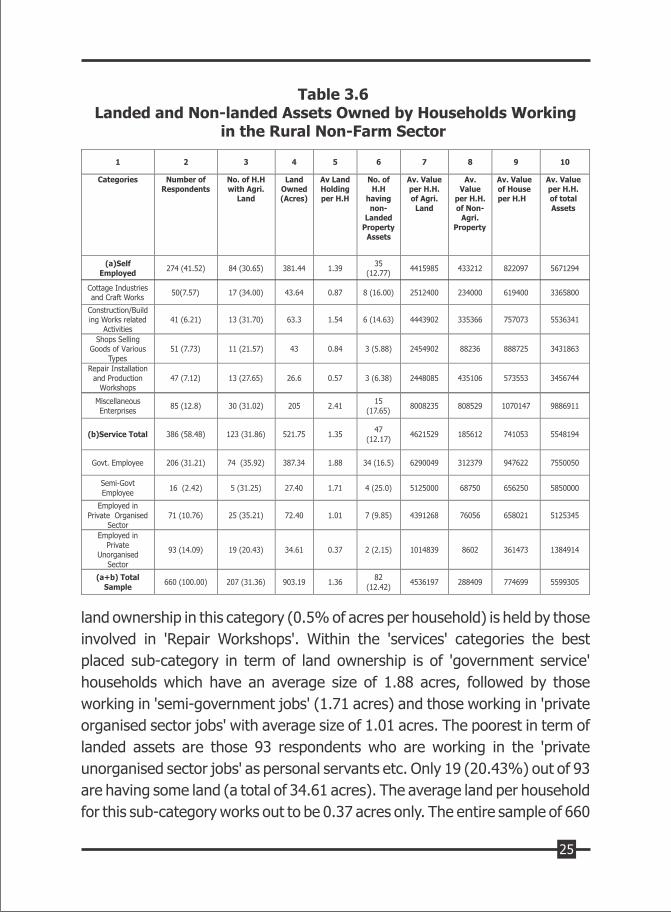
Table 3.6 Landed and Non-landed Assets Owned by Households Working
in the Rural Non-Farm Sector
25
land ownership in this category (0.5% of acres per household) is held by those
involved in 'Repair Workshops'. Within the 'services' categories the best
placed sub-category in term of land ownership is of 'government service'
households which have an average size of 1.88 acres, followed by those
working in 'semi-government jobs' (1.71 acres) and tho se working in 'private
organised sector jobs' with average size of 1.01 acres. The poorest in term of
landed assets are those 93 respondents who are working in the 'private
unorganised sector jobs' as personal servants etc. Only 19 (20.43%) out of 93
are having some land (a total of 34.61 acres). The average land per household
for this sub-category works out to be 0.37 acres only. The entire sample of 660
households owned a total of 903.19 acres of agricultural land giving an
average of 1.36 aces per household.
Column 6 of the table gives information about number of
respondents having non-agricultural property such as shop, residential plot
etc. in nearby town. We find that 35 (12.77%) respondents from the self-
employed category own non-agricultural property also. Similarly from the
'services' category 47 out of 386 (12.17) own some non-agricultural property.
Once again within the self employed in RNFA category those involved in the
'Miscellaneous Enterprises' are the best placed with each household on an
average having non-agricultural property worth Rs 8 lakh. Within service
category once again those in the government or semi-government services
are relatively better placed, followed by those working in the organised
private sector respondents. As for as workers working in the unorganised
private sector is concerned, only 2 out of a total of 93 (2.15%) own any non-
agricultural property. Thus, this sub-section of the service category which
work as personal servant of private individuals is the most deprived lot both in
term of land as well as non-landed property.
Column 7, 8 and 9 of the table give average per household value of
agricultural land, average per household value of non-agricultural property
and average household value of house respectively. The last column 10 of the
table gives total per household value of landed and non-landed property held
by various categories of our sampled households. An average household
belonging to 'self-employed' in rural non-farm sector own property and house
as asset worth Rs. 48.49 lakh whereas an average household belong to the
'services' category in our sample own property and house as asset worth Rs.
48.07 lakh. So both the sub sets in our data have more or less the same
economic background in terms of assets owned. Within each of these two
categories, of course, there are wide variations. For example within the
category of self employed respondents the richest in term of all the three
assets are those belonging to the category of 'Miscellaneous Enterprises. On
an average a household in our sample belong to the sub category of
'Miscellaneous Enterprises' own assets worth Rs. 98.86 lakh. Those belonging
to the sub category 'Construction/ Building Works Related Activities' are at
number two in term of assets with average per household assets value of Rs.
26
55.36 lakh. Respondents belonging to other three sub-categories i.e. 'Cottage
Industries and Craft Works', 'Shops Selling Goods', and Repair Workshops'
have more or less similar position in term of assets with average assets
ranging between Rs. 33.65 lakh and Rs 34.56 lakh. Within the 'service'
category the best placed in terms of assets are Government Employees
followed by Semi-Government Employees and Private Sector Employees. The
worst in term of assets are those doing jobs in the private unorganised sector
as personal servants etc. While an average respondent who is in the
government job own totalproperty worth Rs. 75.50 lakh, the one working in
the private unorganised sector as personal servant etc own property worth
Rs. 13.84 lakh only. Thus, whichever way we look at our sample we find that
most well off section in our sample consists of those who are working as self
employed in the Miscellaneous Enterprises category of self employed and in
the service category those working in Government or Semi-Government jobs.
Within those having private sector jobs, those working in private
establishments are relatively better placed. The most deprived economically,
socially and educationally are those who are doing private jobs, with
individuals as drivers, helpers, security guards etc.
Intensity of Employment
It will also be interesting to see the intensity of employment of those
working in the rural non-farm sector of Punjab i.e. whether they are fully
employed or under –employed. For that we have looked at the data regarding
number of days they are working in a month and the number of hours they
work in a day.
Table 3.7 contains that information. A look at the table shows that
the self-employed in RNFA's work on an average for 27.86 days in a month
while those who are working on salary or wages in the rural non-farm sector
work on an average for 26.31 days in a month. Within the category of Self
Employed, those engaged in 'Shops Selling Goods of Various Types' work
maximum for 29.37 days in a month followed by 'Repair Shops' (28.40 days),
'Cottage Industries, and Craft Works' (28.30 days) and 'Miscellaneous
Enterprises' (27.65days). Those in 'Construction/ Building Related Activities'
spend the minimum time i.e. (25.32 days) in a month.
27
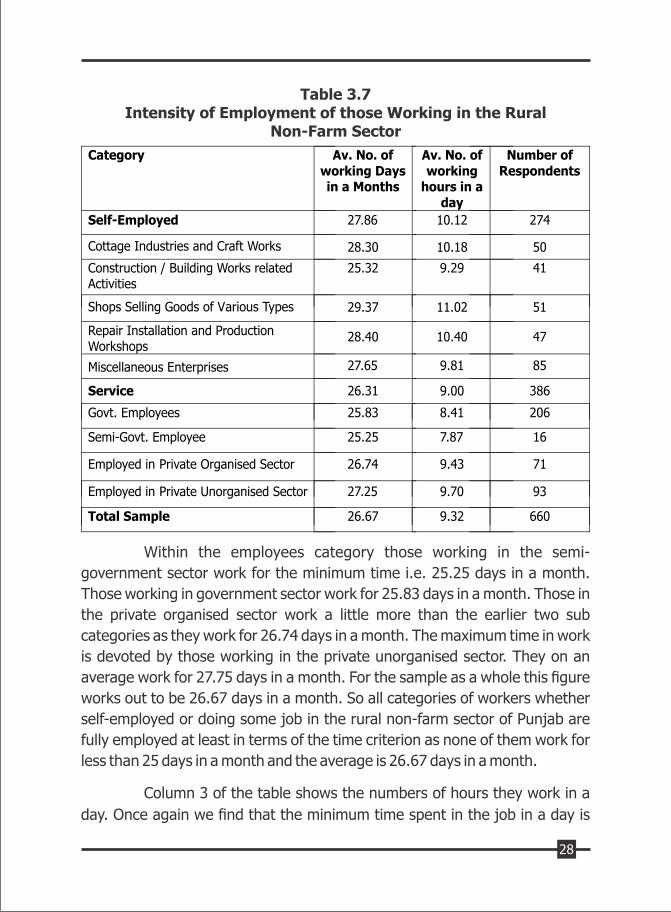
Table 3.7Intensity of Employment of those Working in the Rural
Non-Farm Sector
Within the employees category those working in the semi-
government sector work for the minimum time i.e. 25.25 days in a month.
Those working in government sector work for 25.83 days in a month. Those in
the private organised sector work a little more than the earlier two sub
categories as they work for 26.74 days in a month. The maximum time in work
is devoted by those working in the private unorganised sector. They on an
average work for 27.75 days in a month. For the sample as a whole this figure
works out to be 26.67 days in a month. So all categories of workers whether
self-employed or doing some job in the rural non-farm sector of Punjab are
fully employed at least in terms of the time criterion as none of them work for
less than 25 days in a month and the average is 26.67 days in a month.
Column 3 of the table shows the numbers of hours they work in a
day. Once again we find that the minimum time spent in the job in a day is
28
7.87 hours by those working in the semi-government organisation. Those
working in government jobs devote 8.41 hours in a day to work. Those
working in private organised sector devote 9.43 hours and those working in
the private unorganised sector, infact, work for the maximum period i.e. 9.70
hours in a day. Those working as self-employed in RNFA's are, infact, working
for even longer hours as, on an average, they put in 10.12 hours of work every
day. Thus, in term of time criterion our results show that all categories of
workers engaged in the rural non-farm sector of Punjab are fully employed
whether we consider number of working hours in a day or number of working
days in a month. Whether after working full time they can be classified as fully
employed even in terms of the income criterion will be discussed in the next
chapter.
To sum up our study shows that nearly 42 percent participants in
the rural non-farm sector are self employed and the remaining are doing
some job in the government sector, semi-government sector, private
organised sector or private unorganised sector. More than 61 percent of them
belonging to SC or OBC,s. About 71 percent of the respondents are relatively
young below 45 years of age. Nearly 7 percent of them are illiterate, one
fourth of them are literate but below matric. Another 55 percent are either
matriculate or senior secondary pass. Less than 14 percent are graduate or
above. Nearly 30 percent participants own some land. The poorest in terms of
landed and other assets are those doing some job in the unorganised private
sector as personal servants etc. Infact this section of respondents is the most
deprived not only economically but also socially and educationally as more
than 81 percent of them hail from SC/ OBC background and most of them are
matric or below.
29
Chapter -4
Earnings and Levels of Living of Sample Households Working in
the Rural Non-Farm Sector in Punjab
After having discussed the socio-economic and educational profile
of those working in Punjab's rural non-farm sector in the preceding chapter, in
this chapter we will look at their income levels and their living standard as
represented by the amenities they have in their homes. The real test of any
gainful employment is whether it generates enough income or not which
ensures a reasonably decent living standard for the earner and his family.
Therefore, an analysis of the monthly household income of those working in
the rural non-farm sector of the state and the contribution of various sources
in it particularly contribution of income from non-farm activity/employment
becomes all the more meaningful.
Earnings and the Composition of Household Income of
RNFA Participants
Table 4.1 shows the composition of monthly income of those
engaged in the rural non-farm sector either as self-employed in their own
establishments or as workers doing some job in the rural non-farm sector of
the state. A look at the table shows that on an average a respondent
household in our sample which is self-employed in RNFA earns a family
income of Rs. 30907 per month. Compared to this an average respondent in
our sample who is doing some job in this sector, in fact, earns a little more than
the self- employed with his household income being Rs. 31849 per month.
Thus the respondents in our sample belonging to both the categories earn
roughly the same level of income. Within the 'Self-Employed' the highest per
household monthly income (Rs. 41994) is earned by those households which
are engaged in 'Miscellaneous Enterprises'. They are followed by those
engaged in 'Construction/ Building Works Related Activities' with monthly
30
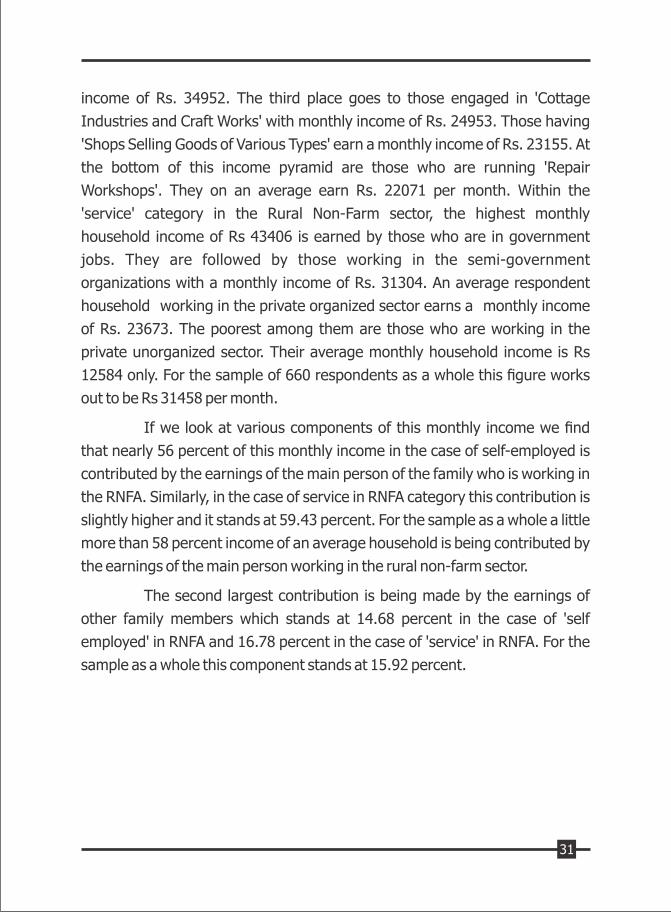
income of Rs. 34952. The third place goes to those engaged in 'Cottage
Industries and Craft Works' with monthly income of Rs. 24953. Those having
'Shops Selling Goods of Various Types' earn a monthly income of Rs. 23155. At
the bottom of this income pyramid are those who are running 'Repair
Workshops'. They on an average earn Rs. 22071 per month. Within the
'service' category in the Rural Non-Farm sector, the highest monthly
household income of Rs 43406 is earned by those who are in government
jobs. They are followed by those working in the semi-government
organizations with a monthly income of Rs. 31304. An average respondent
household working in the private organized sector earns a monthly income
of Rs. 23673. The poorest among them are those who are working in the
private unorganized sector. Their average monthly household income is Rs
12584 only. For the sample of 660 respondents as a whole this figure works
out to be Rs 31458 per month.
If we look at various components of this monthly income we find
that nearly 56 percent of this monthly income in the case of self-employed is
contributed by the earnings of the main person of the family who is working in
the RNFA. Similarly, in the case of service in RNFA category this contribution is
slightly higher and it stands at 59.43 percent. For the sample as a whole a little
more than 58 percent income of an average household is being contributed by
the earnings of the main person working in the rural non-farm sector.
The second largest contribution is being made by the earnings of
other family members which stands at 14.68 percent in the case of 'self
employed' in RNFA and 16.78 percent in the case of 'service' in RNFA. For the
sample as a whole this component stands at 15.92 percent.
31
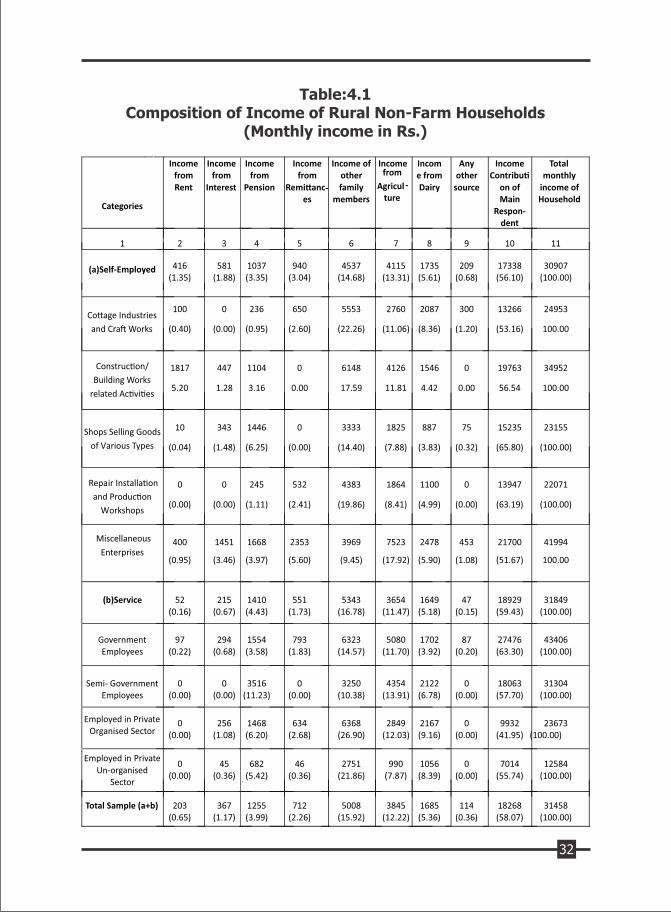
Table:4.1Composition of Income of Rural Non-Farm Households
(Monthly income in Rs.)
32
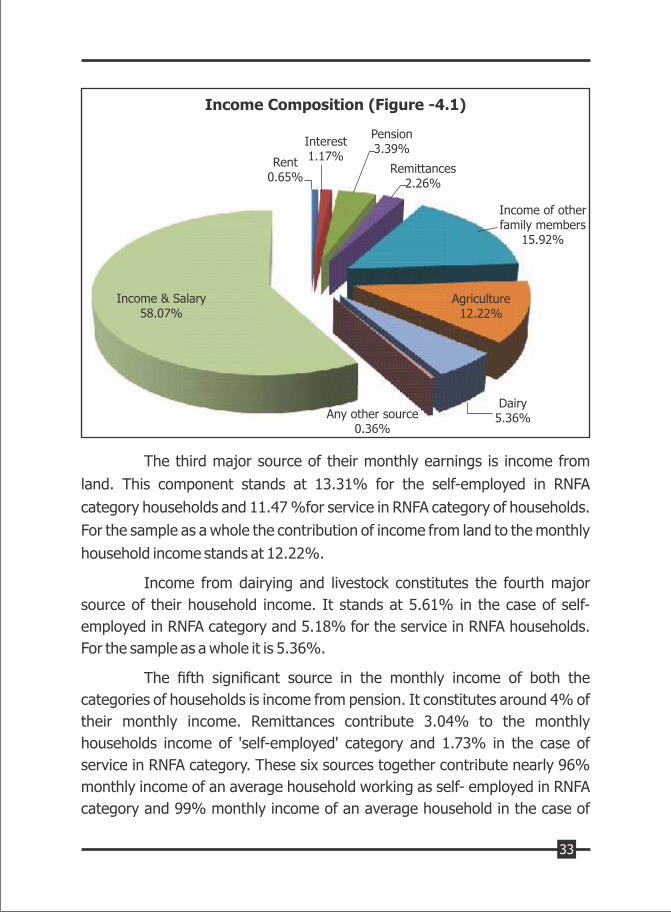
Income Composition (Figure -4.1)
Rent0.65%
Interest1.17%
Pension3.39%
Remittances2.26%
Dairy5.36%
Income of otherfamily members
15.92%
The third major source of their monthly earnings is income from
land. This component stands at 13.31% for the self-employed in RNFA
category households and 11.47 %for service in RNFA category of households.
For the sample as a whole the contribution of income from land to the monthly
household income stands at 12.22%.
Income from dairying and livestock constitutes the fourth major
source of their household income. It stands at 5.61% in the case of self-
employed in RNFA category and 5.18% for the service in RNFA households.
For the sample as a whole it is 5.36%.
The fifth significant source in the monthly income of both the
categories of households is income from pension. It constitutes around 4% of
their monthly income. Remittances contribute 3.04% to the monthly
households income of 'self-employed' category and 1.73% in the case of
service in RNFA category. These six sources together contribute nearly 96%
monthly income of an average household working as self- employed in RNFA
category and 99% monthly income of an average household in the case of
Agriculture12.22%
Any other source0.36%
Income & Salary58.07%
33
service in RNFA category. Even for the sample as a whole the contribution of
these six sources of income stands at 97.82%. Thus, the contribution of all the
three remaining sources i.e. 'rent', 'interest' and 'any other source' to the
monthly household income is very small.
Adequacy of Earnings of RNFA Participants
Now whether this monthly income of Rs. 31458 for an average
household engaged in Punjab's rural non-farm sector is sufficient or not for a
family of five is a subjective question but it is certainly more than what an
efficient farmer in Punjab who owns 5-6 acres of land and who goes for the
most profitable and least risky crop combination of wheat and rice, earns. In
fact even if the income from land which is Rs. 3845 per month for an average
household in our sample, is taken out of this monthly income, and only income
from non-farm activity, contribution of other family members, income from
dairying and income from pension and remittances is considered, it still works
out to be Rs. 27613 per month or Rs. 331356 per annum. Even this is more
than what an average farmer in Punjab who owns five acres of land can earn.
Thus, non-farm activity in Punjab is an economically viable activity which
generates reasonably good income. It appears that at this juncture rural non-
farm employment is perhaps the only option available for the state's
unemployed and under employed youth because those working in the non-
farm sector are not only fully employed in term of time criterion and income
criterion but they earn a reasonably good income which is more than the
income of a small farmer who owns up to five acres of land.
In the preceding paragraph we have seen that on an average a
family which is engaged in Punjab's rural non-farm sector earns a monthly
income of Rs. 31458 or an annual income of Rs. 377496. The average family
size in our sample is 4.97 for self- employed in RNFA's and 4.79 for the service
category. For the entire sample of 660 households the family size works out to
be 4.87. If we divide the household annual income of Rs. 377496 by the
average family size i.e. 4.87 we get a per capital income of Rs. 77504 per
annum which is nearly as good as the per capital income of an average person
in Punjab. And to top it all, unlike farmers, the income of rural non-farm
34
households is not subject to the vagaries of weather nor he has to spend
several days in the market every season to sell his produce and then wait for
several days for the payment. That is why we often do not hear about suicide
by the participants of the rural non-farm sector in the state.
Correlates of their Capacity to Earn
It is often said that averages conceal more than they reveal. From
table 4.1 we know that an average respondent belonging to the category of
self-employed earns a monthly income of Rs. 17338 from his principal rural
non-farm activity which he runs. Similarly an average respondents who is
doing some job in the rural non-farm sector earns Rs. 18929 per month. But
these average figures do not reveal the vast inequalities in the monthly
earnings of our respondents. For example, if we pick up the top five percent
earners and consider their monthly income from principal non-farm activity
only, we find that each one of them earns more than Rs. 42000 per month.
Infact their average monthly income from RNFA's works out to be Rs. 56509.
On the other hand if we pick up the lowest 25% respondents and look at their
monthly earnings we find that none of them is earning more than Rs. 7800 per
month. In fact he average monthly income per respondent from non-farm
activity in their case works out to be Rs. 5797 only. Thus, a respondent in the
top 5 percent category working in the rural non-farm sector earns nearly ten
times more than what a respondent in the lowest quartile of income earns
from RNFA. To find out what makes the difference between these two sets of
earners we tabulated the socio-economic, educational and training
background of both these sets of high and low income earners working in the
state's rural non-farm sector. The results are presented in Table 4.2.
A look at the table reveals that 63.64 percent of the high income
respondents are from higher castes; 66.67 percent of them have + 2 or higher
levels of educational qualification; 33.33 percent of them have formal
training; 60.61 percent of them own land and more than half of them hail from
agriculturist families. Compared to this the composition of respondents
belonging to the lowest 25 percent income bracket is: 75.32 percent of them
are from scheduled castes or backward castes; 74.69 percent of them have
35
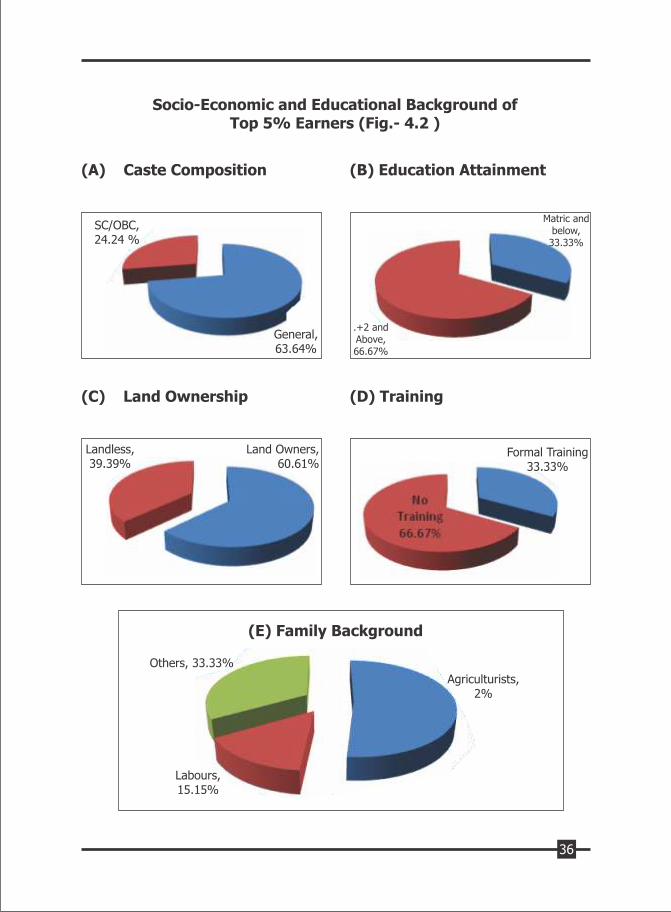
Socio-Economic and Educational Background of Top 5% Earners (Fig.- 4.2 )
(A) Caste Composition (B) Education Attainment
SC/OBC, 24.24 %
General, 63.64%
.+2 and Above, 66.67%
Matric and below, 33.33%
(C) Land Ownership (D) Training
Landless, 39.39%
Land Owners, 60.61%
Formal Training33.33%
(E) Family Background
Others, 33.33%
Agriculturists,2%
Labours,15.15%
36
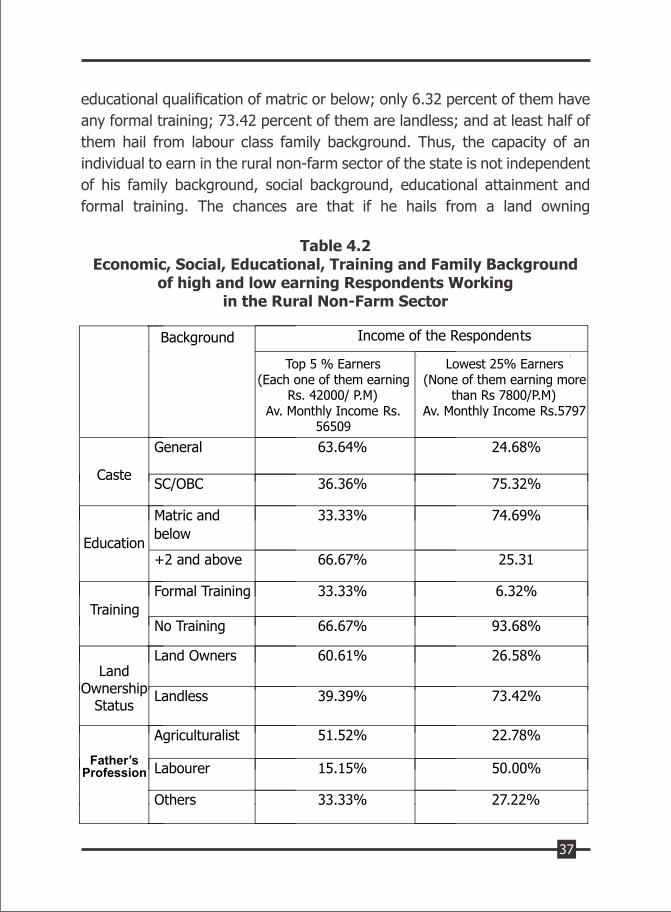
educational qualification of matric or below; only 6.32 percent of them have
any formal training; 73.42 percent of them are landless; and at least half of
them hail from labour class family background. Thus, the capacity of an
individual to earn in the rural non-farm sector of the state is not independent
of his family background, social background, educational attainment and
formal training. The chances are that if he hails from a land owning
Table 4.2Economic, Social, Educational, Training and Family Background
of high and low earning Respondents Working in the Rural Non-Farm Sector
37
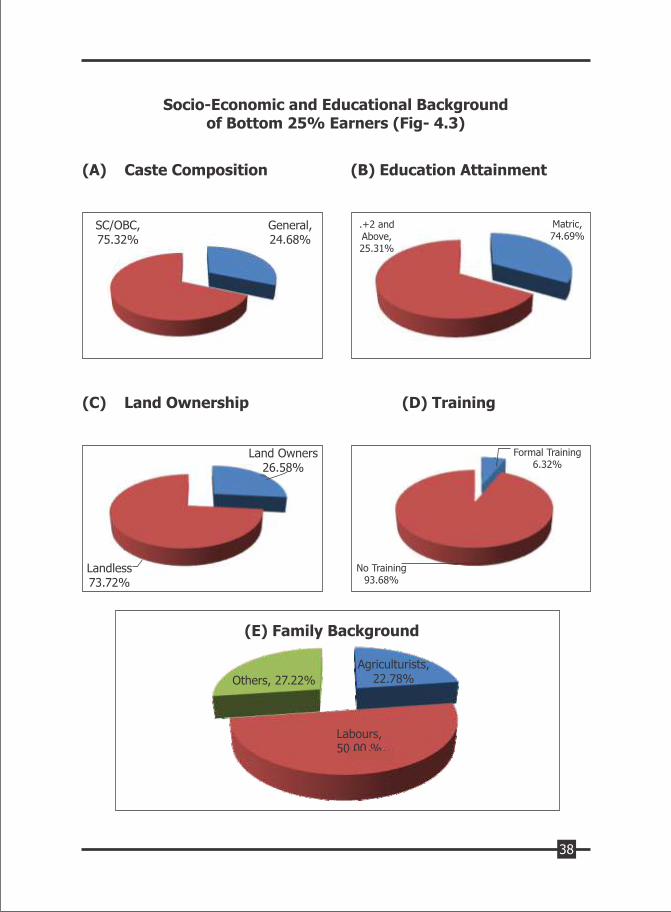
(A) Caste Composition (B) Education Attainment
SC/OBC, 75.32%
General, 24.68%
.+2 and Above,25.31%
Matric,74.69%
(C) Land Ownership (D) Training
Land Owners26.58%
Formal Training6.32%
Landless73.72%
No Training93.68%
(E) Family Background
Others, 27.22%
Agriculturists,22.78%
Labours,50.00 %
Socio-Economic and Educational Background of Bottom 25% Earners (Fig- 4.3)
38
agriculturist higher caste family with higher educational qualification and
formal training then he is likely to be amongst the high income earners in the
rural non-farm sector irrespective of whether he is running his own
establishment or he is doing a job. On the contrary an average non-farm
respondent in the bottom quartile of monthly earners is more likely to be from
SC/BC category, hailing from labouring class background almost without or
with very little land, with educational qualification of matric or below and
almost without any formal training. The point we are trying to make is that
while average income of a respondent in our sample working in the rural non-
farm sector of Punjab is reasonably good but there are wide variations in their
ability to earn and those variations are explained by the economic and social
background of the earner and his educational attainments and training
which, in turn, are again dependent on their economic and /or social
background. And if these differences in economic and social background are
to be smoothened, providing good quality education to everyone and
equipping them with skill and training will help reduce these differences in
their earning capacities. Providing them skill and training will not only reduce
income inequalities in the country side but it will also raise their standard of
living by improving their productivity and incomes across the board.
Living Conditions of those Working in the
Rural Non-Farm Sector of Punjab
After having discussed the pattern and sources of monthly income of
those working in Punjab's rural non-farm sector in the preceding pages, we
shall now turn to look at their living condition in terms of facilities they have in
their homes. Column-1 of this table gives information about those who are
self- employed (274 households in our sample). Column-2 contains
information about those (386 households in our sample) who are doing some
service or job in the non-farm sector. Column-3 tells us the consolidated
position of the entire sample of 660 households covered by our study. We
asked from the households about availability or otherwise of 18
facilities/amenities/gadgets. The Census of India 2011 also collected
information about at least 11 of these facilities. For comparison we are
reproducing the results of Census 2011 about availability or otherwise of
these eleven facilities for the state of Punjab in the last column of the table.
39
A look at the table shows that 90.5% of the households in our
sample belonging to the category of self-employed have separate kitchen in
their homes. Nearly the same percentage (89.38%) of those belonging to the
second category i.e. those doing some job in the non-farm sector also have
separate kitchen in their homes. For the sample as a whole this figure works
out to be 89.85 percent. We do not have comparable figures for rural Punjab
separately from the Census 2011. But we do have comparable information for
the entire Punjab (urban + rural combined) in the Census 2011. Surprisingly
while for the state as a whole, only 72.0 percent households in 2011 had
separate kitchen, in our sample which is more recent (as the survey was
conducted in the latter half of 2014,) this figure for the participants in Punjab's
rural non-farm sector stands at 89.85 percent. Thus, in this respects the RNFA
households covered by our survey are in a better position compared to an
average households in Punjab in 2011.
A more or less similar picture emerges for use of LPG in the kitchen.
In our sample this figure stands at 92.34 percent for self-employed
households and 95.08 percent for service category. For the sample as a whole
it stands at 93.94 percent while the state's figure in 2011 was 54.5 percent
only. Again 97.73 percent of the households in our sample belonging to the
rural non-farm sector have bath room in their homes while for Punjab the
Census 2011 figure was 71.5% only. Similarly, 93.64% of the respondents in
our sample have lavatory in their homes while in 2011 only 71.3% homes in
Punjab had this facility. Again while 97.12% households in our sample have TV
in their homes. This figure was 82.6% for the Punjab state in 2011. Similarly in
our sample 95.76% households have landline and/or mobile phone. For
Punjab this figure was 82% in 2011. In our sample collected in the latter half
of 2014, 16.21% houdeholds had computer in their homes. In 2011 only
12.8% homes in the state had computers in their homes. While in our sample
10.61 homes are having internet facility, the figure for the state in 2011 was
5.42% only. 86.82% households in our sample have bicycles. Comparable
figure for the state in 2011 is 66.4%. In our sample 76.57% households own
scooter/motorcycle while for the state this figure was 47.4% in 2011. And
lastly while 20.76% households in our sample own car and/or jeep, only
13.1% households in Punjab as per Census 2011 had car and/or jeep.
40
Table 4.3 Living Condition of Sampled Households
41
While it must be kept in mind that our data was collected in 2014, the
Census was conducted in 2011 and therefore, these figures strictly speaking
are not comparable because more and more people are using these facilities
as incomes go up but still at least one thing is clear that an average person
working in Punjab's rural non-farm sector whether as self-employed or as
service person is in no way less than an average Punjabi households. He
enjoys at least as good a standard of living, if not better, as an average Punjabi
household.
In fact we also collected data about some other facilities in their
homes while Census of India 2011 did not collect that information. For
example, in our sample 93.03 percent household have washing machines,
Comparative Position of Facilities in the Homes of Our Sample RNFA Participant
and Punjab (urban+ rural) 2011 (Fig- 4.4)
Our Sample of Rural Non-Farm Workers
89.8593.94
97.73
93.6497.12
16.21
10.61
86.82
76.67
47.12
20.76
93.03
61.82
13.82
39.24
9.09
15.30
72.00
54.50
71.50
79.3082.60 82.00
12.80
5.40
66.4
47.40
Separa
te K
itchen
LPG
Bat
hroo
m
Lava
tory
T.
V./H
ome
The
ater
Tele
phon
e/M
obile
Com
pute
r In
tern
et C
onne
ctio
n
Bic
yle
Sco
oter
/Mot
orcy
cle
Was
hing
Mac
hine
C
ar J
eep
Frid
ge
Coo
ler
AC
Gen
erat
or/In
vertor
M
icro
wav
e
Gys
er/W
ater
Hea
ter
Punjab Census 2011
42
61.82 percent have coolers, 13.48 percent have air conditioners, 39.74
percent have generator/inverters, 9.09 percent homes have microwave in
their kitchen and 15.30 percent have Geyser/water heaters.
Thus, to sum up, we can say that whether we compare our sample
households in terms of income or facilities in their homes, an average
household whose main earning member is working in the rural non-farm
sector of the state, compares favourably with an average Punjabi household.
Hence there is a strong case for promoting the rural non-farm sector by giving
training to the rural youth to make them employable and/or start their own
enterprise. Chances are that Punjab's rural youth may be more enthusiastic in
taking up rural non-farm work compared to working in the farm sector which
most of them seem not interested in. In any case promoting rural non-farm
activities in the state is about the only option available to policy makers in the
state at the moment to generate gainful employment opportunities.
43
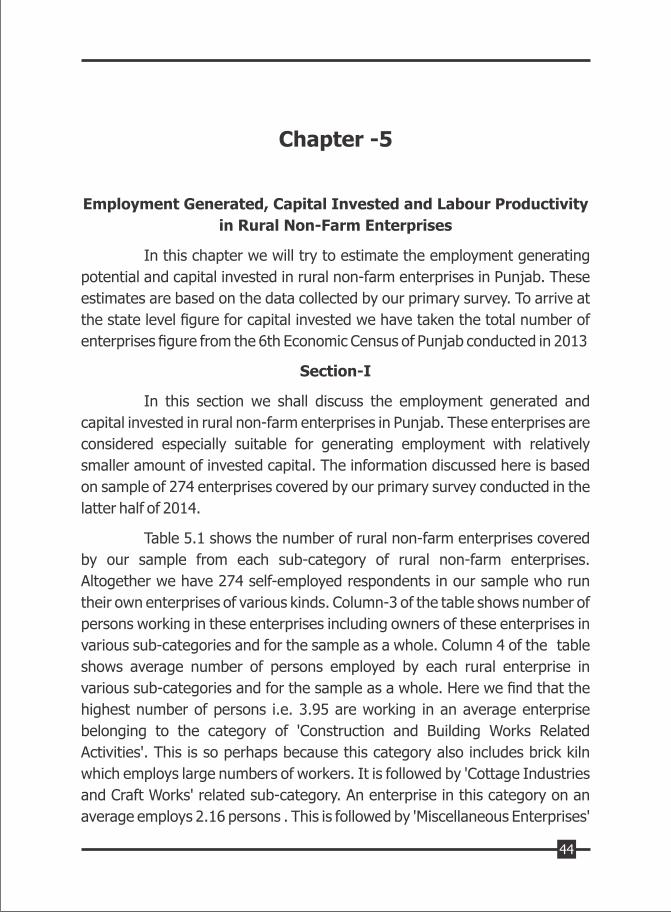
Chapter -5
Employment Generated, Capital Invested and Labour Productivity
in Rural Non-Farm Enterprises
In this chapter we will try to estimate the employment generating
potential and capital invested in rural non-farm enterprises in Punjab. These
estimates are based on the data collected by our primary survey. To arrive at
the state level figure for capital invested we have taken the total number of
enterprises figure from the 6th Economic Census of Punjab conducted in 2013
Section-I
In this section we shall discuss the employment generated and
capital invested in rural non-farm enterprises in Punjab. These enterprises are
considered especially suitable for generating employment with relatively
smaller amount of invested capital. The information discussed here is based
on sample of 274 enterprises covered by our primary survey conducted in the
latter half of 2014.
Table 5.1 shows the number of rural non-farm enterprises covered
by our sample from each sub-category of rural non-farm enterprises.
Altogether we have 274 self-employed respondents in our sample who run
their own enterprises of various kinds. Column-3 of the table shows number of
persons working in these enterprises including owners of these enterprises in
various sub-categories and for the sample as a whole. Column 4 of the table
shows average number of persons employed by each rural enterprise in
various sub-categories and for the sample as a whole. Here we find that the
highest number of persons i.e. 3.95 are working in an average enterprise
belonging to the category of 'Construction and Building Works Related
Activities'. This is so perhaps because this category also includes brick kiln
which employs large numbers of workers. It is followed by 'Cottage Industries
and Craft Works' related sub-category. An enterprise in this category on an
average employs 2.16 persons . This is followed by 'Miscellaneous Enterprises'
44
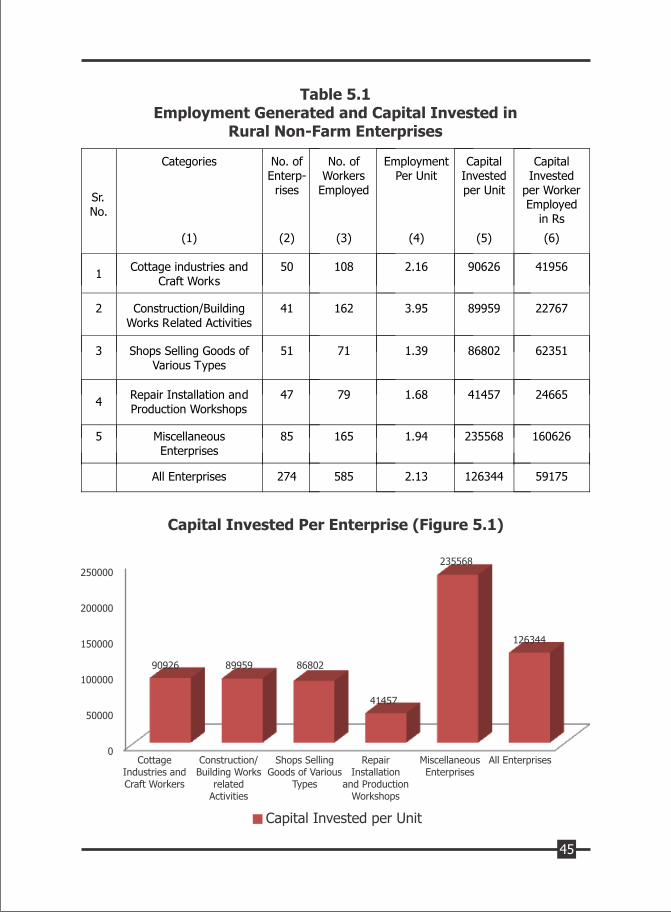
Table 5.1Employment Generated and Capital Invested in
Rural Non-Farm Enterprises
Capital Invested per Unit
CottageIndustries andCraft Workers
Construction/Building Works
relatedActivities
Shops SellingGoods of Various
Types
RepairInstallation
and ProductionWorkshops
MiscellaneousEnterprises
All Enterprises
250000
200000
150000
100000
50000
0
90926 89959 86802
41457
235568
126344
Capital Invested Per Enterprise (Figure 5.1)
45
Capital Invested per Worker Employment (Figure 5.2)
Capital Invested per Worker Employment
CottageIndustries andCraft Workers
Construction/Building Works
relatedActivities
Shops SellingGoods of Various
Types
RepairInstallation
and ProductionWorkshops
MiscellaneousEnterprises
All Enterprises
180000
160000
140000
120000
100000
80000
60000
40000
20000
0
41956
22767
62351
24665
160626
59175
category with 1.94 persons employed per unit and ' Repair, Installation and
Production Workshops' which have on an average 1.68 persons employed per
enterprise. The sub-category 'Shops Selling Goods of Various Types' has the
lowest number of persons employed with the average being 1.39 persons
only. The average for all enterprises in our sample works out to be 2.13
workers per enterprise. This is very close to the figure arrived at by the Sixth
Economic Census of Punjab conducted in January-March 2013 whose
provisional results have become available recently where 1698190 persons
were found to be employed in 818727 rural non-farm enterprises in Punjab
giving an average of 2.07 workers per enterprise. If we below up our survey
figures at the state level we find that presently 1743888 persons are employed
by rural non-farm enterprises in Punjab. Considering the fact that our survey
was conducted in the latter half of 2014 i.e. about a year and a half after the
Sixth Economic Census, the results thrown up by our sample are almost bang
on target.
Column-5 of the table 5.1 shows average amount of capital invested
in each enterprise belonging to the five sub-categories and for the sample of
all the 274 enterprises covered by our survey. Here we find that the highest
amount of capital (Rs. 235598) is invested in the sub-category of
46
'Miscellaneous Enterprises'. This is so because this sub-category includes
three respondents which have invested large sums. These are (i) a
commission agent(ii) a marriage palace owner and (iii) owner of a private
school. This is followed by 'Cottage Industries and Craft Works' (Rs. 90626),
'Construction/Building Works Related Activities' (Rs. 89959) and ' Shops
Selling Goods (Rs 86802). The least amount of capital is invested in sub-
category' Repair, Installation and Production Workshops' where on an average
only Rs. 41457 is invested per workshop.
The last column of the table 5.1 depicts the amount of capital
invested per person employed which in other words means the amount of
capital required to create a job in various sub-categories in Punjab's rural non-
farm enterprises. The highest amount of capital (Rs. 160626) required to
create a job is in 'Miscellaneous Enterprises' category. This is following by
'Shops Selling Goods of Various Types' with Rs. 62351 and 'Cottage Industries
and Craft Works' with Rs. 41956, 'Repair Installation and Production
Workshops' require only Rs. 24665 to create a job while the least amount of
capital required to create a job is Rs. 22767 in 'Construction, Building and
Works related Activities'. On an average a non-farm enterprises in Punjab has
Rs. 126344 as invested capital and employs 2.13 workers per unit thus
creating one job with Rs. 59175 only. There is hardly any other manufacturing
or service activity where a job can be created with such a small amount of
capital. Thus, rural non-farm enterprises are perhaps the least capital
intensive source of job creation and therefore, should be the core of our
employment generation strategy in rural areas. As already mentioned
according to Sixth Economic Census, the state had 818727 rural non-farm
enterprises in 2013. Our study shows that on an average each unit has Rs.
126344 of capital invested in each enterprises. Thus, the total capital invested
in Punjab's rural non-farm enterprises works out to be Rs. 10344.12 crores. So
presently nearly rupee ten and a half thousand crores of capital is invested in
these rural non-farm enterprise in Punjab.
Section-II
Labour Productivity
In this section we will discuss the productivity of workers engaged in
47
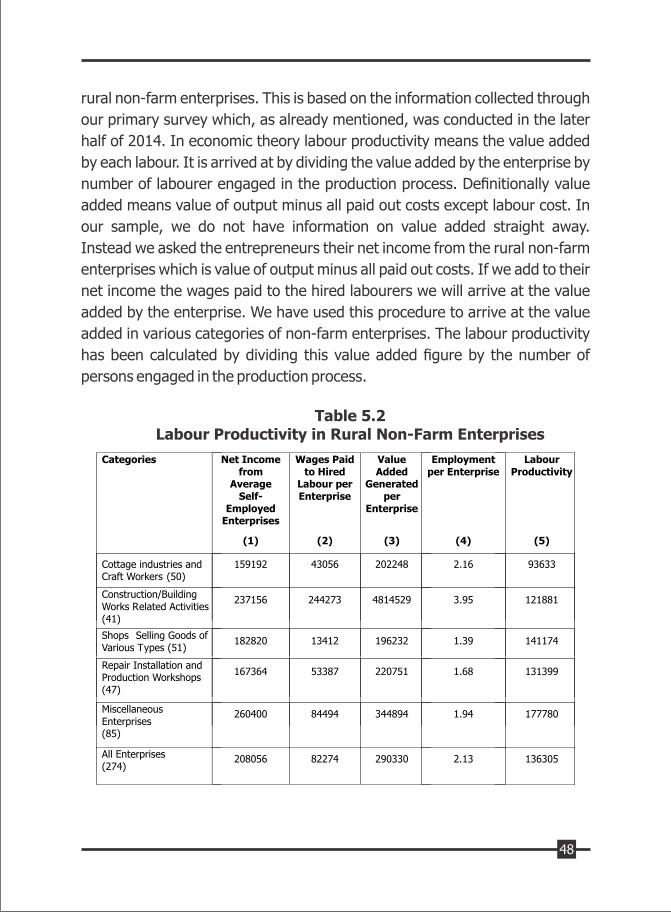
rural non-farm enterprises. This is based on the information collected through
our primary survey which, as already mentioned, was conducted in the later
half of 2014. In economic theory labour productivity means the value added
by each labour. It is arrived at by dividing the value added by the enterprise by
number of labourer engaged in the production process. Definitionally value
added means value of output minus all paid out costs except labour cost. In
our sample, we do not have information on value added straight away.
Instead we asked the entrepreneurs their net income from the rural non-farm
enterprises which is value of output minus all paid out costs. If we add to their
net income the wages paid to the hired labourers we will arrive at the value
added by the enterprise. We have used this procedure to arrive at the value
added in various categories of non-farm enterprises. The labour productivity
has been calculated by dividing this value added figure by the number of
persons engaged in the production process.
Table 5.2Labour Productivity in Rural Non-Farm Enterprises
48
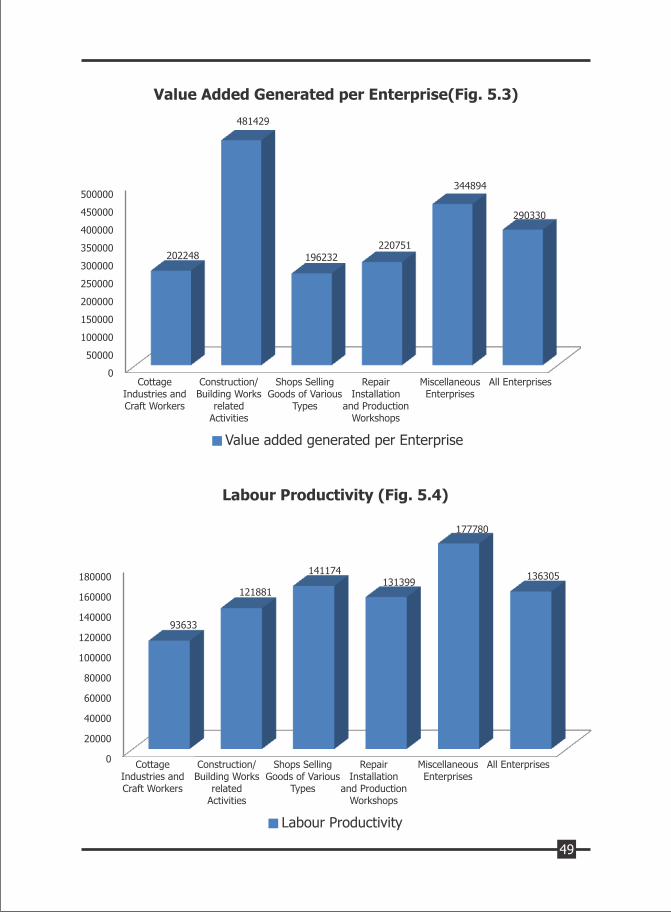
Labour Productivity
CottageIndustries andCraft Workers
Construction/Building Works
relatedActivities
Shops SellingGoods of Various
Types
RepairInstallation
and ProductionWorkshops
MiscellaneousEnterprises
All Enterprises
180000
160000
140000
120000
100000
80000
60000
40000
20000
0
93633
121881
141174131399
177780
136305
Value Added Generated per Enterprise(Fig. 5.3)
Value added generated per Enterprise
CottageIndustries andCraft Workers
Construction/Building Works
relatedActivities
Shops SellingGoods of Various
Types
RepairInstallation
and ProductionWorkshops
MiscellaneousEnterprises
All Enterprises
500000
450000
400000
350000
300000
250000
200000
150000
100000
50000
0
202248
481429
196232220751
344894
290330
Labour Productivity (Fig. 5.4)
49
As already mentioned the rural non-farm enterprises covered by our
survey were divided into five broad categories i.e. 'Cottage Industries and
Craft Works,' Construction/Building Related Activities, Shops Selling Goods of
Various Types,' 'Repair, Installation and production Workshops' and
'Miscellaneous Enterprises'. The labour productivity estimates for these five
broad categories of rural non-farm enterprises are presented in table 5.2. The
table shows the highest labour productivity of Rs. 177780 is recorded in
'Miscellaneous Enterprises' category and the lowest of Rs. 93633 is estimated
in 'Cottage Industries and Craft Works'. Labour Productivity of the other three
categories stands at Rs. 141174 for 'Shops Selling Goods of Various Types', Rs
131399 for Repair Installation and Production Workshops' and Rs. 121881 for
'Construction /Building Related Activities'. The range of variation in labour
productivity between these five broad categories of enterprises, though
substantial is not very large. The ratio of the highest to the lowest labour
productivity is 1:1.9. In fact the variations between the other three categories
is quite small and they vary in a range of less than Rs. 20000 per annum. Of
course, the estimates reported are average figures for these five broad
categories and within each of these categories there may be considerable
variation around the average. The average labour productivity for all rural
non-farm enterprises in Punjab works out to be Rs. 136305 per annum at
2014 prices. Together these rural enterprises are making value addition of the
order of Rs. 23770 crores to the Net State Domestic Product of Punjab.
To sum up, our study shows that an average non-farm enterprise in
Punjab employs 2.13 workers including the person who is running the
enterprise. The amount of capital invested in each enterprise works out to be
Rs. 126344 or Rs 59175 per person employed which is quite a small amount
for creation of one job in the rural non-farm sector. Presently Rs. 10344 crores
are invested in Punjab's rural non-farm enterprises. Together these
enterprises employed 1743888 workers in 2014. Each worker contributed
value worth Rs. 136305 every year and this sub- sector of the rural non-farm
sector is making a net contribution of Rs 23770 crores to the states' net
domestic product.
50
Chapter -6
Identifying Skills and Non-Farm Activities
Which Need to be Promoted
The recently conducted Economic Census of Punjab shows that
818727 non-agricultural enterprises are already functioning in rural Punjab.
These enterprises as per our estimate employ 17.43 lakh workers thus giving
an average employment of slightly above two per enterprise. But given the
fact that neither organised industry in urban areas nor agriculture in rural
Punjab is able to employ any more additional labour force, the number and
employment capacity of these rural non-farm enterprises will have to be
increased further to absorb the additional rural labour force. In any case in the
light of jobless growth of the urban industry and given the fact that
agriculture in Punjab is in fact shedding some of the labour force already
employed in it, the development of rural non-farm enterprises has become a
compulsion and, therefore needs to be given a top priority.
We have seen in our previous chapters that the income generation
capacity of an average non-farm enterprise operating in the rural areas of the
state is better than the income generation capacity of a farmer with five to six
acres of land . Similarly those working on salary or wages in the rural non-farm
sector are also better placed than agricultural labourer and small and marginal
farmers. This is despite the fact that more than two third of those working in
the state's rural non-farm sector do not own any agricultural land. Nor is there
any possibility of making agricultural land available to these landless
households. The only option available is to train more and more young
unemployed and/or under-employed youth to make them capable for
participating in the rural non-farm activities and jobs. It will not only make
unemployed youth employable but training will also make presently employed
in the state's rural non-farm sector more productive thus improving their
skills, income and standard of living. But before we embark upon a skill and
entrepreneurial development programme we must know what kind of skills
51
are required in the state's rural non-farm sector. In this chapter we have tried
to identify those skills. Our emphasis should also be on identifying those non-
farm activities which have good scope of development in future so that more
and more young aspirants become self-employed entrepreneurs. They should
not only be given training and guidance to own and manage those rural
enterprises but financial institutions should also be asked to support their
projects so that partly with their own savings but largely with institutional
finance they are able to set up their own enterprises. At the present juncture
that appears to be the only way forward if Punjab's youth is to be employed
gainfully.
On the basis of our experience gained during primary survey,
analysis of data collected and our discussions with the participants in the rural
non-farm sector, we have drawn a list of activities in which Punjab's rural
youth should be trained to make them employable in the rural non-farm sector
of the state. We have also identified 27 types of rural non-farm enterprises
which have good scope of further development in the state. Of course this list
of non-farm activities in which rural youth should be trained or list of
enterprises which have good scope of future development in the state is
based on the conditions presently prevailing in the state. As conditions change
in the future on account of improved level of skills, managerial ability, growth
of income, change in tastes and demands of the populace, many other
activities and many more types of rural non-farm enterprises will emerge in
future. Thus, in the first place this list is only suggestive depending upon the
conditions presently prevailing in the state and it is not exhaustive and;
secondly, there will be many additions and subtractions in future depending
upon changes taking place in the state's rural economy. Many of those people
may eventually move to urban areas to join urban industrial sector for better
incomes but their acquisition of skill and experience gathered in rural non-
farm activities will help them in their future success in urban sector jobs and
business activities.
52
Table. 6.1
List of Activities in Which Punjab's Rural Youth should be Trained
(Category A)
(Availability of jobs with the following skills is more in towns than in villages. So the youth from villages which are situated within a radius of 10-12 km from the town should be preferred for training in these skills. They can commute daily to the town and come back to their place of residence in the evening.)
1 Automobile Repairing
2 Denting / Painting
3 Bus/ Truck Body Fabrication
4 Wheel Balancing/ Alignment
5 Computer/ Mobile/ TV Repairing
6 Laboratory Technician
7 Marble Laying / Polishing /Tile Laying
8 Plumbing
9 Doors / Windows/ Furniture Polishing
10 POP Work in Buildings
11 Printing Technology (Printing of Invitations / Visiting Cards)
12 Lathe Machine Operator / Turners
13 Leather Technology/ Shoe Designing
14 Web Designing
15 Computer Networking
16 Data Entry Operator Cum Typist
17 Accounting
18 Hospitality / Tour Operating
19 Refrigeration Technology
20 Marketing
53
21 Advertising / Flex Board Making
22 Book Binding / Card Board Boxes Making
23 Boiler Operator
24 Electrician (AC Repair)
25 Electrician (Automobiles)
26 Fitter
27 JCB Machine / Heavy Earthmoving Equipment Operator
28 Watch Repairing
29 Radio Jockeys/Disco- Jockeys
(Category B)
(Availability of work for these skills is in both villages as well as towns. Therefore the training in these skills should be open to all irrespective of the location of their residence.)
30 Carpentry
31 Masonry
32 Painting and White Washing
33 Tailoring
34 Hair Dressing
35 Furniture Making
36 Canning of Furniture
37 Cement Pipes/ Interlocking Tiles/ Flower pots making
38 Gas Stove / Sewing Machine Repairing
39 Tractor Repairing
40 Tyre Repairing / Retreading
41 Scooter/ Motor Cycle Repairing
42 Photography / Videography
54
43 Online Filling of Forms /Applications
44 Driving
45 Welding
46 Cable/ DTH Operator
47 Electric Motor Rewinding / Repairing
48 Bakery
49 Soap making
50 Dancing /Singing/ Performing Arts
51 Dying Technology
52 Iron Rod Net Making
53 Fast Food (Tikki, Bhalla, Burger, Noodles)
54 Financial Instruments Marketing
55 Gardener / Nursery Raising
56 Battery Repairing
57 Electrician (Electrical Goods and House Fitting)
58 Refrigerator/ Washing Machine Repairing
59 R.O. Filter Technology / Installation / Repairing / Servicing
60 Inverter / Generator Mechanic
61 Tubewell / Pump Sets Installation/ Repairing
62 Veterinary Services (including Artificial Insemination)
63 Poultry / Goatry / Piggery
64 Cotton / Polly Wool Quilt Making
65 Harvesting Machine Operator
66 Net House / Poly House Making
67 Milk Processing
68 Beekeeping
69 Mushroom Production & Processing
70 Fabrication/ Installation /Operation of Solar Thermal Energy
71 Fruit and Vegetable Processing
72 Training of Youth for Security Forces
73 Halwai and Catering
55
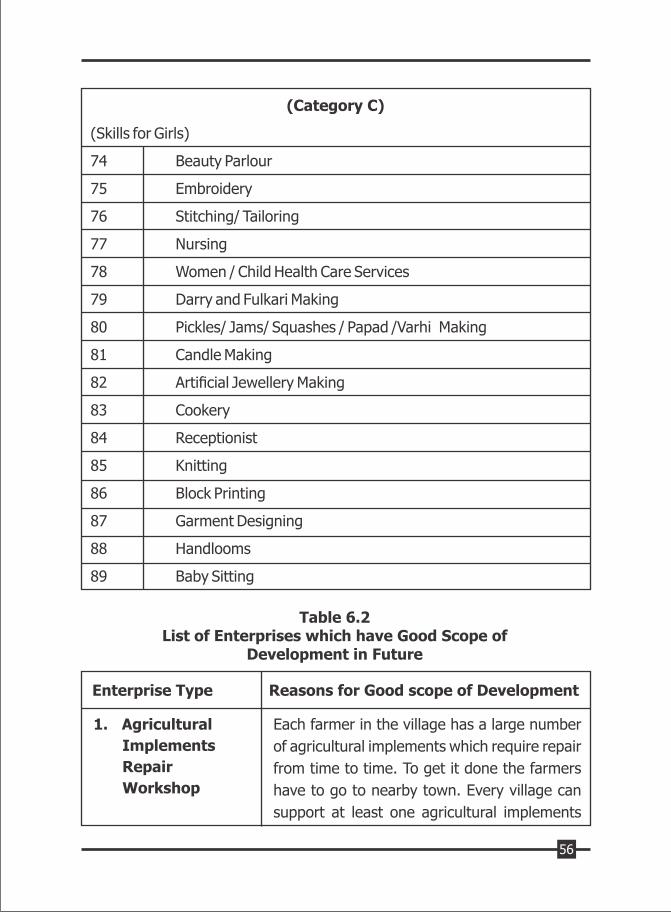
(Category C)
(Skills for Girls)
74 Beauty Parlour
75 Embroidery
76 Stitching/ Tailoring
77 Nursing
78 Women / Child Health Care Services
79 Darry and Fulkari Making
80 Pickles/ Jams/ Squashes / Papad /Varhi Making
81 Candle Making
82 Artificial Jewellery Making
83 Cookery
84 Receptionist
85 Knitting
86 Block Printing
87 Garment Designing
88 Handlooms
89 Baby Sitting
Table 6.2List of Enterprises which have Good Scope of
Development in Future
Enterprise Type Reasons for Good scope of Development
Each farmer in the village has a large number
of agricultural implements which require repair
from time to time. To get it done the farmers
have to go to nearby town. Every village can
support at least one agricultural implements
1. Agricultural
Implements
Repair
Workshop
56
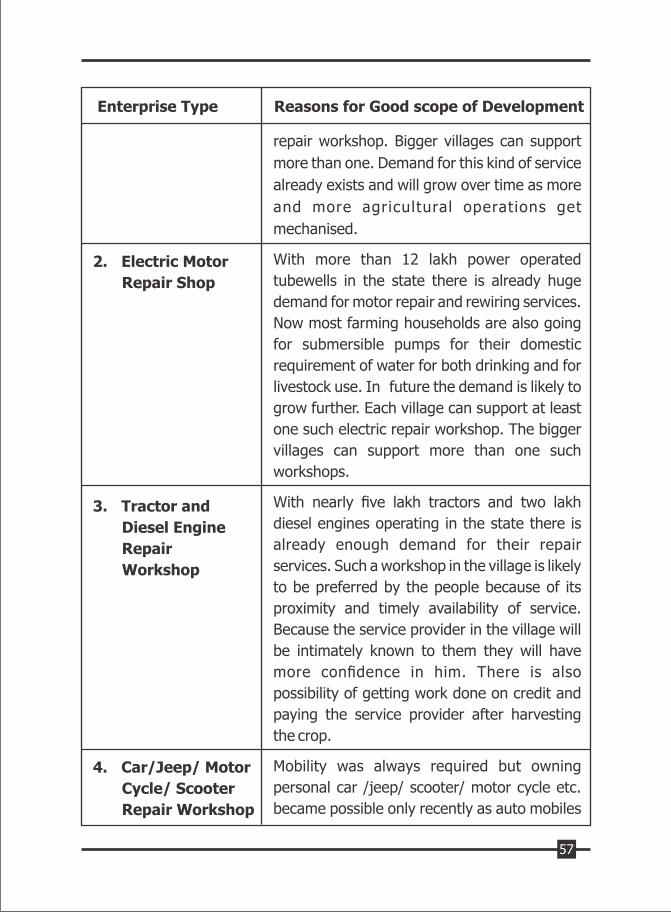
repair workshop. Bigger villages can support
more than one. Demand for this kind of service
already exists and will grow over time as more
and more agricultural operations get
mechanised.
With more than 12 lakh power operated
tubewells in the state there is already huge
demand for motor repair and rewiring services.
Now most farming households are also going
for submersible pumps for their domestic
requirement of water for both drinking and for
livestock use. In future the demand is likely to
grow further. Each village can support at least
one such electric repair workshop. The bigger
villages can support more than one such
workshops.
With nearly five lakh tractors and two lakh
diesel engines operating in the state there is
already enough demand for their repair
services. Such a workshop in the village is likely
to be preferred by the people because of its
proximity and timely availability of service.
Because the service provider in the village will
be intimately known to them they will have
more confidence in him. There is also
possibility of getting work done on credit and
paying the service provider after harvesting
the crop.
Mobility was always required but owning
personal car /jeep/ scooter/ motor cycle etc.
became possible only recently as auto mobiles
Enterprise Type Reasons for Good scope of Development
2. Electric Motor
Repair Shop
3. Tractor and
Diesel Engine
Repair
Workshop
4. Car/Jeep/ Motor
Cycle/ Scooter
Repair Workshop
57
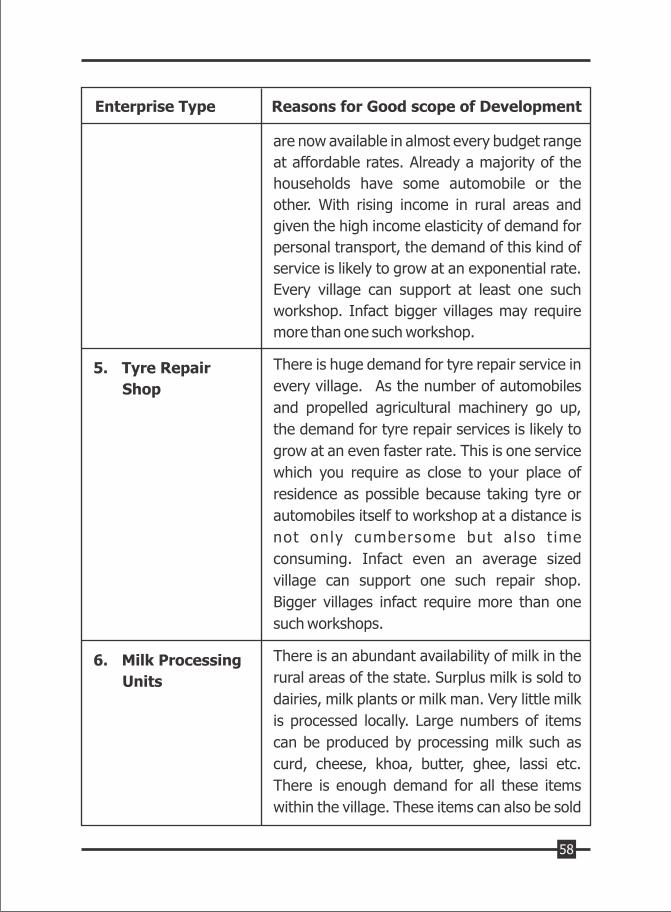
are now available in almost every budget range
at affordable rates. Already a majority of the
households have some automobile or the
other. With rising income in rural areas and
given the high income elasticity of demand for
personal transport, the demand of this kind of
service is likely to grow at an exponential rate.
Every village can support at least one such
workshop. Infact bigger villages may require
more than one such workshop.
There is huge demand for tyre repair service in
every village. As the number of automobiles
and propelled agricultural machinery go up,
the demand for tyre repair services is likely to
grow at an even faster rate. This is one service
which you require as close to your place of
residence as possible because taking tyre or
automobiles itself to workshop at a distance is
not only cumbersome but a lso t ime
consuming. Infact even an average sized
village can support one such repair shop.
Bigger villages infact require more than one
such workshops.
There is an abundant availability of milk in the
rural areas of the state. Surplus milk is sold to
dairies, milk plants or milk man. Very little milk
is processed locally. Large numbers of items
can be produced by processing milk such as
curd, cheese, khoa, butter, ghee, lassi etc.
There is enough demand for all these items
within the village. These items can also be sold
Enterprise Type Reasons for Good scope of Development
5. Tyre Repair
Shop
6. Milk Processing
Units
58
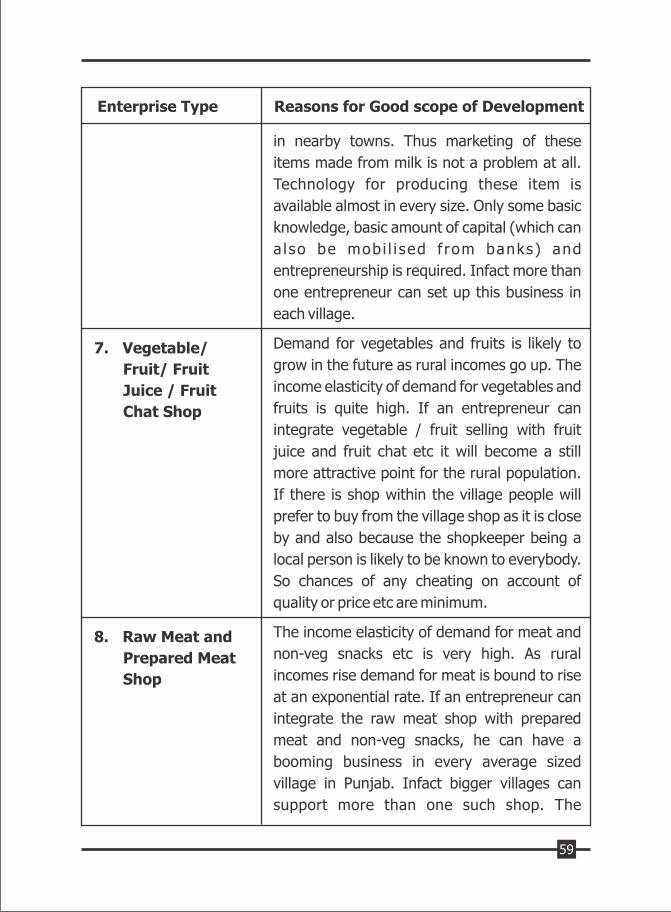
in nearby towns. Thus marketing of these
items made from milk is not a problem at all.
Technology for producing these item is
available almost in every size. Only some basic
knowledge, basic amount of capital (which can
a lso be mobi l i sed f rom banks) and
entrepreneurship is required. Infact more than
one entrepreneur can set up this business in
each village.
Demand for vegetables and fruits is likely to
grow in the future as rural incomes go up. The
income elasticity of demand for vegetables and
fruits is quite high. If an entrepreneur can
integrate vegetable / fruit selling with fruit
juice and fruit chat etc it will become a still
more attractive point for the rural population.
If there is shop within the village people will
prefer to buy from the village shop as it is close
by and also because the shopkeeper being a
local person is likely to be known to everybody.
So chances of any cheating on account of
quality or price etc are minimum.
The income elasticity of demand for meat and
non-veg snacks etc is very high. As rural
incomes rise demand for meat is bound to rise
at an exponential rate. If an entrepreneur can
integrate the raw meat shop with prepared
meat and non-veg snacks, he can have a
booming business in every average sized
village in Punjab. Infact bigger villages can
support more than one such shop. The
Enterprise Type Reasons for Good scope of Development
7. Vegetable/
Fruit/ Fruit
Juice / Fruit
Chat Shop
8. Raw Meat and
Prepared Meat
Shop
59
entrepreneur can sell raw meat during the day
and prepared meat and non-veg snacks in the
evening.
A large number of weddings and other social
functions take place in every village every year.
In each function people require a good cook/
tenting/ catering service. Every village can
support one such business in the village. Infact
bigger village can have more than one such
entrepreneur. The demand of this kind of
service will go on increasing in the future also.
With marriage palaces becoming prohibitively
costly, most people in the village would like to
have this service provided by a local man and
even get this service, at least partly, on credit
and pay after the harvesting season.
People even in the villages are becoming used
to decorating their houses on all weddings,
akhand paths, jagratas etc. and social
functions which are celebratory in nature. They
require services of light and sound. For power
back up a generator is almost a necessity. Any
enterprising young man who has some training
as electrician and who can mobilise some funds
for buying generator, lights and a reasonably
good sound system can do good business. Any
large sized village can support at least one
such business. Alternatively a cluster of two
three smaller village will be able to support
such an activity. The demand for this kind of
service is likely to increase over time.
Enterprise Type Reasons for Good scope of Development
9. Cook/ Catering/
Tenting
Business
10. Generator
lighting and DJ/
Sound service
60
Anyone who knows basics of photography and
videography and can invest some money to
buy camera etc can do a very good business in
the village. Almost on every function people
engage a photographer and get videography
done. Infact many a times you requires more
than one such person in a function to manage
the live telecast of such functions through the
internet for the benefit of those relatives and
friends (particularly NRI's) who cannot be
physically present. Enough demand for this
kind of service already exists and the demand
is likely to grow in future.
With more and more households in rural areas
using inverters and batteries as a power back-
up the demand for servicing of these
appliances is going up every day. Beside lakhs
of tractors and automobiles presently
operating in rural Punjab also use batteries
which occasionally require servicing. Thus,
each village require a battery / inverter repair
shop because every time there is a problem
taking these items to the nearby town is a
cumbersome job. Infact bigger village can
support more than one such shop.
Demand for fertilizer, insecticides, pesticides
and herbicides is likely to grow further as
farming becomes more modern. Availability of
these things in the village is likely to be
preferred by farmers of the village compared to
the shop situated 10-15 KM away from the
village in a town. The farmers may be more
Enterprise Type Reasons for Good scope of Development
11. Photography/
Videography
Shop
12. Inverter Battery
Repair Shop
13. Fertilizer and
Insecticide,
Pesticide Shop
61
assured of the quality of these items if the
supplier happens to be a local person whom
they know very well. The local shop may even
give certain items on credit to these farmers
who may be short of cash but are prepared to
pay after the harvest. This will also assure
timely availability of these things which is of
crucial importance.
Almost every home in rural areas now has a
DTH or cable connection. Whenever there is a
bad weather with strong winds and heavy rain,
these connections develop some problem or
the other. Even otherwise such a large
numbers of TV sets generate so much of repair
work. The investment and skill requirement of
this service are within the capacity of many
rural youth if they get proper training. In any
case to provide this service the person will have
to come to the sight of the connection.
Therefore, a local trained person is most
suitable for this job and can do a good
business.
More and more people in rural areas are going
for modern houses. Infact the income elasticity
of demand for modern housing is very high.
Housing requires the services of mason,
carpenter to make doors, windows and
furniture, a plumber, an electrician for electric
fitting, a person who knows stone laying and
stone polishing or tile work, painting and white
washing etc. Therefore, if a group of persons
trained in these skills get together and form a
Enterprise Type Reasons for Good scope of Development
14. Cable TV/ DTH
Service Operator
15. Construction
Related Services
62
team, there is enough work for more than one
teams in each village. Alternatively an
enterprising contractor can employ persons
well versed with these jobs and can float his
own group. In any case there is great demand
for construction related skills most of which are
now being fulfilled by non-Punjabi youth.
There is enough existing demand for iron gates
and grills. Now with wood becoming costly iron
beds and some items of furniture such as
chairs and tables are also being fabricated. The
technology is not at all complicated. If a person
knows moulding and welding and have some
capital for buying required instruments, he can
have a booming business. Infact with land
much cheaper in rural areas, setting up such
workshop in rural areas makes a much better
sense. It is not only grills and gates, if such a
work shop is set up there are a number other
items for which they will get orders. Every
village require at least one such workshop but
bigger villages can support more than one such
enterprises.
There is a big demand for private veterinary
services in the villages as each village have
hundreds of milch animals. Now more and
more people are opting for art ificial
insemination to improve quality of livestock
and milk yield. This demand is likely to grow
further in future. Each village can support a
private veterinary clinic. It does not require
Enterprise Type Reasons for Good scope of Development
16. Gates/ Grills and
Iron Bed
Fabrication
Workshop
17. Private
Veterinary
Services
63
huge capital or long complicated training. This
is one area in which thousands of jobs can be
created in rural areas.
The income elasticity of demand for pucca
houses is very high in both urban and rural
areas. Therefore, the demand for bricks is
always rising. Raw material for brick making is
available in almost every village. Presently
most of the brick kilns are located on the
periphery of urban centres where the land
prices have gone up. It makes sound economic
sense to shift some of these units to rural
areas. The additional demand for bricks is also
emerging largely from rural areas. Thus, at
least one brick kiln in the vicinity of a bigger
village and in a cluster of three four smaller
villages makes an economic sense. In any case
surplus bricks can easily be supplied to nearby
urban centre as road network in Punjab is good
and transportation of bricks should not be a
problem. Brick kiln generates a lot of
employment for unskilled and semi-skilled
labour.
A large quantity of paddy straw is produced in
Punjab. Most of this is either burnt vitiating the
environment or it is simply wasted. A numbers
of products such as card board can be
produced by using paddy straw. It can also be
used as a raw material for power generation.
Thus, collecting paddy straw and supplying it
to the power plants or using it for card board
Enterprise Type Reasons for Good scope of Development
18. Brick Kiln
19. Paddy Straw
Based Products
64
production is a business in itself. Its scientific
collection and use will not only generate
income and employment but will also save the
country side from environment pollution.
With the rise of income, people are becoming
more and more used to consuming food items
prepared outside the home. The amount of
investment required to start such an
establishment is not very large. Organisational
or managerial requirements can be learned
easily. The material used are locally available.
Only somebody has to take the initiative and
set up a shop. An average sized village in
Punjab can support at least one such shop.
Infact bigger villages can support more than
one.
Nearly cent percent households in rural areas
have mobile phones. Infact more than half of
them have more than one member owning
mobile phones. It requires data recharging for
which rural people have to go to nearby town.
From time to time these sets also require repair
and accessories. Thus, each village can have
one such shop and large villages can have
more than one. It does not require much of
capital investment. The mobile repair training
is simple and can be acquired easily.
Even in rural areas people are becoming
conscious of cleanliness. Instead of open
drainage they are using cement pipes.
Similarly for making court yards pucca instead
Enterprise Type Reasons for Good scope of Development
20. Dhaba/ Tea
Stall /Bakery
21. Mobile
Recharge/
Repair /
Accessories
Shop
22. Cement Pipes /
Inter-locking
Tiles unit
65
of brick lining they are making use of
inter locking t i les. The unit can also
manufacture flower pots. Thus, demand is
emerging for these products in rural areas.
This task does not require heavy investment or
very complicated technology. A unit producing
cement pipes and interlocking tiles can be
supported by a bigger village or a cluster of few
smaller villages. Infact, such a unit can only be
profitably set up in rural areas because space
required and requirement of water is relatively
large. Given the high land prices in urban areas
and both land and water availability being
cheap in villages, it makes a better sense to set
up such units in villages only.
There are a large number of households in
rural areas who do not cultivate any land but
they keep milch cattle. They have to buy fodder
standing in the field of cultivators. Going to the
fields daily for cutting and fetching fodder is a
cumbersome job. There is a need in every
village to have bhusa and chaffed green fodder
stall. With new technology laminated silage
bails have also become available. Any
enterprising young man can set up a stall in the
village which can sell all three i.e. bhusa, green
fodder and silage packs. An average sized
village needs at least one such stalls. This
infact will give boost to the development of
landless dairies in the state.
Meat is always in demand and the demand is
likely to grow in future as the incomes go up
Enterprise Type Reasons for Good scope of Development
23. Bhusa / Green
Fodder/ Silage
Stall
24. Poultry/ Goatry /
Piggery Units
66
because the income elasticity of demand for
meat is very high. Poultry, Goatry and Piggery
units can be set up almost anywhere in rural
areas. To be successful in these activities a
perspective entrepreneurs requires only basic
training . A three months certificate course to
manage these activities is already being
offered by PAU Ludhiana. A similar course can
also be offered by proposed Skill and
Entrepreneurial Development Centers. These
activities can generate employment and
livelihood for a large number of rural youth.
With modernisation more and more ladies in
rural areas are becoming beauty conscious.
However they cannot afford to go to nearby
towns to avail of these services. This is a
suitable profession for young women
entrepreneurs. More than one such centre can
function in every village as hair care, hair
colouring, facial, pedicure and massages etc is
in great demand these days. It will open up
avenues fo r t ra i ned young women
entrepreneurs.
Young girls in the villages can be trained in
stiching / tailoring and embroidery work. They
can then set up tailoring and embroidery
centres or can even work from their homes.
This work being flexible in nature fits well with
the daily domestic routine of rural women.
The demand for stitching and embroidery is
not only limited to the village. They can do this
work for bigger tailors/ boutique owners in
Enterprise Type Reasons for Good scope of Development
25. Hair Saloon /
Beauty Parlour
(for girls)
26. Tailoring,
Stitching and
Embroidery
Work(for girls)
67
towns and cities. Training is not very lengthy
and / or complicated. It does not require any
large capital to set up such a centre. Infact,
promoting this activity will not only provide
gainful work to rural females but it can also act
as a catalyst for women empowerment.
Yet another area suitable for women
entrepreneurs in rural areas is preparation of
jams/jelles /pickles/ paparvarhi and squashes
etc. The entrepreneur can operate from her
home and the demand is not limited to the
village only. They can do as much work as they
can, and the market of these products exist in
nearby towns as well. It does not require much
of capital. A couple of months of training can
make a prospective entrepreneur economically
independent.
Enterprise Type Reasons for Good scope of Development
27. Preparation of
Jams / Jellies/
Pickles/Papars /
Squashes
(for ladies)
68
Chapter -7
Summary of Main Findings and Policy Recommendations
Policy makers in developing countries are convinced that providing
gainful employment to every able bodied person in rural areas is the key to
poverty alleviation and for achieving prosperity in rural areas. But because of
falling land-man ratio and increasing mechanization of most farm operations,
Punjab agriculture is unable to absorb any more additional labour force. Not
only it does not absorb anymore new entrants to the labour force in rural
areas, it is, infact, shedding some of those already employed in it. The scope
of labour absorption in the state's small scale urban industry is also bleak. In
this scenario the only plausible option for the state 's growing unemployment
appears to be the development of non-farm activities in the rural areas in
which they can find gainful employment without migration to urban centres.
Under the dictates of the market forces Punjab's rural non-farm sector is
already fairly well developed. But this process has to be speeded up further to
generate additional employment for the new entrants to the labour force. For
this to happen the state has to play a pro-active role.
The Punjab State Farmers Commission initiated a study to find out:
(I) The present status of development of the rural non-farm sector in
Punjab;
(ii) To study the profile of those who are already working in the state's
rural non-farm sector;
(iii) To study the employment and income generation potential of rural
non-farm activities;
(iv) To identify skills which can be imparted to the state's unemployed/
underemployed rural youth to make them employable in the rural
non-farm sector of the state;
(v) To identify rural non-farm enterprises that have a good scope for
further development; and
69
(vi) To suggest policy measures for speeding up the growth of these
enterprises.
The present study is based on primary data collected from 660
households involved in the rural non-farm activities spread over 44 villages
taking two village from each district. 15 households whose primary activity is
in the non-farm sector were selected from each village randomly. Wherever
required we also used secondary data available from Census of India (2011),
NSS 68th Round data collected in 2011-12 on 'Employment and
Unemployment' and information thrown up by the 6th Economic Census of
Punjab conducted in 2013.
As per Census 2011 a total of 28.64 lakh workers in Punjab are
working in the rural non-farm sector. They constitute 46.35 percent of the
total rural workforce in the state. There are 8.18 lakh rural non-farm
establishments (Economic Census of Punjab, 2013) which together employ
16.98 lakh worker including owners of these establishments. The remaining
nearly 11.66 lakh workers are working on salary and/or wages in the
government sector, semi-government sector, private organised sector and
private unorganised sector. Construction (30.60%), Manufacturing (25.69%),
Trade and Repair (11.10%), Other Activities (9.60%), Transport and Storage
(6.66%), and Education (6.27) dominate the rural non-farm sector in Punjab.
Together these six activities absorb nearly 90 percent of all rural non-farm
workers.
Compared to other major states of India, Punjab stands at number
two in terms of the level of development of non-farm sector in the country.
The only other state which is ahead of Punjab in this respect is Kerala where
nearly 74 percent of its rural workforce is working in the rural non-farm sector.
The fact that Kerala is ahead of Punjab by nearly twenty percentage points in
term of the proportion of rural work force working in rural non-farm sector
indicates the possibilities of further growth of rural non-farm employment in
Punjab.
The result of our primary survey shows that 274 (41.52%)
respondents in our sample are self-employed in the RNFA's i.e. they have their
own establishments and the remaining 386 (58.48%) are working in the
70
government sector, semi-government organisations, private organised sector
or private unorganised sector. Caste wise 256 ( 38.78 %) respondents in our
sample belong to the general category, 302 (45.76%) are from scheduled
castes and the remaining 102 (15.45%) belong to backward castes. Thus
more than 61 percent of our sampled households belong to socially deprived
sections of our society. Age-wise nearly 45 percent of the sample respondents
are below 35 years of age. Another 26.21 percent are in the age group of 35-
45 years. Thus more than 71 percent of the respondents in our sample are
relatively young below 45 years of age. Education wise 6.82 percent
respondents are illiterate, Another 24.24 percent are literate but below
matric. 55 percent have completed schooling i.e. they are either matric pass
or senior secondary pass. Only 13.93 percent are graduates and above.
It is not only formal education which is important but training both
formal and informal also matters. Our study shows that only 11.67 percent
respondents in our sample had any kind of formal training before joining the
non-farm sector. Another 34.85percent had some kind of training through the
informal channels by working as apprentice with knowledgeable persons.
Thus, a majority of the workers presently working in the rural non-farm sector
of Punjab are without any kind of formal or even informal training.
Out of 660 respondents in our sample 207 (31.26%) own some land.
The percentage of those from self -employed and service category who own
land is roughly the same being 30.65 percent among the self-employed and
31.86 percent among the 'service' category. However, the poorest in terms of
landed assets are 93 (14%) households who are doing job in the un-organised
private sector mostly as personal servants with rich rural households. Infact
this section of respondents is the most deprived not only economically but
also socially and educationally as more than 81 percent of them come from
the SC/ BC background and most of them are matric or below.
To see how well employed these workers working in the rural non-
farm sector of the state are we also looked at their intensity of employment.
Our results show that on an average a worker engaged in the rural non-farm
work in Punjab works for 9.32 hours in a day and 26.67 days in a month. Thus
71
in terms of the time criterion they are fully employed and are not casual
workers.
An average household whose principal activity is in RNFA's in the
state earns Rs. 31458 per month or Rs. 377496 per annum which is certainly
more than what an efficient farmer in Punjab with 5-6 acres of land can earns.
This is despite the fact that nearly 70 percent of these households are
landless. Thus even in terms of income criterion they are decently employed
and are better off compared to the small and marginal farmers of the state.
Nearly 58 percent of the monthly household income is contributed
by the earnings of the main respondent who is working in the rural non-farm
sector. Another 16 percent household income is contributed by the earnings of
other family members. Income from land constitutes around 12 percent and
income from dairying constitutes slightly more than 5 percent of the total
household income of the RNFA participants.
An average worker working in the state's rural non-farm sector earn
Rs. 17338 per month if he is self-employed in RNFA's and Rs. 18929 if he is
doing some job in the rural non-farm sector. For the sample as a whole, this
figure works out to be Rs. 18268. However, the higher figure of the service
category is largely because of high earning of government employees who on
an average earn Rs. 27476 per month. On the lowest rung of the earnings
ladder are those working in the private sector. Those working in the private
organized sector are on an average earning Rs. 9932 per month and those
doing jobs with the private individuals as personal servant etc. earn Rs. 7014
only.
However our study also shows that the monthly earnings of the
participants in the rural non-farm activities are not independent of their
economic and social background or educational and training attainments.
Most of the top 5 percent earners in our sample hail from land owning
agriculturist high caste families with relatively higher educational
qualifications and training while 75 percent of those in the bottom quartile of
monthly earnings belong to SC/ BC category and hail from labour class
background with no or very little land ownership, with educational
qualification of matric or below and with almost no formal training. Thus their
72
capacity to earn is a function of their social and economic background and
their educational and training attainments.
An average household in our sample belonging to those working in
the rural non-farm sector of the state has more facilities in his home compared
to an average Punjab household as per Census 2011. Thus whether we look at
their monthly income or levels of living those working in the state's rural non-
farm sector are on an average better off than most agriculturalist households
in the state. And this is despite the fact that less than 12 percent of them had
any formal training before joining RNFA's. If training is imparted to them it can
substantially improve their incomes and levels of living.
On an average a non-farm enterprise in rural Punjab has capital
investment of Rs. 126344 and it employs 2.13 workers including the
entrepreneur who is running the enterprise, thus creating a job with a capital
investment of Rs. 59175 only. Thus these rural non-farm enterprises are
perhaps the least capital intensive source of job creation and therefore should
be the core of state's employment generation strategy in rural areas.
Presently 8.18 lakh rural non-farm enterprises operating in Punjab together
have invested capital of Rs. 10344 crores.
An average worker engaged in these rural non-farm enterprises of
the state makes a contribution of Rs. 136305 per annum to the State's
income. With nearly 17 lakh workers presently working in the state's rural
non-farm enterprises, the total annual contribution of these enterprises alone
to the state's NSDP works out to be more than Rs. 23000 crores. Besides this
nearly 11.60 lakh workers from state's rural work force are also engaged in
various other non-farm jobs in the government sector, semi- government
sector, organized private sector and unorganized private sector. Thus the total
contribution of rural nonfarm sector to the state's NSDP is quite substantial.
We have identified 87 skills in which training should be imparted to
make Punjab's unemployment and under employed youth employable. In the
present scenario when Punjab's organised industry in urban areas and
agriculture in rural areas is not able to absorb any more additional labour
force, training youth to make them capable of participating in the state's
73
emerging rural non-farm sector is perhaps the only option available at the
moment.
We have also identified 27 rural non-farm activities which have good
scope for development in the future. To develop these RNFA's perspective
entrepreneurs will have to be given relevant technical skills, managerial ability
and support to mobilize required amount of capital. For this to happen a
systematic policy intervention is required at the government level to
overcome this technical, managerial and financial barrier.
Recommendations for Policy Intervention
We strongly feel that a systematic policy intervention is required at the
government level. Following are some of the recommendations.
(1) The government should set up Skill and Entrepreneurial
Development Centres in each block where rural youth is imparted
training in various identified skills. After giving them basic training in
these centres they should be attached to an actual functioning
enterprise in the nearby town to get on the job training may be for a
few months. While the trainees should be given some stipend during
these 'hands on' training period the employers participating in this
apprenticeship programmes should be given some financial
incentive to accept these trainees.
(2) This skill and training programme should not only be confined to the
unemployed/underemployed rural youth or prospective rural
entrepreneurs only but it should also include the owner- operator of
existing enterprises because it is observed that most of the existing
rural entrepreneurs have started their enterprise without any formal
training. At best they have got some experience before starting
these enterprises only through informal channels. Their training will
not only help improve the quality of their product and /or service but
will also improve their earnings.
(3) The rural youth presently engaged in the state's farm sector but who
are interested in moving to the non-farm jobs and enterprises
should also be given training in the non-farm skills. For them the
74
training programme should be made flexible and dovetailed as per
their availability so that they are able to take advantage of this
programme without disrupting their present jobs. We know, in
Punjab most of the farm work is concentrated in two peaks of
relatively short duration and in between there are two lean seasons
from December to mid April and then from July to mid October. The
training for such youth should be scheduled in such a manner that in
one lean season they are given theoretical knowledge and the other
lean season is utilised for practical or hands on training. In this way,
they can be trained in these skills without disrupting their present
work schedule in the farm sector.
(4) At present most of the existing Rural Non-farm Enterprises are
running with funds provided by entrepreneur himself or herself
and/or with money borrowed from friends and/or relatives. The
share of institutional finance is almost negligible. On an average an
existing RNFA in our sample has a capital investment of Rs. 126344
only but most youth who may be interested in setting up such
enterprises may not have even this small amount of capital. The
government should intervene and make sure that any rural youth
who after getting proper training from the proposed Skill and
Entrepreneurial Development Centres is interested in setting up his
or her own enterprise gets bank loan at low interest rates with easy
repayment schedule and on the collateral of the enterprise itself.
This step will help speed up the growth of rural non-farm enterprises
both in number as well as in scale.
(5) Besides these rural Skill and Entrepreneurial Development Centres
the government should ask the associations of existing major
industries in the state to start industry specific Training Institutes.
These institutes can then give training to both rural and urban youth
in the skills required for work force in these industries. Industry
Specific Associations should be persuaded to start such institutes
under the Corporate Social Responsibility and give training and
stipends to the trainees. This will not only make the local educated
75
youth employable but will also provide trained local workforce for
the existing industries.
(6) Our study shows that more than 61 percent of those working in
Punjab's rural non-farm sector are from SC/BC background and
nearly 70 percent of them are from landless families. They are
handicapped in starting small rural non-farm enterprises not only
because of lack of training and shortage of capital but also because
they do not have required space in the village for setting up their
own enterprise. Government should come out with a policy to
provide plots at reasonable rates to such young men and women
who after getting training in the required skills may want to start the
non-farm enterprises. The common land owned by village
panchayats can be used for this purposes or government can buy
some land close to the village preferably touching the circular road
of the village, and develop it into small plots to be given to
prospective rural entrepreneurs from landless families.
Our estimate is that even if half of the identified rural enterprises
come up in each of the nearly 12000 villages of the state during the
next few years and if each one of these non-farm enterprises
generate employment for 2-3 persons, the non-farm enterprises
alone have the potential of creating several lakh jobs in the next few
years in the state. Besides a large number of skill trained rural youth
will get absorbed within the rural areas as also in nearby towns
where the demand for these skilled workers exists and is expanding
over time. In the long run the promotion of rural non-farm sector
through skill development may prove to be a turning point in
channelizing the energies of Punjab's rural youth towards
productive uses and usher in an era of economic development and
prosperity in rural Punjab.
76