Promoting Healthy Food Choices for Children
142
1 Sarah White Sydney Ganon Jonathan Mcllroy Hiroto Iwaoka A strategic analysis on how to incorporate behavioral economics into nutrition education programs UCLA Luskin School of Public Affairs MPP Applied Policy Project Word Count: 12,236 Promoting Healthy Food Choices for Children
-
Upload
khangminh22 -
Category
Documents
-
view
2 -
download
0
Transcript of Promoting Healthy Food Choices for Children

1
Sarah White Sydney Ganon
Jonathan Mcllroy Hiroto Iwaoka
A strategic analysis on how to
incorporate behavioral economics
into nutrition education programs
UCLA Luskin School of Public Affairs
MPP Applied Policy Project
Word Count: 12,236
Promoting Healthy
Food Choices for Children

2
Table of Contents
Acknowledgements ······························································ 5
Executive Summary ······························································· 6
Chapter 1. The Client and the Problem ···································· 8
1-1. Client
1-2. Importance of Common Threads Mission
1-3. Schools as an Intervention Location
1-4. Limitation of Current Nutrition Education
Chapter 2. Policy Options ······················································ 18
2-1. Strict Paternalism
2-2. Conditional Incentives
2-3. Behavioral Economics
2-4. Policy Options for Evaluation
Chapter 3. Policy Evaluation Criteria ······································ 27
Chapter 4. Evaluation of Policy Options ··································· 30
4-1. Effect Size
4-2. Duration of Effect
4-3. Net Behavior Change
4-4. Cost
4-5. Cost Effectiveness

3
4-6. Political Feasibility
4-7. Policy Option Evaluation Summary
Chapter 5. Sensitivity Analysis ················································· 63
5-1. Weighting
5-2. Political Feasibility
5-3. Cost-Effectiveness
5-4. Continuous Point Values
Chapter 6. Policy Recommendations and Implementation Strategies
··························································································· 69
6-1. Bundled Interventions
6-2. Monitoring and Evaluation
Chapter 7. Policy Implications ················································ 77
Glossary ··············································································· 82
Bibliography ········································································· 86
Appendix ············································································ 94

4
This report was prepared in partial fulfillment of the requirements for the Master in Public Policy
degree in the Department of Public Policy at the University of California, Los Angeles. It was
prepared at the direction of the Department and of Common Threads as a policy client. The
views expressed herein are those of the authors and not necessarily those of the Department, the
UCLA Luskin School of Public Affairs, UCLA as a whole, or the client.

5
Acknowledgements
Our team would like to take this opportunity to thank the following:
● The Luskin Center for Innovation for its generous support of our research
● Our advisor, Dr. Manisha Shah
● Dr. Anya Samek and Dr. Neile Edens for their continued partnership
● Professors DeShazo, Phillips, Reber, Stoll, and Yin for their guidance and feedback
throughout the project
● Common Threads staff, including James Bell, Nekosi Nelson, and Stephanie Folkens,
for their continued assistance and provision of resources to complete this project
6
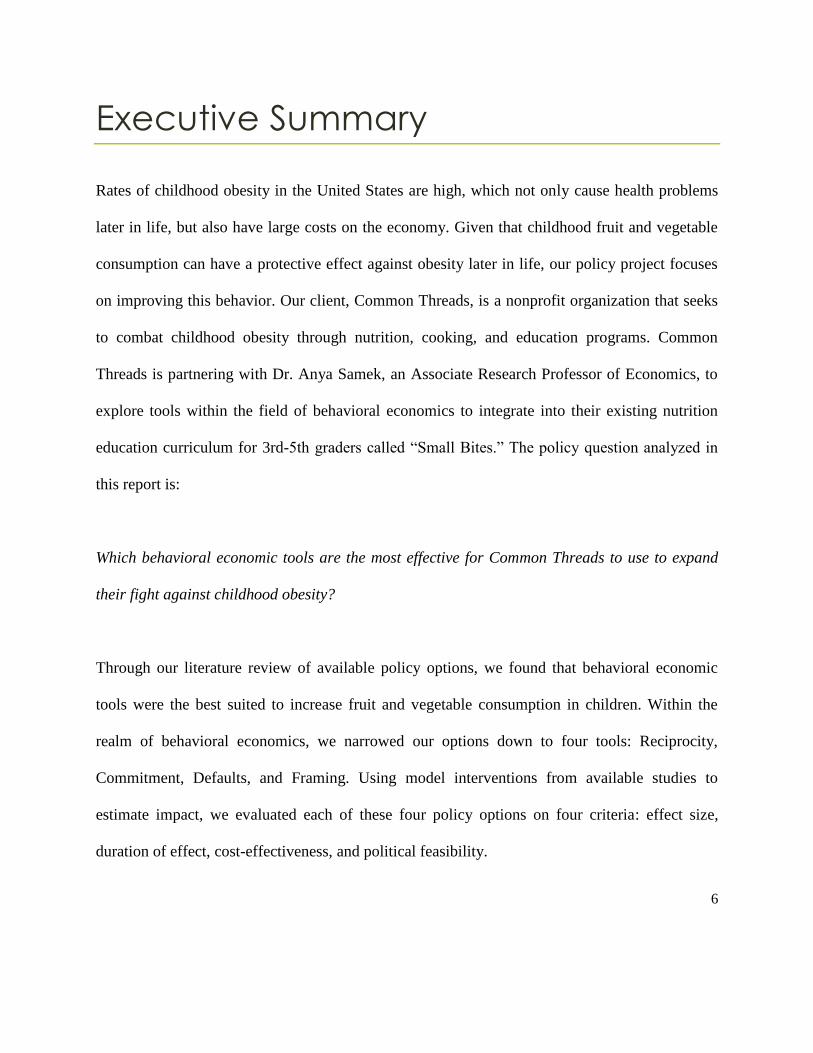
Executive Summary
Rates of childhood obesity in the United States are high, which not only cause health problems
later in life, but also have large costs on the economy. Given that childhood fruit and vegetable
consumption can have a protective effect against obesity later in life, our policy project focuses
on improving this behavior. Our client, Common Threads, is a nonprofit organization that seeks
to combat childhood obesity through nutrition, cooking, and education programs. Common
Threads is partnering with Dr. Anya Samek, an Associate Research Professor of Economics, to
explore tools within the field of behavioral economics to integrate into their existing nutrition
education curriculum for 3rd-5th graders called “Small Bites.” The policy question analyzed in
this report is:
Which behavioral economic tools are the most effective for Common Threads to use to expand
their fight against childhood obesity?
Through our literature review of available policy options, we found that behavioral economic
tools were the best suited to increase fruit and vegetable consumption in children. Within the
realm of behavioral economics, we narrowed our options down to four tools: Reciprocity,
Commitment, Defaults, and Framing. Using model interventions from available studies to
estimate impact, we evaluated each of these four policy options on four criteria: effect size,
duration of effect, cost-effectiveness, and political feasibility.
7
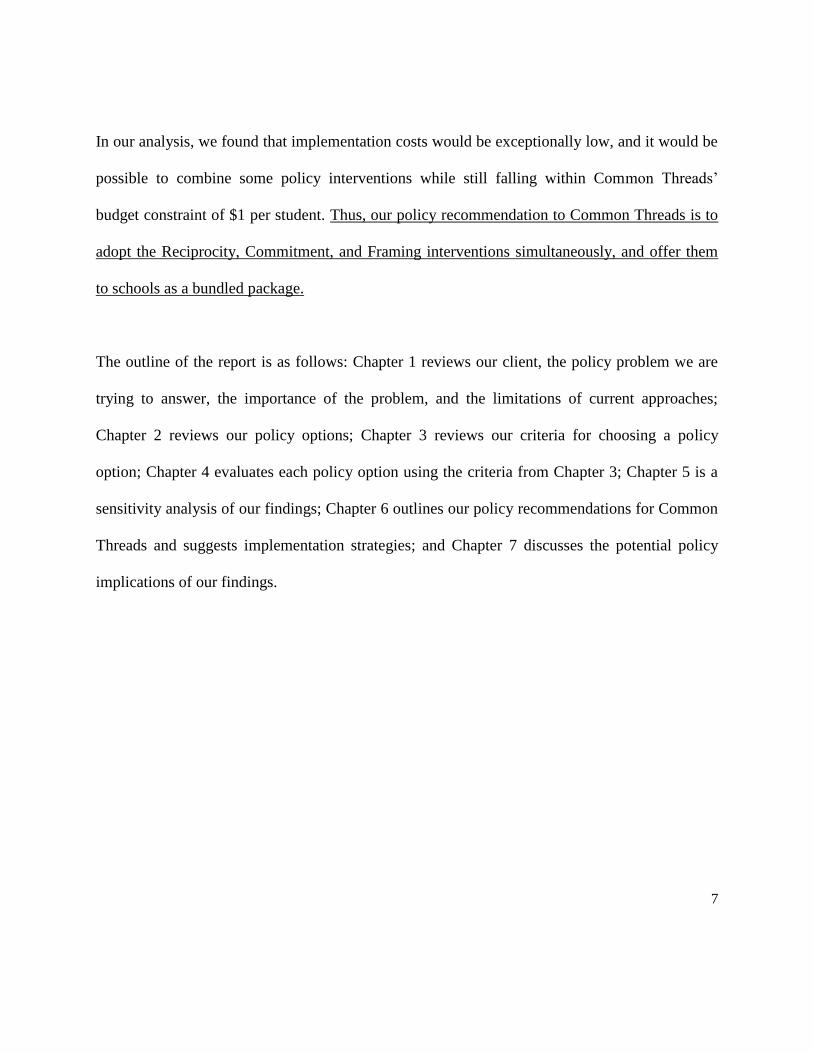
In our analysis, we found that implementation costs would be exceptionally low, and it would be
possible to combine some policy interventions while still falling within Common Threads’
budget constraint of $1 per student. Thus, our policy recommendation to Common Threads is to
adopt the Reciprocity, Commitment, and Framing interventions simultaneously, and offer them
to schools as a bundled package.
The outline of the report is as follows: Chapter 1 reviews our client, the policy problem we are
trying to answer, the importance of the problem, and the limitations of current approaches;
Chapter 2 reviews our policy options; Chapter 3 reviews our criteria for choosing a policy
option; Chapter 4 evaluates each policy option using the criteria from Chapter 3; Chapter 5 is a
sensitivity analysis of our findings; Chapter 6 outlines our policy recommendations for Common
Threads and suggests implementation strategies; and Chapter 7 discusses the potential policy
implications of our findings.

8
Chapter 1
The Client and the Problem

9
In this chapter, we discuss our client, the importance of their mission, and the limitations of
current nutrition education programs in combating obesity.
1-1. Client
Our client is Common Threads, a 501(c)(3) nonprofit organization that uses nutrition and
cooking programs to develop children’s love of eating to prevent obesity. Common Threads
currently serves over 113 schools and works in five cities: Chicago, Los Angeles, Miami, New
York City, and Washington, D.C. Their programs target low-income, urban schools and work to
empower children to make healthy choices both in school and at home. Common Threads is
Common Core aligned, making it easier for schools to partner with them and provide nutrition
education. Current programs offered by Common Threads include in-classroom nutrition lessons,
after-school programs, teacher education, and parent-focused programs.
Common Threads is working to find ways to increase healthy eating behaviors in Small Bites,
one of its nutrition programs for 3rd-5th grade students. The organization is currently examining
how behavioral economic tools can impact behavior change in students. Behavioral economics is
an economic analytic technique used to explain how individuals make decisions which draws
concepts from several fields, including psychology and habit formation. Common Threads is
partnered with Dr. Anya Samek, an Associate Research Professor of Economics at the University
of Southern California, who has conducted previous studies using behavioral economic tools that

10
found positive effects on children’s eating habits.1 ,2
Given the success of her research, the
partnership is optimistic that adding behavioral economic tools to the program will help
Common Threads in its mission to prevent childhood obesity.
In addition to examining behavioral economic tools within the Common Threads curriculum, our
own conversations with staff revealed the nonprofit’s interest in expanding its offerings to new
cities, schools, and the broader community. Given this interest, we partnered with Common
Threads and Dr. Samek to investigate which behavioral economic tools would be both effective
at changing eating behaviors in children and easily implemented in schools.
With this in mind, our policy question is: Which behavioral economic tools are the most
effective for Common Threads to use to expand their fight against childhood obesity?
1-2. Importance of Common Threads Mission
Today, 38% of adults in the US are obese3 and another 33% are overweight, with statistically
significant differences between ethnicities. For example, there are higher rates of childhood
obesity for Hispanics (21.9%) and non-Hispanic blacks (19.5%) compared to non-Hispanic
1 Anya S. Samek, “Gifts and Goals: Behavioral Nudges to Improve Child Food Choice at School” (CESR-Schaeffer
working paper no. 2016-007, 2016), doi:10.2139/ssrn.2729579. 2 John A. List and Anya S. Samek, “The Behavioralist as Nutritionist: Leveraging Behavioral Economics to Improve
Child Food Choice and Consumption,” Journal of Health Economics 39 (2015): 135-146,
doi:10.1016/j.jhealeco.2014.11.002. 3 The CDC defines obesity using Body Mass Index, or BMI, which is based on a weight to height ratio and does not
directly measure body fat.

11
whites (14.7%).4 In addition, 17% of children and adolescents aged 2-19 years old are obese.
5
That percentage is higher among adolescents (20.5% of 12-19 year olds) compared to young
children (8.9% of 2-5 year olds). Obese children are more likely to be obese in adulthood and to
be exposed to the health risks associated with obesity.6
Reducing obesity in children is incredibly important because of the comorbidities, or diseases
associated with obesity. Comorbidities include but are not limited to: hypertension, cholesterol
problems, type II diabetes, heart disease, stroke, and mental illness.7 There are also social
stigmas surrounding obesity, which could have negative psychological impacts on obese
children.8 Not only does obesity have serious consequences for an individual’s health, it harms
the U.S. economy with lower job productivity and higher medical and human capital costs.9 In
2008, estimated medical costs of obesity were $147 billion, and the annual productivity costs of
obesity-related absenteeism was $3.38 billion.10
Common Threads and similar providers of
nutrition education play an integral part in helping reduce childhood obesity and later adult
obesity.
4 “Prevalence of Obesity Among Adults and Youth: United States, 2011–2014,” Centers for Disease Control and
Prevention (CDC),” last modified October 28, 2015, https://www.cdc.gov/nchs/data/databriefs/db219.htm. 5 Ibid.
6 S.S. Guo and W. C. Chumlea, “Tracking of Body Mass Index in Children in Relation to Overweight in Adulthood,”
American Journal of Clinical Nutrition 70 (1999): 145S–8S. 7 “Clinical Guidelines on the Identification, Evaluation, and Treatment of Overweight and Obesity in Adults: The
Evidence Report,” NIH Obesity Education Initiative, National Heart, Lung, and Blood Institute. NIH Publication 98,
no. 4083 (September 1998). 8 R.M. Puhl and J.D. Latner, “Stigma, Obesity, and the Health of the Nation's Children,” Psychological Bulletin 133,
no. 4 (July 2007): 557-580, doi:10.1037/0033-2909.133.4.557. 9 Ross A. Hammond and Ruth Levine, “The Economic Impact of Obesity in the United States,” Diabetes, Metabolic
Syndrome and Obesity: Targets and Therapy 3 (2010): 285-295, doi:10.2147/DMSOTT.S7384. 10
“Prevalence of Obesity Among Adults and Youth: United States, 2011-2014.”

12
1-3. Schools as an Intervention Location
When considering the relevance of behavior change on obesity, research has found that
consumption of fruits and vegetables during childhood is inversely associated with metabolic
syndrome (obesity’s comorbidities, such as diabetes, hypertension, blood pressure) as an adult,
even after taking into account adult vegetable consumption.11
Increasing intake of fruits and
vegetables as a child could have a protective effect against obesity.12
Thus one of the most
effective ways to prevent adult onset obesity is to increase fruit and vegetable consumption of
children.
Schools are the primary location of intervention efforts for children, as students spend nearly half
of their day at school. Children consume on average 35% of their food at school, and this
increases to nearly half for students who participate in the National School Lunch Program.13
Thus, schools are opportune places to influence student health outcomes. However, they are not
maximized, despite the attention it received in the last decade with the Healthy, Hunger-Free
Kids Act (2010).
11
P. Jaaskelainen et al., “Childhood Nutrition in Predicting Metabolic Syndrome in Adults: the Cardiovascular Risk
in Young Finns Study,” Diabetes Care 35, no. 9 (2012): 1937-1943, doi:10.2337/dc12-0019. 12
Ibid. 13
Claire K. Berezowitz, Andrea B. Bontrager Yoder, and Dale A. Schoeller, "School Gardens Enhance Academic
Performance and Dietary Outcomes in Children," Journal of School Health 85, no. 8 (2015): 508-518,
doi:10.1111/josh.12278.

13
1-4. Limitation of Current Nutrition Education
Current traditional nutrition education efforts in public schools are not effective methods for
changing the eating behaviors of students and improving health outcomes. This is especially true
given the budget necessary to implement meaningful programs. Across the country 68% of states,
including California, require public schools to offer nutrition education as part of general health
instruction for elementary schools.14
While the Healthy, Hunger-Free Kids Act requires all
schools to have a wellness policy for their students, it does not specifically require nutrition
education.15
In order to discover the impact and limitations of current nutrition education programs, we
conducted a literature review of various nutrition studies. Our extensive review included:
● A review of 49 randomized control trial or quasi-experimental studies that Dudley et al.
(2015)16
identified in their meta-study, and
● Eight additional studies that met the same criteria as the initial study.17
For each study, we calculated a standardized effect size commonly used in the literature, Cohen’s
d, which is defined by the following equation:
𝑑 = 𝑥�̅� − 𝑥𝑐̅̅̅
𝑆𝐷𝑝𝑜𝑜𝑙𝑒𝑑
14
“Nutrition Education,” National Association of State Boards of Education (NASBE), State School Health Policy
Database, last modified June 3, 2013, http://www.nasbe.org/healthy_schools/hs/bytopics.php?topicid=1150. 15
United States, An Act to Reauthorize Child Nutrition Programs, and for Other Purposes: The Healthy, Hunger-
Free Kids Act, Washington, DC: GPO, 2010. 16
Dean A. Dudley, Wayne G. Cotton, and Louisa R. Peralta, "Teaching Approaches and Strategies that Promote
Healthy Eating in Primary School Children: a Systematic Review and Meta-Analysis," International Journal of
Behavioral Nutrition and Physical Activity 12, no. 1 (2015), doi:10.1186/s12966-015-0182-8. 17
While these studies are not explicitly cited in this paper, they are listed in the bibliography for reference.

14
where 𝑥�̅� is the mean of the treatment group, 𝑥�̅� is the mean of the control group, forming a
difference of means 𝑆𝐷𝑝𝑜𝑜𝑙𝑒𝑑 is the pooled standard deviation of the treatment and control
conditions. Although the studies we analyzed did not always report these exact values, other
Cohen’s d equations allowed us to use reported t-statistics or standard errors.
Calculating a standardized effect size allowed us to compare studies’ different outcomes and thus
allowed us to compare across interventions. This measure is a commonly reported effect size due
to its simplicity and comparability; effect sizes calculate the number of standard deviations of the
study sample and can be standardized across samples. For example, no common definition of a
“serving” of fruit or vegetable exists, and those values often vary by the type of fruit or vegetable
consumed. When a study reports that 1.5 additional servings were consumed, on average, and the
standard deviation of the treatment and control group are both .90, the Cohen’s d is 1.67. Other
studies reported results in the mass of food consumed, the volume consumed, or the number of
items taken; because these aren’t directly comparable, a standardized effect size is necessary.
The relative magnitude of Cohen’s d effect sizes must be compared to other studies in the same
field. Often, these are then assigned qualitative values such as “high,” “medium,” and “low.” In
the field of education meta-analysis, the recommended cutoff for a high effect size is .40;
interventions above this threshold are deemed to be in the “zone of desired effects.”18
In the field
of nutrition and public health, the cutoffs vary; however, many studies use similar cutoff
18
John Hattie, Visible Learning: A Synthesis of Over 800 Meta-Analyses Relating to Achievement (London:
Routledge, 2009).

15
points,19
while others consider large effect sizes to be greater than .8020
or .70.21
After calculating Cohen’s d for each of these studies, we found that the average impact of
nutrition education on knowledge was 0.59, while the average standardized effect size on
consumption was only 0.31, as seen in Figure 1.22
It should also be noted that these studies
examined carefully designed educational interventions in a controlled, experimental setting, and
thus might not be representative of nutrition education broadly.
Figure 1: Average Effect Sizes of Traditional Nutrition Education Programs
19
Lenny R. Vartanian, Marlene B. Schwartz, and Kelly D. Brownell, “Effects of Soft Drink Consumption on
Nutrition and Health: A Systematic Review and Meta-Analysis,” American Journal of Public Health 97, no. 4
(2007): 667–675, doi:10.2105/ajph.2005.083782. 20
Rik Crutzen, “Adding Effect Sizes to a Systematic Review on Interventions for Promoting Physical Activity
Among European Teenagers,” International Journal of Behavioral Nutrition and Physical Activity 7, no. 1 (2010):
7-29, doi: 10.1186/1479-5868-7-29. 21
N. Santesso et al., "Effects of Higher- versus Lower-Protein Diets on Health Outcomes: A Systematic Review and
Meta-Analysis," European Journal of Clinical Nutrition 66, no. 7 (2012): 780-788, doi:10.1038/ejcn.2012.37. 22
Cohen’s d is calculated for studies included in Dudley et al. (2015) up through May 2014, as well as studies
published after May 2014 selected through similar methodology.

16
Using John Hattie’s cutoff effect size of d>0.4023
, we conclude that while traditional nutrition
education has substantial effects on knowledge, it does not have equivalent effects on
consumption. Given the importance of actualizing healthy eating habits, not merely knowing
what is healthy, this is not reassuring.24
There is little evidence of an enduring effect of either the increase in knowledge or consumption
from nutrition education, despite frequently long periods of intervention. The treatment durations
of the included studies ranged from two weeks to six years, with an average duration of nearly 29
weeks. However, the majority of studies did not conduct a long-term follow-up, and we cannot
determine the duration of the effects post-treatment. From our review of the literature on existing
nutrition education efforts, we found that there are positive effects on improving knowledge, but
not substantive impacts on fruit and vegetable consumption, and neither of these effects are
proven to be long lasting.
In light of this discouraging evidence, it is necessary for school staff, nutrition program
developers like Common Threads, and other stakeholders to examine the options available to
bolster these outcomes during a child’s developmental years. While Common Threads’ programs
tackle multiple sides of the issue — from parents to students to teacher education — much of the
programming is still done in the form of traditional nutrition education: an instructor teaches a
23
John Hattie, Visible Learning. 24
We also looked solely at outcomes that studies indicated had statistically significant effects. For the statistically
significant outcomes, the Cohen’s d for knowledge, positive attitude towards healthy choices, and consumption are
0.69, 0.47, and 0.38 respectively. Although this method increases the average calculated effect sizes, it is likely an
overestimate for typical nutrition education interventions, as it selectively eliminates interventions that have effects
not statistically significant different from zero.

17
lesson, the students absorb information, and then they do an activity. This method is well
received by schools, students, and the communities in which Common Threads works, and also
has been proven to have substantive effects on students’ knowledge (Cohen’s d>0.40). However,
Common Threads’ recent internal data show that it’s own programs are not effective at changing
healthy behaviors.25
This is the problem Common Threads wishes to address moving forward.
Given that the traditional nutrition education is not effective, what tools could and should be
utilized to create behavior change in students? Common Threads has a budget constraint of $1
per student to integrate new tools into their Small Bites curriculum. Limited financial resources
and constrained classroom time make finding cost-effective, durable solutions a difficult, yet
necessary task.
25
From UCLA APP Team internal calculations of confidential data. (Fall 2016). Common Threads. “Common
Threads SY1516 SB Final Matched Data USC APP.” This data uses self-reported measures of consumption, which
are less reliable than the direct observations of consumption used in the literature and would likely be subject to
reporting bias.

18
Chapter 2
Policy Options

19
Our initial analysis established the ineffectiveness of current nutrition education in creating
durable changes in healthy food consumption. This chapter identifies two alternative types of
interventions, strict paternalism and conditional (financial) incentives, and explains why we
chose to examine interventions in the realm of behavioral economics.
2-1. Strict Paternalism
One method schools have previously used to advance students’ health is a strictly paternalistic
approach - restricting access to unhealthy foods or eliminating them altogether. However, this
conflicts with Common Threads’ mission, and the power to set school- or district-wide policy is
outside its control. These interventions are politically contentious and have a varied history, such
as LA Unified School District’s recent decision to un-ban chocolate milk to decrease food
waste.26
Although a district can require that every student be served a healthy option, they cannot
force children to consume the food, which leads to waste. Nationally, 42% of vegetables and
22% of fruit is thrown away as plate waste.27
Finally, school-based restrictions may not have a
net impact on health if students can substitute snacks. For example, studies on eliminating
vending machines from schools have found evidence that eliminating soda had no effect,28
or
potentially even increased overall soda consumption.29
For these reasons, we eliminated strict
26
Anna M. Phillips, “The Drought is Over at L.A. Schools. For Chocolate Milk, Anyway,” Los Angeles Times,
October 18, 2016, http://www.latimes.com/local/education/la-me-edu-chocolate-milk-20161018-snap-story.html. 27
Jean C. Buzby and Joanne F. Guthrie, “Plate Waste in School Nutrition Programs: Final Report to Congress,”
Economic Research Service/USDA. E-FAN-02-009 (March 2002). 28
Jason M. Fletcher, David Frisvold, and Nathan Tefft, “Taxing Soft Drinks And Restricting Access To Vending
Machines To Curb Child Obesity,” Health Affairs 29, no. 5 (2010): 1059-1066, doi:10.1377/hlthaff.2009.0725. 29
Daniel R. Taber et al., "How State Taxes and Policies Targeting Soda Consumption Modify the Association
20
paternalism as an option for Common Threads.
2-2. Conditional Incentives
Direct conditional incentives are used to subsidize healthy decisions and assume that subjects
will respond rationally to these concrete, tangible payoffs. The simplest example would be to pay
children for eating more fruits and vegetables. These interventions, while potentially effective in
the short-term,30,31
encounter difficulties in implementation. First, they are expensive to run,
given the costs of the incentives and monitoring participant behavior.32
Second, these
interventions may negatively affect internal motivation, tying the habit to the incentive and thus
undermining an individual’s intrinsic interest when the incentive ends.33 , 34
Finally, these
interventions are infeasible to implement and monitor outside of a controlled setting, such as the
choices made by students after school. These types of interventions also do not fall within the
scope of our client’s services. Considering the above discussion, we also eliminated this option
for Common Threads.
Between School Vending Machines and Student Dietary Behaviors: A Cross-Sectional Analysis," PLoS ONE 9, no.
8 (2014), doi:10.1371/journal.pone.0098249. 30
Edward L. Deci, Richard Koestner, and Richard M. Ryan, “A Meta-Analytic Review of Experiments Examining
the Effects of Extrinsic Rewards on Intrinsic Motivation,” Psychological Bulletin 125, no. 6 (1999): 627-668,
doi:10.1037//0033-2909.125.6.627. 31
David R. Just and Joseph Price, “Using Incentives to Encourage Healthy Eating in Children,” Journal of Human
Resources 48, no. 4 (2013): 855–872, doi:10.1353/jhr.2013.0029. 32
Ibid. 33
Deci et al., “A Meta-Analytic Review.” 34
Judy Cameron and W. David Pierce, “Reinforcement, Reward, and Intrinsic Motivation: A Meta-Analysis,”
Review of Educational Research 64, no. 3 (1994): 363-423, doi:10.2307/1170677.

21
2-3. Behavioral Economics
In light of the limitations of the aforementioned approaches, we turn to the field of behavioral
economics. Our analysis relies on the assumption that health and nutrition habits are malleable
and can be influenced by external factors. That is, consumption behaviors are not fixed,
exogenous variables but are, in fact, endogenously determined based on a series of factors.
Therefore, manipulating these factors can improve eating habits and subsequently important
health outcomes. This model suggests that a more permanent effect on eating behavior or
consumption is indeed possible and surely desirable.
One mechanism through which behavior change of consumption can occur is taste exposure.
Birch and Marlin (1982)35
and, recently, Wardle et al. (2003)36
find that children learn to like and
consume more of a food they had more exposure to. These findings suggest that interventions
that directly encourage consumption, even in the short term, may have an enduring effect beyond
positive reactions driven solely by knowledge gleaned through classroom education.
Furthermore, literature on habit formation in nutrition as well as across fields suggests that
targeted and sustained interventions on changing actions can have a continued effect even after
the intervention has ended.37,38,39
These considerations indicate the need to look towards policy
35
Lean L. Birch and Diane W. Marlin, “I Don't Like It; I Never Tried It: Effects of Exposure on Two-Year-Old
Children's Food Preferences,” Appetite 3, no. 4 (1982): 353-360, doi:10.1016/S0195-6663(82)80053-6. 36
Jane Wardle et al., “Modifying Children's Food Preferences: the Effects of Exposure and Reward on Acceptance
of an Unfamiliar Vegetable,” European Journal of Clinical Nutrition 57, no. 2 (2003): 341-8,
doi:10.1038/sj.ejcn.1601541. 37
George Loewenstein, Troyen Brennan, and Kevin G. Volpp, “Asymmetric Paternalism to Improve Health
Behaviors,” JAMA 298, no. 20 (2007): 2415-2417, doi:10.1001/jama.298.20.2415. 38
Laura McGowan et al., “Healthy Feeding Habits: Efficacy Results From a Cluster-Randomized, Controlled

22
alternatives that incorporate these factors. Given the vastness of this field, and the lack of a
specific taxonomy for interventions, we distinguished between two broad types of interventions:
choice architecture and internal behavioral tools.
First, we classified interventions aimed at changing the settings of choice as “choice
architecture.”40
We distinguished these interventions as those that do not aim to change the
internal decision mechanisms of a student, but instead design a setting or context that favorably
leverages pre-existing beliefs or habits. These include interventions such as framing, defaults,
and feedback.41,42
These interventions usually are effective in changing consumption and have
high cost-efficiency and external validity, but may not align with our client’s mission nor easily
extend to settings outside of the manipulated context. For example, studies that modify school
lunchroom or cafeteria layouts have proven to be highly effective in promoting healthy food
consumption,43,44
but do not have an effect once the student leaves the manipulated environment.
Second, we categorized interventions that aim to change a student’s specific preferences or
mental processes as “internal behavioral tools.” These tools attempt to induce behavior change
Exploratory Trial of a Novel, Habit-Based Intervention with Parents,” American Journal of Clinical Nutrition 98, no.
3 (September 2013): 769-777, doi: 10.3945/ajcn.112.052159. 39
Reshmaan Hussam et al., “Habit Formation and Rational Addiction: A Field Experiment in Handwashing”
(working paper, Yale University, November 10, 2016),
http://media.wix.com/ugd/b51e74_d9113402644647ccbafbae1500276c3c.pdf. 40
Richard H. Thaler and Cass R. Sunstein, Nudge: Improving Decisions About Health, Wealth, and Happiness
(New York, NY: Penguin Books, 2009). 41
Thaler and Sunstein, Nudge. 42
See Table 1 in Appendix A for more details. 43
David R. Just and Brian Wansink, “Smarter Lunchrooms: Using Behavioral Economics to Improve Meal
Selection.” Choices 24, no. 3 (2009), doi:10.1016/j.jneb.2014.04.261. 44
H. Ensaff et al., “Food Choice Architecture: An Intervention in a Secondary School and its Impact on Students’
Plant-based Food Choices,” Nutrients 7, no. 6 (2015): 4426-4437, doi:10.3390/nu7064426.

23
and habit formation directly and can be assigned to one of six categories, including Reciprocity
and Commitment.45,46
A growing number of studies and meta-analyses describe the success of
these interventions in general, as well as identify those that are the most effective.47,48,49
By
manipulating the behaviors and internal processes of students, these interventions prove to have
positive effects on consumption of healthy foods. These are also highly cost-effective, often
requiring few additional resources or staff; are easy to reproduce; and align with our client’s
mission and programs. Currently, the primary topic for research in this field pertains to the
duration of effects and whether or not they engender long-term habit formation. As previously
mentioned, given the newness of this field and the perpetual difficulty in long-term follow up
studies, duration remains an elusive factor. Our initial findings from the literature show mixed
durations for behavior change at three and six months post-treatment. However, these lingering
effects are generally larger than those measured for traditional nutrition education, and may
extend beyond the setting of a school cafeteria.
45
Based on Cialdini’s “Weapons of Influence.” Robert B. Cialdini, Influence: The Psychology of Persuasion (New
York, NY: Collins, 2007). 46
See Table 2 in Appendix A for more details. 47
Samek, “Gifts and Goals.” 48
Alice S. Ammerman, “The Efficacy of Behavioral Interventions to Modify Dietary Fat and Fruit and Vegetable
Intake: A Review of the Evidence,” Journal of Preventative Medicine 35, no. 1 (2002): 25-41,
doi:10.1006/pmed.2002.1028. 49
Cynthia A. Thomson and Jennifer Ravia, “A Systematic Review of Behavioral Interventions to Promote Intake of
Fruit and Vegetables,” Journal of the American Dietetic Association 111, no. 10 (2011): 1523-1535,
doi:10.1016/j.jada.2011.07.013.

24
2-4. Policy Options for Evaluation
We assessed each of the choice architecture and internal behavioral tools and narrowed our scope
to four policy options that we evaluate in depth in Chapter 4. For more detail on the selection
process of our policy options, see Table 3 in Appendix A. Our policy options are: Reciprocity
and Commitment (internal behavioral tools), and Defaults and Framing (choice architecture).
1. RECIPROCITY50
Reciprocity involves exchanging something with another in which both people benefit.
The type of reciprocity intervention we will be evaluating is known as “unconditional
incentives.” This strategy involves the teacher handing out a sticker to each student
before lunch and saying, “Thank you for making the healthier choice today.” The
incentive is unconditional as each student receives a sticker regardless of whether they
choose to eat healthy or not. However, reciprocity theory leads us to believe that in
exchange for receiving the sticker, students will feel a sense of obligation in response and
choose to eat healthy.
2. COMMITMENT51
Commitment theory states that people are more likely to follow through with something
that is aligned with internal beliefs or goals. The type of commitment intervention we
will be evaluating is known as “goal setting.” This strategy involves each student writing
50
Cialdini, Influence: The Psychology of Persuasion. 51
Ibid.

25
down a goal related to consuming fruits and vegetables, as part of the Common Threads
curriculum. When the students leave for lunch, they will be more inclined to choose
healthier foods because they have written a goal, and therefore committed to that goal.
3. DEFAULTS52
Defaults involve making the default option the healthier food. While there are many
restrictions on which foods can be provided in the cafeteria, schools have some flexibility
in changing the way foods are offered or displayed. The default intervention we will be
evaluating is the default entree or side being the healthier option and the unhealthier
option not on display. When students are in line for their meal, they will automatically be
handed a healthy meal and will only receive the less healthy option if they ask to change
it. As most people tend to accept the default option, we expect an increased in healthy
food consumption.
4. FRAMING53
Framing involves changing the presentation to encourage a desired behavior. Common
Threads’ curriculum is offered in school, so the cafeteria would be “framed” in a way to
encourage children to choose healthier foods. This intervention would rename the fruits
and vegetables to be fun and more appealing to children. For example, replacing “carrots”
52
Thaler and Sunstein, Nudge. 53
Ibid.

26
with “X-ray vision carrots.”54
Changing the presentation of the food, in conjunction with
the Common Threads nutrition program, may push the effect size of consumption of
fruits and vegetables over our 0.4 Cohen’s d threshold.
54
Brian Wansink, Brian, David R. Just, Collin R. Payne, and Matthew Z. Klinger, “Attractive Names Sustain
Increased Vegetable Intake in Schools,” Journal of Preventative Medicine 55 (July 2012): 330-332,
doi:10.1016/j.ypmed.2012.07.012

27
Chapter 3
Policy Evaluation Criteria

28
Any policy option should not only have substantive effect sizes for changing consumption, but
also be feasible for Common Threads to implement given its role providing nutrition education
to schools. Therefore, in order to evaluate policy interventions for Common Threads, we
employed four criteria: effect size, duration of effect, cost-effectiveness, and political feasibility.
For reasons explained further in Chapter 4, political feasibility is weighted most important, then
cost-effectiveness (effect size included in this), and duration weighted least important in
evaluating our policy options.
1. EFFECT SIZE
Effect size will help us determine the size and significance of fruit and vegetable
consumption change that occurs under each policy intervention. Similar to our analysis of
traditional nutrition education, this is quantified using Cohen’s d to standardize effect size.
Again, we consider a value of 0.40 to be a medium-to-large outcome worthy of
consideration.55
2. DURATION OF EFFECT
For duration, we note the longevity of the behavior change. Although it is rare to find long-
term follow up in a study, we look for the length of time before which no statistically
significant differences are observed between the treatment and control groups. We are also
mindful of any potential crowding out effects, where outcomes may return to lower than pre-
intervention levels post-intervention. Unfortunately, duration is unavailable for a majority of
55
Based on Hattie’s “Zone of Desired Effect.” Hattie, Visible Learning.

29
the studies listed. For this criterion, we thus rely on broader theories of duration of effect for
each intervention.
3. COST-EFFECTIVENESS
For cost-effectiveness, we compare the effects on consumption against the monetary value of
the intervention. Although few studies list precise costs, these costs are inferred through
stated intervention techniques, required teacher time, and other tangible inputs.
4. POLITICAL FEASIBILITY
Under political feasibility, we explore stakeholder feedback from those who might have a say
in implementation. Feedback from students, families, teachers, school administrators, and
other parties could affect adoption of certain interventions. This measure of feasibility also
includes the relative ease with which Common Threads could reproduce and monitor the
program at new sites. If either the studied population or the particular implementation
procedure is not representative or easily duplicated, an intervention will score poorly.
30
Chapter 4
Evaluation of Policy Options

31
In this chapter, we evaluate our four policy alternatives: Reciprocity, Commitment, Defaults, and
Framing.
In order to evaluate the policy options, we chose a model intervention that represented the most
replicable and effective program for each of the four intervention types. These archetypal
interventions were drawn from literature as well as our discussions with researchers. With a
specific intervention in mind, we are thus able to more accurately gauge effect size, duration,
costs, and political feasibility.
4-1. Effect Size
Schools can be studied at different levels: the school level, the classroom level, and the
individual student level. These levels are nested within each other, and thus studies focused on
schools involve multi-level designs. In most cases, studies involving school students employ a
cluster randomized design, in which groups of students, either a whole school or a whole
classroom, are assigned to treatment and control. It is important to note that in these multi-level
models, a different effect size for our policy options can be calculated for each different level.56
In our survey of literature, we identified studies with one, two, and three levels of nesting.
However, because most of these studies did not report the necessary statistics to calculate a
single type of effect size comparable across all of the studies, we were limited to reporting effect
sizes of different types (effect sizes at the individual, classroom, and school level). This is a
56
Larry V. Hedges, “Effect Sizes in Nested Designs,” The Handbook of Research Synthesis and Meta-Analysis, eds.
Harry Cooper, Larry V. Hedges, and Jeffrey C. Valentine (New York: Russell Sage Foundation, 2009), 337-353.

32
limitation of our literature review, because in order to compare effect sizes across studies, the
same type of effect size must be used.57
Ignoring these multi-level structures in meta-analyses may substantially underestimate standard
errors and deviations and thus overestimate effect sizes, especially when treatment and control
groups differ in the number of students per classroom or classrooms per school.58
Therefore, in
calculating effect sizes for the various archetypal studies in our four options, we attempted to
select the same type of effect size that ignores these levels in order to compare them.
The remainder of the criteria analysis section will continue to report treatment effects as the
standardized Cohen’s d for the purpose of comparisons. However, these effect sizes are often
unintuitive. In the Policy Recommendation section, these effect sizes will be translated into the
outcome variable units initially reported in the studies for ease of interpretation.
4-1-1. Internal Behavioral Tools
To calculate the effects of the internal behavioral tools, we used data from Samek’s Gifts and
Goals.59
This study is our model treatment for both Commitment and Reciprocity. The study
uses a multisite cluster randomized trial, for which individual classrooms within a school are
randomly assigned to one of two treatment conditions or control. The dependent variable of
57
Ibid. 58
Ibid. 59
Samek, “Gifts and Goals.”

33
interest is milk choice, where the healthy option is to choose white milk and the unhealthy option
is to choose chocolate milk or no milk at all. These choices are aggregated at the classroom level
to calculate differences in the percent of students choosing the healthy option over the unhealthy
option. Results are measured at the classroom aggregate level, and not by the individual student.
The study’s population ranges from K-6, thus falling just above and just below the initial grade
level we are targeting in our intervention and well within the population that Common Threads
works with in its programs. The study population includes 1,483 children divided among 90
classrooms in 8 schools.
In the reported results of the study for the Reciprocity treatment, in which students are given a
sticker before lunch thanking them for making a healthy decision, 15% more students in the
average classroom chose white milk. In the Commitment treatment, where students were asked
to set a goal for a milk choice, there was a 10% increase of students in the class who chose white
milk, controlling for grade level. These findings were statistically significant at the .1 and .05
levels, respectively.
Multi-Level Modeling of Effect Size
Because of the nested structure of the study, effect sizes are more difficult to calculate. However,
if we ignore this structure and calculate Cohen’s d as we did in our literature review, we arrive at
naïve estimates of 0.75 for Reciprocity and 0.47 for Commitment. Although both are likely
overestimates, these are still well above the thresholds for large education effects and between
medium and large nutritional effects, and are more comparable to the other studies cited for

34
Framing and Defaults.
Reciprocity and Commitment HLM Effect Sizes
To compare these outcomes to other research which acknowledges the correct, nested structure
of the data, we calculate the appropriate standardized effect sizes of .574 and .410 for
Reciprocity and Commitment, respectively.60
These effect sizes are slightly smaller than the
estimates in the unnested model, but still in the zone of desired effects, and should represent
more accurate estimates. However, because our estimates for Framing and Defaults do not
account for this nested data, and we do not have the raw data to accurately incorporate that
structure, the simple, non-HLM model is likely more reliable for comparison.
4-1-2. Choice Architecture Tools
To estimate expected effect sizes for Framing and Defaults, we first reviewed literature to find a
study that was: (1) most similar to our archetypal intervention, (2) studied in a controlled
research setting, and (3) reported the information necessary to calculate effect size.
Defaults
Under the Healthy, Hunger-Free Kids Act (2010), school lunches are required to include a fruit
or vegetable serving in order to qualify for federal reimbursement as part of the National School
60
See Appendix B for the full Hierarchical Level Model.

35
Lunch Program.61
Previously, students could choose among multiple options to comprise a fully
reimbursable meal and not have to necessarily choose a fruit or vegetable. This change in policy
allows us to approximate the effect of a default: students received a fruit or vegetable, but can
opt out of its consumption by throwing it away. The research is mixed on the program’s effect on
consumption and waste.62,63
Schwartz et al. (2015) find different results for fruits and vegetables
in a study of middle school students: fruit choice increased and consumption among those
choosing fruit remained constant, while vegetable choice decreased but consumption among
those choosing vegetables increased.64
In a more isolated examination of defaults on their own in
an elementary school that opted into the fruit and vegetable requirement before the other aspects
of the new Act’s requirements took effect, the proportion of students that ate at least one serving
of fruits or vegetables increased by 8 percentage points.65
This yields a very large effect size of
1.18. However, given the null results in the same study’s cross-district comparison, as well as
other studies’ lack of significant or substantial findings, this effect size may be considered an
overestimate, or upper limit for true effect size. The mandated serving for a fruit and vegetable
leads to a considerably higher proportion of students taking a serving, even if they’re not eating
it. It is thus unlikely that, given the option to switch to a different item, the same number of
61
Cynthia Long, Updated Offer versus Serve Guidance for the National School Lunch Program and School
Breakfast Program in School Year 2013-2014. Memorandum SP 45-2013, United States Department of Agriculture,
Food and Nutrition Service (June 2013). 62
Andrew S. Hanks et al., “Healthy Convenience: Nudging Students Toward Healthier Choices in the Lunchroom,”
Journal of Public Health (Oxf) 34, no. 3 (August 2012): 370-376, doi:10.1093/pubmed/fds003. 63
David R. Just and Joseph Price, “Default Options, Incentives and Food Choices: Evidence from Elementary-
School Children,” Public Health Nutrition 16, no. 12 (December 2013): 2281-2288,
doi:10.1017/S1368980013001468. 64
Marlene Schwartz et al., “New School Meal Regulations Increase Fruit Consumption and Do Not Increase Total
Plate Waste,” Journal of Child Obesity 11, no. 3 (June 2015): 242-7, doi:10.1089/chi.2015.0019. 65
Just and Price, “Default Options.”

36
students will take a fruit or vegetable.
Framing
The study used for Framing is by Wansink et al.66
The researchers conducted two studies on the
effects of giving vegetables attractive names on consumption. In the first study, consumption of
carrots that were named “X-ray vision carrots” were compared to carrots simply called “food of
the day.” Students ages 8-11 ate 6.6, or 140% more attractively named carrots than plainly
named carrots. This study uses the same target student population and setting as our policy
recommendations, and thus will likely reflect the effect size of our intervention. From the
reported differences in means and standard deviations, we calculated the effect size for this
difference as 0.547, a large effect.
Total Effect
The effect sizes presented in this section, summarized in Table 1, represent the expected change
for an average individual in a single meal, during or immediately following the treatment or
intervention.
66
Brian Wansink et al., “Attractive Names Sustain Increased Vegetable Intake in Schools,” Journal of Preventative
Medicine 55 (July 2012): 330-332, doi:10.1016/j.ypmed.2012.07.012.

37
Table 1: Intervention Effect Sizes
Intervention Effect Size (Cohen’s d)
Reciprocity (simple) 0.75
Reciprocity (HLM) 0.574
Commitment (simple) 0.47
Commitment (HLM) 0.410
Defaults 1.18
Framing 0.547
Because the policy options presented here represent on-going efforts, either through the eight
weeks of the Small Bites curriculum or through sustained changes to the cafeteria and lunch lines,
we can consider the total effect of the program to include all meals over the course of
intervention. Thus, for a typical eight week lesson timeline, we can expect approximately 40
school lunches are consumed by a typical student.
It is certainly feasible that the novelty of each intervention will wear off from the initial peak.
However, in the studies cited for the choice architecture interventions, post-treatment results are
recorded over a span of days following the transition to the new intervention. Similarly, our
internal behavioral tool interventions include an active reminder by the teacher, the gift-given, or
an on-going, weekly food log where students can remind themselves of their goals. At present,
the permanence of these effect sizes across the span of treatment remain indeterminate, but there
is little evidence to suggest that certain interventions will differ dramatically from their initial
effect sizes after the first week. Therefore, when determining the total effect, or the cumulative

38
amount of additional fruits and vegetables consumed, we can be reasonably justified in
considering the effect size similar for each of the interventions, if not stable, across the eight
week time span. Nevertheless, for the purposes of comparison, both the single instance effect
size and the eight week total effect are proportionally similar, and the analysis does not rely on
selecting one over the other.
4-2. Duration of Effect
As mentioned in Chapter 2, duration of effect represents the longevity of behavior change. We
examined previous research on each policy option and judged whether there was evidence of
longevity of effect. One way to conduct this evaluation would be to use a quantitative method,
establishing the effect-size declination formula for each policy option and estimating the time for
the effect-size to become zero. This was the first method by which we tried to estimate duration.
However, because there are very few studies that report long-term follow-up data and even fewer
that target child nutrition habits, there were significant validity issues in estimating a solid
declination formula of duration for each option using current literature. We share our results
using this quantitative evaluation in Appendix C for further discussion, but ultimately decided to
use a simpler theoretical approach and evaluate each option’s duration of effect on a scale of
“High,” “Medium,” or “Low” duration of effect. This did not completely solve all of our issues
with the lack of literature, but was the best option given the current literature and data. Due to the
aforementioned problems, duration was weighted the least when we reviewed our policy options
for recommendation. The studies we use to investigate the duration of effect can be found in

39
Tables 1-4 of Appendix C.
Reciprocity
Brock et al. (2014) investigated how clinician’s clinical efforts increased by giving them a one-
time conditional or unconditional incentive. The results show that the effect of unconditional
incentives declines sharply after the intervention and becomes zero about nine weeks after
finishing the intervention. This implies that we cannot expect a long duration of effect for
Reciprocity. It should be noted that the study’s subjects are adults and there is therefore an
external validity problem.67
Considering that a student’s reciprocal action to an unconditional
incentive from a teacher is driven by the same sense of “fairness equilibrium”68
as adults, it
makes sense that the duration of effect does not last long after the intervention, absent the
imbalance of fairness. Therefore, we found the potential duration of effect for Reciprocity was
“Low.”
Commitment
For Commitment we used Raju et al. (2010),69
which examined the effect of incentives, goals,
and competition on elementary and secondary school students’ healthy food choices. The results
showed that the effect of goal setting lasts not only for the short-term, but also for the long-term.
67
Michelle J. Brock, Andreas Lange, and Kenneth L. Leonard, “Giving and Promising Gifts: Experimental
Evidence on Reciprocity from the Field” (working paper, European Bank for Reconstruction and Development,
February 2014), http://kangur.uek.krakow.pl/bibl_ae_zasoby/siec_lokalna/Ebor/w165.pdf. 68
Matthew Rabin, “Incorporating Fairness into Game Theory and Economics,” American Economics Review 83
(1993): 1281–1302, http://www.jstor.org/stable/2117561. 69
Sekar Raju, Priyali Rajagopal, and Timothy J. Gilbride, “Marketing Healthful Eating to Children: The
Effectiveness of Incentives, Pledges, and Competitions,” Journal of Marketing 74, no. 3 (May 2010): 93-106,
doi:10.1509/jmkg.74.3.93.

40
The treatment effect dropped by 66% the first week after treatment but the effect remained at
56% the original level even 10 weeks post-treatment. The result shows the contrast between the
sharp drop right after treatment and the very slight drop afterwards. This aligns with our findings
on habit formation theory. The study’s subjects, treatment, and outcome variables are quite
similar to our policy option, so it is reasonable to suggest that we can apply this result to the
duration of effect. However, we should note that the follow-up data was taken 10 weeks after
intervention, so we do not have evidence that the effect will last beyond this time. Therefore, we
found the potential duration of effect for Commitment was “Medium.”
Defaults and Framing
For Defaults and Framing, we did not find individual studies for each option with post-
intervention follow-up, so used one study exploring both Defaults and Framing to construct our
duration model.70
Defaults and Framing have an advantage over Commitment and Reciprocity
for potential duration of effect. This advantage comes from the low operational costs of Defaults
and Framing. They require very low costs once the tools are implemented, with little long-term
maintenance. Therefore, when we implement programs using these options, we do not have to
restrict the length of the program — we can use the intervention as long as it is effective. For
example, once we set the default choice of the school lunch menu, no additional costs will be
required to maintain the change. This advantage leads us to believe that Defaults and Framing
has higher potential to create long-term effects considering their long-run interventions.
70
Ensaff et al., “Food Choice Architecture.”

41
There is also research that shows choice architecture’s potential duration of effect. Ensaff et al.
(2015)71
investigated how improving choice architecture in a cafeteria increased students’
healthy food purchases. This study’s subjects, treatment, and outcome variables are quite similar
to our policy options. In this study, the treatment effect at three weeks post-intervention was 41%
the original effect size. Since the results show that the effect remained even without the treatment,
it is not unrealistic to think that the effect would be higher if the treatment continued.
Though these interventions do not have a time limit, the effect size of the program would not be
constant. It is reasonable to assume that students’ responsiveness to the program would decline
as time goes on, so the effect size will also gradually decline. Based on our interview with one of
the leading choice architecture experts,72
the decrease in effect size is fast. This is especially true
for Framing because the unique names of fruits and vegetables quickly lose their attraction if
names aren’t changed within certain time periods (within several weeks).
Based on these factors, we found the potential duration of effect for Defaults was “High” and
Framing was “Medium.” A summary of our duration findings is below (Table 2).
71
Ibid. 72
David R. Just (Cornell Center for Behavioral Economics in Child Nutrition Programs), interview by Jonathan
McIlroy, February 1, 2017.

42
Table 2: Duration of Effect Evaluation Summary
Policy Option Evaluation
Reciprocity Low
Commitment Medium
Default High
Framing Medium
4-3. Net Behavior Change
Effect size and potential duration of effect are two sides of the same coin when it comes to
evaluating the total impact of each policy option on children’s habits. Though students frequently
eat fruit and vegetables right after a program ends, if they stop eating them soon after, the total
impact of the program on students’ behavior change is quite small. As discussed previously,
habit formation and taste exposure theories reveal that when students repeat a healthy choice for
a longer time period, the potential to form a healthy food habit increases.73,74,75
Hence, we decided to create a new concept, Net Behavior Change (“NBC”), by combining the
effect size and duration of effect to evaluate each policy option from the perspective of total
behavior change induced by the interventions. In this section, we investigate the potential NBC
for each option by reviewing each intervention’s effect size and duration of effect. We first tried
to calculate NBC quantitatively by taking the integral of the formula of duration of effect, but, as
73
Wardle et al., “Modifying Children's Food Preferences.” 74
McGowan et al., “Healthy Feeding Habits.” 75
Hussam et al., “Habit Formation and Rational Addiction.”

43
mentioned previously, there were validity concerns about the formula of duration of effect.76
Instead, we relied on a simpler evaluation of NBC.
The results of the effect size and the duration analysis implied that Defaults had the highest
potential NBC. Reciprocity had the second highest effect size, but no evidence of the duration of
effect, so its potential NBC was “Medium.” Commitment and Framing both had medium effect
sizes as well as medium duration of effect, so their potential NBC was also “Medium” (See
Table 3).
Table 3: Potential Net Behavior Change Evaluation Summary
Policy Option Effect Size Duration Potential NBC
Reciprocity 0.75 Low Medium
Commitment 0.47 Medium Medium
Default 1.18 High High
Framing 0.547 Medium Medium
4-4. Costs
The marginal costs of implementing any of these tools on top of the Small Bites curriculum are
integral in helping Common Threads choose between policy options. For the purposes of this
analysis, we will be using the $1 per student target as the budget constraint, as provided to us by
Common Threads’ Director of Research and Evaluations. Costs include physical costs as well as
76
See Appendix D for further discussion and our theoretical calculations of NBC.

44
cost of time for Common Threads staff, cafeteria workers, teachers, and administrators to train or
implement the intervention.77
We calculated costs for both Common Threads and the school for the 8-week Small Bites
curriculum. The costs to Common Threads is important because our client would like to know
which behavioral tool is cheapest but also has a large impact on fruits and vegetable
consumption. The costs to the school are important to calculate as costs are considered the
primary barrier to implementing a tool inside the school. Table 4 shows the additional costs of
each policy option on top of the Small Bites curriculum at the student, classroom, and school
levels.
It should be noted that we are using the composition of the average elementary school in LA
Unified School District to understand costs and impacts of each policy option. That is, an
elementary school serving grades K-5 with 22 total classrooms and a 1:24 teacher to student
ratio.78
77
To see the costs used to estimate cost of time, please see Table 1 in Appendix E. To see the breakdown of costs
for each behavioral tool, please see Tables 2-5 in Appendix E. Opportunity costs have not been included in this
analysis, as there are many different outside options teachers could pursue instead of the behavioral tools and it is
nearly impossible to estimate the opportunity cost for all. 78
For the full school model, please see Table 6 in Appendix E.

45
Table 4: Summary of Costs at Each Level 79,80,81,82,83
School Costs Common Threads Costs
Reciprocity
Per Student $0.75 $0.27
Per Classroom $18.00 $6.56
Per School $396.00 $144.32
Commitment
Per Student $0.90 $0.23
Per Classroom $21.60 $5.40
Per School $475.20 $118.80
Defaults
Per Student $0.25 $0.05
Per Classroom $6.04 $1.13
Per School $132.85 $25.00
Framing
Per Student $0.48 $0.05
Per Classroom $11.50 $1.13
Per School $252.85 $25.00
4-5. Cost-Effectiveness
All of the policy options fall below Common Threads’ budget constraint of $1 per student. While
we calculated costs and determined the effect size of each policy option, doing a cost-
79
Staffing costs estimated from: "Los Angeles Unified School District: Personnel Commission July 1, 2016
Classified Salary Schedule," Los Angeles Unified School District (“LA Unified”), July 1, 2016,
http://achieve.lausd.net/cms/lib08/CA01000043/Centricity/Domain/356/July%201%202016%20-
%20Salary%20Schedule%20020617.pdf. 80
Teachers costs estimated from: Thomas Himes, "LAUSD Educators Typically Earned $75,504 Last Year," LA
Daily News, March 23, 2015, http://www.dailynews.com/social-affairs/20150321/lausd-educators-typically-earned-
75504-last-year. 81
Client costs estimated from James Bell (Common Threads Program Manager), interview by Sydney R. Ganon,
February 23, 2017. 82
Sticker estimates from: "TREND Sticker Assortment Pack, Super Stars and Smiles, 738 pk," Walmart.com,
accessed January 25, 2017, https://www.walmart.com/ip/Trend-Enterprises-Sticker-Pad-Super-Stars-and-Smiles-
Assorted-Colors-738-Stickers-per-Pack/14879090. 83
Printing costs from: "Copies and Documents," Staples.com, accessed February 9, 2017,
http://www.staples.com/sbd/content/copyandprint/copiesanddocuments.html.

46
effectiveness analysis allowed us to directly compare each policy option by impact per dollar.
The outcome we compared is the percent increase in student consumption of the healthy choice
compared to control groups (Table 5). To estimate this outcome, we used the same intervention
models that were used to determine effect size.
Table 5: Cost-Effectiveness84
Intervention Treatment Effect Cost CE Ratio
Reciprocity 67.6 -51.8= 15.8 $6.56 2.4 per dollar
Commitment 61.8-51.8 = 10 $5.40 1.85 per dollar
Defaults 27.9-20.4 = 7.5 $1.13 6.63 per dollar
Framing 11.3-6.8 = 4.5 $1.13 3.98 per dollar
There are limitations to this cost-effectiveness analysis. First, we needed a model for each
intervention, and given the lack of literature on this topic, we had at most 1-2 studies that were
similar enough to our proposed interventions. Each intervention measured the percent impact of
the behavioral tool, but length and time of each intervention varied and that difference could
have an impact on the size of the effect. Second, not all outcomes are exactly the same. For
example, the model intervention for Reciprocity and Commitment measured milk choice and
Framing measured vegetable choice. However, we broadened our outcome to choosing a healthy
option over an unhealthy option so that we could compare between options. These limitations
84
Both percentage points and our costs are calculated at the classroom level, and therefore the cost-effectiveness
ratio can be interpreted as percentage point increase in healthy food consumption per dollar spent on a classroom.

47
should be kept in mind when weighing this criterion for each intervention. We consider this
further in Chapter 5: Sensitivity Analysis.
4-6. Political Feasibility
To understand the political feasibility of our interventions we conducted interviews with Los
Angeles Unified School District (LA Unified) administrators, LA Unified elementary school
teachers, and teachers who use the current Common Threads curriculum. We also analyzed LA
Unified food and curriculum policies and observed a Common Threads lesson. In addition, we
observed an elementary school cafeteria/kitchen set-up, spoke with a Food Services Manager,
and looked at the costs that might be imposed on the school itself. Below we examine the general
categories of internal behavioral tools and choice architecture, then divide those categories by
our interventions: Reciprocity, Commitment, Defaults, and Framing. The marginal costs per
school are in Table 6.
Table 6: Marginal Costs per School by Policy Option
Cost per School Points
Reciprocity $396.00 2
Commitment $475.20 1
Defaults $132.85 4
Framing $252.85 3

48
4-6-1. Internal Behavioral Tools
We found that there are multiple levels of stakeholders when considering whether or not to
implement internal behavioral tools (Figure 2). Within LA Unified, it is the district’s
responsibility to work with nonprofits to offer nutrition education programs and the school’s
responsibility to provide nutrition materials to all grade levels that align with California’s core
curriculum standards.85
In addition to ensuring materials are provided to all grade levels, it is the
school’s responsibility to incorporate the idea that cafeterias are places of learning86
and to
provide nutrition education consistent with the USDA’s Dietary Guidelines and MyPlate87
plan.88
In tandem, the school district should incentivize teachers to provide appropriate nutrition
education that is focused on behavior change.89
Once the school provides the materials, it is the
responsibility of the classroom teacher to implement the nutrition education into the school day.
85
“Food and Nutrition Policy Motion Implementation Plan Appendix A,” Los Angeles Unified School District
(“LA Unified”) (2012),
http://achieve.lausd.net/cms/lib08/CA01000043/Centricity/Domain/126/Food%20and%20Nutrition%20Policy%20
Motion-Implementation%20Plan%20Appendix%20A%2011.9.12.pdf. 86
Ibid. 87
The updated version of the Food Pyramid, see Figure 4 in the Political Feasibility Summary section. 88
“Blueprint for Wellness: Healthy Choices for Lifelong Health, the LAUSD Health and Wellness Policy,” Los
Angeles Unified School District (“LA Unified”) (January 2016),
http://achieve.lausd.net/cms/lib08/CA01000043/Centricity/domain/453/files/Blueprint%20for%20Wellness%20Aug
%202014%20FINAL.pdf. 89
“Food and Nutrition Policy Motion Implementation Plan.”

49
Figure 2: Stakeholders for Implementing Internal Behavioral Tools
Based on the current LA Unified nutrition education policies described above, our proposed
internal behavioral tools would be a good fit for elementary schools. Both Commitment (goal-
setting) and Reciprocity (thanking students for making a healthy choice with a sticker) use the
idea that the cafeteria is a place of learning. Common Threads’ basic nutrition lessons are aligned
to California’s Common Core state standards and also utilize the USDA Dietary Guidelines and
MyPlate concept within its curriculum. In addition, as shown in the effect and duration
evaluations, both Reciprocity and Commitment are focused on behavior change, albeit with
varying levels of effectiveness.
The primary challenge for teachers would be fitting lessons in with all of the other requirements
of the school day. One teacher stated that she does twenty minutes of preparation work and one
hour of teaching nutrition education monthly. How much time a lesson would take would be a
LA Unified
School District
School Site
Administration
Classroom Teacher

50
large factor in creating teacher buy-in for a nutrition intervention. Some differences arise
between the two internal behavioral tools within classroom teacher preferences and costs to the
school.
Reciprocity: Thank You Sticker
Our interviews found that elementary school teachers were quite willing to try thank you stickers
as part of a nutrition intervention. All teachers and administrators we interviewed said stickers
are frequently used with students and work well at any age (even up through high school). As for
time, we estimate that the marginal time this intervention would take on top of the curriculum is
five minutes, slightly less than the Commitment option. With this consideration, teachers are
likely to favor this option more highly than Commitment.
Interviews with administrators found that principals would not have an issue if teachers wanted
to teach the curriculum in their own classrooms, but in order for it to be a school-wide
intervention the curriculum would have to align with state required curriculum. Administrators
also looked favorably on the idea of positive reinforcement for students.90
One assistant principal
shared that his school had used wristbands and stickers in the past to remind students of goals
and it helped demonstrate solidarity within the students. He believed that stickers for health
would work similarly.91
Reciprocity would also cost a school $79.20 less than Commitment
which may lead to a slight preference for this option by school administrators.
90
M.G. (School Administrator), interview by Sydney Ganon, February 16, 2017 and A.O. (School Administrator),
interview by Sydney Ganon, February 21, 2017, interviews #2 and #3 (Appendix F). 91
A.O., interview.

51
Commitment: Goal-Setting
Our interviews found that elementary school teachers were willing to try goal-setting in their
nutrition education and some were even very enthusiastic about the idea, having seen it work
well in other settings.92,93,94
One teacher who currently teaches the Common Threads’ Small
Bites curriculum suggested goal setting would work very well with the homework she currently
does. She also suggested that the parents frequently review students’ homework, so it could be
good way to engage entire families.95
As for time, we estimate that the marginal time this
intervention would take on top of the traditional curriculum is 15 minutes, which is slightly more
than the Reciprocity option but not substantially. With this consideration, teachers are likely to
favor this option less highly than Reciprocity.
Interviews with administrators found that principals and other site leadership would not have an
issue if teachers wanted to teach the curriculum in their own classrooms, but in order for it to be
a school-wide intervention the curriculum would have to align with state required curriculum. In
general, administrators wanted teachers to use curricula they believed in and were favorable to
the idea of using goal sheets to influence healthy eating behaviors.96,97
One assistant principal we
spoke with believed that goal-setting would be a beneficial addition to his school’s current
92
S. S. (Elementary School Teacher), interview by Sarah M. White, February 19, 2017. 93
M.V. (Elementary School Teacher), interview by Sarah M. White, February 14, 2017, interview #1 (Appendix F). 94
J. B. (Elementary School Teacher), interview by Hiroto Iwaoka, February 27, 2017. 95
M.S. (Elementary School Teacher), interview by Sydney R. Ganon, February 23, 2017. 96
M.G., interview. 97
A.O., interview.

52
nutrition lessons.98
However, Commitment would cost a school site $79.20 more than
Reciprocity which may lead to a slight preference for Reciprocity by school administrators.
4-6-2. Choice Architecture Tools
We found there were multiple levels of stakeholders when considering whether or not to
implement choice architecture tools. In addition to the school district and school site
responsibilities enumerated above, these interventions would most heavily involve the Food
Services Division of LA Unified (Figure 3).
Figure 3: Stakeholders for Implementing Choice Architecture Tools
In LA Unified, it is the Food Services Division’s (“FSD”) responsibility to manage menu
presentation and display (including signage) as well as to train all Food Services staff about meal
programs with specific training on how to educate children about their food choices. It also falls
98
Ibid.
LA Unified
School District
Food Services
Division
School Site
Administration

53
to this department to identify ways to increase the number of students choosing a full and
complete meal each day. LA Unified policy states that FSD should actively facilitate input from
parents, students, teachers, non-profits, and involve students in developing and marketing menus.
FSD should also incorporate the idea that cafeterias are places of learning, using appropriate
signage and display materials.99
Based on LA Unified policies, the Food Services Division would be an integral part of
implementing choice architecture tools in the cafeteria. With this in mind, we consider the
political feasibility of our two choice architecture tools (Defaults and Framing) below.
Defaults: Defaulting to the Healthy Choice
Based on our review of LA Unified’s policies, Defaults are the least politically feasible option to
implement in schools. While this option aligns with the idea that schools should focus on
behavior change, it does not align with the way that school food is currently offered. In order to
qualify for federal reimbursement for the Free and Reduced Lunch Program, a meal must meet
USDA nutritional standards. Each meal must have three items from the following categories:
Fruit, Vegetable, Grain, and Protein. In addition, at least one of these items must be a fruit or a
vegetable. Since our default intervention was to have the cafeteria offer food that seemingly
excludes a choice, this option is not politically feasible.
Our interviews supported this conclusion. The teachers interviewed were uncertain this type of
99
“Food and Nutrition Policy Motion Implementation Plan.”

54
intervention would work in their schools considering lunch logistics.100
The administrators we
spoke with wouldn’t personally mind this intervention, but suggested that they would have
difficulty with implementation due to USDA restrictions. With this consideration, they would not
have the power to implement Defaults.101
One principal suggested that since everything served is
approved by the USDA, food services staff would argue that everything they serve is already
healthy.102
In addition, we observed a typical school kitchen and cafeteria and spoke with a Food Services
Manager. Based on this interview and observation, school kitchens are not well-equipped to
implement Defaults. The kitchen is basically a warming station and K-5 students do not get a
choice in lunch entree, though can choose between two fruits and two vegetable options. There
was also only one staff person who worked in the kitchen.103
Additional research found further consequences. One study found that implementing a Defaults
option at elementary schools increased plate waste. The study estimated an additional 0.7
servings per lunch served were thrown away as a result of this intervention.104
Plate waste is a
serious concern, especially in LA Unified where studies have found significant plate waste and
translates to dollars lost. One LA Unified study found that of the students who chose fruits and
100
S.S., interview; M.V., interview; M.S., interview; and J.B., interview. 101
M.G., interview and A.O., interview. 102
M.G., interview. 103
Glenfeliz Elementary School, observations by Sydney R. Ganon and Hiroto Iwaoka, February 23, 2017. 104
Just and Price, “Default Options.”

55
vegetables, 31.4% discarded their vegetables and 22.6% discarded their fruits.105
Some plate
waste may be a byproduct of students trying new foods and, as previously discussed, simply
trying new foods can help reduce picky eating and increase consumption of healthy foods.106
However, this is not what is occurring when using default options in this study.
We conclude that the logistics of implementation, plate waste issues, and staffing considerations
outweigh the slightly cheaper costs that this policy option provides for the Food Services
Division and subsequently LA Unified as well and thus rank it low on political feasibility.
Framing: Naming Foods
The administrators we interviewed saw Framing as a potentially positive influence on
students.107,108
One site leader thought that naming, presented in an attractive fashion, could take
on obesity and help nutrition efforts. He pointed out that his students are attracted to marketing
tools that add unique names to things like clothes and technology.109
Based on our interviews, teachers are in favor of naming lunch choices in a way that is designed
to increase choice and consumption of healthier items.110
This would, however, be more likely to
105
Lauren N. Gase et al., "Student Receptivity to New School Meal Offerings: Assessing Fruit and Vegetable Waste
Among Middle School Students in the Los Angeles Unified School District," Preventive Medicine 67 (2014): S28-
33, doi:10.1016/j.ypmed.2014.04.013. 106
Wardle et al., “Modifying Children's Food Preferences.” 107
M.G., interview. 108
A.O., interview. 109
Ibid. 110
S.S., interview; M.V., interview; and M.S., interview.

56
work with younger children and may become less effective with older middle school students
and high school students. One teacher brought up the idea that schools may not like the idea of
using subconscious messaging with students,111
but further research into LA Unified Schools
suggest the opposite.
LA Unified’s Blueprint for Wellness specifically highlighted Marina Del Rey Middle School for
its use of renaming to influence healthy choices. The Food Services Manager at this school
modified water to include fruits and/or vegetables and labeled it, “Spa Water.” This simple
modification led to an increased consumption of water over other beverages.112
Although this
increase was self-reported, the inclusion of this concept in LA Unified’s report indicates that
similar choice architecture adjustments, like the naming of fruits and vegetables, would be highly
politically feasible.
This aligns with our kitchen observations in an LA Unified elementary school.113
While the setup
would make it difficult to implement Defaults, Framing could be implemented into the
cafeteria’s current setup. One Food Services Manager we spoke to said she put a sign out each
day for what was included on the menu and that this could potentially be customized with new
names.114
In addition, having students pick appealing names for fruits and vegetables aligns well
with LA Unified’s policy to have input from students on developing and marketing menus.
111
M.V., interview. 112
“Blueprint for Wellness.” 113
Glenfeliz Elementary School, observations. 114
S. (Glenfeliz Food Services Manager), interview by Sydney R. Ganon, February 23, 2017.

57
However, it is worth noting that Framing costs $120.00 more than Defaults and these costs
would have to be covered by the Food Services Division.
Political Feasibility Summary
The curriculum used by Common Threads, Small Bites, utilizes the same portion size concepts
as the California Department of Education which are built off of the USDA MyPlate concept.
Within Common Threads’ curriculum students are taught that, “The Chef’s Plate is a guide for
how a healthy plate should look… each plate of food we eat should be half vegetables and fruits,
a quarter whole grains, and a quarter lean protein.”115
LA Unified Schools display the below
poster (Figure 4) in their cafeterias.116
For comparison, the Common Threads’ version also
shown.
Figure 4: CDE MyPlate Poster (left)117 vs. Common Threads Chef’s Plate (right)118
115
“Small Bites Curriculum: 3rd - 5th Grade In-School Nutrition Program,” Common Threads, (Confidential
Curriculum 2016). 116
“Blueprint for Wellness.” 117
Ibid. 118
“Small Bites Curriculum: 3rd - 5th Grade In-School Nutrition Program.”
58
When compared to everything else a teacher must cover in a day, nutrition education often is
ranked somewhere in the middle of a teacher’s priorities.119
This occurs even though all are
aware of its importance, especially in schools that serve primarily Latino and black students who
come from low-income families with the highest rates of diabetes. We found that teacher interest
in nutrition curriculum increased when told that there was evidence of positive impact on
students, so any program should also have a teacher education component in which teachers are
taught the impact of the intervention.120
Based on our interviews, we suspect that this would
increase the likelihood of teachers regularly utilizing the curriculum in their classrooms. We also
found that teachers who do not currently participate in Common Threads’ programs want strong
materials to use in their required nutrition education but that curriculum and resources were
frequently lacking.121
Resources and materials should connect with other lessons in the classroom, as Common
Threads has done with its Common Core alignment. One teacher cited Small Bites’ alignment
with her other lessons as an incredible bonus. She was able to integrate her classroom lessons on
health, science, and math directly into Small Bites lessons. The Common Core alignment also
meant she could use the lessons to teach the day’s required state standards.122
Additional interviews brought up the idea that external resources are more likely to be adopted if
119
A.O., interview. 120
S.S., interview; M.V., interview; M.S.; interview; and J.B., interview. 121
S.S., interview and M.V., interview. 122
M.S., interview.

59
teachers can implement the lessons at a time of their choosing throughout the school year. This
type of intervention could remove many perceived constraints of classroom implementation.123
This is also a feature that Common Threads programs currently use, though the lack of consistent
implementation may add complications to the effect of the program based on what we know
about habit formation.
Additional challenges arise when trying to implement an intervention that may not align with LA
Unified’s regulations or state education standards. The lack of choice within a school cafeteria
further restricts what policy options are most feasible. Given how pressed for time teachers often
are to cover all classroom requirements, the amount of time an intervention takes to prepare and
deliver as a lesson is key to the actual implementation of a nutrition education program. Based
on these constraints, we find that the Common Threads’ curriculum is well aligned to serve LA
Unified Schools.
Adding the Reciprocity or Commitment tools would not negate this alignment and would, in fact,
enhance it. Both categories had high feasibility ratings from teachers and administrators as well
as alignment with LA Unified’s nutrition policies. Considering the positive alignment of
Framing for LA Unified’s policies, this category also ranked highly for political feasibility.
Based on our interviews and reviews of district policy, we found that Defaults were the least
politically feasible option out of our interventions. Table 7 shows our political feasibility
rankings.
123
S.S., interview.

60
Table 7: Political Feasibility Rankings of Policy Options by Stakeholder Importance124
Stakeholder Measure Commitment Reciprocity Framing Defaults
Classroom
Teachers
Points 3 4 2 1
Weight 0.65 0.65 0.05 0.05
Score 1.95 2.60 0.10 0.05
School Site
Admin
Points 3 4 2 1
Weight 0.20 0.20 0.15 0.10
Score 0.60 0.80 0.30 0.10
LA Unified
Food Services
Division
Points 3 2 4 1
Weight 0.05 0.05 0.70 0.75
Score 0.15 0.10 2.80 0.75
LA Unified
School District
Points 1 2 4 3
Weight 0.10 0.10 0.10 0.10
Score 0.10 0.20 040 0.30
Average Points 2.5 3.0 3.0 1.5
Total Score 2.8 3.7 3.6 1.2
Each policy option was weighted by stakeholder importance. For example, teachers were the
most important stakeholders for classroom-based interventions, so teacher rankings received the
highest weight for those options (65% for Reciprocity/Commitment). Each weighted score was
then summed to find the highest total score. Based on this analysis, Reciprocity was the most
politically feasible and Defaults was the least.
124
Note: Points given number 1-4, with 4 the best option and 1 the worst option. The total is the summed score
across stakeholders, weighted by estimated stakeholder importance and/or influence for each policy option.

61
4-7. Policy Option Evaluation Summary
In summary, we rank each of our four policy options (Table 8) by how they perform in each
criteria. We weighed our criteria based on strengths and limitations in relation to our final policy
recommendation and more information on this follows. Each of our policy options falls under
our budget constraint of $1 per student so cost is wrapped into cost-effectiveness criteria.
The points given to each policy option within a criteria assessment number 1-4, with 4 as the best
option. Weights for each policy option add up to 1.0 across criteria and a greater weight indicates
that the criteria is more important to our client. We weighed political feasibility at 50%, cost-
effectiveness at 30%, and duration at 20%, considering the limitations previously discussed. The
score is the weight for that particular criteria multiplied by points earned. Total weighted score is
the summed scores for each criteria and total average points is the averages across points given
in each criteria for that policy option. For both total weighted score and average points, a higher
number indicates a more preferable policy option.
Based on our evaluation, the most feasible and preferred policy option is to use Framing to
improve healthy eating habits in third, fourth, and fifth grade students participating in Common
Threads’ program. After Framing, Reciprocity is the most feasible option, followed by Defaults,
and finally, Commitment.

62
Table 8: Policy Option Evaluation Summary
Criteria Measures Commitment Reciprocity Framing Defaults
Duration
Points 2 1 3 4
Weight 0.2 0.2 0.2 0.2
Score 0.4 0.2 0.6 0.8
Cost-
Effectiveness
Points 1 2 3 4
Weight 0.3 0.3 0.3 0.3
Score 0.3 0.6 0.9 1.2
Political
Feasibility
Points 2 4 3 1
Weight 0.5 0.5 0.5 0.5
Score 1 2 1.5 0.5
Average Points 1.7 2.3 3 3
Total Weighted Score 1.7 2.8 3 2.5
It should be noted that while we use ordinal rankings and weighting to evaluate our options on
our criteria this method has its weaknesses. We further discuss the alternative methods and
results in Chapter 5, but the largest weakness we find in our above analysis is the placement of
Defaults. While Defaults may be able to work well in some environments, we find that the
political infeasibility of the option for our client and LA Unified to be insurmountable for our
final recommendation. Therefore, despite its ranking of third place in our policy options, we
remove it from our final consideration. While ranking systems such as the one used above are
helpful to conceptualize the different issues at stake, they are not perfect and we want to
recognize their shortcomings in terms of our final recommendations.

63
Chapter 5
Sensitivity Analysis

64
In Chapter 5, we discuss our sensitivity analysis for selecting among our policy options.
Although the four policy options presented in this report do not represent a high risk, high cost
departure from the status quo for Common Threads, the selection of specific alternatives over
others is very sensitive to small changes in estimates. As this report has noted throughout,
limited research exists exploring these types of interventions on childhood nutrition and fruit and
vegetable consumption. The evidence available suggests that these low-cost, moderate-impact
tools likely play a crucial but often overlooked role in the success of various programs. Given the
prominence of schools as the battlegrounds of obesity, short-term costs may be far outweighed
by long-term benefits. Thus, the need for certainty in programmatic decisions becomes all the
more important.
The uncertainty in evaluating our alternatives and thus the need for a sensitivity analysis
proceeds from uncertainty in measuring our criteria. As discussed in each of these chapters,
variability and inconsistency across studies, as well as the paucity of available data, make
estimates sensitive to minor differences.
For example, the reported effect sizes for the four interventions are drawn from either
observational studies conducted at only a handful of schools, or in a controlled, one-off
experiment. Thus, the true effect size for each of these interventions forces a reordering of their
assigned point values.

65
Simultaneously, the extremely low cost of these interventions make their corresponding cost-
effectiveness ratios highly sensitive to changing costs. For example, the choice to print handouts
in color versus black and white can have a significant impact on the costs for the goal-setting
intervention. Likewise, extended naming exercises beyond the time accounted for in the analysis,
even by a few hours each month, can also change the cost-effectiveness of that intervention.
Similarly, the names created for various fruits and vegetables might dramatically change
consumption of a specific item week to week.
Finally, in our initial evaluation matrix, we weighted the criteria of duration low not because of
its relative lack of importance but because of our lack of certainty regarding the long-term,
persistent effects of these interventions. Indeed, duration might have the single greatest impact,
provided that one or more of these interventions succeed in creating sustained behavior change.
To account for these uncertainties in effect, cost, and duration, we vary both the relative
weightings and the assigned point values in the analysis that follows.
5-1. Weighting
Our initial scenario assigned a relatively low weight to cost effectiveness and duration, together
equal to political feasibility. However, if both effect size and the duration of effect were
estimated with greater certainty and at optimistic values, we could increase their weightings
accordingly. Although political feasibility might remain equally important, if every intervention

66
were shown to have slightly higher effects, lower costs, and longer durations, those relative
criteria would be of greater importance.
To account for weighting sensitivity both cost-effectiveness and duration received a weight 1.5X
larger than previously calculated, with political feasibility halving in importance.125
In this
analysis, Defaults became the highest scored intervention, while the other three maintained their
relative positions. However, because Defaults remains politically unfeasible, we continued to
eliminate it from consideration and our policy recommendations did not change.
5-2. Political Feasibility
Returning to our initial weightings, we tested for changes in political feasibility. In our analysis
of political feasibility, Reciprocity and Framing received nearly identical weighted scores, 3.7 to
3.6, respectively (Table 7). It is reasonable to assume that these two scores might be reversed,
such that Framing might be more politically feasible than reciprocity.
Our results were not sensitive to this reversal.126
In fact, our results provided further support for
Framing as the first choice. Nevertheless, as our final recommendation (discussed further in the
next chapter), is to implement a suite of options including both Reciprocity and Framing, this
change does little to alter our conclusions. It is only relevant in the case where Common Threads
and the school will opt to adopt only one practice — an unlikely scenario.
125
See Table 1 in Appendix G. 126
See Table 2 in Appendix G.

67
5-3. Cost-Effectiveness
In capturing both the effect size and expected costs of the intervention, the cost-effectiveness
measure is very sensitive to subtle changes. As seen in Table 6, extremely low per-classroom
costs as well as varying percent effects drawn from the literature could easily alter the ranking.
In the case of Defaults, for example, some studies showed substantial, statistically significant
effects while others showed almost no effect. Defaults’ costs are also highly variable depending
on how plate waste is accounted for. We also switched the relative positions for Commitment
and Reciprocity, as their cost-effectiveness ratios were similar and might change from even
minor deviations in costs or site-to-site effectiveness.127
In this case, Defaults was the lowest scored intervention though Framing, Reciprocity, and
Commitment maintained their relative order. This suggests that our results are not sensitive to
these relative changes in cost or effect.
5-4. Continuous Point Values
As previously noted, one potential limitation is our ordinal ranking system, in which we assigned
values based solely on the order of the interventions from best to least within a particular
criterion. While simplifying and standardizing our evaluation, this method also ignored the
relative differences between them. In the prior sensitivity analyses, we simply swapped close
outcomes. However, to more fully account for these relative differences, we also calculated
127
See Table 3 in Appendix G.

68
points based on the values assigned. These values were then placed on a 1-4 point scale, with the
highest scoring intervention receiving a 4 and the other interventions receiving a score adjusted
to their value relative to a score of 4. 128 This scoring system did not change the final
recommended order, but did more accurately illuminate the relative differences between the
options. For example, while Reciprocity was still second to Framing, the difference in scores was
considerably wider, and the gap between Commitment and Reciprocity was considerably smaller.
This suggests that our interventions were more similar in preferability than our initial analysis
revealed.
128
See Table 4 in Appendix G.

69
Chapter 6
Policy Recommendations
and Implementation
Strategies

70
In this chapter, we present our recommended policy options based on the results of our Chapter
4 analysis. We also suggest ways to incorporate and implement recommended tools into
curriculum and schools and explain the limitations of our research.
Given Common Threads’ budget constraint of $1 per student, the exceptionally low combined
costs incurred by Common Threads for all of these interventions, and the interventions’ mutual
compatibility, we recommend that Common Threads adopt the Reciprocity, Commitment, and
Framing interventions simultaneously, and offer them to schools either as a bundle or individual
packages. The recommended single intervention is Framing.
6-1. Bundled Interventions
Our examination of the literature on behavior change and our analysis of cost structures suggest
that executing multiple interventions simultaneously will be more effective than their
independent effects.
We find support for utilizing more than one tool to support healthy nutrition in children from the,
albeit limited, literature on habit formation. We hypothesize that combining internal behavioral
tools and choice architecture could, in fact, speed up the process of habit formation. Studies have
not yet been done on this exact phenomenon and we therefore do not rely on this concept for our
final recommendation. However, we believe this combination is worth exploring further.

71
Internal behavioral tools are, at their core, reflective tools. Setting a goal or reciprocating a
gesture rely on some type of deliberate action on the part of the individual. On the other hand,
choice architecture is a reflexive tool.129
The environment is set up so that an individual makes a
choice without contemplating their actions. These two types of actions mirror stages of behavior
change theory (Table 9), and both support the ultimately desired habit formation.
Table 9: Model of Behavior Change130
Stage of Change Description
Precontemplation Individual unaware of desire/need to change behavior
Contemplation Individual aware of desire or need to change, thinking of change
Preparation Individual prepares to change behavior, creates plan to change
Action Individual completing actions towards change
Maintenance/
Automaticity131
Individual completed change, monitoring to prevent relapse,
behavior automatic
Based on these concepts within behavior change, we view internal behavioral tools and choice
architecture as part of the “Action” stage. We also hypothesize that utilizing choice architecture
129
R.J. Dolan and P. Dayan, “Goals and Habits in the Brain,” Neuron 80, no. 2 (2013): 312-325,
doi:10.1016/j.neuron.2013.09.007. 130
J.O. Prochaska, C.C. DiClemente, and J.C. Norcross, “In Search of How People Change: Applications to the
Addictive Behaviors,” American Psychologist 47, 9 (September 1992): 1102-1114, doi:10.1037/0003-
066X.47.9.1102. 131
Benjamin Gardner, Phillippa Lally, and Jane Wardle, “Making Health Habitual: the Psychology of ‘Habit-
Formation’ and General Practice,” The British Journal of General Practice 62, no. 605 (December 2012): 664–666,
doi:10.3399/bjgp12X659466.

72
tools in the cafeteria will help prevent decision fatigue. Studies have shown that decision making
and self-regulation stem from the same resource within an individual and that making repeated
choices can exhaust the pool from which these actions are drawn, leading to poorer
decisions.132 , 133
By supporting students’ commitments to eating healthy foods with the
environmental structures of choice architecture, it may be possible to reduce decision fatigue for
students and allow them to maintain healthy choices for a longer period and reach the
automaticity stage more easily.
In addition to the potentially positive interaction between the choice architecture and internal
behavioral tools, the internal behavioral tools themselves benefit from economies of scope due to
overlap in the underlying cost structure. In our initial analysis, costs for both Reciprocity and
Commitment were estimated separately. However, for both Common Threads and the
participating school, both interventions can be simultaneously implemented at a cost lower than
the raw total cost of the two combined. For example, Common Threads’ retraining and
curriculum redevelopment costs are largely fixed costs, and implementing those interventions
simultaneously will be dramatically cheaper than completing the process twice. Likewise, a
classroom teacher can hand out stickers during the time when children are completing the
commitment worksheet. The marginal costs of an internal behavioral tools package for Common
Threads and a typical classroom are $10.40 and $21.60, respectively, which are lower than the
132
Roy F. Baumeister et al., “Ego Depletion: Is The Active Self a Limited Resource?” Journal of Personality and
Social Psychology 74, no. 5 (1998): 1252-1265, doi:10.1037//0022-3514.74.5.1252. 133
Kathleen D. Vohs et al., “Making Choices Impairs Subsequent Self-Control: A Limited-Resource Account of
Decision Making, Self-Regulation, and Active Initiative,” Motivation Science 1, no. S (August 2014): 19-42,
doi:10.1037/2333-8113.1.S.19.

73
simple summation of their independent costs, $11.96 and $39.66, respectively.134
Therefore,
offering the internal behavioral tools package yields a savings of 13.04% for Common Threads
and 45.54% for a typical school compared to the simple total costs (Table 10).
In order for the package to be an attractive, non-dominated choice, the effect sizes would have to
be at least 86.96% and 54.46% as large as their simple totals for Common Threads and a school,
respectively. That translates to a necessary minimum combined treatment effect of 22.4 and 14.0
percentage points, respectively. Although we can expect some cannibalization of treatment
effects, the combined effects are likely to be at least as high as 14.0 percentage points, increasing
the political feasibility of this option. For Common Threads, with a typical classroom size of 24,
the per classroom marginal budget is $24 for the full 8 week program. Excluding Defaults, the
total cost to Common Threads for Reciprocity, Commitment, and Framing combined is $11.53,
well under the budget constraint (Table 4.) Therefore, even if there is cannibalization that
reduces the combined internal behavioral tools treatment effect to below 22.4 percentage points,
it would still have a positive cost-effectiveness ratio and fall within Common Threads’ budget
constraint.
134
See Table 4 above and Table 7 in Appendix E.

74
Table 10: Internal Behavioral Tools Package Savings
Intervention Common
Threads Cost
School Cost
Reciprocity $6.56 $18.00
Commitment $5.40 $21.66
Simple Total $11.96 $39.66
IBT Package $10.40 $21.60
IBT/Simple Total 86.96% 54.46%
Because there are increased costs for the bundle, and not all schools would be interested in
implementing both simultaneously, we recommend that Common Threads follows a mixed
bundling strategy, in which schools can opt in to an individual plan or the bundle. Although
marginal costs are low, large scale implementation with tight school budgets and limited teacher
time suggest that mixed bundling will be more politically feasible. However, it is likely that the
package option will be more attractive than the individual interventions on average.135
6-2. Monitoring and Evaluation
The scarcity of available data for effect sizes and duration, as well as concerns over fidelity of
implementation136
necessitates ongoing monitoring and preliminary evaluation of effectiveness.
As a consequence of Common Threads’ train-the-trainer model, it is likely that there will be
heterogeneous implementation of the interventions across school sites and classrooms.
135
See Table 5 in Appendix G. 136
N.N. (VP of Programs and Evaluation), interview by Sarah M. White, November 11, 2016.

75
To limit potential variation across sites, we created a set of teacher instructions and student
worksheets to be implemented alongside the Small Bites curriculum for the Reciprocity and
Commitment interventions.137
Before rolling these out, feedback from students, teachers, and
Common Threads core staff should be solicited for readability and fit into the existing
curriculum. For the first year after roll out, Common Threads’ school site staff should pay
careful attention to how these interventions are implemented and ask for additional feedback
during their regularly scheduled observation.
Additionally, organizational and research interests support the adoption of an impact evaluation
study. Dr. Samek has a proposed multi-site cluster randomized trial, to be conducted on a sample
of schools in LA, which will be pivotal in studying the effectiveness of these specific
interventions. We suggest schools be assigned treatments consisting of individual interventions
as well as the various bundles of Framing, Commitment, and Reciprocity to study both their
independent and combined effects on actual consumption. Although these lunchtime
observations are expensive to run, directly measuring consumption and waste for all students in
the experiment will guarantee accurate results. Ideally, this study should include baseline and
immediate post-treatment measures, as well as an end-of-year followup evaluation to study the
duration of effects. Given that the duration of effect is the least measured but potentially most
important outcome affecting habit formation and later in life health, this information will be very
valuable. Given the number of schools currently teaching the Small Bites curriculum in Los
Angeles, there should be a sufficient number of sites to randomize different treatment
137
See Appendix H for instructions and worksheet examples.

76
combinations and control assignments in the first year. By offering these interventions to some
schools earlier than others, but at random, the study can ensure a strong experimental design
while not unfairly excluding schools entirely.

77
Chapter 7
Policy Implications

78
While our applied policy project focused on interventions for Common Threads, our findings
also have broader implications. Below, we briefly consider some of the findings as applied to
federal, state, school district, and school policies.
Federal
Adjustments to federal policies around school nutrition could come from Congress or the
President of the United States. Given the current administration, however, it is unlikely that the
White House will look to expanding the Healthy, Hunger-Free Kids Act, the most recent
legislation addressing issues within the scope of this report.138
However, it is within the scope of the U.S. Department of Agriculture’s Food and Nutritional
Services Division to implement changes to its department policies. Based on our interviews with
teachers and school administrators, additional resources are desired to help implement nutrition
education compliant with USDA regulations. For example, the USDA could add resources for
schools on how to teach nutrition using Commitment or Reciprocity. The USDA could also
encourage districts to utilize attractive naming techniques to increase consumption of healthy
items, perhaps advertising the method as a way to decrease plate waste. The website for school
supports are already in place,139
so the implementation would merely be a matter of adding links
to resource pages.
138
“An Act to Reauthorize Child Nutrition Programs.” 139
"Healthier School Day," United States Department of Agriculture (USDA), Food and Nutrition Services (2017),
Last modified February 1, 2017. https://www.fns.usda.gov/healthierschoolday.

79
In addition, while we found Defaults to be politically infeasible for our client, this is an area that
the USDA could consider utilizing in the future. Considering the potential for lasting impact,
Defaults has the potential to greatly increase the health of public school children who participate
in the Free or Reduced Lunch Program. The USDA currently uses an offer versus serve method
of lunch distribution in an attempt to reduce food waste,140
but may consider changing this policy
in light of the potential impact Defaults have on long-term health. Additional research has found
that combining Defaults with an incentive has significant positive effects on healthy food
consumption and negates increased plate waste.141
State of California
The California State Department of Education supports Team California for Healthy Kids
(TCHK), an initiative led by the State Superintendent of Public Instruction. One of TCHK’s
main goals is to, “increase access and consumption of healthy food.”142
This initiative could be a
good platform to support and encourage the use of the tools described in this report. The
initiative also has broad reach via its partner organizations and could further influence healthy
consumption habits through these channels. Partner organizations include California Action for
Healthy Kids, California School Board Association, the Center for Nutrition in Schools, and the
140
“Offer Versus Serve: Guidance for the National School Lunch Program and the School Breakfast Program,”
United States Department of Agriculture (USDA), Food and Nutrition Services (2015),
https://www.fns.usda.gov/sites/default/files/cn/SP41_2015a.pdf. 141
Just and Price, “Default Options.” 142
“What We Do,” California Department of Education (CDE), Team California for Healthy Kids, accessed
February 26, 2017, http://teamcaliforniaforhealthykids.org/what-we-do/.

80
California Department of Public Health.143
Los Angeles Unified School District
Based on our findings, LA Unified School District should look to partner with nonprofits and
organizations that utilize the tools described in this report. Such partnerships are part of the
District’s responsibility on nutrition education. These tools utilize the cafeteria as a place of
learning, which is one of the ideas the District is meant to incorporate in that nutrition education.
In addition, such tools emphasize behavior change both in the classroom and the cafeteria,
another one of the district’s goals.144
Los Angeles Unified School District Food Services Division
LA Unified’s Food Services Division could fairly easily implement some of the policy options
discussed above. The primary option the Food Services Division (FSD) should consider is
Framing. As discussed previously, FSD highlighted an example of Framing within a recent
report.145
However, Framing itself was not explicitly called out as a tactic and, based on the
findings of this report, we would urge the Food Services Division to include it specifically as a
method for schools to increase consumption of healthy choices. FSD is well-situated to include
this as a way to combat obesity within LA Unified schools.
143
Ibid. 144
“Food and Nutrition Policy Motion Implementation Plan.” 145
“Blueprint for Wellness.”

81
Individual School Sites
Individual school sites can implement goal setting and reciprocity interventions without a
nonprofit partner. As schools are required to teach nutrition to their students as part of California
state law,146
these could be integrated with those mandatory lessons. These tools are not limited
to use by classroom teachers, if a school has a parent volunteer or a health class that covers these
topics, the internal behavioral tools could easily be adapted for their use. Based on our findings
of the potential long-term impact of these tools, schools seeking to improve this aspect of their
educational programming could benefit from these practices.
146
NASBE, “Nutrition Education.”

82
Glossary
Authority: See “Internal Behavioral Tools.”
Behavior Change Theory: Health and nutrition habits are malleable and can be influenced by
external factors. Manipulating these factors can improve eating habits in the short and long
term. This is based on the idea that targeted and sustained interventions on changing actions
can have a continued effect even after the intervention has ended.147,148,149
Behavioral Economics: Based on a combination of fields, including the economic concept that
preferences are flexible and manipulable. Utilizes this concept, as well as ideas from
psychology, to influence individual or group actions based on predictable individual
behaviors.
Choice Architecture:150
This subtype of behavioral economics deliberately changes the external
environment or setting of choice to influence behaviors. Examples of this include:
● Framing: Structuring the environment to promote certain choices. E.g. Moving the salad bar
so all students have to walk around it to check-out.
● Defaults: Choosing the desired, default option. E.g. The default option in the lunch line is
that you get carrots unless you specifically ask for french fries.
● Feedback: Changing an action based on system/human feedback. E.g. A cafeteria worker
asks student, “Are you sure you want to make that food choice?”
Cohen’s d: A measure of standardized effect size used to compare studies’ different outcomes of
interest. Commonly reported effect size due to simplicity and comparability using standard
deviations.
Commitment: See “Internal Behavioral Tools.”
Common Core:151
The Common Core State Standards are national standards in math and
147
Loewenstein et al., “Asymmetric Paternalism.” 148
McGowan et al., “Healthy Feeding Habits.” 149
Hussam et al., “Habit Formation.” 150
Thaler and Sunstein, Nudge. 151
"Preparing America's Students for Success,” Common Core State Standards, accessed February 27, 2017,
http://www.corestandards.org/.

83
English that set goals for what students should have learned in each grade in these fields.
They were created so that all children graduate from high school with the skills needed for
college and career, no matter the state in which they received their education.
Conditional Incentives: Providing an incentive, such as money, to complete a particular action.
The incentive is only given once the action is completed. In this project, this could be a
policy that gives a child a quarter if they consume their serving of vegetables at lunch.
Cost-Effectiveness: The measurement comparing effect sizes to behavior change to the
monetary costs of the intervention. When costs were unable to be obtained from our client or
a particular study of interest, they were inferred using market rates. One of four criteria.
Decision Fatigue:152,153
The concept that decision making and self-regulation stem from the
same internal resource within an individual and that making repeated choices can exhaust
the pool from which these actions are drawn, leading to poorer decisions.
Defaults: See “Choice Architecture.”
Duration of Effect: The longevity of the behavior change which resulted from a particular
intervention. This particular project relies on theory of duration due to the lack of literature
on this subject. One of four criteria.
Effect Size: The size and significance of the behavior change that occurs under each policy
option. This is quantified using Cohen’s d and we consider a value of 0.40 standard
deviations to be a medium/large outcome worthy of further consideration based on education,
nutrition, and public health fields of measurement. One of four criteria.
Fairness Equilibrium:154
The theory that people are willing to sacrifice their own well-
being in order to help those who were kind to them. Under this theory, a person who
received a kind gesture from another will reciprocate with an offer of higher value, even if
they do not maximize their material benefit by doing so.
Feedback: See “Choice Architecture.”
Framing: See “Choice Architecture.”
Hattie’s Zone of Desired Effects:155
This represents the zone at which an effect size can be
152
Baumeister et al., “Ego Depletion.” 153
Vohs et al., “Making Choices.” 154
Rabin, “Incorporating Fairness.” 155
Hattie, Visible Learning.

84
considered significant, based on education literature. This is based on John Hattie’s research
which incorporates over 50,000 educational studies and meta-analyses in an effort to
understand what works in education. Using this research, Hattie finds that the average effect
of an education intervention is 0.40, which we also use to consider a worthy outcome for our
own interventions.
Healthy, Hunger-Free Kids Act, The (2010):156
Federal legislation passed by President Obama
which reauthorizes funding and policies for the U.S. Department of Agriculture’s child
nutrition programs.
Internal Behavioral Tools:157
Behavioral economic tools that work to directly influence internal
motivations and behaviors. Examples of this include:
● Reciprocity: Returning a gift/favor to someone who has initiated a gift/favor
● Commitment: Remaining internally consistent with personal goals or beliefs, goal setting
● Social Proof: Following the actions of others
● Liking: Doing an action based on how much you like or identify with the person asking you
to do that action
● Authority: Doing an action because of a real or perceived authority figure
● Scarcity: Valuing an object based solely because it is rare
Liking: See “Internal Behavioral Tools.”
Meta-Analysis: An analysis of many analyses. Used to understand treatment effects across
studies.
Net Behavior Change: (“NBC”) The combination of effect size and duration of effect. Used in
this research to theorize the total behavior change possible for a policy option, during and
after the intervention is completed.
Paternalism (Strict): Paternalism is based on the economic concept that individuals are not
rational and require a higher authority to make choices in their best interest. In this instance,
paternalism could include policies such as completely banning a particular food from school
campus.
156
“An Act to Reauthorize Childhood Nutrition Programs.” 157
Cialdini, Influence: the Psychology of Persuasion.

85
Plate Waste: The food that was served at a meal but thrown away uneaten.
Political Feasibility: The relative ease by which a particular policy option could be implemented
at a site and the level of difficulty in reproducing the intervention at new locations, based on
the expertise and opinions of stakeholders. This could include students, families, teachers,
school administrators, policy experts, and/or staff at Common Threads. One of four criteria.
Reciprocity: See “Internal Behavioral Tools.”
Scarcity: See “Internal Behavioral Tools.”
Sensitivity Analysis: Analysis performed when the selection of specific alternatives over others
is very sensitive to small changes in estimates. As this report notes, limited research exists
exploring these types of interventions on our population of interest. Therefore, the
uncertainty in our research necessitates a sensitivity analysis, as seen in Chapter 5.
Social Proof: See “Internal Behavioral Tools.”
Taste Exposure Theory:158 , 159
The concept that increasing exposure to a particular food
increases consumption and preference for that food in children.
Transtheoretical Model:160
A model of behavior change frequently used in habit formation
literature. Created by Prochaska et al. (1992), there are five stages of change in this model:
(1) precontemplation, (2) contemplation, (3) preparation, (4) action, and (5) maintenance.
158
Birch and Marlin, “I Don't Like It.” 159
Wardle et al., “Modifying Children's Food Preferences.” 160
Prochaska et al., “In Search of How People Change.”

86
Bibliography
Ammerman, Alice S., Christine H. Lindquist, Kathleen N. Lohr, and James Hersey. “The
Efficacy of Behavioral Interventions to Modify Dietary Fat and Fruit and Vegetable Intake: A
Review of the Evidence.” Journal of Preventative Medicine 35, no. 1 (2002): 25-41.
doi:10.1006/pmed.2002.1028.
Battjes-Fries M., A. Haveman-Nies, R. Renes, H. Meester, and P. van't Veer. “Effect of the
Dutch School-Based Education Programme 'Taste Lessons' on Behavioral Determinants of
Taste Acceptance and Healthy Eating: A Quasi-Experimental Study.” Public Health Nutrition
18 (2014): 2231-2241.
Baumeister, Roy F., Ellen Bratslavsky, Mark Muraven, and Dianne M. Tice. “Ego Depletion: Is
The Active Self a Limited Resource?” Journal of Personality and Social Psychology 74, no. 5
(1998): 1252-1265. doi:10.1037//0022-3514.74.5.1252.
Berezowitz, Claire K., Andrea B. Bontrager Yoder, and Dale A. Schoeller. "School Gardens
Enhance Academic Performance and Dietary Outcomes in Children." Journal of School
Health 85, no. 8 (2015): 508-18. doi:10.1111/josh.12278.
Birch, Lean L., and Diane W. Marlin. “I Don't Like It; I Never Tried It: Effects of Exposure on
Two-Year-Old Children's Food Preferences.” Appetite 3, no. 4 (1982): 353-360.
doi:10.1016/S0195-6663(82)80053-6.
Brock, Michelle J., Andreas Lange, and Kenneth L. Leonard. “Giving and Promising Gifts:
Experimental Evidence on Reciprocity from the Field.” Working Paper, European Bank for
Reconstruction and Development, February 2014.
http://kangur.uek.krakow.pl/bibl_ae_zasoby/siec_lokalna/Ebor/w165.pdf.
Buzby, Jean C. and Joanne F. Guthrie. “Plate Waste in School Nutrition Programs: Final Report
to Congress.” Economic Research Service/USDA. E-FAN-02-009, (March 2002).

87
California Department of Education. "What We Do." Team California for Healthy Kids.
Accessed February 26, 2017. http://teamcaliforniaforhealthykids.org/what-we-do/.
Cameron, Judy and W. David Pierce. “Reinforcement, Reward, and Intrinsic Motivation: A
Meta-Analysis.” Review of Educational Research 64, no. 3 (1994): 363-423.
doi:10.2307/1170677.
Centers for Disease Control and Prevention. “Prevalence of Obesity Among Adults and Youth:
United States, 2011–2014.” Last modified October 28, 2015.
http://www.cdc.gov/nchs/data/databriefs/db219.htm.
Cialdini, Robert B. Influence: The Psychology of Persuasion. New York, NY: Collins, 2007.
Common Core State Standards. "Preparing America's Students for success." Common Core State
Standards Initiative. Accessed February 27, 2017. http://www.corestandards.org/.
Common Threads. “Small Bites Curriculum: 3rd - 5th Grade In-School Nutrition
Program.” Confidential Curriculum, 2016.
Crutzen, Rik. “Adding Effect Sizes to a Systematic Review on Interventions for Promoting
Physical Activity Among European Teenagers.” International Journal of Behavioral
Nutrition and Physical Activity 7, no. 1 (2010): 7-29. doi: 10.1186/1479-5868-7-29.
Davis J., L. Martinez, D. Spruijt-Metz, and N. Gatto. “LA Sprouts: A 12-Week Gardening,
Nutrition, and Cooking Randomized Control Trial Improves Determinants of Dietary
Behaviors.” Journal of Nutrition Education and Behavior 48 (2016): 2-11.
Deci, Edward L., Richard Koestner, and Richard M. Ryan. “A Meta-Analytic Review of
Experiments Examining the Effects of Extrinsic Rewards on Intrinsic Motivation.”
Psychological Bulletin 125, no. 6 (1999): 627-668. doi:10.1037//0033-2909.125.6.627.
Dolan, R. J. and P. Dayan. “Goals and Habits in the Brain.” Neuron 80, no. 2 (October 2013):
312-325. doi:10.1016/j.neuron.2013.09.007.
Dudley, Dean A., Wayne G. Cotton, and Louisa R. Peralta. "Teaching Approaches and Strategies
that Promote Healthy Eating in Primary School Children: a Systematic Review and Meta-
analysis." International Journal of Behavioral Nutrition and Physical Activity 12, no. 1

88
(2015). doi:10.1186/s12966-015-0182-8.
Ed-Data. "Los Angeles Unified School District: 2015-16." Accessed February 10, 2017.
http://www.ed-data.org/district/Los-Angeles/Los-Angeles-Unified.
Ensaff H., M. Homer, P. Sahota, D. Braybrook, S. Coan, and H. McLeod. “Food Choice
Architecture: An Intervention in a Secondary School and its Impact on Students’ Plant-based
Food Choices.” Nutrients 7, no. 6 (2015): 4426-4437. doi:10.3390/nu7064426.
Evans A., N. Ranjit, D. Hoelscher, C. Jovanovic, M. Lopez, and A.McIntosh. “Impact of School-
Based Vegetable Garden and Physical Activity Coordinated Health Interventions on Weight
Status and Weight-Related Behaviors of Ethnically Diverse, Low-Income Students: Study
Design and Baseline Data of the Texas, Grow! Eat! Go!(TGEG) Cluster-Randomized
Controlled Trial.” BMC Public Health, 16:973 (2016): 1-16.
Fletcher, Jason M., David Frisvold and Nathan Tefft. “Taxing Soft Drinks And Restricting
Access To Vending Machines To Curb Child Obesity.” Health Affairs 29, no. 5 (2010): 1059-
1066. doi:10.1377/hlthaff.2009.0725.
Gardner, Benjamin, Phillippa Lally, and Jane Wardle. “Making Health Habitual: the Psychology
of ‘Habit-Formation’ and General Practice.” The British Journal of General Practice 62, no.
605 (December 2012): 664–666. doi:10.3399/bjgp12X659466.
Gase, Lauren N., William J. Mccarthy, Brenda Robles, and Tony Kuo. "Student Receptivity to
New School Meal Offerings: Assessing Fruit and Vegetable Waste Among Middle School
Students in the Los Angeles Unified School District." Preventive Medicine 67 (2014): S28-33.
doi:10.1016/j.ypmed.2014.04.013.
Guo, S.S. and W. C. Chumlea. “Tracking of Body Mass Index in Children in Relation to
Overweight in Adulthood.” American Journal of Clinical Nutrition 70 (1999): 145S–8S.
Hammond, Ross A. and Ruth Levine. “The Economic Impact of Obesity in the United States.”
Diabetes, Metabolic Syndrome and Obesity: Targets and Therapy 3 (2010): 285-295.
doi:10.2147/DMSOTT.S7384.
Hanks, Andrew S., David R. Just, L.E. Smith, and Brian Wansink. “Healthy convenience:

89
nudging students toward healthier choices in the lunchroom.” Journal of Public Health (Oxf)
34, no. 3 (August 2012): 370-376. doi:10.1093/pubmed/fds003.
Hattie, John. Visible Learning: A Synthesis of Over 800 Meta-analyses Relating to Achievement.
London: Routledge, 2009.
Hedges, Larry V. “Effect Sizes in Nested Designs.” The Handbook of Research Synthesis and
Meta-Analysis. Eds. Harry Cooper, Larry V. Hedges, and Jeffrey C. Valentine. New York:
Russell Sage Foundation, 2009.
Himes, Thomas. "LAUSD Educators Typically Earned $75,504 Last Year." LA Daily News.
March 23, 2015. http://www.dailynews.com/social-affairs/20150321/lausd-educators-
typically-earned-75504-last-year.
Hussam Reshmaan, Atonu Rabbani, Giovanni Reggiani, and Natalia Rigol. “Habit Formation
and Rational Addiction: A Field Experiment in Handwashing.” Working Paper, Yale
University, November 10, 2016.
http://media.wix.com/ugd/b51e74_d9113402644647ccbafbae1500276c3c.pdf.
Hutchinson J., M. Christian, C. Evans, C. Nykjaer, N. Hancock, and J. Cade. “Evaluation of the
Impact of School Gardening Interventions on Children's Knowledge of and Attitudes Towards
Fruits and Vegetables. A cluster randomized controlled trial.” Appetite 91 (2015): 405-414.
Jääskeläinen P., C.G. Magnussen, K. Pahkala, V. Mikkilä, M. Kähönen, M.A. Sabin, M.
Fogelholm, N. Hutri-Kähönen, L. Taittonen, R. Telama, T. Laitinen, E. Jokinen, T. Lehtimäki,
J.S. Viikari, O.T. Raitakari, and M. Juonala. “Childhood Nutrition in Predicting Metabolic
Syndrome in Adults: the Cardiovascular Risk in Young Finns Study.” Diabetes Care 35, no. 9
(2012): 1937-1943. doi:10.2337/dc12-0019.
Jarpe-Ratner E., S. Folkens, S. Sharma, D. Daro, and N. Edens. “An Experiential Cooking and
Nutrition Education Program Increases Cooking Self-Efficacy and Vegetable Consumption in
Children in Grades 3-8.” Journal of Nutrition Education and Behavior 48 (2016): 697-705.
Just, David R. and Joseph Price. “Default Options, Incentives and Food Choices: Evidence
from Elementary-School Children.” Public Health Nutrition 16, no. 12 (December 2013):

90
2281-2288. doi:10.1017/S1368980013001468.
Just, David R. and Joseph Price. “Using Incentives to Encourage Healthy Eating in Children.”
Journal of Human Resources 48, no. 4 (2013): 855–872. doi:10.1353/jhr.2013.0029.
Just, David R. and Brian Wansink. “Smarter Lunchrooms: Using Behavioral Economics to
Improve Meal Selection.” Choices 24, no. 3 (2009). doi:10.1016/j.jneb.2014.04.261.
Kipping R., L. Howe, R. Jago, R. Campbell, S. Wells, and C. Chittleborough. “Effect of
Intervention Aimed at Increasing Physical Activity, Reducing Sedentary Behavior, and
Increasing Fruit and Vegetable Consumption in Children: Active for Life Year 5 (AFLY5)
School Based Cluster Randomised Controlled Trial. BMJ 348(g3256) (2014): 1-13.
Long, Cynthia. Updated Offer versus Serve Guidance for the National School Lunch Program
and School Breakfast Program in School Year 2013-2014. Memorandum SP 45-2013. United
States Department of Agriculture, Food and Nutrition Service. June 2013.
Los Angeles Unified School District (“LA Unified”). Blueprint for Wellness: Healthy Choices
for Lifelong Health, the LAUSD Health and Wellness Policy. January 2016.
http://achieve.lausd.net/cms/lib08/CA01000043/Centricity/domain/453/files/Blueprint%20for
%20Wellness%20Aug%202014%20FINAL.pdf
Los Angeles Unified School District (“LA Unified”). “Food and Nutrition Policy Motion
Implementation Plan Appendix A.” 2012.
http://achieve.lausd.net/cms/lib08/CA01000043/Centricity/Domain/126/Food%20and%20Nut
rition%20Policy%20Motion-Implementation%20Plan%20Appendix%20A%2011.9.12.pdf
Los Angeles Unified School District (“LA Unified”). "Los Angeles Unified School District:
Personnel Commission July 1, 2016 Classified Salary Schedule." July 1, 2016.
http://achieve.lausd.net/cms/lib08/CA01000043/Centricity/Domain/356/July%201%202016%
20-%20Salary%20Schedule%20020617.pdf.
List, John A. and Anya S. Samek. “The Behavioralist as Nutritionist: Leveraging Behavioral
Economics to Improve Child Food Choice and Consumption.” Journal of Health Economics
39 (2015): 135-146. doi:10.1016/j.jhealeco.2014.11.002.

91
Loewenstein, George, Troyen Brennan, and Kevin G. Volpp. “Asymmetric Paternalism to
Improve Health Behaviors.” JAMA 298, no. 20 (2007): 2415-2417.
doi:10.1001/jama.298.20.2415.
McGowan, Laura, Lucy J. Cooke, Benjamin Gardner, Rebecca J. Beeken, Helen Croker, and
Jane Wardle. “Healthy Feeding Habits: Efficacy Results From a Cluster-Randomized,
Controlled Exploratory Trial of a Novel, Habit-Based Intervention with Parents.” American
Journal of Clinical Nutrition 98, no. 3 (September 2013): 769-777. doi:
10.3945/ajcn.112.052159.
National Association of State Boards of Education (NASBE). “Nutrition Education.” State
School Health Policy Database. Last modified June 3, 2013.
www.nasbe.org/healthy_schools/hs/bytopics.php?topicid=1150.
NIH Obesity Education Initiative. “Clinical Guidelines on the Identification, Evaluation, and
Treatment of Overweight and Obesity in Adults: The Evidence Report.” National Heart, Lung,
and Blood Institute. NIH Publication 98, no. 4083 (September 1998).
Phillips, Anna M. “The Drought is Over at L.A. Schools. For Chocolate Milk, Anyway.” Los
Angeles Times, October 18, 2016. http://www.latimes.com/local/education/la-me-edu-
chocolate-milk-20161018-snap-story.html.
Prochaska, J.O., C.C. DiClemente, and J.C. Norcross. “In Search of How People Change:
Applications to the Addictive Behaviors.” American Psychologist 47, 9 (September 1992):
1102-1114. doi:10.1037/0003-066X.47.9.1102.
Puhl, R.M. and J.D. Latner. “Stigma, Obesity, and the Health of the Nation's Children.”
Psychological Bulletin 133, no. 4 (July 2007): 557-580. doi:10.1037/0033-2909.133.4.557.
Rabin, Matthew. “Incorporating Fairness into Game Theory and Economics.” American
Economics Review 83 (1993): 1281-1302. http://www.jstor.org/stable/2117561.
Raju, Sekar, Priyali Rajagopal, and Timothy J. Gilbride. “Marketing Healthful Eating to
Children: The Effectiveness of Incentives, Pledges, and Competitions.” Journal of Marketing
74, no. 3 (May 2010): 93-106. doi:10.1509/jmkg.74.3.93.

92
Samek, Anya S. “Gifts and Goals: Behavioral Nudges to Improve Child Food Choice at School.”
CESR-Schaeffer Working Paper 2016-007, 2016. doi:10.2139/ssrn.2729579.
Santesso, N., E.A. Akl, M. Bianchi, A. Mente, R. Mustafa, D. Heels-Ansdell, and H.J.
Schünemann. "Effects of Higher- versus Lower-Protein Diets on Health Outcomes: A
Systematic Review and Meta-Analysis." European Journal of Clinical Nutrition 66, no. 7
(2012): 780-788. doi:10.1038/ejcn.2012.37.
Schwartz, Marlene, Kathryn Henderson, Margaret Read, Nicole Danna, and Jeannette Ickovics.
“New School Meal Regulations Increase Fruit Consumption and Do Not Increase Total Plate
Waste.” Journal of Child Obesity 11, no. 3 (June 2015): 242-7. doi:10.1089/chi.2015.0019.
Staples, Inc. "Copies and Documents." Accessed February 9, 2017.
http://www.staples.com/sbd/content/copyandprint/copiesanddocuments.html.
Taber, Daniel R., Jamie F. Chriqui, Renee Vuillaume, and Frank J. Chaloupka. "How State
Taxes and Policies Targeting Soda Consumption Modify the Association between School
Vending Machines and Student Dietary Behaviors: A Cross-Sectional Analysis." PLoS ONE 9,
no. 8 (2014). doi:10.1371/journal.pone.0098249.
Thaler, Richard H., and Cass R. Sunstein. Nudge: Improving Decisions About Health, Wealth,
and Happiness. New York, NY: Penguin Books, 2009.
Thomson, Cynthia A. and Jennifer Ravia. “A Systematic Review of Behavioral Interventions to
Promote Intake of Fruit and Vegetables.” Journal of the American Dietetic Association 111,
no. 10 (2011): 1523-1535. doi:10.1016/j.jada.2011.07.013.
Triador, L., A. Farmer, K. Maximova, N. Willows, and J.Kootenay. “A School Gardening and
Healthy Snack Program Increased Aboriginal First Nations Children's Preferences Towards
Vegetables and Fruit.” Journal of Nutrition Education and Behavior 47 (2015): 176-180.
United States. An Act to Reauthorize Child Nutrition Programs, and for Other Purposes: The
Healthy, Hunger-Free Kids Act. Washington, DC: GPO, 2010.
United States Department of Agriculture (USDA). "Healthier School Day." Food and Nutrition
Services. Last modified February 1, 2017. https://www.fns.usda.gov/healthierschoolday.

93
United States Department of Agriculture (USDA). "Offer Versus Serve: Guidance for the
National School Lunch Program and the School Breakfast Program." Food and Nutrition
Services. 2015. Accessed February 28, 2017.
https://www.fns.usda.gov/sites/default/files/cn/SP41_2015a.pdf.
Vartanian, Lenny R., Marlene B. Schwartz, and Kelly D. Brownell. “Effects of Soft Drink
Consumption on Nutrition and Health: A Systematic Review and Meta-Analysis.” American
Journal of Public Health 97, no. 4 (2007): 667–675. doi:10.2105/ajph.2005.083782.
Vohs, Kathleen D., Roy F. Baumeister, Brandon J. Schmeichel, Jean M. Twenge, Noelle M.
Nelson, and Dianne M. Tice. “Making Choices Impairs Subsequent Self-Control: A Limited-
Resource Account of Decision Making, Self-Regulation, and Active Initiative.” Motivation
Science 1, no. S (August 2014): 19-42. doi:10.1037/2333-8113.1.S.19.
Walmart, Inc. "TREND Sticker Assortment Pack, Super Stars and Smiles, 738pk." Accessed
January 25, 2017. https://www.walmart.com/ip/Trend-Enterprises-Sticker-Pad-Super-Stars-
and-Smiles-Assorted-Colors-738-Stickers-per-Pack/14879090.
Wansink, Brian, David R. Just, Collin R. Payne, and Matthew Z. Klinger. “Attractive Names
Sustain Increased Vegetable Intake in Schools.” Journal of Preventative Medicine 55 (July
2012): 330-332. doi:10.1016/j.ypmed.2012.07.012
Wardle Jane, M.L. Herrera, L. Cooke, and E.L. Gibson. “Modifying Children's Food
Preferences: the Effects of Exposure and Reward on Acceptance of an Unfamiliar Vegetable.”
European Journal of Clinical Nutrition 57, no. 2 (February 2003): 341-8.
doi:10.1038/sj.ejcn.1601541.
Zhou W., X. Xu, G. Li, M. Sharma, Y. Qie, and Y. Zhao. “Effectiveness of a School-Based
Nutrition and Food Safety Education Program Among Primary and Junior High School
Students in Chongqin, China.” Global Health Promotion 23 (2014): 37-49.

94
Appendix
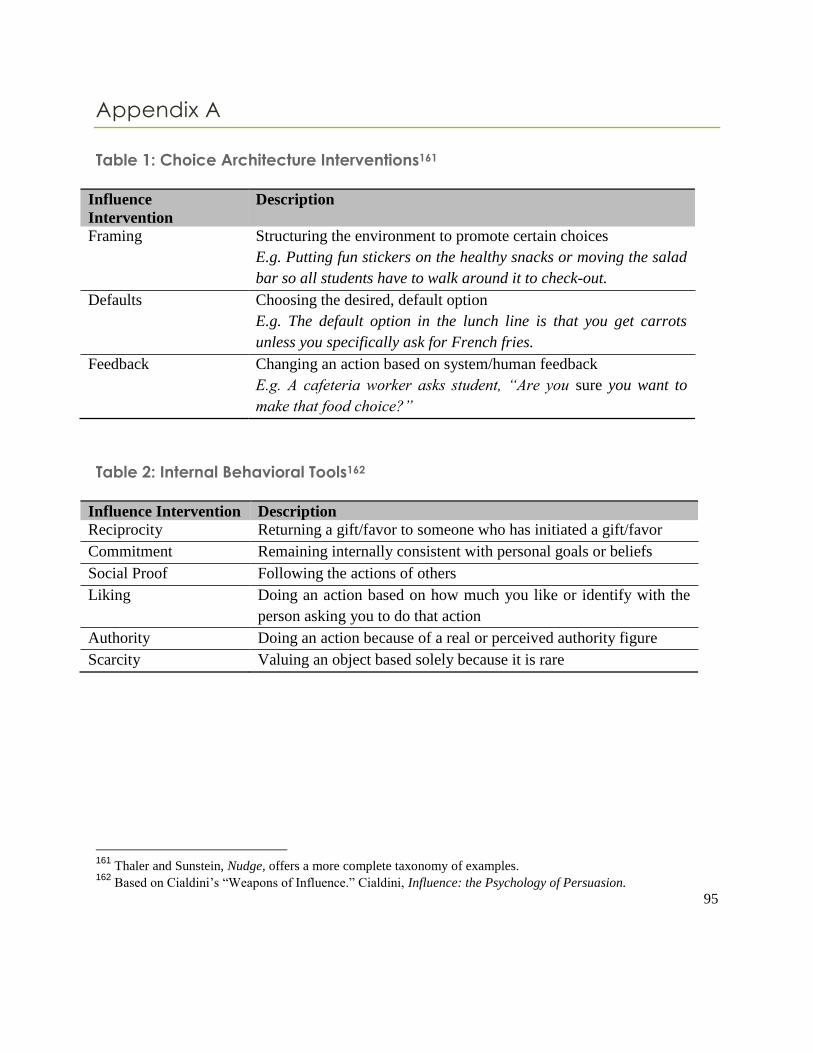
95
Appendix A
Table 1: Choice Architecture Interventions161
Influence
Intervention
Description
Framing Structuring the environment to promote certain choices
E.g. Putting fun stickers on the healthy snacks or moving the salad
bar so all students have to walk around it to check-out.
Defaults Choosing the desired, default option
E.g. The default option in the lunch line is that you get carrots
unless you specifically ask for French fries.
Feedback Changing an action based on system/human feedback
E.g. A cafeteria worker asks student, “Are you sure you want to
make that food choice?”
Table 2: Internal Behavioral Tools162
Influence Intervention Description
Reciprocity Returning a gift/favor to someone who has initiated a gift/favor
Commitment Remaining internally consistent with personal goals or beliefs
Social Proof Following the actions of others
Liking Doing an action based on how much you like or identify with the
person asking you to do that action
Authority Doing an action because of a real or perceived authority figure
Scarcity Valuing an object based solely because it is rare
161
Thaler and Sunstein, Nudge, offers a more complete taxonomy of examples. 162
Based on Cialdini’s “Weapons of Influence.” Cialdini, Influence: the Psychology of Persuasion.

96
Table 3: Choosing Between Behavioral Economic Interventions
Criteria
Tool
Behavior
Change
Duration Political
Feasibility
Cost
Effectiveness
Type of BE
Intervention*
Defaults Yes No Yes Yes CA
Feedback Yes Unknown Unknown Yes CA
Framing Yes No Yes Yes CA
Reciprocity Yes Unknown Yes Unknown IBT
Commitment Yes Unknown Yes Unknown IBT
Social Proof Yes Unknown No No IBT
Liking No Unknown No Yes IBT
Authority No Unknown No Yes IBT
Scarcity No No No No IBT
*CA= Choice Architecture; IBT=Internal Behavioral Tool
Note: Interventions failed to pass our initial criteria for a variety of reasons. Liking and
Authority’s effect on behavior change are highly dependent on the specific teacher-student
relationship, which is itself highly dependent on age. Social Proof and Scarcity are
exceptionally hard to manipulate in a school setting, while feedback has a relatively high
training cost and relies on a student’s pre-existing knowledge of nutrition to conceptualize
the feedback.

97
Appendix B: Multi-Level Modeling of Effect Size
We also wanted to take into account the nested structure of schools to test how far off our naive
estimates of effect size were. To do this, we used a two-level model to calculate more accurate
effect sizes for Reciprocity and Commitment. This first level describes the between-classroom
data:
Level 1
𝑚𝑖𝑙𝑘𝑝𝑜𝑠𝑡𝑖𝑗= 𝐵0𝑗 + 𝐷1𝑗 (𝑔𝑖𝑓𝑡𝑖𝑗 − 𝑔𝑖𝑓𝑡𝑗) + 𝐷𝑗2 (𝑔𝑜𝑎𝑙𝑖𝑗 − 𝑔𝑜𝑎𝑙𝑗) + 𝐵3𝑗 (𝑚𝑖𝑙𝑘𝑝𝑟𝑒𝑖𝑗
− 𝑚𝑖𝑙𝑘𝑝𝑟𝑒𝑗) + 𝑟𝑖𝑗
𝑟𝑖𝑗 ̴ 𝑁(0, 𝜎2)
where:
𝑩𝟎𝒋: is true mean milk consumption for classroom i in school j
𝑫𝟏𝒋: is effect of the reciprocity treatment on milk chose for school j
𝒈𝒊𝒇𝒕𝒊𝒋: takes 1 if received the reciprocity treatment, 0 otherwise for classroom i in school j
𝒈𝒊𝒇𝒕𝒋: represents percentage of students getting the reciprocity treatment in school j
𝑫𝒋𝟐: is the effect of the goal setting treatment for school j
𝒈𝒐𝒂𝒍𝒊𝒋: takes 1 if received the goal setting treatment, 0 otherwise for classroom i in school j
𝒈𝒐𝒂𝒍𝒋: represents the percentage of students getting the goal-setting treatment in school j
𝑩𝟑𝒋: controls for the prior level of milk consumption in school j on post-consumption
𝒎𝒊𝒍𝒌_𝒑𝒓𝒆𝒊𝒋: represents the pre-treatment proportion of milk consumed by classroom i in school j

98
𝒎𝒊𝒍𝒌_𝒑𝒓𝒆𝒋: represents the proportion of white milk consumed by school j pretreatment
𝒓𝒊𝒋: the deviation of class i's milk consumption from expectation in school j
𝝈𝟐: The variance of the level 1 residuals, or within school residuals, assumed normally distributed with mean
0.
The second level describes the between-schools data:
Level 2
𝐵0𝑗 = 𝜆00 + 𝑢0𝑗 , − − − 𝑢0𝑗 ̴𝑁(0, 𝜏00)
𝐷1𝑗 = 𝜆10 + 𝑢1𝑗 , − − − 𝑢1𝑗 ̴𝑁(0, 𝜏11)
𝐷2𝑗 = 𝜆20 + 𝑢2𝑗 , − − − 𝑢2𝑗 ̴𝑁(0, 𝜏22)
𝐵1𝑗 = 𝜆30 + 𝑢3𝑗 , − − − 𝑢3𝑗 ̴𝑁(0, 𝜏33)
where:
𝝀𝟎𝟎: is the grand mean of percent while milk across all schools post-treatment
𝝀𝟏𝟎: is the grand mean of the reciprocity treatment effect
𝝀𝟐𝟎: is the grand mean of the goal setting treatment effect
𝝀𝟑𝟎: is the grand mean of percent white milk across all schools pre-treatment
𝒖𝟎𝒋, 𝒖𝟏𝒋, 𝒖𝟐𝒋, 𝒖𝟑𝒋: are the deviations (random effects) for post-treatment outcomes, reciprocity treatment,
goal setting treatment, and pre-treatment outcomes, respectively
𝝉𝟎𝟎, 𝝉𝟏𝟏, 𝝉𝟐𝟐, 𝝉𝟑𝟑 : are the variances of the post-treatment outcomes, reciprocity treatment, goal setting
treatment, and pre-treatment outcomes, respectively

99
Our treatment effects of interest are 𝜆10 and 𝜆20 representing the grand mean, or overall average,
treatment effect. In a hierarchical linear model (HLM), there are multiple different standardized
effect sizes that can be calculated using different combinations of estimated variances for each
level; these effect sizes must be compared to effect sizes of the same type.163
In our case, we are
comparing studies that often use a two-level structure, but do not report standard errors from
mixed models. Given the structure of the data, we can expect our effect sizes to vary greatly. We
divide the grand mean treatment effects 𝜆10 and 𝜆20by the square root of the error variance, 𝜎 ,
to arrive at effect sizes of .574 and .410 for Reciprocity and Commitment, respectively.
163
Hedges, “Effect Sizes in Nested Designs,” 337-53.
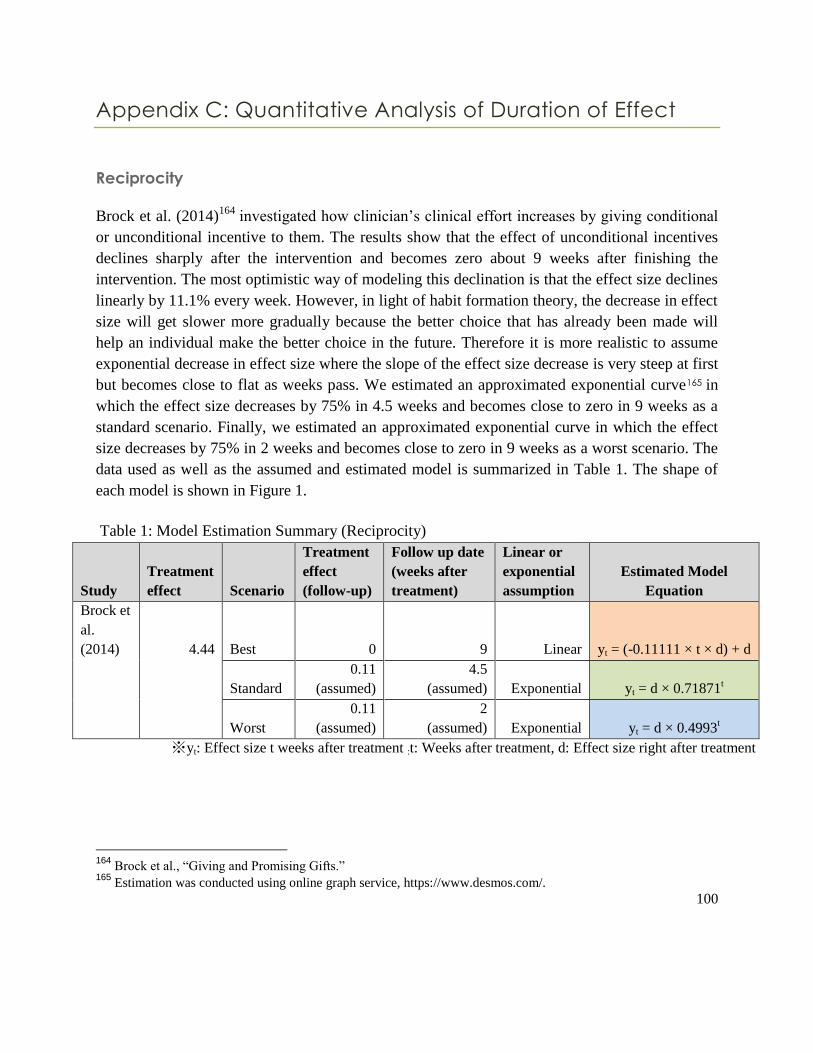
100
Appendix C: Quantitative Analysis of Duration of Effect
Reciprocity
Brock et al. (2014)164
investigated how clinician’s clinical effort increases by giving conditional
or unconditional incentive to them. The results show that the effect of unconditional incentives
declines sharply after the intervention and becomes zero about 9 weeks after finishing the
intervention. The most optimistic way of modeling this declination is that the effect size declines
linearly by 11.1% every week. However, in light of habit formation theory, the decrease in effect
size will get slower more gradually because the better choice that has already been made will
help an individual make the better choice in the future. Therefore it is more realistic to assume
exponential decrease in effect size where the slope of the effect size decrease is very steep at first
but becomes close to flat as weeks pass. We estimated an approximated exponential curve165 in
which the effect size decreases by 75% in 4.5 weeks and becomes close to zero in 9 weeks as a
standard scenario. Finally, we estimated an approximated exponential curve in which the effect
size decreases by 75% in 2 weeks and becomes close to zero in 9 weeks as a worst scenario. The
data used as well as the assumed and estimated model is summarized in Table 1. The shape of
each model is shown in Figure 1.
Table 1: Model Estimation Summary (Reciprocity)
Study
Treatment
effect Scenario
Treatment
effect
(follow-up)
Follow up date
(weeks after
treatment)
Linear or
exponential
assumption
Estimated Model
Equation
Brock et
al.
(2014) 4.44 Best 0 9 Linear yt = (-0.11111 × t × d) + d
Standard
0.11
(assumed)
4.5
(assumed) Exponential yt = d × 0.71871t
Worst
0.11
(assumed)
2
(assumed) Exponential yt = d × 0.4993t
※ yt: Effect size t weeks after treatment :t: Weeks after treatment, d: Effect size right after treatment
164
Brock et al., “Giving and Promising Gifts.” 165
Estimation was conducted using online graph service, https://www.desmos.com/.

101
Figure 1 : Effect-size declination model (Reciprocity)
Commitment
Raju (2010)166
examined the effect of incentives, pledges, and competition on elementary and
secondary school students’ healthy food choices and the results show that the effect of goal
setting (the pledge) lasts not only for the short-term, but also for the long-term. The treatment
effect dropped by 66% in the first week after treatment but the effect remained at 56% of the
original level even after 10 weeks post-treatment. The result clearly shows the contrast between
the sharp drop right after the treatment and the slight (or no) drop afterwards and it is in line with
our findings on habit formation theory. Therefore, we estimated three exponential models of
effect size declination for best, standard and worst scenarios. For the best scenario, we estimated
an approximated exponential curve by which the treatment effect drops by only 44.4% in 10
weeks. For the worst scenario, we drew an approximated exponential curve by which the
treatment effect drops by 66% in the first week post-treatment. We also assumed a standard
scenario in which the treatment effect decreases by 38.9% in 5 weeks. The data used as well as
166
Raju et al. “Marketing Healthful Eating to Children.”

102
the assumed and estimated model is summarized in Table 2. The shape of each model is shown
in Figure 2.
Table 2: Model Estimation Summary (Commitment)
Study
Treatmen
t effect Scenario
Treatment
effect
(follow-up)
Follow up date
(weeks after
treatment) Estimated Model Equation
Raju et
al.
(2010) 0.9 Best 0.4 10 yt = d × 0 .92211t
Standard
0.35
(assumed)
5
(assumed) yt = d × 0.82788t
Worst 0.1 1 yt = d × 0.33333t
※ yt: Effect size t weeks after treatment :t: Weeks after treatment, d: Effect size right after treatment
Figure 2: Effect-size declination model (Commitment)
Defaults
Defaults and Framing, our choice architecture behavioral economic tools, require a different set
of assumptions than Commitment and Reciprocity. This difference comes from the low
operational costs of Defaults and Framing; they require very low costs once the tools are

103
implemented. Therefore, when we actually implement programs using choice architecture, we do
not have to decide for how long we will implement the program and we can use the intervention
for as long as it’s effective. For example once we set the default choice of the school lunch menu,
no additional costs will be required to maintain the change. For that reason, it is not useful to
estimate an effect-size declination model such as we used for Commitment and Reciprocity.
Though these interventions do not have a time limit, the effect size of the program would not be
constant. It is reasonable to assume that students’ responsiveness to the program would decline
as time goes on, so the effect size will decline gradually. This assumption is backed up by our
qualitative interviews with choice architecture experts. Therefore, as with Framing and Defaults,
we assumed that the effect size is the highest at the beginning of the treatment and estimate the
declination model of the effect size after this point.
For Defaults, we used the data from Ensaff et al. (2015)167
to estimate the declination model.
Ensaff et al. investigated how much improving the choice architecture in a school cafeteria
affected students purchases of healthy foods containing vegetables. In this study, the treatment
effect at three weeks post-intervention was 41% of the original effect size. The most optimistic
interpretation of this result is that the treatment effect would not have gone below 41% of its
original level if the intervention had continued. Again, in light of habit formation theory, it is
reasonable to assume that the decrease of the effect size will be exponential rather than linear.
Therefore, for the best scenario we estimated an exponential curve which never goes below 41 %
of the original effect size. However, there is no guarantee that the effect size never goes below
that line, so for the worst scenario, we estimated an exponential curve by which the effect size
becomes nearly zero in the end. For the standard scenario, we estimated an exponential curve
which never goes below 20.5% of the original effect size. The data used as well as the assumed
and estimated model is summarized in Table 3. The shape of each model is shown in Figure 3.
167
Ensaff et al., “Food Choice Architecture.”

104
Table 3: Model Estimation Summary (Defaults)
Study
Treatment
effect
(during
treatment) Scenario
Treatment effect
(after intervention)
= lower limit Estimated Model Equation
Ensaff et
al. (2015) 1.7 Best 0.7 yt = (d - d × 0.4118) × 0.8489t + d × 0.4118
Standard 0.35 (assumed) yt = (d - d × 0.2059) × 0.84839t + d × 0.2059
Worst 0 (assumed) yt = d × 0.84799t
※ yt: Effect size t weeks after starting treatment :t: Weeks after treatment, d: Effect size at the start of treatment
Figure 3: Effect-size declination model (Default)
Framing
For Framing, we also used the data from Ensaff (2015)168
to estimate the duration model, but we
needed to estimate it using a different assumption. Because our qualitative interview with the
168
Ibid.

105
pioneers of choice architecture indicates that the effect of attractive naming tapers off and ends
up being ineffective after a time, it is unrealistic to assume that the effect will last forever.
Therefore, we interpreted the data in a different way and estimated another duration model for
Framing. We estimated the best, standard and worst scenario based on the decreasing speed of
the effect size, assuming that the effect size will end up becoming zero at some point in the
future.
According to Ensaff et al., the effect size remained 41% of the original level at week 9 after
starting the intervention even post-treatment, so in our best scenario, we estimated the
exponential curve by which the effect size remained 62% of the original level at week 9,
assuming that the effect size would be 50% higher than reported if the intervention continued.
For the standard scenario, we estimated the exponential curve by which the effect size remained
at 41% of the original level, as reported in the study. Finally, for the worst scenario, we assumed
that the effect size will become zero at week 9 post-treatment. The data used as well as the
assumed and estimated model is summarized in Table 4. The shape of each model is shown in
Figure 4.
Table 4: Model Estimation Summary (Framing)
Study Treatment effect (during treatment)
Scenario Treatment effect (9 weeks after start)
Estimated Model Equation
Ensaff et
al. (2015)
1.7
Best 1.05 (assumed) yt = d × 0.94787t
Standard 0.7 (assumed) yt = d × 0.90611t
Worst 0 (assumed) yt = d × 0.83895t
※ yt: Effect size t weeks after starting treatment :t: Weeks after treatment, d: Effect size at the start of treatment

106
Figure 4: Effect-size declination model (Framing)
In order to compare each option’s duration of effect, we calculated how many weeks it would
take for the effect size to reach below 10 % of its original level (Table 5).

107
Table 5: Necessary weeks for the effect size to reach below 10%
Option Scenario Necessary weeks Ranking
Commitment Best Scenario 29 weeks
3rd
Standard Scenario 13 weeks
Worst Scenario 3 weeks
Reciprocity Best Scenario 9 weeks
4th
Standard Scenario 7 weeks
Worst Scenario 4 weeks
Defaults Best Scenario Never
1st Standard Scenario Never
Worst Scenario 14 weeks
Framing Best Scenario 44 weeks
2nd
Standard Scenario 24 weeks
Worst Scenario 14 weeks
In summary, we can expect the longest duration of effect for Defaults and the shortest duration
of effect for Reciprocity. This result is in line with the theoretical analysis in the body of the
report.

108
Appendix D: Quantitative Analysis of NBC
We have the estimated effect size and its duration models for each policy option. In this section,
we calculate the estimated Net Behavior Change (NBC) of each policy option by using the effect
size (in Cohen’s d) and the duration model equation. NBC was basically calculated by taking the
definite integral of each duration model’s equation multiplied by 5 (Number of times lunch is
offered in a week), so NBC stands for “How much in standard deviation does the policy
potentially change a student’s fruits and vegetables consumption in lunchtime during and after
the program as a total?” The mathematical formula used to calculate NBC for each option and
calculated NBC is summarized in Table 1. NBC average was calculated under the assumption
that best, standard and worst scenario would happen with the same probability.
Here, we have to add an assumption to make the NBC of Reciprocity & Commitment and the
NBC of Default and Framing, because we estimated the model of the effect size after finishing
the program for Commitment and Reciprocity while we estimated the duration model of the
effect size after the beginning of the program for Default and Framing. Therefore, if we simply
take the definite integral of duration of effect formula for all policies, we are not taking into
account the behavior change during the intervention for Commitment and Reciprocity. Hence,
we added estimated behavior change during the program to the behavior change after the
program for Commitment and Reciprocity. The behavior change during the intervention was
calculated as “Effect size × 8 weeks × 5 meals”, because our client’s current offered nutrition
education program is for 8 weeks and there is no explicit evidence for us to think that the effect
size will decline in such a short term with full of novel materials to learn.
Also, for the best and standard scenario in Default, the NBC will be infinite unless we constrain
the treatment length because we are assuming that the effect size would never go below certain
level. To make Default’s NBC comparable to other options, we temporarily set the treatment
length of Default as 40 weeks (one school year) because most of the effect size for every policy
option and every scenario taper off by 90% after 40 weeks. Calculated NBC is summarized in
Table 1.

109
Table 1: Estimated Net Behavior Change for each option
Policy
Option
Scenario Formula NBC NBC (avg.)
Reciprocity Best
35.88
31.54
Standard
31.66
Worst
27.09
Commitment Best
41.68
29.06 Standard
27.24
Worst
18.27
Default Best
118.35
77.06
Standard
77.08
Worst
35.75
Framing Best
51.09
31.45 Standard
27.73
Worst
15.56
※: Reciprocity and Commitment, t: Weeks after treatment, d: Effect size right after the treatment, l: length of treatment (8
weeks) Default and Framing: t: Weeks after starting treatment d: Effect size at the start of treatment
In conclusion, in terms of the potential Net Behavior Change to be induced by each policy option,
Default potentially has the highest average score and Commitment has the lowest average score.
However, the average NBC for Commitment, Reciprocity and Framing is quite similar to each other.
Considering the naive assumptions made for this analysis, we cannot conclude the potential NBC
assertively for these three options.

110
Appendix E: Costs 169,170,171,172,173
Table 1: Costs Utilized in Cost-Effectiveness Analysis
Common Threads Cost Info
Training Costs (2 hours) $150.00
LAUSD Teacher Cost Information
Highest Salary $80,074.00
Base Salary $45,637.00
Average Teacher Salary $62,855.00
Pay per day (182 days/year) $345.36
Pay per hour (8 hours/day) $43.17
LAUSD Senior Food Production
Assistant Cost Information
Hourly Wage $15.00
LAUSD Principal Cost Information
Average Principal Salary $112,400.00
Pay per day (249 days/year) $451.41
Pay per hour (8 hours/day) $56.42
169
"LA Unified School District: Personnel Commission July 1, 2016 Classified Salary Schedule." 170
Himes, "LAUSD Educators Typically Earned $75,504 Last Year." 171
J.B., interview. 172
"TREND Sticker Assortment Pack.” 173
"Copies and Documents."

111
Table 2: Reciprocity Option
Expense Description Expense
Level Estimated
Costs Costs to Common Threads Stickers
Stickers come in a pack of several sheets, and
each teacher will be provided a sticker pack for
the duration of the Small Bites Curriculum (8
weeks).
Classroom $5.00
15 min
Teacher Training
Common Threads provides a 2-hour Small Bites
training for a minimum of 12 teachers at a cost
of $150. The marginal time needed to instruct
teachers on implementing this tool will take an
estimated extra 15 minutes. Costs are
determined by taking the estimated costs of an
additional 15 minutes ($150/8=$18.75) and
dividing by the minimum number of teachers
attending (12).
Classroom $1.56
Costs to School 15 min
Teacher Training
The costs of teachers attending the training are
taken into account as well, as teachers are
compensated for required additional training.
Costs for this additional 15 minutes in training is
estimated by using average LAUSD teacher
salary.
Classroom $10.80
10 min
Teacher Time
Time it would take a teacher to pass out all of
the stickers to each student. Costs are calculated
using average LAUSD teacher salary.
Classroom $7.20

112
Table 3: Commitment Option
Expense Description Expense
Level Estimated
Costs Costs to Common Threads Goal Setting
Worksheets
Teachers will be provided with the worksheets for
setting a goal. There is 1 goal sheet per lesson, so
each student should receive 8 goal sheets
throughout the program. Average printing costs
are $0.02/sheet.
Individual $0.16
15 min
Teacher Training
Common Threads provides a 2-hour Small Bites
training for a minimum of 12 teachers at a cost of
$150. The marginal time needed to instruct
teachers on implementing this tool will take an
estimated extra 15 minutes. Costs are determined
by taking the estimated costs of an additional 15
minutes ($150/8=$18.75) and dividing by the
minimum number of teachers attending (12).
Classroom $1.56
Costs to School
15 min
Teacher Training
The costs of teachers attending the training are
taken into account as well, as teachers are
compensated for required additional training.
Costs for this additional 15 minutes in training is
estimated by using average LAUSD teacher
salary.
Classroom $10.80
15 min
Teacher Time
Time it would take a teacher to pass out all of the
worksheets to each student and have them
complete it. Costs for additional 15 minutes of
work spent on Small Bites program is estimated
by using average LAUSD teacher salary.
Classroom $10.80

113
Table 4: Default Option
Expense Description Expense
Level Estimated
Costs Costs to Common Threads
20 min
Cafeteria Worker
Training
Common Threads provides a 2-hour Small Bites
training for a minimum of 12 teachers at a cost of
$150. The marginal time needed to instruct a
cafeteria worker on implementing this tool will
take an estimated extra 20 minutes. Costs are
determined by taking the estimated costs of an
additional 20 minutes ($150/6=$25).
School $25.00
Costs to School
20 min
Cafeteria Worker
Training
The costs of cafeteria workers attending the
training are taken into account as well, as workers
are compensated for required additional training.
Costs for this additional 20 minutes in training is
estimated by using hourly wage of LAUSD Food
Production Assistant.
School $5.00
1 hour
Implementation
Costs
The default option requires a rearranging and set
up of the cafeteria food, and implementation costs
are calculated using estimated time it would take a
LAUSD Food Production Assistant to make these
changes.
School $15.00
2 hours
Approval from
Food Services
Dept.
To make changes at the cafeteria level, school
administrators will need to gain approval from the
Food Services Division before they can implement
this tool. Approval costs are estimated using
Principal median salary and two hours over a time
period of two weeks dedicated to getting approval.
School $112.85

114
Table 5: Framing Option
Expense Description Expense
Level
Estimated
Costs
Costs to Common Threads 20 min
Cafeteria Worker
Training
Common Threads provides a 2-hour Small Bites
training for a minimum of 12 teachers at a cost of
$150. The marginal time needed to instruct a
cafeteria worker on implementing this tool will
take an estimated extra 20 minutes. Costs are
determined by taking the estimated costs of an
additional 20 minutes ($150/6=$25).
School $25.00
Costs to School 20 min
Cafeteria Worker
Training
The costs of cafeteria workers attending the
training are taken into account as well, as workers
are compensated for required additional training.
Costs for this additional 20 minutes in training is
estimated by using hourly wage of LAUSD Food
Production Assistant.
School $5.00
1 Hour
Design Costs of
New Names
The framing option requires creating new and fun
names for the fruit and vegetables of the day.
These design costs are calculated using estimated
time it would take an LAUSD Food Production
Assistant to design these names.
School $15.00
1 hour/month
Design Costs
(Replacing New
Names)
The framing option includes the variable costs of
consistently updating names of the fruits and
vegetables to sustain the size of the effect. These
variable costs are calculated using time it would
take an LAUSD Food Production Assistant to
design these names each month (8 additional
school months).
School $120.00
2 hours
Approval from
Food Services
Dept.
To make changes at the cafeteria level, school
administrators will need to gain approval from the
Food Services Division before they can
implement this tool. Approval costs are estimated
using Principal median salary and two hours over
a time period of two weeks dedicated to getting
approval.
School $112.85

115
Table 6: Model LA Unified Elementary School Used for Policy Option Analysis174
Grade Avg Class Size # Classrooms
K 22 5
1 23 4
2 23 4
3 23 4
4 27 3
5 28 3
Total 24 22
174
Based on data from Ed-Data. "Los Angeles Unified School District: 2015-16." Accessed February 10, 2017,
http://www.ed-data.org/district/Los-Angeles/Los-Angeles-Unified.

116
Table 7: Internal Behavioral Tools Package
Expense Description Expense
Level Estimated
Costs Costs to Common Threads Stickers Stickers come in a pack of several sheets, and
each teacher will be provided a sticker pack for
the duration of the Small Bites Curriculum (8
weeks).
Classroom $5.00
Goal Setting
Worksheets
Teachers will be provided with the worksheets
for setting a goal. There is 1 goal sheet per
lesson, so each student should receive 8 goal
sheets throughout the program. Average
printing costs are $0.02/sheet.
Individual $0.16
15 min
Teacher
Training
Common Threads provides a 2-hour Small Bites
training for a minimum of 12 teachers at a cost
of $150. The marginal time needed to instruct
teachers on implementing this tool will take an
estimated extra 15 minutes. Costs are
determined by taking the estimated costs of an
additional 15 minutes ($150/8=$18.75) and
dividing by the minimum number of teachers
attending (12).
Classroom $1.56
Costs to School 15 min
Teacher
Training
The costs of teachers attending the training are
taken into account as well, as teachers are
compensated for required additional training.
Costs for this additional 15 minutes in training
is estimated by using average LAUSD teacher
salary.
Classroom $10.80
15 min
Teacher Time
Time it would take a teacher to pass out all of
the stickers and worksheets to each student and
have them complete it. Costs for additional 15
minutes of work spent on Small Bites program
is estimated by using average LAUSD teacher
salary.
Classroom $10.80

117
Appendix F: Qualitative Interviews and Observations
Interview #1: M.V. (Elementary School Teacher)
Interviewer: Describes research and what the interview will cover. Asks permission to
record, which is granted.
Interviewer: So the first thing I want to ask is what grades you teach.
Interviewee: Second and third grade, and I teach a special day class.
Interviewer: And what is a special day class?
Interviewee: It's for students that have mild to moderate learning disabilities or learning
[inaudible comment].
Interviewer: So the first question that we wanted to ask is, do you currently teach any
form of nutrition education?
Interviewee: We do Harvest of the Month, or I do Harvest of the Month, which is a fruit
or a vegetable determined by our nutrition department, and then we teach all about that. And then
the nutrients of it and the food group, where it comes from and different things and then the
students try it. They eat it. They try it.
Interviewer: Oh, great.
Interviewee: Yeah, but I'm not really doing the MyPlate to be honest.
Interviewer: Is this nutrition education something that all classes at Barton does? Or is
this something that you personally like to implement?
Interviewee: Classes at Barton do it. It's for schools that have a certain percentage of
students who are on a free lunch and breakfast. So those schools get the program.
Interviewer: Got it. And so for Harvest of the Month, how much time in a typical year
is dedicated to that?
Interviewee: Just for my part or the whole –
Interviewer: If there are two different versions we'd love to hear both.
Interviewee: Well I don't know how much – the people in the nutrition office who put it

118
together, 'cause they send the teachers a whole slide show and a parents' education pamphlet, and
then the teacher gets one. And so they're all putting that stuff together. And then my part is
teaching from the slide show and there's like a booklet that goes with it, like a student workbook.
So I don't know. My part is probably for prep is probably maybe just 20 minutes but for the
actual teaching it's probably an hour. So I don't know.
Interviewer: And this happens once a month?
Interviewee: Yes, once a month.
Interviewer: Great. And the other thing we wanted to ask was just relative to the other
lessons that you have to teach your students, how important do you personally find the nutrition
education portion?
Interviewee: In comparison to the other stuff? I would not rank it at the top. Maybe fifth
on the list maybe. I know that sounds bad but it's true.
Interviewer: No, we completely understand. And one of the things that we wanted to
glean from this is we know that teachers have a lot of constraints and so we just want to figure
out what those are.
Interviewee: Right, right. Okay, that's good.
Interviewer: So do you see any benefits from doing these education lessons with the
students when you do Harvest of the Month? Or do you see any problems with it?
Interviewee: I don't see any problems with it. I see the benefit because a lot of my
students hadn't tried the fruit or the vegetable before and then they'll tell me the next day or the
next week that they saw it at the store and they asked their parents to buy it. They get really
excited about it, which I like to see. So I do see a big benefit from it. They're trying something
that they've never tried before and if they like it they're asking their parents to buy it.
Interviewer: And it sounds like the Harvest of the Month that you do is inside the
school. But how likely would you or the school be to adopt a third-party curriculum? So working
with an organization outside of the school to adopt a nutrition education program?
Interviewee: Well I would be open to it. I'm not sure how much other teachers would. I
guess it would depend on how much time per week or per day or whatever it would take to
implement the program I think. That would be a major factor I think.
Interviewer: Right. So we have four different slight versions to this curriculum, so we
just want to ask you a question about each one. How likely would you be to support nutrition
education in the form of completing a goal setting worksheet and a food diary type of worksheet

119
in the classroom?
Interviewee: I don't know. That would be what the students were eating at home and at
school. I don't know. Is that what you mean? They would be tracking what they're eating at home
and at school?
Interviewer: Our initial idea was setting a goal to consume the healthy food from their
school lunch. So when they go to the cafeteria, if they get fruits and vegetables, to actually set
the goal that you [crosstalk] –
Interviewee: Oh, okay. Yeah, I would do that.
Interviewer: And how likely would you be to support handing out stickers to encourage
eating their healthy food at lunch?
Interviewee: Oh, I would do that.
Interviewer: Do you find that there's a lot of student response to stickers?
Interviewee: My students might because when they try the Harvest of the Month there's
an I tried it sticker that they get and they seem to really like that. And then it helps them when
they go home, their parents ask them what did you try? And then that [inaudible comment due to
crosstalk].
Interviewer: And then the third one –
Interviewee: Sorry. My principal's on the loud speaker. Okay, go ahead.
Interviewer: That's okay. The third one would be, and I know this is outside of your
control, so I guess just your response about the school's openness to this. But rebranding some of
the school foods to make them sound more appealing to kids. So changing the names of the fruits
and vegetables to fun names to make them sound more appealing.
Interviewee: I don't know. 'Cause I think with the name change all the way, like a
totally different name than what it really is? Or it would be like – or would it be a cute name in
combination with the fruit name or the vegetable?
Interviewer: Yeah. Sorry, I should have clarified. So not completely changing the name
to not say what it is, but for example power peas. So it's the name of the fruit or the vegetable but
trying to make it sound, I don't know, cooler or more [crosstalk] –
Interviewee: Yeah. Actually I think that's a really good idea. I don't know how open the
school would be, but yeah. I like that idea, too. It would make the kids feel more like a

120
subconscious message like if you eat peas you're gonna have more power, you'll have more
energy or whatever. Whatever it is.
Interviewer: And then the last one of our four different versions is kind of like setting
default in the lunchroom, so where they're automatically given a healthy option and then they
have to ask if they want something else. I'm not really sure how your school cafeteria does it
where they have to get everything.
Interviewee: Yes, they have to get one – yes. It's pretty much a set lunch that they have
to get. They could choose yogurt or the main entrée. They have two choices. If they don't like the
main entrée they can get a yogurt, but that's about it as far as choices.
Interviewer: And then we have two more questions for you. Would any of these
interventions make a nutrition education program more appealing to you if you knew they were
shown to improve consumption of healthy food?
Interviewee: If the data showed that they worked?
Interviewer: Yeah. Would it be –
Interviewee: Yeah, definitely that would be more appealing for sure if it had already
been studied and it had shown that it works. Yeah.
Interviewer: And then my last question, and please don't hold back on this, what
barriers or challenges would you anticipate or applying any of these into your school or
classroom?
Interviewee: The biggest challenge would just be the time. It would just be getting it
into my schedule. That would be the biggest challenge I think. And I think for most of the
teachers because we have a STEM program, an engineering program, there's all kinds of things
that we have and it's hard to even do the basics, just the basics. Teaching the kids how to read
and math and writing, and so anything extra is really, really difficult. Even though it's super
important and necessary, it's really hard. It's really hard to do it.
Interviewer: Okay, I think those are all of our questions.
Interviewee: Okay, I hope that helped.
Interviewer: It helps a lot. We really appreciate it. Getting teacher feedback is the most
important. Because if you don't have time for it there's no point in what we're doing. So we want
to make sure we can produce a really good project.
Interviewee: Yeah, it sounds very exciting.

121
Interviewer: Hopefully.
Interviewee: Yeah, because nutrition education is really lacking. We don't really have a
curriculum to follow. Years ago we got some information about My Plate and that's kind of it.
We got like a poster of the plate and that's it. We don't have any materials really or anything
except what we find on our own.
You picked a really good topic to go on for sure because really I don't have anything in my
classroom except what I bought myself. Yeah, I would as a teacher loved more direction with
that kind of thing. I'm not like an expert on nutrition or anything. So yeah. It's a great idea.
Really good.
Interviewer: Yeah, the organization we're working with partners with schools but they
have created a curriculum. So it's a lot more about implementation than having the teachers have
to come up with their own.
Interviewee: Which is awesome. That's awesome. Yeah, I would say that's what we
need.
Interviewer: Great.
[End of Audio]

122
Interview #2: M.G. (Principal)
Interviewer: Nice. And then I think that your school actually does quite a bit around
cooking and nutrition, but could you tell me a little bit about how you currently teaches nutrition
education?
Interviewee: In order to receive nutrition education is basically you have to take an
elective of nutrition/culinary class. We also have an afterschool program through our culinary
class that works with the students. But other than that, if you didn't take that elective class you
wouldn't have much information on healthy eating habits.
Interviewer: Okay. And then the afterschool class and the smaller unit class during the
school day, are those taught by Santee staff or do you partner with an outside nonprofit or
something?
Interviewee: So the school, during the school day, the teacher has an afterschool it is a
partner.
Interviewer: And what's the name of the partner?
Interviewee: Her name is Mel Nicolia. She's just an LAUC volunteer. And then through
her connections they do yoga and – 'cause she's a chef so she invites some of her friends to come
and work with kids and their parents.
Interviewer: Very cool. And then in general, how important do you find student
nutrition kind of like relevant to I imagine many other concerns that you have about running a
school?
Interviewee: I mean it's definitely with the high rates of diabetes between African
American and Latino students, that's 99 percent of our students, I would say very important.
Interviewer: And do you see any primary benefits from most nutrition education
programs?
Interviewee: Yeah, I mean the kids that are in it they learn to not only learn what is
healthy food but also they learn how to cook it and how to cook traditional Hispanic food in a
healthier way.
Interviewer: That's awesome. And do you see any weaknesses in general of nutrition
education programs or yours specifically?

123
Interviewee: For me specifically the challenges that it's not an A through G approved
course, so if you think about the college-bound kid that wants to be Valedictorian or that wants
to be the top kid, they're not gonna take that class because it's not gonna help them on their
college application much.
Interviewer: Right.
Interviewee: So they do get elective credits but it's not like an A through G approved.
It's a culinary art, so you can take culinary art or an art class. No, they still have to take art, they
still have to take their other elective stuff. This is just an extra fluff, what they would call like a
fluff class.
Interviewer: So are there certain types of students that you see that are more likely to
take that course?
Interviewee: I would say, I don't know, if you know the avid programs, but it would be
like our – kids that are not failing other classes, because those kids are trying to make up their
courses. But like the DCB kids that are middle of the road type kids that [inaudible comment due
to audio cutting out] – they're not failing classes so they have room in their schedule to take
more electives.
Interviewer: Gotcha.
Interviewee: And then every once in a while you get the high flyers that want to do
culinary professionally and have great grades and they do a great job in the kitchen as well.
Interviewer: And then how actively do you manage or can you manage the nutritional
offerings in the schools, like the lunches offered to the kids or do you have vending machines or
do people do bake sales? That sort of thing.
Interviewee: Can you repeat that question?
Interviewer: How actively do you kind of manage what food is offered in the school? I
know with the free and reduced lunch program, correct me if I'm wrong but I don't think that you
have too much control over which lunches are offered through that program unless you have
another vendor.
Interviewee: We really don't have a say as to what food is offered, like it's through
LAUSD, through the district and they pretty much set the menu. The kids when they go into the
lunch line they do have an option usually between two different options. It's a pretty strict
requirement as to what they can sell in the vending machines.

124
It has to meet the health requirements, so a lot of the stuff when I was in school, probably when
you were in school they don't sell in the vending machines anymore. It's a strict guideline that
schools and vendors have to follow.
And you said something about bake sales or other types of sales, legally schools are not allowed
to compete with the cafeteria food. We can't sell stuff at the same time that lunch is going on. So
we don't bring an outside vendor to sell to our kids during lunchtime, so our kids either get the
cafeteria food or they don't eat.
Interviewer: Gotcha. Then I know you currently are doing an in-school class on
nutrition education, but if you weren't given the constraints of working within LA Unified
School District, would you be likely to adopt a third-party curriculum for a nutrition education
for the whole school?
Interviewee: Yeah, that would be the decision of the teacher. If the teacher enjoys the
curriculum they have – my big thing is if we can have a push to make it an elective that matters
in the A through G course that would be great. Then we can change the type of kid that goes in
there.
Interviewer: Gotcha. So for the most part you'd say it's kind of up to the teacher what
curriculum they could use?
Interviewee: Yeah. I mean as long as it meets the standards and the things that they're
supposed to teach I don't see any – as long as the kids are engaged and the teachers enjoy the
curriculum I don't see a problem with it.
Interviewer: Okay. Now I'm gonna ask you about specific types of interventions, and I
should preface this by saying that the population that we're specifically working with is third
through fifth grade, so I know that some of the options might seem not really a good fit for your
high school students, but just thinking about how these types of interventions just might fit in
with the school day in general.
So how likely would you be to support these actions in your school? So the first one is within a
nutrition program completing a goal-setting worksheet with a food diary to kind of help kids take
ownership and commitment with their personal nutrition.
Interviewee: Within the class? Yeah –
Interviewer: Yep.
Interviewee: [Inaudible comment due to audio cutting out]

125
Interviewer: And then handing out stickers to encourage healthy food choices before
lunch, so this gets at the idea that people like to reciprocate good actions. So if a teacher gives
you a sticker and says thank you for making a healthy choice at lunch today, students have been
shown to be more likely to actually make healthier choices. Although this is up to eighth grade. I
don't know if it would apply to high schoolers.
Interviewee: The kids like stickers and they like positive reinforcement. So I think any
nice little thing like that would be a plus.
Interviewer: Okay. Then the other two questions are around kind of the lunch itself.
Would you be willing to support kind of rebranding the school lunch to make them sound more
appealing? An example of this might be having students rename all the fruits and vegetables.
Like in elementary school it might be something like x-ray vision carrots or something like that.
Interviewee: Yeah, that's a little too elementary-ish I think.
Interviewer: And then the next the school lunch option is to provide a default option.
So you mentioned that your students get kind of two different lunch options. Would you be
willing to make the healthier option kind of the default that they would automatically get handed
unless they specifically requested the other option?
Interviewee: I don't know if that's an issue with the cafeteria. [Inaudible comment due
to audio cutting out] as long as we can [inaudible comment] the other.
Interviewer: Oh, sorry. Could you repeat that? It cut out a little.
Interviewee: I don't know if that's an issue with the cafeteria manager, whether we hand
one item over the other. I do know that everything that is in the cafeteria, and I'm sure someone
with _____ everything is approved to be under the health requirements and so they would
probably push back and say everything that we give is healthy. But I think what you're saying is
hand out the healthier one.
Interviewer: Mm-hmm.
Interviewee: Yeah, I don't see a problem with that. However, I don't know if it's
allowed.
Interviewer: Okay. Specifically allowed by the person that manages your cafeteria or
by the USDA Food Services?
Interviewee: Well I'm sure that the cafeteria manager would be able to tell you rather
quickly the answers to that.

126
Interviewer: Okay.
Interviewer: So the first is kind of thinking about adopting kind of an entire nutrition
package for your school. So that would be things like the goal-setting worksheets and the stickers
and maybe changing where the cafeteria salad bar is located, kind of as a whole kind of
environmental intervention to help improve nutrition. Is that something that if it was a low cost
for you to implement that you'd be interested in?
Interviewee: It would just have to rely on the teacher. So at my school the teachers have
funding for the program. And if it's something that catches their attention then they would be the
ones that would fund it out of the budgets that we give them.
Interviewer: Go ahead.
Interviewee: So it would have to be something that they would want to buy into and
own.
Interviewer: Okay, is that practice common across other schools or is that unique to
your school?
Interviewee: I think it depends on – personally as a principal I wouldn't want to force a
curriculum on a teacher that may not believe in it. Or if they already have something that they
deem similar, I wouldn't want them to spend money on something that they're doing or
something that they may be doing better.
Interviewer: And is that something that you've heard at other high schools? For
example, that they do that as well?
Interviewee: Yeah, I would say in general at the high school level the principals would
definitely speak with the teacher ahead of time.
Interviewer: And we had talked a little bit about some of the kind of barriers or
challenges that might happen with making any changes to how the school lunch was offered or
doing defaults. But would you anticipate any other barriers for your school implementing
interventions like this other than as long as the teacher is interested?
Interviewee: Can you repeat that again? I'm sorry.
Interviewer: Sorry. Would you see any other barriers or challenges for implementing
different nutrition curriculums or interventions, like the handing out of stickers or things like
that?

127
Interviewee: No. I think the biggest challenge would be if it sticks to the curriculum of
the teacher and then as always making sure that the rules and regulations of the district are
followed when it comes to different things like handing stuff out or changing the name of things.
But with regards to the class, making sure that the big sell needs to be with the teacher ahead of
the principal. They're the ones that would go vouch for the program.
[End of Audio]
Interview #3: A.O. (Assistant Principal)
Interviewee: I taught Social Studies. That would be mainly focusing on seventh grade
and eighth grade Social Studies.
Interviewer: Okay, great. And then could you tell me a little bit about how [y] currently
teaches Nutrition Education?
Interviewee: I believe that it is taught through their science curriculum in the seventh
grade. I'm not so well informed on the sixth grade curriculum, if they see or hear anything
through their sixth grade science class, or the eighth grade. I'm pretty sure that the eighth grade
science curriculum does not have - doesn't focus on the eating habits or nutrition, but I'm very
sure the seventh grade does.
Interviewer: Okay, great. Thank you. And then obviously, you have a whole school to
be concerned about. So how would you say - how would you rank Nutrition Education relative to
the other concerns that you have about your school and your students?
Interviewee: I think that the Nutrition Education is, I think it currently falls short, to be
honest with you, based on the current needs and trends that I see, you know, our kids in terms of
their consumption, food consumption. In the last few years, you know, I don't know if this
answers your question, but in the last few years, I do - I have seen a tremendous increase in the
consumption of food that is, you know, opposite to healthy and actually very unhealthy food. It's
an all-day from morning to lunch that I see kids, you know, digging into their bags of chips or
into their candy, and I believe that, I mean, whatever the curriculum is in the seventh grade,
clearly it's not sending the message. I believe also that the message should be - any curriculum
should also involve the whole. Yes, because parents play a, you know, obviously, parents play a
big role in this. And I am going to say that parents, our parents, anyway, they play a role not in
the playing game of you know, what their kids are eating, but they're certainly not helping.
Interviewer: Right. That makes sense. And then do you or another one of the Carver
Middle School staff actively manage kind of what food is offered by the school? By this I mean,
do you choose what might go into vending machines if you have them or monitor bake sales or
other food fundraisers?

128
Interviewee: I can't say that I do. And this year, I am, you know, the administrator over
the cafeteria and I work shoulder to shoulder with our cafeteria manager. We also have a student
store that sells, you know, again, we are part of the, you know, eliminate that with a stakeholder
that needs to improve and clean up their act because they also sell chips and other things. Now
the chips that they sell, I'm not very well versed on chips and qualities and calorie intake of the
chips that we are selling, but I believe that they are not the usual, you know, Doritos, Cheetos,
and that kind of more popular stuff among the kids. So the chips that we do sell here at the
school are probably I'm going to say a little bit of a healthier kind of a quality, if that actually
exists. Yeah. And in terms of the food that they eat from the cafeteria, we do not have any - I do
not have any control over that, because that menu is put together by higher powers at the District.
Interviewer: And then do you know or could you tell me what the process might be if
you wanted to kind of lobby to change what was offered in the school lunchroom or how it might
be presented?
Interviewee: Say that again.
Interviewer: So you mentioned that the items that are offered for school lunch are kind
of, like, the higher power, the Food Services Division of the District.
Interviewee: Of the District, right.
Interviewer: Do you know if there's any process by which the school could ask the
District to change any of that? Or is that not an option?
Interviewee: I don't know if it is an option, Interviewer. I don't know about the process,
yeah. This is the first year that I'm working with the Food Services personnel here at the school.
So I would have to ask, you know, and I would start with my cafeteria manager if we could as a
school independently of the District, could we, if we could offer some alternative to what the
District, you know, recommends.
Interviewer: Okay. Could you tell me a little bit about what the relationship is between
you and the food manager in the cafeteria. Like how do you work together?
Interviewee: Sure. The lady, Miss Jenny Martin her name is. It's a very collegial and
professional relationship to begin with. My role with her is that her staffing, she informs me of
her staffing whenever is short for any reason or whenever she needs personnel, she comes and
informs me. Pretty much Miss Jenny, Miss Martin manages the operations of the cafeteria,
because that is the way that it is supposed to run. I am working with her, but she manages - she is
the manager. You know, she's a manager. And so she manages the staff. She manages their hours.
And so basically, at this point the way that it works, she just keeps me in the loop, so to speak.

129
Interviewer: Okay. And so she works for the District, not really the school, right?
Interviewee: That is it. That is correct, yeah.
Interviewer: Okay. Great. That's really helpful to know. Okay. And then in terms of
nutrition curriculum, how likely do you think your school as a whole school would be to adopt a
third party curriculum for Nutrition Education if it was Common Core aligned and went with
State standards?
Interviewee: We would have to definitely discuss it, Interviewer and I, but to which
grade would you-- would it be for the entire school? So the question is would it be for sixth,
seventh and eighth grade students? Or just focusing on one grade? You know, how would you
envision this? To the whole school or just a specific grade?
Interviewer: For so, probably I'm curious about both. So as a whole school.
Interviewee: As a whole school.
Interviewer: How likely would you be?
Interviewee: We would have to - I think that - let me see. Let me ask then another
question. Would it be embedded through, let's see, shall we say, through a science class?
Interviewer: It could definitely be embedded within another class, because I know that
makes it easier for teachers to implement.
Interviewee: Right. Because I'm trying to think where it could be, you know, embedded
in the curriculum. Certainly if it's within science classes, specifically in the seventh grade,
because the seventh grade science class as far as I know, it has a huge unit on Health, right. So
that is the subject of the seventh grade curriculum. I'm not so well-informed of sixth grade. I
think that eighth grade science is more about organic matter, okay. And so I'm trying to think if it
were not possible to bring it through the science classes, there is another - We have a homeroom,
right. We have a home room. We also, we call it Advisory. So it's a 20-minute block of time, the
first 20 minutes of the school day, and I'm wondering whether we could, you know, present the
project by adding it and presenting it through the homeroom classes. Now currently, we have the
homeroom where we have curriculums being taught by teachers through our homeroom. They
have to do with Restorative Justice practices. Teachers are supposed to be running community
building circles, talking to the kids about their grades and, you know, that kind of like us, to
improve our school climate, overall school climate. So there is two curriculums that the teachers
are running through their homeroom. One of them is again Restorative Justice curriculum and
practices, and the other one is called Second Set, which is another kind of a little bit similar to
Restorative Justice, but the whole effort is to improve our overall school climate and improve
student to student and student to teacher relationships. So if we were to infuse this health

130
nutrition curriculum, how long would you say it would take? I mean, does it require an hour
every day? Is it an hour every single day or is it an hour once a week? What is the logistics of it?
Do you know at this time?
Interviewer: Sure. The curriculum that we're looking at is currently there are eight
lessons. Each lesson is about an hour long, but the teachers have the flexibility to do the lesson
whenever it's just most convenient for them throughout the school year.
Interviewee: Okay.
Interviewer: So it would be eight hours total for the whole year.
Interviewee: Eight hours for the whole year.
Interviewer: Mm-hmm.
Interviewee: Okay. That sounds - An hour each - For the whole year. And in your
summation, does it include also activities that are involved that can be done in that one hour
block of time?
Interviewer: Yes.
Interviewee: Okay. So eight lessons. And what would be the culminating activity? Is
there some sort of culminating conclusion or activity to it?
Interviewer: Sure. So as the curriculum currently stands, each lesson also has like a
food making component. So students would also like learn about the different nutrients, about
proteins and then also kind of make their own snack at the end of the lesson. And then we are
also considering adding some additional things into the curriculum that we think would make it
more effective, such as goal setting and different kind of behavioral interventions that we think
would increase the effectiveness of the curriculum.
Interviewee: I see. Would the teachers require any kind of training to impart this
curriculum?
Interviewer: There would be initial training. It's probably an hour of training that would
happen before the school year starts.
Interviewee: So this is being projected to get it running if, you know, if we can
implement it to get it running for the next school year, is that correct?
Interviewer: Yeah. So we're actually, we're partnered with a non-profit that currently
does regular nutrition education in schools, and they do this model that I've been talking about.

131
And they're called "Common Threads," and we're working with them to increase the
effectiveness of their lessons because, you know, like you said with the seventh graders at your
school, the regular nutrition curriculum doesn't seem to be really creating changes in what kids
are eating. So we're trying to come up with ways to make their curriculum better.
Interviewee: Okay. So we would have to have the teachers present, I presume sometime
during their summer school vacation, so that they can go to the one hour training, is that correct?
Interviewer: Mm-hmm.
Interviewee: Okay. So that they could try to begin to implement it at the beginning of
the year and proceed with the lessons. You know, I can definitely, Interviewer, it sounds, you
know, it sounds like it is and I believe that it is a very needed instruction that our kids need to,
you know, need to know. I can certainly present it to my principal and, you know, and the other
admin, and Miss Jenny, Miss Jenny Martin the cafeteria manager, I'm sure that she will play a
very, you know, we can have her play a definitely active role in this. And we would have to, you
know, relate this information to my principal, Natasha Buck to see if we can, you know, I don't
know as I talk to you right now, I don't know if we are going to have the teachers at any time
during the summer. And I remember that last year during the summer there was, we had the
teachers and this was a whole new theory kind of a training that we had. We had them here for a
couple of days but it was voluntary that they, you know, they were able to come during the
summer for two days for a training. And clearly not all the teachers came on that day. So I'm
trying to, what I'm trying to say is, I want to know from Miss Buck if she plans to have the
teachers during summertime for any kind of training. And we could, you know, have a one hour,
hour and a half portion of that training dedicated to this project, you know, so that perhaps it
could be implemented here in the coming year.
Interviewer: Sure. So right now, I am more than happy to send you the information
about the non-profit that we're working with if you are interested in doing this implementation.
Right now, what I am just interested in is kind of understanding how the different L.A. unified
schools work to see how we could just best help our non-profit partner improve their curriculum.
Just don't worry, this isn't - I'm not trying to sell you specifically on this curriculum, especially if
your school already has something, although I'm happy to send you the information. But that was
all very helpful information for us to know.
Interviewee: Have you - have you implemented this curriculum to any other L.A.
school as we speak?
Interviewer: Yes. So, the non-profit that we're helping out does have this curriculum in
several L.A. unified schools right now, and they offer grade-targeted curriculum for grades three
through eight. But for our just kind of general research purposes, we're just trying to understand
the general L.A. unified environment so we can make recommendations to them for future
improvements.
132
Interviewee: Sure. Sure. What are some of the schools that you have been working
with?
Interviewer: I don't know the names of the schools that the non-profit is partnered with.
Right now, I'm just contacting folks to just get more information for the non-profit and for our
Capstone project.
Interviewee: Okay. Okay. Okay, so why don't if you do me a favor then, send me the
non-profit information.
Interviewer: Sure.
Interviewee: I will relay it to my principal, to Miss Buck, and discuss the possibilities
of initiating, you know, we could start by thinking about what date will be a feasible date during
the summer to have the teachers, you know, be here and be presented with information that they
need in order to implement this program here. You know, I'm going to run it by Miss Buck and
you know, if you send me the e-mail, we can discuss it at greater length. And, you know, if she
says it's good to go, then I'm fine with it. You know, I will be really happy to support this for
next year. I know that the school is going to go through some transition for next year,
Interviewer. Currently, we enjoy, we do enjoy we have the principal and three other
administrators. But for next year, that number, the number of administrators and/or APs is going
to most likely change drastically. So what I'm trying to say is that even I might not be here next
year, because of the number of students, you know, every year we lose a large number of kids to
the surrounding charter schools and, you know, for all of the reasons. So but as far as I know,
you know, I don't know who - which one of us is going to be here next year, but, you know, I can
give the dual support if Miss Buck decides and tells me, you know, let's run with it, I will give
this project the dual support, you know, until, you know, until I know whether I'll be here next
year or not.
Interviewer: Sure. I'm definitely happy to send you the information if you're interested.
Just a couple more quick questions.
Interviewee: Sure.
Interviewer: So if, for example, the seventh grade science teacher wanted to adopt a
third party curriculum, would they just be able to do that themselves? Or would they go through
you and other administrators?
Interviewee: That's a good question. I don't know. I mean, yeah, I don't know the
answer to that question. If we just -
Interviewer: Okay.

133
Interviewee: Decide to just go with a segment, right, a seventh grade portion of the
school, I don’t know if we can, you know, if we can just implement it here locally. And because
it is one hour sessions, right.
Interviewer: Mm-hmm.
Interviewee: So it would have to be, you know, I don’t know if we have to alert
somebody in the District. Or I just don't know about that kind of promising that it will require.
Interviewer: Okay.
Interviewee: But, you know, but if it is doable with just with the seventh graders, you
know, just implement activities or lessons throughout the year, you know, I'm pretty sure that it
can be done. But in terms of injecting this new curriculum on top of the science curriculum, I
don't know if we would have to, you know, get some sort of permission or anything like that or
it's a local type of decision, you know.
Interviewer: Okay. And then I just wanted to get your opinion on some things that
we're thinking about adding to the curriculum. So one thing that we were thinking about adding
on top of kind of the traditional education is doing some goal setting and food diaries. In your
experience with students, do you think that that would be helpful?
Interviewee: Food diaries?
Interviewer: Yeah. And some teaching kids about goal setting.
Interviewee: Sure, sure. I think so. I would think that it would be a beneficial, you
know, addition to the lessons and to the activity.
Interviewer: Okay.
Interviewee: I think so, yes.
Interviewer: Another idea that we had is handing out kind of these unconditional small
incentives. So we were thinking about recommending that teachers after or before lunch hand out,
like, stickers or buttons or something to students and just say, "Thanks for making a healthy
choice today," kind of getting at this idea that, you know, if somebody gives you something,
you're more likely to want to respond to that gift.
Interviewee: Sort of like commitment kind of buttons type of thing?
Interviewer: Yeah, mm-hmm.

134
Interviewee: Like I commit to, you know, make healthy - Yeah, I think so. You know, I
think that - I think that, you know, well, I'm thinking that the teachers, that the teacher plays a
very important part, Interviewer, in how should I say? In applying this curriculum, right.
Interviewer: Yes.
Interviewee: And, you know, and I'm sure that you know this, that if the teacher is very
much of a - excited about the curriculum and, you know, presents it in an important - in an
interesting fashion and is excited and kind of buys into the curriculum and helps the students also
buy into the curriculum, I think that buttons like that, commitment buttons, and I say this because
we do use wrist bands and I think we have used stickers in the past, where, you know, students
show their commitment as to stay drug free, you know, and so these are perhaps that the District
has been implementing for a while. So this, a button where the kids demonstrate their support
and solidarity to healthy eating I think would be a good idea.
Interviewer: Great.
Interviewee: Yeah.
Interviewer: Another idea that we had, which I think would be - would have to go
through the Food Services Division, but I wanted to get your opinion if you thought it might
work for kids, is kind of this idea of rebranding or renaming school lunches and the healthy
portions of school lunches to make them sound more appealing. So this may be, I don't know, it
would be a good target for a middle school student, but some things that we've seen be effective
are, like, renaming carrots, like, "x-ray vision carrots," or renaming water "spa water" instead
regular water. Do you think that kids would respond to that sort of rebranding?
Interviewee: I would think so. Again, presented in a very attractive fashion in a very
attractive way and being spoken about in a very - dynamically, I think that it could take off. Yes.
Interviewer: Okay.
Interviewee: Because kids, that's the language that kids, you know, speak about this.
Everything has a, you know, you look - you look at any normal, good, old-fashioned catalogue
and all kinds of shoes have names now, you know, and [laughs] and blouses and shirts and pants,
they all have it. It's not just pants anymore, it's just some sort of name. So I think that it's the new
trend and it would be, you know, applying what the kids are used to already and they see it on a
daily basis.
Interviewer: Okay. Great. And then I don't know if this would work with the - with
how the cafeterias are currently set up, but having the student lunch kind of default to, like, the
healthiest option. I know students currently get to pick a couple different options for lunch. But

135
having it kind of default to the absolute healthiest out of those options and then kids would have
to ask to have it changed.
Interviewee: Yeah, that would be something that I would have to, you know, research
with Jenny to see if it could be done.
Interviewer: Okay.
Interviewee: Yeah.
Interviewer: No problem at all. And then do you see, I know that your school is
undergoing some transitions, but do you see any other barriers or challenges for implementing
any of the ideas that I just talked about in your school?
Interviewee: None that I can think of. Interviewer, again, I'm not well-versed in the
protocols and diplomacy of the District. I mean, you said that you have already implemented this
project in some of the L.A. unified schools, so that is why I would be interested to find out if
they found any difficulty in red tape, in, you know, getting, you know, I don't know, permits or
okays from personnel in the District. So, you know, but what has been the experience of other
schools in terms of bringing in this third party program having to do with nutrition, I would like
to know what was their experience in getting this enacted on the campuses, you know, and
accepted by the District.
[End of Audio]
Site Visit to LA Unified Elementary School Small Bites Curriculum Observation and Interviews
Attended: Hiroto, Sydney, J.B.
23 February 2017, 11:00 am - 1:00 pm
J.B. Notes
● Teacher Training
○ CT prefers in person, but also does online
○ Timing of when training happens is at discretion of partner organization
■ Some do it in summer, some do it on professional development days
○ In person takes 2 hours
○ Online takes 1 hour 40 minutes (no demonstrations)
○ Teachers get professional development credit for doing the training (necessary for
LA Unified teachers to get these credits)
○ Training is mostly done by Trainer Facilitators, though James is open to the idea
of using chefs as trainers if they are well trained themselves
○ Costs $150 for training

136
■ This includes the trainer, between 12-25 or 30 teachers, supplies, and food
for demonstrations (min 12 people required for training)
● Los Angeles programs
○ ~15 sites doing the cooking classes
○ 205 sites doing Small Bites
■ 45-50 during academic year, 100-110 during the summer
○ Partner orgs outside of schools include: LA’s Best, Beyond the Bell, Youth Policy
Institute, LA Conservation Corps
● Logistics
○ Varies who pushes for the curriculum, can be teacher or can be principal
■ Both are the drivers of the implementation
■ Teachers are “our champions”
○ Some schools have the program only in some classes, others have it school-wide
○ Timing of lesson is very variable across schools
■ Varies what days/weeks the teacher does the lesson
■ Standard timing is 1 hour for lesson and snack
■ Used to do 90 minutes, but found that was too long
■ Commented that Mrs. S. was really stretching out her lesson (we were
about an hour in at this point)
Teacher Notes: Mrs. S. ● Happy to answer any more questions, gave us her email
● Taught 3rd grade last year (and the 3rd grade CT curriculum)
● Found that there were differences in book and recipes in online curriculum (Common
Bites)
○ James said that’s because online one is more versatile
○ Slow roll out of Common Bites online version, some teachers like it others don’t
● Parents
○ Very supportive, parents donate all the food/supplies for the lessons (knives, forks,
cutting boards, bananas, etc.)
■ James said that some schools get need-based food donations from
Common Threads, but this school didn’t need that
○ Parents love the program, she will share recipes with them via email from the
online recipes, some students have mentioned that they do the cooking lessons at
home so there is some trickle down effect
● Timing
○ Usually now does it before lunch, found that later in the day the activities riled the
kids up too much but might also do it in the morning (did this for soup so that it
could cook throughout the day and eat it later)
○ Usually preps during recess, prepping takes 15-20 minutes but is quite easy
○ She stretches out the lessons and adds things in from her curriculum and other
things the kids are learning. We saw the lesson/activity for 1.5 hours, likely would
have been another 30 minutes after lunch as well.

137
● Impressions
○ She pulls Small Bites lessons that align with the other curriculum she is doing in
class, find it all aligns really well
○ Everything ties into her curriculum somehow, aligns really well with math. They
are currently working on fractions and they were going to do a worksheet with
fractions for Healthy Hydration.
○ Would absolutely recommend Small Bites to other teachers
○ Loves Kitchen Times, has good fun facts, also uses it for kids homework
assignments
● Obstacles
○ No real obstacles, mostly what comes up is LAUSD tech issues (projector or
internet not working or something)
○ Currently looking more at using the website material now, blending the book and
online curriculum/recipes
● On our policy options
○ Goal Setting - Awesome, could be added into homework which they currently
write 2 paragraphs on the lesson and how they liked the food. Parents still check
over homework so could be a good way to get them involved.
○ Reciprocity - Love stickers, she was surprised she hadn’t already thought about
using this idea. Everyone agreed stickers are the best.
○ Framing - Didn’t know
○ Defaults - Didn’t know
■ 6th grade students are the only ones given options on the entree, not lower
grades but they get to pick a fruit/veggie
Kitchen Observation ● Spoke with the food manager at the elementary school
● She works for the Food Services Division of LAUSD
○ Seemed like she was the only staff for the kitchen, although we didn’t ask this to
confirm
● Kitchen is basically a warming area for food delivered from a central location
● Kids get an option of 2 veggies, 2 fruits, milk, and then one entree (unless they are 6th
grade, then they get a choice between 2 entrees)
○ One of the fruit options is now a “frozen fruit cup” which we didn’t see but didn’t
sound very healthy...
● Food is placed on table in front of the building window (kids line up outside, building is
quite small and separate from the rest of the school, “bungalow” style)
● Based on the setup of the kitchen, don’t think defaults would be easy to do in this
location
● Framing could still be possible, they put a sign out with what’s on the menu each day,
could potentially be customized

138
Appendix G: Sensitivity Analysis and Criteria Alternative Matrices
Table 1: Weighting Sensitivity
Criteria Measures Commitment Reciprocity Framing Defaults
Duration Points 2 1 3 4
Weight 0.3 0.3 0.3 0.3
Score 0.6 0.3 0.9 1.2
Cost-
Effectiveness
Points 1 2 3 4
Weight 0.45 0.45 0.45 0.45
Score 0.45 0.9 1.35 1.8
Political
Feasibility
Points 2 4 3 1
Weight 0.25 0.25 0.25 0.25
Score 0.5 1 0.75 0.25
Total Average Rank 1.7 2.3 3.0 3.0
Total Weighted Score 1.55 2.2 3 3.25
Table 2: Political Feasibility Sensitivity
Criteria Measures Commitment Reciprocity Framing Defaults
Duration Points 2 1 3 4
Weight 0.2 0.2 0.2 0.2
Score 0.4 0.2 0.6 0.8
Cost-
Effectiveness
Points 1 2 3 4
Weight 0.3 0.3 0.3 0.3
Score 0.3 0.6 0.9 1.2
Political
Feasibility
Points 2 3 4 1
Weight 0.5 0.5 0.5 0.5
Score 1 1.5 2 0.5
Total Average Rank 1.7 2.0 3.3 3.0
Total Weighted Score 1.7 2.3 3.5 2.5

139
Table 3: Cost-Effectiveness Sensitivity
Criteria Measures Commitment Reciprocity Framing Defaults
Duration Points 2 1 3 4
Weight 0.2 0.2 0.2 0.2
Score 0.4 0.2 0.6 0.8
Cost-
Effectiveness
Points 3 2 4 1
Weight 0.3 0.3 0.3 0.3
Score 0.9 0.6 1.2 0.3
Political
Feasibility
Points 2 4 3 1
Weight 0.5 0.5 0.5 0.5
Score 1 2 1.5 0.5
Total Average Rank 2.3 2.3 3.3 2.0
Total Weighted Score 2.3 2.8 3.3 1.6
Table 4: Point Values
Criteria Measures Commitment Reciprocity Framing Defaults
Duration Points 2.66 1.33 2.66 4.00
Weight 0.20 0.20 0.20 0.20
Score 0.53 0.27 0.53 0.80
Cost-
Effectiveness
Points 1.11 1.45 2.40 4.00
Weight 0.30 0.30 0.30 0.30
Score 0.33 0.44 0.72 1.20
Political
Feasibility
Points 3.02 4.00 3.89 1.30
Weight 0.50 0.50 0.50 0.50
Score 1.51 2.00 1.94 0.65
Total Average Rank 2.26 2.26 2.98 3.10
Total Weighted Score 2.38 2.70 3.20 2.65

140
Table 5: Internal Behavioral Tools Package
Criteria Measures Commitment Reciprocity Framing Defaults IBT
Package
Duration Points 2 1 3 4 2
Weight 0.2 0.2 0.2 0.2 0.2
Score 0.4 0.2 0.6 0.8 0.4
Cost-
Effectiveness
Points 1 2 3 4 3
Weight 0.3 0.3 0.3 0.3 0.3
Score 0.3 0.6 0.9 1.2 0.9
Political
Feasibility
Points 2 4 3 1 4
Weight 0.5 0.5 0.5 0.5 0.5
Score 1 2 1.5 0.5 2
Total Average Rank 1.7 2.3 3.0 3.0 3.0
Total Weighted Score 1.7 2.8 3 2.5 3.3

141
Appendix H: Small Bites Curriculum Worksheets Examples175
175
Developed by APP Team ROOTS for Common Threads Small Bites Curriculum (2017).

142