Learning and the Lifecourse: The Acquisition of Qualifications in Adulthood
Upload
independentCategory
view
5download
0
Molecular and Cellular Endocrinology I I7 (1996) 41-52
Prolactin receptor gene expression in rat splenocytes and thymocytes from birth to adulthood’
Hatice Giine92, Andrea M. Mastro*
The Pennsylvania State University, Department of Biochemistry and Molecular Biology, 431 South Frear Building. University Park, PA 16802, USA
Received I4 August 1995: accepted I I November 1995
Abstract
In vivo and in vitro studies have indicated that the anterior pituitary hormone prolactin (PRL) is an immunoregulator and functions in the development of the neonatal immune system. In this study, prolactin receptor (PRL-R) expression from birth to adulthood as well as the effect of milk ingestion on the PRL-R expression were examined in splenocytes and thymocytes of neonatal rats. Three approaches were taken to measure PRL-R expression: (i) polymerase chain reaction (RT-PCR); (ii) antibody to PRL-R and Western blotting; (iii) antibody to PRL-R and flow cytometry. RT-PCR analysis revealed the short and long form of PRL-R mRNA in both spleen and thymus at every age tested. However, the long form of PRL-R mRNA was always more abundant than that of the short form. In addition, antipeptide antibody against the long form of PRL-R recognized 84 and 42 kD proteins in the spleen, but only the 84 kD protein in the thymus. A monoclonal antibody U6 recognized 38 and 40 kD proteins in both the spleen and thymus. Although the mRNA level of PRL-R was relatively low at birth and increased with age in both the spleen and thymus, the levels of protein bands detected with both antibodies correlated with development in the spleen; whereas the levels remained steady in the thymus. Therefore, we concluded that the expression of PRL-R at the protein level is developmentally regulated in the spleen but not in the thymus. Finally. milk ingestion in the first seven hours decreased the percentage of cells expressing cell surface PRL-R, suggesting that milk-borne PRL may have a direct effect on lymphocytes.
Keywords: Milk: Neonatal Immunity; Prolactin; Prolactin Receptor: Splenocytes; Thymocytes
1. Introduction
A growing body of evidence indicates that the ante- rior pituitary hormone, prolactin (PRL), is an im- munomodulator. For example, both decreased anti- body production and depressed cell mediated immunity have been observed in hypophysectomized rats (Nagy and Berczi, 1978). Similarly, immunosuppression has been observed after the administration of bromo- criptine, which decreases the circulating levels of PRL to nonhypophysectomized rats. Administration of exo-
*Corresponding author, Tel.: + I 814 8630152; fax: + I 814 8637024.
’ Part of this investigation has been presented in abstract form
(Cell Prolif. 1994, 24:427). This work was submitted by H.G. in
partial fulfilment for requirements of the Ph.D. degree in Biology at
Pennsylvania State University. z Present address: Izmir Institute of Technology (IZTECH), Ana-
fartalar Caddesi, Basmane 35230 Izmir, Turkey.
genous PRL to the rats restored these immune func- tions (Berczi et al., 1981; Nagy and Berczi, 1983) and resulted in an increase in ornithine decarboxylase activ- ity (ODC), expression of the c-myc proto-oncogene and DNA synthesis in both spleen and thymus (Russell and Larson 1985; Berczi et al. 1991). Moreover. Mukherjee et al. (1990); Viselli et al. (1991) showed a direct mitogenic effect of PRL in vitro on splenocytes and thymocytes from rats in certain hormonal states.
Several studies have shown that PRL plays a role in the development of the immune system. For instance, neonatal mice treated with either an antiserum to PRL or with bromocriptine displayed an altered develop- mental pattern of T and B cells in the spleen and thymus. The percentage of splenocytes and thymocytes expressing the CD4 surface marker (helper T cell) was reduced (Russell et al., 1988). Grove et al. (1991) examined the effect of PRL-poor milk on the develop- ment of the neonatal immune response because rat milk
0303-7207/96/$15.00 0 1996 Elsevier Science Ireland Ltd. All rights reserved
SSDI 0303-7207(95)03724-L

contains PRL and the concentration is highest in early lactation (McMurtry and Malven. 1974; Grosvenor et al.. 1976). Splenocytes and thymocytes from neonatal rats ingesting PRL-poor milk. showed an accelerated and increased response to mitogens as well as alter- ations in the expression of cell stage specific antigens.
The response of lymphocytes to PRL implies the presence of cell surface prolactin receptors (PRL-R). Indeed, binding studies with “‘I-labeled PRL, and flow cytometric analysis with antibodies to PRL-R indicate that human T and B lymphocytes as well as many subsets of rat lymphocytes display cell surface PRL-R (Russell et al., 1985; Viselli and Mastro 1993).
Two forms of PRL-R. short (292 amino acids) and long (598 amino acids), have been identified in several normal rat tissue including liver, ovary. thymus and spleen (Shirota et al., 1990: Ouhtit et al., 1993; Gunes et al. 1993; Tourdine et al., 1994). Only an intermediate form (393 amino acids) has been found in a rat T lymphoma cell line, Nb2 (Shiu et al., 1983). Because the receptor is encoded by a single gene. alternative splicing of a primary transcript is most likely responsible for these different forms (Kelly et al., 1993).
In the rat, all three forms of PRL-R are identical in the extracellular and transmembrdne domains but differ at certain regions of the cytoplasmic domain (Kelly et al., 1993). Both the long and intermediate forms, but not the short form, of the PRL-R have been shown to transduce a PRL signal for the induction of a milk protein gene (Lesueur et al., 1990; Ali et al.. 1992; Lesueur et al., 1991).
Because milk-borne PRL appears to play a role in lymphocyte function and in the development of the immune system. we examined the forms of PRL-R expression in rat spleen and thymus from birth to adulthood. In addition, we asked if milk-PRL ingestion affected PRL-R expression. We found that splenocytes and thymocytes expressed PRL-R at all the ages tested. The level of PRL-R protein in the thymus was at adult level at birth, whereas in splenocytes it was low at birth and increased with age. In addition, milk deprivation or ingestion during the first 7 h after birth affected the percentage of cells expressing cell surface PRL-R.
2. Materials and methods
2.1. Anirnuls
SpragueeDawley rats or pregnant rats (Harlan Lab- oratories, Indianapolis, IN) were housed in a room maintained at 20&22”C on a 14 h light, 10 h dark schedule with free access to food and water. In most cases, pups were allowed to remain with their mother until they reached an appropriate age. For some exper- iments. four pups were sacrificed immediately after
birth (0 h), four of them were kept with the mother and allowed to suckle for 7 h (plus milk), and four of them were kept for 7 h (minus milk) in Styrofoam cups layered with wood chips and floated in a 39°C water bath.
Nb2 cells, rat T lymphoma cell line (Gout et al., 1980) were cultured in Fisher’s medium as described by Tanaka et al. (1980). NOG-8 cells, which were cloned from a normal mouse mammary gland cell, were a generous gift from Dr. Barbara Vonderhaar (NIH). NOG-8 cells were maintained in DMEM medium sup- plemented with 5% fetal calf serum, 100 U/ml peni- cillin. 100 mg/ml streptomycin. Nb2 cells and NOG-8 cells are known to contain PRL-R (Shiu et al.. 1983; Hynes et al., 1985) and were used as positive controls in this study. CTLL-2 cells were obtained from Central- ized Biological Laboratory (CBL), Pennsylvania State University. This cell line does not contain PRL-R (Gala and Shevach. 1993), so therefore, it served as a negative control.
Pups were decapitated, the spleens and thymi re- moved, and placed in sterile saline. For pups older than 2 days of age, each tissue was handled separately. For younger animals, the tissues of four pups were com- bined. Cells were isolated as described (Gunes et al., 1993). Cell counts were performed with a hemacytome- ter and viability determined by trypan blue exclusion. Cell viability averaged 85% for splenocytes and 96% for thymocytes.
Total cytoplasmic RNA was extracted from a range of 2 x IO’ to 1 x 10’ cells by either the guanidinium thiocyanate method of Chomczynski and Sacchi (1987) or by the Glass Max RNA Micro isolation kit (Chirg- win, 1979: Gibco BRL, Gaithersburg, MD). Isolated RNA pellets were suspended in ribonuclease free water and quantified by spectrophotometry.
Primers were designed and prepared (Oligo Synthesis by the Biotechnology Institute, Pennsylvania State Uni- versity) in order to differentiate the mRNA of the long form of the PRL-R from the short form (Fig. 1). The 5’ primer, TACATCGTTGAGCCCAGAG (352%269), was taken from a region preceding the transmembrane region. The sequences for both forms are homologous (Boutin et al., 1988). The sequences of the long and short forms diverge in their cytoplasmic regions. The short form 3’ primer, AGTCTGCAGCTTCAGTAG

H. Giines. A.M. Mastro / Molecular and Crll~tlur Endocrinology f i 7 (I 996) 41~ .52 43
(927-944) (Boutin et al., 1988), was taken from the sequences of the final 30 amino acids of the short form. The long form 3’ primer, CTGTCATAGCTTC- CGTGA (1037-1054) (Shirota et al., 1990). is from sequences after the short form stops. The expected PCR products using these primers are 701 bp for the long form and 593 bp for the short form. Actin primers (5’ primer CACTGGCATTGTGATGGA; 3’ primer ACG- GATGTCAACGTCACA) were chosen from the se- quence of rat j?-actin gene (Nude1 et al., 1983) to produce a 427 bp PCR product.
2.5. Preparation of F3 and actin probes
A Bluescript plasmid containing the PRL-R short form (F3. a generous gift from Dr. Paul Kelly; Kelly et al., 1989) was cut with restriction enzymes NcoI and BamHl (Gibco-BRL, Gaithersbug, MD). This piece was purified by agarose gel electrophoresis and quantified by spectrophometry. Similarly, rat actin DNA was cut by EcoRl and Pst 1, and purified. Both were biotinylated using the polarplex chemiluminescent blotting kit (Millipore/New England Biolabs, Beverly, MA). Briefly, template DNA was denatured in boiling water for 5 min, cooled on ice for 5 min, and then centrifuged. A labelling mix containing random biotiny- lated octomers, a mix of dNTPs containing bio-dUTP, and DNA polymerase 1 (Klenow fragment) were added and incubated at 37°C for 1 h. The probe was stored at - 20°C until used.
2.6. Reverse transcription and PCR ampkjication (RT-PCR)
Total RNA (10 Fig) was reverse transcribed to cDNA with 200 U of M-MLV reverse transcriptase (Gibco BRL, Gaithersburg, MD) as described (Gunes et al.,
Transmembrane Region
Extracellular Domain Cytoplasmic Domain
LONG
T - / \' 3' long primer
5’ piimer KGKSEELLSALGCQD (Peptide)
I J 3’ short primer
SHORT z
J\ TGSPSKYKVDLYLAL (Peptide)
Fig. 1. Peptide and primer design for antibody production and PCR
of the long and short forms of PRL-R. 3’ primers were designed using
nonhomologous sequences in order to differentiate the long and short
form mRNA. For antibody production, amino acid sequences were
chosen from non-homologous sequences to distinguish the short and
long forms.
1993). The cDNA was amplified using 2.5 U of taq polymerase (Perkin-Elmer, Norwalk, CT) in a thermo- cycler programmed with the following cycles: cycle 1, 3 min at 94°C 2 min at 50°C. 2 min at 72°C; cycles 2-39, 1 min at 94°C 1 min at 5O”C, 2 min at 72°C; and cycle 40, 1 min at 94°C 1 min at 50°C. 10 min at 72°C. A sample without cDNA served as negative control. After amplification, PCR products were kept at - 20°C until used.
2.7. Southern blot analysis
The amplified cDNA was electrophoresed through a 1.5% agarose gel containing 0.001% ethidium bromide and transferred to Immobilon-S membrane (Millipore, Beverly, MA). Prehybridization was performed for at least for 1 h at 68°C in a solution of 6 x SSC, 5 x Denhart’s reagent, 0.5% SDS, 10 mg/ml denatured salmon sperm DNA.
Both PRL-R cDNA and actin cDNA were biotiny- lated using the polarplex chemiluminescent blotting kit. The biotinylated probe was added to a hybridization bag at a concentration of 20 ng/ml and kept overnight at 68°C. After hybridization, the membrane was pro- cessed for detection by the polarplex chemiluminescent kit. The membrane was exposed to XARS X-ray film for various lengths of time so that the resulting bands were within the linear range of the film.
2.8. Quantification of PRL-R bands
In order to compare the relative levels of the two forms of PRL-R, primers for actin, a house-keeping gene was included in the PCR reaction. The Southern blots were scanned by densitometry (Quick Scan Jr., Helena Laboratories, Beamont, TX). Quantitative anal- ysis of mRNA for PRL-R was carried out by normaliz- ing the densitometric signal for the short and long form with that of actin. Also PRL-Rs detected with Western blotting were quantified in similar fashion.
2.9. Flow cytometric anulysis
Staining with antibody to PRL-R and flow cytomet- ric analysis were carried out as described by Viselli et al. (1993). In brief, lymphocytes were plated at 1 x lo6 cell/well in 96 well v-bottom plates. Primary antibody, a polyclonal anti-PRL-R to the extracellular region of the receptor, a gift from Dr. Kurt Ebner (University of Kansas, Medical Center) and preimmune serum, which served as a negative control, were added at 1:100 dilutions. Anti-leukocyte common antigen (LCA) was used at a 1: 1600 dilution. Incubation was carried out for 25 min at 4°C. Cells were washed twice with PBS (pH 7.5) containing 2% calf serum, 1% goat serum, and 0.01% azide, and incubated with a 1:lOO dilution of

phycoerythrin-conjugated secondary antibody for 25 min at 4°C. Ten thousand cells were analyzed with flow cytometry. The fluorescence of phycoerythrin was mon- itored using an Epics 753 flow cytometer (Coulter Corp, Hialeah, FL). Laser excitation was 488 nm and the fluorescent signal was collected using a 456- 503 nm laser blocking filter, a 550 nm long pass dichroic filter to separate the PE signal, and with a 575 nm bandpass filter in front of the yellow photomultiplier tube. Per- centages were normalized to the percentage of cells bearing the LCA (96-98% thymus; 58 76% spleen).
2.10. [-‘H]thvmidine incorporution
Splenocytes were cultured at 2.5 x 10” cells:ml in triplicate in 200 ~1 volumes in 96-well flat bottom tissue culture plates. Thymocytes were cultured at 5 x 10” cells/ml in triplicate in a 200 /ll volume in 96-well
round bottom tissue culture plates. Cells were incu- bated with ConA (1 ilg/rnl) for 72 h. In order to measure DNA synthesis, 0.5 ,~lCi [3H]TdR was added to each well at 48 h and 24 h later, cells were harvested onto glass fiber filter paper. [jH]TdR incorporation was measured by liquid scintillation spectroscopy as de- scribed (Mastro et al., 1991).
2.1 I. Anti-peptide untibocly prodwtion
In order to produce antibodies to the long form of PRL-R, a multiple antigen peptide (MAP) unique to the cytoplasmic region of the long form of PRL-R (Fig. 1) was prepared by Research Genetics (Huntsville, AL). Injection of the synthetic peptide to rabbit and blood collection were carried out by CBL, Pennsylvania State University. IgG was purified with protein G column (Pierce) and kept either at - 20°C until used, or at 4°C in 0.01% sodium azide up to one month. We also used the same strategy to produce an anti-peptide antibody to the short form of the receptor but we were unsuc- cessful. However, we used a monoclonal antibody U6 to PRL-R (a generous gift from Dr. Paul Kelly, IN- SERM, Paris, France) for comparison.
2.12. Indirect ELISA to detrrnline urltibodJ$ titer
Determination of the antibody titer in serum raised against a synthetic peptide was performed according to the method of Van Regenmortel (1988).
2.13. Prepurution of’ liver nkrosomes und solubilizution of’ IJwlphocyte proteins
Two adult virgin female Sprague-Dawley rats were injected subcutaneously with 17-p estradiol and bro- mocriptine as described by Katoh et al. (1987). Livers were removed and homogenized using a Polytron
PTIO-35 (Brinkmann Instruments, Westburg, NY). Mi- crosomes were prepared (Katoh et al., 1987) in a buffer containing 2 mM PMSF and stored at - 20°C until used.
Solubilization of membrane and cytoplasmic proteins of lymphocytes was carried out as described by Coligan et al. (1994). Briefly, cells were suspended at 2 x 10’ cells in 5 ml ice-cold PBS and centrifuged for 5 min at
500 x ,y, 4°C. The pellet was resuspended in 200 ~1 Triton X-100 lyses bufler (300 mM NaCl, 50 mM Tris-Cl pH 7.6. 0.5% Triton X-100) with protease in- hibitors. I mM PMSF, 10 Llg:‘rnl aprotinin, 10 /lg;rnl leupeptin and kept on ice for about 1 h. The samples were microcentrifuged for 15 min at 10 000 x g at 4°C. Supernatants were aliquoted at 50 ~11 and kept at ~ 20°C until used.
2. 14. Western blot mul~sis
Solubilized membranes and cytosolic proteins were separated on 10% SDS-polyacrylamide gel elec- trophoresis (Laemmli, 1970) and electrophoretically transferred (150 mAmp, 1 h, 0.9 mAmp/cm’) to polyvinylidene difluoride (PVDF) membrane (Mil- lipore, Beverely, MA) using a graphite plate electroblot- ting apparatus (Andersen, 1984). Prestained molecular weight markers were both electrophoresed and electrob- lotted. The membrane was incubated with a mono- clonal antibody U6 to PRL-R or with a polyclonal antibody to the long form of PRL-R or with an anti-
actin mAb (Oncogene Science, Uniondale, NY). Protein bands were detected with an enhanced chemilu- minescent (ECL) Western blotting kit (Amersham, Ar- lington Heights. IL).
3. Results
3.1. C’IlLlI.LI~.t~~ri-uti~)n cf pol~&nul untiboc!l, to the kwg f&w qf PRL-R
ln order to test whether antibodies were produced against the injected synthetic peptide, indirect ELISA assays were carried out. The comparison of absorbance values for the rabbit antiserum with that of normal rabbit serum indicated that the rabbit had produced antibodies against the MAP peptide for the long form of PRL-R (Fig. 2).
Because the MAP contains synthetic peptide and polylysine. microtiter plates for ELISA assays also were coated with an unrelated MAP peptide. However, the rabbit antiserum did not cross react with an unrelated MAP peptide (Fig. 2); almost the same absorbance values were obtained with antiserum and normal rabbit serum.

H. chines, A.M. Masrro 1 Molecular and Cellular Endocrinology II 7 (1996) 41-52 45
1 o-1 1 o-2 10-s 104 1 o-s
Antibody Concentration
Fig. 2. Characterization of antibodies produced against the peptide of the long form of PRL-R using ELISA assay. The wells of a microtiter plate were coated with 100 ~1 of 1 pg/ml synthetic peptide for the long form of PRL-R; and serial dilutions of rabbit antiserum (l:lOO, 1:500, l:lOOO, 1:5000, 1:lO 000) were added into triplicate wells (0). Normal rabbit serum served as a control (W). To test for possible cross reactivity of the antibody to the long form of PRL-R with an unrelated MAP peptide, the wells of microtiter plate were coated with the peptide for the short form and incubated with rabbit antiserum for the long form (0). After 1 h incubation at 37”C, the wells were washed and further incubated for 1 h with alkaline phosphatase conjugated goat anti rabbit second antibodies at 1:lOOO dilution. Wells were washed and color intensity after addition of the enzyme substrate (p-nitrophenylphosphate) was measured at 450 nm with a microtiter plate reader. The difference among the absorbance values of triplicate samples was less than 2%.
In order to determine if the antipeptide antibodies recognized denatured PRL-Rs, liver microsomes were subjected to SDS-PAGE and Western blotting. Anti- body to the long form of PRL-R detected a protein with an estimated molecular weight (M,) of 84 kD (Fig. 3(A), lanes 2-4). A monoclonal antibody to rat liver PRL-R (Okamura et al., 1989), U6, recognized two proteins (lane 1) with an approximate M, of 38 and 40 kD lane 1). No proteins were detected with normal rabbit serum (lanes 5 and 6).
In addition to liver microsomes, cell lysates from Nb2 cells, NOG-8 cells (a mouse mammary gland cell line) and splenocytes from ovariectomized rats were analyzed (Fig. 3(B)). Splenocyte lysate (lane 1) showed an 84 and 42 kD protein, Nb2 (lane 2) showed a 52 kD protein band, and NOG-8 (lanes 3-6) showed three proteins of 84, 53, and 42 kD. The antibody did not detect any proteins in lysates of CTLL-2 cells (a mouse IL-2 dependent cell line) which was used as a negative control because it does not express PRL-R (Gala and Stevach, 1993). Together these results indicated that the antibodies to the long form were specific for PRL-Rs. Further evidence that these proteins were PRL-R long form came from experiments done with lysates of mouse 3T3 cells transfected with the long form of the human PRL-R. The antipeptide antibodies revealed one large protein band at about 90 kD by Western blotting. However, these antibodies did not detect any
protein in lysates of 3T3 cells transfected with the short form of the mouse PRL-R (Personal communication with Dr. Barbara Vonderhaar who tested our antibod- ies in her laboratory).
3.2. Developmental expression of PRL-R at the protein level
The antipeptide antibodies specific for the long form of the receptor were used to examine how PRL-R changed during neonatal development. Protein lysates from splenocytes or thymocytes of rats at birth (0 h) or 1, 2, 8, 10, 14, 22, and 30 days were analyzed by Western blotting. Two protein bands with molecular mass of 42 and 84 kD were detected in splenocytes (Fig. 4(A)). The 84 kD band was at a relatively low level from birth to 14 days of age (Fig. 4(B)). After day 14, it increased gradually for rats aged 22, 30, 40, and 50
A
Mrxio-3
1231
BQ-
67-
50-
Fig. 3. Western blot analysis of PRL-R from rat liver microsome (A) and lysates of Nb2 cells, NOG-8 cells, CTLL-2 cells and splenocytes from ovariectomized rats (B). Crude liver microsome and cell lysates were subjected to 10% SDS-PAGE, transferred to PVDF membrane and incubated with different antibodies. (A) Lane 1 (200 fig micro- some) with U6 mAb (I:1000 dilution); lanes 2-4 (100, 200, 500 fig microsome) with antibodies to the long form of PRL-R (I:1000 dilution); lanes 5 and 6 (200, 500 pg microsome) with normal rabbit serum (I : 1000 dilution). (B) 15 p I of each cell lysate (2 x 10’ cells in 200 ~1 lysis buffer) was loaded in the first three lanes (1, splenocytes; 2. Nb2; 3, NOG-8). Lanes 4-6 contained 10, 20, 30 ~1 of NOG-8 lysate; lane 7, 20 ~1 of CTLL-2 lysate. Lanes 1-7 were incubated with antibodies to the long form of PRL-R (1:lOOO); Lane 8 (30 ~1 of NOG-8 lysate) with normal rabbit serum (1:lOOO). After incubation with horse radish peroxidase (MRP) conjugated-second antibody at 1:4000 dilution, the protein bands were detected using ECL.

A A
1 2 3 4 5 6 7 8 9 10 11 1 2 3 4 5 6 7 8 9 1011
-ACTIN
0 20 40 60 80 100
Days After Birth
Fig. 4. Western blot analysis of PRL-R expression in splenocytcs of rats from different ages. Splenocytes (2 x IO’) from 0, 2. 8. IO. 14. 22. 30, 40, 50, 80. 90 day old rats were lysed in 200 jr1 lysis buffer and 20 ~1 was subjected to Western blot analysis as in the legend to Fig. 3. The membrane was stripped and relabeled with anti-actin mono- clonal antibodies at 2 pg/ml and incubated with sheep anti-mouse secondary antibodies. (A) Western blot. Lanes I -- I I correspond to 0, 7 8, IO, 14. 22, 30, 40, 50, 80. and 90 daya. respectively. (B)
;; uantification of Western blot. C. 42 kD band; n 84 kD band. Data represent average + S.E.M. of two rats.
days; it declined again at 80 and 90 days. The develop- mental pattern of the expression of the 42 kD band was similar to that of the 84 kD band; during the first 10 days after birth the level was relatively low. However, it increased significantly from days 10 to 50 and declined again in the older animals. At all the other ages tested (except for day 0 and 2) the relative level of the 42 kD band was greater than that of the 84 kD band.
In contrast to splenocytes. only the 84 kD band was detected in thymocytes (Fig. 5(A)). Compared with the first 2 days, the level of the protein decreased from days 10 through 90 (Fig. 5(B)).
In addition to the antipeptide polyclonal antiserum against the long form of PRL-R, U6 mAb to the PRL-R was used in this study. First, we noted that 38-40 kD proteins detected with U6 mAb were not recognized by antibodies to the long form of PRL-R (Fig. 6). The result is similar to that of Okamura et al. (1989a,b) and Dorato et al. (1992) who found that the U6 antibody recognizes a short form of PRL-R, 40 and 42 kD. All the Western blots labeled with antibody to the long form of PRL-R were stripped and relabeled with U6 mAb to see how the level of the form detected by this antibody changed during development. In the
-PRL-R
-ACTIN
180 -
5 160-
2 140 -
CL - % 220
5 IOO-
5 -I 80-
$ 60-
g 40-
8 20-
B
OL 0 20 40 60 80 100
Days After Birth
Fig. 5. Western blot analysis of PRL-R expression in thymocytes of rats from different ages. Samples are exactly as described in the legend to Fig. 4 except that thymocytes were used. (A) Western blot. Lanes I -11 correspond to 0. 2, 8, IO, 14, 22, 30, 40, 50. 80, and 90 day old rats. respectively. (8) Quantification of Western blot. l , 84 kD band. Data are the average f S.E.M. of two rats.
spleen. the level of PRL-R detected with U6 mAb was relatively low during early days of neonatal life. Whereas the level doubled after day 14 and remained at about the same level until day 90, the last age tested (Fig. 6(A) and (B)). The developmental pattern of expression of the PRL-R short form was similar to that
A I 2 3 4 5 6 7 8 9 IO 11
,PFlL-A
160
‘is ioo 5 5 80 -1 2 60 ‘G 3 40 K
20 I I I I I
0 20 40 60 80 l&J
Days After Birth
Fig. 6. Western blot analysis of PRL-R expression in splenocytes detected with U6 mAb during diKerent ages. The membrane de- scribed in Fig. 4 was stripped and labeled with U6 mAb at I: 1000
dilution. (A) Western blot. (B) Quantification of Western blot.

H. Giines. A.M. Mastro / Molecular and Cellular Endocrinology I I7 (1996) 41-52 41
*l 23456 1 2 3 4 5 6 7 8 9lO11 121314 15
.iF? - 0 Long Form B
0 Short Form
10'
RN* Input ha)
I 102
Fig. 7. PCR analysis of PRL-R short and long forms. Total RNA from splenocytes or thymocytes were reverse transcribed to cDNA and the resulting cDNA (10% of each cDNA reaction) was amplified by 40 cycles of PCR. After separation on an agarose gel. PCR products were transferred to an immobilon membrane and hybridized with biotinylated probes for the short and long forms of PRL-R. (A) Southern blot. Long form, 701 bp, lanes 1-3 (20, IO, 5 peg RNA, respectively); short form, 503 bp, lanes 4-6 (20, 10, 5 pg RNA respectively). (B) There was a linear relationship between the log of the chemiluminescent signal and the log of the RNA input.
of the long form (Fig. 4). However, the abundance of the short form was always greater than that of long form during all the ages tested in spleen.
In the thymus, the level of PRL-R detected with U6 was relatively high at birth and did not show a consis- tent pattern of change throughout the periods tested (data not shown).
3.3. The expression of long and short jbrms of PRL-R mRNA
The levels of mRNA for the PRL-R were too low to be detected by Northern blots; thus, expression of mRNA was analyzed by RT-PCR. The long and short forms of PRL-R were detected in splenocytes and thy- mocytes of neonatal rats (Fig. 7(A)). The amplified product of the long and short forms were 701 and 593 bp, respectively. A linear relationship between log RNA input and the intensity of the autoradiographic signal was observed up to 20 pug RNA for 40 cycles of the PCR reaction (Fig. 7(B)). Therefore, 10 pug RNA was used for analysis of both forms. The samples were also adjusted so that the same linear relationship was ob- tained for /3-actin, as an internal standard.
The mRNA for the long form was detected in spleno- cytes from every age animal tested (Fig. 8(A) and (B)); the level increased by 1.5 to nearly 2-fold from birth to 8 days of age and then remained at a steady level. The mRNA of the short form also was observed at all ages; but the mRNA levels at birth and day 2 were relatively low. After day 2, they increased. At all ages tested the relative levels of the long form were greater than that of
+ACTlN
0 Long F0m.1 0 Short Form
cc 0 5 10 15 20 25 30
Days After Birth
Fig. 8. The expression of PRL-R short and long form mRNA in rat splenocytes from different neonatal ages. Total RNA IO pg from 0, 2, IO, 14, 22, and 28 day old neonatal splenocytes were used to prepare PCR products as in the legend to Fig. 7. In addition to primers for short and long form, a primer for actin was included. (A) Southern blot of PCR products. Long form, lanes 2-8 are days 0, 2, 8, IO, 14, 22, and 28, respectively); short form, lanes 9-15 are days 0, 2, 8, IO, 14. 22, and 28, respectively). Lane I is a negative control without cDNA. (B) Quantification of Southern blot. The experiment was repeated with similar results.
the short form (Table 1). However, after day 8, the difference between them became smaller.
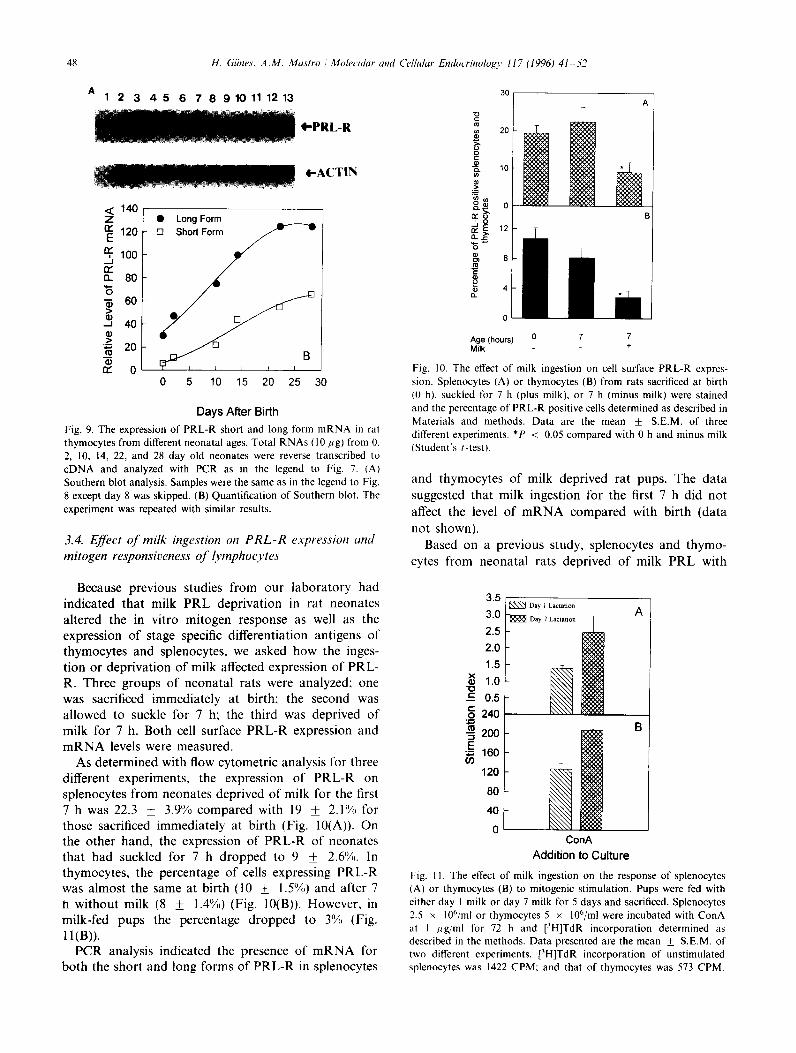
In thymic tissue the mRNA for the long form in- creased gradually until day 22 and remained at the same level at day 28 (Fig. 9(A) and (B)). The short form mRNA increased similarly. The levels of the long form of the mRNA were always greater than that of the short form mRNA (Table 1). On the other hand, the difference between the amounts of mRNA of two forms became less after day 10.
Table I Comparison of PRL-R short and long form mRNA levels during different neonatal ages
Days Ratio of long form to short form
Splenocytes Thymocytes
0 4.8 3.7 2 7.6 4.2 8 2.3 ND” IO I.4 3.4 I4 1.0 2.2 22 1.6 2.2 28 1.2 1.8
The relative amounts of the long and short forms of the PRL-R as detected by PCR analysis and after normalizing to actin were com- pared. “ND, not done.
48
A 12 3 45 6 79910111213
CPRL-R
tACTIN
< 140
E 0 Long Form
E 120 - 0 Short Form
rr o----.-i 0 5 10 15 20 25 30
Days After Birth
Fig. 9. The expression of PRL-R short and long form mRNA in rat
thymocytes from different neonatal ages. Total RNAs (IO fig) from 0.
2, 10, 14, 22, and 28 day old neonates were reverse transcribed to
cDNA and analyzed with PCR as in the legend to Fig. 7. (A)
Southern blot analysis. Samples were the same as in the legend to Fig.
8 except day 8 was skipped. (B) Quantification of Southern blot. The
experiment was repeated with similar results.
3.4. EfSect of milk ingestion on PRL-R expression uncl mitogen responsiveness of l_vmphocytes
Because previous studies from our laboratory had indicated that milk PRL deprivation in rat neonates altered the in vitro mitogen response as well as the expression of stage specific differentiation antigens of thymocytes and splenocytes, we asked how the inges- tion or deprivation of milk affected expression of PRL- R. Three groups of neonatal rats were analyzed; one was sacrificed immediately at birth; the second was allowed to suckle for 7 h; the third was deprived of milk for 7 h. Both cell surface PRL-R expression and mRNA levels were measured.
As determined with flow cytometric analysis for three different experiments, the expression of PRL-R on splenocytes from neonates deprived of milk for the first 7 h was 22.3 + 3.9% compared with 19 f 2.1% for those sacrificed immediately at birth (Fig. 10(A)). On the other hand, the expression of PRL-R of neonates that had suckled for 7 h dropped to 9 k 2.6%. In thymocytes, the percentage of cells expressing PRL-R was almost the same at birth (10 _t 1.5%) and after 7 h without milk (8 ? 1.4%) (Fig. 10(B)). However, in milk-fed pups the percentage dropped to 3% (Fig.
1 l(B)). PCR analysis indicated the presence of mRNA for
both the short and long forms of PRL-R in splenocytes
l_L * Age (hours) ’ 7 7
Milk +
Fig. 10. The effect of milk ingestion on cell surface PRL-R expres-
sion. Splenocytes (A) or thymocytes (B) from rats sacrificed at birth
(0 h), suckled for 7 h (plus milk), or 7 h (minus milk) were stained
and the percentage of PRL-R positive cells determined as described in
Materials and methods. Data are the mean k S.E.M. of three
different experiments. *P < 0.05 compared with 0 h and minus milk
(Student’s t-test).
and thymocytes of milk deprived rat pups. The data
suggested that milk ingestion for the first 7 h did not
aIfect the level of mRNA compared with birth (data
not shown).
Based on a previous study, splenocytes and thymo-
cytes from neonatal rats deprived of milk PRL with
2.5
2.0
1.5
3 1.0
5 0.5
,E 240
z 200
.S 160 cn
120
ConA
Addition to Culture
Fig. 1 I. The effect of milk ingestion on the response of splenocytes
(A) or thymocytes (B) to mitogenic stimulation. Pups were fed with
either day 1 milk or day 7 milk for 5 days and sacrificed. Splenocytes
2.5 x 10h/ml or thymocytes 5 x 10⁶/ml were incubated with ConA
at I pgjml for 72 h and [‘H]TdR incorporation determined as described in the methods. Data presented are the mean + S.E.M. of
two ditferent experiments. [3H]TdR incorporation of unstimulated
splenocytes was 1422 CPM; and that of thymocytes was 573 CPM.
H. Giines, A.M. Mastro / Molecular and Cellular Endocrinology 117 (1996) 41-52 49
bromocriptine have an accelerated and increased re- sponse to mitogens as well as alterations in the percent- ages of thymocytes or splenocytes expressing cell surface markers (Grove et al., 1991). Cross-fostering was chosen as a way to deplete or decrease milk PRL level because the concentration of milk PRL changes during lactation. Pups from the same litter were divided into two groups. The first group (6 pups) was put with a mother at day 1 of lactation when milk PRL is high; whereas, the second group was placed with a foster mother at day 7 of lactation when milk PRL is low. Pups were allowed to suckle for 5 days and sacrificed.
Splenoytes and thymocytes from both groups of pups were incubated in the presence or absence of ConA at 1 fig/ml. [3H]TdR incorporation assay was performed to determine how the milk PRL concentration might affect the mitogen responsiveness of these neonatal lymphocytes. [‘H]TdR incorporation of splenocytes from pups fed with day 7 milk increased 1.2-fold com- pared with that of splenocytes from neonates fed with day 1 milk (Fig. 11(A)). Similarly, the ConA respon- siveness of thymocytes from pups fed with day 7 milk was higher (1.6-fold) than that of thymocytes from neonates fed with day 1 milk (Fig. 1 l(B)). These find- ings suggest that either high concentration of PRL or certain PRL variants in early milk may inhibit lymphocyte proliferation in response to ConA or that later milk might contain stimulators.
4. Discussion
In this present study, we examined PRL-R expression in splenocytes and thymocytes of neonatal rats from birth to adulthood using a polyclonal or a monoclonal antibody. The antipeptide antibody to the long form of PRL-R detected two proteins, 84 kD and 42 kD, in splenocytes.
One possibility is that the 42 kD protein in spleen is a degradation product of the 84 kD protein in spite of the fact that protease inhibitors were included during the cell lysis. However, the possibility seems unlikely because the 84 kD form was detected in the thymus and liver microsome preparations with the same antibody. Moreover, we never detected any intermediate sizes nor did the relative ratios of the 42 kD band to the 84 kD band change from time to time with the same sample preparation. Therefore, it is possible that the long form of the PRL-R may exist in two different isoforms in splenocytes due to different postranscriptional or pos- translational modifications. In support of this idea is the report that the cross-linking of [‘*‘I]ovine prolactin (oPRL) with PRL-R revealed several different molecu- lar forms (80, 50, 40, 16 kD) of PRL-R in mammary glands and in the liver (80, 40 kD) (Guillaumot and Cohen, 1994). Also, Hu and Dufau (1991) indicated
that there were multiple forms of PRL-R mRNA as well as a variant form of PRL-R mRNA for the long form with a truncated and altered extracellular domain.
During neonatal development the level of both the 42 and 84 kD protein bands was low between birth and day 14, increased at day 22, and reached adult levels at day 30 (Figs. 3, 7(B)). Although both the 42 kD and 84 kD PRL-R exhibited similar developmental patterns, the level of the 42 kD protein was always higher than that of the 84 kD one (Table 1). On the other hand, only the 84 kD PRL-R was detected in thymus using the same antibody. The relative level remained constant from birth to 90 days of age (Figs. 3, S(B)), suggesting that the long form of PRL-R detected with this anti- body is not developmentally regulated after birth in the thymus. These differential expression patterns of the 84 kD PRL-R in spleen and thymus suggest that regula- tion of PRL-R levels is tissue specific. Similarly, Hayden et al. (1979) found a negative correlation be- tween the number of PRL binding sites in the mam- mary gland and in the liver. They showed that the binding of ‘251-labeled oPRL to rat mammary gland microsomes decreased between 30 and 100 days of age; whereas, binding to liver microsome increased at these ages.
The tissue specific expression of the 42 kD PRL-R implies that this PRL-R variant may have tissue specific functions. For example, thyroid hormone and retinoic acid have receptors that exist in several different iso- forms in different tissues with different biological func- tions (Hodin et al., 1989; Kastner et al., 1990; Mangelsdorf et al., 1990). Also, the existence of differ- ent isoforms of PRL (Grosvenor et al., 1992; Sinha, 1995) suggests that each might exert different biological functions. Becuse the spleen unlike the thymus contains B cells and natural killer cells (NK), the 42 kD band might be cell specific. The function of each cell popula- tion differs from that of others. Therefore, it is possible that the 42 kD PRL-R could be required for exerting PRL’s effect on B and NK cells’ function rather than T cells’ function. The thymus contains mainly T cells and does not express the 42 kD PRL-R.
Analysis of the PRL-R seen with the U6 mAb in the spleen during different ages revealed that relative level of this form correlated with development and exhibited a similar pattern of expression as the long form. The abundance of PRL-R protein detected with the U6 antibody was greater than that of the long form protein at almost every age tested in both spleen and thymus. This finding suggests that the role of this form of PRL-R may be similar in both tissues.
Developmental regulation of PRL-R expression also was examined in the liver by Jolicoeur et al. (1989) using Northern blot analysis and an [‘251]oPRL binding assay. Their results showed that PRL-R gene expres- sion is developmentally regulated at both transcrip-
tional and translational levels in liver from fetal and newborn pups, i.e. the level of PRL-R mRNA and PRL binding sites increased as rats aged. Similar to their results, we also found that the amount of PRL-R mRNA increased as a function of age in both the spleen and the thymus. In addition, the level of PRL-R protein increased with age in the spleen but not in the thymus. The presence of PRL-R short and long form mRNA and protein as early as birth in the spleen and thymus, implies that both forms of PRL-R can bind and respond to PRL.
Ontogeny of the thymus and spleen differ. The thy-
mus is already mature at birth in regard to expression of cell surface differentiation markers (CD4, CD5,
CDS. and Thy-l) and can respond to mitogens (Ritter et al., 1987; Middleton and Bullock, 1984; Grove et al.. 1991). In addition, PRL-Rs have been detected in fetal rat thymus (Freemark et al., 1995; Royster et al., 1995). Likewise, this present study showed that the expression of PRL-R protein in the thymus at birth was also at adult levels. These findings suggest that the expression of the PRL-R gene is regulated along with those con- trolling T-cell differentiation during gestation in the thymus. PRL-R expression during gestation implies that PRL has a function on the early development of T-cells. The presence of PRL-R in thymocytes as well as the fact that PRL decreases thymic cellularity in dwarf mice (Murphy et al., 1993) suggest that PRL plays a role in education and selection of T-cells in the thymus. In contrast, PRL stimulates proliferation of mature T-cells in peripheral blood and lymph nodes (Gala and Shevach, 1993; Murphy et al., 1993).
In contrast to the thymus, the spleen is an immature organ at birth. NK activity, the level of cell surface markers and mitogen responsiveness are absent or are very low at birth (Vujanovic et al., 1988; Grove et al., 1991; Middleton and Bullock, 1984). Although T and B cells have been observed at birth (Dijkstra and Dopp, 1983). the percentage of cells expressing B cell marker (Ig) and T cell markers (CD4, CD5, CD8 and CD2) increased with age and reached adult levels by day 15 of neonatal life (Grove et al., 1991). Similarly, we found that the level of PRL-R in the spleen was relatively low at birth and increased with age. One possibility is that the increase in the percentage of PRL-R positive cells during development is due to the migration of T and B cells to the spleen. The microenvironment of lymphoid tissue as well as type of cell population may account for differences in the level of PRL-R expression in spleno- cytes and thymocytes.
The finding that both PRL-R short form and long form mRNA were expressed in the spleen and thymus of neonatal rats is consistent with the results of Ouhtit et al. (1993) who demonstrated short and long form PRL-R mRNA expression in the spleen and thymus using in situ hybridization techniques. Like Ouhtit et al.
(1993) we also found that the level of the transcript was higher for the long form than the short form in both tissues. However, at this time neither our study nor the studies of others allow us to state whether each individual cell expresses both long and the short forms of the receptor. PCR analysis of RNA from a single cell would answer this question.
As described in the experimental procedure (Fig. 1). the cDNA sequence of primers for PCR analysis and amino acid sequences for antibody production were chosen from non-homologous sequences to differentiate the short and long forms of PRL-R at mRNA and protein levels. However. the long form sequence used for antibody production is different from the one used for PCR analysis, i.e. these sequences are hundred base pairs apart. Therefore, if there is an isoform of PRL-R long form, truncated at the cytoplasmic region which excludes the primer sequences for PCR analysis of the long form, this isoform of the receptor would not have been amplified with PCR. When the relative levels of PRL-R long form of mRNA in the spleen were com- pared to that of the PRL-R proteins in the same tissue during different ages, it was found that PRL-R long form mRNA changed only during birth and day 2 but remained at a steady level at the other ages tested. However, PRL-R protein increased from birth to 28
days of age. i.e. the protein level gradually increased as rats got older. These results show that the protein level did not exactly parallel the mRNA levels. They suggest that gene expression of PRL-R long form might be regulated at the translational level in spleen.
In the case of the thymus. an increase in both the PRL-R short and long form mRNA’s from birth to 28 days of age indicated that gene expression changed with development at the transcriptional level. As in the spleen, the levels of PRL-R long form protein during all the ages tested did not correlate with the level of long form mRNA in the thymus. This result suggests that the long form of PRL-R expression is probably regulated at the translational level in the thymus.
During fetal life, the major source of PRL is the placenta. Milk-borne and pituitary PRL serve as post- natal sources of PRL for neonates. Milk-borne PRL enters the neonatal circulation within 30-40 min after suckling begins (Whitworth and Grosvenor, 1978). Therefore, PRL-R expression at the mRNA and protein levels was examined after milk ingestion in this study. The results show that lack of milk in the first 7 h did not change the percentage of cells expressing surface PRL-R compared to that at birth. However, ingestion of milk in the first 7 h decreased the percent- age of PRL-R positive cells (Fig. 10). This decrease may reflect the down-regulation of the PRL-R after PRL binding and internalization of hormone-receptor complex. This finding is consistent with the results of Djiane et al. ( 1979) who showed the rapid down-regula-

H. Giinrs, A.M. Mastro I Molecular ami Cellulur Endocrinology I I7 (1996) 41-52 51
tion of the receptor in mammary gland at high concen- trations of PRL. This down-regulation of PRL-R ex- pression after milk ingestion indicates that milk-borne PRL functions directly on lymphocytes. The fact that the level of mRNA for PRL-R was largely unaffected after milk ingestion supports a direct action of PRL on
the receptor. After ConA stimulation, DNA synthesis of spleno-
cytes and thymocytes from rats fed with day 7 milk was higher than that of splenocytes and thymocytes fed with day 1 milk. These results suggest that a certain PRL variant in early milk could have an inhibitory effect on
lymphocyte proliferation. In fact, the glycosylated frac- tion of human milk has been reported to be inhibitory
to Nb2 cells (Ellis and Picciano, 1995). According to Grosvenor et al. (1992) the concentration and type of PRL variants change during the course of lactation. In addition, the fact that there are neonatal splenocytes adherent suppresser cells (Middleton and Bullock, 1984) and weaning decreased the suppresser activity suggest a connection between PRL and suppressive activity of adherent cells. Therefore, much more exten- sive work is necessary to determine which stage of lactation or which PRL variants are the most effective in altering immune cell function.
In summary, splenocytes and thymocytes expressed cell surface PRL-Rs from birth through adulthood, These results suggest that PRL plays some role in the development of the neonatal immune system. However, the variants in the forms of PRL-R seen in the thymus and spleen suggest a tissue or cellular basis for a differential response to PRL. Moreover, levels of mRNA and protein for both the short and long form do not parallel each other during different neonatal ages. Therefore, it can be concluded that expression of PRL-R long and short form is regulated at the transla- tional level in both the spleen and thymus. Finally, the milk ingestion in the first 7 h of life decreased the
percentage of both splenocytes and thymocytes express- ing cell surface PRL-R, suggesting that milk-borne PRL may have a direct effect on lymphocytes.
Acknowledgements
We thank Dr. Richard Wilson, Dr. Deb Grove and the CBL at Pennsylvania State University for their collaboration on polyclonal antibody production to prolactin receptor. In addition, we thank Dr. Paul Kelly for his generous gifts of anti-prolactin receptor antibody (U6) and plasmids containing cDNA for pro- lactin receptor short and long form. This work was supported in part by NIH grants CA-24385 and CA- 23248 to AMM and by a scholarship to Hatice Gunes from the Turkish Government, The Ministry of Na- tional Education.
References
Ali. S.. Edery. M., Pellegrini. I., Lesueur, L., Paly. J., Djiane, J. and
Kelly. P.A. (1992) Mol. Endocrinol. 6, 1242- 1248.
Andersen, K.J. (1984) J. Biochem. Biophy. Meth. IO. 2033209.
Berczi, 1.. Nagy, E., Kovacs, K. and Horvath, E. (1981) Acta
Endocrinol. 98. 507-513.
Berczi, 1.. Nagy, E., Toledo, SM.. Matusik, R.J. and Friesen. H.G.
(1991) J. Immunol. 146. 2201-2206.
Boutin. J.M., Jolicoeur, C., Okamura, H., Gagnon, J., Edery, M.,
Shirota, M.. Banville. M., Dusanter-fourt, I.. Djiane, J. and Kelly.
P.A. (1988) Cell 53. 69977.
Coligan. J.E., Kruisbeek, A.M., Margulies, D.H.. Shevach. E.M. and
Strober. W., (eds.) (1991) Current Protocols in Immunology.
Greene and Wiley Interscience, New York. pp. 8.1.1-8.1.2.
Chomczynski, P. and Sacchi, N. (1987) Anal. Biochem. 162, I56- 159.
Chirgwin, J.M., Przybyla, A.E., McDonald. R.J. and Rutter, W.J.,
(1979) Biochemistry 18, 5594-5599.
Dijkstra, C.D. and Dopp. E.A. (1983) Cell Tissue Res. 229. 351-363.
Djiane. J., Clauser, H. and Kelly, P.A. (1979) Biochem. Biophys. Res.
Commun. 90. 137 I - 1378.
Dorato, A., Raquet, S., Okamura, H., Bergeron, J.J.M.. Kelly, P.A.,
Endocrinology 131, l734- 1742.
Ellis. L.A. and Picciano, M.F. (1995). Endocrinology 136, 271 I-
2720.
Freemark. M., Nagano. M., Edery, M. and Kelly, P.A. J. Endocrinol.
144. 2855292.
Gala, F.R. and Shevach, E.M. (1993) Endocrinology 133, 1617-1623.
Grosvenor, C.E. and Whithworth. N.S. (1976) J. Endocrinol. 70,
I-9.
Grosvenor. C.E. and Withworth, N.S. (1983) Endocrinol. Exp. 17,
271-282.
Grosvenor. C.E.. Picciano, M.F. and Baumrucker, C.R. (1992). En-
docrinol. Rev. 14, 710-728.
Grove. D.S.. Bour. B., Kacsoh. B. and Mastro, A.M. (1991). En-
docrinol. Reg. 25, 11 I - 119.
Gunes. H.. Grove, D.S., Bour, B., Zawilla, S. and Mastro, A.M.
(1993) Endocrinol. Reg. 27. 193-200.
Gout. P.W., Beer, C.T. and Noble, R.L. (1980). Cancer Res. 40, 243332436.
Guillaumot, P. and Cohen, H. (1994) J. Endocrinol. 141. 271-278.
Hayden. T.J., Bonney. R.C. and Forsth, I.A. (1979) J. Endocrinol. 80. 2599269.
Hodin R.A.. Lazar, M.A.. Wintman, B.I., Darling, D.S., Koenig,
R.J.. Larsen, P.R.. Moore, D.D. and Chin, W.W. (1989) Science
244. 76683.
Hu. Z-Z. and Dufau, M.L. (1991) Biochem. Biophys. Res. Commun. 181, 219-22.
Hynes, N.E., Jaggy, R., Kozma. S.C.. Ball, R., Muellener, D.,
Wetherall. N.T., Davis, B.W. and Groner. B. (1985) Mol. Cell Biol. 5. 268-272.
Jolicoeur, C., Boutin, J.M., Okamura, H.. Raguet. S.. Djiane, J. and
Kelly. P.A. (1989) Mol. Endocrinol. 3, 8955900.
Kastner, P.. Krust, A.. Mendelsohn, C., Garnier. J.M.. Zelent. A..
Leroy. P.. Stdub. A. and Chambon, P. (1990) Proc. Nat]. Acad.
Sci. USA 87. 2706.
Katoh, M.. Raguet, S., Zachwieja, J.. Djiane, J. and Kelly, P.A.
(1987) Endocrinology 120, 739--749.
Kelly, P.A., Boutin. J.M., Jolicoeur. C.. Okamura, H., Shirota, M..
Edery, M., Dusanter-Fourt, I. and Djiane, J. (1989) Biol. Reprod. 40. 27732.
Kelly, P.A.. Ah, S., Rozakis, M., Goujon, L., Nagano, M., Pellegrini,
I.. Gould. D.. Djiane, J.. Edery. M., Finidori. J. and Postel-Vinary.
M.C.. (1993) Recent Prog. Horn-r. Res. 48. 1233163.
Laemmli. U.K., (1970) Nature 227, 680-685.

Lesueur. L.. Edery, M.. Paly. J.. Clark. J.. Kelly. P.A. and Djiane. J.
(1990) Mol. Cell. Endocrinol. 71. R7-RI?.
Lesueur, L., Edery. M.. Ali, S.. Paly. J. and Kelly. P.A. (IYYI) Proc.
Natl. Acad. Sci. USA 88, 824-828.
Mastro, A.M.. Garlisi. CC., Grove. D.S., Crier. III C.E. xnd Pishac.
S.A. (1991) Lymphokine Cytokine Res. IO. 153 164.
McMurtry. J.P. and Malven. P.V. (1974) J. Endocrinol. 61. 71 I 217.
Mangelsdorf, D.J.. Ong. ES.. Dyck. J.A. and Evans. R.M. (lY90)
Nature 345 ‘24 229. 3 - Middleton. P. and Bullock. W. (1984) Cell. Immunol. 88. 421 435.
Middleton P.A. and Bullock. W.W. ( 1984) Dev. Comp. Immunol. 8.
895~ 906.
Mukherjee. P.. Mastro, A.M. and Hymer. W.C. (1990). Endocrinol-
ogy 126. 88 93.
Murphy, W.J.. Durum. S.K. and Longo, D.L. ( lY9.1). J. Exp. Med.
178. 23 I m~236.
Nagy. E. and Berczi. I. (1978) Acta Endocrinol. 89. 530~5.37.
Nagy. E.. Berczi. I.. Wren. G.E.. Asa, S.L. and Kovacks. K. (1983)
lmmunopharmacology 6. 23 I 743.
Nudel. U.. Zakut. R.. Shani. M.. Neuman. S.. Lev). Z. and Yalfc. 0.
(1983) Nucl. Acid Res. I I. 1759%177(X
Okamura. H.. Raguet. S.. Bell. A.. Gagnon. J. ‘ind Kelly. P.A.
(1989a) J. Biol. Chem. 764. 5904 5911.
Okamurd. H.. Zachwieja. J.. Raguet. S. and Kelly. P.A. (lY89bl.
Endocrinology 124. 1499%2508.
Ouhtit. A.. Morel, G. and Kelly. P.A. (lYY3) Endocrinology 133.
135%144.
Rirtrr. M.A.. Gordon, L.K. and Goldschneider. I. (lY78) J. Immunol.
I2 I. 7463 2470.
Royster. M.. Driscoll. P.. Kelly. P.A. and Freemark. M. (1995)
Endocrinol. (In press).
Russel. D.H.. Kibler. R.. Matrisian, L., Larson. D.F.. Poulos, B. and
Magun. B.E. (1985) J. Immunol. 134. 3027-3031.
Russell. D.H. and Larson. D.F. (1985). Immunopharmacology 9.
I65 174.
Russell. D.H.. Mills. K.T.. Talamante~. F.J. and Bern, H.A. (lY88)
Proc. Natl. Acad. Sci. USA 85. 7404 -7407.
Sinha, Y.N. (IY95) Endocrine Rev. 16. 354 369.
Shirota. M., Banville, D.. AIi, S.. Joliceour. C‘.. Boutin, J.M.. Edery.
M., Djiane. J. and Kelly, P.A. (1990) Endocrinology 4, 11% 1143.
Shiu. R.P.C.. Elsholtz, H.P.. Taneke. T.. Friesen. H.G.. Gout, P.W..
Geer. C.T. and Noble. R.L. (1983) Endocrinology I 13. I59 165.
Tanaka. T.. Shiu. R.P.C.. Gout. P.W., Beer, C.T., Noble. R.L. and
Friesen, H.G. (1980) J. Clin. Endocrinol. Metab. 51, lO58~- 1063.
Touraine. P., Maria. C.L.M.. Dardenne. M. and Kelly. P.A. (1994)
Mol. Cell Endocrinol. 104. 18% 190.
Van Regenmortel. M.H.V.. Briand. J.P.. Mueller, S. and Plauc. S..
(1991) In: Current Protocols in Immunology. pp. 9.4.8 9.4.1 I.
Nem York.
Viselli. S.M.. Stanek. EM.. Mukherjee, P. and Hymer. W.C. (1991)
Endocrinology 179. 983 989.
Viselli. S.M. and Mastro. A.M. (1993) Endocrinology 131. 571 576.
Vujanovic. N.L.. Herberman. R.B. and Hiserodt. J.C. (1988) Canccr
Res. 48. 878 883.
WItworth. N.S. and Grosvenor. C.E. (1978) J. Endocrinol. 79. IYI
I Y9.
Copyright © 2022 FDOKUMEN