Project Report - ELIB-DLR
52
Project Report Alternative Transport Technologies for Megacities 27. February 2015 German Aerospace Center Institute of Vehicle Concepts
-
Upload
khangminh22 -
Category
Documents
-
view
0 -
download
0
Transcript of Project Report - ELIB-DLR
Project Report Alternative Transport Technologies for Megacities
27. February 2015
German Aerospace Center
Institute of Vehicle Concepts
Seite II
German Aerospace Center Institute of Vehicle Concepts Pfaffenwaldring 38-40 D-70569 Stuttgart, Germany Institute Director Project Manager Prof. H. E. Friedrich Dr. E. D. Özdemir Tel.: +49 (0)711/6862-256 Tel.: +49 (0)711/6862-562 FAX.: +49 (0)711/6862-258 FAX.: +49 (0)711/6862-258
Title Alternative Transport Technologies for
Megacities
Authors Enver Doruk Özdemir
Tel.: +49 (0)711/6862-562
Johannes Pagenkopf
Tel.: +49 (0)30/670557-957
Florian Kleiner
Tel.: +49 (0)711/6862-8120
Ulrike Kugler
Tel.: +49 (0)711/6862-8142
Stephan Schmid
Tel.: +49 (0)711/6862-533
Project Greenpeace-Megacity

Seite III
Approved 25 February 2015, Stephan Schmid, Head of
Department Vehicle Systems and
Technology Assessment
Approved 26 February 2015, Horst Friedrich, Institute
Director

Seite IV
Table of Content
1 Introduction 1
2 Locally emission-free powertrains 3
2.1 Battery electric powertrain ................................................................................... 3
2.2 Catenary electric powertrain ................................................................................ 5
2.3 Fuel cell electric powertrain ................................................................................. 8
3 Locally emission-free vehicles for megacities 11
3.1 Individual passenger transport .......................................................................... 11
3.1.1 Two- and three-wheelers ..................................................................... 11
3.1.2 Passenger cars .................................................................................... 16
3.2 Public passenger transport ................................................................................ 22
3.2.1 Buses ................................................................................................... 22
3.2.2 Rail ...................................................................................................... 28
3.2.3 Aerial Ropeway ................................................................................... 31
3.3 Comparison of energy demand for passenger transport modes ....................... 32
3.4 Freight transport ................................................................................................ 36
4 Conclusions 39
5 References 40
Seite V
List of Abbreviations
AC Alternating current
BE Battery electric
BEV Battery electric vehicle
DC Direct current
E-bike Electric bike
FC Fuel cell
FCE Fuel cell electric
FCEV Fuel cell electric vehicle
GVW Gross vehicle weight
H2 Hydrogen
H2O Water
LRT Light rail transit
NEDC New European driving cycle
O2 Oxygen
OEM Original Equipment Manufacturer
pass. passenger
pedelec pedal electric cycle
pkm Passenger kilometer
tkm Ton kilometer
Seite VI
List of Figures
Figure 1: Schematic architecture of battery electric vehicles (BEV) .................................... 4
Figure 2: Schematic architecture of rail and road bound catenary vehicles ........................ 7
Figure 3: Schematic architecture of fuel cell electric vehicles (FCEV) ................................ 8
Figure 4: Components of PEM fuel cell ............................................................................... 9
Figure 5: Electrical energy demand of passenger transport systems ................................ 35
Seite VII
List of Tables
Table 1: Overhead catenary and third rail systems in urban public transport applications .. 6
Table 2: Techno-economic characteristics of pedelecs/e-bikes ........................................ 12
Table 3: Techno-economic characteristics of battery electric scooters ............................. 13
Table 4: Techno-economic characteristics of battery electric motorbikes ......................... 14
Table 5: Techno-economic characteristics of battery electric rickshaw ............................. 15
Table 6: European car market classification system with brand and model examples (European focus) ............................................................................................................... 16
Table 7: Techno-economic characteristics of A-segment battery electric passenger cars 18
Table 8: Techno-economic characteristics of B-segment battery electric passenger cars 19
Table 9: Techno-economic characteristics of C-segment battery electric passenger cars 20
Table 10 Techno-economic characteristics of fuel cell electric passenger cars: ............... 21
Table 11: Techno-economic characteristics of battery electric minibuses (6-8 m) ............ 24
Table 12: Techno-economic characteristics of battery electric buses (12 m) .................... 24
Table 13: Techno-economic characteristics of fuel cell electric minibuses (6-8 m) ........... 26
Table 14: Techno-economic characteristics of fuel cell electric buses (12 m) ................... 26
Table 15: Techno-economic characteristics of trolleybuses (18 m) ................................... 28
Table 16: Techno-economic characteristics of light rail transit systems ............................ 29
Table 17: Techno-economic characteristics of metro systems .......................................... 30
Table 18: Techno-economic characteristics of commuter rail systems ............................. 31
Table 19: Techno-economic characteristics of aerial ropeway systems (detachable gondolas) ........................................................................................................................... 32
Table 20: Occupancy rates of individual and public passenger transport means used in this report ........................................................................................................................... 34
Table 21: Techno-economic characteristics of battery electric vehicles in N1 vehicle category ............................................................................................................................. 37
Table 22: Techno-economic characteristics of fuel cell electric vehicles in N1 vehicle category ............................................................................................................................. 38
Seite 1
1 Introduction
The United Nations have emphasized in their World Urbanization Prospects report that
population growth and rapid urbanization are important trends in many regions around
the world, and especially in developing countries (UN, 2014). These megatrends trigger
among others increased urban transport, pollution and increased energy use for urban
transport, in particular of fossil fuels, the latter being one of the significant contributors
to climate change.
Each megacity, though, has its own characteristic transportation patterns and problems
(Shah, 2014). There is a vast variety of city types differing amongst others in their
spatial structure, existing traffic system, population density, cultural transport habits,
and driving profiles. Other factors contributing to the uniqueness of cities are the
economic power, the degree of (in)formality and political regulation and city planning
schemes, all acting back on the shape of transport systems (Priester, Kenworthy et al.,
2013). As a consequence, taking city-specific preconditions and requirements into
account, there cannot be a “one-solution-fits-all” in terms of customized traffic systems.
On the contrary, individual tailor-made solutions are needed.
This report shall support in enlightening the various options that exist for transport
systems and in particular in terms of oil-independent vehicle concepts that are suitable
for megacity contexts in the near future. More precisely, the aim is to compare and
contrast - locally - emission-free individual and public land transport options (or vehicle
concepts) that are suitable for megacity contexts, which are available on the market
today or will likely be within the next 5 years. Investigated vehicle concepts are
described in terms of their technical and economic characteristics using standardized
key figures and comparing them among vehicle classes and drivetrain options.
Chapter 2 begins with a concise characterization of locally emission-free powertrain
options, namely drivetrains for battery electric, fuel cell electric and overhead catenary
vehicles on road and rail.
Based on the three powertrain options, Chapter 3 describes and characterizes
individual and public transport vehicle options, namely two- and three-wheelers,

Seite 2
passenger cars, buses, light rail trains, metros, urban heavy rail and aerial ropeway
systems. In addition, locally emission-free road freight transport options are described.
Data used in this report (e. g. on energy consumption, passenger capacity, prices) are
a compilation of vehicle manufacturer data (simulation of test cycles), real life operator
data. Furthermore, the DLR vehicle database is utilized, which is also mainly based on
manufacturer data. Since there are large bandwidths of each characteristic based on
the specific vehicle, operational profiles and the like, we give typical values and a lower
and upper bound level.
Seite 3
2 Locally emission-free powertrains
Currently, to achieve a locally emission-free land transport option, electric motors are
utilized as a main powertrain. The electricity may be provided to the electric motor via
several means either on or off-board:
Battery electric powertrain: The electricity is generated off-board and stored on-
board via electro-chemical energy storage units (see section 2.1),
Catenary electric powertrain: The electricity is generated off-board and
constantly supplied to the vehicle via an external catenary during driving (see
section 2.2),
Fuel cell electric powertrain: The electricity is generated on-board with a fuel
cell via reaction of hydrogen and oxygen. For this application, an on-board
hydrogen storage unit is needed (see section 2.3).
2.1 Battery electric powertrain
A battery electric vehicle (BEV) utilizes an electric motor to convert electrical energy
into mechanical energy and requires a battery for the energy storage. The battery is
connected to electric motor via a DC/AC converter including a control system
(Grunditz, 2014). Most of the BEVs have a gearbox with only one gear ratio (Lienkamp,
2014). If the vehicle has only one central electric motor, then a differential is needed
similar to the conventional vehicles. The structure of a BEV with a central electric motor
is presented schematically in Figure 1.
The battery is considered to be one of the most critical components of electrified
vehicles due to its cost intensive nature (Özdemir and Hartmann, 2012; Redelbach,
Özdemir et al., 2014). Furthermore, another drawback of the batteries compared to
fossil liquid fuels is its lower energy density resulting in limited driving ranges combined
with high volumes and masses of the energy storage system. Therefore, batteries
(especially lithium-based ones) have been subject to tremendous research efforts in
recent years and this trend is expected to continue in the following years (Wagner,
Preschitschek et al., 2013) with improvements in costs, life expectancy and energy
density.

Seite 4
Figure 1: Schematic architecture of battery electric vehicles (BEV)
Several quick battery charging strategies for battery electric road and rail vehicles
beyond common conductive cable-based charging have emerged in recent years
(some of which have already entered commercialization):
- Conductive quick charging
o This strategy is mainly designed for buses and trams. The charging at
high power rates (200-500 kW) is performed at intermediate and turning
points via extendable pantographs, a demonstration project for buses is
for example in day-to-day use in Geneva, Switzerland (SAE Off-
Highway Engineering Online, 2013).
- Inductive quick charging
o Several research and demonstration projects on inductive charging at
traffic lights or even dynamically in-road-charging exist for passenger
cars (EGVI, 2014; WiCh, 2014).
o For buses at intermediate stops and 10-30 minutes re-charging at
turning points, several research, demonstration and commercialization
projects are underway operating with a charging power of 50-200 kW
(FTA, 2014b).
- Battery swapping stations
o China is operating robotic battery swapping stations for its urban battery
electric buses in several cities since 2008 (Li, 2013).

Seite 5
o Battery car maker Tesla has installed a commercial battery swap station
in California allowing a battery swap in about 3 minutes (Forbes, 2014).
Both inductive charging at stations and battery swap stations demand high
infrastructural investments but enable a reduction of on-board battery capacity, weight
and, thus, vehicle cost in turn (and allowing also an increase of passenger load).
Although battery-electric drivetrains could also be applied to rail applications, only road
battery electric vehicles are considered in this study since external catenary systems
are best suited to rail-bound urban mass rapid transit systems (see Chapter 3.2). The
advantages of battery electric road vehicles compared to conventional internal
combustion engine vehicles are summarized below:
Zero local emissions
Significant lower well-to-wheel greenhouse gas emissions possible (depending
on the electricity generation)
Lower variable costs (mainly fuel)
Higher torque compared to internal combustion engine at low speed
Lower vibrations and noise
However, battery electric road vehicles have also some drawbacks compared to
internal combustion engine vehicles, which include:
Limited driving range due to lower energy density
Longer charging time
Additional infrastructure requirement for charging points
Higher purchase costs (at the moment)
2.2 Catenary electric powertrain
Public transport systems, such as trams (light rail trains), metro, commuter train and
trolley bus systems are operated on rail or road networks that are equipped with
electric overhead wires or rigidly installed third rails alongside the track. The electric
power is continuously transferred to the vehicle via the wire or third rail, usually direct
current (DC) with 500 – 1500 V, and drawn by a current collector installed on the

Seite 6
vehicle. Sometimes, also alternate current (AC) systems with higher voltages are
applied in commuter rail systems. Urban tram, metro and usually also commuter rail
systems draw the electricity from an overhead catenary or a third rail. Road trolley
buses operate with special current collectors under two overhead wires; one is to draw
the current from the wire and the other to close the circuit.
In recent years, overhead catenary trucks for goods transport on roads have been in
discussion (den Boer, Aarnik et al., 2013), but no such system has until now begun to
enter commercial service in an urban environment. Furthermore, as overhead catenary
trucks are not expected to be in service in the megacities in the near future (about 5
years), they are not considered in this study.
In general, overhead catenary systems can be distinguished by transport application as
presented in Table 1.
Table 1: Overhead catenary and third rail systems in urban public transport applications
Transport Applications Energy Supply System Typical Voltage Levels Tram/Light Rail
Metro Commuter Train
Overhead Catenary 500-750 V DC
750-1500 V DC 0.75-1.5 kV DC or 15/25 kV AC
Metro, Commuter Train Third Rail 750-1500 V DC Trolley bus Overhead Catenary (two poles) 600-750 V DC
Source: DLR vehicle database
Depending on the network layout and the type of vehicles the voltage level in cities is
usually in the range of 500 – 1500 V DC, some suburban commuter trains operate also
on alternating current with 15 kV, 16.7 Hz or 25 kV, 50 Hz. In some networks,
recuperation of braking energy is possible.
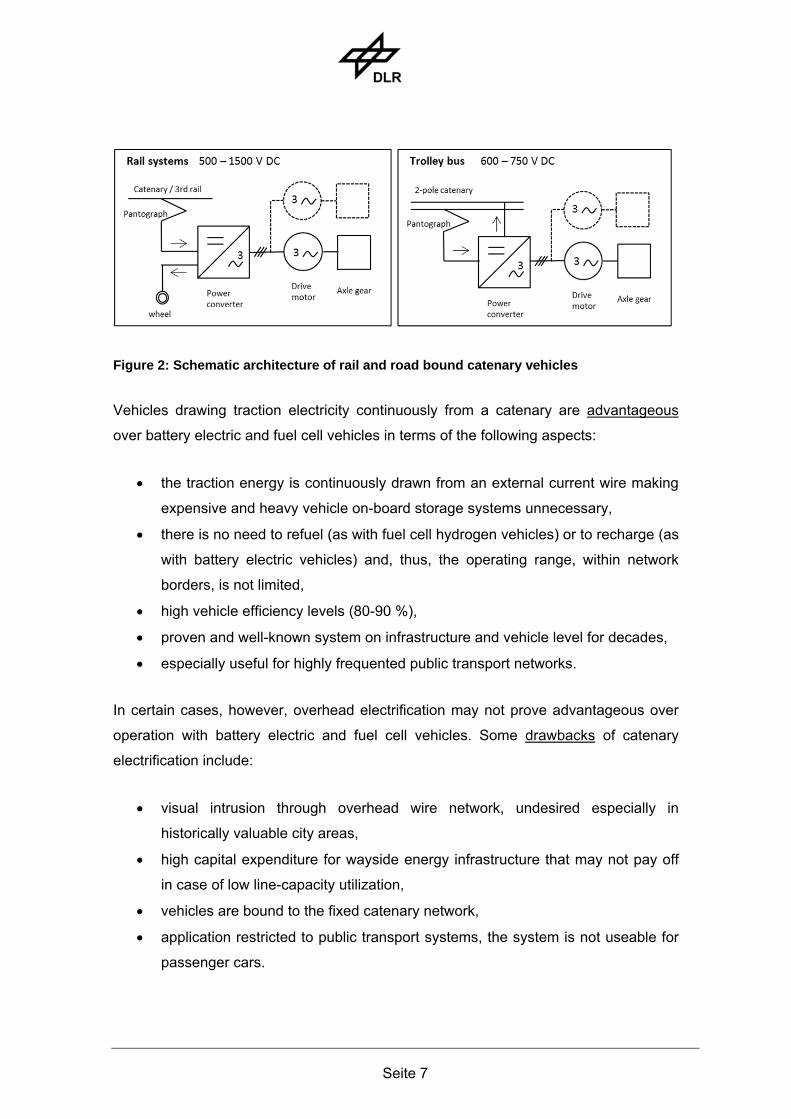
In modern catenary vehicles, the DC current drawn from the catenary is converted by
power electronics to a three-phase current with variable frequency and voltage that
feeds the drive motors. Between drive motor and axle, a gear translates torque and
speed required for the transmission. Figure 2 shows schematic drivetrain topologies of
rail and trolleybus catenary vehicles (the latter with 2-pole catenary systems).
Seite 7
Figure 2: Schematic architecture of rail and road bound catenary vehicles
Vehicles drawing traction electricity continuously from a catenary are advantageous
over battery electric and fuel cell vehicles in terms of the following aspects:
the traction energy is continuously drawn from an external current wire making
expensive and heavy vehicle on-board storage systems unnecessary,
there is no need to refuel (as with fuel cell hydrogen vehicles) or to recharge (as
with battery electric vehicles) and, thus, the operating range, within network
borders, is not limited,
high vehicle efficiency levels (80-90 %),
proven and well-known system on infrastructure and vehicle level for decades,
especially useful for highly frequented public transport networks.
In certain cases, however, overhead electrification may not prove advantageous over
operation with battery electric and fuel cell vehicles. Some drawbacks of catenary
electrification include:
visual intrusion through overhead wire network, undesired especially in
historically valuable city areas,
high capital expenditure for wayside energy infrastructure that may not pay off
in case of low line-capacity utilization,
vehicles are bound to the fixed catenary network,
application restricted to public transport systems, the system is not useable for
passenger cars.

Seite 8
2.3 Fuel cell electric powertrain
In contrary to the vehicle architectures described above, fuel cell (hybrid) electric
vehicles provide traction power by using a fuel cell as energy converter of chemical
energy (mostly hydrogen) into electrical energy based on ionic catalytic breakdown of
the molecular fuel at the anode. Figure 3 illustrates an exemplary fuel cell powertrain
with a central electric motor. Key elements of this system are the hydrogen storage and
fuel cell system.
There are several possibilities to store hydrogen on board such as in liquid form,
compressed under high pressure or via physical and chemical compounds (Eichlseder
and Klell, 2012). State of the art is the compressed hydrogen storage under 350 and
700 bar using composite materials for the tanks, which prevents hydrogen diffusion and
ensures safety. The 700 bar technology allows a higher energy storage capacity
compared to the 350 bar storage. Energy losses due to compression amounts to
approximately 15 % of the energy content of hydrogen, which is significantly less than
hydrogen being stored in liquid form (30-40 % losses) (Ferrari, Offinger et al., 2012).
Figure 3: Schematic architecture of fuel cell electric vehicles (FCEV)
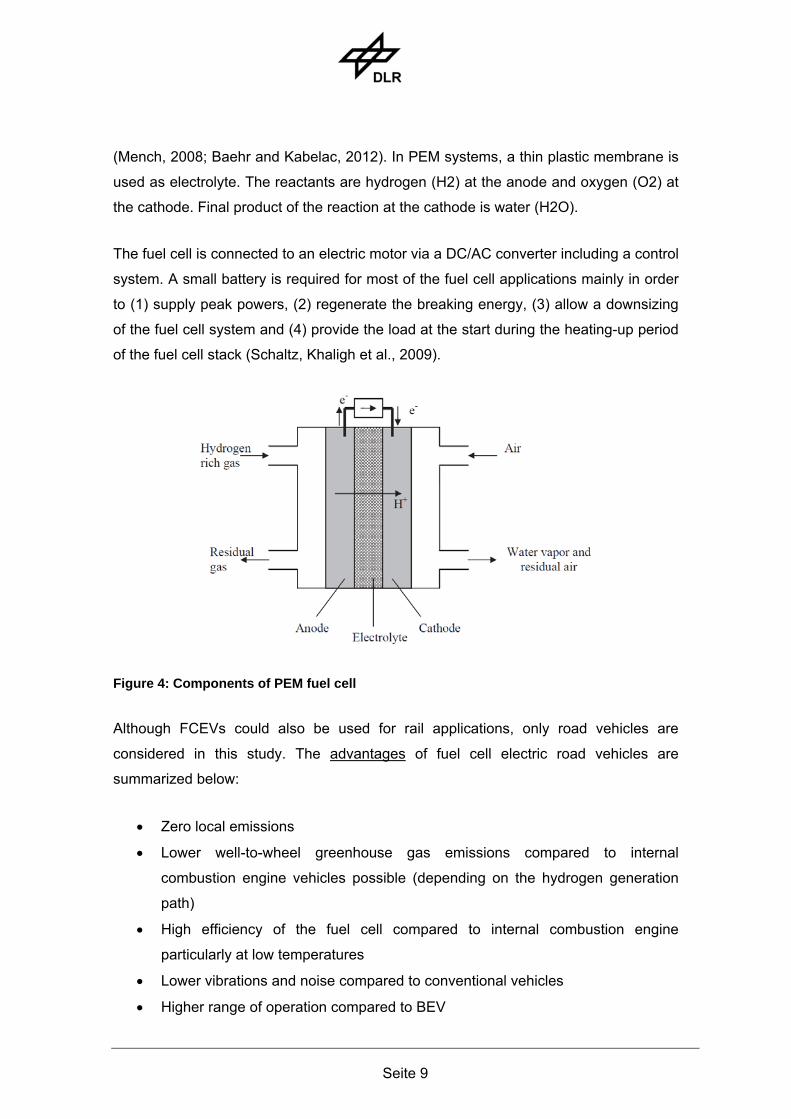
There are several fuel cell types, however, in this study only the proton exchange
membrane (PEM, see in Figure 4 taken from Özdemir, 2012) is considered as this type
is most suitable for automotive applications due to advantageous current-over-voltage
characteristics, the flexibility to react on rapid load changes and the fast warm-up time
Seite 9
(Mench, 2008; Baehr and Kabelac, 2012). In PEM systems, a thin plastic membrane is
used as electrolyte. The reactants are hydrogen (H2) at the anode and oxygen (O2) at
the cathode. Final product of the reaction at the cathode is water (H2O).
The fuel cell is connected to an electric motor via a DC/AC converter including a control
system. A small battery is required for most of the fuel cell applications mainly in order
to (1) supply peak powers, (2) regenerate the breaking energy, (3) allow a downsizing
of the fuel cell system and (4) provide the load at the start during the heating-up period
of the fuel cell stack (Schaltz, Khaligh et al., 2009).
Figure 4: Components of PEM fuel cell
Although FCEVs could also be used for rail applications, only road vehicles are
considered in this study. The advantages of fuel cell electric road vehicles are
summarized below:
Zero local emissions
Lower well-to-wheel greenhouse gas emissions compared to internal
combustion engine vehicles possible (depending on the hydrogen generation
path)
High efficiency of the fuel cell compared to internal combustion engine
particularly at low temperatures
Lower vibrations and noise compared to conventional vehicles
Higher range of operation compared to BEV

Seite 10
Significant shorter refueling times than recharging times for BEV
However, fuel cell electric road vehicles have also some drawbacks, which include:
Higher purchase costs (even higher than BEVs)
Requirement to build a hydrogen infrastructure
High purity requirements and high costs of hydrogen as fuel
Durability and long-term performance of fuel cell stack especially for transient
operation
Seite 11
3 Locally emission-free vehicles for megacities
In this chapter, the powertrain types described in Chapter 2 are linked to different road
and rail bound vehicle types relevant for megacities. The vehicle concepts are
subdivided into individual passenger transport, public passenger transport and road
freight transport means.
3.1 Individual passenger transport
The individual passenger transport is subdivided into two sections: two- and three-
wheelers (see chapter 3.1.1) and passenger cars (see chapter 0).
3.1.1 Two- and three-wheelers
Pedelecs and E-bikes
Pedelecs (pedal electric cycle) have an electric motor up to 250 W and the cyclist is
supported by the electric motor only if he/she is also cycling and the speed is less than
25 km/h. E-bikes (also called pedelec 45 or S-pedelec) are equipped with an electric
motor with up to 500 W, which supports the cyclist up to 45 km/h. Additionally, the e-
bike cyclist may drive only electrically up to 20 km/h (ADFC, 2014)1.
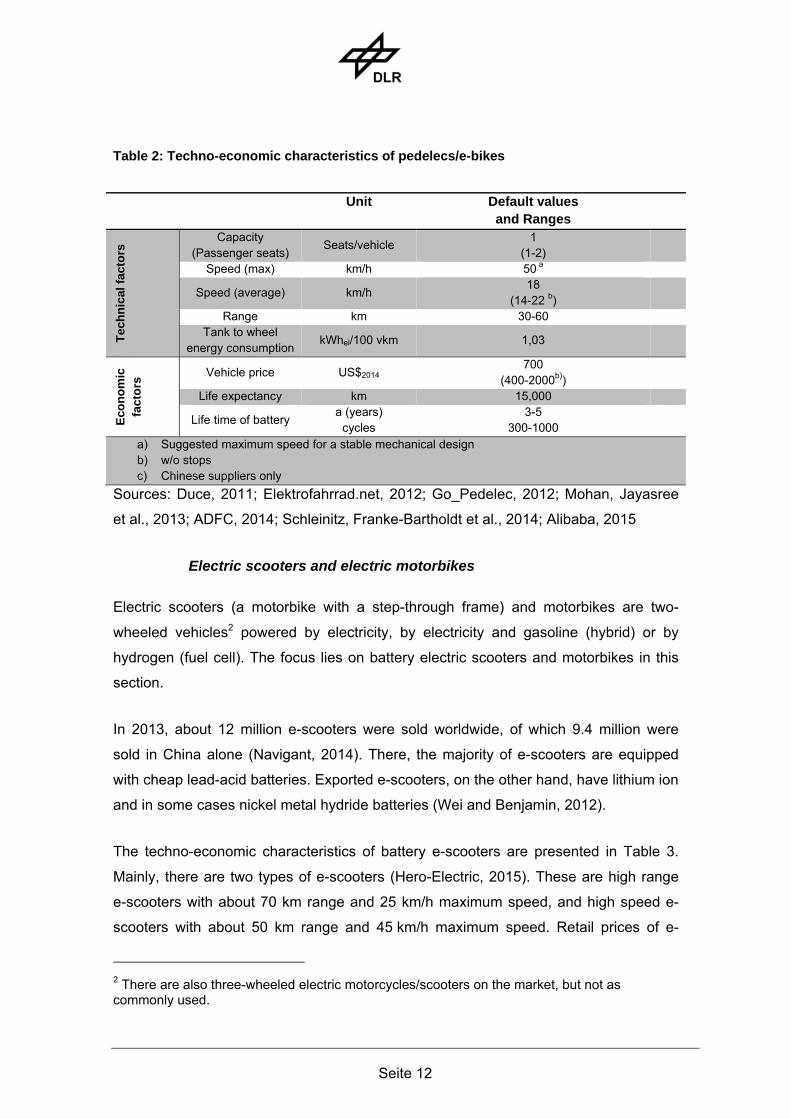
The characteristics of pedelecs and e-bikes are presented in Table 2. The average
speed without stops for pedelecs and e-bikes is about 18 km/h. The energy for
supporting the cyclist is stored in the battery and the electric driving range is typically
between 30 and 60 km, depending on the battery capacity. The average electricity
consumption is about 1 kWh per 100 km bicycle ride. Retail prices of pedelecs and e-
bikes (only from Chinese suppliers) are between 400 and 2,000 US $, with an average
value of 700 US $.
1 The maximum wattage or limits for supporting the cyclist are valid for Germany and may vary by country and jurisdiction.
Seite 12
Table 2: Techno-economic characteristics of pedelecs/e-bikes
Unit Default values and Ranges
Tec
hn
ical
fac
tors
Capacity (Passenger seats)
Seats/vehicle 1
(1-2)
Speed (max) km/h 50 a
Speed (average) km/h 18
(14-22 b)
Range km 30-60 Tank to wheel
energy consumption kWhel/100 vkm 1,03
Eco
no
mic
fa
cto
rs Vehicle price US$2014
700 (400-2000b))
Life expectancy km 15,000
Life time of battery a (years)
cycles 3-5
300-1000
a) Suggested maximum speed for a stable mechanical design b) w/o stops c) Chinese suppliers only
Sources: Duce, 2011; Elektrofahrrad.net, 2012; Go_Pedelec, 2012; Mohan, Jayasree
et al., 2013; ADFC, 2014; Schleinitz, Franke-Bartholdt et al., 2014; Alibaba, 2015
Electric scooters and electric motorbikes
Electric scooters (a motorbike with a step-through frame) and motorbikes are two-
wheeled vehicles2 powered by electricity, by electricity and gasoline (hybrid) or by
hydrogen (fuel cell). The focus lies on battery electric scooters and motorbikes in this
section.
In 2013, about 12 million e-scooters were sold worldwide, of which 9.4 million were
sold in China alone (Navigant, 2014). There, the majority of e-scooters are equipped
with cheap lead-acid batteries. Exported e-scooters, on the other hand, have lithium ion
and in some cases nickel metal hydride batteries (Wei and Benjamin, 2012).
The techno-economic characteristics of battery e-scooters are presented in Table 3.
Mainly, there are two types of e-scooters (Hero-Electric, 2015). These are high range
e-scooters with about 70 km range and 25 km/h maximum speed, and high speed e-
scooters with about 50 km range and 45 km/h maximum speed. Retail prices of e-
2 There are also three-wheeled electric motorcycles/scooters on the market, but not as commonly used.
Seite 13
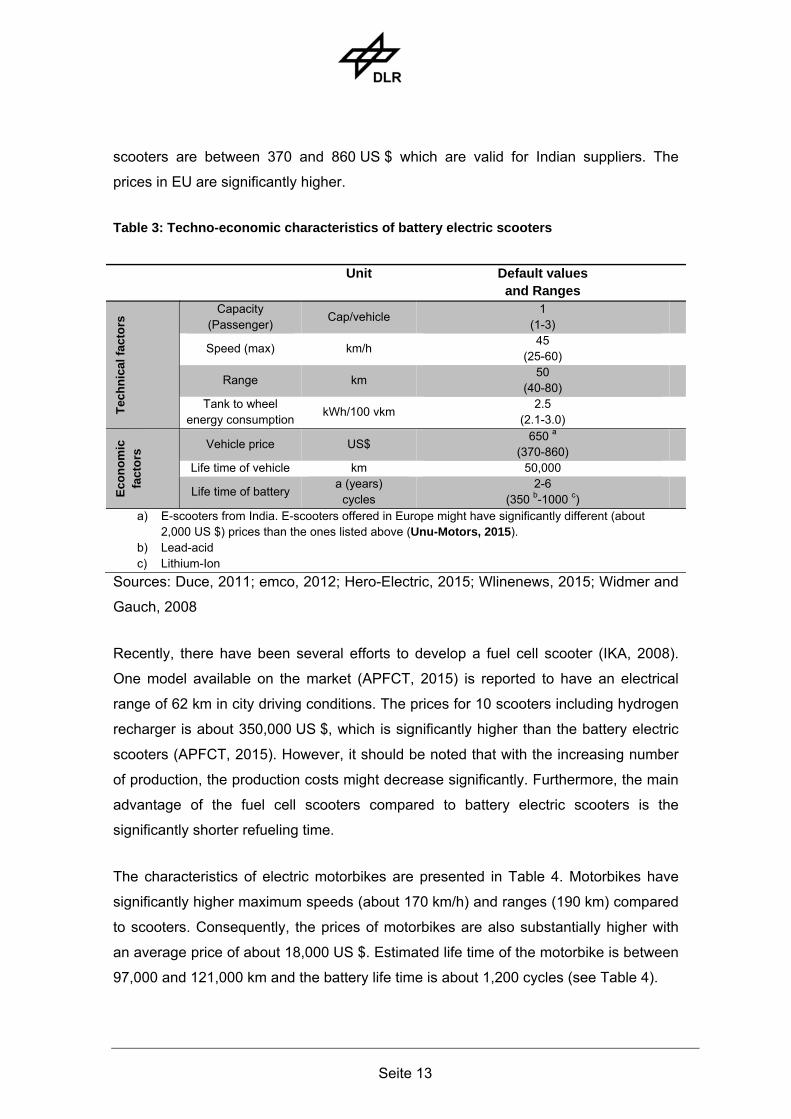
scooters are between 370 and 860 US $ which are valid for Indian suppliers. The
prices in EU are significantly higher.
Table 3: Techno-economic characteristics of battery electric scooters
Unit Default values and Ranges
Tec
hn
ical
fac
tors
Capacity (Passenger)
Cap/vehicle 1
(1-3)
Speed (max) km/h 45
(25-60)
Range km 50
(40-80)
Tank to wheel energy consumption
kWh/100 vkm 2.5
(2.1-3.0)
Eco
no
mic
fa
cto
rs Vehicle price US$
650 a
(370-860)
Life time of vehicle km 50,000
Life time of battery a (years)
cycles 2-6
(350 b-1000 c)
a) E-scooters from India. E-scooters offered in Europe might have significantly different (about 2,000 US $) prices than the ones listed above (Unu-Motors, 2015).
b) Lead-acid c) Lithium-Ion
Sources: Duce, 2011; emco, 2012; Hero-Electric, 2015; Wlinenews, 2015; Widmer and
Gauch, 2008
Recently, there have been several efforts to develop a fuel cell scooter (IKA, 2008).
One model available on the market (APFCT, 2015) is reported to have an electrical
range of 62 km in city driving conditions. The prices for 10 scooters including hydrogen
recharger is about 350,000 US $, which is significantly higher than the battery electric
scooters (APFCT, 2015). However, it should be noted that with the increasing number
of production, the production costs might decrease significantly. Furthermore, the main
advantage of the fuel cell scooters compared to battery electric scooters is the
significantly shorter refueling time.
The characteristics of electric motorbikes are presented in Table 4. Motorbikes have
significantly higher maximum speeds (about 170 km/h) and ranges (190 km) compared
to scooters. Consequently, the prices of motorbikes are also substantially higher with
an average price of about 18,000 US $. Estimated life time of the motorbike is between
97,000 and 121,000 km and the battery life time is about 1,200 cycles (see Table 4).

Seite 14
Table 4: Techno-economic characteristics of battery electric motorbikes
Unit Default values and Ranges
Tec
hn
ical
fac
tors
Capacity (Passenger)
Cap/vehicle 1
Speed (max) km/h 170
(150-240 b)
Range km 190
(50-300) Tank to wheel
energy consumption
kWh/100 vkm 4.5-5.0
Eco
no
mic
fa
cto
rs
Vehicle price US$ 18,000
(9,900-39,000) Life time of
vehicle km 97,000 – 121,000
Life time of battery
cycles 1,200
a) The range and the (tank to wheel) energy consumption values are referring to the statements of manufacturers, which are mostly based on standardized driving cycles. The energy consumption for real driving conditions might be significantly higher than the standardized driving cycles.
b) A single electric motorcycle model with a maximum speed of 350 km/h is not considered here.
Sources: Chester and Horvath, 2009; Energica, 2015; Johammer, 2015;
LightningMotorcycle, 2015; ZeroMotorcycles, 2015b; ZeroMotorcycles, 2015a;
ZeroMotorcycles, 2015c
Auto Rickshaw (electric)
Electric Auto Rickshaws are usually three-wheeled vehicles (also called tricycles or tuk
tuks) with a cabin used for public transport, which is substituting basically a taxi
(Hickman, 2011). Although many rickshaws are men-powered, more than eight million
only in India (Sarmah, 2010), there are also rickshaws with conventional combustion
engines. Recently, there are several available models on the market that are equipped
with a battery and an electric motor.
The techno-economic characteristics of battery electric rickshaws are presented in
Table 5. Passenger capacities of rickshaws from India vary between 4+1 and 7+1,
where most of the models are built for 5 passengers + 1 driver. The average maximum
speed and range are 35 km/h and 80 km respectively. In Mumbai (India), a rickshaw is
operated on average 10 hours per day and travels 105 km on average (Shlaes and
Seite 15
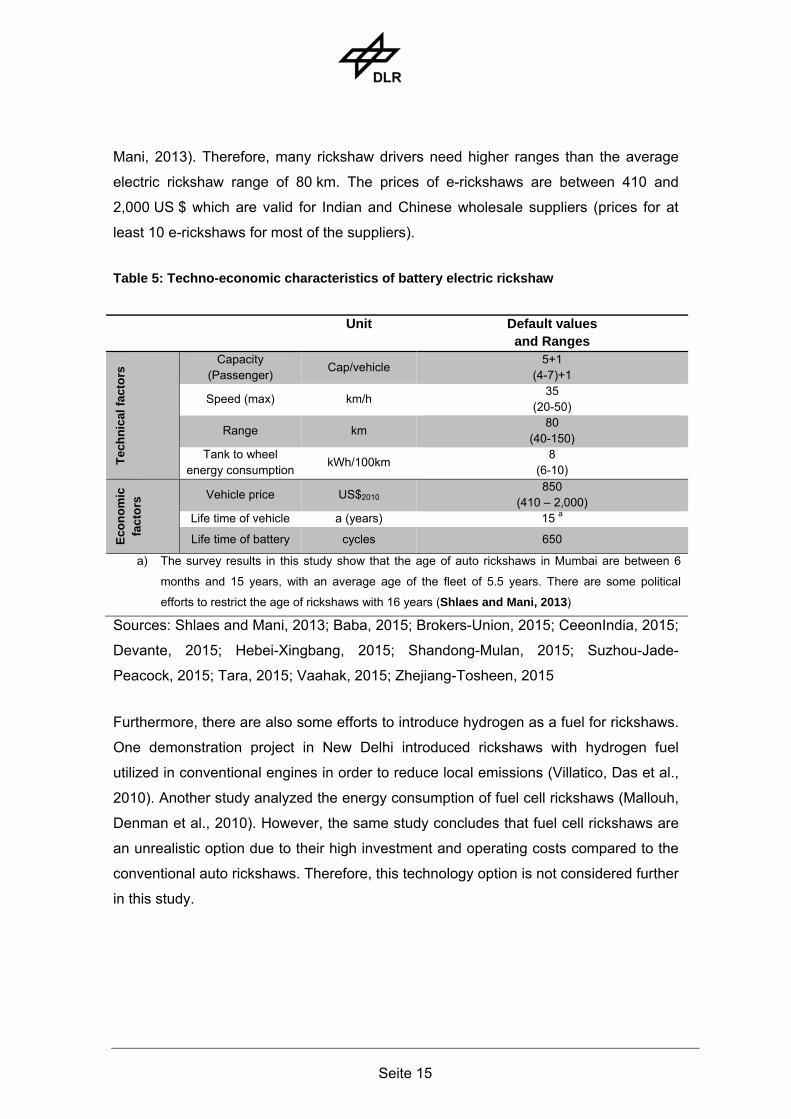
Mani, 2013). Therefore, many rickshaw drivers need higher ranges than the average
electric rickshaw range of 80 km. The prices of e-rickshaws are between 410 and
2,000 US $ which are valid for Indian and Chinese wholesale suppliers (prices for at
least 10 e-rickshaws for most of the suppliers).
Table 5: Techno-economic characteristics of battery electric rickshaw
Unit Default values and Ranges
Tec
hn
ical
fac
tors
Capacity (Passenger)
Cap/vehicle 5+1
(4-7)+1
Speed (max) km/h 35
(20-50)
Range km 80
(40-150) Tank to wheel
energy consumption kWh/100km
8 (6-10)
Eco
no
mic
fa
cto
rs Vehicle price US$2010
850 (410 – 2,000)
Life time of vehicle a (years) 15 a
Life time of battery cycles 650
a) The survey results in this study show that the age of auto rickshaws in Mumbai are between 6
months and 15 years, with an average age of the fleet of 5.5 years. There are some political
efforts to restrict the age of rickshaws with 16 years (Shlaes and Mani, 2013)
Sources: Shlaes and Mani, 2013; Baba, 2015; Brokers-Union, 2015; CeeonIndia, 2015;
Devante, 2015; Hebei-Xingbang, 2015; Shandong-Mulan, 2015; Suzhou-Jade-
Peacock, 2015; Tara, 2015; Vaahak, 2015; Zhejiang-Tosheen, 2015
Furthermore, there are also some efforts to introduce hydrogen as a fuel for rickshaws.
One demonstration project in New Delhi introduced rickshaws with hydrogen fuel
utilized in conventional engines in order to reduce local emissions (Villatico, Das et al.,
2010). Another study analyzed the energy consumption of fuel cell rickshaws (Mallouh,
Denman et al., 2010). However, the same study concludes that fuel cell rickshaws are
an unrealistic option due to their high investment and operating costs compared to the
conventional auto rickshaws. Therefore, this technology option is not considered further
in this study.
Seite 16
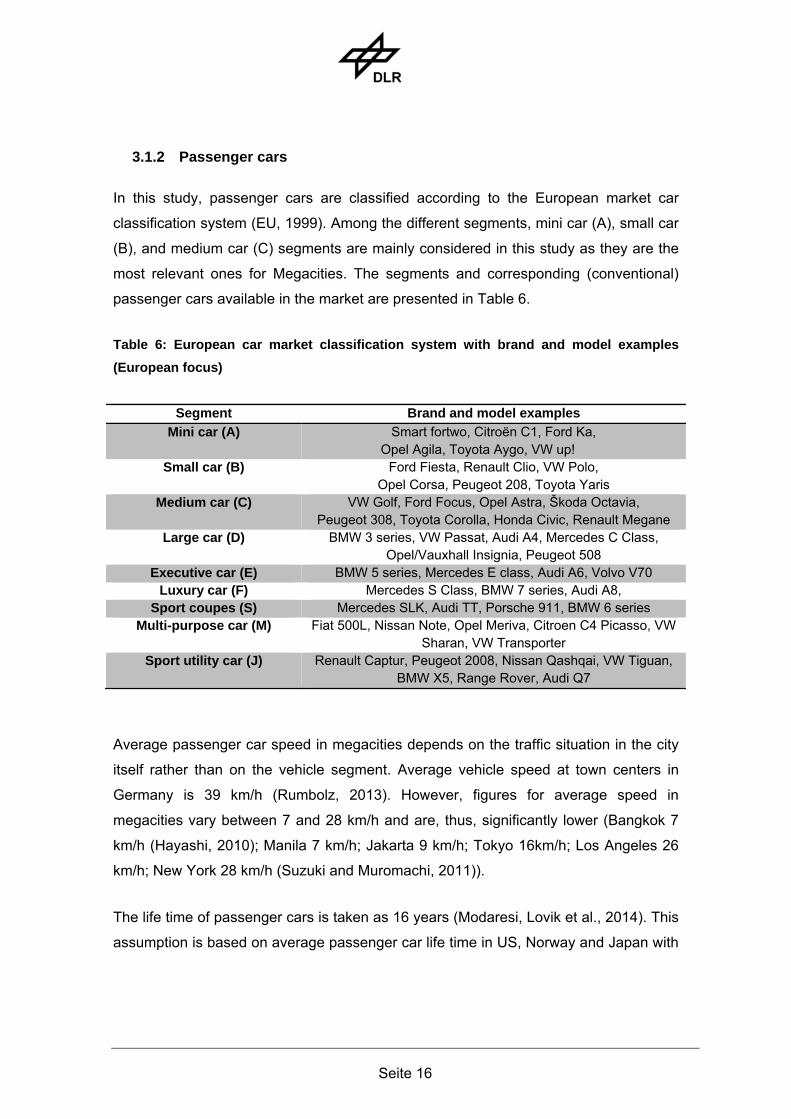
3.1.2 Passenger cars
In this study, passenger cars are classified according to the European market car
classification system (EU, 1999). Among the different segments, mini car (A), small car
(B), and medium car (C) segments are mainly considered in this study as they are the
most relevant ones for Megacities. The segments and corresponding (conventional)
passenger cars available in the market are presented in Table 6.
Table 6: European car market classification system with brand and model examples
(European focus)
Segment Brand and model examples
Mini car (A) Smart fortwo, Citroën C1, Ford Ka, Opel Agila, Toyota Aygo, VW up!
Small car (B) Ford Fiesta, Renault Clio, VW Polo, Opel Corsa, Peugeot 208, Toyota Yaris
Medium car (C) VW Golf, Ford Focus, Opel Astra, Škoda Octavia, Peugeot 308, Toyota Corolla, Honda Civic, Renault Megane
Large car (D) BMW 3 series, VW Passat, Audi A4, Mercedes C Class, Opel/Vauxhall Insignia, Peugeot 508
Executive car (E) BMW 5 series, Mercedes E class, Audi A6, Volvo V70 Luxury car (F) Mercedes S Class, BMW 7 series, Audi A8,
Sport coupes (S) Mercedes SLK, Audi TT, Porsche 911, BMW 6 series Multi-purpose car (M) Fiat 500L, Nissan Note, Opel Meriva, Citroen C4 Picasso, VW
Sharan, VW Transporter Sport utility car (J) Renault Captur, Peugeot 2008, Nissan Qashqai, VW Tiguan,
BMW X5, Range Rover, Audi Q7
Average passenger car speed in megacities depends on the traffic situation in the city
itself rather than on the vehicle segment. Average vehicle speed at town centers in
Germany is 39 km/h (Rumbolz, 2013). However, figures for average speed in
megacities vary between 7 and 28 km/h and are, thus, significantly lower (Bangkok 7
km/h (Hayashi, 2010); Manila 7 km/h; Jakarta 9 km/h; Tokyo 16km/h; Los Angeles 26
km/h; New York 28 km/h (Suzuki and Muromachi, 2011)).
The life time of passenger cars is taken as 16 years (Modaresi, Lovik et al., 2014). This
assumption is based on average passenger car life time in US, Norway and Japan with
Seite 17
a standard deviation of 3 years (normal distribution)3. However, the life time of a
passenger car differs in different countries among others depending on the income
level, the taxation system and availability of public transport systems. The average age
of the existing fleet is about 8 years in Germany, 9 years in Brazil and 11 years in the
US (RolandBerger, 2013).
Battery electric vehicles (BEV)
As mentioned in chapter 2, the battery is the most critical component in a battery
electric vehicle (BEV) due to its costs and durability. There is a discussion about the
lifetime of batteries in the literature. Duvall (2003) argues that the battery would last
between 130,000 and 150,000 km, which corresponds to about 8 years for an average
driver. Neubauer, Brooker et al. (2012) state that the lifetime of the battery is at least 15
years with the maximum battery capacity loss of 50%. Hartmann and Özdemir (2011)
assume that a battery would last 4,500 cycles (about 12 years) in 2030. Gerssen-
Gondelach and Faaij (2012) are much more pessimistic and are arguing with a lifetime
of 1,000 cycles (about 3 years) in 2015 and 3000 cycles (about 8 years) in 2025.
On the other hand, today, most of the OEMs (BMW, 2015; Nissan, 2015; Toyota,
2015b; VW, 2015) are giving battery warranties with 8 years or 100,000 miles (ca.
161,000 km). Renault ZOE has a shorter warranty period of 5 years or 60,000 miles
with 70% of battery capacity (Renault, 2015). Therefore, in this study a minimum
lifetime of 8 years is assumed for the battery.
BEVs are analyzed in 3 different categories (A, B, and C segment according to Table
6) in this study. Techno-economic characteristics of mini cars (or passenger cars in A-
segment), which are available on the market with the market introduction year between
2010 and 2013, are presented in Table 7. Although most of the A-segment BEVs (11
among 21 available cars) are having a capacity of 2 passengers, four-seaters are not
negligible (9 among 21) in this segment4. The average curb weight for A-segment
BEVs is about 950 kg. The electrical driving range varies between 40 and 160 km, with
3 Depending on this assumption, 99.7% of passenger cars would have a lifetime between 7 and 25 years 4 Only one model has a capacity of three seats.

Seite 18
a default value of 130 km5 for an average A-segment vehicle. The prices of A segment
cars start with about 9,300 US $ for a Renault Twizy and amount to 25,000 US $ for an
average A-segment passenger car.
Table 7: Techno-economic characteristics of A-segment battery electric passenger cars
Unit Default values and Ranges a
Tec
hn
ical
fac
tors
Capacity (Passengers)
Cap/vehicle 2
(2-4)
Speed (max) km/h 100
(45-130)
Range b km 130
(40-160)
Energy consumption b
kWhel/100vkm
15 (12-20)
Eco
no
mic
fa
cto
rs
Vehicle price US $ 25,000
(9,300-65,000)
a) DLR vehicle concept database for small serial and serial vehicles (available on the market) with the market introduction year between 2010 and 2013. There are 23 considered vehicles, which include among others Citroen C-Zero, Peugeot iOn, Renault Twizy, VW e-up! and Karabag 500 Electro.
b) The range and the (tank to wheel) energy consumption values are referring to the statements of manufacturers, which are mostly based on standardized driving cycles. The energy consumption for real driving conditions might be significantly higher than the standardized driving cycles (Mock, Tietge et al., 2014). As a consequence, the range (for a real driving condition) might be lower.
Sources: DLR vehicle concept database
Small battery electric vehicles (or BEVs in B-segment) are presented in Table 8. The
passenger capacity varies between 4 and 5 passengers and the average curb weight is
about 1,100 kg, which is slightly higher than the A-segment. Furthermore, the electrical
driving range is also higher than in the A-segment with an average of 150 km (variation
between 100 and 220 km). The price of an average B-segment car is about
36,000 US $.
5 Average and median for electrical driving range (among 23 available BEVs) are 127 km and 135 km respectively.

Seite 19
Table 8: Techno-economic characteristics of B-segment battery electric passenger cars
Unit Default values and Ranges a
Tec
hn
ical
fac
tors
Capacity (Passenger)
Cap/vehicle 4
(4-5)
Speed (max) km/h 115
(60-150)
Range b km 150
(100-220)
Tank to wheel energy consumption b
kWhel/100vkm
16 (10-22)
Eco
no
mic
fa
cto
rs
Vehicle price US $ 36,000
(8,000 c-70,000)
a) DLR vehicle concept database for small serial and serial vehicles (available on the market) with the market introduction year between 2010 and 2013. Considered vehicles include among others BMW i3, Renault ZOE, Mitsubishi i-MEV, Mercedes-Benz A class, Cherry QQ3EV, JAC J3 iev and Tata Indica Vista.
b) The range and the tank to wheel energy consumption values are referring to the statements of manufacturers, which are mostly based on standardized driving cycles. The energy consumption for real driving conditions might be significantly higher than the standardized driving cycles (Mock, Tietge et al., 2014). As a consequence, the range (for a real driving condition) might be lower.
c) The cheapest B-segment car is Tara Tiny EV with 99,999 INR (Mitra, 2008), which was marketed in 2008 as world cheapest car (today it corresponds to about 1,600 US $). However, this car is excluded from the list as there are no recent information about this brand and model.
Sources: DLR vehicle concept database
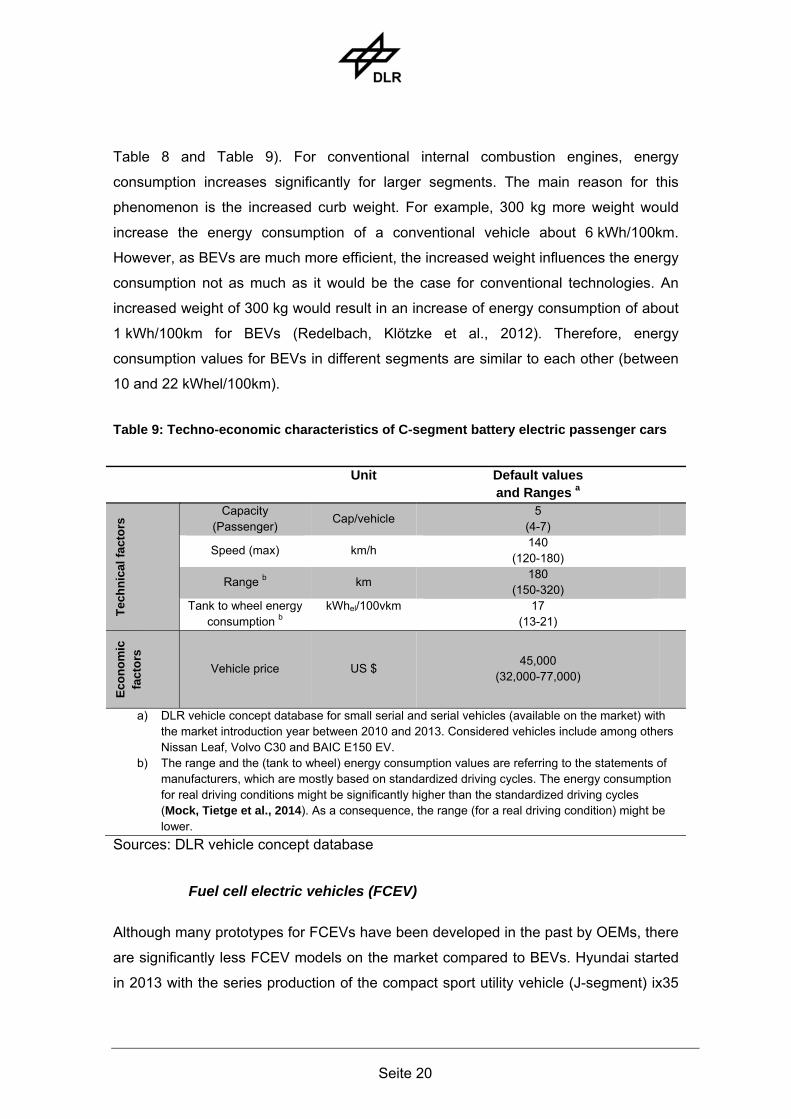
Medium BEVs (C-segment) are presented in Table 9. Most of the C-segment
passenger battery electric vehicles are having a passenger capacity of 5 people. The
average C-segment passenger car has a curb weight of about 1,400 kg. The electrical
driving range is between 150 and 320 km, where an average C-segment BEV has a
range of 180 km. The prices vary between 32,000 and 77,000 US $, where
45,000 US $ is taken as a default value for the C-segment.
The energy consumption of BEVs is not significantly different for different segments
(see Table 7,
Seite 20
Table 8 and Table 9). For conventional internal combustion engines, energy
consumption increases significantly for larger segments. The main reason for this
phenomenon is the increased curb weight. For example, 300 kg more weight would
increase the energy consumption of a conventional vehicle about 6 kWh/100km.
However, as BEVs are much more efficient, the increased weight influences the energy
consumption not as much as it would be the case for conventional technologies. An
increased weight of 300 kg would result in an increase of energy consumption of about
1 kWh/100km for BEVs (Redelbach, Klötzke et al., 2012). Therefore, energy
consumption values for BEVs in different segments are similar to each other (between
10 and 22 kWhel/100km).
Table 9: Techno-economic characteristics of C-segment battery electric passenger cars
Unit Default values and Ranges a
Tec
hn
ical
fac
tors
Capacity (Passenger)
Cap/vehicle 5
(4-7)
Speed (max) km/h 140
(120-180)
Range b km 180
(150-320)
Tank to wheel energy consumption b
kWhel/100vkm
17 (13-21)
Eco
no
mic
fa
cto
rs
Vehicle price US $ 45,000
(32,000-77,000)
a) DLR vehicle concept database for small serial and serial vehicles (available on the market) with the market introduction year between 2010 and 2013. Considered vehicles include among others Nissan Leaf, Volvo C30 and BAIC E150 EV.
b) The range and the (tank to wheel) energy consumption values are referring to the statements of manufacturers, which are mostly based on standardized driving cycles. The energy consumption for real driving conditions might be significantly higher than the standardized driving cycles (Mock, Tietge et al., 2014). As a consequence, the range (for a real driving condition) might be lower.
Sources: DLR vehicle concept database
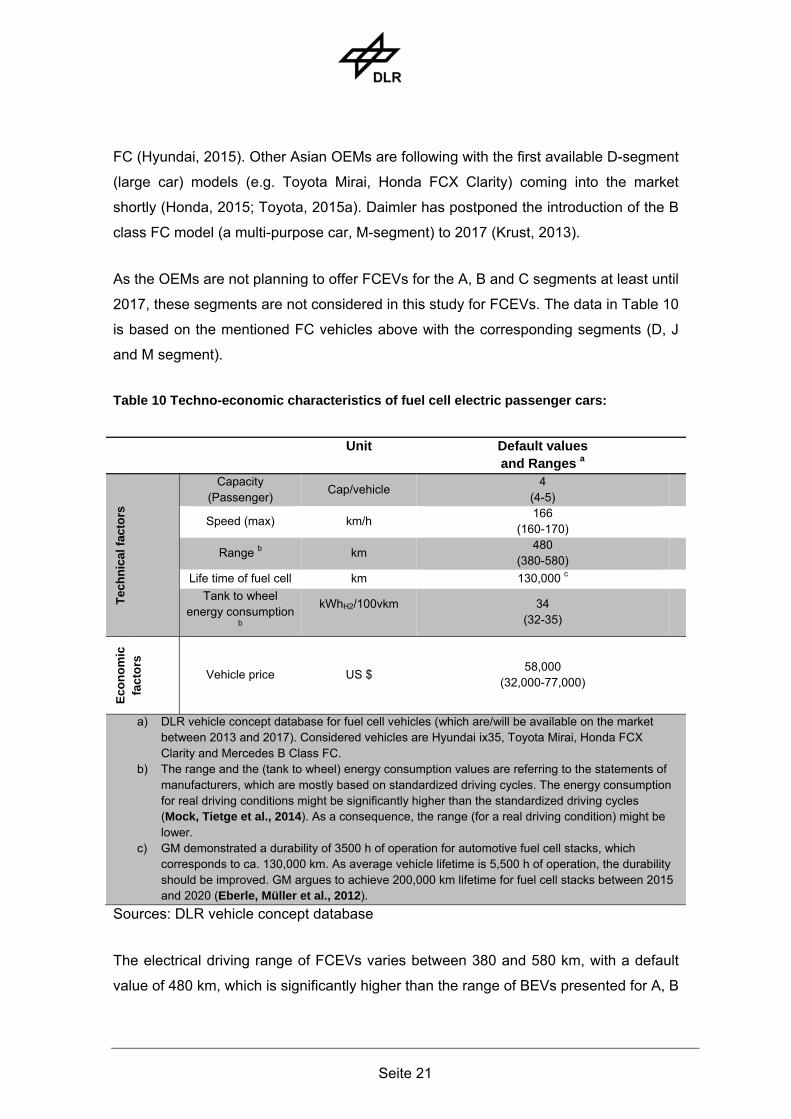
Fuel cell electric vehicles (FCEV)
Although many prototypes for FCEVs have been developed in the past by OEMs, there
are significantly less FCEV models on the market compared to BEVs. Hyundai started
in 2013 with the series production of the compact sport utility vehicle (J-segment) ix35
Seite 21
FC (Hyundai, 2015). Other Asian OEMs are following with the first available D-segment
(large car) models (e.g. Toyota Mirai, Honda FCX Clarity) coming into the market
shortly (Honda, 2015; Toyota, 2015a). Daimler has postponed the introduction of the B
class FC model (a multi-purpose car, M-segment) to 2017 (Krust, 2013).
As the OEMs are not planning to offer FCEVs for the A, B and C segments at least until
2017, these segments are not considered in this study for FCEVs. The data in Table 10
is based on the mentioned FC vehicles above with the corresponding segments (D, J
and M segment).
Table 10 Techno-economic characteristics of fuel cell electric passenger cars:
Unit Default values and Ranges a
Tec
hn
ical
fac
tors
Capacity (Passenger)
Cap/vehicle 4
(4-5)
Speed (max) km/h 166
(160-170)
Range b km 480
(380-580)
Life time of fuel cell km 130,000 c Tank to wheel
energy consumption b
kWhH2/100vkm
34 (32-35)
Eco
no
mic
fa
cto
rs
Vehicle price US $ 58,000
(32,000-77,000)
a) DLR vehicle concept database for fuel cell vehicles (which are/will be available on the market between 2013 and 2017). Considered vehicles are Hyundai ix35, Toyota Mirai, Honda FCX Clarity and Mercedes B Class FC.
b) The range and the (tank to wheel) energy consumption values are referring to the statements of manufacturers, which are mostly based on standardized driving cycles. The energy consumption for real driving conditions might be significantly higher than the standardized driving cycles (Mock, Tietge et al., 2014). As a consequence, the range (for a real driving condition) might be lower.
c) GM demonstrated a durability of 3500 h of operation for automotive fuel cell stacks, which corresponds to ca. 130,000 km. As average vehicle lifetime is 5,500 h of operation, the durability should be improved. GM argues to achieve 200,000 km lifetime for fuel cell stacks between 2015 and 2020 (Eberle, Müller et al., 2012).
Sources: DLR vehicle concept database
The electrical driving range of FCEVs varies between 380 and 580 km, with a default
value of 480 km, which is significantly higher than the range of BEVs presented for A, B
Seite 22
and C segment. The energy consumption by a FCEV is about 34 kWhH2/100 km, which
is higher than BEVs. Higher energy consumption of FCEVs is reasonable since the
electricity is produced on board from hydrogen with the corresponding efficiency
(between 40% and 60%) of fuel cell system DoE, 2006. The prices of FCEV are
between 32,000 and 77,000 US $, which are also higher than BEVs in C-segment
mainly due to the additional costs of the fuel cell stack.
3.2 Public passenger transport
Public mass transport enables the accommodation of large flows of people at
comparably low cost and energy demand and little space requirements which qualify
them for highly condensed megacity contexts.
Public passenger transport comprises in this study road and rail bound vehicles and
aerial ropeway systems. There exist more than these vehicle concepts and also cross-
concepts, but the outlined are the most important ones in urban contexts to the authors’
view.
3.2.1 Buses
Buses are road-bound public transport vehicles that offer passenger seating and
mostly also standing capacities. We distinguish between minibuses, buses and trolley
buses. Minibuses have a seating capacity of more than 9 and up to 25-30 and are
usually not designed to accommodate standing passengers. Minibuses are mostly 6-
8 m long. Informal and private transport operators in emerging countries tend to use
minibuses instead of larger buses. Buses have standardized lengths of 12 or 18 m
long (the latter articulated), further categories are buses with lengths between 8-12 m
(midibuses) and with 24 m (double-articulated buses). We investigate the standard 12
m bus (also called solobus) with typical combined seating and standing capacities for
60 – 80 passengers. Trolleybuses, operating electrically under an overhead catenary,
are usually articulated and 18 m long with a capacity of between 120 and 150
passengers both for sitting and standing. In order to compare the passenger capacities
over time of the examined vehicles, a further metric is introduced: the number of
passengers that can be transported in one direction in one hour (pass/h/dir.) in a
corridor for a given headway (i.e. the time span between two vehicles).
Seite 23
Investigated drivetrain options for buses in this report include battery electric, fuel cell
electric and overhead catenary electric (trolley) configurations.
Battery Electric Buses
Battery electric buses (BE buses) are still expensive primarily because of cost-intensive
batteries. However, battery electric bus prices have been reported to sink massively
recently, since especially Chinese cities place substantial orders generating economies
of scale (Hales, 2014).
Batteries are heavy due to their low energy density and a full charge lasts several
hours restricting operational flexibility. As a consequence, the range of battery electric
buses is limited. Partly due to these range constraints most battery electric buses on
offer are only up to 12 m long, reducing energy demand and battery size, although
BYD has an articulated 18 m battery bus on offer. Most bus operators demand full
flexibility during an operational day (8 to 16 hours). In response, several battery
charging strategies, as outlined in Chapter 2.1, have emerged (conductive and
inductive quick charging and battery swap stations). In this report, however, mainly
battery electric buses are investigated, that are recharged conductively over a few
minutes each at terminus stations while turn-around and longer overnight at the depot.
Battery lifetime in bus operations depends very much on environmental conditions
(mainly outside temperatures) and on the charging and discharging profile. Chinese
battery bus producer BYD claims up to 12 years of battery lifetime. The battery
capacity should be minimum 80 % of its original capacity after 12 years (Halvorson,
2014). A lifetime of 7.5 years is estimated for Barcelona’s bus operator (EVObsession,
2013). We assume an average battery lifetime of 8 years for buses.
The following tables specify typical BE minibuses (Table 11) and buses (Table 12).
Range of battery buses is in general limited and depends on battery size and the
driving profile. Battery truck producer Smith suggests ranges of ca. 130 km for its Smith
Edison minibus and BYD states a range of about 250 km for its K9 bus with 324 kWh of
installed battery capacity (BYD, 2015). Prices of battery buses vary among producer,
configuration and production output. We take 80,000 US$ for BE minibuses and
400,000 US$ for BE buses.

Seite 24
Table 11: Techno-economic characteristics of battery electric minibuses (6-8 m)
Unit Default values and Ranges
T
ech
nic
al f
acto
rs
Capacity (Passenger)
Cap/vehicle 15 (10-30)
Passengers per hour per direction @ 3 min.
headway
Pass/h/dir. 300 (200-600)
Speed (max) km/h 70 (60-80)
Range km 130 (80-200)
Energy consumption (battery level)
kWh/100 pass-capacity-km
1.9 (1.1-2.8)
Eco
no
mic
fa
cto
rs
Vehicle price mUS$ 0.08 (0.03-0.2)
Life time of vehicle a (years) 12 (10-20)
Life time of battery a (years) 8 3-15
Sources: DLR vehicle database; Smith Electric Vehicles, 2011; VansA2Z, 2015
Table 12: Techno-economic characteristics of battery electric buses (12 m)
Unit Default values and Ranges
Tec
hn
ical
fac
tors
Capacity (Passenger)
Cap/vehicle 75
(60-80)
Passengers per hour per direction
@ 3 min. headway
Pass/h/dir.
1500 (1200-1600)
Speed (max) km/h 90
(80-100)
Range km 250
(150-300)
Energy consumption (battery level)
kWh/100 pass-
capacity-km
1.8 (1.3-2.5)
Eco
no
mic
fa
cto
rs
Vehicle price mUS$ 0.4
(0.2-1)
Life time of vehicle
a (years) 12
(10-20)
Life time of battery a (years) 8
3-15
Sources: DLR vehicle database
Seite 25
Fuel Cell Electric Buses
Fuel cell electric buses (FCE buses) are less subject to range limitations than battery
electric buses are. Extensive operator experiences with fuel cell buses have been
build-up in recent years in a number of European and North American cities as part of
public financed research projects (FTA, 2014a; CHIC, 2015). Ranges of 250 km for
FCE minibuses and 350 km for FCE buses are taken as default values in this report.
Prices of fuel cell electric buses are still high and not competitive to diesel buses
because so far they are not manufactured in series production and fuel cell systems
are complex and, thus, costly. Costs of about 2 million US $ per fuel cell electric bus
are reported at present, but are decreasing currently mainly because of sinking fuel cell
costs and improvements in fuel cell bus assembly and installation processes
(CTtransit, no year) Ahluwalia, Wang et al., 2012 suggest a cost target of 650,000 USD
per bus by 2015, which would still be a cost premium of 50-80 % over conventional
diesel buses.
Technical and operational specifications of FCE buses are assumed to be similar to
those of BE buses differing only in range, energy demand, price and life time. We
assume the energy demand of fuel cell buses to be 2.5 times that of battery electric
buses (calculated at battery or tank level respectively), mainly due to the fuel cell
efficiency, which is about 40-45 % (combined efficiency of fuel cell stacks and
periphery). Costs of FC buses are still very high as outlined above. A drawback of fuel
cells is their still limited life time. Producers grant 12,000 – 15,000 hours lifetime
warranty in current generation fuel cells for transit bus applications (Ballard, 2014). We
assume a lifetime of 20,000 hours in our calculations. At 16 hours of operations per day
and 330 days of operation per year, this yields a lifetime of 3.8 (rounded up to 4) years.
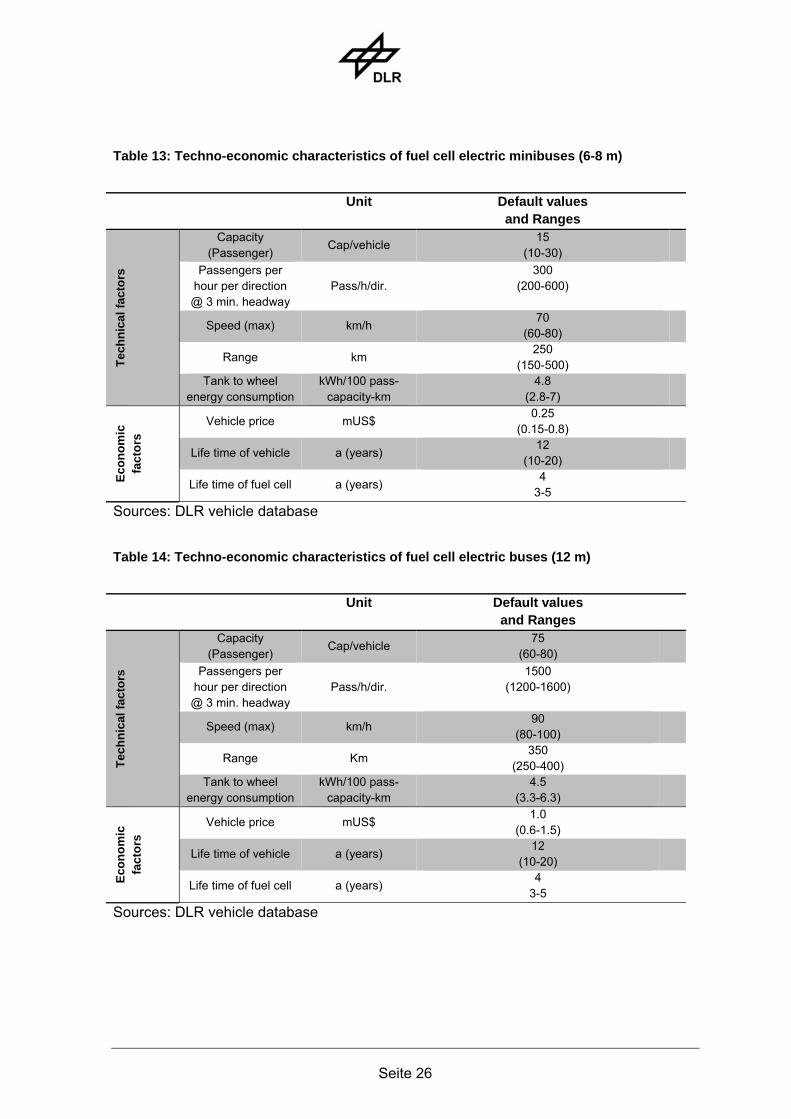
The following tables specify the characteristics of typical FCE minibuses (Table 13) and
buses (Table 14).
Seite 26
Table 13: Techno-economic characteristics of fuel cell electric minibuses (6-8 m)
Unit Default values and Ranges
Tec
hn
ical
fac
tors
Capacity (Passenger)
Cap/vehicle 15
(10-30)
Passengers per hour per direction @ 3 min. headway
Pass/h/dir. 300
(200-600)
Speed (max) km/h 70
(60-80)
Range km 250
(150-500)
Tank to wheel energy consumption
kWh/100 pass-capacity-km
4.8 (2.8-7)
Eco
no
mic
fa
cto
rs
Vehicle price mUS$ 0.25
(0.15-0.8)
Life time of vehicle a (years) 12
(10-20)
Life time of fuel cell a (years) 4
3-5
Sources: DLR vehicle database
Table 14: Techno-economic characteristics of fuel cell electric buses (12 m)
Unit Default values and Ranges
Tec
hn
ical
fac
tors
Capacity (Passenger)
Cap/vehicle 75
(60-80)
Passengers per hour per direction @ 3 min. headway
Pass/h/dir. 1500
(1200-1600)
Speed (max) km/h 90
(80-100)
Range Km 350
(250-400)
Tank to wheel energy consumption
kWh/100 pass-capacity-km
4.5 (3.3-6.3)
Eco
no
mic
fa
cto
rs
Vehicle price mUS$ 1.0
(0.6-1.5)
Life time of vehicle a (years) 12
(10-20)
Life time of fuel cell a (years) 4
3-5
Sources: DLR vehicle database
Seite 27
Trolleybuses
Trolleybuses draw the traction electricity via a current collector from a two-pole
catenary. Thus, there are no range restrictions as with battery electric and fuel cell
buses. But trolleybus systems require the funding, erection and maintenance of an
overhead catenary system. Furthermore, an advantage of trolley bus systems over light
rail systems is that they require less capital expenditure.
There are efforts to integrate additional energy storage systems on-board, e.g.
batteries and super-capacitors, in order to bridge non-electrified sections and to reduce
energy consumption by regenerative braking. In field tests, energy reductions of 10-
20 % by re-using regenerative braking energy have been reported (TROLLEY Project,
2013).
In general, energy demand for auxiliaries (mainly heating, ventilation and air
conditioning) is substantial in electrified urban traffic. A German trolley bus operator
reports up to 45 % share of auxiliaries (mainly heating) on total combined auxiliaries
and traction energy consumption in German winter conditions (TROLLEY Project,
2013). This high share of auxiliaries can also be seen on BE and FCE buses.
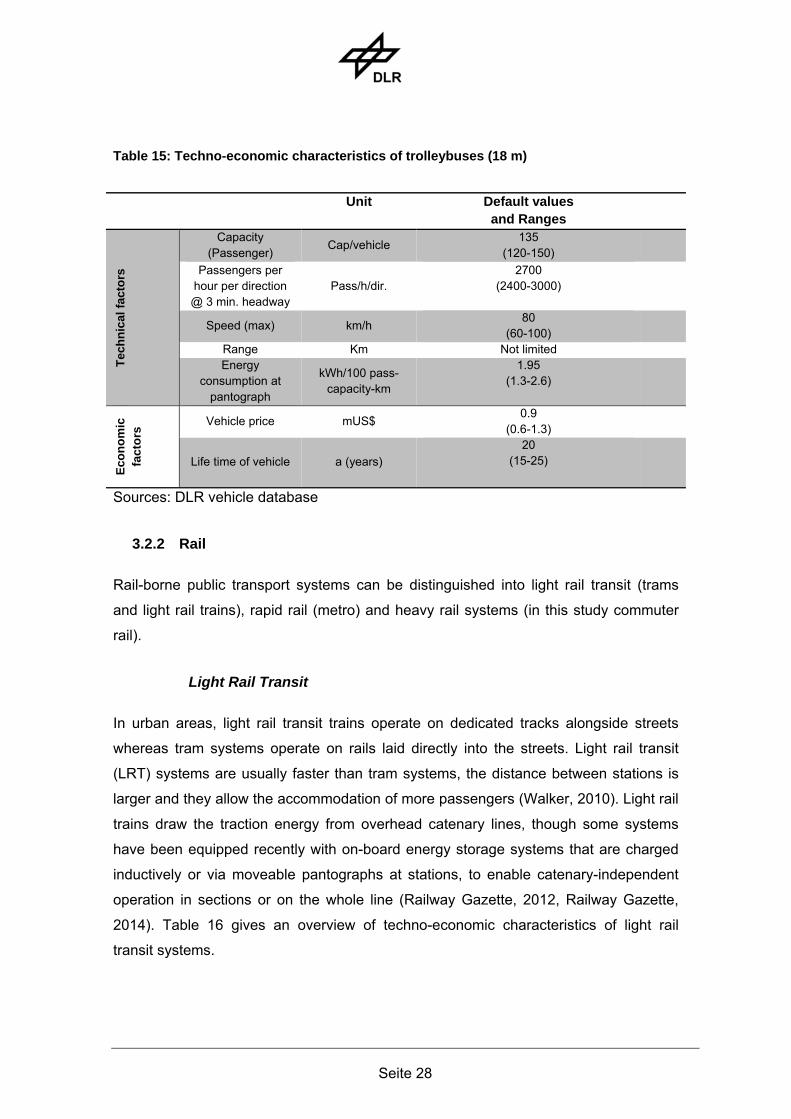
The techno-economic characteristics of trolleybuses (capable of braking energy
recuperation) are presented in Table 15.
Seite 28
Table 15: Techno-economic characteristics of trolleybuses (18 m)
Unit Default values and Ranges
Tec
hn
ical
fac
tors
Capacity (Passenger)
Cap/vehicle 135
(120-150)
Passengers per hour per direction @ 3 min. headway
Pass/h/dir. 2700
(2400-3000)
Speed (max) km/h 80
(60-100)
Range Km Not limited
Energy consumption at
pantograph
kWh/100 pass-capacity-km
1.95 (1.3-2.6)
Eco
no
mic
fa
cto
rs Vehicle price mUS$
0.9 (0.6-1.3)
Life time of vehicle a (years)
20 (15-25)
Sources: DLR vehicle database
3.2.2 Rail
Rail-borne public transport systems can be distinguished into light rail transit (trams
and light rail trains), rapid rail (metro) and heavy rail systems (in this study commuter
rail).
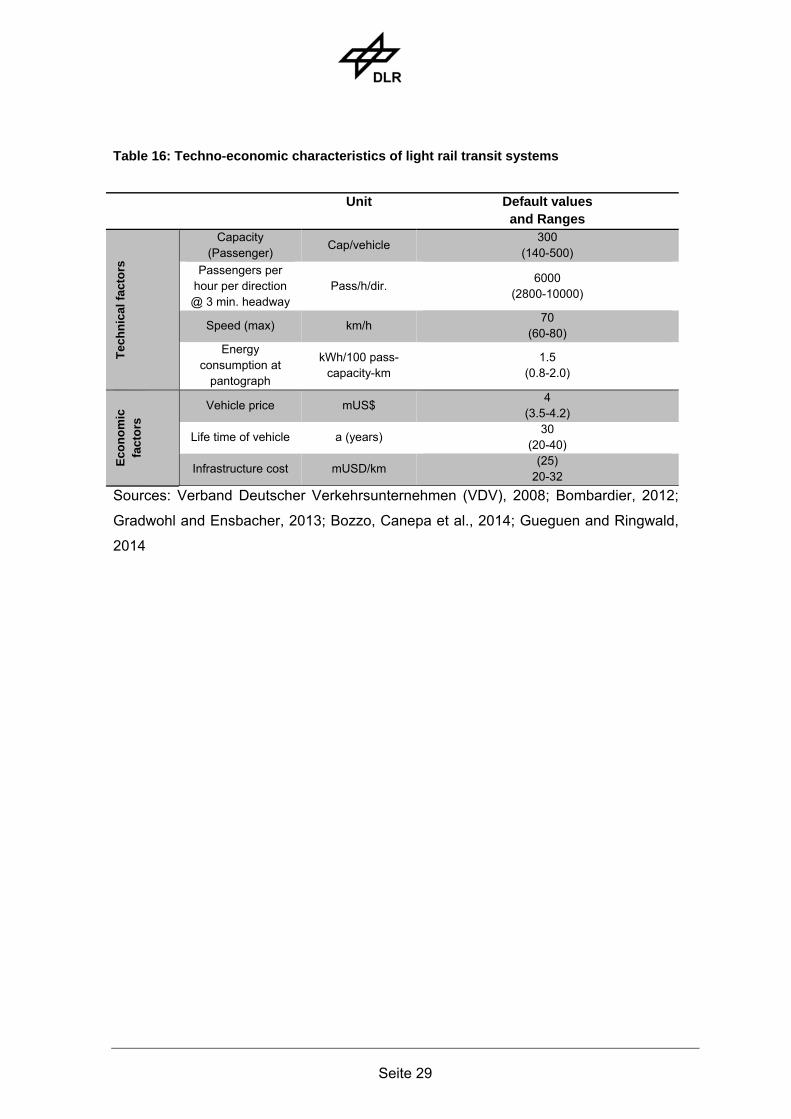
Light Rail Transit
In urban areas, light rail transit trains operate on dedicated tracks alongside streets
whereas tram systems operate on rails laid directly into the streets. Light rail transit
(LRT) systems are usually faster than tram systems, the distance between stations is
larger and they allow the accommodation of more passengers (Walker, 2010). Light rail
trains draw the traction energy from overhead catenary lines, though some systems
have been equipped recently with on-board energy storage systems that are charged
inductively or via moveable pantographs at stations, to enable catenary-independent
operation in sections or on the whole line (Railway Gazette, 2012, Railway Gazette,
2014). Table 16 gives an overview of techno-economic characteristics of light rail
transit systems.
Seite 29
Table 16: Techno-economic characteristics of light rail transit systems
Unit Default values and Ranges
Tec
hn
ical
fac
tors
Capacity (Passenger)
Cap/vehicle 300
(140-500)
Passengers per hour per direction @ 3 min. headway
Pass/h/dir. 6000
(2800-10000)
Speed (max) km/h 70
(60-80) Energy
consumption at pantograph
kWh/100 pass-capacity-km
1.5 (0.8-2.0)
Eco
no
mic
fa
cto
rs
Vehicle price mUS$ 4
(3.5-4.2)
Life time of vehicle a (years) 30
(20-40)
Infrastructure cost mUSD/km (25)
20-32
Sources: Verband Deutscher Verkehrsunternehmen (VDV), 2008; Bombardier, 2012;
Gradwohl and Ensbacher, 2013; Bozzo, Canepa et al., 2014; Gueguen and Ringwald,
2014
Seite 30
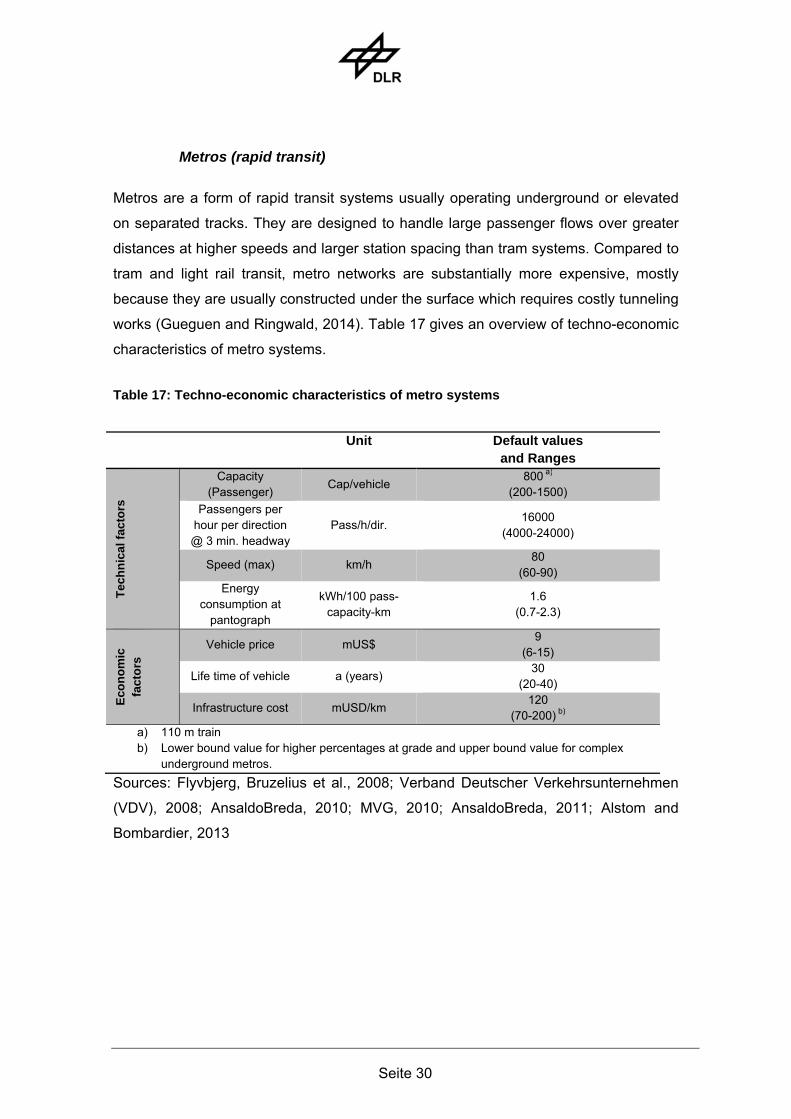
Metros (rapid transit)
Metros are a form of rapid transit systems usually operating underground or elevated
on separated tracks. They are designed to handle large passenger flows over greater
distances at higher speeds and larger station spacing than tram systems. Compared to
tram and light rail transit, metro networks are substantially more expensive, mostly
because they are usually constructed under the surface which requires costly tunneling
works (Gueguen and Ringwald, 2014). Table 17 gives an overview of techno-economic
characteristics of metro systems.
Table 17: Techno-economic characteristics of metro systems
Unit Default values and Ranges
Tec
hn
ical
fac
tors
Capacity (Passenger)
Cap/vehicle 800 a)
(200-1500)
Passengers per hour per direction @ 3 min. headway
Pass/h/dir. 16000
(4000-24000)
Speed (max) km/h 80
(60-90) Energy
consumption at pantograph
kWh/100 pass-capacity-km
1.6 (0.7-2.3)
Eco
no
mic
fa
cto
rs
Vehicle price mUS$ 9
(6-15)
Life time of vehicle a (years) 30
(20-40)
Infrastructure cost mUSD/km 120
(70-200) b) a) 110 m train b) Lower bound value for higher percentages at grade and upper bound value for complex
underground metros.
Sources: Flyvbjerg, Bruzelius et al., 2008; Verband Deutscher Verkehrsunternehmen
(VDV), 2008; AnsaldoBreda, 2010; MVG, 2010; AnsaldoBreda, 2011; Alstom and
Bombardier, 2013
Seite 31
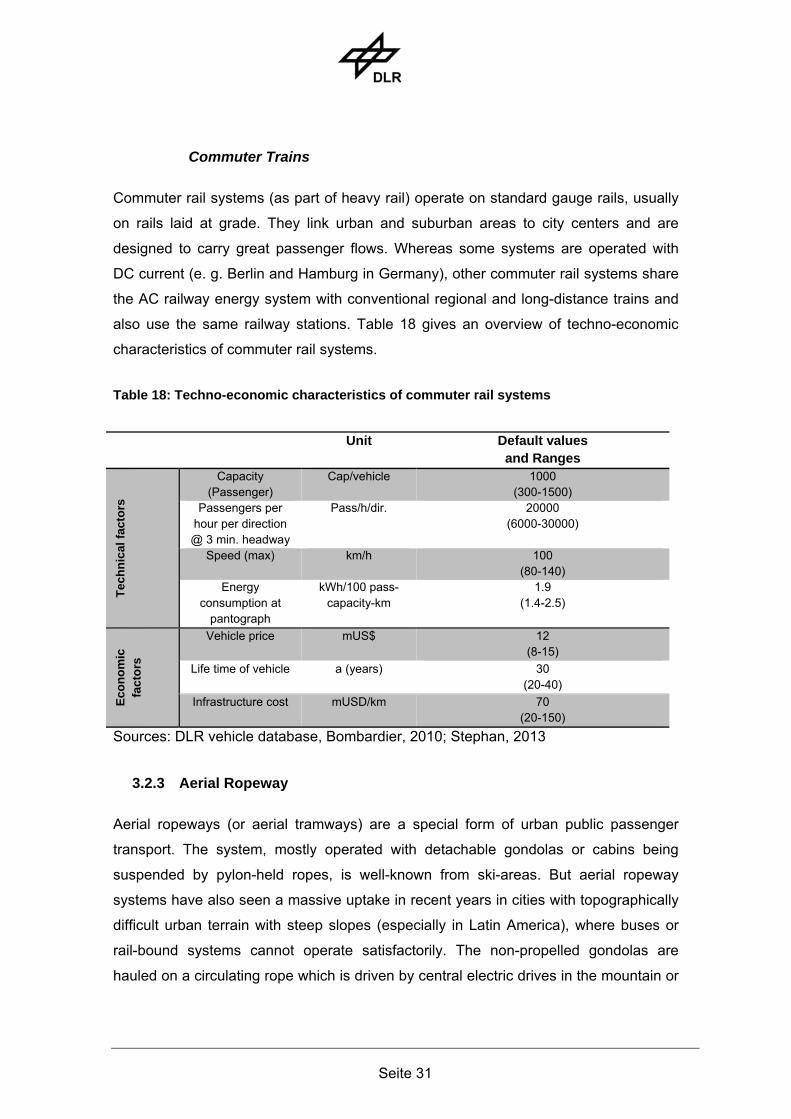
Commuter Trains
Commuter rail systems (as part of heavy rail) operate on standard gauge rails, usually
on rails laid at grade. They link urban and suburban areas to city centers and are
designed to carry great passenger flows. Whereas some systems are operated with
DC current (e. g. Berlin and Hamburg in Germany), other commuter rail systems share
the AC railway energy system with conventional regional and long-distance trains and
also use the same railway stations. Table 18 gives an overview of techno-economic
characteristics of commuter rail systems.
Table 18: Techno-economic characteristics of commuter rail systems
Unit Default values and Ranges
Tec
hn
ical
fac
tors
Capacity (Passenger)
Cap/vehicle 1000 (300-1500)
Passengers per hour per direction @ 3 min. headway
Pass/h/dir. 20000 (6000-30000)
Speed (max) km/h 100 (80-140)
Energy consumption at
pantograph
kWh/100 pass-capacity-km
1.9 (1.4-2.5)
Eco
no
mic
fa
cto
rs
Vehicle price mUS$ 12 (8-15)
Life time of vehicle a (years) 30 (20-40)
Infrastructure cost mUSD/km 70 (20-150)
Sources: DLR vehicle database, Bombardier, 2010; Stephan, 2013
3.2.3 Aerial Ropeway
Aerial ropeways (or aerial tramways) are a special form of urban public passenger
transport. The system, mostly operated with detachable gondolas or cabins being
suspended by pylon-held ropes, is well-known from ski-areas. But aerial ropeway
systems have also seen a massive uptake in recent years in cities with topographically
difficult urban terrain with steep slopes (especially in Latin America), where buses or
rail-bound systems cannot operate satisfactorily. The non-propelled gondolas are
hauled on a circulating rope which is driven by central electric drives in the mountain or
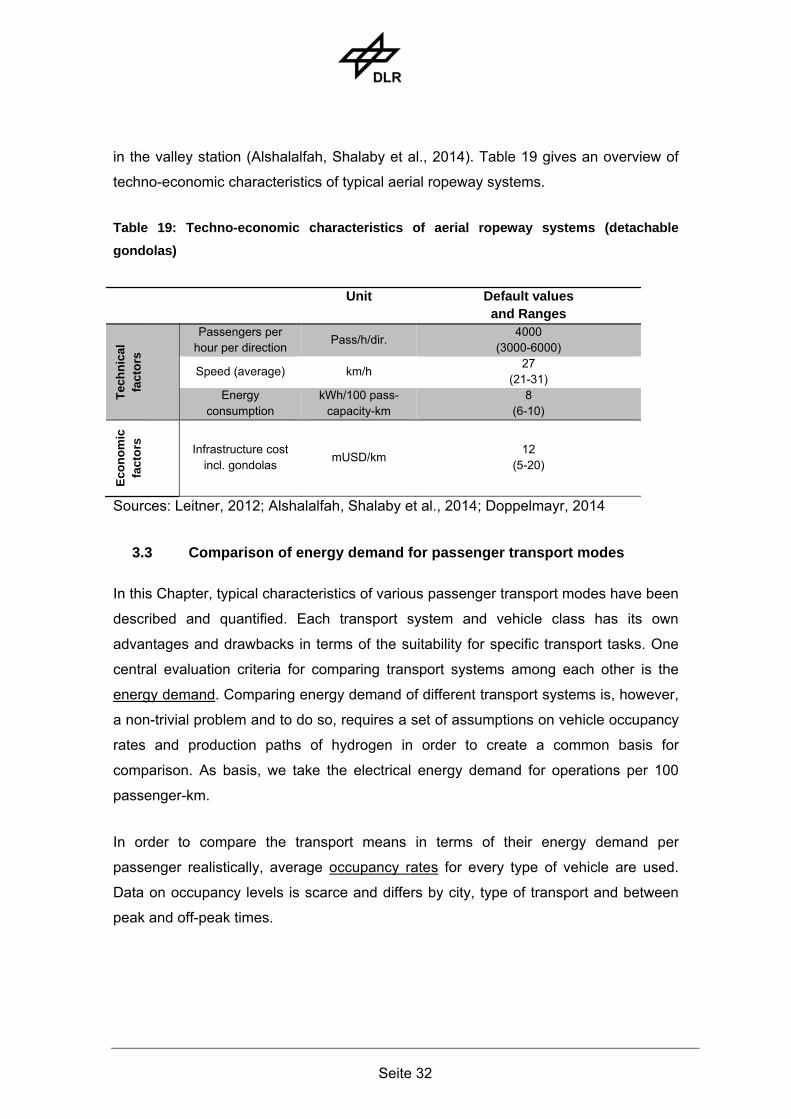
Seite 32
in the valley station (Alshalalfah, Shalaby et al., 2014). Table 19 gives an overview of
techno-economic characteristics of typical aerial ropeway systems.
Table 19: Techno-economic characteristics of aerial ropeway systems (detachable
gondolas)
Unit Default values and Ranges
Tec
hn
ical
fa
cto
rs
Passengers per hour per direction
Pass/h/dir. 4000
(3000-6000)
Speed (average) km/h 27
(21-31) Energy
consumption kWh/100 pass-
capacity-km 8
(6-10)
Eco
no
mic
fa
cto
rs
Infrastructure cost incl. gondolas
mUSD/km 12
(5-20)
Sources: Leitner, 2012; Alshalalfah, Shalaby et al., 2014; Doppelmayr, 2014
3.3 Comparison of energy demand for passenger transport modes
In this Chapter, typical characteristics of various passenger transport modes have been
described and quantified. Each transport system and vehicle class has its own
advantages and drawbacks in terms of the suitability for specific transport tasks. One
central evaluation criteria for comparing transport systems among each other is the
energy demand. Comparing energy demand of different transport systems is, however,
a non-trivial problem and to do so, requires a set of assumptions on vehicle occupancy
rates and production paths of hydrogen in order to create a common basis for
comparison. As basis, we take the electrical energy demand for operations per 100
passenger-km.
In order to compare the transport means in terms of their energy demand per
passenger realistically, average occupancy rates for every type of vehicle are used.
Data on occupancy levels is scarce and differs by city, type of transport and between
peak and off-peak times.
Seite 33
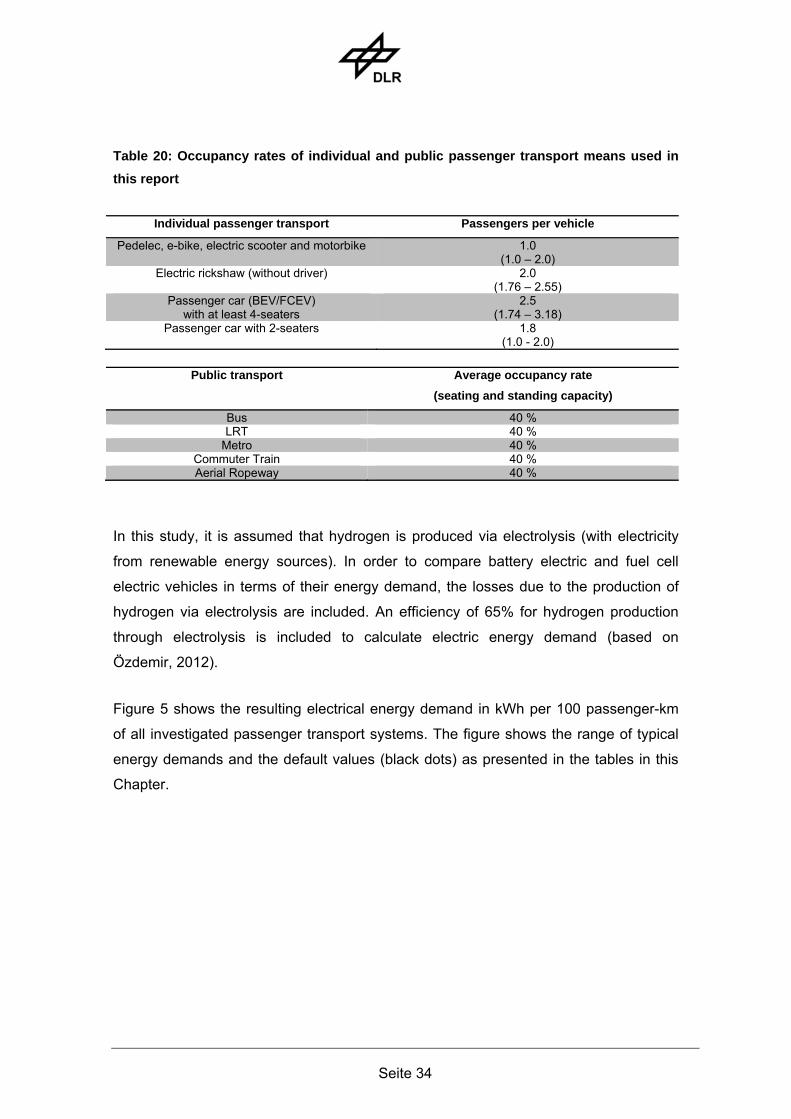
The occupancy rate for pedelecs, e-bikes scooters and motorbikes are assumed to be
1.0, although the average occupancy rate can be as high as 1.5 depending on the city
(Singh, 2000).
For rickshaws, occupancy rates between 1.76 and 2.55 are reported (without driver) in
the literature (Singh, 2000; CISTUP, 2012; RITES, 2011). In this study, an average
value of 2.0 is taken for the occupancy rate of auto rickshaws.
Schäfer, Heywood et al. (2009) and Schäfer (2011) report passenger car occupancy
rates of 2.0 to 2.5 with a tendency to decline with rising income levels and decreasing
household sizes. Singh mentions an occupancy rate of 3.18 for India (Singh, 2000). For
Bengaluru (India), a passenger car occupancy rate of 2.59 is given (RITES, 2011). On
the other hand, a passenger car occupancy rate of 1.75 in 1990 (with a range of 1.00 –
4.75) and 1.74 in 2005 (with a range of 1.43 - 6.00) is reported in Singapore (Fwa and
Chua, 2007). In this study, an average occupancy rate of 2.5 is assumed for the
passenger cars with at least 4-seats. For 2-seaters, as there is no specific occupancy
rate data is available, a value of 1.8 is assumed for this study.
Average occupancy rates of public transport systems in megacities in developing
countries can be assumed to be higher than in developed cities. Average passenger
occupancy rates of all public transport systems (buses, LRT, metros, commuter trains
and aerial ropeways) are taken as 40 % (based on total seating and standing capacity)
following published data on occupancy rates of Chinese bus lines with 44 % and 39 %
(IFEU, 2008) and metro lines with 39 % (He, Meng et al., 2011).
Table 22 gives average occupancy rates for individual passenger transport and public
transport means used to calculate and compare energy demand per passenger.
Seite 34
Table 20: Occupancy rates of individual and public passenger transport means used in
this report
Individual passenger transport Passengers per vehicle
Pedelec, e-bike, electric scooter and motorbike 1.0 (1.0 – 2.0)
Electric rickshaw (without driver) 2.0 (1.76 – 2.55)
Passenger car (BEV/FCEV) with at least 4-seaters
2.5 (1.74 – 3.18)
Passenger car with 2-seaters 1.8 (1.0 - 2.0)
Public transport Average occupancy rate
(seating and standing capacity)
Bus 40 % LRT 40 %
Metro 40 % Commuter Train 40 % Aerial Ropeway 40 %
In this study, it is assumed that hydrogen is produced via electrolysis (with electricity
from renewable energy sources). In order to compare battery electric and fuel cell
electric vehicles in terms of their energy demand, the losses due to the production of
hydrogen via electrolysis are included. An efficiency of 65% for hydrogen production
through electrolysis is included to calculate electric energy demand (based on
Özdemir, 2012).
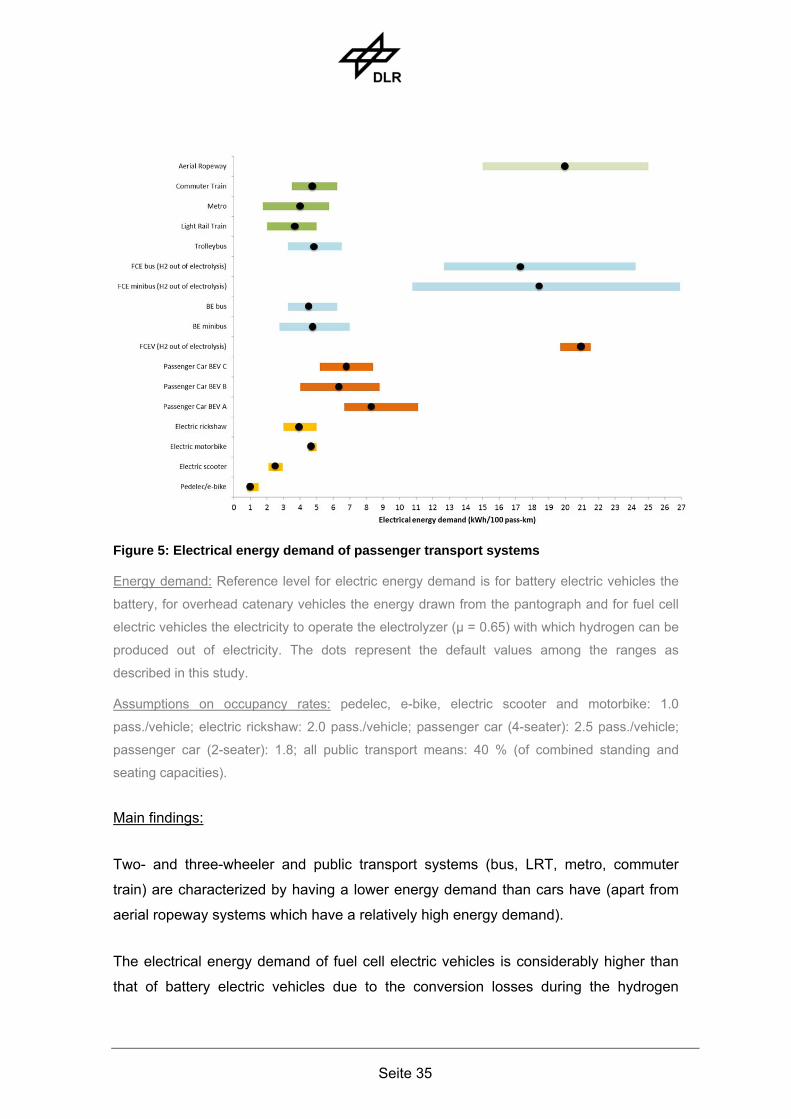
Figure 5 shows the resulting electrical energy demand in kWh per 100 passenger-km
of all investigated passenger transport systems. The figure shows the range of typical
energy demands and the default values (black dots) as presented in the tables in this
Chapter.
Seite 35
Figure 5: Electrical energy demand of passenger transport systems
Energy demand: Reference level for electric energy demand is for battery electric vehicles the
battery, for overhead catenary vehicles the energy drawn from the pantograph and for fuel cell
electric vehicles the electricity to operate the electrolyzer (μ = 0.65) with which hydrogen can be
produced out of electricity. The dots represent the default values among the ranges as
described in this study.
Assumptions on occupancy rates: pedelec, e-bike, electric scooter and motorbike: 1.0
pass./vehicle; electric rickshaw: 2.0 pass./vehicle; passenger car (4-seater): 2.5 pass./vehicle;
passenger car (2-seater): 1.8; all public transport means: 40 % (of combined standing and
seating capacities).
Main findings:
Two- and three-wheeler and public transport systems (bus, LRT, metro, commuter
train) are characterized by having a lower energy demand than cars have (apart from
aerial ropeway systems which have a relatively high energy demand).
The electrical energy demand of fuel cell electric vehicles is considerably higher than
that of battery electric vehicles due to the conversion losses during the hydrogen
Seite 36
production and fuel cell operation. However, this should not discourage the usage of
fuel cells in transport applications since hydrogen can play an important role as storage
medium for fluctuating supply of renewable energy itself. Furthermore, hydrogen
vehicles have considerably higher ranges and shorter refuel times compared to battery
electric vehicles.
The consumption ranges shown in Figure 5 are only due to the uncertainties as to the
energy consumption per vehicle km. However, the results show that for the energy
consumption per passenger-km, the average occupancy level is at least as important
as the technical factors. As these values may differ significantly for different cities, a
city-specific analysis is required in order to assess the energy consumption locally.
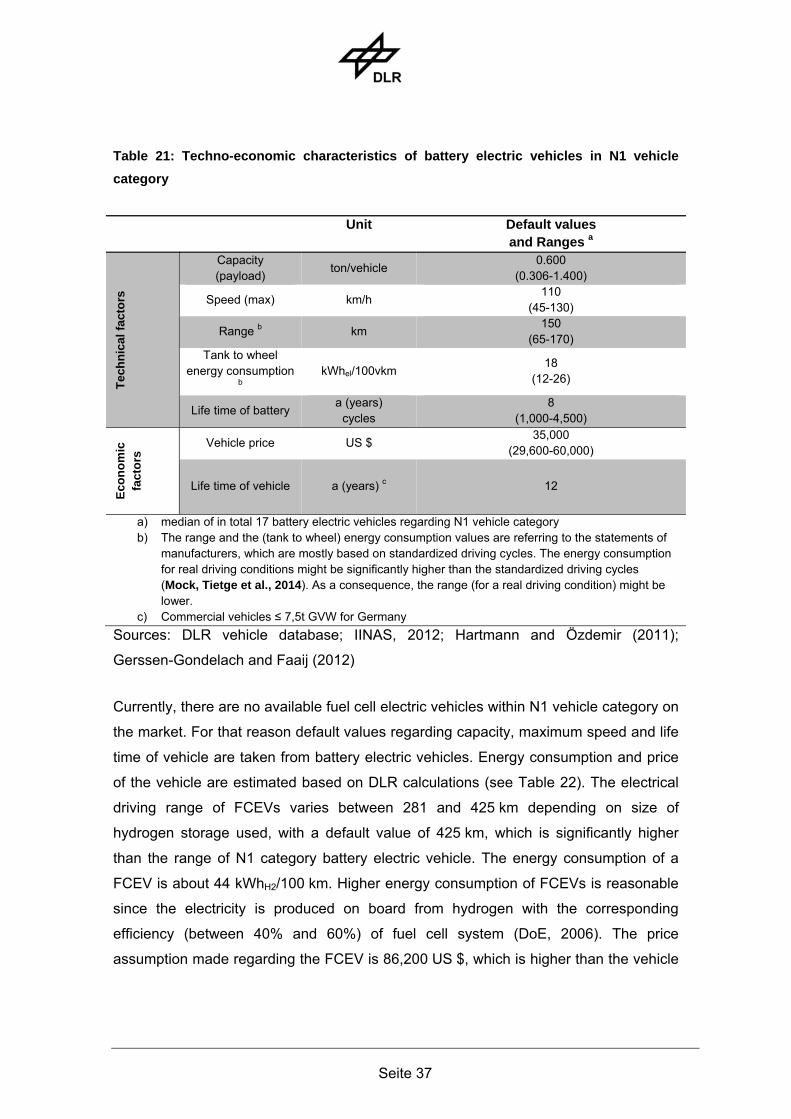
3.4 Freight transport
In this section, only locally emission-free vehicle profiles of vehicle category N1, with a
maximum of 3.5 tones gross vehicle weight (GVW), are presented. N1 category
vehicles are, as described within European Commission, 2007, vehicles with at least
four wheels designed and constructed for the carriage of goods. Most important for
freight transport is the available payload which varies in the range of 300 kg until
1.400 kg. In this study, 600 kg is assumed as a default value, which is representative
for a vehicle with around 2.2 tons GVW. Additional default values, gathered from
currently existing or presented battery and fuel cell electric vehicles, are presented
within Table 21 and Table 22. Battery electric N1 category vehicles do not significantly
differ in comparison to passenger cars regarding possible driving range and maximum
speed. Driving ranges given are varying in a range of 65 km and 170 km as specified
by the manufacturers and, therefore, based on standardized driving cycles. Median of
vehicles considered is 130 km and 110 km/h in terms of maximum speed. Due to the
greater vehicle weight and vehicle dimensions in comparison to passenger cars,
energy consumption is higher. Life time of battery is in analogy to passenger cars
assumed to be 8 years. The prices of N1 category vehicle car start at about
29,600 US $ for a Peugeot iOn Cargo and amount to 35,000 US $ as average N1
vehicle price.
Seite 37
Table 21: Techno-economic characteristics of battery electric vehicles in N1 vehicle
category
Unit Default values
and Ranges a
Tec
hn
ical
fac
tors
Capacity (payload)
ton/vehicle 0.600
(0.306-1.400)
Speed (max) km/h 110
(45-130)
Range b km 150
(65-170) Tank to wheel
energy consumption b
kWhel/100vkm 18
(12-26)
Life time of battery a (years)
cycles 8
(1,000-4,500)
Eco
no
mic
fa
cto
rs Vehicle price US $
35,000 (29,600-60,000)
Life time of vehicle a (years) c 12
a) median of in total 17 battery electric vehicles regarding N1 vehicle category b) The range and the (tank to wheel) energy consumption values are referring to the statements of
manufacturers, which are mostly based on standardized driving cycles. The energy consumption for real driving conditions might be significantly higher than the standardized driving cycles (Mock, Tietge et al., 2014). As a consequence, the range (for a real driving condition) might be lower.
c) Commercial vehicles ≤ 7,5t GVW for Germany
Sources: DLR vehicle database; IINAS, 2012; Hartmann and Özdemir (2011);
Gerssen-Gondelach and Faaij (2012)
Currently, there are no available fuel cell electric vehicles within N1 vehicle category on
the market. For that reason default values regarding capacity, maximum speed and life
time of vehicle are taken from battery electric vehicles. Energy consumption and price
of the vehicle are estimated based on DLR calculations (see Table 22). The electrical
driving range of FCEVs varies between 281 and 425 km depending on size of
hydrogen storage used, with a default value of 425 km, which is significantly higher
than the range of N1 category battery electric vehicle. The energy consumption of a
FCEV is about 44 kWhH2/100 km. Higher energy consumption of FCEVs is reasonable
since the electricity is produced on board from hydrogen with the corresponding
efficiency (between 40% and 60%) of fuel cell system (DoE, 2006). The price
assumption made regarding the FCEV is 86,200 US $, which is higher than the vehicle
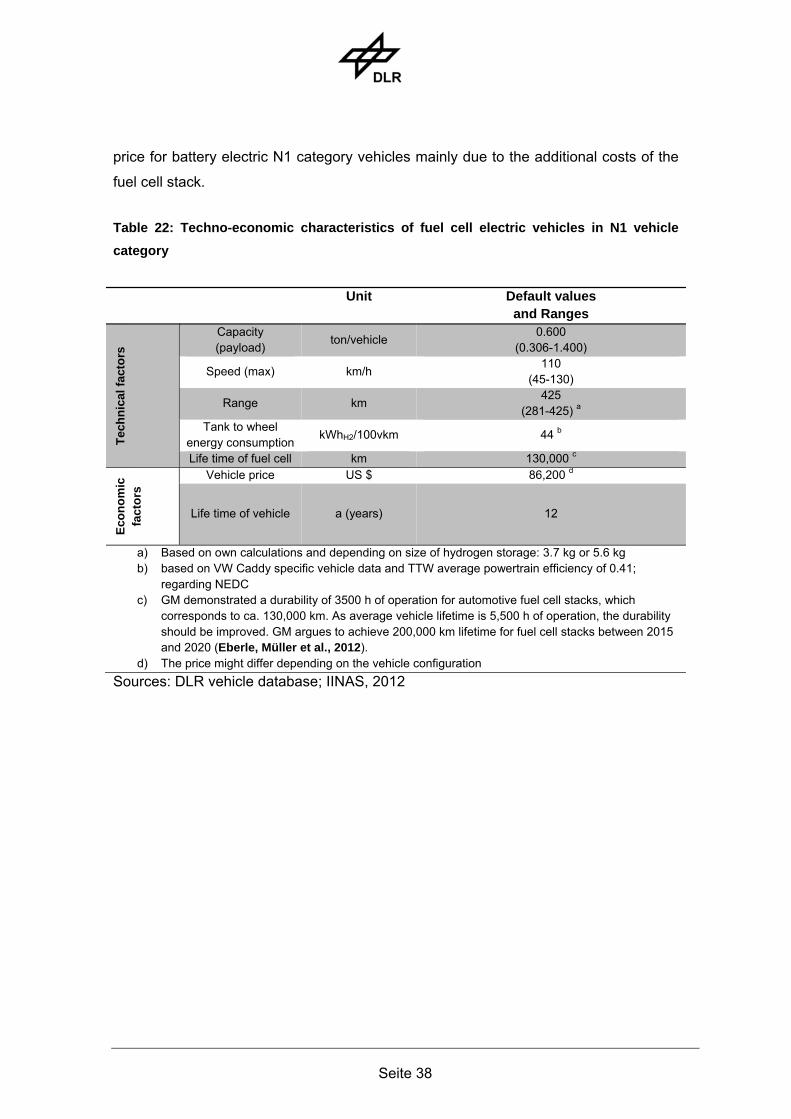
Seite 38
price for battery electric N1 category vehicles mainly due to the additional costs of the
fuel cell stack.
Table 22: Techno-economic characteristics of fuel cell electric vehicles in N1 vehicle
category
Unit Default values and Ranges
Tec
hn
ical
fac
tors
Capacity (payload)
ton/vehicle 0.600
(0.306-1.400)
Speed (max) km/h 110
(45-130)
Range km 425
(281-425) a Tank to wheel
energy consumption kWhH2/100vkm 44 b
Life time of fuel cell km 130,000 c
Eco
no
mic
fa
cto
rs
Vehicle price US $ 86,200 d
Life time of vehicle a (years) 12
a) Based on own calculations and depending on size of hydrogen storage: 3.7 kg or 5.6 kg b) based on VW Caddy specific vehicle data and TTW average powertrain efficiency of 0.41;
regarding NEDC c) GM demonstrated a durability of 3500 h of operation for automotive fuel cell stacks, which
corresponds to ca. 130,000 km. As average vehicle lifetime is 5,500 h of operation, the durability should be improved. GM argues to achieve 200,000 km lifetime for fuel cell stacks between 2015 and 2020 (Eberle, Müller et al., 2012).
d) The price might differ depending on the vehicle configuration
Sources: DLR vehicle database; IINAS, 2012
Seite 39
4 Conclusions
The aim of this project is to collect, describe and structure data on locally emission-free
individual passenger transport, public transport and urban freight transport systems
that are suitable for megacity contexts. Vehicle concepts are investigated in terms of
technical, operational and commercial aspects. Considered are electric and fuel cell
electric systems which are either available on the market today, or will likely be within
the next 5 years. Data are compiled for two- and three-wheelers, passenger cars,
buses, light rail trains, metros, commuter trains, aerial ropeway and freight transport
systems.
The results of this report can be used as input to combined energy and transport
scenarios for individual cities and also as a foundation for in-depth analysis on
transport options for specific megacities, where decreasing the adverse environmental
effects of the transport sector is a main challenge and opportunity likewise.
Comparison of transport modes on a city-specific level is an important further research
area, since each urban setting has its own characteristic transportation problems and
challenges. As a consequence, rather than “one-solution-fits-all”, megacity-specific
tailor-made solutions are needed. Another further research topic could be the
assessment of infrastructure and in particular energy infrastructure requirements for
different oil-free transport alternatives (e.g. overhead catenary lines, charging points,
hydrogen fueling stations etc.).
Seite 40
5 References ADFC (2014). Verbraucherinformation zu Pedelecs und E-Bikes - Was Sie wissen sollten und wie Sie ein gutes Elektrofahrrad finden. Ahluwalia, R., X. Wang, et al. (2012). Fuel Cell Transit Buses. I.-F. Cells. Alibaba (2015). "Pedelec country search." Retrieved 20.01.2015, from http://www.alibaba.com/countrysearch/CN/pedelec.html. Alshalalfah, B., A. Shalaby, et al. (2014). "Experiences with Aerial Ropeway Transportation Systems in the Urban Environment." Journal of Urban Planning and Development 140(1): 04013001. Alstom and Bombardier (2013). Environmental Product Declaration DT5. Salzgitter & Hennigsdorf. AnsaldoBreda (2010). Certified Environmental Product Declaration - MLA Metrobus Brescia. Pistoia. AnsaldoBreda (2011). Environmental Product Declaration - Metropolitana di Roma Linea C. Pistoia. APFCT (2015). "APFCT Hydrogen Fuel Cell Scooter." from http://www.apfct.com/data/file/1261033252yi38e.pdf. Baba (2015). "Electric BABA rickshaw manufacturer." Retrieved 20.01.2015, from http://motorcycle-parts.vivastreet.co.in/motorcycle-accessories+jamshedpur/electric-baba-rickshaw-manufacturer/105908385. Baehr, H. D. and S. Kabelac (2012). Thermodynamik, Springer. Ballard (2014). "Advances in Hydrogen Fuel Cells for Public Transportation (Company Presentation)." Retrieved 15.01.2015, from http://www.evopro.hu/uploads/HFC-Workshop_3_Chris_Guzy_Ballard_Canada_small.pdf. BMW (2015). "BMW i3 Features and Specs." Retrieved 08.01.2015. Bombardier (2010). SPACIUM - Environmental Product Declaration. Crespin. Bombardier (2012). Environmental Product Declaration - Flexity Outlook. Bozzo, R., M. Canepa, et al. (2014). Method for analysis and comparison in planning urban surface transport systems. Public Mobility Systems. A. Pratelli. Ashurst, WIT Press: 63-74. Brokers-Union (2015). "Electric Tricycle." Retrieved 20.01.2015, from http://www.ecvv.com/product/2542740.html. BYD (2015). "Electric Bus introduction." Retrieved 11.02.2015, from http://www.byd.com/na/auto/ElectricBus.html. CeeonIndia (2015). "Battery Rickshaw." from http://www.ceeonindia.com/battery-rickshaw-1936666.html. Chester, M. V. and A. Horvath (2009). "Environmental assessment of passenger transportation should include infrastructure and supply chains." Environmental Research Letters 4: 8. CHIC (2015). "Clean Hydrogen in European Cities." Retrieved 26.01.2015, from http://chic-project.eu/. CISTUP (2012). A Study of the Autorickshaw Sector in Bangalore City. Bangalore. CTtransit (no year). "How much does a fuel cell bus cost?" Connecticut's Zero Emission Hydrogen Fuel Cell Bus Program. Retrieved 22.01.2015, from http://fuelcell.cttransit.com/index.php/facts/187-how-much-does-a-fuel-cell-bus-cost. den Boer, E., S. Aarnik, et al. (2013). Zero emissions trucks - An overview of state-of-the-art technologies and their potential. Delft, CE Delft.
Seite 41
Devante (2015). "Electronic Battery Rikshaw-Tuk Tuk." Retrieved 20.01.2015, from http://www.devante.in/passenger.php. DoE (2006). Hydrogen Fuel Cells. D. o. Energy. Doppelmayr (2014). "Ropeways in the urban environment (company brochure)." Retrieved 08.01.2015, from newsroom.doppelmayr.com/download/file/4256/. Duce, A. D. (2011). Life cycle assessment of conventional and electric bicycles. Eurobike 2011. Friedrichshafen, Germany. Duvall, M. (2003). Advanced Batteries for Electric-Drice Vehicles. Palo Alto, CA, EPRI. Eberle, U., B. Müller, et al. (2012). "Fuel cell electric vehicles and hydrogen infrastructure: status 2012." Energy and Environmental Science 5: 8780-8798. EGVI (2014). "UNPLUGGED - Inductive charging for Electric Vehicles (February 2014)." Retrieved 28.01.2015, from http://www.egvi.eu/projects/13/38/UNPLUGGED-Inductive-charging-for-Electric-Vehicles-February-2014. Eichlseder, H. and M. Klell (2012). Wasserstoff in der Fahrzeugtechnik, Springer. Elektrofahrrad.net (2012). "Elektrofahrrad Akku & Batterie richtig aufladen." Retrieved 20.01.2015, from http://www.das-elektrofahrrad.net/elektrofahrrad-akku-batterie-richtig-aufladen/. emco (2012). "Batterien der emco Elektroroller." Retrieved 28.01.2105, from http://www.emco-elektroroller.de/emco-elektroroller/batterie.html. Energica (2015). "Ego." Retrieved 20.01.2015, from http://www.energicasuperbike.com/PDF/web-catalogo-ego.pdf. EU (1999). Regulation (EEC) No 4064/89 Merger Procedure. European Commission (2007). Proposal for a regulation of the european parliament and of the council on type-approval of hydrogen powered motor vehicles and amending Directive 2007/46/EC. COM(2007) 593 final. EVObsession (2013, 08.12.2013). "Barcelona’s Bus Story Explains Why Battery-Electric Vehicles Are Growing Fast & Hydrogen Vehicles Not." from http://evobsession.com/barcelonas-bus-story-explains-battery-electric-vehicles-growing-fast-hydrogen-vehicles/. Ferrari, C., S. Offinger, et al. (2012). Studie zu Range Extender Konzepten für den Einsatz in einem batterieelektrischen Fahrzeug - REXEL. Stuttgart, DLR-FK DLR-VT Stuttgart University - IVK FhG - ISE. Flyvbjerg, B., N. Bruzelius, et al. (2008). "Comparison of Capital Costs per Route-Kilometre in Urban Rail." European Journal of Transport and Infrastructure Research 8(1): 17-30. Forbes (2014). "Tesla's Battery Swap Stations Will Help It Requalify For ZEV Credits In California." Retrieved 20.01.2015, from http://www.forbes.com/sites/greatspeculations/2014/12/30/teslas-battery-swap-stations-will-help-it-requalify-for-zev-credits-in-california/. FTA (2014a). "National Fuel Cell Bus Program." Retrieved 21.01.2015, from http://www.fta.dot.gov/about/14617.html. FTA (2014b). Review and Evaluation of Wireless Power Transfer (WPT) for Electric Transit Applications, FTA Report No. 0060, Federal Transit Administration. F. T. A. U.S. Department of Transportation. Fwa, T. F. and G. K. Chua (2007). "PASSENGER CAR TRAVEL CHARACTERISTICS IN SINGAPORE." IATSS Research 31(2): 48-55.

Seite 42
Gerssen-Gondelach, S. J. and A. Faaij (2012). "Performance of batteries for electric vehicles on short and longer term." Journal of Power Sources 212: 111-129. Go_Pedelec (2012). "Go Pedelec! EU." Retrieved 28.01.2015, from http://www.gopedelec.eu/cms/index.php. Gradwohl, R. and R. Ensbacher (2013). Energiesparende Maßnahmen bei der Wiener - Niederflurstraßenbahn ULF. 41. Tagung Moderne Schienenfahrzeuge, Graz. Grunditz, E. A. (2014). BEV Powertrain Component Sizing With Respect to Performance, Energy Consumption and Driving Patterns. Department of Energy and Environment, Chalmers University of Technology Licentiate of Engineering. Gueguen, A. and P.-M. Ringwald (2014). The mutual complementarity of the different urban public transport modes toward sustainable mobility - The Engineering Challenge to select the best option (Presentation). Colloque Franco – Turc sur la ville durable, Istanbul. Hales, R. L. (2014). "BYD Sells Another 2,200 Ebuses & Taxis." from http://www.theecoreport.com/byd-sells-another-2200-ebuses-taxis/. Halvorson, B. (2014, 23.06.2014). "Portland Tests BYD K9 All-Electric Passenger Bus: Quick Ride." 22.01.2015, from http://www.greencarreports.com/news/1092875_portland-tests-byd-k9-all-electric-passenger-bus-quick-ride/page-2. Hartmann, N. and E. D. Özdemir (2011). "Impact of different utilization scenarios of electric vehicles on the German grid in 2030." Journal of Power Sources 196: 2311-2318. Hayashi, Y. (2010). Transport SOlutions for Congestion and Climate CHange Control in Developing Mega-Cities He, D., F. Meng, et al. (2011). "Impacts of Urban Transportation Mode Split on CO2 Emissions in Jinan, China." Energies 4(4): 685-699. Hebei-Xingbang (2015). "Passenger electric tricycle rickshaw with roof support." Retrieved 20.01.2015, from http://hbxb.manufacturer.globalsources.com/si/6008833904090/pdtl/Electric-trike/1082396187/Passenger-electric-tricycle-rickshaw.htm. Hero-Electric (2015). "Hero Electric Products." from http://heroelectric.in/products-page/. Hickman, M. R. (2011). A STudy on Power Assists for Bicycle Rickshaws in India, including Fabrication of Test Apparatus. Mechanical Engineering, MIT. Honda (2015). "FCX Clarity." Retrieved 09.01.2015, from http://automobiles.honda.com/fcx-clarity/. Hyundai (2015). "ix35 Fuel Cell." Retrieved 9.1.2015, from http://worldwide.hyundai.com/WW/Showroom/Eco/ix35-Fuel-Cell/PIP/index.html. IFEU (2008). Transport in China: Energy Consumption and Emissions of Different Transport Modes. Heidelberg. IINAS (2012). GEMIS. IKA (2008). "Hydrogen and Fuel Cell Scooters - Electric Bicycles - Wheelchairs." Retrieved 20.01.2015, from http://www.ika.rwth-aachen.de/r2h/index.php/Hydrogen_and_Fuel_Cell_Scooters_-_Electric_Bicycles_-_Wheelchairs. Johammer (2015). "Elektromotorrad." Retrieved 20.01.2015, from http://www.johammer.com/elektromotorrad/. Krust, M. (2013). "Daimler verschiebt Brennstoffzelle auf 2017." Retrieved 09.01.2015, from http://www.automobilwoche.de/article/20130120/nachrichten/130119932#.VK_y8XvQJaz.
Seite 43
Leitner (2012). "Ropeways for the urban environment and tourism resorts (company brochure)." Retrieved 08.01.2015, from http://en.leitner-ropeways.com/content/download/10459/458101/version/40/file/Urban+2012+Englisch.pdf. Li, J. L. F. (2013). "Case Study of EV City Bus Operations." from http://bestar.lbl.gov/us-china-workshop-2013/files/2013/04/Jan-Li-Lithium-Force.pdf. Lienkamp, M. (2014). Status of Electrical Mobility 2014 LightningMotorcycle (2015). "Product specifications." Retrieved 20.01.2015, from http://lightningmotorcycle.com/product/specifications/. Mallouh, M. A., B. Denman, et al. (2010). "A study of fuel cell hybrid auto rickshaws using realistic urban drive cycles." Jordan Journal of Mechanical and Industrial Engineering 4(1): 225-229. Mench, M. M. (2008). Fuel Cell Engines. Hoboken, New Jersey, John Wiley & Sons, Inc. Mitra, I. R. (2008). "Tara Tiny @ Rs 99K is the world's cheapest car!". Retrieved 25.01.2015, from http://specials.rediff.com/money/2008/mar/17tara1.htm. Mock, P., U. Tietge, et al. (2014). FROM LABORATORY TO ROAD: A 2014 update of official and "Real-world" fuel consumption and CO2 Values for passenger cars in Europe. ICCT White Paper. Modaresi, R., A. N. Lovik, et al. (2014). "Component- and Alloy-Specific Modeling for Evaluating Aluminum Recycling Strategies for Vehicles." JOM 66(11): 2262-2271. Mohan, S., P. R. Jayasree, et al. (2013). Economically viable conversion of a pedal powered bicycle into an electric bike. International Conference on Electrical Machines and Systems Busan, Korea. MVG (2010). Nachhaltigkeitsbericht 2010 der Münchner Verkehrsgesellschaft mbH - Nachhaltige Mobilität für München. Munich. Navigant (2014). "Navigant Research Leaderboard Report: Electric Scooters." Retrieved 28.01.2015, from http://www.navigantresearch.com/research/navigant-research-leaderboard-report-electric-scooters. Neubauer, J., A. Brooker, et al. (2012). "Sensitivity of battery electric vehicle economics to drive patterns, vehicle range, and charge strategies." Journal of Power Sources 209: 269-277. Nissan (2015). "Nissan Leaf: Charging and range of Batteries." Retrieved 08.01.2015, from http://www.nissanusa.com/electric-cars/leaf/charging-range/battery/. Özdemir, E. D. (2012). The future role of alternative powertrains and fuels in the German transport sector. Institute for Energy Economics and the Rational Use of Energy Stuttgart, Stuttgart University. PhD. Özdemir, E. D. and N. Hartmann (2012). "Impact of electric range and fossil fuel price level on the economics of plug-in hybrid vehicles and greenhouse gas abatement costs." Energy Policy 46: 185-192. Priester, R., J. Kenworthy, et al. (2013). The Diversity of Megacities Worldwide: Challenges for the Future of Mobility. Megacity Mobility Culture – How cities move on in diverse world. ifmo, Springer: 23-54. Railway Gazette (2012). "Qatar Foundation awards €100m Doha tram contract." from http://www.railwaygazette.com/news/urban/single-view/view/qatar-foundation-awards-siemens-EUR100m-doha-tram-contract.html. Railway Gazette (2014). "Battery trams running in Nanjing." from http://www.railwaygazette.com/news/urban/single-view/view/battery-trams-running-in-nanjing.html?sword_list%5B%5D=pantograph&no_cache=1. Redelbach, M., M. Klötzke, et al. (2012). Impact of lightweight design on energy consumption and cost effectiveness of alternative powertrain concepts. European Electric Vehicle Congress (EEVC). Brussels, Belgium.

Seite 44
Redelbach, M., E. D. Özdemir, et al. (2014). "Optimizing baterry sizes of plug-in hybrid and extended range electric vehicles for different user types." Energy Policy 73: 158-168. Renault (2015). "WARRANTY FOR RENAULT Z.E. PRODUCTS." Retrieved 08.01.2015, from http://www.renault.co.uk/media/PDF/ownerservices/att20d4f299eecf4961b7ff2778979a1f47/Renault_ZE_Warranty_Terms_and_Conditions.pdf. RITES (2011). COMPREHENSIVE TRAFFIC AND TRANSPORTATION PLAN FOR BENGALURU, KARNATAKA URBAN INFRASTRUCTURE DEVELOPMENT AND FINANCE CORPORATION. RolandBerger (2013). Regional Insights. Automotive Insights. Rumbolz, P. (2013). Untersuchung der Fahrereinflüsse auf den Energieverbrauch und die Potentiale von verbrauchsreduzierenden Verzögerungsassistenzfunktionen beim PKW. IVK. Stuttgart, Stuttgart University. SAE Off-Highway Engineering Online (2013). "ABB ‘flash charges’ electric bus in 15 s." Retrieved 20.01.2015, from http://articles.sae.org/12293/. Sarmah, P. K. (2010). "Rickshaw Bank: Empowering the poor through asset ownership." Innovations 5(1): 35-55. Schäfer, A. (2011). The future of energy for urban transport. Urban Transport in the Developing World: A Handbook of Policy and Practice. H. T. Dimitriou and R. Gakenheimer. Cheltenham, Edward Elgar Publishing Limited. Schäfer, A., J. B. Heywood, et al. (2009). Transportation in a Climate-constrained World, MIT Press. Schaltz, E., A. Khaligh, et al. (2009). "Influence of Battery/Ultracapacitor Energy-Storage Sizing on Battery Lifetime in a Fuel Cell Hybrid Electric Vehicle." IEEE TRANSACTIONS ON VEHICULAR TECHNOLOGY 58(8): 3882-3891. Schleinitz, K., K. Franke-Bartholdt, et al. (2014). Pedelec-Naturalistic Cycling Study, Gesamtverband der Deutschen Versicherungswirtschaft e. V. Unfallforschung der Versicherer. 27. Shah, J. (2014). VI BRICS Academic Forum. R. C. B. d. Neves and T. G. d. Farias. Brasilia, Institute for Applied Economic Research. Shandong-Mulan (2015). "Best price of electric rickshaw for india ,battery operated electric tricycle,electric rickshaw for passenger ". Retrieved 20.01.2015, from http://mulanev.en.alibaba.com/product/852772087-218244321/Best_price_of_electric_rickshaw_for_india_battery_operated_electric_tricycle_electric_rickshaw_for_passenger.html. Shlaes, E. and A. Mani (2013). A case study of the auto-rickshaw sector in Mumbai, EMBARQ India. Singh, S. K. (2000). "Estimating the level of rail- and road-based passenger mobility in India." Indian journal of transport management 24(12): 771-781. Smith Electric Vehicles (2011). Smith Edison - The World's Favourite All-Electric Light Commercial Vehicle. Brochure. Stephan, A. (2013). Stadtbahnen der Zukunft. ETG Fachtagung „Elektrische Fahrzeugarchitekturen für Schienenfahrzeuge“ (Presentation), Kassel. Suzhou-Jade-Peacock (2015). "Electric Rickshaw with Beautiful Appearance for Sight-Seeing." Retrieved 20.01.2015, from http://abokykq.en.made-in-china.com/product/mvkEJjebXRVy/China-Electric-Rickshaw-with-Beautiful-Appearance-for-Sight-Seeing.html. Suzuki, T. and Y. Muromachi (2011). URBAN DEVELOPMENT AND CAR USE IN MEGA-CITIES. Tara (2015). "Product Brochure." Retrieved 20.01.2015, from http://www.tarainternational.us/brochure.php?pg_nm=4.

Seite 45
Toyota (2015a). "Mirai Toyota FCV." Retrieved 09.01.2015, from http://www.toyota.com/fuelcell/fcv.html. Toyota (2015b). "Warranty and maintenance guides." Retrieved 08.01.2015, from http://www.toyota.com/owners/web/pages/resources/owners-manuals. TROLLEY Project (2013). Transnational Manual on Advanced Energy Storage Systems - Part 2 - Stationary energy storage systems for trolleybus systems. UN (2014). World Urbanization Prospects: The 2014 Revision, Highlights (ST/ESA/SER.A/352), United Nations, Department of Economic and Social Affairs, Population Division (2014). Unu-Motors (2015). "Get your Unu." from https://unumotors.com/get-your-unu.html#. Vaahak (2015). "Electric Rickshaw." Retrieved 20.01.2015, from http://www.vaahak.com/electric-rickshaw.php. VansA2Z (2015). "Smith Electric Edison Review & Buyers' Guide." Retrieved 22.01.2015, from http://www.vansa2z.com/Smith-Electric-Edison-Review-Buyers-Guide. Verband Deutscher Verkehrsunternehmen (VDV) (2008). Statistik 2008. Cologne. Villatico, F., L. M. Das, et al. (2010). Hydrogen Rickshaws Fleet Demonstration in New Delhi. 18th World Hydrogen Energy Conference, Forschungszentrum Jülich. VW (2015). "10 Fragen zum e-up!". Wagner, R., N. Preschitschek, et al. (2013). "Current research trends and prospects among the various materials and designs used in lithium-based batteries." J Appl Electrochem 43: 481-496. Walker, J. (2010). "basics: the spacing of stops and stations." Retrieved 15.01.2015, from http://www.humantransit.org/2010/11/san-francisco-a-rational-stop-spacing-plan.html. Wei, W. and W. Benjamin (2012). 120 Million E-bikes, the Effect on Chinese Lifestyle. Electric Vehicle Symposium (EVS26). Los Angeles, California, US. WiCh (2014). "Wireless charging of electric vehicles." Retrieved 28.01.2015, from http://www.wich.se. Widmer, R. and M. Gauch (2008). Umweltnutzen von E-Scooter - Zusatzinfo zur Postersession an der SwissMoto09, EMPA TSL. EMPA. Wlinenews (2015). "Top 5 Best Electric Bike Brands and Leading Models in India." Retrieved 17.01.2015, from http://www.wlivenews.com/top-5-best-electric-bike-brands-and-leading-models-in-india.html. ZeroMotorcycles (2015a). "Zero-DS." Retrieved 20.01.2015, from http://www.zeromotorcycles.com/zero-ds/specs.php. ZeroMotorcycles (2015b). "Zero-FX." Retrieved 20.01.2015, from http://www.zeromotorcycles.com/zero-fx/specs.php. ZeroMotorcycles (2015c). "Zero-S." Retrieved 20.01.2015, from http://www.zeromotorcycles.com/zero-s/specs.php. Zhejiang-Tosheen (2015). "Electric Tricycle." Retrieved 20.01.2015, from http://www.ecvv.com/product/2246180.html.