Project official report - Cambria
58
1 DESIGN & SYNTHESIS OF AN OCEAN WAVE ENERGY CONVERSION MECHANISM GAJANAN S. RANE P.R.No.200800911 ACHINTYA H. KAMBLI P.R.No.200800999 PRATIK D. SAWARDEKAR P.R.No.200801039 ADITYA D. SHETGAONKAR P.R.No.200801333 JANARDHAN SINGH TOMAR P.R.No.200807747 A project report submitted in partial fulfilment of the requirements for the degree of Bachelor of Engineering in Mechanical Engineering GOA UNIVERSITY Under the guidance of Mr. D.V. Shirodkar Faculty & Workshop Superintendent Department of Mechanical Engineering Goa College of Engineering Farmagudi, Goa Mr. R Madhan Scientist National Institute of Oceanography Dona Paula, Goa Department of Mechanical Engineering Goa College of Engineering June 2012
Transcript of Project official report - Cambria

1
DESIGN & SYNTHESIS OF AN OCEAN WAVE
ENERGY CONVERSION MECHANISM
GAJANAN S. RANE P.R.No.200800911 ACHINTYA H. KAMBLI P.R.No.200800999
PRATIK D. SAWARDEKAR P.R.No.200801039
ADITYA D. SHETGAONKAR P.R.No.200801333
JANARDHAN SINGH TOMAR P.R.No.200807747
A project report submitted in partial fulfilment of the requirements
for the degree of Bachelor of Engineering
in Mechanical Engineering
GOA UNIVERSITY
Under the guidance of
Mr. D.V. Shirodkar Faculty & Workshop Superintendent
Department of Mechanical Engineering Goa College of Engineering
Farmagudi, Goa
Mr. R Madhan Scientist
National Institute of Oceanography Dona Paula, Goa
Department of Mechanical Engineering
Goa College of Engineering
June 2012

2
PROJECT APPROVAL SHEET
This is to certify that the project entitled
“DESIGN & SYNTHESIS OF AN OCEAN WAVE ENERGY CONVERSION MECHANISM”
by
GAJANAN S. RANE P.R.No.200800911 ACHINTYA H. KAMBLI P.R.No.200800999
PRATIK D. SAWARDEKAR P.R.No.200801039
ADITYA D. SHETGAONKAR P.R.No.200801333
JANARDHAN SINGH TOMAR P.R.No.200807747
completed in the year 2011-2012 is approved as a partial fulfilment of the requirements for the degree of BACHELOR OF ENGINEERING in Mechanical Engineering and is a record of bonafide work carried out successfully under our guidance.
_________________ (Project Guide) Mr. D. V. Shirodkar Faculty & Workshop Superintendent Department of Mechanical Engineering
________________ (Project Guide)
Mr. R Madhan Scientist
National Institute of Oceanography
_________________ (Head of Department) Prof. Uday Amonkar Professor Goa College of Engineering
__________________ (Principal)
Mr Vivek Kamat Professor
Goa College of Engineering
Place: Goa College of Engineering, Farmagudi, Ponda, Goa Date: ___________________

3
CERTIFICATE
This is to certify that the project entitled
“DESIGN & SYNTHESIS OF AN OCEAN WAVE ENERGY CONVERSION MECHANISM"
Submitted by
GAJANAN S. RANE P.R.No.200800911 ACHINTYA H. KAMBLI P.R.No.200800999
PRATIK D. SAWARDEKAR P.R.No.200801039
ADITYA D. SHETGAONKAR P.R.No.200801333
JANARDHAN SINGH TOMAR P.R.No.200807747
has been satisfactorily completed in the academic year 2011-2012 as a partial fulfilment of the requirement for the degree course in
BACHELOR OF ENGINEERING in Mechanical Engineering, at Goa College of Engineering, Farmagudi.
______________________ ________________________ (Internal Examiner) (External Examiner)
__________________________ (Head of Department)
Date: __________________ Place: _________________

4
ACKNOWLEDGEMENTS We are greatly obliged to our project guides Professor D. V. Shirodkar & Mr. R. Madhan for their constant guidance and supervision. We would like to thank Prof. Arun Telang for giving us his valuable time & guiding us. We also wish to thank Professor Uday Amonkar, Head of Department, Mechanical Engineering, for constantly motivating us in our journey through this project. We would like to thank our parents & our friends for motivating us constantly. Finally and most importantly it is our duty to thank our respected Principal Shri Vivek B. Kamat for having furnished us with well equipped labs & workshops due to which at no stage of our project did we feel deprived of any kind of facility. June 2012, Goa College of Engineering

5
ABSTRACT
Our aim is to synthesize, analyze and design an alternative Wave Energy
Conversion mechanism which effectively captures and converts the
available wave energy flux into useful energy. Ocean waves contain a large
amount of greatly unutilized energy & hence developing methods to
convert it into a useful form turns into a task of great importance.
6
Contents
DESIGN & SYNTHESIS OF AN OCEAN WAVE ENERGY CONVERSION MECHANISM ................................ 1
PROJECT APPROVAL SHEET ................................................................................................................... 2
CERTIFICATE .......................................................................................................................................... 3
ACKNOWLEDGEMENTS ......................................................................................................................... 4
ABSTRACT ............................................................................................................................................. 5
LIST OF FIGURES .................................................................................................................................... 8
Chapter 1 : INTRODUCTION ................................................................................................................. 9
1.1 PREAMBLE ........................................................................................................................... 9
1.2 OBJECTIVE ........................................................................................................................... 9
1.3 PROBLEM STATEMENT .................................................................................................... 10
1.4 PROBLEM DEFINATION .................................................................................................... 10
Chapter 2 : LITERATURE SURVEY ........................................................................................................ 11
2.1 INTRODUCTION: ................................................................................................................ 11
2.1.1 CURRENT ENERGY GENERATION SENARIO .................................................................. 11
2.1.2 ENERGY CONSUMPTION & THE FUTURE ..................................................................... 13
2.1.3 NEED FOR DEVELOPMENT OF ALTERNATIVE ENERGY SOURCES ................................. 14
2.1.4 OCEAN WAVE ENERGY AS A IMPORTANT PLAYER IN ENERGY SECTOR ....................... 15
2.2 OCEAN WAVE ENERGY ..................................................................................................... 16
2.2.1 GLOBAL SCENARIO ...................................................................................................... 16
2.2.2 WAVE POWER DISTRIBUTION IN THE INDIAN SUBCONTINENT ................................... 16
2.3 OCEAN WAVES: A STUDY.................................................................................................. 18
2.3.1 GENERAL CONSIDERATIONS ABOUT WAVES ............................................................... 18
2.3.2 TYPES OF WAVES ......................................................................................................... 18
2.3.3 DEFINING A WAVE ....................................................................................................... 18
2.4 WAVE ENERGY & POWER ................................................................................................. 21
2.4.1 NOMENCLATURE ......................................................................................................... 21
2.4.2 WAVE ENERGY FORMULAE ......................................................................................... 22
2.5 EXISTING WAVE ENERGY CONVERSION MECHANISMS ................................................ 23
2.5.1 CRITERTIA FOR COMPARISSON ................................................................................... 23
2.5.2 KNOWN MECHANISMS:............................................................................................... 25
Chapter 3 : SYSTEM DESIGN ............................................................................................................... 28
3.1 CONCEPT DESIGN OF WAVE ENERGY CONVERTOR: ...................................................... 28

7
3.2 ENERGY CONVERSION MECHANISM ............................................................................... 29
3.3 VARIOUS DESIGN CONCEPTS OF MOTION CONVERSION MECHANISMS ...................... 30
3.2.1 MECHANISM 1:............................................................................................................ 30
3.2.2 MECHANISM 2:............................................................................................................ 31
3.2.3 MECHANISM 3:............................................................................................................ 32
3.2.4 MECHANISM 4:............................................................................................................ 33
3.2.5 MECHANISM 5:............................................................................................................ 34
3.4 SELECTION OF MOTION CONVERSION MECHANISM ..................................................... 35
3.5 DESIGN & ANALYSIS OF WAVE ENERGY CONVERTOR .................................................. 36
3.5.1 DESIGN ASSUMPTIONS ................................................................................................ 36
3.5.2 WAVE POWER CALCULATIONS & KINEMATIC SYNTHESIS OF LINKAGES...................... 36
3.5.3 FORCE ANALYSIS.......................................................................................................... 45
3.5.4 DESIGN ANALYSIS ........................................................................................................ 48
Chapter 4 : SYSTEM ANALYSIS & HARDWARE VERIFICATION ............................................................. 50
4.1 INTRODUCTION ................................................................................................................. 50
4.2 LAB TESTING ..................................................................................................................... 50
4.2.1 WAVE ENERGY CONVERTOR ....................................................................................... 50
4.2.2 ENERGY CONVERSION MECHANISM ........................................................................... 52
4.3 SIMULATION ...................................................................................................................... 53
4.4 RESULTS & DISCUSSIONS ................................................................................................. 55
Chapter 5 : CONCLUSION ................................................................................................................... 56
Chapter 6 : FUTURE WORK................................................................................................................. 57
REFERENCES ........................................................................................................................................ 58

8
LIST OF FIGURES
2-1: Energy generation distribution ................................................................................................ 11
2-2: Thermal energy break-up ......................................................................................................... 11
2-3: Nuclear power projects in India ............................................................................................... 12
2-4: Energy scenario-Present & Future ........................................................................................... 13
2-5: Global wave energy distribution............................................................................................... 16
2-6: Wave energy zones in India where potential was estimated .................................................. 16
2-7: Wave records in India ............................................................................................................... 17
2-8: Wave terminology ..................................................................................................................... 21
2-9: Plot of wave power density ....................................................................................................... 22
3-1: Schematic of wave energy convertors ...................................................................................... 28
3-2: Model of an Energy Conversion Mechanism ............................................................................ 29
3-3: Line Diagram of Mechanism 1................................................................................................... 30
3-4: Model of Mechanism 1 ............................................................................................................... 30
3-5: Line diagram of Mechanism 2 ................................................................................................... 31
3-6: Model of Mechanism 2 ............................................................................................................... 31
3-7: Model of Mechanism 3 ............................................................................................................... 32
3-8: Line Model of Mechanism 3 ...................................................................................................... 32
3-9: Model of Mechanism 4 ............................................................................................................... 33
3-10: Line Diagram of Mechanism 4 ................................................................................................ 33
3-11: Model of mechanism 5 ............................................................................................................ 34
3-12: Line Diagram of Mechanism 5 ................................................................................................ 34
3-13: Mechanism overview .............................................................................................................. 35
3-14: Force analysis of wave energy convertor design ................................................................... 45
3-15: Line diagram of wave energy convertor for purpose of Force analysis ............................... 46
3-16: Force diagram .......................................................................................................................... 47
4-1: Model of wave energy mechanism test model ......................................................................... 50
4-2: Technical Diagram & dimensions of wave energy convertor test model ............................... 51
4-3: Testing of cylinders for pressure development ....................................................................... 52
4-4: Simulation of Flow through from a cylinder to conductor with axial arrangement of
conductor ........................................................................................................................................... 53
4-5: Simulation of Flow through from a cylinder to conductor with radial arrangement of
conductor ........................................................................................................................................... 54

9
Chapter 1 :
INTRODUCTION
1.1 PREAMBLE
With the rise of economic powers, rapid socio-economic progress and development of
nations as well as development of technology Energy is emerging to be one the most
important resource. The global energy requirements are on a path of rapid rise. The
current sources of energy are near or already being tapped to the maximum. Thus arises
the need to look for new & sustainable sources of energy. With the problems associated
with conventional energy sources, it is important that research be done to harness non-
conventional energy sources. Ocean Wave Energy is one of the most abundant energy
sources available at our disposal especially at the coastal regions of the world. Yet it is
one of the least researched energy sources. This project aims to conceptualize,
synthesize & design a wave energy convertor which will be able to convert ocean wave
energy available at the shores into a usable form.
1.2 OBJECTIVE
To look into the area of ocean wave energy conversion for feasibility studies of
ocean wave energy conversion.
To calculate wave energy output for a given input & a given mechanism
configuration.
To synthesize mechanisms which performs wave energy conversion & to select
the best after analysis of each.
To construct a scaled model of the selected mechanism
To demonstrate the working of the model.
To perform various tests determining its efficiency.

10
1.3 PROBLEM STATEMENT
To design a wave energy convertor which can convert wave energy input into useful energy output.
1.4 PROBLEM DEFINATION
Wave energy conversion is a relatively unexplored field in the domain on energy generation. With the rising global energy needs, it has become necessary to explore each & every potential source of energy. The project aims to conceptualize, synthesize, design & analyze a wave energy convertor. The wave energy convertor will be placed at the shores. The coastline of India is inundated with hundreds of beaches separated by cliff faces. These are prime locations for installing such convertors. The convertors will receive wave energy input. The task of the wave energy convertor is to convert the oscillating motion of the wave into a usable output. The output shall be used for energy generation. The wave energy convertor needs to be designed considering the ocean environment it shall be subjected to. The design shall be analysed considering many parameters. Tests shall be performed to determine its effectiveness & efficiency.
11
Chapter 2 :
LITERATURE SURVEY
2.1 INTRODUCTION:
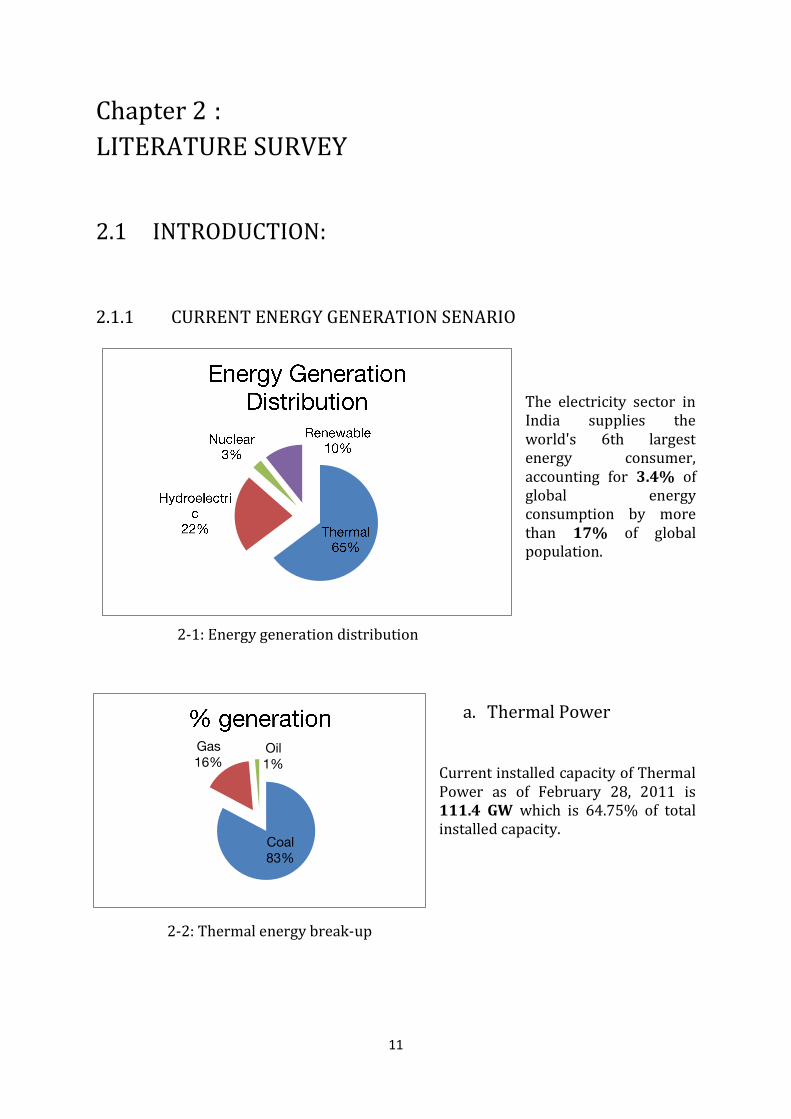
2.1.1 CURRENT ENERGY GENERATION SENARIO
The electricity sector in India supplies the world's 6th largest energy consumer, accounting for 3.4% of global energy consumption by more than 17% of global population.
a. Thermal Power
Current installed capacity of Thermal Power as of February 28, 2011 is 111.4 GW which is 64.75% of total installed capacity.
Coal 83%
Gas 16%
Oil 1%
2-1: Energy generation distribution
2-2: Thermal energy break-up

12
b. Hydro Power
India was one of the pioneering countries in establishing hydro-electric power plants. The power plants at Darjeeling and Shimsha (Shivanasamudra) were established in 1898 and 1902 respectively and are among the first in Asia. The installed capacity as of 2011 was approximately 37,368 MW.
c. Nuclear Power
Currently, twenty nuclear power reactors produce 4,780 MW. 7 other reactors are under construction and are expected to generate an additional 5,300 MW.
In October 2010, India drew up a plan to reach a nuclear power capacity of 63,000 MW by 2032.
India has been making advances in the field of thorium-based fuels, working to design and develop a prototype for an atomic reactor using thorium and low-enriched uranium, a key part of India's three stage nuclear power programme.
d. Renewable Energy
India was the first country in the world to set up a ministry of non-conventional energy
resources, in early 1980s. Renewable energy in India comes under the purview of the
Ministry of New and Renewable Energy. As of early 2012, India had an installed capacity
of about 10.7% as renewable energy of its total installed capacity. Solar Power & wind
power are the two main sources of renewable energy.
Solar power is being rapidly developed as a major source of renewable energy. The
current installed capacity is about 420 MW. Plans are to increase production to 20GW
by the year 2020.
As of early 2012, the total installed Wind Energy power plant production was about
16080 MW. By the end of 2012, the Indian government plans to install an additional
6000 MW of power generation capacity
2-3: Nuclear power projects in India

13
2.1.2 ENERGY CONSUMPTION & THE FUTURE
Rapid economic growth has created a growing need for dependable and reliable supplies of electricity, gas and petroleum products. Due to the fast-paced growth of India's economy, the country's energy demand has grown an average of 5% per annum in the last 10 years i.e. from 1999-2009. In 2011, the installed power generation capacity of India stood at 119 GW. The Indian government has set a modest target to add approximately 78 GW of installed generation capacity by 2012 which it is likely to miss. The total demand for electricity in India is expected to cross 445 GW by 2030.
2-4: Energy scenario-Present & Future
119
243.95
2011 2030
Energy Scenario (Figures in GW)
14
2.1.3 NEED FOR DEVELOPMENT OF ALTERNATIVE ENERGY SOURCES
2.1.3.1 Problems associated with Non-renewable Sources of Energy
FOSSIL FUEL
Natural resources such as coal, petroleum, oil and natural gas take thousands of years to form naturally and cannot be replaced as fast as they are being consumed. Eventually natural resources will become too costly to harvest and humanity will need to find other sources of energy.
They are extremely polluting & damage the environment to a great extent.
NUCLEAR ENERGY
Uranium ore, the primary fuel is present in the ground at relatively low concentrations and mined in 19 countries.
Nuclear technology is a volatile and contaminating source of fuel production, with the expense of the nuclear industry predominantly reliant on subsidies.
The radioactive waste the nuclear industry collects is highly hazardous, for a prolonged period and storage has risks of containment. Radioactive fuel continues to be controversial and unresolved industry.
2.1.3.2 Advantages of renewable sources of energy
One major advantage with the use of renewable energy is that as it is renewable it is therefore sustainable and so will never run out.
Renewable energy facilities generally require less maintenance than traditional generators. Their fuel being derived from natural and available resources reduces the costs of operation.
Even more importantly, renewable energy produces little or no waste products such as carbon dioxide or other chemical pollutants, so has minimal impact on the environment.
Renewable energy projects can also bring economic benefits to many regional areas, as most projects are located away from large urban centres and suburbs of the capital cities. These economic benefits may be from the increased use of local services as well as tourism.

15
2.1.4 OCEAN WAVE ENERGY AS A IMPORTANT PLAYER IN ENERGY
SECTOR
Ocean waves arise from the transfer of energy from the sun to wind then water. Solar energy creates wind which then blows over the ocean, converting wind energy to wave energy. Once converted, this wave energy can travel thousands of miles with little energy loss. Most importantly, waves are a regular source of power with an intensity that can be accurately predicted several days before their arrival. Furthermore, wave energy is more predictable than wind or solar energy.
India has a coastline of about 6000 Km of coast. Primary estimates indicate that the annual wave energy potential along the Indian coast is between 5 MW to 15 MW per meter, thus a theoretical potential for a coast line of nearly 6000 Km works out to 40000-60000 MW approximately. In India the research and development activity for exploring wave energy started at the Ocean Engineering Centre, Indian Institute of Technology, Madras in 1982. However since then there have been very little efforts in developing this energy resource. As from the figures, it can be determined that ocean wave energy can play a very significant role in our nation’s energy needs.

16
2.2 OCEAN WAVE ENERGY
2.2.1 GLOBAL SCENARIO
The approximate global distribution of ocean wave energy is given is plotted on the map below depicting wave power levels in kW/m of wave crest, the typical units for measuring wave energy. As it can be seen, the wave energy available on the coasts of India is not as high as that is available in other regions of the globe.
2-5: Global wave energy distribution
2.2.2 WAVE POWER DISTRIBUTION IN THE INDIAN SUBCONTINENT
The wave power data is depicted in the table below for 6 regions as shown in the map. From the table we can make the following conclusions:
The wave Power along the Indian
coasts varies seasonally and
geographically from 1.2 to 39.6
KW/m with an average of 9.4
KW/m.
2-6: Wave energy zones in India where potential was estimated

17
The annual potential varies from place to place between 8 and 11 kW/m.
Table 1 Wave Power along the Indian Coast (In kW/m):
Area Jan Feb Mar Apr May June July Aug Sept Oct Nov Dec
A 3.02 3.73 3.91 4.47 6.98 26.77 39.57 24.84 10.03 2.69 3.58 4.74 B 5.13 5.05 2.24 1.56 6.31 17.21 27.04 17.14 8.15 4.55 3.52 5.40 C 9.26 4.54 4.05 5.50 11.44 18.85 17.69 15.34 10.11 7.21 6.67 7.52 D 5.78 5.13 3.30 3.38 10.60 16.67 14.79 12.57 8.49 7.94 10.98 14.05 E 4.03 1.69 2.35 3.69 11.14 17.24 17.45 16.16 9.18 6.90 9.71 5.62 F 1.24 1.39 3.28 12.34 14.30 11.90 13.24 16.67 16.07 6.28 2.80 1.85
The maximum wave power potential occurs along the Konkan coast in July.
The southwest monsoon period (May-September), in general, offers a greater
potential all along the coast with a mean of about 15 kW/m.
During the northeast monsoon, wave power is generally low and is particularly
along the west coast as compared to that along the east coast cyclones occur
during this period.
The directional distribution of wave power shows that along the east coast about
65% of the total wave power is contributed by waves from south and southwest
and along the west coast about 85% by waves from south to southwest and
northwest.
2-7: Wave records in India

18
2.3 OCEAN WAVES: A STUDY
2.3.1 GENERAL CONSIDERATIONS ABOUT WAVES
One of the causes of ocean waves is by the blowing of wind near the ocean surface. The wind continues to blow and the waves increase in energy and begin to move faster than the storm, the waves begin to move in one direction and leave the general area of the windy zone, pushed by the wind. In the case of the storm, the waves that travel long distances away from the storm are called swell waves. A group of these waves together is called a wave train. These wave trains travel away from the windy zone. The distance of travel is influenced by the amount of energy they receive from the wind. It is common for waves generated by strong winds to travel great distances.
2.3.2 TYPES OF WAVES
Progressive waves are any waves that you can see moving through the water.
They are divided into 3 broad classes:
1. Longitudinal (push-pull) – a good example are sound waves
2. Transverse (side to side) – energy moves at right angles to the
wave. E.g. A rope that you send waves down.
3. Orbital (interface waves) These occur at the interface of two materials with different densities (e.g. air and water)
Ocean waves are all orbital waves, and are characterized by a circular (orbital)
motion. They combine the characteristics of longitudinal and transverse waves.
2.3.3 DEFINING A WAVE
2.3.3.1 Mathematical Description
A wave can be described mathematically with the help of the following terms:
a. Height (H) of a wave is the distance between the crest of the wave and the
trough of the wave

19
b. Wavelength (L) is the distance between any two similar points on adjacent oscillations of a wave. Popularly, the distance between two consecutive crests or troughs
c. Steepness is the ratio of height and length (H/L)
d. Period (T) is the time it takes for one wavelength (L) to pass a point
e. Speed (S) equals L/T, or how much distance (L) a wave covers in time (T)
f. Frequency (f) is 1/T, so S = L x f
Because waves move much more slowly than light or sound, the term frequency
isn’t used very often. Its Period or Speed is spoken about instead.
In a pure wave, there is no flow of particles. Only the energy is propagated. Particles in a wave travel in a circular motion, with the circle diameter equal to H.
In water, the wave particles slow down with depth, so that at L/2, there is essentially no motion
Because the trough moves a little bit slower than the crest, there’s actually a
small net transport of particles (water) along the energy path, though, so ocean waves are not pure waves.
The period of a wave is set when the wave is created. Therefore, any change in
the wave results in a change in wavelength, and so results in slowing it down, speeding it up, or changing the height.
2.3.3.2 Classification
We divide waves up into groups, dependent on their mathematical properties
and how they are formed:
Deep-Water Waves: They are deeper than L/2, so they don’t feel the bottom at all Speed is determined by L/T, but it’s hard to measure L so, we measure T i.e. the
Period Using the equation: S = gT / 2p, we can calculate S (g is the gravitational
constant). Simplifying this, S = 1.56 x T (m/s). Therefore, speed is controlled by length and period. These form the pure circular orbits

20
Shallow-Water Waves: The depth (d) of these waves is less than 1/20 the wavelength (L). Also called
long waves. Wind waves that move inshore become shallow-water waves Tsunamis, Tide waves are always shallow-water because they have a very long
wavelength (L). Speed, S = square root of g x d, or 3.1 x d ½. Therefore, speed is controlled by depth (increases with depth).
Shallow-water wave motion is flattened out, so the particles move in a shallow, elliptical pattern, almost horizontal.
Transitional Waves: Length is greater than 2x but less than 20x depth (d). They have properties somewhere between deep and shallow waves
21
2.4 WAVE ENERGY & POWER
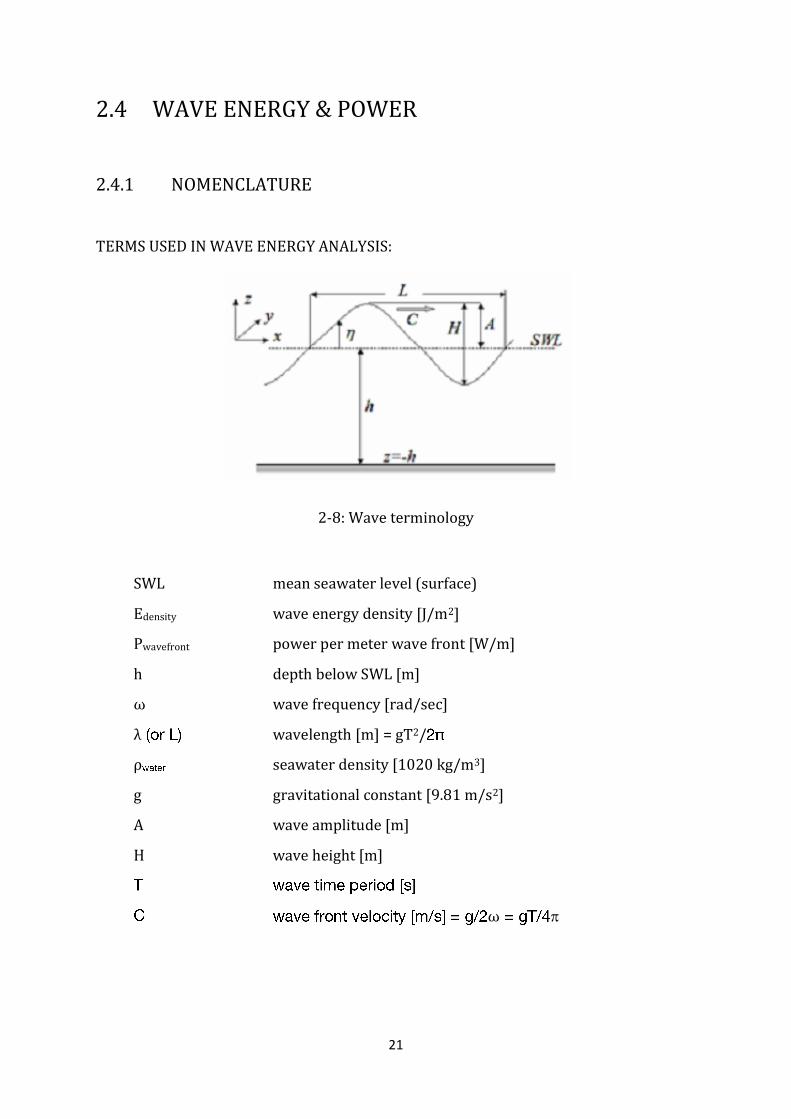
2.4.1 NOMENCLATURE
TERMS USED IN WAVE ENERGY ANALYSIS:
2-8: Wave terminology
SWL mean seawater level (surface)
Edensity wave energy density [J/m2]
Pwavefront power per meter wave front [W/m]
h depth below SWL [m]
ω wave frequency [rad/sec]
λ wavelength [m] = gT2/
ρ seawater density [1020 kg/m3]
g gravitational constant [9.81 m/s2]
A wave amplitude [m]
H wave height [m]
ω
22
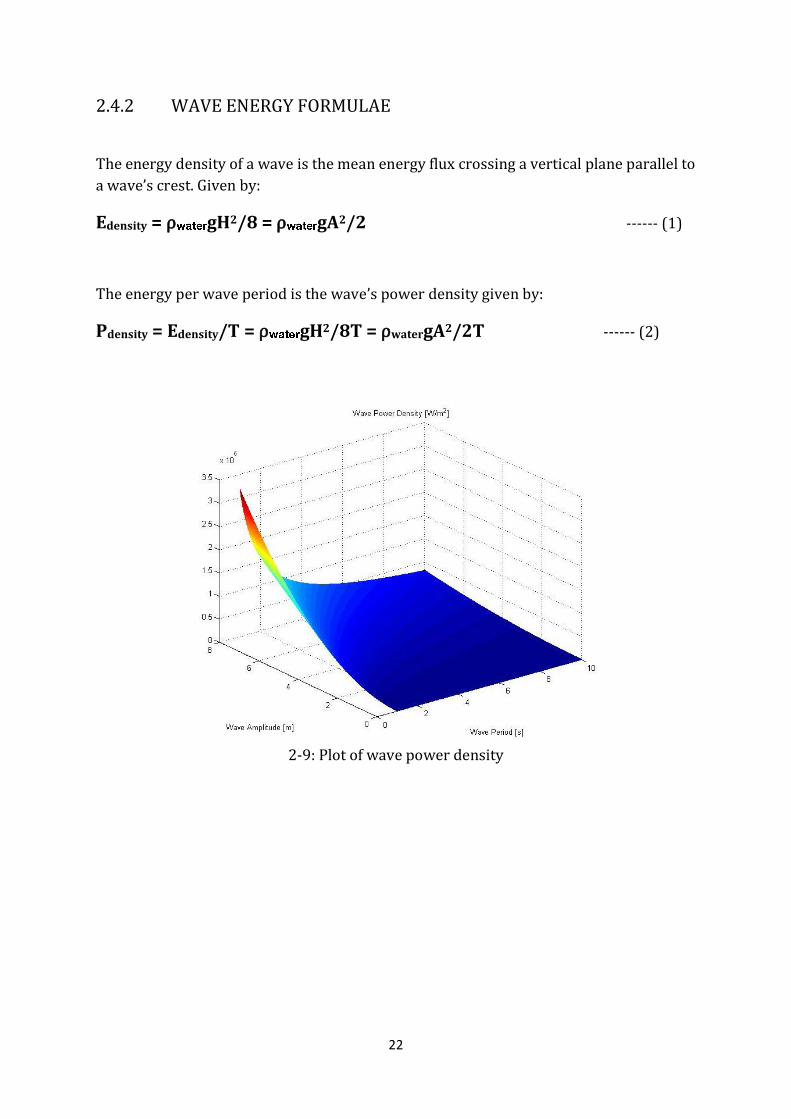
2.4.2 WAVE ENERGY FORMULAE
The energy density of a wave is the mean energy flux crossing a vertical plane parallel to
a wave’s crest. Given by:
Edensity = ρ gH2/8 = ρ gA2/2 ------ (1)
The energy per wave period is the wave’s power density given by:
Pdensity = Edensity/T = ρ gH2/8T = ρwatergA2/2T ------ (2)
2-9: Plot of wave power density

23
2.5 EXISTING WAVE ENERGY CONVERSION MECHANISMS
2.5.1 CRITERTIA FOR COMPARISSON The feasibility of the devices discussed in this section will be evaluated on behalf of the following criteria:
Environmental impact Maintenance Manufacturability
The Environmental impact and the Maintenance will be further divided into:
1.1 High 1.2 Medium 1.3 Low
The Manufacturability will be further classified as:
Good Medium Poor
Environmental impact: The environmental impact and the visual impact of both the device and its PTO will be evaluated under the following criterion:
High: Excessive damage to the environment and a great visual impact. Medium: It has an impact on the environment, but marine life will still be able to coexist with the device. The visual impact is less as for the previous category.
Low: The device has a neglect able impact on the environment.
Maintenance: The maintenance cost and the ease of maintenance will be evaluated according to the following criterion:
High: These devices will not only require regular maintenance, but the performing of the maintenance is also difficult. Thus the maintenance cost will be high. Medium: The device will require scheduled. It will also be moderately easy to access.

24
Low: Regular maintenance is required. The performing of the maintenance will also be quite difficult, typically bottom mounted devices that’s difficult to access.
Manufacturability: This will include the manufacturing and installation cost of the WEC.
Good: The WEC is made from readily available components and/or materials, for instance steel and concrete. It will also require minimal preparation of the desired installation site and should be easy to install.
Medium: These WECs will require some custom made components and may require some exotic materials. They will also be more difficult to install than the previous category.
Poor: Custom made components and/or exotic materials are necessary. These devices will also require are large structure that accompanied with great installation cost.
25
2.5.2 KNOWN MECHANISMS:
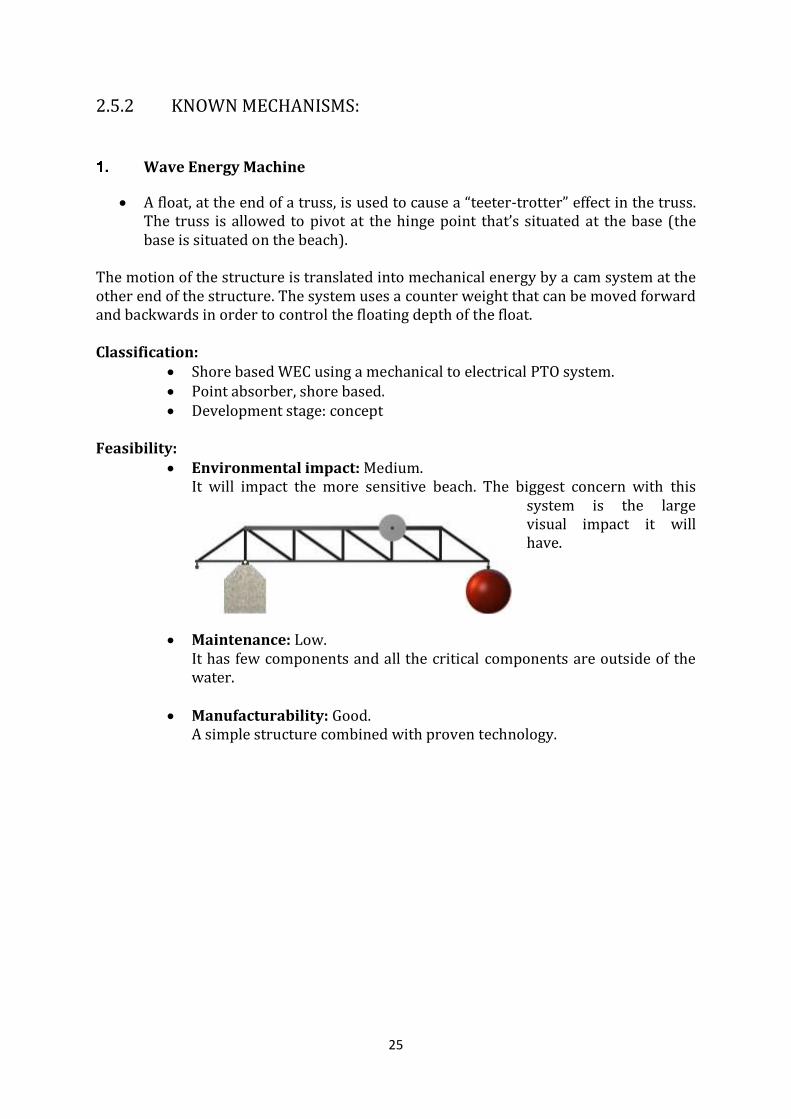
Wave Energy Machine
A float, at the end of a truss, is used to cause a “teeter-trotter” effect in the truss. The truss is allowed to pivot at the hinge point that’s situated at the base (the base is situated on the beach).
The motion of the structure is translated into mechanical energy by a cam system at the other end of the structure. The system uses a counter weight that can be moved forward and backwards in order to control the floating depth of the float. Classification:
Shore based WEC using a mechanical to electrical PTO system. Point absorber, shore based. Development stage: concept
Feasibility:
Environmental impact: Medium. It will impact the more sensitive beach. The biggest concern with this
system is the large visual impact it will have.
Maintenance: Low. It has few components and all the critical components are outside of the water.
Manufacturability: Good. A simple structure combined with proven technology.

26
2. Tapchan
The system has a tapered channel that leads up to an elevated reservoir. The channel focuses the waves as it gets narrower, this effect allows the waves to flow into the elevated reservoir. The elevated water will be used to drive a conventional hydropower plant as it’s allowed to flow back into the ocean. It is a favourable system because it can deliver electricity on demand (it stores the water in the reservoir until needed), but its use is limited to coastlines with deep water near shore and high cliffs. It also
requires a tidal range of less than 1m. Classification:
Shore based WEC with an overtopping type PTO. Development stage: Unknown.
Feasibility:
Environmental impact: Medium. It is a rather large structure, but it will not have too a great affect on the suitable places where it can be installed.
Maintenance: Low. It uses well proven and readily available technology. All the critical components are protected from storms and also easily accessible.
Manufacturability: Medium. It requires a relatively large structure and it is limited to only a few suitable locations.

27
3. Pelamis It is a semi-submerged system that consists
of several cylindrical sections (made out of steel) that are connected with hinged joints.
Hydraulic pumps are used to utilize the bending motion inside the joints, which is caused by the passing waves. The high pressure oil is used to generate electricity in a hydraulic system.
The electricity generation system, as well as the rectifying circuit, is situated inside the structure.
Several modules can be connected in parallel and the electricity will be fed into the grids using a single cable system.
It is possibly the furthest developed system up to date and the company is busy with negotiations in order to build several plants across the world (including South Africa).
Classification:
Above waterline WEC with hydraulic PTO. Far off shore (5-10 km). Development stage: Currently busy to install the world’s first wave farm
(Agucadura) with a capacity of 2.25MW.
Feasibility:
Environmental impact: Low. The unit itself will have a small impact and that of the anchor is also very small. The hydraulic system further uses biodegradable fluid.
Maintenance: Low.
The system uses proven technology and all the critical components are easily accessible. If it’s necessary the device can be towed to a nearby harbour in order to service it.
Manufacturability: Good.
The structure is made from steel and it can be built in almost any shipyard using standard equipment and then towed to the desired site.

28
Chapter 3 :
SYSTEM DESIGN
3.1 CONCEPT DESIGN OF WAVE ENERGY CONVERTOR:
The device is made of a float which is placed in the sea, which moves in a vertical
motion, according to the frequency of the ocean wave. The float’s movement passes on
the motion to a mechanism which converts the motion into a circular. The circular
motion is transferred to a operating an electricity generator and the process culminates
in the production of electricity.
3-1: Schematic of wave energy convertors
The wave energy convertor is divided into:
1. The Motion Conversion Mechanism
2. The Energy Conversion Mechanism
The motion conversion mechanisms convert the motion of the waves into a standard,
preferably constant output. The type of the mechanism varies as per requirement &
design. They shall be discussed in the later sections.
29
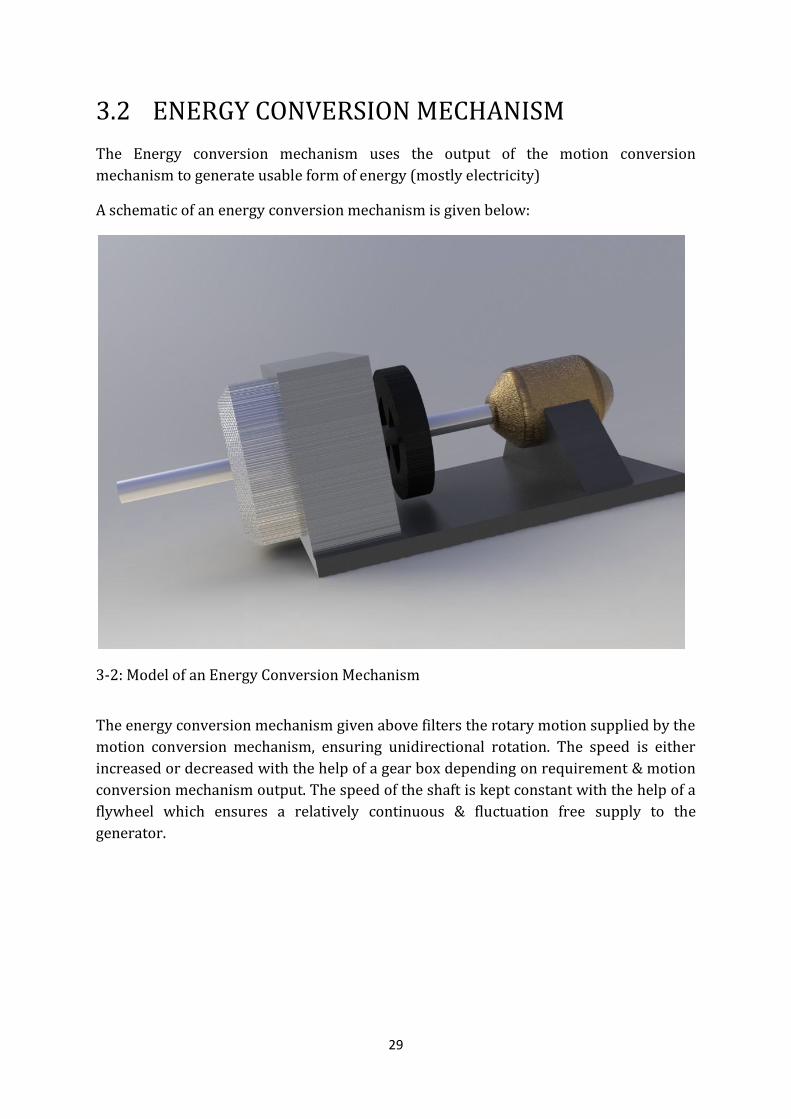
3.2 ENERGY CONVERSION MECHANISM
The Energy conversion mechanism uses the output of the motion conversion
mechanism to generate usable form of energy (mostly electricity)
A schematic of an energy conversion mechanism is given below:
3-2: Model of an Energy Conversion Mechanism
The energy conversion mechanism given above filters the rotary motion supplied by the
motion conversion mechanism, ensuring unidirectional rotation. The speed is either
increased or decreased with the help of a gear box depending on requirement & motion
conversion mechanism output. The speed of the shaft is kept constant with the help of a
flywheel which ensures a relatively continuous & fluctuation free supply to the
generator.

30
3.3 VARIOUS DESIGN CONCEPTS OF MOTION CONVERSION MECHANISMS
3.2.1 MECHANISM 1:
This mechanism is the basic 4 bar mechanism. Oscillating wave is given at end A. The oscillation causes the mechanism to transmit the wave force due to the design to the rotor shaft attached at end B as rotary motion.
Advantages:
a. Simplicity of design & construction. b. Low weight & construction cost.
Disadvantages:
a. The mechanism has an inherent imbalance. During half of the rotation, the weight of the mechanism slows down the rotation.
b. If inadequate bearing support is provided at the rotor end, the weight of the bearing in its entirety falls on the rotor shaft connecting it to the generator mechanism.
c. The rotor level is close to the sea level, hence entire mechanism & generation will be subjected to the sea conditions.
d. If the wave height goes beyond the mechanism’s operating limit, great amount of stress is developed in the structure & eventual failure of the structure may occur.
3-4: Model of Mechanism 1
3-3: Line Diagram of Mechanism 1

31
3.2.2 MECHANISM 2:
This mechanism is a manifestation of the 4 bar mechanism. Wave input is given at point A. The oscillatory motion causes the end B to rotate. Advantages:
a. Accounts for the difference of heights required to prevent damage the
mechanism by the sea.
b. The problem of weight of mechanism acting on & against the rotor is solved
to quite an extent.
Disadvantages:
a. If the wave height goes beyond the mechanism’s operating limit, great
amount of stress is developed in the structure & eventual failure of the
structure may occur.
b. The relative difference between rotor shaft height & sea level may not be
enough to isolate the generation mechanism from the sea.
3-6: Model of Mechanism 2
3-5: Line diagram of Mechanism 2

32
3.2.3 MECHANISM 3:
This mechanism is a manifestation of the 4 bar mechanism. It incorporates a change in the previous design. Here the generation mechanism is placed above & behind linkage pivot point. Wave input is given at point A. The oscillatory motion causes the end B to rotate.
Advantages: a. Accounts for the relative height difference between rotor shaft height & sea
level to provide enough difference to isolate the generation mechanism from the sea.
b. Problem of mechanism weight acting on shaft bearing is reduced.
Disadvantages:
a. If the wave height goes beyond the mechanism’s operating limit, great amount of stress is developed in the structure & eventual failure of the structure may occur.
b. Due to an increase in number of linkages & joints, the reliability of the system reduces.
3-8: Line Model of Mechanism 3
3-7: Model of Mechanism 3

33
3.2.4 MECHANISM 4:
This mechanism is a manifestation of the slider crank mechanism. Wave input is given
to the Buoy B which causes to crank to rotate.
Advantages:
a. Simplicity of design & construction.
b. Low weight & construction cost.
Disadvantages:
a. If the wave height goes beyond the mechanism’s operating limit, great
amount of stress is developed in the structure & eventual failure of the
structure may occur.
b. Problem of mechanism weight acting against rotation exists during the
upward stroke.
3-10: Line Diagram of Mechanism 4
3-9: Model of Mechanism 4

34
3.2.5 MECHANISM 5:
Float F is placed in water, where due to wave motion it is forced up & down. The motion is transmitted to the piston P which slides within the casing C. This motion can be used to convert wave energy into useful energy by 2 methods:
i. By use of a linear generator ii. By use of hydraulic system
The two systems are described in the next sections. Advantages:
a. This system can incorporate design features to ensue relative flexibility between the energy conversion & generation mechanisms.
b. The system can account for the seasonal changes in wave average & average water levels due to tidal variations.
c. The generation mechanism can be kept at a distance from the actual wave energy convertor thus the generation mechanism will have added protection from the sea conditions.
Disadvantages:
a. The system requires interfacing of two systems (mechanical linkages with hydraulics or mechanical linkage with a linear generator). This may bring about problems with regards to implementation & maintenance.
b. The hydraulic fluid flow in the hydraulic circuit is subjected to fluid flow resistance & hence there are losses in the conductors.
3-12: Line Diagram of Mechanism 5 3-11: Model of mechanism 5

35
3.4 SELECTION OF MOTION CONVERSION MECHANISM
Mechanism 5 was selected for the purpose of energy generation because of its advantages over the other mechanisms that were conceptualized. The advantages being:
a) Relative flexibility between the positioning of the wave energy converter
and the energy generation mechanism. b) Option for transmission of power over short distances allowing the
positioning of the energy generation mechanism to be housed at a safer location.
c) Fluid component allows the speed to be varied as per requirements.
3-13: Mechanism overview

36
3.5 DESIGN & ANALYSIS OF WAVE ENERGY CONVERTOR
3.5.1 DESIGN ASSUMPTIONS To initiate calculations, we use the following considerations & assumptions as the initial data:
i. Average wave height; A=1.0m (from data)
ii. Width of float; W=1m (assumption)
3.5.2 WAVE POWER CALCULATIONS & KINEMATIC SYNTHESIS OF
LINKAGES A wave resource is typically described in terms of power per meter of wave front (or
wave crest). This can be calculated by multiplying the energy density by the wave front
velocity.
ρ ω ρ ω
For a float of dimensions W*B, Power generated per wave is given by
P = Pwavefront*width of float = C*Edensity*W (From eqn.1)
Now, the force F acting on the float is found by
P = F.C (C in horizontal direction)
C*Edensity*W = F.C
F= Edensity*W
From (1)
ρ
Here we see that the force acting on given float is function of A2.

37
Iteration 1: Force calculations: Substituting following values in eqn. 2
To start with the wave power calculations we consider average wave height obtained
from data i.e. A=1.0m & proceed with the calculations.
ρ = 1020kg/m3, g = 9.81m/s2, A = 1m, W = 0.8m
We get force F acting on the float as
F = 4002.48N = 4kN
A more practical approach to calculate vertical forces acting on the float can be
modelled via Newton’s 2nd Law i.e. F=ma where the mass of water is taken to be
ρ HAfloat and gravity is the accelerating force.
ρ
Substituting, ρ = 1020kg/m3, g = 9.81m/s2, Afloat = (1*0.8)m2,
Fwater = 4002.48N
Pmax generated = Fwater(Lstroke/T)
= 4002.48*(0.5/8) = 250.16W

38
Kinematic synthesis:
Let l be the distance between the float pin and the oscillating edge point
Let x be the distance between the float pins
Let a be the distance between the supports
Let h be the wave height
Let be the final angle
Let be the change in angle
We have initial conditions as
1. Let derived stroke length ≤ 1/2 of actual stroke length of piston (this is to take account of wave height above 1m)
2. Let ≤ 100 (To prevent the float from tipping below & becoming vertical)
3. Let ≤ 35 (To reduce the stroke length)
4. Let l ≤ 1.5m (to facilitate construction and should be as small as possible)
5. Let h varies from 0.5 to 2m seasonally (taking a mean h= 1m for calculations)
→

39
→
Tabulating values of length as a function of h for various possible
60 40 1.37h
65 35 1.57h 70 30 1.84h
80 20 2.78h
Here, we get the best values
We get even better values as we increase above 35 and decrease , however it violates the initial condition 3.
Thus we take l =1.57h = 1.57 * 1
l = 1570mm
Inserting in equations below & solving for Lmax- Lmin, which is the length of the stroke of the linkage;
Now, using cosine rule, we have:
cos(+)
(angle at lowest point)
cos()
(angle at uppermost point)
Substituting the values =65, = 35, x = 700mm, a = 2000mm
We get,
L max = 2334mm
L min = 1818mm
Stoke length = L= 516 500mm
Dimensions of the float:
Length: 1.57m
Width: 0.8m
Height: 0.25m

40
Observations: This iteration can to withstand waves upto 1m efficiently. To prevent larger
waves crashing on it, the top pin joint of the cylinder will have to be moved higher
increasing the cost as well as size of the mechanism.
Also, the bigger waves might push down the float that will increase the stresses
on the components and the pin joints.
The ratio the cumulative length of the piston cylinder assembly to the stroke
length is high, i.e. it increases the size of mechanism such that an unnecessary
long piston & cylinder needs to be provided.
As we see the dimensions obtained are with standard wave height of 1m are unsuitable for construction, we proceed to next iteration directly taking the wave power data available.
Iteration 2:
Force Calculations:
From the data provided, we have an average of 11kW/m Wave power available on
Konkan coast, with a peak of about 40kW/m during monsoons.
Pdesign= 40kW
P= F*C (in horizontal direction)
F= P/C
Fmax= 40*4 gT = 51.21kN for t=1sec
Fmax= 51.23kN
Also, the buoyancy force (vertical force) acting on the float can be modelled via
Newton’s 2nd law i.e. F=ma where the mass of water is taken to be ρ HAfloat and
gravity is the accelerating force.
Fwater = (ρ HAfloat) *g
Substituting, ρ = 1020kg/m3, g = 9.81m/s2, Afloat = 1*0.75m2, H=2m
Fwater = 15009.92N ~15kN
41
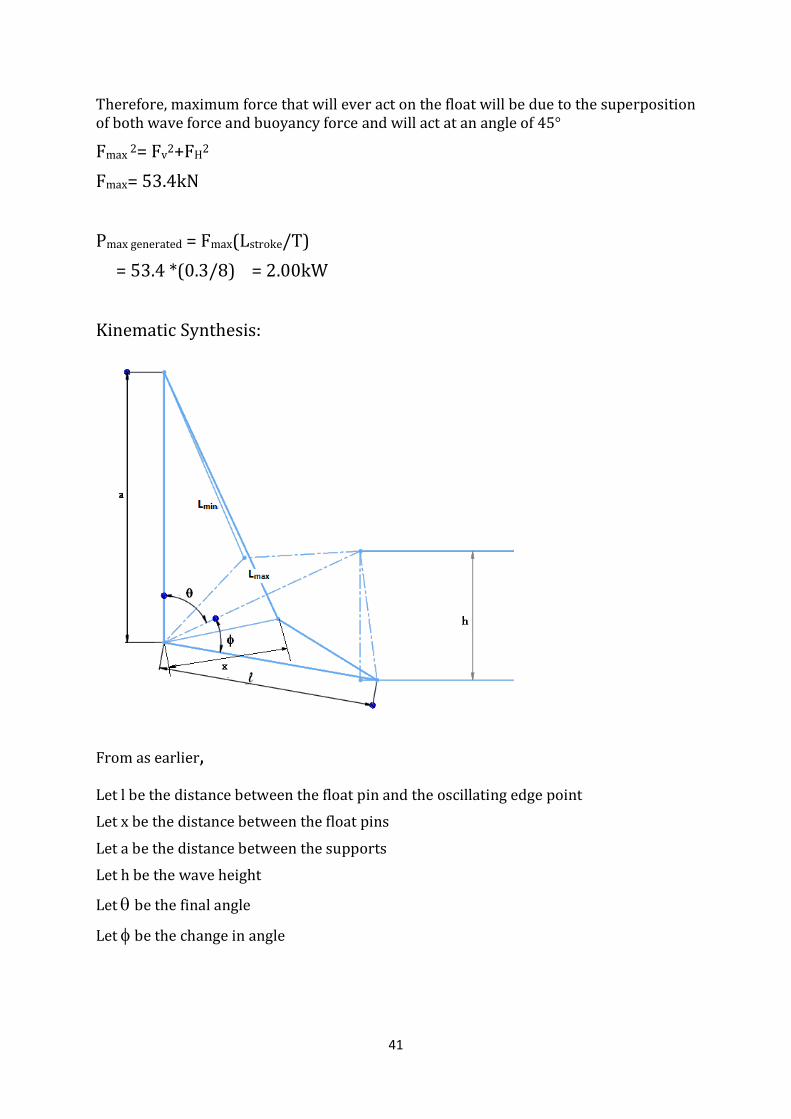
Therefore, maximum force that will ever act on the float will be due to the superposition of both wave force and buoyancy force and will act at an angle of 45°
Fmax 2= Fv
2+FH2
Fmax= 53.4kN
Pmax generated = Fmax(Lstroke/T)
= 53.4 *(0.3/8) = 2.00kW
Kinematic Synthesis:
From as earlier,
Let l be the distance between the float pin and the oscillating edge point
Let x be the distance between the float pins
Let a be the distance between the supports
Let h be the wave height
Let be the final angle
Let be the change in angle
42
We have initial conditions as
1. + ≤ 80 (otherwise the float will bend down n become vertical)
2. l ≤ 1m (to facilitate construction and should be as small as possible) 3. h varies from 0.5 to 2m seasonally (we took h= 1m for calculations)
l * tan () = h* sec (90- )
→l = h *
→l =
Tabulating values of length as a function of h for various possible &
L
45 55 .9902h 50 50 1.095h
55 45 1.2207
60 40 1.37h
65 35 1.5757h
70 30 1.84h
80 20 2.78h
Here, we get the best values =45 & =55
Thus we take l =.9902* 1
l =9902mm~ 1m
Inserting in equations below & solving for stroke length, L= Lmax- Lmin, which is the length of the stroke of the linkage.
Using cosine rule, we have
cos+ =
(angle at lowest point)
cos =
(angle at uppermost point)

43
For =45 & =55, a=2
x Lmax Lmin stroke 0.9 2.3313 1.5048 0.9902 0.8 2.2794 1.5418 0.7376 0.7 2.2307 1.5843 0.6464 0.6 2.1855 1.6318 0.5537 0.5 2.1441 1.6839 0.4602 0.4 2.1066 1.7402 0.3664 0.3 2.0732 1.8004 0.2728
=45 & =55
x lmax lmin stroke 0.9 1.8785 1.072 0.8065 0.8 1.8184 1.0922 0.7262 0.7 1.7619 1.1203 0.6416 0.6 1.7015 1.1563 0.5452 0.5 1.6614 1.1997 0.4617 0.4 1.6181 1.2495 0.3686 0.3 1.5799 1.3052 0.2747
For =45 & =55, a=1
x lmax lmin stroke 0.9 1.4553 0.7329 0.7224 0.8 1.3834 0.7131 0.6703 0.7 1.3151 0.7071 0.608 0.6 1.2511 0.7151 0.536 0.5 1.1921 0.7368 0.4553 0.4 1.1388 0.7709 0.3679 0.3 1.0921 0.8159 0.2762
With all trial and error, we finalise with
=45, = 55, x = 500mm, a = 1000mm
We get,
L max = 1192mm
L min = 0736mm

44
Stoke length = L= 455mm 0.45m
Using, this dimensions, we can restrict the size of the entire mechanism to near 1m3
Dimensions of the float:
Length: 1m
Width: 1m
A=1m
X=0.5m
Height: 0.25m

45
3.5.3 FORCE ANALYSIS
3-14: Force analysis of wave energy convertor design
Let FA is the force acting tangential to float curvature at pt A somewhere midway on the curvature and FB is the force acting tangential to OB at point B then
The force FA will be maximum when Fmax acts directly on the curvature.
FA = 50 cos (35) kN
We have, Mo= 0
FA * OA + FB * OB = 0
FB = - FA *
= 51*cos (35) *
FB = - 71.02kN

46
Force FB acts perpendicular to link OB. The negative sign shows that the force is reaction force at B (acting in downward direction) to attain equilibrium.
Hence the actual force acting at point B is in upward direction.
3-15: Line diagram of wave energy convertor for purpose of Force analysis
Figure shows various Forces acting on the links
So, now we have three concurrent forces acting at point B.

47
3-16: Force diagram
Let FBC be the Force acting in the direction of link BC (the piston).
Let FBO be the Force acting in the direction of link BO.
From Lami’s Theorem for 3 concurrent forces we have,
FBO = - 23.53kN (Reaction at pin O)
FBC = 74.83kN (Force on Piston)

48
3.5.4 DESIGN ANALYSIS
DIMENSIONS OF PINS
We consider all the pins of same configuration to facilitate easy manufacturing.
Let outer diameter of pin be 30mm
Using steel of, t = 400MPa, taking FOS = 2, D=30mm, F = 75kN
s
d=20.55mm
Adopt d = 20mm
DIMENSIONS OF PISTON
Force on the piston = 75kN
Using steel of t = 400 MPa, FOS = 4
t= 4F/d2
d2 = 955.41
d = 30.91mm
Adopt d = 35mm
SIZING OF CYLINDER
The minimum acceptable internal diameter considering the maximum pressure build
inside the cylinder as 10MPa due to trapping of fluid in the cylinder is given by Di,
Pressure,
Di=97.75mm
Adopt Di= 100mm
For cylinders, bursting pressure,
Also, (WP= working pressure)

49
BP= 8*10= 80MPa
t =10 mm
Adopt t = 10mm
Di= 100mm
t=10mm

50
Chapter 4 :
SYSTEM ANALYSIS & HARDWARE VERIFICATION
4.1 INTRODUCTION
With the design of the wave energy convertor ready, its analysis for performance verification becomes a necessary. This is because of various inefficiencies that are inherent in the design that can affect the adversely affect the performance of the system. The two major components of the system to be tested are its two fundamental sub systems:
i. The wave convertor comprising of the float & the connecting linkages ii. The energy conversion mechanism comprising of the fluid power circuit &
the electrical energy generator mechanism. The project planned to test the performance of these two major sub-systems independently to aid ease of testing & increase accuracy of measurement of test parameters.
4.2 LAB TESTING
The 2 components were assembled for lab testing.
4.2.1 WAVE ENERGY CONVERTOR The model of the wave energy convertor was built to scale to be tested in simulated conditions. The model was built to:
i. Verify the feasibility & force calculations that were done
ii. Find out the most effective float profiles amongst rectangular, semicircular & exponential shapes.
4-1: Model of wave energy mechanism test model
The model was built as per the following dimensions:

51
4-2: Technical Diagram & dimensions of wave energy convertor test model
52
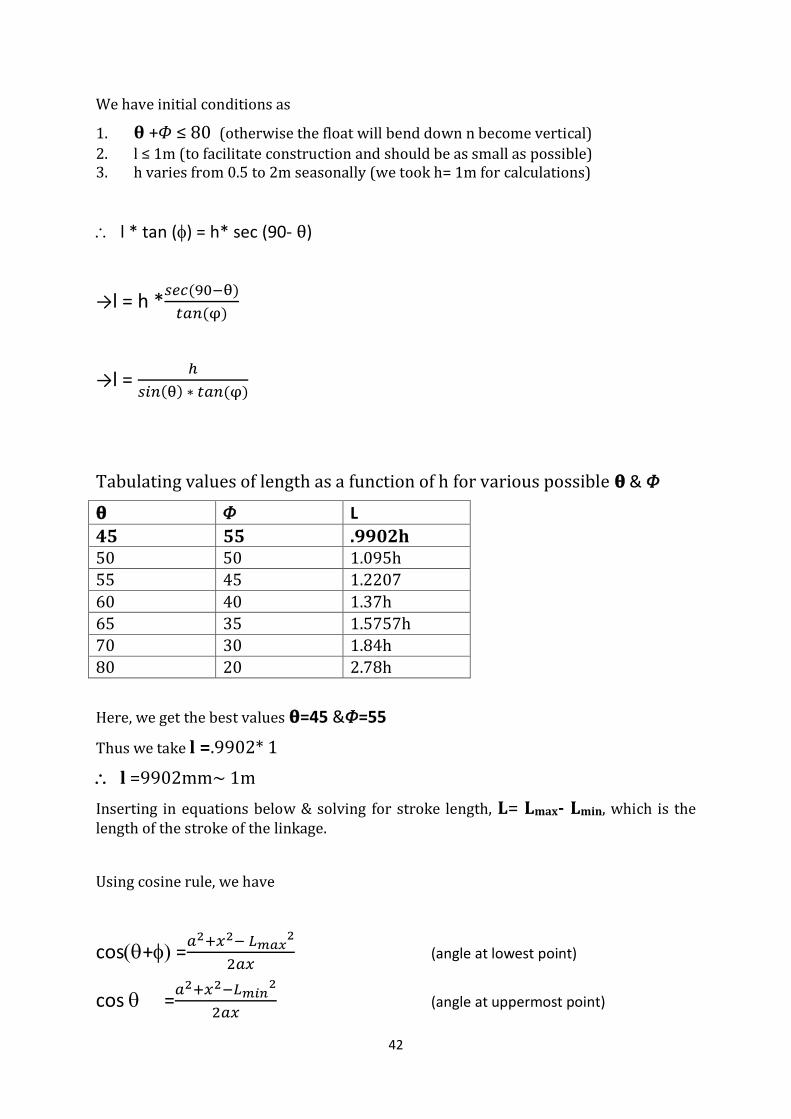
The model was subjected to simulated wave conditions and the results were as below.
Sr. No.
Float Profile
Spring Constant
(K)
(N/m)
Avg. Wave Height
(m)
Avg. Spring Deflection Observed
(m)
Avg. Force Exerted by Waves
(N)
Avg. Force Converted by Convertor
(N)
1 Rectangular 272.5 0.18 0.046 47.6766 12.535 2 Semi-Circular 272.5 0.18 0.055 47.6766 14.9875 3 Exponential 272.5 0.18 0.058 47.6766 15.805
From the above observations & subsequent calculations, it can be concluded that an exponential float profile is the most suitable for use with a wave convertor.
4.2.2 ENERGY CONVERSION MECHANISM
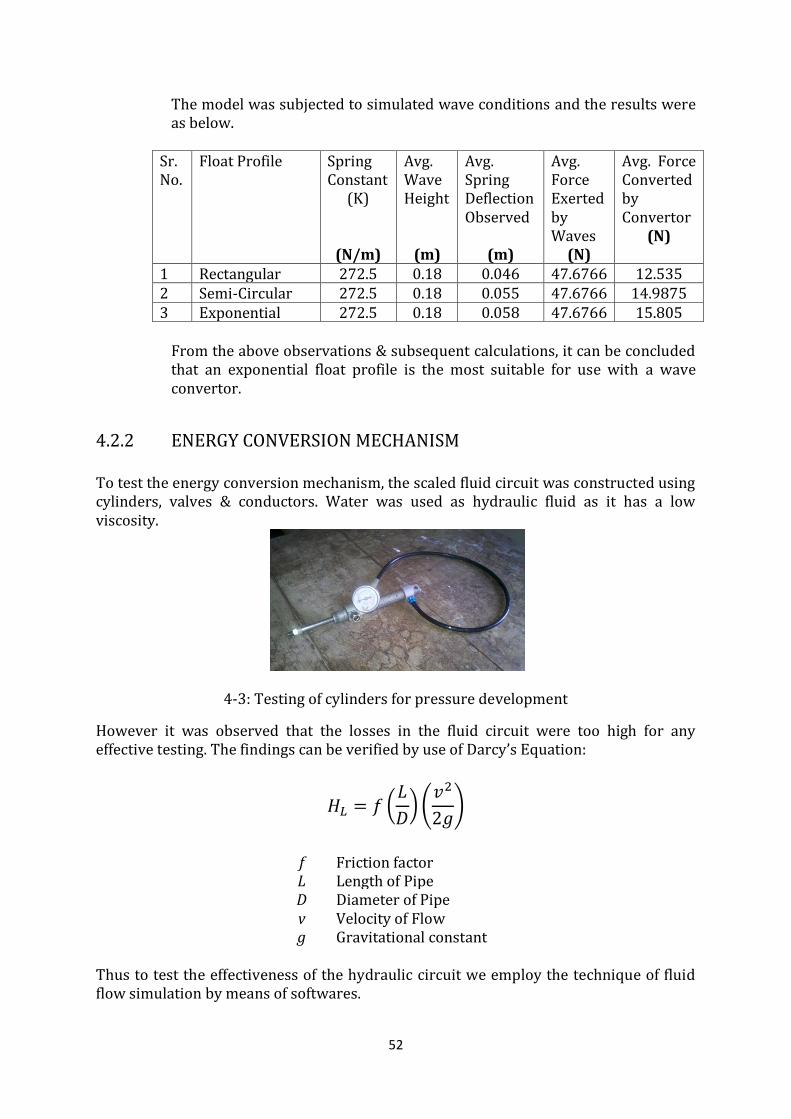
To test the energy conversion mechanism, the scaled fluid circuit was constructed using cylinders, valves & conductors. Water was used as hydraulic fluid as it has a low viscosity.
4-3: Testing of cylinders for pressure development
However it was observed that the losses in the fluid circuit were too high for any effective testing. The findings can be verified by use of Darcy’s Equation:
f Friction factor L Length of Pipe D Diameter of Pipe v Velocity of Flow g Gravitational constant
Thus to test the effectiveness of the hydraulic circuit we employ the technique of fluid flow simulation by means of softwares.

53
4.3 SIMULATION
We use SolidWorks 2010 FloXpress for simulation of flow. We simulate the following:
i. Flow of fluid from cylinder into conductor under action of force exerted during the wave convertor’s power stroke.
ii. Flow of fluid in the convertor.
i. Simulation of flow from cylinder into conductor under pressure
Here we simulate flow in cylinders with different configurations & outlet size & positioning. Elaborating;
a. The primary parameter to be simulated is the d/D ratio i.e. ratio of outlet
diameter to cylinder diameter.
b. The second is the positioning of the outlet of the cylinder; axial or radial.
The simulation yields in the following results:
I. With Variation of d/D ratio for axial outlet:
4-4: Simulation of Flow through from a cylinder to conductor with axial arrangement of
conductor

54
II. With Variation of d/D ratio for radial outlet:
Losses through the conductors can be calculated with the help of Darcy’s Equation.
ii. Simulation of fluid flow through convertor
Simulation of fluid flow through a convertor (in this case a hydraulic motor) is beyond the scope of this project due to its complexity & high computational resource requirements. Losses can however be determined by using the data sheets & specifications of the motor in use provided by the manufacturer.
4-5: Simulation of Flow through from a cylinder to conductor with radial arrangement of conductor

55
4.4 RESULTS & DISCUSSIONS
From the observations made above the following results can be summarized as below. From the lab model of the wave convertor mechanism & its related calculation, the following conclusions can be drawn:
i. The wave convertor can efficiently convert the energy of the waves into desired form.
ii. The exponential float profile can convert the wave energy most effectively & efficiently.
From the simulation of the energy conversion mechanism, the following conclusions can be drawn:
i. The increase in d/D ratio i.e. diameter of the cylinder to that of the conductor decreases the resistance to fluid flow.
ii. Axial arrangement of conductor gives far lesser resistance to fluid flow than a radial attachment of conductor to the cylinder.

56
Chapter 5 :
CONCLUSION
From the observations, calculations & experimentation the following conclusions can be
made:
1. Wave power along the coast has a high power density.
2. Wave power can be used as a reliable source of energy.
3. Many possible mechanisms can be used to convert wave energy into a usable &
useful form of energy.
4. Careful design & selection of components is necessary for the effective & efficient
running of the wave energy convertor.
5. Owing to the variable nature of wave heights, time periods & other characters,
wave energy convertors should be coupled with inverters to ensure a steady
supply of electrical energy at the output.
6. Due to the tidal variations of sea level, provision should to account for the
difference in water heights.
7. Wave energy convertors can be used alongside other renewable energy sources of
energy.

57
Chapter 6 :
FUTURE WORK
As we proceed into the future, the global energy requirements will continue to rise at a
large & every increasing rate. Hence it is important to develop methods to harness
previously untapped sources of energy. A vast amount of energy is available in the
ocean & a significant portion of that energy is available on-shore. New & more advanced
mechanisms can be developed to harness the energy available on-shore. Furthermore, a
greater amount of energy is available further out at sea in various forms who’s
harnessing needs to be looked into.
This project can be further developed. A small scale working model can be built using
data collected at a point. Further, the model once built & tested can be integrated into
the local energy supply system. As per the analysis done, usage of custom made parts &
components in necessary in order to improve efficiency & decrease losses at various
stages. Thus arises the need to look into development of new & more suited
components for the purpose of ocean energy conversion. Further research &
development is required for efficient harnessing of ocean wave energy out at sea apart
from other forms of ocean energy.
Ocean energy is one of the largest sources of untapped energy. If researched &
harnessed, ocean energy can possibly help solve the world’s energy requirements if
tapped efficiently & effectively.

58
REFERENCES
Ocean Wave Energy Conversion, by Jennifer Vining, Advanced Independent Study
Report Electrical and Computer Engineering Department University of Wisconsin – Madison, December 2005
Wave statistics around the Indian coast based on ship observed data by P Chandramohan, V. Sanil Kumar & B. U. Nayak, NIO, India.
Wave power as a source of energy along the Indian Coast by V Kesava Das, NIO, India.
Herbich, John B. (2000). Handbook of coastal engineering.
National Energy Map for India: Technology Vision 2030, TERI
Load Generation Balance Report , 2011-12, Central Electricity Authority
Analysis of energy trends in the European Union & Asia to 2030, Technology development prospects for the Indian power sector, Information
paper by Uwe Remme, Nathalie Trudeau, Dagmar Graczyk & Peter Taylor, International Energy Agency