
Project Management Notes
145
PROJECT MANAGEMENT BM 404 STUDY NOTES 0
Transcript of Project Management Notes

PROJECTMANAGEMENT
BM 404
STUDY NOTES
0

A. MAFUKAMIDLANDS STATE UNIVERSITY DEPARTMENT OF BUSINESS MANAGEMENT2005
PROJECT MANAGEMENT
CHAPTER 1
Introduction: Overview of project Management
1. WHAT IS AN INVESTMENT?
It is the current commitment of dollars for a period of
time in order to derive future payments that will
compensate the investor for
1. The time the funds are committed
2. The expected rate of inflation
3. The uncertainty of the future payments.
2. WHO IS AN INVESTOR?
Investor can be an individual, a government, a pension
fund or corporation. The investor is trading a known
1

dollar amount today for some expected future stream of
payments that will be greater than the current outlay.
- Investors invest to earn a rate of return,
which compensates for the time, the expected
rate of inflation and the uncertainty of
return.
3. Investment choices are a function of a investor’s risk
appetite.
Factors like
Inflation rate, interest rate
Financial stability
Political – country risk
Legal and regulatory consensus
Liquidity needs and time horizon
Tax concerns
Time horizon – short term cash (liquid)
Tax concerns – taxable income (VAT)
Unique needs + personal preferences
Critical skills
Infrastructure
2

4. Organisations/institutions that promote development:
Zimbabwe Investment Centre (ZIC)
Zimbabwe Development Bank (ZBD)
Small Enterprises Development Corporation (SEDCO)
Industrial Development Corporation of Zimbabwe
(IDC)
Department of small and medium Enterprise (SMES)
Ministry of Youth and Gender (MYG)
Welfare Organizations (NGO)
-What are the functions?
-What are the objectives?
-What is the structure?
-What are the rules and regulations for the
project requirements?
-Is the role of project development being
met?
PROJECT ENVIRONMENT
a) Project environment needs to be analysed, understood and
addressed if project is to be implemented successfully.
3

b) Project environment provides managers with a structured
approach to analyzing and handling possible external
constraints
c). There must be continued interaction between the project
and its environment, and the project itself affects the
environment just as it in turn is affected by it, so that
there is a two –way relationship between them.
Physical environment:
Refers to the natural setting of the project, its
geology, soils, landscape, climate, water resources and
ecological systems
Many projects are sited in a particular location and
surrounded by a specific physical setting. Sometimes
this setting is the very reason why the projects exist
e.g. mining project is established precisely to exploit
deposits in physical environment, agricultural projects
exist to maximize potential of the natural physical
environment for agricultural production.
Technologies:
4

Technologies utilized for the exploitation or conservation
of the natural resources. Availability –provision of these
technologies is a key dimension of the project environment.
Economic and Financial management:
Projects utilize resources to create assets. Resources
utilized have a cost and these assets created have a value.
Relative costs and values (worth of the projects) are
directly affected by the economic and financial environment
within which they are implemented . Such issues as
budgetary constraints, foreign currency shortages, price
controls, inflation, interest rates are constantly reviewed
in order to complete project at stated cost, using resources
to be acquired. Cost-over-runs often associated with time
delays are very frequently encountered- and these are caused
by constraints of the economic and financial environment.
Institutional and political environment:
Institutional framework concerns such matters as the
legal systems within which project managers are
operating and aspects of social organization such as
the land tenure and water rights system
5

Formal/less formalized organizations are crucial
determinants of project outcome:
Formal: government departments,marketing and credit
institutions, local authorities have clear terms of
references
Less fomalised but official organizations- village level
committees, political groups, religious institutions may
be as important
Political framework in the project environment needs to
considered. Projects necessarily reflect the political
priorities of the country within which they are
implemented. Politics determine the progress of any
project.
Project managers need to be political –need to lobby,
negotiate, use influence to gain political support for
their project. The political environment surrounding a
project involves a complex web of political relationships
which extends beyond individuals to organizations and
geographical areas.
Socio-cultural environment:
6

People –orientated projects e.g most agricultural
projects, health,education and welfare
projects,urban housing, water supply, rural
industrialistion projects are implemented through
people who are not directly part of the formal
project organization
Project organization provides resources, training
services and infrastructure to the population
For the project to be successful, its objectives
will need to be consistent with values and practices
of those people it is designed to assist
It is vital for project personnel to be sympathetic
to the local culture and to have an understanding of
“why things are done the way they are.”
DISCUSSION:
1. Critically analyse the business operating
environment of a project you are familiar with.
What are the prospects of its success? Why?
What are the areas of improvement, if any,
7

would you recommend to the project sponsors for
it to be a success?
2. Examine any one of the
organizations/institutions that promotes
project development. To what extend is it
fulfilling its role in the current economic
environment?
CHAPTER 2
NATURE OF PROJECTS
What is a project?
Definition:
a) It is a collection of linked activities, carried
out in an organized
8

manner with a clearly defined start(ing) point and
finish(ing) point
to achieve some specific results that satisfy the
needs of an organization as derived from the
current business plans.
b) It is organization of people and resources to meet
objectives
c) It is the investment of capital in a time – bound
intervention to create productive assets.
2.2 Characteristic features of a project:
Involves new and unknown tasks
It is an instrument of change (has elements of
risk)
It has clearly defined start and finish dates
It has specific aims
It should result in something being delivered
It is the responsibility of a project manager/
management team
It involves costs, resources and time (subject
to strict deadline)
9
It leads to a change in people’s daily work or
living conditions
Requires the right people at the right time but
people of different backgrounds who are not
used to working together.
Examples of a project
Writing and publication of a book
Relining of a blast furnace in steel works
Setting up a new department at a University
Supporting of a self help efforts of a rural
community
Technical projects: construction of bridges, dams,
water pipe line
Introducing a new product
Organizing a trade fair.
Projects in Midlands
Unki platinum mine project
Relocation of Mtapa long distance bus terminus
10
Construction of MSU administration Block
2.3 PROJECT MANAGEMENT
Definition
a) The dynamic process utilizing the appropriate
resources of the organization in a controlled and
structured manner, employed to achieve a change
clearly defined with specific objectives
identified as strategic needs.
Characteristic features:
- Objective oriented – without these you have
no outcomes
- Change oriented – creating something you need
but do not have.
- Multi disciplined – needs a wide range of
skills to achieve success
- Opportunistic – you must seek to take
shortcuts and bypass old norms
11
- Performance oriented – setting appropriate
standards and quality of outputs
- Control oriented – carefully designed
controls to maintain the schedule
- Avoid getting trapped by the old ways of
doing things.
b) Project management is a tool for management to manage
organization:
Interfaces between organization and its
environment to achieve
stated goals Interfaces within an organisation
2.4 Sources of projects:
1. Corporate and strategic plans/business plans
2. Normal operations/ step changes
3. Continuous improvements/ programmes cross functional
4. Growth by projects addressing needs/ opportunities
5. Growth by incremental change of quality/performance
12
2.5 LIFE CYCLE OF A PROJECT
All projects go through similar life cycle,
comprising the following phases namely:
Phase1: Idea generation and screening the idea
It is done through feasibility study ie
whether to go for the project or
not(prefeasibility Go/and No Go)
-Needs are clearly identified and project is
defined with agreement of those people with
an interest in the outcomes
-Also called conception and definition stage
-Organization realizes that a project may be
needed or receives a request from a customer
to propose a plan to perform a project.
Phase 2: feasibility study: Project formulation
-Looks at techno-economic design stage
aspects of the project
13
-Looks into such issues like location,
finance, commercial, institutional
preliminary organizational/set up, economic
financial aspects.
-Also termed project formulation/design
stage.
-Here the planning phase becomes critical to
derive a realistic schedule and budget taking
into account the constraints imposed on the
project
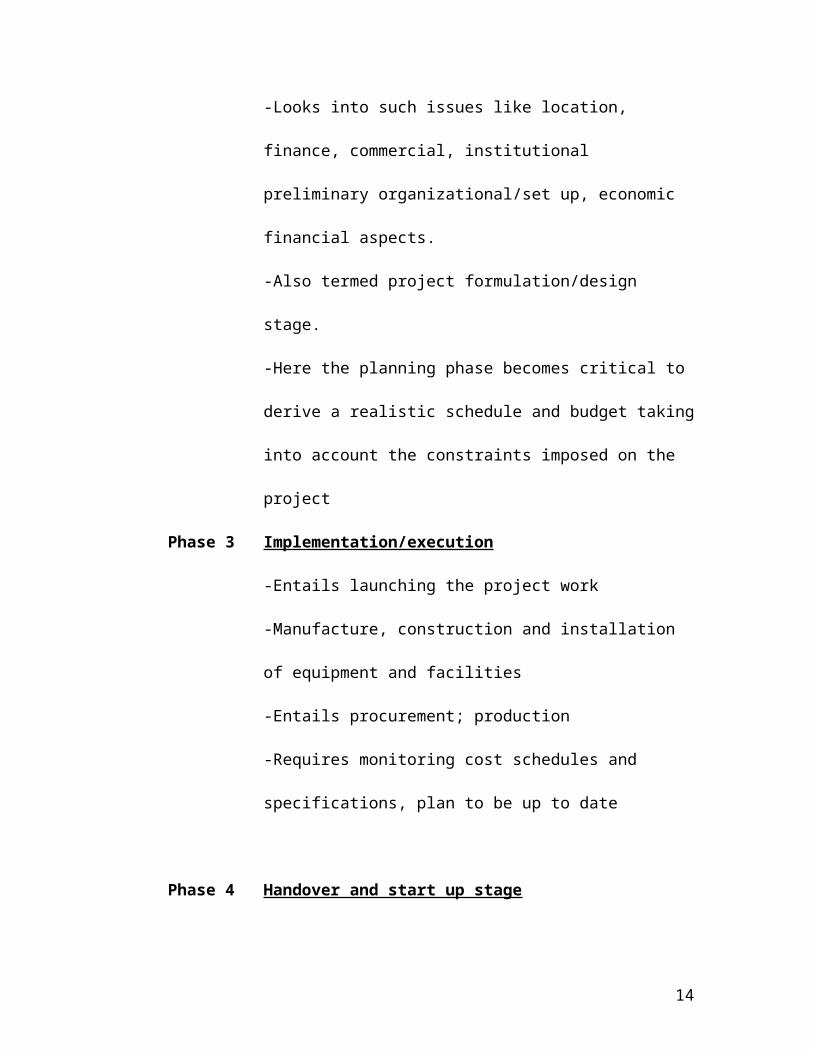
Phase 3 Implementation/execution
-Entails launching the project work
-Manufacture, construction and installation
of equipment and facilities
-Entails procurement; production
-Requires monitoring cost schedules and
specifications, plan to be up to date
Phase 4 Handover and start up stage
14

- Preparing customer for acceptance and
handover to ensure the project can deliver.
Any follow- up activities are identified and
assigned and project evaluation is completed
Phase 5 Post project evaluation
done after project is handed over to the
customer. It provides data for future
projects.
Contents of a project report(proposal)
15

1. INTRODUCTION:
-purpose
-scope(limits)
2. EXECUTIVE SUMMARY
-executive highlights
-summarises completed project report
-findings
-decisions
3. CONCLUSIONS/RECOMMENDATIONS
4. PROJECT DESCRIPTION
General objectives
Specific objectives
-market analysis
Product/service description
Market position
Competition and marketing strategy
Project structure
Work breakdown structure
Work packages
Project costs
16

Capital and expense requirements
Financial plan (project budget)
Contingencies
Economic and financial analysis(viability)
Risk and sensitivity analysis
Schedule
Time estimates
Calendar schedule
Bar chart schedule
Network
List of activities
Arrow diagram
Resource allocation
Resource type
Resource availability and constraints
Control systems
Project evaluation methods
Cost control
Cost minimizing (time/cost trade offs)
Status report
17

Milestones
ORGANISATION AND ACCOUNTABILITY
Management capacity
Labour /employee plan
Responsibility/accountability matrix
Procedures
Special conditions/contractual
aspects
APPENDIX
Reference material
Calculations
Curriculum vitae (cv)
NB a project plan (report) varies from organization to
organization but any project must contain most of the
above elements.
18
CHAPTER 3
3.0 PROJECT ORGANISATIONAL STRUCTURE -
Hierarchical structure: organizational chart
Appropriate for very large, long-term projects which
work on isolated tasks and are staffed mainly by full
time employees.
Is not appropriate when project is to be integrated
with the base organization.
Advantages
Functional specialists easily share their knowledge and
normally work together.
Easier to implement work rules and regulations for a
group of similar functional experts.
Share a commonality of perspectives that will help the
main thrust of a project.
19
Disadvantages
Disadvantages of organizational projects according to
hierarchical structure
Does not develop technology useful for the future.
Minimal career continuity for project personnel.
It often leads to:-
- bureaucracy
- inefficiency
- poor use of resources
- collapse of authority or the project usurping
responsibility it should not have.
- Little commitment from people outside the
project
- Little informal contact between the project
and its surroundings
MATRIX STRUCTURE
20

Can be on full or part time basis. It is a high breed
organization. It is characterized by having a pull of
project managers who will be assigned to projects. It
comprises of :-
- Core team members with previous experience
who are not necessarily drawn from across the
functional structures.
- Extended team members who are drawn from
across functional structures and do a
specific part of a job for a relatively short
time.
Advantages
Response to changing needs is very rapid.
Functional experts are more part of a team and are
more focused on project deliverables.
Team members have a functional department to
return to after the project.
Their respective departments look after careers
and specific development needs.
21

Disadvantages
There can be conflict between functional line
managers and project managers over the deployment
of resources.
If the team is not physic ally located in the same
area in a building, communications and control
becomes a difficulty.
Matrix structures are frequently hindered by
accusations of poor accountability and lack of
clarity in responsibilities.
Project organization
It is based on assigning projects to each organizational
unit (department). The project make contribution to
corporate strategy. Senior management is involved in
project process and has defined roles and
responsibilities. Senior management sponsor projects and
have authority i.e. ownership over projects. Project
sponsors can form project steering team.
22

Advantages
- It ensures everyone in the organization
focuses on important active projects.
- The reporting structure is clear
- It priotises project for limited resources
- Reaction to market changes if rapid as
authority exists in project team
- Functional specialists work with project
managers
Disadvantages
- Duplication of functional experts will exist
across the organization as they are each
dedicated to a single project.
- There is a lack of information exchange
between functional experts as they are
located in different parts of the
organization.
23
Project sponsor (owns, commissions the project, chairs
PST)
The project sponsor for any project is accountable (to
the PST) for the performance of their projects and must
demonstrate their concern for success to everyone
involved. Responsibilities include:
Ensuring project objectives are always aligned
to corporate needs;
Selecting the project manager;
Approving the project definition;
Sustaining the project direction;
Ensuring priorities are maintained for all
their projects;
Overseeing the project process and procedures,
budget and control; finds and wins resource(s)
for the project
Reacting promptly to issues escalating to them
for decisions;
Maintaining support and commitment;
24

Approving project plans, changes and status
reports.
Project steering team (created by project sponsors has
representatives from business + technical functions + user
community)
This group of project sponsors – the project steering team
(PST) – meets at regular intervals to review the status of
all active projects, initiate new projects and decide the
prioritization of project activity in the organization.
Responsibilities include:-
Ensuring projects are aligned to corporate
objectives;
Giving strategic direction;
Maintaining focus on customer and business needs;
Ensuring environmental influences are taken into
account (internal and external);
Prioritizing all active projects and their
resourcing;
Resolving escalating issues;
25
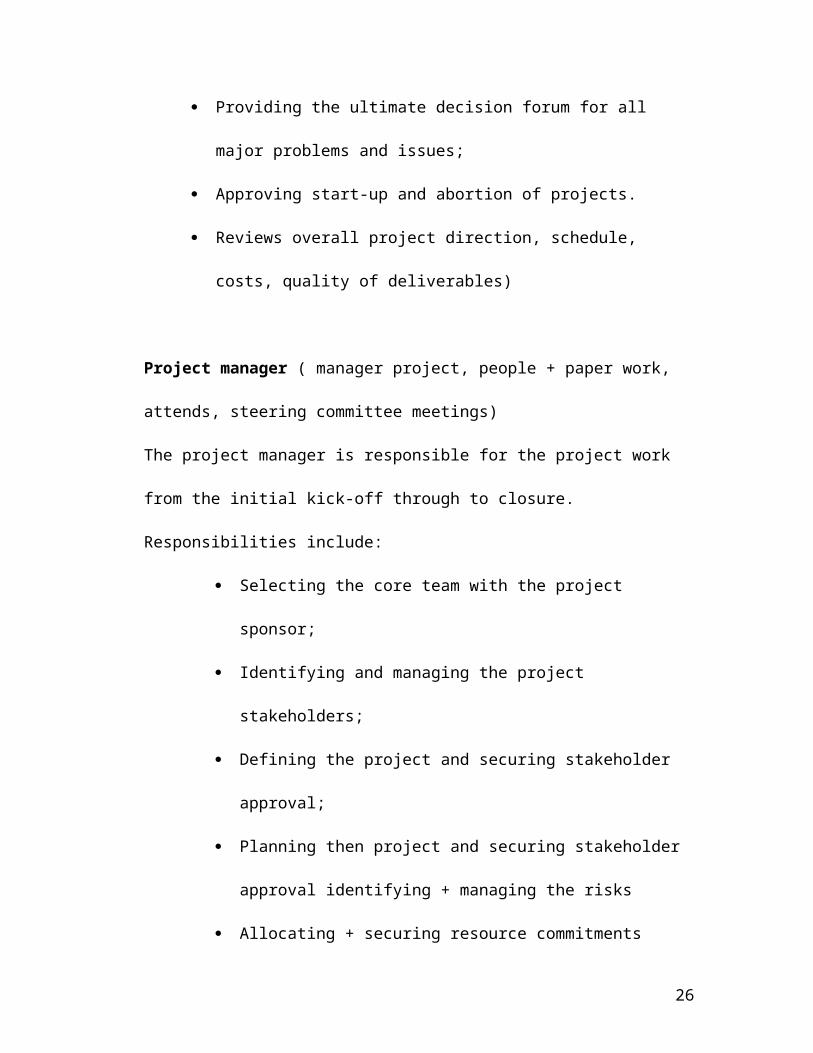
Providing the ultimate decision forum for all
major problems and issues;
Approving start-up and abortion of projects.
Reviews overall project direction, schedule,
costs, quality of deliverables)
Project manager ( manager project, people + paper work,
attends, steering committee meetings)
The project manager is responsible for the project work
from the initial kick-off through to closure.
Responsibilities include:
Selecting the core team with the project
sponsor;
Identifying and managing the project
stakeholders;
Defining the project and securing stakeholder
approval;
Planning then project and securing stakeholder
approval identifying + managing the risks
Allocating + securing resource commitments
26

Monitoring and tracking project progress
Solving the problems that interfere with
progress
Controlling costs
Leading project team
Informing stakeholders of progress status
Delivering the project deliverables + benefits
Managing performance of everyone involved with
project
Project Manager’s deliverables
i.e The physical items to be delivered from a project.
This typically includes reports and plan as well as
physical products and services project deliveries a
product or service.
Terms of reference or project definition
Milestone plan
Budget
Work breakdown structure
Project organization chart
27

Responsibility
Task definitions
Deliverable definitions
Deliverablee definitions
Quality plan
Dependency chart
Progress reporting standards
Change control standards
Lost of planning + estimating assumptions
Gantt chart
Progress reports
End of phase reports
Project review report
Project Team
Successful teams have to be built through effective
leadership + commitment
Criteria for selecting team members
Relevant technical experience/specialized
knowledge are essential to project.
28

Have worked in project team before i.e have
experience
Assets current non project work load
Do they get on easily with other people
Are they good team players
Is line manager in agreement with possible
assignments.
Project member
Technical expert qualified to complete project
tasks
Gives regular feedback on progress to project
manager
Focuses on delivering quality contributes to
teamwork and morale
CHAPTER 4
4.0 PROJECT PLANNING
“íf you fail to plan: you prepare to fail”
29
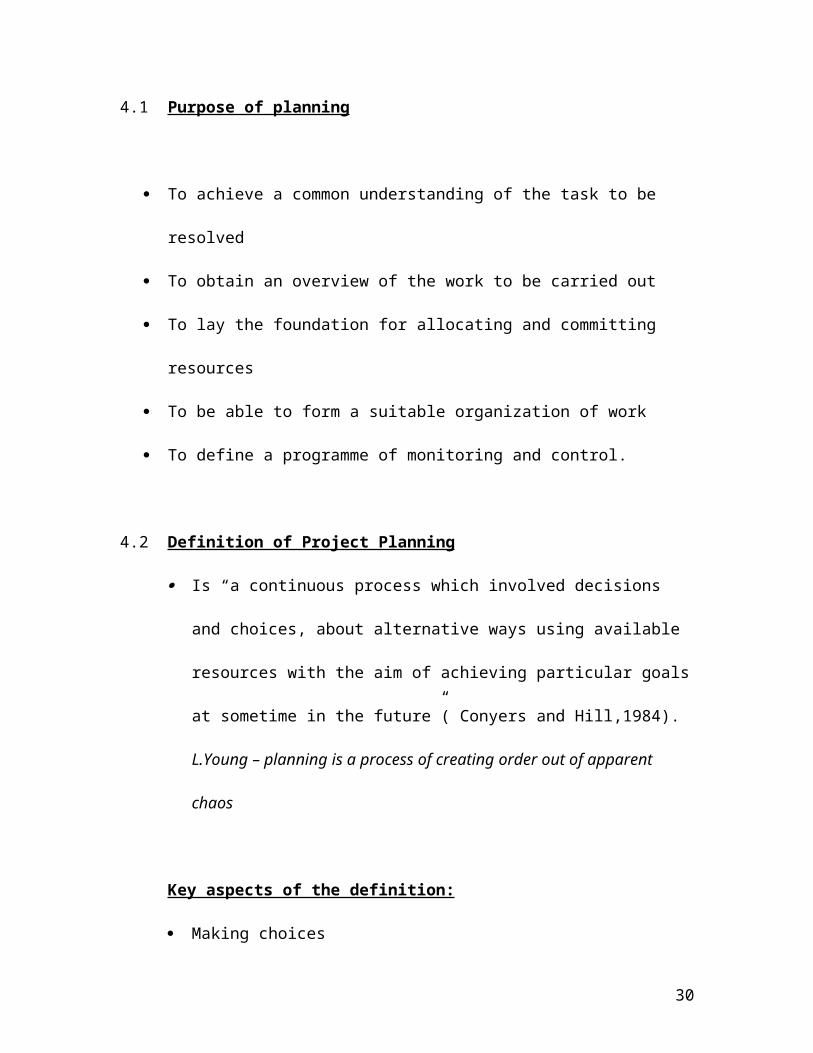
4.1 Purpose of planning
To achieve a common understanding of the task to be
resolved
To obtain an overview of the work to be carried out
To lay the foundation for allocating and committing
resources
To be able to form a suitable organization of work
To define a programme of monitoring and control.
4.2 Definition of Project Planning
Is “a continuous process which involved decisions
and choices, about alternative ways using available
resources with the aim of achieving particular goals
at sometime in the future”( Conyers and Hill,1984).
L.Young – planning is a process of creating order out of apparent
chaos
Key aspects of the definition:
Making choices
30

Concerning use of limited resources
To achieve given goals and objectives
Pertaining to some future time
NB: Goal – aim or objective towards which an endeavor is directed.(simply
objective)
4.3 Project planning involves stating
Why a project should be undertaken
What should be done and
By whom, in order to achieve well-defined objectives
by some future dates.
4.4 Products of planning
Plans consisting basically of graphics and text e.g.
graphics – include charts, logic diagrams, sketches
and in some cases photographs
Texts include narratives and tables.
Logic of planning = plan.
List of what jobs (activities) have to be done and
the order of carrying them out.
31

4.5 Planning cycle and project cycle
Like project cycle, planning cycle is made up of three
main elements:
1. Clarity problems to be solved
2. Set out objectives and
3. Draw up the project plans
4.6 Planning procedures:
(i) Establish objectives
State objectives – derived from requirements
(problems that motivated the project
List interim objectives or milestones – these are
significant events in meeting the main objectives
Designate responsible personnel or departments
- These are important groups whose
participation in planning and scheduling are
required for successful project
implementations. These participating
32
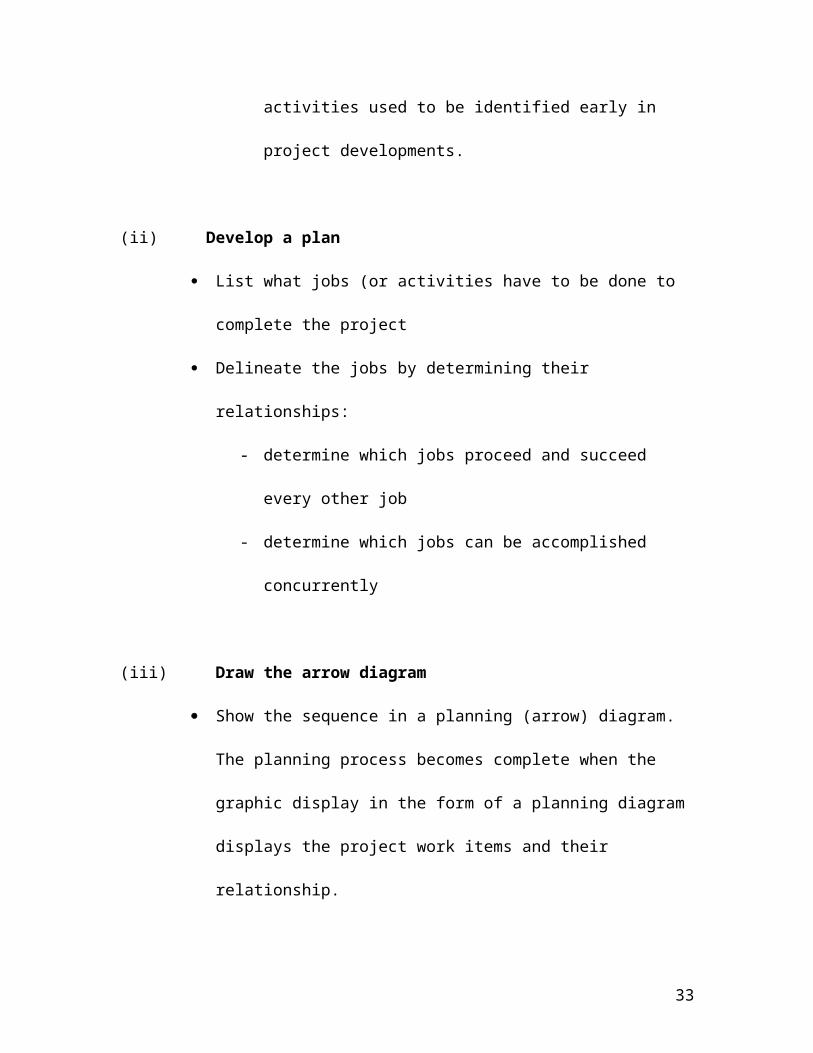
activities used to be identified early in
project developments.
(ii) Develop a plan
List what jobs (or activities have to be done to
complete the project
Delineate the jobs by determining their
relationships:
- determine which jobs proceed and succeed
every other job
- determine which jobs can be accomplished
concurrently
(iii) Draw the arrow diagram
Show the sequence in a planning (arrow) diagram.
The planning process becomes complete when the
graphic display in the form of a planning diagram
displays the project work items and their
relationship.
33

4.7 Obstacles to project planning
4.7.1 Network planning Techniques
Network analysis(planning)
This is a graphic analysis of the project showing
the plan of action through the use of a graphic
diagram (used in project planning)
Network planning techniques
Common ones include:
4.7.2 Critical Path Analysis/Critical Path Method CPA/CPM
Developed by Rand corporation and Du Pont
to improve the planning, scheduling and
controlling of projects(as a means of
scheduling shutdowns regular shutdowns at chemical
processing plants)
4.7.3 Programme Evaluation Review Technique(PERT)
Developed from work involving the US Navy for
planning, coordinating the projects associated
with the development of the missile programme
34
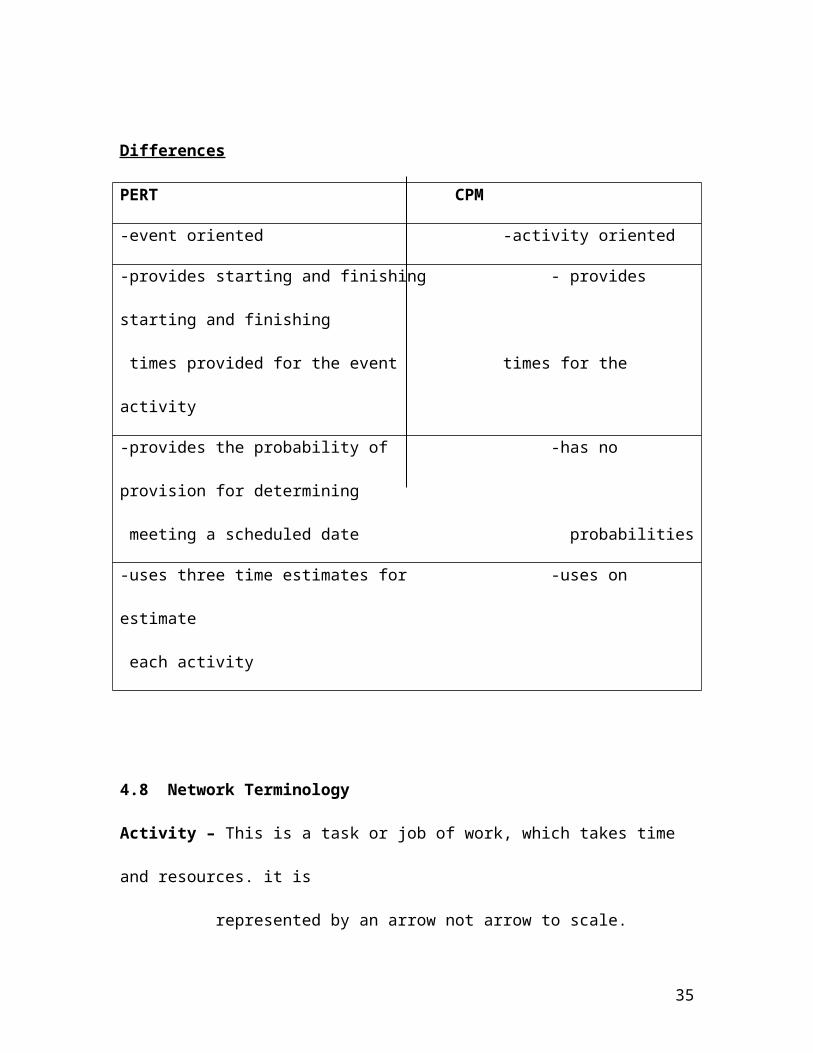
Differences
PERT CPM
-event oriented -activity oriented
-provides starting and finishing - provides
starting and finishing
times provided for the event times for the
activity
-provides the probability of -has no
provision for determining
meeting a scheduled date probabilities
-uses three time estimates for -uses on
estimate
each activity
4.8 Network Terminology
Activity – This is a task or job of work, which takes time
and resources. it is
represented by an arrow not arrow to scale.
35

Tail of Head of the arrow arrow -Indicates where Where task ends Task beginse.g Build a wall
- Verify debtors in a sales ledger.
a) What activities are involved in the project.
b) Establish their logical relationship i.e which activity
comes after or before.
c) Establish the estimate of time that the activity is
expected to take.
EVENT- It is a just in time, it indicates the start or
finish of an activity or
activities. It is represented in a network by a
circle or node.
36

Establishing of activities automatically determines events
which are the start of finish if activities e.g wall bulk,
debtors verified, arrived city.
Dummy Activity – It is an activity that does not consume
time or resources. It is a fictitious activity with zero
activity time used to create a PERT or CPM network. It is
used merely to show clear logical dependents between
activities so as not to violet the rules for drawing
network.
It is represented is a network by a dummy activities are not
usually listed with led activities may become necessary as
the network is drawn.
CONCURRENT ACTIVITY – They are activities as tasks that are
designed to be carried out in parallel i.e at the same time.
37

SERIES ACTIVITIES – are activities or tasks that are
designed to be carried out are after another each strictly
dependent on compilation of the earlier activity.
NETWORK – A combination of activities, dummy activities and
events in a logical sequence according to the rules for
drawing networks.
RULES FOR DRAWING NETWORKS
A – A Complete network should have one part of entry i.e a
start event and only
Part of exist i.e a finish event.
B – Every activity must have one preceding as task event and
one succeeding or
head event.
NOTE :- that activities may use the same head event.
Tail Head eventEvents Head
38
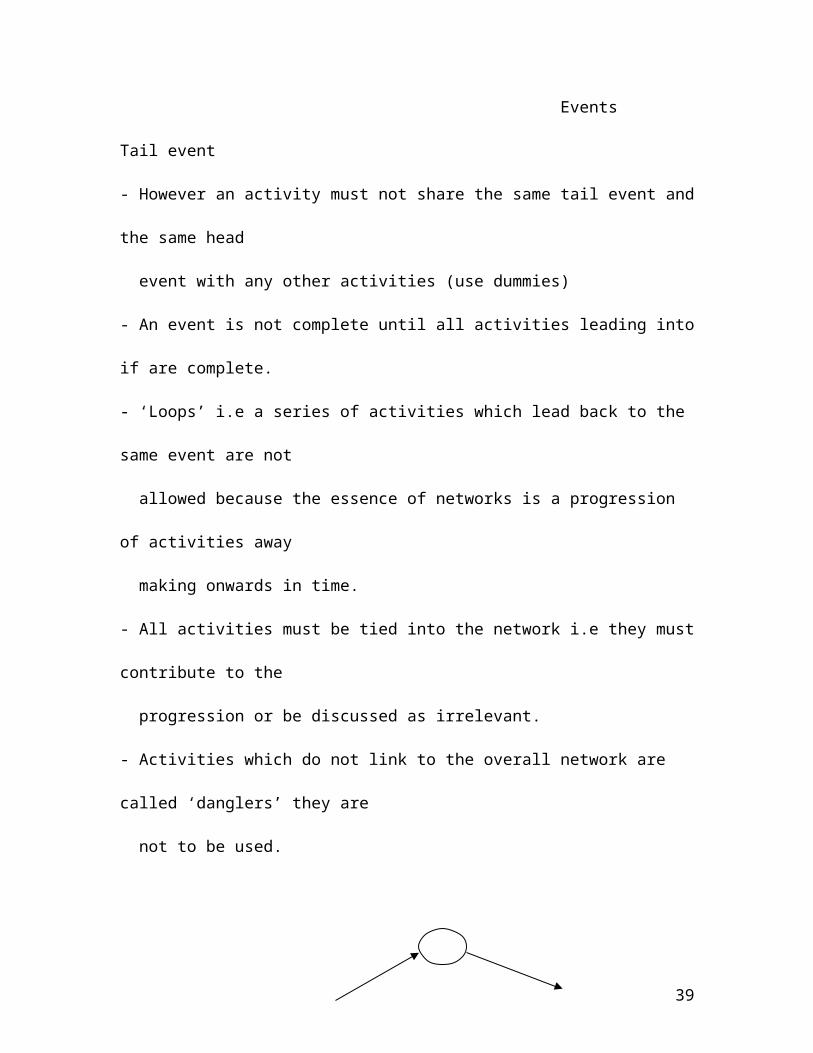
Events
Tail event
- However an activity must not share the same tail event and
the same head
event with any other activities (use dummies)
- An event is not complete until all activities leading into
if are complete.
- ‘Loops’ i.e a series of activities which lead back to the
same event are not
allowed because the essence of networks is a progression
of activities away
making onwards in time.
- All activities must be tied into the network i.e they must
contribute to the
progression or be discussed as irrelevant.
- Activities which do not link to the overall network are
called ‘danglers’ they are
not to be used.
39

Dangling activity not to be
used.
CONVENTIONS FOR DRAWING NETWORKS
a) Networks proceed from left to right.
b) Networks are not draws to scale i.e the length of
the arrow does not
represent the time elapsed.
c) Arrows need not be draws in the horizontal plane.
- If they are not already numbers events or nodes should
be progressively
numbered from left to right.
Simple networks have events numbers in simple numeric
progression i.e
0,1,2,3,e.t.c
40
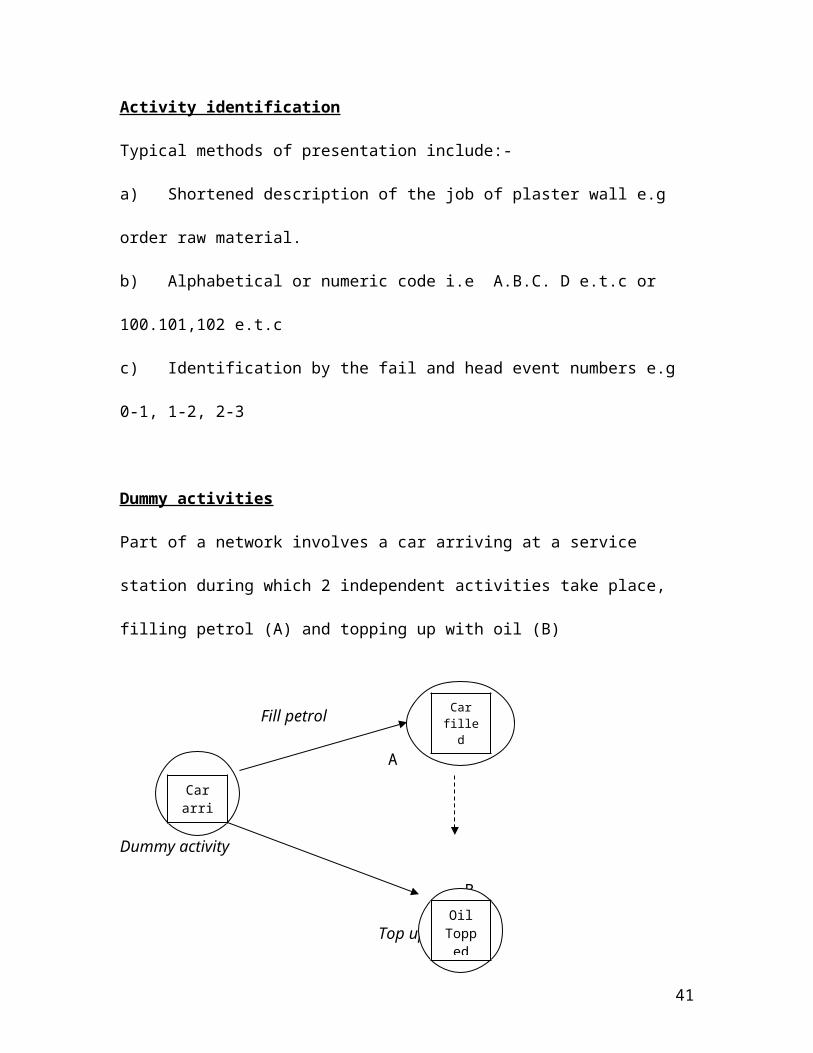
Activity identification
Typical methods of presentation include:-
a) Shortened description of the job of plaster wall e.g
order raw material.
b) Alphabetical or numeric code i.e A.B.C. D e.t.c or
100.101,102 e.t.c
c) Identification by the fail and head event numbers e.g
0-1, 1-2, 2-3
Dummy activities
Part of a network involves a car arriving at a service
station during which 2 independent activities take place,
filling petrol (A) and topping up with oil (B)
Fill petrol
A
Dummy activity
B
Top up with oil
41
Cararrives
Carfilled
with
OilTopped

EXAMPLE
Assume that part of the network involves a man lighting a
cigarette. Activities and there relationship are assumed to
be as follows.
ACTIVITY DESCRIPTION PRECEDING ACTIVITY
A Remove cigarette from case -
C Put cigarette case away A
B Strike match -
D Light cigarette A , B
REQUIRED - A network diagram
Remove cigarette from Put cigar away Case A C
B D
Network Analysis: (Time Analysis)42

Assessing the time
Once outline network has been drawn there is need to
complete it by in settling the activity duration time.
a) Time estimate – an estimate is a decision about how
much time and
resources are required to carry out a piece of work
to acceptable
standards of work performance – You determine the
size of group of
tasks, the amount of effort required to complete
the work. Effort is
measured in project time units, e.g hours days
weeks.
Sources of accurate estimates.
- Use experience of others
- Seek expert views (advice)
- Historical data from other projects
43

NETWORK TERMINOLOGY
3.1.3 Three time estimate approach
This approach is used to offset bias. Before beginning
scheduling of a project it is necessary to estimate the
time required to complete each activity. After
completing the initial arrow diagram, a time estimate
is obtained for each job in the project. Persons
familiar with work to be performed make the time
estimates based on their best judgment.
Sources for accurate estimates:
- Experience from others
- The expert view
- Historical data from other projects
Estimate is a decision about how much time and resources are
required to carry out a piece of work of performance.
44

Determine:
The “size” of the task or group of tasks
The amount of “effort” required to complete the work;
effort is measured in project time units (hours, days,
weeks)
Effort Duration
Schedule
3.1.4 PROJECT SCHEDULING
This is the second phase of a project after planning,
detailing the time at which each job is to be started
and completed. This phase represents when the work need
to be done.
Scheduling Procedure:
1. After the sequence of jobs has been planned and laid in
a network diagram, establish the timing
45

a. Estimate the time required to complete each
project item
b. Calculate the scheduled time for each project
c. Compare the required time (time estimate)
with the available time to complete each job.
d. Identify the critical jobs
e. Determine the front times of non critical
jobs
2. If the project duration time calculated initially is
not acceptable make adjustments to the plan so as to
meet project deadline that is acceptable.
3. Establish a time schedule (using a bias chart)
EXPECTED TIME CALCULATION
Expected time = Optimistic time +4 (normal time) +
pessimistic time
6
46

Optimistic Time - is the shortest possible time required
for completing an activity i.e. everything goes as planned;
deliveries are on time, machines and equipment operate
without breakdowns, personal work within the standards.
Normal Time - is the time most frequently required if
activity were repeated many times under similar conditions.
This is the estimate that should be used in an arrow
diagram, as there is no contingency added.
Pessimistic Time - is the maximum possible time required to
complete an activity i.e. about everything goes wrong:
delivery difficulties work delays, accidents.
e.g. Assume that three estimates for an activity are :
DAYS
(O) Optimistic 11
Most likely 15
(P) Pessimistic 18
EXPECTED TIME = 11+18+4(15)6
= 14.8 days = 15 days
47
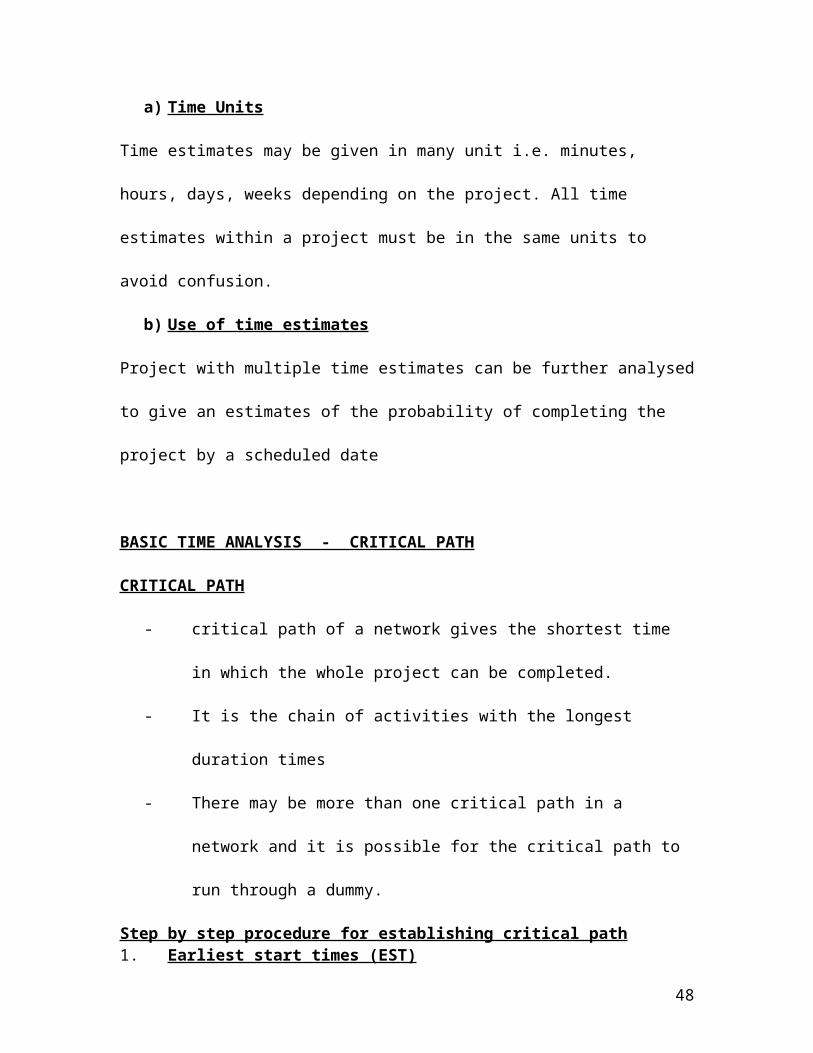
a) Time Units
Time estimates may be given in many unit i.e. minutes,
hours, days, weeks depending on the project. All time
estimates within a project must be in the same units to
avoid confusion.
b) Use of time estimates
Project with multiple time estimates can be further analysed
to give an estimates of the probability of completing the
project by a scheduled date
BASIC TIME ANALYSIS - CRITICAL PATH
CRITICAL PATH
- critical path of a network gives the shortest time
in which the whole project can be completed.
- It is the chain of activities with the longest
duration times
- There may be more than one critical path in a
network and it is possible for the critical path to
run through a dummy.
Step by step procedure for establishing critical path1. Earliest start times (EST)
48
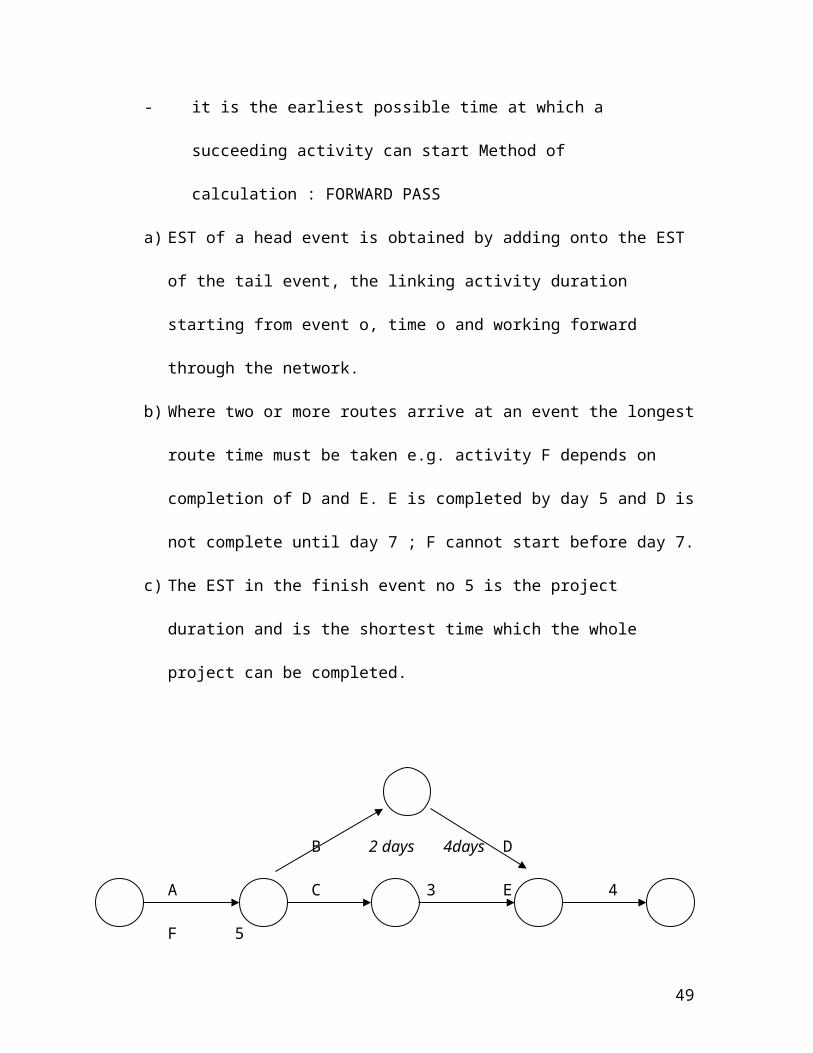
- it is the earliest possible time at which a
succeeding activity can start Method of
calculation : FORWARD PASS
a) EST of a head event is obtained by adding onto the EST
of the tail event, the linking activity duration
starting from event o, time o and working forward
through the network.
b) Where two or more routes arrive at an event the longest
route time must be taken e.g. activity F depends on
completion of D and E. E is completed by day 5 and D is
not complete until day 7 ; F cannot start before day 7.
c) The EST in the finish event no 5 is the project
duration and is the shortest time which the whole
project can be completed.
2
B 2 days 4days D
A 1 C 3 E 4
F 5
49

1 day 3 days 1 day 2 days
A – F = Activities
0– 5 = Events
Find the critical path (forward pass)
2
B 2 4 D
A 1 C 3 E 4
F 5
1 3 1 2
The EST of the head event =
Zero starting time + 1 day =
1 + 2 = 3
1 + 3 = 4
4 + 1 = 5
50
0 0 0 0998l0o0 00
23
11
34
47
59
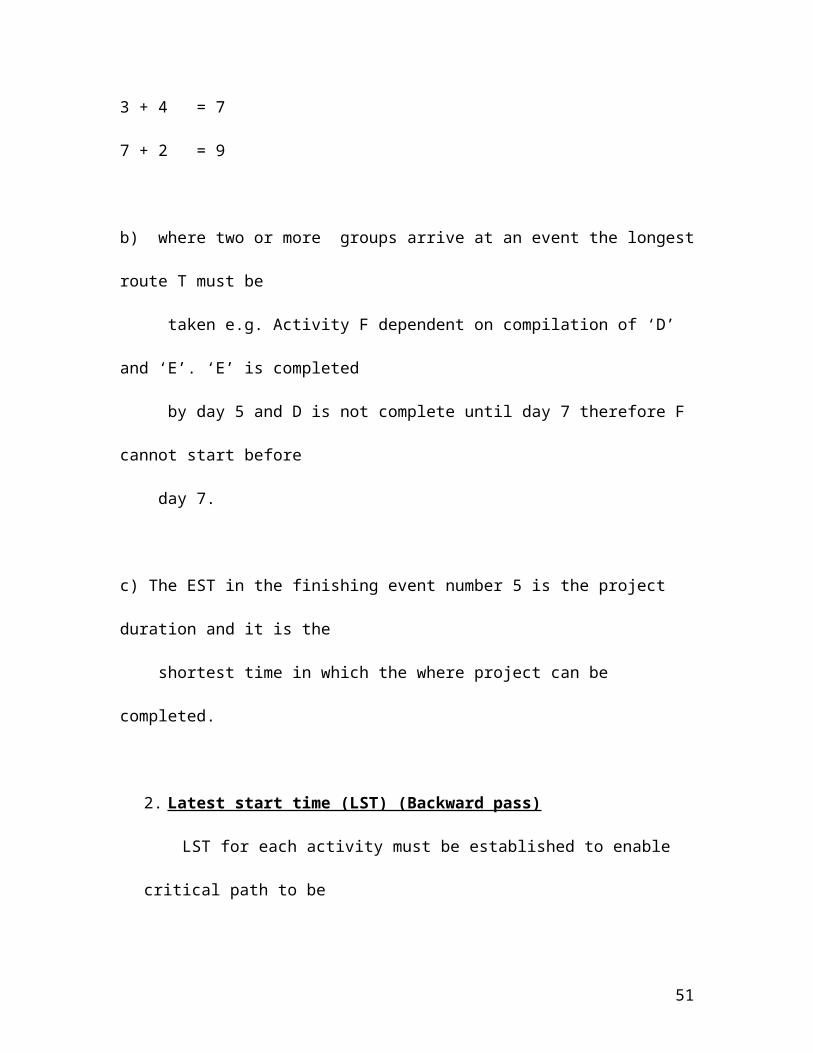
3 + 4 = 7
7 + 2 = 9
b) where two or more groups arrive at an event the longest
route T must be
taken e.g. Activity F dependent on compilation of ‘D’
and ‘E’. ‘E’ is completed
by day 5 and D is not complete until day 7 therefore F
cannot start before
day 7.
c) The EST in the finishing event number 5 is the project
duration and it is the
shortest time in which the where project can be
completed.
2. Latest start time (LST) (Backward pass)
LST for each activity must be established to enable
critical path to be
51
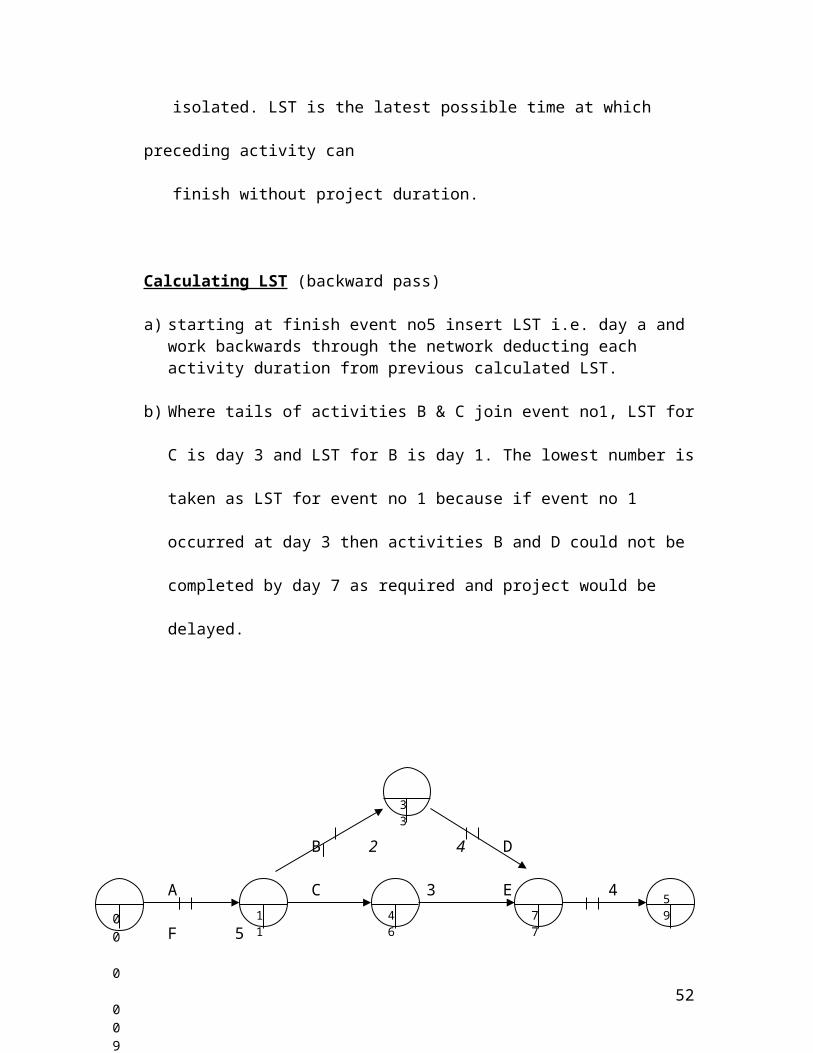
isolated. LST is the latest possible time at which
preceding activity can
finish without project duration.
Calculating LST (backward pass)
a) starting at finish event no5 insert LST i.e. day a and work backwards through the network deducting each activity duration from previous calculated LST.
b) Where tails of activities B & C join event no1, LST for
C is day 3 and LST for B is day 1. The lowest number is
taken as LST for event no 1 because if event no 1
occurred at day 3 then activities B and D could not be
completed by day 7 as required and project would be
delayed.
2
B 2 4 D
A 1 C 3 E 4
F 5
52
0 0 0 0 0998l0o0 00
3 3
1 1
4 6
7 7
59
1 3 1 2
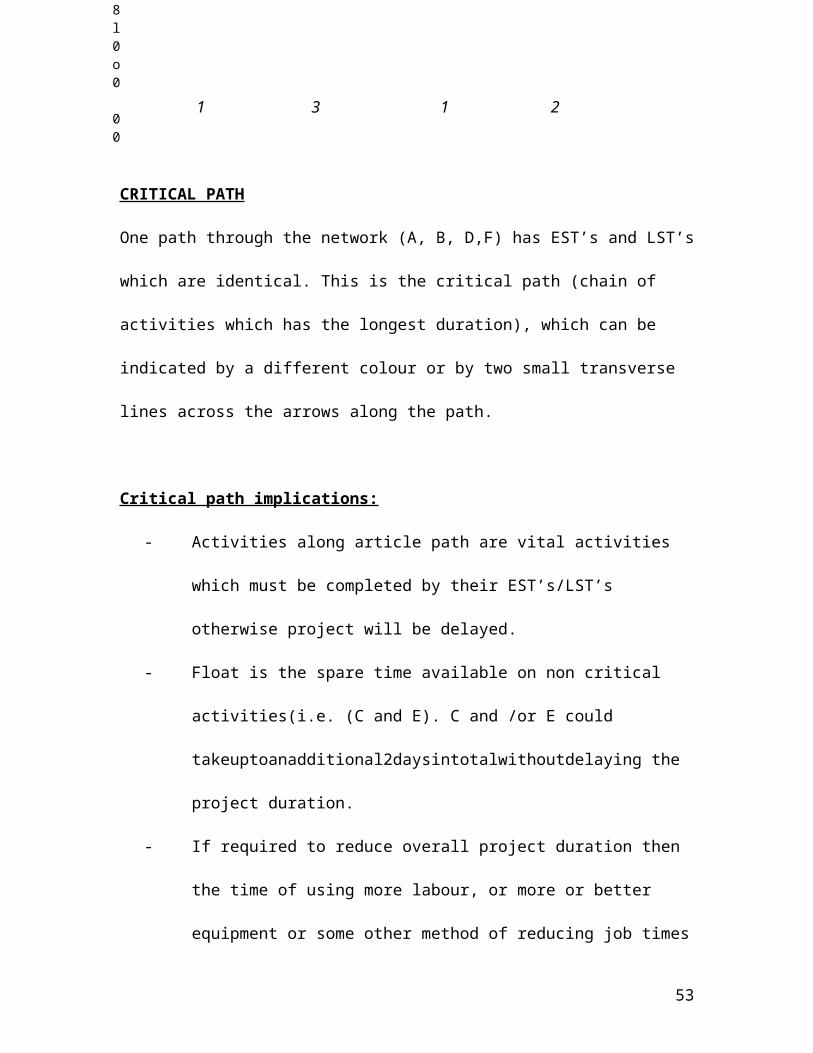
CRITICAL PATH
One path through the network (A, B, D,F) has EST’s and LST’s
which are identical. This is the critical path (chain of
activities which has the longest duration), which can be
indicated by a different colour or by two small transverse
lines across the arrows along the path.
Critical path implications:
- Activities along article path are vital activities
which must be completed by their EST’s/LST’s
otherwise project will be delayed.
- Float is the spare time available on non critical
activities(i.e. (C and E). C and /or E could
takeuptoanadditional2daysintotalwithoutdelaying the
project duration.
- If required to reduce overall project duration then
the time of using more labour, or more or better
equipment or some other method of reducing job times
53
0 0 0 0 0998l0o0 00

must reduce one or more of the activities on
critical path.
Float
Types of floata) Total Float - This is the amount of time a path
of activities could be delayed without affecting the
overall project duration.
Total Float = Latest Heat time –Earliest
Tail time –Activity duration
Total float = 50-10-10
=30 days.
b) Free Float - This is the amount of time activity
can be delayed without affecting the commencement of a
subsequent activity at its earliest start time, but may
affect float of a previous activity.
Free float = Earliest Head Time –Earliest
Tail Time – Activity Duration
Free float = 40 – 10 - 10
20 days
c) Independent Float - This is the amount of time an
activity can be delayed when all preceding activities are
54

completed as late as possible and all succeeding
activities are completed as early as possible.
Independent float does not affect the float of either
preceding or subsequent activities.
Independent Float = Earliest Head Time –
Latest Tail Time –
Activity duration.
Independent float = 40 –20 –10
10 days.For examination purposes the most important type of float
is Total Float .
Calculate float (total)
1) Calculating separately
2) or calculating for total float over chains.
Non –critical chain Time read time available total float
over chain
55
C, E 3+1 = 4days 7 – 1 = 6days 2
days
Slack
This is the difference between EST and LST for each event.
Strictly speaking it does not apply to activities but on
occasions the terms are confused in exam questions.
Exercise:
A project has five activities as follows:
Project data activity Preceding activity Duration
(days) normal
A - 4
B - 8
C A 5
D A 9
E B, C 5
a) Find critical path using EST’s /LST’s
b) Calculate the floats of the network.
NETWORK ANALYSIS a) Cost scheduling
56

A further important feature of network analysis is concerned
with costs of activities and of the project as a whole.
Cost analysis objectives
The primary objective of network cost analysis is to be able
to calculate the cost of various project durations. Normal
duration of a project numbers a given cost:
More labour
Working overtime
More equipment
Network cost analysis seeks to find the cheapest way of
reducing overall duration.
b) Resource scheduling
Management need to know what activities and what resources
are critical to the project duration and if resources
limitations e.g. (shortage of materials, limited number of
skilled labour might delay the project.
Resources scheduling requirements:
57
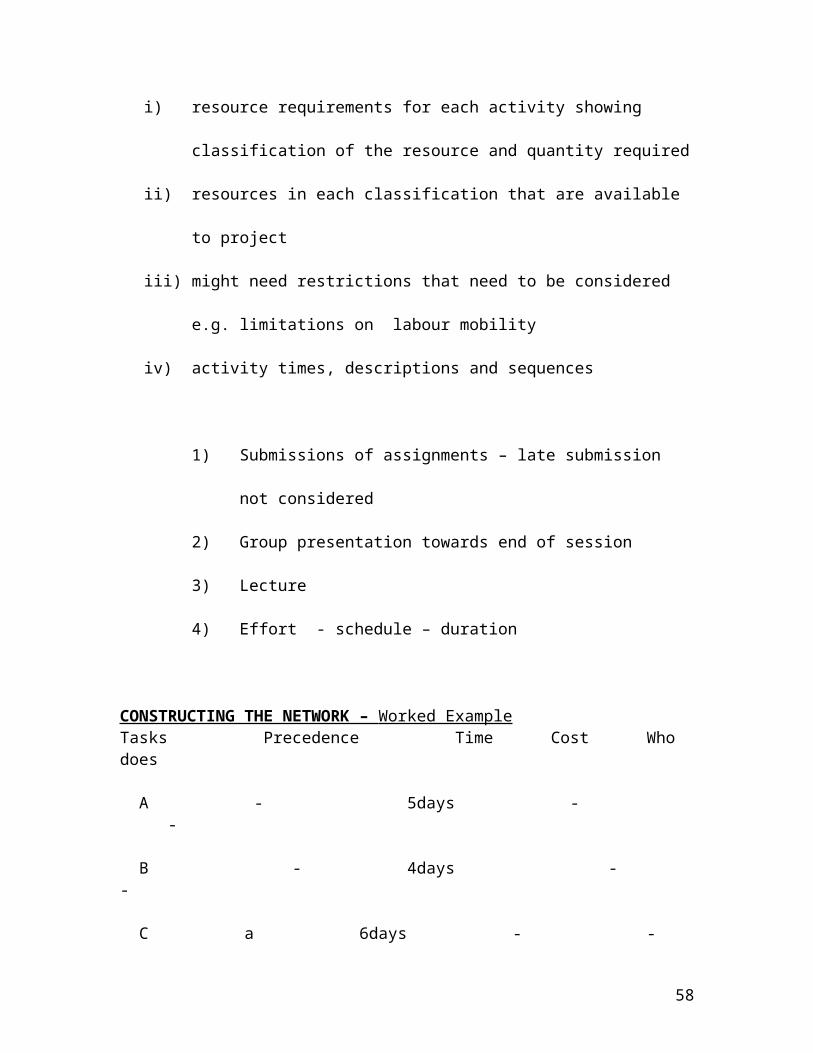
i) resource requirements for each activity showing
classification of the resource and quantity required
ii) resources in each classification that are available
to project
iii) might need restrictions that need to be considered
e.g. limitations on labour mobility
iv) activity times, descriptions and sequences
1) Submissions of assignments – late submission
not considered
2) Group presentation towards end of session
3) Lecture
4) Effort - schedule – duration
CONSTRUCTING THE NETWORK – Worked Example Tasks Precedence Time Cost Who does
A - 5days --
B - 4days - -
C a 6days - -
58

D b 2days - -
E b 5days - -
F c, d 8days --
Finda) Critical path
b) How long it will take to complete the project
i) Node numbered I denotes event called “START”
ii) Activities a and b have no predecessors, assume
source is at “start” –Node 1
iii) Destination at nodes are numbered 2 and 3
respectively
iv) Arrow heads show direction of flow.
i) Activity c follows a activity d follows b activity e
follows b
NoteNumber event nodes sequentially from left to right as you
construct the network
59
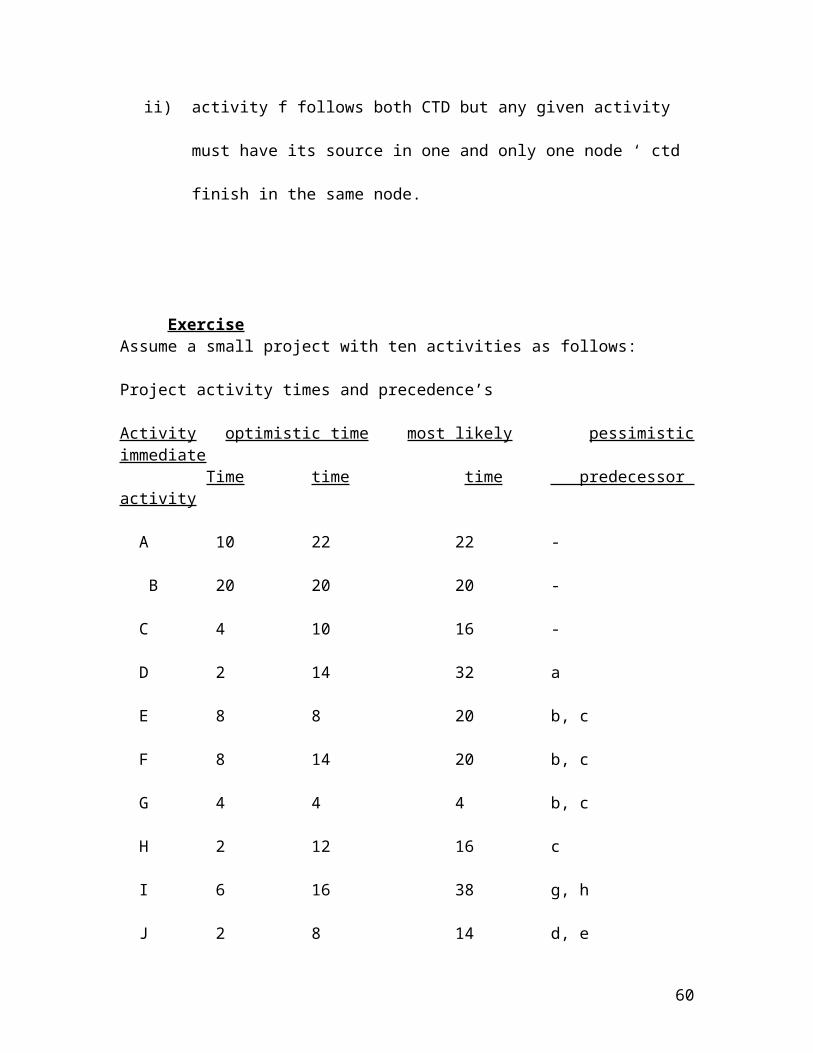
ii) activity f follows both CTD but any given activity
must have its source in one and only one node ‘ ctd
finish in the same node.
ExerciseAssume a small project with ten activities as follows:
Project activity times and precedence’s
Activity optimistic time most likely pessimisticimmediate
Time time time predecessor activity
A 10 22 22 -
B 20 20 20 -
C 4 10 16 -
D 2 14 32 a
E 8 8 20 b, c
F 8 14 20 b, c
G 4 4 4 b, c
H 2 12 16 c
I 6 16 38 g, h
J 2 8 14 d, e
60

Question 1.
Hints
i) start network by finding those activities that have
no predecessors - activities a, b, c meet the test:
they can all be drawn emerging from the starting
node
ii) look for activities that only require a, b, or c or
some combination of a, b, and c to precede them:
- activity d requires that a be completed and e, f
and g all require that b and c completed
- note that a dummy will be necessary unless we begin
the network from separate nodes b and c
- h requires only that c be completed
iii) last activity I and j are drawn in the same manner.
Activity I requires both g and h be completed; so g
and h are directed to a single node (node 5)
Similarly activity j requires completion of both d
and e which are directed to node 6
61
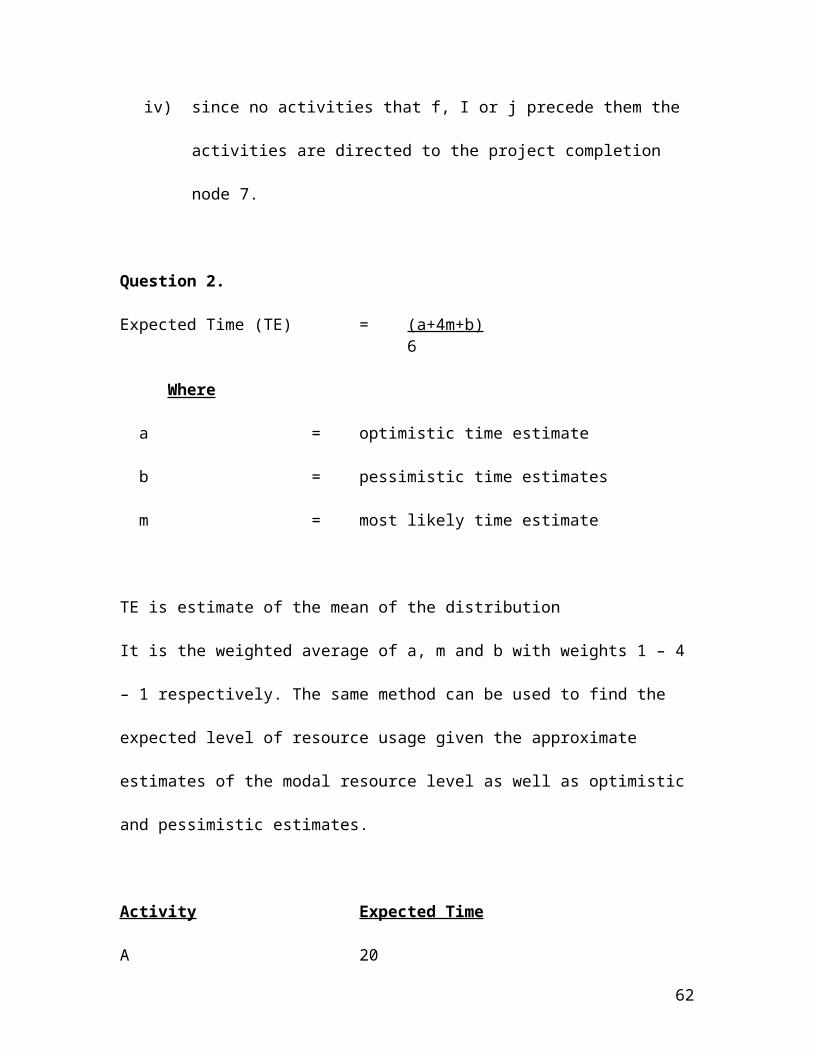
iv) since no activities that f, I or j precede them the
activities are directed to the project completion
node 7.
Question 2.
Expected Time (TE) = (a+4m+b) 6
Where
a = optimistic time estimate
b = pessimistic time estimates
m = most likely time estimate
TE is estimate of the mean of the distribution
It is the weighted average of a, m and b with weights 1 – 4
– 1 respectively. The same method can be used to find the
expected level of resource usage given the approximate
estimates of the modal resource level as well as optimistic
and pessimistic estimates.
Activity Expected Time
A 20
62

B 20
C 10
D 15
E 10
F 14
G 4
H 11
I 18
J 8
Longest of these paths is a-d-jusing43 days which means that
43 days is the shortest time in which the entire network can
be completed. A – d – j is the critical path.
Times and slacks for network
Event Latest occurrence time earliest occurrence
time Slack
1 0 0 0
2 20 20 0
3 21 20 1
63

4 14 10 4
5 25 24 1
6 35 35 0
7 43 43 0
Activity LST EST Slack
A 0 0 0
B 1 0 1
C 4 0 4
D 20 20 0
E 25 20 5
F 29 20 9
G 21 20 1
H 14 10 4
I 25 24 1
J 35 35 0
Notes
EST for an activity = for the event from which activity
emanates
64
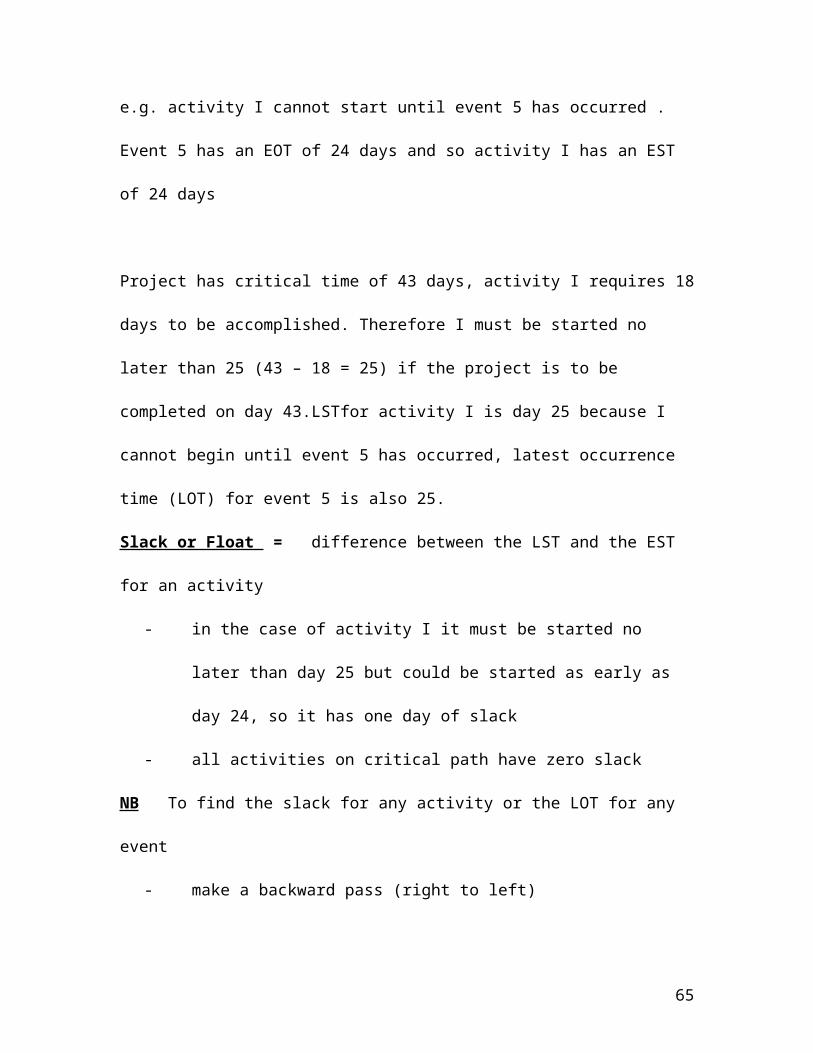
e.g. activity I cannot start until event 5 has occurred .
Event 5 has an EOT of 24 days and so activity I has an EST
of 24 days
Project has critical time of 43 days, activity I requires 18
days to be accomplished. Therefore I must be started no
later than 25 (43 – 18 = 25) if the project is to be
completed on day 43.LSTfor activity I is day 25 because I
cannot begin until event 5 has occurred, latest occurrence
time (LOT) for event 5 is also 25.
Slack or Float = difference between the LST and the EST
for an activity
- in the case of activity I it must be started no
later than day 25 but could be started as early as
day 24, so it has one day of slack
- all activities on critical path have zero slack
NB To find the slack for any activity or the LOT for any
event
- make a backward pass (right to left)
65

To find the critical path and time and the EOT’s for
al events
make a forward pass (left to right) which are also
EST’s for successor activities.
Adopt the following convention:
When there are two or more non-critical activities on a
path, it is conventional to calculate the slack for each
activity as if it were the only activity in the path.
Problems1. Given the following information, draw the PERT/CPM
diagram.
Activity Immediate Predecessor
1 -
2 -
3 1, 4
4 2
5 2
6 3, 5
66

2. Given the diagram below, find:
a) Critical path
b) How long it will take to complete the project
3. Given the following network
a) What is the critical path
b) How long will it take to complete this project
c) Can activity B be delayed without delaying the
completion or the project? If so, how many days?
4. Activity a m b
AB 3 6 9
AC 1 4 7
CB 0 3 6
CD 3 3 3
CE 2 2 8
BD 0 0 6
BE 2 5 8
67
DF 4 4 10
DE 1 1 1
EF 1 4 7
Find:
a) the critical path
b) all event slacks
c) critical path to event D
d) the effect if CD slips to 6days, to 7days,to 8days.
NB a = optimistic time estimate
B = pessimistic time estimate
M = most likely time estimate
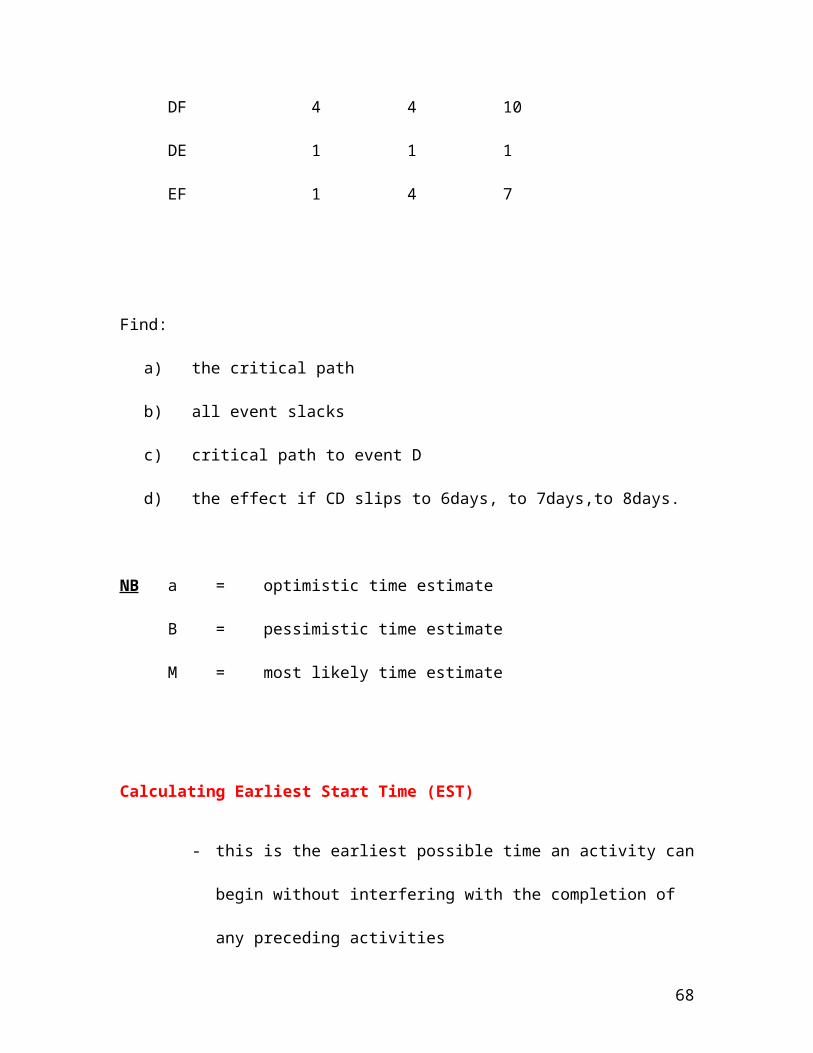
Calculating Earliest Start Time (EST)
- this is the earliest possible time an activity can
begin without interfering with the completion of
any preceding activities
68
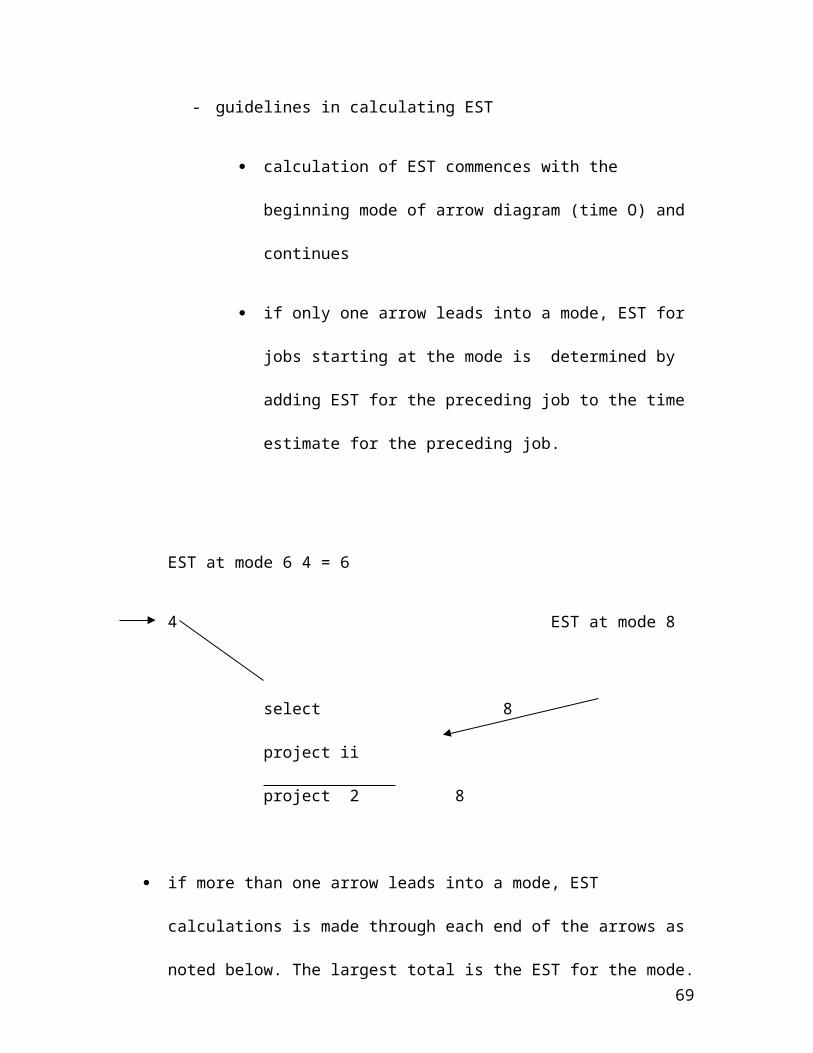
- guidelines in calculating EST
calculation of EST commences with the
beginning mode of arrow diagram (time O) and
continues
if only one arrow leads into a mode, EST for
jobs starting at the mode is determined by
adding EST for the preceding job to the time
estimate for the preceding job.
EST at mode 6 4 = 6
4 EST at mode 8
select 8
project ii
project 2 8
if more than one arrow leads into a mode, EST
calculations is made through each end of the arrows as
noted below. The largest total is the EST for the mode.69

EST at mode 3 EST at mode 7
13 23
pressure equipment
3 7
EST at mode 6
17
Develop operating procedures
6
6
70

Calculating latest finish time (LFT)
- LFT an activity must be completed without delaying the
end of the project.
- Guidelines when calculating (LFT)
Project duration must first be determined by
calculating EST
Project duration is the LFT of the end mode of the
project
Calculation of LFT involves working from the end
mode back through each mode to the first mode in
the project
If more than one arrow originates at a mode, the calculation
of LFT is made via each arrow and the smallest result is
from each mode to the end of the diagram.
71

LFT at mode 4 LFT
at
6 select operating manager
mode
4 6 17
6
9
hire operating train
up personnel
10 personnel
5
4 7
Job 4, 6 17 LFT at mode 6
72

- 9 Time estimate for job 4, 6
8
Job4, 5 10 LFT at mode 5
- 4 Time estimate for job 4, 5
6
LFT at mode 4 is 6 days the smaller of the two results.
Milestone dates can be set V12 P32 – 36
Float: optional start and finish times. A float is the
difference between time available for performing a job and
the time required for doing it.
Available time = Latest finish time - earliest start time
Required time = time estimate for completing a job
73

DIAGRAMS
Benefits from timing calculations:
Establishment of project duration for plan
Identification of longest path (critical path) through
the project
Identification of jobs for which there is scheduling
flexibility without lengthening project duration.
Formula for calculating optional starting and finishing times:
Latest start = earliest start + total floats
Earliest finish = Latest finish - total float.
74
Tabulated schedule can be converted into a calendar
schedule for reporting and monitoring the project.
Bar Chart time schedule can be plotted after schedule is
calculated.
Procedure for constructing bar chart:
1. use earliest start time for each project activity.
2. The length of each bar is the duration of each
activity.
3. Plot one activity per line (in some cases, a number of
activities per time)
75
4.8 Benefits and limitations of network planning
Benefits
A disciplined basis for planning a project
A clear picture of the scope of the project
that be read and understood easily by someone
who is not familiar( but knowledge of the
network diagramming technique) with the
project.
A means of communicating what is to be done in
the project
A vehicle for use in evaluating alternative
strategies and objectives
A means of defining relationships among the
project items
A means of pinpointing those responsible for
accomplishing the jobs that make up the project
An excellent vehicle for training project
personnel
76

4.9 Limitations
Network is often difficult to interpret
A great deal of time is usually needed to prepare
changes, often requiring a great deal of time for
modifications to the network diagram
A network makes it difficult to note estimated
costs versus actual costs
Individual skills are not recognized.
4.10 Bar chart/Gant Chart Construction
Is a graphic planning and control method
a project is broken down into separate tasks and
for each task, estimates are made of the amount of
time required and of the termination date
necessary to meet the specified completion date
for the project.
Information is shown as a pair of brackets
indicating the start and end of dates for each
task
77

Grant Chart enables a manager to make commitments
based on the planned completion times, to acquire
extra resources to shorten some of the times etc.
Grantt Chart enables manager to fill in the
brackets (accomplishment) enabling him to see
immediately what tasks are behind( or ahead of
schedule and how far.
Advantages – provides excellent communication to management
Depicts more readily than network diagrams, a
summary of status of project and thus are used
extensively in reporting on progress of projects.
4.11 Deficiencies/weaknesses
-Relationships among the jobs cannot be shown and questions
cannot be answered regarding
Parts of these jobs that can be done concurrently
Parts of each job that must be completed be for other
parts begin
78

Certain jobs or parts of jobs that must be given
priority so as not to hold up scheduled completion of
project
Optional starting and end dates of some jobs or parts
of jobs if any.
To overcome above deficiencies during planning
Network diagrams explicitly show interrelationships
between jobs. A network diagram shows which jobs can
be done concurrently, which owes precede, and which
ones follow other jobs
Jobs with critical schedules are specified with their
required beginning and end dates
Using computer calculations based on the network diagram
also permits more rapid and accurate updating of project
schedule.
79

“While PERT/CPM and Gannt charts are both scheduling techniques, they are
not merely different ways of achieving the same ends: they are
complementary rather than competitive” Discuss
The date may relate to when a decision is to be made
concerning outside financing, when announcement of a
project to the press is planned, when a thorough
project review is scheduled on whatever.
Milestone scheduling indicates seluted dates by which
various phases of the entire project to be completed.
Milestones add detail to Gantt chart
Milestones serve as formal review points where
costs, progress and the need for replanning on
schedule modification can be reviewed.
Gantt chart shows the relationship between milestones
within the same task but not within different tasks.
80

4.12 Milestone Planning
Is the date when a certain accomplishment, decision or
event is to take place as indicated on the horizontal
bar of a chart . V12 p 14
4.13 PROJECT WORK BREAKDOWN STUCTURE (WBS)
This is a dynamic tool which divides(segments) the
project into parts before starting a project. It is
updated as the work proceeds, particularly as minor
changes affect the task analysis.
Reasons for segmenting a project
Project is large
Project is long term
It is advantageous to have information to plan the
whole project as one unit
We do not have information to plan the whole
project as one unit
The project has several natural phases with
completing different contents.
81
NB: a characteristic of a phase is that it is possible to
plan it as a whole i.e. giving us an insight into the types
of activities that should be done in this phase.
A WBS does not show dependencies other than a grouping under
the key stages.
A WBS is not time based – there is no time scale on the
drawing.
e.g. feasibility(phase) study V
implementation phase
Preliminary project V (main project)
-Defines precisely objectives and goals -it implements
what has been
on project decided
-Requires thoroughness
completeness
4.14 PROJECT RESPONSIBILITY CHART
82
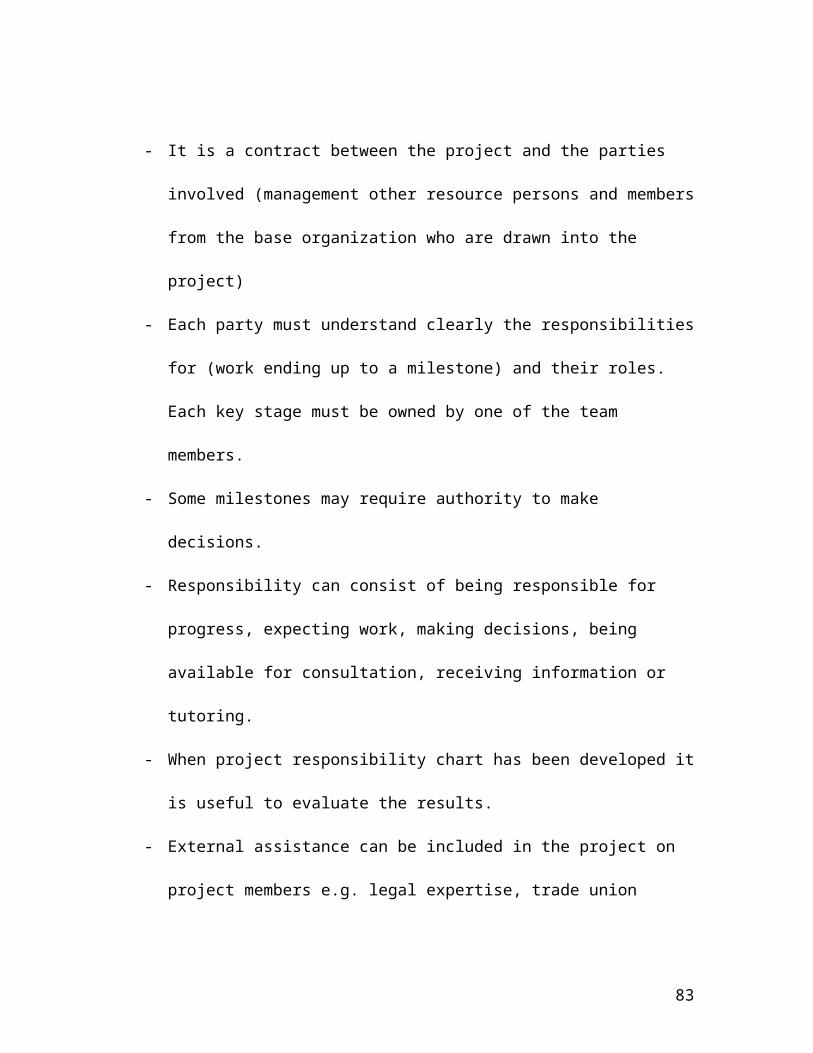
- It is a contract between the project and the parties
involved (management other resource persons and members
from the base organization who are drawn into the
project)
- Each party must understand clearly the responsibilities
for (work ending up to a milestone) and their roles.
Each key stage must be owned by one of the team
members.
- Some milestones may require authority to make
decisions.
- Responsibility can consist of being responsible for
progress, expecting work, making decisions, being
available for consultation, receiving information or
tutoring.
- When project responsibility chart has been developed it
is useful to evaluate the results.
- External assistance can be included in the project on
project members e.g. legal expertise, trade union
83

representative, expert in economics and finance (if not
found from within)
- At this stage data to complete “duration” on plan “end
date” is not yet in place.
LINEAR RESPONSIBILITY CHART (LRC)
- It is a contract between the project and the parties
involved i.e right and member from the base
organization who are drawn into the project as resource
persons and each party must understand clearly for work
leading up to a milestone (date of announcement)
- Responsibilities can consist of being responsible for
progress or implementing work, making decisions, being
available for consultations, receiving information or
tutoring as well as evaluating the results.
- External assistant can also be included in the project
as project members such as legal practioners, TUs,
economic experts if not found from within.
- If summaries the relationships between project
participants and their responsibilities in each element
84

of a project and an element can be a specific activity
an authorization to perform an activity, a decision or
a report. The LRC has government column to represent
organizational elements and roles which correspond to
the project elements and roles which correspond to the
project elements performed by the organization.
- The LRC depicts authority, responsibility and
communication channels.
Activity Engineering manager
Manufacturing manager
Contracts manager
Project manager
Marketing manager
Qualityassurance manager
Negotiating
Contract
I, N I, N I, R P I A
Preliminary
Design
P A R O, B I A
Execution R P - O, B I R
Delivery N N P A N A
KEY
A - ApprovalP - Preliminary responsibility – who is responsible for accomplishing
85

R - ReviewN - NotificationO - OutputI - InputB - Initiation
4.0 PROJECT DOCUMENTATION
Project work produces a large amount of data and
it is important that you record essential
material. Insist that the team keep all essential
project records on a standard set of templates
(format 5) derived specifically for the purpose.
To ensure project data is resolved in a
consistent and disciplined manner without
reinventing every week.
To get the right information recorded for the
project file to support your control system
and aid project evaluation at completion.
Standard formats can be designed on the
computer
a) Project File
86

- use a paper based system but more preferably on
computer based file which makes distribution of
information easier with a network.
- Organize your project file into sections for different
stages of the project e. g.
Background information
Project definition
- project organization
- stakeholders
- project brief
Project plans and schedules
- project risk management
- responsibility charts
- schedules
- work plans
Project execution and implementation
- project status reports
87
- changes to project plans
- action plans for correction action
- cost control data
- supplier and subcontractor data
- records of meetings
Project closure
- handover checklist
- acceptance pressure
- follow up and post project responsibilities
- project evaluation data
- completion report
b) Project logbook
- open a project log book at the start of your project
- book in an A4 bound …….book
- log book is particularly valuable to record events with
third parties like suppliers and contractors. When
conflicts and differences occur the logbook provides a
88
record of events that can have a legal status in a
dispute
- log book is an addendum to the project file
- the logbook is an invaluable record of what actually
happened throughout the project. It is useful for post-
project evaluation and a source of active data for
other projects in the future.
c) Project definition
- process of turning the data into something more solid
and realistic, something that is no longer a wish or a
hope
- a clear definition of your project is critical to
success – a large number of projects (more than 75%)
are perceived to fail as a consequence of poor or
nuclear definition
Documents required to effectively define project:
I. a statement of requirements
89

II. a stakeholder list –
- all with an interest in the project, how or in the
future : customer, endures, project sponsors, line
managers of your core team members
- finance department, sales and marketing department,
consultants ,
contractors, suppliers, other divisions or sites.
Project log book
Record events with essential relevant data:
date
time
who is involved
key points or content
Events to record Telephone calls – incoming and outgoing
Faxes – incoming and outgoing
Letters – sent and received
Memos – sent and received
90

E –mail - sent and received
Purchases instructions issued
Contracts signed
Action plans agreed
Decisions taken – how implemented
Solutions derived
Reports issued
Meetings – sponsor team, third party, one – to – one
When using log book
Use every page and number them sequentially
Never remove any pages
Start each day with anew page
Always write with ink, never with pencil
Write on very line
Rule out all unused lines at the end of each day and
sign the page at the bottom
Do not allow anyone else to write in the logbook – even
the project sponsor.
- the public, other agencies/statutory bodies
91

stakeholders used to be consulted for their inputs
to give you a wider
perspective of:
- the real project needs and requirements
- what is realistically available in the time scale
demanded.
III. Project brief – one page document with the following
sub headings:
Project title – relevant title for identification
(project number)
Project overall objective – describes project’s
desired results in 25 –30 words
Project leader and sponsor to be identified
Project proposed start date: date when the real
work starts after definition is approved and
planning begins
Project required and date: and project is handled
over to customer
92

Project deliverables; tangibles outputs from the
project which must be impabale of being measured
through its lifecycle, apply SMART test to ensure
that each deliverable is specific, measurable
achievable, realistic and time bound
Project benefit
Lists benefits and quantity them in financial
terms-cost savings, increased turnover,
contribution or profitability in a specific time
scale.
Project strategy –explore alternative, carry out
feasibility study, set up site team, involve
customers in the team
Project skills required: identify and highlight
special experience and technical skills you expect
to need, external skills, expertise from outside
the organization.
Relationships with other active projects –any
project interfaces with other projects in terms of
93

inputs, outputs critical interface dates to be
determined.
Project cost – if known or budget exists from
earlier studies or feasibility with them state
cost, if not give estimate cost o rleave blank.
Risk management – risk log and management forms
attached
Project brief is a document that summarizes all relevant
facts about the project and is a source of definitive
information:
Contents:
Projects origins –a need or opportunity statement
Project …….. – why is it necessary now?
Benefits of project –to customer and your organisation
Project budget if known at this stage
Current timescale and dead lines –subject always to
detailed planning later
94
Iv Scope of work statement (SOW)
- it is a narrative description of the project objectives
in more detail, giving more information about each
deliverable and benefit identified. SOW must identify
boundary limits of project clearly stating what is not
going to be done as part of the project. It records all
constraints made earlier and any assumptions made in
each of the meetings, SOW is where the applicable
specification list is recorded:
- internal product specifications
- external product specifications
- mandatory standards imposed by legislation
- process specification
- customer specifications
- standard operating procedures
- purchasing procedures
- quality standards
- testing specifications and procedures
95

- sub contract terms and conditions imposed on third
parties
Its purpose:
- to make sure that everyone knows from the offset which
standards and specifications apply to your project
- it identifies where actual document scan be found for
reference
- it identifies what exceptions, if any, apply to any
specification for your project
- if necessary record for reference purposes any other
relevant documents that have been issued previously
relating to project e.g. CBA fundability reports,
studies carried out by consultants, project evaluation
reports from previous projects
v Risk Management
- a risk is any event that could prevent the project from
realizing expectations of the stakeholders as stated in
96

the agreed project briefs or a agreed definition. A
risk that becomes a reality is treated as an issue
- there are risks to all projects and risk management is
the process o identifying and containing them to ensure
your project’s success. It is necessary to anticipate
what might go wrong.
Two types of risks
o project risks – associated with technical aspects of
the work of the work to achieve the required customers
o process risks – associated with project process,
procedures, tools and techniques employed, the controls
put in place, communication, stakeholders and team
performances
o can be due to external / internal factors
Project manager is made an obligation with the team to,
identify and evaluate potential risks
obtain agreement for action plans to contain risks
97
take actions and monitor results
promptly resolve any issues arising from risks that
happen
Risk management is a continuous process throughout the life
cycle of the project. Identify the triggers or signals that
suggest a risk likely to happen, and you must maintain
awareness of risk in the minds of all your project team;
should be started at definition phase.
Is essential to establishing project brief
Compile a complete list of a project risk log
Review the list at regular intervals as the project
moves forward.
Approval of project definitionRequires following documents to be presented
Project organization chart p56 T&Young
Project stakeholder list
Scope of work statement
Project risk management forms
Project brief.
98

5. PROJECT LAUNCHING
After project definition, plan and schedule have been
approved you are ready to launch the project work.
i) ask key stage owners(people
assigned with project work and
own the work) to record their
task lists
-using WBS
-use schedule start and end
dates
-note name of person responsible
for carrying out the tasks.
-prepare Gannt chart.
ii) establish milestone scheduling –
milestone should be considered
as a flag or some signal at some
clearly defined point in the
99

project. There are selected key
events that are of major
importance towards achieving
objectives.
Milestone are excellent tools for reporting project status
in summary form to management. It summarizes the status of
major events.
e.g.
completion of key task
completion of one of the project deliverables
stage generation of benefits
completion of third party activity
financial audit point
project audit point
quality audit
significant decision point.
Record list of milestone on a schedule and on Gantt chart.
100
5.1.3 IDENTIFYING CRITICAL SUCCESS FACTORS OF PROJECT
Use process type CSF which include:
- tools, techniques, processes and procedures you use to
define, plan, execute and complete project on time, to
the budget
- these must be acceptable to the key stakeholders i.e.
customer and project sponsor
Examples:
- defining project objectives, deliverables, benefits
- ensuring sponsor is appointed and sustains support and
commitment to project
- appropriate team is formed and right skill are utilized
- scheduled plans exist, up to date
- WBS is maintained
- Control procedures are understood
- Project risks regularly reviewed
- Reporting and communication procedures are established
–plan a meeting schedule (1 to 1)meetings for your
project.
101
5.1.4. Launch Meeting: as a milestone in the project
- get together all important people involved in a project
project sponsor
the customer
other stakeholders(key) –line managers
project team
Consider preparing a document package for distribution
containing:
project organization chart
project stakeholderlist
key stage Gantt chart
key stage responsibility chart
project brief
any other relevant information
CHAPTER 6: PROJECT WORTH
INVESTMENT DECISIONS
Decision to invest is based on 3 major factors.
102

(a) Investor’s beliefs in the future – such
beliefs would be based on forecasts of internal
factors including: costs, revenues, inflation,
interest rates, taxation etc.
(b) Alternatives available in which to invent –
appraisal techniques are used to assess competing
investments.
(c) Investor’s attitude to risk – analysis of
project uncertainity, risk are critical given the
size of investment.
Appraisal techniques
Payback is the period usually expressed in yeas which it
takes for the project’s net cash inflows to recoup the
original investment.
e.g
Calculate payback for the following projects:
103
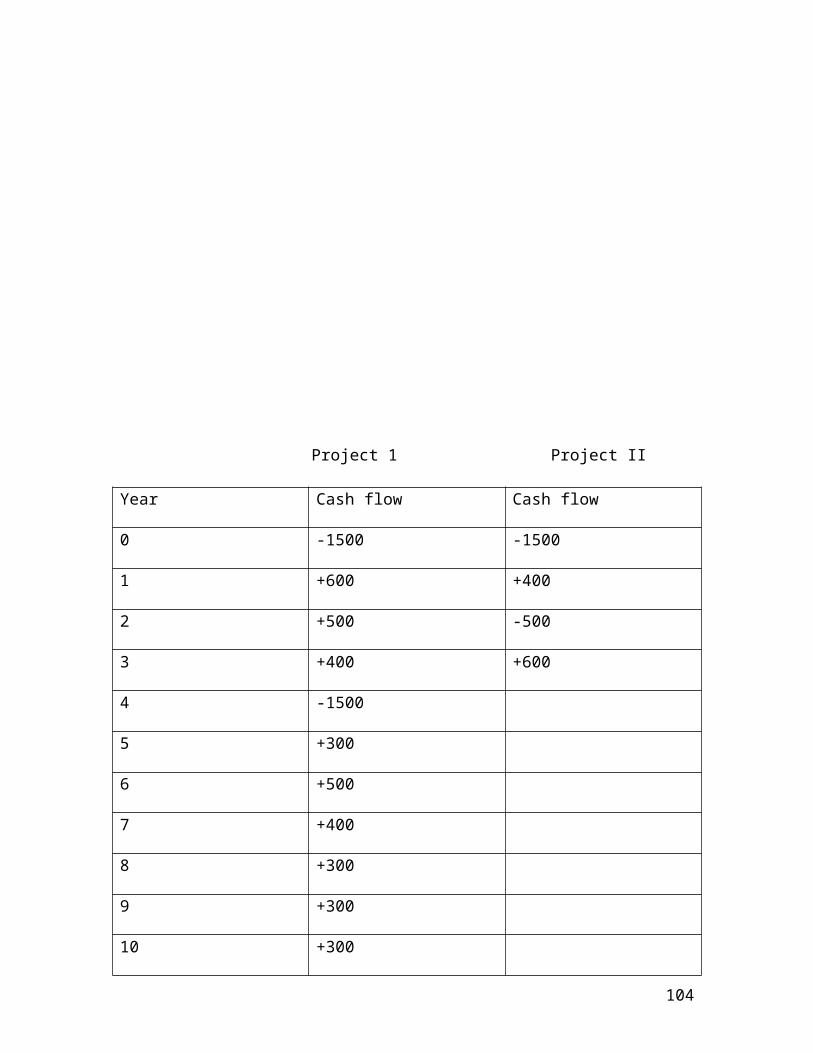
Project 1 Project II
Year Cash flow Cash flow
0 -1500 -1500
1 +600 +400
2 +500 -500
3 +400 +600
4 -1500
5 +300
6 +500
7 +400
8 +300
9 +300
10 +300
104
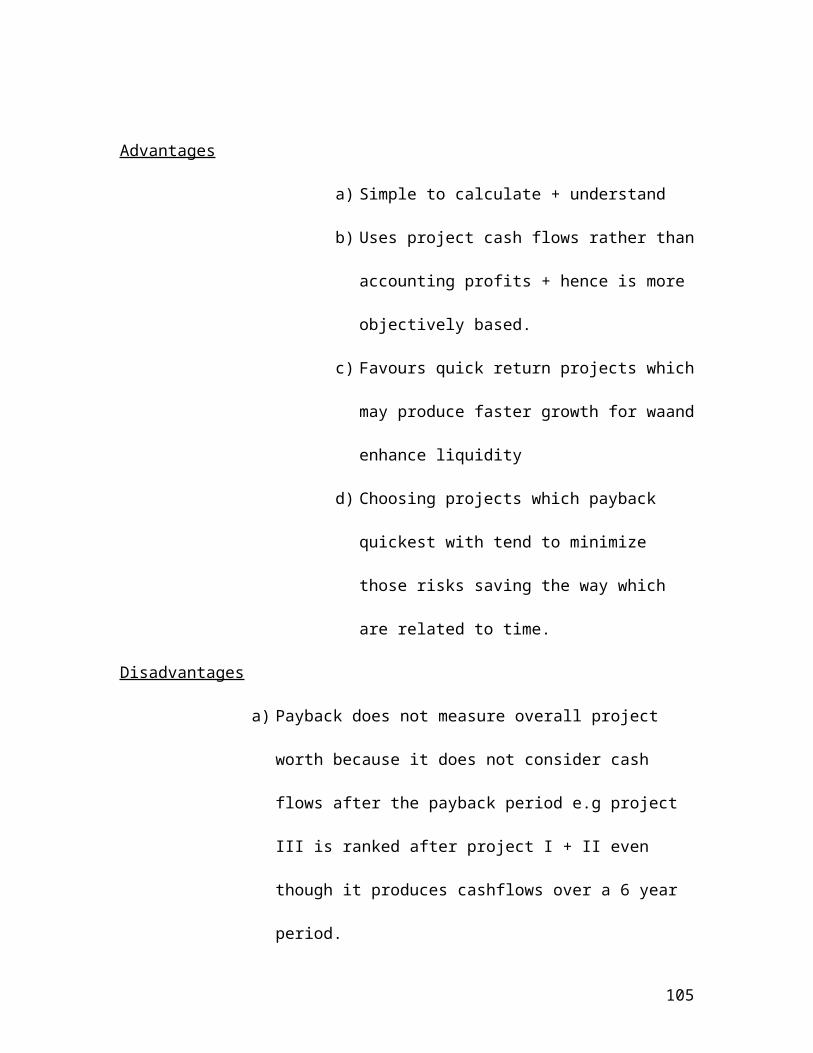
Advantages
a) Simple to calculate + understand
b) Uses project cash flows rather than
accounting profits + hence is more
objectively based.
c) Favours quick return projects which
may produce faster growth for waand
enhance liquidity
d) Choosing projects which payback
quickest with tend to minimize
those risks saving the way which
are related to time.
Disadvantages
a) Payback does not measure overall project
worth because it does not consider cash
flows after the payback period e.g project
III is ranked after project I + II even
though it produces cashflows over a 6 year
period.
105

b) Payback provides only a crude measure of
project cashflows. eg project I + II are
reached equally even though there are clear
differences in timing of cash flows. In
spite of above it is undoubtedly the most
popular appraisal criteria in practice.
Discounted cashflow (DCF)
Use of Def overcomes some of the disadvantages of the
traditional technique of payback.
Two common features to DCF methods:
a) Use of cash flows not accounting profit.
This is preferred because:-
- Cash flows are more objective and in the end
are what actually count. Profits cannot be
spent cash is the life blood of the company.
- Accounting conventions regarding
revenue/capital expenditure classifications,
106

depreciation calculations, stock valuations
become largely redundant.
- The whole life of the project is to be
considered therefore it becomes unnecessary
and misleading to consider accounting profits
which are related to periods (period
oriented- monthly, quarterly, annually)
- Timing or expected timing of cash flows is
more easily ascertained.
Typical cash flow items include;
1. project revenues
2. cost grants
3. resale or scrap value of assets
4. tax receipts capital injection
(contribution)
5. any other cash inflows caused by accepting
the project.
107
Cash outflows
- initial investment in acquiring the assets
- project costs (labour, materials etc)
- working capital investment
- tax payments
- any other cash outflows caused by accepting
project.
b) Time value of money (money received now is worth more
than money
received in use of money)
It is preferable to receive a given sum of money earlier
rather than later because the sum received earlier can be
put to use by earning interest or some productive investment
within the business.
Assumptions in basic DCF Appraisal
a) uncertainty does not exist
b) inflation does not exist
c) appropriate discount ate to use is known
108

d) a perfect capital market existsi.e.
unlimited funds can be raised at the
market rate of interest.
NPV method
It calculates the present values of expected cash inflows
and outflows (i.e the process of discounting) and finds out
whether in total the present value of cashinflows is greater
than the present value of cash out flows.
NPV = C (1 + r)
Where C = net cash flow
= Summation of
r = discount rate
e.g An investment is being considered for which the net
flows have been estainated as follows.
Period cashflow PVF Discounted PV
Yr 0 Yr 1 Yr2 Yr3 Yr4
109

-9500 +3000 +4700 +4500
+3200
What is the NPV if the discount rate is 20%. Is the project
acceptable?
NPV = -9500 + (0,833 x 3000) + (0,094 x 4700)
+ (0,579 x 14800) + (0,482 x 3200)
= $582
Use tables
To verify use calculator I
1 + r
Investment acceptable because it has positive NPV at the
firm’s cost of capital.
Interpretation: the NPV means potential increase in
consumption made possible by the project valued in present
day terms.
Internal Rate of return (IRR)
Alternative names:
- DCF yield
110

- Marginal efficiency of capital
- Trial and error method
- Discounted yield
- Actual rate of return
Definition
- It is the discount rate which gives zero NPV.
- It can be found by either
i) drawing a graph known as a present value profile
or
ii) calculations involving lines interpolation.
Present value profile
- Is a graph of the project NPV’s at various
discount rates
- Plot two points one at a rate which gives
positive NPV and one at a rate which gives a
negative NPV
111

e.g 20% gives + $ 582 NPV; and a higher rate is tried to see
if a negative NPV is obtained e.g 25% discount rate gives –
322 NP
Plot these points and draw a line between them to see where
it crosses the horizontal axis which gives then IRR
PRESENT VALUE PROFILE
700 -
600 -
+ VE 500 - NPV @ 20% = $
582
400 -
300 –
112
200 -
100 - IRR i.e the discount rate which gives
NPV 0 - zero NPV
$ 100 - 5 10 15 20 25 30 35
40
- VE 200 -
300 - NPV @ 25%
= $ -322
400 -
500 -
Note
a) at least out discount rate must be
chosen which gives a negative NPV so
that the present values line crosses the
horizontal axis.
b) The present value line crosses the axis
at approximately 23% which is close
enough estimate for most practical
purposes.
Finding the IRR by linear interpolation
113

IRR C
= 20% + 5% 582904
(a) (b) (d)
Where
a) is a discount rate which gives a positive NPV
i.e 20% = $582
b) Is the difference between (a) and the rate which gives a
negative NPV
25% - 20% = 5%
c) Is the positive NPV at discount rate chosen in a) i.e
$ 582
d) Is the total range of NPV at rates chosen i.e +582 to –
322 = 904
Decision rule using IRR:
Where calculated IRR is greater than company’s cost of
capital then project is acceptable.
NPV and IRR compared:
a) Accept/reject decisions
114
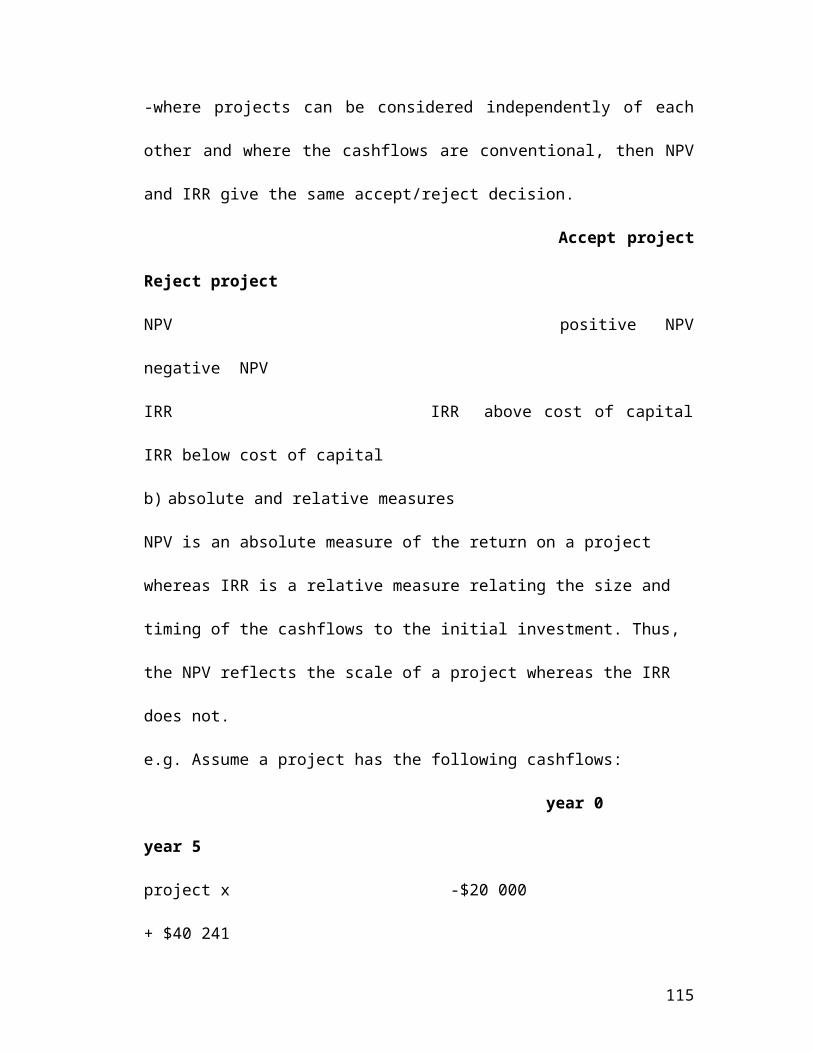
-where projects can be considered independently of each
other and where the cashflows are conventional, then NPV
and IRR give the same accept/reject decision.
Accept project
Reject project
NPV positive NPV
negative NPV
IRR IRR above cost of capital
IRR below cost of capital
b) absolute and relative measures
NPV is an absolute measure of the return on a project
whereas IRR is a relative measure relating the size and
timing of the cashflows to the initial investment. Thus,
the NPV reflects the scale of a project whereas the IRR
does not.
e.g. Assume a project has the following cashflows:
year 0
year 5
project x -$20 000
+ $40 241
115

NPV @ 10% = $4990
IRR = 15%
Therefore, project is acceptable by both methods-assuming
10% is the cost of capital.
Now assume that the project is scaled by a factor of 10:
Year 0
year 5
Project 10x = 200 000
+402 410
NPV = 49 900
IRR = 15%
NPV clearly distinguishes between project x and project
10x whereas IRR remains unchanged at 15%.
c) Mutually Exclusive projects
This where only one of several alternative projects can
be chosen. Projects are ranked in order of attractiveness
and choice is made on the most profitable. In such
circumstances NPV and IRR may give conflicting rankings.
116

A property company wishes to develop a site it owns.
Three sizes of property are considered and costs and
revenues are as follows:
Year 0
year 1 to perpetuity
Expenditure
rentals per annum
$million
$million
small development 2
0,6
medium development 4
1
large development 6
1,35
The cost of capital is 10 % and it is required to rank
the projects by NPV and IRR and to select the most
profitable.
The projects are mutually exclusive because the building
of one size of development excludes the others.
117

Perpetuity = is a constant stream of cashflows without
end e.g. bonds give cashflow stream (yearly interest)
PV = C + C + C
1 +r ( 1 + r) ( 1 + r)
= C
r
NB ranking is preferred i.e. large development because it
leads to the greatest increase in wealth for the company.
Non-conventional cash-flows (the multiple rate problem)
Non-conventional cashflows –where cashflows vary;
opposite of conventional cashflows i.e. an initial
cashflow followed by a series of inflows.
e.g.
year 0 year 2 year 3
project x -2
000 +4 700 -2 750
project y +2
000 - 4 000 +4 000
Project x has 2 outflows and is thus no-conventional.
118

Project y has an outflow in a year’s time instead of
initially and is thus non-conventional.
When a project has non-conventional cash-flows it may
have:
i. One IRR
ii. Multiple IRRs
iii. No IRR
Multiple rates:
Project x =two IRRs at 10% and 25%
Project y =No IRR
NPV Method gives clear, unambiguous results
whatever the cash-flow pattern
Project x has positive NPVs at discount
rates between 10% and 25% and negative
NPVs at lower and higher rates. Project y
has a positive NPV at any discount rate.
NPV @ 0% = -50
NPV @ 10% = 0
NPV @ 15% = +10
119

NPV @ 25% = 0
NPV @ 30% = -14
Annuity:
This is a level of stream of regular payments that lasts for
a fixed number of periods.
PV annuity = C + C + C……..+
C
1+r 1+ r
1+r 1+r
PV annuity = C
Exercises:
1. Mr X has won a lottery paying $50 000 a year for twenty
(20) years. He is to receive his first payment a year
from now. If interest rate is 8%. What is the true
value of lottery?
2. A firm can generate net cash flows of $500 000 in the
first year and +$200 000 for each of the next five (5)
years . Calculate the Present Value.
120

3. A firm is considering a project with a cash outlay of
one million Zim.dollars now and a five (5) yearly cash
inflows of $500 000. What is the NPV at 10%?
4. What is the Net Present Value and Internal Rate of
Return of the following series at 10%
Year 0 1 2
3 4
Cash-flows -2 000 +800 +600
+700 +500
Draw a present value profile of the above. Is the
project acceptable at 10% cost of capital?
5. An entrepreneur is considering buying a freezit
making machine
Summary of NPV and IRR comparison:
NPV is technically superior to IRR and is simpler
to calculate
Where cash-flow patterns are non-conventional there
may be nil or several IRRs making the IRR impossible
to apply
121

NPV is superior for ranking investments in order of
attractiveness
With conventional cash-flow patterns both methods
give the same accept or reject decision
Where discount rates are expected to differ over the
life of the project such variations can be readily
incorporated into NPV calculations but not in those
for the IRR.
Notwithstanding the technical advantages of NPV over
IRR is widely used in practice so that it is
essential that students are aware of its inherent
limitations.
7.1.0. EXECUTING THE PROJECT WORK
PROJECT CONTROL – 3RD phase of project management cycle
Consists of
1. – monitoring progress o f each project item
2. – assessing its effects on the total project
122

3. – taking the necessary action on the critical items to
keep the project on the planned schedule.
7.1.1 Project control system and system design
Control of a project environment involves three operating
modes:
Measuring - determining progress through formal and
informal reports
Evaluating - determining the cause of deviations from
the plan and how to react
Correcting - taking actions to correct the situation
System design
Its purpose is to ensure that you and the team always have
information to make an accurate assessment of:
o What has happened and compare this with
o What should have happened according to the plans.
Controlling the project means managing the many problems
that arise to maintain the project schedule.
You do this on a day –to day basis through:
123

Monitoring the work – observing and checking what is
happening
Identifying and resolving the problems that arise
Tracking the project – comparing with the plan and
updating the records.
Good control of any process is dependent on accurate data-
keep project file up to date. This involves a regular check
and up date of:
Project organization chart
Stakeholder list
Key stage responsibility chart
Project brief
Key stage Gantt charts
Key stage work plan charts
Project risk log
Control system must be capable of providing information on:
Resource required –availability and its effective use
Equipment and machinery required and used
124

Materials used, ordered and required
Costs incurred to date and forward commitments
The results achieved – tasks completed
A valuation of the results- as expected
Monitoring ProgressMonitor:
- The team (talkings to them, holding meetings)
- The stakeholders (hold 1 to 1 meetings)
- Performance (checking activity)
Do this by MBWA, observe and have conversations.
Do this by written reports which provide a historical record
Tools to use: working with WBS
Use of Gantt chart/bar charts
Project status report
Good monitoring and tracking (measuring) builds team
confidence, anticipates problems and prepares future
success.
Taking corrective action:
1. rearrange work loads
2. put more effort into the job
125

3. put additional resources
4. more milestone date
5. lower scope /quality of results demanded.
Go through problem solving process p158 - 161
Regular progress meetings
essential part of project control process
keep your meetings to the point
focus the team on what must be done next not history
come up with an action list
project control is dependant on good communication
7.1.4. Project status report
a project status report is prepared on a regularly scheduled
basis(usually monthly)and reflects programme content in a
summary form.
Status of key project items
Assessment of key project items
Resolution of “troubled” areas
Difficulties anticipated in the work waiting to be done
Status report documents p50-55 spinner
126

- many include 3 documents
- cover letter
- executive highlights (listing, in a sentence or two)
- project summary
- bar chart
- project status
- milestone report
7.1.3. Cost Control Measures
Developing cost estimates
- Cost estimates for project activities are provided by
experienced personnel
- Sum total of project costs relate to cost estimates as
standards
- Usually cost associated with activities on the network
are reliable costs.
A completed bar chart timing schedule is a prerequisite to
developing a project cost schedule. You can use the WBS and
Gantt chart as the basis of collecting data.
Steps to develop a cost schedule
127

1. complete bar chart time schedule and add the cost value
of each activity to its corresponding bar.
2. calculate the cost per unit
3. tabulate cost schedule
7.15. Managing time
Time is the most valuable resource that, if lost or
misplaced is gone forever. There is need to convert
this constraint to a manageable resource
Barriers to effective time management.
- encourages good time management for:
self
the team
stakeholders
8.0 People problems and role of project manager
8.1.1 Qualities of a project manager
Role of a project manager is a complex role because of
involvement in a changing environment. It is a temporary
management role with specific responsibilities that are
linked only to the project.
Project manager has to balance the demands and needs of :
128

Customer
The project
The organization
The project team
Primary Responsibilities of a project manager include:
Selecting the core team with project sponsor
Identifying and managing project stakeholders
Defining the project and securing stakeholder
approval
Identifying and managing the risks
Allocating and securing resource commitments
Monitoring and tracking project progress
Solving the problems that interfere with progress
Controlling costs
Leading the project team
Informing stakeholders of progress status
Delivering the project deliverables and benefits
Managing the performance of everyone involved with
the project
8.1.2. Managing project stakeholders
129

Stakeholders are the people who have a specific and clearly
definable interest in the project. They have influence in
the management of the project as they provide some resources
e.g. line managers.
Other stakeholders include: (internal/external stakeholders)
- Your customers
- Your project sponsor
- Customer’s user group
- Finance department
- Production
- Marketing
- Personnel e.t.c
They need to be consulted and managed all stakeholders have
a hidden agenda about what they expect from your project and
you need to expose these expectations before you define the
project.
External stakeholders also have an interest in the project
Suppliers
Contractors
130

Consultants
Government or agencies etc
8.1.3 Projects and conflicts
Hopes, desire and needs of people across the organization as
well as outside players are often in compatible with each
other resulting in conflict where change takes place,
conflict is inevitable.
Most common types of conflict:
- resources
- equipment and facilities
- budgets and costs
- technical opinions
- priorities
- procedures
- responsibilities
- personality clashes
Some common causes for conflict1 diverse expertise in project team
2 low level of authority given to project leader
131
3 lack of understanding of project objectives by project
team
4 unclear or shared responsibilities
5 unclear schedules and performance targets for team
members
6 local interference from high level involvement
7 people do not like each other or do not get on together
in their worst
Conflict is good if it:-
- brings problems and issues out into the open for
discussion
- brings the team together, screening loyalty
- promotes creativity, generating new ideas and work
practices
- focuses people to give their work more detailed
analysis
Good conflict generates win-win relationship between
individuals, promoting sharing of information and improved
motivation.
132
Bad conflict- creates stress, stiring up negative feelings
- makes the working environment less pleasant
- surely reduces effectiveness of communication
processes
- interferes with coordination of effort between groups
and individuals
- encourages an automatic approval to working
Bad comfort generates a win-lose relationship between
individuals.
A team without conflict could be perceived as complaint and
lethargic with little creativity.
Projects and teamwork:
Successful teams do not just happen, they have to be built
through effective leadership and commitment.
Select your core team carefully
You want creative, enthusiastic people with a strong
sense of responsibility and commitment
133
A successful team consists of a carefully designed
mixture of right skills and personalities who can work
together without dissension and conflict.
Take positive actions to build the team
Regularly review the performance
Test team working
Encourage participation
9.0 USE OF COMPUTERS IN PROJECT
What can software do?Most software programmes are in project work designed around
some fundamental features that include:
Tabulating a list of tasks at different levels of the
WBS
Inputting duration data
Calculating critical path and float date
Deriving the Gantt chart
Deriving the logic diagram or Pert chart
On putting a list of resources
Assignment of resources by responsibility or capacity
Inputting of cost data as resources cost rates and
materials costs
134

Deriving a budget and cost curves
Scheduling the project based on input data
“what if” analysis of issues using a Gantt chart
reassignment of resources
identifying and correcting resource overloads
outputting a wide range of reports
Software programmes can be used for:
Graphics part - produces Gantt char t,logie diagram or
Pert chart
And graphics used for reporting
Spread sheet part – is used for the forms, table, reports
Database part - stores and manipulates the data
provided for
Calculations using the spread sheet
section to
Insert results into the tables,
charts, diagrams
Viewed on the screen.
Selecting project software:
135

Selection should not be based on price alone but includes
are view of :
past track record of performance
ease of use
compatibility with other software in use
stand alone or networked and availability
platforms available
features for planning and scheduling
features for control and updating
quality and eases of reporting
networking features-passwords , access restrictions etc
training available
helpline and back up available
Using a software programme
Steps:
open a new project file
insert project title, start date and project manager’s
name
set up the master calendar giving public and
organizational holidays
136

if possible design the specific formats for the tables
you require
input the project organization – the core team on a
resource listing
set up resource calendars – one for yourself and each
team members to show their available capacity for the
project, including holidays
input the list of key stages to a blank Gantt chart
assign responsibilities for the key stages –select by
responsibility
input the durations for each key stage
input dependencies between the key stages
programme calculates the critical path, the key stage
start and finish times and floats
Gantt chart produced, highlighting critical stages
Pert diagram produced
Table generated showing early and late start and finish
times with total float
Total project time is now available
137

Input cost data as resource lost rates and materials
costs for key stages
Operating budget cumulative curve calculated
Use “update mode” during implementation.
10.0 CLOSING, EVALUATING AND APPRAISING PROJECTS
Closure of projects does not happen, it must be planned
with care.
The date may relate to when a decision is to be made
concerning outside financing, when announcement of a
project to the press is planned, when a thorough
project review is scheduled on whatever.
Milestone scheduling indicates seluted dates by which
various phases of the entire project to be completed.
Milestones add detail to Gantt chart
Milestones serve as formal review points where
costs, progress and the need for replanning on
schedule modification can be reviewed.
138

Gantt chart shows the relationship between milestones
within the same task but not within different tasks.
Establish with customer and user group the criteria
they want to use to confirm completion. These must be
measured by agreed methods to avoid conflict
a) Acceptance process (handover) must be based on a
checklist agreed with customer and user group.
Acceptance process should identify customer
representative with authority to assign the project
completion report.
b) Hold a team meeting to review all tasks and present
completion report for approval and sign – off
c) Evaluate your project to learn what went well and what
went wrong.
PITFALLS IN PROJECT MANAGEMENT
Possible flaws relate to the following:
Foundations of the project [PITFALLS IN TOR]
139
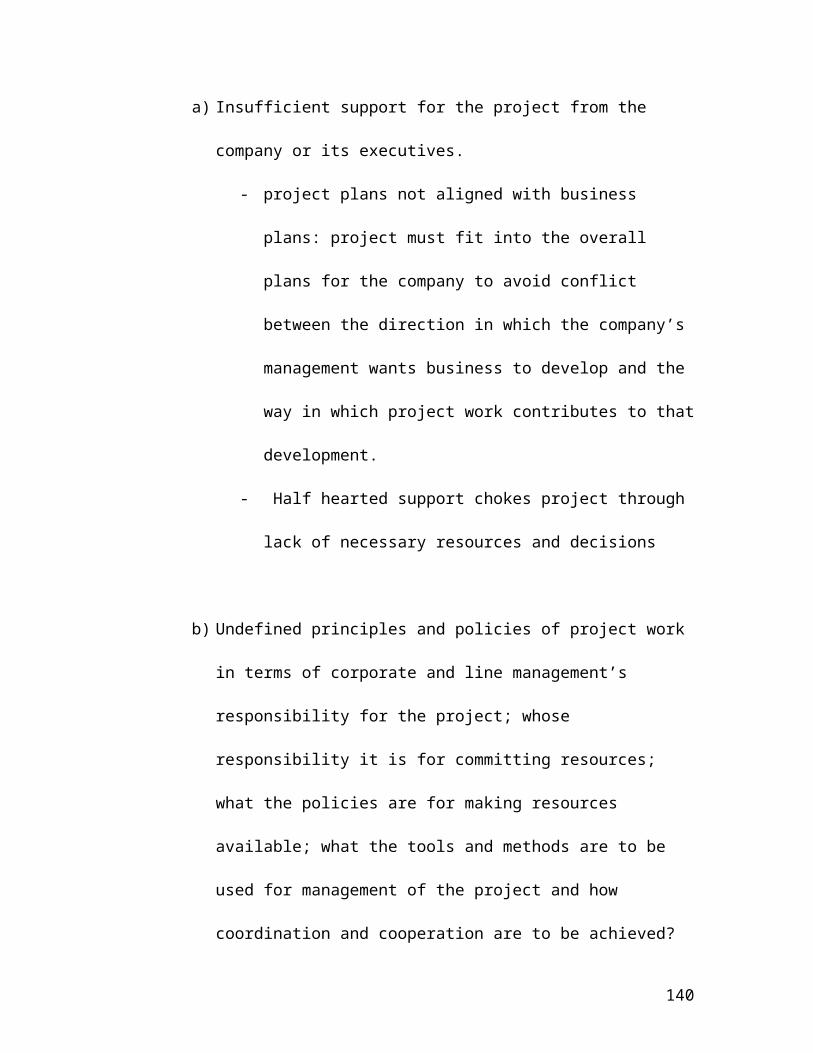
a) Insufficient support for the project from the
company or its executives.
- project plans not aligned with business
plans: project must fit into the overall
plans for the company to avoid conflict
between the direction in which the company’s
management wants business to develop and the
way in which project work contributes to that
development.
- Half hearted support chokes project through
lack of necessary resources and decisions
b) Undefined principles and policies of project work
in terms of corporate and line management’s
responsibility for the project; whose
responsibility it is for committing resources;
what the policies are for making resources
available; what the tools and methods are to be
used for management of the project and how
coordination and cooperation are to be achieved?
140

c) Poor project definition
- Goals for project are imprecise affecting
adversely 4 phases to problem solving ie
Decision making
Decision taking
Implementation
Monitoring
- Undefined limits of scope (use milestone plan
and a clear responsibility chart.
- Unbalanced levels of ambition.
- Project manager has to balance technical
aspects, the right people and system
(physical products) using a milestone plan
(PSO project mind set)
(ii) Planning of Project
planning level is uniform: plan contains too
much detail for some users and too little for
141

others: use milestone plan at management
level and activity plan at task level.
Planning tools are too unwieldy
Planning range is psychologically unsound
Planning method discourages creativity and
encourages bureaucratic – democratic process,
free of jargon, tools and methods.
Planning of time and cost are over optimistic
Unrealistic, arbitrary plans.
Insufficient previous experience against
which to judge the work content.
Planning of resources overestimates their
competence and capacity.
Project calendar ignores lost time.
Plan omits activities: activity planning
(iii) PITFALLS IN ORGANISING
Alternative orgamisations for the project are not
considered.
- Distribution of responsibility is not defined
142
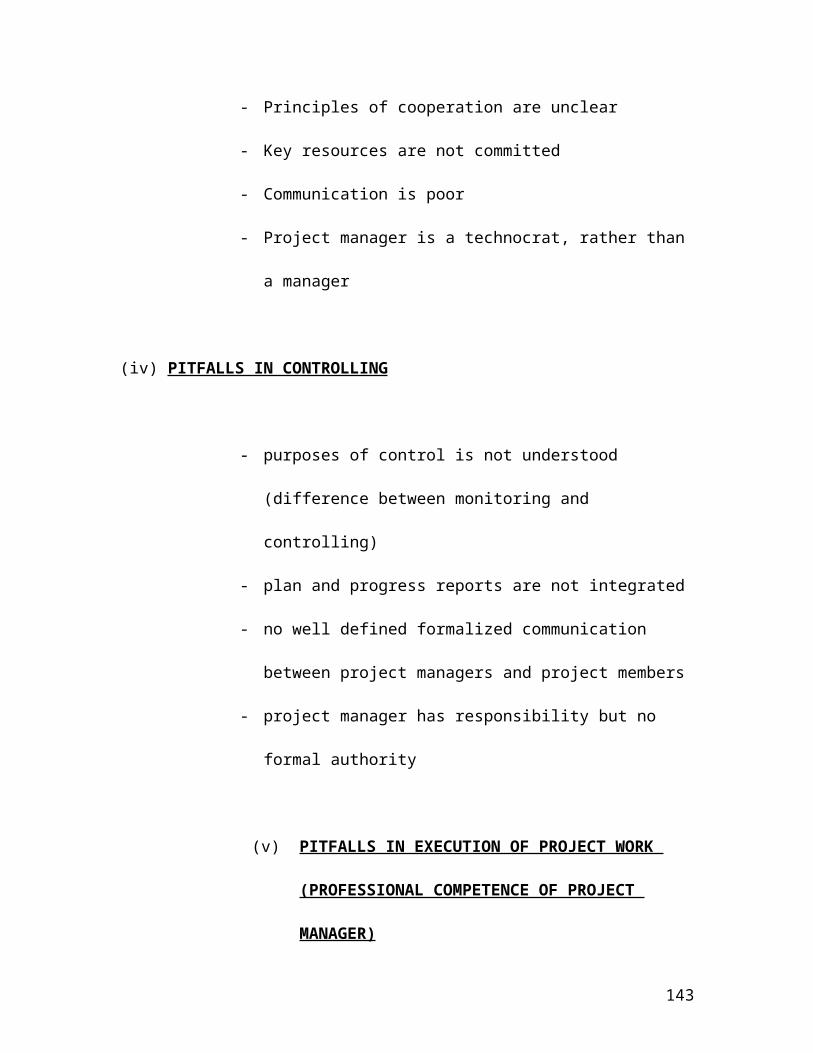
- Principles of cooperation are unclear
- Key resources are not committed
- Communication is poor
- Project manager is a technocrat, rather than
a manager
(iv) PITFALLS IN CONTROLLING
- purposes of control is not understood
(difference between monitoring and
controlling)
- plan and progress reports are not integrated
- no well defined formalized communication
between project managers and project members
- project manager has responsibility but no
formal authority
(v) PITFALLS IN EXECUTION OF PROJECT WORK
(PROFESSIONAL COMPETENCE OF PROJECT
MANAGER)
143

- complexity of coordinating a variety of
resources is under estimated
- changes to the plan or specification are
uncontrolled
- activities are not completed and documented
before others begin
- the targets of time , cost and quality are
unbalanced
DISCUSSION:
Review a project that has failed. Examine the reasons for
its failure. At what stage in the life cycle did this
occur? What lessons can future project managers learn?
144