
Project Management and Quality Control
41
Yarmouk University Yarmouk University Hijjawi Faculty For Engineering Tech Hijjawi Faculty For Engineering Tech Project Management and Quality Control 1 Mwaffaq Otoom & Shadi Alboon Lecture03
-
Upload
khangminh22 -
Category
Documents
-
view
1 -
download
0
Transcript of Project Management and Quality Control

Yarmouk UniversityYarmouk UniversityHijjawi Faculty For Engineering TechHijjawi Faculty For Engineering Tech
Project Management
and Quality Control
1Mwaffaq Otoom & Shadi AlboonLecture03

Overview
�What is project selection?
�What techniques are used to select projects?
�Project selection models and evaluation
factorsfactors
� Numeric models
� Nonnumeric models
2Lecture03 Mwaffaq Otoom

Project selection
�Project selection is the process of evaluating
individual projects or groups of projects, and then
choosing to implement some set of them so that the
objectives of the parent organization will be achieved.
3Mwaffaq Otoom & Shadi AlboonLecture03
objectives of the parent organization will be achieved.
�Managers often use decision-aiding models to
abstract the relevant issues about a problem from the
plethora of details in which the problem is embedded.
�Models represent the problem’s structure and can be
useful in selecting and evaluating projects.

What Projects to Bid on
� Company selection of the projects they will bid on is generally based on:
�Their own expertise and track record
�Resources they have available
�Their chance of winning the bid�Their chance of winning the bid
� They do not want to waste that effort on bids where they are unlikely to be successful
� Preparing a bid is expensive!
4Lecture03 Mwaffaq Otoom & Shadi Alboon

Criteria for Project Selection
� Each project has different risks, benefits and costs – often
much uncertainty.
� Companies need to be able to evaluate and select those projects
that most closely fit the firm’s strategic objectives – always done
in the context of competing for limited resources.
5Lecture03 Mwaffaq Otoom & Mohammad Al Bataineh
in the context of competing for limited resources.
� Why Project Selection Models?
� Models abstract the relevant issues about a problem from the plethora of
details in which the problem is embedded (Model is a representative of the
reality, not the exact replica (reality is more complex)
� Models help make rational decisions (Models do not make decisions, people
do)
Criteria for Project Selection Models
� When a firm chooses a project selection model, the following criteria are most important:� Realism – The model should take into account the realities of the firm’s
limitations on facilities, capital, personnel, and so forth.
� Capability- The model should be sophisticated enough to deal with multiple time periods, simulate various situations both internal and external to the project (e.g., strikes, interest rate changes), and optimize the decision.
� Flexibility – The model should have the ability to be easily modified, or to be � Flexibility – The model should have the ability to be easily modified, or to be self-adjusting in response to changes in the firm’s environment (e.g. tax laws change, new technological advancements alter risk levels, and, above all, the organization’s goals change).
� Ease of Use - The model should be reasonably convenient, not take a long time to execute, and be easy to use and understand.
� Cost - Data-gathering and modeling costs should be low relative to the cost of the project.
� Easy Computerization – It must be easy and convenient to gather, store and manipulate data in the model.
6Lecture03 Mwaffaq Otoom & Mohammad Al Bataineh

Nature of Project Selection Models
� Two basic types of project selection models:
� Numeric models (Use financial metrics such as cash flow, profit … etc.)
� Nonnumeric models (do not use numbers as inputs into the model, but other data or
considerations).
• If the estimated level of goal achievement is sufficiently large, the project is selected.
�� Two Critical Facts:
� Models do not make decisions - People do!
A model helps in making project selection decisions.
� All models, however sophisticated, are only partial representations of the
reality they are meant to reflect (Reality is far too complex for us to capture more
than a small fraction of it in any model. )
7Lecture03 Mwaffaq Otoom & Mohammad Al Bataineh

Project Evaluation Factors
� Production Factors� Interruptions, learning, process
� Marketing Factors� Customer management issues
� Financial Factors� Return on investment – what is � Return on investment – what is
acceptable?
� Personnel Factors� Skills and training, working
conditions – what impact on employee motivation?
� Administrative and Miscellaneous Factors� Regulatory standards, ‘strategic
fit’ – with what?
8Mwaffaq Otoom & Shadi Alboon & Mohammad Al BatainehLecture03

Project Evaluation Factors
� Production Factors� Interruptions, learning,
process
� Marketing Factors� Customer management
issues
� Financial Factors� Return on investment –� Return on investment –
what is acceptable?
� Personnel Factors� Skills and training, working
conditions – what impact on employee motivation?
� Administrative and
Miscellaneous Factors
� Regulatory standards, ‘strategic fit’ – with what?
9Mwaffaq Otoom & Shadi Alboon & Mohammad Al BatainehLecture03
Numeric models
� Models that return a numeric value for a project that can be easily compared with other projects
� Two major categories of numeric models:
1. Profit/profitability (considered the sole measure of project acceptability)
2. Scoring (multiple criteria for project evaluation/selection are used)
10Lecture03 Mwaffaq Otoom & Mohammad Al Bataineh
Numeric models: Profit/Profitability
� Models that use profitability as the sole measure of project acceptability– there are several models:
– Payback Period - Initial fixed investment/estimated annual net cash
inflows from the project. فترة ا�سترداد.
– Average Rate of Return - Average annual profit/initial or average – Average Rate of Return - Average annual profit/initial or average
investment in the project متوسط معدل العائد.
– Discounted Cash Flow - Also referred to as the Present Value
Method التدفق النقدي المخفض
– Profitability Index – Net present value (NPV) of all future
expected cash flows/initial cash investment مؤشر الربحية
11Mwaffaq Otoom & Shadi Alboon & Mohammad Al BatainehLecture03
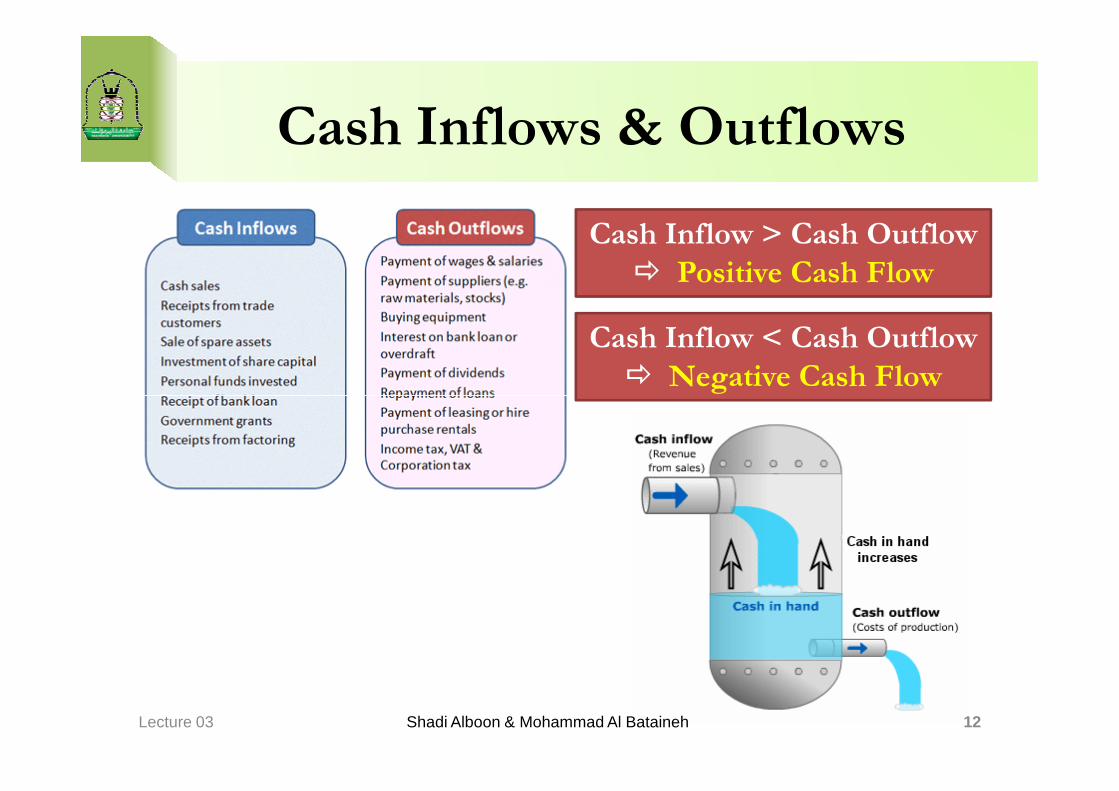
Cash Inflows & Outflows
Cash Inflow > Cash Outflow
� Positive Cash Flow
Cash Inflow < Cash Outflow
� Negative Cash Flow
Lecture 03 Shadi Alboon & Mohammad Al Bataineh 12
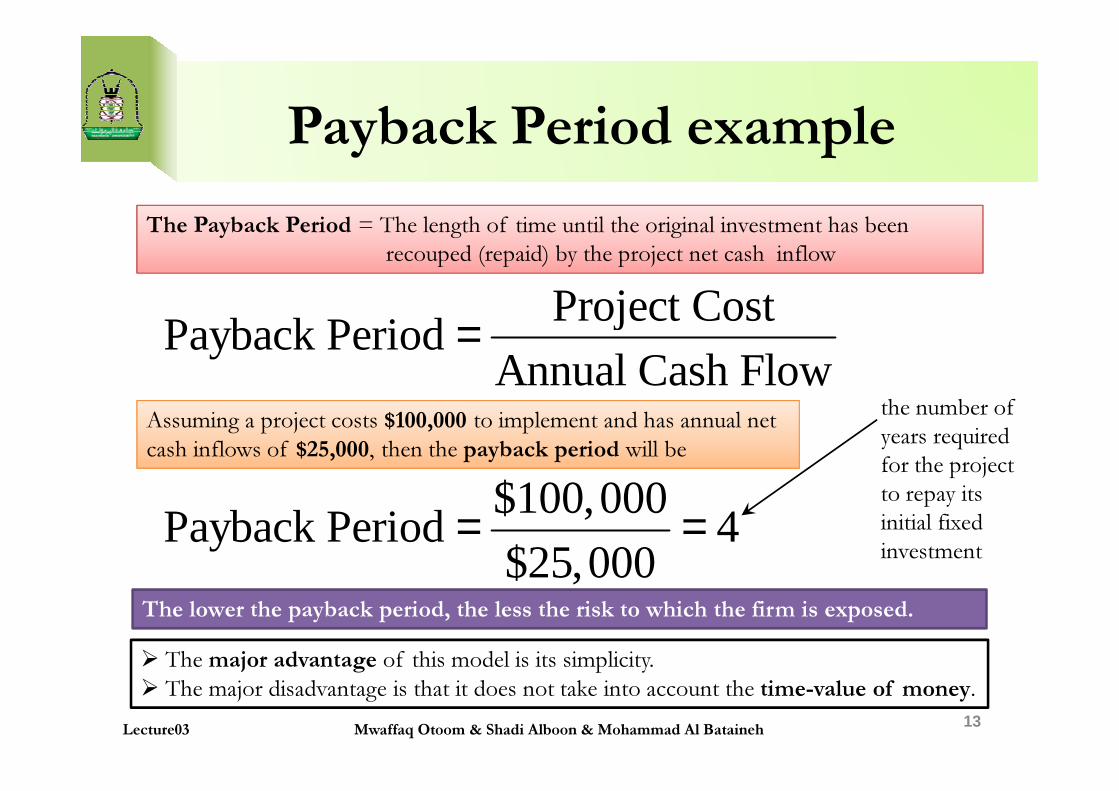
Payback Period example
Project CostPayback Period
Annual Cash Flow=
The Payback Period = The length of time until the original investment has been
recouped (repaid) by the project net cash inflow
the number of
13
$100,000Payback Period 4
$25,000= =
The lower the payback period, the less the risk to which the firm is exposed.
Lecture03
the number of
years required
for the project
to repay its
initial fixed
investment
Assuming a project costs $100,000 to implement and has annual net
cash inflows of $25,000, then the payback period will be
Mwaffaq Otoom & Shadi Alboon & Mohammad Al Bataineh
� The major advantage of this model is its simplicity.
� The major disadvantage is that it does not take into account the time-value of money.
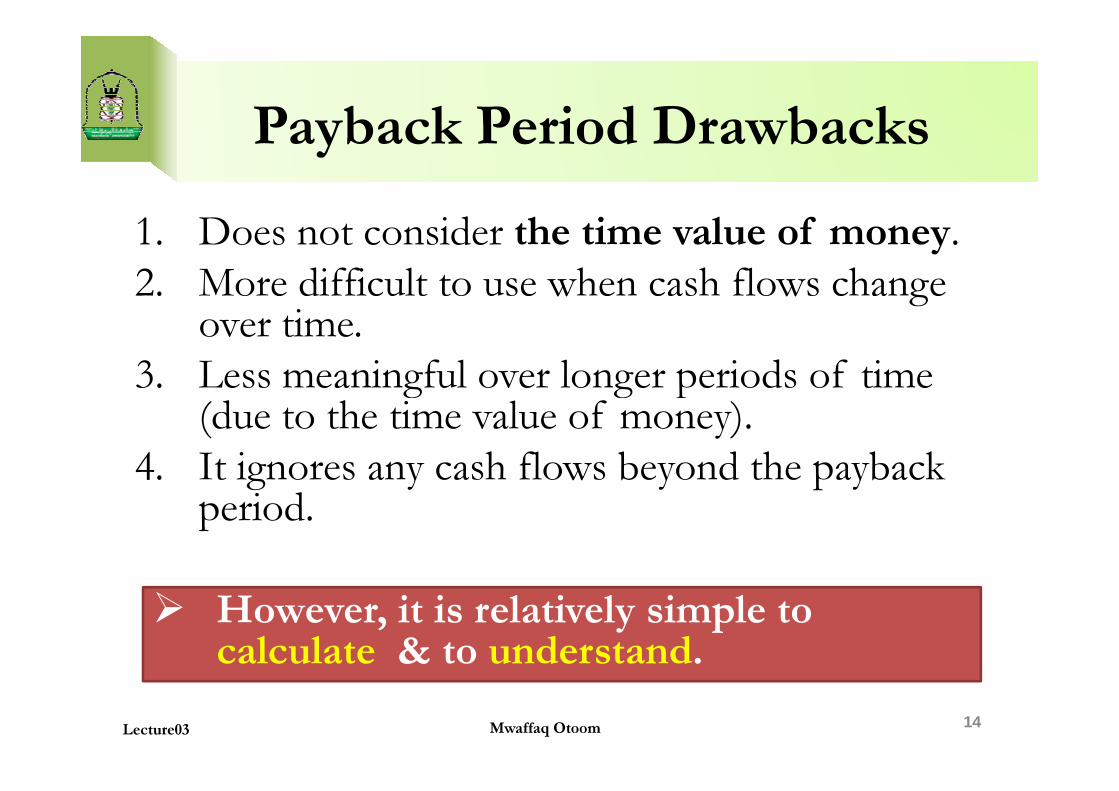
Payback Period Drawbacks
1. Does not consider the time value of money.
2. More difficult to use when cash flows change over time.
3. Less meaningful over longer periods of time (due to the time value of money).
3. Less meaningful over longer periods of time (due to the time value of money).
4. It ignores any cash flows beyond the payback period.
14Lecture03 Mwaffaq Otoom
� However, it is relatively simple to calculate & to understand.
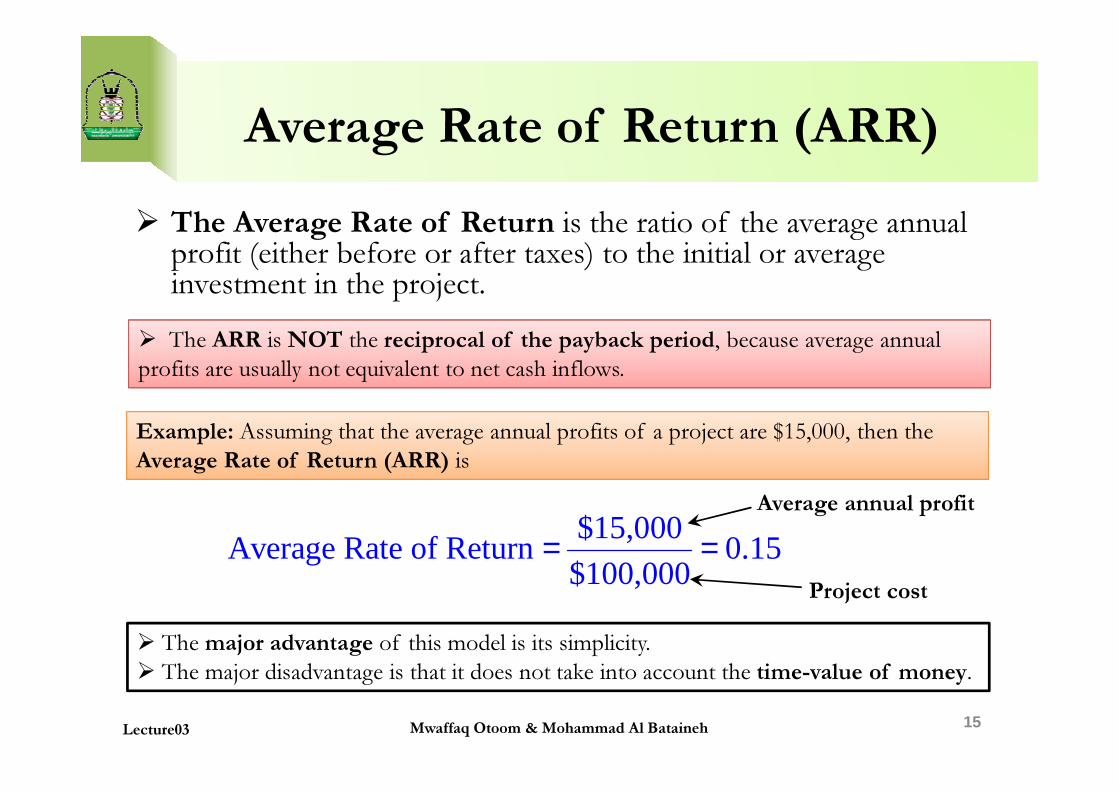
Average Rate of Return (ARR)
� The Average Rate of Return is the ratio of the average annual profit (either before or after taxes) to the initial or average investment in the project.
� The ARR is NOT the reciprocal of the payback period, because average annual
profits are usually not equivalent to net cash inflows.
15
$15,000Average Rate of Return 0.15
$100,000= =
Average annual profit
Project cost
Lecture03 Mwaffaq Otoom & Mohammad Al Bataineh
Example: Assuming that the average annual profits of a project are $15,000, then the
Average Rate of Return (ARR) is
� The major advantage of this model is its simplicity.
� The major disadvantage is that it does not take into account the time-value of money.
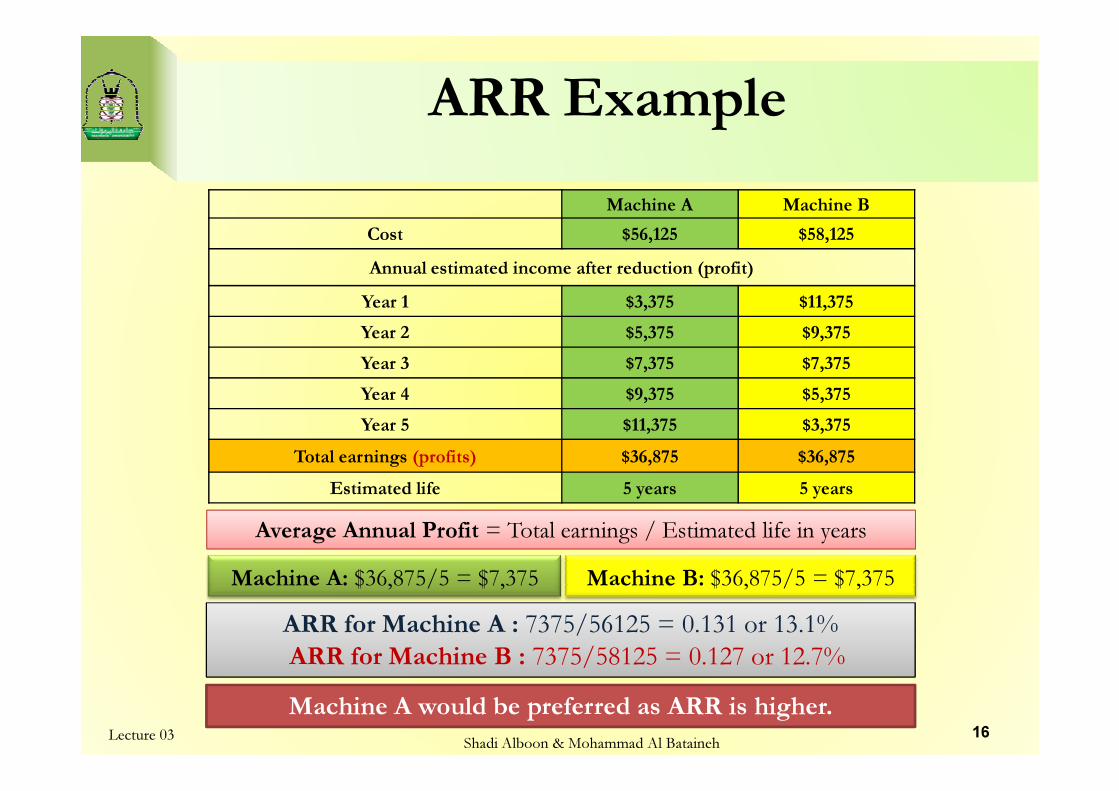
ARR Example
Machine A Machine B
Cost $56,125 $58,125
Annual estimated income after reduction (profit)
Year 1 $3,375 $11,375
Year 2 $5,375 $9,375
Year 3 $7,375 $7,375
Year 4 $9,375 $5,375
Lecture 03Shadi Alboon & Mohammad Al Bataineh
16
Year 4 $9,375 $5,375
Year 5 $11,375 $3,375
Total earnings (profits) $36,875 $36,875
Estimated life 5 years 5 years
Average Annual Profit = Total earnings / Estimated life in years
Machine A: $36,875/5 = $7,375 Machine B: $36,875/5 = $7,375
ARR for Machine A : 7375/56125 = 0.131 or 13.1%
ARR for Machine B : 7375/58125 = 0.127 or 12.7%
Machine A would be preferred as ARR is higher.
Discounted Cash Flow (NPV)
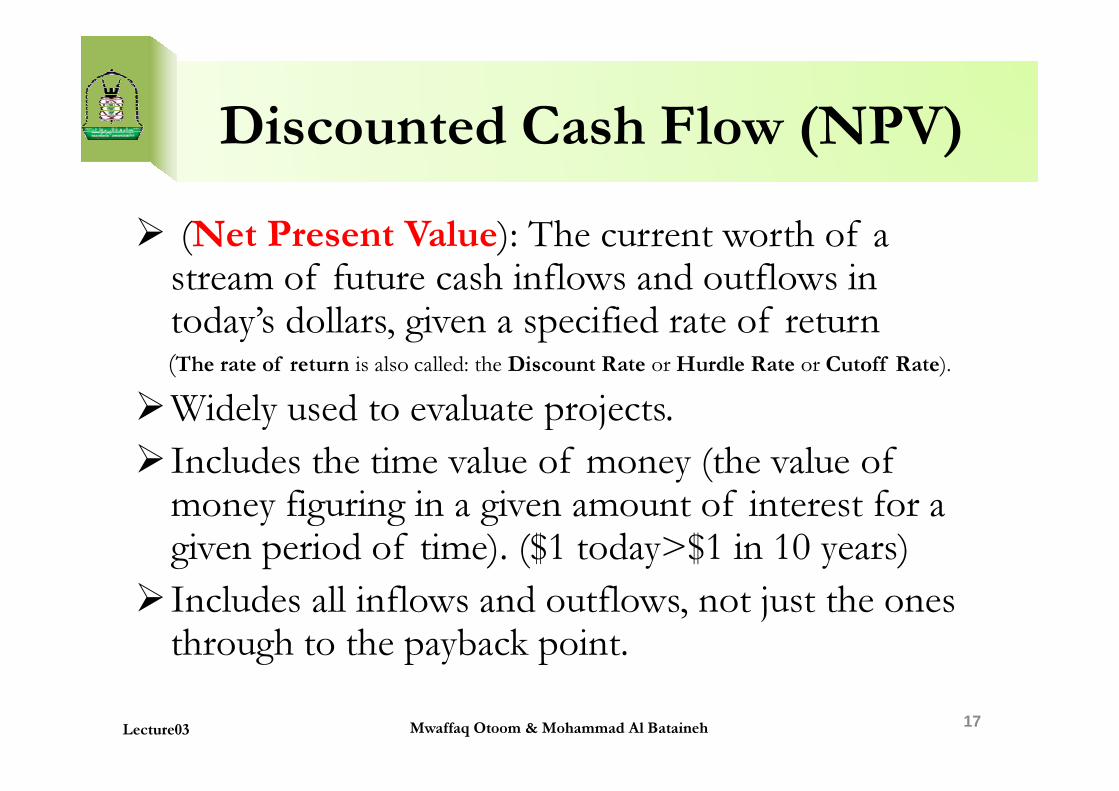
� (Net Present Value): The current worth of a stream of future cash inflows and outflows in today’s dollars, given a specified rate of return (The rate of return is also called: the Discount Rate or Hurdle Rate or Cutoff Rate).
�Widely used to evaluate projects.�Widely used to evaluate projects.
�Includes the time value of money (the value of money figuring in a given amount of interest for a given period of time). ($1 today>$1 in 10 years)
�Includes all inflows and outflows, not just the ones through to the payback point.
17Lecture03 Mwaffaq Otoom & Mohammad Al Bataineh
Discounted Cash Flow (NPV)
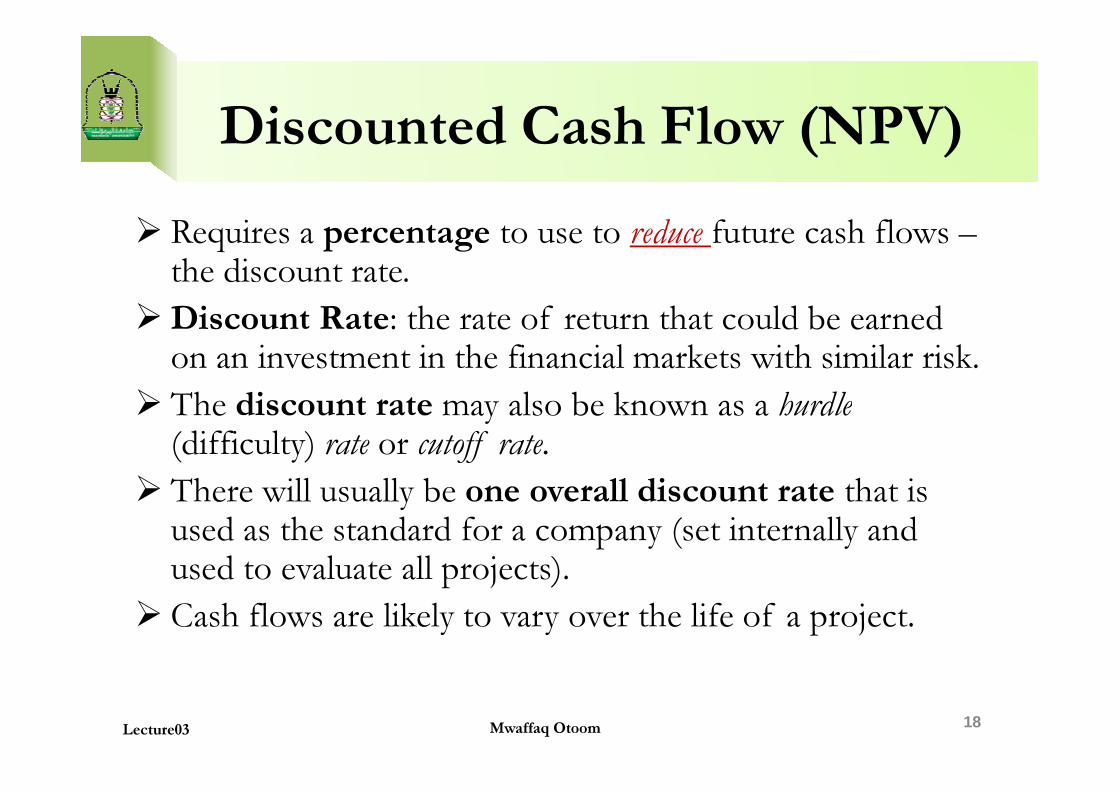
� Requires a percentage to use to reduce future cash flows –the discount rate.
�Discount Rate: the rate of return that could be earned on an investment in the financial markets with similar risk.
� The discount rate may also be known as a hurdle� The discount rate may also be known as a hurdle(difficulty) rate or cutoff rate.
� There will usually be one overall discount rate that is used as the standard for a company (set internally and used to evaluate all projects).
� Cash flows are likely to vary over the life of a project.
18Lecture03 Mwaffaq Otoom
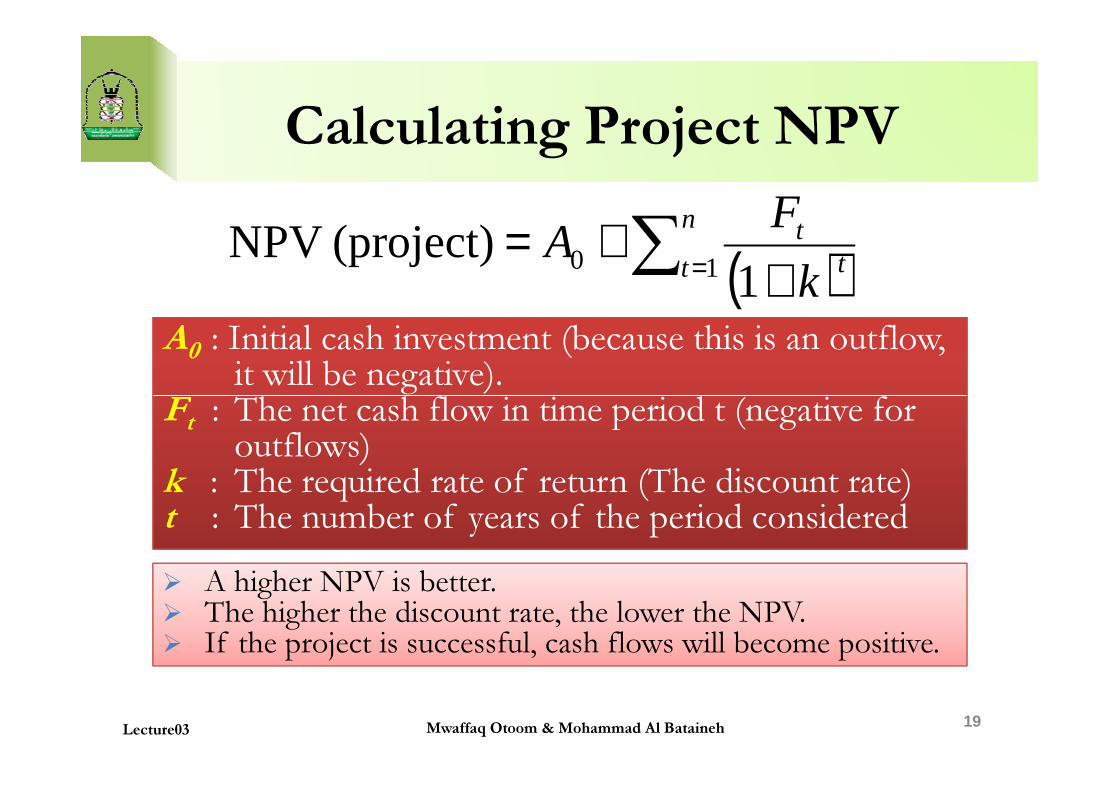
Calculating Project NPV
A : Initial cash investment (because this is an outflow, A0
: Initial cash investment (because this is an outflow, it will be negative).
F : The net cash flow in time period t (negative for
( )∑ = ++= n
t tt
k
FA
101
(project) NPV
19
Ft
: The net cash flow in time period t (negative for outflows)
k : The required rate of return (The discount rate)t : The number of years of the period considered
� A higher NPV is better.� The higher the discount rate, the lower the NPV.� If the project is successful, cash flows will become positive.
Lecture03 Mwaffaq Otoom & Mohammad Al Bataineh
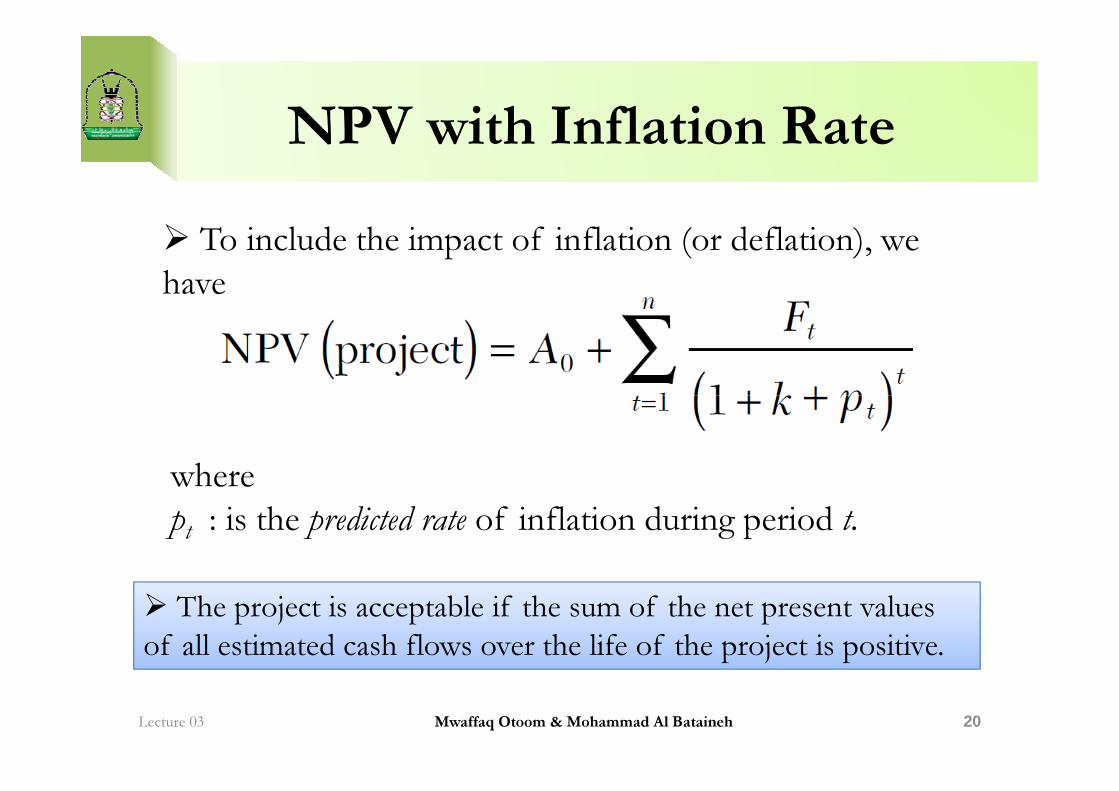
NPV with Inflation Rate
� To include the impact of inflation (or deflation), we
have
Lecture 03 Mwaffaq Otoom & Mohammad Al Bataineh 20
where
pt : is the predicted rate of inflation during period t.
� The project is acceptable if the sum of the net present values
of all estimated cash flows over the life of the project is positive.
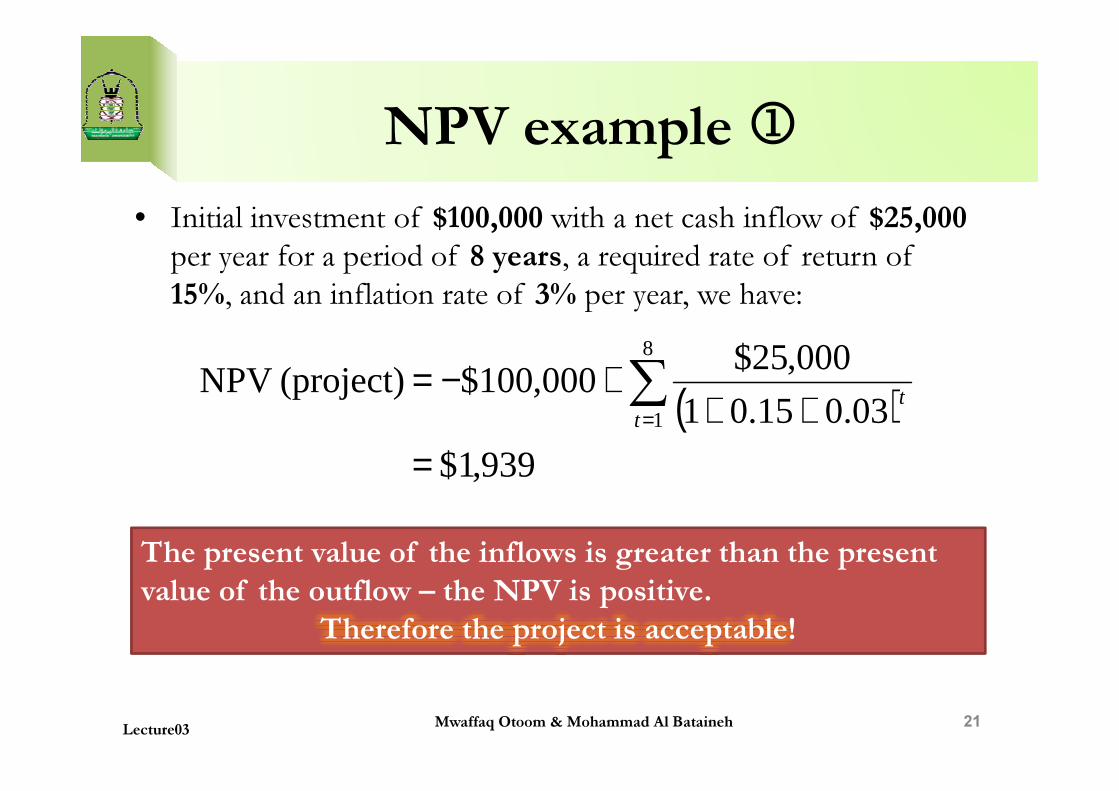
NPV example 1
• Initial investment of $100,000 with a net cash inflow of $25,000
per year for a period of 8 years, a required rate of return of
15%, and an inflation rate of 3% per year, we have:
( )03.015.01
000,25$000,100$ (project) NPV
8
+++−= ∑ t
Mwaffaq Otoom & Mohammad Al Bataineh 21
The present value of the inflows is greater than the present
value of the outflow – the NPV is positive.
Therefore the project is acceptable!
( )939,1$
03.015.01000,100$ (project) NPV
1
=++
+−= ∑=t
t
Lecture03
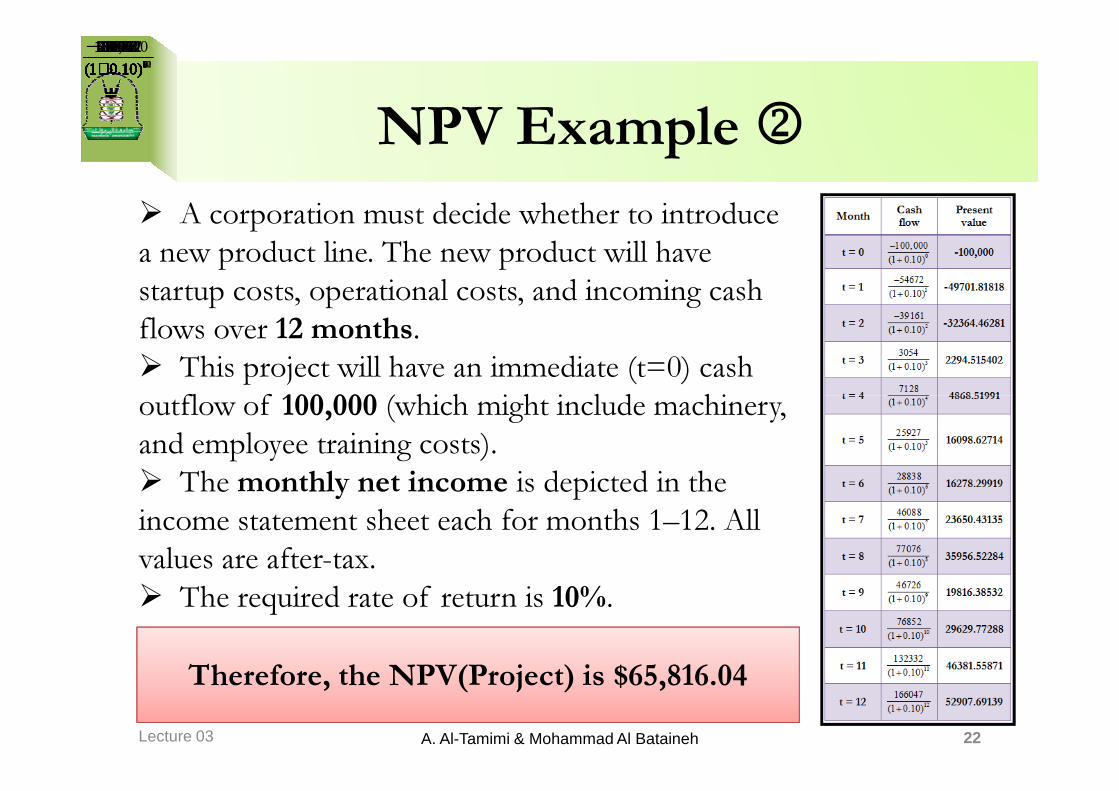
� A corporation must decide whether to introduce
a new product line. The new product will have
startup costs, operational costs, and incoming cash
flows over 12 months.
� This project will have an immediate (t=0) cash
outflow of 100,000 (which might include machinery,
NPV Example 2
0
100,000
(1 0.10)
−+ 1
54672
(1 0.10)
−+ 2
39161
(1 0.10)
−+ 3
3054
(1 0.10)+ 4
7128
(1 0.10)+ 5
25927
(1 0.10)+ 6
28838
(1 0.10)+ 7
46088
(1 0.10)+ 8
77076
(1 0.10)+ 9
46726
(1 0.10)+ 10
76852
(1 0.10)+ 11
132332
(1 0.10)+ 12
166047
(1 0.10)+
outflow of 100,000 (which might include machinery,
and employee training costs).
� The monthly net income is depicted in the
income statement sheet each for months 1–12. All
values are after-tax.
� The required rate of return is 10%.
Lecture 03 A. Al-Tamimi & Mohammad Al Bataineh 22
Therefore, the NPV(Project) is $65,816.04
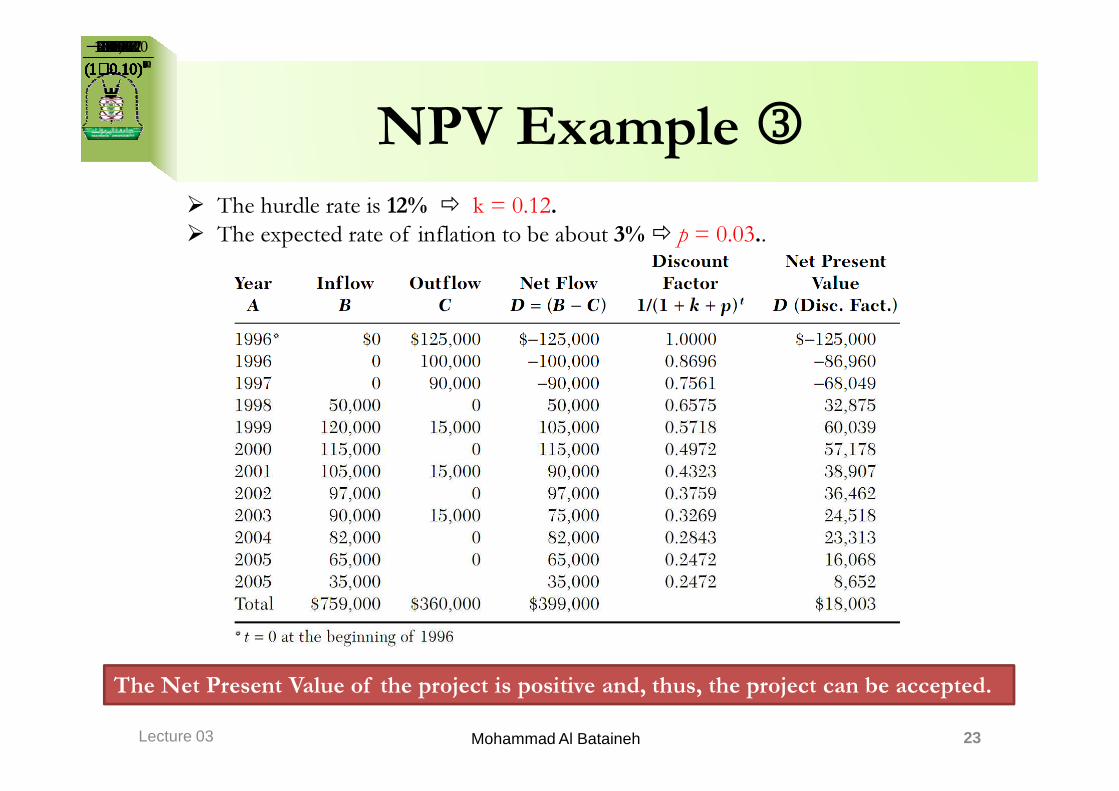
NPV Example 3
0
100,000
(1 0.10)
−+ 1
54672
(1 0.10)
−+ 2
39161
(1 0.10)
−+ 3
3054
(1 0.10)+ 4
7128
(1 0.10)+ 5
25927
(1 0.10)+ 6
28838
(1 0.10)+ 7
46088
(1 0.10)+ 8
77076
(1 0.10)+ 9
46726
(1 0.10)+ 10
76852
(1 0.10)+ 11
132332
(1 0.10)+ 12
166047
(1 0.10)+
� The hurdle rate is 12% � k = 0.12.
� The expected rate of inflation to be about 3% � p = 0.03..
Lecture 03 Mohammad Al Bataineh 23
The Net Present Value of the project is positive and, thus, the project can be accepted.
Profitability Index (PI)
� PI: is the net present value of all future expected cash flows divided by the initial cash investment.
PV of future expected cash flowsProfitability Index
Initail cash investment=
� Also known as the benefit–cost ratio.
� As the value of the PI increases, so does the financial attractiveness of the proposed project.
• Rules for selection or rejection of a project:� If PI > 1 then the project may be accepted.
� If PI < 1 then the project is rejected.
� If PI = 1 then this indicates breakeven (التعادل).
Shadi Alboon & Mohammad Al Bataineh 24Lecture 03
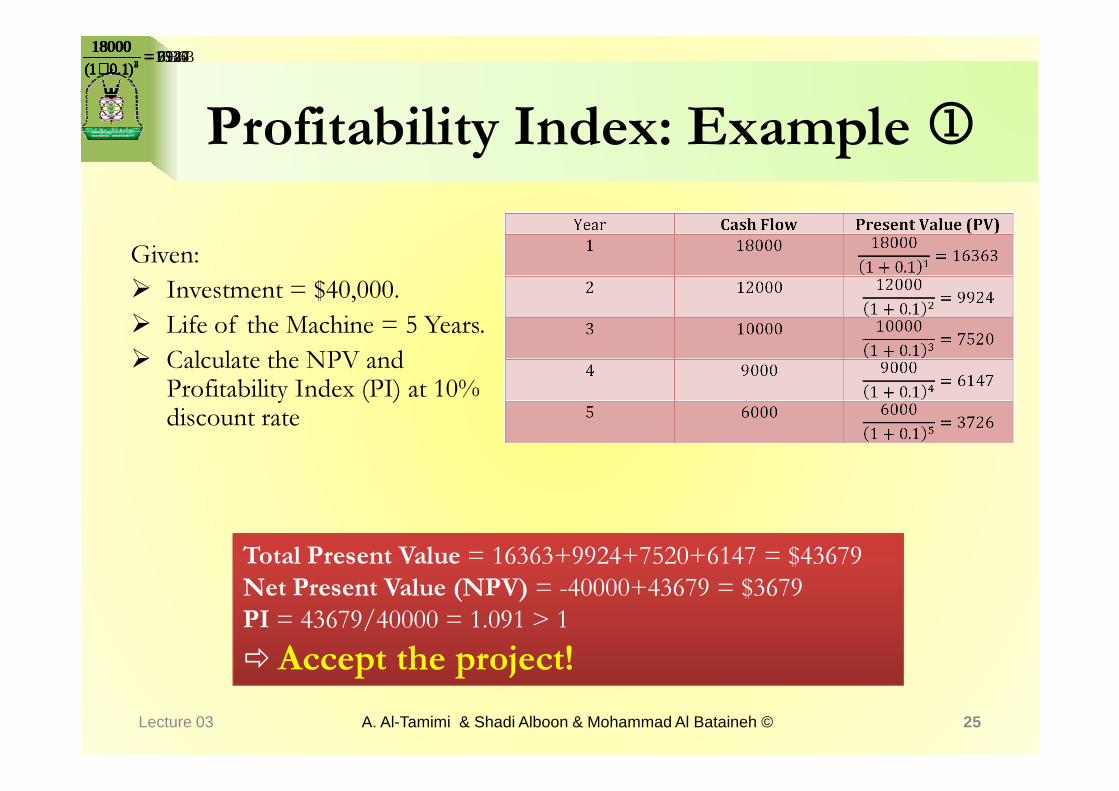
Profitability Index: Example 1
Given:
� Investment = $40,000.
� Life of the Machine = 5 Years.
� Calculate the NPV and Profitability Index (PI) at 10%
1
1800016363
(1 0.1)=
+ 2
180009924
(1 0.1)=
+ 3
180007520
(1 0.1)=
+ 4
180006147
(1 0.1)=
+
Profitability Index (PI) at 10% discount rate
Lecture 03 A. Al-Tamimi & Shadi Alboon & Mohammad Al Bataineh © 25
Total Present Value = 16363+9924+7520+6147 = $43679
Net Present Value (NPV) = -40000+43679 = $3679
PI = 43679/40000 = 1.091 > 1
� Accept the project!
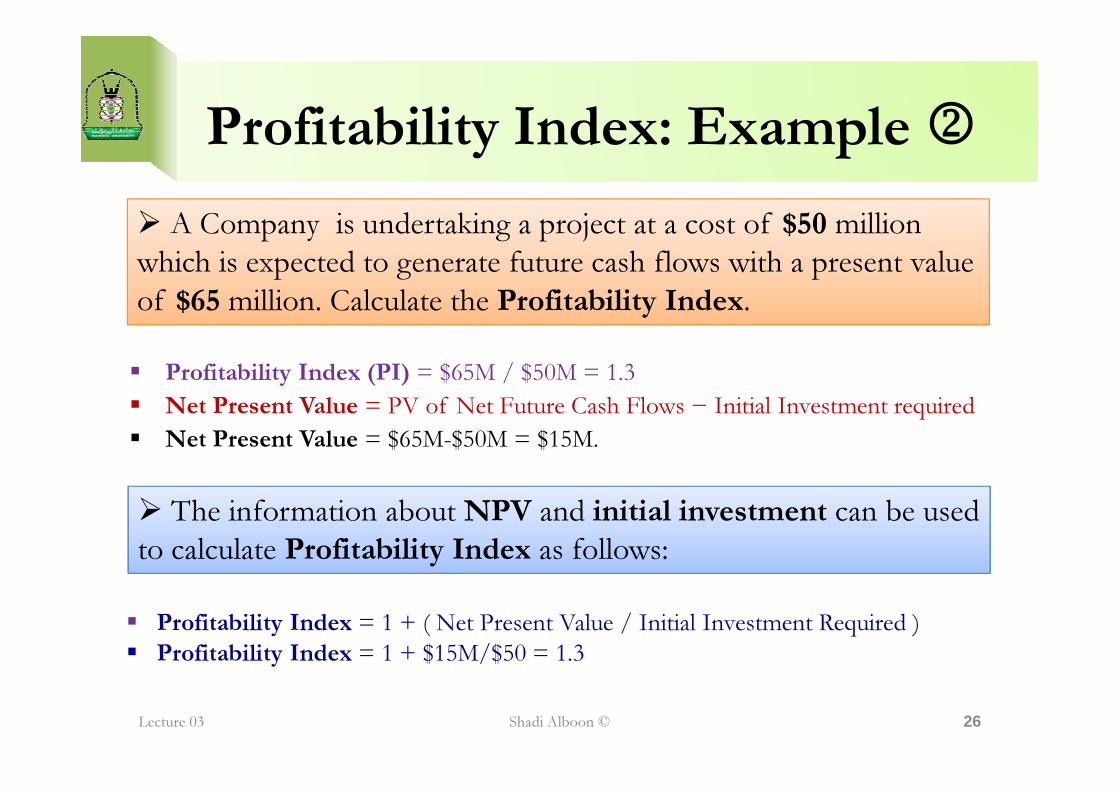
Profitability Index: Example 2
� Profitability Index (PI) = $65M / $50M = 1.3
� Net Present Value = PV of Net Future Cash Flows − Initial Investment required
� A Company is undertaking a project at a cost of $50 million
which is expected to generate future cash flows with a present value
of $65 million. Calculate the Profitability Index.
� Net Present Value = PV of Net Future Cash Flows − Initial Investment required
� Net Present Value = $65M-$50M = $15M.
Lecture 03 Shadi Alboon © 26
� The information about NPV and initial investment can be used
to calculate Profitability Index as follows:
� Profitability Index = 1 + ( Net Present Value / Initial Investment Required )
� Profitability Index = 1 + $15M/$50 = 1.3
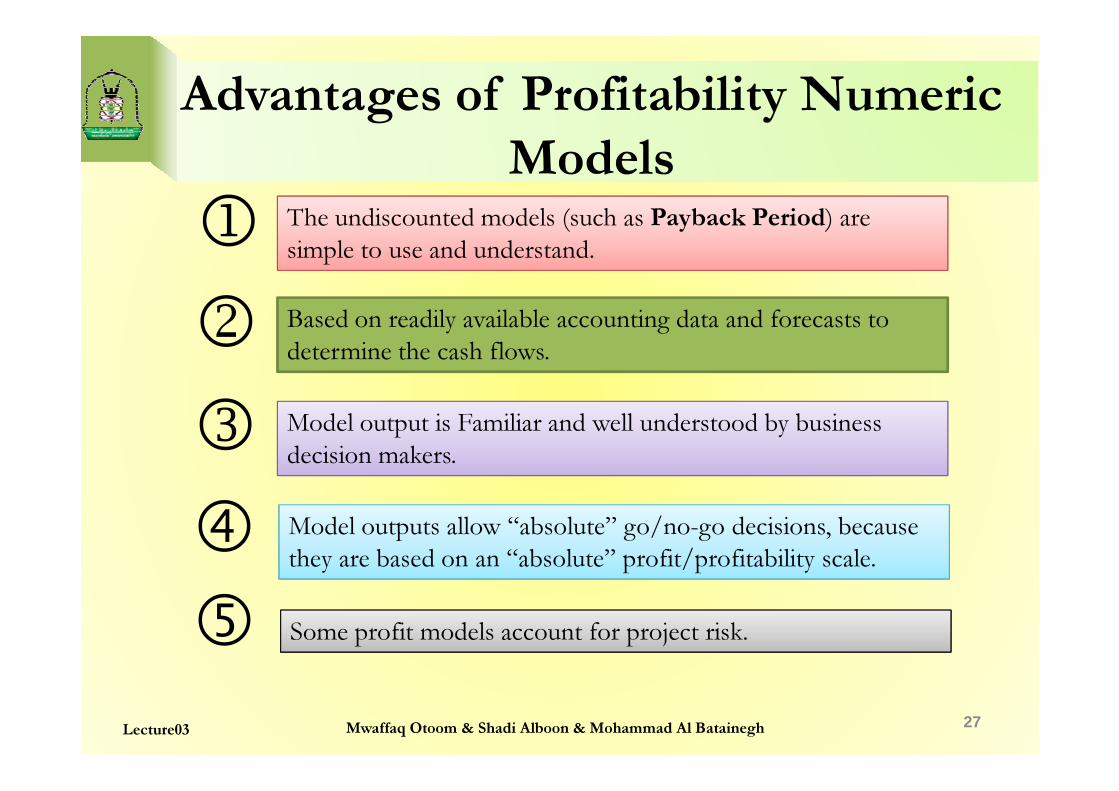
Advantages of Profitability Numeric
ModelsThe undiscounted models (such as Payback Period) are
simple to use and understand.
Based on readily available accounting data and forecasts to
determine the cash flows.
1
2
3
27Lecture03 Mwaffaq Otoom & Shadi Alboon & Mohammad Al Batainegh
Model output is Familiar and well understood by business
decision makers.
Model outputs allow “absolute” go/no-go decisions, because
they are based on an “absolute” profit/profitability scale.
Some profit models account for project risk.
3
�
�
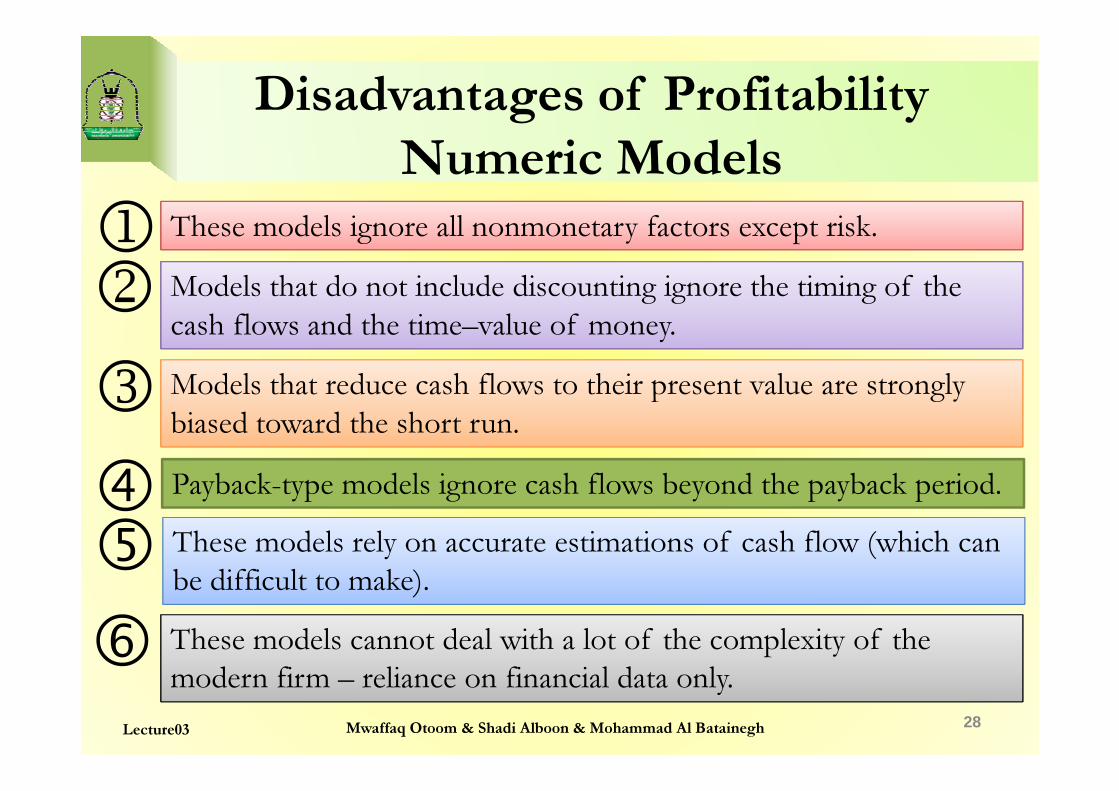
Disadvantages of Profitability
Numeric ModelsThese models ignore all nonmonetary factors except risk.
Models that do not include discounting ignore the timing of the
cash flows and the time–value of money.
Models that reduce cash flows to their present value are strongly
12
3
28Lecture03
Models that reduce cash flows to their present value are strongly
biased toward the short run.
Payback-type models ignore cash flows beyond the payback period.
These models rely on accurate estimations of cash flow (which can
be difficult to make).
These models cannot deal with a lot of the complexity of the
modern firm – reliance on financial data only.
3
��
�
Mwaffaq Otoom & Shadi Alboon & Mohammad Al Batainegh
Numerical Models: Scoring Models
�Scoring models attempt to overcome some of the disadvantages of probability models by incorporating additional decision criteria.
�Use multiple criteria to evaluate a project with a score for each criteria.score for each criteria.
�Vary widely in their complexity and information requirements.
�Some scoring models examples – Unweighted 0-1 Factor Model– Weighted Factor Scoring Model
29Lecture03 Mwaffaq Otoom & Shadi Alboon
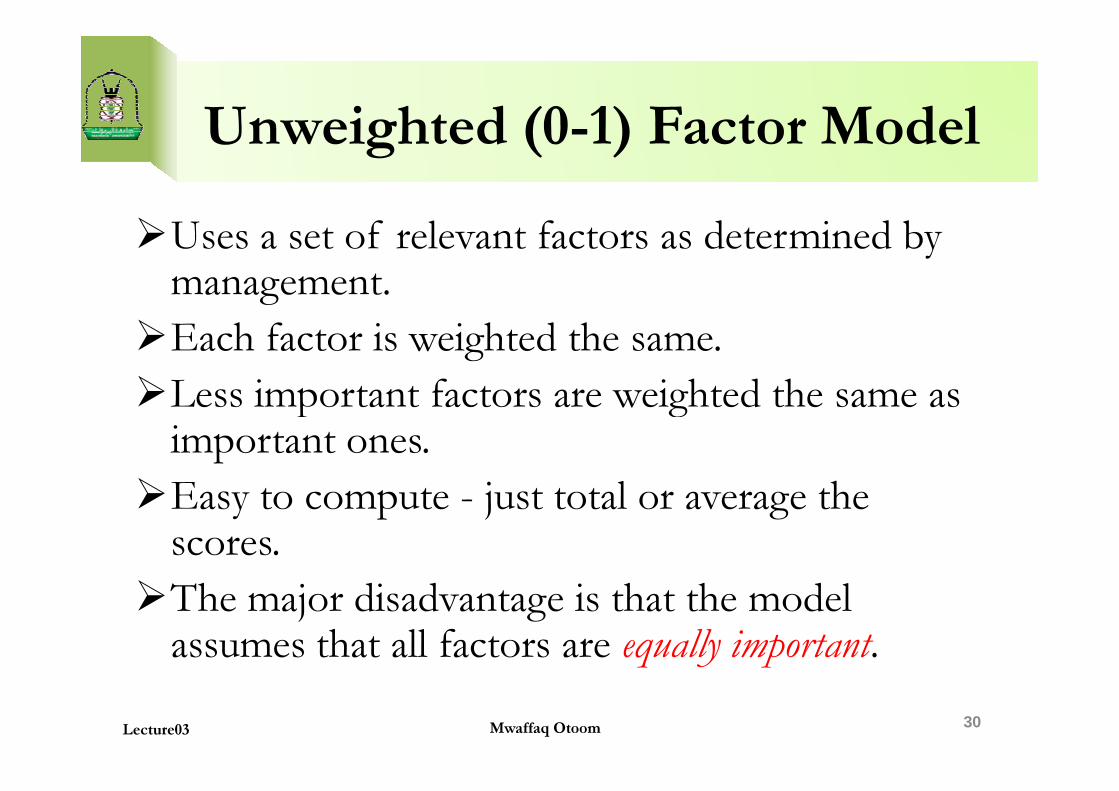
Unweighted (0-1) Factor Model
�Uses a set of relevant factors as determined by management.
�Each factor is weighted the same.
�Less important factors are weighted the same as �Less important factors are weighted the same as important ones.
�Easy to compute - just total or average the scores.
�The major disadvantage is that the model assumes that all factors are equally important.
30Lecture03 Mwaffaq Otoom
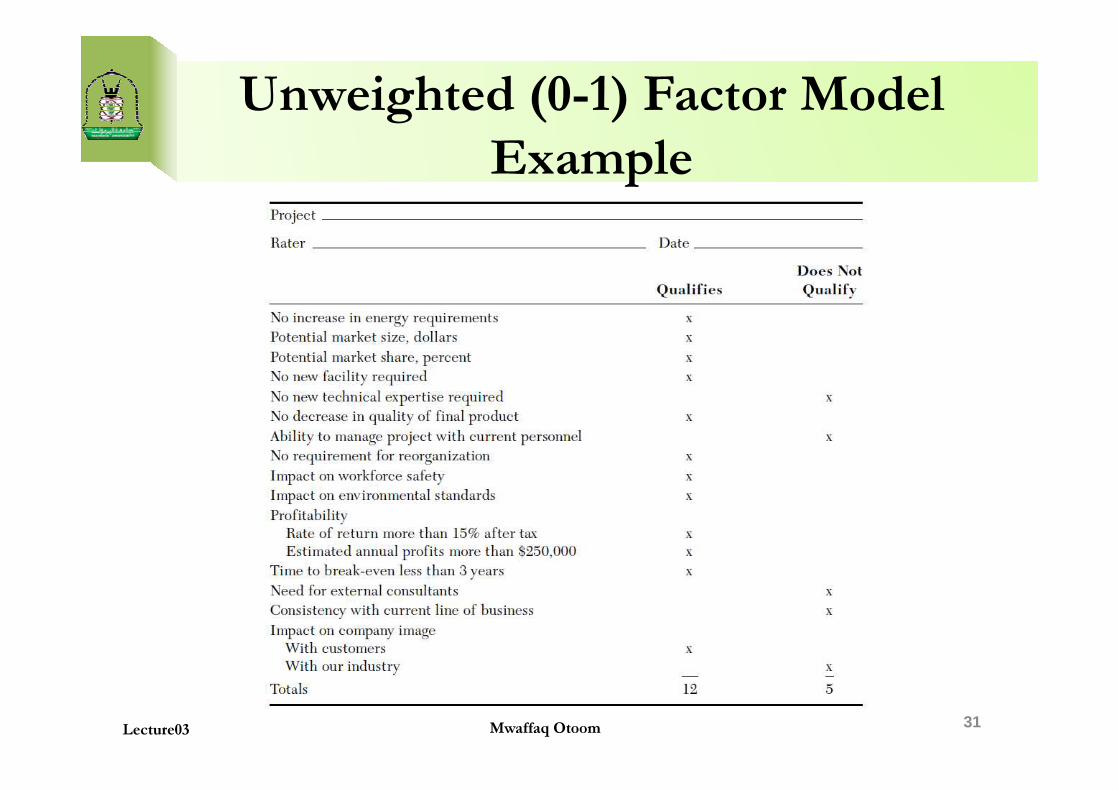
Unweighted (0-1) Factor Model
Example
31Lecture03 Mwaffaq Otoom
Weighted Factor Scoring Model
�When numeric weights reflecting the relative
importance of each individual factor are added ,we have
a weighted factor scoring model.
� Weighting allows important factors to stand out.
�A good way to include non-numeric data in the analysis.
� Factors need to sum to one.
�All weights must be set up so higher values mean more
desirable.
� Small differences in totals are not meaningful.
32Lecture03 Mwaffaq Otoom
Weighted Factor Scoring Model
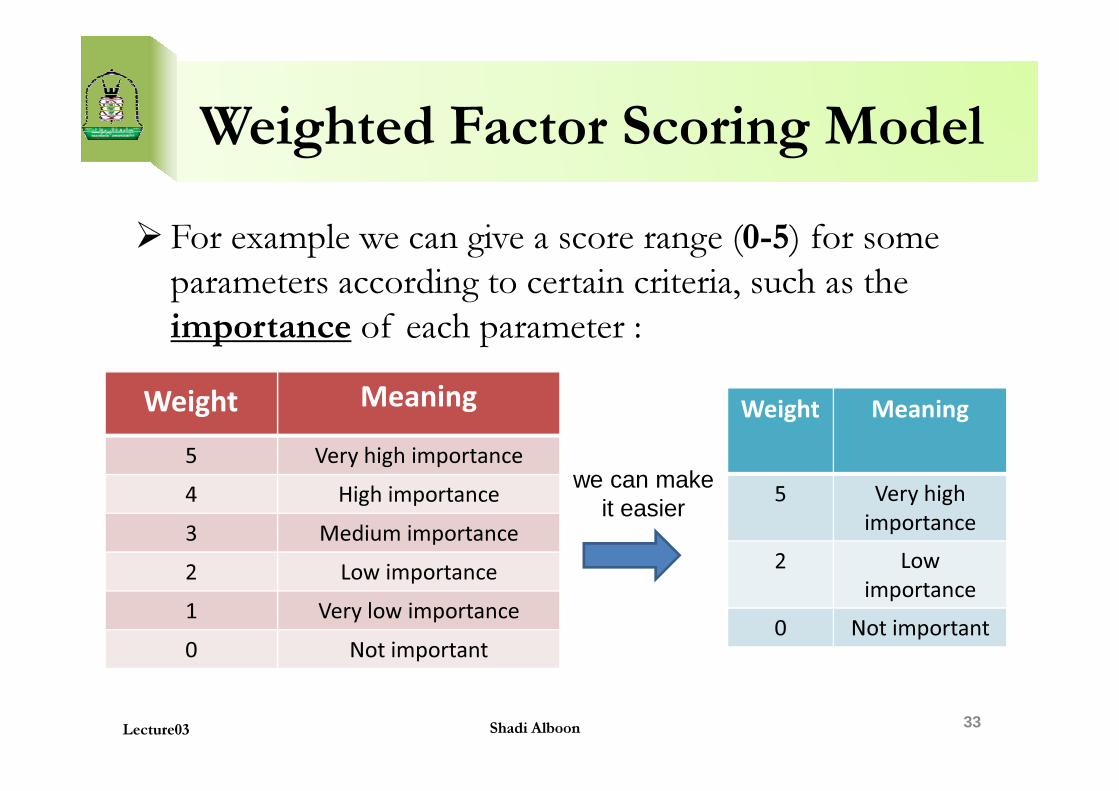
� For example we can give a score range (0-5) for some
parameters according to certain criteria, such as the
importance of each parameter :
MeaningWeight MeaningWeight
33Lecture03 Shadi Alboon
MeaningWeight
Very high importance5
High importance4
Medium importance3
Low importance2
Very low importance1
Not important0
we can make it easier
MeaningWeight
Very high
importance
5
Low
importance
2
Not important0
Weighted Factor Scoring Model
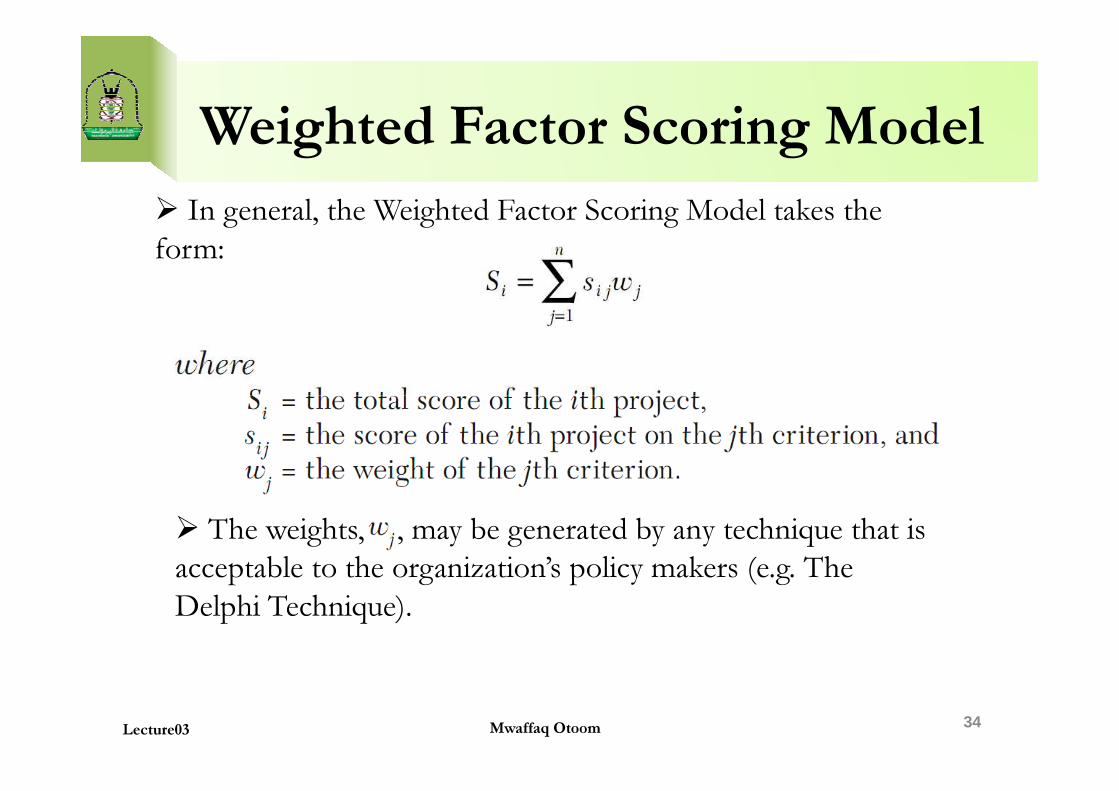
� In general, the Weighted Factor Scoring Model takes the
form:
34Mwaffaq OtoomLecture03
� The weights, , may be generated by any technique that is
acceptable to the organization’s policy makers (e.g. The
Delphi Technique).
Weighted Factor Scoring Model
Example
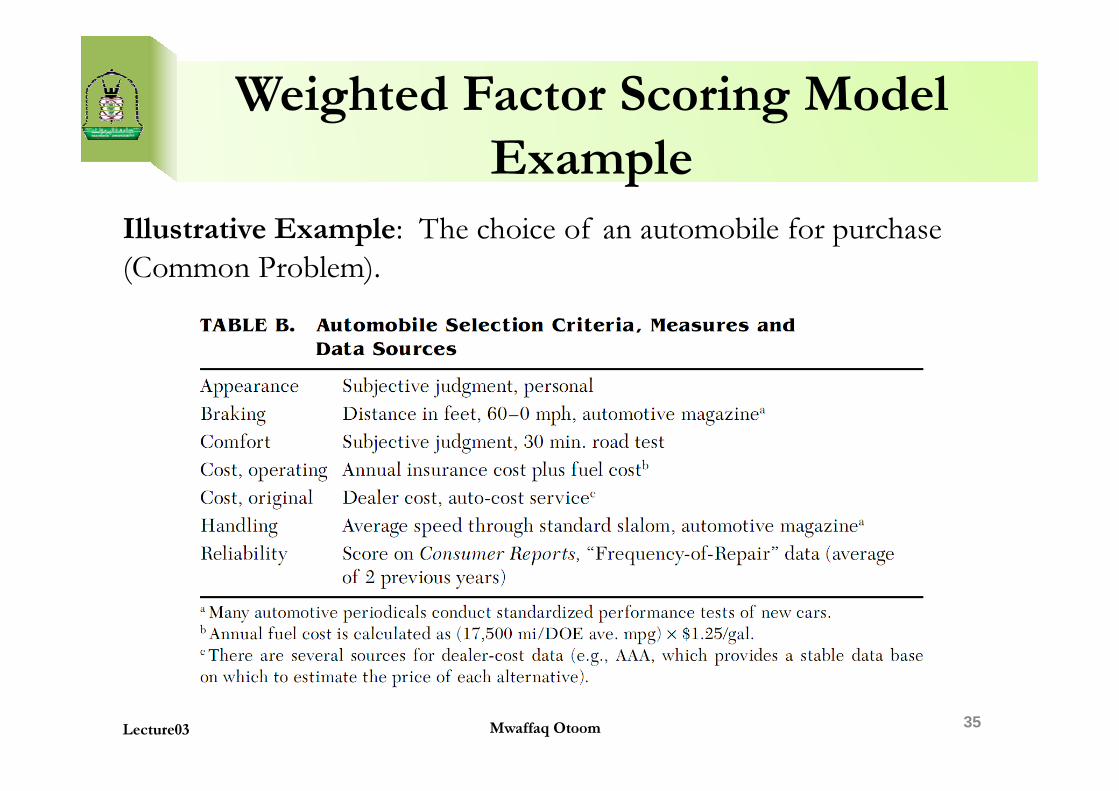
Illustrative Example: The choice of an automobile for purchase
(Common Problem).
35Mwaffaq OtoomLecture03
Weighted Factor Scoring Model
Example
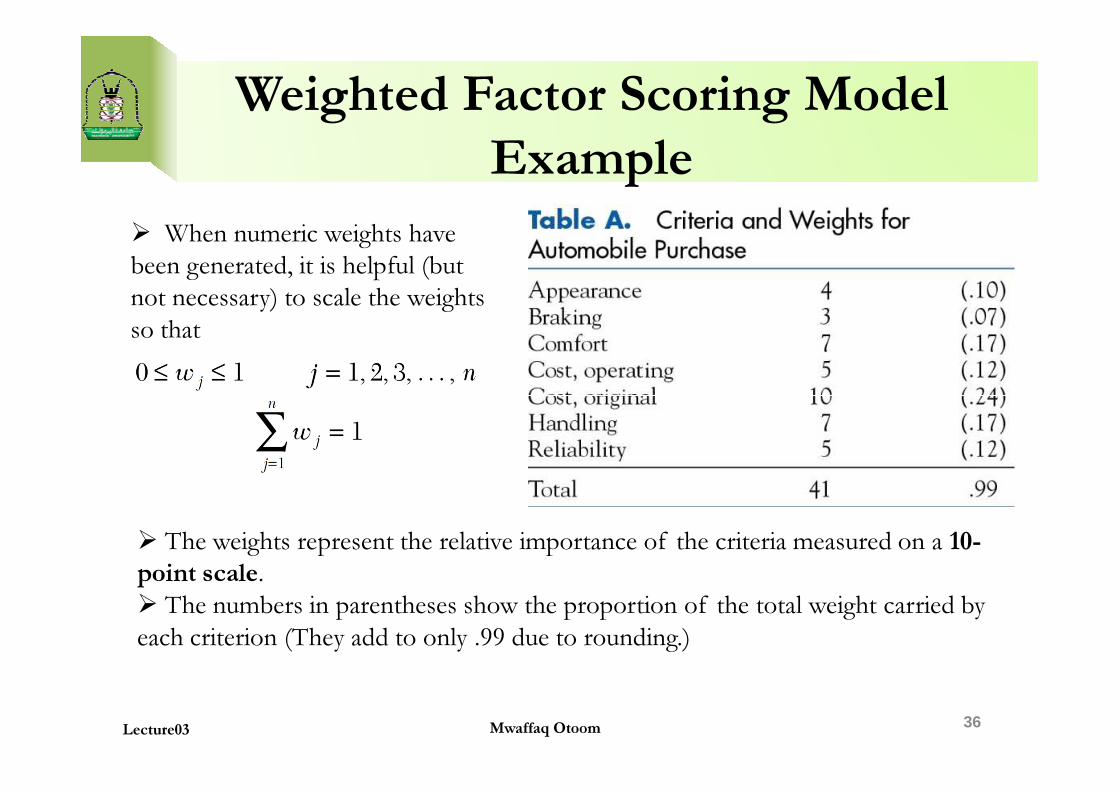
� When numeric weights have
been generated, it is helpful (but
not necessary) to scale the weights
so that
36Mwaffaq OtoomLecture03
� The weights represent the relative importance of the criteria measured on a 10-
point scale.
� The numbers in parentheses show the proportion of the total weight carried by
each criterion (They add to only .99 due to rounding.)
Weighted Factor Scoring Model
Example
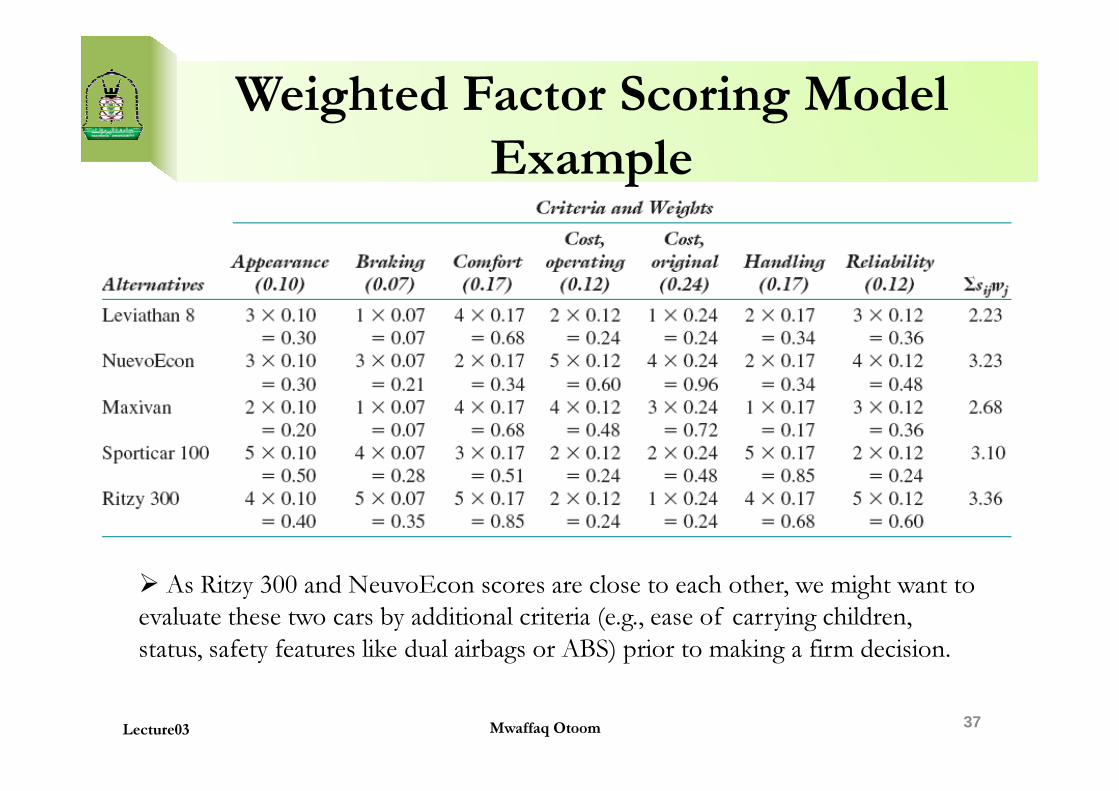
37Lecture03 Mwaffaq Otoom
� As Ritzy 300 and NeuvoEcon scores are close to each other, we might want to
evaluate these two cars by additional criteria (e.g., ease of carrying children,
status, safety features like dual airbags or ABS) prior to making a firm decision.
Advantages of the Scoring Model
�They allow multiple criteria to be used for evaluation.
�Weighted models recognize that some criteria are more
important than others.
� Structurally simple and relatively easy to understand.� Structurally simple and relatively easy to understand.
�They are a direct reflection of management policy.
�Easily altered to accommodate change in management
policy or priorities.
�They allow for sensitivity analysis, because trade-off
between factors is easily observable.
38Lecture03 Mwaffaq Otoom
Disadvantages of the Scoring Model
�Ease of use can lead to the inclusion of too
many criteria.
�The output of a scoring model is strictly a
relative measure rather than an absolute go/no relative measure rather than an absolute go/no
go indication.
�Unweighted scoring models assume all criteria
are of equal importance – this is seldom the
case.
39Lecture03 Mwaffaq Otoom
Summary
� Primary selection model criteria are: realism, capability,
flexibility, ease of use, and cost.
� In preparing to use a model, a firm must identify its
objectives, weighting them relative to each other, and objectives, weighting them relative to each other, and
determining the probable impacts of the project on the
firm’s competitive abilities.
�Models can be numeric or nonnumeric.
40Mwaffaq OtoomLecture03

Questions
4141Mwaffaq OtoomLecture03