
Evaluation of time profile reconstruction from complex two-color microarray designs
Upload
independentCategory
view
3download
0
1140 VOLUME 24 NUMBER 9 SEPTEMBER 2006 NATURE BIOTECHNOLOGY
Performance comparison of one-color and two-color platforms within the MicroArray Quality Control (MAQC) projectTucker A Patterson1, Edward K Lobenhofer2, Stephanie B Fulmer-Smentek3, Patrick J Collins3, Tzu-Ming Chu4, Wenjun Bao4, Hong Fang5, Ernest S Kawasaki6, Janet Hager7, Irina R Tikhonova7, Stephen J Walker8, Liang Zhang9, Patrick Hurban2, Francoise de Longueville10, James C Fuscoe1, Weida Tong1, Leming Shi1 & Russell D Wolfinger4
Microarray-based expression profiling experiments typically use either a one-color or a two-color design to measure mRNA abundance. The validity of each approach has been amply demonstrated. Here we provide a simultaneous comparison of results from one- and two-color labeling designs, using two independent RNA samples from the MicroArray Quality Control (MAQC) project, tested on each of three different microarray platforms. The data were evaluated in terms of reproducibility, specificity, sensitivity and accuracy to determine if the two approaches provide comparable results. For each of the three microarray platforms tested, the results show good agreement with high correlation coefficients and high concordance of differentially expressed gene lists within each platform. Cumulatively, these comparisons indicate that data quality is essentially equivalent between the one- and two-color approaches and strongly suggest that this variable need not be a primary factor in decisions regarding experimental microarray design.
Although microarray technology has now been available for more than ten years1–3, many fundamental questions remain about essentially every aspect of its use, including experimental design, data acquisition, data analysis and data interpretation. One of the first decisions encountered
when planning a microarray experiment is whether to use a one-color or two-color approach. A one-color procedure involves the hybridization of a single sample to each microarray after it has been labeled with a single fluorophore (such as phycoerythrin, cyanine-3 (Cy3) or cyanine-5 (Cy5)), whereas in a two-color procedure, two samples (e.g., experimen-tal and control) are labeled with different fluorophores (usually Cy3 and Cy5 dyes) and hybridized together on a single microarray.
There are advantages and disadvantages associated with each experi-mental approach. Although the two-color design was initially developed to reduce error associated with the variability in microarray manufac-turing, the availability of high quality commercial microarrays has decreased the variability due to microarray production and thereby improved the consistency of microarray results at both the signal and ratio level. In two-color designs, the hybridization of two samples to the same microarray allows a direct comparison, minimizing variability due to processing multiple microarrays per assay. This reduced variability theoretically results in increased sensitivity and accuracy in determining levels of differential expression between sample pairs. More complex hybridization schemes are also an option when using two-color plat-forms, including hybridization with common reference samples or the use of loop designs4. Although dye-specific biases can substantially affect results when experiments are performed using two-color designs, these biases can be mitigated by performing dye-reversed replicates (dye swaps or fluorophore reversals). Such technical replication adds to experimen-tal costs, but can enhance both accuracy and sensitivity in measuring differential expression. The primary advantages of one-color designs are experimental design simplicity and flexibility. Hybridization of a single sample per microarray facilitates comparisons across microarrays and between groups of samples. Data inconsistency across assays due to multiple sources of variability, including microarray fabrication and processing, can be reduced for one-color microarrays by performing sufficient biological and technical replicate assays.
Several groups have reported an inability to generate reproducible data across laboratories and across platforms5,6. More recent studies have demonstrated that under properly controlled conditions both inter- and intralaboratory comparisons show relatively good agreement7–10. Although a few recent studies have made one-color to two-color com-parisons across different platforms11–14 this manuscript describes a
1 National Center for Toxicological Research, US Food & Drug Administration, 3900 NCTR Rd., Jefferson, Arkansas 72079, USA. 2Cogenics, A Division of Clinical Data, 100 Perimeter Park Drive, Suite C, Morrisville, North Carolina 27560, USA. 3Integrated Biology Solutions, Agilent Technologies, 5301 Stevens Creek Blvd., Santa Clara, California 95052-8059, USA. 4SAS Institute Inc., SAS Campus Drive, Cary, North Carolina 27513, USA. 5Division of Bioinformatics, Z-Tech Corporation at NCTR/FDA, 3900 NCTR Rd., Jefferson, Arkansas 72079, USA. 6NCI Advanced Technology Center, 8717 Grovemont Circle, Bethesda, Maryland 20892-4605, USA. 7Yale University, W.M. Keck Biotechnology Resource Laboratory, Microarray Resource, 300 George St., Suite 2110, New Haven, Connecticut 06511, USA. 8Department of Physiology & Pharmacology, Wake Forest University School of Medicine, 115 S. Chestnut St., Winston-Salem, North Carolina 27101, USA. 9CapitalBio Corporation, 18 Life Science Parkway, Changping District, Beijing 102206, P.R. China. 10Gene Expression Chips, Eppendorf Array Technologies (EAT), 20, rue du seminaire, 5000 Namur, Belgium. Correspondence should be addressed to T.A.P. ([email protected]).
Published online 8 September 2006; doi:10.1038/nbt1242
ANALYS IS©
2006
Nat
ure
Pub
lishi
ng G
roup
ht
tp://
ww
w.n
atur
e.co
m/n
atur
ebio
tech
nolo
gy

NATURE BIOTECHNOLOGY VOLUME 24 NUMBER 9 SEPTEMBER 2006 1141
comprehensive study comparing one-color to two-color designs within the same platform and across multiple test sites. An advantage of this type of comparison is that results can be easily compared within a platform because the same microarray (thus identical probes), sample labeling protocols and detection technologies are used for both the one- and two-color designs. In this study we have used three different microarray platforms with the intent of focusing on the experimental design variable, rather than specific attributes of a given platform. Although comparison across platforms is possible, the purpose of this study is to compare results within and across design schemes for each platform. Differential expres-sion profiles from a pair of total RNA samples (Stratagene Universal Human Reference total RNA and Ambion Human Brain Reference total RNA) were generated using both one-color and two-color assays on dif-ferent microarray platforms (Agilent, CapitalBio and TeleChem). These data were used to evaluate the reproducibility, specificity and sensitivity of differential expression measurements between one- and two-color experimental designs within each platform. These analyses attempt to answer a fundamental question in microarray assay experimental design: are there significant differences between the results obtained with a one-color approach versus a two-color approach?
RESULTSAll data sets from the three platforms and five test sites (three sites for the Agilent platform and one site each for CapitalBio and TeleChem) were generated using the recommended protocols and methods of the respective manufacturers (including amplification, labeling, hybridiza-tion, image analysis and data preprocessing and filtering). The same lots of two distinct RNA samples (Stratagene Universal Human Reference total RNA and Ambion Human Brain Reference total RNA) were used
for all data sets. For each of the Agilent and CapitalBio sites 20 microar-rays (10 two-color and 10 one-color) were used. For the TeleChem site, 30 microarrays (20 two-color and 10 one-color) were used. Across all five sites, a total of 110 microarrays were hybridized (60 two-color and 50 one-color), which assayed a total of 170 samples (see the Methods section for additional experimental design details). After data prepro-cessing and filtering, the numbers of probes used in subsequent analyses for the Agilent, CapitalBio and TeleChem platforms were 19,802, 11,735 and 12,453, respectively.
ReproducibilityTo examine reproducibility within platforms, we calculated Pearson cor-relations on log2-scaled data for all pair-wise combinations of microar-rays within a given sample, and then averaged across combinations of specific microarrays to enable different comparisons regarding technical or platform variability. Table 1 presents average intra- and intersite cor-relations of intensities or ratios within one- and two-color designs for each platform. Scatter plots representing a subset of the comparisons are illustrated in Supplementary Figure 1 online. For the two-color designs, intensity reproducibility was calculated both within and across the two different dyes to assess the impact of the dye on the resulting measure-ment. For the within-dye calculations, the technical replicates of samples labeled with the same dye across the microarrays were considered, and for the across-dyes calculations, all of the replicates for a given sample when labeled with either dye were evaluated. The ratio results were sepa-rated according to whether the values used were calculated from within or across dye-swap configurations.
Most of the average correlations are well above 0.9, indicating high reproducibility. As expected, the correlations decline when computed
Table 1 Averages and standard deviations of Pearson correlations for both one-color and two-color data from each of the three platforms Platform Comparison Average one-color
correlation value (s.d.)Average two-color
correlation value (s.d.)
Agilent (three sites) Intrasite Within Dye/A 0.992 (0.005) 0.990 (0.013)
Intrasite Within Dye/B 0.993 (0.004) 0.980 (0.038)
Intrasite Within Dye Swap (Ratio) n/a 0.980 (0.032)
Intrasite Across Dye/A n/a 0.984 (0.015)
Intrasite Across Dye/B n/a 0.977 (0.029)
Intrasite Across Dye Swap (Ratio) n/a 0.950 (0.019)
Intersite Intra Dye/A 0.959 (0.018) 0.982 (0.015)
Intersite Intra Dye/B 0.965 (0.015) 0.970 (0.038)
Intersite Within Dye Swap (Ratio) n/a 0.968 (0.031)
Intersite Across Dye/A n/a 0.977 (0.016)
Intersite Across Dye/B n/a 0.966 (0.033)
Intersite Across Dye Swap (Ratio) n/a 0.950 (0.023)
CapitalBio (one site) Intrasite Within Dye/A 0.959 (0.010) 0.913 (0.073)
Intrasite Within Dye/B 0.975 (0.006) 0.912 (0.078)
Intrasite Within Dye Swap (Ratio) n/a 0.955 (0.038)
Intrasite Across Dye/A n/a 0.916 (0.074)
Intrasite Across Dye/B n/a 0.918 (0.075)
Intrasite Across Dye Swap (Ratio) n/a 0.950 (0.038)
TeleChem (one site) Intrasite Within Dye/A 0.931 (0.018) 0.902 (0.042)
Intrasite Within Dye/B 0.885 (0.023) 0.910 (0.041)
Intrasite Within Dye Swap (Ratio) n/a 0.805 (0.072)
Intrasite Across Dye/A n/a 0.887 (0.032)
Intrasite Across Dye/B n/a 0.884 (0.043)
Intrasite Across Dye Swap (Ratio) n/a 0.543 (0.106)
Correlations are computed from log2 normalized intensity values except for rows containing (Ratio), in which case they are computed from log2 normalized ratios.
ANALYS IS©
2006
Nat
ure
Pub
lishi
ng G
roup
ht
tp://
ww
w.n
atur
e.co
m/n
atur
ebio
tech
nolo
gy
1142 VOLUME 24 NUMBER 9 SEPTEMBER 2006 NATURE BIOTECHNOLOGY
across known sources of variability (dye and site). Interestingly, log2 ratios appeared to be slightly less reproducible than log2 intensities for Agilent and TeleChem, but more reproducible for CapitalBio. This result could be driven by a larger microarray-to-microarray variabil-ity for CapitalBio or the performance of a manual channel balancing while scanning two-color, but not one-color CapitalBio microarrays. The overall lower correlation values for TeleChem appear to be driven by a nonlinear dye bias (data not shown). The intersite, one-color results for the Agilent sites are presented elsewhere15 and reveal that the Agilent data are very consistent between sites.
To determine if the one-color and two-color designs are revealing the same biology, we compared the reproducibility of the lists of genes iden-tified as differentially expressed by each approach within each platform. Common gene lists were generated comparing the number of differen-tially expressed genes for one-color and two-color data within each plat-form (Table 2). Comparisons are given for combinations of two P values (P < 0.05 and P < 0.01) and three fold-change (FC) thresholds (FC > 1.5, FC > 2.0 and FC > 4.0), with differentially expressed genes identi-fied using a one-sample t-test of the sample B to sample A (B/A) ratio
data including five replicates for each site. Concordances of differentially expressed genes are consistently >80% for all three Agilent sites, regard-less of the P-value or fold-change criteria used. Similarly, the CapitalBio concordances are consistently ~70%. The TeleChem concordances are less consistent across P values and fold changes and are generally lower than those for the CapitalBio and Agilent data, which is in agreement with the lower overall correlation values for this platform.
Specificity and sensitivityIn addition to evaluating the reproducibility of the data from the one- and two-color assays, we also considered the sensitivity and specificity. Specificity defines the ability of an assay to determine differences only when they truly exist (that is, the true-negative rate). Sensitivity is the power to detect true differences (that is, the true-positive rate). Both of these measures make a tacit assumption that the truth is divided, which in this case means the mRNA levels derived from a gene are either the same for samples A and B or they are different. The actual truth is that they are likely to be always different, but this difference is small enough relative to technical noise that a substantial fraction
a b c
d e f
g h i
One-color intensity fold change (log2)
Two-color intensityfold change (log2)
Two-color ratiofold change (log2)
One-color intensity fold change (log2)
Two-color intensityfold change (log2)
Two-color ratiofold change (log2)
One-color intensity fold change (log2)
Two-color intensityfold change (log2)
Two-color ratiofold change (log2)
One
-col
or in
tens
ityP
val
ue (
–log
10)
Two-
colo
r in
tens
ityP
val
ue (
–log
10)
Two-
colo
r in
tens
ityP
val
ue (
–log
10)
Two-
colo
r in
tens
ityP
val
ue (
–log
10)
Two-
colo
r ra
tioP
val
ue (
–log
10)
Two-
colo
r ra
tioP
val
ue (
–log
10)
Two-
colo
r ra
tioP
val
ue (
–log
10)
One
-col
or in
tens
ityP
val
ue (
–log
10)
One
-col
or in
tens
ityP
val
ue (
–log
10)
50
40
30
20
10
0
–10 –8 –6 –4 –2 0 2 4 6 8 10
18
15
12
9
6
3
0
20
18
16
14
12
10
8
6
4
2
0
20
18
16
14
12
10
8
6
4
2
0
20
18
16
14
12
10
8
6
4
2
0
–10 –8 –6 –4 –2 0 2 4 6 8 10
18
15
12
9
6
3
0
–10 –8 –6 –4 –2 0 2 4 6 8 10
18
15
12
9
6
3
0
50
40
30
20
10
0
–10 –8 –6 –4 –2 0 2 4 6 8 10
50
40
30
20
10
0
–10 –8 –6 –4 –2 0 2 4 6 8 10
–10 –8 –6 –4 –2 0 2 4 6 8 10
–10 –8 –6 –4 –2 0 2 4 6 8 10–10 –8 –6 –4 –2 0 2 4 6 8 10–10 –8 –6 –4 –2 0 2 4 6 8 10
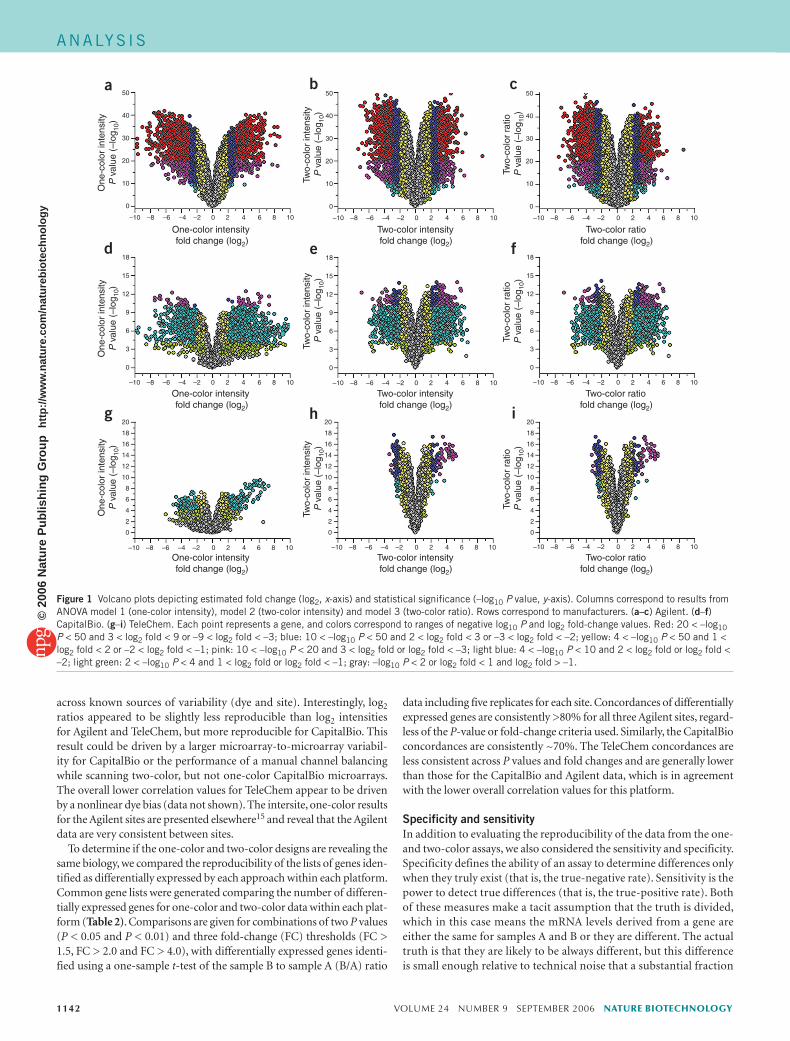
Figure 1 Volcano plots depicting estimated fold change (log2, x-axis) and statistical significance (–log10 P value, y-axis). Columns correspond to results from ANOVA model 1 (one-color intensity), model 2 (two-color intensity) and model 3 (two-color ratio). Rows correspond to manufacturers. (a–c) Agilent. (d–f) CapitalBio. (g–i) TeleChem. Each point represents a gene, and colors correspond to ranges of negative log10 P and log2 fold-change values. Red: 20 < –log10 P < 50 and 3 < log2 fold < 9 or –9 < log2 fold < –3; blue: 10 < –log10 P < 50 and 2 < log2 fold < 3 or –3 < log2 fold < –2; yellow: 4 < –log10 P < 50 and 1 < log2 fold < 2 or –2 < log2 fold < –1; pink: 10 < –log10 P < 20 and 3 < log2 fold or log2 fold < –3; light blue: 4 < –log10 P < 10 and 2 < log2 fold or log2 fold < –2; light green: 2 < –log10 P < 4 and 1 < log2 fold or log2 fold < –1; gray: –log10 P < 2 or log2 fold < 1 and log2 fold > –1.
ANALYS IS©
2006
Nat
ure
Pub
lishi
ng G
roup
ht
tp://
ww
w.n
atur
e.co
m/n
atur
ebio
tech
nolo
gy
NATURE BIOTECHNOLOGY VOLUME 24 NUMBER 9 SEPTEMBER 2006 1143
of mRNA levels can be considered to be the same. When the binary truth is known, the trade-off between sensitivity and specificity is typically portrayed using a receiver operator characteristic (ROC) plot. However, here the truth is unknown with respect to A versus B gene expression, as is the case with most gene expression profiling experiments. Therefore, relative specificity and sensitivity is compared in terms of distributions of statistical modeling results.
By using a P-value criterion to declare genes differentially expressed, the specificity (false-positive rate) can be controlled at the desired level. The accuracy of this control depends, at least in part, on the standard t-test assumptions, which can be shown to be approximately valid for these data. Once specificity is bounded, the total number of differentially expressed genes can be compared as a measure of sensitivity.
To more rigorously assess sensitivity in this fashion, we fit and com-pared results from three different gene-by-gene ANOVA models (see Methods for details):
Model 1: log2(Intensity) = Mean + Sample + Site + Error Model 2: log2(Intensity) = Mean + Sample + Dye + Sample*Dye + Site +Microarray + Error Model 3: log2(Ratio) = Mean + Dye + Site + ErrorModel 1 is applied to one-color data, model 2 is applied for intensity
data directly without forming ratios for two-color data and model 3 is applied to ratios for two-color data.
Direct modeling of intensities in models 1 and 2 enables a straightforward comparison between results for the one- and two-color data. Furthermore, the results from models 2 and 3 are quite similar, and so model 2 provides a bridge between models 1 and 3 that can be used for comparisons with ratio results that are commonly computed with two-color data.
Before discussing primary results from these models, it should be noted that there is an imbalance in the number of samples hybridized for the one-color and two-color designs, which improves the sensitivity of the two-color results. More specifically, for each of the Agilent and CapitalBio sites, there are ten one-color microarrays and ten two-color microarrays, hence, there are twice as many samples hybridized on the two-color microarrays; that is, the one-color results effectively have half as much data, as only one sample was hybridized to each microarray.
This degree of unbalance is even greater in the TeleChem platform for which 20 two-color and only 10 one-color hybridizations were pro-cessed, resulting in four times as much two-color data. Subsequent results should be interpreted with this in mind.
The three models were fit to the preprocessed Agilent, CapitalBio and TeleChem data and several output summary statistics were collected for each gene. Volcano plots (Fig. 1) compare the estimated log2 fold-change (x-axes) against its statistical significance (y-axes). Large numbers of genes are identified as differentially expressed as a result of the analyses of data from all three platforms, as is expected when comparing a brain sample to a tissue pool sample. All of the volcano plots visually have a similar distribution and range for the statistical significance values (y-axes) within each platform, except for model 1 for the TeleChem data (Fig. 1g), which has a substantially smaller range, that (as noted above) may be due to differences in the total number of microarrays processed for each approach. For all three platforms there is a tendency for the one-color data to exhibit larger fold changes but smaller significance scores (that is, the volcano plots are shorter and wider for one-color as compared to two-color).
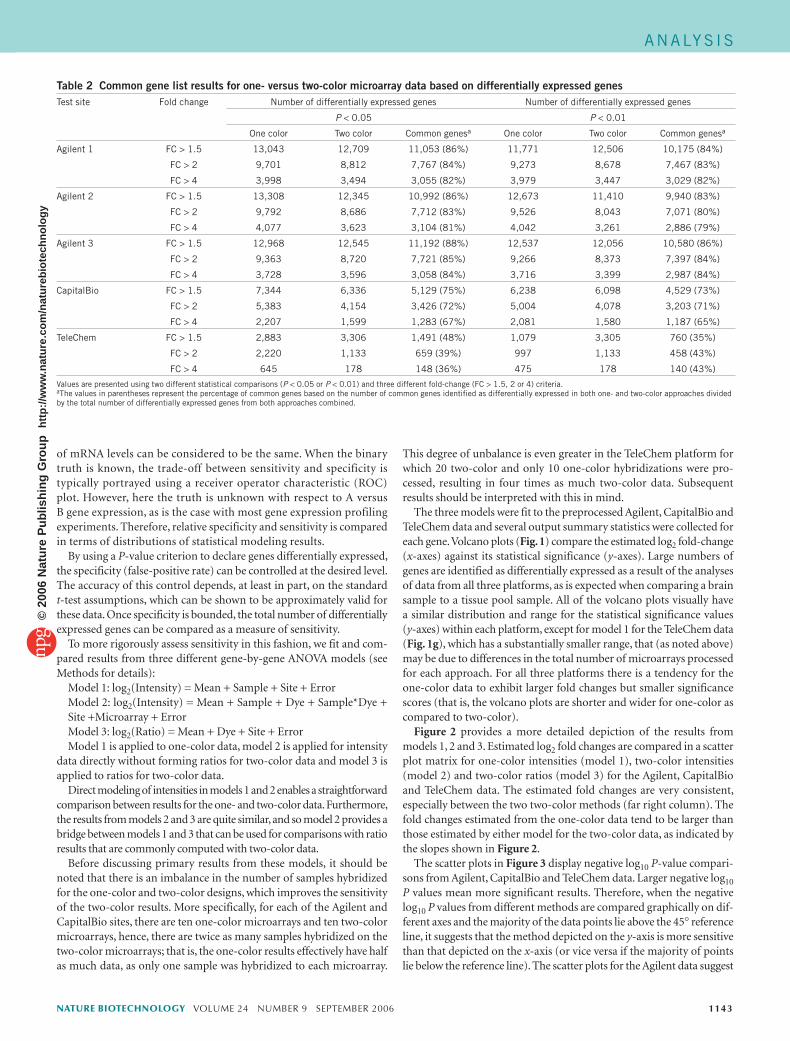
Figure 2 provides a more detailed depiction of the results from models 1, 2 and 3. Estimated log2 fold changes are compared in a scatter plot matrix for one-color intensities (model 1), two-color intensities (model 2) and two-color ratios (model 3) for the Agilent, CapitalBio and TeleChem data. The estimated fold changes are very consistent, especially between the two two-color methods (far right column). The fold changes estimated from the one-color data tend to be larger than those estimated by either model for the two-color data, as indicated by the slopes shown in Figure 2.
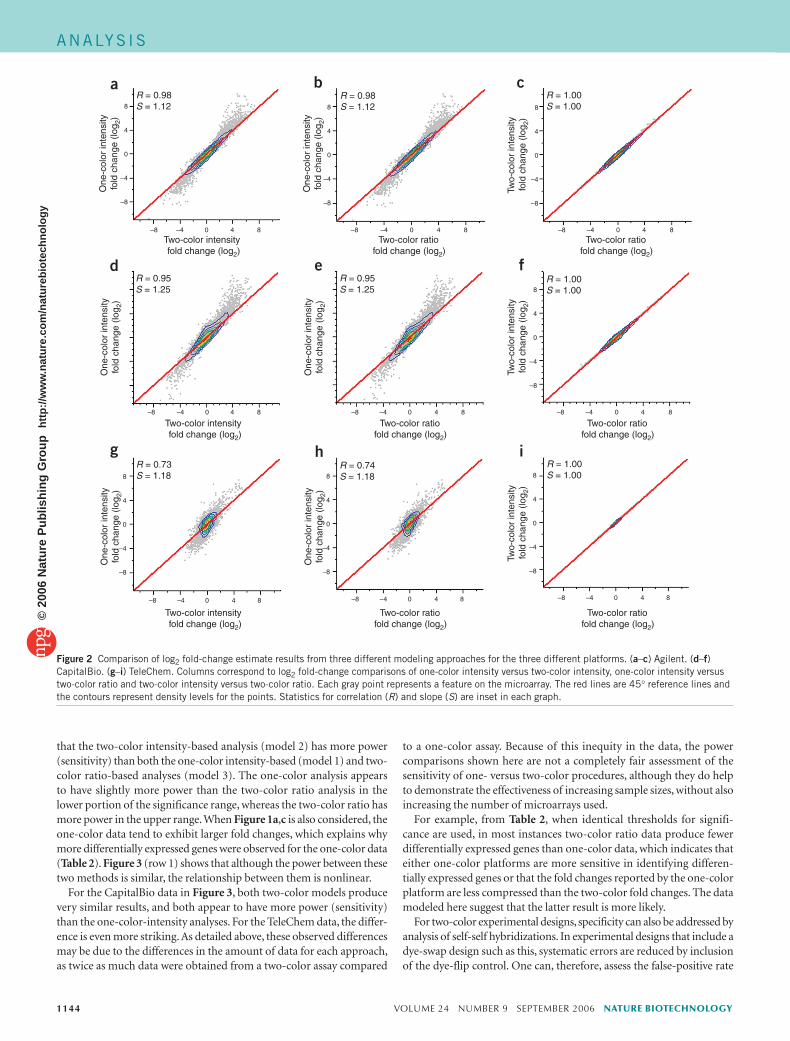
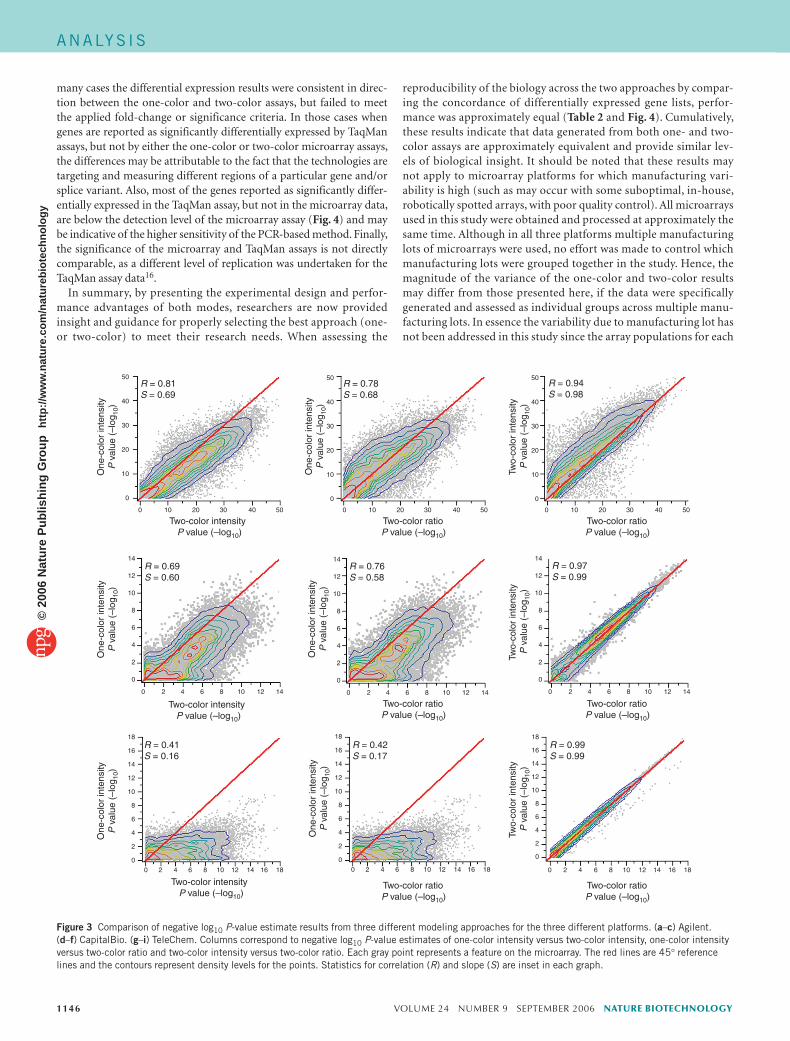
The scatter plots in Figure 3 display negative log10 P-value compari-sons from Agilent, CapitalBio and TeleChem data. Larger negative log10 P values mean more significant results. Therefore, when the negative log10 P values from different methods are compared graphically on dif-ferent axes and the majority of the data points lie above the 45° reference line, it suggests that the method depicted on the y-axis is more sensitive than that depicted on the x-axis (or vice versa if the majority of points lie below the reference line). The scatter plots for the Agilent data suggest
Table 2 Common gene list results for one- versus two-color microarray data based on differentially expressed genesTest site Fold change Number of differentially expressed genes Number of differentially expressed genes
P < 0.05 P < 0.01
One color Two color Common genesa One color Two color Common genesa
Agilent 1 FC > 1.5 13,043 12,709 11,053 (86%) 11,771 12,506 10,175 (84%)
FC > 2 9,701 8,812 7,767 (84%) 9,273 8,678 7,467 (83%)
FC > 4 3,998 3,494 3,055 (82%) 3,979 3,447 3,029 (82%)
Agilent 2 FC > 1.5 13,308 12,345 10,992 (86%) 12,673 11,410 9,940 (83%)
FC > 2 9,792 8,686 7,712 (83%) 9,526 8,043 7,071 (80%)
FC > 4 4,077 3,623 3,104 (81%) 4,042 3,261 2,886 (79%)
Agilent 3 FC > 1.5 12,968 12,545 11,192 (88%) 12,537 12,056 10,580 (86%)
FC > 2 9,363 8,720 7,721 (85%) 9,266 8,373 7,397 (84%)
FC > 4 3,728 3,596 3,058 (84%) 3,716 3,399 2,987 (84%)
CapitalBio FC > 1.5 7,344 6,336 5,129 (75%) 6,238 6,098 4,529 (73%)
FC > 2 5,383 4,154 3,426 (72%) 5,004 4,078 3,203 (71%)
FC > 4 2,207 1,599 1,283 (67%) 2,081 1,580 1,187 (65%)
TeleChem FC > 1.5 2,883 3,306 1,491 (48%) 1,079 3,305 760 (35%)
FC > 2 2,220 1,133 659 (39%) 997 1,133 458 (43%)
FC > 4 645 178 148 (36%) 475 178 140 (43%)
Values are presented using two different statistical comparisons (P < 0.05 or P < 0.01) and three different fold-change (FC > 1.5, 2 or 4) criteria. aThe values in parentheses represent the percentage of common genes based on the number of common genes identified as differentially expressed in both one- and two-color approaches divided by the total number of differentially expressed genes from both approaches combined.
ANALYS IS©
2006
Nat
ure
Pub
lishi
ng G
roup
ht
tp://
ww
w.n
atur
e.co
m/n
atur
ebio
tech
nolo
gy
1144 VOLUME 24 NUMBER 9 SEPTEMBER 2006 NATURE BIOTECHNOLOGY
that the two-color intensity-based analysis (model 2) has more power (sensitivity) than both the one-color intensity-based (model 1) and two-color ratio-based analyses (model 3). The one-color analysis appears to have slightly more power than the two-color ratio analysis in the lower portion of the significance range, whereas the two-color ratio has more power in the upper range. When Figure 1a,c is also considered, the one-color data tend to exhibit larger fold changes, which explains why more differentially expressed genes were observed for the one-color data (Table 2). Figure 3 (row 1) shows that although the power between these two methods is similar, the relationship between them is nonlinear.
For the CapitalBio data in Figure 3, both two-color models produce very similar results, and both appear to have more power (sensitivity) than the one-color-intensity analyses. For the TeleChem data, the differ-ence is even more striking. As detailed above, these observed differences may be due to the differences in the amount of data for each approach, as twice as much data were obtained from a two-color assay compared
to a one-color assay. Because of this inequity in the data, the power comparisons shown here are not a completely fair assessment of the sensitivity of one- versus two-color procedures, although they do help to demonstrate the effectiveness of increasing sample sizes, without also increasing the number of microarrays used.
For example, from Table 2, when identical thresholds for signifi-cance are used, in most instances two-color ratio data produce fewer differentially expressed genes than one-color data, which indicates that either one-color platforms are more sensitive in identifying differen-tially expressed genes or that the fold changes reported by the one-color platform are less compressed than the two-color fold changes. The data modeled here suggest that the latter result is more likely.
For two-color experimental designs, specificity can also be addressed by analysis of self-self hybridizations. In experimental designs that include a dye-swap design such as this, systematic errors are reduced by inclusion of the dye-flip control. One can, therefore, assess the false-positive rate
One
-col
or in
tens
ityfo
ld c
hang
e (lo
g 2)
Two-color intensity fold change (log2)
Two-color ratiofold change (log2)
Two-color ratiofold change (log2)
One
-col
or in
tens
ityfo
ld c
hang
e (lo
g 2)
Two-color intensity fold change (log2)
Two-color ratiofold change (log2)
Two-color ratiofold change (log2)
One
-col
or in
tens
ityfo
ld c
hang
e (lo
g 2)
One
-col
or in
tens
ityfo
ld c
hang
e (lo
g 2)
One
-col
or in
tens
ityfo
ld c
hang
e (lo
g 2)
One
-col
or in
tens
ityfo
ld c
hang
e (lo
g 2)
Two-
colo
r in
tens
ityfo
ld c
hang
e (lo
g 2)
Two-
colo
r in
tens
ityfo
ld c
hang
e (lo
g 2)
Two-
colo
r in
tens
ityfo
ld c
hang
e (lo
g 2)
Two-color intensity fold change (log2)
Two-color ratiofold change (log2)
Two-color ratiofold change (log2)
8
4
0
–4
–8
–8 –4 0 4 8 –8 –4 0 4 8
8
4
0
–4
–8
8
4
0
–4
–8
–8 –4 0 4 8
8
4
0
–4
–8
–8 –4 0 4 8–8 –4 0 4 8–8 –4 0 4 8
8
4
0
–4
–8
8
4
0
–4
–8
8
4
0
–4
–8
–8 –4 0 4 8
–8 –4 0 4 8 –8 –4 0 4 8
R = 0.98S = 1.12
R = 1.00S = 1.00
R = 1.00S = 1.00
R = 1.00S = 1.00
R = 0.98S = 1.12
R = 0.95S = 1.25
R = 0.95S = 1.25
R = 0.73S = 1.18
R = 0.74S = 1.18
a b c
fed
ihg
Figure 2 Comparison of log2 fold-change estimate results from three different modeling approaches for the three different platforms. (a–c) Agilent. (d–f) CapitalBio. (g–i) TeleChem. Columns correspond to log2 fold-change comparisons of one-color intensity versus two-color intensity, one-color intensity versus two-color ratio and two-color intensity versus two-color ratio. Each gray point represents a feature on the microarray. The red lines are 45° reference lines and the contours represent density levels for the points. Statistics for correlation (R) and slope (S) are inset in each graph.
ANALYS IS©
2006
Nat
ure
Pub
lishi
ng G
roup
ht
tp://
ww
w.n
atur
e.co
m/n
atur
ebio
tech
nolo
gy
NATURE BIOTECHNOLOGY VOLUME 24 NUMBER 9 SEPTEMBER 2006 1145
from self-self designs if one half of the self comparisons have the polarity reversed before calculation of significance. This analysis was performed for one of the Agilent test sites, for both pairs of self-self experiments. In this analysis, four of the self-self hybridizations were combined with two randomly chosen microarrays chosen for polarity reversal. For the A sample, 98 of 41,000 genes were detected as significantly differentially expressed (that is, false positives, P < 0.01). For the B sample, 61 of 41,000 genes were detected as significantly differentially expressed (P < 0.01).
To further address the question of which design (one-color or two-color) provides greater sensitivity, we examined correlations of one-color and two-color data for one of the Agilent test sites without any filtering based on detection calls (see Supplementary Fig. 2 online). Fold-change values correlated well between the two approaches across the entire inten-sity range, indicating that the approaches have similar levels of sensitivity. Furthermore, when thresholds for differential expression were applied (P < 0.01 and FC > 1.5) there was a 69% overlap of the genes identified by both approaches. Each approach uniquely identified 13–18% of the total number of differentially expressed genes and only a very small subset of the genes were found to be anticorrelated (18 or 0.09%).
AccuracyWhereas specificity and sensitivity refer to a divided version of the truth, a more direct assessment of the accuracy of the platforms can be obtained when the truth is quantitative. Again, the true quantita-tive differences between the mRNA levels of samples A and B for each gene are unknown, but a well accepted surrogate can be obtained from orthogonal quantitative technologies (e.g., TaqMan assays).
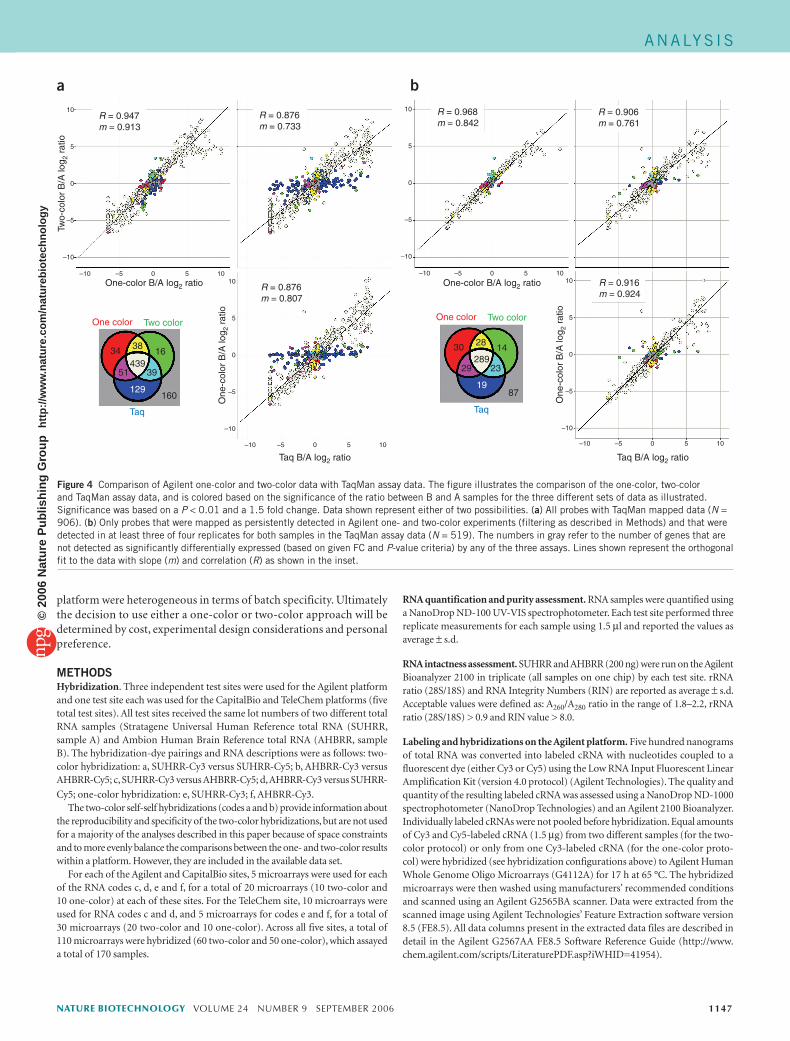
As detailed above, when data from one of the Agilent test sites were analyzed, ~31% of the total number of differentially expressed genes detected by one approach was not also identified by the other. To discern if these discordant data points are false positives on one or another of the approaches, we compared both to results generated using TaqMan assays. Genes were selected for measurement in these samples by TaqMan assays as part of the main MAQC study15. Most of the genes assayed by TaqMan were randomly selected from a set of RefSeq genes that were common to four commercial microarray platforms (Affymetrix, Agilent, GE Healthcare and Illumina). More details on the selection of these genes can be found elsewhere16. Figure 4 illustrates the comparison of the one-color, two-color and TaqMan assay data, and is colored based on the significance (P < 0.01 and FC > 1.5) of the ratio between B and A samples for the three different platforms (one-color, two-color and TaqMan assays). Data shown represent either all probes with TaqMan mapped data (Fig. 4a, N = 906) or only probes that were mapped as persistently detected in Agilent one- and two-color experiments (filtered as described in Methods) and detected in at least three of four replicates for both samples in the TaqMan assay data (Fig. 4b, N = 519). The results show a good overall correlation between the TaqMan assay data and both the one-color and two-color data. The 18 probes that were anticorrelated between one- and two-color data were not in the subset of genes assessed with TaqMan assays in this study. However, for those genes identified as discordant between the Agilent one- and two-color data, some were verified with TaqMan assays for each platform. A slightly higher per-centage of probes found to be significant for only the two-color design were verified with TaqMan assays (51 of 85 or 60% for one-color, versus 39 of 55 or 71% for two-color; Fig. 4a), thereby indicating that both approaches have similar levels of accuracy.
DISCUSSIONEvery aspect of microarray experimentation, including RNA isolation and purification, labeling and amplification, microarray fabrication, hybridization, data acquisition, analysis and statistical methods has
seen major advancements in the last several years. With the variety of platform choices available that have benefited from these advancements, a natural question arises regarding the characteristics of data generated from one-color and two-color assays. Results presented here describe a comprehensive study comparing one-color to two-color assays within three different platforms and across multiple test sites for one of the platforms, using two distinct RNA samples. Differential expression data from a pair of total RNA samples (Stratagene Universal Human Reference total RNA and Ambion Human Brain Reference total RNA) were generated using both one-color and two-color assays on different microarray platforms (Agilent, CapitalBio and TeleChem) and used to evaluate the relative reproducibility, specificity, sensitivity and accuracy of the two approaches.
One of the strengths of this analysis is that comparison of the one-color and two-color assays is not dependent on interplatform analysis, thus avoiding many of the complications inherent to such a comparison (including probe sequence issues as well as target labeling and detection technology differences). In addition, the filtered gene lists used for the analysis presented here are consistent between the two different design schemes on each platform, but are different between the different plat-forms, further complicating interplatform comparisons.
Overall, the results between one- and two-color assays compare well, which aligns with expectations generated by numerous independent successes of one- and two-color microarray applications. Here we pro-vide a statistical validation of this expectation. Reproducibility between the one-color and two-color assays is quite similar for each platform as demonstrated by the consistency of Pearson correlation values. When ratios are generated from the two distinct RNA samples, the differentially expressed gene lists are highly consistent across one- and two-color data when using widely accepted P-value and fold-change thresholds for sig-nificance. Just as important, the stability of the differentially expressed gene lists is consistent within individual platforms. Correlation coeffi-cients in Table 1 are higher for the Agilent data, leading to greater overall concordance, but for all the platforms the one-color data and two-color data are comparable when assessing concordance using differentially expressed gene lists.
Three ANOVA models are defined to provide a statistical framework for comparison of relative intraplatform specificity and sensitivity. Model 1 applies to one-color log2 intensities and model 3 to two-color log2 ratios. Model 2 handles two-color log2 intensities, and serves as a bridge between models 1 and 3. The use of these models avoids the problem of arbitrarily defining ratios for the one-color data, and enables adjustment for all known sources of variability. In addition, model 2 is shown to have slightly more sensitivity over model 3 for the Agilent data. Modeling two-color intensities directly as in model 2 is not common practice, but offers several advantages, including the ability to study sample-dye interactions. Overall, the relative specificity and sensitiv-ity of the three platforms as determined by the three models is very similar between one- and two-color assays within each platform (Figs. 1–3). The results suggest that the two-color assays have a slight advan-tage with regard to power (sensitivity) and the detection of small fold changes (Figs. 1 and 3), especially when considering an equal number of microarrays. The one-color data do appear to be less compressed than two-color data as indicated by the slopes shown in Figures 2 and 4, which should be considered when using filtering rules that apply directly to estimated fold changes.
In addressing the accuracy of the one-color and two-color assays using data from the Agilent platform, the results also show a good overall cor-relation with the TaqMan assay data. In some cases the TaqMan assay data have better agreement with the one-color data and in others the TaqMan assay data have better agreement with the two-color data. In
ANALYS IS©
2006
Nat
ure
Pub
lishi
ng G
roup
ht
tp://
ww
w.n
atur
e.co
m/n
atur
ebio
tech
nolo
gy
1146 VOLUME 24 NUMBER 9 SEPTEMBER 2006 NATURE BIOTECHNOLOGY
many cases the differential expression results were consistent in direc-tion between the one-color and two-color assays, but failed to meet the applied fold-change or significance criteria. In those cases when genes are reported as significantly differentially expressed by TaqMan assays, but not by either the one-color or two-color microarray assays, the differences may be attributable to the fact that the technologies are targeting and measuring different regions of a particular gene and/or splice variant. Also, most of the genes reported as significantly differ-entially expressed in the TaqMan assay, but not in the microarray data, are below the detection level of the microarray assay (Fig. 4) and may be indicative of the higher sensitivity of the PCR-based method. Finally, the significance of the microarray and TaqMan assays is not directly comparable, as a different level of replication was undertaken for the TaqMan assay data16.
In summary, by presenting the experimental design and perfor-mance advantages of both modes, researchers are now provided insight and guidance for properly selecting the best approach (one- or two-color) to meet their research needs. When assessing the
reproducibility of the biology across the two approaches by compar-ing the concordance of differentially expressed gene lists, perfor-mance was approximately equal (Table 2 and Fig. 4). Cumulatively, these results indicate that data generated from both one- and two-color assays are approximately equivalent and provide similar lev-els of biological insight. It should be noted that these results may not apply to microarray platforms for which manufacturing vari-ability is high (such as may occur with some suboptimal, in-house, robotically spotted arrays, with poor quality control). All microarrays used in this study were obtained and processed at approximately the same time. Although in all three platforms multiple manufacturing lots of microarrays were used, no effort was made to control which manufacturing lots were grouped together in the study. Hence, the magnitude of the variance of the one-color and two-color results may differ from those presented here, if the data were specifically generated and assessed as individual groups across multiple manu-facturing lots. In essence the variability due to manufacturing lot has not been addressed in this study since the array populations for each
Two-color intensity P value (–log10)
Two-color intensity P value (–log10)
Two-color intensity P value (–log10)
Two-color ratioP value (–log10)
Two-color ratioP value (–log10)
Two-color ratioP value (–log10)
Two-color ratioP value (–log10)
Two-color ratioP value (–log10)
Two-color ratioP value (–log10)
50
40
30
20
10
0
50
40
30
20
10
0
50
40
30
20
10
0
0 10 20 30 40 50
14
12
10
8
6
4
2
0
0 2 4 6 8 10 12 14
18
16
14
12
10
8
6
4
2
0
0 2 4 6 8 10 12 14 16 18
18
16
14
12
10
8
6
4
2
0
0 2 4 6 8 10 12 14 16 18
18
16
14
12
10
8
6
4
2
0
0 2 4 6 8 10 12 14 16 18
14
12
10
8
6
4
2
0
0 2 4 6 8 10 12 14
14
12
10
8
6
4
2
0
0 2 4 6 8 10 12 14
0 10 20 30 40 50 0 10 20 30 40 50
R = 0.99S = 0.99
R = 0.97S = 0.99
R = 0.94S = 0.98
R = 0.78S = 0.68
R = 0.81S = 0.69
R = 0.69S = 0.60
R = 0.76S = 0.58
R = 0.42S = 0.17
R = 0.41S = 0.16
One
-col
or in
tens
ityP
val
ue (
–log
10)
One
-col
or in
tens
ityP
val
ue (
–log
10)
One
-col
or in
tens
ityP
val
ue (
–log
10)
One
-col
or in
tens
ityP
val
ue (
–log
10)
One
-col
or in
tens
ityP
val
ue (
–log
10)
One
-col
or in
tens
ityP
val
ue (
–log
10)
Two-
colo
r in
tens
ityP
val
ue (
–log
10)
Two-
colo
r in
tens
ityP
val
ue (
–log
10)
Two-
colo
r in
tens
ityP
val
ue (
–log
10)
Figure 3 Comparison of negative log10 P-value estimate results from three different modeling approaches for the three different platforms. (a–c) Agilent. (d–f) CapitalBio. (g–i) TeleChem. Columns correspond to negative log10 P-value estimates of one-color intensity versus two-color intensity, one-color intensity versus two-color ratio and two-color intensity versus two-color ratio. Each gray point represents a feature on the microarray. The red lines are 45° reference lines and the contours represent density levels for the points. Statistics for correlation (R) and slope (S) are inset in each graph.
ANALYS IS©
2006
Nat
ure
Pub
lishi
ng G
roup
ht
tp://
ww
w.n
atur
e.co
m/n
atur
ebio
tech
nolo
gy
NATURE BIOTECHNOLOGY VOLUME 24 NUMBER 9 SEPTEMBER 2006 1147
platform were heterogeneous in terms of batch specificity. Ultimately the decision to use either a one-color or two-color approach will be determined by cost, experimental design considerations and personal preference.
METHODSHybridization. Three independent test sites were used for the Agilent platform and one test site each was used for the CapitalBio and TeleChem platforms (five total test sites). All test sites received the same lot numbers of two different total RNA samples (Stratagene Universal Human Reference total RNA (SUHRR, sample A) and Ambion Human Brain Reference total RNA (AHBRR, sample B). The hybridization-dye pairings and RNA descriptions were as follows: two-color hybridization: a, SUHRR-Cy3 versus SUHRR-Cy5; b, AHBRR-Cy3 versus AHBRR-Cy5; c, SUHRR-Cy3 versus AHBRR-Cy5; d, AHBRR-Cy3 versus SUHRR-
Cy5; one-color hybridization: e, SUHRR-Cy3; f, AHBRR-Cy3.The two-color self-self hybridizations (codes a and b) provide information about
the reproducibility and specificity of the two-color hybridizations, but are not used for a majority of the analyses described in this paper because of space constraints and to more evenly balance the comparisons between the one- and two-color results within a platform. However, they are included in the available data set.
For each of the Agilent and CapitalBio sites, 5 microarrays were used for each of the RNA codes c, d, e and f, for a total of 20 microarrays (10 two-color and 10 one-color) at each of these sites. For the TeleChem site, 10 microarrays were used for RNA codes c and d, and 5 microarrays for codes e and f, for a total of 30 microarrays (20 two-color and 10 one-color). Across all five sites, a total of 110 microarrays were hybridized (60 two-color and 50 one-color), which assayed a total of 170 samples.
RNA quantification and purity assessment. RNA samples were quantified using a NanoDrop ND-100 UV-VIS spectrophotometer. Each test site performed three replicate measurements for each sample using 1.5 µl and reported the values as average ± s.d.
RNA intactness assessment. SUHRR and AHBRR (200 ng) were run on the Agilent Bioanalyzer 2100 in triplicate (all samples on one chip) by each test site. rRNA ratio (28S/18S) and RNA Integrity Numbers (RIN) are reported as average ± s.d. Acceptable values were defined as: A260/A280 ratio in the range of 1.8–2.2, rRNA ratio (28S/18S) > 0.9 and RIN value > 8.0.
Labeling and hybridizations on the Agilent platform. Five hundred nanograms of total RNA was converted into labeled cRNA with nucleotides coupled to a fluorescent dye (either Cy3 or Cy5) using the Low RNA Input Fluorescent Linear Amplification Kit (version 4.0 protocol) (Agilent Technologies). The quality and quantity of the resulting labeled cRNA was assessed using a NanoDrop ND-1000 spectrophotometer (NanoDrop Technologies) and an Agilent 2100 Bioanalyzer. Individually labeled cRNAs were not pooled before hybridization. Equal amounts of Cy3 and Cy5-labeled cRNA (1.5 µg) from two different samples (for the two-color protocol) or only from one Cy3-labeled cRNA (for the one-color proto-col) were hybridized (see hybridization configurations above) to Agilent Human Whole Genome Oligo Microarrays (G4112A) for 17 h at 65 °C. The hybridized microarrays were then washed using manufacturers’ recommended conditions and scanned using an Agilent G2565BA scanner. Data were extracted from the scanned image using Agilent Technologies’ Feature Extraction software version 8.5 (FE8.5). All data columns present in the extracted data files are described in detail in the Agilent G2567AA FE8.5 Software Reference Guide (http://www.chem.agilent.com/scripts/LiteraturePDF.asp?iWHID=41954).
34439
3816
39
160 87
51
129
30289
2814
2329
19
R = 0.947m = 0.913
R = 0.876m = 0.733
R = 0.968m = 0.842
R = 0.906m = 0.761
R = 0.916m = 0.924
R = 0.876m = 0.807
One-color B/A log2 ratio
One
-col
or B
/A lo
g 2 r
atio
One
-col
or B
/A lo
g 2 r
atio
Two-
colo
r B
/A lo
g 2 r
atio
Taq B/A log2 ratio
One-color B/A log2 ratio
Taq B/A log2 ratio
Taq Taq
a b10
5
0
–5
–10
10
5
0
–5
–10
–10 –5 0 5 1010
5
0
–5
–10
10
5
0
–5
–10
–10 –5 0 5 10
–10 –5 0 5 10
–10 –5 0 5 10
One color Two colorOne color Two color
Figure 4 Comparison of Agilent one-color and two-color data with TaqMan assay data. The figure illustrates the comparison of the one-color, two-color and TaqMan assay data, and is colored based on the significance of the ratio between B and A samples for the three different sets of data as illustrated. Significance was based on a P < 0.01 and a 1.5 fold change. Data shown represent either of two possibilities. (a) All probes with TaqMan mapped data (N = 906). (b) Only probes that were mapped as persistently detected in Agilent one- and two-color experiments (filtering as described in Methods) and that were detected in at least three of four replicates for both samples in the TaqMan assay data (N = 519). The numbers in gray refer to the number of genes that are not detected as significantly differentially expressed (based on given FC and P-value criteria) by any of the three assays. Lines shown represent the orthogonal fit to the data with slope (m) and correlation (R) as shown in the inset.
ANALYS IS©
2006
Nat
ure
Pub
lishi
ng G
roup
ht
tp://
ww
w.n
atur
e.co
m/n
atur
ebio
tech
nolo
gy

1148 VOLUME 24 NUMBER 9 SEPTEMBER 2006 NATURE BIOTECHNOLOGY
Labeling and hybridizations on the CapitalBio platform. The human genome-wide long oligonucleotide microarray was constructed in-house at CapitalBio Corporation. Briefly, 5′-amino-modified 70-mer probes representing 21,329 H. sapiens genes from the Human Genome Oligo Set Version 2.1 (Qiagen), and internal and external controls, were printed on amino silaned glass slides using a SmartArray microarrayer (CapitalBio Corp.).
Fluorescent-labeled DNA (Cy3 and Cy5-dCTP) was produced through Eberwine’s linear RNA amplification method and subsequent enzymatic reaction. This procedure has been previously described in detail17. Briefly, double-stranded cDNA containing T7 RNA polymerase promoter sequence was synthesized with 5 µg of total RNA using Reverse Transcription System, RNase H, DNA polymerase I and T4 DNA polymerase, according to the manufacturer’s recommended pro-tocol (Promega). The resulting labeled DNA (labeled control and test samples) was quantitatively adjusted based on the efficiency of Cy-dye incorporation and mixed into 80-µl hybridization solution (3× SSC, 0.2% SDS, 25% formamide and 5× Denhart’s). Individually labeled cRNAs were not pooled before hybridization. Hybridization on a microarray (see hybridization configurations above) was per-formed under LifterSlip (Erie Company). The hybridization chamber was laid on a three-phase Tiling Agitator (CapitalBio Corp.) to facilitate the microfluidic circulation under the coverslip. The microarray was hybridized at 42 °C over-night and washed with two consecutive washing solutions (0.2% SDS, 2× SSC at 42 °C for 5 min, and 0.2% SSC for 5 min at 22 °C) before scanning with a confocal LuxScan scanner (CapitalBio Corp.). For two-color microarrays, the scanning setting for the Cy3 and Cy5 channels was manually balanced by visual inspection of the external control spots. The data from the obtained images were extracted
with SpotData software (CapitalBio Corp.).
Labeling and hybridizations on the TeleChem H25K platform. Two micrograms of each sample was amplified using a Genisphere SenseAmp Plus Amplification kit (generating amplified poly A–tailed senseRNA), according to the manufac-turer’s recommended protocol. The resulting tailed senseRNA was reverse tran-scribed with amino-allyl indirect labeling using a SuperScript Indirect cDNA Labeling Kit (Invitrogen) with slight modifications. Each first strand cDNA generation reaction used 5 µg of senseRNA with Superscript II and aa-dUTP at 42 °C for 2 h. cDNA was purified using a MinElute PCR Purification Kit and conjugated with mono-functional Cy3 or Cy5 dye aliquot (GE Healthcare) for 1 h at 22 °C in the dark. Dye-conjugated cDNA was purified with a MinElute PCR Purification Kit. Dye:base labeling efficiency was determined at this point for all dye-conjugated cDNA.
Hybridization was done manually in TeleChem Hybridization cassettes using LifterSlip (Erie Company). cRNAs were labeled independently and not pooled before hybridization. In one-color experiments, Cy3-labeled cDNA samples were denatured independently and one sample applied to each microarray. For two-color experiments, Cy3- and Cy5-paired cDNA samples were combined and denatured before applying to individual microarrays (see hybridization configu-rations above). Hybridization mixes (55 µl total volume) consisted of 38.5 µl labeled cDNA, 5.5 µl 2% SDS, 7.0 µl 20× SSC, 3.0 µl poly dA (5 µg/µl) and 1.0 µl Cotl DNA (1 µg/µl). Hybridization cassettes and slides were pre-heated to 55 °C before samples were added and 3× SSC was added into humidity grooves in the cassette. Samples were applied to the microarrays and hybridized for 16 h at 55 °C in a water bath. After hybridization, slides were washed (10 min, 2× SSC/0.1% SDS at 42 °C; 10 min, 0.2× SSC/0.1% SDS at 42 °C; 10 min, 0.2× SSC at 22 °C twice) before centrifugation in 50-ml conical tubes at 201g for 5 min to dry. Scanning was performed on Axon 4200A or 4200B instruments at a PMT
yielding 1% or less saturated spots.
Agilent data preprocessing, normalization and filtering. For one-color experi-ments, gProcessedSignal values from Agilent’s Feature Extraction software were used as input into experimental analyses. This ProcessedSignal is generated after background subtraction and includes correction for multiplicative surface trends. Features were marked as Absent (A) when the processed signal intensity was less than twofold the value of the processed signal error value (these features were transformed by setting their processed intensity value to that of the processed signal error value). Features were marked as Marginal (M) when the measured intensity was at a saturated value or if there was a substantial amount of varia-tion in the signal intensity within the pixels of a particular feature. Features not considered Absent or Marginal were marked Present (P).
For the two-color microarrays, raw data signals were preprocessed in a similar fashion as those for one-color microarrays, but did not include a surface-trend correction and did include additional preprocessing to adjust for possible dye bias within a microarray. Data used in the two-color analyses was either the red and green ProcessedSignal or LogRatio values from Agilent’s Feature Extraction software. Dye normalization of two-color Agilent microarrays includes both linear scaling and Lowess normalization to a rank invariant set of microarray features. For some of the analyses (see Table 2, Fig. 4 and Supplementary Fig. 2), LogRatio values, which are calculated from the ProcessedSignals by Agilent’s Feature Extraction software, were used. When LogRatio was used for the two-color data, the sign on LogRatio was changed for half of the RNA comparisons to accommodate the dye swap.
Generation of a filtered feature list for Agilent one- and two-color data was conducted as follows: (i) Agilent flagging rules were applied, setting all absent and marginal features to missing. (ii) To derive a reliable common gene set across both one- and two-color data, features with fewer than 50% present genes across all microarrays were filtered. (iii) Features with fewer than five present calls from each sample group (A or B) across sites for one-color or fewer than five pres-ent calls across sites for two-color were also filtered. (iv) This filtering results in 19,802 genes in the final common gene set that was used for much of the statistical analysis presented, from a total of 41,000 non-control probes on the microarray. For the analysis presented in Figure 4 and Supplementary Fig. 2, all 41,000 noncontrol probes were included in the analysis.
Further details on the data processing steps used to generate the Agilent one- and two-color output columns can be found in the Agilent G2567AA FE8.5 Software Reference Guide (http://www.chem.agilent.com/scripts/LiteraturePDF.asp?iWHID=41954).
Data were median normalized for the statistical analyses in Figures 1–3 and Supplementary Figure 1 through JMP Genomics software (http://www.jmp.com/). For the remainder of the analyses, normalization of the Agilent one-color data was performed in GeneSpring GX as follows: (i) Values below 5.0 were set to 5.0. (ii) Each measurement was divided by the 50th percentile of all measurements in that sample. The percentile was calculated using only genes marked present.
For analyses presented in Figure 4 and Supplementary Figure 2 only, specific samples were normalized to one another. All samples were normalized against the median of the control samples (A). Each measurement for each gene in those specific samples was divided by the median of that gene’s measurements in the
corresponding control samples.
CapitalBio data preprocessing, normalization and filtering. All one-color and two-color images were analyzed using SpotData software (CapitalBio Corp.) and raw data were provided in the form of tab-delimited text files for each microar-ray. A spot-exclusion method was adopted to filter faint spots18,19. The aver-age log2 intensity of each gene across all replicates of both samples (A and B) was calculated and sorted. Genes with average intensity in the lowest 50% were excluded from further analysis. A subset of 11,735 genes from a total of 23,231 spots (including controls) remained for analysis.
Local median and background subtraction was applied for one-color and two-color intensity. For two-color data, an additional linear Lowess normalization was applied to the background-subtracted data. This was performed by scaling each channel to a median intensity of 100 and then normalized. For one-color data,
each microarray was scaled to a median intensity of 1,000.
TeleChem data preprocessing, normalization and filtering. All one-color and two-color images were analyzed using Axon GenePix Pro 5.0 software, and raw data were provided in the form of one tab-delimited text (.gpr) file per micro-array. Features automatically marked as Absent (A) had a numerical value of –75 and corresponded to features in the Axon (.gal) file that show ID ‘empty’. Features marked Not Found (NF) had a numerical value of –50 and were defined as features with less than 6 pixels, or the feature diameter was greater than the lesser of three nominal diameters set in Block Properties of the (.gal) file, or the diameter that would cause it to overlap an adjacent feature of nominal diameter, or the feature was found at a position that would overlap an adjacent feature. Features marked Bad (B) had a numerical value of –100 and were defined by visual inspection during spot finding as having major noise associated with either the spot or background signal. All probes with a value less than 0 on at least one microarray were removed across all microarrays. Features marked Present (P) had
ANALYS IS©
2006
Nat
ure
Pub
lishi
ng G
roup
ht
tp://
ww
w.n
atur
e.co
m/n
atur
ebio
tech
nolo
gy
NATURE BIOTECHNOLOGY VOLUME 24 NUMBER 9 SEPTEMBER 2006 1149
a numerical value of 0 and were considered acceptable for further analysis. The common filtered genes between one- and two-color microarrays were retained. The subset data was based on the list of 12,453 genes from a total of 27,648 spots (including controls) on the microarray. Analysis was based on intensity values: (F532_Median)-B532 intensity was used for one- and two-color data, in addition to (F635_Median)-B635 for two-color data. Lowess normalization of intensities was applied within individual two-color microarrays and median normalization across the microarrays.
The aforementioned preprocessing and normalization methods for all three platforms followed manufacturers’ recommendations to reflect what will most likely occur in common practice. The methods differ somewhat across platforms but are consistent within platforms in order to make intraplatform one-and two-color comparisons fair.
The primary difference in normalization techniques between the three plat-forms is found in the TeleChem two-color data. For all the other data analyses, median scaling was applied to the data before Lowess normalization. However, with the TeleChem two-color data, this process was reversed. To compare all the data using the same normalization work flow, we applied median scaling to the TeleChem two-color data before Lowess normalization and compared to the original normalization process (Lowess before median scaling). This compari-son is shown in Supplementary Figure 3 online. These additional data confirm that the minor differences in normalization procedure have very little impact
on the data.
Outlier assays. For the Agilent data set, microarrays identified as outlier microar-rays based on single microarray quality metrics (AG1_1_A1, AG1_2_A3, AG1_3_B3, AGL_1_B5, AGL_1_D1, AGL_2_A1, AGL_2_C4) were not removed from analysis for the majority of the analysis presented here. The analysis presented in
Figure 4 and Supplementary Figure 2 did exclude outlier microarrays.
Generation of common differentially expressed gene lists. Data used for the generation of the common differentially expressed gene lists (Table 2) were from the genes that passed data preprocessing and filtering criteria for each platform and included 19,802 genes for Agilent, 11,735 genes for CapitalBio and 12,453 genes for TeleChem. Data normalization for the Agilent data was performed as described above. For both CapitalBio and TeleChem, ArrayTrack20 median scal-ing was used for one-color data and Linear & Lowess for two-color data (default median target intensity = 1,000). Significant differentially expressed genes were identified with a one sample t-test of log2 (B/A) ratio of five replicates that differ from 0. For two-color data, the dye swap result was averaged before doing the t-test. For both one-color and two-color data, all combinations of P-values of 0.05 and 0.01 and fold-changes of 1.5, 2.0 and 4.0 were calculated to determine the percentage of common differentially expressed genes. The percentage of common genes was calculated by dividing the number of common genes identified as dif-ferentially expressed in both one- and two-color approaches by the total number of differentially expressed genes from both approaches combined. The common
manufacturer ID was used to identify the common genes from the gene lists.
ANOVA models. Several analyses are based on fitting three different models to the preprocessed and normalized data:
Model 1: log2(Intensity) = Mean + Sample + Site + Error Model 2: log2(Intensity) = Mean + Sample + Dye + Sample*Dye + Site +Microarray + ErrorModel 3: log2(Ratio) = Mean + Dye + Site + ErrorSeparate models are fitted to the data from each feature within each platform.
Model 1 is used for the one-color data and models 2 and 3 are used for the two-color data. In these models, Intensity refers to a particular intensity value for one gene; Ratio refers to a particular ratio value for one gene; Mean indicates an overall mean value, which corresponds to mean log2(Intensity) for models 1 and 2, and mean log2(Ratio) for model 3; Sample indicates whether the intensity measurement is from sample A or B (this term is not needed in model 3 because ratios between A and B are being modeled); Site indicates the site (included for Agilent data only because CapitalBio and TeleChem data only had one site); Dye indicates the dye effect in model 2 and the dye-swap configuration in model 3; Sample*Dye refers to an interaction effect between samples and dyes; Microarray indicates the microarray from which the data were measured; Error indicates
random error, which is assumed to be normally distributed with mean zero and variance specific for each gene.
Along with the Error term, the Site and Microarray effects are also assumed to be normally distributed with mean zero and constant variance. This arises from an assumption that effects of Site and Microarray can be assumed to be drawn from a normal population. They are so-called random effects, and estimates of their variances are known as variance components. All other effects are assumed to be fixed, that is, they have a finite number of levels, the mean value of which is estimated during the model fitting process.
Model 2 is obviously the most complex of the three models but is easily fitted to two-color data using standard mixed models software. The random Microarray effect is critical, as it models the correlation between pairs of intensi-ties observed on the same microarray. This model enables a more refined analysis of two-color results than that from model 3 by including estimates of overall mean intensity and the Sample*Dye interaction. Model 2 and its variants have been used successfully for the past five years in a variety of microarray applica-tions21–23.
For each feature on each platform, an estimate of the log2 fold change between samples A and B is computed in models 1 and 2 as the difference between the two levels of the estimated Sample effect. The ANOVA model output also includes a standard error and degrees of freedom for this difference, from which a –log10 P value is computed using a t-distribution. For model 3, the estimate of the Mean effect represents the estimated log2-scaled fold change (B/A) because the ratios were computed by dividing the B-intensity by the A-intensity, and a –log10 P value is computed in the same way as in models 1 and 2. Statistical results for all three models are based on mixed model theory21–24.
Comparison of Agilent one-color and two-color data with TaqMan assay data. One-color data were normalized in Agilent GeneSpring GX as described above including the normalization of specific samples to each other (Fig. 4). Two-color data were analyzed using the following scheme.
The processed signal data from the Agilent Feature Extraction software were loaded into Agilent’s GeneSpring GX software. To account for dye swap, we reversed the signal channel and control channel measurements for all d micro-arrays. Each gene’s measured intensity was divided by its control channel value in each sample.
TaqMan assay data were generated as part of the MAQC study as described elsewhere16. TaqMan assay data were imported into Agilent’s GeneSpring GX from the data file provided by the MAQC after splitting it into individual files for each sample. For the TaqMan assay comparisons, the mapping from the final 12,091 genes was used for cross comparison between the Agilent probes and TaqMan assays15. The processed (‘intensity like’) TaqMan assay data were imported into GeneSpring GX based on the mapping, and ratios were calculated as follows: each measurement for each gene in those specific samples was divided by the median of that gene’s measurements in the corresponding control (A, SUHRR) samples.
P values were calculated for the Agilent and TaqMan assay data using a one-sample t-test with the appropriate number of replicates (four or five for the microarray assays, depending on the comparison, and four for the TaqMan assays), with the mean intensity value (as calculated above) compared to 1.
Note: Supplementary information is available on the Nature Biotechnology website.
ACKNOWLEDGMENTSThe authors thank the MicroArray Quality Control (MAQC) consortium for generating the large data sets used in this study. E.K.L. and P.H. acknowledge the Advanced Technology Program of the National Institute of Standards and Technology, whose generous support provided partial funding of this research (70NANB2H3009).
DISCLAIMER This work includes contributions from, and was reviewed by, the FDA and the NIH. This work has been approved for publication by these agencies, but it does not necessarily reflect official agency policy. Certain commercial materials and equipment are identified in order to adequately specify experimental procedures. In no case does such identification imply recommendation or endorsement by the FDA or the NIH, nor does it imply that the items identified are necessarily the best available for the purpose.
ANALYS IS©
2006
Nat
ure
Pub
lishi
ng G
roup
ht
tp://
ww
w.n
atur
e.co
m/n
atur
ebio
tech
nolo
gy
1150 VOLUME 24 NUMBER 9 SEPTEMBER 2006 NATURE BIOTECHNOLOGY
COMPETING INTERESTS STATEMENTThe authors declare competing financial interests (see the Nature Biotechnology website for details).
Published online at http://www.nature.com/naturebiotechnology/Reprints and permissions information is available online at http://npg.nature.com/reprintsandpermissions/
1. Fodor, S.P. et al. Light-directed, spatially addressable parallel chemical synthesis. Science 251, 767–773 (1991).
2. Fodor, S.P. et al. Multiplexed biochemical assays with biological chips. Nature 364, 555–556 (1993).
3. Schena, M. et al. Quantitative monitoring of gene expression patterns with a comple-mentary DNA microarray. Science 270, 467–470 (1995).
4. Churchill, G.A. Fundamentals of experimental design for cDNA microarrays. Nat. Genet. 32, Suppl. 490–494 (2002).
5. Li, J., Pankratz, M. & Johnson, J. Differential gene expression patterns revealed by oligonucleotide versus long cDNA arrays. Toxicol. Sci. 69, 383–390 (2002).
6. Tan, P. et al. Evaluation of gene expression measurements from commercial platforms. Nucleic Acids Res. 31, 5676–5684 (2003).
7. Dobbin, K.K. et al. Interlaboratory comparability study of cancer gene expression analysis using oligonucleotide microarrays. Clin. Cancer Res. 11, 565–572 (2005).
8. Irizarry, R.A. et al. Multiple-laboratory comparison of microarray platforms. Nat. Methods 2, 345–349 (2005).
9. Larkin, J.E., Frank, B.C., Gavras, H., Sultana, R. & Quackenbush, J. Independence and reproducibility across microarray platforms. Nat. Methods 2, 337–343 (2005).
10. Kuo, W.P. et al. A sequence-oriented comparison of gene expression measurements across different hybridization-based technologies. Nat. Biotechnol. 24, 832–840 (2006).
11. Järvinen, A-K. et al. Are data from different gene expression microarray platforms comparable? Genomics 83, 1164–1168 (2004).
12. de Reynies, A. et al. Comparison of the latest commercial short and long oligonucleotide microarray technologies. BMC Genomics 7, 51 (2006).
13. Wang, Y. et al. Large scale real-time PCR validation on gene expression measurements from two commercial long-oligonucleotide microarrays. BMC Genomics 7, 59 (2006).
14. Bammler, T. et al. Standardizing global gene expression analysis between laboratories and across platforms. Nat. Methods 2, 351–356 (2005).
15. MAQC Consortium. The MicroArray Quality Control (MAQC) project shows inter- and intramolecular reproducibility of gene expression measurements. Nat. Biotechnol. 24, 1151–1161 (2006).
16. Canales, R.D. et al. Evaluation of DNA microarray results with quantitative gene expres-sion platforms. Nat. Biotechnol. 24, 1115–1122 (2006).
17. Guo, Y. et al. Genomic analysis of anti-hepatitis B virus (HBV) activity by small interfer-ing RNA and lamivudine in stable HBV-producing cells. J. Virol. 79, 14392–14403 (2005).
18. Barczak, A. Spotted long oligonucleotide arrays for human gene expression analysis. Genome Res. 13, 1175–1785 (2003).
19. Shi, L. et al. Cross-platform comparability of microarray technology: intra-platform con-sistency and appropriate data analysis procedures are essential. BMC Bioinformatics 6 Suppl. 2, S12 (2005).
20. Tong, W. et al. Development of public toxicogenomics software for microarray data management and analysis. Mutat. Res. 549, 241–253 (2004).
21. Wolfinger, R.D. et al. Assessing gene significance from cDNA microarray data via mixed models. J. Comput. Biol. 8, 625–637 (2001).
22. Jin, W., Riley, R., Wolfinger, R.D., White, K.P, Passador-Gurgel, G. & Gibson G. Contributions of sex, genotype and age to transcriptional variance in Drosophila mela-nogaster. Nat. Genet. 29, 389–395 (2001).
23. Chu, T-M., Deng, S., Wolfinger, R.D., Paules, R.S. & Hamadeh, H.K. Cross-site com-parison of gene expression data reveals high similarity. Environ. Health Perspect. 112, 449–455 (2004).
24. Chu, T-M., Deng, S. & Wolfinger, R.D. Modeling Affymetrix data at the probe level. in DNA microarray and statistical genomics techniques: Design, analysis, and interpreta-tion of experiment. (eds. Edwards, J.W., Beasley, T.M., Page, G.P. and Allison, D.B.) 197–222 (Chapman & Hall/CRC, Taylor & Francis Group, Boca Raton, FL, 2006).
ANALYS IS©
2006
Nat
ure
Pub
lishi
ng G
roup
ht
tp://
ww
w.n
atur
e.co
m/n
atur
ebio
tech
nolo
gy
Copyright © 2022 FDOKUMEN