
Project Quality Management - Why, What And How
193
-
Upload
independent -
Category
Documents
-
view
3 -
download
0
Transcript of Project Quality Management - Why, What And How

Project QualityManagementWhy, What and How
by Kenneth H. Rose, PMP
Copyright ©2005 by J. Ross Publishing, Inc.
ISBN 1-932159-48-7
Printed and bound in the U.S.A. Printed on acid-free paper10 9 8 7 6 5 4 3 2 1
Library of Congress Cataloging-in-Publication Data
Rose, Kenneth, 1947–Project quality management : why, what and how / by Kenneth Rose.
p. cm.Includes index.ISBN 1-932159-48-7 (softcover : alk. paper)
1. Project management. 2. Quality control. I. Title.HD69.P75R664 2005658.4′013—dc22 2005011209
This publication contains information obtained from authentic and highly re-garded sources. Reprinted material is used with permission, and sources are indicated.Reasonable effort has been made to publish reliable data and information, but theauthor and the publisher cannot assume responsibility for the validity of all materialsor for the consequences of their use.
All rights reserved. Neither this publication nor any part thereof may be repro-duced, stored in a retrieval system or transmitted in any form or by any means,electronic, mechanical, photocopying, recording or otherwise, without the priorwritten permission of the publisher.
The copyright owner’s consent does not extend to copying for general distributionfor promotion, for creating new works, or for resale. Specific permission must beobtained from J. Ross Publishing for such purposes.
Direct all inquiries to J. Ross Publishing, Inc., 6501 Park of Commerce Blvd., Suite200, Boca Raton, Florida 33487.
Phone: (561) 869-3900Fax: (561) 892-0700
Web: www.jrosspub.com

Dedication
Thank you, Nancy,for your love and support over the years.
This book is dedicated to our son, Geoffrey —a good person and a good engineer.

Table of Contents
Preface ............................................................................................ ixAbout the Author ........................................................................... xiWeb Added Value™ .................................................................... xiii
Section I. Quality FoundationsChapter 1. Understanding Quality in the Project Management Domain ..... 3Definition of Quality ................................................................................. 4
Traditional Definitions ........................................................................... 5Quality and the Triple Constraint ......................................................... 6
Cost of Quality .......................................................................................... 7Failure ..................................................................................................... 8Prevention ............................................................................................... 9Appraisal ............................................................................................... 10
Benefits of Quality ................................................................................... 11Summary .................................................................................................. 12References ................................................................................................ 12
Chapter 2. Evolution of Quality and Its Contemporary Applicationto Projects .................................................................................................. 13Progressive History ................................................................................... 13
The Dark Ages ..................................................................................... 13Scientific Management ......................................................................... 14Understanding Variation ....................................................................... 15Inspection Reigns .................................................................................. 16Japanese Quality ................................................................................... 16Customers and Systems ....................................................................... 17Quality Then and Now ........................................................................ 17
v

vi Project Quality Management: Why, What and How
The Wheel of Quality ............................................................................. 18Customer Focus .................................................................................... 19Variation ............................................................................................... 21Continuous Improvement .................................................................... 22Training and Leadership ....................................................................... 23The Wheel of Quality Model .............................................................. 23Quality and Responsibility ................................................................... 24
Summary .................................................................................................. 24Reference .................................................................................................. 25
Chapter 3. Pioneers and Paradigms .......................................................... 27Pioneers .................................................................................................... 27
Walter Shewhart .................................................................................. 27W. Edwards Deming ............................................................................ 28Joseph M. Juran ................................................................................... 30Philip B. Crosby ................................................................................... 30Kaoru Ishikawa ..................................................................................... 31Genichi Taguchi ................................................................................... 31
Paradigms ................................................................................................. 32Six Sigma .............................................................................................. 32ISO 9000 .............................................................................................. 33Baldrige National Quality Program ...................................................... 35Closing Thoughts ................................................................................. 36
Summary .................................................................................................. 36References ................................................................................................ 37
Section II. Quality ManagementChapter 4. Project Quality Planning ......................................................... 41Quality Management ............................................................................... 41Quality Planning ...................................................................................... 42
Quality Management Plan .................................................................... 42Identifying Customers .......................................................................... 43Prioritizing Customers .......................................................................... 45Identifying Requirements ..................................................................... 48Prioritizing Requirements ..................................................................... 50Quality Planning and Project Planning ................................................ 54Identifying Standards ............................................................................ 54
Summary .................................................................................................. 57References ................................................................................................ 59
Chapter 5. Project Quality Assurance ....................................................... 61Quality Assurance .................................................................................... 61
Developing Assurance Activities .......................................................... 62
Table of Contents vii
Metrics .................................................................................................. 62Quality Assurance Plan ........................................................................ 63Quality Audits ...................................................................................... 64
Summary .................................................................................................. 64References ................................................................................................ 65
Chapter 6. Project Quality Control and Quality Improvement ................. 67Quality Control ........................................................................................ 67
Role of Inspection ................................................................................ 68Quality Control Tools .......................................................................... 68
Quality Improvement .............................................................................. 69Reasons for Quality Improvement ....................................................... 69Hurdles ................................................................................................. 70Improvement Methodology .................................................................. 71
Summary .................................................................................................. 73References ................................................................................................ 73
Section III. Tools for Managing Project QualityChapter 7. Collecting and Understanding Project Data ............................ 77Tools for Collecting Data ........................................................................ 78
Check Sheet ......................................................................................... 78Tools for Understanding Data ................................................................. 81
Graphs .................................................................................................. 82Histograms ............................................................................................ 84Pareto Charts ........................................................................................ 86Scatter Diagrams .................................................................................. 90
Summary .................................................................................................. 93
Chapter 8. Understanding Project Processes .............................................. 95Tools for Understanding Processes .......................................................... 95
Flow Charts .......................................................................................... 95Run Charts ........................................................................................... 99Control Charts .................................................................................... 103
Summary ................................................................................................ 113
Chapter 9. Analyzing Project Processes ................................................... 115Tools for Analyzing Processes ............................................................... 115
Cause and Effect Diagrams ................................................................ 115Pillar Diagrams ................................................................................... 120
Summary ................................................................................................ 122
Chapter 10. Solving Project Problems ...................................................... 125Tools for Solving Problems .................................................................... 125
Force Field Analysis ........................................................................... 126Brainstorming ...................................................................................... 129Affinity Diagrams ............................................................................... 132Nominal Group Technique and Multivoting ..................................... 138
Summary ................................................................................................ 143
Chapter 11. Common Project Practices ................................................... 145Commonly Used Tools .......................................................................... 145
Compliance Matrix ............................................................................. 145Peer Review ........................................................................................ 148
Summary ................................................................................................ 149
Section IV. Quality in PracticeChapter 12. Project Systems and Solutions ............................................. 153The Red Bead Experiment .................................................................... 153Practical Exercise ................................................................................... 156
Background ......................................................................................... 156Data Collection .................................................................................. 157Requirement ....................................................................................... 158Tips ..................................................................................................... 158
Summary ................................................................................................ 159
Epilogue ................................................................................................... 161
Appendix 1. Case Study: Dakota Wireless Network ................................ 163
Index ....................................................................................................... 165
viii Project Quality Management: Why, What and How
Preface
This book is a product of frustration. Quality is clearly one of the keycomponents of project success. Everyone talks about quality. Everyone de-mands and promises quality in project implementation. But in the end, itseems to be much mentioned and little employed. The reason why is notdifficult to identify or understand. Many quality tools — indeed many qualitybooks, lectures, and training sessions — seem to be oriented toward themanufacturing domain. A discussion of methods and tools may start offgenerally enough, but as soon as examples enter the discussion, they leapright back to some kind of manufacturing environment. That may be finefor shop supervisors, but it provides little information of relevance to projectmanagers who work with intellectual processes more than the action detailsof production.
So where does a project manager go for guidance on how to integratequality into project implementation? Many years of searching have yieldedfew results. There just do not seem to be any good sources that deal directlywith both quality of the project and quality of the product. Project managersare busy people. They want answers, not a lot of Socratic questions or a lotof theory followed by good wishes for subsequent application.
This book delivers what has been missing. It provides a background ofquality concepts and their evolution over time, but is focused on the limitedinformation that is necessary for project managers to understand the contextof quality. It summarizes concepts in a model of contemporary quality thatprovides a unifying, big-picture view. It provides a simple framework ofspecific action steps to manage project quality. It explains key quality toolsrelevant to the framework and presents them in a logical order of application.Finally, the book takes readers through a practical exercise in a management
ix

environment that will allow them to experience an application — to dosomething — not just read about one.
This book will not make you an expert on quality. It will not enable youto lecture long and eloquently about the history and theory of quality. It willgive you an immediate hands-on capability to improve project implementa-tion and customer satisfaction by making quality an integral part of yourprojects and the products of your projects. That is probably what reallymatters anyway.
x Project Quality Management: Why, What and How

About the Author
Kenneth H. Rose completed a twenty-three-yearmilitary career in high-technology developmentand project management as a member of the ArmyAcquisition Corps. His hands-on experienceranges from the first steps of initiating concepts,identifying user requirements, and evaluatingtechnology alternatives to the culminating pro-cesses of project implementation and delivery.Subsequently, as senior research scientist withPacific Northwest National Laboratory, he helpedlarge government organizations to develop andapply quality improvement programs, innovative
performance measurement procedures, and strategic plans. As a projectmanager for a not-for-profit affiliate of Virginia Tech, he led projects andperformed technical work related to environmental activities, project man-agement training and implementation, and organization development andleadership. He is currently self-employed as Director, Peninsula Center forProject Management, Hampton, Virginia, providing project managementconsulting and training services.
Mr. Rose holds a Master of Arts degree in management from Ball StateUniversity and a Bachelor of Fine Arts degree in music theory and compo-sition from the University of Wisconsin-Milwaukee. He is a member of theProject Management Institute, a certified Project Management Professional(PMP®), and serves as book review editor of Project Management Journal, theacademic-research publication of PMI®. He is a senior member of the Ameri-
xi

can Society for Quality and an ASQ Certified Quality Manager. He is a lifemember of the National Defense Industrial Association and past chairman ofthe robotics division.
xii Project Quality Management: Why, What and How
xiii
Free value-added materials available fromthe Download Resource Center at www.jrosspub.com
At J. Ross Publishing we are committed to providing today’s professional withpractical, hands-on tools that enhance the learning experience and give read-ers an opportunity to apply what they have learned. That is why we offerfree ancillary materials available for download on this book and all partici-pating Web Added Value™ publications. These online resources may includeinteractive versions of material that appears in the book or supplementaltemplates, worksheets, models, plans, case studies, proposals, spreadsheetsand assessment tools, among other things. Whenever you see the WAV™symbol in any of our publications, it means bonus materials accompany thebook and are available from the Web Added Value Download ResourceCenter at www.jrosspub.com.
Downloads available for Project Quality Management: Why, What andHow consist of tools and templates for creating quality assurance plans,collecting and understanding data, comprehending and analyzing processes,and problem solving, such as cause-and-effect and pillar diagrams, force fieldanalysis, compliance matrix, and Excel tools for creating L-shaped matrix,Pareto charts, run charts, control charts, and various graphs used in managingproject quality.

Section IQuality Foundations

1Understanding Quality
in the ProjectManagement Domain
What is quality? Customers know it when they see it. Suppliers promise thattheir goods and services embody it. Both views are often missing a clear, up-front definition of what quality is, and this leads to confusion and frustrationwhen trying to determine just how to deliver it.
Project managers probably feel this most acutely. A customer may de-mand quality and an organization may promise to deliver quality, but aproject manager is the one who has to do it. Failure can have devastatingimmediate and long-term consequences for both the project manager and theproject organization.
Given its importance to project outcomes, quality ought to be a problemlong ago solved. It is not. Projects continue to be plagued by imprecise qualitygoals and arcane quality methods most suited for a shop floor, all of thiscondemning the project to less-than-satisfactory results or worse.
There is a better way. From a product manufacturing or service deliverypoint of view, quality is, to a great degree, a problem solved. Quality toolsand techniques have been developed and refined over the past 100 years tothe level that they are now a matter of science, not art. Applying these provenways to project management should be a simple matter of transference, butthat is the problem. Projects come in many stripes and colors. A projectundertaken by a national professional association to create a new technicalmanual has little relation to the codified quality tools of manufacturing,except in the final steps of producing the book itself, and that task is usuallycontracted to a source outside the project team.
3

4 Project Quality Management: Why, What and How
Definition of QualityThe key to project quality lies in making a more effective, meaningful transferof proven quality methods to a general project management domain. The firststep is to answer the question “What is quality?”
Exercise 1 — Consider the question “What is quality?” for a fewmoments. Take time to do this seriously. Put this book down, getout a blank sheet of paper, and think about the question in depth.What does quality mean to you? What might it mean to others?How do you describe quality to others? How do you know qualitywhen you see it? What are quality’s component elements? Makea few notes, then continue reading.
The results of this brief exercise probably vary among individuals. Somecentral themes may be common to all.
� Products — In some way, quality is associated with products. Thismay be the most obvious linkage. We define quality by our view ofthe features or attributes of some particular product: an automobile,an article of clothing, an electronic device, and so on. This view canlead us with confidence to the destructive “I’ll know it when I see it”definition of quality.
� Defects — The idea of defects in a product is closely related to theview of products themselves. The perception of product quality mayarise from favorable features, such as an automobile that always startson the first attempt, or is comfortable on long trips, or exhibitsefficient fuel consumption. Defects are a bit different. We expectquality products to be free of defects. When we purchase a car, theupholstery should not be ripped or soiled, all the indicator lights onthe dashboard should function properly, and there should be no crackedmirrors or light covers.
� Processes — Now things get a little more obscure. If we manufacturea product, we probably care very much about processes. To the usersof our product, the matter of processes tends to be rather transparent.Users focus more on the product and how it performs than on howit was produced. This issue is also very important to project managers.Whether they are delivering a product that results from manufactur-ing or purely intellectual activity, the processes that produce thatproduct have great effect on the outcome. What you do may keepa smile on your customer’s face, but how you do it will keep you on
Understanding Quality in the Project Management Domain 5
schedule and on budget — and that may make the customer’s smileeven brighter and longer lasting.
� Customers — People who sell what they make may be very productfocused in their view of quality. They seek to make products that aresuperior to those of competitors and always strive to be the best: “Thisis the best DVD player on the market today.” This view of qualitymay have short-term utility, but can be limiting, even lethal, for theorganization in the long term. Consider the boasts “This is the bestcarburetor on the market today” or “This is the best buggy whip onthe market today.” Both statements may be true, but if nobody isbuying carburetors or buggy whips, are they relevant? People whomake what other people want to buy have a different view of qualityand it is rooted in what customers want. To these people, quality isdefined by customers, their needs, and their expectations.
� Systems — A system is a group of things that work together. At ahigher level of analysis, quality may be viewed as arising from thingsthat work together. Products, defects, processes, and customers are allpart of a system that generates quality, as are suppliers, policies,organizations, and perhaps some other things unique to a specificsituation.
Traditional DefinitionsSeveral definitions of quality already exist. In Juran’s Quality Handbook, 5thedition,1 quality pioneer Joseph M. Juran states that quality has two meaningsthat are critically important to its management. Quality means “features ofproducts which meet customer needs and thereby provide customer satisfac-tion.” Quality improvement related to features usually costs more. Qualityalso means “freedom from deficiencies.” These deficiencies are errors that re-quire rework (doing something over again) or result in failures after a producthas been delivered to a customer. Such failures may result in claims, customerdissatisfaction, or dire consequences to the user. Quality improvement relatedto deficiencies usually costs less. Juran’s view considers products, defects, andcustomers.
Juran also makes a distinction between “Big Q” and “Little Q.” The conceptof Big Q is a more recent development, arising in the 1980s, and is moresystems-wide in its approach. It takes a broader view of quality that encom-passes the goals of the enterprise and all its products. It is usually embracedby quality managers and senior managers within the organization. Little Qis more limited in scope, often focused on individual products or customers.This view is usually embraced by those in technical or staff functions.
6 Project Quality Management: Why, What and How
The Project Management Institute defines quality as “the degree to whicha set of inherent characteristics fulfill requirements.”2 This definition is takendirectly from ISO 9000:2000, published by the International Organization forStandardization.3 The ISO 9000-series standards are a group of internationalconsensus standards that address quality management. ISO 9000:2000 is abrief introductory standard that covers fundamentals and vocabulary. Thisdefinition is most complete because it is so general. The set of inherentcharacteristics may be of a product, processes, or system. The requirementsmay be those of customers or stakeholders, an important group that is ignoredat great peril to the success of the project.
One important aspect of quality does not come out in any of thesedefinitions. Quality is “counterentropic”; it is not the natural order of things.Entropy, from the Second Law of Thermodynamics, says that things natu-rally move from a state of organization to a state of disorganization. Dropa handful of mixed coins on the floor and the result is not an array linedup in rows by type. The result is a bunch of coins spread randomly acrossthe floor. So it is with quality. However it is defined, quality is not anaturally occurring event. It is a result of hard, deliberate work that beginswith planning, includes consideration of contributing elements, applies dis-ciplined processes and tools, and never, ever ends. Achieving quality inproject implementation is not a matter of luck or coincidence; it is a matterof management.
Quality and the Triple ConstraintThe project “triple constraint” includes time, cost, and scope. All three el-ements are of equal importance to project success and to the project manager.Project managers typically try to balance the three when meeting projectobjectives, but they may make trade-offs among the three during projectimplementation in order to meet objectives and satisfy customers. Quality isa fourth among equals. It may be most closely associated with scope becausescope is based on customer requirements and quality is closely associated withcustomer requirements. This linkage addresses quality of the product of theproject. There is another important quality consideration: quality of the projectitself. Quality processes, attuned to the scope specifications, will ensure aquality product. Quality processes that maintain cost and schedule constraintswill ensure a quality project. Some recent project management literaturesuggests that quality is part of a quadruple constraint consisting of time, cost,scope, and quality. This approach is wrong-headed for one simple reason:Project managers routinely make trade-offs among the triple constraint tomeet project objectives. A project manager should never, never, ever tradeoff quality during project implementation.
Understanding Quality in the Project Management Domain 7
Cost of QualityMuch misunderstanding exists about quality in spite of the various definitionsin circulation. Quality is many things to many people, but quality is also notsome things that have been assumed over time.
� An expensive process — One of the first questions asked when aquality improvement effort is proposed is “How much will this cost?”This is always a valid question, but an uninformed view can producean invalid answer. Conventional wisdom, perhaps better called “con-ventional ignorance” in this case, has it that better quality costs more.In times of cost control and cost cutting, the answer to quality im-provement can be an unwise “We can’t afford that.” Philip B. Crosby,another quality pioneer, addressed this in a book entitled Quality IsFree. Briefly, his point was that quality does not cost, it pays. Whenyou improve the quality of a process, you reduce the defects thatresult from that process. While the new process may be more expen-sive — it may be less expensive, too — the resulting reduction ofdefects is something that pays back over and over and over. So if thepayback is more than the cost, as it often is, quality is essentially free.
� An expensive product — This may be the greatest misunderstandingof all because of the tendency to view quality in terms of products.An automobile with leather seats and little mechanical wipers on theheadlights costs more than one without these features. A fine “writinginstrument” costs more than a plastic ballpoint pen. But price doesnot confer quality. Review the definitions of quality. None of themmentions price. Quality arises from an ability to satisfy customerneeds. If a customer’s goal is to spend a lot of money, then an ex-pensive product may be viewed as top quality. Customers generallyseek the lowest price for a product that meets their functional needs,not the highest. Considering accuracy and maintenance, an inexpen-sive digital watch from a drugstore provides better quality than a moreexpensive mechanical watch from a jewelry store. A customer maywant the jewelry item, but only because it serves a purpose other thantimekeeping, not because it is a better quality watch.
� Time consuming — “We don’t have time” is the response that con-demns an organization to poor quality. Urgency prevails and shippingdates or field requirements rule. The reality is that we always havetime; we just choose not to use it wisely. The old adage “There’s neverenough time to do it right, but always enough time to do it over” isnot just a clever collection of words; it is the truth. Poor quality inproduction leads to rework. Delivery of poor quality products leads
8 Project Quality Management: Why, What and How
to replacement, warranty charges, lost customers, and loss of reputa-tion. In the long run, quality saves time and much, much more.
Crosby’s statement that quality is free is good theory. In practice, qualitydoes have costs, even if those costs are subsequently outweighed by benefits.The sources of cost of quality are three: failure, prevention, and appraisal.
FailureFailure costs may result from either internal or external failure. The majorcosts associated with internal failures, those that occur before a product hasbeen delivered to a customer, are scrap and rework. At the end of someprocess, a product may not conform to prescribed specifications. The degreeof nonconformance may be so severe that the product cannot be fixed andmust be discarded. Any costs associated with production to this point are lost.This is scrap. In some cases, the degree of nonconformance may not be sosevere. A reasonable amount of additional effort may bring the product intoconformance, so the product is re-entered into the process and any additionalwork adds to the overall cost of production. This is rework. The costs of scrapand rework are more than the sum of lost product and additional work. Costsassociated with disposal, storage, transportation, and inventory control mustbe included to determine total costs.
External failures, those that occur after a product has been delivered toa customer, may generate costs for repairs in accordance with product war-ranty obligations. They may also generate product recalls, which can be farmore expensive. Consider the potential cost of fixing a defective part duringassembly versus recalling 1.2 million automobiles to replace the defectivepart. Recall costs are orders of magnitude higher than repeat costs.
An external failure may also generate liability costs that are far moreexpensive. A coffeemaker that is improperly marked or includes defectivetemperature controls may produce coffee that scalds unsuspecting custom-ers. Or worse, an automobile may be so poorly designed that when struckfrom the rear in an accidental collision, the fuel tank ruptures and ignitesthe fuel, which causes immolation of any passengers in the car. The cost inhuman suffering and loss of life cannot be calculated, but courts will do thebest they can. Resulting awards in compensatory and punitive damages canbe astronomic.
External failure costs include those associated with complaints and com-plaint handling. Organizations must pay specially skilled staff members toreceive and respond to complaints. These employees must be empowered tooffer satisfaction of various kinds, all of which have a cost. Loss of customersis a cost of nonconformance that has been characterized as unknown andunknowable.4 Suppose a woman buys an expensive silk blouse at a high-end

Understanding Quality in the Project Management Domain 9
boutique. She wears it to a special event where a careless guest spills some-thing on it. She has it dry-cleaned, but notices on its return that one of theside seams has opened up. She takes it back to the boutique where her moneyis promptly returned because the shop stands by its products. Is the womana satisfied customer? Sure, she got her money back, but what about all theinconvenience and disappointment? Will she ever shop there again? There isno way to tell because no device has yet been invented that will count thenumber of customers who do not come back through the front door. Andwhat about her friends who will never shop there after hearing about her badexperience? Again, no device exists that will count the number of customerswho do not come through the front door initially. There is a bit of wisdomin retail sales regarding the buying habits of dissatisfied customers: “The goodscome back, but the customers don’t.”5
Beyond costs, the effects of failure are significant and many. The effectsbegin with dissatisfied customers. Satisfied customers can serve as unpaidsales representatives. Without coaching or any expectation of reward, theywill sing the praises of an organization and its products to all who will listen.Dissatisfied customers do just the opposite, and research shows they do soto a greater degree than satisfied customers. With a corps of complainersworking against them, organizations may experience a loss of customers,which leads to loss of business, loss of revenue, loss of jobs, and eventualfailure of the organization. Failure cost is not a trivial matter to be acceptedor analyzed away in a spreadsheet.
PreventionPrevention costs are fundamentally different from failure costs. These costsare related to things that an organization does rather than to outcomes of aprocess. Prevention costs begin with planning. One of the greatest errors aproject manager can make is to leap into performance without sufficientplanning. Planning may be limited for many reasons, none of them very good.Urgency may be a reason, but if the need for the product is so urgent, theproduct should be right when delivered. Management’s desire to cut costsmay be a reason, but would management be willing to fund the effort re-quired to do the work over and make it right if it is not when delivered?Planning generates early costs to be sure, but good planning prevents latercosts that arise from changes to an inadequate plan. The cost of changes goesup as the project progresses. Changes made during implementation are farmore expensive than changes made during planning. Good planning preventslater costs.
Prevention costs include both quality planning and audits, and processplanning and control. Quality planning establishes the quality managementsystem for the project. Quality audits ensure that the system works as in-
10 Project Quality Management: Why, What and How
tended. Generally, an audit is a comparison of performance to plan. A qualityaudit compares the performance of the organization or project quality systemto the quality plan. Audits have an associated cost, which may recur withevery audit. The results of quality audits show that the quality system isworking or show that it is not working and must be improved. The subse-quent result of either outcome is an effective quality system that reducesdefects and costs associated with those defects.
Process planning establishes the steps to be taken to produce the productof the project. Process control ensures that the process performs as expected.A well-trained work force may produce defective products if the establishedprocesses are not capable of producing a high degree of conforming product.Processes tend to be rather static, but other things in the system (materials,management, working conditions, tools, requirements) change around them.Processes must be monitored and analyzed to ensure that they are currentwith the need of the organization and not something that is done becauseit seemed like a good idea at the time of implementation. Process planningwill cause an organization to incur a cost for the plan and additional costsfor control activities and process improvements, but these costs will pay backin reduced defects over time.
Product reviews constitute another prevention cost. Customer coordina-tion and requirements definition, internal design reviews, and reliabilityengineering all generate early costs that contribute to quality of the finalproduct.
Suppliers are a critical component of quality. Costs related to evaluatingsuppliers and their quality management systems are prevention costs.
A well-trained worker and a well-trained work force are more likely toproduce products that conform to specifications. Less-trained workers maynot possess the ability to perform according to specifications. They may notrecognize nonconformance with specifications, and they may not even knowwhat the specifications are. When a worker produces an item that is sodefective that it must be discarded (scrap), the organization incurs a cost forevery item discarded…again, and again, and again. When the organizationtrains the worker to perform better, it incurs a one-time cost for the trainingand obtains cost savings from the reduced number of defects produced bythe worker as a result of the training. The training pays the organizationback…again, and again, and again.
AppraisalAppraisal costs begin with inspection of incoming supplies. The computerscience phrase “garbage in, garbage out” applies equally here. The quality ofa product is significantly affected by the quality of materials that go into itsproduction. Supplier evaluations may have determined that a particular supplier
Understanding Quality in the Project Management Domain 11
will provide what is needed for a project, but inspection of actual deliveriesis both prudent and essential. Some years ago, an army engineering centerwas fabricating special devices for clearing land mines in desert terrain. Asupplier initially delivered inferior quality steel that did not meet specifica-tions and would have endangered the lives of those depending on the devices.
In-process product inspection is a form of appraisal that ensures produc-tion is following the plan. Noted deficiencies may be corrected before the endof the process when scrap or additional-cost rework are the inevitable results.Final product inspection determines conformance of the result of the com-plete process.
Performance of well-known products may be predicted with some cer-tainty. Buy a ream of copy paper and it is likely to work as expected in theoffice copy machine. New products do not enjoy the same degree of certaintyin eventual performance. Testing will verify performance before the productis finished and delivered. Testing has a cost, but it is another appraisal costthat pays back over time in reduced rework of products that do not performprecisely as specified.
The effects of prevention and appraisal are simple and straightforward:better products, better processes, more capable workers, and more satisfiedcustomers. The big difference between prevention/appraisal costs and failurecosts is that failure costs are responses that occur repeatedly over time;prevention/appraisal costs are investments that provide cost benefits repeat-edly over time.
Benefits of QualityThe benefits of quality in project performance are many. First, a qualityproject and product will yield customer satisfaction. If you meet or exceedrequirements and expectations, customers will not only accept the resultswithout challenge or ill feeling, but may come back to you for additional workwhen the need arises. They may well become that oh-so-important unpaidsales representative and generate additional work from new customers throughreferrals. A satisfied customer may perceive greater value than originallyanticipated, which goes beyond customer satisfaction to customer delight.
Reduced costs are another benefit. Quality processes can reduce waste,improve efficiency, and improve supplies, all things that mean the projectmay cost less than planned. As costs go down, profits may go up (dependingon the pricing arrangement in the contract on which the project is based) orreduced costs may mean more sales to an existing customer within existingprofit margins.
Finally, better products, better project performance, and lower costs trans-late directly into increased competitiveness in an ever-more-global market-

12 Project Quality Management: Why, What and How
place. This is the essence of a quality chain reaction described by W. EdwardsDeming: improve quality, reduce costs, improve productivity, capture themarket, stay in business, provide more jobs.6
Summary� Quality involves products, defects, processes, customers, and systems.� Quality is the ability of a set of inherent characteristics of a product,
system, or process to fulfill requirements of customers and other inter-ested parties.
� Quality is a fourth among equals in relation to the project triple con-straint of time, cost, and scope.
� Quality is not an expensive process, an expensive product, or timeconsuming.
� The cost of quality may be viewed in terms of internal and externalfailure to conform to specifications (recurring costs) or prevention ofnonconformance and appraisal (investments, recurring benefits).
� The effects of failure to conform to specifications may include dissatisfiedcustomers, loss of customers, loss of business, loss of revenue, and failureof the organization.
� The effects of prevention and appraisal may include better products,better processes, more capable workers, and more satisfied customers.
� Quality benefits include customer satisfaction, reduced costs, increasedprofits, and increased competitiveness.
References1. Juran, J.M. and Godfrey, A.B., Eds., Juran’s Quality Handbook, 5th ed., McGraw-
Hill, New York, 1999, pp. 2.1–2.2.2. A Guide to the Project Management Body of Knowledge — Third Edition, Project
Management Institute, Newtown Square, PA, 2004, p. 180.3. ISO 9000:2000, Quality management systems — Fundamentals and vocabulary,
International Organization for Standardization, Geneva, 2000, p. 7.4. Deming, W.E., Out of the Crisis, The MIT Press, Cambridge, MA, 2000, p. 121.5. Ibid., p. 175.6. Ibid., p. 3.
13
2Evolution of Quality
and Its ContemporaryApplication to Projects
The concept of quality did not leap into existence fully formed. It evolvedover time. It developed in progressive steps that responded to the needs andlimitations of the times.
Progressive HistoryThe historical development of quality concepts may be traced by examiningmajor themes that held sway during various times. In some cases, thesethemes followed practice. In other cases, they made new practice possible andadvanced the overall concept of quality.
The Dark AgesThe march of quality began during the age of craft production, the 1700sand before. During this period, individual craftsmen produced items for useby others. The craftsmen were totally responsible for the product from startto finish. Consider Paul Revere, an American silversmith in Boston in the late1700s. He was personally responsible for all aspects of what he produced. Hedesigned the items, obtained supplies, developed production techniques,probably made many of his tools, sold the items to customers, and handledany complaints. He also received any suggestions or requests for custom-made
14 Project Quality Management: Why, What and How
items. He made the items one at a time, and each one was just a littledifferent (perhaps in ways indistinguishable to the casual observer) from anyother similar item.
Craftsmen had complete responsibility for, and total control of, the out-put of their work. They probably acquired their skills by watching and workingwith someone who was very good at the specific skill. Paul Revere probablyserved as an apprentice to a master silversmith before he established his ownbusiness. Schools and training courses with highly codified, standard proce-dures did not exist. Apprentices learned and adopted the ways of the master,perhaps later developing new methods that might result in better products,shorter or more efficient procedures, and increased competitiveness. Crafts-men worked in the home or a shop closely associated with the home. Today,visitors to Colonial Williamsburg in Virginia or similar historical sites mayview such craftsmen at work, including silversmiths, gunsmiths, and coopers(barrel makers).
The need for more items, produced faster, put a fatal strain on craftsmen.Work began to move to central locations where many workers combined theirefforts toward a common goal. Factories arose and the industrial revolutionchanged production in ways that emphasized quantity and commonality. Theproduction of a teapot, which Paul Revere made himself from start to finish,was broken down into tasks. Individual workers were responsible for only apart of the final product. Often, the workers did not even have a view ofwhat the final product was; they were only responsible for their particularpiece.
An element of craft production still existed in factories. Workers weregenerally highly skilled because work was done by hand, but now the focuswas on individual parts, not the whole. It was important that parts be verysimilar to each other so that they might be assembled into a final productwithout significant modification. Inspection became an important aspect ofproduction to ensure that parts met some established design standard. Workerswere the critical element in production; they were held responsible for theoutcome. The quality philosophy in play at the time might best be stated as“If you want to make the boat go faster, whip the oarsmen harder.”
Scientific ManagementFrederick Winslow Taylor saw things a bit differently. In his view, if you wantto make the boat go faster, you should examine and analyze those things thatmake the boat go and determine the best way to do it. In other words, itis not what you do, but how you do it that counts. In 1911, he publishedThe Principles of Scientific Management, which described his approach. Taylorsuggested that in getting things done, there is “one best method,” and it ismanagement’s responsibility to determine that method and the worker’s
Evolution of Quality and Its Contemporary Application to Projects 15
responsibility to follow established procedures. Taylor changed the focusfrom the worker to the process and, most significantly, separated planningand execution. Planning was a responsibility of management; execution wasa responsibility of workers.
Taylor’s approach broke the mold of worker-focused quality, but failedto recognize two key aspects of quality. The first is motivation. Taylor as-sumed that workers were principally motivated by money. He described a“high-priced man” as a worker who will perform according to management’sprescribed procedures for money. The other is his assumption that once anoptimal procedure is defined, the results will be the same for every worker.Taylor’s scientific management involves one way of doing something, onestandard worker, no variation in performance, and no communication be-tween workers and management.
Understanding VariationThe next leap forward occurred when Walter Shewhart expanded the qualityfocus to include variation. In 1918, Shewhart was a newly hired physicistworking at Western Electric’s Bell Laboratories. At that time, radio was arelatively new invention being applied to military use. Shewhart was assigneda project to develop a radio headset for the military. The headsets had to fitcomfortably, so “head breadth” (the physical distance between the ears) wasone of the factors to be considered. When analyzing head breadth dataprovided by the military, Shewhart noticed an orderly distribution. Somepeople had wide heads, some had narrow heads, and a lot fell in between.The data seemed to follow a normal distribution pattern.
Shewhart wondered if manufacturing processes employed at Western Elec-tric might exhibit the same kind of variation. He began to study the issueand this became a primary interest for the rest of his career. Shewhart’sstudies revealed that almost all types of repeatable processes exhibit variation.The key is repeatable processes. If you do something the same way over andover, the results will not be exactly the same. They will be similar, but willvary to some degree in predictable ways. Shewhart found this phenomenonin both manufacturing and administrative activities.
Over time, Shewhart developed methods for analyzing and understandingthis variation. His work became a foundation for doing something about thevariation, not just observing it. In 1931, he published Economic Control ofQuality in Manufactured Products, which outlined the principles of statisticalprocess control (SPC), a disciplined approach for improving quality by reduc-ing variation in the process. In 1939, Shewhart published another book,Statistical Method from the Viewpoint of Quality Control, which introduced theplan-do-check-act cycle as a means of implementing quality improvements(see Chapter 6 for further discussion).

16 Project Quality Management: Why, What and How
Inspection ReignsVariation meant potential waste. If a product varied too far from a target,it had to be redone or discarded. During World War II, the demand formanufactured products of many kinds increased dramatically. Military cus-tomers had urgent requirements that would not tolerate a lot of scrap andrework. At the same time, shortages of materials required efficient utilizationof what was available. Shewhart’s SPC techniques were put to good use byindustrial suppliers of military goods. W. Edwards Deming, who had workedwith Shewhart at Western Electric, helped the War Department applyShewhart’s methods. Conformance to specifications became the central focusof quality, and inspection (comparing final results to targets) became theprimary method of achieving conformance.
It would be nice to believe that wartime requirements moved qualityforward, but they did not. Urgent requirements demanded shorter productiontimes and that, in turn, reduced quality. The tendency arose to ship productsthat were close enough to target because the military forces in the field neededthem right now.
After World War II, the United States had very little industrial compe-tition because of wartime damage to facilities in other countries. Producersbecame complacent. SPC withered as an unnecessary expense. Postwarmanagers did not take time to understand the benefits of SPC. Qualitymatters became a function of organizational quality departments. Qualitybecame a numbers game involving the number of charts rather than themeaning of the data, or the number of people trained rather than the im-provement that resulted from the training. Inspection departments flourishedas the quality focus drifted back to conforming within an acceptable level oferror.
Japanese QualityNot everyone was complacent, however. In Japan, members of the JapaneseUnion of Scientists and Engineers considered quality a key component inrebuilding the country’s industrial base in ways that would enhance interna-tional competitiveness. They invited experts from other countries to come toJapan and share their methods. W. Edwards Deming was one of the first. In1950, he presented a series of lectures to leaders of Japanese industry. TheJapanese participants were much taken by both Dr. Deming and his ideas.They listened carefully and took steps to put quality concepts into practice,particularly SPC.
Other American quality pioneers participated. Joseph Juran visited andprovided a more strategic view that expanded quality methods to all functionswithin an organization, not just the shop floor. His definition of quality as“fit for customer use” changed the focus from conformance to specification

Evolution of Quality and Its Contemporary Application to Projects 17
to meeting customer expectations. Armand Feigenbaum’s “total quality con-trol” approach integrated the various departments in an organization so thatquality became a way of life — all elements of an organization workingtogether toward the same goals.
For their own part, Japanese engineers and managers added internalcustomers to the quality equation, those elements of a process that receiveinput from others and act on it in some way before providing it to the nextelement in the process. They added the concept of quality circles — smallgroups of workers and managers who work together to solve a problem —a far cry from Taylor’s “do what management says” approach. And perhapsof most significance, they added the concept of kaizen — continual, incre-mental improvement. Quality was no longer a destination based on conform-ance to requirements; it became a journey that never ends.
As a result, Japan became a global economic superpower within twentyyears. The label “Made in Japan” attached to simple products like a smallbamboo umbrella served with an exotic beverage was once a source of mildderision. Because of Japanese quality achievements, it became a label ofrespect, denoting items that did what customers expected them to do, workedthe first time, and did not fail during use.
Customers and SystemsIn the contemporary view, customer requirements define quality, not prod-ucts or processes. In other words, it is not what you do or how you do it,but who uses it that counts. Quality is in the perception of the customer.Using the classic example from quality literature again: You can make thebest buggy whip that was ever made, using the finest materials and applyingefficient processes that have almost no defects or waste, but if nobody needsa buggy whip, it just does not matter.
Many things work together to yield products that meet customer require-ments. Viewing these things independently can lead to competition amongthe elements that interferes with the desired quality outcomes. Viewing thesethings as a system allows integrated consideration and optimization of thewhole for the customer’s benefit. Elements of a quality system include ex-ternal customers, internal customers, suppliers, materials, processes, policies,tools, skills, capabilities, and even society as a whole.
Quality Then and NowContemporary quality concepts might be best understood by way of compari-son to what existed previously, a comparison of quality then and quality now.In recent times past, quality comprised three elements: inspection, statistics,and rework. At the end of some production process, a result was inspectedto determine its degree of conformance to specifications. The degree of

18 Project Quality Management: Why, What and How
conformance was usually stated in terms of a range of values to account forprocess variation. Statistical techniques were applied to determine the accept-able level of performance. Organizations might establish an “acceptable qual-ity level” of 99.995 percent for a particular process; that is, no more than5 defects per 100,000 results. Items that were judged to be defective werereinserted into the process for additional work at additional cost to bringthem into conformance or discarded if the defects were so severe that theitem could not be fixed economically. Higher levels of quality usually meanthigher costs because more defective items fell into the unacceptable categoryand had to be either reworked or discarded.
Contemporary quality comprises a significantly different set of elements:customer focus, variation, and continuous improvement. Quality begins withan understanding of customer requirements as the base. Customer require-ments establish the performance goals for the organization. Variation is anomnipresent aspect of every process. It cannot be wished away or analyzedaway through statistics, which ultimately accept the variation and change theprocess expectations around it. Instead, variation is understood and controlledusing statistical methods that determine its predictability. Continuous im-provement begins with the state of the current process as statistically definedand identifies opportunities for modifications to the process that will reducethe degree of variation, which in turn reduces defects and increases consis-tency and predictability of performance (see Table 2.1).
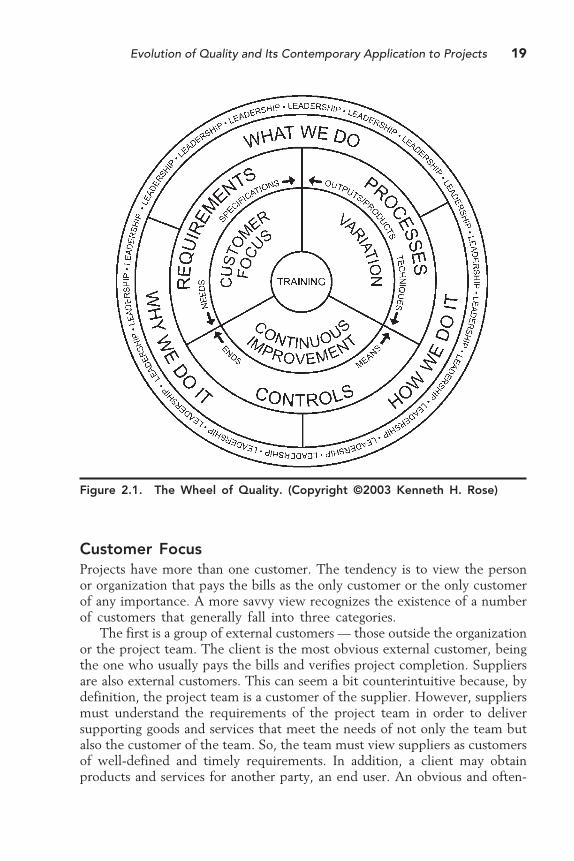
The Wheel of QualityThe concepts of contemporary quality are codified in a single graphic imageas seen in Figure 2.1. This graphic displays the three elements of customerfocus, variation, and continuous improvement, showing the relationships andinteractions among them. It also adds the essential elements of training andleadership.
Table 2.1. Quality Then and Now.
Quality Then Quality Now
Inspection: Inspect something at the endof production to determine if it meetsspecifications
Statistics: Establish statistical goals forconformance
Rework: Fix (or discard) nonconformingproduct
Customer focus: Customer requirementsare the base
Variation: Understand it, control it
Continuous improvement: Products andprocesses improve forever
Evolution of Quality and Its Contemporary Application to Projects 19
Customer FocusProjects have more than one customer. The tendency is to view the personor organization that pays the bills as the only customer or the only customerof any importance. A more savvy view recognizes the existence of a numberof customers that generally fall into three categories.
The first is a group of external customers — those outside the organizationor the project team. The client is the most obvious external customer, beingthe one who usually pays the bills and verifies project completion. Suppliersare also external customers. This can seem a bit counterintuitive because, bydefinition, the project team is a customer of the supplier. However, suppliersmust understand the requirements of the project team in order to deliversupporting goods and services that meet the needs of not only the team butalso the customer of the team. So, the team must view suppliers as customersof well-defined and timely requirements. In addition, a client may obtainproducts and services for another party, an end user. An obvious and often-
Figure 2.1. The Wheel of Quality. (Copyright ©2003 Kenneth H. Rose)
20 Project Quality Management: Why, What and How
used example is dog food. The end user of the product is the dog that eithereats or rejects the food. The client is the dog owner who either buys or rejectsthe food initially. Marketing and sales efforts are directed toward the client,not the end user, but the end user must be considered throughout the projectto develop, produce, and sell the product.
Internal customers constitute another category. A project, unless it isextremely simple, is usually completed by a number of collaborating ele-ments within an organization. Each element performs a piece of the workand passes its piece on to another element that will perform another pieceand pass it along to another and another until the final product is deliveredto the client. These collaborating elements have a supplier-customer rela-tionship to each other. Each element produces something as a supplier thatis passed along to another element that receives it as a customer. Projectsmay involve complex networks of internal customers that are critical toproject success. Simply stated, an internal customer is the next step in theprocess chain.
Hidden customers can be the most difficult to identify and the mosttroublesome for project managers. Hidden customers are stakeholders —people or organizations that do not participate directly in the project, buthave an interest in or concern about the project to the degree that they maywant to influence the outcome. Some may be apparent; initiate a project todeploy a statewide wireless network and a government regulator (such as theFederal Communications Commission) will pop up as a hidden customer.Some are not apparent; these tend to be the dangerous ones as they canappear out of nowhere and put a project off track. Wireless network imple-mentation may be going according to plan until a local group files a stop-work lawsuit because people do not want any communication towers in theirbackyard.
Customers are important for many reasons. An unknown source suggeststhat people who do not think customers are important should try to dobusiness without them for a while. Customers buy our products. They buyour products repeatedly. They tell their friends to buy our products. Theydefine needs for new products. They indicate interest in, or a lack of interestin, or even opposition to, potential products. And perhaps most importantof all, they complain and give us valuable information and insight for improv-ing our products.
All of this suggests a customer role that falls into four parts:
1. Provide needs and requirements — Customers are important becausethey are the source of requirements that are the foundation for theproject.
2. Define standards — Beyond requirements, customers describe “howwell” a product should perform. They provide measurable targets.
Evolution of Quality and Its Contemporary Application to Projects 21
3. Evaluate products — Customers will accept or reject products basedon the degree to which the products meet their expectations.
4. Provide feedback — Customers will comment, complain, recommend,or purchase a product again.
VariationRepeatable processes do not produce precisely repeatable results. Variationis a characteristic of any production process, but it is not a great mystery.Variation can and must be understood and controlled in order to influenceresults. The unique aspects of projects can lead managers and team membersto believe that everything they do is unique and that variation is not an issue.Project managers may have to spend a little time to determine what taskswithin a project, or between projects, involve repeatable work. Doing so isan early step toward improved quality.
This is an important matter because variation can produce defects. Afteridentifying sources of potential variation, project managers must seek tounderstand the variation, why it occurs, and what its effects are. Then theymust control the variation so the process involved performs consistently,producing predictable results. Improvement occurs when project managers ormembers of the project team analyze the process and take action to reducethe variation to some degree. If the process is routinely producing results thatlie outside established specifications, it must be fixed immediately. Subse-quent actions should reduce variation further, which results in a higher numberof conforming products or products that conform more closely to the targetvalue. As an example, the “Six Sigma” approach to quality managementestablishes a goal of process variation so narrow that product specificationsencompass six standard deviations above and below the mean when perfor-mance results are plotted on a curve. The practical result, adjusted to allowa slight shift in the mean over time, is no more than 3.4 defects per million.(Six Sigma is discussed further in Chapter 3.)
Project managers and other levels of management are primarily respon-sible for quality. This obligation is based on a principle credited by varioussources to both Joseph Juran and W. Edwards Deming. It is the “85/15 rule,”which states that 85 percent of workers’ performance is determined by thesystem they work within and 15 percent is determined by their own indi-vidual effort. Management, not individual workers, is responsible for thesystem. Therefore, when seeking improvement in a process, project managersshould first analyze and fix the system, not blame the workers. In the sameway, project managers should be careful about rewarding individual workersfor system performance over which they had no influence. Rewarding peoplefor the wrong things can be just as harmful to organizational cohesion andmorale as blaming people for the wrong things.

22 Project Quality Management: Why, What and How
Continuous ImprovementContinuous improvement can be a thorny issue for project managers. Projectsbased on an external contract have explicit specifications — obligations in thecontract. A practical approach may be to “meet specifications” because thatis what is required and that is all that is paid for. In fact, “quality” is definedby some as “conformance to requirements,” suggesting that meeting specifi-cations achieves quality. Superficially, meeting specifications is the goal. TheProject Management Institute makes much of this, stating that this is all aproject manager should do; anything beyond is “gold plating.” This makesgood sense. Gold plating (adding expensive features to a product that gobeyond the original scope, but do not add anything of value to the customer)should be avoided, but in a wider view, meeting specifications may be doingjust enough work to escape punishment. The result may be a satisfied cus-tomer, albeit a minimally satisfied customer. Meeting specifications alsoconstrains project performance to the limits of the specification or thecustomer’s understanding of technology or what is possible. It does not givethe customer a better solution if one is possible. It does not enhance orga-nizational competence unless specifications have been set challengingly high,something contract managers are reluctant to do. Meeting specifications canmean safe, routine performance that does not enhance organizational com-petitiveness. Specifications provide a conundrum that is simply stated:
If you don’t meet the specifications, you are in default.
If you want to complete the current contract, meet the contractspecifications.
If you want to win the next contract, meet or exceed the customer’sexpectations.
Continuous improvement involves at least three specific actions. Commu-nication is essential. The project team must have effective communicationwithin itself and with customers, suppliers, and stakeholders. Communicationis the means of identifying problems and opportunities, resolving problems,and exploiting opportunities.
Corrective action is also essential. Fixing problems is necessary, but notsufficient. Project managers and team members must also identify the causesfor any problems and eliminate them or reduce them to the greatest extentpossible. It is good to fix a problem; it is better to prevent it from occurringagain.
Identifying and acting on opportunities completes the three. The plan-do-check-act cycle provides a disciplined approach for continuous improvementbased on either identified problems or opportunities.
Evolution of Quality and Its Contemporary Application to Projects 23
The results of continuous improvement may be incremental small stepsor dramatic great leaps forward. Both types of results provide common benefitsto the performing organization that enable it to:
� Meet dynamic needs and requirements — Customer needs are alwayschanging. Give them what they ask for and they will ask for more.
� Stay competitive — Competitors are always improving. The globalmarketplace is not in a steady state; it is a race, and you cannot wina race by standing still.
� Reduce costs, increase profits — The global marketplace includescompetitors with very low costs, particularly in labor. Reducing costscan increase competitiveness, which will increase sales and overallprofit.
� Develop new technologies, processes, and products — Technology isalways changing. Improving processes to take advantage of new tech-nology or simply to employ a better way can reduce costs, providea better product, or both.
Training and LeadershipTraining is the foundation of quality. Action should be based on well-groundedtheory, not trial and error, how things have been done before, or the desireor dictum of an individual. Members of the project team, including theproject manager, must be trained in all necessary skills. Members new to theteam during implementation must be trained also, not simply placed on thejob and admonished to learn from others.
Leadership is the unifying force of quality. The goals of leadership are toimprove performance and quality, increase output, and bring pride of work-manship to people.1 Leadership is necessary to eliminate the causes of defects,not just the defects alone. To be effective, leaders must know the job. Theymust be technically competent in the work at hand and capable in purelyleadership skills in order to earn the respect and commitment of team membersand to represent the project team well with customers, stakeholders, andupper management within the organization.
The Wheel of Quality ModelThe graphic image of The Wheel of Quality discloses how all these elementsinteract. Customer focus, variation, and continuous improvement are thecentral issues in contemporary quality. Each is related to the others and sharesa common boundary. Each is expressed through a more specific aspect ofproject work — respectively, requirements, processes, and controls.

24 Project Quality Management: Why, What and How
These aspects are not discrete, but exist as a spectrum between twoextremes. Requirements may range from general needs to explicit specifica-tions. Processes may be viewed from those focused on outputs or products,which interface with the explicit specifications of requirements, to generaltechniques. Controls may focus on means of production, which interface withthe techniques of processes, to ends of production, which interface with thegeneral needs of requirements, completing the linkage of all three aspects.
These aspects are further linked by higher level considerations in theorganization that bridge the aspects two at a time. What we do bridgesrequirements and processes, how we do it bridges processes and controls, andwhy we do it bridges controls and requirements.
As the foundation of quality, training is the hub of the wheel. Withouttraining, project team members will be unable to employ the three elementseffectively. Leadership holds it all together. Leadership encircles all elements,aspects, and considerations in a continuous outer loop that binds them in aunified whole.
Quality and ResponsibilityGiven all this, a simple question remains: Who is responsible for quality? Intimes past, the quality department was responsible, but no more. Qualitydepartments have been significantly reduced and functions have been trans-ferred to the performing level or eliminated altogether. Nowadays, everyoneis responsible for quality. Organizational management is responsible for thequality system. Project managers are ultimately responsible for project andproduct quality. Project teams are responsible for the quality aspects of theirpart of the project, and individual team members are responsible for qualityin everything they do to contribute to project completion. No one has theluxury of off-loading quality responsibility to someone else or some otherfunction. Everyone associated with a project is responsible in some way, withthe project manager bearing the burden or obligation of ensuring quality ineverything the project does.
Summary� Contemporary quality arose through an evolution from craftsmen totally
responsible for quality, to factories that distributed tasks and qualityresponsibility, to scientific management that focused on processes ratherthan individual workers. It further developed through an understandingof process variation and an understanding of the role of customers andsystems.

Evolution of Quality and Its Contemporary Application to Projects 25
� The traditional quality approach involved inspection, statistics, and re-work. The contemporary approach involves customer focus, variation,and continuous improvement.
� Training and leadership are essential to contemporary quality.� The Wheel of Quality graphically displays the elements of contemporary
quality and the interrelationships among them.� Everyone is responsible for quality. The project manager is ultimately
responsible for project and product quality.
Reference1. Deming, W.E., Out of the Crisis, The MIT Press, Cambridge, MA, 2000, p. 248.


27
3Pioneers
and Paradigms
Contemporary quality is what it is today because of the combined contribu-tions of pioneers who made breakthrough advances by developing, describing,and deploying new techniques. Over time, new methods were integrated intoexisting frameworks or coalesced into entirely new frameworks that providedcomprehensive, systematic approaches to quality.
PioneersThe few included here are principal pioneers, well known for achievement andapproach. Many others contributed, some probably unnoticed or unrecognized.
Walter ShewhartShewhart was mentioned previously in Chapter 2. His work at Bell Labora-tories was the foundation for statistical techniques that brought considerationof variation into the mainstream of quality. Accordingly, Shewhart has beencalled “the father of statistical quality control.” He was acquainted with W.Edwards Deming and Joseph Juran and mentored them both in their earlycareers.
In his 1931 book, Economic Control of Quality of Manufactured Product,Shewhart identified two types of variation: chance cause, which was inherentin the system and could not be individually identified, and assignable cause,which was an exception in the system and could be individually identifiedand removed. He developed techniques for collecting and analyzing data that
28 Project Quality Management: Why, What and How
would show the difference between these two sources of variation and allowimprovement by eliminating assignable cause variation. He later developedand described the plan-do-check-act cycle, a disciplined approach to qualityimprovement that will be discussed in detail in Chapter 6.
W. Edwards DemingDeming is perhaps the best-known quality pioneer. His approach to qualitywas statistically based, but focused on responsibilities of management. Whileothers focused on details, he maintained a broad, almost philosophical, viewthat considered quality in overall economic terms. His “chain reaction,”mentioned in Chapter 1, is a good example of his wide-ranging approach.
Early in his career, he worked at Western Electric’s Hawthorne plant,where he came into contact with Walter Shewhart. In the 1940s, he assistedthe U.S. Census Bureau in applying statistical sampling techniques. DuringWorld War II, he worked with U.S. defense industries to improve the qualityof military items through statistical processes.
After World War II, Deming went to Japan under government sponsor-ship to assist with a population census. While there, he was invited by theJapanese Union of Scientists and Engineers to present a series of lectures onstatistical quality control techniques. He found a copy of Shewhart’s 1931book in a library at General MacArthur’s headquarters in Tokyo and used itas a foundation for the lectures. The Japanese participants were much takenwith Dr. Deming and his ideas. They listened carefully and applied what theylearned energetically and relentlessly. Japan’s national quality award, theDeming Prize, is named in his honor. Dr. Deming was also much taken bythe Japanese pursuit of quality. He commented later in life that no popu-lation in his worldwide experience equaled the dedication of Japan’s.
Deming never established a short, single theory of quality. Instead, hedeveloped a list of fourteen goals or admonitions that he called “fourteenpoints for management.” He strongly believed that these points were thefoundation for a transformation of American industry. He viewed quality asan obligation of management. He did not view with great kindness what hesaw as the traditional American approach of blaming quality problems onworkers. During his lectures in Japan, he bluntly told participants to importAmerican quality techniques, but not to import American management tech-niques. The fourteen points, in a somewhat abbreviated form, are shown inTable 3.1.
The fourteen points must be taken as a whole. Piecemeal or partial adop-tion will not suffice, and no individual point is more important than another.Later in life, Deming expressed some regret that he had numbered the pointsbecause people assumed that the numbers indicated priority of performance,something Deming had not intended at all.
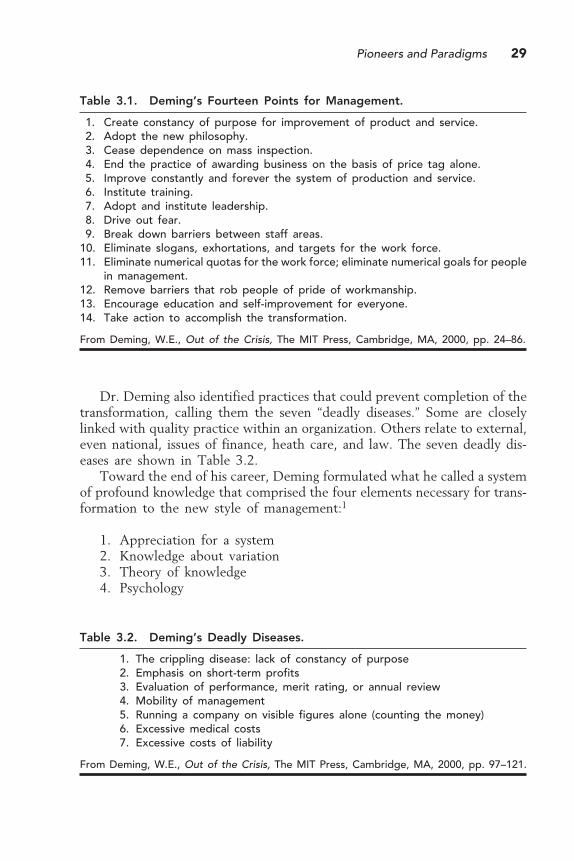
Pioneers and Paradigms 29
Dr. Deming also identified practices that could prevent completion of thetransformation, calling them the seven “deadly diseases.” Some are closelylinked with quality practice within an organization. Others relate to external,even national, issues of finance, heath care, and law. The seven deadly dis-eases are shown in Table 3.2.
Toward the end of his career, Deming formulated what he called a systemof profound knowledge that comprised the four elements necessary for trans-formation to the new style of management:1
1. Appreciation for a system2. Knowledge about variation3. Theory of knowledge4. Psychology
Table 3.1. Deming’s Fourteen Points for Management.
1. Create constancy of purpose for improvement of product and service.2. Adopt the new philosophy.3. Cease dependence on mass inspection.4. End the practice of awarding business on the basis of price tag alone.5. Improve constantly and forever the system of production and service.6. Institute training.7. Adopt and institute leadership.8. Drive out fear.9. Break down barriers between staff areas.
10. Eliminate slogans, exhortations, and targets for the work force.11. Eliminate numerical quotas for the work force; eliminate numerical goals for people
in management.12. Remove barriers that rob people of pride of workmanship.13. Encourage education and self-improvement for everyone.14. Take action to accomplish the transformation.
From Deming, W.E., Out of the Crisis, The MIT Press, Cambridge, MA, 2000, pp. 24–86.
Table 3.2. Deming’s Deadly Diseases.
1. The crippling disease: lack of constancy of purpose2. Emphasis on short-term profits3. Evaluation of performance, merit rating, or annual review4. Mobility of management5. Running a company on visible figures alone (counting the money)6. Excessive medical costs7. Excessive costs of liability
From Deming, W.E., Out of the Crisis, The MIT Press, Cambridge, MA, 2000, pp. 97–121.

30 Project Quality Management: Why, What and How
These interrelated elements are discussed at length in Dr. Deming’s book TheNew Economics for Industry, Government, and Education.
Joseph M. JuranJuran also presented quality lectures in Japan. His approach to quality focusedon strategic and planning issues. He believed that poor quality results frominadequate or ineffective planning, so he proposed the Juran Trilogy, a three-step approach to quality that includes quality planning, quality control, andquality improvement.2 His view that quality has two aspects — productfeatures and freedom from defects — was mentioned in Chapter 1. Jurans’sQuality Handbook, 5th edition, edited by Juran and A. Blanton Godfrey, isthe most comprehensive quality book on the market today.
According to Juran, quality improvement depends on two different activi-ties: control and breakthrough. Control ensures that processes are performingconsistently, free of assignable cause variation. Breakthrough occurs after aprocess has been studied and some major improvement has been designed andimplemented. He suggests that these activities are not separate and sequen-tial; they can and should occur simultaneously.
Juran is also known for Pareto analysis, a quality technique based on aprinciple from economics. This will be discussed in detail later, along withthe associated quality tool, the Pareto chart. Briefly, Pareto analysis recognizesthat all possible contributors to defects in a product are not equally respon-sible for results. A small number of contributors are usually responsible formost defects. The goal is to identify that small number (the “vital few”) andeliminate them.
Philip B. CrosbyCrosby viewed quality as conformance to requirements. Further, he saw noreason for nonconformance. Acceptable levels of quality established on astatistical basis were simply recipes for failure. Quality was a result of pre-vention of defects, not inspection and subsequent correction of defects. Hebelieved that the goal of any process should be zero defects, and this term soonbecame a widespread mantra in government and industry.
A major tenet of his approach was that quality is free; that the cost ofquality is eventually outweighed by the benefits and, therefore, is not a costat all. Crosby focused on behavioral and motivational aspects of work ratherthan statistical aspects of processes. Of all the pioneers, he was perhaps themost successful at selling his ideas through consultation and training.
Not everyone agreed with Crosby’s approach, however. Juran thoughtquality was not at all free. He believed that quality improvement effortswould experience diminishing returns, that initial efforts would yield cost-
Pioneers and Paradigms 31
favorable results, but later efforts would yield less value and constitute a trueexpense. Deming viewed zero defects as insufficient. Customer satisfaction(the thing that keeps a company in business) depends on many things otherthan the number of defects.
Kaoru IshikawaIshikawa’s enormous influence on quality is often unrecognized simply be-cause his contributions have become so ingrained that they seem a naturalpart of things. He brought customers into the quality equation, redirectingfocus to them rather than the methods of production. He emphasized train-ing and education of workers as a foundation of quality. He created qualitycircles, increasing the role of workers in solving problems and identifyingopportunities for improvement. Taking this further, he emphasized totalinvolvement of employees in improving quality and coined the phrase “com-pany-wide quality control.” Throughout his life, he provided a model ofselfless dedication to quality that inspired others around the world.
Under his leadership, the Japanese Union of Scientists and Engineersadopted training as a primary mission. One of Ishikawa’s greatest achieve-ments was the codification of basic quality tools that fit well within thequality frameworks presented by Deming and Juran. His Guide to QualityControl is an international classic that concisely defines what have becomeknown as the “seven basic tools” of quality. Written for workers, not statis-ticians, the book is credited with democratizing statistics and making thesetechniques accessible to those who really need to use them.
Genichi TaguchiTaguchi is best known for his innovative approach to quality known as “theTaguchi method.” It is a follow-on to Shewhart’s work in statistics and Deming’swork in quality improvement. Many consider the method to be equal instature to the contributions of Deming and Ishikawa.
The Taguchi method considers quality not as conformance to specifica-tions, but as a target within a range. The target value provides ideal quality.Deviations from the target are expressed in a quality loss function. Insteadof an acceptable level of variation within a specified range, all variation isviewed as some degree of cost to the customer, the supplier, or society ingeneral. Consider the local pizza parlor. Both its profit and reputation aredependent on the amount of cheese on the pizzas it sells. So it establishesa target value, say eight ounces for an extra-large, and prices the item accord-ingly. Deviations above target will increase the cost of the product to theowner and deviations below target will generate customer dissatisfaction,which is also considered a cost. Traditionally, the owner would establish an
32 Project Quality Management: Why, What and How
acceptable range of variation, say seven to nine ounces, and manage to thatrange. Taguchi said that every degree of variation has a cost to either theowner or the customer. Those costs are captured and disclosed in the qualityloss function. The Taguchi method also employs a three-step process ofrobust design that uses Design of Experiments to determine which elementsof a process have the greatest effect on the outcome and statistical methodsto produce results that are high quality and defect free.
ParadigmsEvolving quality concepts are captured in a number of formalized frame-works. Project managers should be aware of several of the principal para-digms. Not all may be applicable to a particular project. Each may providesome benefit, depending on the goals of the project team.
Six SigmaIn the mid-1980s, the U.S. electronics firm Motorola set out to make a greatleap in defect reduction — not just a small step, but an orders-of-magnitudereduction. It called the approach “Six Sigma.” The name comes from theGreek letter sigma (σ), which is used in statistics and quality as a symbol forstandard deviation. From basic statistics, the area under a standard normalcurve (a “bell-shaped” curve) encompassed by three standard deviations aboveand below the mean is 99.73 percent of the total curve. By extension, aprocess that produces results that show plus or minus three standard devia-tions from the mean within specifications is producing 99.73 percent accept-able product, or only 27 defects per 10,000. That may seem like good per-formance, but it is not. Twenty-seven defects in every 10,000 items producedcan be very expensive. Motorola did not establish a three-sigma target; itestablished a target of six sigma. In other words, the goal was to reducevariation so far that the results provided plus or minus six standard deviationsfrom the mean within specification.
Technically, six standard deviations above and below the mean encompass99.9999998 percent of the standard normal curve, or two defects per billion.Motorola modified the percentages to allow for a 1.5-sigma shift in the meanover time, understanding that processes may drift a bit. The result is a six-sigma goal that, in Motorola parlance, is 99.99966 percent, or 3.4 defects permillion.
Results were not trivial. Over ten years, Motorola achieved $414 billionin savings, a five-times increase in sales, and a 20 percent annual increasein profits. The concept was subsequently applied at General Electric andAllied Signal with beneficial results. The Six Sigma approach is not for

Pioneers and Paradigms 33
everyone. It is intended for, and works best in, high-volume productionenvironments.
Six Sigma has, in some ways, taken on a life of its own. Cynics may seeit as “the next big thing” that will fade as soon as a new buzzword comesalong. In a practical view, however, it seems to have some staying power.Currently, the approach has two aspects: management and methods. Appli-cation begins with a management initiative that recognizes the goal as break-through, great-leap-forward improvement, not incremental improvement. Itinvolves a systematic and focused approach that is highly disciplined. Successdepends on selecting the right projects, those that support the strategic goalsof the organization, not the most convenient, the most troubled, or the boss’sfavorite. Selecting and training the right people to lead the effort and carrythrough is critical. A Six Sigma effort is not a short-term opportunity forcorporate job hoppers. Implementation requires effective project manage-ment and comprehensive, no-nonsense reviews of progress. Any gains mustbe sustained and institutionalized. All of these elements combine to producethe right results — process improvements that improve the bottom line andglobal competitiveness.
Six Sigma methods and tools arise from common quality practice. The SixSigma approach begins with process thinking that considers inputs, outputs,and both controlled and uncontrolled variables. Variation is a foundation ofthe approach, with the goal being to reduce variation around the mean andto move the mean closer to the target value if necessary. Six Sigma dependson data-based decisions, so data, facts, and figures play a key role. Standardquality tools and statistical tools are employed throughout implementation.Because statistics are so important, user-friendly statistical software has beendeveloped that is specifically oriented toward Six Sigma application. The“vital few” variables are the focus of attention, not the whole range of possiblevariables.
These tools are all integrated into a standard methodology designated bythe acronym “DMAIC,” for define, measure, analyze, improve, and control:
.� Define customers and requirements� Measure things critical to quality� Analyze baseline, opportunities, objectives, and root causes� Improve the process� Control the process
ISO 9000The International Organization for Standardization (ISO) is a global bodyheadquartered in Geneva, Switzerland that develops consensus standards forworldwide use. The organization’s short title “ISO” is not a fractured acro-
34 Project Quality Management: Why, What and How
nym, but rather an adaptation of the Greek word isos, which translates toEnglish as “equal.” The American National Standards Institute (ANSI) is theU.S. member of ISO. The American Society for Quality (ASQ) is a memberof ANSI and is responsible for quality management standards. It publishesstandards in the ANSI/ISO/ASQ-Q9000 series that are the U.S. equivalentof standards published by ISO.
The ISO 9000-series of standards addresses quality management systems.The series includes three standards:
1. ISO 9000, Quality management systems — Fundamentals and vocabulary2. ISO 9001, Quality management systems — Requirements3. ISO 9004, Quality management systems — Guidelines for performance
improvements
ISO 9001 is a specification standard. If an organization wishes to becomecertified or registered — the terms mean the same thing, only the conventionsof use differ — it would have to conform to the requirements in ISO 9001.Organizations can self-declare conformance or can hire a third-party registrar.Third-party certifications are generally viewed as more objective. ISO 9004is a guidance standard. It provides additional, useful information about qualitymanagement. Nothing in it is required for certification. Generally, ISO 9004contains elements on which international consensus could not be reachedand, therefore, could not be included in ISO 9001. Neither ISO 9001 norISO 9004 are performance standards. They do not address quality itself, onlythe management processes necessary to achieve quality. Various editions ofthe ISO standards include dates in the reference number. The ISO 9001standard may be listed as ISO 9001:2000 to indicate the 2000 edition.
The initial motivation for applying ISO 9001 may be commercial. Manyinternational customers favor suppliers that are certified. Once organizationssee the benefits of a quality management system, they may continue regard-less of specific commercial pressures.
ISO 9001 is a brief document. It contains many prescriptive paragraphsthat indicate what an organization “shall” do. Conformance requires extensivedocumentation, including:
� Quality policy — A statement from top management.� Quality manual — A document that addresses each clause in ISO
9001. Specific procedures may be part of the manual or referencedin the manual.
� Quality objectives — Goals assigned to organizational elements.� Quality procedures — Step-by-step actions for each ISO 9001 re-
quirement or any process that affects quality.� Forms, records, documentation — Proof of performance.
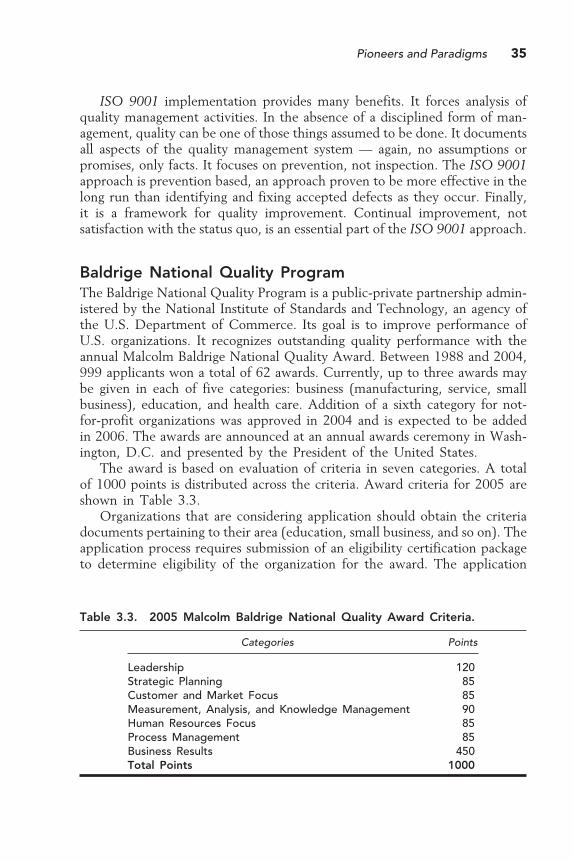
Pioneers and Paradigms 35
ISO 9001 implementation provides many benefits. It forces analysis ofquality management activities. In the absence of a disciplined form of man-agement, quality can be one of those things assumed to be done. It documentsall aspects of the quality management system — again, no assumptions orpromises, only facts. It focuses on prevention, not inspection. The ISO 9001approach is prevention based, an approach proven to be more effective in thelong run than identifying and fixing accepted defects as they occur. Finally,it is a framework for quality improvement. Continual improvement, notsatisfaction with the status quo, is an essential part of the ISO 9001 approach.
Baldrige National Quality ProgramThe Baldrige National Quality Program is a public-private partnership admin-istered by the National Institute of Standards and Technology, an agency ofthe U.S. Department of Commerce. Its goal is to improve performance ofU.S. organizations. It recognizes outstanding quality performance with theannual Malcolm Baldrige National Quality Award. Between 1988 and 2004,999 applicants won a total of 62 awards. Currently, up to three awards maybe given in each of five categories: business (manufacturing, service, smallbusiness), education, and health care. Addition of a sixth category for not-for-profit organizations was approved in 2004 and is expected to be addedin 2006. The awards are announced at an annual awards ceremony in Wash-ington, D.C. and presented by the President of the United States.
The award is based on evaluation of criteria in seven categories. A totalof 1000 points is distributed across the criteria. Award criteria for 2005 areshown in Table 3.3.
Organizations that are considering application should obtain the criteriadocuments pertaining to their area (education, small business, and so on). Theapplication process requires submission of an eligibility certification packageto determine eligibility of the organization for the award. The application
Table 3.3. 2005 Malcolm Baldrige National Quality Award Criteria.
Categories Points
Leadership 120Strategic Planning 85Customer and Market Focus 85Measurement, Analysis, and Knowledge Management 90Human Resources Focus 85Process Management 85Business Results 450Total Points 1000
36 Project Quality Management: Why, What and How
requires answers to about one hundred questions spread across nineteen itemsin the seven categories (2005 criteria). Scoring is a two-step process involvingan individual evaluation by an examiner, then a consensus examination bya small group of examiners. Organizations that score highly are selected fora site visit during which examiners confirm the data contained in the appli-cation. Selection of winners follows, with subsequent announcement andpresentation of the award.
The award itself, though prestigious, is not the only way an organizationcan benefit from the Baldrige National Quality Program. Any organizationmay complete a self-assessment using the award criteria and gain insight intoits quality performance. Application documents contain clear and specificdescriptions of criteria and scoring procedures. Applying these criteria can bea stand-alone effort for internal benefit or the first step in a complete appli-cation process. One bit of cautionary advice regarding self-assessment: Be-ware of overstating the results. Organizations will not benefit from an un-realistically optimistic evaluation approach. It must be a warts-and-all view,regardless of the discomfort such a view may cause to some within theorganization. If an organization tends to punish the bearers of bad news, itprobably is not on very solid quality ground to begin with.
Closing ThoughtsQuality is hard work and it is situation dependent. There is no cookbook, nomagic formula, no plug-and-play. There is no instant pudding.3
Summary� Walter Shewhart developed statistical techniques for analyzing, under-
standing, and controlling process variation.� W. Edwards Deming assisted the U.S. Census Bureau and U.S. defense
industries in applying statistical techniques. He presented quality lecturesin Japan that helped initiate that country’s quality efforts. His view wasthat quality is a responsibility of management. His fourteen points formanagement provide guidance on quality.
� Joseph Juran’s view of quality focused on strategic and planning issues.He developed Pareto analysis to identify the “vital few” variables thataccount for the majority of defects in a system.
� Kaoru Ishikawa brought a new focus on customers, training, and totalemployee involvement to quality. He codified the seven basic tools ofquality.
� Genichi Taguchi developed the Taguchi method that includes a qualityloss function and robust design to achieve quality.
Pioneers and Paradigms 37
� Six Sigma is a framework for quality that seeks to reduce variation to thepoint where a process produces only 3.4 defects per million. A standardapproach includes the five steps of define, measure, analyze, improve,and control.
� ISO 9000 is a series of international consensus standards for qualitymanagement systems. ISO 9001 is a specification standard that prescribeswhat an organization must do to achieve ISO certification.
� The Malcolm Baldrige National Quality Award is a U.S. national awardthat recognizes quality performance. Organizations may use the awardcriteria to perform a self-assessment and gain benefit without actuallyapplying for the award.
References1. Deming, W.E., The New Economics for Industry, Government, and Education, 2nd
ed., The MIT Press, Cambridge, MA, 2000, p. xv.2. Juran, J.M. and Godfrey, A.B., Eds., Juran’s Quality Handbook, 5th ed., McGraw-
Hill, New York, 1999, p. 2.5.3. Deming, W.E., Out of the Crisis, The MIT Press, Cambridge, MA, 2000, p. 126.

Section IIQuality Management

4Project
Quality Planning
So, you have the contract. Now what? Or you have just received the directivefrom management to initiate an internal project. Now what? What exactlyshould you do next to ensure that quality is built into the project? The answerlies in the component parts of quality management.
Quality ManagementMany approaches to quality management exist. Every consultant with a laptopand flip chart probably has a proprietary approach that is advertised as theone best method. Taking a broader view, the PMBOK® Guide describes threeelements of quality management: quality planning, quality assurance, andquality control. The Juran Trilogy describes three slightly different elements:quality planning, quality control, and quality improvement. Juran’s viewincludes assurance and control activities within quality control. It also addsthe essential element of quality improvement, which the PMBOK® Guidedoes not include as a distinct process. Our approach combines the best ofthese two views to include quality planning, quality assurance, quality con-trol, and quality improvement.
The PMBOK® Guide states that quality management processes “…includeall the activities of the performing organization that determine quality poli-cies, objectives, and responsibilities so that the project will satisfy the needsfor which it was undertaken.”1 This description is sufficiently general to coverthe needs of the project in terms of time, cost, and scope and the needs ofthe product of the project or customers of the project in terms of the defined
41
42 Project Quality Management: Why, What and How
requirements. Project quality management is linked to overall organizationalquality management in terms of processes and costs.
Quality PlanningThe PMBOK® Guide defines quality planning as “…identifying which qualitystandards are relevant to the project and determining how to satisfy them.”2
This activity is the foundation for quality being planned in, not inspected in.Project managers need not, and must not, depend on inspection and correc-tion to achieve project quality. Instead, they should use conformance andprevention to achieve quality. Project managers should, through planning,design in and build in quality.
Quality Management PlanThe basic document for project quality is the quality management plan. Itis one of the several subordinate management plans within the project plan.When faced with an unfamiliar task (as quality management often seems tobe), project managers may look for an existing template to apply as a startingpoint. Few such templates exist. Quality management plans are more de-scribed than demonstrated in project management literature. That may bebeneficial to project managers. Applying a template may not allow consid-eration of the subtle aspects of a project that are inherently unique. It maybe best for project teams to craft an individual quality management plan thatfits the needs of the project, not just the format of a published template. Ageneral framework for quality management plans includes four elements:
1. Quality policy — This expresses the intended direction of a perform-ing organization with regard to quality.3 One of the best examples ofa clear, concise quality policy (though probably not so named at thetime) is “We shall build good ships here; at a profit if we can, at aloss if we must, but always good ships” (Collis P. Huntington, NewportNews Shipbuilding and Dry Dock Company, 1893). The project teammay simply apply the existing organizational quality policy, but onlyif it is a good fit. Needs of the project may demand a quality policythat is more specific than a generally stated organizational qualitypolicy.
2. Who is in charge? — This question is one of three that lie at the heartof quality management. The answer is neither trivial nor simple; it isnot just the name of the project manager. A complete answer — oneessential to project success — addresses project and organizational
Project Quality Planning 43
infrastructure and describes participants, reporting chains, and respon-sibilities. There are few more certain paths to project failure than anambiguous collection of participants in which everyone is in charge,but no one is responsible.
3. Where are we going? — Managing quality effectively depends onspecific performance targets. Goals provide broad descriptions of whatthe project is expected to achieve. Requirements provide more de-tailed descriptions. Operational definitions, which describe what some-thing is and how it is measured, provide the means for understandinggoals and requirements that may be vague or ambiguous.
4. How are we going to get there? — The answer to this question shouldaddress processes, resources, and standards. Processes define the thingsthe project team will do to meet requirements and achieve projectgoals. The quality management plan may include a lengthy list ofprocesses covering many different aspects of project work. Resourcesinclude more things than money. This part of the plan should describethe people available, participating organizational elements, tools to beused, and, of course, the budget that provides funding for all qualityactivities. Standards to be applied to project work are an importantelement of this part of the plan. Remember that, by definition, qualityplanning is all about identifying relevant standards.
Identifying CustomersCustomers were discussed previously in Chapter 2. Customers are the base.To reiterate, customers may be classified as external (the paying client, sup-pliers, and end users), internal (elements in the supplier-process-customerchain), and hidden (those not directly involved, but concerned about theproject’s outcome). All of this is rather straightforward. Internal customersmay be the most difficult to identify. A simple graphic may help (see Figure4.1).
Identifying customers is not a matter of intuition or guesswork. Identifi-cation involves four explicit steps:
1. Analyze the contract — As a first step, analyzing the contract willidentify an important external customer, the paying client. This analy-sis may also identify an end user. If the end user is not clear from thecontract information, the project team may have to coordinate directlywith the paying customer to determine if the end user is someoneother than the paying customer. Contract analysis may also revealsuppliers. If key suppliers are not specifically identified as subcontrac-tors, the project team may have to coordinate among its own technical

44 Project Quality Management: Why, What and How
elements or with the organization’s procurement office to determinewhat suppliers will be part of project implementation.
2. Analyze the project team and organization — This is the step thatidentifies internal customers. Analysis should disclose how work willproceed — what project team or organizational elements will partici-pate and how they will be linked together in the supplier-process-customer chain.
3. Analyze product use — This step starts with the end user and goesa bit further to identify more specifically who will use the product andhow they will use it. Remember, quality means satisfying customerneeds, not just meeting specifications in a contract. Analyzing productuse may also disclose hidden customers — those who do not use theproduct themselves, but care very much about how use by others mayaffect them or other areas of concern, such as the environment, aes-thetics of the local community, and so on.
4. Analyze the means of production — This is important whether theproject involves manufacturing a product, delivering a service, orperforming some intellectual or administrative activity. This step, whichtakes a process view, may clarify or confirm internal customers alreadyidentified or add additional internal customers that were missed whenanalyzing the project team and organization.
Case StudyThe concepts of quality management are illuminated by a case study thatdevelops progressively throughout this book. As with the exercise in Chapter
Figure 4.1. Internal Customers.
Internal chain produces product of the project
Provides inputsto a process
A series oftasks that turninputs intooutputs
Receives outputsfrom a process
Feedback loop
ProcessSupplier Customer
Customer Supplier Customer SupplierCustomer Supplier
Project Quality Planning 45
1, readers should take time to complete the case study tasks. Not doing somay limit learning. Reading about something has some value, but actuallydoing something is far more effective for internalizing new concepts andinformation for future use. Readers should probably start a case study file ornotebook to collect and retain papers associated with task work. The casestudy subject should be relevant to most readers, given the universal presenceof cell phones and laptops in business and society in general.
Case Study: Task 1 — Read the case study information in Appen-dix 1. Identify customers by considering external, internal, andhidden customers. It is not necessary to divide customers intothese three categories, but doing so may be helpful to clarify theconcept of customers and make sure that identification is as com-plete as possible.
The result may be a rather long list of perceived customers. It probably shouldbe. If the list is short, the team should go back and reconsider. A short listof key customers may seem convenient for management, but such a listprobably includes only the most obvious customers. The intent here is toidentify all the customers, not just those that come immediately to mind.Customers are important because they have requirements that must be met.If the team does not identify all potential customers, it runs the risk of notidentifying all potential requirements. Projects based on incomplete require-ments will encounter changes that may confound implementation or evenlead to project failure. A list of fifteen, twenty, or even thirty potentialcustomers may seem excessive, but it is the right and necessary place to start.For the purposes of this case study and considering space limitations, we willestablish a list of five customers. Your list should have been much longer.The five customers are:
1. State of Dakota2. Hardware Development Division3. Users4. Federal Communications Commission5. Union of Concerned Citizens
Prioritizing CustomersNot all customers are created equal. An old adage about individual rank inorganizations applies here: “If everybody is somebody, nobody is anybody.”If all customers are considered equal, the project team may have an impos-sible task when applying limited project resources during project implemen-tation. The project team must prioritize customers. The purpose is to gain
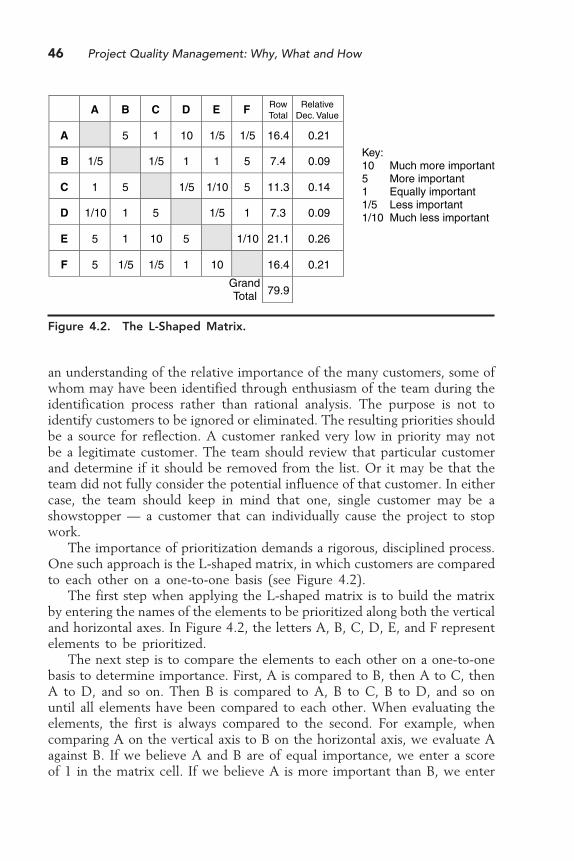
46 Project Quality Management: Why, What and How
an understanding of the relative importance of the many customers, some ofwhom may have been identified through enthusiasm of the team during theidentification process rather than rational analysis. The purpose is not toidentify customers to be ignored or eliminated. The resulting priorities shouldbe a source for reflection. A customer ranked very low in priority may notbe a legitimate customer. The team should review that particular customerand determine if it should be removed from the list. Or it may be that theteam did not fully consider the potential influence of that customer. In eithercase, the team should keep in mind that one, single customer may be ashowstopper — a customer that can individually cause the project to stopwork.
The importance of prioritization demands a rigorous, disciplined process.One such approach is the L-shaped matrix, in which customers are comparedto each other on a one-to-one basis (see Figure 4.2).
The first step when applying the L-shaped matrix is to build the matrixby entering the names of the elements to be prioritized along both the verticaland horizontal axes. In Figure 4.2, the letters A, B, C, D, E, and F representelements to be prioritized.
The next step is to compare the elements to each other on a one-to-onebasis to determine importance. First, A is compared to B, then A to C, thenA to D, and so on. Then B is compared to A, B to C, B to D, and so onuntil all elements have been compared to each other. When evaluating theelements, the first is always compared to the second. For example, whencomparing A on the vertical axis to B on the horizontal axis, we evaluate Aagainst B. If we believe A and B are of equal importance, we enter a scoreof 1 in the matrix cell. If we believe A is more important than B, we enter
Figure 4.2. The L-Shaped Matrix.
A B C D E F RowTotal
RelativeDec. Value
A 5 1 10 1/5 1/5 16.4 0.21
B 1/5 1/5 1 1 5 7.4 0.09
C 1 5 1/5 1/10 5 11.3 0.14
D 1/10 1 5 1/5 1 7.3 0.09
E 5 1 10 5 1/10 21.1 0.26
F 5 1/5 1/5 1 10 16.4 0.21
GrandTotal 79.9
Key:10 Much more important5 More important1 Equally important1/5 Less important1/10 Much less important

Project Quality Planning 47
a score of 5. If A is much more important than B, we enter a score of 10.If we believe A is less important than B, we enter the inverse of the “moreimportant” score of 5 — we enter 1/5. And if A is much less important, weenter a score of 1/10. Each comparison also determines the reverse compari-son. If A compared to B is rated as 5, then B compared to A must be ratedas 1/5. The team should make both entries in the matrix immediately so thatno unintentional inconsistency results. This scoring convention is also shownin Figure 4.2.
After completing the pair-wise comparisons, scores in each row should beadded to determine a row total. Now is a convenient time to convert frac-tional numbers to decimals. Row totals are added to determine a grand total.
The last step is to divide each individual row total by the grand total. Theresult shows what percentages the row totals represent of the grand total.These relative decimal values indicate priority, the goal of applying the L-shapedmatrix technique.
Case Study: Task 2 — Using an L-shaped matrix, prioritize yourcustomer list. To reduce time required, limit your list to fivecustomers. Try to select customers from all categories: external,internal, and hidden.
Your completed matrix should look something like Figure 4.3. Notice inFigure 4.3 that Users (not State of Dakota, the paying customer) are rated
Figure 4.3. L-Shaped Matrix for Customer Prioritization.
CustomerPrioritization
Sta
te o
f Dak
ota
Har
dwar
e D
ev D
iv
Use
rs
FC
C
Uni
on o
f Con
c C
it
RowTotal
RelativeDecimal
Value
State of Dakota 10 1/5 1 5 16.2 0.28
Hardware Dev Div 1/10 1/10 1/5 1/5 0.6 0.01
Users 5 10 1/5 5 20.2 0.34
FCC 1 5 5 5 16 0.27
Union of Conc Cit 1/5 5 1/5 1/5 5.6 0.10
GrandTotal
58.6

48 Project Quality Management: Why, What and How
as highest priority. This is probably a healthy view. State of Dakota may bepaying the project bill, but if Users do not like the network, they will notbuy the service and the project will be a failure in practice. Notice also thatHardware Development Division, an internal customer, is rated very low inpriority. This, too, is probably a healthy view. Project teams, especially themore technical elements, can sometimes focus too much on themselves,forgetting that they only exist to meet some customer requirement.
This completes the first step in a seven-step quality journey that providesa framework for quality management. The framework is not unique to anyparticular technical domain or industry. It may be applied to any project,anywhere, any time (see Figure 4.4).
Identifying RequirementsCustomers are sources of requirements that must be met for project success.The contract awarded by the paying customer is the most obvious source ofrequirements. Contract terms and conditions prescribe what must be done.Project and organizational elements, including suppliers and subcontractors,are also sources of requirements. Users and affected groups provide additionalrequirements, often of great importance to the project team. “Affected groups”are those that participate in product or service delivery in some way, suchas warehouses, transportation providers, original equipment manufacturers,and so on. Government agencies and other regulatory agencies are also asource of requirements that must not be overlooked. Last, groups of theconcerned provide requirements that must be considered.
Identifying requirements includes defining them in such a way that theyare useful to the project team. Requirements are not vague statements offantasy, but they are generally stated; details come later. A good example ofa requirement is “Responsive telephone hotline service.” While the precisemeaning is lacking, it provides a foundation for further quality planning.
Figure 4.4. Quality Journey: Customers.
Customers

Project Quality Planning 49
Requirements may be explicitly stated. The contract or government regu-lations are sources of explicit requirements. Contract requirements may existin minute design detail or they may be stated as functional requirements thatprescribe less detail or performance requirements that simply describe adesired outcome. Requirements may also be implied or unstated. Users,affected groups, and concerned groups may be sources of implied require-ments. A user of an off-road vehicle may have a requirement for a CDplayer, but this user really intends to run the vehicle off-road across somevery rough terrain, not just use it for trips to the shopping mall. This userhas an implied requirement for a rugged CD player that will withstandextreme use. The common characteristic of all requirements is that they arein some way measurable. If the requirement deals with matters that cannotbe measured, the project team will be unable to determine if it has met therequirement.
Defining requirements may require research, interviews, and analysis. Evencontract requirements, often negotiated by people not on the project team,may require analysis and interviews with the paying customer to determineand confirm exactly what is required. It is best to involve the whole teamin this process. An old Japanese proverb advises that “None of us is as smartas all of us.” Involving different people with different views and insights leadsto better results than those obtained by one individual.
It is also essential to involve the customer. Customer interviews are usefulmeans for collecting information and are a foundation for analyzing needs anddefining requirements. It is helpful to review results with the customers toconfirm understanding before proceeding.
Having done all this, the project team should still expect and be preparedto deal with change. Customers can change their minds. New technologiesmay arise that allow new performance capabilities. Laws may change. Newgroups of concerned citizens may surface. Requirements definition is an essentialand dynamic process.
Case Study: Task 3 — Using your prioritized customer list as abase, identify customer requirements. Consider all or several typesof customers. Remember that requirements are measurable in someway and generally stated. Do not go into great detail.
Your requirements list will be unique, based on your list of identified cus-tomers. For case study purposes, we will consider the following identified re-quirements:
� Access� Speed� Reliability
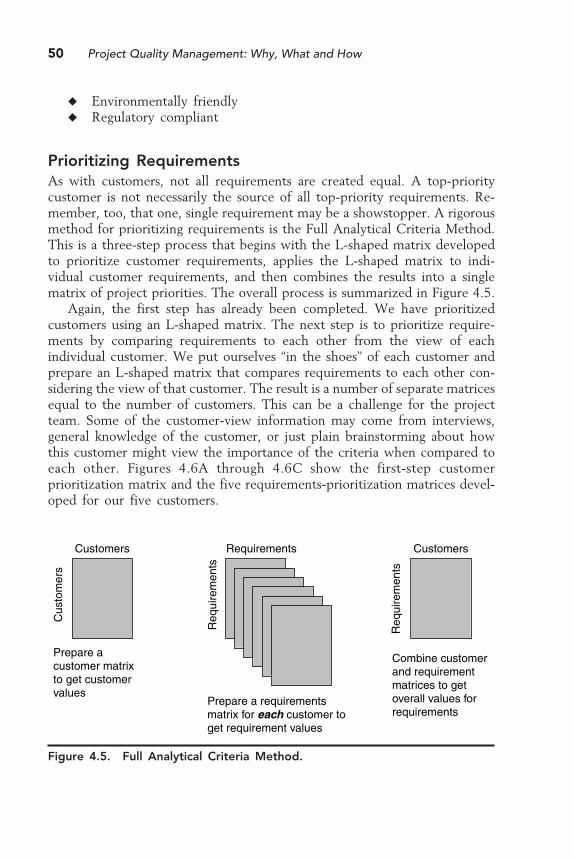
50 Project Quality Management: Why, What and How
� Environmentally friendly� Regulatory compliant
Prioritizing RequirementsAs with customers, not all requirements are created equal. A top-prioritycustomer is not necessarily the source of all top-priority requirements. Re-member, too, that one, single requirement may be a showstopper. A rigorousmethod for prioritizing requirements is the Full Analytical Criteria Method.This is a three-step process that begins with the L-shaped matrix developedto prioritize customer requirements, applies the L-shaped matrix to indi-vidual customer requirements, and then combines the results into a singlematrix of project priorities. The overall process is summarized in Figure 4.5.
Again, the first step has already been completed. We have prioritizedcustomers using an L-shaped matrix. The next step is to prioritize require-ments by comparing requirements to each other from the view of eachindividual customer. We put ourselves “in the shoes” of each customer andprepare an L-shaped matrix that compares requirements to each other con-sidering the view of that customer. The result is a number of separate matricesequal to the number of customers. This can be a challenge for the projectteam. Some of the customer-view information may come from interviews,general knowledge of the customer, or just plain brainstorming about howthis customer might view the importance of the criteria when compared toeach other. Figures 4.6A through 4.6C show the first-step customerprioritization matrix and the five requirements-prioritization matrices devel-oped for our five customers.
Figure 4.5. Full Analytical Criteria Method.
Combine customerand requirementmatrices to getoverall values forrequirements
Cus
tom
ers
Prepare acustomer matrix to get customervalues
Prepare a requirementsmatrix for each customer toget requirement values
CustomersCustomers Requirements
Req
uire
men
ts
Req
uire
men
ts
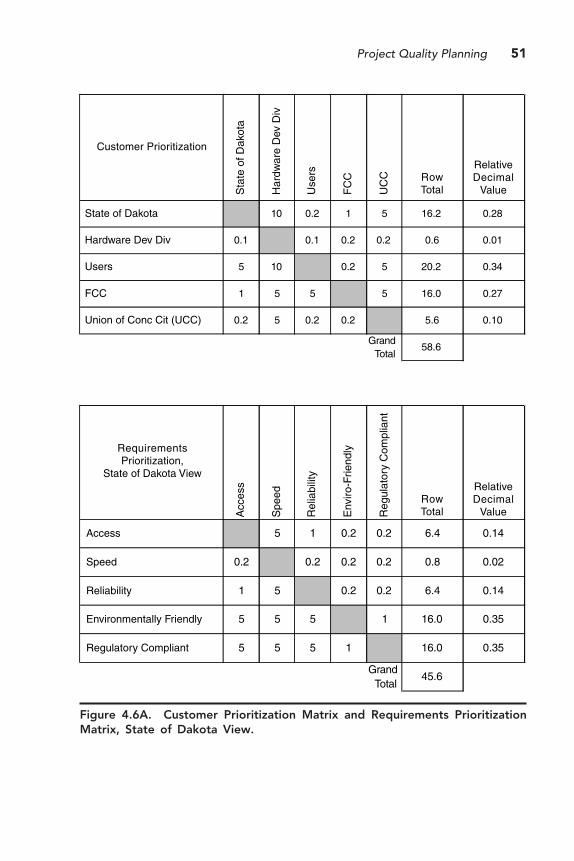
Project Quality Planning 51
Figure 4.6A. Customer Prioritization Matrix and Requirements PrioritizationMatrix, State of Dakota View.
Customer Prioritization
Sta
te o
f Dak
ota
Har
dwar
e D
ev D
iv
Use
rs
FC
C
UC
C RowTotal
State of Dakota 10 0.2 1 5 16.2 0.28
Hardware Dev Div 0.1 0.1 0.2 0.2 0.6 0.01
Users 5 10 0.2 5 20.2 0.34
FCC 1 5 5 5 16.0 0.27
Union of Conc Cit (UCC) 0.2 5 0.2 0.2 5.6 0.10
58.6Grand
Total
RequirementsPrioritization,
State of Dakota View
Acc
ess
Spe
ed
Rel
iabi
lity
Env
iro-F
riend
ly
Reg
ulat
ory
Com
plia
nt
Access 5 1 0.2 0.2 6.4 0.14
Speed 0.2 0.2 0.2 0.2 0.8 0.02
Reliability 1 5 0.2 0.2 6.4 0.14
Environmentally Friendly 5 5 5 1 16.0 0.35
Regulatory Compliant 5 5 5 1 16.0 0.35
45.6Grand
Total
RelativeDecimal
Value
RowTotal
RelativeDecimal
Value

52 Project Quality Management: Why, What and How
Figure 4.6B. Requirements Prioritization Matrices, Hardware Development Di-vision and Users Views.
RequirementsPrioritization,
Hardware Dev Div View
Acc
ess
Spe
ed
Rel
iabi
lity
Env
iro-F
riend
ly
Reg
ulat
ory
Com
plia
nt
RowTotal
RelativeDecimal
Value
Access 5 1 10 1 17.0 0.32
Speed 0.2 0.2 10 1 11.4 0.21
Reliability 1 5 10 1 17.0 0.32
Environmentally Friendly 0.1 0.1 0.1 0.2 0.5 0.01
Regulatory Compliant 1 1 1 5 8.0 0.15
53.9
5 1 5 1 12.0 0.31
0.2 0.2 5 1 6.4 0.16
1 5 5 1 12.0 0.31
0.2 0.2 0.2 0.2 0.8 0.02
1 1 1 5 8.0 0.20
39.2GrandTotal
Access
Speed
Reliability
Environmentally Friendly
Regulatory Compliant
GrandTotal
Acc
ess
Spe
ed
Rel
iabi
lity
Env
iro-F
riend
ly
Reg
ulat
ory
Com
plia
nt
RowTotal
RelativeDecimal
Value
RequirementsPrioritization,Users View
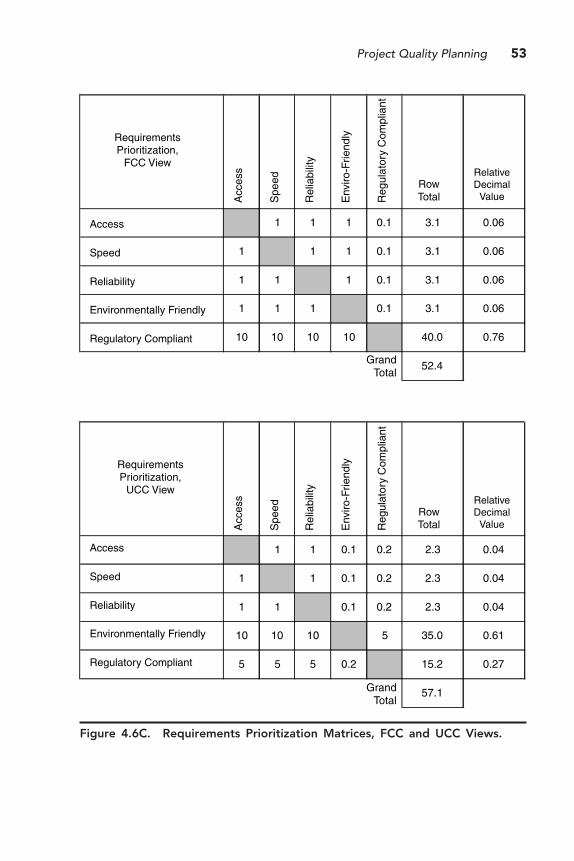
Project Quality Planning 53
Figure 4.6C. Requirements Prioritization Matrices, FCC and UCC Views.
RequirementsPrioritization,
FCC View
1 1 1 0.1 3.1 0.06
1 1 1 0.1 3.1 0.06
1 1 1 0.1 3.1 0.06
1 1 1 0.1 3.1 0.06
10 10 10 10 40.0 0.76
52.4
RequirementsPrioritization,
UCC View
1 1 0.1 0.2 2.3 0.04
1 1 0.1 0.2 2.3 0.04
1 1 0.1 0.2 2.3 0.04
10 10 10 5 35.0 0.61
5 5 5 0.2 15.2 0.27
57.1
RelativeDecimal
ValueAcc
ess
Spe
ed
Rel
iabi
lity
Env
iro-F
riend
ly
Reg
ulat
ory
Com
plia
nt
RowTotal
RelativeDecimal
ValueAcc
ess
Spe
ed
Rel
iabi
lity
Env
iro-F
riend
ly
Reg
ulat
ory
Com
plia
nt
RowTotal
Access
Speed
Reliability
Environmentally Friendly
Regulatory Compliant
Access
Speed
Reliability
Environmentally Friendly
Regulatory Compliant
GrandTotal
GrandTotal
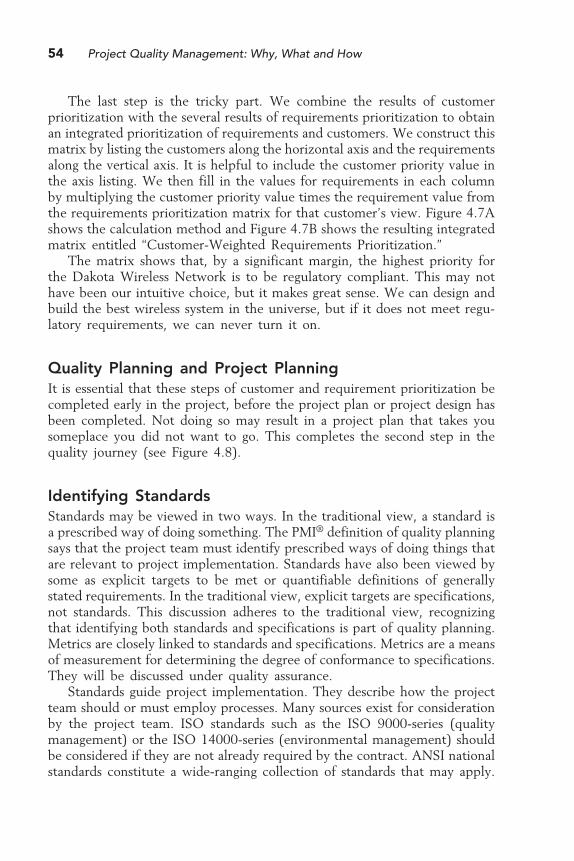
54 Project Quality Management: Why, What and How
The last step is the tricky part. We combine the results of customerprioritization with the several results of requirements prioritization to obtainan integrated prioritization of requirements and customers. We construct thismatrix by listing the customers along the horizontal axis and the requirementsalong the vertical axis. It is helpful to include the customer priority value inthe axis listing. We then fill in the values for requirements in each columnby multiplying the customer priority value times the requirement value fromthe requirements prioritization matrix for that customer’s view. Figure 4.7Ashows the calculation method and Figure 4.7B shows the resulting integratedmatrix entitled “Customer-Weighted Requirements Prioritization.”
The matrix shows that, by a significant margin, the highest priority forthe Dakota Wireless Network is to be regulatory compliant. This may nothave been our intuitive choice, but it makes great sense. We can design andbuild the best wireless system in the universe, but if it does not meet regu-latory requirements, we can never turn it on.
Quality Planning and Project PlanningIt is essential that these steps of customer and requirement prioritization becompleted early in the project, before the project plan or project design hasbeen completed. Not doing so may result in a project plan that takes yousomeplace you did not want to go. This completes the second step in thequality journey (see Figure 4.8).
Identifying StandardsStandards may be viewed in two ways. In the traditional view, a standard isa prescribed way of doing something. The PMI® definition of quality planningsays that the project team must identify prescribed ways of doing things thatare relevant to project implementation. Standards have also been viewed bysome as explicit targets to be met or quantifiable definitions of generallystated requirements. In the traditional view, explicit targets are specifications,not standards. This discussion adheres to the traditional view, recognizingthat identifying both standards and specifications is part of quality planning.Metrics are closely linked to standards and specifications. Metrics are a meansof measurement for determining the degree of conformance to specifications.They will be discussed under quality assurance.
Standards guide project implementation. They describe how the projectteam should or must employ processes. Many sources exist for considerationby the project team. ISO standards such as the ISO 9000-series (qualitymanagement) or the ISO 14000-series (environmental management) shouldbe considered if they are not already required by the contract. ANSI nationalstandards constitute a wide-ranging collection of standards that may apply.
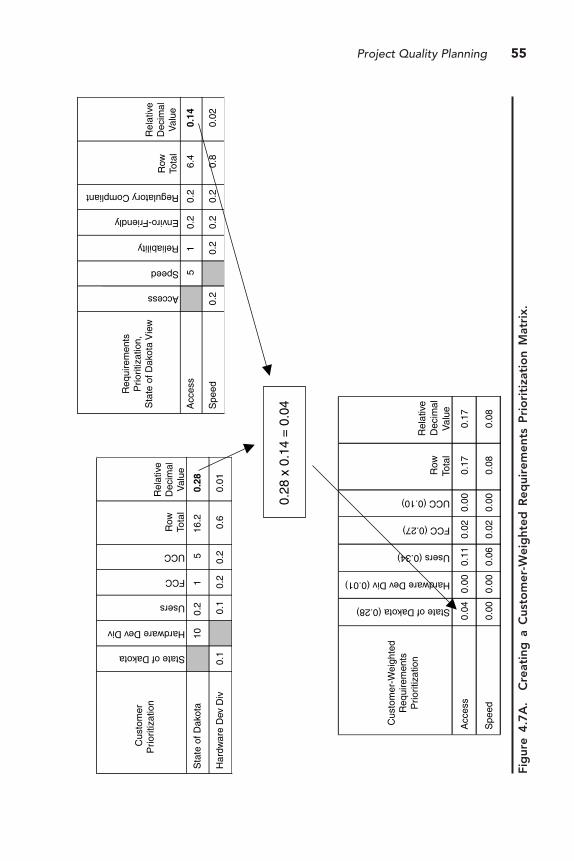
Project Quality Planning 55
Fig
ure
4.7
A.
Cre
atin
g a
Cus
tom
er-W
eig
hted
Req
uire
men
ts P
rio
riti
zati
on
Mat
rix.
Cus
tom
erP
riorit
izat
ion
State of Dakota
Hardware Dev Div
Users
FCC
UCC
Row
Tota
l
Rel
ativ
eD
ecim
alV
alue
Sta
te o
f Dak
ota
100.
21
516
.20.
28
Har
dwar
e D
ev D
iv0.
10.
10.
20.
20.
60.
01
Access
Speed
Reliability
Enviro-Friendly
Regulatory Compliant
Row
Tota
l
Rel
ativ
eD
ecim
alV
alue
Acc
ess
51
0.2
0.2
6.4
0.14
Spe
ed0.
20.
20.
20.
20.
80.
02
Cus
tom
er-W
eigh
ted
Req
uire
men
tsP
riorit
izat
ion
State of Dakota (0.28)
Hardware Dev Div (0.01)
Users (0.34)
FCC (0.27)
UCC (0.10)
Row
Tota
l
Rel
ativ
eD
ecim
alV
alue
Acc
ess
0.04
0.00
0.11
0.02
0.00
0.17
0.17
Spe
ed0.
000.
000.
060.
020.
000.
080.
08
0.28
x 0
.14
= 0
.04
Req
uire
men
tsP
riorit
izat
ion,
Sta
te o
f Dak
ota
Vie
w
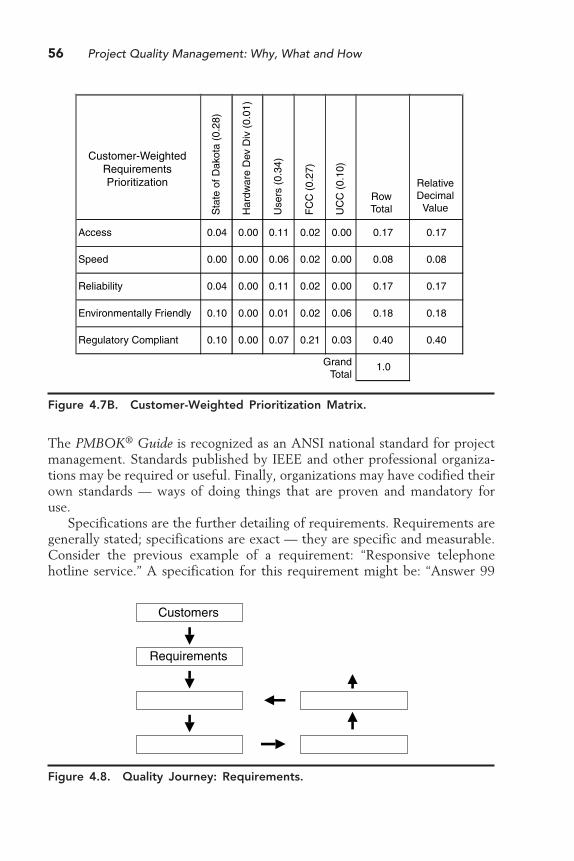
56 Project Quality Management: Why, What and How
Figure 4.7B. Customer-Weighted Prioritization Matrix.
The PMBOK® Guide is recognized as an ANSI national standard for projectmanagement. Standards published by IEEE and other professional organiza-tions may be required or useful. Finally, organizations may have codified theirown standards — ways of doing things that are proven and mandatory foruse.
Specifications are the further detailing of requirements. Requirements aregenerally stated; specifications are exact — they are specific and measurable.Consider the previous example of a requirement: “Responsive telephonehotline service.” A specification for this requirement might be: “Answer 99
Figure 4.8. Quality Journey: Requirements.
Customer-WeightedRequirementsPrioritization
Sta
te o
f Dak
ota
(0.2
8)
Har
dwar
e D
ev D
iv (
0.01
)
Use
rs (
0.34
)
FC
C (
0.27
)
UC
C (
0.10
)
RowTotal
RelativeDecimal
Value
Access 0.04 0.00 0.11 0.02 0.00 0.17 0.17
Speed 0.00 0.00 0.06 0.02 0.00 0.08 0.08
Reliability 0.04 0.00 0.11 0.02 0.00 0.17 0.17
Environmentally Friendly 0.10 0.00 0.01 0.02 0.06 0.18 0.18
Regulatory Compliant 0.10 0.00 0.07 0.21 0.03 0.40 0.40
1.0GrandTotal
Customers
Requirements
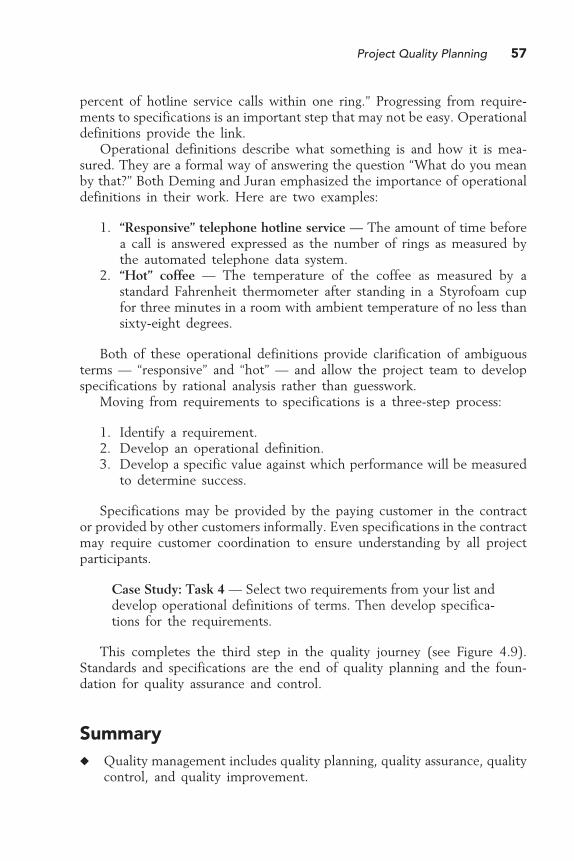
Project Quality Planning 57
percent of hotline service calls within one ring.” Progressing from require-ments to specifications is an important step that may not be easy. Operationaldefinitions provide the link.
Operational definitions describe what something is and how it is mea-sured. They are a formal way of answering the question “What do you meanby that?” Both Deming and Juran emphasized the importance of operationaldefinitions in their work. Here are two examples:
1. “Responsive” telephone hotline service — The amount of time beforea call is answered expressed as the number of rings as measured bythe automated telephone data system.
2. “Hot” coffee — The temperature of the coffee as measured by astandard Fahrenheit thermometer after standing in a Styrofoam cupfor three minutes in a room with ambient temperature of no less thansixty-eight degrees.
Both of these operational definitions provide clarification of ambiguousterms — “responsive” and “hot” — and allow the project team to developspecifications by rational analysis rather than guesswork.
Moving from requirements to specifications is a three-step process:
1. Identify a requirement.2. Develop an operational definition.3. Develop a specific value against which performance will be measured
to determine success.
Specifications may be provided by the paying customer in the contractor provided by other customers informally. Even specifications in the contractmay require customer coordination to ensure understanding by all projectparticipants.
Case Study: Task 4 — Select two requirements from your list anddevelop operational definitions of terms. Then develop specifica-tions for the requirements.
This completes the third step in the quality journey (see Figure 4.9).Standards and specifications are the end of quality planning and the foun-dation for quality assurance and control.
Summary� Quality management includes quality planning, quality assurance, quality
control, and quality improvement.
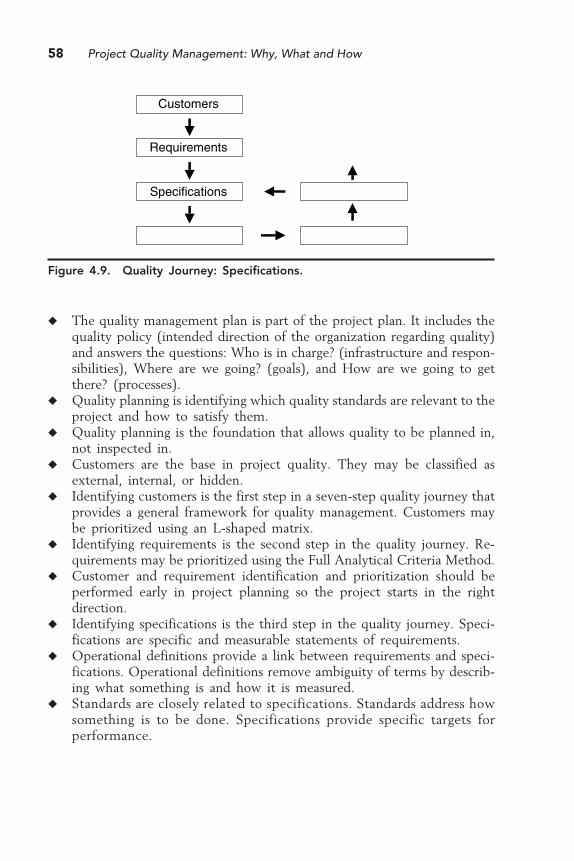
58 Project Quality Management: Why, What and How
� The quality management plan is part of the project plan. It includes thequality policy (intended direction of the organization regarding quality)and answers the questions: Who is in charge? (infrastructure and respon-sibilities), Where are we going? (goals), and How are we going to getthere? (processes).
� Quality planning is identifying which quality standards are relevant to theproject and how to satisfy them.
� Quality planning is the foundation that allows quality to be planned in,not inspected in.
� Customers are the base in project quality. They may be classified asexternal, internal, or hidden.
� Identifying customers is the first step in a seven-step quality journey thatprovides a general framework for quality management. Customers maybe prioritized using an L-shaped matrix.
� Identifying requirements is the second step in the quality journey. Re-quirements may be prioritized using the Full Analytical Criteria Method.
� Customer and requirement identification and prioritization should beperformed early in project planning so the project starts in the rightdirection.
� Identifying specifications is the third step in the quality journey. Speci-fications are specific and measurable statements of requirements.
� Operational definitions provide a link between requirements and speci-fications. Operational definitions remove ambiguity of terms by describ-ing what something is and how it is measured.
� Standards are closely related to specifications. Standards address howsomething is to be done. Specifications provide specific targets forperformance.
Figure 4.9. Quality Journey: Specifications.
Customers
Requirements
Specifications

Project Quality Planning 59
References1. A Guide to the Project Management Body of Knowledge — Third Edition, Project
Management Institute, Newtown Square, PA, 2004, p. 179.2. Ibid., p. 183.3. Ibid., p. 184.


61
5Project
Quality Assurance
The PMBOK® Guide defines quality assurance as “…the application of planned,systematic quality activities to ensure that the project will employ all pro-cesses needed to meet requirements.”1 This logically follows quality planning,as the processes employed must satisfy the standards that were identifiedduring the quality planning process.
“Quality assurance” can be a somewhat troublesome term. Often, “qualityassurance” is used in conversation and writing when the term “quality control”would be more accurate and more properly applied. This may be becausepeople are not well informed about the difference between the two. Or,assuming equivalent meaning, people consider “assurance” to be a nicer, lessoffensive word than “control,” which may have strongly negative, personalassociations. Whatever the reason for possible confusion, the project teammust understand the difference between assurance and control. Both areessential elements of quality management and both are necessary for projectsuccess.
Briefly, quality assurance addresses the program; it is the combined setof activities that the project team will perform to meet project objectives.Quality control addresses the outcomes; it is monitoring performance anddoing something about the results. Quality control will be addressed inChapter 6.
Quality AssuranceThe key words in the PMBOK® Guide definition are “planned, systematicactivities.” The activities are the things that the project team will do to
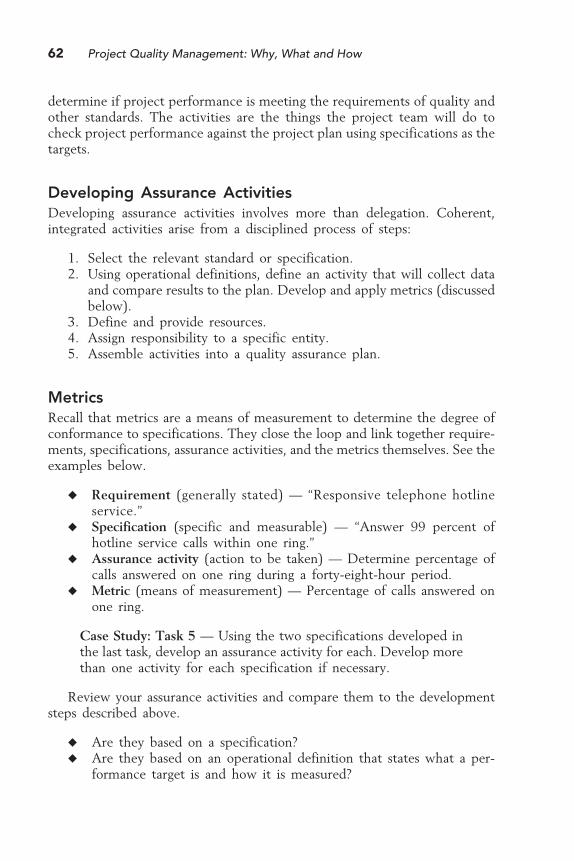
62 Project Quality Management: Why, What and How
determine if project performance is meeting the requirements of quality andother standards. The activities are the things the project team will do tocheck project performance against the project plan using specifications as thetargets.
Developing Assurance ActivitiesDeveloping assurance activities involves more than delegation. Coherent,integrated activities arise from a disciplined process of steps:
1. Select the relevant standard or specification.2. Using operational definitions, define an activity that will collect data
and compare results to the plan. Develop and apply metrics (discussedbelow).
3. Define and provide resources.4. Assign responsibility to a specific entity.5. Assemble activities into a quality assurance plan.
MetricsRecall that metrics are a means of measurement to determine the degree ofconformance to specifications. They close the loop and link together require-ments, specifications, assurance activities, and the metrics themselves. See theexamples below.
� Requirement (generally stated) — “Responsive telephone hotlineservice.”
� Specification (specific and measurable) — “Answer 99 percent ofhotline service calls within one ring.”
� Assurance activity (action to be taken) — Determine percentage ofcalls answered on one ring during a forty-eight-hour period.
� Metric (means of measurement) — Percentage of calls answered onone ring.
Case Study: Task 5 — Using the two specifications developed inthe last task, develop an assurance activity for each. Develop morethan one activity for each specification if necessary.
Review your assurance activities and compare them to the developmentsteps described above.
� Are they based on a specification?� Are they based on an operational definition that states what a per-
formance target is and how it is measured?

Project Quality Assurance 63
� Are necessary resources identified?� Has responsibility been assigned to a specific entity?
This completes the fourth step in the quality journey (see Figure 5.1).
Quality Assurance PlanIn a project consisting of several hundred or even several thousand tasks,quality assurance activities can be difficult to track. They should be assembledinto a quality assurance plan that documents all activities and allows effectivemanagement. Mature organizations may have a prescribed format for qualityassurance plans. If not, the project team will have to develop one. A qualityassurance plan should include at least the following elements:
� The work breakdown structure reference number for the task concerned� A statement of the requirement (usually from the customer)� A statement of the specification that is specific and measurable� A description of the assurance activity (what is to be done)� Schedule information (when it is to be done).� Designation of the responsible entity (who will do it)
A simple format for quality assurance plans is shown in Figure 5.2.
Case Study: Task 6A — Select some aspect of your own work andprepare a one-line entry in the quality assurance plan format shownin Figure 5.2. Be specific about what will be done, when it willbe done, and who will do it.
Case Study: Task 6B — Now that you have some experience ina familiar domain, return to the Dakota Wireless Network case
Figure 5.1. Quality Journey: Quality Assurance Activities.
Customers
Requirements
Specifications
QA Activities
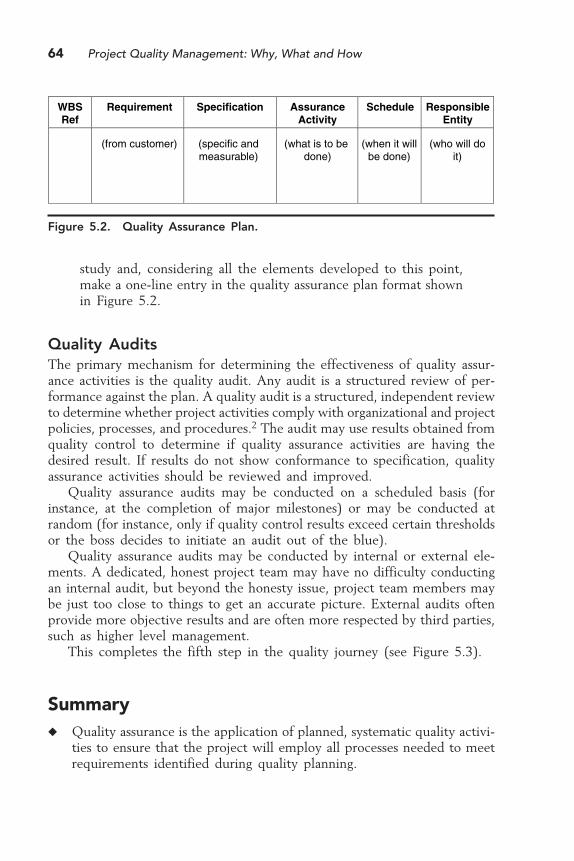
64 Project Quality Management: Why, What and How
study and, considering all the elements developed to this point,make a one-line entry in the quality assurance plan format shownin Figure 5.2.
Quality AuditsThe primary mechanism for determining the effectiveness of quality assur-ance activities is the quality audit. Any audit is a structured review of per-formance against the plan. A quality audit is a structured, independent reviewto determine whether project activities comply with organizational and projectpolicies, processes, and procedures.2 The audit may use results obtained fromquality control to determine if quality assurance activities are having thedesired result. If results do not show conformance to specification, qualityassurance activities should be reviewed and improved.
Quality assurance audits may be conducted on a scheduled basis (forinstance, at the completion of major milestones) or may be conducted atrandom (for instance, only if quality control results exceed certain thresholdsor the boss decides to initiate an audit out of the blue).
Quality assurance audits may be conducted by internal or external ele-ments. A dedicated, honest project team may have no difficulty conductingan internal audit, but beyond the honesty issue, project team members maybe just too close to things to get an accurate picture. External audits oftenprovide more objective results and are often more respected by third parties,such as higher level management.
This completes the fifth step in the quality journey (see Figure 5.3).
Summary� Quality assurance is the application of planned, systematic quality activi-
ties to ensure that the project will employ all processes needed to meetrequirements identified during quality planning.
Figure 5.2. Quality Assurance Plan.
WBSRef
Requirement Specification AssuranceActivity
Schedule ResponsibleEntity
(from customer) (specific andmeasurable)
(what is to be done)
(when it willbe done)
(who will doit)
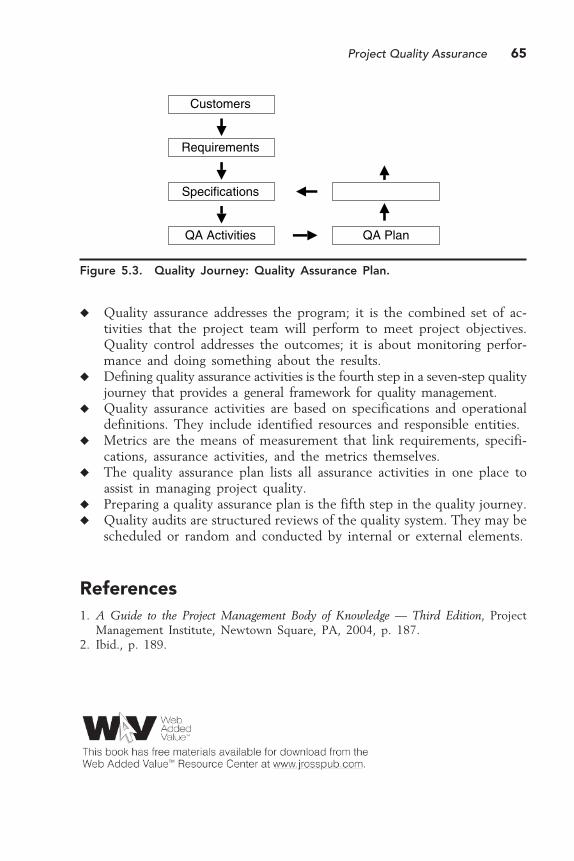
Project Quality Assurance 65
� Quality assurance addresses the program; it is the combined set of ac-tivities that the project team will perform to meet project objectives.Quality control addresses the outcomes; it is about monitoring perfor-mance and doing something about the results.
� Defining quality assurance activities is the fourth step in a seven-step qualityjourney that provides a general framework for quality management.
� Quality assurance activities are based on specifications and operationaldefinitions. They include identified resources and responsible entities.
� Metrics are the means of measurement that link requirements, specifi-cations, assurance activities, and the metrics themselves.
� The quality assurance plan lists all assurance activities in one place toassist in managing project quality.
� Preparing a quality assurance plan is the fifth step in the quality journey.� Quality audits are structured reviews of the quality system. They may be
scheduled or random and conducted by internal or external elements.
References1. A Guide to the Project Management Body of Knowledge — Third Edition, Project
Management Institute, Newtown Square, PA, 2004, p. 187.2. Ibid., p. 189.
Figure 5.3. Quality Journey: Quality Assurance Plan.
Customers
Requirements
Specifications
QA Activities QA Plan


6Project
Quality Control andQuality Improvement
The PMBOK® Guide defines quality control as “…monitoring specific projectresults to determine if they comply with relevant quality standards and identify-ing ways to eliminate causes of unsatisfactory performance.”1 This is an actionprocess in which the project team looks at results and determines necessarycorrective action.
Quality ControlMonitoring specific project results serves several important purposes:
� Results may confirm that all is well. If results are within specifications(no variance from specifications is indicated), the project team knowsthat performance is proceeding according to plan.
� Results may provide the basis for corrective action. If results do notconform to specifications (some degree of variance is indicated), theproject team knows that something has gone wrong or is going wrong.The project team must take corrective action to fix the existing variancefrom the plan. The team must also identify the source of the varianceand take corrective action to prevent it from recurring.
� Results provide feedback to the quality assurance process. Resultsobtained during quality control provide data that are examined during
67

68 Project Quality Management: Why, What and How
quality audits. Performance that does not conform to specificationsindicates that the quality assurance activities associated with thatperformance are not having the desired effect. Quality assurance ac-tivities are intended to ensure conforming performance. If they donot, the project team must analyze the data, determine the shortcom-ing, improve the quality assurance activities, and update the qualityassurance plan.
Role of InspectionA continuing theme in quality management is that quality is planned in, notinspected in. Superficially, this may suggest that planning is in; inspection isout. Not true. Inspection plays a significant role in quality management, butit is a role that is different from that in the traditional approach to quality.Products must be inspected at the end of a process to ensure that theyconform to specification. Products must be checked before they are deliveredto the paying customer. In the traditional approach to quality, as explainedearlier, this end-of-process inspection was the principal focus. Results of theinspection allowed delivery of the product or required rework or discard ofthe defective items.
In the contemporary view of quality, inspection plays a very broad roleacross and throughout the process. Small, frequent inspections ensure thatthe process is performing as planned, with the result being fewer noncon-forming products at the end of the process. In-process inspection may revealdeficiencies that can be corrected before they cause costly scrap and rework.
Inspections may include several kinds of activities, such as:
� Measuring physical characteristics of products� Examining products for completeness or correct assembly� Testing products for performance
Quality Control ToolsMany quality control tools are available to the project team. Ishikawa’s sevenbasic tools are a comprehensive set, but many others exist beyond these.Quality control may be a simple matter of checking something. It may involvethe application of complex tools that require some expertise. Many of thetools of quality control are also tools of quality improvement. Their use, theircorrect use, is so important to the project team that they will be addressedseparately in Section III.
This completes the sixth step in the quality journey (see Figure 6.1). Notethat this step of the journey leads back to a previous step, specifications.

Project Quality Control and Quality Improvement 69
Quality control is a process that monitors specific project results to ensurethat results conform to specifications.
Quality ImprovementThe loop from quality control back to specifications is not the end of thequality journey, however. Figure 6.1 shows another exit from the qualitycontrol step. That path goes to quality improvement. Juran defines qualityimprovement as “…the organized creation of beneficial change; the attain-ment of unprecedented levels of performance…breakthrough.”2 Qualityimprovement is a deliberate process that uses objective measurement anddata. All quality improvement begins with data collection. The Japanese wordkaizen (meaning continual, incremental improvement) is widely used in quality-related activities.
Reasons for Quality ImprovementQuality improvement is not just a good idea. Many practical reasons exist,demanding that organizations continually improve their quality of product orservice.
� A basic reason is to improve products or reduce deficiencies. Betterproducts or fewer deficiencies will improve customer satisfaction,improve reputation, and increase competitiveness.
� Recall that products are not things unto themselves; they meet somekind of customer need. Another reason for quality improvement is toproduce better products for customers. This, too, will increase cus-
Figure 6.1. Quality Journey: Quality Control.
Customers
Requirements
Specifications
QA Activities QA Plan
Quality Control

70 Project Quality Management: Why, What and How
tomer satisfaction and may increase deliveries to existing customersand generate sales to new customers.
� Better processes may result in more efficient use of time, less waste,or fewer defects.
� Customers can be a frustrating lot. Give them what they want andthey ask for more. Dynamic customer needs and requirements de-mand that we continually improve to meet the new needs and re-quirements. We should welcome this attribute of customers. Withoutit, we might tend to be satisfied with current products and perfor-mance and be overtaken, even overcome, by competitors with newer,better ideas.
� Quality improvement may reduce costs. Lower costs can increasecompetitiveness through lower prices or result in delivery of moreproduct or service for the existing price.
� Global competition is a cold, hard fact of business life. Almost allproducts or services are subject to competition from just about any-place in the world. Often, global competitors have an advantage inprice because of local labor costs. Quality improvement can makeproducts more competitive in the face of low-cost labor markets.
� New technologies and the pace of technology development requirechange and enable quality improvement. We must improve to keepup, and the continual changes allow us to improve continually andprovide better products and services to our customers.
Quality improvement is a matter of business survival. Consider all thereasons described above. Ignoring any one of them may result in businessfailure.
HurdlesIf quality improvement is so critical, everyone should support it, but that isnot always the case. Quality improvement can be difficult for many reasons.Members of the project team may be disillusioned by past failures. Past effortsat improvement may not have produced any results, or at least not the resultsthat the team expected or considered to be worth the effort.
Members of the team or members of external management may believe,wrongly, that improved quality costs more. They can focus on short-termcosts rather than long-term benefits. This can be a difficult mind-set to break,but it must be broken. A focus on short-term costs and a belief that betterquality costs more will have devastating effects on the project, the productof the project, customer satisfaction, and the organization as a whole.
Quality improvement responsibility can be delegated down the projectteam, sometimes to the point where the person responsible has no authority
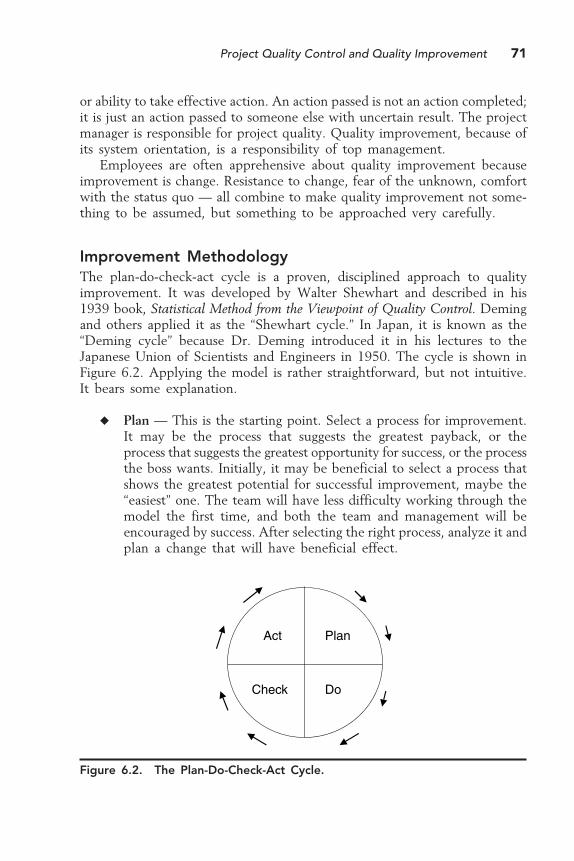
Project Quality Control and Quality Improvement 71
or ability to take effective action. An action passed is not an action completed;it is just an action passed to someone else with uncertain result. The projectmanager is responsible for project quality. Quality improvement, because ofits system orientation, is a responsibility of top management.
Employees are often apprehensive about quality improvement becauseimprovement is change. Resistance to change, fear of the unknown, comfortwith the status quo — all combine to make quality improvement not some-thing to be assumed, but something to be approached very carefully.
Improvement MethodologyThe plan-do-check-act cycle is a proven, disciplined approach to qualityimprovement. It was developed by Walter Shewhart and described in his1939 book, Statistical Method from the Viewpoint of Quality Control. Demingand others applied it as the “Shewhart cycle.” In Japan, it is known as the“Deming cycle” because Dr. Deming introduced it in his lectures to theJapanese Union of Scientists and Engineers in 1950. The cycle is shown inFigure 6.2. Applying the model is rather straightforward, but not intuitive.It bears some explanation.
� Plan — This is the starting point. Select a process for improvement.It may be the process that suggests the greatest payback, or theprocess that suggests the greatest opportunity for success, or the processthe boss wants. Initially, it may be beneficial to select a process thatshows the greatest potential for successful improvement, maybe the“easiest” one. The team will have less difficulty working through themodel the first time, and both the team and management will beencouraged by success. After selecting the right process, analyze it andplan a change that will have beneficial effect.
Figure 6.2. The Plan-Do-Check-Act Cycle.
Plan
DoCheck
Act
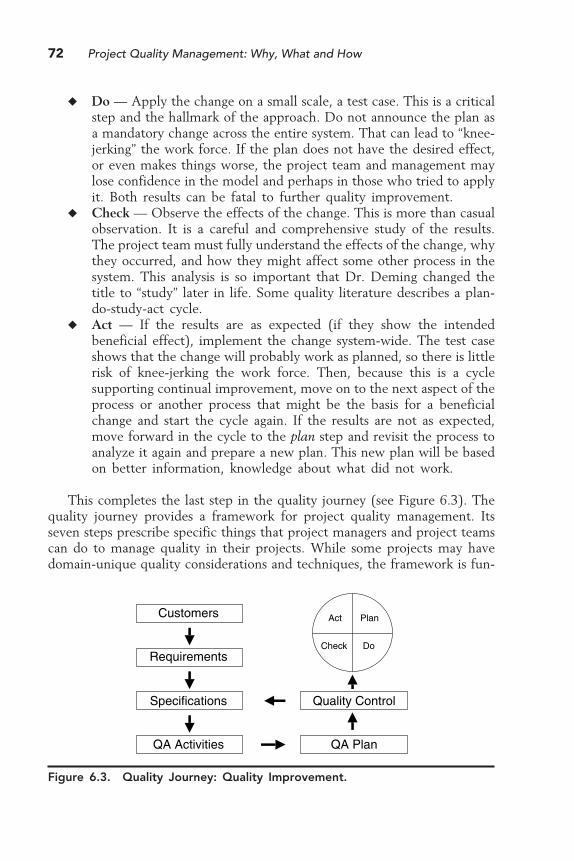
72 Project Quality Management: Why, What and How
� Do — Apply the change on a small scale, a test case. This is a criticalstep and the hallmark of the approach. Do not announce the plan asa mandatory change across the entire system. That can lead to “knee-jerking” the work force. If the plan does not have the desired effect,or even makes things worse, the project team and management maylose confidence in the model and perhaps in those who tried to applyit. Both results can be fatal to further quality improvement.
� Check — Observe the effects of the change. This is more than casualobservation. It is a careful and comprehensive study of the results.The project team must fully understand the effects of the change, whythey occurred, and how they might affect some other process in thesystem. This analysis is so important that Dr. Deming changed thetitle to “study” later in life. Some quality literature describes a plan-do-study-act cycle.
� Act — If the results are as expected (if they show the intendedbeneficial effect), implement the change system-wide. The test caseshows that the change will probably work as planned, so there is littlerisk of knee-jerking the work force. Then, because this is a cyclesupporting continual improvement, move on to the next aspect of theprocess or another process that might be the basis for a beneficialchange and start the cycle again. If the results are not as expected,move forward in the cycle to the plan step and revisit the process toanalyze it again and prepare a new plan. This new plan will be basedon better information, knowledge about what did not work.
This completes the last step in the quality journey (see Figure 6.3). Thequality journey provides a framework for project quality management. Itsseven steps prescribe specific things that project managers and project teamscan do to manage quality in their projects. While some projects may havedomain-unique quality considerations and techniques, the framework is fun-
Figure 6.3. Quality Journey: Quality Improvement.
Customers
Requirements
Specifications
QA Activities QA Plan
Quality Control
Check
Act Plan
Do

Project Quality Control and Quality Improvement 73
damentally applicable to any project in any domain. Project managers neednever again ask “What am I supposed to do?” regarding quality. The frame-work shows the way.
Summary� Quality control is a process that monitors specific project results to
determine if they conform to specifications and identify ways to eliminatethe causes of unsatisfactory results.
� Quality control is the sixth step in a seven-step quality journey thatprovides a general framework for quality management.
� Quality control results provide feedback to quality assurance; resultsdisclose effectiveness of assurance activities.
� In-process inspection plays a key role in quality control. Inspection ac-tivities may include measuring, examining, or testing.
� Quality control tools are well defined. They are also applied to qualityimprovement.
� Quality improvement is the organized creation of beneficial change.� Quality improvement is the last step in the quality journey.� All quality improvement begins with data collection.� Quality improvement is necessary for many reasons, all associated with
customer satisfaction and competitiveness.� Quality improvement is not easy. Hurdles include disillusionment with
past efforts, belief that better quality costs more, delegation, and resis-tance to change.
� The plan-do-check-act cycle is a proven model for quality improvement.It includes: plan a change that will have beneficial effect, do the plan ona small scale, check the result to determine effectiveness, act to implementthe change system-wide if it is effective, or return to the plan step andstart over with better information.
References1. A Guide to the Project Management Body of Knowledge — Third Edition, Project
Management Institute, Newtown Square, PA, 2004, p. 190.2. Juran, J.M. and Godfrey, A.B., Eds., Juran’s Quality Handbook, 5th ed., McGraw-
Hill, New York, 1999, p. 5.3.


Section IIITools for Managing
Project Quality

77
7Collecting andUnderstandingProject Data
The evolution of quality theory and practice has created a number of toolsthat may be applied to managing project quality. The tools described in thesechapters constitute a set that is generally relevant to project management.Other quality tools may be useful, depending on the project situation. Toolsdescribed here fall into five categories, including tools for:
� Collecting data� Understanding data� Understanding processes� Analyzing processes� Solving problems
The set includes the seven basic tools of quality described by Ishikawa inhis book Guide to Quality Control.
� Check sheet� Graph� Histogram� Pareto chart� Scatter diagram� Control chart� Cause and effect diagram
78 Project Quality Management: Why, What and How
Seven additional tools are:
� Flow chart� Run chart� Brainstorming� Affinity diagram� Nominal group technique and multivoting� Force field analysis� Pillar diagram
The set also includes two tools, compliance matrix and peer review, thatare related to general management, but are so common in use and so relevantto project quality management that any discussion would be incompletewithout them.
Tools for Collecting DataImproper or incomplete collection of data is a fundamental error with aneffect that may be magnified many times by subsequent action. Data maybe collected in an ad hoc fashion by a quick scan, word of mouth, or evenassumption. All of these methods yield unsatisfactory results. A more delib-erate method is necessary.
Check SheetA check sheet is a simple yet powerful tool for collecting data. It is used tocompile and record data from contemporaneous observations or historicaldata, nothing more. Using a check sheet involves four steps:
1. Define events and data. It is important to describe precisely what willbe collected and to establish the boundaries of the collection effort.Failure to do this early and well may result in collecting the wrongdata, not enough data, or irrelevant data.
2. Decide who, what, when, where, how, and why. These aspects of thecollection effort are essential to its ultimate success. Determining whocollects the data establishes responsibility. What data will be collectedis determined by adding detail to the definition of events and data inthe previous step to prescribe exact data elements. The when andwhere aspects determine the conditions under which the data will becollected. The how aspect describes the collection method and specificinstructions for use of the check sheet. Last, it is important to establishthe reason for collecting the data (the why aspect) so that data col-
Collecting and Understanding Project Data 79
lectors may understand the goal and may then respond appropriatelyto unexpected situations.
3. Design the check sheet. The check sheet should be clear and easy touse. Instructions and terms should be unambiguous. Physical layoutshould facilitate easy navigation by users and should follow the logicalorder of the collection sequence of actions.
4. Collect data. When all preparations are complete, take action to collectthe data.
Although a check sheet is used only to compile and record data, thecollected data may provide a foundation for subsequent analysis. Data do notspeak for themselves. Users of a check sheet may apply additional analyticskills or tools, or just plain common sense, to obtain meaning from the datacollected. Consider the following situation in which a task manager (TM) hasjust received a “see me” e-mail from the project manager (PM).
TM: Bob, I got your note. What’s up?PM: Have a seat, Jim. You need to do something for me. I was
over at the client site yesterday meeting some people and Carol,the client’s contract manager, was in the group. She didn’t sayanything directly to me, but I got the impression she was unhappywith us. Now, she usually works with our contracting office, soI don’t have much contact with her. But if something is amiss, Iwant to know about it before it gets to the program manager andI get a nasty phone call. I don’t know what her problem could be.We have the best technical people in the industry working on theproject and we’re giving them great results. But maybe the engi-neers are covering something up. Look into it and get back to me.
TM: I’ll get right on it.(Several days go by.)TM: Bob, got a minute? I’ve got some information about Carol’s
concerns.PM: Sure, what’s the deal?TM: Well, you were right about the technicals. Carol and
everybody else over there are really pleased with what we’re doingon the technical side. It’s the administration that’s all messed up.
PM: Administration? That’s nonsense. That stuff takes care ofitself. Besides, nobody really cares about paperwork; they all wantthe technical work done right.
TM: Well, it’s not nonsense to Carol…PM: Look, I’ve been doing this for thirty-two years. I know what
I’m talking about. It’s obviously not the administration. You’re wasting
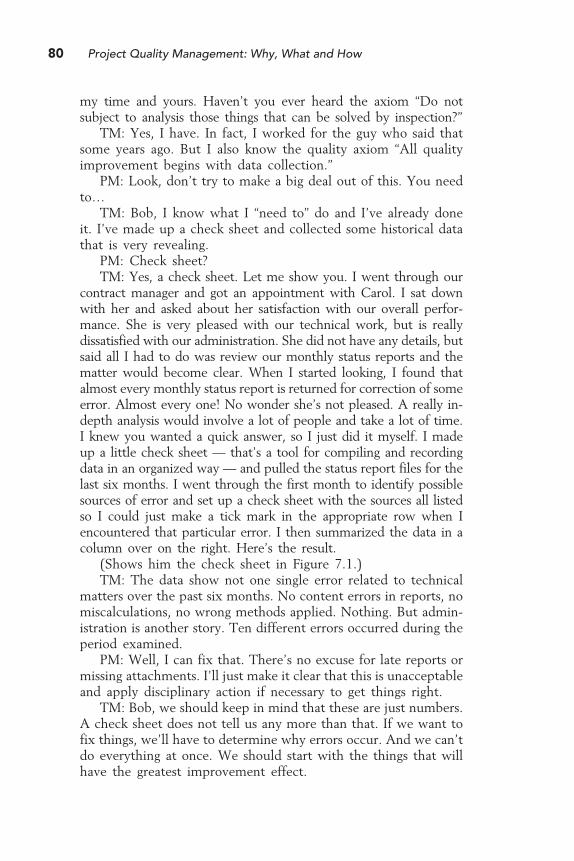
80 Project Quality Management: Why, What and How
my time and yours. Haven’t you ever heard the axiom “Do notsubject to analysis those things that can be solved by inspection?”
TM: Yes, I have. In fact, I worked for the guy who said thatsome years ago. But I also know the quality axiom “All qualityimprovement begins with data collection.”
PM: Look, don’t try to make a big deal out of this. You needto…
TM: Bob, I know what I “need to” do and I’ve already doneit. I’ve made up a check sheet and collected some historical datathat is very revealing.
PM: Check sheet?TM: Yes, a check sheet. Let me show you. I went through our
contract manager and got an appointment with Carol. I sat downwith her and asked about her satisfaction with our overall perfor-mance. She is very pleased with our technical work, but is reallydissatisfied with our administration. She did not have any details, butsaid all I had to do was review our monthly status reports and thematter would become clear. When I started looking, I found thatalmost every monthly status report is returned for correction of someerror. Almost every one! No wonder she’s not pleased. A really in-depth analysis would involve a lot of people and take a lot of time.I knew you wanted a quick answer, so I just did it myself. I madeup a little check sheet — that’s a tool for compiling and recordingdata in an organized way — and pulled the status report files for thelast six months. I went through the first month to identify possiblesources of error and set up a check sheet with the sources all listedso I could just make a tick mark in the appropriate row when Iencountered that particular error. I then summarized the data in acolumn over on the right. Here’s the result.
(Shows him the check sheet in Figure 7.1.)TM: The data show not one single error related to technical
matters over the past six months. No content errors in reports, nomiscalculations, no wrong methods applied. Nothing. But admin-istration is another story. Ten different errors occurred during theperiod examined.
PM: Well, I can fix that. There’s no excuse for late reports ormissing attachments. I’ll just make it clear that this is unacceptableand apply disciplinary action if necessary to get things right.
TM: Bob, we should keep in mind that these are just numbers.A check sheet does not tell us any more than that. If we want tofix things, we’ll have to determine why errors occur. And we can’tdo everything at once. We should start with the things that willhave the greatest improvement effect.
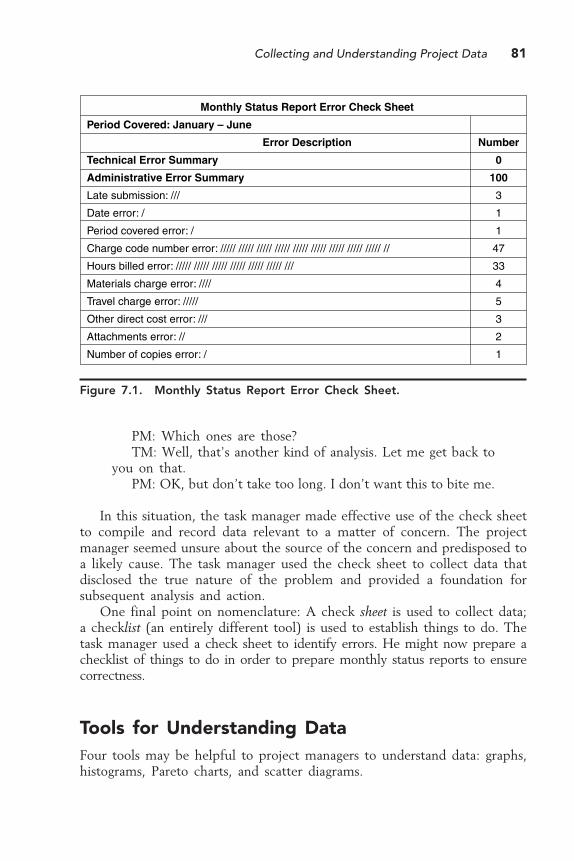
Collecting and Understanding Project Data 81
PM: Which ones are those?TM: Well, that’s another kind of analysis. Let me get back to
you on that.PM: OK, but don’t take too long. I don’t want this to bite me.
In this situation, the task manager made effective use of the check sheetto compile and record data relevant to a matter of concern. The projectmanager seemed unsure about the source of the concern and predisposed toa likely cause. The task manager used the check sheet to collect data thatdisclosed the true nature of the problem and provided a foundation forsubsequent analysis and action.
One final point on nomenclature: A check sheet is used to collect data;a checklist (an entirely different tool) is used to establish things to do. Thetask manager used a check sheet to identify errors. He might now prepare achecklist of things to do in order to prepare monthly status reports to ensurecorrectness.
Tools for Understanding DataFour tools may be helpful to project managers to understand data: graphs,histograms, Pareto charts, and scatter diagrams.
Figure 7.1. Monthly Status Report Error Check Sheet.
Monthly Status Report Error Check Sheet
Period Covered: January – June
Error Description Number
Technical Error Summary 0
Administrative Error Summary 100
Late submission: /// 3
Date error: / 1
Period covered error: / 1
Charge code number error: ///// ///// ///// ///// ///// ///// ///// ///// ///// // 47
Hours billed error: ///// ///// ///// ///// ///// ///// /// 33
Materials charge error: //// 4
Travel charge error: ///// 5
Other direct cost error: /// 3
Attachments error: // 2
Number of copies error: / 1
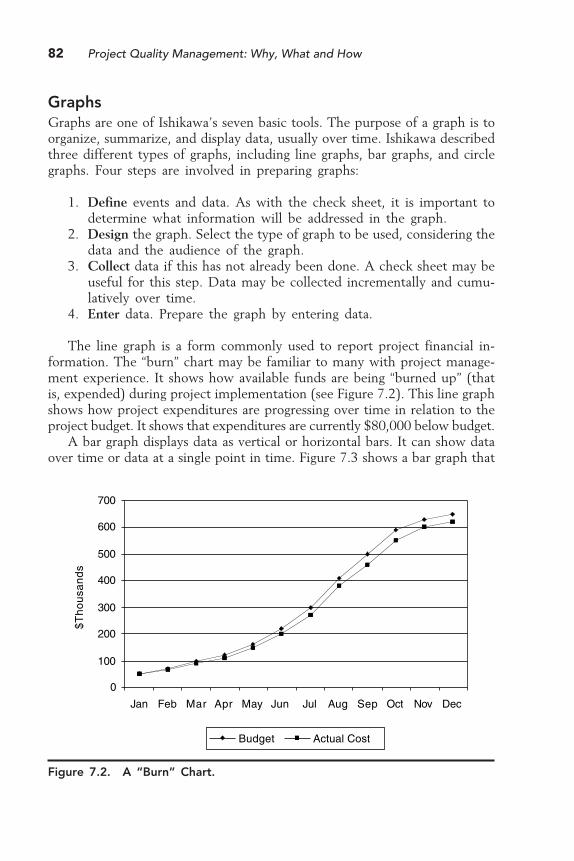
82 Project Quality Management: Why, What and How
GraphsGraphs are one of Ishikawa’s seven basic tools. The purpose of a graph is toorganize, summarize, and display data, usually over time. Ishikawa describedthree different types of graphs, including line graphs, bar graphs, and circlegraphs. Four steps are involved in preparing graphs:
1. Define events and data. As with the check sheet, it is important todetermine what information will be addressed in the graph.
2. Design the graph. Select the type of graph to be used, considering thedata and the audience of the graph.
3. Collect data if this has not already been done. A check sheet may beuseful for this step. Data may be collected incrementally and cumu-latively over time.
4. Enter data. Prepare the graph by entering data.
The line graph is a form commonly used to report project financial in-formation. The “burn” chart may be familiar to many with project manage-ment experience. It shows how available funds are being “burned up” (thatis, expended) during project implementation (see Figure 7.2). This line graphshows how project expenditures are progressing over time in relation to theproject budget. It shows that expenditures are currently $80,000 below budget.
A bar graph displays data as vertical or horizontal bars. It can show dataover time or data at a single point in time. Figure 7.3 shows a bar graph that
Figure 7.2. A “Burn” Chart.
0
100
200
300
400
500
600
700
Jan Feb Mar Apr May Jun Jul Aug Sep Oct Nov Dec
$T
ho
usa
nd
s
Budget Actual Cost

Collecting and Understanding Project Data 83
displays project budget and expense data by quarter for a twelve-monthperiod.
A circle graph (often called a “pie chart”) is useful for displaying datawhen the relationships between data elements and the whole are moreimportant than showing data over time. Figure 7.4 shows a circle graph thatdisplays the composition of a project team by level of education.
Figure 7.3. Project Budget and Expense Data.
Figure 7.4. Project Team Education Levels.
50 100 150 200 250 300 350 400 450 500 550 600 650 700
$Thousands
1st Qtr
2nd Qtr
3rd Qtr
4th Qtr
Total
Budget Expenses
HS Grad24%
Bachelor’s20%Master’s
37%
Doctorate19%

84 Project Quality Management: Why, What and How
HistogramsA histogram is a type of bar graph that deals with data that exist in acontinuous range from a low number to a high number. Histograms displayfrequency distribution, or how often (frequency) individual data points occuracross the range of the data from low to high (distribution). Histogramssummarize data in a form that is more easily understood than a table ofcollected numbers. Creating and using a histogram requires six steps:
1. Select the measures to be examined. Typical measures are things likesize, speed, time, weight, dimensions, and so on.
2. Collect the data. Again, a check sheet may be useful. Data may alreadyexist in some sort of spreadsheet or tabular form.
3. Prepare a frequency table. This is the first step in organizing the data.It is a summary of data in a sequential format.
4. Design the histogram. Histograms are constructed in a disciplined way.Throwing the data together in a way that seems convenient at themoment may result in a display that is completely useless.
5. Draw the histogram. Enter the data and prepare the graphic display.Most word-processing and spreadsheet programs include chart-makingcapabilities that will be helpful in this step.
6. Interpret the data. View the bars of the histogram and analyze theirrelationship to each other.
As an example, consider the task manager who just received an additionalassignment from the project manager to look into contract processing time.The project manager has a feeling that processing time is too long and wantssome data to either confirm or dispel his concerns. The task manager preparesa check sheet and starts collecting data on the number of days required toprocess individual contracts during the past year. He collects a lot of databecause every purchase associated with the project is a contract, even routinepurchases of office supplies. He then arranges the data sequentially in afrequency table that shows the number of days required for processing andthe number of contracts. The frequency distribution is shown in Figure 7.5.
The collected data show that contract processing time ranged from sixteento sixty-five days during the period examined. A total of twenty-five contractswere awarded during this time. To enhance clarity in this example, data havebeen shown in five columns. If the data were shown in one or two columns,it would be difficult to make any sense of them. That is where a histogramcomes in.
The first step in designing a histogram is to select the number of bars toappear on the chart. This is called the class interval. The histogram will notdisplay each number of processing days as a separate bar. Instead, numbers
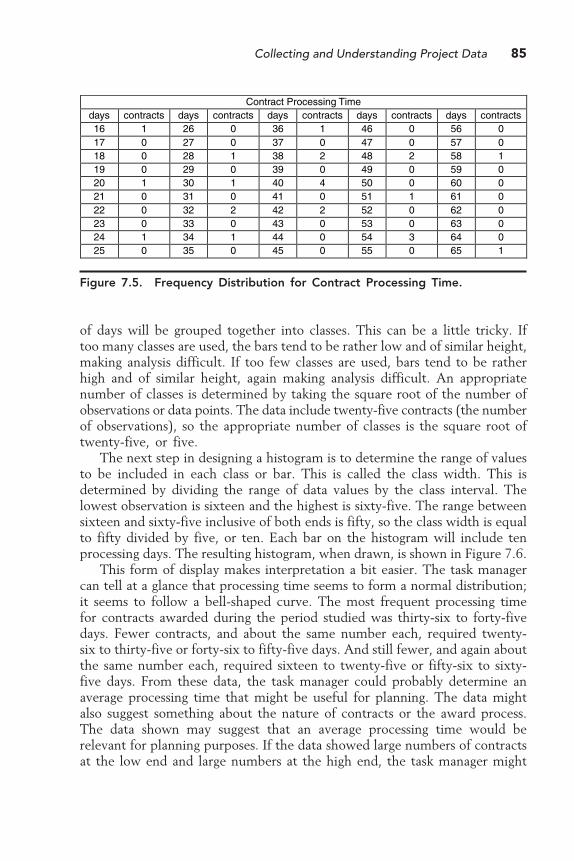
Collecting and Understanding Project Data 85
of days will be grouped together into classes. This can be a little tricky. Iftoo many classes are used, the bars tend to be rather low and of similar height,making analysis difficult. If too few classes are used, bars tend to be ratherhigh and of similar height, again making analysis difficult. An appropriatenumber of classes is determined by taking the square root of the number ofobservations or data points. The data include twenty-five contracts (the numberof observations), so the appropriate number of classes is the square root oftwenty-five, or five.
The next step in designing a histogram is to determine the range of valuesto be included in each class or bar. This is called the class width. This isdetermined by dividing the range of data values by the class interval. Thelowest observation is sixteen and the highest is sixty-five. The range betweensixteen and sixty-five inclusive of both ends is fifty, so the class width is equalto fifty divided by five, or ten. Each bar on the histogram will include tenprocessing days. The resulting histogram, when drawn, is shown in Figure 7.6.
This form of display makes interpretation a bit easier. The task managercan tell at a glance that processing time seems to form a normal distribution;it seems to follow a bell-shaped curve. The most frequent processing timefor contracts awarded during the period studied was thirty-six to forty-fivedays. Fewer contracts, and about the same number each, required twenty-six to thirty-five or forty-six to fifty-five days. And still fewer, and again aboutthe same number each, required sixteen to twenty-five or fifty-six to sixty-five days. From these data, the task manager could probably determine anaverage processing time that might be useful for planning. The data mightalso suggest something about the nature of contracts or the award process.The data shown may suggest that an average processing time would berelevant for planning purposes. If the data showed large numbers of contractsat the low end and large numbers at the high end, the task manager might
Figure 7.5. Frequency Distribution for Contract Processing Time.
Contract Processing Timedays contracts days contracts days contracts days contracts days contracts16 1 26 0 36 1 46 0 56 017 0 27 0 37 0 47 0 57 018 0 28 1 38 2 48 2 58 119 0 29 0 39 0 49 0 59 020 1 30 1 40 4 50 0 60 021 0 31 0 41 0 51 1 61 022 0 32 2 42 2 52 0 62 023 0 33 0 43 0 53 0 63 024 1 34 1 44 0 54 3 64 025 0 35 0 45 0 55 0 65 1
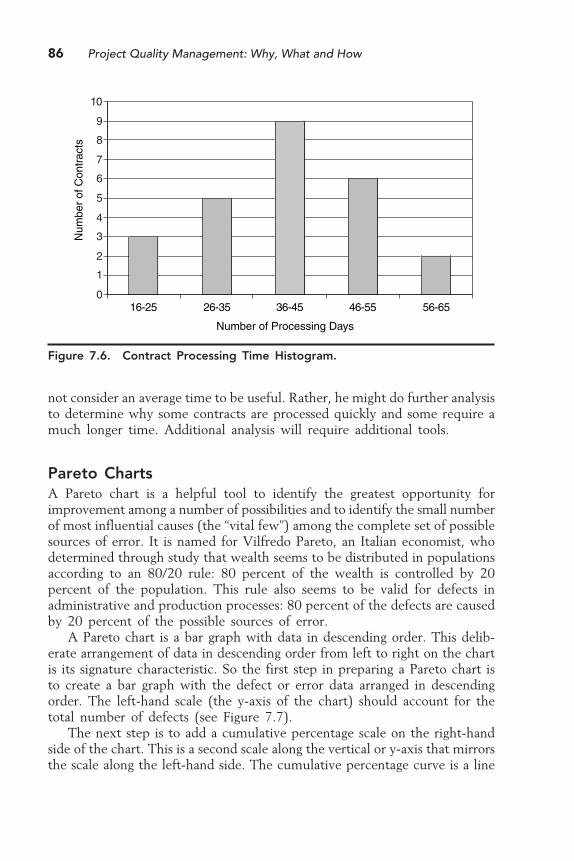
86 Project Quality Management: Why, What and How
not consider an average time to be useful. Rather, he might do further analysisto determine why some contracts are processed quickly and some require amuch longer time. Additional analysis will require additional tools.
Pareto ChartsA Pareto chart is a helpful tool to identify the greatest opportunity forimprovement among a number of possibilities and to identify the small numberof most influential causes (the “vital few”) among the complete set of possiblesources of error. It is named for Vilfredo Pareto, an Italian economist, whodetermined through study that wealth seems to be distributed in populationsaccording to an 80/20 rule: 80 percent of the wealth is controlled by 20percent of the population. This rule also seems to be valid for defects inadministrative and production processes: 80 percent of the defects are causedby 20 percent of the possible sources of error.
A Pareto chart is a bar graph with data in descending order. This delib-erate arrangement of data in descending order from left to right on the chartis its signature characteristic. So the first step in preparing a Pareto chart isto create a bar graph with the defect or error data arranged in descendingorder. The left-hand scale (the y-axis of the chart) should account for thetotal number of defects (see Figure 7.7).
The next step is to add a cumulative percentage scale on the right-handside of the chart. This is a second scale along the vertical or y-axis that mirrorsthe scale along the left-hand side. The cumulative percentage curve is a line
Figure 7.6. Contract Processing Time Histogram.
0
1
2
3
4
5
6
7
8
9
10
Num
ber
of C
ontr
acts
16-25 26-35 36-45 46-55 56-65
Number of Processing Days
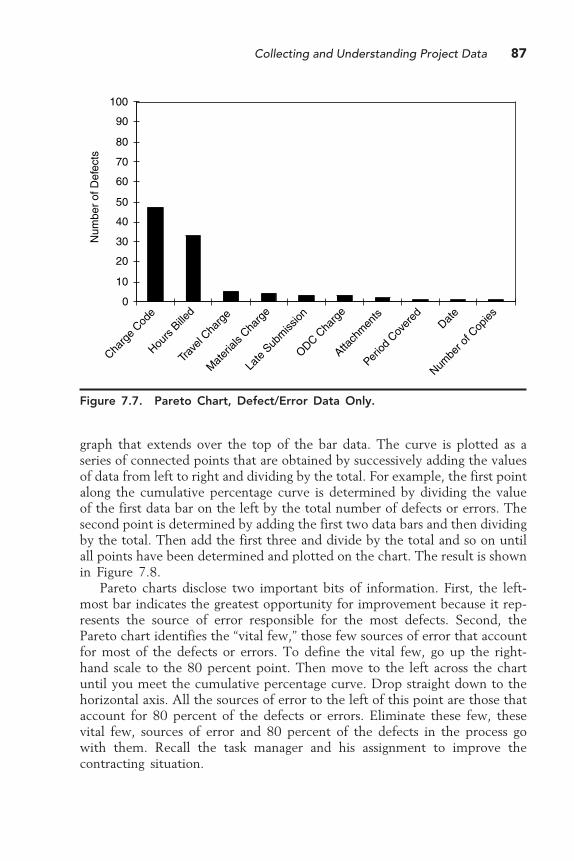
Collecting and Understanding Project Data 87
graph that extends over the top of the bar data. The curve is plotted as aseries of connected points that are obtained by successively adding the valuesof data from left to right and dividing by the total. For example, the first pointalong the cumulative percentage curve is determined by dividing the valueof the first data bar on the left by the total number of defects or errors. Thesecond point is determined by adding the first two data bars and then dividingby the total. Then add the first three and divide by the total and so on untilall points have been determined and plotted on the chart. The result is shownin Figure 7.8.
Pareto charts disclose two important bits of information. First, the left-most bar indicates the greatest opportunity for improvement because it rep-resents the source of error responsible for the most defects. Second, thePareto chart identifies the “vital few,” those few sources of error that accountfor most of the defects or errors. To define the vital few, go up the right-hand scale to the 80 percent point. Then move to the left across the chartuntil you meet the cumulative percentage curve. Drop straight down to thehorizontal axis. All the sources of error to the left of this point are those thataccount for 80 percent of the defects or errors. Eliminate these few, thesevital few, sources of error and 80 percent of the defects in the process gowith them. Recall the task manager and his assignment to improve thecontracting situation.
Figure 7.7. Pareto Chart, Defect/Error Data Only.
0
10
20
30
40
50
60
70
80
90
100
Charg
e Cod
e
Hours
Bille
d
Trave
l Cha
rge
Mat
erial
s Cha
rge
Late
Sub
miss
ion
ODC Cha
rge
Attach
men
ts
Period
Cov
ered
Date
Numbe
r of C
opies
Num
ber
of D
efec
ts

88 Project Quality Management: Why, What and How
TM: Bob, got a minute?PM: Sure, what’s up.TM: When we spoke the other day about contracting, I said
I would get back to you about what we should do first. So I’d liketo show you a Pareto chart.
PM: A what?TM: A Pareto chart. Kind of an unusual name I guess. It’s
named for an Italian economist who did some studies about thedistribution of wealth in populations. He found that there is an80/20 relationship between wealth and people that seems to holdtrue for administrative and production processes, too.
PM: What do you mean?TM: Any process may include a number of sources of defects.
But the errors in the process are not equally distributed across allsources. A couple of the sources seem to account for most of theproblems. It’s about an 80/20 ratio; 80 percent of the problemscome from 20 percent of the sources. And by the way, don’t wesee that among team members, too? In a large team, it seems thata couple of people are the real workhorses…
Figure 7.8. Pareto Chart.
0
10
20
30
40
50
60
70
80
90
100
Charg
e Cod
e
Hours
Bille
d
Trave
l Cha
rge
Mat
erial
s Cha
rge
Late
Sub
miss
ion
ODC Cha
rge
Attach
men
ts
Period
Cov
ered
Date
Numbe
r of C
opies
Num
ber
of D
efec
ts
0%
10%
20%
30%
40%
50%
60%
70%
80%
90%
100%
Cum
ulat
ive
Per
cent
age
Collecting and Understanding Project Data 89
PM: Like you, for instance?TM: Well…and a couple of people seem to be the problem
children who take up a lot of management time.PM: Boy howdy!TM: A Pareto chart is a specialized tool that helps identify that
small number of sources that cause most of the problems. They’recalled the “vital few.”
PM: How does it do that?TM: Look at this.(Shows him the chart.)TM: A Pareto chart starts with a bar graph that has the bars
deliberately arranged in descending order from left to right. Thebar farthest to the left represents the highest numbers of defects,so it is the area of greatest opportunity for improvement — thearea we should fix first.
PM: Well, that seems pretty obvious. I don’t need a Paretochart to tell me that.
TM: You’re right. These data are pretty straightforward. Butnot all data are. In a more complex situation, we could havetwenty-five or thirty potential sources of error with several beingrelatively equal. And another thing…do you recall what you saidwhen I first showed you the check sheet with the ten sources?
PM: Yes. I thought I’d fix the late reports and missing attach-ments first.
TM: Right. If we did that, we’d spend money and time elimi-nating 5 percent of the errors. People can tend to go after sourcesthat seem easiest to fix or are in some way attractive to them. APareto chart forces us to consider the data and go after the thingsthat have the most effect on the process.
PM: But it’s more than just the first bar, right?TM: Exactly. And that’s where the other unique feature of a
Pareto chart comes into play. Look at this percentage scale overon the right side of the chart. You don’t see that elsewhere. Itmirrors the defect scale on the left side. The 100 percent markequals the total number of defects on the left. And look at thisline across the top.
PM: Yeah, I’ve been wondering what that was.TM: It’s called a cumulative percentage curve. It’s plotted by
taking the percent of the total that each bar plus every bar to itsleft represents. So it’s cumulative moving to the right. See?
PM: Got it.TM: What we do is, we go to the 80 percent point on the right-
hand scale, then move straight across to the left until we intersect
90 Project Quality Management: Why, What and How
with the cumulative percentage curve. We drop straight down andthere we have it. We have just defined the vital few. The bars tothe left of this point account for 80 percent of the defects. If wefix these two sources of error, we’ll eliminate 80 percent of theproblem, not 5 percent.
PM: And Carol is a lot happier with our administration.TM: Right!PM: You know, this looks complex, but it’s really pretty simple.TM: It sure is. Once you understand it, a Pareto chart is a
powerful tool that is easy to use. And our standard office softwarehas a utility for making these charts, so they are readily accessible.
PM: That’s good work, Jim. Let’s get on it.TM: Already started. Now that we understand the data, we’ll
have to do some analysis before we take action. We want effectiveactions, not trial and error. And as you might have guessed, that’sanother chart.
One last point about Pareto charts is important to understand. Paretocharts usually deal with the number of defects, and subsequent action isintended to reduce the number. Sometimes the number of defects or errorsis not as important as the cost or the effect of the error. Consider accidentsat an oil-drilling field site. Accidents have a cost in lost time, medical claims,and human suffering. Suppose research showed that for every 100,000 laborhours, there are seven accidents involving workers who slip and fall on wet,slick soil. The resulting cost is a bump or bruise, a couple of pain pills, andperhaps some liniment. Suppose the data also show that for every 100,000labor hours, there is one accident in which a worker gets a hand caught insteel cables and suffers a traumatic amputation of one or more fingers. Theresulting cost is much more lost time, perhaps a temporary suspension ofwork, and a great deal of human suffering. The goal should be to eliminatethe one accident, not the seven. When cost of errors is more significant thannumber of errors, simply construct the Pareto chart in a way that expressesthe cost of the errors, not the number.
Scatter DiagramsA scatter diagram identifies possible relationships between two variables.Understanding relationships among data elements is essential to understand-ing the data as a whole. The steps in creating a scatter diagram include:
1. Define the theoretical relationship. Relationships between variablesare not always obvious. Relationships are also easy to assume. This firststep identifies the two variables that will be formally examined.

Collecting and Understanding Project Data 91
2. Collect 50 to 100 paired samples of data. Analysis must be based ona sufficient amount of data. Too few data may result in erroneousconclusions that arise from random flukes among the limited data.
3. Plot the data on x-y axes. The x-axis, the horizontal axis, should beused for the independent variable; that is, the variable that is the base.The data of the other variable will change in some regular way as thebase changes if there is a relationship between the two. The y-axisshould be used for the dependent variable; that is, the variable thatmay change in some regular way as the base changes.
4. Interpret the data. Look for regular patterns among the plotted points.
Recall the task manager who was looking into contract processing time.Using a histogram, he determined that contract processing time varied fromsixteen to sixty-five days, but why did some contracts require more time thanothers? The task manager suspects that some kind of relationship existsbetween the variables that influence the contracting process. Perhaps process-ing time is related to the dollar value of the contract. Perhaps it is relatedto the time of year during which the contract is processed.
A scatter diagram identifies possible relationships between variables. Thetask manager can use a scatter diagram to investigate relationships, two at atime. He collects a little more data so he has at least fifty data points. Someof the data points are the same (that is, some contracts required the sameamount of time to process), so the chart will not necessarily show fiftyseparate data points. He then plots the data on a scatter diagram with thedollar value on the x-axis and the processing time on the y-axis. This isbecause he believes that processing time (a dependent variable) may changein some regular way as the dollar value (the independent variable) changes.The result is shown in Figure 7.9.
Notice that the data for each level of contract value are close together.The task manager could almost draw a single line from left to right connectingall the data points. Data grouped together like this suggest a strong relation-ship between contract value and processing time. As the contract value in-creases, the processing time also increases in a somewhat uniform way.
The task manager may also suspect that processing time is related in someway to the time of year during which the contract is processed. Perhapscontracts take more time to process during traditional vacation periods whenstaffing levels might be reduced. So he collects the time-of-year data for thecontracts he is analyzing and prepares a scatter diagram with the month onthe x-axis and the processing time on the y-axis. This result is shown in Figure7.10.
Now the data points are all over the diagram. There does not seem to beany grouping of data for each month or any kind of regular pattern at all.This kind of grouping (or lack of grouping) suggests that no relationship exists
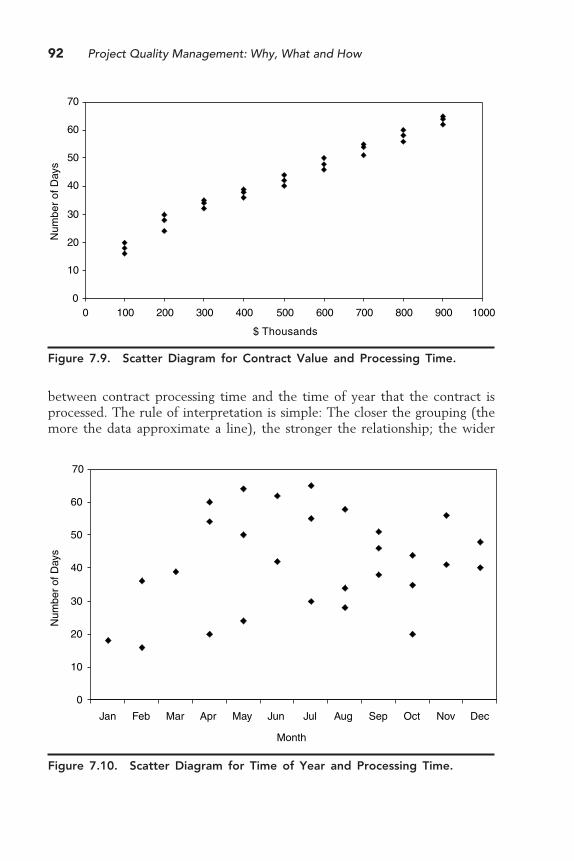
92 Project Quality Management: Why, What and How
between contract processing time and the time of year that the contract isprocessed. The rule of interpretation is simple: The closer the grouping (themore the data approximate a line), the stronger the relationship; the wider
Figure 7.9. Scatter Diagram for Contract Value and Processing Time.
Figure 7.10. Scatter Diagram for Time of Year and Processing Time.
0
10
20
30
40
50
60
70
0 100 200 300 400 500 600 700 800 900 1000
$ Thousands
Num
ber
of D
ays
0
10
20
30
40
50
60
70
Jan Feb Mar Apr May Jun Jul Aug Sep Oct Nov Dec
Month
Num
ber
of D
ays
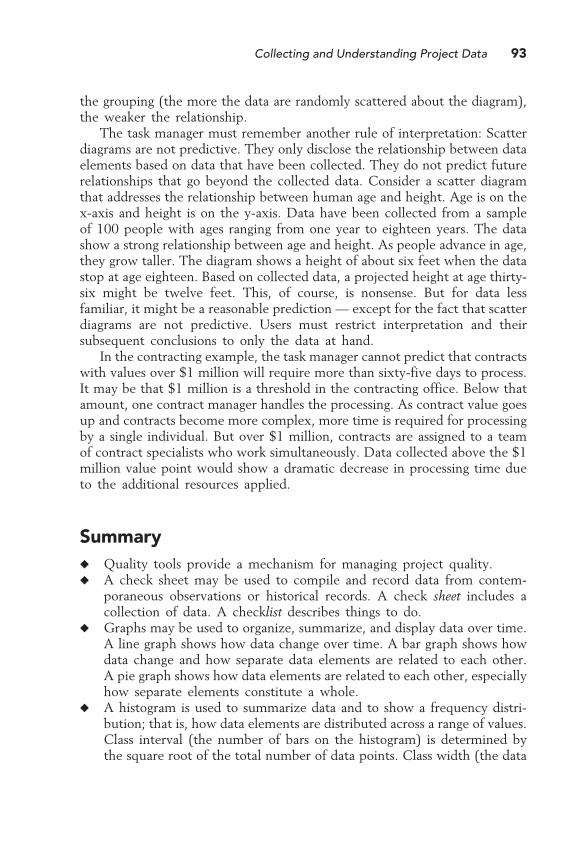
Collecting and Understanding Project Data 93
the grouping (the more the data are randomly scattered about the diagram),the weaker the relationship.
The task manager must remember another rule of interpretation: Scatterdiagrams are not predictive. They only disclose the relationship between dataelements based on data that have been collected. They do not predict futurerelationships that go beyond the collected data. Consider a scatter diagramthat addresses the relationship between human age and height. Age is on thex-axis and height is on the y-axis. Data have been collected from a sampleof 100 people with ages ranging from one year to eighteen years. The datashow a strong relationship between age and height. As people advance in age,they grow taller. The diagram shows a height of about six feet when the datastop at age eighteen. Based on collected data, a projected height at age thirty-six might be twelve feet. This, of course, is nonsense. But for data lessfamiliar, it might be a reasonable prediction — except for the fact that scatterdiagrams are not predictive. Users must restrict interpretation and theirsubsequent conclusions to only the data at hand.
In the contracting example, the task manager cannot predict that contractswith values over $1 million will require more than sixty-five days to process.It may be that $1 million is a threshold in the contracting office. Below thatamount, one contract manager handles the processing. As contract value goesup and contracts become more complex, more time is required for processingby a single individual. But over $1 million, contracts are assigned to a teamof contract specialists who work simultaneously. Data collected above the $1million value point would show a dramatic decrease in processing time dueto the additional resources applied.
Summary� Quality tools provide a mechanism for managing project quality.� A check sheet may be used to compile and record data from contem-
poraneous observations or historical records. A check sheet includes acollection of data. A checklist describes things to do.
� Graphs may be used to organize, summarize, and display data over time.A line graph shows how data change over time. A bar graph shows howdata change and how separate data elements are related to each other.A pie graph shows how data elements are related to each other, especiallyhow separate elements constitute a whole.
� A histogram is used to summarize data and to show a frequency distri-bution; that is, how data elements are distributed across a range of values.Class interval (the number of bars on the histogram) is determined bythe square root of the total number of data points. Class width (the data

94 Project Quality Management: Why, What and How
range within each bar) is determined by the total data range divided bythe class interval.
� A Pareto chart is a bar graph with bars arranged in descending order fromleft to right. The bars represent sources of error, and the values of thebars reflect the number of defects. The left-most bar (the category withthe greatest number of data points) represents the greatest opportunityfor improvement. A Pareto chart includes a cumulative percentage curvethat helps identify the “vital few,” the small number of sources of error(about 20 percent) that account for most of the defects (about 80percent).
� When the cost of defects is more important than the number of defects,a Pareto chart should be constructed so that bars represent the cost ofdefects rather than the number.
� Scatter diagrams identify possible relationships between two variables.Close groupings of data points suggest a strong relationship. Very widegroupings or widely dispersed data points suggest weak relationships orno relationship. Scatter diagrams cannot be used to predict values outsidethe range of data included in the diagram.
95
8Understanding
Project Processes
Understanding data is important, but it is only an early step in managingproject quality. Data are the voices of processes. When performed, processesproduce some kind of result. Data are the expressions of those results. Thenext step in managing project quality is to understand processes.
Tools for Understanding ProcessesThree quality tools for understanding processes are useful for project man-agers. One of them is probably familiar to most project managers. The othertwo may be less familiar because of their traditional application to manufac-turing processes.
Flow ChartsFlow charts are probably familiar to most project managers. They are com-mon tools of basic management. A flow chart identifies the sequence ofevents in a process. Beyond that, it allows — even forces — identification ofthe sometimes-obscure elements in a process. Using flow charts requires sixdeliberate actions:
1. Set boundaries. A common problem among novices or the overlyenthusiastic is that they try to flow-chart the world. This approachseldom has a happy result. The individual or team should decide what
96 Project Quality Management: Why, What and How
they will consider in the flow-charting effort and what they will ex-clude. A good result often depends on properly framing the effort atthe start. The team should also agree on the level of detail to beobtained. A top-level macro view may be all that is necessary at themoment.
2. Determine the steps in the process. Before attempting to draw thechart, identify the basic framework of inputs, outputs, activities, anddecisions.
3. Establish the sequence of process steps. This can be done effectivelywith a lot of “sticky notes” and wall space. Involve the team so thatdifferent views may be considered. It is important, and sometimesdifficult, to describe the sequence as it is, not as it should be. Perfor-mance results arise from what is occurring, not what is expected tooccur.
4. Draw the flow chart. Automated tools are available to do this. Thesetools may include a variety of symbols to represent elements in thechart. The five basic symbols shown in Figure 8.1 may be sufficientfor most project flow charts. Keep things simple. Add the level ofdetail necessary to understand the process. Trying to include the low-est possible level of detail may only result in a morass of symbols andlines that is unintelligible and of little value. Use simple words todescribe activities and be consistent in both construction and language.
5. Test the flow chart for completeness and accuracy. First, ensure thatthe chart is constructed correctly and that all symbols are properlyused. Review the process flow to ensure that all activities are includedand fully addressed. Beware of “magic happens” activities, those thatsuggest some kind of activity or result but do not include all theessential elements. It may be helpful to obtain a review by someonenot directly involved in the effort, but who is knowledgeable about theprocess. Such a person may help overcome blind spots or identifyprocess steps not readily apparent to those analyzing the process andpreparing the chart. Above all, ensure that the chart reflects the waythe process really works, not the way it should work.
6. Finalize the chart. Put the chart in final form using consistent fontsand graphic alignment. A well-organized chart, even a “pretty” chart,is easier to read and understand.
Recall the task manager who used a check sheet to compile and recorderrors and then used a Pareto chart to identify the vital few sources of errorin the process. He may now use a flow chart to identify the sequence ofevents in the process of preparing monthly status reports and, in so doing,identify where and how things might go wrong. The flow chart in Figure 8.2shows the report preparation process.

Understanding Project Processes 97
The task manager carefully considers the final flow chart and determinesif the process, as shown, may be reasonably expected to produce correctreports if all goes well. He then refers to his initial check sheet and comparesthe sources of error to the flow chart to determine how errors might occur.For example, late submission could be a result of delays in any of the stepsshown on the flow chart, but if all goes well during the preparation process,late submission probably results from some kind of delay in the distributioncenter after the task manager hands off the report. Errors in the date of thereport or the period covered probably occur during the “prepare MSR” stepbecause that is where this information is added to the report.
The two most significant sources of error, charge code number errors andhours-billed errors, may occur outside the process addressed by this flow
Figure 8.1. Flow Chart Basic Symbols.
An oval indicates start points and end points, or inputs and outputs.
A rectangle represents an activity.
A diamond represents a decision point.
A circle indicates a connection to another chart.
An arrow represents the direction of process flow.
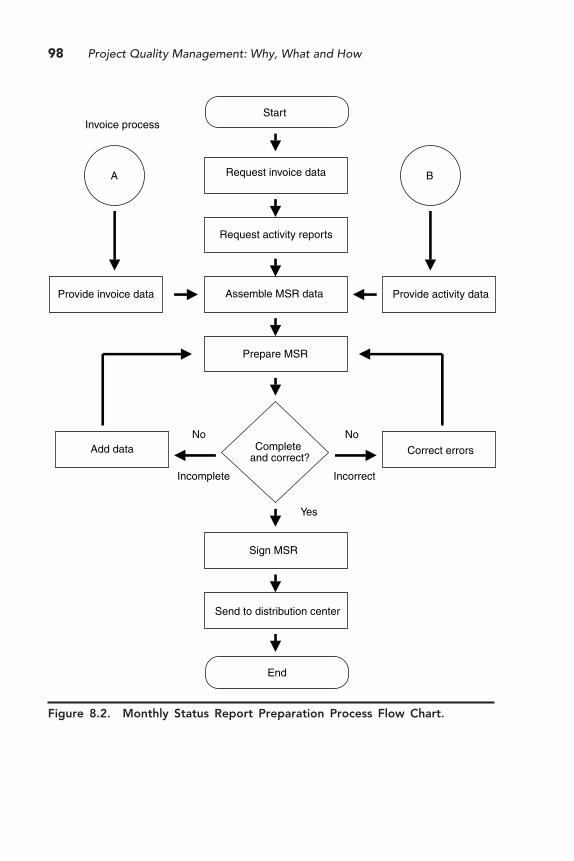
98 Project Quality Management: Why, What and How
Figure 8.2. Monthly Status Report Preparation Process Flow Chart.
Start
End
Request invoice data
Assemble MSR data
Request activity reports
Provide activity dataProvide invoice data
Send to distribution center
Sign MSR
Completeand correct?
Prepare MSR
Add data Correct errors
Yes
NoNo
A B
Invoice process
Incomplete Incorrect
Understanding Project Processes 99
chart. The task manager determines that these data are entered into themonthly status report “as is” from the invoice data provided by the accountingoffice. Whatever errors are present must be occurring in the accounting officeor in the reporting process that provides the data to accounting. Furtheranalysis and probably another flow chart are required.
Run ChartsA run chart is used to observe process performance over time. It is a linegraph with data that vary around a centerline, usually the mean. It is used forrepeatable processes where performance is expected to be stable. A run chartwill show defect trends, shifts, or cycles. To create a run chart:
1. Identify the process to be observed. Make sure the process involvessome kind of repeatable activity in which results are expected to beconsistent over time. A run chart has no value in areas where data areexpected to change, as in a chart showing profits (expected to go upover time) or customer complaints (expected to go down over time).
2. Collect data. Usually twenty to twenty-five data points are requiredfor a meaningful chart.
3. Create the graph. As stated, a run chart is a line graph with data thatvary about a centerline. Plot the data on an x-y axis graph, thencalculate and plot the mean. Do not recalculate the mean when youadd new data. Only recalculate the mean after you change the process.Initial data collection establishes the process mean. Subsequent datamust be evaluated against that mean unless the process has beenchanged since initial data collection.
4. Interpret the data. Look for trends, shifts in data groupings, or cycles.All may suggest further analysis to determine the reason.
As an example, consider commute time, or the time required for projectteam members to travel from their homes to the office. The task managerhas noticed that tardiness has been an occasional problem, but has someregular aspects. When one person is late, many seem to be late, and it seemsthat some days of the week have a higher incidence of tardiness than others.He would like to see people at work on time and is tempted to issue adirective with a threat of punishment for late arrivers, but he thinks theremay be factors beyond employees’ control that are affecting arrival times. Hecollects data from all employees for a twenty-day period. He computes dailyaverages and plots the data on a run chart (see Figure 8.3).
The run chart shows a repeatable process: People commute to work everyday. It also shows a process that is expected to be rather stable: Travel time

100 Project Quality Management: Why, What and How
may vary according to traffic and weather, but generally the commute timeshould be about the same every day. The first thing that the task managernotices is that there are two “spikes,” examples of extreme deviation fromthe mean. He recalls that a truck overturned recently and closed the mainhighway for several hours during morning rush hour. The run chart showsan average of 120 minutes for the commute on that day. A few weeks later,a federal holiday occurred on a Monday. Many businesses were closed, butnot the project office. Team members experienced a significantly shortercommute due to reduced traffic.
After a little more study, the task manager notices a regular pattern ofdata points significantly above the mean. These points occur every Friday.Seems reasonable, he thinks. Traffic always seems to be heavier on Friday.He is about to send an e-mail to all team members advising them to get anearlier start on Fridays so they can arrive at the office on time when Amystops by his work cube.
Amy: Jim, got a minute?TM: Sure, what can I do for you?Amy: Well, remember last week when you asked Larry to
collect data from all of us about our morning commute time? Iasked Larry to give me a copy and I’ve prepared what’s called arun chart. It shows how data vary over time, but more important,how data vary around a centerline, usually the mean. Take a lookat this chart. Other than the two exceptions, the day there wasan accident and the day of the federal holiday, it shows that Friday
Figure 8.3. Run Chart for Commute Time.
0
20
40
60
80
100
120
140
M T W TH F M T W TH F M T W TH F M T W TH F
Day of Week
Mean
Trav
el T
ime
(Min
utes
)
Mean = 53 minutes

Understanding Project Processes 101
is consistently a bad commute day. And we see that in the office.A lot of people are late on Fridays, and everybody is generally outof sorts because of the bad commute.
TM: Yeah, I know. I made a similar chart and I was just aboutto send out a note telling people to get an earlier start on Fridays.
Amy: Jim, that’s going to be a lead balloon. I’ve got a betteridea. Why don’t we adopt a flex-time schedule where people canwork extra hours during the week and take a Friday off every payperiod? Or better yet, why don’t we do telecommuting and allowpeople to work from home on Fridays? We’ll contribute to reduc-ing traffic, save fuel consumption, and make people a lot happier— and I’ll bet a lot more productive — on Fridays. What do youthink?
The task manager thought Amy had a pretty good idea. It was an ideathat made sense to him because of the data, and it was an idea that he couldpropose and defend to the project manager because it was based on data, notintuition or personal choice.
The matter of contract processing time provides another example, per-haps one more closely related to project actions. Previously, the task managerused a histogram to understand the data, to see how processing time wasdistributed across the range of values. Now he uses a run chart to see howprocessing time varies around the mean. He collects data for a twelve-weekperiod. For each week, he calculates the average processing time for allcontracts that were processed to completion during the week. He plots thedata on a run chart as shown in Figure 8.4.
Figure 8.4. Run Chart for Contract Processing Time.
30
35
40
45
50
55
1 2 3 4 5 6 7 8 9 10 11 12
Week
Pro
cess
ing
Tim
e (D
ays)
Mean
Mean = 42 days
102 Project Quality Management: Why, What and How
The task manager has just heard from the project manager that the pro-gram manager told him that the vice president for operations wants allcontracts processed and awarded by the end of August so that the contractingoffice can use September to put everything in order in preparation for thenew fiscal year that begins on October 1st. He wonders if these people evermake decisions based on data or ever consider the effect that their directiveshave on the work force. He knows that September is always extremelyunpleasant for his friends in contracting because of all the extra hours re-quired to meet this annual management directive. And he knows that he andother task managers make the situation worse by dumping as many contractactions as possible on the contracting office late in the year knowing nonewill be processed during September and will have to be completed by theend of August.
Looking for a better way, he begins to analyze the run chart. Because theaverage processing time is forty-two days, his first thought is that the con-tracting office should stop accepting new contract actions forty-two workingdays before the end of August. That means around the first of July, but thatis only the average. Contracts requiring more than forty-two days to processwould still create extra hours of work in order to be completed unless anequal number requiring less than forty-two days were in the queue. Maybethe cutoff date should be fifty-two working days before the end of August,an amount of time equal to the highest number of days shown by the currentdata. This does not seem like a good solution. Besides, the contracting officeis unlikely to announce that it will stop serving customers on the first of Julyor before.
The task manager takes another look at the scatter diagram preparedearlier to determine that contract processing time seems to be related in someway to the dollar value of the contract. After a little thought, he decides thatthe best solution is one that involves all the participants, not one that justdumps the problem onto the contracting office. He develops a progressiveschedule of lead times for distribution to task managers. Lead times are basedon expected processing times related to contract value. This schedule willadvise task managers that if they anticipate a contract action of a certainamount, they should have the action to the contract office by a certainnumber of days before August 31st. Now, task managers will have informa-tion they can use for planning, the contracting office will probably receivecontract actions within more reasonable time frames, and the contractingoffice can extend receipt of low-dollar-value contracts into September be-cause of assured available processing time. All of this is possible because thetask manager applied quality tools to understand data and processes: a his-togram, a scatter diagram, and a run chart.
Sometimes the centerline is not a mean, but a zero value. For example,a project manager may want to observe how expenditures are progressing
Understanding Project Processes 103
during project implementation. The goal is to spend all the available money,but no more. A run chart might be constructed that shows a centerline ofzero, which represents the authorized budget, with data plotted as percent-ages above and below the authorized budget. In this kind of chart, the actualbudget amounts are not important and not shown. Only the percentagesabove and below the currently authorized budget amount are displayed.
Control ChartsControl charts are very powerful tools for monitoring, controlling, and im-proving processes over time. They are one of the most complex quality toolsand probably the most little used outside of manufacturing domains. Controlcharts are applicable to administrative processes. Data speak, sometimes loudlyand sometimes more subtly. Control charts, as “the voice of the process,” canspeak volumes of useful information. Like run charts, control charts are usefulto analyze repeatable processes in which results are expected to be stable overtime. It is a mistake to attempt to apply control charts to processes in whichresults may change over time. Control charts:
� Disclose the nature of variation in the process� Indicate what should be expected� Indicate what lies outside of expectations
Control charts use sample data to generalize about a population. Smallamounts of data, properly selected — and that usually means randomlyselected — can provide sufficient information to make process decisions.Control charts use two types of data: attribute and variable. Attribute dataare binary. Something is or is not. Something is go or no-go. A report is eitherlate or not late; the degree of lateness is irrelevant. Variable data are somekind of measurement. An environmental project may be concerned not aboutthe presence or absence of contaminants in groundwater but about the levelof contamination as measured on a continuous scale of parts per million.
Control charts are the basic tools of statistical process control, which hasbeen and continues to be widely used in manufacturing. The traditionalmanner of application may be a hindrance to their use in project settings.Project managers may assume that control charts are restricted to manufac-turing and not relevant to processes more administrative in nature. Bothproduction and administration include processes that are repeatable, pro-cesses in which results are expected to be stable over time. Control chartsare applicable in either domain. Consider the following situation.
Johnson Medical Services (JMS) processes and pays medicalclaims for insurance providers in a fourteen-state area. Claims are
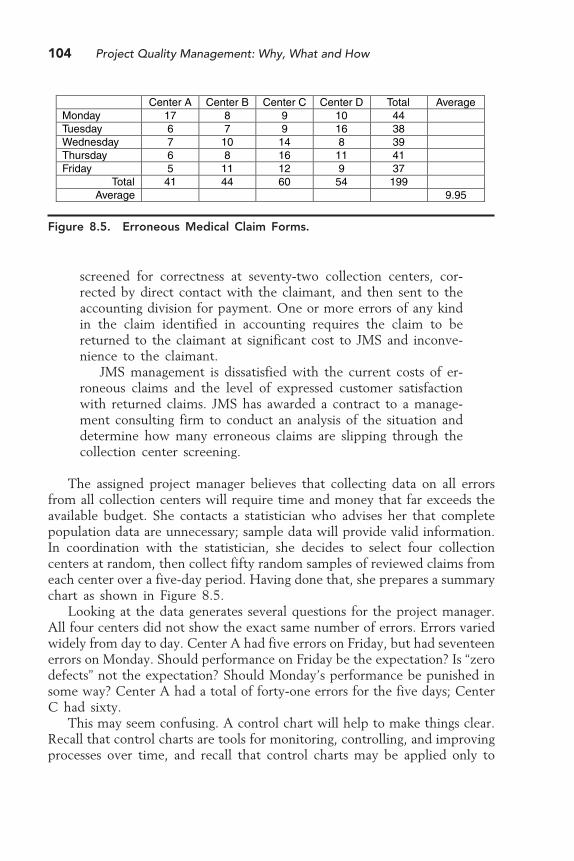
104 Project Quality Management: Why, What and How
screened for correctness at seventy-two collection centers, cor-rected by direct contact with the claimant, and then sent to theaccounting division for payment. One or more errors of any kindin the claim identified in accounting requires the claim to bereturned to the claimant at significant cost to JMS and inconve-nience to the claimant.
JMS management is dissatisfied with the current costs of er-roneous claims and the level of expressed customer satisfactionwith returned claims. JMS has awarded a contract to a manage-ment consulting firm to conduct an analysis of the situation anddetermine how many erroneous claims are slipping through thecollection center screening.
The assigned project manager believes that collecting data on all errorsfrom all collection centers will require time and money that far exceeds theavailable budget. She contacts a statistician who advises her that completepopulation data are unnecessary; sample data will provide valid information.In coordination with the statistician, she decides to select four collectioncenters at random, then collect fifty random samples of reviewed claims fromeach center over a five-day period. Having done that, she prepares a summarychart as shown in Figure 8.5.
Looking at the data generates several questions for the project manager.All four centers did not show the exact same number of errors. Errors variedwidely from day to day. Center A had five errors on Friday, but had seventeenerrors on Monday. Should performance on Friday be the expectation? Is “zerodefects” not the expectation? Should Monday’s performance be punished insome way? Center A had a total of forty-one errors for the five days; CenterC had sixty.
This may seem confusing. A control chart will help to make things clear.Recall that control charts are tools for monitoring, controlling, and improvingprocesses over time, and recall that control charts may be applied only to
Figure 8.5. Erroneous Medical Claim Forms.
Center A Center B Center C Center D Total AverageMonday 17 8 9 10 44Tuesday 6 7 9 16 38Wednesday 7 10 14 8 39Thursday 6 8 16 11 41Friday 5 11 12 9 37
Total 41 44 60 54 199Average 9.95
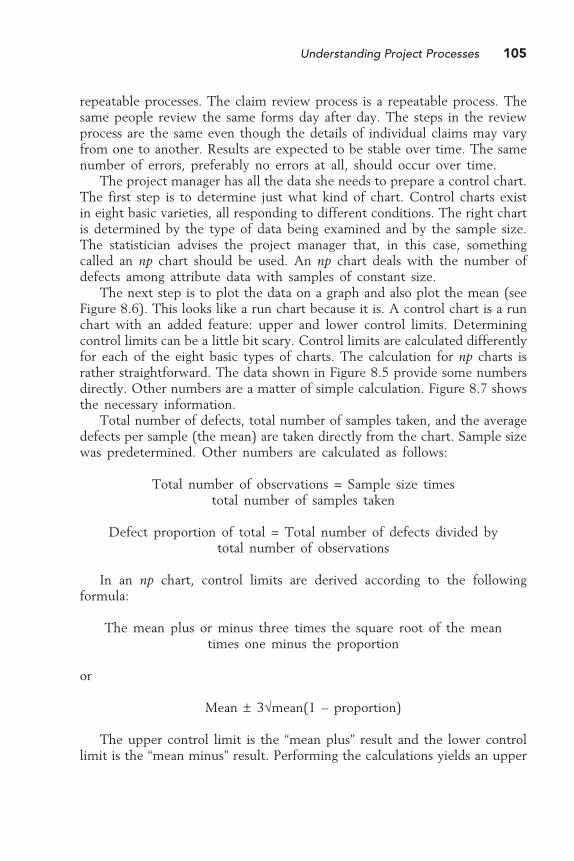
Understanding Project Processes 105
repeatable processes. The claim review process is a repeatable process. Thesame people review the same forms day after day. The steps in the reviewprocess are the same even though the details of individual claims may varyfrom one to another. Results are expected to be stable over time. The samenumber of errors, preferably no errors at all, should occur over time.
The project manager has all the data she needs to prepare a control chart.The first step is to determine just what kind of chart. Control charts existin eight basic varieties, all responding to different conditions. The right chartis determined by the type of data being examined and by the sample size.The statistician advises the project manager that, in this case, somethingcalled an np chart should be used. An np chart deals with the number ofdefects among attribute data with samples of constant size.
The next step is to plot the data on a graph and also plot the mean (seeFigure 8.6). This looks like a run chart because it is. A control chart is a runchart with an added feature: upper and lower control limits. Determiningcontrol limits can be a little bit scary. Control limits are calculated differentlyfor each of the eight basic types of charts. The calculation for np charts israther straightforward. The data shown in Figure 8.5 provide some numbersdirectly. Other numbers are a matter of simple calculation. Figure 8.7 showsthe necessary information.
Total number of defects, total number of samples taken, and the averagedefects per sample (the mean) are taken directly from the chart. Sample sizewas predetermined. Other numbers are calculated as follows:
Total number of observations = Sample size timestotal number of samples taken
Defect proportion of total = Total number of defects divided bytotal number of observations
In an np chart, control limits are derived according to the followingformula:
The mean plus or minus three times the square root of the meantimes one minus the proportion
or
Mean ± 3√mean(1 – proportion)
The upper control limit is the “mean plus” result and the lower controllimit is the “mean minus” result. Performing the calculations yields an upper

106 Project Quality Management: Why, What and How
Fig
ure
8.6
.C
ons
truc
ting
a C
ont
rol
Cha
rt:
Firs
t St
ep.
02468
10
12
14
16
18
20
Sa
mp
le
Number of defects Def
ects
178
910
67
916
710
148
68
1611
511
129
MA
MB
MC
MD
TAT
BT
CT
DW
AW
BW
CW
DTh
ATh
BT
hCT
hDFA
FB
FC
FD
Mea
n
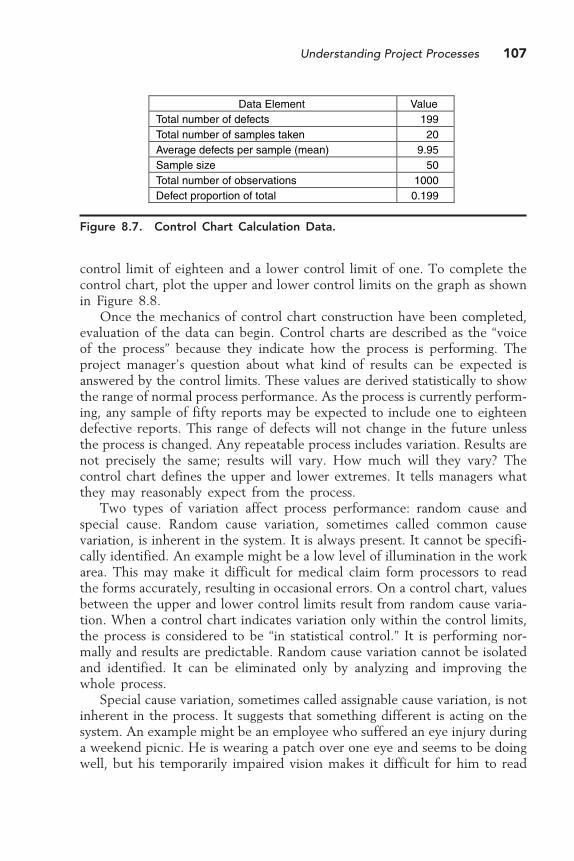
Understanding Project Processes 107
control limit of eighteen and a lower control limit of one. To complete thecontrol chart, plot the upper and lower control limits on the graph as shownin Figure 8.8.
Once the mechanics of control chart construction have been completed,evaluation of the data can begin. Control charts are described as the “voiceof the process” because they indicate how the process is performing. Theproject manager’s question about what kind of results can be expected isanswered by the control limits. These values are derived statistically to showthe range of normal process performance. As the process is currently perform-ing, any sample of fifty reports may be expected to include one to eighteendefective reports. This range of defects will not change in the future unlessthe process is changed. Any repeatable process includes variation. Results arenot precisely the same; results will vary. How much will they vary? Thecontrol chart defines the upper and lower extremes. It tells managers whatthey may reasonably expect from the process.
Two types of variation affect process performance: random cause andspecial cause. Random cause variation, sometimes called common causevariation, is inherent in the system. It is always present. It cannot be specifi-cally identified. An example might be a low level of illumination in the workarea. This may make it difficult for medical claim form processors to readthe forms accurately, resulting in occasional errors. On a control chart, valuesbetween the upper and lower control limits result from random cause varia-tion. When a control chart indicates variation only within the control limits,the process is considered to be “in statistical control.” It is performing nor-mally and results are predictable. Random cause variation cannot be isolatedand identified. It can be eliminated only by analyzing and improving thewhole process.
Special cause variation, sometimes called assignable cause variation, is notinherent in the process. It suggests that something different is acting on thesystem. An example might be an employee who suffered an eye injury duringa weekend picnic. He is wearing a patch over one eye and seems to be doingwell, but his temporarily impaired vision makes it difficult for him to read
Figure 8.7. Control Chart Calculation Data.
Data Element ValueTotal number of defectsTotal number of samples takenAverage defects per sample (mean)Sample sizeTotal number of observationsDefect proportion of total
19920
9.9550
10000.199
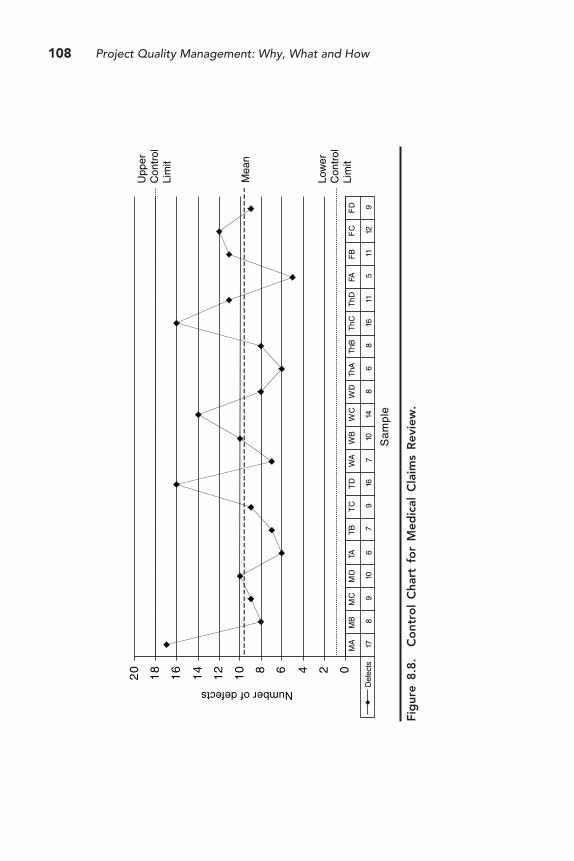
108 Project Quality Management: Why, What and How
Fig
ure
8.8
.C
ont
rol
Cha
rt f
or
Med
ical
Cla
ims
Rev
iew
.
02468
10
12
14
16
18
20
Sa
mp
le
Number of defects Def
ects
178
910
67
916
710
148
68
1611
511
129
MA
MB
MC
MD
TAT
BT
CT
DW
AW
BW
CW
DTh
ATh
BT
hCT
hDFA
FB
FC
FD
Mea
n
Low
erC
ontr
ol
Lim
it
Upp
erC
ontr
olLi
mit
Understanding Project Processes 109
the medical claim forms accurately, resulting in occasional errors. On a controlchart, values that lie outside the control limits result from special causevariation. When a control chart indicates values outside the control limits,the process is considered to be out of statistical control. The sources of specialcause variation can and must be identified and eliminated to bring the processback into control. A process out of control will not produce predictableresults and managers will have no idea about what to expect.
Exercise — Try this exercise as a demonstration of random causeand special cause variation. On a blank sheet of lined paper, writethe capital letter “A” repeatedly along one line. Make all the letterslook exactly alike. All the letters should be the same height, theangle between the sides should be the same, the horizontal lineconnecting the sides should be parallel with the line on the paper,and all horizontal lines should be exactly the same distance abovethe line on the paper. After you are finished, critically examinethe result. Are all the letters exactly the same? Probably not, eventhough you tried your hardest to make them so. The minisculedifferences result from random cause variation. You do not knowwhat causes the differences; that is just the way it is.
Now prepare to write another line of letters just below thefirst. Make this second row look exactly like the first. But beforeyou begin, move your pen or pencil to your other hand. Aftercompleting a line of letters, examine the results. Is the second rowexactly like the first? Probably not. And is there a greater degreeof variation among the letters in the second row? Probably so. Thedifferences in the second row result from special cause variation.Something different was acting on the process. You changed handsand were now using your nondominant hand to write the letters,causing a greater degree of variation.
Interpreting a control chart is rather simple. Data points that lie outsidethe control limits suggest special cause variation and require investigation.Data points that lie within the control limits suggest random cause variationand require no investigation, except for some unusual exceptions. In practice,evaluation is a little more complex than as described here. One additionalthing to keep in mind is the “rule of seven.” Seven consecutive data pointsprogressing in one direction either up or down, or seven consecutive pointson the same side of the mean, suggest that special cause variation is affectingthe process even though the data points lie between the control limits. It isstatistically unlikely that seven consecutive data points will occur in thismanner. Such a situation should be investigated to determine if somethingis acting on the process and producing special cause variation.
110 Project Quality Management: Why, What and How
Using control charts includes four steps:
1. Collect initial data. This will be the baseline data for the process.2. Create the control chart. Plot the data. Calculate and plot the mean
and the upper and lower control limits.3. Enter new data. This is the key. A control chart is not just a snapshot
of collected data. It is a tool for use over time to ensure that theprocess remains in statistical control. Using the mean and controllimits established by the baseline data, enter new data points anddetermine if they lie within or outside the control limits.
4. Do not change the control limits based on new data unless the processchanges. The control chart is the voice of the process. Do not try tochange the voice unless you change the process. Completion of aprocess improvement effort to reduce random cause variation wouldbe a reason to collect new data and establish a new mean and newcontrol limits.
Control limits are established by data, not by management direction. Amanager at JMS who is unfamiliar with control charts may look at the chartand decide that eighteen possible defective claim forms are too many. Thatmanager might decide to establish the upper control limit at fifteen in aneffort to improve performance. The intent is good, but the action is bad.Control charts define process performance; they are the voice of the process,but managers or customers may not be satisfied with process performance.Either may decide that they want to see fewer defects than indicated by thecontrol charts. In so doing, they are establishing a specification that processperformance is expected to meet. Specifications define customer require-ments; they have been called the “voice of the customer.”
Suppose JMS just received a letter from its largest client, an insurancecompany whose claims make up 60 percent of the claim form processingbusiness. The client has expressed dissatisfaction with JMS’s performance,citing an unacceptable level of complaints about processing times from itspolicyholders. The client has indicated that if performance does not improve,it will take its business elsewhere. JMS asks the project manager for advice.
The project manager understands that the insurance company does nothave access to JMS performance data, so it could not provide a specific goal.It just wants things to be better. The project manager also realizes that majorimprovement may not occur overnight. She establishes a goal, a specifica-tion, of no more than fifteen defective reports in any sample of fifty as aninitial target. She plots this specification on her control chart, as shown inFigure 8.9.
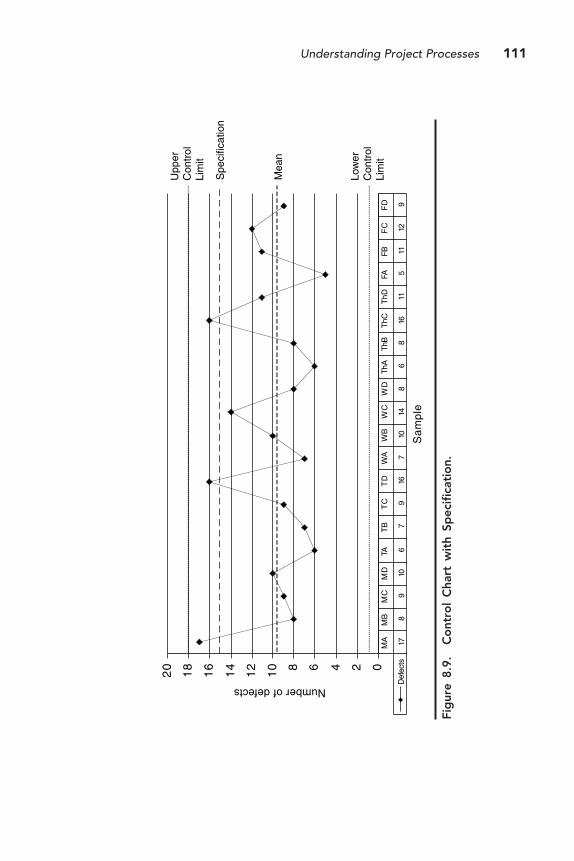
Understanding Project Processes 111
Fig
ure
8.9
.C
ont
rol
Cha
rt w
ith
Spec
ific
atio
n.
02468
10
12
14
16
18
20
Sa
mp
le
Number of defects Def
ects
178
910
67
916
710
148
68
1611
511
129
MA
MB
MC
MD
TAT
BT
CT
DW
AW
BW
CW
DTh
ATh
BT
hCT
hDFA
FB
FC
FD
Mea
n
Spe
cific
atio
n
Low
erC
ontr
ol
Lim
it
Upp
erC
ontr
olLi
mit
112 Project Quality Management: Why, What and How
The control chart now shows that the process is guaranteed to produceunacceptable results. The process is in control, it is performing predictably,but it is not performing according to specifications. It is producing a certainamount of unacceptable defects; that is, sixteen, seventeen, or eighteendefective claim forms per sample of fifty. The statistician informs the projectmanager that even the degree of defect is predictable — what percentage ofthe time defects of sixteen to eighteen will occur. When desired specificationlimits lie inside control limits, the process is considered to be in control, butnot “capable.” The statistician also informs the project manager that addi-tional formulas are available to analyze process capability. The project man-ager decides that additional analysis is not necessary at this point. She workswith the project team to prepare a recommended process improvement actionfor JMS that will identify and reduce sources of defects and change perfor-mance to the degree that any sample of fifty may be expected to include lessthan fifteen defective reports. The goal is to improve process performance,then collect new data that will show a new mean and new control limits thatlie within specification limits, guaranteeing acceptable process performance.
The project manager did not recommend that JMS send its slickest sales-person over to the client to convince them to accept JMS’s current perfor-mance. When there is a difference between the voice of the process (whatthe control chart reflects) and the voice of the customer (what the specifi-cation reflects), the voice of the process must always be changed to matchthe voice of the customer. The process must always be improved to meetcustomer specifications and expectations. Some may be tempted to “sell theclient” the current process, to convince the client that it is as good as it canbe, that the client must accept current performance. Such an approacheventually fails. Any initial agreement fades over time as frustration anddissatisfaction continue. Dissatisfied customers eventually seek other sources.
Control charts may be constructed quickly using a shortcut for determin-ing the control limits. Recall from the discussion of Six Sigma in Chapter 3that three standard deviations (3σ) above and below the mean account for99.73 percent of the data under a normal curve. A quick way to create acontrol chart is to plot the data, plot the mean, and then set the control limitsat 3σ above and below the mean. These control limits encompass 99.73percent of the data, close enough to 100 percent for quality managementpurposes. Standard deviation may be easily calculated from the collected datausing any handheld calculator with resident statistical functions. This methodmay not be as precise as the more rigorous methods that use more complexformulas. For example, the rigorous method applied to medical claim formdata produced an upper control limit of 18.41. The 3σ method applied tothe same data produces an upper control limit of 20.45. Wider control limitssuggest a greater number of normal errors, which could be misleading tothose seeking process improvement because more data are accepted as ran-
Understanding Project Processes 113
dom cause variation. The rigorous methods are not very complex. Theyshould be applied when possible.
Summary� Flow charts identify the sequence of events in a process. They allow
analysis of where errors might occur. A small set of commonly usedsymbols provides significant capability.
� Run charts show process performance over time. They are applied torepeatable processes in which results are expected to be consistent. Runcharts show how data vary around a centerline, usually a mean.
� Control charts also show performance over time. They are run chartswith added upper and lower control limits that allow monitoring, con-trolling, and improving processes over time.
� Control charts use sample data. Eight different types of control chartsmay be applied to process analysis. The type of chart is determined bythe type of data and sample size.
� Control limits may be established through rigorous mathematical calcu-lations or by setting them equal to 3σ above and below the mean.
� Data that lie within control limits result from random cause variation.This kind of variation is inherent in the system and can be reduced onlyby improving the whole process. When all data lie within control limits,the process is in statistical control and results are predictable.
� Data that lie outside control limits result from special cause variation.This kind of variation can and must be identified and removed to bringthe process back into statistical control.
� Managers or customers may establish specification limits for processperformance. If the specification limit is inside the control limit, theprocess is guaranteed to produce defective results. Processes must beimproved so that control limits are inside specification limits, guarantee-ing acceptable process performance.


115
9Analyzing
Project Processes
Having achieved an understanding of data and processes, project managersare ready to analyze processes and solve problems. Merely understanding aprocess is not a sufficient basis for taking action. Action without analysis islimited to precedent, intuition, trial and error, or guesswork about what theboss wants. None of these approaches is likely to yield happy results. Analysisis necessary to determine the system interaction aspects of the process andcause-effect relationships.
Tools for Analyzing ProcessesTwo tools are helpful in analyzing processes. One is a classic tool, proven overmany years of effective use; the other is new.
Cause and Effect DiagramsThis diagram is sometimes called a “fishbone diagram” because of its shapeand sometimes called an “Ishikawa diagram” in honor of its developer, Dr.Kaoru Ishikawa. It is used to identify, explore, and graphically display allpossible causes related to a problem, including root causes. Using a cause andeffect diagram includes four steps:
1. Identify and define the problem. Determine the extent of the problemto be addressed. It is important to establish specific and limited bound-
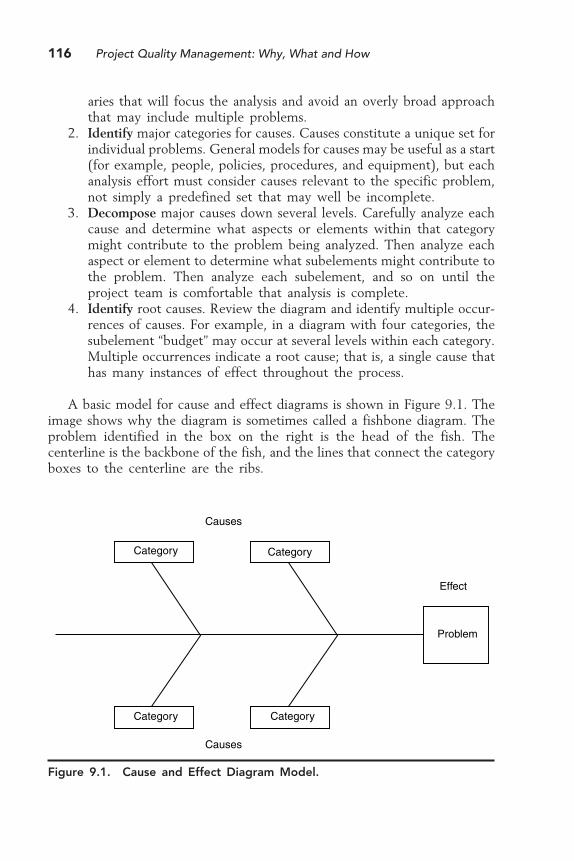
116 Project Quality Management: Why, What and How
aries that will focus the analysis and avoid an overly broad approachthat may include multiple problems.
2. Identify major categories for causes. Causes constitute a unique set forindividual problems. General models for causes may be useful as a start(for example, people, policies, procedures, and equipment), but eachanalysis effort must consider causes relevant to the specific problem,not simply a predefined set that may well be incomplete.
3. Decompose major causes down several levels. Carefully analyze eachcause and determine what aspects or elements within that categorymight contribute to the problem being analyzed. Then analyze eachaspect or element to determine what subelements might contribute tothe problem. Then analyze each subelement, and so on until theproject team is comfortable that analysis is complete.
4. Identify root causes. Review the diagram and identify multiple occur-rences of causes. For example, in a diagram with four categories, thesubelement “budget” may occur at several levels within each category.Multiple occurrences indicate a root cause; that is, a single cause thathas many instances of effect throughout the process.
A basic model for cause and effect diagrams is shown in Figure 9.1. Theimage shows why the diagram is sometimes called a fishbone diagram. Theproblem identified in the box on the right is the head of the fish. Thecenterline is the backbone of the fish, and the lines that connect the categoryboxes to the centerline are the ribs.
Figure 9.1. Cause and Effect Diagram Model.
Problem
CategoryCategory
CategoryCategory
Causes
Causes
Effect
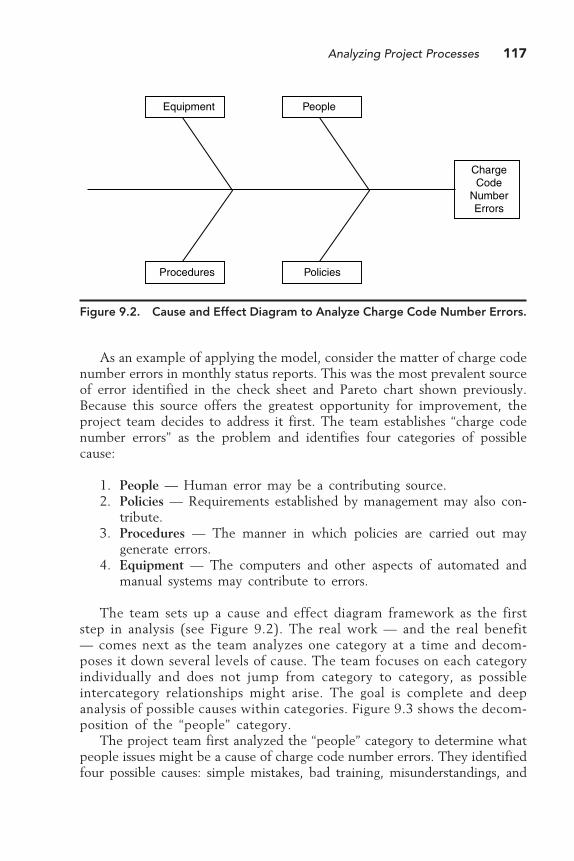
Analyzing Project Processes 117
As an example of applying the model, consider the matter of charge codenumber errors in monthly status reports. This was the most prevalent sourceof error identified in the check sheet and Pareto chart shown previously.Because this source offers the greatest opportunity for improvement, theproject team decides to address it first. The team establishes “charge codenumber errors” as the problem and identifies four categories of possiblecause:
1. People — Human error may be a contributing source.2. Policies — Requirements established by management may also con-
tribute.3. Procedures — The manner in which policies are carried out may
generate errors.4. Equipment — The computers and other aspects of automated and
manual systems may contribute to errors.
The team sets up a cause and effect diagram framework as the firststep in analysis (see Figure 9.2). The real work — and the real benefit— comes next as the team analyzes one category at a time and decom-poses it down several levels of cause. The team focuses on each categoryindividually and does not jump from category to category, as possibleintercategory relationships might arise. The goal is complete and deepanalysis of possible causes within categories. Figure 9.3 shows the decom-position of the “people” category.
The project team first analyzed the “people” category to determine whatpeople issues might be a cause of charge code number errors. They identifiedfour possible causes: simple mistakes, bad training, misunderstandings, and
Figure 9.2. Cause and Effect Diagram to Analyze Charge Code Number Errors.
PeopleEquipment
PoliciesProcedures
ChargeCode
NumberErrors
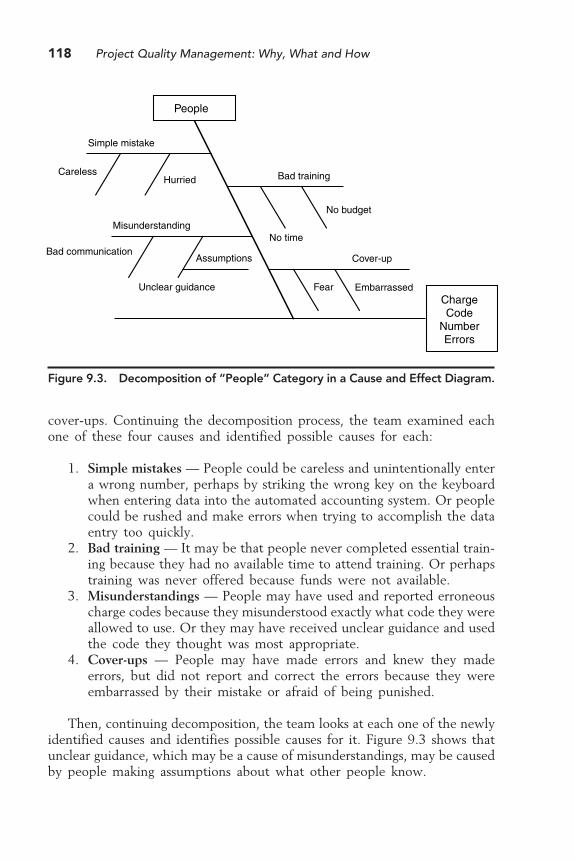
118 Project Quality Management: Why, What and How
cover-ups. Continuing the decomposition process, the team examined eachone of these four causes and identified possible causes for each:
1. Simple mistakes — People could be careless and unintentionally entera wrong number, perhaps by striking the wrong key on the keyboardwhen entering data into the automated accounting system. Or peoplecould be rushed and make errors when trying to accomplish the dataentry too quickly.
2. Bad training — It may be that people never completed essential train-ing because they had no available time to attend training. Or perhapstraining was never offered because funds were not available.
3. Misunderstandings — People may have used and reported erroneouscharge codes because they misunderstood exactly what code they wereallowed to use. Or they may have received unclear guidance and usedthe code they thought was most appropriate.
4. Cover-ups — People may have made errors and knew they madeerrors, but did not report and correct the errors because they wereembarrassed by their mistake or afraid of being punished.
Then, continuing decomposition, the team looks at each one of the newlyidentified causes and identifies possible causes for it. Figure 9.3 shows thatunclear guidance, which may be a cause of misunderstandings, may be causedby people making assumptions about what other people know.
Figure 9.3. Decomposition of “People” Category in a Cause and Effect Diagram.
ChargeCode
NumberErrors
People
CarelessHurried
No budget
No timeBad communication
Unclear guidance EmbarrassedFear
Simple mistake
Bad training
Misunderstanding
Cover-upAssumptions
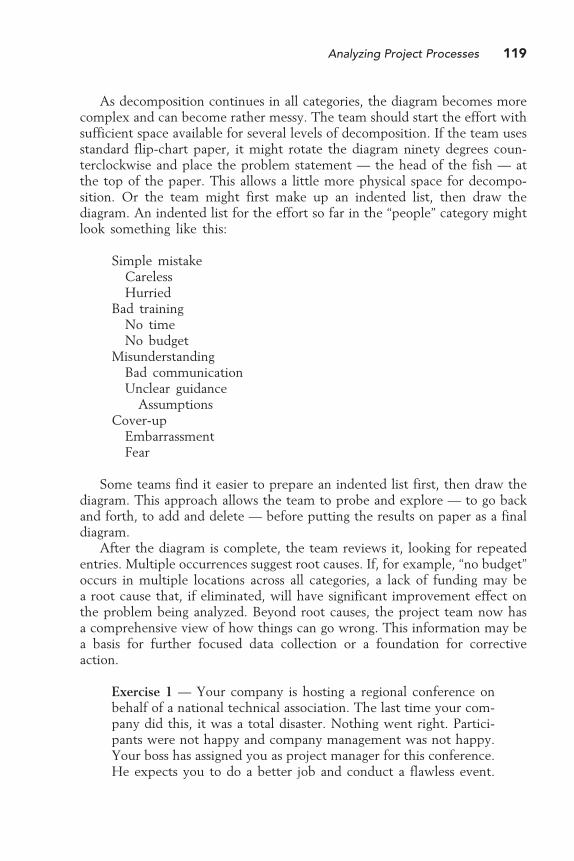
Analyzing Project Processes 119
As decomposition continues in all categories, the diagram becomes morecomplex and can become rather messy. The team should start the effort withsufficient space available for several levels of decomposition. If the team usesstandard flip-chart paper, it might rotate the diagram ninety degrees coun-terclockwise and place the problem statement — the head of the fish — atthe top of the paper. This allows a little more physical space for decompo-sition. Or the team might first make up an indented list, then draw thediagram. An indented list for the effort so far in the “people” category mightlook something like this:
Simple mistakeCarelessHurried
Bad trainingNo timeNo budget
MisunderstandingBad communicationUnclear guidance
AssumptionsCover-up
EmbarrassmentFear
Some teams find it easier to prepare an indented list first, then draw thediagram. This approach allows the team to probe and explore — to go backand forth, to add and delete — before putting the results on paper as a finaldiagram.
After the diagram is complete, the team reviews it, looking for repeatedentries. Multiple occurrences suggest root causes. If, for example, “no budget”occurs in multiple locations across all categories, a lack of funding may bea root cause that, if eliminated, will have significant improvement effect onthe problem being analyzed. Beyond root causes, the project team now hasa comprehensive view of how things can go wrong. This information may bea basis for further focused data collection or a foundation for correctiveaction.
Exercise 1 — Your company is hosting a regional conference onbehalf of a national technical association. The last time your com-pany did this, it was a total disaster. Nothing went right. Partici-pants were not happy and company management was not happy.Your boss has assigned you as project manager for this conference.He expects you to do a better job and conduct a flawless event.

120 Project Quality Management: Why, What and How
To analyze what went wrong with the previous conference, youdecide to meet with a number of people who were involved andprepare a cause and effect diagram. Take some time right now andconstruct the diagram using your personal experience and imagi-nation about what could go wrong in hosting a technical confer-ence. The result in the diagram is “unsuccessful conference.”Consider the following categories, or perhaps others: location,facilities, transportation, program, speakers, food service, proceed-ings, and administration. Try decomposing some categories graphi-cally and others by indented list. Analyze the diagram and deter-mine root causes. (There is no prescribed solution for this exercise.)
Pillar DiagramsA cause and effect diagram is a powerful tool for analyzing a single problemand identifying all the possible causes. Sometimes a project team may wantto analyze a situation in which multiple problems are related to multiplecauses, all of which are generally known or can be identified readily and existin limited number. A pillar diagram (a new quality tool introduced here forthe first time) allows a project team to do just that. A pillar diagram is acombination of a cause and effect diagram and another quality tool, theinterrelationship digraph. It addresses multiple problems (a cause and effectdiagram addresses just one) and it shows relationships among a limited setof causes and results. An interrelationship digraph is used to determine re-lationships among all contributing elements of a system. The purpose of apillar diagram is to identify root causes related to multiple results. To createa pillar diagram:
1. Build the pillars by identifying results, then causes. Results and causesare represented by boxes stacked on top of one another, resemblinga pillar.
2. Connect causes to relevant results using arrows. Analyze each causeagainst each result in successive pair-wise comparisons. If there is arelevant relationship from the cause to the result, connect the causebox to the result box with an arrow.
3. Count the “out” arrows for each cause.4. Identify root causes. Causes with the most arrows are root causes; that
is, causes that influence the most results.
An example of how a pillar diagram might be used to analyze multiplecauses and results related to late monthly status reports is shown in Figure9.4.

Analyzing Project Processes 121
To build the chart, the project team first determined what results wouldbe analyzed. From the previously prepared check sheet and Pareto chart, theteam decided to consider errors related to billing or payment. Errors relatedto charge code numbers and charges for labor, travel, materials, and otherdirect costs generate billing errors. Late submissions or missing attachmentsmay cause the report to be returned for correction and delay payment. Theteam determined that errors related to date, period covered, and number ofcopies may have been one-time errors and did not include these in the pillardiagram analysis.
Next, the team considered what possible causes might be affecting theprocess. They identified the five causes shown in Figure 9.4. Then theyanalyzed each cause against each result and determined if a causal relationshipexisted between the two. If a relationship seemed apparent, they drew anarrow from the cause to the result. Counting the number of “out” arrows foreach cause showed that two causes, bad input and computation errors, seemedto have the most influence on results and were, therefore, root causes. Processimprovement actions to remove these two causes should produce significantimprovement in performance.
The pillar diagram does not allow deep analysis of cause. It is not adecomposition tool like the cause and effect diagram. Subsequent analysisusing a cause and effect diagram may be necessary before taking effectiveimprovement action. For example, it may be necessary to analyze “bad input”further to identify root causes within that cause. Charge code and billing data
Figure 9.4. Pillar Diagram for Late Monthly Status Reports.
Charge code number error
Missing attachments
Late submission
Hours billed error
Materials charge error
Travel charge error
Other direct cost error
Wrong guidance
Bad input
Excessive workload
Computation error
Human error
CAUSES RESULTS
122 Project Quality Management: Why, What and How
for the monthly status report are not collected from original sources. Theyare taken from the monthly invoice already prepared by the accounting office.This ensures consistency between the invoice and the monthly status report.Any errors in the invoice are transferred directly to the monthly status report.The invoice may be identified as a source of input error, but further analysiswill be necessary to determine the sources of erroneous invoice data. A causeand effect diagram would be an ideal tool for this additional analysis.
When analyzing causes, sometimes the degree of influence is more im-portant than the number of results affected. It may be that all causes are ofgenerally equal influence, but “wrong guidance” is far more influential be-cause it sets in motion multiple billing errors that occur because of a basiccharge code number error. When degree of influence is a concern, weightsmay be assigned to cause-result relationships as follows:
1 = low influence3 = moderate influence9 = high influence
This hierarchy of 1, 3, and 9 is drawn from a comprehensive quality toolcalled quality function deployment. The value of 3 should be used as a base,with cause-result relationships determined to be less influential assigned avalue of 1 and cause-result relationships determined to be more influentialassigned a value of 9. The values of “out” arrows for each cause should beadded together and the sum divided by the total value of all arrows. Theresult is a percentage of influence for each cause that may, in some cases,identify root causes that are different from those identified by the numberof relationships (arrows) alone. Now, a high percentage rather than a highnumber of arrows suggests root causes, those that have the greatest influenceon results.
This method of applying a pillar diagram addresses the value of causes.It does not address the value of results. That is a different issue and shouldbe addressed with different tools, perhaps a Pareto chart in which the defectsare considered by their value rather than their number, as explained earlier.
Summary� Analyzing processes is an essential step before taking improvement action.� A cause and effect diagram is used to identify, explore, and graphically
display all possible causes related to a single problem. It is sometimescalled a fishbone diagram because of its distinctive shape or an Ishikawadiagram in honor of its inventor.

Analyzing Project Processes 123
� A cause and effect diagram includes several categories of causes, deter-mined by the problem being analyzed. Basic categories useful to projectmanagers for analyzing processes include people, policies, procedures,and equipment. Categories are decomposed down several levels in a tree-like structure.
� In a cause and effect diagram, multiple occurrences of a single causesuggest it is a root cause. Eliminating root causes will have significantimprovement effect across the process.
� Cause and effect diagrams may be constructed graphically or may beprepared first as an indented list, with the graphic being constructed afterall causes have been identified.
� A pillar diagram is a new quality tool that may be used to identify rootcauses related to multiple results.
� A pillar diagram is created by graphically stacking multiple results andcauses in columns that resemble pillars. Causes are then analyzed againsteach result. If a relationship exists, arrows are drawn from the cause tothe result.
� Causes with the highest number of “out” arrows” are the most significantcauses, those that have the most influence on results.
� If cause-result relationships have different degrees of influence on a process,a pillar diagram may be constructed with weights of 1, 3, or 9 assignedto relationships to reflect low, moderate, or high influence, respectively.
� Pillar diagrams address causes and their influence on results. They do notaddress the value of results.

125
10Solving
Project Problems
Collecting data, understanding and analyzing data, and analyzing processesare important. They are important as preparatory steps for taking action.These steps alone do not guarantee quality. Eventually, a project managermust do something. Much anecdotal guidance exists regarding action. Thefollowing may be familiar to many.
� “Do something. Even if it’s wrong, do something.” (A bias for action.)� “It’s better to ask for forgiveness than to ask for permission.” (Do not
wait for approval from others; act now.)� “If you understand 80 percent of a problem, you have enough infor-
mation to act.” (Do not procrastinate. You will never have completeinformation.)
Taking action is necessary and good. Not taking the right action can leadto the classic excuse “It seemed like a good idea at the time.”
Tools for Solving ProblemsFour quality tools help a project manager determine the right action. Takentogether, these tools constitute a progressive set that supports understandingof the organizational environment and supports generating, organizing, andprioritizing actions.
126 Project Quality Management: Why, What and How
Force Field AnalysisKurt Lewin (pronounced la-veen) was a social psychologist who was activeand highly influential in the United States during the 1940s. He developedT-groups (the foundation for contemporary team building) and the “unfreeze-movement-refreeze” model of organizational change. He also developed forcefield analysis, a disciplined way of identifying forces and factors that help orhinder problem solving.
In Lewin’s view, powerful forces that influence change are at play withinany organization. These forces are of two types: those that help or enablechange and those that hinder or restrain change. If you want to effect somekind of change within an organization, you must first identify and understandthe forces at play and then use them in some advantageous way. Force fieldanalysis is a method for doing this that includes five steps:
1. Define the challenge. Establish the scope of the analysis. The challengemay be very broad or it may be specific.
2. Identify helping and hindering forces. Consider the organization’soperating environment. Determine what aspects of the environmentmight push the organization toward change and what aspects mightstand as barriers to change.
3. Assume the forces are in balance. The opposing forces that may helpor hinder change are probably in a state of equilibrium. That is whythe organization is where it is at the current time; the forces thatinfluence change are balanced.
4. Develop action plans to change the balance of forces. Changing thebalance of opposing forces will break the equilibrium and allow changeto occur.
5. Change the balance. Take the actions planned and pursue the desiredchange.
Force field analysis employs a simple graphic tool to organize the stepsand capture the information for use. The example shown in Figure 10.1addresses an organizational change — improving the quality of monthly statusreports.
The challenge is entered at the top of the chart. Helping and hinderingforces are entered in two columns below. Forces are entered in no particularorder and there is no relationship between forces that may be listed acrossfrom each other on the chart. When forces are entered on the chart, theyare assigned a value from one to five, with one meaning “not too influential”and five meaning “very influential.” The values are determined by the projectteam, either by consensus or simply by the judgment of the individual whosuggested the force.
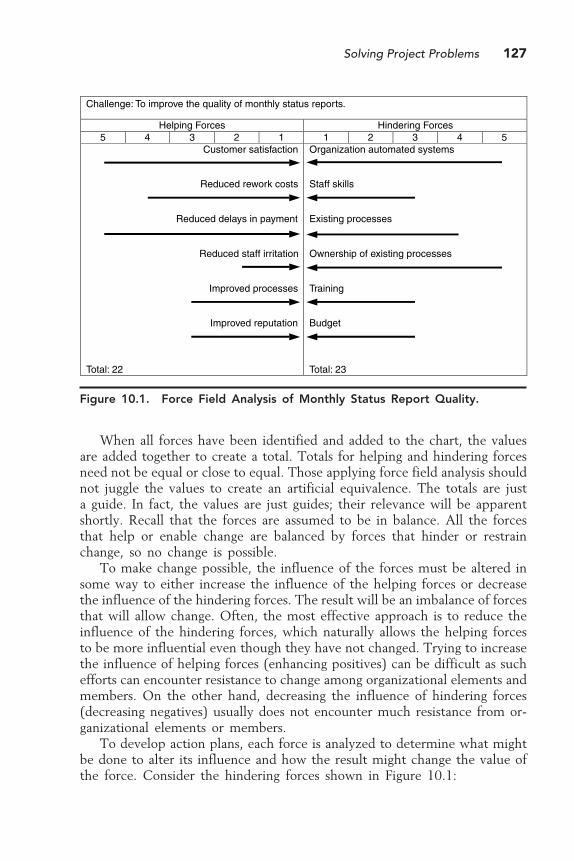
Solving Project Problems 127
When all forces have been identified and added to the chart, the valuesare added together to create a total. Totals for helping and hindering forcesneed not be equal or close to equal. Those applying force field analysis shouldnot juggle the values to create an artificial equivalence. The totals are justa guide. In fact, the values are just guides; their relevance will be apparentshortly. Recall that the forces are assumed to be in balance. All the forcesthat help or enable change are balanced by forces that hinder or restrainchange, so no change is possible.
To make change possible, the influence of the forces must be altered insome way to either increase the influence of the helping forces or decreasethe influence of the hindering forces. The result will be an imbalance of forcesthat will allow change. Often, the most effective approach is to reduce theinfluence of the hindering forces, which naturally allows the helping forcesto be more influential even though they have not changed. Trying to increasethe influence of helping forces (enhancing positives) can be difficult as suchefforts can encounter resistance to change among organizational elements andmembers. On the other hand, decreasing the influence of hindering forces(decreasing negatives) usually does not encounter much resistance from or-ganizational elements or members.
To develop action plans, each force is analyzed to determine what mightbe done to alter its influence and how the result might change the value ofthe force. Consider the hindering forces shown in Figure 10.1:
Figure 10.1. Force Field Analysis of Monthly Status Report Quality.
Challenge: To improve the quality of monthly status reports.
Helping Forces Hindering Forces5 4 3 2 1 1 2 3 4 5
Customer satisfaction
Reduced rework costs
Reduced delays in payment
Reduced staff irritation
Improved processes
Improved reputation
Total: 22
Organization automated systems
Staff skills
Existing processes
Ownership of existing processes
Training
Budget
Total: 23

128 Project Quality Management: Why, What and How
� Organization automated systems — Systems could be improved toallow edit checks for data entry and to allow electronic transfer of datafrom one report to another without human intervention that mightbe a source of errors. (Reduce influence from five to three.)
� Staff skills — Training could be applied that would improve staff skillsin making decisions about data to be entered and in using the auto-mated systems. (Reduce influence from three to one.)
� Existing processes — Process improvement could be applied thatwould reduce the opportunity for errors and allow identifying errorsbefore they go into a final report. (Reduce influence from four toone.)
� Ownership of existing processes — This is a nice way to describe thesituation where people want to do what they want to do because itis their area of responsibility. It is a difficult situation to address.Perhaps an effort to broaden the view of organizational elements tothe degree that people understand better how their piece contributesto the whole may be effective. (Reduce influence from five to four.)
� Training — Training is a hindering force because nobody has the timefor it and nobody wants to pay for it. Management support anddirective may make training an obligation rather than an option.(Reduce influence from three to one.)
� Budget — Everything has a cost, and the matter of who will bear thecost of improvement is not trivial. Management support can makededicated funds available for essential improvement activities. (Re-duce influence from three to one.)
The results of this analysis and planned actions are shown in Figure 10.2by the dashed-line arrows. The total value of the influence of the hinderingforces is now eleven rather than twenty-three. This is a significant decreasethat will result in a corresponding increase in the influence of the helpingforces. The result should be an overall ability to take effective change actionsin areas related to helping forces because such action will not bump againstbalancing hindering forces that act to maintain the status quo. Note that thevalues assigned to the forces serve only as a guide. A planned action toreduce the hindering influence of staff skills may be expected to have ben-eficial effect that is expressed as a reduction of the influence level from threeto one. The total value of eleven is only an expression of the degree ofimprovement. It shows that the balance of helping-hindering forces haschanged significantly; the forces are no longer in balance and change shouldbe possible.
Exercise 1 — Consider the challenge “improve organization qual-ity” and conduct a force field analysis using your own work ex-
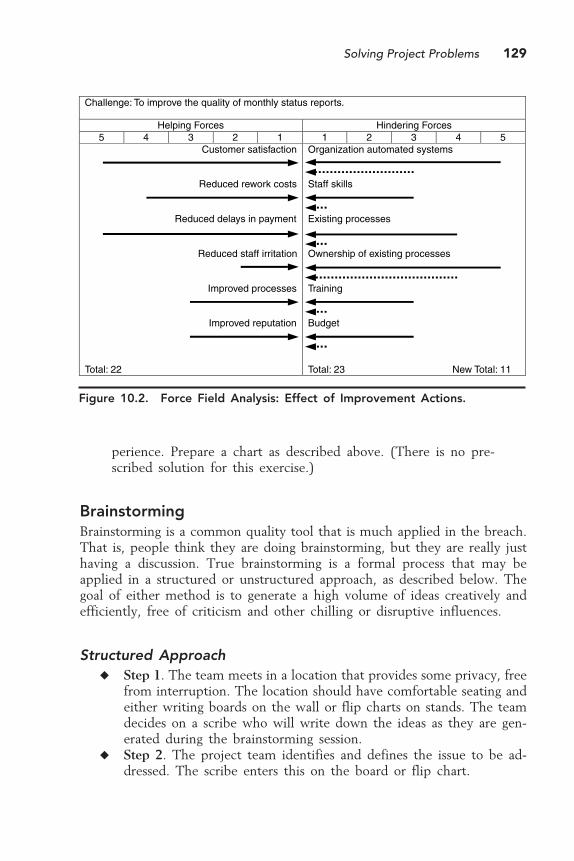
Solving Project Problems 129
perience. Prepare a chart as described above. (There is no pre-scribed solution for this exercise.)
BrainstormingBrainstorming is a common quality tool that is much applied in the breach.That is, people think they are doing brainstorming, but they are really justhaving a discussion. True brainstorming is a formal process that may beapplied in a structured or unstructured approach, as described below. Thegoal of either method is to generate a high volume of ideas creatively andefficiently, free of criticism and other chilling or disruptive influences.
Structured Approach� Step 1. The team meets in a location that provides some privacy, free
from interruption. The location should have comfortable seating andeither writing boards on the wall or flip charts on stands. The teamdecides on a scribe who will write down the ideas as they are gen-erated during the brainstorming session.
� Step 2. The project team identifies and defines the issue to be ad-dressed. The scribe enters this on the board or flip chart.
Figure 10.2. Force Field Analysis: Effect of Improvement Actions.
Challenge: To improve the quality of monthly status reports.
Helping Forces Hindering Forces5 4 3 2 1 1 2 3 4 5
Customer satisfaction
Reduced rework costs
Reduced delays in payment
Reduced staff irritation
Improved processes
Improved reputation
Total: 22
Organization automated systems
Staff skills
Existing processes
Ownership of existing processes
Training
Budget
Total: 23 New Total: 11
130 Project Quality Management: Why, What and How
� Step 3. Team members present ideas, going around the team in round-robin fashion. Each team member presents only one idea. Then it isthe next member’s turn. The scribe writes the idea on the board orflip chart.
� Note: No criticism, clarification, prioritization, or discussion of anykind is allowed. Any of these may disrupt the flow and possiblybog down the team in fruitless, wandering discussion.
� Step 4. Team members may “pass” if they do not have an idea whentheir turn comes around. This does not exclude them from furtherparticipation. Intervening ideas presented by others may stimulatethought that may generate an idea on the next go-round.
� Step 5. When all team members pass in succession, the idea genera-tion is over. The team may now review the ideas generated and clarifyany fine points or perhaps remove duplicates. Teams should exercisegreat care in removing any ideas from the list as duplicates. What mayseem like duplication may, in fact, be a different idea based on anuance of meaning of the suggestor.
� Step 6. After tidying up the list, the brainstorming session is finished,with the result being a list of ideas that address the subject issue.
Unstructured Approach� Step 1. The team meets in a location that provides some privacy, free
from interruption. The location should have comfortable seating andeither writing boards on the wall or flip charts on stands. The teamdecides on a scribe who will write down the ideas as they are gen-erated during the brainstorming session.
� Step 2. The project team identifies and defines the issue to be ad-dressed. The scribe enters this on the board or flip chart.
� Step 3. Team members call out ideas as the ideas occur to them.There is no need to wait their turn. Members are not limited in thenumber of ideas they may present at one time. If someone has twentyideas and can get them all out without taking a breath, so be it. Thescribe writes the ideas on the board or flip chart, trying to keep upwith the flow of ideas.� Note. No criticism, clarification, prioritization, or discussion of
any kind is allowed. Any of these may disrupt the flow andpossibly bog down the team in fruitless, wandering discussion.This constraint may be harder to observe in the unstructuredapproach because of the free-for-all aspect of participation.
� Step 4. Eventually, everyone will run out of ideas. When the partici-pation is clearly finished, not just at a lull, the idea generation is over.
Solving Project Problems 131
This point should be determined by team consensus, not by directionof one particular participant.
� Step 5. The team may now review the ideas generated and clarify anyfine points or perhaps remove duplicates. Teams should exercise greatcare in removing any ideas from the list as duplicates. What may seemlike duplication may, in fact, be a different idea based on a nuanceof meaning of the suggestor.
� Step 6. After tidying up the list, the brainstorming session is finished,with the result being a list of ideas that address the subject issue.
The two approaches, structured and unstructured, offer different advan-tages and disadvantages. A structured approach allows everyone to take a turnand prevents one person from monopolizing the session. It allows time forindividual thought and reflection as participants await their next turn. It mayproduce better-formed ideas. A structured approach may also make peopleparticipate who otherwise might sit silently by as others generate all the ideas.Those who might be rather reserved or who might feel that nobody listensto their ideas anyway now have a dedicated time in the spotlight, a time whenthey hold the floor and everyone else is obligated to listen. The disadvantageis that this very deliberate approach may not release creative energy. It maygive people a chance to “think twice” and offer more cautious ideas or evenwithhold ideas that, in a more spontaneous approach, they would throw outfor consideration. All participants must keep in mind that creativity is acommon rule in both approaches. No idea is too wild, too silly, or toounconventional for consideration.
The unstructured approach allows an element of spontaneity and mayresult in more creative ideas. People are not restricted to waiting their turnand, as a result, things can get a bit raucous. This is good. It may be just whatis needed to break the bonds of conventional thinking and open the doorsto new ideas, no matter how wild and crazy they may seem initially. Withno control on who speaks when, the potential exists that one especiallygregarious or perhaps overbearing individual may monopolize the session. Inpractice, this is seldom the case. Even when they are on a rant, people runout of steam. Given the unconstrained nature of the session, a slight pauseis all other participants need to jump in with their own ideas. Rules ofdecorum and courtesy should be relaxed without offense to allow an ener-getic, free flow of ideas.
The greater danger (and the greatest disadvantage) of the unstructuredapproach is that the session might degenerate into a meandering discussion.People who are free to jump in any time with new ideas may feel free tocriticize or comment on ideas suggested by others. After all, there are norules, right? Wrong. The team must decide up front and agree throughout
132 Project Quality Management: Why, What and How
the session to observe the rule about no criticism, clarification, prioritization,or discussion during idea generation.
The results of both approaches are generally the same: a list of ideas. Ideasgenerated through the structured approach may be better defined. Ideasgenerated through the unstructured approach may be more creative. In practice,the number of ideas generated by either approach is about the same. Sowhich approach should a team use? It depends on the preference of the team.If team members are more deliberate and reserved in their personal interac-tions, a structured approach may be better. If team members tend to be quickto respond and are more outgoing in their personal interaction, an unstruc-tured approach may be better. The team should decide among itself whatapproach to use in brainstorming.
Exercise 2 — Within your own project team, find an excuse togenerate some ideas about an issue using the brainstorming tech-niques described here. Try both a structured approach and anunstructured approach. Explain the difference to the team aheadof time. After you have tried both, discuss the experiences withinthe team. Decide if one works better than the other. Decide if theideas generated are different or better than the kinds of ideasgenerated through usual team practice if that usual practice differsfrom the techniques described here.
Affinity DiagramsYou must remember this: A list is just a list. Having generated a list of ideasthrough brainstorming, the project team must now make some sense out ofit. Ideas are probably listed helter-skelter on the board or flip chart in theorder that they were generated. An affinity diagram is a quality tool that isused to organize and summarize unstructured issues or ideas. Recall the taskmanager, who just received another “see me” note from the project manager.
TM: Hey Bob…PM: Jim, you need to do something for me, and quick. When
the corporate quality director was here last week — you were onthe site visit that day — she said she wanted some ideas from thetrenches on how to improve quality. So she had a brainstormingsession with your team…
TM: Yeah, I heard…PM: …that generated this list of ideas. Well, she took it with
her and I thought that was the end of it. Then I get this note fromthe program manager that says he got the list from the VP foroperations. He attached the list and asked me what I’m doing

Solving Project Problems 133
about it. Hey…it’s just a list of ideas that go all over the place.I don’t even know what it means, let alone what to do about it.
TM: Relax, Bob. I know this hit you cold, but I’ve got a qualitytool that is just perfect for this. It’s called an affinity diagram. Ican see you are really pressed here. I’ll go see what my people areup to and try to get back to you in a couple of hours with someanswers.
PM: Good! Go!
The list the task manager received was the classic output from a brain-storming session: a list of widely differing ideas with no suggestion of order(see Table 10.1). The task manager looks over the list and notices some thingsthat he has found that are typical of brainstorming results. The early ideasare very broadly stated. The ideas toward the middle get a little bolder, theyeven show a little frustration, and the ideas at the end are rather blunt. Hechecks with the team and discovers that everyone is available for a shortmeeting. He assembles the team in the conference room and explains thatan affinity diagram is a quality tool for organizing and summarizing unstruc-tured ideas and issues, exactly the tool to apply to the brainstorming list totry and make some sense of it. He explains the five steps of the affinitydiagramming process:
1. Write each idea on a “sticky note” (a small note-size piece of paperwith a lightly adhesive back) and stick all the notes on the wall or aflip chart.
Table 10.1. Brainstorming Results: How to Improve Quality.
1. Improve leadership2. Get better requirements3. Develop a training plan4. Make rewards fair5. Improve senior management skills6. Improve project management7. Develop a project management methodology8. Increase training budget9. Train new hires
10. Listen to employees11. Solicit employee suggestions12. Follow established procedures13. Develop training for new processes14. Send managers to training15. Stop punishing honest mistakes16. Improve performance controls17. Stop the training “guilt trip”
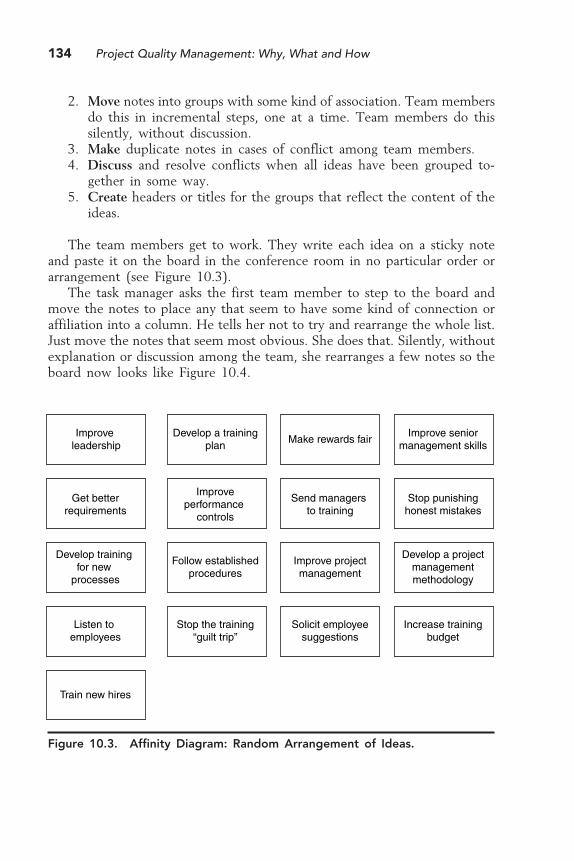
134 Project Quality Management: Why, What and How
2. Move notes into groups with some kind of association. Team membersdo this in incremental steps, one at a time. Team members do thissilently, without discussion.
3. Make duplicate notes in cases of conflict among team members.4. Discuss and resolve conflicts when all ideas have been grouped to-
gether in some way.5. Create headers or titles for the groups that reflect the content of the
ideas.
The team members get to work. They write each idea on a sticky noteand paste it on the board in the conference room in no particular order orarrangement (see Figure 10.3).
The task manager asks the first team member to step to the board andmove the notes to place any that seem to have some kind of connection oraffiliation into a column. He tells her not to try and rearrange the whole list.Just move the notes that seem most obvious. She does that. Silently, withoutexplanation or discussion among the team, she rearranges a few notes so theboard now looks like Figure 10.4.
Figure 10.3. Affinity Diagram: Random Arrangement of Ideas.
Train new hires
Listen to employees
Stop the training“guilt trip”
Solicit employeesuggestions
Increase trainingbudget
Develop training for new
processes
Follow establishedprocedures
Improve projectmanagement
Develop a projectmanagementmethodology
Get betterrequirements
Improveperformance
controls
Send managers to training
Stop punishinghonest mistakes
Improve leadership
Develop a trainingplan
Make rewards fairImprove senior
management skills

Solving Project Problems 135
The task manager then invites the second team member to step to theboard and try to make some associations among the tasks. She moves somenotes so the board now looks like Figure 10.5.
The third team member steps to the board and confidently begins to movetasks associated with leadership into one column. He feels that the previousmember made a mistake in grouping “send managers to training” with tasksthat seem to be related to training because the important thing is the effectthis task has on leadership. He starts to move the note when the task managerintervenes and explains that each team member’s action is unchangeable; itcannot be undone or overruled by another member. If one team member feelsthat a task belongs in a group other than the one in which it was placed byanother member, the dissenting team member makes a copy of the task andassociates it with the other group. The third team member makes a copy ofthe “send managers to training” task and places it under the first column. Theboard now looks like Figure 10.6.
The task manager steps to the board and completes the affinity diagramby moving the remaining tasks into a column. The board now shows threecolumns of associated tasks (see Figure 10.7).
Figure 10.4. Affinity Diagram: First Round.
Stop the training“guilt trip”
Improveperformance
controls
Stop punishinghonest mistakes
Send managers to training
Develop training for new
processes
Follow establishedprocedures
Solicit employeesuggestions
Listen to employees
Train new hires
Increase trainingbudget
Develop a projectmanagementmethodology
Improve projectmanagement
Improve seniormanagement
skills
Make rewards fair
Develop a training plan
Get betterrequirements
Improve leadership
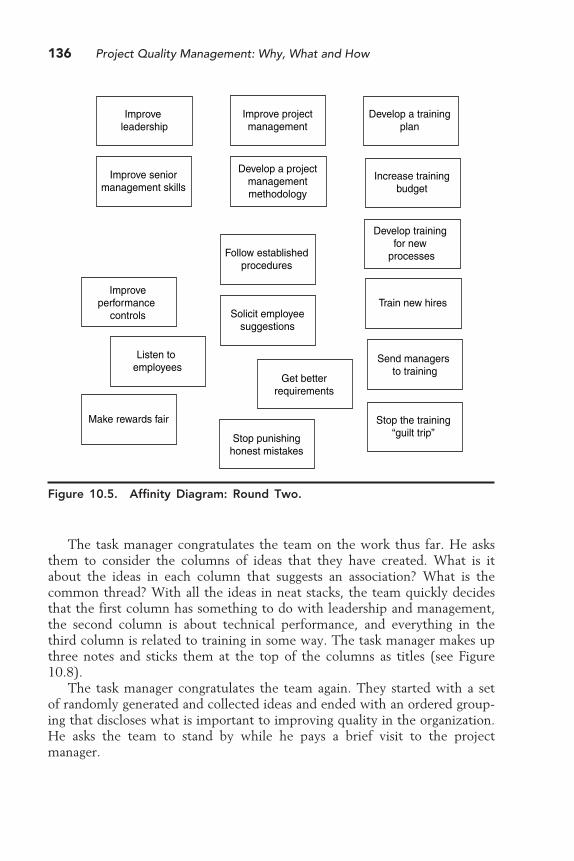
136 Project Quality Management: Why, What and How
The task manager congratulates the team on the work thus far. He asksthem to consider the columns of ideas that they have created. What is itabout the ideas in each column that suggests an association? What is thecommon thread? With all the ideas in neat stacks, the team quickly decidesthat the first column has something to do with leadership and management,the second column is about technical performance, and everything in thethird column is related to training in some way. The task manager makes upthree notes and sticks them at the top of the columns as titles (see Figure10.8).
The task manager congratulates the team again. They started with a setof randomly generated and collected ideas and ended with an ordered group-ing that discloses what is important to improving quality in the organization.He asks the team to stand by while he pays a brief visit to the projectmanager.
Figure 10.5. Affinity Diagram: Round Two.
Train new hires
Listen to employees
Stop the training“guilt trip”
Solicit employeesuggestions
Increase trainingbudget
Develop training for new
processesFollow establishedprocedures
Improve projectmanagement
Develop a projectmanagementmethodology
Get betterrequirements
Improveperformance
controls
Send managers to training
Stop punishinghonest mistakes
Improve leadership
Develop a trainingplan
Make rewards fair
Improve seniormanagement skills
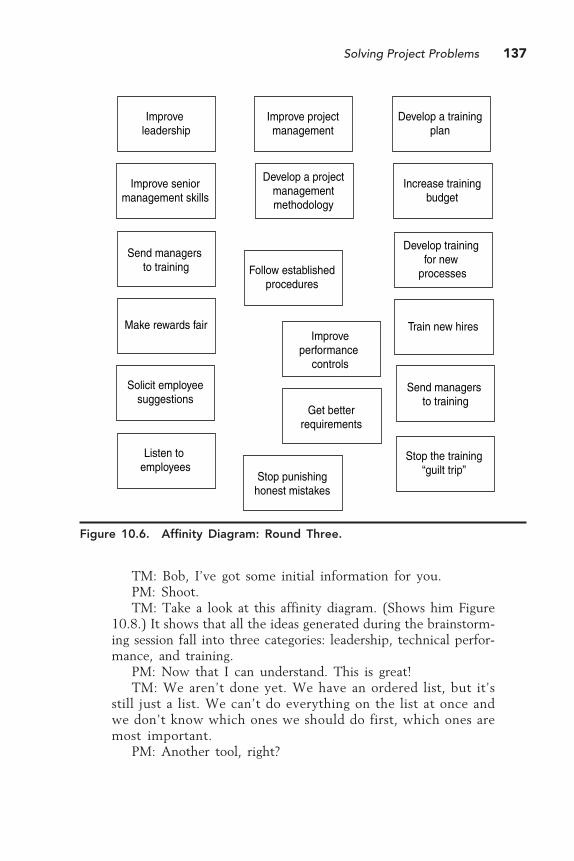
Solving Project Problems 137
TM: Bob, I’ve got some initial information for you.PM: Shoot.TM: Take a look at this affinity diagram. (Shows him Figure
10.8.) It shows that all the ideas generated during the brainstorm-ing session fall into three categories: leadership, technical perfor-mance, and training.
PM: Now that I can understand. This is great!TM: We aren’t done yet. We have an ordered list, but it’s
still just a list. We can’t do everything on the list at once andwe don’t know which ones we should do first, which ones aremost important.
PM: Another tool, right?
Figure 10.6. Affinity Diagram: Round Three.
Train new hires
Listen to employees
Stop the training“guilt trip”
Solicit employeesuggestions
Increase trainingbudget
Develop training for new
processesFollow establishedprocedures
Improve projectmanagement
Develop a projectmanagementmethodology
Get betterrequirements
Improveperformance
controls
Send managers to training
Stop punishinghonest mistakes
Improve leadership
Develop a trainingplan
Make rewards fair
Improve seniormanagement skills
Send managers to training
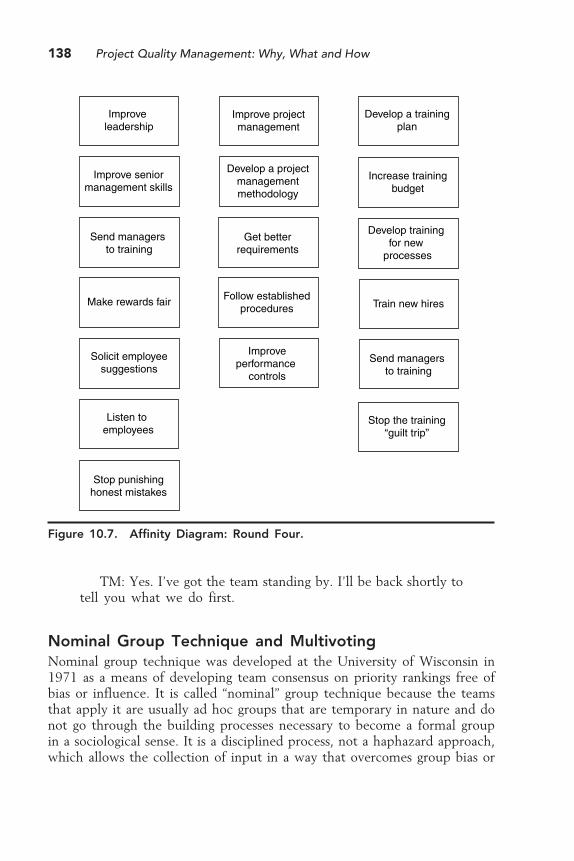
138 Project Quality Management: Why, What and How
TM: Yes. I’ve got the team standing by. I’ll be back shortly totell you what we do first.
Nominal Group Technique and MultivotingNominal group technique was developed at the University of Wisconsin in1971 as a means of developing team consensus on priority rankings free ofbias or influence. It is called “nominal” group technique because the teamsthat apply it are usually ad hoc groups that are temporary in nature and donot go through the building processes necessary to become a formal groupin a sociological sense. It is a disciplined process, not a haphazard approach,which allows the collection of input in a way that overcomes group bias or
Figure 10.7. Affinity Diagram: Round Four.
Train new hires
Listen to employees
Stop the training“guilt trip”
Solicit employeesuggestions
Increase trainingbudget
Develop training for new
processes
Follow establishedprocedures
Improve projectmanagement
Develop a projectmanagementmethodology
Get betterrequirements
Improveperformance
controls
Send managers to training
Send managers to training
Stop punishinghonest mistakes
Improve leadership
Develop a trainingplan
Make rewards fair
Improve seniormanagement skills
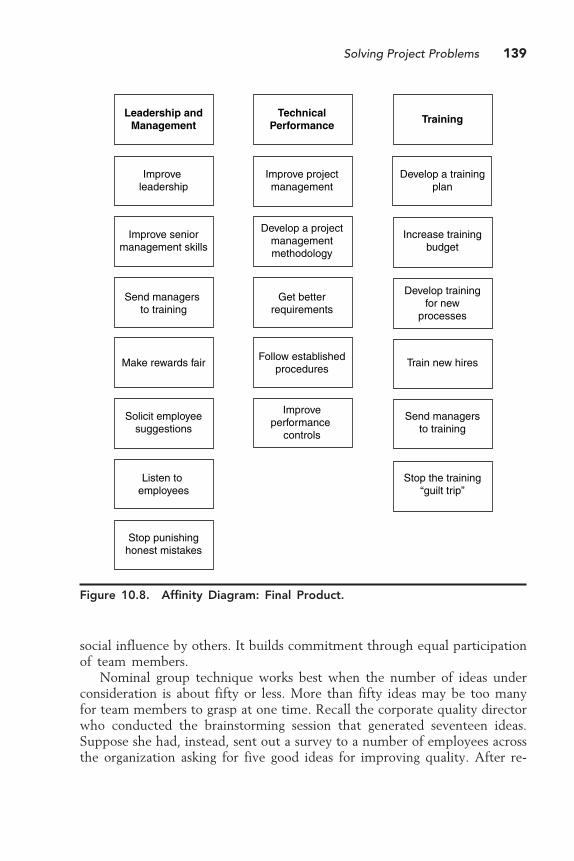
Solving Project Problems 139
Figure 10.8. Affinity Diagram: Final Product.
social influence by others. It builds commitment through equal participationof team members.
Nominal group technique works best when the number of ideas underconsideration is about fifty or less. More than fifty ideas may be too manyfor team members to grasp at one time. Recall the corporate quality directorwho conducted the brainstorming session that generated seventeen ideas.Suppose she had, instead, sent out a survey to a number of employees acrossthe organization asking for five good ideas for improving quality. After re-
Stop punishinghonest mistakes
Send managers to training
Solicit employeesuggestions
Listen to employees
Improve seniormanagement skills
Make rewards fair
Improve leadership
Leadership andManagement
Develop a projectmanagementmethodology
TechnicalPerformance
Improveperformance
controls
Follow establishedprocedures
Get betterrequirements
Improve projectmanagement
Stop the training“guilt trip”
Develop trainingfor new
processes
Train new hires
Increase trainingbudget
Training
Send managersto training
Develop a trainingplan
140 Project Quality Management: Why, What and How
ceiving responses and eliminating duplicates, she may have a list of eighty orninety ideas. She could reduce the number to fifty or less by assembling asmall analysis team and applying multivoting in the following way:
1. List all the ideas and assign a sequential number to each.2. Ask each team member to identify the top twenty ideas from the list
and write the numbers for those ideas on a sheet of paper. There isnothing magical about the number twenty. It is just a nice roundnumber that seems to work well in most cases. If the total numberof ideas is larger (say, 125 or so), a number of thirty top-priority ideasmay be more appropriate.
3. Tabulate the results. Collect the individual top-twenty lists and assignone point to each idea on the total list for each time it appears on anindividual top-twenty list. Add the scores for each idea on the totallist.
4. Delete ideas with low scores. Starting with ideas that received nopoints at all may be sufficient to reduce the list to fifty or less. Ifnot, delete those with a score of one, then two, and so on untilthe list has been sufficiently reduced. All deletions should be doneby group consensus. No idea should be deleted without permissionof the originator.
Nominal group technique consists of five general steps, with some varia-tion within the steps in practice:
1. Generate ideas. Team members, silently and on their own, write theirideas on a piece of paper. There is no limit on the number of ideasand no constraints on the nature of the ideas. As in brainstorming,creativity is the rule. Team members may write all ideas on a singlesheet of paper or, if anonymous input is desired, they may write eachidea on a separate note card, such as an index card.
2. Collect and record ideas. Each team member discloses one idea at atime, going around the team in round-robin fashion until all ideas havebeen disclosed. The team leader writes the ideas on a flip chart usingas many pages as necessary. If the team desires anonymous input, theteam leader collects the note cards, perhaps shuffling them to elimi-nate any order of collection that might suggest the writer’s identity,and writes all the ideas on the flip chart.
3. Review and discuss the ideas. Remove any obvious duplicates, beingcareful not to eliminate ideas that are similar, but slightly different.Discuss each idea briefly to make sure everyone has the same under-standing. The team leader must keep the discussion moving so that this
Solving Project Problems 141
step does not turn into a discussion or argument about the merits ofthe ideas. The purpose is clarification only.
4. Vote on the ideas. Each team member, individually and anonymously,selects and prioritizes a small number of ideas from the total list. Inpractice, the number selected varies. In one convention, team mem-bers select and prioritize five ideas from the total. In another conven-tion, the number selected for prioritization depends on the total ac-cording to the following scale:� Up to twenty ideas, prioritize four� Twenty-one to thirty-five ideas, prioritize six� Thirty-six or more ideas, prioritize eightNo matter the number of ideas, the prioritization process is the same.By convention, each team member writes the idea’s sequential numberin the upper left corner of a note card, then writes the idea in thecenter of the card. Team members place all the cards in front of themand rank-order them according to priority. They write the prioritynumber in the lower right corner with priority values from highest tolowest. When prioritizing four ideas, the first priority is assigned avalue of four, the second priority is assigned a value of three, the thirdpriority is assigned two, and the fourth, one. The technique is the samewhen prioritizing six ideas, except it begins with a first priority valueof six.
5. Record results. The team leader collects the cards, shuffles them toavoid disclosing a writer’s identity, and enters the priority values fromthe cards on the general list. Adding all the priority numbers for eachidea yields a prioritized list.
Recall the task manager who promised the project manager an answer asto which of the seventeen ideas about quality improvement should be ad-dressed first. He went back to the team which was standing by and appliednominal group technique to the list of seventeen ideas that had already beengenerated by brainstorming. He gave each of the five team members four notecards and asked them to select the top four priority ideas from the list ofseventeen. He asked them to write the idea number in the upper left cornerof a card and the idea in the center of the card. He then asked them to placeall four cards in front of them and arrange them in priority order, highestto lowest. Once that was done, he asked them to write the priority numberson the cards, highest to lowest, four to one, in the lower right corner.
The task manager then had one team member collect the cards and shufflethem. He took the cards and wrote the priority numbers from each cardbeside the idea description on the total list. The results are shown in Table10.2.
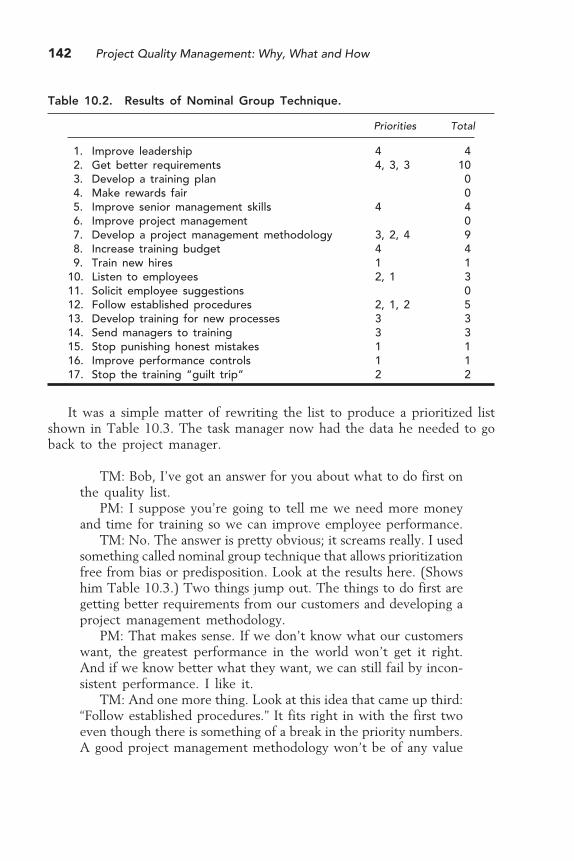
142 Project Quality Management: Why, What and How
It was a simple matter of rewriting the list to produce a prioritized listshown in Table 10.3. The task manager now had the data he needed to goback to the project manager.
TM: Bob, I’ve got an answer for you about what to do first onthe quality list.
PM: I suppose you’re going to tell me we need more moneyand time for training so we can improve employee performance.
TM: No. The answer is pretty obvious; it screams really. I usedsomething called nominal group technique that allows prioritizationfree from bias or predisposition. Look at the results here. (Showshim Table 10.3.) Two things jump out. The things to do first aregetting better requirements from our customers and developing aproject management methodology.
PM: That makes sense. If we don’t know what our customerswant, the greatest performance in the world won’t get it right.And if we know better what they want, we can still fail by incon-sistent performance. I like it.
TM: And one more thing. Look at this idea that came up third:“Follow established procedures.” It fits right in with the first twoeven though there is something of a break in the priority numbers.A good project management methodology won’t be of any value
Table 10.2. Results of Nominal Group Technique.
Priorities Total
1. Improve leadership 4 42. Get better requirements 4, 3, 3 103. Develop a training plan 04. Make rewards fair 05. Improve senior management skills 4 46. Improve project management 07. Develop a project management methodology 3, 2, 4 98. Increase training budget 4 49. Train new hires 1 1
10. Listen to employees 2, 1 311. Solicit employee suggestions 012. Follow established procedures 2, 1, 2 513. Develop training for new processes 3 314. Send managers to training 3 315. Stop punishing honest mistakes 1 116. Improve performance controls 1 117. Stop the training “guilt trip” 2 2
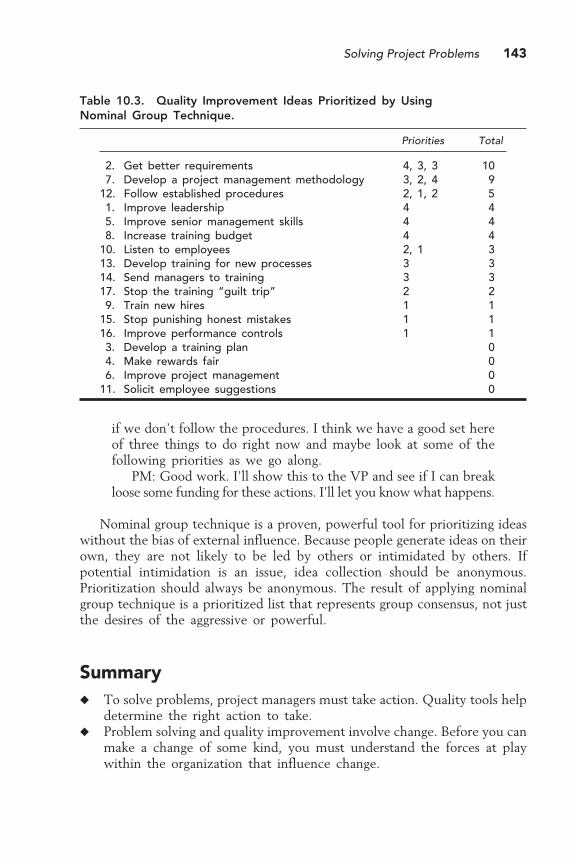
Solving Project Problems 143
Table 10.3. Quality Improvement Ideas Prioritized by UsingNominal Group Technique.
Priorities Total
2. Get better requirements 4, 3, 3 107. Develop a project management methodology 3, 2, 4 9
12. Follow established procedures 2, 1, 2 51. Improve leadership 4 45. Improve senior management skills 4 48. Increase training budget 4 4
10. Listen to employees 2, 1 313. Develop training for new processes 3 314. Send managers to training 3 317. Stop the training “guilt trip” 2 29. Train new hires 1 1
15. Stop punishing honest mistakes 1 116. Improve performance controls 1 13. Develop a training plan 04. Make rewards fair 06. Improve project management 0
11. Solicit employee suggestions 0
if we don’t follow the procedures. I think we have a good set hereof three things to do right now and maybe look at some of thefollowing priorities as we go along.
PM: Good work. I’ll show this to the VP and see if I can breakloose some funding for these actions. I’ll let you know what happens.
Nominal group technique is a proven, powerful tool for prioritizing ideaswithout the bias of external influence. Because people generate ideas on theirown, they are not likely to be led by others or intimidated by others. Ifpotential intimidation is an issue, idea collection should be anonymous.Prioritization should always be anonymous. The result of applying nominalgroup technique is a prioritized list that represents group consensus, not justthe desires of the aggressive or powerful.
Summary� To solve problems, project managers must take action. Quality tools help
determine the right action to take.� Problem solving and quality improvement involve change. Before you can
make a change of some kind, you must understand the forces at playwithin the organization that influence change.

144 Project Quality Management: Why, What and How
� Force field analysis identifies forces and factors that help or hinder prob-lem solving. Helping forces must be made more influential or hinderingforces must be made less influential. It is often easier to reduce theinfluence of hindering forces than it is to increase the influence of helpingforces.
� Brainstorming is a tool for creatively and efficiently generating a highvolume of ideas free of criticism. During brainstorming, creativity is therule; no idea is too unconventional for consideration. No criticism, clari-fication, prioritization, or discussion of ideas is permitted as ideas arepresented.
� Brainstorming may be employed in a structured approach in which teammembers present one idea at a time, going around the team in round-robin fashion.
� Brainstorming may be employed in an unstructured approach in whichteam members present their ideas in a free-for-all fashion with no limiton the number of ideas presented at one time and no sequence of pre-sentation among team members.
� The brainstorming approach employed depends on the desires and per-sonalities of the team.
� An affinity diagram may be used to organize and summarize unstructuredideas or issues. Team members associate individual ideas with other ideasthat have something in common one at a time until all ideas are groupedtogether in associated categories. Groups are then given titles that reflectthe nature of the association.
� A large number of ideas may be reduced to a more workable number bymultivoting in which each team member assigns one point each to thetop twenty ideas among the total. Adding all points for each idea allowselimination of low-scoring ideas. No idea should be eliminated withoutthe writer’s concurrence.
� Nominal group technique is a method for developing team consensus onpriority ranking of ideas or issues free of bias or influence. Ideas may begenerated by anonymous input from team members or by a public dis-closure method such as brainstorming.
� In applying nominal group technique, team members anonymously assignpriorities to a small number of ideas. Adding priorities for each ideaproduces a prioritized list that was reached by team consensus.

145
11Common
Project Practices
Managing project quality is not restricted to using traditional quality tools.Project managers may and should use or develop whatever tools are necessaryto deliver quality products and services to customers.
Commonly Used ToolsThe two tools described below are not among the set of traditional qualitytools, but they are so ubiquitous in use that any discussion of project qualitywould be incomplete without mentioning them.
Compliance MatrixA compliance matrix is a tool to ensure that actions comply with require-ments. It may be a simple checklist or it may be a little more complex. Itsfirst application to project quality may be during the bid and proposal phase.A good compliance matrix well applied will provide confidence that theproposal responds to all requirements in the solicitation. It may also beapplied during project implementation as a checklist for deliverables. A goodcompliance matrix will ensure that all requirements have been met beforea deliverable is released to the customer. Project managers may design thematrix structure in any way that meets project needs. An example format isshown in Figure 11.1. The example includes essential elements of informationnecessary to ensure compliance with requirements.

146 Project Quality Management: Why, What and How
� Reference — This column shows the paragraph numbers of the re-quirements, perhaps from a solicitation document or a task order ofsome kind.
� Requirement — This column includes the exact requirements fromthe solicitation document or task order. Requirements may be ex-tracted and quoted directly or they may be summarized in languagethat is meaningful to the project team. Either way, all requirementsmust be included. It may be useful to analyze the paragraphs in thesource document and look for verbs. Any verb (action word) indicatesthat what follows is something that must be done. A verb tied todescriptive language constitutes a probable requirement.
� Response — In the simplest use of a compliance matrix, this columnmay include brief statements of what the project team will do tocomply with the requirement. In an expanded use, perhaps during thebid and proposal phase, this column may be a repository of ongoingnotes about how the project team will comply. When the matrix iscomplete, this column may then be used as a foundation for writingthe final proposal.
� Done — This column indicates status on completion of the require-ment-response connection as a yes/no entry.
� Date — This column indicates the date of completion or latest action.� Contact — This column indicates contact data for the individual
responsible for the action or individuals who must be included incoordination.
To show how a compliance matrix may be applied, consider the followingextract from a request for proposal for the Dakota Wireless Network.
Figure 11.1. Compliance Matrix.
Ref Requirement Response Done Date Contact
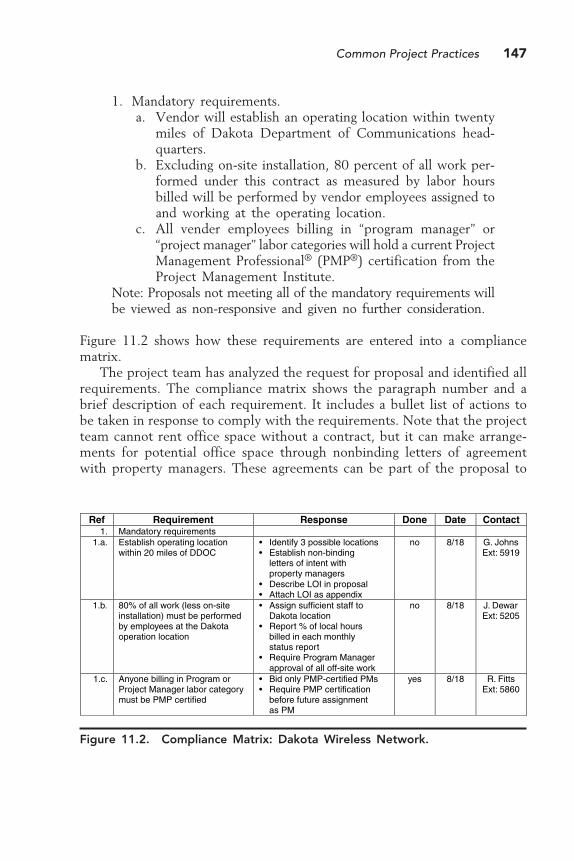
Common Project Practices 147
1. Mandatory requirements.a. Vendor will establish an operating location within twenty
miles of Dakota Department of Communications head-quarters.
b. Excluding on-site installation, 80 percent of all work per-formed under this contract as measured by labor hoursbilled will be performed by vendor employees assigned toand working at the operating location.
c. All vender employees billing in “program manager” or“project manager” labor categories will hold a current ProjectManagement Professional® (PMP®) certification from theProject Management Institute.
Note: Proposals not meeting all of the mandatory requirements willbe viewed as non-responsive and given no further consideration.
Figure 11.2 shows how these requirements are entered into a compliancematrix.
The project team has analyzed the request for proposal and identified allrequirements. The compliance matrix shows the paragraph number and abrief description of each requirement. It includes a bullet list of actions tobe taken in response to comply with the requirements. Note that the projectteam cannot rent office space without a contract, but it can make arrange-ments for potential office space through nonbinding letters of agreementwith property managers. These agreements can be part of the proposal to
Figure 11.2. Compliance Matrix: Dakota Wireless Network.
Ref Requirement Response Done Date Contact1. Mandatory requirements
1.a. Establish operating locationwithin 20 miles of DDOC
• Identify 3 possible locations• Establish non-binding
letters of intent withproperty managers
• Describe LOI in proposal• Attach LOI as appendix
no 8/18 G. JohnsExt: 5919
1.b. 80% of all work (less on-siteinstallation) must be performedby employees at the Dakotaoperation location
• Assign sufficient staff toDakota location
• Report % of local hoursbilled in each monthlystatus report
• Require Program Managerapproval of all off-site work
no 8/18 J. DewarExt: 5205
1.c. Anyone billing in Program orProject Manager labor categorymust be PMP certified
• Bid only PMP-certified PMs• Require PMP certification
before future assignmentas PM
yes 8/18 R. FittsExt: 5860

148 Project Quality Management: Why, What and How
show a good-faith effort to establish an operating location as required. Thematrix also shows completion status and date. Item 1.c indicates “yes” becausethe project team has identified employees to bid as program or projectmanagers and all hold a current PMP® certification. Last, the matrix showsthe name and telephone number of the person responsible for completingthe actions.
As a next step, the project team might select its most gifted writer toprepare the final proposal using the information in the “response” column asa guide. When the proposal has been written and coordinated, the compli-ance matrix might serve as a last-step checklist for reviewing the proposalbefore it is submitted to the soliciting organization.
Peer ReviewPeer review is a common practice in most project organizations. Its purposeis to ensure technical soundness of products before they are delivered tocustomers. Products involved are usually plans, reports, or some other typeof intellectual document. Peer review is a simple process. When authorscomplete documents, they send the finished product to another person whopossesses technical expertise equal to or superior to their own. That personreviews the document for technical soundness. If reviewers disagree aboutapproach, methods, conclusions, or any technical aspects of the documents,they work out the disagreement directly with the authors. If reviewers andauthors cannot agree, they escalate the matter to a superior (a task manageror a project manager) for resolution.
Peer review is focused on technical matters only. It is not a review ofgrammar or writing style; that is an editorial review, which is an entirelydifferent process. Peer reviewers must resist any temptation to force authorsto “write it my way.” At the same time, authors must be able to accepttechnical criticism and not defend on “that’s the way I write.” Peer reviewis an excellent way to get a second look at important products before theyare delivered to customers.
Peer review can have a dark side. Some authors may funnel their docu-ments to personal friends who are not likely to criticize their work or to otherwriters with whom they have an unspoken mutual noncritique agreement.This can lead to ineffective reviews and the phenomenon of “group think.”Some reviewers may use the process to take cheap shots at authors withwhom they may be feuding or whom they see as competitors for promotion,rewards, or influence within the organization. Effective peer review dependson good intentions by all, inoffensive candor by all involved, and nonpunitiveresolution of any technical disagreements.
Common Project Practices 149
Summary� A compliance matrix is used to ensure that actions comply with require-
ments. It may be applied as a checklist or as a tool for developing acomprehensive, responsive proposal.
� Peer review is a common method of ensuring technical soundness ofintellectual products prior to delivery to customers.
� Peer review is technically focused. It is not a review of grammar orwriting style.

Section IVQuality in Practice

12Project Systems
and Solutions
Project quality is a result of many things working together to produce asatisfied customer. Things that work together constitute a system. To manageproject quality, project managers must, in Dr. Deming’s words, gain anappreciation for systems. They must understand the elements of the systemwithin which they work and how the elements interact with and influenceeach other. This is no easy task. System performance can be obscured byarrogance, ignorance, or bias. To overcome these hurdles, Dr. Deming de-veloped a demonstration using red and white beads.
The Red Bead ExperimentDr. Deming explained the red bead experiment in his book Out of the Crisis.He also credited William A. Boller of the Hewlett-Packard Company withintroducing the demonstration at a company seminar. The experiment in-cludes the following:
� People — Six workers, consistently referred to as “willing workers”;two inspectors and one chief inspector; and one recorder.
� Materials — Red and white spherical beads (commercially availabledemonstration kits generally provide 4000 beads: 3200 white, 800red), a container to hold the beads, and a paddle with fifty indenta-tions that will hold one bead each.
� Processes — Willing workers dip the paddle into the bead containeruntil it is completely covered, then carefully withdraw it. Gently
153

154 Project Quality Management: Why, What and How
shaking the paddle and allowing excess beads to roll off results in apaddle with a bead in each of the fifty indentations.
During the experiment, each willing worker, in turn, dips the paddle intothe container and produces a sample of fifty beads. This is repeated for severalrounds, usually four or five, to simulate a number of workdays; willing workersproduce one sample per day. After the willing workers produce their samples,they report to an inspector who counts defects. A defect is a red bead or avacant indentation. The willing workers then report to a second inspectorwho makes a second count of defects. After making their counts, the inspec-tors report to the chief inspector who checks the results of the inspectors.If the results are the same, the chief inspector reports the number to therecorder. If the results are not the same, the chief inspector counts thedefects, reports that number to the recorder, and directs the willing workerto dump the beads back in the container and return to the work line. Therecorder writes all results on a matrix that shows willing worker performanceby day.
In practice, the facilitator of the experiment adds other, potentially con-founding elements to the experiment. Willing workers are provided brieftraining and told they will have an apprenticeship period. They are then putdirectly to work without any period of apprenticeship. New workers who areadded to the line as a result of dismissals are given no training. The facilitatorannounces a quota of no more than one red bead per day. The facilitatorpraises good performance, a very low number of defects, and condemns orpunishes with dismissal poor performance, a very high number of defects.The facilitator may throw in quality slogans and generally exhort the willingworkers to perform better. After several days of work, the facilitator threatensworkers with dismissal because of their inconsistent and generally poor per-formance. After all, no one is meeting the quota of no more than one defectper paddle. The facilitator ensures that senior managers among the partici-pant group are included in the willing worker group and, as the experimentprogresses, points out their poor performance to the great glee of the otherparticipants. Finally, when all workdays are complete, the facilitator closesthe operation and tells all willing workers to collect their severance pay onthe way out.
The matrix prepared by the recorder might look something like Figure12.1.
The red bead experiment reveals much about system performance. Whilemany system elements interact, in this case, materials determine results. Thebead mixture is 80 percent white beads and 20 percent red beads. The paddleholds fifty beads. Given a fair production effort by the worker — that is, theworker does not try to change results by quickly dipping the paddle againif it looks like a large number of red beads are on the paddle from the initial
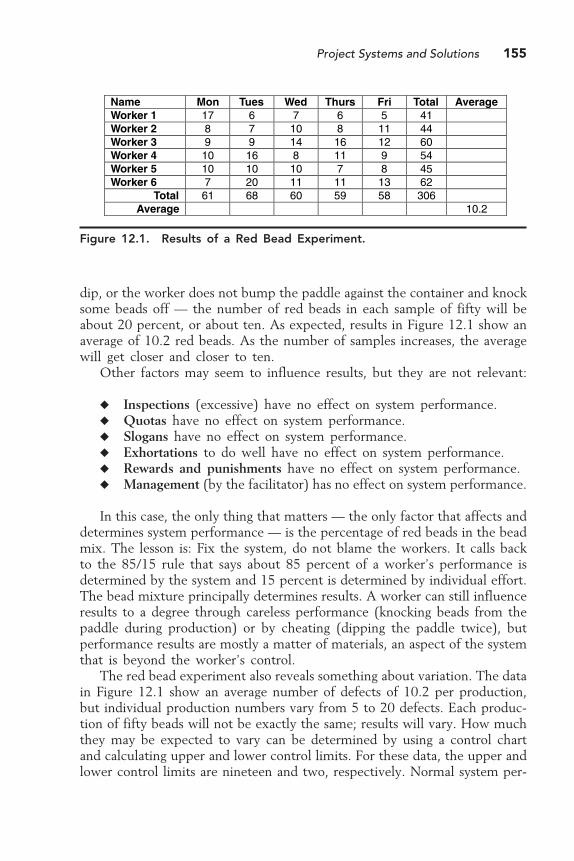
Project Systems and Solutions 155
dip, or the worker does not bump the paddle against the container and knocksome beads off — the number of red beads in each sample of fifty will beabout 20 percent, or about ten. As expected, results in Figure 12.1 show anaverage of 10.2 red beads. As the number of samples increases, the averagewill get closer and closer to ten.
Other factors may seem to influence results, but they are not relevant:
� Inspections (excessive) have no effect on system performance.� Quotas have no effect on system performance.� Slogans have no effect on system performance.� Exhortations to do well have no effect on system performance.� Rewards and punishments have no effect on system performance.� Management (by the facilitator) has no effect on system performance.
In this case, the only thing that matters — the only factor that affects anddetermines system performance — is the percentage of red beads in the beadmix. The lesson is: Fix the system, do not blame the workers. It calls backto the 85/15 rule that says about 85 percent of a worker’s performance isdetermined by the system and 15 percent is determined by individual effort.The bead mixture principally determines results. A worker can still influenceresults to a degree through careless performance (knocking beads from thepaddle during production) or by cheating (dipping the paddle twice), butperformance results are mostly a matter of materials, an aspect of the systemthat is beyond the worker’s control.
The red bead experiment also reveals something about variation. The datain Figure 12.1 show an average number of defects of 10.2 per production,but individual production numbers vary from 5 to 20 defects. Each produc-tion of fifty beads will not be exactly the same; results will vary. How muchthey may be expected to vary can be determined by using a control chartand calculating upper and lower control limits. For these data, the upper andlower control limits are nineteen and two, respectively. Normal system per-
Figure 12.1. Results of a Red Bead Experiment.
Name Mon Tues Wed Thurs Fri Total AverageWorker 1 17 6 7 6 5 41Worker 2 8 7 10 8 11 44Worker 3 9 9 14 16 12 60Worker 4 10 16 8 11 9 54Worker 5 10 10 10 7 8 45Worker 6 7 20 11 11 13 62
Total 61 68 60 59 58 306Average 10.2

156 Project Quality Management: Why, What and How
formance will yield two to nineteen defects in any individual production.Workers should not be criticized or specially rewarded for performance withinthis range. Quotas should not be established outside this range. Slogans andexhortations should not address any performance outside this range.
What about worker 6 who produced twenty defects on Tuesday? Howshould management respond? Punish the worker? Recall that control limitsdo not encompass 100 percent of the data. Control limits are sometimesestablished at 3σ above and below the mean, which encompasses 99.73percent of the data. The performance of twenty defects could be normalsystem performance that falls within the other 0.23 percent, or, if these datarelate to performance that occurred after the control limits were established,the twenty defects could be a result of special cause variation acting on thesystem. Perhaps worker 6 was a new hire that joined the work line after theinitial workers completed training and, therefore, received no training. Anuntrained worker is a source of special cause variation.
Using a control chart to analyze the data obtained during the red beadexperiment shows that the system is stable and is producing predictableresults. The red bead experiment is often an eye-opening experience forparticipants. It shows more clearly than any text can describe how systemsinfluence results.
Practical ExerciseThe following exercise allows readers to apply the concepts and tools pre-sented in this book. Readers should complete the exercise, not simply scanthe description and assume they “got it.” Completing the exercise will solidifyunderstanding of quality concepts and tools before readers attempt to applythem in real project practice.
BackgroundBeads R Us is a producer of high-quality plastic beads for commercial use.The production process is as described in the red bead experiment. Workersproduce beads in lots of fifty by dipping a paddle into a bin of beads andwithdrawing fifty at a time. Some of the beads are red; red beads are defec-tive. If the production lot is less than fifty, the absent beads count as defects.Recently, management has become dissatisfied with the number of defectsduring production.
Beads R Us obtains materials from Bead World, one of three suppliersworldwide. Materials include defective beads, which must be eliminated priorto delivery to customers.

Project Systems and Solutions 157
A major customer of Beads R Us has informed management that it willreject any future delivery that includes more than fifteen defective beads ina sample of fifty to be taken on the receiving dock at the time of delivery.
Beads R Us has engaged your project team on a consulting contract toanalyze its process, identify any shortcomings, and recommend solutions.
Data CollectionSix members of your project team were secretly sent to Beads R Us as newemployees to gain first-hand experience with the bead production process.They worked for five days before being withdrawn. The performance datafor the six team members are summarized as shown in Figure 12.1 (above).
The six team members also prepared a report of their work experiences.The key points in their report are summarized below.
1. Training is not good. New hires are not given any training. They areimmediately placed on the production line and told to do what theperson next to them is doing. Beads R Us calls this “on-the-job training.”
2. Communication is not good. Workers are not allowed to ask questionsand are not allowed to talk to each other while on the line. Anyonecaught talking is punished. Beads R Us managers tell workers thatthere is no time for frivolous behavior. They are paid to work, not talk.
3. Management is not good. When things go well, managers take all thecredit. When things do not go well, managers blame the workers andthreaten punishment.
4. Leadership is not good. Managers are seldom seen on the productionline. When they do show up, they walk quickly through the area andtell people to do better or their jobs are at risk.
5. The work environment is not good. The production area is coveredwith posters containing quality slogans such as “Mistakes cost us money,”“Work hard, keep your job,” “We’re counting on YOU,” and “Nodefect is a good defect.” Workers have trouble understanding themeaning of these slogans and have no idea about how to implementthem.
6. Quotas are unreasonable. Management has assigned quotas for produc-tion that have never been achieved by anyone. Managers continuallyharp on the quotas and threaten punishment of those who do notmake quota.
7. Rewards are inconsistent and inequitable. Two people can produce thesame quality and one gets a reward while the other does not. A workercan be rewarded one day for good performance and punished the nextday for poor performance. A worker who performed particularly well

158 Project Quality Management: Why, What and How
one day received an on-the-spot bonus and a pin that said “Employeeof the Day.” The next day, the same employee was fired for poorperformance.
RequirementApply your quality knowledge and meet all contractual requirements.Specifically:
� Analyze the process of bead production at Beads R Us.� Identify any shortcomings that indicate inability to meet customer
requirements.� Recommend solutions that eliminate any shortcomings.
TipsThis practical exercise does not include a prescribed solution. Readers shouldbe creative in their solution approach; results will vary from reader to reader.Readers should apply as many of the quality tools as possible. Some tools areintended for group use. Not all may be beneficial. Readers will better under-stand the utility and limitations of the tools as they try to put them to use.Here are some suggestions.
1. Collecting data� A check sheet might be prepared to show defects by day or by
worker. The matrix in Figure 12.1 is already a collection of data.2. Understanding data
� A line graph or a bar graph might be used to show the progressionof defects by worker over time. A pie graph might be used to showthe number of defects by worker or by day relative to the totalnumber of defects.
� A histogram might be used to show how defects are distributed byworker or by day.
� A Pareto chart might be used to identify defects in descendingorder by worker or by day of the week.
� A scatter diagram might be used to investigate a possible relationshipbetween days of the week and the number of defects produced.
3. Understanding processes� A flow chart might be used to better understand the steps in the
bead production process.� A run chart might be used to understand how production progresses
over time.

Project Systems and Solutions 159
� A control chart might be used to determine system performanceand if expected performance meets customer requirements. (Hint:All thirty productions must appear on the x-axis, with the numberof defects on the y-axis. They may be plotted either by worker/by day or by day/by worker.)
4. Analyzing processes� A cause and effect diagram might be used to identify causes and
root causes of defective beads. (Hint: When determining catego-ries, consider the information provided by the six team membersin their report.)
� A pillar diagram might be used to identify the relationships be-tween suspected causes and results.
5. Solving problems� Force field analysis might be used to identify and understand the
forces that affect quality performance. It might provide a founda-tion for improvement action.
� Brainstorming might be used to identify causes when using processanalysis tools or to identify possible improvement actions.
� An affinity diagram might be used to organize and better under-stand the random results of brainstorming.
� Nominal group technique might be used to gain consensus onpriorities of action to be recommended.
Recommendations should be presented to Beads R Us as a final report,with relevant quality tools attached for clarification and justification.
Summary� When managing project quality, project managers must gain an appre-
ciation for systems. They must understand the elements that work to-gether to produce project results.
� Quality tools enable understanding of systems. They enable fact-based analysisand decisions that ensure delivery of quality products and services.

Epilogue
Dr. Deming would often close his lectures by saying, “Your life is foreverchanged. Tomorrow is a new day. Nothing will ever be the same.” A cynicmight think such pronouncements rather arrogant, but Dr. Deming was right.Having experienced the red bead experiment and understood its implications,no participant could go back to the old ways of thinking about quality. Andthinking about quality is the first step toward doing something about quality.
Quality does not arise from whipping the oarsmen harder. It does not arisefrom scientific, detailed analysis to determine the one best method. There isno “one best method” and there are no standard, just-like-all-the-others workers.People are different. They come in different sizes and shapes. They possessand exhibit different motivations and attitudes. They have different skills andcapabilities — and some days they are hot and some days they are not.
Quality is not a thing. Outside the natural world, there are no things.There are only things that people make or things that people do. Quality arisesfrom people, people who make or do the things that other people buy or use.The project manager’s obligation is to achieve the highest level of quality inmeeting project goals and satisfying customer requirements and expectations.That is not a matter of chance. It is only possible through a deliberate effortto manage quality from the inception of the project idea, through projectplanning and implementation, to the delivery of the product of the projectto the customer.
This book has proposed a method for managing project quality. To some,it may not be complete. To others, it may not be relevant. But to all, it isan opportunity to turn away from chance, or tradition, or whatever else hasnot worked well in the past and try something different. Considering theimportance of project outcomes, it is an opportunity not to be ignored.
161


163
Appendix 1.Case Study:
DakotaWireless Network
BackgroundThe State of Dakota seeks to increase the investment of new business in thestate by providing the best wireless communications environment in the coun-try. Dakota has vast land areas suitable for high-tech business, but its limitedcommunications infrastructure inhibits development. State planners realize thathigh-tech businesses depend on virtual teams supported by robust communi-cations capabilities. The state recently issued a request for proposal (RFP) forthe Dakota Wireless Network (DWN) with the following performance-basedspecifications:
a. Design, install, and maintain a digital communications network thatwill allow—(1) Cell phone services for all state residents and businesses from any
habitable point within state borders.(2) Wireless Internet connections for all state residents and businesses
from any habitable point within state borders with downloadspeeds of at least 2.0 Mbps at all times.
(3) 99.99966 percent system availability at all times.b. Design and install network in a manner that minimizes environmental
impact and community intrusion.
164 Project Quality Management: Why, What and How
c. Plan, prepare, conduct, and analyze public comment sessions asrequired.
d. Design and prepare promotional media items intended to attract newbusiness development to Dakota because of the unique capabilities ofthe DWN.
e. Develop a course of instruction on “Virtual Teams for Project Man-agement” that may be adopted without modification by all state col-leges and universities as a three-credit undergraduate course.
f. Develop and present as required a four-day seminar for professionalson “Virtual Teams for Project Management” that awards three under-graduate credits recognized by the American Council on Education.
g. Comply with all applicable federal and state regulations.
The ProjectYour company, JCN Networks, was recently awarded a five-year contract forthe Dakota Wireless Network based on a specific proposal that took noexceptions to the RFP.
You were notified Sunday night by e-mail from the CEO that you havebeen selected as project manager. Key members of your project team havealso been selected. Two of the six participated on the proposal team. Theywill all meet with you Monday morning at 8:30 a.m. in the conference roomat corporate headquarters in Sioux River Station.

165
INDEX
A
“Acceptable quality level,” 18Activity, 97Affected groups, 48, 49Affinity diagram, 78, 132–138, 139,
159Allied Signal, 32American National Standards
Institute (ANSI), 34, 54, 56American Society for Quality
(ASQ), 34Analyzing project processes, see
Project processesAnonymous input, 140, 143ANSI, see American National
Standards InstituteAppraisal, 10–11ASQ, see American Society for
QualityAssignable cause variation, 27, 28, 107Assurance activities, developing,
62–63Attribute data, 103Audit, 9–10
B
Baldrige National Quality Program,35–36
Bar graph, 82, 83, 158Behavior, 30Bell-shaped curve, 32, 85Bias, 138, 153“Big Q,” 5Brainstorming, 78, 129–132, 133,
159structured approach, 129–130,
132unstructured approach, 130–131,
132Breakthrough, 30“Burn” chart, 82
C
Capable process, 112Cause and effect diagram, 77,
115–120, 121, 159Cause of a problem, 115, 116Causes
multiple, 120value of, 122
Centerline, 99, 102Chance cause variation, 27Change, resistance to, 71, 127Checklist, 81, 145Check sheet, 77, 78–81, 158Circle graph, 82, 83
166 Project Quality Management: Why, What and How
Class internal, 84–85Class width, 85Collecting project data, see Project
dataCommon cause variation, 107Communication, 15, 22Company-wide quality control, 31Competition, global, 70Competitiveness, 11, 69, 70Competitors, 23Complaints, 8, 9, 20Compliance matrix, 78, 145–148Concerned groups, 49Conformance, see also specific
topicsto requirements, 22, 30to specifications, 16, 17–18
Continuous improvement, 18, 22Contract
analysis, 43–44, 145terms and conditions, 48, 49
Controlas prevention cost, 9, 10quality improvement and, 30in Wheel of Quality, 2, 24
Control chart, 77, 103–113, 155,156, 159
Control limits, 105, 109, 112, 155,156
lower,105, 107, 108, 111, 155shortcut, 112upper, 105, 107, 108, 111, 112,
155Corrective action, 22, 67Cost, 6
of quality, 7–11appraisal, 10–11failure, 8–9prevention, 9–10
reduced, 11, 23, 70Counterentropic, quality as, 6Craft production, 13–14
Crosby, Philip B., 7, 8, 30–31Cumulative percentage curve,
86–87Customer
communication with, 22definition of quality, 3, 5dissatisfied, 9, 112external, 19–20, 43hidden, 20, 43identifying, 43–48importance of, 20internal, 17, 20, 43, 44prioritizing, 45–48role of, 20–21
Customer focus, 18, 19–21, 23, 31Customer interview, 49Customer needs, 70Customer prioritization matrix, 50,
51, 54Customer requirements, 6, 17, 18,
23, 70, 110Customer satisfaction, 5, 11, 69,
70Customer-weighted prioritization
matrix, 56Customer-weighted requirements
prioritization matrix, 54, 55
D
Dataattribute, 103project, see Project datasample, 103, 104variable, 103
Decision point, 97Decomposition process, 117–119,
121Defect
control chart and, 105, 110cost of, 7defined, 4

Index 167
freedom from, 30as part of system, 5prevention of, 30reduction, 32, 70variation and, 21
Deficiency, defined, 5Degree of influence, 122Deming, W. Edwards, 16, 21, 27,
28–30, 31, 161operational definitions,
importance of, 57plan-do-check-act cycle, 71, see
also Plan-do-check act cyclequality chain reaction, 112red bead experiment, 153–156SPC techniques, 16
Deming cycle, 71Deming Prize, 28Dependent variable, 91Diminishing returns, 30DMAIC, 33Documentation, 34
E
Education, 3180/20 rule, 86, 8885/15 rule, 21Employee involvement, 31End-of-process inspection, 68End user, 19–20Equipment, 117Execution, 15Exhortations, 155Explicit requirements, 49External customer, 19–20, 43External failure, 8
F
Failure, 5cost of, 8–9, 11
external, 8internal, 8
Feigenbaum, Armand, 17Fishbone diagram, 115, 116, see
also Cause and effect diagramFlow chart, 78, 95–99, 158Force field analysis, 78, 126–129,
159“Fourteen points for management,”
28, 29Frequency distribution, 84, 85Full Analytical Criteria Method, 50
G
General Electric, 32Global competition, 70Global marketplace, 23Goals, 43Gold plating, 22Government agencies, 48Government regulations, 49Graphs, 77, 82–83Greatest opportunity for
improvement, 87Group bias, 138Group think, 148
H
Helping forces, 126, 127, 128Hidden customer, 20, 43“High-priced man,” 15Hindering forces, 126, 127–128Histogram, 77, 84–86, 101, 102,
158
I
Implicit requirements, 49Improvement, greatest opportunity
for, 87

168 Project Quality Management: Why, What and How
In control process, 112Indented list, 119Independent variable, 91In-process inspection, 68Input, 33, 97Inspection, 16, 17, 30, 155
appraisal and, 10, 11craft production, 14end-of-process, 68in-process, 68role of, 68
Internal customer, 17, 43, 44Internal failure, 8International Organization for
Standardization (ISO), 6,33–34
Interrelationship digraph, 120Ishikawa, Kaoru, 31, 68, 77, 82Ishikawa diagram, 115, see also
Cause and effect diagramISO 9000, 6, 33–35, 54ISO 9001, 34, 35ISO 9004, 34ISO 14000, 54
J
Japan, 28Japanese quality, 16–17Japanese Union of Scientists and
Engineers, 16, 28, 31Juran, Joseph M., 21, 27, 30
definition of quality, 5, 69Japanese quality and, 16operational definitions,
importance of, 57Juran Trilogy, 30, 41
K
Kaizen, 17
L
Leadership, 19, 23, 24Lewin, Kurt, 126Liability, 8Line graph, 82, 158“Little Q,” 5Lower control limit, 105, 107, 108,
111, 155L-shaped matrix, 46, 47, 50
M
Malcolm Baldrige National QualityAward, 35
Management, 155responsibility of, 14, 21, 24, 28Six Sigma and, 33
Mean, 105, 106, 108, 111Methods, Six Sigma, 33Metrics, 54
for assurance activities, 62–63Motivation, 15, 30Motorola, 32Multivoting, 78, 138–143
N
National Institute of Standards andTechnology, 35
Nominal group technique, 78,138–143, 159
np chart, 105
O
“One best method,” 14Operational definition, 43, 57, 62Organizational competence, 22Organizational management, 24Output, 33, 97
Index 169
PPareto, Vilfredo, 86Pareto analysis, 30Pareto chart, 30, 77, 86–90, 96,
117, 122, 158Peer review, 78, 148People, 117, 118, 119Performance target, 43Pie chart, 82, 83, 158Pillar diagram, 78, 120–122, 159Plan-do-check-act cycle, 15, 22, 28,
71–72Planning, 15, 30, 102
prevention costs and, 9–10project, see Project planningproject quality, see Project quality
planningquality, see Quality planning
PMBOK® Guide, 41, 42, 56quality assurance definition, 61quality control definition, 67
Policies, 117Predictable results, 109Prevention, 35
costs, 9–10Prioritizing ideas, 141, 142, 143Problems
multiple, 120project, see Project problems
Procedures, 117Process, 23, 24
better, 70capable, 112in control, 112control charts and, see Control
chartdefined, 43planning, see Process planningproject, see Project processesquality, 4–5, 6, 11
cost of, 7
repeatable, 15, 21, 99, 103variation and, 21, see also
VariationProcess control, 9, 10Process flow, 97Process improvement, 33, 112Process performance, control charts
and, 110, see also Controlchart
Process planning, 9–10Product
features, 30inspection, 11quality, 4, 6
cost of, 7review, 10technical soundness of, 148use, 44
Profit, increased, 23Project, quality in, 6
collecting, tools for, 78–81, 158,see also specific tools
checksheet, 78–81understanding, tools for, 77–93,
158, see also specific toolsgraphs, 82–83histogram, 84–86Pareto chart, 86–90scatter diagram, 90–93
Project data, 77–94Project management, 56
applying quality tools andtechniques, 3, 4
quality in, see QualityProject Management Institute, 54
definition of quality, 6Project manager
delivering quality, 3responsibility of, 24triple constraint and, 6
Project plan, 42, 54

170 Project Quality Management: Why, What and How
Project planning, 54Project problems
solving, tools for, 125–144, 159,see also specific tools
affinity diagram, 132–138, 139brainstorming, 129–132force field analysis, 126–129nominal group technique and
multivoting, 138–143Project processes
analyzing, tools for, 115–123,159, see also specific tools
cause and effect diagram,115–120
pillar diagram, 120–122understanding, tools for, 95–113,
158–159, see also specifictools
control chart, 103–113flow chart, 95–99run chart, 99–103
Project quality assurance, 61–65developing assurance activities,
61–62metrics, 62–63quality assurance plan, 63–64quality audits, 64
Project quality control, see Qualitycontrol
Project quality improvement, seeQuality improvement
Project quality management, 41, 42Project quality planning, 41–59
identifying customers, 43–45identifying requirements, 48–50identifying standards, 54, 56–57prioritizing customers, 45–48prioritizing requirements, 50–54,
55, 56project planning and, 54, 56quality management, 41–42quality management plan, 42–43
Project systems and solutions,153–159
practical exercise, 156–159red bead experiment, 153–156
Project team, 24, 44disillusionment of, 70
Punishment, 155
Q
Quality, 161benefits of, 11–12cost of, 7–11, 70
appraisal, 10–11failure, 8–9prevention, 9–10
definition of, 3, 4–7traditional, 5–6triple constraint, 6
evolution of, 13–25progressive history, 13–18Wheel of Quality, 18–24, see
also Wheel of Qualityparadigms, 32–36, see also
specific topicsBaldrige National Quality
Program, 35–36ISO 9000, 33–35Six Sigma, 32–33
pioneers, 27–32, see also specifictopics
Crosby, 30–31Deming, 27, 28–30, 31Ishikawa, 31Juran, 27, 30Shewhart, 27–28Taguchi, 31–32
responsibility for, 24Quality assurance, 41
defined, 61developing assurance activities,
61–62
Index 171
feedback for, 67, 68metrics, 62–63quality assurance plan, 63–64quality audits, 64
Quality assurance audit, 64Quality assurance plan, 62, 63–64Quality audit, 9–10, 64, 68Quality chain reaction, 12Quality circle, 17, 31Quality control, 30, 41, 61, 67–69
company-wide, 31defined, 67inspection, role of, 68, see also
Inspectionpurpose of, 67–68tools for, 68–69, see also Tools;
specific toolsQuality improvement, 5, 30, 31,
41, 69–73defined, 69hurdles to, 70–71improvement methodology,
71–73, see also Plan-do-check-act cycle
reasons for, 69–70tools, 68, see also Tools; specific
toolsQuality is free, 30Quality journey
customers, 48quality assurance activities, 63quality assurance plan, 64, 65quality control, 68, 69quality improvement, 72requirements, 54, 56specifications, 57 58
Quality loss function, 31, 32Quality management, 6, 9, 41–42Quality management plan, 42–43Quality management system, 34–35Quality manual, 34Quality objectives, 34
Quality planning, 9, 30, 41, 48, 54,55
defined, 54project, see Project quality
planningQuality policy, 34, 42Quality priority, 6Quality procedures, 34Quality process, 6, 11Quality system, 24Quality tools, 33, see also Tools;
specific toolsQuotas, 155
R
Random cause variation, 107Recall, 8Red bead experiment, 153–156Repair, 8Repeatable process, 15, 21, 99, 103Replacement, 8Reputation, 69
loss of, 8, 9Requirement, 43, 56, 57
assurance activities, 62compliance matrix, 145, 146, 147conformance to, 22, 30defining, 49explicit, 49identifying, 48–50implicit, 49implied, 49measurement of, 49meeting, 23metrics for, 62prioritizing, 50–54, 55, 56quality assurance plan and, 63in Wheel of Quality, 24
Requirements prioritization matrix,50, 51, 52, 53
customer-weighted, 54, 55
172 Project Quality Management: Why, What and How
Resource, 62defined, 43
Responsibility, 62for quality, 24
Results, value of, 122Rewards, 21, 155Rework, 5, 7, 8, 11, 17, 18Root causes, 115, 116, 119“Rule of seven,” 109Run chart, 78, 99–103, 105, 159
S
Sample data, 103, 104Scatter diagram, 77, 90–93, 102, 158Schedule, 6Scientific management, 14–15Scope, 6Scrap, 8, 10, 11Seven basic tools, 68, 71, 82Seven “deadly diseases,” 29Shewhart, Walter, 27–28, 31, 71
plan-do-check-act cycle, 71, seealso Plan-do-check-act cycle
SPC techniques, 16variation and, 15
Six Sigma, 21, 32–33Slogans, 155Solving project problems, see
Project problemsSPC, see Statistical process controlSpecial cause variation, 107, 109Specification
conformance to, 16, 17–18continuous improvement and, 22control charts and, 110, 111, 112defined, 56–57metrics for, 62quality assurance plan and, 63quality control and, 67, 68quality planning and, 54
variation and, 21in Wheel of Quality, 24
Specification limits, 112Stakeholder, 20, 48
communication with, 22Standard, 62
defined, 43identifying, 54, 56–57, 58
Standard deviation, 32Standard normal curve, 32Statistical control, 107, 109Statistical process control (SPC),
15, 16, 103Statistical sampling techniques, 28Statistical software, 33Statistical techniques, 27Statistical tools, 33, see also ToolsStatistics, 17, 18, 31Subcontractor, 43, 48Supplier, 48
communication with, 22definition of quality, 7evaluation, 10–11as external customer, 19prevention costs, 10
Supplier-customer relationship, 20System
defined, 5project, see Project systems and
solutionsquality, 6
elements of, 17System of profound knowledge, 29System performance, 153–156
T
Taguchi, Genichi, 31–32Taguchi method, 31–32Taylor, Frederick Winslow, 14–15,
17

Index 173
Technical soundness of products,148
Technology, 23, 70Testing, 11Time, 6, 7–8Tools, see also specific topics;
specific toolsfor analyzing project processes,
115–123for collecting and understanding
project data, 77–94for common project practices,
145–149quality control, 68–69for solving project problems,
125–144for understanding project
processes, 95–113Total quality control, 17Training, 10, 19, 23, 24, 31Triple constraint, quality and, 6
U
Unacceptable results, 112Understanding project data, see
Project dataUnderstanding project processes, see
Project processesUnstructured issues, 132Upper control limit, 105, 107, 108,
111, 112, 155U.S. Census Bureau, 28User, 48, 49
V
Value of causes, 122Value of results, 122
Variabledependent, 91independent, 91relationship between two, 90, 91
Variable data, 103Variance, 67Variation, 15, 18, 19, 21, 23
assignable cause, 27, 28, 107chance cause, 27common cause, 107control charts and, 103cost of, 31–32random cause, 107red bead experiment and, 155Six Sigma and, 33special cause, 107, 109understanding, 15
“Vital few,” 30, 33, 86, 87, 90, 96Voice of the customer, 110, 112Voice of the process, 103, 107
W
Warranty, 8Waste, 11Wheel of Quality, 18–24, see also
specific topicscontinuous improvement, 18, 19,
22–23customer focus, 18, 19–21leadership, 19, 23training, 19, 23variation, 18, 19, 21
Work breakdown structure, 63Worker, responsibility of, 14–15
Z
Zero defects, 30, 104