PROJECT DESIGN DOCUMENT FORM (CDM-SSC-PDD) - SGS
32
PROJECT DESIGN DOCUMENT FORM (CDM-SSC-PDD) - Version 03 CDM – Executive Board 1 CLEAN DEVELOPMENT MECHANISM PROJECT DESIGN DOCUMENT FORM (CDM-SSC-PDD) Version 03 - in effect as of: 22 December 2006 CONTENTS A. General description of the small scale project activity B. Application of a baseline and monitoring methodology C. Duration of the project activity / crediting period D. Environmental impacts E. Stakeholders’ comments Annexes Annex 1: Contact information on participants in the proposed small scale project activity Annex 2: Information regarding public funding Annex 3: Baseline information Annex 4: Monitoring Information
-
Upload
khangminh22 -
Category
Documents
-
view
6 -
download
0
Transcript of PROJECT DESIGN DOCUMENT FORM (CDM-SSC-PDD) - SGS
PROJECT DESIGN DOCUMENT FORM (CDM-SSC-PDD) - Version 03
CDM – Executive Board
1
C L E A N D E V E L O P M E N T M E C H A N I S M
P R O J E C T D E S I G N D O C U M E N T F O R M ( C D M -SSC-PDD)
Vers ion 03 - in ef fec t as of : 22 December 2006
C O N T E N T S
A. General description of the small scale project activity
B. Application of a baseline and monitoring methodology
C. Duration of the project activity / crediting period
D. Environmental impacts
E. Stakeholders’ comments
A n n e x e s
Annex 1: Contact information on participants in the proposed small scale project activity
Annex 2: Information regarding public funding
Annex 3: Baseline information
Annex 4: Monitoring Information

PROJECT DESIGN DOCUMENT FORM (CDM-SSC-PDD) - Version 03
CDM – Executive Board
2
Revis ion h is tory of th i s document
Version Number
Date Description and reason of revision
01 21 January
2003
Initial adoption
02 8 July 2005 xThe Board agreed to revise the CDM SSC PDD to reflect guidance and
clarifications provided by the Board since version 01 of this document.
xAs a consequence, the guidelines for completing CDM SSC PDD have
been revised accordingly to version 2. The latest version can be found
at <http://cdm.unfccc.int/Reference/Documents>.
03 22 December
2006xThe Board agreed to revise the CDM project design document for small-
scale activities (CDM-SSC-PDD), taking into account CDM-PDD
and CDM-NM.

PROJECT DESIGN DOCUMENT FORM (CDM-SSC-PDD) - Version 03
CDM – Executive Board
3
S E C T I O N A . Genera l descr ip t ion of small -sca le project act ivi ty
A.1 Tit le of the small-sca le project act ivi ty:
8.75 MW Bundle Wind Power Project in Maharashtra
Version: 1
Date : 16/01/2007
A.2 Description of the small-scale project activity:
The proposed project is a bundled project activity which involves the establishment of a Wind Power
Project of 8.75 MW installed capacity enabling generation of electricity by state-of-art 1.25 MW Wind
Electricity Generators (WEGs) (One of the latest available technologies in the country developed by
M/s Suzlon Energy Limited) in the State of Maharashtra by M/s Shahi Exports Pvt. Ltd (hereafter
SEPL or project proponent).
The bundled project activity consists of 2 sub-bundles:
x Sub-bundle I : At Dhulia (3 x 1.25 MW).
x Sub-bundle II : At Nandurbar (4 x 1.25 MW)
The electricity generation from this project will contribute to annual GHG reductions estimated at
161920 tCO2e (tonnes of carbon dioxide equivalent) over period of 10 years. Although the project life
is envisaged as 20 years, it is proposed that the project activity needs to mitigate the risks involved in
Renewable Energy Technology for the first 10 years. The project activity will evacuate approximately
176.00 lakh KWh of renewable power annually to the power deficit Western Region Grid.
Purpose of the projec t ac t iv i ty :
The main purpose of the project activity is to generate electrical energy through sustainable means
using wind power resources, to uti l ize the generated output for either meeting the captive energy
demand and/or selling it to the state electricity utility and/or a third party and to contribute to climate
change mitigation efforts.
Apart from generation of renewable electricity, the project has also been conceived for the following:
x To enhance the propagation of commercialisation of wind turbines in the region.
x To contribute to the sustainable development of the region, socially, environmentally and economically.
x To reduce the prevalent regulatory risks for this project through revenues from the CDM.

PROJECT DESIGN DOCUMENT FORM (CDM-SSC-PDD) - Version 03
CDM – Executive Board
4
Contr ibut ion of pro jec t ac t iv i ty to sus ta inable development :
Ind ian economy i s h ighly dependent on “Coal” as fue l to genera te energy and for product ion
processes. Thermal power plants are the major consumers of coal in India and yet the basic electricity
needs of a large section of population are not being met.
This results in excessive demands for electrici ty and places immense stress on the environment.
Changing coal consumption pat terns wil l require a mult i -pronged strategy focusing on demand,
reducing wastage of energy and the optimum use of Renewable Energy (RE) sources.
Government of India has stipulated the following indicators for sustainable development in the interim
approval guidelines1 for CDM projects.
1. Social well-being
The proposed project act ivi ty leads to al leviat ion of poverty by establishing direct and indirect
employment benefits accruing out of ancillary units for manufacturing towers for erecting the WEGs
and for maintenance during operation of the project activity. The infrastructure in and around the project
area wil l also improve due to project act ivi t ies. This includes development of road network and
improvement of the quality of electricity in terms of its availability and frequency as the generated
electricity is fed into a deficit grid.
2. Economic well-being
The project activity leads to an investment of about INR 437.3 million to a developing region which
otherwise would not have happened in the absence of the project activity. The generated electricity is fed
into the Western Regional Grid through local grid, thereby improving the grid frequency and availability
of electr ici ty to the local consumers (vi l lagers and sub-urban habitants) which will provide new
opportunities for industries and economic activities to be setup in the area thereby resulting in greater
local employment, ul t imately leading to overal l development. The project act ivi ty also leads to
diversification of the national energy supply, which is dominated by conventional fuel based generating
units.
3. Environmental well-being
The project utilizes wind energy for generating electricity which otherwise would have been generated
through alternate fuels (most likely - fossil fuel) based power plants, thereby contributing to the reduction
in specific emissions (emissions of pollutant/unit of energy generated) including GHG emissions. As
wind power projects produce no end products in the form of solid waste (ash etc.), they address the
problem of solid waste disposal encountered by most other sources of power. Being a renewable
resource, using wind energy to generate electricity contributes to resource conservation. Thus the project
causes no negative impact on the surrounding environment contributing to environmental well-being.
1 Ministry of Environment and Forests web site: http://envfor.nic.in:80/divisions/ccd/cdm_iac.html

PROJECT DESIGN DOCUMENT FORM (CDM-SSC-PDD) - Version 03
CDM – Executive Board
5
4. Technological well-being
The project activity leads to the promotion of 1.25 MW WEGs into the region, demonstrating the
success of wind turbines, which feed the generated power into the nearest sub-station, thus increasing
energy availability and improving quality of power under the service area of the substation. Hence, the
project leads to technological well-being.
A.3 Pro jec t par t ic ipants :
Name of Par ty involved ( (host)
indica tes a hos t Par ty)
Pr ivate and/or publ ic ent i ty
( ies) project par t ic ipants (as
applicable)
K i n dly indicate if the Party
involved wishes to be
cons ide red as p ro jec t
par t ic ipant (Yes/No)
India. M/s Shahi Exports Pvt. Ltd. No.
A.4. Technical descr ip t ion of the small-sca le project activity:
I n w i n d e n e r g y g e n e r a t i o n , k i n e t i c e n e r g y o f w i n d i s c o nver ted in to mechanical energy and
subsequently into electrical energy.
Wind has considerable amount of kinetic energy when blowing at high speeds. This kinetic energy
when it passes through the blades of the wind turbines it is converted into mechanical energy and
rotates the wind blades. When the wind blades rotate, the connected generator also rotates, thereby
producing electricity.
Figure 01, Major Mechanical Parts of a Wind Turbine.

PROJECT DESIGN DOCUMENT FORM (CDM-SSC-PDD) - Version 03
CDM – Executive Board
6
The technology is a clean technology since there are no GHG emissions associated with the electricity
generation. The project installs Suzlon make WEGs of individual capacity 1.25 MW (7 WEGs).
Sal ien t Fea tures of 1 .25 MW (S 70) WEG
Sr. No. Par t icu la rs Specificat ions
1. Rotor diameter 69.1 m
2. Hub height 74 m
3. Installed electrical output 1250 kW
4. Cut-in wind speed 3 m/s
5. Rated wind speed 12 m/s
6. Cut-out wind speed 20 m/s
7. Rotor swept area 3750 m2
8. Rotational speed 13.2/19.8
9. Rotor material GRP
10. Regulation Pitch
11. Generator Asynchronous Generator, 4/6 poles
12. Rated output 250/1250 kW
13. Rotational speed 1010/1515 rpm
14. Operating voltage 690 V
15. Frequency 50 Hz
16. Protection IP 56
17. Insulation class H
18. Cooling system Air cooled
19. Gear box 3-stage gearbox, 1 planetary & 2 helical.
20. Manufacturer Winergy
21. Gear ratio 77.848
22. Nominal load 1390 kW
23. Type of cooling Oil cooling system
24. Yaw drive system 4 active electrical yaw motors
25. Yaw bearing Polyamide slide bearing
26. Safety system --
27. Aerodynamic brake 3 times independent pitch regulation
28. Mechanical brake Spring power disc brake, hydraulically released, fail safe.
Microprocessor controlled, indicating.
29. Control unit Actual operating conditions, UPS back-up system
30. Tower Tubular
31. Design standards GL/IEC

PROJECT DESIGN DOCUMENT FORM (CDM-SSC-PDD) - Version 03
CDM – Executive Board
7
Sal ien t Fea tures of 1 .25 MW (S 66) WEG
Sr. No. Par t icu la rs Specificat ions
1. Rotor diameter 66 m
2. Hub height 74 m
3. Installed electrical output 1250 kW
4. Cut-in wind speed 3 m/s
5. Rated wind speed 14 m/s
6. Cut-out wind speed 22 m/s
7. Rotor swept area 3421 m2
8. Rotational speed 1006 / 1506 rpm (50 Hz)
1208 / 1810 rpm (60 Hz)
9. Rotor material GRP
10. Regulation Pitch
11. Generator Asynchronous Generator, 4/6 pole
12. Rated output 250/1250 kW
13. Rotational speed 1010/1515 rpm
14. Operating voltage 690 V
15. Frequency 50 / 60Hz
16. Protection IP 56
17. Insulation class H
18. Cooling system Air cooled
19. Gear box 3-stage gearbox, 1 planetary & 2 helical.
20. Manufacturer Winergy
21. Gear ratio 74.917:1
22. Nominal load 1390 kW
23. Type of cooling Oil cooling system
24. Yaw drive system 4 active electrical yaw motors
25. Yaw bearing Polyamide slide bearing
26. Safety system --
27. Aerodynamic brake 3 times independent pitch regulation
28. Mechanical brake Spring power disc brake, hydraulically released, fail safe.
Microprocessor controlled, indicating.
29. Control unit Actual operating conditions, UPS back-up system
30. Tower Tubular
31. Design standards GL/IEC
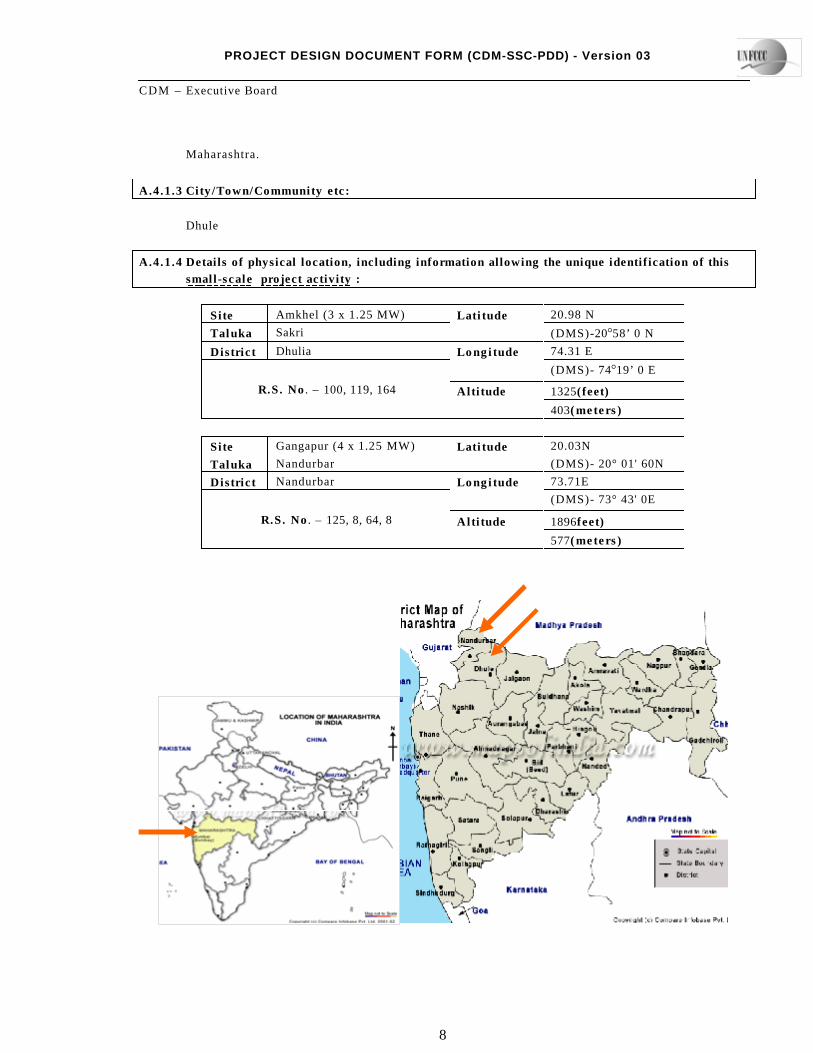
A.4.1 Locat ion of the small-sca le project act ivi ty:
A.4.1 .1 Hos t Pa r ty ( ies) :
India.
A.4.1.2 Region /S ta te /Prov ince e tc . :
PROJECT DESIGN DOCUMENT FORM (CDM-SSC-PDD) - Version 03
CDM – Executive Board
8
Maharashtra.
A.4.1.3 Ci ty /Town/Communi ty e tc :
Dhule
A.4.1.4 Details of physical location, including information al lowing the unique identif icat ion of this
smal l -sca le project act ivi ty :
Si te Amkhel (3 x 1.25 MW) 20.98 N
T a l u k a Sakri
La t i t ude
(DMS)-20q58’0 N
Dist r ic t Dhulia 74.31 EL o n g i t u d e
(DMS)- 74q19’0 E
1325(feet)R.S. No . – 100, 119, 164 Alt i tude
403( m e t e r s )
Si te Gangapur (4 x 1.25 MW) 20.03N
T a l u k a Nandurbar
La t i t ude
(DMS)- 20° 01' 60N
Dist r ic t Nandurbar 73.71EL o n g i t u d e
(DMS)- 73° 43' 0E
1896fee t )R.S. No . – 125, 8, 64, 8 Alt i tude
577( m e t e r s )

PROJECT DESIGN DOCUMENT FORM (CDM-SSC-PDD) - Version 03
CDM – Executive Board
9
Figure 02, Location Map
A.4.2 Type and ca tegory( ies ) and technology/measure of the small-sca le project act ivi ty:
As defined under Appendix B of the simplified modalities and procedures for small-scale CDM project
activities, the project activity proposes to apply following project types and categories:
� T y p e : I – Renewab le Energy P ro jec t s
� Pro jec t Ca t ego ry : I .D. – Grid connected renewable electrici ty generation
(Version 10: 23 December 2006)
Requirements with respect to technology/measure under AMS I .D . – Grid connected renewable
electricity generation (Version 10: 23 December 2006)
� This category comprises renewable energy generation units, such as photovoltaics, hydro, tidal/wave,
wind, geothermal, and renewable biomass, that supply electricity to and/or displace electricity from an
electricity distribution system that is or would have been supplied by at least one fossil fuel or non-
renewable biomass fired generating unit.
� If the unit added has both renewable and non-renewable components (e.g.. a wind/diesel unit), the
el igibi l i ty l imit of 15 MW for a small-scale CDM project act ivi ty applies only to the renewable
component. If the unit added co-fires non-renewable biomass or fossil fuel, the capacity of the entire
unit shall not exceed the limit of 15 MW.
� Biomass combined heat and power (co-generation) systems that supply electricity to and/or displace
electricity from a grid are included in this category. To qualify under this category, the sum of all
forms of energy output shall not exceed 45 MW thermal. e.g., for a biomass based co-generating system
the rating for all the boilers combined shall not exceed 45 MWthermal.
� Project activities adding renewable energy capacity should consider the following cases:
1) Adding new units;
2) Replacing old units for more efficient units.
To qualify as a small scale CDM project activity, the aggregate installed capacity after adding the new
units (case 1) or of the more efficient units (case 2) should be lower than 15 MW.
� Project activities that seek to retrofit or modify an existing facility for renewable energy generation are
included in this category. To qualify as a small scale project, the total output of the modified or retrofitted
unit shall not exceed the limit of 15 MW
Just if icat ion :
� This project activity is a 8.75 MW (< 15 MW) bundled wind power (renewable energy) project that
supply electricity to a grid that is or would have been supplied by at least one fossil fuel or non-
renewable biomass fired generating unit.
PROJECT DESIGN DOCUMENT FORM (CDM-SSC-PDD) - Version 03
CDM – Executive Board
10
� So, in light of the above the applicability of this type & category of methodology to this project is
justified.
This category comprises renewable energy, including wind power, which supplies electricity to an
electricity distribution system (grid). The proposed project will generate 189.25 lakh kWh per annum
of electricity from a renewable source (Wind Energy); this electricity will be supplied to the Western
Region Electricity Grid, where the major part of electricity comes from non-renewable electricity
generation. As the proposed project will supply electricity from a renewable source to the regional
grid, the application of Type ID is justified.
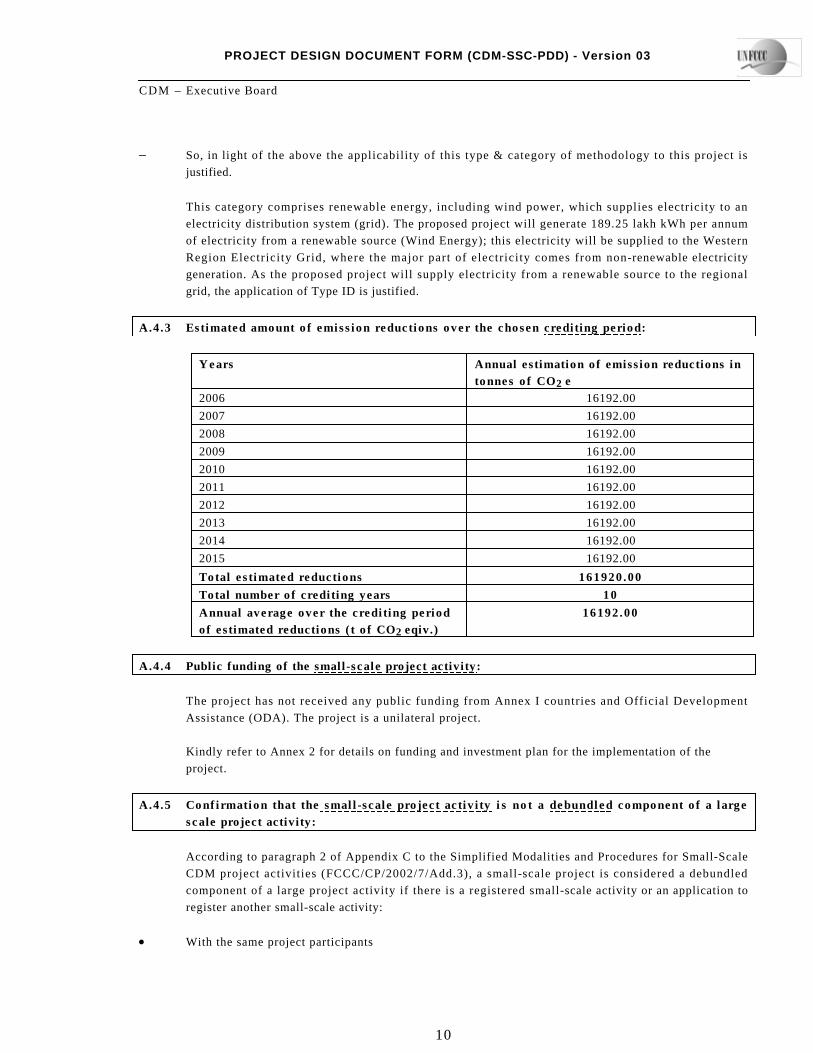
A.4.3 Es t ima ted amount o f emiss ion r educ t ions ove r the chosen c red i t ing per iod :
Y e a r s Annual es t imat ion of emiss ion reduct ions in
t onnes o f CO 2 e
2006 16192.00
2007 16192.00
2008 16192.00
2009 16192.00
2010 16192.00
2011 16192.00
2012 16192.00
2013 16192.00
2014 16192.00
2015 16192.00
Tota l e s t ima ted r educ t ions 161920 .00
Tota l number of c red i t ing years 1 0
Annua l average over the c red i t ing pe r iod
of es t imated reduc t ions ( t o f CO2 eqiv.)
16192 .00
A.4.4 Public funding of the small-sca le project act ivi ty:
The project has not received any public funding from Annex I countries and Official Development
Assistance (ODA). The project is a unilateral project.
Kindly refer to Annex 2 for details on funding and investment plan for the implementation of the
project.
A.4.5 Conf i rma t ion t ha t t he sma l l -sca le p ro jec t ac t iv i ty i s n o t a d e b u n d l e d componen t o f a l a rge
s ca le project act ivi ty:
According to paragraph 2 of Appendix C to the Simplified Modalities and Procedures for Small-Scale
CDM project activities (FCCC/CP/2002/7/Add.3), a small-scale project is considered a debundled
component of a large project activity if there is a registered small-scale activity or an application to
register another small-scale activity:
x With the same project participants

PROJECT DESIGN DOCUMENT FORM (CDM-SSC-PDD) - Version 03
CDM – Executive Board
11
x In the same project category and technology
x Registered within the previous two years; and
x Whose project boundary is within 1 km of the project boundary of the proposed small scale activity
None of the above applies to the above project and SEPL has not registered or applied for registration
of another wind project. Therefore, the proposed project is not a debundled component of a larger
CDM project activity.
S E C T I O N B . Appl icat ion of a basel ine and moni tor ing methodology
B . 1 T i t l e a n d r e f e r e n c e o f t h e a p p r o v e d b a s e l i n e a n d m o n i t o r i n g m e t h o d o l o g y a p p l i e d t o t h e
small-scale project act ivi ty:
Project Type : I – Renewable Energy Projects
Project Category: D – Grid connected renewable electricity generation
(Version 10: 23 December 2006)
Reference: Appendix B of the simplified M&P for small-scale CDM project activities (UNFCCC,
2003b)
B . 2 Just i f ica t ion of the choice of the project ca tegory:
The p ro jec t i s a r enewab le ene rgy p ro jec t gene ra t ing e l ec t r i c i ty (Type ID) – the monitoring
methodology and baseline are selected here as suggested in the document ‘Simplified Modalities and
Procedures for Small-Scale CDM project activities’
B . 3 Descr ip t ion of the p ro jec t boundary :
Projec t boundary speci f ied in the Appendix B of s impl i f ied modal i t ies and procedures i s tha t
encompasses the physical and geographical site of the renewable generation source. This includes the
wind turbine installation, pooling and MSEDCL sub-stations. The proposed project activity evacuates the
power to the Western Region Grid. Therefore all the power plants contributing electricity to the Western
Grid are taken in the connected (project) electricity system for the purpose of baseline estimation.

PROJECT DESIGN DOCUMENT FORM (CDM-SSC-PDD) - Version 03
CDM – Executive Board
12
B . 4 Descr ipt ion of base l ine and i t s deve lopment :
Base l ine Es t ima t ion :
According to Point 10, Methodology AMS I D, Version10 -
“For all other systems, the baseline is the kWh produced by the renewable generating unit multiplied
by an emission coefficient (measured in kg CO2e/kWh) calculated in a transparent and conservative
manner as:
(a) A combined margin (CM), consis t ing of the combination of operating margin (OM) and build
margin (BM) according to the procedures prescribed in the approved methodology ACM0002. Any of
the four procedures to calculate the operating margin can be chosen, but the restrictions to use the
Simple OM and the Average OM calculations must be considered.
O R
(b) The weighted average emissions (in kg CO2e/kWh) of the current generation mix. The data of the
year in which project generation occurs must be used. Calculations must be based on data from an
official source (where available) and made publicly available.”
The project opted to choose for the option (b) i.e. weighted average emission factor and the value has
been used from the latest version of B a s e l i n e C a r b o n D i o x i d e E m i s s i o n s f r o m P o w e r S e c t o r
provided by the Central Electricity Authority, Govt. of India.1
1 http://cea.nic.in/planning/c%20and%20e/Government%20of%20India%20website.htm

PROJECT DESIGN DOCUMENT FORM (CDM-SSC-PDD) - Version 03
CDM – Executive Board
13
B . 5 D e s c r i p t i o n o f h o w t h e a n t h r o p o g e n i c e m i s s i o n s o f G H G b y s o u r c e s a r e r e d u c e d b e l o w
t h o s e t h a t w o u l d h a v e o c c u r r e d i n t h e a b s e n c e o f t h e r e g i s t e r e d small-sca le C D M p r o j e c t
activity:
The installed capacity of the project is 8.75 MW, is less than the limiting capacity of 15 MW and is
thus eligible to use small-scale simplified methodologies. Further, the project activity is generation of
electricity for a grid system using wind energy. Hence, the type and category of the project activity
matches with I.D. as specified in Appendix B of the indicative simplified baseline and monitoring
methodologies for small-scale CDM project activities.
9 Just if icat ion for addit ionali ty of the project
UNFCCC simplified modalities seek to establish additionality of the project activity as per Attachment
A to Appendix B, which listed various barriers, out of which, at least one barrier shall be identified due
to which the project would not have occurred any way. Project participants identified the following
barriers for the proposed project activity.
9 Barr ie r s due to p reva i l ing Prac t i ces :
This source of energy has not been exploited widely in India. It is only during the last couple of years
that a commercial exploitation of wind energy started in a big way. Wind energy has been the most
unpredictable of all the other common sources of generating energy i.e. coal, diesel etc. Further wind
turbines generation plant has the lowest load factor of all other sources. In the concerned cases it is in
between 25.57% to 27.82%.
The total installed electricity-generating capacity in India, as on January 2005 was about 115,545 MW.
This includes 69.4% thermal (80201 MW), 26.08% hydro (30135 MW), 2.35% nuclear (2720 MW)
and 2.15% wind based generation (2488 MW)2. Coal based thermal power generation has been the
mainstay of electricity generation.
To bridge India’s peak power shortage of 13-15% and average shortage of 8-10%, in the business as
usual scenario, nearly 100,000 MW of fresh capacity addition would be required by 2012 of which
more than 75% is likely to be coal based 3.
The instal led capaci ty of Western Region at the end of f inancial year 2004-05 as pe r CEA was
33242.76 MW The total installed capacity comprises of Hydro – 5876.33 MW, Gas – 5035.72 MW,
Coal- 20816.50 MW, Nuclear- 760 MW, Wind–658.70 MW and Diesel – 17.48 MW. The hydro, gas,
thermal and nuclear energy generation in the region during 2004-05 was 10577.22 MUs, 25807.25
MUs, 141961.97 MUs & 5099.68 MUs respectively (WREB Annual Report 2004-05). As per the
2006 CEA General Review gross electrical energy generation by wind in Western Region at the end
of year 2004-2005 is only 884.12 MUs which clearly shows that the share of electricity generation
from wind is very low in the region and the current practice being followed in the region is preferential
generation of electricity from fossil fuel based power plants.
2 http://cea.nic.in/exe_summ/jan/6.pdf.
3 Power on Demand by 2012: Perspective Plan Studies, CEA, GOI.

PROJECT DESIGN DOCUMENT FORM (CDM-SSC-PDD) - Version 03
CDM – Executive Board
14
The technical wind power potential of the State of Maharashtra, which is in the western part of the
country, is approximately 3040 MW. The current practice followed by investors (investing in WEGs) is
to execute wind electricity projects in southern states2 of India because of higher generation potential
( these states observe two monsoon seasons, leading to a higher PLF). Owing to this fact, the total
capacity exploited in the state of Maharashtra (as on March 31, 2005) was just about 15% of the
technical potential , which is far behind the potential harnessed in southern states. Hence, a wind
power project in Maharashtra needs to be encouraged.
9 O t h e r B a r r i e r :
¾ In t e rms o f I nves tmen t :
The entire project was planned based on the arrangement of supplying the electricity produced to the
western regional grid of India. At the time of making the decision to invest in these windmills, the
payment mechanisms were not stabilized and delays were very common, the grid availability and other
structural readiness were not in a very dependable state. This adversity played its role. During the first
4 months of operations, Dhule site suffered a reduction in the sale of units to the extent of 80%. This
was because the equipments & necessary grid related arrangements were not in place.
This source of energy has not been exploited widely in India. It is only during the last couple of years
that a commercial exploitation of wind energy started in a big way. Wind energy has been the most
unpredictable of all the other common sources of generating energy i.e. coal, water or sun. Further
windmill generation plant has the lowest load factor of all other sources. In the concerned cases it is
between 25.57% to 27.82%.
Project proponent has chosen the activity for their urge of sustainable development, despite being not
so financially rewarding as compared to the usual business returns. In India, investment in Govt.
Securities generate a tax free return of 5 to 5.5%, long term Bank Deposits earn about 9%, Rated
Companies Debentures earn about 9 to 10%. The investors in other infrastructure projects such as
roads & urban services expect minimum annual return of 14 to 15%.
Wind power projects are comparatively more risky than these because wind, the main source for
generating the energy is not very predictable and totally beyond anybody’s control. In India annually
infla t ion ra te moves around 5%. Hence a minimum re turn between 14.40% to 15% ( i .e . ra te of
interest @ 9.40% plus inflation of 5%) from the concerned project activity is reasonably justifiable.
The term loan for the project was sanctioned by the Bank @ 8.40% i.e. 2.35% less BPLR. But due to
changes in the policy of RBI (i.e. increase in SLR and CRR) has forced all banks to change its BPLR
(Benchmark Prime lending rate), which is resulted in to increase in rate of interest in the project
2 The total technical potential of Southern region is 5585 MW and that of Western region is 5665 MW. But as per CEA General Reviev 2006 only 11.6 % ( i.e. 658 MW) of the total potential has actually been harnessed in Western region and in Southern region it goes well above 35% ( i.e. 2056 MW )
Source : http://mnes.nic.in/frame.htm?majorprog.htm

PROJECT DESIGN DOCUMENT FORM (CDM-SSC-PDD) - Version 03
CDM – Executive Board
15
proponent from 8.40% to 9.40% (BPLR is revised to 11.75%), which has adversely affected the
project.
Initially the project was sanctioned by the Bank @ 8.40% rate of interest. If we compare the effect of
change in RBI policy over the DSCR of the project without benefits from CER sale, the results are as
under:
Par t icular R a t e o f I n t e r e s t @ 8 . 4 0 % R a t e o f I n t e r e s t @ 9 . 4 0 %
DSCR 1.06 1.01
So the DSCR of the project reduced from 1.06 to 1.01, the DSCR of 1.06 was also not so attractive
for the proposal without CER sale, but after increase in the rate of interest the DSCR of proposal
almost equivalent to 1, which is not acceptable for any proposal, CER fund is required to increase the
DSCR of the proposal.
The wind turbines set up by the project proponent generate an overall annual return of 13.69 % (after
change in RBI policy). This return is arrived at estimated generation of units, operation & maintenance
expenses and all other variables materialize as expected. The adverse scenarios in any combinations
have a significant negative impact on the project profitability. Few scenarios with main variables are
given below.
Scenar ios >> 1 2 3 4
Saleable units: reduction by 10.0% 7.5% 5.0% 2.5%
IRR 11.59% 12.13% 12.66% 13.18%
O&M expenses increased by 10.0% 7.5% 5.0% 2.5%
IRR 13.49% 13.54% 13.59% 13.64%
We can say that the increase in the cost of O& M does not effect too much to the returns of the
project while decrease in the generation of unit affect the proposal adversely and the IRR comes
down to 11.59% if the electr ic i ty generat ion is reduced by 10%, which is much lesser than the
minimum return expected from the project.
The company has invested in proposed project act ivi ty. If the same amount is invested in to the
existing activity of the company (Manufacturing & Export of Textile) then the returns would have
been different. We have considered the performance figures of the company for the financial year
2004-05 and 2005-06 to asses cash returns, the results are as under:
Rs. In Lacs
Par t icular 2 0 0 4 -0 5 2 0 0 5 -0 6
Net Profit after Tax 1867.36 Lacs 2429.28 Lacs

PROJECT DESIGN DOCUMENT FORM (CDM-SSC-PDD) - Version 03
CDM – Executive Board
16
Depreciation 1032.96 Lacs 1397.97 Lacs
Cash Profit (A) 2900.32 Lacs 3827.25 Lacs
Ordinary Share Capital 11079.09 Lacs 499.97 Lacs
General Reserve 0.00 450.18 Lacs
Unsecured Loan 0.00 13200 Lacs
Other Reserves 0.00 1621.63 Lacs
Surplus in Profit & Loss Account 1867.36 Lacs 1739.78 Lacs
Term loan O/S 0.00 1102.35 Lacs
Total Investment in the Business (B) 12946.45 Lacs 18613.91 Lacs
Return against Investment (A/B) 22.40% 20.56%
On the basis of above table, we can say that the company is getting a return of around 20 to 22% on
the investment. So, if the amount would have been invested in to the existing business the company
may have get the return of 20 to 22% easily.
But, despite of lower returns (i.e. 13.90%) in wind energy, the Company has decided to invest in to the
same just to promote the renewable energy keeping in mind that the CDM benefit will improve the
returns marginally (i.e. 15.21%).
The CDM benefits of Rs. 83.06 lacs (16,192 tCO2e x approx Euro 9 per tCO2e x Rs 57 per euro) per
year are expected. This amount takes the return to the investors to a reasonably acceptable level of
15.21 %, provided the CDM benefits are available to the project participant by himself and not to be
s h a r e d w i t h a n y Govt . body . The DSCR of the p ro jec t a l so inc reased up to 1 .13 , which a l so
reasonably well for any green field proposals.
9 Regula tory Risks :
Maharashtra Electricity Regulatory Commission (MERC) in exercising its power under Sec 22(i) c
and 29 of the erstwhile ERC Act 1998, and also under Sections 62 & 86 (i) e of the EA 2003, fixed
the tariff rates of electricity when sold to the state owned utility for wind energy projects that are
commissioned after 1st April, 2003. This was a regulatory barrier as the rate at which electricity is to
be sold to State utility was fixed by MERC and binding on the project promoter who had no say in the
matter.
Further, a negative impact was created in the whole set-up owing to defaults in payment of revenue
by the State owned utility, to earlier investors in wind energy projects. While the former statement is a
direct regulatory risk, the latter statement is an indirect regulatory risk to the project promoter.
The project promoter has entered into an agreement with Maharashtra State Electricity Distribution
Company Ltd . (MSEDCL) (a sub-division of Maharashtra State Electricity Board) for the sale of
electricity to them. This Agreement (Article 18 Section 18.02 CDM Benefit) stipulates “MERC shall
be approached to review the tariff structure (contained in the Agreement) once the project becomes
eligible for CDM benefit or similar credits and any mechanism for sharing of CDM or similar credit
between the seller (in this case SEPL) and MSEDCL. The decision of the MERC will be binding on
both parties.” Hence, though an Agreement has been signed, the rate at which electricity is sold to
MSEDCL may change if SEPL obtain any benefit under CDM or they may have to share the benefit
with MSEDCL. The extent of sharing of the CDM benefit has not been specified by MERC. Hence,

PROJECT DESIGN DOCUMENT FORM (CDM-SSC-PDD) - Version 03
CDM – Executive Board
17
this is a big risk undertaken by the project promoter as revenue, either from the sale of electricity or
from the CDM benefit may be affected depending upon the decision of MERC.
A G r e e n E n e r g y F u n d h a s b e e n c r e a t e d by the Government of Maharashtra for funding power
evacuation arrangements by MSEB and development of infrastructure such as roads by the Public
Works Department of the State Government. Though the fund is theoret ical ly available but i t is
actually dependant on its “Availability” as stated in Maharashtra Government Resolution No. Pawan
2004/P No. 1274/Urja-7 dated February 26, 2004 and issued by the Industries, Energy and Labour
Department. Therefore, non-availability of the fund may delay the commercial operation of the project
and result in a financial loss to the project promoter. This also forms a risk to this project. A total of
131.25 Lakh INR has been deposited under this scheme by the SEPL.
Despite of an agreement of payment of bills within 45 days of Billing from MSEDCL, the bills are
general ly paid in about 90 days af ter bi l l ing. This also creates some problem in get t ing cash at
stipulated time.
¾ Due to Lack of Exper ience in th i s F ie ld :
The project promoter is in the business of manufacturing and export of various products. Entering into
the field of wind electricity generation was an entirely new activity for them, as they did not possess
any knowledge or experience in this field. Hence, entering into this totally new field itself was a major
barrier or a risky business for the project promoters.
In order to enter into this business, the project promoter had to upgrade the knowledge and skill not
only at the Management level but also for the subordinates in the Company who would look after this
project. This was a definite barrier for the project promoters.
¾ Due to Uncer ta in ty in Power Genera t ion :
The major additional risk faced by the promoters was the uncertainty in the amount of electricity that
can be generated and sold. Generation of electricity in a wind electric project is mainly dependant on
the available wind. As the electricity generation from the WEG is a function of the cube of the wind
speed, even small variations in the wind speed contribute to relatively large variations in the electricity
generated.
For example at the si te chosen for sett ing up a sub-bundle of the project at Dhulia in Maharashtra
state, the Plant Load Factor (PLF) varies from 21.82 % to 25.80 % for different turbines set-up at the
same site by other parties in the past and commissioned on March 31, 2004. All these turbines are of
the same make and ra t ing , i . e . 1 .25 MW and are of the same des ign and suppl ied by the same
manufacturer, M/s Suzlon Energy Ltd. The PLFs mentioned above are the averages for the year April
2004 to March 2005, and this fluctuation can be seen in the following table.
Turb ine No . PLF at 100 % Grid Avai labi l i ty
K 003 24.21 %
K 004 25.80 %
K 005 23.91 %
K 006 23.57 %

PROJECT DESIGN DOCUMENT FORM (CDM-SSC-PDD) - Version 03
CDM – Executive Board
18
K 009 21.82 %
Apart from the above variations in PLF, at the same site there is a constant variation in the PLF from
year to year owing to variations in the wind speed. A comparison in the generation of electricity in a
particular month for 2 consecutive years for the above wind generators is given the table below.
Turb ine No. k W h G e n e r a t i o n i n M a y 2 0 0 4 a t
Con t ro l l e r
k W h G e n e r a t i o n i n M a y 2 0 0 5 a t
Con t ro l l e r
K 003 369641 318745
K 004 379651 348251
K 005 370186 331142
K 006 378965 332950
K 009 345938 294117
The maximum variation in the above table is for Turbine No. K 009. However, there was a substantial
variation in the machine availability for this turbine in the month of May for the 2 years considered
above. But even where the machine availability was nearly the same as for Turbine No. K 004, the
difference in generation was 31,400 kWh, which is a variation of 8.27 %. This variation in generation
can be attributed only to variation in the wind speed at that Turbine location. This forms a major risk to
the project promoter.
The next major risk to the project promoter is the variation in the grid availability. The grid is under the
control of MSEB and the project promoter has no control over this grid and its availability. To cite an
extreme example, the grid availability for Turbine No. K 003 was 41.76 % in April 2004 and the same
was 94.81 % in April 2005. This implies that the project promoter lost 58.24 % of the generated
electricity and so lost the same percentage in revenue in April 2004. Though the above is an extreme
example, the variation in grid availability between 95 % to 99 % is quite common. This variation in the
grid availability also forms a major risk to the project promoter.
The setting up of the grid to evacuate the electricity generated is the sole responsibility of MSEB and
the project promoter has no control over this activity. Hence, any delay in setting up the grid by the
State utility forms a major risk to the project promoter as, though the turbines have been commissioned
and are in a position to generate electricity, they cannot do so as the grid is not in place. In this case
SEPL, had commissioned the machine on March, 2006 at Dhule site but could only supply electricity
and get proper revenue from August, 2006 when the grid became operational. Hence, there was a loss
of revenue for about 3 months, which again forms a risk to the project promoter.
The PLF achieved at both side differ considerably in month as well as site specific. The table given
below explain the PLF achieved at both site over a period of time.
M o n t h % P L F R e a l i z e d
Dhulia (1.25 × 3) Nandurbar (1 .25 × 4)
Mar-06 0.0646 2.6515
Apr-06 10.8780 24.3422
May-06 10.7309 40.0133
Jun-06 5.9310 42.4814
Jul-06 21.8502 50.5016

PROJECT DESIGN DOCUMENT FORM (CDM-SSC-PDD) - Version 03
CDM – Executive Board
19
Aug-06 49.9979 48.4322
Sep-06 9.5226 15.0569
Oct-06 2.0102 4.9280
Nov-06 1.8791 2.1746
Dec-06 3.4624 5.5067
A v e r a g e 11 .6327 23 .6088
It quite evident from above table that though the machine is of same capacity and site is also not so
far, the trend of realized PLF is quite different so the generation is never stable. Over and above,
there is vast difference in PLF realized, almost of 12 %. So it is one of the most important barrier to
the project promoter in achieving the normal financial benefit out of the project.
¾ Due to Natura l Ca lami t ies :
The generation of electricity from wind is, of necessity, an entirely an outdoor activity which is usually
located in a remote location, beyond the control of project promoter. The wind generators and the grid
are constantly subject to natural elements such as high winds and rain and a calamity such as a severe
thunderstorm and lightning can damage the generators and/or the grid. Whereas the cost of repairing
the generators or grid can be recovered by insuring them, the loss in revenue due to the turbine not
generating electricity when it is damaged or the grid not functioning cannot be recovered as insurance
companies normally do not provide liquidated damages in their insurance cover. Even if, the insurance
company agrees for liquidated damages cover, the insurance premium will be prohibitively very high.
To mitigate the risks mentioned in the above paragraphs and encourage the setting up of a wind power
project in Maharashtra, CDM support to the project promoters is required.
The proposed activity thus satisfies the additionality conditions as required under Attachment A to
Appendix B of the simplified modalities and procedures for small-scale CDM project activities, and
thus qualifies as a CDM project.
B . 6 Emiss ion reduc t ions :
B .6 .1 Explanat ion of methodological choices :
Baseline methodology for projects under Type I.D has been detailed in paragraphs 7-11 (Type I.D) of
the above-mentioned document. Paragraph 9 (Type I.D) applies to this project activity, which states
that:
For all other systems, the baseline is the kWh produced by the renewable generating unit multiplied by
an emission coefficient (measured in kg CO2equ/kWh) calculated in a transparent and conservative
manner as:
(a) A combined margin (CM), consisting of the combination of operating margin (OM) and build margin
(BM) according to the procedures prescribed in the approved methodology ACM0002. Any of the
four procedures to calculate the operating margin can be chosen, but the restrictions to use Simple
OM and the Average OM calculations must be considered.

PROJECT DESIGN DOCUMENT FORM (CDM-SSC-PDD) - Version 03
CDM – Executive Board
20
OR
(b) The weighted average emissions (in kg CO2equ/kWh) of the current generation mix.
Baseline emission reductions have been estimated using the weighted average emission ( in kgCO2
equ/kWh) of the current generation mix, using the most recent statistics available at the time of PDD
submission. (Paragraph 9, sub point (b))
In the proposed baseline, Western Region grid is used as the reference region for est imating the
current generation mix. Using the methodology available for small-scale project activities, the weighted
average emissions (in tCO2 e/GWh) of current generation mix of Western Region grid of India is used
for the calculation of baseline. The weighted average emission factor data calculated and provided by
Central Electricity Authority (CEA)3 is used for the proposed project activity.
B.6.2 Data and parameters tha t a re avai lab le a t va l ida t ion:
(Copy this table for each data and parameter)
Data / Param e t e r : Energy
Data unit: KWh
Description: Electricity Generation
Source of data used: Machine Provider
Value applied: 16192
Justification of the choice of data or
description of measurement methods
and procedures actually applied :
The data is provided by Suzlon Energy Ltd..
Any comment:
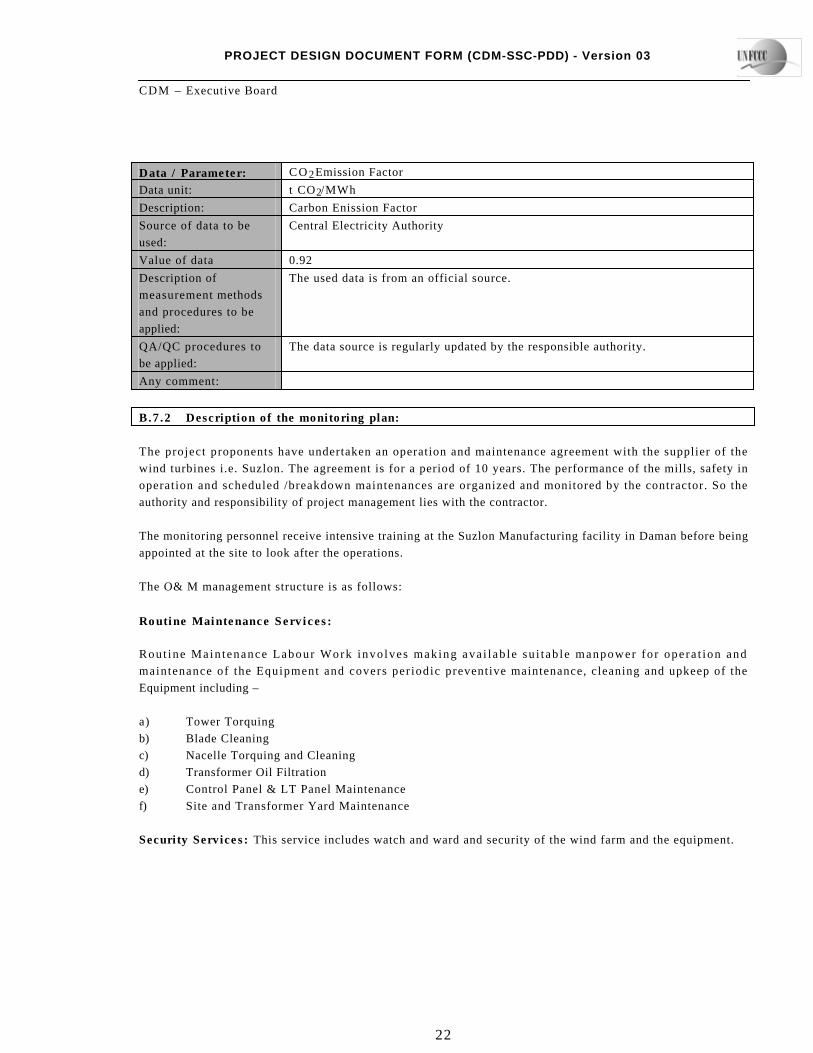
Data / Pa ramete r : C O 2 Emission Factor
Data unit: t CO2/MWh
Description: Carbon Enission Factor
Source of data used: Central Electricity Authority
Value applied: 0.92
Justification of the choice of data or
description of measurement methods
and procedures actually applied :
The used data is from an official source.
Any comment:
3 http://cea.nic.in/planning/c%20and%20e/Government%20of%20India%20website.htm

PROJECT DESIGN DOCUMENT FORM (CDM-SSC-PDD) - Version 03
CDM – Executive Board
21
B.6.3 E x -ante ca lcula t ion of emiss ion reduct ions :
Baseline Emission = Units of electricity generated X Weighted Av. Emission Factor
= 17600 × 0.92 t CO2
= 16192 t CO2 / annum
B.6 .4 Summary of the ex-an te es t imat ion of emiss ion reduc t ions :
Yea r Pro jec t Emiss ion
(t o n n e s C O 2e /yr.)
Base l ine
Emiss ions
(t o n n e s C O 2e /yr.)
L e a k a g e
(t o n n e s C O 2e / yr.)
Emiss ion
R e d u c t ions
(t o n n e s C O 2e /yr.)
2006 0 16192.00 0 16192.00
2007 0 16192.00 0 16192.00
2008 0 16192.00 0 16192.00
2009 0 16192.00 0 16192.00
2010 0 16192.00 0 16192.00
2011 0 16192.00 0 16192.00
2012 0 16192.00 0 16192.00
2013 0 16192.00 0 16192.00
2014 0 16192.00 0 16192.00
2015 0 16192.00 0 16192.00
Total (t o n n e s
C O 2e )
0 161920 .00 0 161920 .00
B . 7 Appl icat ion of a moni tor ing methodology and descr ipt ion of the moni tor ing plan:
B .7 .1 Da ta and pa rame te r s mon i to r ed :
(Copy this table for each data and parameter)
Data / Pa ramete r : Energy
Data unit: MWh
Description: Electricity Generation
Source of data to be
used:
MSEDCL
Value of data 17600
Description of
measurement methods
and procedures to be
applied:
The data can be very accurately measured. The meters installed measure
mentioned variables on a continuous basis. Every month these meter readings will
be recorded by plant personnel, these records will be archived for crosschecking
yearly figures.
QA/QC procedures to
be applied:
The meter maintained by MSEDCL
Any comment:
PROJECT DESIGN DOCUMENT FORM (CDM-SSC-PDD) - Version 03
CDM – Executive Board
22
Data / Pa ramete r : C O 2 Emission Factor
Data unit: t CO2/MWh
Description: Carbon Enission Factor
Source of data to be
used:
Central Electricity Authority
Value of data 0.92
Description of
measurement methods
and procedures to be
applied:
The used data is from an official source.
QA/QC procedures to
be applied:
The data source is regularly updated by the responsible authority.
Any comment:
B.7 .2 Descr ip t ion of the moni tor ing p lan:
The project proponents have undertaken an operation and maintenance agreement with the supplier of the
wind turbines i.e. Suzlon. The agreement is for a period of 10 years. The performance of the mills, safety in
operation and scheduled /breakdown maintenances are organized and monitored by the contractor. So the
authority and responsibility of project management lies with the contractor.
The monitoring personnel receive intensive training at the Suzlon Manufacturing facility in Daman before being
appointed at the site to look after the operations.
The O& M management structure is as follows:
R o u t i n e M a i n t e n a n c e S e r v i c e s :
Rout ine Main tenance Labour Work invo lves mak ing ava i l ab le su i t ab le manpower fo r ope ra t ion and
maintenance of the Equipment and covers per iodic preventive maintenance, cleaning and upkeep of the
Equipment including –
a) Tower Torquing
b) Blade Cleaning
c) Nacelle Torquing and Cleaning
d) Transformer Oil Filtration
e) Control Panel & LT Panel Maintenance
f) Site and Transformer Yard Maintenance
Secur i ty Service s : This service includes watch and ward and security of the wind farm and the equipment.

PROJECT DESIGN DOCUMENT FORM (CDM-SSC-PDD) - Version 03
CDM – Executive Board
23
M a n a g e m e n t S e r v i c e s :
a) Data logging in for power generation, grid availability, machine availability.
b) Preparation and submission of monthly performance report in agreed format.
c) Taking monthly meter reading jointly with utility, of power generated at Wind Farm and supplied to
grid from the meter/s maintained by utility for the purpose and co-ordinate to obtain necessary power
credit report/ certificate.
Technical Se r v i c e s :
a) Visual inspection of the WTG and all parts thereof.
b) Technical assistance including checking of various technical, safety and operational parameters of the
equipment, trouble shooting and relevant technical services.
The project activity essentially involves generation of electricity from wind, the employed WEG can only
convert wind energy into electrical energy and cannot use any other input fuel for electricity generation. As the
operation of WEGs is emission free and no emissions are produced during the lifetime of the WEG.
Although it is being anticipated that there would be no unintended emissions/leakages from this project ,
however, if any such condition arises, and leakage effect is found due to the project, such leakage will be
accounted accordingly as mentioned in the chosen applied baseline methodology.
� The proposed project activity requires evacuation facilities for sale to grid and the evacuation facility is
essentially maintained by the state power utility (MSEDCL).
� T h e electr ic i ty generat ion measurements are required by the ut i l i ty and the investors to assess
electricity sales revenue and / or wheeling charges.
� The project activity has therefore envisaged two independent measurements of generated electricity
from the wind turbines.
� The primary recording of the electricity fed to the state utility grid will be carried out jointly at the
incoming feeder of the state power utility (MSEDCL). Machines for sale to utility will be connected to
the feeder.
� The joint measurement will be carried out once in a month in presence of both parties (the developer’s
representative and officials of the state power utility). Both parties will sign the recorded reading.
� Metering equipment- Metering is carried out through electronic trivector meters of accuracy class
0.2% required for the project. The main meter shall be installed and owned by MSEDCL, whereas the
project proponent owns the check meters. The metering equipments are maintained in accordance
with electricity standards.
� Meter Readings- The monthly meter readings (both main and check meters) at the project site and the
receiving stat ion shall be taken simultaneously and joint ly by the part ies on the f irs t day of the
fo l lowing month . At the conc lus ion of each mete r read ing an appoin ted representat ive of the
MSEDCL and the company signs a document indicating the number of kWh exported to the grid
� The secondary monitoring, which will provide a backup (fai l-safe measure) in case the pr imary
monitoring is not carried out, would be done at the individual WEGs. Each WEG is equipped with an
integrated electronic meter. These meters are connected to the Central Monitoring Station (CMS) of
the entire wind farm through a wireless Radio Frequency (RF) network (SCADA). The generation
data of individual machine can be monitored as a real-time entity at CMS. The snapshot of generation

PROJECT DESIGN DOCUMENT FORM (CDM-SSC-PDD) - Version 03
CDM – Executive Board
24
on the last day of every calendar month will be kept as a record both in electronic as well as printed
(paper) form.
All the relevant data & reports for maintaining accuracy in future monitoring and reporting of GHGs
emission reduction is with SEPL, which follows Quality Management System (QMS) procedure as per
ISO 9001 and is ISO certified organization.
SEPL has appointed a fu l l t ime projec t in-c h a r g e t o m a n a g e t h e o verall project activities after
commissioning. The project in-c h a r g e s u p e r v i s e s t h e f u n c t i o n i n g o f t h e W i n d f a r m i n c l o s e
coordination with the officials 7 technical personnel of Suzlon Energy Limited (SEL).
B . 8 Date o f comple t ion o f the app l ica t ion o f the base l i ne and mon i to r ing me thodo logy and the
name of the respons ib le person(s ) /en t i ty ( ies )
Date of completion of Baseline and Monitoring methodology – 15th January 2007.
S E C T I O N C . Durat ion of the project act ivi ty / c red i t ing per iod
C . 1 Dura t ion of the project act ivi ty:
C .1 .1 Star t ing date of the project act ivi ty:
27/10/2005
C.1.2 Expected operational lifetime of the project activity:
20 Years
C . 2 Choice of the c red i t ing per iod and re la ted informat ion:
C .2 .1 Renewable c red i t ing pe r iod
Not opted for.
C.2 .1 .1 Star t ing date of the f i rs t c red i t ing per iod :
Not applicable
C.2 .1 .2 Length of the f i rs t c red i t ing per iod :
Not applicable
PROJECT DESIGN DOCUMENT FORM (CDM-SSC-PDD) - Version 03
CDM – Executive Board
25
C.2.2 . F ixed c red i t ing per iod :
C.2 .2 .1 Star t ing da te :
1st April 2007
C.2 .2 .2 L e n g t h :
10 years.
S E C T I O N D . Env i ronmenta l impac t s
D.1 I f r equ i r ed by t he hos t Pa r ty , documenta t ion on the analys is of the envi ronmenta l impacts of
the project ac t iv i ty :
The project activity does not fall under the purview of Environmental Impact Assessment notification of the
Ministry of Environment and Forests (MoEF), Government of India (GOI) and the project activity is exempted
from environmental clearances. The project activity has no significant impact on the environment. However,
certain foreseen impacts due to the project activity are discussed below:
Impact on airWind energy plants are known to contribute to zero atmospheric pollution as no fuel combustion is involved
during any stage of the operation.
Impact on waterThere is absolutely no effluent discharge during operation of wind turbine generators.
Impact on ecologyThere are no known migratory birds/endangered species in the region of project activity. Therefore no harm on
the ecological environment is envisaged.
Impact due to noiseNoise is generated due to the movement of rotor blades. Noise is very much below the regulatory norms. It
has no direct effect on the population, as the area is less populated and noise generated will be attenuated by
ambient condit ions. The consider ing the overa l l impact of the pro jec t in reduc ing GHG’s, c rea t ion of
employment etc., makes this effect negligible.
Socio-Economic ImpactsThere is no inconvenience to the local community due to the transmission lines. The locals have benefited
economically through land sales. The project activity helps the up-liftment of skilled and unskilled manpower in
the region. The project will be providing employment opportunities not only during the construction phase, but
also during its operational lifetime. The project activity improves employment rate and livelihood of local
populace in the vicinity of the project. Moreover, the project generates eco-friendly, GHG free power, which
contributes to sustainable development of the region.

PROJECT DESIGN DOCUMENT FORM (CDM-SSC-PDD) - Version 03
CDM – Executive Board
26
ConclusionThe net impact under environmental pollution category would be positive as all necessary abatement measures
would be adopted and periodically monitored. The project activity does not have any major adverse impacts on
environment during its construction or operational phase. The human-interest parameters would show positive
impacts due to increased job opportunities at the facility as well as other ancillary units coming up.
D.2 I f env i ronmen ta l impac t s a r e cons ide r ed s i gn i f i c an t by t he p ro j ec t pa r t i c i pan t s o r t he h o s t
Par ty , p l e a s e p r o v i d e c o n c l u s i o n s a n d a l l r e f e r e n c e s t o s u p p o r t d o c u m e n t a t i o n o f a n
e n v i r o n m e n t a l i m p a c t a s s e s s m e n t u n d e r t a k e n i n a c c o r d a n c e w i t h t h e p r o c e d u r e s a s
r equ i red by the hos t Par ty :
Not Applicable.
S E C T I O N E . S t a k e h o l d e r s ’ c o m m e n t s
E .1 B r i e f descr ipt ion how comments by local s t a k e h o l d e r s have been inv i ted and compi led :
SEPL identified local communities, farmers, and villagers, as the stakeholders with an interest in the
CDM activities. The meeting was conducted separately for both the sites i.e., Dhule & Nandurbar.
Accordingly, SEPL issued a letters to all the respective stakeholders requesting all to attend meeting
or depute representatives at respective venues:
S.No. Si te V e n u e D a t e
1. Dhule Amkhel Village, Taluka – Sakri, Dist. Dhule. 19/06/2006
2. Nandurbar Gangapur village, Taluka – Nandurbar, Dist.. Nandurbar 19/06/2006
The agenda of the meeting was fixed as follows:
x Welcome
x Description of the project details.
x Queries and responses from the proponent and the stakeholders.
x Vote of Thanks.
The stake holder’s view is SEPL in its own small way is contributing positively to local economy &
development.
E.2 Summary o f the comment s r ece ived :
Stakeholders had no objections from installations of WEGs instead they have openly said that wind
power projects helped to us by…
x Additional revenue generated thro’ land / lease to outsiders like contractors & their employees.
x Job opportunities for day -to - day maintenance and security of WEGs
x Developments of roads.
x No any adverse impact on rains, agriculture.
PROJECT DESIGN DOCUMENT FORM (CDM-SSC-PDD) - Version 03
CDM – Executive Board
27
E.3 Repor t on how due accoun t was t aken o f any comments r ece ived :
The stakeholders have given very positive feedback and thus no measures were required to be taken.

PROJECT DESIGN DOCUMENT FORM (CDM-SSC-PDD) - Version 03
CDM – Executive Board
28
A n n e x 1
C O N T A C T I N F O R M A T I O N O N P A R T I C I P A N T S I N T H E P R O J E C T A C T I V I T Y
Organization: M/s Shahi Exports Pvt. Ltd.
Street/P.O.Box: Industrial Plot No. -1, Sector-28
Building: --
City: Faridabad
State/Region: Haryana
Postfix/ZIP: 121 008
Country: India
Telephone: +91 129 2273980, 504444
FAX: +91 129 2273485, 2273491
E-M ail: [email protected]
URL:
Represented by:
Title:
Salutation: Mr
Last Name: Gupta
Middle Name: --
First Name: Vijay
Department: Management
Mobile: 09868845049
Direct FAX: --
Direct tel: --
Personal E-Mail: [email protected]

PROJECT DESIGN DOCUMENT FORM (CDM-SSC-PDD) - Version 03
CDM – Executive Board
29
A n n e x 2
I N F O R M A T I O N R E G A R D I N G P U B L I C F U N D I N G
� The project has not received any public funding and Official Development Assistance (ODA).
� The project is a unilateral project.

PROJECT DESIGN DOCUMENT FORM (CDM-SSC-PDD) - Version 03
CDM – Executive Board
30
A n n e x 3
B A S E L I N E I N F O R M A T I O N
Baseline emissions are calculated as the kWh produced by the project act ivi ty mult ipl ied by an
emission coefficient for the Western Regional grid, calculated as the weighted average emissions (in
kg CO2equ/kWh) of the current generation mix.
BE = EGy * CEFgrid
Where EGy is the net quantity of electricity generated by the project in year y, and CEFgrid is the
carbon emissions factor of the Western grid.
CEFgrid is taken from CDM database provided by CEA and i t is approved by DNA i.e Ministry of
Environment and Forest, India.
0.92 tCO2/MWh0 tCO2/GWh
Baseline Emission Reductions
Year UnitsBaseline Emission
Project Emmision
LeakageEmission Reduction
(MWh) tCO2
2007-08 17600.00 16192.0000 0 0 16192.00
2008-09 17600.00 16192.0000 0 0 16192.00
2009-10 17600.00 16192.0000 0 0 16192.00
2010-11 17600.00 16192.0000 0 0 16192.00
2011-12 17600.00 16192.0000 0 0 16192.00
2012-13 17600.00 16192.0000 0 0 16192.00
2013-14 17600.00 16192.0000 0 0 16192.00
2014-15 17600.00 16192.0000 0 0 16192.00
2015-16 17600.00 16192.0000 0 0 16192.00
2016-17 17600.00 16192.0000 0 0 16192.00
Total 176000.00 161920 0.00 0 161920.00
Annual Average 17600 16192 0 0 16192
Baseline EmmisionProject Emmision
PROJECT DESIGN DOCUMENT FORM (CDM-SSC-PDD) - Version 03
CDM – Executive Board
31
A n n e x 4
M O N I T O R I N G I N F O R M A T I O N
The poin ts g iven be low deta i l the moni tor ing p lan:
x The Electronic Meter that is used for monitoring is the Export-Import Energy Meter and is, installed before the grid.
x Its is a three phase, Four wire, 50Hz, 110 Volts, 6Amp,Time of Day (ToD), 0.2 class Export-Import tri- vector Energy meter.
x The calibration procedure followed, requires calibrating the meter once in a 12 month, by the MSEDCL. MSEDCL is State Electricity Utility Company
which functions under Government of Maharashtra (GoM) as per Central Electricity Act & it is responsible for Energy Meter calibration check with their
calibrated Refrence Standard Meter having tracability with International Standards through Institute for Design of Electric Measuring Instruments, Sion,
Mumbai (IDEMI, Govt. of India Institution). The Purchaser/ wheeling agent of power, performs calibration check in presence of representative of owner.
x The import and export of electricity is continuously monitored by the export/ import meter and the data is recorded on a monthly basis jointly by the
proponent and the electricity board
x This meter is located at the delivery point of wind power in MSEDCL grid. This accounts for the import of electricity that is used by the Project proponent.
Hence the net electricity generated is calculated from the joint meter reading and recorded /archived in paper/electronic.
The comple te moni tor ing respons ib i l i ty i s car r ied out as fol lows:
x Monitoring is joint responsibility of both owner as well as MSEDCL hence, daily monitoring is in the scope of owner
x Monthly monitoring is a joint responsibility. All services are provided by MSEDCL to the owner of wind farm.
x Though the ownership of the meter is with owner, but it is in possession of SEB’s sealed meter box under lock & Key as per statutory requirements. Owner
can only see readings through glass window of sealed meter box

PROJECT DESIGN DOCUMENT FORM (CDM-SSC-PDD) - Version 03
CDM – Executive Board
32
Qual i ty control (QC) and qual i ty assurance (QA) p rocedures a r e be ing unde r t aken fo r da t a mon i to red
Data(Indicate table and ID number e.g. 3.-1.; 3.2.)
Uncertainty level of data (High/Medium/Low)
Explain QA/QC procedures planned for these data, or why such procedures are not necessary.
1 Low This Data will be directly used for calculating emission reduction. Sales record to grid to be used with other
record to check for consistency
2 Low Default data (for emission factors) and CEA statistics (for energy data) are used to check the local data.
- - - - -