Progress Report - Gujranwala Waste Management Company
409
JAPAN INTERNATIONAL COOPERATION AGENCY CITY DISTRICT GOVERNMENT GUJRANWALA LOCAL GOVERNMENT AND COMMUNITY DEVELOPMENT DEPARTMENT GOVERNMENT OF THE PUNJAB ISLAMIC REPUBLIC OF PAKISTAN PROJECT FOR INTEGRATED SOLID WASTE MANAGEMENT MASTER PLAN IN GUJRANWALA DRAFT FINAL REPORT VOLUME 1 MAIN REPORT September 2015 CTI ENGINEERING INTERNATIONAL CO., LTD. NJS CONSULTANTS CO., LTD. EX RESEARCH INSTITUTE LTD.
-
Upload
khangminh22 -
Category
Documents
-
view
1 -
download
0
Transcript of Progress Report - Gujranwala Waste Management Company

JAPAN INTERNATIONAL COOPERATION AGENCY
CITY DISTRICT GOVERNMENT GUJRANWALA
LOCAL GOVERNMENT AND COMMUNITY DEVELOPMENT DEPARTMENT GOVERNMENT OF THE PUNJAB
ISLAMIC REPUBLIC OF PAKISTAN
PROJECT FOR
INTEGRATED SOLID WASTE MANAGEMENT MASTER PLAN
IN GUJRANWALA
DRAFT FINAL REPORT
VOLUME 1 MAIN REPORT
September 2015
CTI ENGINEERING INTERNATIONAL CO., LTD.
NJS CONSULTANTS CO., LTD.
EX RESEARCH INSTITUTE LTD.

All Pakistan Rupee amounts including project costs shown in this report are stated in 2015 prices
unless otherwise indicated. The amounts are estimated on the basis of foreign prices by applying
the interbank currency exchange rates as of 1st of September 2015, namely; USD1 = Rs. 102.92 =
JPY 121.22.

i
LOCATION MAP


iii
COMPOSITION OF DRAFT FINAL REPORT
Volume 1 MAIN REPORT
Volume 2 SUPPORTING REPORT
Section A Waste Amount and Composition Analysis
Section B Waste Collection and Transportation
Section C Final Disposal
Section D Intermediate Treatment and 3R Promotion
Section E Environmental Education and Public Awareness Raising
Section F Economic and Financial Aspect
Section G Institutional Strengthening and Organizational Restructuring
Section H Environmental and Social Considerations
Section I Hospital, Industrial, and Construction and Demolition Waste
Management

v
PROJECT
FOR
INTEGRATED SOLID WASTE MANAGEMENT
MASTER PLAN IN GUJRANWALA
DRAFT FINAL REPORT
VOLUME 1
MAIN REPORT
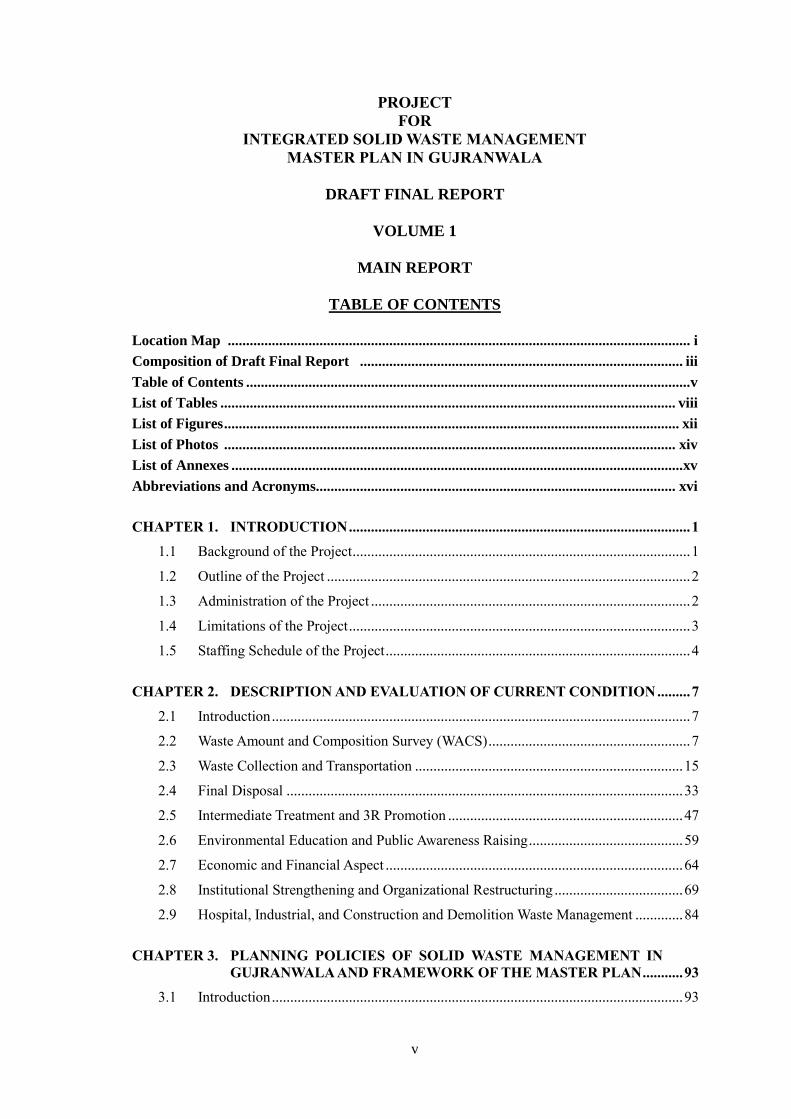
TABLE OF CONTENTS
Location Map .............................................................................................................................. i
Composition of Draft Final Report ........................................................................................ iii
Table of Contents ......................................................................................................................... v
List of Tables ............................................................................................................................ viii
List of Figures ............................................................................................................................ xii
List of Photos ........................................................................................................................... xiv
List of Annexes ........................................................................................................................... xv
Abbreviations and Acronyms.................................................................................................. xvi
CHAPTER 1. INTRODUCTION ............................................................................................. 1
1.1 Background of the Project ............................................................................................ 1
1.2 Outline of the Project ................................................................................................... 2
1.3 Administration of the Project ....................................................................................... 2
1.4 Limitations of the Project ............................................................................................. 3
1.5 Staffing Schedule of the Project ................................................................................... 4
CHAPTER 2. DESCRIPTION AND EVALUATION OF CURRENT CONDITION ......... 7
2.1 Introduction .................................................................................................................. 7
2.2 Waste Amount and Composition Survey (WACS) ....................................................... 7
2.3 Waste Collection and Transportation ......................................................................... 15
2.4 Final Disposal ............................................................................................................ 33
2.5 Intermediate Treatment and 3R Promotion ................................................................ 47
2.6 Environmental Education and Public Awareness Raising .......................................... 59
2.7 Economic and Financial Aspect ................................................................................. 64
2.8 Institutional Strengthening and Organizational Restructuring ................................... 69
2.9 Hospital, Industrial, and Construction and Demolition Waste Management ............. 84
CHAPTER 3. PLANNING POLICIES OF SOLID WASTE MANAGEMENT IN
GUJRANWALA AND FRAMEWORK OF THE MASTER PLAN ........... 93
3.1 Introduction ................................................................................................................ 93

vi
3.2 Establishment of Principles and Planning Policies for ISWM in Gujranwala ........... 93
3.3 Planning Strategy for ISWM in Gujranwala .............................................................. 96
3.4 Planning Direction of the Master Plan ....................................................................... 97
CHAPTER 4. FORMULATION OF THE MASTER PLAN ............................................. 103
4.1 Introduction .............................................................................................................. 103
4.2 Socioeconomic Aspect ............................................................................................. 103
4.3 Present and Future Waste Amounts and Composition .............................................. 108
4.4 Waste Collection and Transportation Plan................................................................ 115
4.5 Final Disposal Plan ................................................................................................... 146
4.6 Intermediate Treatment and 3R Promotion Plan ...................................................... 165
4.7 Environmental Education and Public Awareness Raising Plan ................................ 181
4.8 Economic and Financial Plan ................................................................................... 193
4.9 Environmental Monitoring Plan ............................................................................... 203
4.10 Institutional Strengthening and Organizational Plan ................................................ 210
4.11 Recommendations on Hospital, Industrial, and Construction and Demolition
Waste Management .................................................................................................. 225
4.12 Development of the Master Plan Alternatives .......................................................... 226
4.13 Evaluation of the Master Plan Alternatives .............................................................. 228
4.14 Evaluation of the Optimum Master Plan .................................................................. 233
4.15 Future Waste Stream of the ISWM Master Pan ........................................................ 250
4.16 Operation and Effect Indicators for Project Evaluation ........................................... 252
4.17 Implementation Schedule and Cost, and Plan of Operation ..................................... 256
4.18 Selection of Priority Projects .................................................................................... 259
CHAPTER 5. ENVIRONMENTAL AND SOCIAL CONSIDERATIONS ....................... 261
5.1 Introduction .............................................................................................................. 261
5.2 Planning Procedures and Selection of Optimum Master Plan .................................. 261
5.3 Baseline of Environmental and Social Condition .................................................... 263
5.4 Confirmation of Environmental and Social Considerations Systems and
Organizations in Pakistan ......................................................................................... 265
5.5 Scoping for Consideration of EIA or IEE Study ...................................................... 270
5.6 Impact Forecast ........................................................................................................ 271
5.7 Impact Assessment and Review of the Proposed Project ......................................... 276
5.8 Stakeholder Meeting ................................................................................................. 281
CHAPTER 6. PROPOSAL FOR THE ACTION PLAN .................................................... 283
6.1 Introduction .............................................................................................................. 283
6.2 Action Plan for Waste Collection and Transportation .............................................. 283

vii
6.3 Action Plan for Final Disposal ................................................................................. 294
6.4 Action Plan for Intermediate Treatment and 3R Promotion..................................... 308
6.5 Action Plan for Environmental Education and Public Awareness Raising .............. 312
6.6 Action Plan for Economic and Financial Aspect ..................................................... 316
6.7 Action Plan for Environmental Monitoring ............................................................. 320
6.8 Action Plan for Institutional Strengthening and Organizational Restructuring ....... 327
CHAPTER 7. CONCLUSION .............................................................................................. 331
CHAPTER 8. RECOMMENDATIONS .............................................................................. 332
ANNEXES

viii
LIST OF TABLES
Table 1.5.1 Members of the Project Management Unit (PMU) ................................................ 4 Table 2.2.1 Types of Waste Generation Sources and Number of Samples for Waste
Amount Survey ...................................................................................................... 8 Table 2.2.2 Waste Generation Rate of Each Generation Source ............................................... 9 Table 2.2.3 Types of Waste Generation Sources and Number of Samples for the Waste
Composition Survey ............................................................................................. 10 Table 2.2.4 Waste Composition of Each Generation Source (Average of the Three
Survey Results) .................................................................................................... 12 Table 2.2.5 Number of Samples for Chemical Composition Survey ...................................... 13 Table 2.2.6 Results of Three-Component Analysis of Each Generation Source (Average)
.............................................................................................................................. 14 Table 2.2.7 Results of Carbon and Nitrogen Analysis of Each Generation Source
(Average) .............................................................................................................. 14 Table 2.3.1 Summary of Waste Collection and Transportation Analysis by Vehicle Type ..... 16 Table 2.3.2 Key Factors affecting Operation Time during the Survey.................................... 16 Table 2.3.3 Waste Collection Service Coverage Area and Population, and their
Percentage ............................................................................................................ 20 Table 2.3.4 Location of Garbage Containers in Gujranwala City ........................................... 22 Table 2.3.5 Summary of the Status on Each Transfer Station ................................................. 23 Table 2.3.6 Average Daily Collection Tonnage per Arm-roll Truck/Tractor Trolley .............. 24 Table 2.3.7 Average Number of Trips per Arm-Roll Truck/Tractor Trolley ........................... 25 Table 2.3.8 List of Vehicles in GWMC ................................................................................... 26 Table 2.3.9 O&M Expense from 2006 to 2013 ....................................................................... 27 Table 2.3.10 Waste Amount Collected by the One Time Cleaning Activity ............................. 29 Table 2.3.11 Number of Illegal Dumping Sites in the Towns ................................................... 30 Table 2.3.12 Identification of Problems and Issues on Waste Collection and
Transportation ...................................................................................................... 32 Table 2.4.1 Record of Incoming Vehicles (Arm-Roll Truck) to Chianwali Disposal Site ...... 36 Table 2.4.2 Number of Functional Vehicles in Fiscal Years 2006-2007 to 2012-2013 ........... 37 Table 2.4.3 Annual and Cumulative Waste Disposal Amounts at Chianwali ......................... 37 Table 2.4.4 Monthly Annual and Cumulative Waste Disposal Amount at Gondlanwala ........ 37 Table 2.4.5 Daily Incoming Waste Amount at Gondlanwala Disposal Site (September
2014) .................................................................................................................... 38 Table 2.4.6 Outline of Top-Ranked Sites for Final Disposal of Waste in Gujranwala ............ 45 Table 2.4.7 Identification of Problems and Issues in Final Disposal ...................................... 46 Table 2.5.1 Number of Waste Pickers at Container and Final Disposal Sites ......................... 50 Table 2.5.2 Price of Recyclables ............................................................................................. 51 Table 2.5.3 Typical Industries, Recyclables, Destinations and Final Products ....................... 52 Table 2.5.4 Comparison of Cost and Consumption of Chemical Fertilizers and Compost
Application on Crops in Gujranwala City and Sadar Tehsil (2013-2014) ........... 54 Table 2.5.5 Salient Features of the Lahore Compost Plant ..................................................... 55 Table 2.5.6 Salient Features of the D.G. Khan Cement RDF Plant ........................................ 57 Table 2.5.7 Identification of Problems and Issues in Intermediate Treatment and 3R ............ 58 Table 2.6.1 Identification of Problems and Issues on Environmental Education and
Public Awareness .................................................................................................. 63 Table 2.7.1 Town-Wise Population in Project-Related Town in Gujranwala.......................... 64 Table 2.7.2 Estimated and Forecast Percentage of Population by Economic Category in
Gujranwala ........................................................................................................... 65 Table 2.7.3 Industrial Profile of Gujranwala ........................................................................... 65 Table 2.7.4 Major Road Network in Gujranwala in 2008 ....................................................... 66 Table 2.7.5 Number of Educational Institutions in Gujranwala and Punjab ........................... 66 Table 2.7.6 Budget for SWM Services of GWMC ................................................................. 67 Table 2.7.7 Identification of Problems and Issues on Economic and Financial Aspect .......... 68

ix
Table 2.8.1 Other Federal Legislations Related to Solid Waste Management ......................... 69 Table 2.8.2 Important Laws and Regulations Concerning Solid Waste Management in
Punjab Province .................................................................................................... 71 Table 2.8.3 Factors for Success and Failure of Private Sector Involvement ........................... 81 Table 2.8.4 Identification of Problems and Issues on Institutional Strengthening and
Organizational Restructuring ................................................................................ 83 Table 2.9.1 Sources of C&D Waste Generated in Gujranwala ................................................ 89 Table 2.9.2 Identification of Problems and Issues on Hospital, Industrial, and
Construction and Demolition Waste Management ................................................ 91 Table 3.2.1 Waste Category and Management Responsibility ................................................. 94 Table 3.2.2 Parties Involved in Solid Waste Management and Their Responsibilities ............ 95 Table 4.2.1 Town-wise Population in the Area of ISWM Master Plan (1998 Census) .......... 104 Table 4.2.2 Projected Population in 98 UCs in Gujranwala .................................................. 105 Table 4.2.3 Estimated Population in the Project Area for ISWM Plan (unit: 1,000
persons) ............................................................................................................... 106 Table 4.2.4 GDP Real Growth Rate, Inflation Rate and Nominal GDP Growth Rate per
Annum of Pakistan during 2009-2013 ............................................................... 107 Table 4.2.5 Comparison of GDP Real Growth Rate Record among Punjab, Rest of
Pakistan and Pakistan during 1973-2000 ........................................................... 107 Table 4.2.6 Comparison of GDP Real Growth Rate Record among Punjab, Rest of
Pakistan and Pakistan during 2000-2011 ........................................................... 107 Table 4.2.7 IMF’s Medium-Term Macroeconomic Framework ............................................ 107 Table 4.3.1 Income Group Ration in 64 Urban UCs .............................................................. 109 Table 4.3.2 Adopted Per Capita Domestic Waste Generation Rate in 2014 .......................... 110 Table 4.3.3 Daily Average Regular Time Waste Collection Amount (Sep.2014 -
Feb.2015) ............................................................................................................ 110 Table 4.3.4 Demarcation of Waste Collection Service Area (March 2014) ........................... 111 Table 4.3.5 Per Capita Domestic Waste Generation Rate ...................................................... 111 Table 4.3.6 Planned Domestic Waste Collection Rate ........................................................... 112 Table 4.3.7 Commercial and Institutional Waste Ratio to Domestic Waste Amount for
Collection ............................................................................................................ 112 Table 4.3.8 Estimated Waste Generation Amount in the Project Area ................................... 113 Table 4.3.9 Weighted Average of Domestic Waste Composition........................................... 113 Table 4.3.10 3R and Intermediate Potential by Domestic Waste Composition ....................... 114 Table 4.3.11 Waste Amount for Major Elements in Waste Management Stream in 2014 ....... 114 Table 4.4.1 Summary of Each Case on a Narrow Street ........................................................ 119 Table 4.4.2 Annual Cost of Each Item on a Narrow Street .................................................... 121 Table 4.4.3 Cost Comparison Table on Each Case ................................................................ 122 Table 4.4.4 Result of the Comparison in Each Case .............................................................. 122 Table 4.4.5 Summary of Each Case on a Wide Street ........................................................... 122 Table 4.4.6 Annual Cost of Each Item on a Wide Street ....................................................... 124 Table 4.4.7 Annual Cost for Each Case ................................................................................. 124 Table 4.4.8 Comparison Table on Each Case ......................................................................... 124 Table 4.4.9 Summary of Planned Waste Collection Population and Amount (Year
2014-2018) .......................................................................................................... 126 Table 4.4.10 Summary of Planned Waste Collection Population and Amount (Year
2019-2022) .......................................................................................................... 126 Table 4.4.11 Summary of Planned Waste Collection Population and Amount (Year
2023-2026) .......................................................................................................... 127 Table 4.4.12 Summary of Planned Waste Collection Population and Amount (Year
2027-2030) .......................................................................................................... 128 Table 4.4.13 Type of Vehicles in Use ...................................................................................... 128 Table 4.4.14 Vehicles Applied to Waste Collection and Transportation in the Master Plan .... 129 Table 4.4.15 Waste Loading Capacity and Number of Trips of Each Vehicle ......................... 129 Table 4.4.16 Total Number of Vehicles Required in 64 UCs (Year 2016-2030) ..................... 129

x
Table 4.4.17 Total Number of Vehicles Required in 34 UCs (Year 2016-2030) ..................... 130 Table 4.4.18 Existing Containers in the City .......................................................................... 130 Table 4.4.19 Total Number of Containers Required in 64 UCs (Year 2016-2030) ................. 131 Table 4.4.20 Total Number of Containers Required in 34 UCs (Year 2016-2030) ................. 131 Table 4.4.21 Necessary Number of Workers for Waste Collection (Year 2016-2030)............ 131 Table 4.4.22 Total Cost of Waste Collection and Transportation Vehicles and Containers
(Year 2016-2023) ............................................................................................... 132 Table 4.4.23 Total Cost of Waste Collection and Transportation Vehicles (Year
2024-2030) ......................................................................................................... 132 Table 4.4.24 Number of Street Cleaning Equipment .............................................................. 133 Table 4.4.25 Number of Vehicles for Street Cleaning (Year 2016-2030) ............................... 133 Table 4.4.26 Total Cost of Street Sweeping (Year 2016-2023) ............................................... 133 Table 4.4.27 Total Cost of Street Sweeping (Year 2024-2030) ............................................... 134 Table 4.4.28 Implementation Cost for Bulky Waste (Year 2016-2023) .................................. 134 Table 4.4.29 Implementation Cost for Bulky Waste (Year 2024-2030) .................................. 134 Table 4.4.30 Comparison of Cost for the Cleaning Work ....................................................... 136 Table 4.4.31 Project Cost for Cleaning the Illegal Dumping Sites in the City (Year
2016-2018) ......................................................................................................... 136 Table 4.4.32 Annual Number of Vehicles in the Master Plan (Year 2014-2030) .................... 137 Table 4.4.33 Implementation Cost of the Parking Area (Year 2016-2023) ............................. 138 Table 4.4.34 Implementation Cost of the Parking Area (Year 2024-2030) ............................. 138 Table 4.4.35 Project Cost of Waste Collection and Transportation (Year 2016-2023) ........... 138 Table 4.4.36 Project Cost of Waste Collection and Transportation (Year 2024-2030) ........... 138 Table 4.4.37 Result of Environmental and Social Survey on Source Separation .................. 139 Table 4.4.38 Result of Environmental and Social Survey on No Separation at Source ......... 139 Table 4.4.39 Advantages and Disadvantages of Each Alternative .......................................... 140 Table 4.4.40 Advantages and Disadvantages of Daily Collection and Alternate-Day
Collection of Waste ............................................................................................ 141 Table 4.4.41 Total Cost of the Waste Collection and Transportation Plan .............................. 146 Table 4.5.1 Estimated Waste Disposal Amount by Cases ..................................................... 153 Table 4.5.2 Estimated Annual Landfill Volume by Cases ..................................................... 154 Table 4.5.3 Estimated Cumulative Landfill Volume by Cases .............................................. 154 Table 4.5.4 Landfill Development Options for Gondlanwala ............................................... 156 Table 4.5.5 Landfill Development Options for Bhakhraywali .............................................. 156 Table 4.5.6 Total Cost of the Final Disposal Plan ................................................................. 165 Table 4.6.1 Qualitative Evaluation of Intermediate Treatment Options................................ 167 Table 4.6.2 Technical Option for Recovery of Recycle Waste .............................................. 170 Table 4.6.3 Technical Alternatives for Intermediate Treatment Facility and 3R................... 173 Table 4.6.4 Simulation Results of Proposed Central Compost Plant and RDF Plant in
Gujranwala ......................................................................................................... 173 Table 4.6.5 Salient Features of Proposed Gujranwala Central Compost and RDF Plant by
SPV .................................................................................................................... 176 Table 4.6.6 Total Cost of the Intermediate Treatment and 3R Promotion Plan .................... 181 Table 4.7.1 Comparison of Alternatives of Environmental Education and Public
Awareness Raising Activities ............................................................................. 186 Table 4.7.2 Target of Students Covered by Informal Education in Schools by Terms ......... 187 Table 4.7.3 Relationship between Number of Visiting Schools and Communication
Members (Year 2016-2030) ............................................................................... 187 Table 4.7.4 Approximate Costs for the Short-Term Plan (Year 2016-2018) ......................... 189 Table 4.7.5 Approximate Cost for Mid and Long-Term Plans (Year 2019-2030) ................ 189 Table 4.7.6 Approximate Cost for Short-Term Periodical Events (2016–2018) ................... 190 Table 4.7.7 Approximate Cost for Periodical Events in the Mid and Long-Term Plan
(2019–2030) ....................................................................................................... 191 Table 4.7.8 Project Cost for Implementation of Environmental Education and Public
Awareness Raising Plan ..................................................................................... 191

xi
Table 4.7.9 Total Cost of the Environmental Education and Public Awareness Raising
Plan ..................................................................................................................... 192 Table 4.8.1 Alternative Options for Tariff Charging System ................................................. 195 Table 4.8.2 Alternative Options for Costing Methods ........................................................... 198 Table 4.8.3 Positive and Negative Effects of Service Contract with Private Sector .............. 200 Table 4.8.4 Total Cost of the Economic and Financial Plan .................................................. 203 Table 4.9.1 Proposed Environmental Monitoring Plan in EIA Report for Bhakhlaywali ...... 204 Table 4.9.2 Parametres for Leachate Monitoring ................................................................... 205 Table 4.9.3 Total Cost of the Environmental Monitoring Plan .............................................. 210 Table 4.10.1 Comparison of Possible PPP Options ................................................................. 211 Table 4.10.2 Comparison of Options for BOT and Its Variations ............................................ 212 Table 4.10.3 Proposed Number of Staff in the Operation Unit ................................................ 216 Table 4.10.4 Required Number of Managers and Total Number of GWMC Staff for
Implementation of the Master Plan ..................................................................... 217 Table 4.10.5 Outline of the Proposed Comprehensive Capacity Development
Programme (CCDP) ............................................................................................ 223 Table 4.10.6 Total Cost of the Institutional Strengthening and Organizational Plan ............... 225 Table 4.12.1 Master Plan Alternatives by Combination of the Optimum Options for Each
Component .......................................................................................................... 228 Table 4.13.1 Evaluation of the Master Plan Alternatives ......................................................... 231 Table 4.14.1 Financial Investment Cost for the Master Plan ................................................... 234 Table 4.14.2 Total Financial Project Cost for the Master Plan ................................................ 235 Table 4.14.3 Estimated Weighted Average of Selling Prices of Various Recyclables ............. 237 Table 4.14.4 Results of Financial Evaluation and Sensitivity Analysis ................................... 238 Table 4.14.5 Cases of Evaluation for Tariff Review Analysis ................................................. 239 Table 4.14.6 Required Tariff Level for Full Recovery of Operation and Maintenance Cost
at Commencement of Full-scale Tariff System ................................................... 240 Table 4.14.7 Economic Investment Cost for the Master Plan .................................................. 242 Table 4.14.8 Total Economic Project Cost for the Master Plan ............................................... 243 Table 4.14.9 Results of Economic Evaluation and Sensitivity Analysis ................................. 247 Table 4.15.1 Waste Amount for Major Elements in Waste Management Stream from 2018
to 2030 ................................................................................................................ 251 Table 4.15.2 Present and Future Waste Reduction, Material Recovery and Waste
Diversion Rate .................................................................................................... 252 Table 4.16.1 Method for Calculation and Evaluation of Operation and Effect Indicators ...... 252 Table 4.16.2 Current and Planned Value of Operation and Effect Indicator ............................ 255 Table 5.4.1 Environmental Laws in Pakistan......................................................................... 265 Table 5.4.2 Policy, Guidelines, and Rules on Solid Waste Management
Nationwide/Provincial-Wise ............................................................................... 265 Table 5.4.3 Framework of Environmental Institutions in Pakistan ........................................ 266 Table 5.4.4 Comparison of Pakistani Laws and Regulations Related to Environmental
Protection and Waste Management and JICA Environmental Checklist for
Waste Management ............................................................................................. 269 Table 5.5.1 Scoping of Composting and RDF Projects ......................................................... 270 Table 5.5.2 Scoping of Bhakhraywali, Gondlanwala and Chianwali Landfill Projects ......... 271 Table 5.8.1 Summary of the First Stakeholder Meeting ........................................................ 281 Table 5.8.2 Summary of the Second Stakeholder Meeting .................................................... 282 Table 6.2.1 Necessary Number of Waste Collection Containers in Zone 6 ........................... 284 Table 6.2.2 Necessary Number of Waste Collection Vehicles in Zone 6 ............................... 285 Table 6.2.3 Necessary Number of Waste Collection Vehicles and Containers in Other
Zones (2016-2018) ............................................................................................. 288 Table 6.2.4 Annual Number of Vehicles (Year 2016-2018) ................................................... 292 Table 6.2.5 Implementation Cost of the Action Plan for Waste Collection and
Transportation ..................................................................................................... 294 Table 6.3.1 Landfill Machine Procured in the Short-Term Period ......................................... 300

xii
Table 6.3.2 Implementation Cost of the Action Plan for Final Disposal .............................. 308 Table 6.4.1 Implementation Cost of the Action Plan for Intermediate Treatment and 3R
Promotion ........................................................................................................... 311 Table 6.5.1 Estimated Salary for Newly Recruited Staff of the Communication Unit in
the Short-Term Period ........................................................................................ 312 Table 6.5.2 Number of Schools and Students Targeted for the Environmental Education
Programme in the Short-Term Period ................................................................ 313 Table 6.5.3 Implementation Cost of the Action Plan for Environmental Education and
Public Awareness Raising .................................................................................. 315 Table 6.6.1 Implementation Cost of the Action Plan for Economic and Financial Aspect ... 320 Table 6.7.1 Monitoring Items with Their Frequency and Location for Final Disposal Site
in Bhakhraywali ................................................................................................. 323 Table 6.7.2 Monitoring Items with Their Frequency and Location for Post-Closure Final
Disposal Site in Gondlanwala and Chianwali .................................................... 325 Table 6.7.3 Implementation Cost of the Action Plan for Environmental Monitoring ........... 326 Table 6.8.1 Implementation Cost of the Action Plan for Institutional Strengthening and
Organizational Restructuring ............................................................................. 330
LIST OF FIGURES
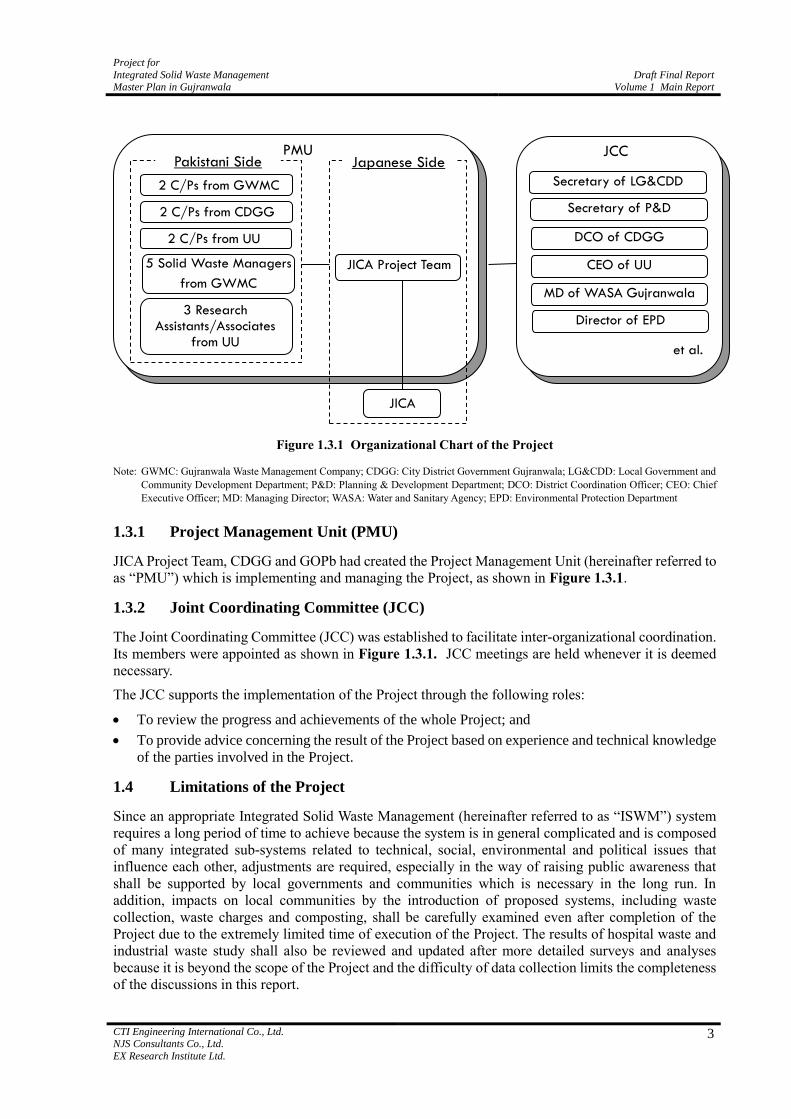
Figure 1.3.1 Organizational Chart of the Project ........................................................................ 3
Figure 1.5.1 Staffing Plan of the JICA Project Team ................................................................. 5
Figure 2.2.1 Waste Generation per Capita in Household in Gujranwala .................................... 9
Figure 2.2.2 Method of Physical Composition Analysis .......................................................... 11
Figure 2.2.3 Physical Composition of Each Generation Source (Average) .............................. 11
Figure 2.2.4 Apparent Specific Gravity .................................................................................... 13
Figure 2.2.5 Results of Three-Component Analysis ................................................................. 14
Figure 2.3.1 Zoning Map of GWMC Service Area .................................................................. 20
Figure 2.3.2 Service Area Map of Waste Collection in Union Councils .................................. 21
Figure 2.3.3 Location of Transfer Stations in Gujranwala City ................................................ 23
Figure 2.3.4 Total Waste Collection Amount (May - December 2014) ................................... 24
Figure 2.3.5 Average Daily Collection Tonnage per Arm-roll Truck/Tractor Trolley .............. 24
Figure 2.3.6 Waste Collection and Transportation Scheme Conducted by GWMC ................. 28
Figure 2.3.7 Relationship between Container and Illegal Dumping Site ................................. 30
Figure 2.4.1 Location Map of Final Disposal Sites .................................................................. 34
Figure 2.4.2 Location of Wells in and around the Gondlanwala Disposal Site ........................ 36
Figure 2.4.3 Daily Number of Incoming Vehicles by Arm-Roll Truck and Tractor Trolley
to Gondlanwala Disposal Site (February 2015) ................................................... 39
Figure 2.4.4 Organizational Structure for Landfill Operation .................................................. 40
Figure 2.4.5 Average Waste Composition of Incoming Waste at Gondlanwala ....................... 42
Figure 2.4.6 Ranking of Candidate Sites according to the Set Criteria .................................... 44
Figure 2.5.1 Material Flow of Recyclables in Gujranwala ....................................................... 49
Figure 2.6.1 Frequency of Waste Collection ............................................................................ 59
Figure 2.6.2 Current Tip Paid to Collection Workers per Month by Income Group ................ 60
Figure 2.6.3 Willingness to Pay for Waste Collection Services by Income Group .................. 60
Figure 2.6.4 Recyclable Separation (Cans) by Income Group ................................................. 61
Figure 2.6.5 Recyclable Separation (Bottles) by Income Group .............................................. 61
Figure 2.6.6 Recyclable Separation (Kitchen Waste) by Income Group .................................. 61
Figure 2.6.7 Recyclable Separation (Papers) by Income Group ............................................... 61
Figure 2.8.1 Organizational Chart of CDGG as of March 2015 ............................................... 76
Figure 2.8.2 Organizational Structure of the Municipal Services of CDGG as of March
2015 ...................................................................................................................... 77
Figure 2.8.3 Organogram of Gujranwala Waste Management Company as of February
2015 ...................................................................................................................... 78

xiii
Figure 2.9.1 Flow Diagram of Hospital Waste .......................................................................... 85
Figure 2.9.2 Percentage of Medical Facilities in Urban and Peri-Urban Area of
Gujranwala ............................................................................................................ 85
Figure 2.9.3 Flow Diagram of Industrial Waste ........................................................................ 88
Figure 2.9.4 Location Map of Small Industrial Estates (SIEs) .................................................. 88
Figure 4.2.1 Gujranwala Historical Growth (Built-up Area) .................................................. 103
Figure 4.2.2 Past Population in Gujranwala (1901-1998) ....................................................... 104
Figure 4.2.3 Past Population (1901-1998) and Projected Population (1999-2030) ................. 105
Figure 4.2.4 Peri-Urban UCs Split into Inside and Outside of the Project Area ..................... 106
Figure 4.2.5 Trend of Estimated Population in the Project Area for ISWM Plan ................... 106
Figure 4.3.1 Flowchart for Confirmation of Present Waste Amount (2014) ........................... 109
Figure 4.3.2 Flowchart for Estimating Future Waste Generation Amount .............................. 112
Figure 4.3.3 Domestic Waste Generation Amount and Collected Commercial Waste
Amount in 98 UCs .............................................................................................. 113
Figure 4.3.4 Waste Management Flow and Estimated Waste Amount in 2014 ....................... 115
Figure 4.4.1 Flowchart of Combination of Collection Method of Each Operation Stage ....... 118
Figure 4.4.2 All Cases for Comparison of Each Waste Collection and Transportation
Alternative........................................................................................................... 119
Figure 4.4.3 Tentative Location of the Transfer Station .......................................................... 120
Figure 4.4.4 Planned Waste Collection Area ........................................................................... 125
Figure 4.4.5 Implementation Schedule of the Waste Collection and Transportation Plan ...... 145
Figure 4.5.1 Urgent Improvement Plan for Gondlanwala Landfill Site .................................. 152
Figure 4.5.2 Increasing Trend of Cumulative Landfill Volume by Cases (1,000 m3)............. 155
Figure 4.5.3 Location of Bhakhraywali Sanitary Landfill Development Project .................... 160
Figure 4.5.4 Access Road of Bhakhraywali Sanitary Landfill Facility ................................... 160
Figure 4.5.5 Location of Gondlanwala Disposal Site Improvement Project ........................... 161
Figure 4.5.6 Location of Chianwali Safe Closure Project ....................................................... 161
Figure 4.5.7 Implementation Schedule of the Final Disposal Plan ......................................... 164
Figure 4.6.1 Flowchart of Selection of Intermediate Treatment and 3R Activity ................... 166
Figure 4.6.2 Conceptual Flow of Implementation of 3R Programmes ................................... 170
Figure 4.6.3 Flow of Recyclables in Gujranwala .................................................................... 172
Figure 4.6.4 Implementation Schedule of the Intermediate Treatment and 3R Promotion
Plan ..................................................................................................................... 180
Figure 4.7.1 Implementation Schedule of Environmental Education and Public
Awareness Raising Plan ...................................................................................... 192
Figure 4.8.1 Implementation Schedule of the Economic and Financial Plan .......................... 202
Figure 4.9.1 Implementation Schedule of the Environmental Monitoring Plan...................... 209
Figure 4.10.1 Project Organization of GWMC 2018 ................................................................ 218
Figure 4.10.2 Project Organization of GWMC 2022 ................................................................ 219
Figure 4.10.3 Project Organization of GWMC 2030 ................................................................ 220
Figure 4.10.4 Implementation Schedule of the Institutional Strengthening and
Organizational Plan ............................................................................................. 224
Figure 4.15.1 Waste Management Flow and Estimated Waste Amount in 2018 ....................... 251
Figure 4.15.2 Waste Management Flow and Estimated Waste Amount in 2024 ....................... 251
Figure 4.15.3 Waste Management Flow and Estimated Waste Amount in 2030 ....................... 252
Figure 4.17.1 Summary of Implementation Schedule and Cost of the Master Plan (1) ............ 257
Figure 4.17.2 Summary of Implementation Schedule and Cost of the Master Plan (2) ............ 258
Figure 5.2.1 Planning Procedure of the Master Plan with Environmental and Social
Considerations..................................................................................................... 262
Figure 5.4.1 Process of EIA in Pakistan by the “Pakistan Environmental Protection
Agency (Review of IEE & EIA) Regulations 2000” ......................................... 267
Figure 5.4.2 Major Contents of EIA Report (Planned) ........................................................... 268
Figure 6.2.1 Waste Container Allocation Plan in Zone 6 ........................................................ 285
Figure 6.2.2 Vehicle Fleet Allocation Plan in Zone 6 .............................................................. 286
Figure 6.2.3 Implementation Schedule of the Action Plan for Waste Collection and
xiv
Transportation .................................................................................................... 293
Figure 6.3.1 Layout Plan of Bhakhraywali SLF Facilities ..................................................... 297
Figure 6.3.2 Profile of Bhakhraywali SLF Facilities .............................................................. 298
Figure 6.3.3 Details of Major Facilities of Bhakhraywali SLF Facilities ............................... 299
Figure 6.3.4 Layout Plan of Improvement Work at Gondlanwala Existing Disposal Site ..... 302
Figure 6.3.5 Layout Plan of Safe Closure Work at Chianwali Former Disposal Site ............. 304
Figure 6.3.6 Implementation Schedule of the Action Plan for Final Disposal ....................... 307
Figure 6.4.1 Implementation Schedule of the Action Plan for Intermediate Treatment and
3R Promotion ..................................................................................................... 311
Figure 6.5.1 Implementation Schedule of the Action Plan for Environmental Education
and Public Awareness Raising ............................................................................ 315
Figure 6.6.1 Implementation Schedule of the Action Plan for Economic and Financial
Aspect ................................................................................................................. 319
Figure 6.7.1 Implementation Schedule of the Action Plan for Environmental Monitoring ... 326
Figure 6.8.1 Implementation Schedule of the Action Plan for Institutional Strengthening
and Organizational Restructuring ....................................................................... 329
LIST OF PHOTOS
Photo 2.3.1 Current Situation of Vehicle Workshop ................................................................ 26
Photo 2.3.2 View of Illegal Dumping Sites in Gujranwala City ............................................ 30
Photo 2.3.3 Installed Weighbridge at Gondlanwala ................................................................ 31
Photo 2.4.1 Current Status of Final Disposal Sites .................................................................. 34
Photo 2.4.2 Operation Status of Gondlanwala Final Disposal Site in September 2014 .......... 35
Photo 2.4.3 Landfill Tractor with Front Loading Bucket ........................................................ 39
Photo 2.5.1 Recycle Private Shop, UC No.54 ......................................................................... 51
Photo 2.5.2 Street Hawkers in Peri-Urban Area, UC No.117 ................................................. 51
Photo 2.5.3 Composting Process under Operation of LCC Compost Plant ............................ 56
Photo 2.5.4 RDF Material Product under Operation of D.G. Khan Cement Company .......... 57
Photo 2.9.1 Colour-coded Bags for Waste at a Hospital ......................................................... 86
Photo 2.9.2 Storeroom for Waste at a Hospital....................................................................... 86
Photo 4.5.1 Collapse of Gondlanwala Landfill Site .............................................................. 150
Photo 4.5.2 Leachate Condition of Gondlanwala Landfill Site ............................................. 151
Photo 5.8.1 First Stakeholder Meeting (23 September 2014) ............................................... 281
Photo 5.8.2 Second Stakeholder Meeting (9 June 2015) ....................................................... 282
Photo 6.2.1 Typical Shape of Street Cleaning Vehicles ......................................................... 289

xv
LIST OF ANNEXES
Annex 1 Record of Discussion on Project for Integrated Solid Waste Management
Master Plan in Gujranwala in the Republic of Pakistan Agreed upon
between the Authorities Concerned of the Government of Pakistan and
Japan International Cooperation Agency (JICA), 20 February, 2013
Annex 2 Minutes of Meetings on Amendment of Record of Discussions on Project
for Integrated Solid Waste Management Master Plan in Gujranwala in the
Islamic Republic of Pakistan Agreed upon between the Authorities
Concerned of the Government of Pakistan and Japan International
Cooperation Agency (JICA), 23 August, 2013
Annex 3 Minutes of Meetings on the Second Amendment of Record of Discussions
on Project for Integrated Solid Waste Management Master Plan in
Gujranwala in the Islamic Republic of Pakistan Agreed upon between the
Authorities Concerned of the Government of Pakistan and Japan
International Cooperation Agency (JICA), 14 May, 2014
Annex 4 Record of Meeting for the Second Joint Coordinating Committee (JCC)
on Project for Integrated Solid Waste Management Master Plan in
Gujranwala in the Islamic Republic of Pakistan, 19 December, 2014
Annex 5 Minutes of Meeting for the Third Joint Coordinating Committee (JCC) on
Project for Integrated Solid Waste Management Master Plan in Gujranwala
in the Islamic Republic of Pakistan, 8 June, 2015

xvi
ABBREVIATIONS AND ACRONYMS
3R : Reduce, Reuse, Recycle
ADB : Asian Development Bank
ATP : Affordability to Pay
BHUs : Basic Health Units
BOD : Board of Directors
BOT : Build-Operate-Transfer
CBO : Community-Based Organization
CCB : Citizen Community Board
CCS : CO2 Capture and Storage
C&D : Construction and Demolition
CDGG : City District Government Gujranwala
CDGL : City District Government Lahore
CDM : Clean Development Mechanism
CEO : Chief Executive Officer
CLTS : Community-Led Total Sanitation
CVM : Contingent Valuation Method
DAP : Di-Ammonium Phosphate
DCO : District Coordination Officer
DGKCC : D.G. Khan Cement Company (Pvt.) Ltd.
DHQ : District Headquarters
DO : District Officer
EAD : Economic Affairs Division
EDO : Executive District Officer
EIA : Environment Impact Assessment
EIRR : Economic Internal Rate of Return
ENERCON : National Energy Conservation Centre
EOI : Expression of Interest
EPD : Environment Protection Department
FBR : Federal Board of Revenue
FIRR : Financial Internal Rate of Return
FML : Flexible Membrane Liner
GCCI : Gujranwala Chamber of Commerce and Industry
GDA : Gujranwala Development Authority
GDP : Gross Domestic Product
GEO : Gujranwala Environmental Organization
GHG : Greenhouse Gas
GIS : Geographic Information Systems
GOJ : Government of Japan
GOP : Government of Pakistan
GOPb : Government of the Punjab
GWMC : Gujranwala Waste Management Company
HDPE : High Density Polyethylene
HPM : Hedonic Pricing Method
HQ : Headquarters
IEC : Information, Education and Communication
IEE : Initial Environmental Examination
IPC : Inter Provincial Coordination
ISWM : Integrated Solid Waste Management
JCC : Joint Coordinating Committee
JICA : Japan International Cooperation Agency
KOICA : Korean International Cooperation Agency
LCL : Lahore Compost (pvt.) Ltd.

xvii
LDA : Lahore Development Authority
LG & CDD : Local Government and Community Development Department
LWMC : Lahore Waste Management Company
MCH : Mother-Child Health
MCL : Metropolitan Corporation Lahore
MD : Managing Director
MDGs : Millennium Development Goals
MICS : Multiple Indicator Cluster Surveys
MIS : Management Information System
MRF : Material Recovery Facility
MS : Municipal Services
NCCW : National Council for Conservation of Wildlife
NDM : National Disaster Management
NEP : National Environmental Policy
NEPRA : National Electric Power Regulatory Authority
NEQS : National Environmental Quality Standards
NGO : Non-Governmental Organization
NPV : Net Present Value
NRSP : National Rural Support Programme
NTN : National Text Number
O&M : Operation and Maintenance
OPE : Organization Pan Environment
P&D : Planning and Development
Pak-EPA : Pakistan Environmental Protection Agency
PCSIR : Pakistan Council of Scientific & Industrial Research
PEPA : Pakistan (or Punjab) Environmental Protection Act
PEPC : Pakistan Environmental Protection Council
PHA : Parks and Horticulture Authority
PMU : Project Management Unit
PLGO : Punjab Local Government Ordinance
PPP : Public-Private-Partnership
PR : Public Relations
PRTR : Pollutant Release and Transfer Register
PSP : Private Sector Participation
RCV : Refuse Collection Vehicle
R/D : Record of Discussions
RDF : Refuse Derived Fuels
RFID : Radio-Frequency Identification Device
RHC : Rural Health Centre
RPF : Refuse Paper & Plastic Fuel
Rs. : Pakistan Rupee
SAAMA : Service and Asset Management Agreement
SEA : Strategic Environmental Assessment
SECP : Securities and Exchange Commission of Pakistan
SIE : Small Industrial Estate
SLF : Sanitary Landfill
SMS : Short Message Service
SNS : Social Networking Service
SOP : Standard Operation Procedures
SPV : Special Purpose Vehicle
STEPS : Social Transmission & Environmental Protection Society
SWM : Solid Waste Management
TMA : Teshil Municipal Administration
TOR : Terms of Reference
USD : United States Dollar
xviii
UU : The Urban Unit
WACS : Waste Amount and Composition Survey
WASA : Water and Sanitary Agency
WB : The World Bank
WBS : Work Breakdown Structure
WSS : Water Supply, Sewerage and Sanitation
WTP : Willingness to Pay
ZSD : Zoological Survey Department

Project for
Integrated Solid Waste Management Master Plan in Gujranwala
Draft Final Report
Volume 1 Main Report
CTI Engineering International Co., Ltd. NJS Consultants Co., Ltd.
EX Research Institute Ltd.
1
CHAPTER 1. INTRODUCTION
1.1 Background of the Project
Solid Waste Management (hereinafter referred to as “SWM”) has become a serious problem in Punjab
due to rapid urbanisation, uncontrolled population, lack of resources, institutional weaknesses and lack
of civic sense towards solid waste disposal. The average solid waste collection efficiency in Punjab is
only around 50%, causing spread of multiple diseases such as diarrhea and dengue fever.* Whatever
quantity of waste collected is, normally seen as waste dumped in open areas along the roadside, canal
bank and low-lying areas. Soil contamination is affecting the quality of groundwater from shallow
depth. Un-collected waste is illegally piled on sidewalks, in open spaces, sewer lines, or even in canals,
and blockage of wastewater flow in the sewers are seen, causing additional problem by the local
government. (Note:* The relationship between solid waste management and diseases has been well known broadly from the public health
point of view. For example, see the following papers: Robert J. Anderson, M.D., “The Public Health Aspect of Solid Waste Disposal”, Public
Health Reports, Vol. 79, No. 2, February 1964, pp. 93-96; Ministry of the Environment, Japan, “History and Current State of Waste Management in Japan”, February 2014; Masaaki Osawa, Takayuji Shimaoka and Hirofumi Nakayama, “Waste Management Roles in the
Improvement of Public Hygiene”, Journal of Material Cycles and Waste Management, Vol. 20, No. 5, pp. 291-302, 2009.)
In the Punjab Vision 2020, waste management is located under the priority area of water supply,
sewerage and sanitation (hereinafter referred to as “WSS”), and through the Urban Unit (hereinafter
referred to as “UU”) of the Government of the Punjab (hereinafter referred to as “GOPb”), solid waste
management strategy was developed as the Guidelines of Solid Waste Management issued in 2007.
GOPb has been tackling the issues which contribute to an improvement of SWM based on the
guidelines. However, the budget for SWM in Punjab is restrictive, and about 80% of the budget is spent
on personnel expenses or institutional administrative expenses. Moreover, although SWM is to be
performed under the responsibility of each district government under the law, the manner on how to
conduct SWM effectively and efficiency under their limited human resources and budget has been an
important issue to be solved, since the laws or guidelines on SWM are not fully implemented.
In 2009, the Japan International Cooperation Agency (hereinafter referred to as “JICA”) commissioned
a sector study to take stock of the current status, problems, and necessity of assistance in the SWM
sector in seven major cities of Punjab Province: Faisalabad, Gujranwala, Lahore, Multan, Rawalpindi,
Sargodha and Sialkot. Through the study, the degree of assistance necessary for SWM, SWM related
budget, number of related department personnel, existence of master plan, existence of other donor
support, existence of self-financed activities, motivation/commitment of top management, etc., were
investigated. Based on the results of the study, followed by a series of discussions made by GOPb and
JICA, the necessity of assistance for the SWM sector was ascertained, and in addition, Gujranwala City
was identified as the highest priority among the surveyed cities considering the highly motivated top
management and SWM related staff, non-existence of donor support, the problem of conducting waste
collection under the limited budget, etc.
The Government of Japan (hereinafter referred to as “GOJ”) received the official request for the
Technical Cooperation to formulate the Master Plan to address improvement of SWM in Gujranwala
from the Economic Affairs Division (hereinafter referred to as “EAD”), which was submitted by the
City District Government Gujranwala (hereinafter referred to as “CDGG”) through UU on 30 July 2010.
GOPb has also a plan to replicate the results of the Project to other major cities in Punjab.
In response to the request from the Government of Pakistan (hereinafter referred to as “GOP”), the
Japanese Detailed Planning Study Team (hereinafter referred to as “the Team”) was dispatched by JICA
to Pakistan for the purpose of discussing and confirming the scope of work for the Project for
Integrated Solid Waste Management Master Plan in Gujranwala (hereinafter referred to as “the
Project”) from 28 September to 19 October 2011.

Draft Final Report
Volume 1 Main Report
Project for Integrated Solid Waste Management
Master Plan in Gujranwala
2
CTI Engineering International Co., Ltd. NJS Consultants Co., Ltd.
EX Research Institute Ltd.
The Project was started in February 2014 upon agreement on the “Record of Discussions” (hereinafter
referred to as “R/D”) that was reached between GOP and JICA on the 20th of February 2013. (Refer to
the attached ANNEX 1 and ANNEX 2, the first amendment made on the 23rd
of August 2013.)
After the commencement of the Project, the Pakistani side requested JICA to amend the R/D in March
2014. In response to the request, JICA held a series of discussions with the authorities concerned of
GOP, GOPb and CDGG. As a result, both sides agreed on the second amendment and signed the
Minutes of Meetings on the 14th of May 2014 (see, ANNEX 3).
1.2 Outline of the Project
1.2.1 Objective of the Project
The objectives of the Project are set out as follows:
To develop a Master Plan of Integrated Solid Waste Management for Gujranwala City including the
peri-urban area of Gujranwala;
To enhance the institutional capacity for implementation of the SWM Master Plan; and
To draw lessons and best practices for replication of the master plan in other major cities in Punjab.
1.2.2 Project Site
The Project covers the whole area of Gujranwala City including the peri-urban area of Gujranwala, as
shown in the Location Map.
1.2.3 Project Schedule
The JICA Project Team started the first field work in Pakistan on 3 March 2014 and completed it on
17 April 2014 to collect relevant data and information. Subsequently, a Joint Coordinating Committee
(hereinafter referred to as “JCC”) meeting was held on 27 March 2014 to discuss the results. The second
visit was made between 30 August and 3 October 2014 to prepare the contracts for the site surveys, such
as soil investigation and topographic survey for disposal sites, social survey, and water quality survey,
and to conduct the remaining data collection and site reconnaissance. The third visit was made between
20 November 2014 and 3 January 2015 to follow up and receive some of the results of the site surveys.
In this period, the second JCC meeting was held on 19 December 2014 to review the Progress Report
that was submitted to the JICA headquarters and the Pakistani side including a part of the results of the
site surveys. The minutes of meeting is attached as ANNEX 4 in this report.
The fourth visit was made between 5 May 2015 and 17 June 2015 to submit the Interim Report
comprising the Master Plan. The third JCC meeting was held on 8 June 2015 to discuss the contents of
the Master Plan (see the minutes of the meeting in ANNEX 5.). The fifth visit was started from 22 July
2015 and end up to 7 September 2015. In this last visit, the Draft Final Report was being made and the
fourth JCC meeting was held on 2 September 2015. After going back to Japan, the Draft Final Report
will be finalised and submitted to the Pakistani side in October. The Final Report is to be submitted
within two (2) months after receiving JICA’s comments on the Draft Final Report.
A meeting as a kick-off event was held on 27 March 2014, and the second stakeholder meeting was held
on 9 June 2015 after submission of the Interim Report. The last stakeholder meeting was held on 3
September 2015 in the presence of Finance Minister of the Government of the Punjab to explain the
contents of the Master Plan.
1.3 Administration of the Project
The proposed organizational structure is given in Figure 1.3.1, which was confirmed in the first JCC
meeting held on 27 March 2014.
Project for
Integrated Solid Waste Management Master Plan in Gujranwala
Draft Final Report
Volume 1 Main Report
CTI Engineering International Co., Ltd. NJS Consultants Co., Ltd.
EX Research Institute Ltd.
3
Figure 1.3.1 Organizational Chart of the Project
Note: GWMC: Gujranwala Waste Management Company; CDGG: City District Government Gujranwala; LG&CDD: Local Government and
Community Development Department; P&D: Planning & Development Department; DCO: District Coordination Officer; CEO: Chief
Executive Officer; MD: Managing Director; WASA: Water and Sanitary Agency; EPD: Environmental Protection Department
1.3.1 Project Management Unit (PMU)
JICA Project Team, CDGG and GOPb had created the Project Management Unit (hereinafter referred to
as “PMU”) which is implementing and managing the Project, as shown in Figure 1.3.1.
1.3.2 Joint Coordinating Committee (JCC)
The Joint Coordinating Committee (JCC) was established to facilitate inter-organizational coordination.
Its members were appointed as shown in Figure 1.3.1. JCC meetings are held whenever it is deemed
necessary.
The JCC supports the implementation of the Project through the following roles:
To review the progress and achievements of the whole Project; and
To provide advice concerning the result of the Project based on experience and technical knowledge
of the parties involved in the Project.
1.4 Limitations of the Project
Since an appropriate Integrated Solid Waste Management (hereinafter referred to as “ISWM”) system
requires a long period of time to achieve because the system is in general complicated and is composed
of many integrated sub-systems related to technical, social, environmental and political issues that
influence each other, adjustments are required, especially in the way of raising public awareness that
shall be supported by local governments and communities which is necessary in the long run. In
addition, impacts on local communities by the introduction of proposed systems, including waste
collection, waste charges and composting, shall be carefully examined even after completion of the
Project due to the extremely limited time of execution of the Project. The results of hospital waste and
industrial waste study shall also be reviewed and updated after more detailed surveys and analyses
because it is beyond the scope of the Project and the difficulty of data collection limits the completeness
of the discussions in this report.
PMU
2 C/Ps from GWMC
5 Solid Waste Managers
from GWMC
JICA Project Team
2 C/Ps from UU
3 Research Assistants/Associates
from UU
JICA
Pakistani Side Japanese Side
Secretary of LG&CDD
JCC
Secretary of P&D
DCO of CDGG
CEO of UU
MD of WASA Gujranwala
Director of EPD
et al.
2 C/Ps from CDGG

Draft Final Report
Volume 1 Main Report
Project for Integrated Solid Waste Management
Master Plan in Gujranwala
4
CTI Engineering International Co., Ltd. NJS Consultants Co., Ltd.
EX Research Institute Ltd.
1.5 Staffing Schedule of the Project
The members of the PMU are as listed in the following Table 1.5.1.
Table 1.5.1 Members of the Project Management Unit (PMU)
Name Designation or Field of Expertise
Pakistani Side
Dr. Ata-ul-Haq Managing Director, Gujranwala Waste Management Company (GWMC)
Murad Rana Senior Manager (Operation), GWMC
Imtiaz Malik Executive District Officer (EDO) (MS: Municipal Services), City District
Government Gujranwala (CDGG)
Nauman Raza District Officer (DO) (Additional Charge for SWM), CDGG
Dr. Kiran Farhan Senior SWM Specialist, The Urban Unit (UU)
Kashif Nadeem UU
Fatima Zia Waste Manager, GWMC
Hina Aslam Waste Manager, GWMC
Ambreen Ghazanfar Waste Manager, GWMC
Aqsa Sadiq Waste Manager, GWMC
Hina Ishaque Waste Manager, GWMC
Arkham Wahid Research Assistant, UU
Umama Saleh Research Assistant, UU
Sami Ullah Research Associate, UU
JICA Project Team
Masakazu MAEDA Team Leader / Solid Waste Management / Waste Collection & Transportation Plan 1
Masaharu TAKASUGI Final Disposal Plan
Kazuhiko NAKAMURA Waste Collection & Transportation Plan 2
Shinsuke HORI Intermediate Treatment and 3R Promotion / Administrative Coordinator 2*1
Keigo ITO Intermediate Treatment and 3R Promotion / Administrative Coordinator 2*2
Shinsuke OKAMOTO Environmental Education
Takehiko OGAWA Economic and Financial Analysis
Hisato TAKEDA Environmental and Social Considerations*3
Yasumi TSUTSUI Environmental and Social Considerations*4
Keiko TSUJI Institutional Strengthening / Administrative Coordinator 1*5
Tomoe KUMAGAI Institutional Strengthening / Administrative Coordinator 1*6
Note: *1The assignment was started from March 2014 and ended to December 2015.
*2 The assignment was started from February 2015.
*3 The assignment was started from March 2014 and ended to April 2014.
*4 The assignment was started from August 2014.
*5 The assignment was started from March 2014 and ended to June 2015.
*6 The assignment was started from August 2015.
The staffing schedule of the JICA Project Team is as shown in Figure 1.5.1.

Project for Integrated Solid Waste Management
Master Plan in Gujranwala
Draft Final Report
Volume 1 Main Report
CTI Engineering International Co., Ltd.
NJS Consultants Co., Ltd.
EX Research Institute Ltd.
5
Figure 1.5.1 Staffing Plan of the JICA Project Team
Pakistan Japan
3/3 4/8 8/30 9/7 11/26 12/26 2/5 3/17 5/7 6/11 7/22 9/4
37 (1.23) 9 (0.30) 31 (1.03) 41 (1.37) 36 (1.20) 45 (1.50)
3/8 4/11 8/30 10/3 11/20 1/3 2/15 3/26 5/9 6/17 8/1 9/4
35 (1.17) 35 (1.17) 45 (1.50) 40 (1.33) 40 (1.33) 35 (1.17)
3/8 4/11 8/30 9/13 11/20 1/3 2/2 4/2 5/9 6/12 8/1 9/4
35 (1.17) 15(0.50) 45 (1.50) 60 (2.00) 35 (1.17) 35 (1.17)
3/8 4/17 8/30 9/13 12/10 12/19
41 (1.37) 10 (0.33) 5 (0.17) 10 (0.33)
2/16 3/28 7/22 9/4
34 (1.13) 7 (0.23) 35 (1.17) 10 (0.33)
3/15 4/5 2/12 3/13 8/5 8/29
22 (0.73) 30 (1.00) 2 (0.07) 23 (0.77)
3/7 4/5 2/28 3/29 7/25 9/7
30 (1.00) 30 (1.00) 45 (1.50)
3/19 4/5
18 (0.60)
8/30 9/25 2/27 4/2 8/11 9/4
27 (0.90) 35 (1.17) 25 (0.83)
3/8 4/17 2/12 3/17
20 (0.67) 21 (0.70) 29 (0.97) 5 (0.17)
8/5 8/29
25 (0.83)
38.13
6 (0.30) 6 (0.30) 6 (0.30) 12 (0.60) 10 (0.50)
2 (0.10) 2 (0.10) 2 (0.10) 2 (0.10)
2 (0.10) 2 (0.10) 2 (0.10) 2 (0.10)
2 (0.10)
4 (0.20)
2 (0.10) 4 (0.20)
2 (0.10) 4 (0.20)
2 (0.10) 4 (0.20)
2 (0.10)
4 (0.20)
4.30
▲Inception Report(Mar) Progress Report(Dec)▲ Interim Report(Apr)▲ Draft Final Report(Sep)▲ ▲Final Report(Nov)
◆JCC(1) ◆JCC(2) ◆JCC(3) ◆JCC(4)
★Stakeholders Meeting(1) ★ ★Seminar(2)
Legend : Work in Pakistan CTII : CTI Engineering International Co., Ltd.
Work in Japan NJS : NJS Consultants Co., Ltd.
Work in Pakistan at private expenses EX : EX Research Institute Ltd.
Intermediate Treatment and 3R
Promotion / Administrative
Coordinator 2
Mr. Keigo
ITOCTII
2 4
NJS
2014
6 7 5 88 9 102
JFY2015M/M
2015
JFY2013 JFY2014
4 53 11 3
Role Name Company
Intermediate Treatment and 3R
Promotion / Administrative
Coordinator 2
Mr. Shunsuke
HORICTII
2.03P
a
k
i
s
t
a
n
Team Leader / Solid Waste
Management / Waste Collection
and Transport Plan 1
Mr. Masakazu
MAEDACTII 6.63
Mr. Kazuhiko
NAKAMURANJS
EX 2.50
Mr. Masaharu
TAKASUGI7.67
Waste Collection and Transport
Plan 2
109712 1 6
7.50
11
Environmental EducationMr. Shinsuke
OKAMOTO
2.30
Final Disposal Plan
2.90
Mr. Takehiko
OGAWA
Environmental and Social
Considerations
Mr. Hisato
TAKEDA
Environmental and Social
Considerations
Ms. Yasumi
TSUTSUINJS
Economic and Financial Analysis
Subtotal
Institutional Strengthening /
Administrative Coordinator 1
Ms. Keiko
TSUJICTII
1.67
CTII 3.50
0.60NJS
Institutional Strengthening /
Administrative Coordinator 1
0.30
Mr. Masakazu
MAEDACTII 2.00
Mr. Keigo
ITOCTII 0.20
EX
0.10
Mr. Masaharu
TAKASUGINJS
0.30
0.40
Waste Collection and Transport
Plan 2
Environmental EducationMr. Shinsuke
OKAMOTO
NJS 0.30
0.10
NJS 0.40
Institutional Strengthening /
Administrative Coordinator 1
Ms. Keiko
TSUJICTII
Subtotal
Seminar/JCC
Affiliate Consultation
Reports
J
a
p
a
n
Mr. Kazuhiko
NAKAMURA
Intermediate Treatment and 3R
Promotion / Administrative
Coordinator 2
Mr. Shunsuke
HORICTII
Final Disposal Plan
Environmental and Social
Considerations
Ms. Yasumi
TSUTSUI
Economic and Financial AnalysisMr. Takehiko
OGAWACTII
Intermediate Treatment and 3R
Promotion / Administrative
Coordinator 2
Ms. Tomoe
KUMAGAIEX 0.83
Institutional Strengthening /
Administrative Coordinator 1
Ms. Tomoe
KUMAGAIEX 0.20
Team Leader / Solid Waste
Management / Waste Collection
and Transport Plan 1
(0.87)
(0.17)
(0.57)
Stakeholders
Meeting(2)/
Seminar(1)


Project for Integrated Solid Waste Management
Master Plan in Gujranwala
Draft Final Report
Volume 1 Main Report
CTI Engineering International Co., Ltd. NJS Consultants Co., Ltd.
EX Research Institute Ltd.
7
CHAPTER 2. DESCRIPTION AND EVALUATION OF CURRENT CONDITION
2.1 Introduction
This chapter presents the current condition of SWM mainly in terms of technical, financial and
institutional aspects based on the results of the site surveys, such as waste amount and composition
survey, incoming waste survey, time and motion study, and waste picker survey.
First of all, the survey on generated waste amount and composition in the city at present are explained in
Section 2.2 while the survey took place in three seasons. In view of the technical approaches, collection
and transportation, final disposal and intermediate treatment and 3R studies were conducted as
described in Sections 2.3, 2.4 and 2.5, respectively. Environmental education and public awareness on
SWM is considered in Section 2.6 as well, based on the results of the public and establishment
awareness survey and field investigation.
As other important components for implementation of the SWM programme, the city’s economic and
financial conditions are analysed in Section 2.7.
Finally, from the institutional point of view, the analysis and evaluation of the present arrangements, not
only for institutional but also organizational and human resource management aspects, are carried out
and described in Section 2.8. The current conditions of hospital and industrial, and construction and
demolition waste are additionally described in Section 2.9.
2.2 Waste Amount and Composition Survey (WACS)
2.2.1 Objective of the Survey
The Solid Waste Amount and Composition Survey (hereinafter referred to as “WACS”) was started as a
part of the study for Integrated Solid Waste Management Master Plan in Gujranwala to identify the
amount and composition of the different types of waste generated in Gujranwala City. The
characteristics of representative municipal solid wastes were obtained through the WACS for domestic
waste, commercial waste, institutional waste, market waste, street waste, etc., at the waste generation
sources. The results/analysis of WACS are used for the basic data to formulate the waste collection, 3R,
intermediate treatment and waste disposal plans for review, updating and formulation of the SWM
Master Plan.
The WACS was contracted out with a local contractor and its field survey was started in October 2014
and continued up to June 2015 to cover three different seasons including the wet and dry seasons. The
first field survey was conducted from 13 to 20 October 2014, the second field survey was from 9 to
16 February 2015 and the third field survey was conducted from 18 to 25 May 2015.
2.2.2 Waste Amount Survey
(1) Type of Waste Generation Sources and Number of Samples
The types of waste generation sources and number of samples for the waste amount survey
according to the generation sources are shown in Table 2.2.1.

Draft Final Report
Volume 1 Main Report
Project for Integrated Solid Waste Management
Master Plan in Gujranwala
8
CTI Engineering International Co., Ltd. NJS Consultants Co., Ltd.
EX Research Institute Ltd.
Table 2.2.1 Types of Waste Generation Sources and Number of Samples for Waste Amount Survey
Type
Waste Amount Survey
Area Samples
per Area
Number of Samples Survey Days
Total
Samples
A × B C × D
A B C D E
Household
High Income 2 5 10 8 80
Middle Income 6 5 30 8 240
Low Income 4 5 20 8 160
Rural Area 2 5 10 8 80
Commercial Restaurants 1 5 5 8 40
Others 1 5 5 8 40
Markets (Food, Vegetable, etc.) 5 2 10 8 80
Institution 5 1 5 8 40
Street Sweeping 1 1 1 8 8
Park 1 1 1 8 8
Total --- 97 --- 776
Note: The number of samples is for one season only.
(2) Union Council Classification
The division of Gujranwala urban union councils (UCs) into high, middle and low income areas on
the basis of income level was a pre-requisite to the conduct of various surveys including this WACS
for the subject master plan. However, the data regarding these three income levels per UC is not
available. Therefore, the criterion used for this classification was set by infrastructure including
road condition and width, and house size and landscape. The views of the field staff of GWMC
deployed in jurisdiction areas and the observations made after visiting the representative areas were
taken into account for this task, as described below.
Level of Infrastructure
The UCs having small houses and mostly unpaved and narrow streets are categorised as low
income areas where the sanitation service is poor and most of the drains are open. The UCs
tagged as high income areas have bigger houses and wider streets and receive relatively good
sanitation services. The UCs in middle income areas are situated in between the two. The
houses in middle income areas mostly range from 5 to 10 marlas (from 126.47 m2 to
252.93 m2).
Level of Income
Actually, it is quite difficult to obtain the data of income level for each household in Pakistan.
The classification as shown below is, therefore, not based on any scientific research but only
for reference.*
High Income : more than Rs. 100,000 per month Middle Income : from around Rs. 20,000 up to Rs. 100,000 per month Low Income : less than around Rs. 20,000 per month
Note:* http://www.dawn.com/news/219652/defining-income-groups: Afshan Subohi, Defining income groups, Dawn
published Nov 20, 2006 12:00 am. The range of income level is modified based on this article.
(3) Survey Method
This survey has selected a total of 97 sampling points from each type of waste generation source to
obtain the waste amount discharge ratio by generation source. The selection of sampling areas for
each type was made through discussion between the Pakistani side and the JICA Project Team in
the initial stage of the Project. The number of sampling points is summarised in the table above.

Project for Integrated Solid Waste Management
Master Plan in Gujranwala
Draft Final Report
Volume 1 Main Report
CTI Engineering International Co., Ltd. NJS Consultants Co., Ltd.
EX Research Institute Ltd.
9
The Contractor has carried out the survey and obtained 8-day results of at least the total number of
samples for each type as shown in the table. It is necessary that sampling is conducted for the
duration of eight days consecutively. The result of the first day sample is disregarded assuming that
the first day may have some waste accumulated together with the previous day. The first day
sampling is carried out to familiarise the participating sectors and the JICA Project Team personnel
on the collection of samples. The detailed method is presented in Volume 2, Supporting Report,
Section A: Waste Amount and Composition Analysis, Section 3.2.
The waste amount survey included the sampling of amounts of recycling material of self-treated
waste at each generation source. The unit generation amount at each generation source was verified
through comparative examination with existing data.
(4) Survey Result
The waste generation amount per capita per day of each generation source is as shown in Table
2.2.2. The average waste generation amount per capita per day of the four groups in residential
areas ranges from 0.26 kilogrammes per capita per day (kg/c/d) to 0.48 kg/c/d, as shown in Figure
2.2.1. The waste generation per unit for each generation source applied for this master plan study is
to be used an average of the first two survey results since the third survey was conducted in May
and the final data compilation was completed in July 2015. That time was when the master plan
was already drafted and it was therefore impossible to fit the final survey results in the master plan
formulation. Considering the results of the last survey, the adoption of the first two data is
acceptable for planning purpose since the tendency of each generation amount is almost similar to
that of the previous two survey results. The detailed results are presented in Volume 2, Supporting
Report, Section A: Waste Amount and Composition Analysis, Section 3.3.
Table 2.2.2 Waste Generation Rate of Each Generation Source
Type Unit
Waste Generation (kg/day)
1st Survey 13-20 October
2014
2nd Survey 9-16 February
2015
3rd Survey 18-25 May
2015 Average
Household
High Income person 0.46 0.45 0.48 0.47
Middle Income person 0.41 0.36 0.29 0.35
Low Income person 0.40 0.40 0.33 0.38
Rural Area person 0.33 0.36 0.26 0.32
Commercial Restaurants establishment 11.0 20.0 16.4 15.8
Others establishment 2.10 2.10 1.50 1.90
Markets (Food, Vegetable, etc.) market 200 360 923 494
Institution establishment 4.70 9.00 3.70 5.80
Street Sweeping m 0.61 0.19 0.20 0.33
Park park 9.4 10.0 14.5 11.3
Figure 2.2.1 Waste Generation per Capita in Household in Gujranwala

Draft Final Report
Volume 1 Main Report
Project for Integrated Solid Waste Management
Master Plan in Gujranwala
10
CTI Engineering International Co., Ltd. NJS Consultants Co., Ltd.
EX Research Institute Ltd.
2.2.3 Waste Composition Survey (Physical Composition: Wet Base)
(1) Type of Waste Generation Sources and Number of Samples
The type of waste generation sources and number of samples for waste composition survey
according to the generation sources are shown in Table 2.2.3 below. This sample came from the
reduction method described in Item (2) below; that is, the sample of Waste Amount Survey in the
previous section is different from that of Waste Composition Survey in this section.
Table 2.2.3 Types of Waste Generation Sources and Number of Samples
for the Waste Composition Survey
Type of Waste Generation
Source
Waste Composition Survey
Samples Survey Days
Number of
Physical
Composition
F × G
F G H
Household
High Income 1 8 8
Middle
Income
1 8
8
Low Income 1 8 8
Rural Area 1 8 8
Commercial Restaurants 1 8 8
Others 1 8 8
Markets (Food, Vegetable,
etc.) 1 8 8
Institution 1 8 8
Street Sweeping 1 8 8
Park 1 8 8
Total 10 - 80
Note: The number of samples is for one season only.
(2) Survey Method
The samples analysed are among those extracted during the waste amount survey. Samples from
ten discharge sources, i.e., residential sources (high, middle and low income groups, and rural areas
as the peri-urban area) and non-residential sources (restaurants, other commercial entities, markets,
institutions, streets, park), are brought to the workshop of the Gujranwala Waste Management
Company (GWMC) separately. The samples of large waste generation sources are then subjected
to the reduction method that entails repetition of the process below until the intended sampling
weight of approximately 200 kg is obtained.
Mixing of wastes; bulky items in waste are cut into pieces.
Division of waste into four piles of approximately the same volume once the mixture is
homogeneous.
Removal of two portions at diagonally opposite ends and the mixture of the remaining amount.
The above procedures are illustrated in Figure 2.2.2.
Then, the waste is loaded into a plastic bucket. The plastic bucket containing the waste is dropped
three times from a height of 30 cm to the ground, and then the volume is measured by a measuring
tape and the total weight by a scale.

Project for Integrated Solid Waste Management
Master Plan in Gujranwala
Draft Final Report
Volume 1 Main Report
CTI Engineering International Co., Ltd. NJS Consultants Co., Ltd.
EX Research Institute Ltd.
11
The Apparent Specific Gravity (ASG) is calculated through the following formula:
ASG = Weight of Waste (kg)/Volume of Waste (m3)
Then the physical composition of waste is sorted into the following 16 items:
1. Kitchen waste
2. Paper (recyclable/clean paper)
3. Paper (other paper)
4. Textile
5. Grass and wood
6. Plastic (recyclable plastic)
7. Plastic (non-recyclable plastic)
8. Leather and rubber
9. Metal (recyclable metal)
10. Metal (non-recyclable metal)
11. Bottle and glass (recyclable bottles and glasses)
12. Bottle and glass (non-recyclable bottles and glasses)
13. Ceramic, stone and soil etc.
14. Domestic hazardous wastes
15. Sieve Remaining*
16. Miscellaneous
Note*: Sieve remaining was added from the second survey.
(3) Survey Result
The average waste composition in the first, second and third survey season was adopted to calculate
the physical composition of waste. The results are summarised as an average of the three results in
Figure 2.2.3 Physical Composition of Each Generation Source (Average)
Table 2.2.4, and presented also in Figure 2.2.3. From these tables and figures, the characteristics of
the three survey results are summarised as follows:
The highest percentage of waste composition is kitchen waste from households (58-69%),
restaurants (85%) and markets (61%) followed by paper (4-11%) or plastics (5-11%).
High percentage of grass and wood from institutions (45%), street sweeping (8%) and parks
(56%) can be observed because they might include garden waste.
Except the waste from street sweeping, the ratio of organic waste is quite high at 70 to 98%.
The ratio of recyclable material such as paper, plastic, metal and glass from households varies
from 4% to 6%, and its average is around 3.7% considering the rate of population for each
income group (Detailed discussions are presented in Section 4.3).
Figure 2.2.3 Physical Composition of Each Generation Source (Average)
Figure 2.2.2 Method of Physical
Composition Analysis

Draft Final Report
Volume 1 Main Report
Project for Integrated Solid Waste Management
Master Plan in Gujranwala
12
CTI Engineering International Co., Ltd. NJS Consultants Co., Ltd.
EX Research Institute Ltd.
Table 2.2.4 Waste Composition of Each Generation Source (Average of the Three Survey Results) (Unit: %)
Waste Composition
Household Commercial
Market Institu-
tion
Street sweep-
ing Park High
Income Middle Income
Low Income
Rural Area
Restau-rants
Others
Kitchen Waste 68.7 57.8 66.9 51.1 85.4 9.0 61.1 4.3 9.8 10.8
Paper Paper (recyclable/clean)
4.3 3.5 2.6 2.9 4.8 26.7 3.0 8.7 1.5 1.2
Paper (others) 6.4 7.0 4.0 1.5 1.7 20.4 2.8 3.8 2.6 1.8
Subtotal-Paper 10.7 10.5 6.6 4.4 6.5 47.1 5.8 12.5 4.1 3.0
Textile 2.6 3.4 6.0 4.6 4.0 1.1 6.9 1.7 0.8 1.3
Grass and wood 0.5 0.8 1.0 1.1 6.5 0.1 1.3 16.9 44.9 8.3
Plastics Plastic (recyclable)
1.3 1.2 1.0 1.7 0.1 4.0 0.4 1.0 0.1 4.8
Plastic (non-recyclable)
8.9 9.4 9.4 5.8 5.1 23.3 4.1 7.4 3.0 4.2
Subtotal-Plastic 10.2 10.6 10.4 7.5 5.2 27.3 4.5 8.4 3.1 9.0
Leather and rubber 0.8 0.8 1.2 0.9 0.8 0.1 0.6 0.4 0.0 0.1
Organic Waste - Subtotal 96.9 94.6 87.1 90.5 74.3 98.3 92.2 90.4 70.9 26.7
Metal Metal (recyclable)
0.3 0.4 0.1 0.4 0.0 0.3 0.0 0.2 0.0 0.2
Metal (non-recyclable)
0.0 0.0 0.0 0.0 0.0 0.3 0.0 0.0 0.0 3.4
Subtotal-Metal 0.3 0.4 0.1 0.4 0.0 0.6 0.0 0.2 0.0 3.6
Bottle and glass
Bottle and glass (recyclable)
0.6 0.8 0.8 0.2 0.5 3.4 0.1 0.5 0.1 0.3
Bottle and glass (non-recyclable)
0.7 0.5 0.7 0.4 0.4 1.0 0. 0.9 0.0 0.2
Subtotal-Bottle and glass
1.3 1.3 1.5 0.6 0.9 4.4 0.2 1.4 0.1 0.5
Ceramic, stone and soil etc. 0.5 0.5 4.5 1.4 13.0 0.8 0.2 3.4 12.6 48.8
Inorganic Waste - Subtotal
2.4 2.1 6.2 3.0 14.0 1.7 5.2 3.6 14.2 48.9
Domestic Hazardous Waste 0.7 0.6 1.1 0.7 0.6 0.0 0.6 0.2 0.2 0.1
Sieve Remaining 0.0 0.6 1.7 1.9 3.6 0.0 1.4 2.0 3.5 8.1
Miscellaneous 0.0 2.1 3.9 3.9 7.5 0.0 0.6 3.8 11.2 16.2
Total 100.0 100.0 100.0 100.0 100.0 100.0 100.0 100.0 100.0 100.0
Note: Totals may neither become 100% nor always be equal to the sum of the subjected column due to rounding off to the first decimal point.
Source: Lean & Green (Pvt) Limited, Waste Amount and Composition Survey Report (Season 1-3). (This work was subcontracted to the company by the JICA Project Team under the Project.)
The Apparent Specific Gravity (hereinafter referred to as “ASG”) of solid waste in ton/m
3 is an
important tool required to assess the total mass and volume of waste. The average ASG calculation
results for each generation source survey in the first and second time are shown in Figure 2.2.4. As
shown in the following figure, commercial waste especially those from restaurants have the highest
apparent specific gravity of about 0.56 ton/m3 while the other commercial waste from shops have
the lowest. The apparent specific gravity of household is at around 0.28 ton/m3.

Project for Integrated Solid Waste Management
Master Plan in Gujranwala
Draft Final Report
Volume 1 Main Report
CTI Engineering International Co., Ltd. NJS Consultants Co., Ltd.
EX Research Institute Ltd.
13
Figure 2.2.4 Apparent Specific Gravity
2.2.4 Three (3) Component Analysis, Carbon and Nitrogen Analysis, and Moisture
Contents Analysis
(1) Type of Waste Generation Sources and Number of Samples
In consideration of the possibility of intermediate treatment, the large waste discharge amount from
domestic waste and market waste is subject to the Three Component Analysis, Carbon and
Nitrogen Analysis, and Moisture Contents Analysis. Three Component Analysis, Carbon and
Nitrogen Analysis, and Moisture Contents Analysis are carried out for the waste discharge
sources/types specified in Table 2.2.5. The total number of samples for the analysis is as follows:
Three Components Analysis : 3 samples × 3 days × 4 discharge sources = 36 samples
Carbon and Nitrogen Analysis : 3 samples × 3 days × 4 discharge sources = 36 samples
Moisture Contents : 3 samples × 3 days × 4 discharge sources = 36 samples
Table 2.2.5 Number of Samples for Chemical Composition Survey
Type
Chemical Composition Survey
Discharge Source
Three
Component
Analysis
Carbon and
Nitrogen
Analysis
Moisture Contents
F Samples Samples Samples
Households
High Income 1 3 × 3 days = 9 3 × 3 days = 9 3 × 3 days = 9
Middle Income 1 3 × 3 = 9 3 × 3 = 9 3 × 3 = 9
Low Income 1 3 × 3 = 9 3 × 3 = 9 3 × 3 = 9
Markets (Food, Vegetable, etc.) 1 3 × 3 = 9 1 × 3 = 9 3 × 3 = 9
Total 4 36 36 36
Note: Number of samples is for one season only.
(2) Survey Method
Data and information from the Three (3) Component Analysis, Carbon and Nitrogen Analysis, and
Moisture Contents Analysis of wastes are used as the basic data for considering the introduction of
intermediate treatment facilities. The following analysis is carried out:
Analysis of the three components (waste types 1 to 16)
Analysis of Carbon and Nitrogen concentration in wastes (waste type 1, 2, 3 and 5)
Measurement of moisture content of combustible waste (waste type 1, 2, 3, 4, 5 and 8)

Draft Final Report
Volume 1 Main Report
Project for Integrated Solid Waste Management
Master Plan in Gujranwala
14
CTI Engineering International Co., Ltd. NJS Consultants Co., Ltd.
EX Research Institute Ltd.
The above analysis is carried out for seven consecutive days in eight days, and the detailed daily
schedule of the survey is as shown in Volume 2, Supporting Report, Section A: Waste Amount
and Composition Analysis, Section 4.2.
(3) Survey Result
Data and information from the Three (3) Component Analysis, Carbon and Nitrogen Analysis, and
Moisture Contents Analysis of wastes are used as the basic data for considering the introduction of
intermediate treatment facilities.
For this study, the chemical analysis considered was the chemical property analysis of the three
contents, namely; moisture, ash and combustible. The average results of the three-component
analysis for each generation source in the first (13-20 October 2014), second (9-16 February 2015)
and third (9-16 May 2015) seasons are shown in Table 2.2.6 and Figure 2.2.5. The three
components exhibit almost the same tendency, i.e., the ratio of moisture, ash and combustible
ranges from around 68% to 73%, 5% to 13% and 20% to 22%, respectively. Wastes from the high
income groups in residential areas showed the highest value of moisture content while the market
wastes have the highest percentages of ash content, which contains much organic waste such as
vegetable waste.
Table 2.2.6 Results of Three-Component Analysis of Each Generation Source (Average)
Type of Waste Generation Source Moisture (%) Ash (%) Combustible (%)
Household
High Income 73.2 4.7 22.1
Middle Income 70.2 8.9 20.9
Low Income 69.3 8.5 22.1
Markets (Food, Vegetable, etc.) 67.7 12.8 19.5
Source: Lean & Green (Pvt) Limited, Waste Amount and Composition Survey Report (Season 1-3). (This work was subcontracted to the company by the JICA Project Team under the Project.)
The average results of the Carbon and
Nitrogen (C/N) analysis for each
generation source in the first, second and
third seasons are shown in Table 2.2.7.
The three components exhibit almost the
same tendency, i.e., the ratio of Carbon,
Nitrogen and C/N Ratio ranges from
around 45% to 53%, 0.34% to 0.44% and
119 to 177, respectively. Wastes from the
middle income groups in residential areas
showed the highest C/N ratio while the
lowest income groups in residential area showed the lowest percentages of the ratio.
Table 2.2.7 Results of Carbon and Nitrogen Analysis of Each Generation Source (Average)
Type of Waste Generation Source Carbon (%)* Nitrogen (%)* C/N
Household
High Income 52.2 0.42 148
Middle Income 51.5 0.34 177
Low Income 49.6 0.44 119
Markets (Food, Vegetable, etc.) 49.8 0.43 152
Note:* Carbon content (%) = (100-ash %) /1.83, Nitrogen (%) = (C/N) / Carbon (%)
Source: Lean & Green (Pvt) Limited, Waste Amount and Composition Survey Report (Season 1-3). (This work was subcontracted to the company by the JICA Project Team under the Project.)
Figure 2.2.5 Results of Three-Component Analysis

Project for Integrated Solid Waste Management
Master Plan in Gujranwala
Draft Final Report
Volume 1 Main Report
CTI Engineering International Co., Ltd. NJS Consultants Co., Ltd.
EX Research Institute Ltd.
15
2.3 Waste Collection and Transportation
2.3.1 Time and Motion Study for Collection Work
(1) General
There is no organized data/record and information available for the waste management activities
especially for the efficiency of waste collection and transportation vehicles in operation in
Gujranwala. The Time and Motion Study was therefore conducted to evaluate the efficiency of
waste collection and transportation by the vehicles operated by the Gujranwala Waste Management
Company (GWMC). The first field survey was carried out by the JICA Project Team with the
collaboration of GWMC and the Urban Unit (UU), Government of the Punjab from 9 December to
24 December 2014. The results of the survey were evaluated as the basic data for the waste
collection and transportation plan while the second survey was implemented from 31 March to 8
April 2015.
(2) Objective of the Study
The objectives of the Time and Motion Study are as follows:
To grasp the operation conditions of the different types of waste collection and transportation
vehicles in service;
To evaluate the loading, unloading, travelling and total operational time from the viewpoints
of loading, unloading and total operation time in relation to waste collection and transportation
amount, travelling distance and fuel consumption; and
To develop the basic data for the formulation of a waste collection and transportation plan.
(3) Study Method
Four (4) teams consisting of the Waste Managers, Research Assistants (hereinafter referred to as
“counterparts”) and survey assistants carried out the Study under the guidance of the JICA Project
Team. The study included the recording of time for travelling, loading and unloading of waste,
tracking of the collection route and travelling distance, waste collection amount, fuel consumption
and waste collection operation efficiency, etc.
All of the activities from the starting point of the collection vehicles (i.e., GWMC Workshop
hereinafter referred to as “garage” located at Sheikhupura Road) to the collection points and return
to the garage were recorded as to time and route by GPS devices. The main activities carried out
during the field survey are summarised as follows:
Chasing of the objective collection vehicle and the recording of time consumed for each
stop/departure by GPS device;
Recording of the mileage of odometre respectively for start of collection work, end of
collection work, arrival at disposal site for unloading, start of 2nd/3rd collection work, etc., in
data sheets;
Recording by GPS device of the collection route of each objective vehicle;
Recording of the fuel consumption of each vehicle, and
Recording of observed road conditions, traffic conditions, condition of collection points,
workers behaviour, etc.
(4) Study Result
The primary purpose of using a mini-dumper is to collect waste from narrow streets or roads that
are not accessible to tractor trolleys and arm-roll trucks. Tractor trolleys were used for both waste
collection and transportation whereas the arm-roll trucks were to transport the wastes collected by

Draft Final Report
Volume 1 Main Report
Project for Integrated Solid Waste Management
Master Plan in Gujranwala
16
CTI Engineering International Co., Ltd. NJS Consultants Co., Ltd.
EX Research Institute Ltd.
handcarts and donkey carts from the primary collection points to the dump site. The number of
vehicles subjected to the field survey of 5 days was 8 and the total number of samples collected was
40.
The results of the field survey were evaluated based on the average values computed and tabulated
in Table 2.3.1 for the key factors of waste collection and transportation activities. In particular, the
key factors regarding loading, unloading and travelling times which consist of the total time were
observed as explained in detail in Table 2.3.2. As mentioned above, due to the different types of
services allotted to each vehicle, the values cannot be compared simply but comparison or
evaluation of the performance or the efficiency of the three types of vehicles are described in detail
in Volume 2, Supporting Report, Section B: Waste Collection and Transportation, Subsection
2.1.4.
Table 2.3.1 Summary of Waste Collection and Transportation Analysis by Vehicle Type
No. Evaluation Items
Vehicle Type
Arm-roll
truck
Tractor
trolley
Mini-
dumper* (T/S)
Mini-
dumper* (D/S)
1. Average Waste Handling Amount (kg) 14,345 3,686 2,800 2,050
2. Average Mileage (km) 141 48 53 88
3. Average Fuel Consumption (litres) 35 16 9 13
4. Average Number of Trips (times/day) 5.0 1.8 5.1 4.2
5. Average Number of Crews (persons) 1.0 2.5 2.6 2.0
6. Average Loading Time (minutes: min.) 36 213 260 251
7. Average Travelling Time (min.) 385 275 229 333
8. Average Unloading Time (min.) 39 14 24 30
9. Average Total Operating Time (min.) 460 502 512 615
10. Average Mileage per Unit Fuel Consumption (km/litre) 4.1 3.2 5.9 6.8
11. Average Waste Handling Amount per Unit Distance (kg/km) 103 78 53 23
12. Average Waste Handling Amount per Loading Time (kg/hr) 25,141 1,043 646 490
13. Average Waste Amount per Travelling Time (kg/hr) 2,226 806 734 396
14. Average Waste Handling Amount per Total Time (kg/hr) 1,866 441 328 200
15. Average Waste Handling Amount per Unit Fuel
Consumption (kg/litre) 417 246 311 158
Note:* Mini-dumpers that go to the transfer station are indicated as “T/S”, and mini-dumpers that go to the disposal site are indicated as “D/S”.
Table 2.3.2 Key Factors affecting Operation Time during the Survey
Objective Arm-roll truck Tractor trolley Mini-dumper
(T/S) Mini-dumper
(D/S)
Loading Time
36 minutes (min.) (8% of total time)
3:33 (hr:min.) (42% of total time)
4:20 (hr:min.) (51% of total
time)
4:11 (hr:min.) (41% of total
time)
a) Driver has to wait for a container to be fully filled due to late transportation of primary collected waste.
b) Partial filling and littering of waste outside the container.
c) Improper location of container and traffic problem.
d) Loaded the container from the temporary transfer station and skipped the allotted containers.
e) Residents are reluctant to place the container near to their houses. It sometimes takes time to change the location of a container.
a) Lack of designated crew for loading.
b) Delay due to late sweeping of roads/ streets by sanitation staff.
c) Timing of traffic congestion at school and office site.
d) Routes to access the containers are also used by mini-dumpers.
e) Traffic congestion at School and Office timing
f) In UC-19 & 46, handcarts are also unloaded from mini-dumpers and tractor trolleys.

Project for Integrated Solid Waste Management
Master Plan in Gujranwala
Draft Final Report
Volume 1 Main Report
CTI Engineering International Co., Ltd. NJS Consultants Co., Ltd.
EX Research Institute Ltd.
17
Objective Arm-roll truck Tractor trolley Mini-dumper
(T/S) Mini-dumper
(D/S)
Traveling Time
6:25 (hr:min.) (84% of total time)
4:35 (hr:min.) (55% of total time)
3:49 (hr:min.) (45% of total
time)
5:33 (hr:min.) (54% of total
time)
a) Container was not or partially filled at the arrival of arm-roll truck and the driver had to move the vehicle to find some other allotted points for loading filled/partially filled container.
b) Allotted containers are not from adjacent UCs and far from each other.
c) Fan belt of Hino-11 was broken.
d) Engine problem in Hino-14
a) Travelled at a speed of 5-6km/hr.
b) 20 years old machinery, engine struck out of TT-9774, Gear Plate and Hauling Jack of TT-Holland-1 was out of order, Belt of cylinder broke out and tyre of Holland-2 was also punctured.
c) Steering lever of TT-451 was broken and it took 90 minutes to repair it.
d) Waste collection route by TT-451 was not appropriate: streets were narrow so that it is difficult for the vehicle to turn the corner and it also causes traffic congestion problem.
a) Most drivers made first trip with partially filled dumper.
b) Travelled at slow speed to avoid the littering of waste.
Unloading Time
39 minutes (8% of total time)
14 minutes (3% of total time)
24 minutes (4% of total
time)
30 minutes (5% of total
time)
a) Absence of record keeper at 7:30 a.m.
b) Delay in alignment of remaining waste of previous day at Gondlanwala.
c) Delay due to dumping of other vehicles at designated points.
a) Bucket unloaded the waste from tractor trolley (Holland-1) due to the problem in hauling jack.
b) Steering wheel of TT-6946 was broken and it took 6 days to repair
c) Fuel tank of TT-6946 was leaked.
a) Delay due to dumping of other mini-dumpers at the transfer station.
b) GAJ-49 spends 40 minutes for hauling the waste to Gondlanwala.
(5) Major Findings and Recommendations
Based on the results of the time and motion study, major findings and the matters to be
recommended with respect to improvement of the operation of waste collection and transportation
vehicles are as summarised below.
The arm-roll truck with a container is the most efficient vehicle among the three types in terms
of handling waste amount, operating time and manpower. However, since the container
placement is limited to relatively wide roads or vacant spaces, the utilisation of mini-dumpers
for narrow streets/roads is recommendable among three types of vehicles.
Average mileage per unit fuel consumption of the tractor trolley is as low as 3.2 km/litre and
the traveling performance as well as waste handling amounts are low. In addition, most of the
tractor trolleys are aging, so that maintenance costs would increase. Tractor trolley shall
therefore be replaced with other appropriate types of vehicle such as compactors as soon as
possible from the viewpoint of cost-effectiveness.
Loading efficiency of mini-dumper (T/S) is quite low at 311 kg/litre due to the large number of
collection points and door-to-door operation. The loading efficiency must be improved by
increasing to two sanitory workers and asking cooperation from the residents on the method of
discharging waste from their households.
Loading efficiency of mini-dumpers (D/S) is quite low at 158 kg/litre due to the large number
of collection points and door-to-door operation. In addition, the vehicle has limited collection
capacity and goes to the landfill site directly so that the loading efficiency of mini-dumper
(D/S) is worse than that of mini-dumpers (T/S). Thus, using a mini-dumper on door-to-door
Draft Final Report
Volume 1 Main Report
Project for Integrated Solid Waste Management
Master Plan in Gujranwala
18
CTI Engineering International Co., Ltd. NJS Consultants Co., Ltd.
EX Research Institute Ltd.
collection is not recommended. A 4 m3 compactor is recommended for door-to-door collection
because this compactor has almost the same body length and fuel consumption as the
mini-dumper, and it has 4 times capacity of mini-dumper.
The efficiency of the combination work by mini-dumper and arm-roll truck for collection and
transportation work is lower than that of the performance of tractor trolley in terms of fuel
consumption. Since the distance to the disposal site is less than 10 km from the centre of the
city and not much time and fuel is needed, this kind of waste transfer operation shall be limited
to the minimum to save on cost.
In addition to the recommendations above, the following matters observed and learned during the
survey are also recommended to improve operations:
The parking lot for each vehicle at GWMC garage should be fixed because the early comer
drivers have to wait for the late comers and this results in the delay to start the waste collection
service.
Not only repair and maintenance equipment for tire puncture, etc., should also be made
available at the GWMC garage but also the drivers are obliged to conduct checking the
vehicles at the start of operation to prevent causing the problems during the work.
Waste collection points and routes for each vehicle should be defined for routine work since
the driver has to call and sometimes ask about the next collection points and this causes the
waste of time.
Route of mini-dumper should be different from that of donkey cart and handcart to avoid
duplication of the service area and the service area can be maximised.
Adjacent container points should be allocated to each arm-roll truck to avoid extra traveling
distance for loading and transporting the waste.
Adopting the radio-frequency identification device (RFID) would be useful for monitoring the
operation status. The system will help to check the waste transportation efficiency.
UC supervisor should supervise the container points sine arm-roll trucks skip their designated
container points and load the container from the temporary transfer station to meet their
allotted 4-5 trips per shift.
2.3.2 Present Status of Waste Collection and Transportation Work
(1) Functions of the GWMC
GWMC currently collects solid waste generated in only 64 UCs and covers the following functions:
(i) Waste collection and transportation (ii) Street cleansing (iii) Drainage and gutter cleansing along streets (partially*) (iv) Dead animal collection (v) Others
Note:*The width of more than two feet is managed by WASA and GWMC is responsible for the remaining drainage and gutters.
GWMC collects some construction and demolition wastes while cleaning the city roads/streets
although it is not obligated to collect them. The issues on construction and demolition waste are as
presented in Subsection 2.9.3.
Primary Collection (a)
Basically, residents throw waste into containers allotted by GWMC if there is a container near
their houses, but containers are not located all over the city [see Item (3)]. Therefore, sanitary
workers collect the garbage put in front of the door of each household. In some places, sanitary
workers collect garbage directly from the residents and normally 6 - 7 handcarts are deployed

Project for Integrated Solid Waste Management
Master Plan in Gujranwala
Draft Final Report
Volume 1 Main Report
CTI Engineering International Co., Ltd. NJS Consultants Co., Ltd.
EX Research Institute Ltd.
19
in each union council (UC). The hearing survey is to clarify that sanitary workers receive
some amount of money from households in this case.
The hearing survey is also to clarify that there are few cases where some retired sanitary
workers conduct primary collection and receive collection fee from households. Some waste
pickers take valuables out from the garbage put outside the door of households and pass the
remaining waste to the sanitary workers. Valuable wastes in the garbage from households are
collected by waste pickers or sanitary workers.
There is no waste collection service in some part of the union councils (UCs). In these areas,
residents throw their garbage into nearby open plots and on the streets. The waste left on the
open plots and streets are then scattered by animals scavenging for food, and these become
illegal dumping sites.
Secondary Collection (b)
The situation of secondary garbage collection conducted by GWMC is summarised as follows:
Collection System: One to three 5m3 containers and/or 10m
3 containers. However, the
number of containers is limited, so that no container is deployed in some parts of a UC.
Frequency of Collection: Garbage collection from the containers is made every day. If the
container is not full, the garbage is not collected.
Collection Method: Collection is by arm-roll truck, tractor trolley or mini-dumper based
on the infrastructure conditions such as road width, accessibility and space for placement.
The current collection service is carried out by a combination of 37 tractor trolleys
working together with 7-8 units of handcarts deployed at each UC and 35 mini-dumpers
and 26 units of arm-roll trucks for the 231 units of waste containers placed in the town
area.
Collection Equipment: Arm-roll truck, tractor trolley, mini-dumper, handcart, donkey
cart and motorbike rikshaw.
The collection method varies depending mainly on the size of road. An arm-roll truck
and a tractor trolley are utilised on large and medium-sized streets. In a small street, the
donkey cart and handcart is utilised. Since the end of 2014, GWMC started using
mini-dumpers with donkey carts and handcarts for the collection of waste.
(2) Service Area
GWMC collects garbage from 64 union councils (UCs) and the present service area for waste
collection is demarcated by the same UCs’ boundary as shown in Figure 2.3.2. As shown in this
figure, there are three categories in terms of waste collection service level covered by GWMC,
namely; the served area, partially served area and unserved area which includes private housing
societies, open lands, green lands, etc. Table 2.3.3 shows the area and population of each category
and the ratio to total area. GWMC provides the waste collection services for 76% of the total area
of 64 UCs including the partially served area while 34 UCs in the peri-urban area are not covered
currently by GWMC collection services. Detailed analysis regarding the service area is given in
Subsection 4.3.1.

Draft Final Report
Volume 1 Main Report
Project for Integrated Solid Waste Management
Master Plan in Gujranwala
20
CTI Engineering International Co., Ltd. NJS Consultants Co., Ltd.
EX Research Institute Ltd.
Table 2.3.3 Waste Collection Service Coverage Area and Population, and their Percentage
Service Coverage Area (km2) Population*
Percentage of 64 UCs (%)
Percentage of 98 UCs (%)
Area Population Area Population
64 UCs
Served 22.6 747,192 34.8 36.4 6.9 25.2
Partially served 26.7 878,752 41.1 42.8 8.1 29.7
Unserved 15.7 427,721 24.1 20.8 4.8 14.4
Sub-Total 65.0 2,053,665 100.0 100.0
34 UCs in peri-urban area Unserved 262.6 909,749 - - 80.2 30.7
Total 327.6 2,963,414 - - 100.0 100.0
Note: *The population is estimated as the figures as of 2014.
After GWMC’s commencement of operation, the UCs were divided into 8 zones for management
purposes, as shown in Figure 2.3.1.
Figure 2.3.1 Zoning Map of GWMC Service Area
Source: GWMC
NOT TO SCALE

Project for Integrated Solid Waste Management
Master Plan in Gujranwala
Draft Final Report
Volume 1 Main Report
CTI Engineering International Co., Ltd. NJS Consultants Co., Ltd.
EX Research Institute Ltd.
21
(3) Location of Garbage Containers
Some 216 sets of 5m3 containers and 15 sets of 10m
3 garbage containers were allocated in
Gujranwala City as of January 2015, as shown in Table 2.3.4. Considering the size of the city, the
number of containers seems inadequate. To offset the situation, handcarts and/or donkey carts are
utilised for garbage collection from households to the garbage containers. In addition, 24 dust bins
are located in the city.
Figure 2.3.2 Service Area Map of Waste Collection in Union Councils
Source: GWMC

Draft Final Report
Volume 1 Main Report
Project for Integrated Solid Waste Management
Master Plan in Gujranwala
22
CTI Engineering International Co., Ltd. NJS Consultants Co., Ltd.
EX Research Institute Ltd.
Table 2.3.4 Location of Garbage Containers in Gujranwala City
Location UC Number/Road
Number of Containers
5m3
Containers
10m3
Containers
Total
Zone 1 4, 6, 7, 8, 57, 61, 63, 64 19 2 21
Zone 2 5, 9, 10, 11, 12, 13, 14 19 0 19
Zone 3 1, 2, 15, 16, 17, 18, 19, 20,
21, 22 36 0 36
Zone 4 23, 24, 25, 26, 27, 28, 29 25 2 27
Zone 5 30, 31, 32, 33, 34, 41, 42 33 0 33
Zone 6 35, 36, 37, 38, 46, 47, 48 19 0 19
Zone 7 3, 39, 40, 43, 44, 45, 54, 55,
56 14 1 15
Zone 8 49, 50, 51, 52, 53, 58, 59,
60, 62 13 0 13
Miscellaneous G.T. Road, Sialkot Road,
Sheikhupura Road 16 5 21
Workshop 0 2 2
On Arm-rolls 22 3 25
Total 216 15 231
Source: GWMC, January 2015.
Containers are supposed to be allocated in each UC. However, the number of containers allocated
is not planned by GWMC, but the location of containers is determined by the infrastructure
conditions and residents’ consent of each UC since all the streets/roads are not wide enough to lift
and place the containers. Moreover, most residents are reluctant to place a container near their
houses, shops or stores due to the smell, flies, etc. Some of the UCs are therefore far from the
location of containers, which resulted in the illegal dumping in the city.
Empty 5m3 containers are attached to 22 arm-roll trucks and empty 10m
3 containers are attached to
the arm-roll trucks before the daily collection starts. The reason for this is that the empty container
is placed at the edge of the road to replace the container full of garbage which will be taken by the
trucks to the final landfill site. Life duration of containers is approximately 5 to 7 years. Repair
work for the container is conducted in the workshop.
(4) Transfer Station
Function of Transfer Station (a)
There are five (5) transfer stations/masonry enclosures in the city; namely, the Khiali, Garjakh,
and General bus stations, DHQ Hospital and Khan Mahal. They are called transfer stations,
but the containers are put on the concrete floor surrounded masonry walls, practically, and
only receive garbage from the surrounding UCs. Once a container is filled with the garbage,
an arm-roll truck dispatches another empty container and hauls the filled container. There is no
function such as transfer of garbage from other.
Location and Operation Status on each Transfer Station (b)
Figure 2.3.3 shows the location of transfer stations in Gujranwala City, and the status on each
transfer station is summarised in Table 2.3.5 (Detailed features of the transfer stations are
described in Volume 2, Supporting Report, Section B: Waste Collection and Transportation,
Subsection 2.2.4.).

Project for Integrated Solid Waste Management
Master Plan in Gujranwala
Draft Final Report
Volume 1 Main Report
CTI Engineering International Co., Ltd. NJS Consultants Co., Ltd.
EX Research Institute Ltd.
23
Figure 2.3.3 Location of Transfer Stations in Gujranwala City
Source: GWMC, April 2014.
Table 2.3.5 Summary of the Status on Each Transfer Station
No Location Start
operation
Floor
area
Physical
features
Placement
of
containers
Covered
UCs
Handling
waste
amount
Working
hours
Supervisors
(1) Khiali
Transfer
Station
Centre of
the
commercial
area
2008 50 m2 The roof was
covered with
vinyl sheets.
2 3 to 4 UCs 12 m3 6 a.m. to
3 p.m.
1
(2) Garjakh
Transfer
Station
-ditto- 2008 50 m2 No roof and
no sidewalls.
2 3 UCs 16 m3 -ditto- 1
(3) General
Bus
Station
(Masonry
Enclosure)
General
Bus Station
2008 110 m2 The roof is
being
covered with
vinyl sheets.
1 General
Bus
Station, 1
UC (#4)
4 m3 -ditto- None
(4) DHQ
Hospital
(Masonry
Enclosure)
Main Road
along the
DHQ
Hospital
2008 38 m2 -ditto- 1 DHQ
Hospital
(Municipal
waste)
5 m3 -ditto- None
(5) Khan
Mahal
(Masonry
Enclosure)
Southwest
of the
GWMC
workshop
2008
(closed
within a
couple of
weeks)
- - - - - - -
NOT TO SCALE
(1)
(2)
(3)
(5)
(4)

Draft Final Report
Volume 1 Main Report
Project for Integrated Solid Waste Management
Master Plan in Gujranwala
24
CTI Engineering International Co., Ltd. NJS Consultants Co., Ltd.
EX Research Institute Ltd.
(5) Current State of Collected Waste
(a) Collected Waste Amount
Collected waste is conveyed to the dump site by collection vehicles. No record of disposed
amount is available before the
establishment of GWMC.
However, GWMC studied the
waste collection amount data
utilising the data of a private
weighbridge during May to August,
2014. In addition, a new truck scale
was installed in Gondlanwala and it
started measuring the weight of
each collection vehicle since 4
September 2014. Figure 2.3.4
shows the said waste collection
amount although this amount
includes the waste collected by
One-Time Cleaning Activity as
mentioned in Subsection 2.3.3.
Approximately 370 to 540 tons of waste per day is collected and transported to the landfill site.
Since GWMC started two-shift collection from July 2014, the waste collection amount
increased from July. The waste
amount in October was larger
than that of the other months
because people celebrated the
“Eid Holiday” (Eid-ul-Azha,
the festival of sacrifice for
Muslims), butchered and ate
many goats or sheep resulting
in a quite large amount of
leftovers in the city.
Figure 2.3.5 and Table 2.3.6
are reflected in the average
daily tonnage per arm-roll
truck/tractor trolley.
Table 2.3.6 Average Daily Collection Tonnage per Arm-roll Truck/Tractor Trolley
Unit: ton/car
Item May Jun. Jul. Aug. Sep. Oct. Nov. Dec. Average
Arm-roll truck 3.37 4.25 3.12 3.12 2.85 2.94 2.76 2.89 3.16
Tractor Trolley 2.78 2.85 3.06 2.82 2.21 2.35 2.07 2.09 2.53
Mini-Dumper - - - - - 0.56 0.47 0.46 0.50
According to the survey, an arm-roll truck conveys approximately 3.2 tons and a tractor trolley
conveys 2.5 tons daily. A total of 35 mini-dumpers were newly commissioned for primary
collection since October 2014 and are operating mainly in narrow streets and unloading their
waste at a transfer station. A mini-dumper carries about 0.5 tons in a day.
Figure 2.3.4 Total Waste Collection Amount
(May - December 2014)
Figure 2.3.5 Average Daily Collection Tonnage per Arm-roll
Truck/Tractor Trolley

Project for Integrated Solid Waste Management
Master Plan in Gujranwala
Draft Final Report
Volume 1 Main Report
CTI Engineering International Co., Ltd. NJS Consultants Co., Ltd.
EX Research Institute Ltd.
25
The capacity of tractor trolley is approximately 3.0m3, and it is three-fifths of the 5m
3
container capacity, i.e., around 1.5 tons of waste. The arm-roll truck transports a 5m3
container with approximately 2.5 tons. In each case, it is found that both types of car carry an
excess amount of waste. Table 2.3.7 shows the average number of trips per arm-roll
truck/tractor trolley. These values are slightly different from the results of the Time and
Motion Study described in Subsection 2.3.1 due to the different survey periods and subject
vehicles.
Table 2.3.7 Average Number of Trips per Arm-Roll Truck/Tractor Trolley
Unit: trip/day Item May Jun. Jul. Aug. Sep. Oct. Nov. Dec. Average
Arm-roll truck 2.9 2.8 4.3 4.1 4.2 4.9 4.7 4.5 4.1
Tractor Trolley 2.0 1.2 1.8 2.2 1.7 2.0 2.0 2.0 1.9
Mini-Dumper - - - - - 1.8 1.7 2.4 2.0
Collection Ratio (b)
There is no data regarding collection ratio. According to the interview survey for waste
managers, the collection seems to be sixty (60) percent in Gujranwala City in the end of
December 2014.
According to the collection record, waste amount in a container is assumed at around 3 tons.
The total waste amount that all of the containers could keep is, therefore, 603 tons since the
number of containers before December 2014 was about 201; that is, 201 units × 3 tons = 603
tons. According to the interview survey for waste managers, approximately 1,000 tons of
waste is generated in the city as 0.55 kg/capita/day was considered. Based on the result of the
interview, it is assumed that 60% (603/1,000) of waste is collected. This is relatively close to
the waste managers’ estimate. The more detailed discussion in terms of the current collection
rate is described in Section 4.3.
(6) Collection Workers
One zone is managed by one Assistant Manager (Operations) of GWMC who has one or two Chief
Sanitary Inspectors under him. The Chief Sanitary Inspector manages some of UCs that every UC
has at least one supervisor who manages around 10 to 30 sanitary workers. The total number of
sanitary workers is 1,166.
The average number of sanitary workers deployed per UC is 18 which are not enough to cover the
whole area. In actual work, 250-300 houses and 10-15 streets are allotted to one worker per day.
Accordingly, workers skip their assigned job in some parts of the allotted area every day because
the area is too wide to cover by only one worker in a day.
Workers are not provided with safety gadgets like masks, safety shoes and gloves. Workers sweep
streets and collect waste from 6:00 a.m. to 2:00 p.m. in dusty areas where there is a high potential of
getting asthma. Waste is not segregated at waste generation sources so that there is also the risk of
handling sharp materials like needles or any dangerous material which may cause injury to the
workers.
(7) Collection Vehicles
Summary of Collection Vehicles (a)
Table 2.3.8 shows the list of vehicles owned by GWMC as of January 2015. Currently, 119
vehicles are utilised for waste collection and transportation, and street cleansing operation.
The oldest vehicle was procured in the year 1968 and the latest one was procured in the year
2014. Mini-dumpers were introduced by GWMC in the end of 2014. Most of the-arm roll

Draft Final Report
Volume 1 Main Report
Project for Integrated Solid Waste Management
Master Plan in Gujranwala
26
CTI Engineering International Co., Ltd. NJS Consultants Co., Ltd.
EX Research Institute Ltd.
trucks were procured in 2009 and the tractor trolleys were procured in 1996 by City District
Government Gujranwala (CDGG) then all the vehicles were transferred to GWMC in 2014
based on Services and Assets Management Agreement (SAAMA).
Based on the Time and Motion
Study (see Subsection 2.3.1), the
efficiency of tractor trolley is lower
than those of the other main
collection and transportation
vehicles, i.e., arm-roll trucks and
mini-dumpers. Only two (2) tractor
trolleys were procured after the
year 2007 and the rest were before
2000. The rate of operation of those
superannuated tractor trolleys is
thus low due to frequent
maintenance and repair.
Additionally, the truck bed of a
tractor trolley is high for the
workers to load waste from the
ground that makes the loading time
longer. High fuel consumption and
low travelling performance are the
disadvantages of a tractor trolley so
that it is inappropriate to use them
for the waste collection service. Moreover, if age deterioration of the vehicle is considered,
GWMC also requires preparation of additional maintenance cost for the vehicles as well.
Workshop/Garage (b)
The workshop and the garage are located in Sheikhubura
Road, which is 5 km away from the city centre. The area of
the workshop is 6,000 m2 and unpaved. The
workshop/garage is also annexed to the administration
building. Two engineers, two truck technicians, three
tractor technicians, one electrician, four welders, seven
helpers, one washman, one assistant washman, three
security guards, one painter and one office boy are being
assigned as of June 2015.
Operation condition of waste collection vehicles are
monitored at the administration building. These conditions
are recorded on a log book and driving operation is thus
administered according to the log book. However, the
driving route for each vehicle is not at all recorded on the
book. Thus, waste collection and transportation are also
administered according to the logbook.
There are docks for car repair/check-up in the
garage/workshop. General check-up such as changing tires
could be conducted in the workshop/garage, but vehicle
malfunctions which could not be dealt with in the workshop are repaired by outsourcing.
There is no car wash facility in the workshop and waste collection vehicles are washed at
private car wash facilities. The expense for car wash is paid by the driver and reimbursed once
in every two weeks.
Table 2.3.8 List of Vehicles in GWMC
Type of Vehicle Number of
Vehicle Procurement Year
Arm-roll truck (5m3) 22 (22) 2007 - 2011
Arm-roll truck (10m3) 4 (4) 2001 - 2002
Tractor trolley 37 (36) 1977 - 2007
Mini-dumper 35 2014
Mechanical sweeper 4 (4) 2011
Tractor with bucket, 4×4 3 (3) 2008
Tractor with bucket, 2×2 4 (4) 1998, 2000
Tractor with blade 4 (4) 1988
Rikshaw 2 (2) -
Water sprinkler 2 (2) 2009
Spray machine 1 (1) 2014
Water bowser 1 (1) 1968
Total 119 (83) -
Note: Figures in parentheses indicate the number of vehicles inherited from CDGG.
Source: GWMC, January 2015.
Photo 2.3.1 Current Situation of
Vehicle Workshop

Project for Integrated Solid Waste Management
Master Plan in Gujranwala
Draft Final Report
Volume 1 Main Report
CTI Engineering International Co., Ltd. NJS Consultants Co., Ltd.
EX Research Institute Ltd.
27
Used tires, broken containers and broken vehicles are stored in the workshop/garage. These
items are planned to be sold by auction after repair. Photo 2.3.1 shows the current situation of
the workshop.
Vehicle Condition (c)
More than 110 vehicles are operated for waste collection and transportation in a day. Since
GWMC requests the car dealers to undertake regular check-ups and maintenance of the
vehicles, the condition of vehicles is relatively maintained.
According to the interview survey, the major cause of vehicle malfunction is flat tire by
ceramics abundantly scattered on the streets. The number of malfunction by flat tire is more
than the number of mechanical malfunction of vehicles.
Spare Parts for Vehicles (d)
Spare parts for car maintenance are procured through car dealers/private workshops in
Gujranwala. Spare parts not available in Gujranwala are procured in Lahore. Therefore, no
issue is found with the procurement of spare parts in particular.
Most of the collection vehicles were manufactured around the year 2000. Although it is
impossible to procure genuine spare parts for these vehicles, generic spare parts or other
alternatives such as other manufacturer’s spare parts are utilised for the maintenance or repair
of these vehicles.
O&M Expense for Vehicles (e)
Table 2.3.9 shows the operation and maintenance (O&M) expense paid by CDGG from 2006
to 2013. Most vehciles were repaired in 2006 and the repaired vehicles did not cause big
problem during operation. Therefore, it might help to reduce the repair cost and the O&M
expenditure was almost half figure of 2006 in three years starting from 2007 to 2009. Since
most of the vehicles were made in the year 2000 and utilised for almost 10 years, these
vehicles should have been renewed in the term of 2012-2013. In addition, vehciles procured in
2009 are also broke down in this duration. This is the reason the O&M expense of 2012-2013
was therefore getting higher than that of 2011-2012 and the O&M expence is doubled in a
year.
Table 2.3.9 O&M Expense from 2006 to 2013
Item 2006-2007 2007-2008 2008-2009 2009-2010 2010-2011 2011-2012 2012-2013
O&M Expense
(Rs.) 6,651,535 3,069,816 2,829,089 - 4,476,970 5,815,355 10,751,845
Source: CDGG
Note: There is no data available in 2009-2010.
(8) NGO
There was one NGO, OPE (Organization Pan Environment), which worked in UC
No. 8 (Shaheenbabad) during 2008 to 2010. The organization used to conduct primary collection;
however, some issues such as shortage of funds and not having cooperation by the residents
occurred and the activity was terminated after two years.
(9) Waste Collection and Transportation Scheme Conducted by GWMC
Based on the results of the site reconnaissance and field surveys mentioned above, the waste
collection and transportation scheme conducted by GWMC from generation sources to the final

Draft Final Report
Volume 1 Main Report
Project for Integrated Solid Waste Management
Master Plan in Gujranwala
28
CTI Engineering International Co., Ltd. NJS Consultants Co., Ltd.
EX Research Institute Ltd.
disposal site is illustrated in Figure 2.3.6. The amount of waste for each flow was identified in
consideration of results of incoming waste survey, waste pickers survey and other related surveys
and data collection as presented in Section 4.3.
Figure 2.3.6 Waste Collection and Transportation Scheme Conducted by GWMC
2.3.3 One Time Cleaning Activity
(1) General
GWMC has conducted collection of accumulated waste throughout the city temporarily since June
2014. These wastes piled up in vacant lots and along the roads have been dumped illegally. During
the early stage, the activity was implemented once a month, but it is currently conducted almost
daily.

Project for Integrated Solid Waste Management
Master Plan in Gujranwala
Draft Final Report
Volume 1 Main Report
CTI Engineering International Co., Ltd. NJS Consultants Co., Ltd.
EX Research Institute Ltd.
29
(2) Waste Amount Collected by the Activity
The waste amount collected by this one-time cleaning activity after the installation of truck scale at
Gondlanwala is recorded and summarised in Table 2.3.10. Around 60 tons of waste were collected
by the activity in a day in the latest five months. Roughly 7% of waste generation is being collected
under the activity.
Table 2.3.10 Waste Amount Collected by the One Time Cleaning Activity
Month Sep. 2014 Oct. 2014 Nov. 2014 Dec. 2014 Jan. 2015 Average
Waste Amount per Day (ton/day) 77 77 52 52 43 60
(3) Vehicle Fleet Allocation
The One-Time Cleaning Activity is conducted daily by two sets of one tractor trolley, one tractor
with bucket and one tractor with blade. After the activity, the fleet goes to join the ordinary waste
collection and transportation operation.
2.3.4 Illegal Dumping
(1) Causes of Illegal Dumping
There are nearly 800 illegal dumping sites in Gujranwala City and these sites are mainly vacant
plots. According to the interview with UU and GWMC, the causes of illegal dumping are: (1) the
insufficient number of containers; and (2) the long distance from a resident’s household to the
container location, which temps a resident to dispose his garbage on an empty plot, road or gutter
near his house although a container is located in the UC. Illegally dumped garbage on vacant lots or
streets in the UC has thus piled up because they are not collected by the GWMC. Garbage is
brought to these sites regularly and the number of illegal dumping sites had increased.
The residents do not feel that throwing garbage on a vacant lot is a bad practice, in particular. This
shows the lack of sanitation consciousness which is one of the causes of illegal dumping of waste.
Some parts of the illegal dumping sites used to be swamps and some landlords filled them with
garbage and made flat.
At some locations, garbage is scattered around the containers and the situation is similar to the
illegal dumping sites. This means that the residents near a container do not dispose their garbage
into the container or they do not mind even if the tossed garbage drops outside of the container.
The organization and budget for solid waste collection are also limited. Therefore, the current
situation of data management, facility operation and the organization has not improved.
Figure 2.3.7 shows the relationship between the containers and the illegal dumping sites. The red
squares on the map show the location of containers in the 200 metre or 500 metre circles set on the
map. These circles mean that residents in these circles are considered to be able to access the
container within five minutes to ten minutes. Basically, illegal dumping sites are seen outside of
the circles, which mean that these illegal dumping sites are located in areas where collection service
is poor. Moreover, there are some illegal dumping sites even inside the 500-metre circles. This
reveals that public awareness on solid waste is relatively low among the residents.
GWMC conducts the clean-up campaign once in a month as the countermeasure to illegal dumping
sites as presented in the previous Subsection 2.3.3. In the campaign, waste on an illegal dumping
site is removed by a wheel-loader, dumped into a container and taken to the final landfill site. A
large number of illegal dumping sites exist and the scale of each site varies. No sweeping measure
against illegal dumping has been planned by GWMC and hence illegal dumping is still done by the
residents.

Draft Final Report
Volume 1 Main Report
Project for Integrated Solid Waste Management
Master Plan in Gujranwala
30
CTI Engineering International Co., Ltd. NJS Consultants Co., Ltd.
EX Research Institute Ltd.
(2) Location of Illegal Dumping Sites
Table 2.3.11 shows the list of illegal dumping sites in the towns as of August 2014. shows the
current situation of illegal dumping sites. As mentioned in the preceding Subsection 2.3.3, GWMC
conducts a clean-up drive against illegal dumping sites regularly. However, several dumping sites
still exist in the city. It is difficult to clean up all dumping sites in a short period of time.
Table 2.3.11 Number of Illegal Dumping Sites
in the Towns
Town Number of Illegal
Dumping Site
Aroop 292
Qila Didar Singh 67
Nandi Pur 111
Khiali Shahpur 329
Total 799
Source: GWMC, August 2014.
Photo 2.3.2 View of Illegal Dumping Sites
in Gujranwala City
Figure 2.3.7 Relationship between
Container and Illegal Dumping Site
Source: GWMC, April 2014.

Project for Integrated Solid Waste Management
Master Plan in Gujranwala
Draft Final Report
Volume 1 Main Report
CTI Engineering International Co., Ltd. NJS Consultants Co., Ltd.
EX Research Institute Ltd.
31
2.3.5 Installation of a Truck Scale
(1) Purpose of Weighbridge Installation
No record of collected waste amount was kept by GWMC’s own scale. A record of collected waste
amount is important information for conducting solid waste management. A weighbridge has been
procured in this project and starting operation since 4 September 2014. The new truck scale was
also utilised for conducting the survey for incoming waste amount.
(2) Specification of the Weighbridge
A weighbridge, forty (40) tons of measurement capacity, has been procured in this project. The
measurement capacity of 20 tons or 30 tons satisfies the existing arm-trucks or truck trolleys with
collected waste on their assigned quota. Although GWMC plans to adopt 12m3 or 19m
3 sized
compactors in future, the gross vehicle weight for each car is more or less 18 tons or 26 tons and it
can be measured within the loading limit of this weighbridge.
The gross weight of each vehicle is measured by the weigh bridge. The tareweight of each vehicle is
measured beforehand and registered in the weighbridge computer program. Incoming waste
amount of each vehicle is measured automatically by subtracting the tareweight of the encoded
vehicle from the gross weight of the incoming vehicle. This type of computerised weighbridge
measuring method is common in Pakistan nowadays. It is easy for GWMC to maintain the
weighbridge in case of malfunction of the weighbridge. Thus, the weighbridge is suited for the
project.
GWMC does not accept the waste carrying into the landfill site by private companies. If the private
companies come to dispose the waste in the landfill site, GWMC refuses to accept/dispose the
waste in the site.
The general plan and specifications of the weighbridge are presented in Volume 2, Supporting
Report, Section B: Waste Collection and Transportation, Subsection 2.5.2.
(3) Location of the Weighbridge
The weighbridge is installed at the northern side of the temporary Gondlanwala final landfill site.
After the installation of the weighbridge, all GWMC collection vehicles were registered on the data
collection system in a computer that connects to the weighbridge. Waste amounts brought to the
final landfill site by each vehicle are recorded in the computer. However, this weighbridge is
planned to be relocated at minimal cost, say less than a million rupees or so when the new landfill
site is opened. Photo 2.3.3 shows the installed weighbridge.
Photo 2.3.3 Installed Weighbridge at Gondlanwala

Draft Final Report
Volume 1 Main Report
Project for Integrated Solid Waste Management
Master Plan in Gujranwala
32
CTI Engineering International Co., Ltd. NJS Consultants Co., Ltd.
EX Research Institute Ltd.
2.3.6 Evaluation of Waste Collection and Transportation Condition
The problems and issues in relation to waste collection and transportation activities under the current
situation are summarised in Table 2.3.12. These items will be the basic elements to develop the plans,
programmes and projects to comprise the waste collection and transportation plan in the Integrated Solid
Waste Master Plan in Gujranwala.
Table 2.3.12 Identification of Problems and Issues on Waste Collection and Transportation
Problem Description of Problem Issues for Solving the Problems
1. Not fully covered waste collection service for 64 urban UCs
Uncollected area and partially collected area exist in the current collection area, and 100% of the area or the entire area of 64 urban UCs has not always been collected. Therefore, as a result, waste is scattered in the streets and open spaces in the uncollected area and the partially collected area in the town area.
The method of waste discharge and temporary storage, type of collection vehicles, collection frequency, etc., shall be reviewed for improvement of the primary and secondary collection services that should cover the entire city area.
2. No waste collection service in rural 34 UCs
Waste collection work is being carried out only within the area of 64 urban UCs resulting in the scattering of waste in 34 rural UCs. GWMC will be responsible to cover the waste collection and transportation service with these extended areas in the future.
Waste collection service area in the developed area and the urbanised area of 34 peripheral UCs should be expanded to prevent the scattering of waste and tentative clean-up operation in the affected areas should be carried out continuously.
3. Insufficient number of waste container and arm-roll truck
The number of collection vehicles and waste containers is insufficient for the collection of all wastes generated in the city. As a result, it is causing obstacles to traffic, overflowing of waste from the waste containers and increase of illegal dumpsites in the town area. Such a situation has become a nuisance to daily life of the neighbouring residents.
Formulation and implementation of overall waste collection and transportation plan is required for future upgrading of the service. In particular, appropriate types of waste collection vehicle should be carefully considered to be fitted for the site conditions, such as road width, accessibility, space for container placement and so on.
4. Inadequate management of waste containers
Discharged waste by the residents overflows around the container. In addition, some residents misbehave the waste disposing to the container. As a result, the waste is scattered around the containers and it causes odour and deteriorates the environment in the city.
Implementation of the education program is required to raise awareness of the waste generators to discharge waste properly into the waste container. In addition, the collection work should be regulated to clean-up around the container by the collection worker and/or by street sweeper.
5. Low efficiency by using a tractor trolley
Most of the tractor trolleys are old; consequently, fuel consumption is high and travel performance is low. The number of workers is insufficient for the waste loading work onto the tractor trolleys. Due to these causes, the low waste collection efficiency of tractor trolley has resulted in the difficulty to execute regular waste collection service in the designated service area.
In accordance with procurement of new vehicles, the use of tractor trolleys should be declined and shifted to arm-roll trucks and mini-dumpers. The retired trucks should be used for the other collection area that will be expanded outside of 64 UCs.
6. Small haulage amount and cause of nuisance by mini-dumper
The work efficiency is low because the mini-dumpers could transport only small amounts of waste to the far landfill site and return again for the next collection service. In addition, wastes collected by mini-dumpers are unloaded at an open space beside the waste containers to be transported by arm-roll trucks, causing nuisance to the neighbouring residents.
GWMC is planning to deploy the mini-dumpers only for waste collection in surrounding areas with about 5-7 trips per shift and transfer the collected waste to large loading capacity trucks for transportation to the landfill site. For this purpose, two waste transfer stations for mini-dumpers that are located in the north-east side and the south-west side of the city have been planned, and one of them started the operation.
7. High risk of disease infection for sanitary workers
Sanitary workers are not provided any protective gear, such as masks, safety shoes and gloves in their operation. The sanitary workers pick up wastes and put them into their handcarts by hands. There is high risk of handling hazardous materials and infectious wastes directly.
It is essentially required to provide protective gear for all sanitary workers. It is also important to train them to handle the waste properly and to take a medical check on a regular basis.

Project for Integrated Solid Waste Management
Master Plan in Gujranwala
Draft Final Report
Volume 1 Main Report
CTI Engineering International Co., Ltd. NJS Consultants Co., Ltd.
EX Research Institute Ltd.
33
Problem Description of Problem Issues for Solving the Problems
8. A large number of illegal dumpsites
Many dumpsites exist illegally in the town area causing environmental degradation in the surrounding area. These illegal sites are located in areas adjacent to residential houses and have become a nuisance to the residents. In view of the situation, GWMC has started the programme of One Time Cleaning Activity since June 2014.
The One Time Cleaning Activity by GWMC and/or outsourcing should be accelerated to remove the cause of nuisance to residents, including execution of measures that shall not allow the sites to be used again as waste dumping site.
Preparation of urgent project programmes for the clean-up operation and execution of well-planned work are indispensable.
2.4 Final Disposal
2.4.1 Overview of Final Disposal in Gujranwala
The old disposal site of approximately 4 ha utilised the lowlands along the Grand Trunk Road (G.T.
Road) located in Chianwali at about 14 km south of Gujranwala City. Landfill operation, open dumping,
started at the end of 2006 and finished at the end of February 2014. Landfill operation is no longer
carried out but the site has not been closed properly to ensure safety and environmental degradation in
the surrounding area.
The existing disposal site utilises the abandoned borrow pit in Gondlanwala at about 8 km
north-northwest from the city centre of Gujranwala. The site is used as a temporary landfill site until the
new sanitary landfill facilities become operational. Landfill operation started in March 2014 and this
temporary disposal site currently receives domestic waste collected from the 64 urban union councils in
Gujranwala City. The landfill operation carried out is the open dumping method and the landfill site has
started to become a cause of environmental pollution in the surrounding area.
Engineered landfill facilities or sanitary landfill facilities have not yet been developed for the City of
Gujranwala until now. In view of the situation of solid waste management (SWM) being practiced
without an appropriate landfill site in Gujranwala, the Urban Unit (UU) and CDGG launched the project
for development of new final disposal facilities in 2012. The UU, SWM team visited Gujranwala in
September 2012 and carried out a site selection survey intensively to identify the suitable site for
development of sanitary landfill facilities and prepared the report. Then the report was reviewed and
revised in March 2014 by UU. According to the report entitled “Landfill Site Identification &
Evaluation Report”, the site in Bhakhraywali is proposed as the candidate site for development of a new
sanitary site for Gujranwala. The site selection procedures and the progress status of topographical and
geotechnical surveys will be delineated later in Subsections 2.4.8.
Figure 2.4.1 shows the location of the closed disposal site in Chianwali, the existing disposal site in
Gondlanwala and the candidate landfill site in Bhakhraywali. Photo 2.4.1 shows the current status of
these three disposal sites.

Draft Final Report
Volume 1 Main Report
Project for Integrated Solid Waste Management
Master Plan in Gujranwala
34
CTI Engineering International Co., Ltd. NJS Consultants Co., Ltd.
EX Research Institute Ltd.
Figure 2.4.1 Location Map of Final Disposal Sites
Photo 2.4.1 Current Status of Final Disposal Sites
Chianwali (Closed Site)
Gondlanwala (Existing Site)
Bhakhraywali (Candidate Site)
City Boundary
Peri-urban Boundary
Gujranwala City Centre
Gondlanwala (Existing Disposal Site)
Chianwali (Closed Disposal Site)
Bhakhraywali (Candidate New Disposal Site)

Project for Integrated Solid Waste Management
Master Plan in Gujranwala
Draft Final Report
Volume 1 Main Report
CTI Engineering International Co., Ltd. NJS Consultants Co., Ltd.
EX Research Institute Ltd.
35
2.4.2 Final Disposal Operation
(1) Operation Status of Existing Final Disposal Site in Gondlanwala
The abandoned borrow pit in Gondlanwala site having the approximate area of 4.7 ha and the depth
of 8-9 m is currently used as the temporary landfill site. Landfill operation started in March 2014.
The site is expected to be used for 2 to 3 years for the estimated volume of about 400,000 m3.
Landfill work, open dumping, is carried out actively and the available landfill area is decreasing
day by day. The loaded waste amount of each vehicle is weighed by the weighbridge installed by
the Project in connection with the survey work of this project. As of September 2014, more or less
400 tons per day in average including the waste amount from the clean-up work of the illegal
dumpsites in the town area is carried into the landfill site. In the records of the weighbridge, the
maximum incoming waste amount up to now has become 665 tons per day on 30 September 2014.
Then, the waste is unloaded onto the top of the landfill area and spread by two units of tractor
shovels.
The landfill work is carried out by the open dumping method, so that environmental degradation
especially groundwater contamination, breeding of pests such as flies, etc., have become significant
problems. GWMC is taking measures for earth covering, draining contaminated water at the
bottom of the landfill area and spraying insecticides for controlling waste dumping operation.
Waste pickers, most of them look like under 18 years old male, collect recyclable materials at the
waste unloading area and in the slope where wastes slide down to the bottom of the landfill. The
number of waste pickers was about 20 people, initially, but about 35-40 people divided into three
groups in worked daily in September 2014. Health hazards and risk of recovery operation is a
matter of concern. The waste picker survey including the waste pickers working in town was
conducted in December 2014 and the survey method and results are described in next Section 2.5.
Photo 2.4.2 shows the current operation status described above.
Photo 2.4.2 Operation Status of Gondlanwala Final Disposal Site in September 2014
Disposal Site, Sept. 2014 Weighbridge, Sept. 2014 Water Pollution, Sept., 2014
Disposal Site, March 2014 Unloading Waste, March 2014 Waste Pickers & Recyclables, Sept. 2014

Draft Final Report
Volume 1 Main Report
Project for Integrated Solid Waste Management
Master Plan in Gujranwala
36
CTI Engineering International Co., Ltd. NJS Consultants Co., Ltd.
EX Research Institute Ltd.
Surface water ponding at the bottom of the
landfill is contaminated, causing groundwater
contamination. There are three farmer houses
within the distance of 500 m from the
Gondlanwala disposal site as shown in Figure
2.4.2. The total number of people residing in
the three houses is about 50. They live on
breeding of about 150 livestock and
agriculture in the area.
Every house uses groundwater for daily living,
agriculture and livestock. Every house uses
groundwater from shallow and deep aquifers
by hand pump and tube well. Seasonal water
quality tests have been conducted in this
project and the first water sampling was done
in September 2014, taking groundwater and
surface water samples from 10 sampling
points including the wells of these three
houses. Reference shall be made to the results
of water quality tests delineated in Subsection 2.4.5.
(2) Situation of Closed Chianwali Final Disposal Site
The Chianwali disposal site was used from the end of December 2006 to February 2014. The waste
dumped during the period of approximately 7 years was left without any soil cover. The site is
located just along the G.T. Road. Therefore, in addition to the risk of groundwater contamination,
visual pollution to landscape and waste scattered by wind are causing the negative environmental
impacts.
The record of the number of incoming vehicles to Chianwali available from CDGG was only for 4
months as shown in Table 2.4.1. Only arm-roll vehicles hauled waste to the disposal site and the
tractor trolleys disposed waste at the open spaces in the town area due to long hauling distance
problem, more than 14 km from the city centre, for this type of vehicle.
Table 2.4.1 Record of Incoming Vehicles (Arm-Roll Truck) to Chianwali Disposal Site
Source: Record of SWM Section, CDGG
There were no vehicle lists available for the period of the above table. However, the vehicle list
from the fiscal year 2006/2007 is available and the data shown in Table 2.4.2 was used for the
estimation of waste disposal amount from the beginning of landfill operation in December 2006 to
the end of landfill operation in February 2014. The average loading weight of arm-roll was
obtained from the actual weighing of waste record at the private weighbridge in May 2014.
Accordingly, the estimation of waste disposal amount was carried out by the factors of average
loading weight of arm-roll truck, number of functional vehicles, and the annual operation ratio of
the vehicles in each year.
Vehicle Type Arm-roll Truck
Month/Year November 2013 December 2013 January 2014 February 2014
Total No. of Trips per Month 2,600 2,137 2,062 2,001
Figure 2.4.2 Location of Wells in and around
the Gondlanwala Disposal Site

Project for Integrated Solid Waste Management
Master Plan in Gujranwala
Draft Final Report
Volume 1 Main Report
CTI Engineering International Co., Ltd. NJS Consultants Co., Ltd.
EX Research Institute Ltd.
37
Table 2.4.2 Number of Functional Vehicles in Fiscal Years 2006-2007 to 2012-2013
Fiscal Year 2006-2007 2007-2008 2008-2009 2009-2011 2011-2012 2012-2013
No. of Functional Arm-roll Truck 7 11 22 28 28 28
No. of Functional Tractor Trolley 43 43 43 37 37 37
Total No. of Functional Vehicles 50 54 65 65 65 65
Source: Processed data of Vehicle List of SWM Section, CDGG
Due to unavailability of operation days or the operation rate of vehicles in each year, the estimation
was made on the assumption based on the interview to the GWMC operation section that the
operation rate of vehicles is 70%.
The result of calculation of annual waste disposal amount at Chianwali is given in Table 2.4.3. The
cumulative waste amount disposed at Chianwali had reached 341 thousand tons during the landfill
operation of 7 years and 3 months. The accumulated waste volume is estimated at more or less 310
thousand cubic metres assuming that the bulk density of filled waste layer is 1.1 ton/m3 obtained
from the bulk density survey conducted in Chianwali and Gondlanwala disposal sites (see
Subsection 2.4.6 in detail).
Table 2.4.3 Annual and Cumulative Waste Disposal Amounts at Chianwali
(3) Waste Disposal Amount of Existing Gondlanwala Final Disposal Site
Landfill operation at Gondlanwala started in March 2014. Since then, the number of incoming
vehicles had been recorded manually by the inspector until 8 May 2014. Recording of loading
weight started from 9 May 2014 at a private weighbridge located along the way to Gondlanwala.
A weighbridge was later installed under the scheme of the Project at an area adjacent to the
Gondlanwala landfill site. Weighing of incoming waste amount was then made continuously from
2 September 2014 at the weighbridge of
Gondlanwala disposal site and digital
recording is now available. Since 1
October 2014, the monthly weightbridge
data has been processed and analysed
through the Incoming Waste Amount
Survey under the Project activities. The
incoming waste amount at Gondlanwala
was estimated based on the data recorded
from the sources mentioned above.
Monthly incoming waste amounts to the
disposal site and the cumulative landfill
waste amounts are shown in Table 2.4.4.
The monthly incoming waste amounts to
the disposal site from March to June 2014
show less than 10,000 tons per month.
The incoming waste amount had increased
from July at more than 20% due to the
commencement of two-shift operation and
Year 2006 2007 2008 2009 2010 2011 2012 2013 2014
Waste Disposal Amount (1,000 ton/year) 1.3 15.6 22.2 49.0 55.6 62.3 62.3 63.1 9.6
Cumulative Amount (1,000 ton) 1.3 16.9 39.1 88.1 143.7 206.0 268.3 331.4 341.0
Table 2.4.4 Monthly Annual and Cumulative Waste
Disposal Amount at Gondlanwala
Month
Waste Disposal Amount at the Site
Monthly Amount
(ton/month)
Cumulative Amount
(ton)
March 2014 9,980 9,980
April 9,894 19,874
May 9,628 29,502
June 9,588 39,090
July 12,693 51,783
August 11,767 63,550
September 13,159 76,708
October 16,734 93,442
November 12,688 106,130
December 12,976 119,106
January 2015 15,239 134,345
February 14,799 149,144

Draft Final Report
Volume 1 Main Report
Project for Integrated Solid Waste Management
Master Plan in Gujranwala
38
CTI Engineering International Co., Ltd. NJS Consultants Co., Ltd.
EX Research Institute Ltd.
clean-up of discarded wastes in the town area. In September, the incoming waste amount was more
than 13,000 tons per month. In October 2014, the incoming waste amount transported to the
disposal site jumped up to more than 16,000 tons/month due to additional Eid waste for about one
week. Landfill waste amount has been accumulating day by day at the Gondlanwala disposal site
and the filled waste in the past 12 months from March 2014 to February 2015 is estimated at
149,000 tons. Considering the result of the bulk density survey described in Subsection 2.4.6 and
the estimated lifetime of Gondlanwala disposal site, the bulk density is assumed at 0.9 ton/m3.
Consequently, with the assumed bulk density, the present cumulative landfill volume is estimated
approximately at 166,000 m3. The landfill area is secured at 4.7 ha at present. GWMC is planning
to secure the adjacent land based on the offer of the landowner. After securing the adjacent land, the
total landfill area will become 6.4 ha and available landfill volume will be 510,000 m3. The balance
volume of 344,000 m3 will be filled up in 22 months with the monthly incoming waste of 14,000
tons or 15,600 m3 and the lifetime of the landfill site will end in December 2016.
(4) Fluctuation of Incoming Waste Amount at Gondlanwala Final Disposal Site
Daily incoming waste amounts in September 2014 are shown in Table 2.4.5. The daily incoming
waste fluctuates in the range of approximately 390-670 ton/day. On average, the incoming waste
amounts on Mondays show more than the incoming waste of other days of the week since GWMC
does not carry out waste collection on Sundays except for the requirement of special collection.
The average incoming waste amount on Mondays reaches approximately 121% of the working-day
average waste amount of the month followed by Wednesdays at 113%.
Table 2.4.5 Daily Incoming Waste Amount at Gondlanwala Disposal Site (September 2014)
Day of the
Week
1st Week
(1-7)
(t/d)
2nd Week
(8-14)
(t/d)
3rd Week
(15-21)
(t/d)
4th Week
(22-28)
(t/d)
5th Week (29-30)
(t/d)
Total
(t/week)
Average
Incoming
Waste
Amount by
Day of the
Week (t/d)
Ratio to the
Working-day
Average
(%)
Monday 581 606 589 574 588 2,938 588 120.6
Tuesday 514 416 562 392 665 2,548 510 104.6
Wednesday 541 583 470 601 2,194 549 112.6
Thursday 248 469 496 484 1,697 424 87.0
Friday 303 420 497 556 1,776 444 91.1
Saturday 335 537 451 446 1,769 442 90.7
Sunday 236 236 236 48.5
Total 2,522 3,032 3,301 3,052 1,252 13,159 -
Working-day Average Incoming Waste Amount by Day of the Week (t/d), 27days 487
Daily Average Incoming Waste Amount (t/d), 30days 439
(5) Incoming Number of Vehicles per Day to the Gondlanwala Disposal Site
Collected waste is carried to the disposal site by tractor trolley and arm-roll trucks equipped with
5m3 or 10m
3 containers. Figure 2.4.3 shows the daily number of trips by arm-roll truck and tractor
trolley recorded in February 2015. In total, the incoming number of vehicles to the disposal site
reached approximately 5,100 trips. The incoming number of vehicles varied from the lowest
recorded of 156 trips in 20 February to the highest recorded of 244 trips in 27 February. However,
on average, the total number of 170 to 180 trips per day was performed by arm-roll trucks and the
tractor trolleys. Among the total number of trips, about 75% of trips were performed by arm-roll
trucks and the rest or 25% of trips was performed by tractor trolleys. As a matter of course, as well
as the fluctuation of incoming waste amount described above, the number of trips of incoming
vehicles increase on Mondays and Wednesdays. GWMC had started to dispatch 1m3 mini-dumpers

Project for Integrated Solid Waste Management
Master Plan in Gujranwala
Draft Final Report
Volume 1 Main Report
CTI Engineering International Co., Ltd. NJS Consultants Co., Ltd.
EX Research Institute Ltd.
39
since December 2014 and the wastes collected by mini-dumpers were transported to the disposal
site by arm roll trucks.
Figure 2.4.3 Daily Number of Incoming Vehicles by Arm-Roll Truck and Tractor Trolley to Gondlanwala
Disposal Site (February 2015)
(6) Existing Landfill Machine
Two units of tractors with front end loading
bucket are operated at the landfill site to push
and spread waste unloaded from the incoming
vehicles. The tractors, Model New Holland
Diesel Agriculture Tractor, 105 HP, were
procured in 2008. Due to aging of the vehicles
after 7 years of operation, frequent maintenance
and repair is required. Each vehicle consumes
30 litres of fuel daily and the annual operation
cost is estimated at about Rs. 2 million. Photo
2.4.3 shows an existing landfill tractor.
The incoming vehicles unload waste on the top
of the landfill layer in the public roadside, and then the waste is pushed away by two units of tractor
shovel into the bottom of the landfill area. Earth covering on to the waste layer is carried out only
intermittently. Environmental impacts such as odour problem and breeding of flies occur under the
inappropriate practice of landfill work. In addition, leachate from the landfill layer ponding in the
bottom of the landfill area during the monsoon season might be causing groundwater
contamination.
(7) Landfill Operation Staff
Landfill operation is carried out by staff under the Senior/Manager Landfill. The organizational
structure of landfill operation is as shown in Figure 2.4.4. The post of Operation General Manager
is vacant as of end of July 2015. Besides the post shown in Figure, the sanitary workers and
security guards are dispatched to the disposal site and the current total number is 17 people.
Photo 2.4.3 Landfill Tractor with Front Loading
Bucket

Draft Final Report
Volume 1 Main Report
Project for Integrated Solid Waste Management
Master Plan in Gujranwala
40
CTI Engineering International Co., Ltd. NJS Consultants Co., Ltd.
EX Research Institute Ltd.
Figure 2.4.4 Organizational Structure for Landfill Operation
2.4.3 Topographic Survey of Closed and Existing Final Disposal Sites
The contract for the topographic survey was signed on 12 September 2014. The contractor has finished
the field work of Closed landfill site at Chianwali (Survey Area: approximately 8 ha) and Existing
landfill site at Gondlanwala (Survey Area: approximately 7 ha), and the mapping work. The final
products of topographic map, profiles and cross sectional drawings were submitted to the JICA Project
Team in December 2014. Those output drawings were used for preparation of the preliminary design
including the layout plan and cross section plan for the improvement works for Gondlanwala and safe
closure work for Chianwali.
2.4.4 Geotechnical Survey of Closed and Existing Final Disposal Sites
The contract for the geotechnical survey was signed on 6 September 2014. The contractor started the
field work on 12 October and completed the boring test by the end of October 2014. The results of
boring test and the laboratory test were submitted to the JICA Project Team in December 2014, and
summarised below (See detail in Volume 2, Supporting Report, Section C: Final Disposal, Section
2.4.).
Gondlanwala: Five boreholes drilled at the site reveal that the main soil type at the site comprises of
silty to fine sand, which is overlain by a thin layer of silty clay and clayey silt. Water table was
encountered in the boreholes at about 9 m depth from the ground surface. The results of the field
permeability tests (k* = 1.4×10⁻³
to 2.7×10⁻³
cm/sec) indicates a little high permeability for the
design to prevent leachate infiltration into underground. *k: coefficient of permeability
Chianwali: Six boreholes were drilled at the site exposed the main soil type comprise of old
cohesive fill and silty clay, which is underlain by silty to fine sand. The groundwater was
encountered in all the boreholes at an average depth of 6.4 m from ground surface. The results of the
field permeability tests (k* = 4.4×10⁻⁴
to 8.5×10⁻³
cm/sec) indicates a little high permeability for the
design to prevent leachate infiltration into underground.
2.4.5 Water Quality Survey of Closed and Existing Final Disposal Sites
The contract for the water quality survey was signed on 6 September 2014. The water quality survey
was carried out in three (3) seasons. The contractor conducted water sampling at the end of September
2014 for the monsoon season, at the end of January 2015 for the winter season and at the end of May
2015 for the summer season. As many as 14 parametres were checked in the first water quality test, such
as Temperature, Turbidity, Electric Conductivity, pH, Nitrogen, Chemical Oxygen Demand (COD)
[Note: “COD” in this report is measured by using potassium dichromate unless otherwise indicated.],
Biochemical Oxygen Demand (BOD), Suspended Solid, Cadmium, Lead, Chromium, Selenium,
Arsenic, and Total Mercury. Ten samples were taken in each site: 5 surface water samples and 5
GWMC Managing Director
Human Resource & Administration Gen. Mgr.
Managing Director
Procurement and Contract Gen. Mgr.
Operation General Manager (0)
Financial General Manager
Senior Manager Operation
Senior Manager Workshop
Senior/Manager Landfill (1)
Assistant Manager Landfill (1)
- Record Keeper (3) - Machine Driver (3)

Project for Integrated Solid Waste Management
Master Plan in Gujranwala
Draft Final Report
Volume 1 Main Report
CTI Engineering International Co., Ltd. NJS Consultants Co., Ltd.
EX Research Institute Ltd.
41
groundwater samples in Chianwali, and 3 surface water samples and 7 groundwater samples in
Gondlanwala. Locations of sampling are shown in Volume 2, Supporting Report, Section C: Final
Disposal, Figure C.2.11 to Figure C.2.14, and samples were analysed in SGS Pakistan Private Limited,
a private laboratory in Lahore. Pakistan National Environmental Quality Standard (NEQS) for
municipal and liquid industrial and the Pakistan National Standards for Drinking Water Quality were
used as to surface water and groundwater respectively.
The results of the survey are described in Volume 2, Supporting Report, Section C: Final Disposal,
Subsection 2.5.4, and major findings of the three seasons’ test are summarised as follows:
Gondlanwala: Surface water sample of GGW-1, leachate from the dump site, has reduced the water
contamination level from 607mg/lit to 119mg/lit in terms of COD. Meanwhile, pH value has
increased from 8.6 to 9.2 showing the transition of waste decomposition. Turbidity of three season
samples of the shallow wells, GGW-2, GGW-4 and GGW-6, exceeds the drinking water standards
of 5 NTU. Electric Conductivity of most of the groundwater samples are relatively high exceeding
1,000µS/cm. Animal husbandry nearby the wells would be a cause of groundwater contamination.
Significant water pollution due to the influence of the existing disposal site could not be confirmed
from the three season water quality test results.
Chianwali: Surface water sampling point of the drainage ditch, CSW-1, CSW-2 and CSW-3, are
contaminated by sewage from the surrounding area resulting high values of COD and BOD5.
Groundwater contamination is observed at the sampling point of CGW-2, which exceeds the
standard values by Turbidity and Arsenic. In addition, the value of Electric Conductivity is also high
at more than 1,800µS/cm in three seasons. However, significant water pollution due to the influence
of the former disposal site could not be confirmed from the three season water quality test results.
2.4.6 Landfill Waste Bulk Density Survey
The survey was carried out on 10 February 2015. The purpose of the survey is to find out the bulk
density of landfill waste which will be used for the Bhakhraywali landfill planning. One excavator and
three tractor trolleys were dispatched for the survey. In each site, landfill waste from three sampling
pits, approximately 2m (Width) × 2m (Length) × 2m (Depth), were excavated and loaded onto the
tractor trolleys. The net weights of the loaded wastes or the excavated weight were measured at the
weighbridge installed by the Project. On the other hand, each excavated pit was measured as to width,
length and depth to calculate the excavated volume.
The results of the survey revealed that the Chianwali waste layer is comparatively consolidated as
compared to that of the Gondlanwala waste layer. Chianwali started operation in the end of December
2006 and closed in February 2014 while the site in Gondlanwala became operational in March 2014.
This difference of elapsed time in each site brought the difference of bulk density of the landfill waste
layer because of consolidation. In other words, the average bulk density of each site is depicted as
follows:
Chianwali (1,121 kg/m3) > Gondlanwala (668 kg/m
3)
From the results of this survey, it is recommendable to adopt the bulk density of 1.0 t/m3 for the design of
sanitary landfill facilities in Bhakhraywali while the bulk density of 0.9 t/m3 is appropriate for the
shorter time landfill period of about 3 years at Gondlanwala disposal site. The results of the survey are
described in detail in Volume 2, Supporting Report, Section C: Final Disposal, Subsection 2.6.3.
2.4.7 Incoming Waste Composition Survey
The waste composition data plays a crucial role in planning and designing of solid waste system. The
objectives of the incoming waste composition survey are to determine the composition of waste
collected from Gujranwala waste collection area and hauled to Gondlanwala for disposal, and to
estimate the potential amount of resource or recyclable materials mixed in the incoming waste at the
existing disposal site.

Draft Final Report
Volume 1 Main Report
Project for Integrated Solid Waste Management
Master Plan in Gujranwala
42
CTI Engineering International Co., Ltd. NJS Consultants Co., Ltd.
EX Research Institute Ltd.
The incoming waste composition survey was conducted from 9-12 December 2014 (4 days). Drilling
was conducted by the survey team at the disposal site on 8 December 2014. The survey was carried out
only for once during the period of the project. The whole city area (64 union councils) was considered
for the survey since the SWM services are being provided currently by GWMC in this area. A total of 10
waste samples were taken from each vehicle coming from the subject areas.
The weighted average percent composition of Gujranwala waste being disposed is shown in
Figure 2.4.5. At Gondlanwala, the kitchen waste account for 28% of total waste, thereby representing
the largest fraction and followed by
sieve remains with 16%, miscellaneous
with 14% and non-recyclable paper
with 9%. Only very small amounts of
recyclables (paper 1.24%, plastic
1.41% and glass 0.49%) were found in
waste at the Gondlanwala disposal site.
The composition of domestic
hazardous waste in the waste reaching
Gondlanwala is almost negligible (0%).
It shall be noted that most of the
fraction of sieve remaining and
miscellaneous is organic waste mixed
with kitchen waste and animal
droppings (donkey cart and horse cart).
The results of the survey are described in Volume 2, Supporting Report, Section C: Final Disposal,
Subsection 2.7.3, and the following conclusions can be drawn from the analysis of the incoming waste
composition survey conducted at the Gondlanwala disposal site:
The incoming waste for disposal at Gondlanwala has 32% of organic waste represented by kitchen
waste, grass and wood. The organic waste ratio becomes more than 50% in case sieve remaining and
miscellaneous wastes are included. These wastes have a high potential of waste reduction or waste
division for final disposal by means of biodegradable treatment if GWMC manages to collect
organic waste separately.
The combustible waste ratio represented by plastics, paper, etc., account for almost 34%. As well as
organic waste, these combustible wastes have a high potential for waste reduction and heat recovery
by treatment as a resource for renewable energy projects.
The amount of dry recyclables or resource materials hauled to Gondlanwala is considerably low at
only 4%. Most of the recyclables have already been sorted at sources by dwellers and at the waste
discharge points at waste containers by the waste pickers and sold in the recycling market.
Consequently, the option for construction of centralised material recovery facilities of mixed waste
is negative.
2.4.8 Current Status of Planning of Final Disposal Site by Pakistani Side
This subsection describes the activities related with the selection of candidate final disposal site by
referring to the site selection report prepared by UU.
(1) Implementation Status of Selection of Final Disposal Site
Background of Landfill Site Selection (a)
Gujranwala City has not developed engineered landfill facilities or sanitary landfill facilities
until now. The city and districts are working for the collection and transportation of solid
waste but unfortunately there is no proper way of final waste disposal. Waste is being disposed
of indiscriminately in open plots and pits in and outside of the urban areas.
Figure 2.4.5 Average Waste Composition of Incoming
Waste at Gondlanwala
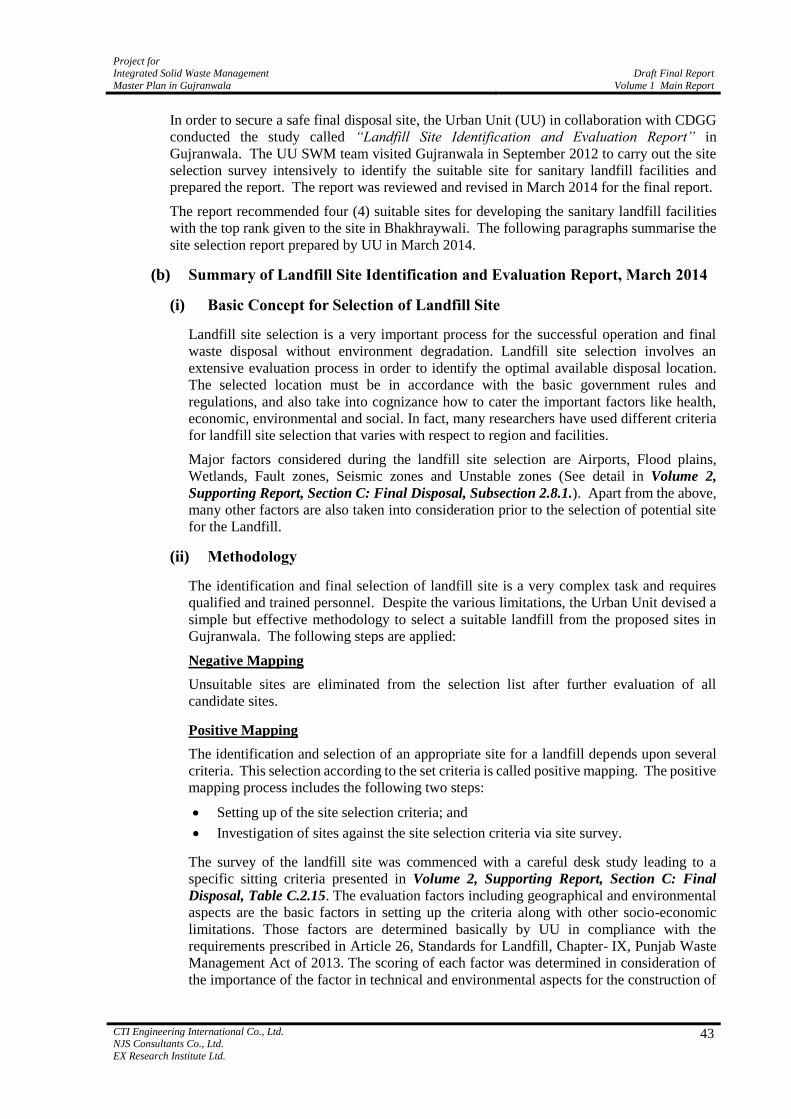
Project for Integrated Solid Waste Management
Master Plan in Gujranwala
Draft Final Report
Volume 1 Main Report
CTI Engineering International Co., Ltd. NJS Consultants Co., Ltd.
EX Research Institute Ltd.
43
In order to secure a safe final disposal site, the Urban Unit (UU) in collaboration with CDGG
conducted the study called “Landfill Site Identification and Evaluation Report” in
Gujranwala. The UU SWM team visited Gujranwala in September 2012 to carry out the site
selection survey intensively to identify the suitable site for sanitary landfill facilities and
prepared the report. The report was reviewed and revised in March 2014 for the final report.
The report recommended four (4) suitable sites for developing the sanitary landfill facilities
with the top rank given to the site in Bhakhraywali. The following paragraphs summarise the
site selection report prepared by UU in March 2014.
Summary of Landfill Site Identification and Evaluation Report, March 2014 (b)
(i) Basic Concept for Selection of Landfill Site
Landfill site selection is a very important process for the successful operation and final
waste disposal without environment degradation. Landfill site selection involves an
extensive evaluation process in order to identify the optimal available disposal location.
The selected location must be in accordance with the basic government rules and
regulations, and also take into cognizance how to cater the important factors like health,
economic, environmental and social. In fact, many researchers have used different criteria
for landfill site selection that varies with respect to region and facilities.
Major factors considered during the landfill site selection are Airports, Flood plains,
Wetlands, Fault zones, Seismic zones and Unstable zones (See detail in Volume 2,
Supporting Report, Section C: Final Disposal, Subsection 2.8.1.). Apart from the above,
many other factors are also taken into consideration prior to the selection of potential site
for the Landfill.
(ii) Methodology
The identification and final selection of landfill site is a very complex task and requires
qualified and trained personnel. Despite the various limitations, the Urban Unit devised a
simple but effective methodology to select a suitable landfill from the proposed sites in
Gujranwala. The following steps are applied:
Negative Mapping
Unsuitable sites are eliminated from the selection list after further evaluation of all
candidate sites.
Positive Mapping
The identification and selection of an appropriate site for a landfill depends upon several
criteria. This selection according to the set criteria is called positive mapping. The positive
mapping process includes the following two steps:
Setting up of the site selection criteria; and
Investigation of sites against the site selection criteria via site survey.
The survey of the landfill site was commenced with a careful desk study leading to a
specific sitting criteria presented in Volume 2, Supporting Report, Section C: Final
Disposal, Table C.2.15. The evaluation factors including geographical and environmental
aspects are the basic factors in setting up the criteria along with other socio-economic
limitations. Those factors are determined basically by UU in compliance with the
requirements prescribed in Article 26, Standards for Landfill, Chapter- IX, Punjab Waste
Management Act of 2013. The scoring of each factor was determined in consideration of
the importance of the factor in technical and environmental aspects for the construction of

Draft Final Report
Volume 1 Main Report
Project for Integrated Solid Waste Management
Master Plan in Gujranwala
44
CTI Engineering International Co., Ltd. NJS Consultants Co., Ltd.
EX Research Institute Ltd.
disposal facility. Then, the field survey was carried out to verify the condition of these
factors.
(iii) Site Survey
A detailed site selection survey was conducted by the Urban Unit team in Gujranwala
through the site visit of all possible potential sites around the city at all 8 major roads
connecting with Gujranwala bypass. A landfill sitting selection criteria was established
considering the important factors and parametres on which all the sites were scrutinised
and evaluated in subsequent steps. During the survey, the coordinate of each site was
determined using Global Positioning System (GPS) as shown in Volume 2, Supporting
Report, Section C: Final Disposal, Figure C.2.17. Further, using the Geographic
Information System (GIS) tool, sites were identified with measuring the distance from
major road.
(iv) Evaluation of Candidate Site
Firstly, all the identified and potential candidate sites were analysed against the set criteria
for selection. Secondly, each site was evaluated through the scoring system in Volume 2,
Supporting Report, Section C: Final Disposal, Table C.2.15 and the computed results are
as presented in Figure 2.4.6. For example, if a site is available for the construction of a
landfill or has lower groundwater table, it will have more marks as compared to availability
of the site although it is not confirmed by the owner or having a considerably higher
groundwater table leading to the chances of groundwater contamination. This process is
called ranking system through which all the potential sites selected via negative mapping
are ranked according to their own properties. The ranking system suggests that if a
proposed site is used for agricultural purposes it will get lesser marks in the category of
land use, in case of barren or any other suitable land is available. The total marks allocated
to each site decide the final ranking. The details of scoring of each site are presented in
Volume 2, Supporting Report, Section C: Final Disposal, Tables C.2.17 and C.2.18.
Figure 2.4.6 Ranking of Candidate Sites according to the Set Criteria
Source: The Urban Unit, Landfill Site Identification and Evaluation Report, March 2014.

Project for Integrated Solid Waste Management
Master Plan in Gujranwala
Draft Final Report
Volume 1 Main Report
CTI Engineering International Co., Ltd. NJS Consultants Co., Ltd.
EX Research Institute Ltd.
45
(v) Conclusion and Recommendations of the Report
In Gujranwala, landfill site selection is very difficult because areas surrounding the city are
densely populated and comprise very fertile agricultural land. That is why no barren land is
available in the adjoining areas. Therefore, in the existing scenario, the four (4) top-ranked
sites out of the 19 were selected after visiting, studying, evaluating and identifying
according to the criteria set by the team of Urban Sector Planning & Management Services
Unit (Pvt.) Ltd. in collaboration with the Urban Unit. The result of site selection study is
deemed appropriate in terms of evaluation indicators and the scoring criteria. Basic
information of the following four top-ranked sites is outlined as shown in Table 2.4.6.
(i) Bhakhraywali (ii) Nandipur (iii) Chan-Nia Pind (iv) Daila Chatta
Table 2.4.6 Outline of Top-Ranked Sites for Final Disposal of Waste in Gujranwala
Site Name Bhakhraywali Nandippur Chan-Nia Pind Daila Chatta
Land Ownership Private Private Private Private
Land Status Borrow Pit and
Agricultural Land Agricultural Land Agricultural Land Agricultural Land
Land Area 25.3 ha 14.2 ha 10.1 ha 14.1 ha
Location (GPS Coordinates)
32011.150 N 74006.187 E
32016.098 N 74015.606 E
32000.682 N 74016.674 E
32014.902 N 73057.552 E
Direction from City Centre
North - West North - East West - South North - West
Main road passing by the site
Alipur Chatha Road Sialkot Road Main Emanabad
Road Alipur Chattha Road
Distance from City Centre
11 km 18 km 14 km 22 km
All of these sites are recommended for further study, which shall include Initial
Environmental Examination (IEE) or Environmental Impact Assessment (EIA).
Among the four sites, the site in Bhakhraywali obtained the highest comprehensive
evaluation including environmental, social, economic aspects, etc. Especially, the
condition of access road distance of 2km from the main road and the site area of
approximately 25ha are advantageous against other selected sites.
Followed by the conclusion of the site final report of “Landfill Site Identification and
Evaluation Report” in March 2014, CDGG announced the Bhakhraywali site as the
candidate site of final disposal facilities. Then, CDGG through GWMC, proceeded with
the procurement process. The draft EIA report was submitted to the UU in March 2015 and
the summary of the draft EIA report is presented in Chapter 5.
The EIA report was submitted to Environmental Protection Department (EPD) in May
2015. After filing EIA report to EPD, a letter for confirmation of completeness for purpose
of initiation of review process under Regulation 9 (1) (a) of the IEE/EIA Regulation, 2000
was marked on dated 03 June 2015. According to this letter EPD reserves the right to
require the proponent to submit additional information at any stage during the review
process.
For Public hearing, approved notice form agency has been publicised 30 days before in
English and Urdu national and local newspaper on dated 14 July, 2015 for hearing on 17
August 2015 at 11:00 AM in Rachna Pearl Hotel, G.T. Road Gujranwala, as required under
section 12 (3) of Punjab Environment Protection Act, 1997 (amended 2012) and also under
IEE/EIA Regulation, 2000. The EIA for construction of Bhakhraywali sanitary landfill

Draft Final Report
Volume 1 Main Report
Project for Integrated Solid Waste Management
Master Plan in Gujranwala
46
CTI Engineering International Co., Ltd. NJS Consultants Co., Ltd.
EX Research Institute Ltd.
facilities is in the public consultation in addition to the further review by the agency for
final approval.
Regarding the future landfill site at Bhakhraywali, the site was advertised as the proposed
landfill site but the site has not been procured yet due to delay of payment from the
government subsidies. If the start of construction work is delayed, the new landfill
facilities will not be completed within the lifetime of the temporary disposal site in
Gondlanwala. This will thus require other provisional landfill sites.
As of September 2015, the negotiation for the land procurement has been completed and
agreed between GWMC and eleven landowners. GWMC is scheduling to complete the
contract signing and payment immediately after execution of the project budget.
(2) Implementation Status of Topographic and Geotechnical Survey on a Candidate
Final Disposal Site in Bhakhraywali
The contractor hired by the UU completed the field work for the topographic survey and
geotechnical survey of Bhakhraywali in September 2014. Outputs of these surveys were submitted
to the UU in February 2015.
2.4.9 Relevant Laws, Regulations and Guidelines on Waste Disposal Plan
The Punjab Provincial Government has been preparing the institutional system of solid waste
management through formulation of the policies and enactment of laws, rules and regulations,
guidelines, manuals, etc. The major government policies, laws, guidelines, etc., are listed below:
National Environmental Policy 2005;
National Sanitation Policy 2006;
Guidelines for Processing and using Refuse Derived Fuel (RDF) in Cement Industry, 2012, Pakistan
Environmental Protection Agency, Ministry of Climate Change;
Punjab Waste Management Act 2013 (Draft);
Punjab Municipal Solid Waste Management Guidelines 2007 and 2011;
Solid Waste Management Manual, The Urban Unit; and
Design and Operation of Sanitary Landfill, The Urban Unit.
Among others, the Punjab Municipal Solid Waste Management Guidelines of 2011 (hereinafter referred
to as “Punjab MSWM Guidelines 2011”) describes the requirement for planning, design and operation
of each system composing solid waste management. The major technical requirements of waste
disposal are stipulated in Chapter 8, Disposal (Landfilling). There are several unclear provisions in the
Punjab MSWM Guidelines 2011; however, the provisions for major items are summarised in Volume 2,
Supporting Report, Section C: Final Disposal, Subsection 2.9.1.
2.4.10 Evaluation of Final Disposal Condition
The problems and issues in relation to final disposal activities under the current situation are
summarised in Table 2.4.7. These items will be the basic elements to develop the plans, programmes
and projects to comprise the final disposal plan in the Integrated Solid Waste Master Plan in Gujranwala.
Table 2.4.7 Identification of Problems and Issues in Final Disposal
Problem Description of Problem Issues for Solving the Problems
1. Solid waste management without sanitary landfill facilities
Gujranwala City has never developed sanitary landfill facilities and the disposal sites tentatively used in the past have caused environmental degradation in the surrounding area.
The existing landfill site in Gondlanwala procured for provisional use was not developed to
Urgent development of sanitary landfill facilities should be made so as not to cause secondary pollution from the landfill site.
To solve this problem, a site selection study for new landfill facilities has been carried out by the Urban Unit, and the site in Bhakhraywali was

Project for Integrated Solid Waste Management
Master Plan in Gujranwala
Draft Final Report
Volume 1 Main Report
CTI Engineering International Co., Ltd. NJS Consultants Co., Ltd.
EX Research Institute Ltd.
47
Problem Description of Problem Issues for Solving the Problems function as an engineered sanitary landfill facility and with the continued inappropriate landfill operation by open dumping, the surrounding area is facing the problem of environmental degradation.
selected for the proposed construction site. EIA study and obtaining approval is one of them and the EIA study is now underway.
2. Delay of procurement procedures for proposed landfill site in Bhakhraywali
The site in Bhakhraywali was advertised as the proposed landfill site but the site has not been procured yet due to delay of payment. This will cause the delay of construction work.
If the start of construction work is delayed, the new landfill facilities will not be completed within the lifetime of the temporary disposal site in Gondlanwala. This will thus require other provisional landfill sites.
Procurement of the proposed landfill site through coordination among the relevant agencies of the government should be required for accelerating the procurement process.
Immediate action by CDGG/GWMC is required to appeal the urgency of the project and the necessity to avoid further environmental degradation in order to increase the priority of subsidy payment by the provincial government agency(s).
3. No development work of landfill facilities of the existing landfill site in Gondlanwala
The existing landfill site in Gondlanwala utilises the abandoned borrow pit without facility development. Most of the troubles in landfill operation occur due to inappropriate site condition, which bring about environmental degradation especially groundwater contamination, breeding of pests such as flies, etc. to the surrounding area.
Implementation of rehabilitation work to install and/or construct the facilities should be carried out for mitigating environmental pollution.
4. Inappropriate landfill operation and management at the existing landfill site in Gondlanwala
Landfill management was not properly implemented at the existing landfill site in Gondlanwala. As a result, the existing landfill site might be causing a negative impact on the environment of the surrounding area.
Minimising the environmental impact of the existing landfill site should be implemented through emergency measures and introduction of landfill operation and maintenance manual, procurement of sufficient number of landfill machines, equipment, materials and deployment of staff.
5. Not proper closed/abandoned landfill site in Chianwali
The Chianwali landfill site was not closed properly and thus causing secondary pollution to the surrounding area. The site is located just along the G.T. Road. Therefore, in addition to the risk of groundwater contamination, visual pollution to landscape and waste scattered by wind are causing the negative environmental impacts.
Mitigating the environmental impacts should be required through implementation of safe closure work of the landfill site.
According to Punjab Municipal Waste Management Guidelines 2011, “Closure Plan”, Chapter 8, the post-closure maintenance and monitoring works shall be provided for a minimum period of 25 years.
2.5 Intermediate Treatment and 3R Promotion
2.5.1 Waste Picker Survey
The Waste Picker Survey is one of the field surveys within the framework of the Project. Recycling of
municipal solid waste in Pakistan relies largely on the informal recovery of resource materials by the
waste pickers, junk shops and waste dealers, which render valuable services to society by recovering
unusable wastes for productive resources. Nevertheless, little is known about the activities of waste
pickers. One of the reasons is that waste traders are understandably very cautious in keeping their
business confidential. Another reason is the difficulty in earning the trust of waste pickers and waste
dealers.
There is an air of secrecy around waste pickers. Quantitative data on solid waste management in
Gujranwala City has been scarce and the recycling rates are unreliable. The waste picker survey was
focused on gathering information from the waste pickers in Gujranwala City and the existing disposal
site with regard to their recycling activities. The survey was carried out in December 2014. The total
number of samples is 40: 20 for Gondlanwala Disposal Site, 5 for low income area, 10 for middle
income area and 5 for high income area in Gujranwala City.
The survey data was evaluated as to the recovery amount and selling price of recyclables collected by
the sample groups of waste pickers surveyed in Gujranwala City and at the Gondlanwala disposal site.
The survey showed that the majority of households discard hazardous wastes together with other wastes.
Those hazardous wastes are corrosive, toxic, ignitable or reactive and may cause injury or poisoning,

Draft Final Report
Volume 1 Main Report
Project for Integrated Solid Waste Management
Master Plan in Gujranwala
48
CTI Engineering International Co., Ltd. NJS Consultants Co., Ltd.
EX Research Institute Ltd.
particularly, to children and people who sort the waste. The waste pickers never wear protective gears
against injury or sickness.
In Gujranwala town areas, the total recovery amount is estimated at 149 kg/day/waste picker. More
cardboard, paper (others), plastics (PET and other), metals (steel and others) and hair are recovered in
the town area as compared to the recyclables recovered at the Gondlanwala disposal site. Waste pickers
in the town area do not segregate rubber and broken glasses, but they segregate or recover food waste.
On the other hand, the total recovery amount is estimated at 141 kg/day/waste picker in Gondlanwala
disposal site. Recovery amount of glass bottles, shoes and bones at the Gondlanwala disposal site is
more as compared to that in the town area while rubber and broken glasses are recovered only at the
disposal site. None of the disposal site waste pickers is involved in food waste recovery.
The results of this survey reveal that the recovery of resource materials in waste is carried out actively
with the involvement of waste pickers, junk shops and dealer. If the resource materials recovered
directly from the large waste generators to the dealers or to the factories is added, the recovery amount in
the current recycling market in Gujranwala is estimated at around 70 ton/day (approximately 800
pickers × 82 kg/day waste in city and 60 pickers × 55 kg/day waste at the dump site). The amount
recovered by the waste pickers in addition to the material recycling is contributing to the waste diversion
or reduction of landfill amount. The detail of the survey results and analysis is presented in Volume 2,
Supporting Report, Section D: Intermediate Treatment and 3R Promotion, Subsections 2.1.3 and
2.1.4.
2.5.2 Overview of Intermediate Treatment and 3R Promotion in Gujranwala
Activities related to the intermediate treatment and 3R in Gujranwala have been surveyed to collect
related information through interview with concerned persons and exploratory investigations.
In Gujranwala, there is no formal intermediate system or 3R (Reduce, Reuse, Recycle) system. Informal
activities take place at various steps from the source to the final disposal site through waste-related
activities (See Figure 2.5.1). Recycling (resource recovery) has been widely done mostly through the
residents, sanitary workers and waste pickers. Segregation at source and resource recovery by waste
pickers has been discussed in the preceding Subsection 2.5.1, and private recycle shops and dealers are
described in this Subsection 2.5.2. Under such circumstances, it is found that there are no laws and
regulations related to 3R activities in Punjab, to support GWMC’s 3R activities and promotion.
(1) Segregation at Household
The segregation of recyclables such as plastics, newspaper, cardboard, food waste, cans and PET
bottles is done mainly by the maids and children who sell them to street hawkers, private recycle
shops or dealers for their supplementary income or snacks. Some private recycle shops hire workers
to collect recyclables in residential areas by moving from one street to another with hand pulled
carts, bicycles and motorcycles.
(2) Segregation at Commercial Area
Owners or employees of commercial shops segregate recyclables such as cardboard, paper, plastic
and so on, and sell them to private recycle shops or dealers. In some areas, the private recycle shops
go to these commercial shops to buy the recyclables.
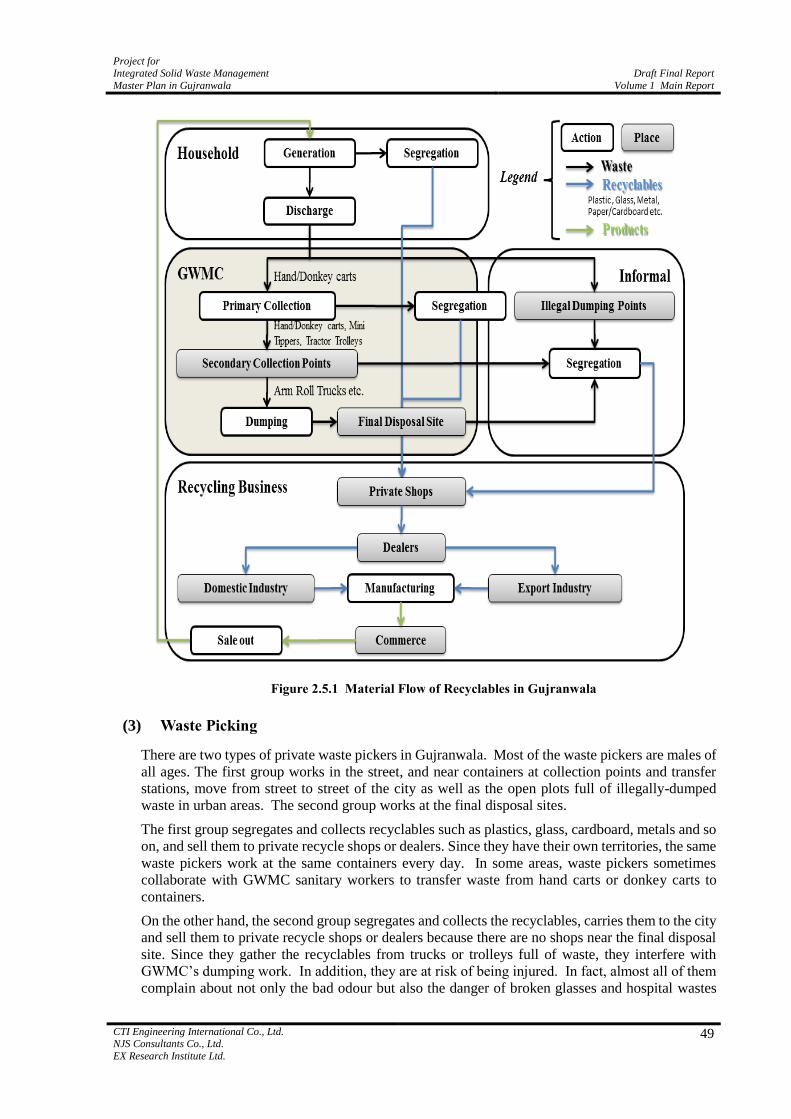
Project for Integrated Solid Waste Management
Master Plan in Gujranwala
Draft Final Report
Volume 1 Main Report
CTI Engineering International Co., Ltd. NJS Consultants Co., Ltd.
EX Research Institute Ltd.
49
Figure 2.5.1 Material Flow of Recyclables in Gujranwala
(3) Waste Picking
There are two types of private waste pickers in Gujranwala. Most of the waste pickers are males of
all ages. The first group works in the street, and near containers at collection points and transfer
stations, move from street to street of the city as well as the open plots full of illegally-dumped
waste in urban areas. The second group works at the final disposal sites.
The first group segregates and collects recyclables such as plastics, glass, cardboard, metals and so
on, and sell them to private recycle shops or dealers. Since they have their own territories, the same
waste pickers work at the same containers every day. In some areas, waste pickers sometimes
collaborate with GWMC sanitary workers to transfer waste from hand carts or donkey carts to
containers.
On the other hand, the second group segregates and collects the recyclables, carries them to the city
and sell them to private recycle shops or dealers because there are no shops near the final disposal
site. Since they gather the recyclables from trucks or trolleys full of waste, they interfere with
GWMC’s dumping work. In addition, they are at risk of being injured. In fact, almost all of them
complain about not only the bad odour but also the danger of broken glasses and hospital wastes

Draft Final Report
Volume 1 Main Report
Project for Integrated Solid Waste Management
Master Plan in Gujranwala
50
CTI Engineering International Co., Ltd. NJS Consultants Co., Ltd.
EX Research Institute Ltd.
mixed in municipal solid waste. Since no one has protective equipment such as boots, gloves,
masks, and so on, some of them have experienced getting injured by broken glasses. It is then
necessary to consider possible methods to protect them from getting injured and to provide means
of earning for their living.
Some GWMC sanitary workers also segregate and collect the recyclables directly from domestic
waste and sell them to the private recycle shops or dealers as the waste pickers do. This is partially
because GWMC does not prohibit the sanitary workers from collecting the recyclables during
working hours.
Based on the results of hearing survey with waste pickers in April 2014, total number of waste
pickers at containers and the final disposal site is estimated at 433 (See Table 2.5.1). In addition,
there are many waste pickers moving around Gujranwala City. Therefore, the estimated number of
waste pickers may exceed 800. Regarding the amount of recyclables treated by waste pickers, it can
be presumed to be around 70 tons per day assuming that the average collection amount is
82 kg/day-waste picker and 55 kg/day-waste picker in Gujranwala City and Gondlanwala disposal
site, respectively, based on the waste pickers survey conducted by GWMC and the JICA Project
Team in December 2014.
Table 2.5.1 Number of Waste Pickers at Container and Final Disposal Sites
Town / Road / Place Number of Containers* Number of Waste Pickers
Aroop Town 48 89
Khiali Town 57 114
Nandipur Town 51 95
Qila Didar Singh Town 40 68
G.T. Road 5 10
Chianwali Final Disposal Site 0 2
Gondlanwala Final Disposal Site 0 55**
Total 201 433
Note: * The number of containers was estimated in April 2014. **The number of waste pickers of 55 is based on the Waste Picker Survey in December 2014.
Source: Results of interview survey with waste pickers, GWMC and JICA Project Team
(4) Other 3R Activities
Based on the interview with residents, the following facts regarding 3R were revealed:
Almost all people get free plastic bags (mainly polyethylene) instead of bringing their bags
when shopping.
When people have troubles with their electronics or furniture, they tend to take actions based
on 3R policy; that is, they firstly try to repair them, handover and/or then sell them out. In case
of combustible materials, they stock and use them as fuel in winter.
2.5.3 Existing Recycling Firms in Gujranwala
In Gujranwala City, informal sector activities are very active as described in Subsection 2.5.2. In order
to evaluate the system of segregation, collection and treatment/disposal of recyclables and abilities of
related contractors, types of recyclable materials, degree of utilisation and penetration to residents, and
presence or absence of markets in Gujranwala have been surveyed. Regarding the markets, size and
operating structure related to firms and problems have also been examined.
(1) Recycle Private Shops and Dealers
There are more than 700 private recycle shops and dealers in Gujranwala City. Basically, private
recycle shops (see Photo 2.5.1) collect recyclables from households, commercial establishments,
waste pickers, street hawkers (see Photo 2.5.2) and sanitary workers. They collect all sorts of

Project for Integrated Solid Waste Management
Master Plan in Gujranwala
Draft Final Report
Volume 1 Main Report
CTI Engineering International Co., Ltd. NJS Consultants Co., Ltd.
EX Research Institute Ltd.
51
recyclables including paper/cardboard, all types of metal, glass, plastic, bread and shoes. They also
sell the recyclables to specified recycle
dealers after collecting a certain amount.
On the other hand, recycle dealers
purchase the recyclables from recyclable
shops and industrial establishments, etc.,
located not only in Gujranwala City but
also all over Pakistan or other countries,
and sell them to industrial establishments.
Most of them are specialised dealers but
some are general ones. In addition, it is said
that there are brokers called “middlemen”
who play the role of mediator between
dealers and factories without treating the
recyclables directly.
Regarding the price of recyclables,
although it depends not only on kind of
recyclables but on quality, recyclables are
sold at a small profit.
Targeted Recyclables (a)
Private recycle shops and dealers treat cardboard, food waste, glass, leather, metals
(aluminium, brass, copper, iron, lead, silver, tin), paper, plastics, rubber, shoes, etc. Almost all
of the private shops deal with cardboard/paper, plastics and metals. Approximately half of the
shops deal with food waste and glass. In contrast, approximately 70% of dealers treat
exclusively metals followed by plastics (ca. 20%) and paper (ca. 15%).
Price of Recyclables (b)
Purchase prices of private recycle shops and dealers are described in Table 2.5.2.
Table 2.5.2 Price of Recyclables
Unit: Rs./kg
Item Price Range Item Price Range
Cardboard 7-17 Metal 25-650
Food waste 17-18 Aluminium 100-200
Glass 1-5 Brass 120-565
Leather 17 Copper 550-650
Paper 8-20 Iron 25-45
Plastic 11-80 Lead 105
Rubber 3-4 Silver 142-175
Shoe 5-38 Tin 30
Source: Interview with private recycles shops and dealers, GWMC and JICA Project Team
Profit (c)
Regarding profit of recycle private shops and dealers, there are few direct answers from them.
Based on their answers about rough transaction amount and purchase/selling prices, their
profit can be estimated at between 5,000 and 125,000 Rs./month. Majority average profit is
estimated at 30,000 Rs./month.
Photo 2.5.1 Recycle Private Shop, UC No.54
Photo 2.5.2 Street Hawkers in Peri-Urban Area,
UC No.117

Draft Final Report
Volume 1 Main Report
Project for Integrated Solid Waste Management
Master Plan in Gujranwala
52
CTI Engineering International Co., Ltd. NJS Consultants Co., Ltd.
EX Research Institute Ltd.
Number of Employees (d)
Almost all recyclable dealers hire less than 10 people at a maximum. Some owners operate
their shops by themselves.
Site Location (e)
The number of recycle private shops and dealers was counted by field survey. The minimum
number of shops and dealers is 398 and 312, respectively because of the purpose and
procedure of this survey. The detailed breakdown of the number of shops and dealers in each
UC is shown in Volume 2, Supporting Report, Section D: Intermediate Treatment and 3R
Promotion, Table D.2.5. Regarding private shops, all urban UCs except No.4 and No.42 have
at least one shop. On the other hand, dealers operate only in about 40% of urban UCs and tend
to be located in UCs with many private shops. Regarding the peri-urban UCs, there are some
recycle private shops in each UCs with few exceptions; there are no recycle private shops in
UC No.114, UC No.117 and so on. However there are no recyclable dealers in the peri-urban
UCs.
Open Hours (f)
Most of the shops and dealers open at around 8 a.m. and close at around 5 p.m. every day
except on Fridays.
Year of Operation (g)
Year of operation depends on the shop and dealer such as 2 to 35 years. The average is
estimated to be about 10 years. Since there are no necessary qualifications to start a business,
it seems to be relatively easy to start operations.
(2) Scrap Market
It has been confirmed that a scrap market focusing on metals exists in UC No.34 in Gujranwala
City. The market is a kind of association composed of about 250 recyclable dealers in UC No.34.
The association has a board of directors, president, finance head, secretary and so on. Some of the
dealers are registered with the Gujranwala Chamber of Commerce and Industry, even though it is
not necessary. Although the transaction volume is not revealed, this market purchases metal scraps
from all over the country and sell them to factories in Gujranwala City. Middlemen described
above play the role of mediation between the scrap dealers and the factories.
(3) Factory
Recycle status in factories in Gujranwala City and surrounding areas were surveyed. Almost all of
the factories sell or give their recyclable waste (metal scrap, slag, plastic scrap, plaster, etc.) to
recycle dealers or applicants. Some factories recycle their generated recyclable waste in their
factories or purchase recyclables from dealers or other factories in order to utilise as their feedstock.
Typical industries and recyclables are enumerated in Table 2.5.3.
Table 2.5.3 Typical Industries, Recyclables, Destinations and Final Products
Industry Sector Recyclables Destination Final Products
Chemicals Plastic drum, Metal drum Dealer Reuse
Ceramics Mould Own factory Filling material
Food Plastic bag* (low density
polyethylene (LDPE) bag, or
polythene bag)
Dealer Plastic crystals/pallets
Foundry Works Combustion residue Applicant No use (waste)

Project for Integrated Solid Waste Management
Master Plan in Gujranwala
Draft Final Report
Volume 1 Main Report
CTI Engineering International Co., Ltd. NJS Consultants Co., Ltd.
EX Research Institute Ltd.
53
Industry Sector Recyclables Destination Final Products
Gas Appliances Metal (Iron, Silver, Steel) Dealer Remoulding and
rerolling
Marble Small cuttings of marble Dealer Basement material
Paper Paper Dealer Recycling
Plastic Plastic* Dealer Plastic crystals/pallets
Sanitary Fittings Metal (Brass) Dealer Remoulding
Spare Parts Metal (Aluminium, Brass,
Copper, Iron, Steel)
Dealer
Other Factory
Spare parts e.g., nuts,
bolts, etc.
Utensil Metal (Iron, Brass, Steel)
Metal (Aluminium)
Plastic (Becolite)
Dealer
Own furnace
Factory workers
Kitchen ware and
spare parts, sanitary
fittings spare parts
Note:* According to the interview results with industrialists and recyclable manufactures, plastic bag and plastic in the above table is not made of poly-vinyl chloride in Gujranwala. However, there may be no act or protection to prohibit the use of poly-vinyl chloride in the country.
Regarding plastics, there are some notifications which may be called the prohibition of non-degradable plastic products (manufacturing, sale and usage) of polyethylene, polypropylene or polystyrene, Regulation 2013 (“Extraordinary Published by Authority, Part-II Statutory Notifications (S.R.O), Government of Pakistan Environmental Protection Agency, Islamabad, 2013”, and “The Punjab Gazette published by Authority, Law & Parliamentary Affairs Department, 2002).
(4) NGO
There are three (3) NGOs related to the environment sector in Gujranwala, namely; Organization
Pan Environment (OPE), Gujranwala Environmental Organization (GEO) and Social Transmission
& Environmental Protection Society (STEPS). One of them, OPE, carried out a pilot project for
composting as part of a waste collection program financially supported by an international NGO
named Water Aid. In particular, from May 2011 to January 2012, OPE had collected domestic
waste and segregated organic waste from the waste in part of UC No.8. The number of covered
households (HH) and population was about 1,800 and 15,000, respectively. After segregation,
organic wastes were transported to UC No. 38 about 10km away from UC No.8 for composting.
OPE adopted the pile method for composting under the technical cooperation of the University of
Agriculture Faisalabad. The number of members related to this project was 13, i.e., 11 for sanitary
workers and 2 for social mobilisers. During the first 6 months, OPE provided the door-to-door
collection service for free and started to charge 50 Rs./month/HH after 6 months. Since the
collection rate of waste discharge fee was only 25%, OPE could not continue to provide the service
after funding stopped. With regard to composting, OPE collected organic waste of about
900 kg/day and produced compost with 25% of weight recovery rate. OPE gave compost free of
charge and sometimes sold them at 20 Rs./kg. Reasons for the failure the marketing of compost
were: (1) OPE does not have a licence for the sale of compost; and (2) Farmers want immediate
results. While compost gives results in 5-6 years, chemical fertilizers give more yield of crops and
immediate results. Therefore, the demand of compost is not much at present.
GEO has been entrusted the project of installation of dust bins by the Environmental Protection
Department (EPD). Dust bins were installed outside government offices, colleges and adjoining
streets of UC No. 90 and No. 54, and small dust bins were distributed free of charge to shopkeepers.
The project was completed in almost 2 months. GEO also printed awareness messages on 5m3
waste containers placed in different UCs of the city. STEPS conducted an awareness campaign
related to environment in a school of Gujranwala.
(5) Private Composting
In one of the largest parks in Gujranwala City named Gulshan Iqbal Park, composting has been
practiced for more than 23 years. After establishment of the Parks and Horticulture
Authority (PHA) on 11 April 2014, the administration of all parks was handed over by the Tehsil
Municipal Administrations (TMA) to PHA.

Draft Final Report
Volume 1 Main Report
Project for Integrated Solid Waste Management
Master Plan in Gujranwala
54
CTI Engineering International Co., Ltd. NJS Consultants Co., Ltd.
EX Research Institute Ltd.
Pit and open heap/pile method of composting is being practiced. In the open heap/pile method, cow
dung, dry crushed leaves and earth are mixed at the ratio of 3:2:14. Periodic sprinkling of 5% DAP
(Di-Ammonium Phosphate) solution is done on the pile. In the pit method of composting, 2 feet
high layer of leaves of eucalyptus tree in the park are placed in the pit and periodic sprinkling of 5%
DAP is also done.
The process is completed in 3 pits. After every 3 months, the material is transferred to the next pit.
This type of compost gets prepared in 9 months. Compost prepared in this park is used only for
horticulture and floriculture within the park. As many as 100,000 plants of 23 different varieties
were grown using this compost in 2014. PHA has a plan to expand composting into the other parks
in Gujranwala City.
(6) Farmer
In Gujranwala District, large cultivated lands spread in the peri-urban UCs. Table 2.5.4 shows the
cultivated area of each crop in Gujranwala City and Sadar Tehsil. The major crop occupies
approximately 95% with rice and wheat. On average, fertilizer consumption amount of wheat is
100 kg of urea, 75 kg of DAP (Di-Ammonium Phosphate) and 50 kg of potassium per acre. On the
other hand, the amount for rice is 100 kg of urea and 50 kg of DAP per acre. The total fertilizer
consumption of crops is estimated to be approximately 50,307 tons per year in Gujranwala City and
Sadar Tehsil. It was revealed through interview with the Managing Director (MD) of Lahore
Compost Company that 6-7 bags of 50kg are required per acre. The total compost consumption for
crops is estimated to be 110,291 tons per year in Gujranwala City and Sadar Tehsil. As shown in the
table, for example, unit price per acre of chemical fertilizers application for wheat becomes
11,300 Rs./acre and unit price of compost application for wheat becomes 1,750 Rs./acre. Compost
is cheaper than the chemical fertilizer. So far there is no data available for a chloride ion
concentration in compost in Gujranwala. However, it is assumed that as the salt in compost comes
from food waste, the salinity of a dish will be less than 1% that becomes delicious, and there are not
large amounts of the food waste mixed in the total amount of organic waste.
The interview survey conducted in peri-urban areas with the local farmers showed that they are
well aware about the benefits of applying organic fertilizer or compost for healthy and eco-crops.
The organic fertilizer produced by cow dung is used as a base fertilizer after cropping or before
seeding by the interviewee farmer. The cow dung softens the soil and the farmers use it in
combination with chemical fertilizers for more yields in short time. The farmers want to see the
effects of compost application on test yards at the compound of the proposed compost plant in
Gujranwala. In addition, it was revealed through some interviews with farmers that they do not
want to start to utilise compost without verification test by authorised public institutions.
Table 2.5.4 Comparison of Cost and Consumption of Chemical Fertilizers and Compost Application on
Crops in Gujranwala City and Sadar Tehsil (2013-2014)
Crop type
Cultivated Area Quantity of
Chemical
Fertilizer
Required (tons)
Estimated Cost of
Chemical
Fertilizers
Application (Rs.)
Quantity of
Compost
Required
(tons)
Estimated Cost of
Compost
Application (@ 7
bags / acre) (Rs.) (acres)
Ratio
(%)
Wheat 139,408 44.2 27,882 1,575,310,400 48,793 243,964,000
Rice 159,892 50.7 20,466 1,674,868,700 55,962 279,811,000
Vegetables 4,070 1.3 1,018 57,387,000 1,425 7,122,500
Sugarcane 180 0.1 45 2,506,500 63 315,000
Maize 189 0.1 43 2,475,900 66 330,750
Fodder 11,378 3.6 853 48,356,500 3,982 19,911,500
Total 315,117 100.0 50,307 3,360,905,000 110,291 551,454,750
Source: Agriculture Department Gujranwala

Project for Integrated Solid Waste Management
Master Plan in Gujranwala
Draft Final Report
Volume 1 Main Report
CTI Engineering International Co., Ltd. NJS Consultants Co., Ltd.
EX Research Institute Ltd.
55
Currently, there are no formal activities related to intermediate treatment and 3R although it was
observed that an appreciable extent of informal activities regarding intermediate treatment and 3R
are carried out. Therefore, it is important to design the manners of utilisation of non-recycled waste
with minimising effect to the informal activities.
2.5.4 Lahore Compost Company and D.G. Khan Cement Company
There are companies for composting and RDF (Refuse Derived Fuel) production, namely; the Lahore
Compost Company (hereinafter referred to as “LCC”) and D.G. Khan Cement Company (hereinafter
referred to as “DGKCC”) in Lahore, Punjab. The JICA Project Team visited the plants and equipment of
the LCC and DGKCC together with members of GWMC in 2014 and 2015. Salient features of the plants
are summarised in Table 2.5.5 and Table 2.5.6 some photos of the on-going LCC Compost Plant are
shown in Photo 2.5.3 and Photo 2.5.4.
Compost produced at the LCC Compost Plant seems not to go well because it was observed that a half or
more of the compost products were remaining unsold. One of the reasons seems to include that the trust
of the users (farmers and inhabitants) about the compost is not obtained, according to the interview
survey. Interview results with the LCC and DGKCC are also shown in the table below.
Table 2.5.5 Salient Features of the Lahore Compost Plant
Project Overview Descriptions
Contracting parties City District Government Lahore and Lahore Compost (pvt.) Ltd. (LCL)
Description of service Establishment of compost plant
Operation capacity 1,000 tons/day
Total plant area 25 acres
Cost of raw material Raw material, i.e., municipal solid waste is given free of cost to Lahore Compost and it shares 10% of its profit to LWMC.
Description of staff involved Project manager, supervisor, mechanics, engineers, biochemist, marketing representative, labourers, etc.
Description of equipment Imported plant from Belgium of Rs. 300 million containing all equipment sorting conveyors, trammel screen, shredder, turner, bagging unit
Start of operation March 2006
Contract period 25 years
Compost preparation time 60~90 days
Production amount 200-250 tons/day of compost and approximately 250 tons/day of RDF
Present status In operation
Major merits of compost*/RDF
Compost is cheaper than other chemical fertilizer, and is useful in long term for soils and crops, increasing the soil porosity and nutritional supply of plants. Compost is environmental friendly.
Compost can reduce waste amounts on the landfill site drastically.
RDF is cheaper than other fuel types.
RDF reduces waste amounts and a burden on the landfill site, and increases its life span.
Major points to be addressed*
A bulk density of Lahore compost products was simply measured at the office of GWMC and the results reveals more than 1.0 t/m3, that may be higher than a density of real compost.
An organic matter of the Lahore compost is around 15% which is smaller than 35%-40% of organic matter in Japan in general. It is advised that quality of LCL products should be improved in terms of high organic contents.
Although the LCL has the licence of compost production from the Agricultural Department Directorate of Soil Fertility Punjab, it is suggested that the quality control of LCL should be required to be improved.
Besides being required the quality control of LCL, IEC (Information, Education and Communication) programmes on effectiveness and safety of LCL is further needed to the famers.
Although the LCL has currently a contract for RDF sale with Lafarge Group, the LCL may need to consider contracts with other enterprises to expand a sale market for RDF.
Source: Interview results with Lahore Compost Company (Pvt) Ltd.
Note: * This means the results of the interview with Lahore Compost Company (Pvt) Ltd.

Draft Final Report
Volume 1 Main Report
Project for Integrated Solid Waste Management
Master Plan in Gujranwala
56
CTI Engineering International Co., Ltd. NJS Consultants Co., Ltd.
EX Research Institute Ltd.
Store house and bagging unit next
to
the compost & RDF plant
Primary sorting process and
magnetic separator for compost &
RDF
Trammel screen for composting
Sorting process for RDF RDF materials Organic compost product
Photo 2.5.3 Composting Process under Operation of LCC Compost Plant

Project for Integrated Solid Waste Management
Master Plan in Gujranwala
Draft Final Report
Volume 1 Main Report
CTI Engineering International Co., Ltd. NJS Consultants Co., Ltd.
EX Research Institute Ltd.
57
Table 2.5.6 Salient Features of the D.G. Khan Cement RDF Plant
Project Overview Descriptions
Contracting parties Lahore Waste Management Company and D.G. Khan Cement Company (Pvt.) Ltd.
(DGKCC)
Description of service Establishment of RDF plant
Operation capacity 700-800 tons/day
Cost of raw material Raw material, i.e., municipal solid waste is given @ Rs. 52/ton to DGKCC
Total plant area 45 acres
Description of staff involved Project manager, plant engineer, supervisor, labourer, mechanics, etc.
Description of equipment
Imported equipment plant from Germany containing shredder, magnetic separator,
vibratory screen, wind shifter and baler unit.
Start of operation 2013
Total Cost
Rs. 1.5 billion. (total construction cost including equipment)
Operation and maintenance cost: Rs. 200,000-300,000/month, production cost:
Rs. 100/ton, transportation to Kallar Kahar: Rs. 900/ton, operation cost:
Rs. 1,000-1,200/ton, selling price of RDF material: Rs.53/ton.
Production amount 280-320 tons/day of RDF
Operation status Under operation
Major merits of the Plant*
RDF is cheaper than other fuel types and contributes the reduction of waste amounts
incoming to a final landfill site and then its life span.
RDF has an advantage of lighter combustible fluff after bailing to transport them to their
own plant at Kallar Kahar.
The owner company of Nihat Group which has more than 25 industries in the country
uses the RDF at their own kilns.
An energy pilot project for waste biogas is in progress and DGKCC intends to produce
electricity energy to consume for the plant use which depends on feasibility. For this
reason, DGKCC does not need to search for other market of RDF to meet their fuel
demand.
Major points to be
addressed*
Currently a big amount of organic waste is being landfilled.
Only some number of cement companies such as Lafarge, DGKCC, Lucky Cement, etc.
use RDF materials in their kiln in combination with other fuels.
As RDF that contains plastics, rubbers and leathers, etc. produces toxic gases on
burning, proper operation and management of the combustion temperature should be
crucial for the air pollution control technology.
Source: Interview results with the D.G. Khan Cement Company for RDF Plant.
Note: * This means the results of the interview with the D.G. Khan Cement Company for RDF Plant.
RDF Product Plant Input waste into the RDF plant Magnetic separator
Main equipment (vibratory screen,
wind shifter, baler unit) Vibratory screen RDF material before baler unit
Photo 2.5.4 RDF Material Product under Operation of D.G. Khan Cement Company

Draft Final Report
Volume 1 Main Report
Project for Integrated Solid Waste Management
Master Plan in Gujranwala
58
CTI Engineering International Co., Ltd. NJS Consultants Co., Ltd.
EX Research Institute Ltd.
2.5.5 Evaluation of Intermediate Treatment and 3R Promotion Condition
The problems and issues in relation to intermediate treatment and 3R (Reduce, Reuse, Recycle)
activities under the current situation are summarised in Table 2.5.7. These items will be the basic
elements to develop the plans, programmes and projects to compose the intermediate treatment and 3R
promotion plan in the Integrated Solid Waste Master Plan in Gujranwala.
Table 2.5.7 Identification of Problems and Issues in Intermediate Treatment and 3R
Problems Description of Problem Issues for Solving the Problems
1. Absence of
formal
intermediate
treatment and 3R
facilities
Gujranwala City has not developed intermediate
treatment or 3R facilities until now.
GWMC should introduce formal intermediate
treatment and 3R facilities with consideration on
not only budget but also the awareness of
residents. To determine the necessary and
sufficient facilities, the result of WACS shall be fully considered.
2. Lack of awareness
of residents on
intermediate
treatment and 3R
People who do not want to get little money from
recyclables are not interested in the segregation
of waste. In addition, almost all people neither
bring bags for shopping nor conduct
pre-treatment like pressing and dewatering. On
the other hand, GWMC has not started
educational programmes for intermediate
treatment and 3R.
GWMC should raise the residents’ awareness
regarding the intermediate treatment and 3R.
Even if there are enough facilities and systems
related to the intermediate treatment and 3R, they
will not be effective without the consciousness of the residents.
3. Health Risk of
Waste Pickers
Waste pickers never wear protective equipment
like shoes, masks, gloves and helmets to protect
themselves from injury or sickness. Although
they sometimes disturb operation like unloading
and collecting, GWMC should not oversimplify
this problem. It cannot be solved by prohibiting
their activities since they do not have any other
means to earn a living except waste picking at present.
Instead of imposing a limit on their work to
improve operation efficiency, GWMC should
provide alternative opportunities when they make
a living. The countermeasure for Problem 1 in
this table must be considered first to determine
the countermeasure for this problem.
4. Ambiguous flow
of recyclables
Although there are no formal facilities and
systems for the intermediate treatment and 3R in
Gujranwala City, there are so many people
involved in the recovery of recyclables. There
seem so many flows of recyclables, and the
amount of recyclables in each flow or point cannot be identified at this moment.
In order to set reasonable goals of intermediate
treatment and 3R plan, it is necessary to grasp the
current situation quantitatively or the recovery
rate. It is also needed to measure the effect of
several plans related to intermediate treatment
and 3R. Therefore, GWMC should take
measures to calculate the recovery rate
periodically.
5. Not well known
quality & effect of
compost products
of the Lahore
Compost / RDF
Plant
Compost produced at the Lahore Compost Plant
seems not to go well because a half or more of the
compost products seem to remain unsold. The
users do not trust the safety and quality of compost produced at the plant.
A regular quality control in the compost
production process should be carried out. A
periodical quality inspection system by the public
institutions or agencies should also be established
for certification of the compost products.
Additionally, it is needed to perform a continuous
IEC activity on the needs of 3R and the running
the compost plant for the integrated solid waste management project in Gujranwala.
6. Lack of laws and
regulations related
to 3R
There is no enforced legal system such as laws
and regulations on SWM and 3R activities in
Gujranwala, Punjab, to support GWMC’s 3R activities and promotion.
As legal background to organize or ask for join of
waste generators or recycling people to the
programs on SWM, recycling laws are needed to
be legislated leading to weak legal status of the
concerned organisations and sectors for 3R activities.

Project for Integrated Solid Waste Management
Master Plan in Gujranwala
Draft Final Report
Volume 1 Main Report
CTI Engineering International Co., Ltd. NJS Consultants Co., Ltd.
EX Research Institute Ltd.
59
2.6 Environmental Education and Public Awareness Raising
2.6.1 Public and Establishment Awareness Survey
Awareness survey was planned to identify the current status of waste management practices by two key
stakeholders: Households (include households targeted in waste amount and composition survey) and
Business entities (market, schools and universities, commercial establishment, restaurants, hotels,
shops, factories, and hospitals). The interview survey is conducted by a private contractor while some
key components, such as sample numbers and target entities, and questionnaire forms are developed
with close cooperation between counterpart personnel and the JICA Project Team.
Number of samples required for the household survey is determined using multistage sampling
methods, in which approximately 400 samples are required giving 95 confident levels. These 400
samples are then distributed among target areas depending upon income level, i.e., high, middle and low,
since income greatly influences the type and volume of waste. Likewise, the number of target
commercial establishments is determined to represent the whole area of Gujranwala City and a total of
50 samples are surveyed. The number of samples per area per income level and per commercial category
is listed in Volume 2, Supporting Report, Section E: Environmental Education and Public Awareness
Raising, Tables E.2.1 and E.2.2.
Although survey items differ considerably since each entity has its own unique characteristics, the items
are categorised into four (4) parts: General Information (location, general information, etc.), Description
of Interviewed Subject (number of members, type of dwelling, household income, etc.), Solid Waste
Conditions (waste container used, waste discharge habit, separation and recycling, charge paid, etc.) and
Awareness on SWM Issues (concept of SWM in the city and willingness to pay). The detailed survey
items of the questionnaires are shown in Volume 2, Supporting Report, Section E: Environmental
Education and Public Awareness Raising, Table E.2.3.
The survey was carried out from late September to November 2014 and a summary of the survey is
presented in the following sections (See detail in Volume 2, Supporting Report, Section E:
Environmental Education and Public Awareness Raising, Subsection 2.1.3.)
(1) Households
As a result, across the income group, there is no gender bias, and a major portion of the answer
come from the master, wife, or children who are familiar with household matters very well. This
makes the result of the survey very accountable. It is found that most of the questions have been
given answers so that the data acquired is very useful. On the other hand, however, respondents
were very reluctant to give information about financial matters, such as how much they are willing
to pay for a service. Therefore, the data on financial matters should be dealt as reference only and
should not be used as definite illustration of the situation on the ground.
Waste Collection Services/Waste Discharge Behaviour (a)
In urban area, more than half of
households have waste collection
services. Of course, households with
higher income receive a higher level of
waste collection services, namely;
door-to-door collection. On the other
hand, close to 70% of households do
not have waste collection services in
rural areas. It also shows that a
majority of households have no issue
about distance from waste collection
point since most of them enjoy either Figure 2.6.1 Frequency of Waste Collection

Draft Final Report
Volume 1 Main Report
Project for Integrated Solid Waste Management
Master Plan in Gujranwala
60
CTI Engineering International Co., Ltd. NJS Consultants Co., Ltd.
EX Research Institute Ltd.
door-to-door collection or curb-side collection.
Figure 2.6.1 shows the frequency of waste collection. As expected, daily collection is
observed in high income groups with more than 60% of households serviced every day. The
graph clearly shows the correlation with income level and frequency, i.e., the higher the
income, the more frequent waste collection. It can be noted that most of the households across
the income group have multiple collection days in a week.
When a household encounters issues on waste collection services, such as insufficient waste
collection (frequency) or waste collection at irregular time, a considerable number of
households imply that they dispose their waste into public places. Seven percent (7%) of
middle income people dispose their waste at nearby waste containers when no prompt waste
collection is provided. In other words, regular waste collection and awareness rising activity
for proper SWM is badly needed to attain a hygienic condition in the community.
Willingness to Pay (WTP) for Waste Collection Services (b)
Since the amount of money that one is willing to pay was asked from the respondents who
want to avail themselves of GWMCs’ waste collection service, no figure was given by the
respondents who gave a “no answer” or “no” to the questions. In other words, the results of
the survey on WTP should be dealt with as reference only since a very limited number of
people answered this question. Actually, nobody in high income group answered this question.
High income residents might have feared that much higher fees would be imposed in the future
when GWMC starts to collect waste with fees.
Interestingly, however, people are much more inclined to give out information about tips they
are currently paying for waste collection workers. In urban settings, close to 70 to 80% of
residents gave out the figure and approximately 30% in rural setting gave out the figure.
Although the WTP figure is based on very limited number of respondents, the general trend is
same across the income groups when the WTP figure and the current tip is compared. In
general, close to 35–40% of residents in urban middle and low income groups pay either
1-50 Rs. or 51-100 Rs. a month. Nonetheless, people willing to pay 51-100 Rs./month
dropped considerably while 0 Rs./month emerged in the willingness to pay questions. A
similar trend can be said also for the rural population.
If GWMC will pursue the collection of operation cost from the residents directly, it should be
emphasised to PR such information as the objectives, operation, and other environmental
related activities to the public to gain their confidence and make them realise that a certain cost
is necessary to properly manage SWM and make the city environment hygienically clean.
The willingness to pay for each income group is shown in Figure 2.6.3, and the tip to
collection workers by income group is presented in Figure 2.6.2.
Figure 2.6.3 Willingness to Pay for Waste
Collection Services by Income Group
Figure 2.6.2 Current Tip Paid to Collection
Workers per Month by Income Group

Project for Integrated Solid Waste Management
Master Plan in Gujranwala
Draft Final Report
Volume 1 Main Report
CTI Engineering International Co., Ltd. NJS Consultants Co., Ltd.
EX Research Institute Ltd.
61
In addition, approximately 40 to 50% of residents in middle and low income groups in
urban area indicated that they were not satisfied with the current waste collection service.
Recycling Behaviour (c)
Figure 2.6.5 to Figure 2.6.7 show residents’ behaviour on recycling. These figures present
the percentage of respondents who separate bottles, cans, and paper from other wastes.
According to the result, bottles are relatively recognised worth separating from other waste
across the income groups although more income seems to mean less interest in segregating
bottles from other waste.
For the metal cans, middle income in urban area shows very little interest in separating them
from other wastes, followed by the urban low income and rural low income. Paper, on the
other hand, is fairly well segregated from the other wastes. Nonetheless, many of the
segregated papers, like newspapers, are being used for other purposes such as wrapping
material in shops.
Almost no one is separating kitchen waste from the other waste in all 4 groups. This suggests
that much of the materials which can be used to make compost is going to landfill site and
shortening its service life.
In all materials, one can say there are a lot of room to improve public to participate in recycling
activities. Segregation of recyclables from general waste should be one of the focus of the
topic in the environmental education.
Cleanness of the City (d)
Approximately 40 to 50 percent of residents view the public spaces in the city as clean, but
another 30 to 40 percent of people answered “not clean”. When asked if they would cooperate
in the effort to keep the city clean, almost all respondents answered “Yes.”
Figure 2.6.5 Recyclable Separation
(Bottles) by Income Group
Figure 2.6.4 Recyclable Separation
(Cans) by Income Group
Figure 2.6.7 Recyclable Separation
(Papers) by Income Group
Figure 2.6.6 Recyclable Separation
(Kitchen Waste) by Income Group

Draft Final Report
Volume 1 Main Report
Project for Integrated Solid Waste Management
Master Plan in Gujranwala
62
CTI Engineering International Co., Ltd. NJS Consultants Co., Ltd.
EX Research Institute Ltd.
(2) Commercial Establishments (Business Establishments)
Interview surveys were also carried out for business establishments. The questionnaire includes the
same or similar questions across the industry such as general information about the interviewees,
recycling and financial matters. Some questions were, however, very different from industry to
industry. For instance, additional questions for medical waste and general waste were asked for
“hospitals” whereas generation of waste types were asked for “factories.”
Accountability on the Results of Survey (a)
Since interview survey was employed, most of the questions were given some answers even if
the answer was simply “No.” Therefore, given the condition of the survey, most of the results
can be considered as valid results. A majority of the questions in the business establishment
survey received some answers, meaning that most of the questions received a 100% response
rate.
Waste Collection Services/Waste Discharge Behaviour (b)
A large number of establishments have waste collection services. The establishments that do
not have a waste collection service usually have their own disposal methods. A result of
questions regarding satisfaction with the current waste collection service varies depending on
business types where restaurants and hospitals have good ratio of satisfaction of the services
while 70% of factory says ‘not satisfied.’
Recycling Behaviour (c)
Recycling practice among business establishments is very low. The only exception done at
restaurants is bottle recycling (100%) and can (60%). Many answered either they did not know
or discharged with other types of waste. Especially for organic waste which can be used for
animal feed or composting, a majority of the establishments discharge them with the other
waste.
(3) Conclusion
In general, the public is not satisfied with the waste management services provided by GWMC,
which resulted in the low awareness of SWM. Also, the limited data suggests that Resident’s
Willingness-to-Pay is very limited or even none.
Discharge behaviour has much room for improvement because the awareness on recycling is low.
Although recycling and reusing bottles is somewhat much popular among the general public and
restaurants, other recyclable materials show a considerably low recycling rate. This can be true for
even the low-income group in rural areas.
Organic materials, which can be used to make compost and reduce the volume of waste sent to the
final disposal site, are also not collected well.
Therefore, public relation activities should be carried out to disseminate the proper SWM practices
expected to be performed by the public and the SWM practice carried out by GWMC.
2.6.2 Findings from the Interview with the District Officer Environment
There is a District Officer Environment in Gujranwala City who deals with environmental issues in
general, such as nature/life, waste/resource, and energy and global warming. The interview with the
District Officer revealed the following:
There is no by-law, ordinance or directive for carrying out environmental education. However, a
framework exists for higher education such as Doctor of Philosophy (Ph.D,), Master of Philosophy

Project for Integrated Solid Waste Management
Master Plan in Gujranwala
Draft Final Report
Volume 1 Main Report
CTI Engineering International Co., Ltd. NJS Consultants Co., Ltd.
EX Research Institute Ltd.
63
(M.Ph)/Master of Science (MS), and Bachelor of Science (BS) in Environmental Sciences.
Collaboration with NGOs exists with, for example, Organization Pan Environment (OPE), Nayab
Welfare Society, Gujranwala Environmental Organization, etc.
Various media including brochures/textbooks, TV/radio/commercial programs, signboards, school
curriculum, and public meetings are utilised in environmental education.
Walks, seminars, activities at educational institutions, e.g., speech competition, essay writing,
printed material distribution, or environmental club, and other activities are employed for
environmental education/awareness raising.
Priority should be placed on (a) recycling of plastics, metals, glass, cardboard and others;
(b) composting from kitchen waste; and (c) animal/donkey waste.
Community meetings are the best strategy for awareness in Gujranwala along with school education
programmes. For mass communication, local cable channels can be very effective. Workshops and
seminars will not work for Gujranwala.
In Gujranwala at community level, education can be delivered by mosques (Imam Masjid).
Moreover, different community groups on the basis of income should be educated through multiple
awareness programmes/media.
Feminist groups/representatives from local community should be selected to address awareness at
household level. The contents of educational network may include major waste types, 3R concept,
at source segregation, waste and economy correlation and use of cloth bags rather than plastic bags.
There is no coordination or consultation from the Education Department while setting the
curriculum.
The Environment Department has conducted composting and recycling sessions in different schools on
periodic basis. An awareness curriculum (books) in private schools under a project was also distributed.
The awareness material includes story books regarding solid waste, composting, 3R concept, water
conservation and solid waste management guidelines.
2.6.3 Evaluation of Environmental Education and Public Awareness Condition
Interviews with the District Officer Environment indicate the lack of commitment in environmental
education in the government, which appears to be the hindering issue. For instance, there is neither legal
framework to carry out environmental education nor coordination among relevant bodies. The problems
and issues under the current situation related to environmental education are as summarised in Table
2.6.1.
Table 2.6.1 Identification of Problems and Issues on Environmental Education and Public Awareness
Problem Description of Problem Issues for Solving the Problems
1. Poor
coordination
among
government
agencies and
departments
There is a lack of coordination among departments
including school education, GWMC and
environment. Since awareness raising campaign or
environmental education activity has been carried
out without much coordination among relevant
bodies, thus messages were not focused nor spread
among target population.
Coordination among the relevant departments like
environment, school education, etc., is necessary
for the implementation of environmental education
and public awareness raising activities. A
mechanism to address environmental awareness
should be developed among the agencies concerned
to realise effective and coherent effort on
environmental education. The relevant bodies may
include Planning and Development, Education, Water and Sanitation, and Environment.
2. Inappropriate
school
curriculum
on the environment
The curriculum is different for public and private
schools. Inevitably, students in public schools,
especially, primary schools, learn less about the environment.
It is necessary to increase the practical applications
and classes regarding the environment in the school
curriculum. Some environmental education
packages for the kids as well as training for the teachers may also be implemented.
3. Lack of
awareness
There is a tendency among the public that the
government has the sole responsibility of taking
Patient effort is necessary to edify the public on
environment, especially, waste management. In

Draft Final Report
Volume 1 Main Report
Project for Integrated Solid Waste Management
Master Plan in Gujranwala
64
CTI Engineering International Co., Ltd. NJS Consultants Co., Ltd.
EX Research Institute Ltd.
Problem Description of Problem Issues for Solving the Problems
among public
care of the environment. Awareness programme
and campaign can be developed through
community groups which may be comprised of
area representatives, religious persons and
students.
this sense, collaboration with grassroots group or
even religious body (mosque) needs to be
considered in order to raise awareness among the
public. In addition, feminist groups may pose
strong influence to each household’s waste
management practices through a network of wives.
The efforts can include waste reduction,
reuse/recycle, source separation, and proper waste
discharge.
4. Irregular
informal
education on
the environment
There is no continuous informal education except
once a year during such event as Earth Day. There
is no strategy defined for the public information
department regarding informal environmental education.
The government should initiate concrete efforts in
highlighting the importance of environment
through implementation of public information for
the environment as well as cooperation with various groups working for environmental issues.
2.7 Economic and Financial Aspect
2.7.1 Demographic Situation
As indicated in Table 2.7.1, the estimated population of 64 Urban UCs of Gujranwala City is
approximately 1.56 million as of 2012 and 1.65 million as of 2014. The estimation in 2014 is based on
the latest population growth rate of 2.6 per cent per annum applied to “Situation Analysis of SWM
Services in Gujranwala City” conducted in 2012. Due to the rapid growth rate of population, the
population density is higher as compared to the whole Punjab.
Table 2.7.1 Town-Wise Population in Project-Related Town in Gujranwala
Town No. of
Urban UCs
Estimated
Population
for Year
2012
Estimated
Population
for Year
2014
Area (km2)
Estimated
Population
Density for
Year 2014
(1000 persons
per km2)
Nandi Pur Town 15 379,980 400,000 12.2 32.8
Khiali Shah Pur Town 13 339,930 357,840 19.8 18.1
Aroop Town 17 426,920 449,410 23.4 19.2
Qila Dedar Singh Town 19 417,680 439,680 9.6 45.8
Total 64 1,564,510 1,646,930 65.0 25.3
Note: Estimated from Socio-economic and Demographic Profile, 1998-2008 and Situation Analysis of SWM Services in
Gujranwala City, 2012.
2.7.2 Economic Situation
Gujranwala is one of the major industrial cities of Punjab, thereby contributing to the economy of
Pakistan. Being an industrial city, it has a variety of manufacturers in industrial machinery, fan industry,
motor pumps industry, washing machine industry, electric goods, poultry feed, soap, ballpoint, rubber
tube, metal utensils, melamine utensils, cutlery, kitchenware, ceramic tiles, sanitary wares, sanitary
fittings, agriculture implements, woollen textiles, steel pipe industries, etc.
The estimated and forecast of percentage of population by economic category and the industrial profiles
are as indicated in Table 2.7.2 and Table 2.7.3, respectively.

Project for Integrated Solid Waste Management
Master Plan in Gujranwala
Draft Final Report
Volume 1 Main Report
CTI Engineering International Co., Ltd. NJS Consultants Co., Ltd.
EX Research Institute Ltd.
65
Table 2.7.2 Estimated and Forecast Percentage of Population by Economic Category in Gujranwala
(Unit: %)
Category 1998 2005 2008 2010 2015
1=2+3 Economically Active 21.64 23.33 24.09 24.60 25.92
2 Employed 16.39 17.68 18.25 18.64 19.64
3 Unemployed 5.24 5.65 5.84 5.96 6.28
4=5+6+7+8 Economically Inactive 78.36 76.67 75.91 75.40 74.08
5 Children under 10
years old
27.52 26.93 26.66 26.48 26.02
6 Students 9.74 9.53 9.43 9.37 9.20
7 Domestic Workers 34.60 33.85 33.51 33.29 32.71
8 Others 6.51 6.36 6.30 6.26 6.15
7=1+4 Total 100.00 100.00 100.00 100.00 100.00
Source: Estimated from Socio-economic and Demographic Profile1998-2008
Table 2.7.3 Industrial Profile of Gujranwala
Type of Industry No. of Units
Power Looms 921
Utensils 504
Foundry Products 341
Fans/Coolers/Washing Machines 321
Sanitary Fittings 172
Motor Pumps 151
Hosiery Products 107
Textile Processing 52
Woven Textile Spinning/Weaving 48
Agricultural Implements 44
Total 2,661
Source: Estimated from Socio-economic and Demographic Profile1998-2008
2.7.3 Social Situation
The Government of the Punjab is committed to attain the Millennium Development Goals (MDGs) for
education, health, water supply and sanitation, and poverty. Towards this end, the Government, with
assistance of UNICEF, has been periodically carrying out the Multiple Indicator Cluster Surveys
(hereinafter referred to as “MICS”). MICS provides provincial and district-wise social data.
MICS 2003-04 was based on 40 indicators and the usage of information generated by the survey pointed
to the need of further improvements in the scope and coverage of selected indicators. The scope of
MICS 2007-08 was further expanded to more than 70 indicators and coverage level. The results of the
2007-08 survey as well as the 2011-12 survey do not only provide information on progress made in key
social indicators since 2003-04 but also provide an excellent baseline for the key social indicators.
Recently, the results of the latest MICS 2011-12 have been compiled. The detailed comparison of the
results of the major social indicators for Punjab Province as well as Gujranwala under MICS 2007-08
and MICS 2011-12 are presented from Table F.2.4 to Table F.2.15 in Volume 2, Supporting Report,
Section F: Economic and Financial Aspect. These socio-economic indicators cover a wide range of
socio-economic situation of the residents of Gujranwala, including literacy, education, water and
sanitation, adult health and health care, child mortality, nutrition, child health, child protection,
reproductive health, HIV knowledge and attitudes, employment, and housing and assets. The results
clearly prove that the social indicators of Gujranwala are better than the average of Punjab in almost all
areas.

Draft Final Report
Volume 1 Main Report
Project for Integrated Solid Waste Management
Master Plan in Gujranwala
66
CTI Engineering International Co., Ltd. NJS Consultants Co., Ltd.
EX Research Institute Ltd.
2.7.4 Infrastructure Situation
(1) Roads and Railways
The road network in Gujranwala has 9 primary
roads, 13 secondary roads and 8 local roads
connecting the city with other areas. In addition, the
Grand Trunk Road (G.T. Road) and a motorway
also pass through it. The inter-city railway
infrastructure is also available, and helps to connect
the city to other areas. The major road network in
Gujranwala is as shown in Table 2.7.4.
(2) Educational Infrastructure
Educational facility is considered to be one of the
most important social infrastructures. In Gujranwala, a large number of schools, colleges, and
medical colleges provide educational services to the citizens. The number of educational
institutions in Gujranwala and Punjab is as shown in Table 2.7.5.
Table 2.7.5 Number of Educational Institutions in Gujranwala and Punjab
Type of Institutions Number of Institutions (As of 2012)
Gujranwala Punjab
Mosque School 41 1,897
Primary School 1,470 42,048
Middle School 290 7,756
High School 193 5,589
Higher Secondary School 15 798
Arts and Science Intermediate College 17 212
Arts and Science Degree College 33 718
Source: Punjab Development Statistics 2013
(3) Health Facilities
Health facility is also considered to be one of the most important social infrastructures. In
Gujranwala, a wide range of health institutions such as hospitals, dispensaries, clinics and health
centres are available. The number of medical institutions in Gujranwala and other information is
separately discussed in Subsection 2.9.1.
2.7.5 Economic and Financial Situation of GWMC
(1) Budget Allocation Mechanism of GWMC
The operational budget and the investment budget for GWMC are being allocated from the budget
of CDGG which almost depends on the subsidies from the Government of the Punjab (GOPb) and
the regular budget of GOPs itself, respectively. For the financial year 2015-16, the total budget
allocated from CDGG and GOPb is approximately Rs. 504 million and Rs. 730 million,
respectively. Out of the operational budget from CDGG, 75.6 percent of the budget is allocated for
salary-related expenses and the remaining 24.4 percent is earmarked for other operating costs.
Table 2.7.6 gives a snapshot of the GWMC budget for SWM services. In addition to the below
regular budget of GWMC, approximately, Rs. 1.2 billion of the development scheme of the sanitary
landfill site is being submitted to GOPb through the PC-1 (Planning Commission 1) format under
2015-2016 financial year budget of GOPb.
Table 2.7.4 Major Road Network in
Gujranwala in 2008
Classification Length (km)
National Highway 69.52
Motorway 45.50
Provincial Roads 422.58
Farm to Market Roads 1,454.28
Sugar Cess Roads 16.66
Ex-District Council Roads 235.70
Intra-City Roads 115.51
Source: Socio-economic and Demographic Profile 1998-2008

Project for Integrated Solid Waste Management
Master Plan in Gujranwala
Draft Final Report
Volume 1 Main Report
CTI Engineering International Co., Ltd. NJS Consultants Co., Ltd.
EX Research Institute Ltd.
67
Table 2.7.6 Budget for SWM Services of GWMC
Expenditure Item
2014-2015 Revised Budget 2015-2016 Budget Estimates
Budget
(Rs. 1,000) Share (%)
Budget
(Rs. 1,000) Share (%)
Total Expenditure of GWMC 956,968 100.0 1,233,612 100.0
Budgetary Allocation from CDGG for
Operating Expenditure 482,968 50.5 503,612 40.8
Salary-related Expenditure 346,208 71.7 380,532 75.6
Other Operating Expenditure 136,760 28.3 123,080 24.4
Budgetary Allocation from GOPb for
Investment Expenditure 474,000 49.5 730,000 59.2
Source: Revised Budget for 2014-2015 and Budget Estimates for 2015-2016, CDGG
In conclusion, GWMC is not in a position to meet their financial needs from the internal financial
sources. They fall back on subsidies from the GOPb. This dependence on the budget of CDGG is
not sustainable in the long term, and GWMC needs to increase their financial resources to meet
their statutory obligations instead of solely depending on the budget of CDGG which is subsidised
from the Provincial Government.
Direct cost recovery through user charges does not exist in Gujranwala although LWMC is
planning to charge user fees in accordance with the income level. An important reason for this
situation is the lack of willingness to pay and proper billing systems. Since there is no official tariff
system for SWM services in Punjab, the tariff setting for SWM services is not controlled by an
authorised organization of the provincial government of Punjab.
The determination of tariff for electric power services is one of the primary responsibilities of
NEPRA (National Electric Power Regulatory Authority). NEPRA determines electricity tariffs,
keeping in view the principles of economic efficiency and service quality, according to the
prescribed tariff standards and procedures of 1998. While the tariff setting/revision of the power
sector is controlled by the federal government, the tariff setting/revision of the water and sanitation
sector is controlled by the independent committee involved in each urban development authority
such as LDA (Lahore Development Authority) and GDA (Gujranwala Development Authority).
Likewise, the tariff setting/revision of plans is subject to the approval of independent organizations
for the price regulation of sanitation/water and electricity, thereby being finally approved by the
provincial and federal governments, respectively. Both of the mechanisms do not require
enactment by the assemblies.
(2) Cost Structure for SWM Services
GWMC is required to accurately identify how much is spent for the various components of SWM
services in Gujranwala to establish strategies to minimise the cost of the services. However, at
present, GWMC is not sufficiently capable of grasping the variable costs, the fixed costs and even
the break-even point for the provision of SWM services.
Public services such as SWM services require cost accounting in order to financially track
activities. Cost accounting is a process of collecting, analysing, summarising and evaluating
various alternative public utility services. Cost accounting provides the detailed cost information
required to control current operations of SWM services.
Cost accounting is used to help grasp the costs of operating SWM services. Most of the costs
incurred by SWM services are what is called "variable costs" because they varied directly with the
amount of wastes.
Some costs tend to remain the same even during busy periods, unlike variable costs, which rise and
fall with the volume of work. These "fixed costs" should also be identified.

Draft Final Report
Volume 1 Main Report
Project for Integrated Solid Waste Management
Master Plan in Gujranwala
68
CTI Engineering International Co., Ltd. NJS Consultants Co., Ltd.
EX Research Institute Ltd.
In order to efficiently provide SWM services, GWMC is required to adopt a strategy for minimising
these costs. For this purposes, it is essential for GWMC to grasp the cost of services accurately.
(3) Pricing Mechanism
GWMC currently does not levy any SWM tax, nor does it impose user fees for SWM services.
SWM tax is a tax whose specific objective is limited to the improvement of SWM services.
Although the SWM tax is being adopted by some other countries, no city in Pakistan has introduced
this purpose-specific tax system for the generation of funds required for SWM services. Financial
sources for SWM services are covered by the budget of CDGG which almost depends on the budget
of the GOPb. Inadequate cost recovery mechanisms by GWMC limit the extent of operation as
well as new investments of SWM services. Therefore, the pricing mechanism such as charging
user fees needs to be considered and adopted.
Thus, in order to secure the budget for financially sustainable SWM services, GWMC needs to
consider its revenue raising capabilities by introducing a proper user charging system for SWM
services.
(4) Situation of Private Sector Involvement
GWMC should explore the possibilities of involving the private sector in SWM services to provide
efficient services cost-effectively with minimum costs. The private sector has been involved in the
SWM services in Punjab in formal as well as informal sectors. Waste Management contracts were
given out on small-scale community areas especially in new developed housing schemes due to
lack of such facilities.
Likewise, GWMC is not currently working with the private sector although it is exploring the
possibilities to introduce the option of private sector participation. Due to the limited resources
available, GWMC is looking towards improvement of its SWM services through outsourcing the
service to the private sector. It is commonly believed that the private sector would perform
significantly better than the public sector. This belief is based on assumptions that the private
sector would be more efficient, cost effective and would bring in new technologies for the
improvement of the SWM system.
2.7.6 Evaluation of Economic and Financial Condition
The problems and issues in relation to economic and financial management under the current situation
are summarised in Table 2.7.7. These items will be the basic elements to develop the plans,
programmes and projects to comprise the economic and financial management plan in the Integrated
Solid Waste Master Plan in Gujranwala.
Table 2.7.7 Identification of Problems and Issues on Economic and Financial Aspect
Problem Description of Problem Issues for Solving the Problems
1. Insufficient
financial
independence
in SWM
services
GWMC is not in a position to meet its financial
needs from the internal financial sources. It falls
back on subsidies from the GOPb. This
dependence on the budget of CDGG is not
sustainable in the long term, and GWMC needs to
increase its financial resources to meet its statutory
obligations instead of solely depending on the
budget of CDGG which is subsidised from the Provincial Government.
The proper revenue generation mechanism such as
the introduction of tariff system by GWMC should
be carefully studied. Transparency for setting the
tariff level as well as a wide range of activities
raising users’ willingness to pay for SWM services
is also required. The continuous financial
monitoring mechanism for GWMC should be also
established in the framework of the institutional strengthening the headquarters of GWMC.
2. Not well
identified
cost structure
for SWM
GWMC is required to accurately identify how
much is spent for the various components of SWM
services in Gujranwala to establish strategies to
minimise the cost of the services. However, at
present, GWMC is not sufficiently capable of
In order to set proper tariffs for users, all the costs
associated in providing SWM services by GWMC
should be reflected as accurately as possible and
streamlined as fixed costs and variable costs.

Project for Integrated Solid Waste Management
Master Plan in Gujranwala
Draft Final Report
Volume 1 Main Report
CTI Engineering International Co., Ltd. NJS Consultants Co., Ltd.
EX Research Institute Ltd.
69
Problem Description of Problem Issues for Solving the Problems
services grasping the variable costs, the fixed costs and even
the break-even point for the provision of SWM services.
3. Lack of
pricing
mechanism
for SWM services
Currently, there is no substantial pricing
mechanism for SWM services in Gujranwala.
GWMC currently does not levy any SWM tax, nor
does it impose user fees for SWM services.
Inadequate cost recovery mechanisms by GWMC
limits the extent of operation as well as new investments of SWM services.
To secure the budget for financially sustaining
SWM services, GWMC needs to consider its
revenue raising capabilities by introducing a proper
user charging system for SWM services. The
pricing mechanism such as charging user fees need to be considered and adopted.
4. Few
involvement
of the private sector
GWMC is not currently working with the private
sector although it is exploring the possibilities to
introduce the option of private sector participation.
Due to the limited resources available, GWMC is
looking towards improvement of its SWM services through outsourcing to the private sector.
GWMC should explore the possibilities of
involving the private sector in SWM services to
provide efficient services cost-effectively with minimum costs.
The objectives of involving the private sector
include 1) enhancing efficiency; and 2) mobilise
the investment resources of the private sector.
2.8 Institutional Strengthening and Organizational Restructuring
2.8.1 Laws and Regulations Related to Solid Waste Management
This section deals with laws and regulations related to solid waste management especially focusing on
the important ones in Punjab Province.
(1) Overview of Environmental Laws in Pakistan
The Pakistan Environmental Protection Ordinance of 1983 was the first federal legislation aiming
to improve the environment especially in the matter of waste. As a federal legislation, the
Ordinance established the Pakistan Environmental Protection Council (hereinafter referred to as
“PEPC”) as the supreme environmental policy-making body in the country and the Pakistan
Environmental Protection Agency (hereinafter referred to as “Pak-EPA”) at the federal level and
Environmental Protection Agencies at provincial level in all four provinces of the State, including
the Province of Punjab, to administer and implement the provisions of the Ordinance. In 1997, the
improved Ordinance was enacted after approval by the Parliament as the Pakistan Environmental
Protection Act (hereinafter referred to as “PEPA”).
The 1997 PEPA retained the institutional framework of the 1983 Ordinance and provides for the
protection, conservation and improvement of environment, for prevention and control of pollution,
and for the promotion of sustainable development.
The PEPA defines waste as any substance or object which has been, is being or is intended to be,
discarded or disposed, and includes liquid waste, solid waste, waste gases, suspended waste,
industrial waste, agricultural waste, nuclear waste, municipal waste, hospital waste, used
polyethylene bags, and residues from the incineration of all types of waste (PEPA Section 2 (xiv).
Other federal legislations related to solid waste management are summarised in Table 2.8.1.
Table 2.8.1 Other Federal Legislations Related to Solid Waste Management
Name of Regulation Year Major Issues related to Solid Waste Management
Pakistan Penal Code 1860
Penal Law
Handling and negligent conduct with respect to poisonous, toxic and hazardous
waste is an offence. The code is to be monitored by the provincial government.
The Factories Act 1934 Regulations on labour factories
Disposal of waste and effluents has to be arranged.
Constitution 1973 Basic rights and duties of the citizens and the Government of Pakistan

Draft Final Report
Volume 1 Main Report
Project for Integrated Solid Waste Management
Master Plan in Gujranwala
70
CTI Engineering International Co., Ltd. NJS Consultants Co., Ltd.
EX Research Institute Ltd.
Name of Regulation Year Major Issues related to Solid Waste Management
Acquiring land for public interest
Pakistan Environment
Protection Act (PEPA) 1997
Protection, conservation, rehabilitation and improvement of environment,
prevention and control of pollution
Defines municipal waste, hazardous waste, hospital waste, industrial waste,
agricultural waste, organic and inorganic matters and living organisms, buildings.
Prohibits discharge of waste in a concentration that violates the National
Environmental Quality Standards (NEQS)
EPAs that are satisfied that the discharge of any kind of waste in violation of the
provisions of the Act is likely to occur or occurring are empowered to direct the
responsible person to take necessary measures.
Penalties for contraventions against the provisions of the Act.
Environmental Tribunal
Rules 1999 Organization and procedures/rules (updated in 2012)
Review of IEE/EIA
Regulations 2000
Regulation on Environmental Impact Assessment (EIA)
Projects requiring an Initial Environmental Examination (IEE)/EIA
Waste disposal projects require IEE/EIA
National Environmental
Quality Standards (NEQS) 2000
Quality Standards for:
Municipal and liquid industrial effluents
Industrial gaseous emissions
Motor vehicle exhaust and noise
NEQS Regulations 2000 Certification of environmental laboratories
Pollution Charge for
Industry Rules 2001 Calculation and collection of charges
Provincial Sustainable
Development Fund Board
Rules
2001 Rules on constitution and meetings of the Board
NEQS Rules 2001
Self-monitoring and reporting by industrial units
Categories of industrial units
Monitoring report in addition to EIA approval
Environmental Sample
Rules 2001 Procedure of inspection and taking samples
Hazardous Substance Rules 2003 Management of hazardous substances
Waste management plan pertaining to hazardous waste
Hospital Waste
Management Rules 2005 Management of waste generated by healthcare institutions
(2) Important Laws and Regulations Concerning Solid Waste Management in Punjab
Province
Among the environmental laws related to solid waste management, the following five laws and
regulations in Table 2.8.2 are most noteworthy in the Province of Punjab. (See detail in Volume 2,
Supporting Report, Section G: Institutional Strengthening and Organizational Restructuring,
Subsection 2.1.2.)
Although there are several laws and regulations related to solid waste management in the Punjab
Province, they are very much fragmented or not well integrated. It means there is no single law on
solid waste management which is precise and comprehensive. This makes it more difficult for
government officials to understand their work and responsibilities.
In addition, the general public is unaware of those laws and regulations partially because of
illiteracy in English. Thus, the by-law being drafted by UU and LWMC should be precise and
comprehensive enough for government officials and residents to understand and comply with it.
This means the by-law should be written not only in English but also in Urdu.
Another issue concerning laws and regulations is their insufficient implementation. This is due to
lack of enforcement. Thus it is necessary to equip GWMC with more effective and efficient
enforcement measures. Another cause is the ignorance of the public. The general public even does
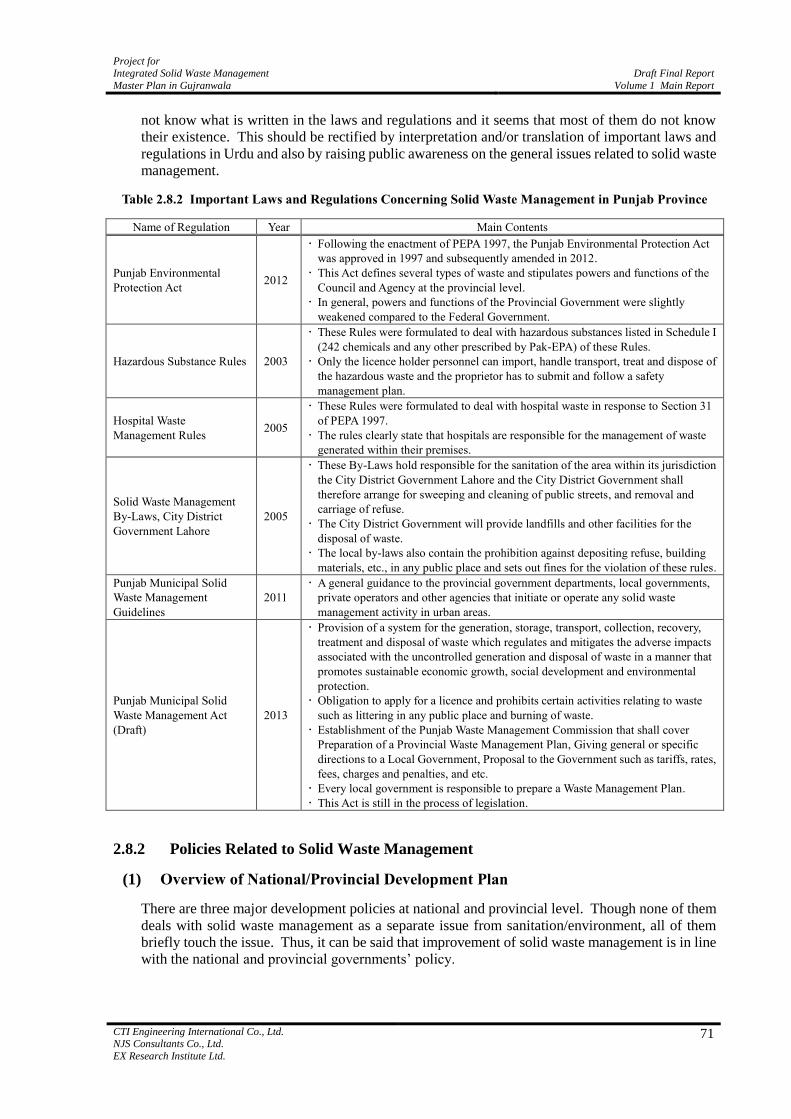
Project for Integrated Solid Waste Management
Master Plan in Gujranwala
Draft Final Report
Volume 1 Main Report
CTI Engineering International Co., Ltd. NJS Consultants Co., Ltd.
EX Research Institute Ltd.
71
not know what is written in the laws and regulations and it seems that most of them do not know
their existence. This should be rectified by interpretation and/or translation of important laws and
regulations in Urdu and also by raising public awareness on the general issues related to solid waste
management.
Table 2.8.2 Important Laws and Regulations Concerning Solid Waste Management in Punjab Province
Name of Regulation Year Main Contents
Punjab Environmental
Protection Act 2012
Following the enactment of PEPA 1997, the Punjab Environmental Protection Act
was approved in 1997 and subsequently amended in 2012.
This Act defines several types of waste and stipulates powers and functions of the
Council and Agency at the provincial level.
In general, powers and functions of the Provincial Government were slightly
weakened compared to the Federal Government.
Hazardous Substance Rules 2003
These Rules were formulated to deal with hazardous substances listed in Schedule I
(242 chemicals and any other prescribed by Pak-EPA) of these Rules.
Only the licence holder personnel can import, handle transport, treat and dispose of
the hazardous waste and the proprietor has to submit and follow a safety
management plan.
Hospital Waste
Management Rules 2005
These Rules were formulated to deal with hospital waste in response to Section 31
of PEPA 1997.
The rules clearly state that hospitals are responsible for the management of waste
generated within their premises.
Solid Waste Management
By-Laws, City District
Government Lahore
2005
These By-Laws hold responsible for the sanitation of the area within its jurisdiction
the City District Government Lahore and the City District Government shall
therefore arrange for sweeping and cleaning of public streets, and removal and
carriage of refuse.
The City District Government will provide landfills and other facilities for the
disposal of waste.
The local by-laws also contain the prohibition against depositing refuse, building
materials, etc., in any public place and sets out fines for the violation of these rules.
Punjab Municipal Solid
Waste Management
Guidelines
2011
A general guidance to the provincial government departments, local governments,
private operators and other agencies that initiate or operate any solid waste
management activity in urban areas.
Punjab Municipal Solid
Waste Management Act
(Draft)
2013
Provision of a system for the generation, storage, transport, collection, recovery,
treatment and disposal of waste which regulates and mitigates the adverse impacts
associated with the uncontrolled generation and disposal of waste in a manner that
promotes sustainable economic growth, social development and environmental
protection.
Obligation to apply for a licence and prohibits certain activities relating to waste
such as littering in any public place and burning of waste.
Establishment of the Punjab Waste Management Commission that shall cover
Preparation of a Provincial Waste Management Plan, Giving general or specific
directions to a Local Government, Proposal to the Government such as tariffs, rates,
fees, charges and penalties, and etc.
Every local government is responsible to prepare a Waste Management Plan.
This Act is still in the process of legislation.
2.8.2 Policies Related to Solid Waste Management
(1) Overview of National/Provincial Development Plan
There are three major development policies at national and provincial level. Though none of them
deals with solid waste management as a separate issue from sanitation/environment, all of them
briefly touch the issue. Thus, it can be said that improvement of solid waste management is in line
with the national and provincial governments’ policy.
Draft Final Report
Volume 1 Main Report
Project for Integrated Solid Waste Management
Master Plan in Gujranwala
72
CTI Engineering International Co., Ltd. NJS Consultants Co., Ltd.
EX Research Institute Ltd.
Vision 2030 (a)
Vision 2030 is the policy document that depicts the vision of the Pakistan Government to
realise Pakistan in 2030 in the world context. Its main objectives are as below:
To realise industrialised, prosperous, just and developed Pakistan through sustainable
development in a resource constrained economy by knowledge inputs; and
To be a middle income country with a GDP of around USD 4,000 by 2030.
Vision 2030 deals with solid waste management in the context of refuse recovery and
electricity generation strategies. In addition, it aims at strengthening urban management and
municipal services in universities including solid waste management.
Vision 2020 (b)
Vision 2020 is the policy document that depicts the vision of Punjab Government. It aims at
making Punjab Province fully literate, employed, skilled, tolerant, culturally sophisticated,
with world class infrastructure and modern centres, internationally connected and a healthy
society by 2020.
Its development plan encompasses areas of agriculture, manufacturing, poverty reduction,
improvement of public services delivery, governance and civil services reforms, infrastructure
improvement and education reforms.
Solid waste management is not considered as a separate issue; however, it is discussed under
the subsection of water supply and sanitation. Water supply and sanitation is discussed under
public health. It mentions that in order to improve public health condition it is important to
improve water and sanitation condition of the Province.
Punjab Development of Cities Act 1976 (c)
This Act was provided for the development of cities in the Punjab Province. Its objectives are
listed as follows:
To establish a comprehensive system of planning and development in order to improve
the quality of life in the cities of the Punjab;
To establish an integrated development approach and a continuing process of planning
and development;
To ensure optimum utilisation of resources, economical and effective utilisation of land;
and
To evolve policies and programmes, relating to education, water supply, sewerage,
drainage, solid waste disposal and matters connected therewith and incidental thereto.
The Act makes the City Development Authority responsible for preparing and implementing
environmental improvement schemes including solid waste disposal in cities. Solid waste
management is considered as a compulsory part of cities development of this act.
(2) Overview of National Policy
There are five (5) national policies related to solid waste management. The detail of each policy is
described in Volume 2, Supporting Report, Section G: Institutional Strengthening and
Organizational Restructuring, Subsection 2.2.1.
National Environmental Policy (2005) (a)
The National Environmental Policy (hereinafter referred to as “NEP”) was adopted in 2005 by
the Federal Government driven from the National Environment Action Plan (approved in 2001

Project for Integrated Solid Waste Management
Master Plan in Gujranwala
Draft Final Report
Volume 1 Main Report
CTI Engineering International Co., Ltd. NJS Consultants Co., Ltd.
EX Research Institute Ltd.
73
by Pakistan Environmental Protection Council). The NEP provides an overarching
framework for addressing the environmental issues facing Pakistan, particularly, pollution of
freshwater bodies and coastal waters, air pollution, lack of proper waste management,
deforestation, loss of biodiversity, desertification, natural disasters and climate change. It also
gives directions for addressing the cross-sector issues as well as the underlying causes of
environmental degradation and meeting international obligations. NEP addresses solid waste
management under Section 3.3, Waste Management. The purpose is to prevent and reduce
pollution caused by liquid and solid waste.
Guideline for Solid Waste Management (2005) (b)
The Guideline addresses the management of municipal solid waste and hazardous waste, i.e.,
above all hospital waste. The focus is on municipal waste.
According to the Guideline, the overall aim of the solid waste management strategy for
Pakistan is “to provide an effective, efficient, affordable, safe and sustainable solid waste
management system for all the urban and rural settlements in Pakistan.” The Guideline
suggests different options on different operational levels right from generation, primary
collection to disposal including capacity building of concerned department. Within the
Guideline, a strategy for solid waste management in Pakistan is proposed (Part A, Chapter 7).
National Sanitation Policy (2006) (c)
The National Sanitation Policy of Pakistan provides a broad framework and policy guidance to
the Federal Government, Provincial Governments, federally administered territories and the
local governments to enhance and support sanitation coverage in the country through
formulation of their sanitation strategies, plans and programmes at all respective levels for
improving the quality of life of the people of Pakistan and the physical environment necessary
for healthy life. The Policy envisions creation of an open defecation free environment with
safe disposal of liquid and solid waste and the promotion of health and hygiene practices in the
county.
National Drinking Water Policy (2009) (d)
The National Drinking Water Policy was approved in order to improve the quality of life of
people of Pakistan by reducing incidence of death and illness caused by waterborne diseases
through ensuring provision of adequate quantity of safe drinking water to the entire population
at an affordable cost and in an equitable, efficient and sustainable manner. While the Policy
does not address issues related to waste management, its policy guidelines can be applicable
for provision of waste management services.
National Climate Change Policy (2012) (e)
The National Climate Change Policy was established in 2012 to ensure that climate change is
mainstreamed in the economically and socially vulnerable sectors of the economy and to steer
Pakistan towards climate resilient development. The Policy addresses issues related to waste
management in the context of climate change mitigation in the energy field.
(3) Overview of Provincial Policy
There are two provincial policies related to solid waste management.
Punjab Urban Water Sanitation Policy (2007) (a)
The Punjab Urban Water Sanitation Policy was approved in 2007 with the vision of
“sustainable water and sanitation for all” to provide optimum quantity of water and sanitation

Draft Final Report
Volume 1 Main Report
Project for Integrated Solid Waste Management
Master Plan in Gujranwala
74
CTI Engineering International Co., Ltd. NJS Consultants Co., Ltd.
EX Research Institute Ltd.
services on a sustainable bases. In the same manner as the National Drinking Water Strategies,
the Punjab Urban Water Sanitation Policy does not directly deal with waste management
issues. However, its policy principles, such as community participation, social and
environmental considerations, environmental education, and so on are applicable to solid
waste management.
In addition, the following socio-economic instruments could serve as useful reference in light
of private sector involvement in solid waste management:
Performance-Based Financing: The Government of the Punjab and the cities will fund
water utilities based on performance-based incentive financing from its own resources
and from private sectors, which are sustainable and invested in sustainable systems;
Component Sharing: Water and sanitation projects will use internal and external
component sharing model for financing of community based interventions;
Need-Based Financing: The Government of the Punjab will fund water and sanitation
projects based on the accessibility to services and the condition of infrastructure in the
city;
PPP Contract: PPP mode of financing and management shall be used as an instrument to
facilitate capital investment, enhance efficiencies, expand the service areas and improve
accountability & quality of service delivery;
User charges: The tariff for provision should be linked to the actual cost of service
provision to ensure financial sustainability; and
Subsidies: Subsidies will be provided through lifeline tariff in the low income areas. To
enhance provision of water and sanitation services in low income areas, the differential
cost will be met through targeted subsidies.
Punjab Landfill Sites Policy (Draft) (2008) (b)
The Punjab Landfill Sites Policy was adopted in order to facilitate, guide and support local
governments in establishing proper landfill sites in the province based on the concept of waste
hierarchy that is waste reuse, reduction, recycling and recovery in the province. The Policy
provides an overarching framework that would address the legal, regulatory, institutional,
administrative, environmental issues and challenges faced by stakeholders. The goal of the
Policy is to protect environment, improve public health and to make cities clean by minimising
negative externalities associated with unregulated waste dumping, establishing and
strengthening the institutional arrangements for landfill site selection, development, operation,
maintenance and post closure, and improving the overall solid waste management system in
the cities by providing well managed sanitary landfill sites.
In line with other policies, the Punjab Landfill Site Policy of 2011 sets its policy principles
such as sustainable development, private sector participation and polluter pays principle. In
addition, attention is paid to economies of scale so that the Policy suggests various policy
measures to share the responsibility among the government of Punjab and local governments.
2.8.3 Organizations Related to Solid Waste Management
There are several organizations related to solid waste management at national, provincial, and local
government levels.
(1) Federal Government
The Planning and Devolution Division at federal level and Planning and Development Departments
at provincial level are responsible for the preparation of development plans and allocation of
financial resources. At the federal level the Ministry of Environment is responsible for the

Project for Integrated Solid Waste Management
Master Plan in Gujranwala
Draft Final Report
Volume 1 Main Report
CTI Engineering International Co., Ltd. NJS Consultants Co., Ltd.
EX Research Institute Ltd.
75
development of policies and programmes under the environmental scheme (Rules of Business 1973
Schedule II).
The Federal Government may, by notification in the official Gazette, make rules for carrying out
the purposes of the PEPA including rules for implementing the provisions of the international
environmental agreements, specified in the Schedule to the Act (PEPA Section 31). Making use of
this power, the Federal Government of Pakistan has enacted several rules in connection with waste
management and enforcement. The federal government has been empowered to levy pollution
charge on persons not complying with the NEQS.
The Pakistan Environmental Protection Agency (Pak-EPA) was established in 1984 under the
Environmental Protection Ordinance. Pak-EPA and the provincial EPAs are the main regulatory
bodies for the implementation of PEPA. In 1997 the Parliament passed the Environmental
Protection Act that repealed the Ordinance.
For carrying out the purposes of the PEPA, the EPA may, with the approval of the Federal
Government, make regulations according to the enumeration in Section 33 of PEPA. Regulation of
hazardous substances/wastes and introduction of public participation in EIA reviews are the topics
relevant to waste management.
(2) Provincial Government
Provincial EPA (a)
Every provincial government established a Provincial Environmental Protection Agency and
delegates powers and functions to them. Punjab EPA was established by Notification
No. S.R.O. 2151 (1) 98 to the Punjab EPA. The following is their responsibility concerning
waste management:
The powers and functions of review and approval of IEE/EIA and those on handling of
hazardous substances.
Provincial EPAs have been given statutory cover. Provincial EPAs can exercise powers
delegated to them by the respective provincial governments or the Pak-EPA. According to
PEPA Section 26, the Federal Government may delegate any of its or of the Federal Agency’s
powers and functions to any government agency of such Provincial Government or any local
council or local authority in the Province.
Under Section 16 of the 1997 PEPA, the Federal Agency or any Provincial Agency that is
satisfied that the discharge of any waste in violation of the provisions of the Act is likely to
occur or occurring are empowered to direct the responsible person to take necessary measures.
Pak-EPA and the provincial EPAs have been empowered to issue Environmental Protection
Orders to deal with an actual or potential adverse environmental effect following a violation of
the provisions of the Act. This may include immediate stoppage of pollution, installation of
pollution control devices and action for disposal of waste and restoration of environment.
Urban Unit (b)
The Urban Unit was established in 2006 as a Project Management Unit of the Planning and
Development Department, Government of the Punjab. In 2012, it was transformed into a
wholly government-owned company registered with the Securities and Exchange Commission
of Pakistan (SECP). The fields of operations mainly include urban planning, urban transport,
solid waste management, urban water and sanitation, geographic information systems (GIS),
urban property tax and land records as well as municipal finance.
The Solid Waste Management (SWM) Sector of the Urban Unit envisions developing and
formulating provincial policies, and legal and regulatory framework for solid waste

Draft Final Report
Volume 1 Main Report
Project for Integrated Solid Waste Management
Master Plan in Gujranwala
76
CTI Engineering International Co., Ltd. NJS Consultants Co., Ltd.
EX Research Institute Ltd.
management in the cities of Punjab. It aims at providing technical assistance to various local
governments and building their institutional capacity by imparting trainings and recruiting
professionals in the field of SWM. The sector on the whole, is committed to improving the
solid waste management practices in Punjab to make its cities the engines of growth and
sustainable development according to the Chief Minister’s vision.
(3) City District Government Gujranwala (CDGG)
The Gujranwala District Government was established under the devolution process that took place
in 2001 as the City District Government in 2005. The district comprises the following five areas
and Tehsils, and the city area and 34 union councils in Sadar area is the Project area:
City area (64 union councils)
Sadar area (39 union councils)
Noshehra Virkan Tehsil
Wazaribad Tehsil
Kamoke Tehsil
Besides, the City and Sadar area is administratively divided into the following four towns:
Aroop Town
Khiali Shahpur Town
Nandipur Town
Qila Didar Singh Town
City District Government Gujranwala (CDGG) is responsible for providing solid waste
management in the four Towns (City area and Sadar area). However, due to the budget constraint,
it is capable to provide the service in only 64 Union Councils (UCs) of the City. In the three
Tehsils, each Tehsil Municipal Administration is in charge of solid waste management.
The City District Nazim, assisted by the District Coordination Officer and the District Police
Officer, heads the CDGG. The District Coordination Officer (DCO), the highest ranking civil
servant in the City District Government, heads the executive branch of the district government. The
executive branch is divided into 7 departments and an Executive District Officer (EDO) heads each
department to carry out its function (see Figure 2.8.1). Before the declaration of the District as
City District, all functions under the Municipal Services category including solid waste
management were performed by the Teshil Municipal Administrations (TMAs). In 2005 when the
District Government Gujranwala declared a City District Government, solid waste management
function together with the staff became the responsibility of the CDGG.
Figure 2.8.1 Organizational Chart of CDGG as of March 2015
The solid waste management comes under the Municipal Services (MS) function in the City
District Government Gujranwala. The other functions of the MS department include Environment,
Spatial Planning and Commercialisation, and Transport. The MS department is headed by the
Executive District Officer (EDO) and the District Officer (DO) heads the sub-departments. The

Project for Integrated Solid Waste Management
Master Plan in Gujranwala
Draft Final Report
Volume 1 Main Report
CTI Engineering International Co., Ltd. NJS Consultants Co., Ltd.
EX Research Institute Ltd.
77
Solid Waste Management sub-department is responsible for solid waste collection, transportation
and disposal of the municipal waste to the final disposal site in four towns of Gujranwala (Aroop,
Khiali Shahpur, Nandipur and Qila Didar Singh). In other three outer teshils, solid waste is
managed by the respective
TMAs.
Figure 2.8.2 illustrates the
organizational structure of the
MS department. The shaded
parts show the Solid Waste
Management Department. The
District Officer is supported by
the chief sanitary inspectors and
assistant sanitary inspectors for
primary and secondary collection
of solid waste. Sanitary
supervisors supervise sanitary
workers in the field.
As for capacity development of
staff of CDGG, only 6 waste
managers received training programme by the Urban Unit specific to solid waste management
while Even EDO (MS) and DO (SWM) have never attended such programme. This shows the lack
of technical expertise of CDGG.
(4) Gujranwala Waste Management Company (GWMC)
Due to rapid urbanisation, waste management has become a major challenge and the Government
including CDGG realised that they could not manage increasing waste by themselves. In case of
Lahore, the City District Government Lahore outsourced sweeping, collection and transportation
three years ago in order to make it more efficient. Following the success of Lahore Waste
Management Company (LWMC), the Chief Minister of the Province of Punjab decided that this
model is to be replicated in the other major six cities of the Punjab Province; namely, Sialkot,
Faisalabad, Rawalpindi, Multan, Bahawalpur and Gujranwala. In this way, the Gujranwala Waste
Management Company (GWMC) was formed under the Company’s Ordinance Section 42 and
registered in July 2013. Actual Operation started in January 2014 as the Managing Director (MD)
was selected.
Figure 2.8.3 below illustrates the organizational structure of GWMC. Operational staff still
belongs to CDGG but under the supervision of MD of GWMC. Management staff of 45 personnel
is going to be hired to supervise 1,604 sanitary workers who are transferred from CDGG.
According to the Service and Asset Management Agreement (SAAMA), GWMC is responsible for
field work (actual provision of solid waste management service) in 64 UCs while CDGG is
responsible for monitoring of GWMC’s work as well as enforcement and enactment of rules and
regulations. In addition, CDGG aims at provision of solid waste management service in the
remaining 34 UCs in 4 towns if its budget allows.
The Contract between CDGG and GWMC is a service contract where:
Equipment is transferred from CDGG to GWMC and owned by GWMC.
Staff belonging to CDGG is placed at the disposal of GWMC.
Additional staff is hired directly by GWMC.
GWMC budget (including staff salary) is covered by CDGG.
Figure 2.8.2 Organizational Structure of the Municipal
Services of CDGG as of March 2015

Draft Final Report
Volume 1 Main Report
Project for Integrated Solid Waste Management
Master Plan in Gujranwala
78
CTI Engineering International Co., Ltd. NJS Consultants Co., Ltd.
EX Research Institute Ltd.
Figure 2.8.3 Organogram of Gujranwala Waste Management Company as of February 2015
Since GWMC is a new organization, it has several challenges to address. The first challenge is lack
of human resources. Since the establishment of GWMC, the hiring of management staff has been
ongoing. However, the first level of hierarchy has not been filled up yet; for example, general
managers and chief financial officer. This is because of: (a) lack of experts in SWM; and (b) strict
criteria of selection. These make it quite difficult to find qualified and/or capable staff in the market
at affordable compensation. Currently, MD is considering filling the positions by developing the
capacity of existing staff and promoting them to the higher positions. For this purpose, an
appropriate training system should be established.
Another challenge is lack of training system. The Management and Profession Development
Department of the Punjab Province is in charge of the provision of training. However, the training
course is only about general administrative issues and not specifically about solid waste
management. As a result, even the management staffs of GWMC and CDGG have not received any
training on solid waste management (only 6 waste managers have received training by UU). To
develop their human/institutional capacity, it is essential to provide such training especially for
management level staff. At the moment, GWMC is planning to have its own training programme
and has started needs assessment of each department.
The third challenge is lack of performance monitoring system. Although it is supposed to be
defined according to the SAAMA agreement, there is no performance indicator (KPI) to monitor
the performance of individual staff. CDGG as well as GWMC should start to work on setting KPI
as soon as possible. Together with performance monitoring system, it is also essential to introduce
incentive measures for staff based on their performance.
The final challenge is lack of financial independence from CDGG. For now, GWMC does not
collect any fee for collection of wastes, meaning there is no waste management related revenue.

Project for Integrated Solid Waste Management
Master Plan in Gujranwala
Draft Final Report
Volume 1 Main Report
CTI Engineering International Co., Ltd. NJS Consultants Co., Ltd.
EX Research Institute Ltd.
79
Thus, CDGG transfers its budget from the Provincial government to GWMC. In order to establish
financial independence of GWMC from CDGG, it is required to secure its own budget by imposing
waste collection fees and tipping fees as currently discussed by UU and LWMC. Otherwise, one of
the advantages of private sector involvement, which is relative freedom from political interference
cannot be assured.
The capacity of CDGG and GWMC under the status quo is sumarrised in Volume 2, Supporting
Report, Section G: Institutional Strengthening and Organizational Restructuring, Table G.2.2.
2.8.4 Review of Past and Present Plans and Projects Related to Solid Waste
Management
(1) Review of Past Foreign Aided Projects Related to Solid Waste Management
Past and present plans and projects related to solid waste management in Punjab Province are listed
below according to donor, namely; the Government of Japan, the Asian Development Bank and the
World Bank. The detail of each plan is described in Volume 2, Supporting Report, Section G:
Institutional Strengthening and Organizational Restructuring, Subsection 2.4.1.
Government of Japan
Improvement of Garbage Collection and Disposal in Rawalpindi City
(1996)
Dispatch of Short-Term Expert on Solid Waste Management (2002)
Dispatch of Long-Term Expert on Municipal Waste Management (2003-2005)
Project for Solid Waste Management in Pakistan (2005-2006)
Capacity Building for Solid Waste Management (2006-2009)
Data Collection Survey on Solid Waste Management in Punjab Province (2009-2010)
Asian Development Bank (ADB)
Southern Punjab Basic Services Project (2005-2009)
Rawalpindi Environment Improvement Project (2006-2011)
The World Bank (WB)
Punjab Municipal Services Improvement Project (2006-2010)
KOICA-World Bank Joint Study on Solid Waste Management in Punjab (2006-2007)
(2) Institutions for Private Sector Involvement in Solid Waste Management
Although currently there is no private service provider of solid waste management in Gujranwala,
the provincial government has taken initiative of private sector involvement. This is mainly
because of the lack of capacity of local governments to catch up with the dramatic urbanisation and
drastic increase of waste volume of cities.
Laws and Regulations Related to Private Sector Involvement (a)
Major laws and regulations related to private sector involvement in Pakistan are as follows,
and the detailed remarks are described in Volume 2, Supporting Report, Section G:
Institutional Strengthening and Organizational Restructuring, Table G.2.3.
Pakistan Policy on Public-Private Partnership (2010)
Protection of Economic Reforms Ordinance (1999)
Companies Ordinance (1984)

Draft Final Report
Volume 1 Main Report
Project for Integrated Solid Waste Management
Master Plan in Gujranwala
80
CTI Engineering International Co., Ltd. NJS Consultants Co., Ltd.
EX Research Institute Ltd.
Labour Policy (2010)
Punjab Procurement Rules (2014)
Examples of Private Sector Involvement in Solid Waste Management in (b)
Punjab Province
There are private sector involvement projects/programmes in the Punjab Province, as listed
below. The detailed descriptions of each project are described in Volume 2, Supporting
Report, Section G: Institutional Strengthening and Organizational Restructuring, Table
G.2.4.
Tehsil Municipal Administration Gujrat
Lahore Sanitation Programme
Cantonment Board Lahore
Chaklala Waste Management, Rawalpindi
Lahore Compost Plant
Metropolitan Corporation Lahore (MCL)
Lahore Waste Management Company (LWMC) (c)
Another example of private sector involvement can be seen in the City District Government
Lahore (CDGL). CDGL established LWMC under Section 42 of the Companies Ordinance of
1984 on 19 March 2010. The company is limited by guarantee having no share capital and is
formed not for profit within the context of Section 42 of the Companies Ordinance. The
LMWC is governed by a Board of Directors, headed by a Chairman. The organogram of
LWMC is given in Volume 2, Supporting Report, Section G: Institutional Strengthening
and Organizational Restructuring, Figure G.2.4. (The budgetary status is not yet provided
by LWMC.). The company was formed in order to meet the demand of institutional innovation
such as:
To have financial and administrative autonomy for quick decision-making;
To exercise corporate governance and professional approach;
To improve human resource and financial management; and
To ensure transparency, accountability and public disclosure.
According to the Services and Asset Management Agreement (SAAMA) between CDGL and
LWMC, all the functions and assets of the SWM department of CDGL and the TMAs have
been entrusted to LWMC. LWMC aims to develop an integrated system of solid waste
management to ensure efficient collection, transportation, recovery, treatment and disposal of
wastes generated in Lahore. The detailed discussion is made in Volume 2, Supporting Report,
Section G: Institutional Strengthening and Organizational Restructuring, Subsection 2.4.2.
Analysis and Recommendation on Private Sector Involvement (d)
From the above-mentioned examples, factors for success and failure of private sector
involvement can be summarised as shown in Table 2.8.3.

Project for Integrated Solid Waste Management
Master Plan in Gujranwala
Draft Final Report
Volume 1 Main Report
CTI Engineering International Co., Ltd. NJS Consultants Co., Ltd.
EX Research Institute Ltd.
81
Table 2.8.3 Factors for Success and Failure of Private Sector Involvement
Success Failure
Capacity of the private sector partner must be
compatible to undertake the proposed project.
Proper planning and design of the project is the
key to success of any PSP model.
Appropriate machinery and manpower.
Strict and vigilant monitoring.
Time Management.
A motivated team of workers.
Involvement of key stakeholders.
Community support.
Support of the local government.
A good customer service system with a
complaint cell.
Public Awareness Campaigns.
Lack of capacity.
Lack of Standard Operation Procedures (SOPs).
Contracts are drawn out without any legal or
regulatory bindings.
There is no penalty clause in PSP Model.
Weak political support.
Resistance and non-cooperation from the
community.
No implementation of Local Government
ordinances/laws.
Appropriate and efficient technologies are
required to bring about positive changes.
Whereas expensive machinery causes financial
burden in terms of costs and maintenance of
such machines.
Corrupt practices in all local governments.
Lack of transparency.
From the above analysis, the following recommendation could be drawn:
Collection
Door-to- door collection is the most efficient and effective method for the collection of
waste. For this purpose, handcarts, mini-dumpers and even donkey carts can be used to
bring the waste to transfer points.
Garbage bags can be distributed if the community is willing to pay for them, or they can
use any shopping bag for the disposal of daily waste.
The door-to-door collection can be privatised to a private sector partner under the
management. Waste collection areas where a private sector could operate may be
contracted or franchised and be allowed to collect fees negotiated with the community.
The door-to-door collection should be limited to not more than 200 households per
vehicle.
Transportation
Once the waste reaches the designated transfer point, the private sector may again be
contracted for the transportation of waste from the transfer station to the disposal point.
The private sector could enhance its capacity by using larger vehicles.
Disposal
Alternate solutions are now in vogue such as Material Recovery Facility (MRF) where
recyclable materials are sorted out before the waste is transported to the landfills.
Composting plants can cater for the organic component of the waste by recycling into
compost.
Some studies are being conducted into biomass energy, Refuse Derived Fuels (RDF) and
bio mechanisations on the same principles as that being conducted in India.
Use 3R approach to minimise the amount of waste being transported to the landfill sites.

Draft Final Report
Volume 1 Main Report
Project for Integrated Solid Waste Management
Master Plan in Gujranwala
82
CTI Engineering International Co., Ltd. NJS Consultants Co., Ltd.
EX Research Institute Ltd.
(3) Institutions for Community Participation in Solid Waste Management
Types of Organization (a)
In Gujranwala, there are two types of civil organizations; namely, Community-Based
Organization (hereinafter referred to as “CBO”) and Non-Governmental Organization
(hereinafter referred to as “NGO”. CBO is a group of volunteers for specific purposes while
NGO is a group with common interest registered under the Social Welfare Act. Both are also
called generally as Civil Society Organization. There used to be another type of group called
Citizen Community Board (hereinafter referred to as “CCB”). CCB is defined under the
Punjab Local Government Ordinances of 2011 and is a coordination group between
government and residents. Eighty percent (80%) of its budget is from government and 20% is
from the residents. There used to be 827 CCBs but 750 CCBs were abolished due to budgetary
constraints of the government. As of January 2015, only 77 CCBs were operating although no
official records exist in terms of their current activities.
Door-to-Door Collection of Solid Waste Management Project, Union Council (b)
No. 8, Shahinabad, Gujranwala
Currently there is no CBO or NGO working in the area of solid waste management. However,
there used to be the pilot project implemented by a CCB called the OPE Development Citizen
Community Board, which was registered under the Social Welfare Department with the aim to
improve solid waste collection in UC No. 8. Its project area was UC No.8 with the population
of 22,000 people. The UC includes the following areas:
Samnabad
Gaoshala
Block B, C, D, Shaheen Abad
Muhalla Insariyan
Javed Town
Mirza Colony, etc.
CDGG aimed at providing people with basic health and sanitation facilities. Thus CDGG in
collaboration with OPE started the door-to-door collection project with the main purpose of
making UC No.8 a model of clean UC where waste is collected on daily basis from the
households.
The responsibilities of each party, CDGG and OPE, are as follows:
CDGG
To provide containers for waste collection in UC No.8;
To provide secondary collection on daily basis to disposal site;
To provide door-to-door collection and to ensure cleanliness of drains and streets; and
To provide technical assistance to OPE during the project.
OPE
To inspect the project on daily, weekly and monthly basis;
To provide 12 private sanitary workers for UC No.8.
To ensure attendance of sanitary workers;
To supervise the work performed by the sanitary workers to ensure door-to-door
collection;

Project for Integrated Solid Waste Management
Master Plan in Gujranwala
Draft Final Report
Volume 1 Main Report
CTI Engineering International Co., Ltd. NJS Consultants Co., Ltd.
EX Research Institute Ltd.
83
To procure 6 motorbike carts for the collection of waste;
To prepare and submit monthly inspection reports of cleanliness to EDO (MS) and DO
(SWM);
To make arrangements with the involvement of residents of UC No. 8 on the mobilisation
of UC NO. 8 seminars and group discussions (community, schools, mosques);
To be responsible for the printing of all materials necessary for the project;
To address any and all complaints regarding the project in UC No.8.
To bear the maintenance and petrol charges of motorbike carts
To be able to charge Rs.50 per household only after 6 months of free service period;
Although this was the first and the last project which involved public participation in solid
waste management, the project was considered as a failure since only 25% of the population
paid the collection fee. In addition, the DCO at that time forced OPE to collect waste from
households whether or not the households pay the collection fee. This action was unfair to the
25% of households that paid the collection fee. The reason of the failure can be summarised as
follows:
People were unwilling to pay for the SWM services;
CCB did not have enforcement power;
Mechanism of collection might not have been effective; and
Policy was not consistent enough to support CCB activities.
2.8.5 Evaluation of Institutional Strengthening and Organizational Restructuring
The problems and issues in relation to institutional strengthening and organizational restructuring under
the current situation are summarised in Table 2.8.4. These items will be the basic elements to develop
the plans, programmes and projects to comprise the institutional strengthening and organizational plan
in the Integrated Solid Waste Master Plan in Gujranwala.
Table 2.8.4 Identification of Problems and Issues on Institutional Strengthening
and Organizational Restructuring
Problem Description of Problem Issues for Solving the Problems
1. Difficulty to understand and comply with laws and regulations
There is no comprehensive law on Solid Waste Management in Gujranwala that is understandable to officials and residents.
In addition, regulations are written only in English so that most of the residents cannot read them. CDGG/GWCM has not implemented any awareness raising activity on SWM rules that residents should follow.
Currently, the committee concerned in the Punjab Province is drafting a by-law, referring to the Indian Municipal Solid Waste Management Rules (Draft) (2013). This by-law should integrate the latest version of laws and regulations related to SWM in the Punjab Province, so that it becomes one single comprehensive by-law to comply with.
In order to make residents understand and comply with the by-law, it is advisable to translate and interpret it in Urdu and implement awareness raising activity on SWM rules.
2. Lack of management staff (especially managers)
There is a high vacancy rate in managerial level. All four manager positions are still vacant due to difficulty to recruit suitable persons. As a result, there is too much burden on MD and the Company Secretary.
In order to attract human resources with adequate expertise on solid waste management, the working environment must be attractive enough. Therefore, it is advisable to introduce the following systems:
• Performance Based Salary;
• Provision of Incentives such as monthly award for outstanding performance;
• Gifts and incentives on Eid and Christmas holidays;
• Rationalisation of working hours: work in three shifts without extra burden;
• Provision of social welfare and old age benefits to secure the minimum quality of life of workers;
3. Lack of expertise of technical staff
Technical staff does not have enough expertise and are not required to have any qualification. As a result, there is a lack of reliable data and improper management and maintenance of vehicles and equipment. Therefore, GWMC cannot provide efficient waste management services.
In addition, there is no institutional arrangement among technical staff, resulting in ambiguous reporting line.

Draft Final Report
Volume 1 Main Report
Project for Integrated Solid Waste Management
Master Plan in Gujranwala
84
CTI Engineering International Co., Ltd. NJS Consultants Co., Ltd.
EX Research Institute Ltd.
Problem Description of Problem Issues for Solving the Problems
and
• Health screening and other facilities.
In addition, in order to develop the capacity of CDGG/GWMC staff continuously, it is essential to provide training regularly. Training modules are further discussed in Volume 2, Supporting Report, Section G: Institutional Strengthening and organizational Study.
4. Lack of financial independence of GWMC from the government
Since the GWMC budget (including staff salary) is covered by CDGG, it is difficult to get funds at the right time. In addition, technical staff such as sanitary workers still belong to CDGG and impossible to lay-off as GWMC needs. This means that GWMC cannot allocate staff flexibly
In order to achieve financial independence from CDGG, it is necessary to introduce user charge. For this purpose, it is quite important to raise awareness of residents and to increase the willingness to pay. As for the technical staff transfer, it is usually difficult to simply transfer them from the public sector (CDGG) to the private sector (GWMC) due to several reasons such as social welfare. Thus, it is recommended to decrease CDGG technical staff gradually as they retire and outsource the service to the contractor.
5. Too high cost of outsourcing compared to direct service
It is difficult to involve the private sector due to the small market size and immature local private sector.
In Gujranwala, direct service (GWMC service) cost is much cheaper than outsourcing cost (800PKR/3500PKR). This is because the market is too small for economy of scale to function. It is also because the local private sector in SWM is still immature and results in outsourcing to Lahore/international contractor.
In order to improve efficiency, it is also advisable to introduce outsourcing of collection and transportation service. In 2025, the population of Gujranwala is estimated to be big enough for economy of scale to work and for the private sector to make profit. By this time, outsourcing cost will decrease as the technologies are localised such as production of machinery and equipment.
6. Extremely low acceptance of new SWM system
There is a quite serious lack of understanding of residents on SWM. Most of them take SWM service as free of charge. This leads to quite low willingness to pay and possible strong resistance to introduce user charge.
It is necessary to raise awareness of residents on a long-term basis. The emphasis should be given to the financial aspect in order to raise understanding on SWM cost and responsibility of each stakeholder. In order to facilitate the process, GWMC should provide good service enough for residents to appreciate the service.
2.9 Hospital, Industrial, and Construction and Demolition Waste Management
2.9.1 Current Situation of Hospital Waste
(1) Category of Hospital Waste
According to the Punjab Environmental Protection Act (PEPA) of 2012 Clause 2. Definitions,
(xxi), “hospital waste”, includes waste medical supplies and materials of all kinds, and waste blood,
tissue, organs and other parts of human and animal bodies from hospitals, clinics and laboratories.
The difference between “hospitals” and “clinics” in Pakistan is generally thought to be as follows:
A clinic is a health care facility that is primarily devoted to the care of outpatients. Clinics can be
privately operated or publicly managed and funded, and typically cover the primary health care
needs of populations in local communities. Clinics usually do not have the facility to admit the
patients for overnight stays in contrast to hospitals which offer specialised treatments and admit
inpatients for overnight stays.
“Hospital waste” used in this report, however, means waste generated from both “hospitals” and
“clinics”, and other medical facilities as clearly described in the preceding PEPA, and this term is
generally used in the rules and regulations in Pakistan. On the other hand, “municipal waste”
includes sewage, refuse, garbage, waste from abattoirs, sludge and human excreta and the like
(Clause 2. Definitions, (xxviii), PEPA, 2012).

Project for Integrated Solid Waste Management
Master Plan in Gujranwala
Draft Final Report
Volume 1 Main Report
CTI Engineering International Co., Ltd. NJS Consultants Co., Ltd.
EX Research Institute Ltd.
85
According to the Hospital Waste Management Rules of 2005, “infectious waste” means waste
contaminated by any type of pathogens such as bacteria, viruses, parasite or fungi and includes
cultures from laboratory works, waste from surgeries, autopsies, and waste from infected patients,
discarded or disposable materials and equipment which have been in contact with such patients and
infected animals from laboratories. Also, according to Hospital Waste Management Rules 2005,
Section 3; every hospital shall be responsible for the proper management of waste generated by it
till its final disposal in accordance with the provisions of the Act and Rules 16 to 22.
Hospital waste includes both risk and non-risk waste. Risk waste means infectious waste,
pathological waste, sharps, pharmaceutical waste, genotoxic waste, chemical waste and radioactive
waste. Sharps include whether infected or not, needles, syringes, scalpels, infusion sets, saws,
knives, blades, broken glass and any other item that could cut or puncture. Non-risk waste includes
paper and cardboard, packaging, food waste and aerosols and like. Figure 2.9.1 shows the flow
diagram of hospital waste.
Figure 2.9.1 Flow Diagram of Hospital Waste
(2) Current Situation
There is the District Headquarters
(hereinafter referred to as “DHQ”) in
Gujranwala and it is the main medical centre
of the Government. Instead of DHQ,
government dispensaries, basic health units
(hereinafter referred to as “BHUs”), rural
health centres (hereinafter referred to as
“RHCs”) and mother care health (hereinafter
referred to as “MCH”) are present in urban
and peri-urban union councils of Gujranwala
(government side). In peri-urban areas,
private hospitals are few as compared to
clinics. Unfortunately DHQ does not even
have up to date data regarding the number of
clinics and hospitals at present in Gujranwala City and in the peri-urban area especially for the
private medical facilities. The JICA Project Team visited every UC of the urban and peri-urban
areas and updated the database regarding the number of medical facilities. As a result of the site
survey, the total number of medical facilities in Gujranwala is 1,372: 844 in urban (62%) and 528 in
peri-urban (38%) as shown in Figure 2.9.2. The detailed results are presented in Volume 2,
Supporting Report, Section I: Hospital, Industrial, and Construction and Demolition Waste
Management, Subsection 2.1.1.
Figure 2.9.2 Percentage of Medical Facilities in Urban
and Peri-Urban Area of Gujranwala

Draft Final Report
Volume 1 Main Report
Project for Integrated Solid Waste Management
Master Plan in Gujranwala
86
CTI Engineering International Co., Ltd. NJS Consultants Co., Ltd.
EX Research Institute Ltd.
Since hospital waste (risk and non-risk) is not the responsibility of GWMC, the medical facilities
adopted the self-collection and disposal systems. Currently the DHQ gives their waste to A.T.
Waste Management, a Lahore based private company, which had installed an incinerator at Kasur
City located 120km south of Gujranwala City. A.T. Waste Management has signed around 40
contracts with hospitals and clinics, and charges them in accordance with the waste produced. Only
the large scaled private hospitals have signed a contract with A.T. Waste Management. The
hospitals that have signed a contract with A.T. Waste Management have dust bins with different
colour-coded bags and separate boxes (for sharps) in each room (See Photo 2.9.1). A.T. Waste
Management’s truck visits with the Gujranwala twice a week. Therefore, in almost all the
contracted hospitals a store room is present where they store the medical waste for 3 days as the
collection truck visits Gujranwala only two times a week, i.e., Tuesday and Friday (See Photo
2.9.2).
The unit fee under the contract with A.T. Waste Management is different among the hospitals and it
ranges between 7 and 100 Rs./kg of medical waste. It neither depends on the number of beds nor
kilogram of waste produced but perhaps on the hospital size and popularity. If the hospital is large
in scale, it pays higher than the small scale hospitals.
There is no planning or set mechanism for the management of risk waste at the city or district level;
for example, even in the District Head Quarter Hospital with 455 beds, which leads to huge quantity
of risk waste per month. This hospital is one of the major hospitals in the whole district but still
does not have any incineration or sterilisation unit.
All other government medical facilities like RHCs and BHUs, government dispensaries and MCH
dig a pit, dispose all the risk wastes into the pit and burn them. This practice is modified every 3 or
4 days. They give the non-risk waste to the municipal corporation workers since GWMC does not
provide services in peri-urban areas.
Representatives of BHU informed the JICA Project Team during the survey that the District Health
Office does not provide any budget for the collection of waste (e.g., separate collection in different
coloured bags) and disposal of risk waste. Although a few clinics signed an agreement with the
A.T. Waste Company, all wastes generated from small and large clinics and also some of the
hospitals, are mixed with municipal waste which is a major risk to sanitary workers. This mixture of
waste is further mixed with the contents of GWMC containers and in peri-urban areas and thrown
into low-lying areas or open plots where they are picked up by the waste pickers and treated as
recyclable material. It was also observed that in some hospitals and clinics, sanitation staff is
involved in the selling of risk waste to the recyclable dealers. Sanitary staff of medical facilities
does not have enough training about the hazardous nature of risk waste and they do not bother to
use any personal protective equipment while sweeping wastes.
Photo 2.9.1 Colour-coded Bags for Waste at
a Hospital
Photo 2.9.2 Storeroom for Waste at
a Hospital

Project for Integrated Solid Waste Management
Master Plan in Gujranwala
Draft Final Report
Volume 1 Main Report
CTI Engineering International Co., Ltd. NJS Consultants Co., Ltd.
EX Research Institute Ltd.
87
The JICA Project Team and GWMC have visited all the urban and peri-urban UCs to make a
comprehensive and updated database regarding the number of medical facilities in each UC and
then further visited 32 medical facilities, DHQ, 13 private hospitals, 10 clinics, 4 BHUs (1 in each
town), 2 dispensaries, 1 RHC and 1 MCH in all towns of Gujranwala to know about the current
waste generation, collection and disposal practices. The results of interviews with 32 medical
institutions are summarised in Volume 2, Supporting Report, Section I: Hospital, Industrial, and
Construction and Demolition Waste Management, Table I.2.2.
From BHUs, the risk waste (also called infectious waste) generated is approximately
30-60 kg/month, from RHC 75 kg/month and from MCH 30 kg/month. On the other hand,
infectious waste from clinics is 15-225 kg/month. The DHQ produces infectious waste of
approximately 1,000 kg/month. The other private hospitals produce infectious waste in the range
of 15 to 1,230 kg/month. The hospitals located in peri-urban areas produce less infectious waste
since the number of patients visiting peri-urban hospitals are less.
Roughly, the overall risk waste produced by all 32 medical facilities is estimated at more than
6,000 kg/month and non-risk waste is more than 7,000 kg/month. Based on the survey, the total
generated amount of hospital waste in Gujranwala could be roughly estimated at 200 tons/month.
The breakdown is that 120 tons/month is for risk waste and 80 tons/month is for non-risk waste.
2.9.2 Current Situation of Industrial Waste
(1) Category of Industrial Waste
According to the Punjab Environmental Protection Act (PEPA) 2012, Clause 2. Definitions, (xxiii),
“Industrial Waste” means waste resulting from an industrial activity.
“Industrial Activity” means any operation or process for manufacturing, making, formulating,
synthesising, altering, repairing, ornamenting, finishing, packing or otherwise treating any article
or substance with a view to its use, sale, transport, delivery or disposal, or for mining, for oil and
gas exploration and development, or for pumping water or sewage or for generating, transforming
or transmitting power or for any other industrial or commercial purpose. (Clause 2. Definitions,
(xxii), PEPA, 2012)
“Municipal waste” includes sewage, refuse, garbage, waste from abattoirs, sludge and human
excreta and the like (Clause 2. Definitions, (xxviii), PEPA, 2012).
Industrial entities are responsible for disposing their waste properly. According to PEPA
Clause 11, no person shall discharge or emit or allow the discharge or emission of any effluent or
waste or air pollutant or noise in an amount, concentration or level which is in excess of the
National Environmental Quality Standards. The Federal Government may levy pollution charges
on any person who contravenes or fails to comply with the provisions.
In Pakistan, construction and demolition waste (hereinafter referred to as C&D waste) is not under
the category of industrial waste. In other countries construction is done by private construction
companies but in Gujranwala no such trend of construction companies is seen. Mostly, people
construct their houses on their own or hire workers. Legally, GWMC is not bound to deal with
C&D waste but the general trend in Gujranwala is that people throw C&D waste in the streets and
roadsides and as its mandate, GWMC is to clean the city. Therefore, GWMC collects the C&D
waste as well. Detail discussion on C&D waste is in Subsection 2.9.3.
Industrial waste may be toxic or not depending on the nature of waste. Figure 2.9.3 shows the flow
diagram of industrial waste.

Draft Final Report
Volume 1 Main Report
Project for Integrated Solid Waste Management
Master Plan in Gujranwala
88
CTI Engineering International Co., Ltd. NJS Consultants Co., Ltd.
EX Research Institute Ltd.
Figure 2.9.3 Flow Diagram of Industrial Waste
(2) Current Situation
Gujranwala is the commercial and industrial centre of Pakistan. It is playing a major role in
supporting Pakistan’s economy. Gujranwala is the main centre of electrical and engineering goods
manufacturing industries in Pakistan, including domestic utensils, home appliances, gas
appliances, and various types of electrical/industrial machinery.
According to the Gujranwala Chamber of Commerce and Industry (GCCI) report, almost
15,000 units are operating as cottage industry (small-scaled home-based units); however, waste
generated from this industry can be negligible because the amount is minimal and mostly
discharged mixed with the other municipal waste. Apart from the cottage industry, therefore, the
site survey for industrial waste was conducted by JICA Project Team by focusing on much larger
scale industries. As a result of the survey, although about 75% of the industries did not cooperate at
all despite the letter-request for cooperation from GCCI, it is identified that approximately 4,000
units are located in 64 urban union councils of Gujranwala and approximately 240 industries are
situated in peri-urban area of Gujranwala. Industries that are registered with GCCI have a National
Tax Number (NTN) and are taxpayers to FBR (Federal Board of Revenue). The detailed results of
the survey are presented in Volume 2, Supporting Report, Section I: Hospital, Industrial, and
Construction and Demolition Waste Management, Subsection 2.1.2.
There are three Small Industrial Estates (hereinafter referred to as “SIE”) in Gujranwala. SIE is
defined as a piece of land notified as industrial area by the government. The government allots plots
in the industrial estate. All the industries in this SIE are taxpayers. Figure 2.9.4 shows the locations
of SIEs.
Major factories surveyed are from 20
different lines of production; namely,
Ceramics, Chemicals, Crushing,
Food, Foundry works, Furniture, Gas
appliances, Home appliances,
Marble, Medicine, Metal works,
Packaging, Plastic products,
Recycling of metals, Rubber works,
Sanitary works, Soap making, Spare
parts making, Textile and Utensil
manufacturing. In Gujranwala the
practice of recycling is very common
in industries. All of the scrap is
reused or recycled within the same
Figure 2.9.4 Location Map of Small Industrial Estates
(SIEs)

Project for Integrated Solid Waste Management
Master Plan in Gujranwala
Draft Final Report
Volume 1 Main Report
CTI Engineering International Co., Ltd. NJS Consultants Co., Ltd.
EX Research Institute Ltd.
89
industry or in another industry as described in Subsection 2.5.1, Item (3). The results of the
interviews are as shown in summarised in Volume 2, Supporting Report, Section I: Hospital,
Industrial, and Construction and Demolition Waste Management, Table I.2.4.
Some industries prefer to buy their raw materials from third parties instead of the scrap dealers
because the cost is cheaper, although they know that third parties also gain profit from the sale.
There is no separate collection, storage, and disposal for hazardous waste. The industrial waste is
mostly in the form of combustion residue produced from foundries, ceramics industries and
sanitary works; slag is produced from chemical manufacturing, battery recycling and sanitary
works; dust is produced from stone grinding, marble industry, ceramics industry and pottery works;
paper and cardboard is produced from food industry, pharmaceuticals, paper mills and textiles.
Scrapped metal is produced from gas appliances industry, metal works, utensils, sanitary works and
spare parts making industry, and this scrapped waste is recycled and reused not wasted. Wastewater
mostly is from packaging industries, soap mills, chemical-making, textile, and marble. Currently,
both industrial and municipal wastes are disposed by the industrial establishments by themselves.
There is no treatment of solid waste in industries; even wastewater is discharged into main drains
without treatment.
It was noted that industries take their raw materials either from dealer shops present in Gujranwala
or import them from other nearby cities as it depends upon their demand. During the survey it was
observed that a majority of the waste from industries is either recycled, reused or sold and only a
small portion of combustible residues are wasted. The common practice of disposing their waste is
open dumping along the road and in vacant spaces. Only few industries dispose their waste to the
GWMC containers.
2.9.3 Current Situation of Construction and Demolition Waste
(1) General
The management plan of construction and demolition waste (C&D waste) is not a part of the
components of this Master Plan formulation because C&D waste is categorised into industrial
waste in general and the Gujranwala Waste Management Company (GWMC) is legally not bound
to deal with the C&D waste. In order to improve the cleanliness of Gujranwala City, however,
GWMC is actually collecting C&D waste from its jurisdiction (i.e., 64 Union Councils). GWMC
signed an agreement with the Lahore Waste Management Company (LWMC) for providing
consultancy to GWMC in June 2014. The C&D waste management plan is also a part of that
agreement. This subsection summarises the present situation of C&D waste based on the report of
LWMC.
(2) Source of C&D Waste
According to the C&D waste management plan provided by LWMC to GWMC, definition and
sources of C&D waste are listed in Table 2.9.1.
C&D waste is generated whenever any construction and demolition activity takes place such as
construction of roads, underpass, flyover, bridges, plaza, remodelling, etc. It consists of inert and
bio-degradable material such as concrete, plaster, metal, plastics, bricks, etc. A part of this waste
goes to the municipal streams.
Table 2.9.1 Sources of C&D Waste Generated in Gujranwala
Activities Sources
Construction Activities Renovation/construction of residential flats, homes, villas and compounds
Public development projects by Town Municipal Administration (TMA),
Highway Department, Construction & Work Department, Gujranwala

Draft Final Report
Volume 1 Main Report
Project for Integrated Solid Waste Management
Master Plan in Gujranwala
90
CTI Engineering International Co., Ltd. NJS Consultants Co., Ltd.
EX Research Institute Ltd.
Activities Sources
Development Authority, etc.
Private construction projects by private housing authorities
Demolition Activities Commercial buildings, plazas, shopping centres
Government anti encroachment drives
Renovation of private homes
Source: Lahore Waste Management Company, Final Report on Construction and Demolition Waste Management Plan for Gujranwala, November 2014, page 10.
(3) Composition of C&D Waste
Gujranwala City is experiencing rapid urbanisation and industrialisation that results in increase of
construction activities. C&D waste due to uncontrolled and unregulated civil works is thrown
usually on roadsides, footpaths, vacant plots, parks, around waste storage containers etc.
According to the LWMC C&D waste plan, percentage of C&D waste generated is mentioned as,
excavated soil/rubble waste generated is about 49 tons per day (35%), concrete waste as 44 tons per
day (31%), bricks/ masonry pieces as 30 tons per day (21%), road scrap material as 13 tons (9%),
ceramic tiles as 6 tons per day (4%), metals as 0.14 tons per day each (0.1%) and no wood
component is found in C&D waste. However, this estimation made a fatal mistake because the
percentage using estimation of the total C&D waste amounts comes from the ratio of
non-combustible waste as a result of the waste amount and composition survey in this Project.
There is obvious difference between C&D waste and non-combustible waste. To estimate the C&D
waste generation in Gujranwala, another special survey exclusively for this purpose is required.
(4) Quantification of C&D Waste
According to field surveys conducted by the LWMC team, 46 sites were identified in Gujranwala
City containing C&D waste with estimated quantity of 3,555 tons. It seems to be accumulated
amount on roads and vacant plots estimated based on a visual observation at the sites.
(5) Collection and Transportation, and Disposal of C&D Waste
Currently there is no proper system for C&D waste collection and transportation in Gujranwala.
C&D collection arrangements are made by the generator. C&D waste generator hires the services
of donkey carts or tractor trolleys depending on quantum of waste. The contractor simply collects
the waste and unloads into vacant plots, low lying areas or in waste storage container placed in the
vicinity and get mixed with municipal solid waste.
C&D waste is collected by GWMC and is openly dumped at Gondlanwala site along with
municipal solid waste. The waste collected by private contractor is dumped in depression/low lying
areas located in the vicinity of the city.
(6) Legal Situation Analysis
There is no regulation in place that directly concerns construction and demolition waste in Pakistan.
Even District Government has not drafted/notified any by-laws for solid waste management in
Gujranwala. Current regulations covering C&D waste are “Building and Zoning” Regulations,
2008 of Gujranwala Development Authority (GDA). These regulations only define demolition
activity. According to GDA regulations-2008, Chapter 8 and 9 dealt with “Builder’s Obligation”
and “Role and Responsibility” and cleary state that the builder shall be responsible for the disposal
of debris/waste from construction site to the waste disposal site (Clause 9.2.1 (iii) f.), and also that
the builder shall be responsible to restore the area in front of his/her plot after construction, as
prescribed by the District Government site (Clause 9.2.1 (iii) g.). The detail of the leagi situation is
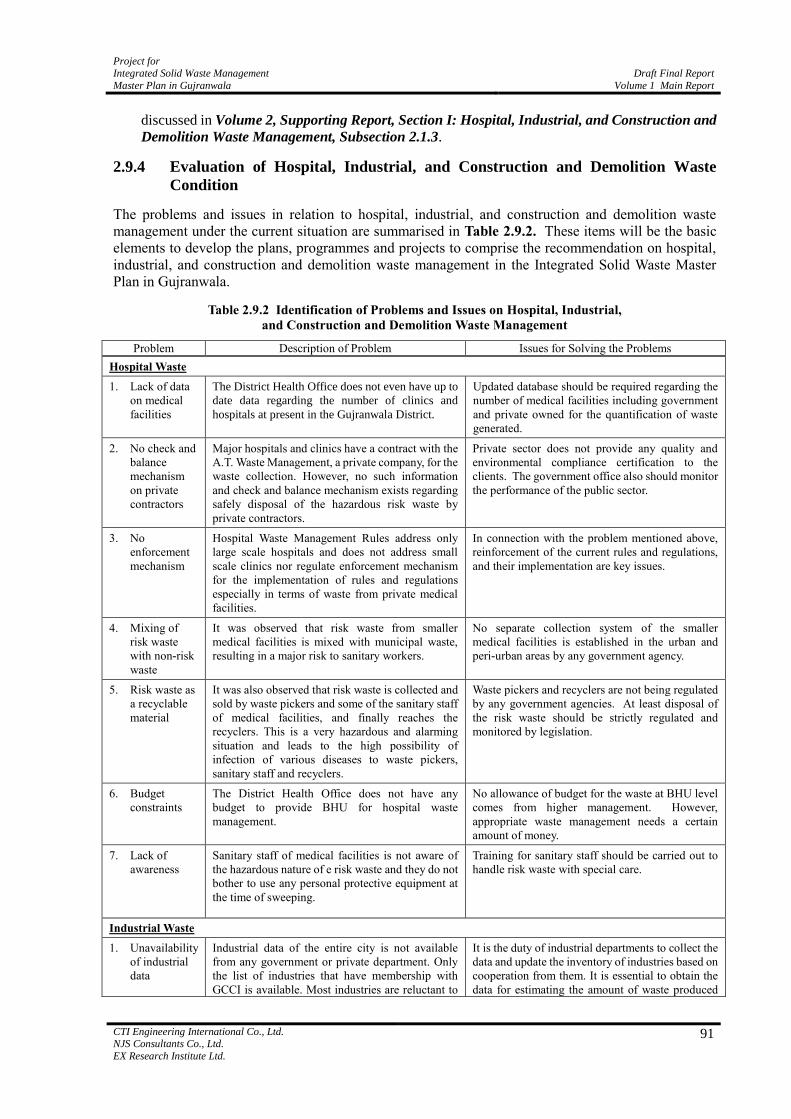
Project for Integrated Solid Waste Management
Master Plan in Gujranwala
Draft Final Report
Volume 1 Main Report
CTI Engineering International Co., Ltd. NJS Consultants Co., Ltd.
EX Research Institute Ltd.
91
discussed in Volume 2, Supporting Report, Section I: Hospital, Industrial, and Construction and
Demolition Waste Management, Subsection 2.1.3.
2.9.4 Evaluation of Hospital, Industrial, and Construction and Demolition Waste
Condition
The problems and issues in relation to hospital, industrial, and construction and demolition waste
management under the current situation are summarised in Table 2.9.2. These items will be the basic
elements to develop the plans, programmes and projects to comprise the recommendation on hospital,
industrial, and construction and demolition waste management in the Integrated Solid Waste Master
Plan in Gujranwala.
Table 2.9.2 Identification of Problems and Issues on Hospital, Industrial,
and Construction and Demolition Waste Management
Problem Description of Problem Issues for Solving the Problems
Hospital Waste
1. Lack of data
on medical
facilities
The District Health Office does not even have up to
date data regarding the number of clinics and
hospitals at present in the Gujranwala District.
Updated database should be required regarding the
number of medical facilities including government
and private owned for the quantification of waste
generated.
2. No check and
balance
mechanism
on private
contractors
Major hospitals and clinics have a contract with the
A.T. Waste Management, a private company, for the
waste collection. However, no such information
and check and balance mechanism exists regarding
safely disposal of the hazardous risk waste by
private contractors.
Private sector does not provide any quality and
environmental compliance certification to the
clients. The government office also should monitor
the performance of the public sector.
3. No
enforcement
mechanism
Hospital Waste Management Rules address only
large scale hospitals and does not address small
scale clinics nor regulate enforcement mechanism
for the implementation of rules and regulations
especially in terms of waste from private medical
facilities.
In connection with the problem mentioned above,
reinforcement of the current rules and regulations,
and their implementation are key issues.
4. Mixing of
risk waste
with non-risk
waste
It was observed that risk waste from smaller
medical facilities is mixed with municipal waste,
resulting in a major risk to sanitary workers.
No separate collection system of the smaller
medical facilities is established in the urban and
peri-urban areas by any government agency.
5. Risk waste as
a recyclable
material
It was also observed that risk waste is collected and
sold by waste pickers and some of the sanitary staff
of medical facilities, and finally reaches the
recyclers. This is a very hazardous and alarming
situation and leads to the high possibility of
infection of various diseases to waste pickers,
sanitary staff and recyclers.
Waste pickers and recyclers are not being regulated
by any government agencies. At least disposal of
the risk waste should be strictly regulated and
monitored by legislation.
6. Budget
constraints
The District Health Office does not have any
budget to provide BHU for hospital waste
management.
No allowance of budget for the waste at BHU level
comes from higher management. However,
appropriate waste management needs a certain
amount of money.
7. Lack of
awareness
Sanitary staff of medical facilities is not aware of
the hazardous nature of e risk waste and they do not
bother to use any personal protective equipment at
the time of sweeping.
Training for sanitary staff should be carried out to
handle risk waste with special care.
Industrial Waste
1. Unavailability
of industrial
data
Industrial data of the entire city is not available
from any government or private department. Only
the list of industries that have membership with
GCCI is available. Most industries are reluctant to
It is the duty of industrial departments to collect the
data and update the inventory of industries based on
cooperation from them. It is essential to obtain the
data for estimating the amount of waste produced

Draft Final Report
Volume 1 Main Report
Project for Integrated Solid Waste Management
Master Plan in Gujranwala
92
CTI Engineering International Co., Ltd. NJS Consultants Co., Ltd.
EX Research Institute Ltd.
Problem Description of Problem Issues for Solving the Problems
cooperate with surveys that are going to try to
clarify their activities. They normally reject
disclosure of any information regarding their types
and sales of production, number of employees,
disposal of industrial waste, etc., to avoid payment
of taxes.
from industries and formulating the waste
management plan.
2. No proper
enforcement
of laws and
regulations
There is no proper enforcement of laws, by-laws
and regulations in Pakistan dealing with
management of the waste discharged from
industries. Although PEPA 2012 includes some
clause related to industrial waste, it does not clearly
demonstrate the responsibilities of industries
regarding the solid waste management.
Rules and regulations that clearly mention the
responsibility with strict enforcement are
necessary.
3. Mixing of
industrial
waste with
municipal
waste
Most of the small scaled industries are in the
residential area and waste is mixed with municipal
waste. Due to no service by any company in the
industrial area, waste of industrial estates is also
mixed with the waste generated from households.
A separate collection system for industries and
households is important to establish the proper
solid waste management system in the city.
Construction and Demolition (C&D) Waste
1. Ambiguity of
classification
and
responsibility
for C&D
waste
Although C&D waste is categorised into municipal
waste under the Punjab Municipal Solid Waste
Management Guidelines 2011, the amount is too
large to deal with municipal waste collected from
households and commercial entities in general. The
other laws and regulations do not clearly define the
classification and responsibility for C&D waste.
The provincial government should firstly make
some by-laws or regulations for C&D waste
management in which rules and responsibilities
should be clearly defined. Simultaneously, GWMC
should consider introduction of tariff for C&D
waste collection and propose it to the provincial
government or city district government.
2. No reliable
data on C&D
waste
generation
amount and
composition
The estimation by LWMC in terms of C&D waste
amount and composition in Gujranwala is wrong so
that no reliable data exists. Special surveys at the
sites are indispensable for obtaining the data and
will take a lot of time and resources.
The waste amount and composition data are basis
of development of the management plan. Without
the data, any plan covering the waste collection
method and required number of vehicles and
personnel cannot be prepared accurately.
3. Many illegal
dumping of
C&D waste
C&D wastes are piled up in front of houses, vacant
plots, along the roadsides, etc., and accumulate day
by day. According to the LWMC report, there are
46 of such sites in Gujranwala and the total amount
is estimated at 3,555 tons.
GWMC has started the One-Time Cleaning
Activity to remove the accumulated waste
including C&D waste in the city area. This activity
should be conducted continuously until all the
illegal dumpsites are cleared by the allocation of
suitable sets of vehicles and machinery.
Project for Integrated Solid Waste Management
Master Plan in Gujranwala
Draft Final Report
Volume 1 Main Report
CTI Engineering International Co., Ltd. NJS Consultants Co., Ltd.
EX Research Institute Ltd.
93
CHAPTER 3. PLANNING POLICIES OF SOLID WASTE MANAGEMENT IN
GUJRANWALA AND FRAMEWORK OF THE MASTER PLAN
3.1 Introduction
The responsibility, duty, authority, regulations, etc., of the local government as mandated by legislation
will be the key elements to formulate the Integrated Solid Waste Management (ISWM) Plan. This
chapter thus proposes the planning policies and strategies for establishing the framework of the ISWM
for Gujranwala City based upon clarification and identification of problems and issues raised from the
findings and data analysis presented in Chapter 2.
3.2 Establishment of Principles and Planning Policies for ISWM in Gujranwala
As a result of a series of discussions and meetings between the JICA Project Team and the Pakistani side,
principles and planning policies for ISWM of the Gujranwala Waste Management Company (GWMC)
are as prepared and presented in the following sections. These principles and planning policies are the
basis on which the planning strategies of the SWM for GWMC and CDGG, as well as the Government
of the Punjab and framework of the Master Plan, shall be formulated hereinafter.
3.2.1 Categories of Waste
(1) Clarification of Definition of Municipal Solid Waste
CDGG is primarily responsible for the management of municipal solid waste within the
jurisdictional area of Gujranwala. In terms of the SWM in Gujranwala, CDGG executed a service
contract with GWMC and the responsibility for handling municipal waste has been transferred to
GWMC since January 2014. Before discussing the setting up of planning policies for the ISWM in
Gujranwala, the definition of municipal solid waste and the demarcation between municipal solid
waste and non-municipal solid waste should be clarified.
“Municipal waste” is defined in the Punjab Environmental Protection Act (PEPA) 2012 as
“sewage, refuse, garbage, waste from abattoirs, sludge and human excreta and the like” (Clause 2.
Definitions, [xxviii]). Another definition in the Punjab Municipal Solid Waste Management
Guidelines 2011 sets out in more detail that “municipal solid waste” for the purpose of these
Guidelines means solid waste generated within the jurisdiction of a local government except
slaughterhouse, hazardous hospitals, or hazardous industrial waste but includes:
(a) Domestic waste (exclusive of hazardous waste) consisting of garbage and rubbish such as
bottles, cans, clothing, plastic disposables, off packaging and food scraps, newspaper and
magazines, plastics and yard trimming that originates from a household;
(b) Commercial waste (Market waste);
(c) Institutional waste (schools, hospitals (non-hazardous), public offices, etc.);
(d) Street sweeping waste;
(e) Garden waste (Tree trimming and grass cutting wastes);
(f) Solid wastes collected from drains and water courses in urban areas*;
(g) Construction/demolition waste;
(h) Industrial waste (except waste generated in designated industrial Estates); and
(i) Agricultural waste from farm and agricultural activities including poultry, cattle farming,
animal husbandry, residues from the use of fertilizer, pesticides and other farm chemicals
Note:* Demarcation of the responsibility for sweeping and clearing drains between GWMC and WASA is presented in Subsection 2.3.2.

Draft Final Report
Volume 1 Main Report
Project for Integrated Solid Waste Management
Master Plan in Gujranwala
94
CTI Engineering International Co., Ltd. NJS Consultants Co., Ltd.
EX Research Institute Ltd.
From the viewpoint of responsibility for handling wastes as a local government in general, the
above categories of municipal waste seem to be too broad to be borne solely by a local government.
Considering the “Polluter Pays Principle” as PEPA 2012 also states some of the articles based on
this concept (e.g., Clause 11, Prohibition of certain discharges or emissions), the generators should
be responsible, at least, for bulky or special wastes that are not discharged from residents’ ordinary
daily life. In this sense, categories (g), (h) and (i) above should be excluded in the list of municipal
solid waste. In case that GWMC collects the waste including these categories, GWMC should
charge the cost covering collection, transportation and disposal directly from the generators.
(2) Proposed Management Responsibility for Municipal Solid Waste
Non-municipal solid waste is waste that is not under GWMC’s responsibility but the responsibility
of waste generators. Since the Punjab Municipal Solid Waste Management Guidelines 2011 do not
have a legally binding force, based on the above argument, waste categories and their management
responsibilities are proposed as summarised in the table below.
Table 3.2.1 Waste Category and Management Responsibility
Kinds of Waste Management Responsibility Remarks
1. Municipal Solid Waste
1-1 Domestic waste
1-2 Commercial waste
1-3 Institutional waste
1-4 Street sweeping waste
(including carcasses)
1-5 Garden waste
1-6 Drain waste (Drain width: less than 2 feet)
GWMC GWMC may collect bulky waste upon
receipt of a request from residents by charging a special tariff.
2. Non Municipal Solid Waste
2-1 Non-hazardous industrial
waste
2-2 Commercial waste of large
amount
2-3 Construction & Demolition
waste
2-4 Agricultural waste
2-5 Discarded vehicles &
machinery
2-6 Hazardous waste including infectious hospital waste
Generators of waste
(GWMC and CDGG should
monitor generators’ management
of non-municipal waste until
they establish a proper
management system for these wastes.)
GWMC may collect non-municipal
waste except waste item 2-6 upon
receipt of a request from the generator by charging a special tariff.
GWMC may also accept these
categories of waste except waste
item 2-6 at its disposal site on full cost recovery basis.
The central government should establish
hazardous waste management (treatment) facilities.
3.2.2 Responsibility of Federal Government, Local Government, Business Waste
Generators and Residents
GWMC must have the power and responsibility for organizing integrated solid waste
management (ISWM). As shown below, there are other stakeholders involved in ISWM.
Federal Government
Government of the Punjab
CDGG
GWMC
Business (Industrial and Commercial) Waste Generators
Residents
The proposed principal responsibilities of respective stakeholders are given in the Table 3.2.2.

Project for Integrated Solid Waste Management
Master Plan in Gujranwala
Draft Final Report
Volume 1 Main Report
CTI Engineering International Co., Ltd. NJS Consultants Co., Ltd.
EX Research Institute Ltd.
95
Table 3.2.2 Parties Involved in Solid Waste Management and Their Responsibilities
Involved Parties Responsibilities
1. Federal Government 1) To formulate a national policy with respect to waste reduction,
recycling and solid waste management.
2) To formulate and pass a national SWM law.
3) To set technical standards.
4) To research on solid waste management.
5) To ensure that the laws and regulations are applied.
6) To provide guidance to local governments.
2. Government of the Punjab 1) To formulate a provincial policy and prepare provincial strategies and
plans (short and long term).
2) To enact Acts, Ordinances, Guidelines, etc. related to SWM.
3) To finance the district governments.
4) To levy a waste tax or tariff.
5) To formulate regulations.
6) To formulate guidelines with respect to:
a) Methods of discharging waste (types of containers to be used);
b) Waste reporting requirements of business waste generators; and,
c) Recycling (types of waste to be recycled).
3. CDGG 1) To formulate a local policy and prepare local strategies and plans (short
and long term).
2) To finance SWM.
3) To supervise performance of GWMC.
4) To enforce bye-laws and regulations.
4. GWMC 1) To provide waste collection, haulage, treatment, disposal and street
sweeping services under contractual arrangements.
5. Business (Industrial and
Commercial) Waste
Generators
1) To manage (collection, treatment and disposal) their waste except those
accepted by the local government as municipal solid waste.
2) To submit reports on their waste (types, quantity, pre-treatment and
other information) as required by the municipal regulations.
6. Residents 1) To conduct 3R (Reduce, Reuse, Recycle) activities.
2) To comply with the local government’s waste collection procedure.
3) To avoid littering waste.
4) To dispose of discarded vehicles by using commercial enterprises.
3.2.3 Vision, Mission and Goals of Integrated Solid Waste Management in
Gujranwala
(1) Vision of Integrated Solid Waste Management in Gujranwala
The vision of integrated solid waste management in Gujranwala is decided, as follows:
“Transformation of Gujranwala to the Cleanest City of Punjab”
(2) Mission of Integrated Solid Waste Management in Gujranwala
The mission of integrated solid waste management in Gujranwala is proposed, as follows:
(a) To improve and protect the public health of Gujranwala residents and visitors;
(b) To deliver efficient and effective waste collection and disposal services to the residents
of Gujranwala;

Draft Final Report
Volume 1 Main Report
Project for Integrated Solid Waste Management
Master Plan in Gujranwala
96
CTI Engineering International Co., Ltd. NJS Consultants Co., Ltd.
EX Research Institute Ltd.
(c) To maximise resource recovery and recycling through the participatory approach; and
(d) To ensure greener and safer environment at final disposal sites.
(3) Goals of Integrated Solid Waste Management in Gujranwala
The goals of integrated solid waste management in Gujranwala are proposed, as follows:
(a) To significantly extend and formalise resource recovery activities, including but going
beyond the creation of enabling environments and the development of markets and
industries for recyclables;
(b) To develop awareness and capacity for waste handling and source separation as essential
components of sustainable waste management;
(c) To restructure and extend efficient and equitable collection of source-separated waste
streams with the view of protection of public health and the environment;
(d) To build environmentally sound infrastructure and systems for safe disposal of residual
waste, replacing the current disposal site and transfer station which must be rehabilitated;
and
(e) To reduce the burden on the disposal site and increase its life span by using intermediate
treatment and 3R approach.
3.3 Planning Strategy for ISWM in Gujranwala
3.3.1 Problem Identification on ISWM in Gujranwala
As stated in Chapter 2, based on the results of site reconnaissance, field surveys and analyses, there are
many causes preventing GWMC from conducting better services of waste collection and disposal.
Identification of the current problems is indispensable for establishment of the planning directions to
solve these problems. The major problems enumerated below are considered to be the key issues on
master plan formulation, and low level of waste collection service coverage and lack of public
awareness are identified as the two core problems that shall be sorted out.
Low level of waste collection service coverage
A large number of illegal dumpsites
Inappropriate landfill operation at the existing final disposal site
No proper closed landfill site
Absence of formal intermediate treatment and 3R facilities
Lack of awareness of residents on intermediate treatment and 3R, and other SWM problems
Health risk of sanitary workers and waste pickers
Lack of management staff and technical expertise of GWMC
Lack of financial independence and pricing mechanism in SWM services
Few involvement of the private sector
3.3.2 Planning Strategy
To solve the problems and achieve the goals, the strategic approach to formulate the ISWM Master Plan
for Gujranwala are proposed with the following six items in consideration of solving the implicated
constraints of the city towards improvement of technical and institutional deficiencies:
Heightening of public awareness and participation
Development of SWM operational capacity of GWMC
Securing of a proper sanitary landfill site
Project for Integrated Solid Waste Management
Master Plan in Gujranwala
Draft Final Report
Volume 1 Main Report
CTI Engineering International Co., Ltd. NJS Consultants Co., Ltd.
EX Research Institute Ltd.
97
Strengthening of SWM financial capacity
Maximisation of public sector involvement in SWM
Promotion of 3R (Reduce, Reuse, Recycle)
3.4 Planning Direction of the Master Plan
3.4.1 Components of the Master Plan
The ISWM Master Plan for Gujranwala is formulated in three implementation stages, namely; the first
implementation stage (Short-Term Plan covering the period from 2016 to 2018); the second
implementation stage (Mid-Term Plan covering the period from 2019 to 2024); and the third
implementation stage (Long-Term Plan covering the period from 2025 to 2030). The action plans
covered in the first implementation stage are formulated through two approaches: (1) technical
approach, and (2) institutional and financial approach. The major planning items of the Master Plan are
summarised as the following seven programmes:
Technical Approach of the Master Plan
Programme 1: Waste Collection and Transportation Plan
Programme 2: Final Disposal Plan
Programme 3: Intermediate Treatment and 3R Promotion Plan
Institutional and Financial Approach of the Master Plan
Programme 4: Environmental Education and Public Awareness Raising Plan
Programme 5: Economic and Financial Plan
Programme 6: Environmental Monitoring Plan
Programme 7: Institutional Strengthening and Organizational Plan
3.4.2 Objectives, Planning Policies and Strategies of Each Component of the Master
Plan
(1) Waste Collection and Transportation Plan
Objective (a)
The overall objective of the Waste Collection and Transportation Plan is to improve the
existing collection service activities and expand the coverage area in Gujranwala City in order
to maintain public sanitation and cleanliness of the city.
Planning Policy (b)
The development plan of the waste collection and transportation plan shall be cover 64
UCs in the year 2018, and the planning area shall start expanding to 34 UCs in the year
2019.
Targeted waste in the master plan shall be municipal waste.
Construction and demolition (C&D) waste shall be handled in a different operation from
the ordinary waste collection and transportation work.
Planning Strategy (c)
Type of municipal solid waste shall be defined for the objective waste for the waste
collection and transportation plan.

Draft Final Report
Volume 1 Main Report
Project for Integrated Solid Waste Management
Master Plan in Gujranwala
98
CTI Engineering International Co., Ltd. NJS Consultants Co., Ltd.
EX Research Institute Ltd.
Technical alternatives on waste collection and transportation system shall be studied by
evaluating the most efficient result in terms of waste collection and transportation from
generation source to final disposal site, as well as evaluation from the viewpoint of less
impact to society and the environment.
Separate collection system shall be established under the conditions with involvement of
all the waste generators in the future.
Implementation of waste collection and transportation is carried out based on the phased
procurement of a sufficient number of waste containers and waste collection vehicles.
The procurement plan for waste collection vehicles and containers on waste collection
and transportation plan shall be determined as the most optimum system of collection and
transportation.
Urgent clean-up work shall be promoted for illegal dumping sites in the city.
Street cleaning work shall be conducted.
Collection of bulky waste shall be conducted.
Construction of necessary parking areas shall be conducted.
(2) Final Disposal Plan
Objective (a)
Waste disposal shall be provided as the last process of solid waste management to dispose
waste for storing eternally and for stabilising the waste of no value for resource materials
and/or waste conversion for further use and protect the surrounding area from secondary
pollution.
Planning Policy (b)
The development plan of final disposal facilities shall be formulated until 2030 for the
final target year of the master plan.
Only treated or residual municipal solid waste shall be the objective waste acceptable to
the final disposal facility of Gujranwala.
Among the several types of final disposal facilities, the sanitary landfill facility is
superior to any other type for disposal of municipal solid waste from technical, economic
and environmental viewpoints. Hence the final disposal plan shall formulate the
development plan for construction and operation of new sanitary landfill facilities in
Bhakhraywali.
The improvement plan of the existing landfill in Gondlanwala and the safe post-closure
plan of the former landfill site in Chianwali shall be included as an integral part of the
final disposal plan.
Planning Strategy (c)
The development work of new sanitary landfill shall be carried out by stage-wise
construction work in consideration of the financial capacity of the project proponent.
The improvement plan of the existing landfill site and the safe post-closure of the former
landfill site shall be carried out to attain the satisfactory level for mitigating the current
negative impacts in consideration of economic efficiency.

Project for Integrated Solid Waste Management
Master Plan in Gujranwala
Draft Final Report
Volume 1 Main Report
CTI Engineering International Co., Ltd. NJS Consultants Co., Ltd.
EX Research Institute Ltd.
99
(3) Intermediate Treatment and 3R Promotion Plan
Objective (a)
The objective of the Intermediate Treatment and 3R Promotion Plan is for reduction of
domestic waste generation, recovery of resources, reuse, recycling, intermediate treatment and
resource circulation.
Planning Policy (b)
The development plan of intermediate treatment and 3R promotion activities shall be
formulated in 2030 as the final target year of the master plan.
The plans should be implemented with consideration for not only limited budget but also
informal activities related to intermediate treatment and 3R promotion.
The intermediate treatment plan shall be implemented through privatisation while the
municipal solid waste management in collection, transportation and disposal shall be
carried out and managed by the GWMC.
Planning Strategy (c)
The appropriate quality control of compost shall be indispensable to maintain the
proposed central compost and RDF plant to be operated by a new compost company of
Special Purpose Vehicle in Gujranwala.
The awareness raising and IEC campaign on the intermediate treatment and 3R
promotion activities shall be exercised upon public, schools and stakeholders in
Gujranwala by leading of GWMC continuously.
The recycling law shall be enacted or legislated to promote 3R activities and formalise the
rapidly growing informal resource recovery activities.
(4) Environmental Education and Public Awareness Raising Plan
Objective (a)
The objective of the Environmental Education is to raise awareness of the general public as
well as selected target groups (e.g., elected officials/representatives, religious scholars) at the
Union Council, Tehsil and District levels of SWM.
Planning Policy (b)
The plan should be formulated to promote better understanding of the resident through
public and school environmental education by establishing coordination mechanisms in
GWMC.
The plan should be continuous and formulated to promote more involvement of public
and selected target groups’ participation by providing opportunities to actively
participate.
Planning Strategy (c)
Capacity of communication unit of GWMC should be strengthened to facilitate and
coordinate numerous education routes, i.e., facilitating educational materials and
coordinating relevant bodies.
GWMC needs to inform the public of the measures to be taken to improve SWM in the
city. A properly structured communication strategy should be developed.
A public environmental education and awareness programme should be carried out to

Draft Final Report
Volume 1 Main Report
Project for Integrated Solid Waste Management
Master Plan in Gujranwala
100
CTI Engineering International Co., Ltd. NJS Consultants Co., Ltd.
EX Research Institute Ltd.
raise awareness and involve the public in the initiatives for better SWM in the city.
The introduction of SWM in the primary education curriculum should be considered to
make school children more aware on solid waste issues. In addition, the development of
educational materials for teachers and students should be considered essential as a tool to
promote environmental education and create awareness among educational community.
(5) Economic and Financial Plan
Objective (a)
The objective of the Economic and Financial Plan is to establish the optimum cost recovery in
the SWM operations of GWMC, thereby achieving the long-term financial sustainability of
providing SWM services to be planned in the Master Plan.
Planning Policy (b)
Cost recovery for the provision of SWM services should be achieved through the ample
generation of stable revenues from users and taxation.
Current operating costs required for SWM services should be accurately and
continuously reviewed and estimated.
Revenues required for the cost recovery should be mainly generated from the tariff
charging system which reflects the cost of SWM services.
Outsourcing of part of SWM services should be introduced for the purpose of utilising the
efficient private sector.
Planning Strategy (c)
(i) Optimum cost recovery to cover the operation and maintenance cost for
SWM services should be achieved for the long-term financial sustainability
based on the following strategies:
Establishment of the long-term road map for the full recovery of the operation and
maintenance cost by user charges and subsidies from the provincial government;
Establishment of a wide range of financial monitoring indicators together with the
standard procedures for monitoring the cost recovery; and
Preparation of manual and training of GWMC’s staff for the management of the cost
recovery.
(ii) Operation and maintenance cost for SWM services should be accurately
estimated based on the following strategies:
Establishment of an independent accounting system for the financial autonomy of
GWMC;
Establishment of organizational setting such as a focal point inside GWMC in charge
of accurately managing and estimating the operation and maintenance cost for SWM
services; and
Establishment of proper monitoring of the operation and maintenance cost for SWM
services together with the minimisation of operation and maintenance cost to attain the
operational efficiency of SWM services.

Project for Integrated Solid Waste Management
Master Plan in Gujranwala
Draft Final Report
Volume 1 Main Report
CTI Engineering International Co., Ltd. NJS Consultants Co., Ltd.
EX Research Institute Ltd.
101
(iii) Revenue generation through the proper tariff charging system should be
introduced based on the following strategies:
Selection and introduction of proper user charge system to cover the operation and
maintenance cost for SWM services;
Selection and introduction of stable financial resources to cover the financial
shortages from the provincial government through subsidies or taxation;
Preparation of official tariff table for the selected user charge system;
Establishment of a wide range of financial monitoring indicators together with the
standard procedures for setting and revising the tariff level; and
Improvement of users’ willingness to pay through raising of public awareness for the
payment of user charges.
(iv) Efficient private sector involvement should be introduced by outsourcing
part of SWM services to private service operators as the following
strategies:
Selection and introduction of an efficient service contract for collection and transport
services; and
Establishment of a wide range of performance monitoring indicators together with the
standard procedures for monitoring the financial performance of private service
operators.
(6) Environmental Monitoring Plan
Objective (a)
The objective of Environmental Monitoring Plan is to monitor the environmental quality to
avoid new negative impacts which might be caused by the disposal sites, and mitigate current
negative impacts of the disposal sites to social and natural environment in Gujranwala.
Planning Policy (b)
Environmental Monitoring shall be applied for not only the proposed landfill site at
Bhakhlaywali but also the current disposal site at Gondlanwala and the closed disposal
site at Chianwali.
Environmental Monitoring shall be carried out in long-term perspective.
Planning Strategy (c)
A system of environmental monitoring should be established and implemented.
Practical and initial solid waste recycling activities should be carried out with inclusion of
waste pickers’ activities.
(7) Institutional Strengthening and Organizational Plan
Objective (a)
The Institutional Strengthening and Organizational Plan have three objectives as follows:
To comprehensively reorganize the functions of the GWMC so that the responsibilities
and services on solid waste management could be effectively and efficiently managed;
To comprehensively strengthen human resources capacities of the managerial and
technical staff of the GWMC to support its functions; and

Draft Final Report
Volume 1 Main Report
Project for Integrated Solid Waste Management
Master Plan in Gujranwala
102
CTI Engineering International Co., Ltd. NJS Consultants Co., Ltd.
EX Research Institute Ltd.
To establish a comprehensive Solid Waste By-Law for Gujranwala.
Planning Policy (b)
For the establishment of the new organization in charge of solid waste management services,
the function of the GWMC should be comprehensively reviewed in terms of organizational
and individual capacity assessment, as follows:
Responsibilities and obligations of the new organization should not be fragmented or
overlapping among the staff and workers;
Linkages and coordination arrangements between different departments in the new
organization should be efficient and effective;
The organizational structure should be optimised in line with the selected structure for
Public-Private Partnership;
Human resources development for providing solid waste management services shall be
comprehensively designed and implemented based on the results of the capacity
assessment;
All rules and regulations related to SWM should be integrated; and
Integrated By-Law should be translated in Urdu.
Planning Strategy (c)
The organization of GWMC shall be restructured comprehensively for effective and efficient
service provision based on the following concepts:
An efficient and rationalised organizational structure with clear reporting lines,
reasonable spans of control and number of levels of managerial and technical staff, and
the appropriate vertical structure to attain the operational efficiency of the solid waste
management;
A clear assignment and delegation of responsibilities and adequate authority to managers
and supervisors with accountability for individual performance as well as a simple
workflow for a quick decision process;
A streamlined workflow based on the practical basis to avoid the overlapping of
organizational structure;
Clear-cut directing functions from the strategic level down to middle management and
supervisors;
Effective and appropriate management information systems and other procedures;
Periodic assessment and feedback of management systems and other procedures based on
agreed performance targets and criteria;
A department or unit in charge of managing and regulating the proper Public-Private
Partnership scheme;
More practical human resources development including on-the-job training programme
based on the capacity assessment and feedback system to share job skills among staff and
workers should be implemented; and
Raising public awareness on best practices in solid waste management such as rules and
regulations, recycling, segregation, re-use, and recovery as well as inculcating the culture
of waste reduction and proper storage among producers and consumers.

Project for Integrated Solid Waste Management
Master Plan in Gujranwala
Draft Final Report
Volume 1 Main Report
CTI Engineering International Co., Ltd. NJS Consultants Co., Ltd.
EX Research Institute Ltd.
103
CHAPTER 4. FORMULATION OF THE MASTER PLAN
4.1 Introduction
This Chapter presents the formulation of the Integrated Solid Waste Management (ISWM) Master Plan
together with the technical options and institutional and financial arrangements. The following two
sections, Section 4.2 and Section 4.3, present the socioeconomic aspects such as population and
economic projection including social conditions, and the conditions of waste generation and
composition from the present situation to the target year 2030. Section 4.4 to Section 4.10 present the
contents of each component of the master plan, which include development of alternatives for each plan,
evaluation of the alternatives and selection of priority projects. Recommendations on hospital and
industrial, and construction and demolition waste are discussed in Section 4.11.
Based on these considerations and evaluations of each components of the master plan, master plan
alternatives are developed based on the combination of some of the preferable options for the four (4)
strategic components of the ISWM Master Plan; namely, (1) the waste collection and transportation
plan; (2) the final disposal plans; (3) the intermediate treatment and 3R promotion plan; and (4) the
environmental education and public awareness raising plan, as discussed in Section 4.12. The
evaluation of these alternatives is then carried out and the optimum master plan is selected in
Section 4.13. The optimum master plan is then evaluated from the technical point of view, economic
and financial aspects, and institutional and organizational aspects in Section 4.14, and the future waste
stream of the optimum plan is presented in Section 4.15.
The formulated Master Plan should be monitored and evaluated in terms of operation and effect
indicators proposed in Section 4.16 and the implementation schedule and cost, and plan of operations of
the Master Plan is presented in Section 4.17. Finally, priority projects are selected in Section 4.18.
4.2 Socioeconomic Aspect
4.2.1 Population Projection
(1) Past Spatial Development and Population in Gujranwala
Information on the past spatial development and population of Gujranwala were obtained from the
“Proposed Peri-Urban Structure Plan Gujranwala City”. Figure 4.2.1 gives a graphic presentation
of the area developed from 1914 to 2009. The early stage development occurred in the west side of
the city. Development of the east side of the city took place after the 1950s. The built-up area has
expanded to the north-west side of the city and the north and south areas along the G.T. Road.
Figure 4.2.2 graphically illustrates the past population in the “Proposed Peri-Urban Structure Plan
Gujranwala City”. This graph shows a rapid growth of population from 224 thousand in 1971 to
1.13 million in 1998.
Figure 4.2.1 Gujranwala Historical Growth (Built-up Area)
Source: Proposed Peri-Urban Structure Plan Gujranwala City (Modified by JICA Project Team)
1914 1947 1971 1985 2009

Draft Final Report
Volume 1 Main Report
Project for Integrated Solid Waste Management
Master Plan in Gujranwala
104
CTI Engineering International Co., Ltd. NJS Consultants Co., Ltd.
EX Research Institute Ltd.
Figure 4.2.2 Past Population in Gujranwala (1901-1998)
Source: Proposed Peri-Urban Structure Plan Gujranwala City (Modified by JICA Project Team)
(2) Population Census in 1998
The available latest population statistics is only those of the national census conducted in 1998.
According to the population census of 1998, population of the 64 urban UCs and 34 peri-urban UCs
covered in the ISWM Master Plan is approximately 1.13 million and 0.61 million, respectively, as
shown in Table 4.2.1, and the total population was 1.74 million in 1998.
Table 4.2.1 Town-wise Population in the Area of ISWM Master Plan (1998 Census)
Type of Area Town Number of Union
Councils
Census Population in
1998
Urban
Qila Didar Singh 19 337,348
Aroop 17 254,329
Khiali Shah Pur 13 276,132
Nandi Pur 15 264,700
Total for 64UCs 64 1,132,509
Peri-Urban
Qila Didar Singh 6 101,488
Aroop 8 217,500
Khiali Shah Pur 12 154,715
Nandi Pur 8 138,391
Total for 34UCs 34 612,094
Total for 98 UCs 98 1,744,603
Source: Population Census of 1998
(3) Projection of Future Population in the 98 UCs
According to the population growth rate obtained from the CDGG, the population growth rate in
1981-1998 is estimated at 3.79 % per year. On the other hand, the population growth rate in the
Punjab Province during the same period is estimated at 2.64% (Note*1
). UU and LWMC carried out
population projections in connection with the formulation of the outsourcing plan of waste
collection services in the 64 UCs of Gujranwala (Note*2
). The population projection in the report
was carried out for the city area in the 64 UCs for the period of 2012-2019. By analysing the
projected population, the annual growth rate could be 3.2%. Considering the rapid growth of the
city in the recent years, the annual population growth rate of 3.79% is adopted for the estimation of
future population in the Project. Population projection is carried out based on the population census
in 1998 as the base year.

Project for Integrated Solid Waste Management
Master Plan in Gujranwala
Draft Final Report
Volume 1 Main Report
CTI Engineering International Co., Ltd. NJS Consultants Co., Ltd.
EX Research Institute Ltd.
105
Table 4.2.2 shows the summary of the population projection. As a result of population projection,
total population in the 64 urban UCs and 34 peri-urban UCs increases from 3.2 million in 2014 to
5.7 million in 2030. Figure 4.2.3 shows the projected population in comparison with the projected
population by UU.
Note: *1 Demographic Indicators-1998 Census
http://www.pbs.gov.pk/sites/default/files/tables/DEMOGRAPHIC%20INDICATORS%20-%201998%20CENSUS.pdf
*2 LWMC, Planning & Design of Proposed SWM System in Gujranwala City, Draft Report, pp. 50-53.
Table 4.2.2 Projected Population in 98 UCs in Gujranwala
Urban UC and
Peri-Urban UC
Census
Population in
1998
Estimated
Population in
2014
Estimated
Population in
2018
Estimated
Population in
2020
Estimated
Population in
2024
Estimated
Population in
2030
Urban UC
Qila Didar Singh 337,348 611,739 709,886 764,715 887,404 1,109,314
Aroop 254,329 461,194 535,188 576,524 669,020 836,320
Khiali Shah Pur 276,132 500,732 581,068 625,948 726,374 908,015
Nandi Pur 264,700 480,001 557,012 600,033 696,301 870,423
Total-64 UCs 1,132,509 2,053,666 2,383,153 2,567,219 2,979,099 3,724,072
Peri-Urban UC
Qila Didar Singh 101,488 184,036 213,562 230,057 266,967 333,727
Aroop 217,500 394,410 457,688 493,038 572,140 715,213
Khiali Shah Pur 154,715 280,557 325,569 350,714 406,982 508,755
Nandi Pur 138,391 250,955 291,218 313,711 364,042 455,076
Total-34 UCs 612,094 1,109,957 1,288,037 1,387,520 1,610,132 2,012,772
Total-98 UCs 1,744,603 3,163,624 3,671,190 3,954,739 4,589,231 5,736,843
Figure 4.2.3 Past Population (1901-1998) and Projected Population (1999-2030)

Draft Final Report
Volume 1 Main Report
Project for Integrated Solid Waste Management
Master Plan in Gujranwala
106
CTI Engineering International Co., Ltd. NJS Consultants Co., Ltd.
EX Research Institute Ltd.
(1) Adjustment of Future Population in the
Project Area of 98 UCs
The peri-urban boundary line crosses the area of 18
peri-urban UCs and splits each UC area into inside and
outside of the Project Area as shown in Figure 4.2.4.
Adjustment was made with the projected population of
the whole area of each UC by proportion of
inside/outside areas. Table 4.2.3 shows the adjusted
population in the Project Area. As shown in the table,
the total population of 3.0 million in 2014 increase up to
5.4 million in 2030, which is 1.8 times of the population
after 16 years.
Table 4.2.3 Estimated Population in the Project Area for ISWM Plan (unit: 1,000 persons)
UCs 2014 2015 2016 2017 2018 2019 2020 2021 2022 2023 2024 2025 2026 2027 2028 2029 2030
Urban UCs 2,054 2,132 2,212 2,296 2,383 2,473 2,567 2,665 2,766 2,870 2,979 3,092 3,209 3,331 3,457 3,588 3,724
Peri-urban UCs 910 944 980 1,017 1,056 1,096 1,137 1,180 1,225 1,272 1,320 1,370 1,422 1,476 1,531 1,589 1,650
Total Project Area 2,964 3,076 3,192 3,313 3,439 3,569 3,704 3,845 3,991 4,142 4,299 4,462 4,631 4,807 4,988 5,177 5,374
Figure 4.2.5 Trend of Estimated Population in the Project Area for ISWM Plan
4.2.2 Economic Projection
Pakistan’s economic record during 2009-2013 has been stagnant. The GDP real growth rate appeared to
have been the slowest of any five-year period in the last century. Inflation had clearly accelerated during
the same period. Table 4.2.4 shows the real GDP growth rate, the inflation rate and the nominal GDP
growth rate of Pakistan, respectively. Meanwhile, Punjab’s regional economy had increased at a much
slower pace than the rest of Pakistan over the period from 2007 to 2011, according to the estimates of the
Figure 4.2.4 Peri-Urban UCs Split into
Inside and Outside of the Project Area

Project for Integrated Solid Waste Management
Master Plan in Gujranwala
Draft Final Report
Volume 1 Main Report
CTI Engineering International Co., Ltd. NJS Consultants Co., Ltd.
EX Research Institute Ltd.
107
Institute of Public Policy. Punjab’s average real GDP growth rate of 2.5 per cent between 2007 and 2011
lags far behind 3.4 per cent for the rest of Pakistan. The shortfall experienced in Punjab during the same
period compared with the rest of Pakistan is mainly due to the irregular agricultural production which is
the major sector of Punjab. Nevertheless, for the long-term perspective, the real GDP growth rates for
the entire country of Pakistan and Punjab have been growing at the almost same pace. Table 4.2.5 and
Table 4.2.6 give the comparison of long-term past GDP real growth rate record among Punjab, the rest
of Pakistan and Pakistan during 1973-2000 and 2000-2011, respectively. The figures indicate that the
GDP real growth rates of Punjab and the whole Pakistan are almost same during the past long-term
record in 1973-2000 and the recent record in 2000-2011.
Table 4.2.4 GDP Real Growth Rate, Inflation Rate and Nominal GDP Growth Rate per Annum
of Pakistan during 2009-2013
Indicator 2009 2010 2011 2012 2013
(Provisional)
Real GDP Growth Rate per Annum (%) 0.4 2.6 3.7 4.4 3.6
Inflation Rate per Annum (%) 17.0 10.1 13.7 11.0 7.4
Nominal GDP Growth Rate per Annum (%) 17.4 12.7 17.4 15.4 11.0
Source: Seventh Annual Report, the State of the Economy: Challenges and Response by Institute of Public Policy (2014)
Table 4.2.5 Comparison of GDP Real Growth Rate Record among Punjab, Rest of Pakistan
and Pakistan during 1973-2000
Year Punjab (%) Rest of Pakistan (%) Pakistan (%)
1973-1980 4.3 3.8 4.1
1980-1990 6.0 6.3 6.1
1990-2000 4.8 3.9 4.4
1973-2000 5.1 4.8 5.0
Source: Fifth Annual Report, the State of the Economy: Punjab Story by Institute of Public Policy (2012)
Table 4.2.6 Comparison of GDP Real Growth Rate Record among Punjab, Rest of Pakistan
and Pakistan during 2000-2011
Year Punjab (%) Rest of Pakistan (%) Pakistan (%)
2000-2006 6.9 7.8 7.4
2007-2011 3.3 1.6 2.3
2000-2011 5.6 5.5 5.5
Source: Fifth Annual Report, the State of the Economy: Punjab Story by Institute of Public Policy (2012)
Based on the above presumption, the IMF’s macroeconomic medium-term projections are employed to
provide the economic growth perspective which is the basis for the population projection of the master
plan, as discussed in the preceding Subsection 4.2.1. Table 4.2.7 indicates the IMF’s mid-term
macroeconomic framework for Pakistan. The annual GDP real growth rates for the long-term period are
estimated at 5.0 per cent per annum. These real GDP growth rates per annum starting from 2016 are
employed to estimate the projection of the population used for the master plan.
Table 4.2.7 IMF’s Medium-Term Macroeconomic Framework
Indicator 2014 2015 2016 2017 2018 2019-
Real GDP Growth Rate per Annum (%) 3.1 3.7 3.9 4.7 5.0 5.0
Inflation Rate per Annum (%) 8.8 9.0 7.0 6.0 6.0 6.0
Nominal GDP Growth Rate per Annum (%) 11.9 12.7 10.9 10.7 11.0 11.0
Source: Seventh Annual Report, the State of the Economy: Challenges and Response by Institute of Public Policy (2014)

Draft Final Report
Volume 1 Main Report
Project for Integrated Solid Waste Management
Master Plan in Gujranwala
108
CTI Engineering International Co., Ltd. NJS Consultants Co., Ltd.
EX Research Institute Ltd.
4.2.3 Social Considerations
As many as six categories of issues, such as Law and Regulation, EIA Process, SEA, Public Disclosure,
Environmental Monitoring, and Workers in Risk, must be considered for the formulation of the Master
Plan and implementation of the Action Plan.
Laws and Regulations: There are some possibilities of ignorance of social issues in the landfill site and
its vicinity because only limited issues related to social environment are mentioned in Pakistan laws and
regulation in terms of waste management. Loss of ignorance of social issues, such as ignorance of
stakeholders’ opinion, will reveal no cooperation from stakeholders. The situation could be negative
impact to the whole progress of the master plan formulation. To consider social issues, the JICA
Guidelines for Environmental and Social Considerations will be referred.
EIA Process: Construction of new landfill site can be started only if its EIA report is approved. Delay of
EIA approval will reveal illegal dumping. Some effort is already made to make the EIA approval process
shorter. However, since delay of EIA approval is obvious, some measures should be carried out to avoid
illegal dumping.
SEA: Since Strategic Environmental Assessment (SEA) is not a legal requirement in Pakistan, the JICA
Guidelines for Environmental and Social Considerations will be referred to in the formulation of the
Master Plan.
Public Disclosure: Public disclosure should be one of the important components in the formulation of
the Master Plan. According to opinions of stakeholders, most of the respondents recognise that having a
disposal site is beneficial for future Gujranwala. However, they are anxious about adverse impact such
as health risk and environmental pollution. The information must be explained sufficiently. If
complaints and anxiousness were not solved, it reveals that residents had built a sense of distrust to
GWMC, and finally they will become reluctant to cooperate with GWMC. Programmes of public
inclusion such as public meetings and awareness programmes shall be considered in the formulation of
the Master Plan.
Environmental Monitoring: For long-term environmental and friendly waste management,
establishment of a monitoring system is one of the important components of the Master Plan. Attention
and effort should be paid for implementation of regular environmental monitoring in the formulation of
the Master Plan. The result of Environmental and Social Consideration Survey in Gondlanwala and
Chianwali (see Chapter 5) shows that no regular environmental monitoring had been carried out.
Environmental monitoring is applied not only in the operational stage but also after closure of the
disposal site, since the Punjab Municipal Solid Waste Management Guideline 2011 shows “A plan for
monitoring groundwater, surface water and landfill gas, erosion and settlement for a minimum
post-closure period of 25 years.”
Workers in Risk: Currently, they are working in severe condition with dangerous environment and
health risk, and their activities sometimes hinder management of GWMC. In the Master Plan, it is
proposed that waste pickers are involved in the official process of solid waste management. They can be
involved in the various programmes for sorting recyclable materials at the controlled area or in organic
waste composting. Trying to get rid of waste pickers will result in failure according to the past examples
in many developing countries. Waste pickers should be involved as a part of the waste management
system. It would benefit both Gujranwala and themselves.
4.3 Present and Future Waste Amounts and Composition
Future waste amount is predicted based on the various factors and waste management stream including
service population, collection service ratio, per capita waste generation amount, recovery amount of
recyclable materials, etc. This section presents the study about those factors for prediction of future
waste generation amount to provide basic data and solid waste management flow to formulate the

Project for Integrated Solid Waste Management
Master Plan in Gujranwala
Draft Final Report
Volume 1 Main Report
CTI Engineering International Co., Ltd. NJS Consultants Co., Ltd.
EX Research Institute Ltd.
109
ISWM Master Plan comprised of collection and transportation plan, intermediate and 3R promotion
plan, final disposal plan and other soft components.
4.3.1 Relation between Waste Collection Amount and Waste Generation Amount
The relation between current waste collection amount and waste generation amount is examined based
on the results of waste amount and composition survey and incoming waste amount and composition
survey which are carried out in the course of the Project. The step-wise study is carried out in accordance
with the flow chart shown in Figure 4.3.1 and described in the following subsections.
Figure 4.3.1 Flowchart for Confirmation of Present Waste Amount (2014)
(1) Per Capita Waste Generation Rate in 2014
WACS survey was carried out at the areas categorised as high income group area, middle income
group area and low income group area in 64 urban UCs and rural area in peri-urban UCs. Weight of
the samples discharged from 10-30 households of each income group for 7 days were processed
and converted by the family size of each household to obtain the per capita waste generation
amount. The information on the population of each income groups was not available. Therefore, the
survey was conducted together with the sanitary supervisor of each UC to categorise the 64 urban
UCs into each income group area. Table 4.3.1 summarises the survey result for the numbers of
UCs categorised into three income groups. From this result, the ratio of 10%, 60% and 30% were
set for the high income group, middle income group and low income group, respectively.
Table 4.3.1 Income Group Ration in 64 Urban UCs
Income Level No. of UCs Ratio (%) Adopted Ratio (%)
High Income Group UCs 6 9.4 10
Middle Income Group UCs 36 56.2 60
Low Income UCs 22 34.4 30
Total 64 100.0 100
Collected Waste Amount from Weighbridge Record
(410 t/d: 100%)
Population in 64 Urban UCs (2.05 million: Base Year 2014)
Per capita waste Generation Amount (400 g/c/d)
WACS Survey Result
Domestic Waste Generation Amount (821 t/d)
Present Served Area/Ratio of Domestic
Waste (43%)
Present Waste Collection Area
Served Area
Partially Served Area
Un-served Area
Domestic Waste Collection Amount in Present Waste
Collection Area
(353 t/d :86%) Balance (57 t/d: 14%)
Waste from other than Domestic Sources
(Commercial & Institutional Wastes)

Draft Final Report
Volume 1 Main Report
Project for Integrated Solid Waste Management
Master Plan in Gujranwala
110
CTI Engineering International Co., Ltd. NJS Consultants Co., Ltd.
EX Research Institute Ltd.
The domestic waste generation ratio of each income group was processed by the weight of each
income group obtained from the number of UCs in order to determine the average per capita waste
generation rate of 64 urban UCs. Table 4.3.2 summarises the domestic waste per capita waste
generation rate of the first and second waste amount survey for each income group and the
weighted average while the third waste amount survey result is shown for the reference. As a result,
the per capita waste generation rate for 64 urban UCs is adopted at 0.40 kilogramme per capita per
day (kg/c/d) and 0.35 kg/c/d for the peri-urban UCs for estimating waste generation amount for the
base year 2014.
Table 4.3.2 Adopted Per Capita Domestic Waste Generation Rate in 2014
Area Category
Per Capita Waste Generation Amount from WACS Survey (kg/capita/day)
1st WACS
Survey
2nd WACS
Survey Average
Income Group
Ratio
Weighted
Average
3rd WACS
Survey*
High income area 0.46 0.45 0.46 10%
0.40
0.48
Middle income area 0.41 0.36 0.39 60% 0.29
Low income area 0.40 0.40 0.40 30% 0.33
Rural area 0.33 0.36 0.35 100% 0.35 0.26
Note:* The third waste amount survey result is not used for the formulation of the master plan since the last result was obtained on July 2015 that was almost the final stage of the project.
(2) Daily Average Incoming Waste Amount at Gondlanwala Temporary Disposal Site
GWMC carries out waste collection services within the area of 64 urban UCs and the collection
service in 34 peri-urban UCs is basically not carried out at present. GWMC started weighing
incoming waste amount at the Gondlanwala temporary disposal site since September 2014 by the
weighbridge installed by the Project. According to the analysis of daily incoming waste amount
tabulated in Table 4.3.3, the average daily incoming waste amount during the last 6 months are
obtained at 410 tons per day, which are collected from domestic (households), commercial,
business, institutional and other waste generation sources.
Table 4.3.3 Daily Average Regular Time Waste Collection Amount (Sep.2014 - Feb.2015)
Month-Year Breakdown of Incoming Waste Amount at Gondlanwala Disposal Temporary Site (t/d)
Total Waste Amount Regular Collection Service One Time Collection Service
September - 2014 439 428 11
October - 2014 540 373 167
November - 2014 423 371 52
December - 2014 419 368 51
January - 2015 493 451 42
February - 2015 517 469 48
Average 472 410 62
(3) Waste Collection Area and Service Population
As discussed previously in Subsection 2.3.2, GWMC demarcated the entire area of 64 urban UCs
into served area, partially served area and unserved area through the field survey and the interview
with the sanitary supervisors of each UC. The result of demarcation work in town-wise area and
ratio is as shown is Table 4.3.4. In order to determine the regular waste collection service area,
assumption was made based on the current operation condition that the collection service has been
carried out once in a week (1 time per 7 days) more or less in the partial collection service area and
adjusted the regular collection service area. As a result, the served area adjusted by conversion of
the partially served area to served area for every 4 towns, i.e., Qila Didar Singh, Khiali Shahpur,
Aroop and Nandipur is calculated at 35%, 27%, 40% and 69%, respectively. Consequently, the
present waste collection area or served population is estimated at 43% for domestic waste for the
average of these percentages.

Project for Integrated Solid Waste Management
Master Plan in Gujranwala
Draft Final Report
Volume 1 Main Report
CTI Engineering International Co., Ltd. NJS Consultants Co., Ltd.
EX Research Institute Ltd.
111
Table 4.3.4 Demarcation of Waste Collection Service Area (March 2014)
Name of Town Served Area
(km2)
(1)
Partially
Served Area
(km2)
(2)
Unserved
Area
(km2)
(3)
Total
Area
(km2)
(4)
Converted
Served Area
(km2)
(5) = (2) / 7
Adjusted
Served Area
(km2)
(6) = (1) + (5)
Qila Didar Singh 2.5 6.1 1.0 9.6 0.9 3.4
(%) (25.9) (63.6) (10.5) (100.0) (9) (35)
Khiali Shahpur 3.5 13.4 3.0 19.8 1.9 5.4
(%) (17.5) (67.4) (15.0) (100.0) (10) (27)
Aroop 8.6 4.6 10.1 23.4 0.7 9.3
(%) (37.0) (20.0) (43.0) (100.0) (3) (40)
Nandipur 8.0 2.5 1.7 12.2 0.4 8.4
(%) (65.6) (20.8) (13.6) (100.0) (3) (69)
Note: Totals may neither become 100% nor always be equal to the sum of the subjected column or row due to rounding off to the first decimal point.
(4) Estimation of Present Waste Generation Amount, Domestic and Commercial
Wastes
The population in 64 urban UCs in 2014 is estimated at approximately 2.05 million. Assuming that
the collection service ratio is 43% as mentioned above, the served population is calculated at
882 thousand. The domestic waste amount deemed collected is estimated at 353 t/d with the
relation between the said service population and the per capita waste generation rate at 400 g/c/d.
On the other hand, as mentioned before, the collected and transported waste amount carried into the
final disposal site is determined at 410 t/d. Accordingly, the balance between the estimated waste
generation amount in the service area of 353 t/d and the total waste disposal amount of 410 t/d is
considered as the waste from other than domestic source such as commercial, business and
institutional waste generators. Based on this result, the present domestic waste ratio and
commercial and institutional waste ratio is determined at 86% and 14%, respectively, to the total
waste collection and transportation amount for further analysis to predict the future waste amount.
4.3.2 Estimation of Future Waste Generation Amount
Waste generation amount in the Project Area is carried out separately for domestic waste, and
commercial and institutional waste in 64 urban UCs and peri-urban UCs based on the step-wise works as
shown in Figure 4.3.2.
Estimation of domestic waste generation amount is carried out based on the estimated future population
adjusted with the Project Area presented in Subsection 4.2.1, Population Projection and the per capita
waste generation rate. The per capita waste generation rate tends to increase depending on the economic
development and increase of disposable income of each individual. On the other hand, the per capita
waste generation rate decrease depending on the implementing status of 3R programmes proposed in the
ISWM Master Plan. In fact, the present waste generation rate per capita per day at 400 g/c/d in the 64
urban UCs and 350 g/c/d in the 34 peri-urban UCs are still low compared with those of the neighbouring
developing countries. Considering the said situations, the minimum increase rate of 1% per annum is
assumed as the per capita waste generation rate. The per capita waste generation rate in 64 urban UCs
and 34 peri-urban UCs are as summarised in Table 4.3.5.
Table 4.3.5 Per Capita Domestic Waste Generation Rate (Unit: g/c/d)
UCs 2014 2015 2016 2017 2018 2019 2020 2021 2022 2023 2024 2025 2026 2027 2028 2029 2030
Urban UCs 400 404 408 412 416 420 424 428 432 436 440 444 448 452 457 462 467
Peri-urban UCs 350 354 358 362 366 370 374 400 404 386 390 394 398 402 406 410 414

Draft Final Report
Volume 1 Main Report
Project for Integrated Solid Waste Management
Master Plan in Gujranwala
112
CTI Engineering International Co., Ltd. NJS Consultants Co., Ltd.
EX Research Institute Ltd.
Figure 4.3.2 Flowchart for Estimating Future Waste Generation Amount
Under this Project, the waste amount of commercial, business, institutional and other sources are
estimated in the relation of collection amount and the ratio to the domestic waste. Table 4.3.6 shows the
planned domestic waste collection rate which was determined after several discussions among the
parties concerned. The waste collection rate in the 64 urban UCs is set at 100% in 2018 and the
collection rate of 34 peri-urban UCs is determined to start with 10% in 2019 and set the target to reach
100% in 2030. Meanwhile, the mixed ratio of commercial and institutional wastes to domestic waste
collection amount is determined at 14% for the area of 64 urban UCs and 12% for the area of 34
peri-urban UCs in 2014. With regard to the mixed ratio of 34 peri-urban UCs set at 12%, it was
determined by the relation of per capita waste generation ratio in the area of 64 urban UCs and that of 34
peri-urban area. In addition, the economic growth in the area brings about more discharged amounts of
commercial and business wastes. It is assumed that the growth of mixed ratio of commercial waste will
become double in the final target year of the Project in 2030 compared with that of the year 2015 as
summarised the mixed ratio of commercial and institutional waste in Table 4.3.7.
Table 4.3.6 Planned Domestic Waste Collection Rate (Unit: %)
UCs 2014 2015 2016 2017 2018 2019 2020 2021 2022 2023 2024 2025 2026 2027 2028 2029 2030
Urban UCs 43 57 71 85 100 100 100 100 100 100 100 100 100 100 100 100 100
Peri-urban UCs 0 0 0 0 0 10 20 30 40 50 60 67 73 80 87 93 100
Table 4.3.7 Commercial and Institutional Waste Ratio to Domestic Waste Amount for Collection
(Unit: %)
UCs 2014 2015 2016 2017 2018 2019 2020 2021 2022 2023 2024 2025 2026 2027 2028 2029 2030
Urban UCs 14 15 16 17 18 19 20 21 22 23 24 25 26 27 28 29 30
Peri-urban UCs 12 13 14 15 16 17 17 18 19 20 21 22 23 24 24 25 26
The future waste generation amount is estimated by the factors mentioned above, and summarised in
Table 4.3.8 and in Figure 4.3.3. As a result of the estimation of future waste generation amount in the
Project Area, the present waste amount of 1,200 t/d in 2014 will increase up to 3,346 t/d in 2030 which
is approximately 2.8 times of the present waste amount.
Total Waste Generation Amount
(Potential Waste Discharge Amount for Collection including Domestic,
Commercial and Institutional Wastes)
Estimation of Population in 64 urban UCs and 34 peri-urban UCs
Assumption of Future Per capita waste Generation Amount
WACS Survey Result Per capita waste Generation Amount in 2014
(Urban UCs: 400 g/c/d) (Peri-Urban UCs: 350 g/c/d)
Estimation of Domestic Waste Generation Amount in Future
Domestic Waste Collection Amount in 64 urban UCs and 34 peri-urban UCs
Planned Domestic Waste Collection Ratio in Urban UCs and Peri-Urban UCs
Commercial and Institutional Wastes Amount in Urban UCs and Peri-Urban UCs

Project for Integrated Solid Waste Management
Master Plan in Gujranwala
Draft Final Report
Volume 1 Main Report
CTI Engineering International Co., Ltd. NJS Consultants Co., Ltd.
EX Research Institute Ltd.
113
Table 4.3.8 Estimated Waste Generation Amount in the Project Area (Unit: t/d)
UCs 2014 2015 2016 2017 2018 2019 2020 2021 2022 2023 2024 2025 2026 2027 2028 2029 2030
Domestic 64 UCs 821 861 903 946 991 1,039 1,089 1,140 1,195 1,251 1,311 1,373 1,438 1,506 1,580 1,658 1,739
Domestic 34 UCs 318 334 351 368 386 406 425 446 468 491 515 540 566 593 622 652 683
Commercial 61 90 126 169 223 250 286 327 372 422 478 536 598 668 746 831 924
Total Project Area 1,200 1,285 1,380 1,483 1,600 1,694 1,800 1,913 2,035 2,165 2,304 2,449 2,602 2,766 2,948 3,140 3,346
Figure 4.3.3 Domestic Waste Generation Amount and Collected Commercial Waste Amount in 98 UCs
Note: Domestic waste generation amount is estimated by the per capita waste generation rate and the population of each year.
Commercial waste amount is estimated based of the proportion to the domestic waste collection amount of each year.
4.3.3 Domestic Waste Composition
Table 4.3.9 shows the domestic waste composition of
the second WACS. The values are obtained by
processing the waste composition result of high
income group, middle income group and low income
group by the weight of each population size as well as
the method adapted to the calculation of the average
waste generation rate per capita per day. These values
are studied to consider 3R and intermediate treatment
as described in the following paragraph.
Each component of domestic waste composition is
categorised for consideration in material recovery,
composting and RDF treatment as shown in
Table 4.3.10. The total recyclable materials ratio is
26.5% and the clean recyclable takes 5.6% which
accounts for only 20% of the total recyclable
materials. The ratio of biodegradable wastes, total of
kitchen waste and grass and wood, accounts for 61 %
which shows higher composting potential from the
results of the WACS survey. The total of combustible
waste takes 31% of the domestic waste for
consideration of RDF and incineration treatment as
well. From the WACS survey results, the mixed ratio
of resource materials for planning is proposed at 30%
for material recycling, 60% for composting and 30% for RDF.
Table 4.3.9 Weighted Average of Domestic
Waste Composition
Waste Composition Ratio (%)
Kitchen waste 59.37
Paper (recyclable) 2.63
Paper (non-recyclable) 13.46
Textile 4.80
Grass and wood 1.64
Plastic (recyclable) 0.89
Plastic (non-recyclable) 7.26
Leather and rubber 0.79
Metal (recyclable) 0.21
Metal (non-recyclable ) 0.01
Bottle and glass (recyclable) 1.12
Bottle and glass (non-recyclable) 0.15
Ceramic, stone and soil etc. 1.46
Domestic hazardous wastes 0.65
Sieve Remaining 3.76
Miscellaneous 1.80
Total 100.00
Unit: t/d

Draft Final Report
Volume 1 Main Report
Project for Integrated Solid Waste Management
Master Plan in Gujranwala
114
CTI Engineering International Co., Ltd. NJS Consultants Co., Ltd.
EX Research Institute Ltd.
Table 4.3.10 3R and Intermediate Potential by Domestic Waste Composition
Material Recycling Potential Composting Potential RDF/Incineration Potential
Component Ratio (%) Component Ratio (%) Component Ratio (%)
Paper (recyclable) 2.63 Kitchen waste 59.37 Paper (recyclable) 2.63
Plastic (recyclable) 0.89 Grass and wood 1.64 Paper (non-recyclable) 13.46
Leather and rubber 0.79 Total 61.01 Textile 4.80
Metal (recyclable) 0.21
Grass and wood 1.64
Bottle and glass (recyclable) 1.12
Plastic (recyclable) 0.89
Subtotal (clean recyclables) 5.64
Plastic (non-recyclable) 7.26
Paper (Non-Recyclable) 13.46
Leather and rubber 0.79
Plastic (non-recyclable) 7.26
Total 31.46
Metal (non-recyclable ) 0.01
Bottle and glass (non-recyclable) 0.15
Subtotal (dirty recyclables) 20.88
Total Recyclable Wastes 26.52
Proposed Value for Planning 30% 60% 30%
4.3.4 Waste Stream and Amount in Formulation of ISWM Master Plan for
Gujranwala
Waste amount is estimated for each stage of waste management operation based on the waste generation,
planned waste collection ratio, intermediate treatment and 3R promotion planning including recovery of
recyclable materials, composting of organic waste, and final disposal. Table 4.3.11 shows the summary
of the present estimated waste amount in each stage of operation. As of 2014, the waste amount is
estimated at 1,200 t/d for waste generation, 724 t/d for uncollected waste amount, 66 t/d for recovery
amount of recyclable materials in town and at the disposal site, 410 t/d for waste collection amount and
406 t/d for final disposal after reduction of recovery of recyclable materials of 4 t/d at the disposal site.
The flow and waste amount in 2014 are shown in Figure 4.3.4.
Table 4.3.11 Waste Amount for Major Elements in Waste Management Stream in 2014
Item 2014
Total Waste Generation Amount (t/d) 1,200
Uncollected Waste Amount (t/d) 724
Waste Collection Ratio in 64 Urban UCs (%) 54
Waste Collection Ratio in 34 Peri-urban UCs (%) 0
Waste Discharge Amount for Collection (t/d) 476
Waste Generation Prevention Amount (t/d) 0
Recovery Amount of Resource Materials (t/d) 66
Intermediate Treatment Amount (Composting/RDF) (t/d) 0
Waste Collection Amount (t/d) 410
Recovery of Resource Materials at Disposal Site (t/d) 4
Waste Disposal Amount (t/d) 406

Project for Integrated Solid Waste Management
Master Plan in Gujranwala
Draft Final Report
Volume 1 Main Report
CTI Engineering International Co., Ltd. NJS Consultants Co., Ltd.
EX Research Institute Ltd.
115
Figure 4.3.4 Waste Management Flow and Estimated Waste Amount in 2014
4.4 Waste Collection and Transportation Plan
4.4.1 Development of Alternatives for Waste Collection and Transportation Plan
(1) Planning Concept for Development of Alternatives
For selecting the optimum waste collection and transportation plan, possible options will be
developed depending upon what kind of waste is dealt with, what kind of vehicle and equipment are
used, what method of waste transfer can be applied and so forth. The following concept is adopted
to enumerate the possible alternatives.
Introduction of Source Separation (a)
Waste generated from households or commercial entities can be separated when it is
discharged for collection, and this is one of important options in the master plan to determine
which collection and transportation method is adopted appropriately at the site. Additionally,
as waste recovery such as composting or RDF facility is applied in the city, separated waste
like organic waste is necessary for the plant. The collected waste after source separation would
have the potential to convert to the environmental friendly resource.
Source separation is also beneficial for the residents who segregate valuables and sell them to
waste pickers or junk shops in the city at present. If source separation is disseminated to the
residents, they will have opportunities to earn money from the waste which they used to
dispose as the garbage.
Currently, GWMC collects mixed waste and transfers to the landfill site. The condition of
waste is deteriorating and has bad odour because a collection vehicle collects and transfers the
container only when it becomes full of waste. It is difficult to separate organic waste from the
other wastes. In addition, there is no custom such as source separation in residents at present. It
means the most potential recyclable material is disposed as it is.
There is a concern that it might take time to disseminate and promote such a new system to the
residents. However, it is assumed that the issue can be solved by conducting public awareness
campaigns, monitoring the disposal method around the container or introducing a different
type of container on site. In this sense, public campaigns to support this effort should be started
in the early stage to build understanding about the importance of proper solid waste
management among the residents.
1,200 476
466
406410
724
Waste generation Collection amountFinal disposal amount
Recycling amountRecovery amount
Illegal dumping/Self-disposal
Discharge amount
Unit:ton/day

Draft Final Report
Volume 1 Main Report
Project for Integrated Solid Waste Management
Master Plan in Gujranwala
116
CTI Engineering International Co., Ltd. NJS Consultants Co., Ltd.
EX Research Institute Ltd.
Since one of the ultimate purposes in integrated solid waste management (ISWM) is the
recycling of waste, source separation matches with the goal of the ISWM. Therefore, source
separation activity for waste collection starts from the Mid-Term, i.e., 2019 in this master plan.
Waste Collection Method by Street Condition (b)
The road configuration in Gujranwala City is complicated and it is difficult to distinguish it as
categories. However, there is a general tendency to categorise the residents based on the street
condition seen in almost all areas of the city into income levels: high income group, middle
income group and low income group. Street width in the middle income group and low income
group in Gujranwala City is narrow, and there is no room for two-way traffic. On the contrary,
street width in the high income group is wider than that of middle income and low income
group. Since the width of the street affects the waste collection and transportation method
during the operation, the waste collection and transportation options in this study takes into
account the following two street conditions: narrow and wide streets.
(i) Narrow Street
The street with a width of less than four (4) metres is defined as a narrow street from the
viewpoint of workability of collection vehicles. In general, an arm-roll truck and a large
compactor cannot approach the road in this case.
For instance, the width of an arm-roll truck is 2.5 metres and the street gutter on one side is
0.5 metre. Based on the situation of a narrow street, a sanitary worker has to conduct waste
collection in the space of only 0.25 metre width of street, which will reduce the working
efficiency significantly. Large vehicles are not usable in the narrow streets.
(ii) Wide Street
The street with a width of more than four (4) metres is considered as a wide street. Any type
of waste collection vehicle is able to access this street.
Consideration of Waste Discharge Method (c)
The waste discharge method is also considered since the method of discharging the waste is
closely related to the method of collection and haulage. In consideration of the site condition,
three (3) methods are discussed in this study: door-to-door, curbside (stationary) and waste
container. The conditions in each case are described as follows:
(i) Door-to-Door
The residents pass the waste to a sanitary worker during the collection. This waste
discharge method is applicable for a narrow street and it is currently applied in middle and
low income group areas in the city.
(ii) Curbside (Stationary)
The residents are obliged to put the waste to a designated discharge point and the sanitary
worker collects the disposed waste on site. This waste discharge method is applicable for a
wide street and it is currently applied in high income group areas in the city.
(iii) Waste Container
The residents need to dump the waste into the container on a designated location. This
waste discharge method is applicable for a wide street and GWMC mainly uses this
method.
Project for Integrated Solid Waste Management
Master Plan in Gujranwala
Draft Final Report
Volume 1 Main Report
CTI Engineering International Co., Ltd. NJS Consultants Co., Ltd.
EX Research Institute Ltd.
117
(2) Possible Options for Waste Collection and Transportation
Based on the above preconditions, possible options for waste collection and transportation can be
evolved in accordance with the actual operation procedures; specifically, there are two (2) options
in primary collection method on a narrow street and other two (2) options exist in secondary
collection on a wide street.
Since the primary collection options only can be adopted in waste collection on a narrow street
while the waste collection on a wide street does not require the primary collection, the following
two (2) are exclusively considered:
Primary collection method on a narrow street; and
Secondary collection method on a wide street.
Primary Collection Method on a Narrow Street (a)
Two options, namely, (i) mini-dumper and (ii) mini-compactor are set as the primary
collection methods on a narrow street in this case. GWMC utilises mini-dumpers for waste
collection in the low income group area of the city although GWMC does not apply
mini-compactors for waste collection.
The carrying capacity of both mini-dumper and mini-compactor is quite small at 500kg of
waste per one trip for one mini-dumper and 2.0 tons of waste per one trip for one
mini-compactor. Therefore, both cases necessitate a transfer station to make up for the small
haulage amounts per one trip and increase in the number of trips. Collected waste by a
mini-dumper is transported to the landfill site via the transfer station as one of the waste
transportation system in the study.
The waste collection using mini-dumpers has some alternatives depending on the combination
of auxiliary equipment, i.e., (i) mini-dumper + arm-roll truck, (ii) mini-dumper + compaction
unit + arm-roll truck, (iii) mini-dumper + compactor and (iv) mini-dumper + compaction
container + arm-roll truck.
Handcarts are checked off in this study since the handcart is a subsidiary tool for waste
collection and its function will decrease if a mini-dumper or a mini-compactor starts operating
the waste collection. In summary, the following five (5) alternatives are to be considered for
the comparison.
(i) Mini-dumper + Arm-Roll Truck
Mini-dumpers dump collected waste into a 10 cubic metres (m3) container in the transfer
station. Once the container is filled with waste, a 10m3 arm-roll truck hauls the waste to the
landfill site.
(ii) Mini-dumper + Compaction Unit + Arm-Roll Truck
Mini-dumpers dump collected waste into a 10m3 container in the transfer station. After the
compaction unit in the transfer station compresses the waste, a 10m3 arm-roll truck hauls
the waste to the landfill site.
(iii) Mini-dumper + Compaction Container + Arm-Roll Truck
Mini-dumpers dump collected waste into a container with the compaction unit in the
transfer station. After the compaction unit in the transfer station has compressed the waste,
a 10m3 arm-roll truck hauls the waste to the landfill site.

Draft Final Report
Volume 1 Main Report
Project for Integrated Solid Waste Management
Master Plan in Gujranwala
118
CTI Engineering International Co., Ltd. NJS Consultants Co., Ltd.
EX Research Institute Ltd.
(iv) Mini-dumper + Compactor
Mini-dumpers dump collected waste into a compactor of 13m3
capacity in the transfer
station. After the compaction unit in the transfer station has compressed the waste, the
compactor hauls the waste to the landfill site.
(v) Mini-compactor
Mini-compactors haul the collected waste from each generation source to the landfill site
directly. No transfer station is required in this option.
Secondary Collection Method on a Wide Street (b)
On wide streets in the city, (i) arm-roll truck and (ii) compactor are to be applied as the
secondary collection method in the study, as follows.
(i) Arm-Roll Truck
One or two containers (10m3 or 5m
3) are deployed on the street based on the present road
and traffic conditions. This method has been broadly utilised in the city.
(ii) Compactor
One or two small containers (0.8m3) are deployed on the street. This method is being
applied in Lahore at present.
(3) Development by Combination of Waste Collection and Transportation Options
Based on the possible options enumerated in the above, the waste collection and transportation
method is developed by combination of these options. Figure 4.4.1 illustrates the flow chart of a
combination of collection method on each operation stage, and all cases for comparison of each
waste collection and transportation alternative are shown in Figure 4.4.2.
Figure 4.4.1 Flowchart of Combination of Collection Method of Each Operation Stage

Project for Integrated Solid Waste Management
Master Plan in Gujranwala
Draft Final Report
Volume 1 Main Report
CTI Engineering International Co., Ltd. NJS Consultants Co., Ltd.
EX Research Institute Ltd.
119
Figure 4.4.2 All Cases for Comparison of Each Waste Collection and Transportation Alternative
(4) Comparison of Each Option for Waste Collection Method on a Narrow Street
Cases for Comparison (a)
Due to the road condition, this method is applied to middle and low income group area. Waste
discharge method in each case is door-to-door collection. There is no enough space for
stationary point or container point. For selecting waste collection system on a narrow street,
five cases as shown in Table 4.4.1 are set. The waste collection and transportation method on
a narrow street applies the optimal case in the table.
Table 4.4.1 Summary of Each Case on a Narrow Street
Item Waste Discharge Primary Collection Transfer / Transportation
Case 1-1
Door-to-Door Mini-dumper
Mini-dumper + Arm-roll truck
Case 1-2 Mini-dumper + compaction unit + Arm-roll truck
Case 1-3 Mini-dumper + container w/ compaction unit +
Arm-roll truck
Case 1-4 Mini-dumper + Compactor
Case 1-5 Mini-compactor -
Case1-1: A mini-dumper collects waste and dumps it into a container at the transfer station.
Once the container is filled with waste, an arm-roll truck hauls it to the landfill site.
Case 1: Narrow Street
Type of Street Waste Discharge Primary Collection Transfer/ Transportation Secondary Collection
Case 1-1 Narrow street door-to-door mini dumper mini dumper+a-r truck arm-roll truck
Case 1-2 Narrow street door-to-door mini dumpermini dumper+compaction
unit+a-r truckarm-roll truck
Case 1-3 Narrow street door-to-door mini dumpermini dumper+container
w/compaction unit+a-r truckcompactor
Case 1-4 Narrow street door-to-door mini dumper mini dumper+compactor compactor
Case 1-5 Narrow street door-to-door mini compactor
Case 2: Wide Street
Type of Street Waste Discharge Primary Collection Transfer Station Secondary Collection
Case 2-1 Wide street curb side compactor
Case 2-2 Wide street waste container small container compactor
Case 2-3 Wide street waste container large container arm-roll truck

Draft Final Report
Volume 1 Main Report
Project for Integrated Solid Waste Management
Master Plan in Gujranwala
120
CTI Engineering International Co., Ltd. NJS Consultants Co., Ltd.
EX Research Institute Ltd.
Case1-2: A mini-dumper collects waste and dumps it into a container at the transfer station.
Once the container is filled with waste, an arm-roll truck hauls it to the landfill site.
Necessary area of the transfer station is smaller than in Case1-1.
Case1-3: A mini-dumper collects waste and dumps it into container attached to a compaction
unit at the transfer station. A compaction unit with a container compresses the
collected waste in the container. An arm-roll truck hauls the waste to the landfill
site after compaction by compaction unit. Necessary area of the transfer station is
smaller than in Case1-1. The difference between Case 1-2 and Case 1-3 is the
compaction method and type of compaction machinery.
Case1-4: A mini-dumper collects waste and takes it to the transfer station. A large compacter
receives the waste from the mini-dumper and compresses it. A large compactor
hauls the waste to the landfill site after compaction of the waste by compaction
unit. Necessary area of the transfer station is the smallest in four cases (Case1-1 to
Case 1-4).
Case1-5: A mini-compactor collects waste and hauls it to the landfill site directly. The
transfer station is omitted in this case.
Transfer Station (b)
Mini-dumpers used to haul the waste and dump it at Sabrri Chowk transfer station, UC No. 17,
and Qadri Darbar, UC No. 52. However, the land got full of garbage and seemed to be like a
temporary landfill site. Unloaded waste on the ground has been scooped by wheel loader and
dumped into a 5m3 container. An arm-roll truck came to pick up the container when it was full
of garbage. The unloaded garbage was chronically there because waste collection vehicles
kept coming to dump the waste there. For this reason, GWMC got complaints from the
residents near Qadri Darbar transfer stations and had to close the operation. Sabrri Chowk
transfer station was also closed because GWMC found another place for the transfer station in
Mugal Chowk, UC No. 12,
located in the north-eastern
part of the city and near the
Sialko, where a bypass road
is located.
Currently, some waste is
collected by mini-dumper
and transported to the open
plot in Mughal Chowk.
Transported waste is loaded
into a container on site by
wheel loader and is hauled
to the landfill site. GWMC
rents the land and uses it as
a temporary transfer
station. However, the
condition of the land is the same as the previous transfer stations. It might be a matter of time
before closure due to complaints from the residents near the transfer station.
For comparing five cases, the location of the transfer station is set in this site. The site is close
to a large road, Sialkot Bypass Road. Figure 4.4.3 shows the tentative location of the transfer
station.
Figure 4.4.3 Tentative Location of the Transfer Station

Project for Integrated Solid Waste Management
Master Plan in Gujranwala
Draft Final Report
Volume 1 Main Report
CTI Engineering International Co., Ltd. NJS Consultants Co., Ltd.
EX Research Institute Ltd.
121
Comparison of Each Case on a Narrow Street (c)
The selection criteria in this study consider the following conditions: (i) Environmental
impact, (ii) Workload, and (iii) Cost comparison.
(i) Environmental Impact
If a transfer station is located in a residential area, the residents near the station might
complain about the odour from the transfer station. There is no environmental impact on
direct hauling.
(ii) Workload
Collected waste has to be unloaded at the transfer station, again. It is not efficient to
transfer collected waste at the transfer station. It is efficient if collected waste is hauled to
the landfill site directly.
(iii) Cost Comparison
For estimating the cost on each case, vehicle, compaction unit and container cost
information is provided from the local supplier. The annual cost of each vehicle is set with
consideration of depreciation periods (8 years). The annual maintenance cost for the
vehicle is set as 5%. As one of operating cost, two workers (driver + sanitary worker) are
deployed on compactors and one driver is deployed on arm-roll truck. Another operating
cost such as fuel cost is estimated based on the result of time and motion survey and the
information from LWMC. The annual container cost is calculated in the same manner: the
depreciation year is set as 5 years and annual maintenance cost is 5%. Table 4.4.2 shows
the annual cost of each item. Looking at vehicle prices on the table, a mini-dumper is the
most economical vehicle and a mini-compactor is the second most economical vehicle.
Table 4.4.2 Annual Cost of Each Item on a Narrow Street
Item Vehicle Cost
(Rs.) Depreciation Period (Year)
Annual Vehicle & Container Cost
(Rs.)
Maintenance Cost (Rs.)
Operation Cost (Rs.)
Labour Cost (Rs.)
Annual Cost (Rs.)
Mini-dumper 1,000,000 8 125,000 50,000 196,128 396,000 767,128
Compaction Unit
2,400,000 8 300,000 120,000 30,000 180,000 630,000
Container w/ Compaction
unit 2,400,000 8 300,000 120,000 30,000 180,000 630,000
Mini- Compactor
(4 m3) 3,500,000 8 437,500 175,000 196,128 396,000 1,204,628
Arm-roll truck (10 m3)
5,000,000 8 625,000 250,000 819,360 216,000 1,910,360
Compactor (13 m3)
9,200,000 8 1,150,000 460,000 282,240 396,000 2,288,240
Transfer Station
15,936,183 30 531,206 24,146 24,146 198,000 777,498
Note: Vehicle, compaction unit and container cost are based on quotation from the supplier.
The necessary number of mini-dumpers per case is considered as follows:
Case 1-1: Container 10m3 / (Mini-dumper 1m
3 × 5 trips) = 2 Mini-dumpers
Case 1-2: Container 10m3
/ (Mini-dumper 1m3 × 5 trips) / Compaction unit (0.5m
3)
= 4 Mini-dumpers
Case 1-3: Container 10m3
/ (Mini-dumper 1m3 × 5 trips) / Compaction unit (0.5m
3)
= 4 Mini-dumpers
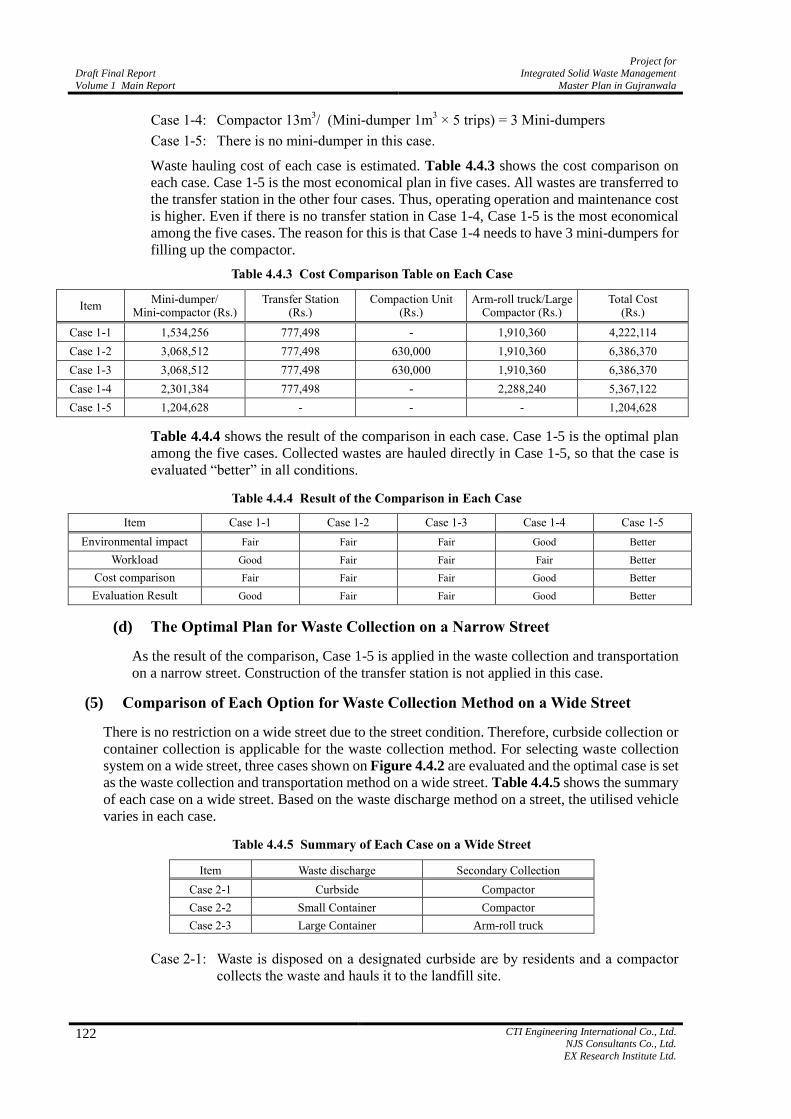
Draft Final Report
Volume 1 Main Report
Project for Integrated Solid Waste Management
Master Plan in Gujranwala
122
CTI Engineering International Co., Ltd. NJS Consultants Co., Ltd.
EX Research Institute Ltd.
Case 1-4: Compactor 13m3/ (Mini-dumper 1m
3 × 5 trips) = 3 Mini-dumpers
Case 1-5: There is no mini-dumper in this case.
Waste hauling cost of each case is estimated. Table 4.4.3 shows the cost comparison on
each case. Case 1-5 is the most economical plan in five cases. All wastes are transferred to
the transfer station in the other four cases. Thus, operating operation and maintenance cost
is higher. Even if there is no transfer station in Case 1-4, Case 1-5 is the most economical
among the five cases. The reason for this is that Case 1-4 needs to have 3 mini-dumpers for
filling up the compactor.
Table 4.4.3 Cost Comparison Table on Each Case
Item Mini-dumper/
Mini-compactor (Rs.) Transfer Station
(Rs.) Compaction Unit
(Rs.) Arm-roll truck/Large
Compactor (Rs.) Total Cost
(Rs.)
Case 1-1 1,534,256 777,498 - 1,910,360 4,222,114
Case 1-2 3,068,512 777,498 630,000 1,910,360 6,386,370
Case 1-3 3,068,512 777,498 630,000 1,910,360 6,386,370
Case 1-4 2,301,384 777,498 - 2,288,240 5,367,122
Case 1-5 1,204,628 - - - 1,204,628
Table 4.4.4 shows the result of the comparison in each case. Case 1-5 is the optimal plan
among the five cases. Collected wastes are hauled directly in Case 1-5, so that the case is
evaluated “better” in all conditions.
Table 4.4.4 Result of the Comparison in Each Case
Item Case 1-1 Case 1-2 Case 1-3 Case 1-4 Case 1-5
Environmental impact Fair Fair Fair Good Better
Workload Good Fair Fair Fair Better
Cost comparison Fair Fair Fair Good Better
Evaluation Result Good Fair Fair Good Better
The Optimal Plan for Waste Collection on a Narrow Street (d)
As the result of the comparison, Case 1-5 is applied in the waste collection and transportation
on a narrow street. Construction of the transfer station is not applied in this case.
(5) Comparison of Each Option for Waste Collection Method on a Wide Street
There is no restriction on a wide street due to the street condition. Therefore, curbside collection or
container collection is applicable for the waste collection method. For selecting waste collection
system on a wide street, three cases shown on Figure 4.4.2 are evaluated and the optimal case is set
as the waste collection and transportation method on a wide street. Table 4.4.5 shows the summary
of each case on a wide street. Based on the waste discharge method on a street, the utilised vehicle
varies in each case.
Table 4.4.5 Summary of Each Case on a Wide Street
Item Waste discharge Secondary Collection
Case 2-1 Curbside Compactor
Case 2-2 Small Container Compactor
Case 2-3 Large Container Arm-roll truck
Case 2-1: Waste is disposed on a designated curbside are by residents and a compactor
collects the waste and hauls it to the landfill site.

Project for Integrated Solid Waste Management
Master Plan in Gujranwala
Draft Final Report
Volume 1 Main Report
CTI Engineering International Co., Ltd. NJS Consultants Co., Ltd.
EX Research Institute Ltd.
123
Case 2-2: A smaller container compared to an existing container is deployed on the street.
A compactor collects waste from the container and transfers it to the landfill
site.
Case 2-3: A large sized container is deployed on the street. An arm-roll truck collects the
container and hauls it to the landfill site. GWMC is currently applying this
method.
Comparison of Each Case on a Wide Street (a)
Set as selection criteria in this study are (i) Environmental impact, and (ii) Workload and Cost
comparison.
(i) Environmental Impact
If curbside collection is applied, uncollected waste is scattered on the station. In
addition, live stocks with free-range on the street mess up uncollected waste at the
station.
Currently, illegal dumping on the open plots is one of the serious issues in the city. It is
assumed that there would be some people who throw the waste other than the
designated day. The open plots are similar to the illegal dumping sites.
Small container: The lid is attached to the top of the container so that few residents
attempt to throw the waste into the container. The environment around the container is
cleaner than the other two cases.
Larger container: Some residents throw the waste into the container. Therefore, wastes
that do not go into the container are scattered around the container making the place
dirty and unsanitary. The weather condition affects the condition of waste.
(ii) Workload
Curbside collection: A sanitary worker collects all waste from the ground. It
sometimes takes much time. If waste is not disposed in an appropriate way (e.g., the
bag is torn and waste is scattered on the ground), the worker has to clean it up. The
condition of the collection points is affected by weather condition. The disposed waste
flows out during the monsoon season.
Small container: A sanitary worker disposes the collected waste from the container
into a compactor and it might take time for loading the waste. However, it is assumed
that amount of scattered waste around the container is fewer so that the worker does
not require much time for cleaning around the container.
Large container: An arm-roll truck driver collects the container. A sanitary worker has
to clean the waste scattered around the container. It is assumed that it takes much time
compared with the work with a small container.
(iii) Cost Comparison
For estimating the cost on each case, vehicle, compaction unit and container cost
information is provided from the local supplier. The annual cost of each vehicle is set with
consideration on depreciation periods (8 years). The annual maintenance cost for the
vehicle is set as 5%. As one of operating cost, two workers (driver + sanitary worker) are
deployed on compactors and one driver is deployed on arm-roll truck. Another operating
cost such as fuel cost is estimated based on the result of time and motion survey and the
information from LWMC. The annual container cost is calculated on the same manner: the
depreciation year is set at 5 years and annual maintenance cost is 5%. Table 4.4.6 shows

Draft Final Report
Volume 1 Main Report
Project for Integrated Solid Waste Management
Master Plan in Gujranwala
124
CTI Engineering International Co., Ltd. NJS Consultants Co., Ltd.
EX Research Institute Ltd.
the annual cost of each item. Based on the table, a middle compactor is the most
economical vehicle among the three.
Table 4.4.6 Annual Cost of Each Item on a Wide Street
Item Vehicle/
Container Cost (Rs.)
Depreciation Period (Year)
Annual Vehicle and Container Cost (Rs.)
Maintenance Cost (Rs.)
Vehicle Operation Cost
(Rs.)
Labour Cost (Rs.)
Annual Cost (Rs.)
Compactor (7 m3) 4,500,000 8 562,500 225,000 282,240 396,000 1,465,740
Arm-roll truck (5 m3)
3,500,000 8 437,500 175,000 819,360 216,000 1,647,860
Small Container (0.8 m3)
28,000 5 5,600 1,400 - - 7,000
Large Container (5 m3)
200,000 5 40,000 10,000 - - 50,000
Necessary number of containers per vehicle is considered on each vehicle.
Case 2-1: No container
Case 2-2: Compactor 7m3/ container 0.8m
3 × 2 trips/day × 6 days × 4 weeks ×
12 months = 5,040 units
Case 2-3: Large container 5m3 × 5 trips/day × 6 days × 4 weeks × 12 months =
7,200 units
Table 4.4.7 shows the annual cost for each case. Case 2-1 is the lowest cost in three cases
because there is no container cost in this case. On the other hand, Case 2-3 is the most
expensive. The number of containers collected by an arm-roll truck reflects the cost.
Table 4.4.7 Annual Cost for Each Case
Item Vehicle Cost (Rs.) Container Cost (Rs.) Total Cost (Rs.)
Case 2-1 1,465,740 - 1,465,740
Case 2-2 1,465,740 35,280,000
(7,000 × 5,040) 36,745,740
Case 2-3 1,647,860 360,000,000
(50,000 × 7,200) 361,647,860
Table 4.4.8 shows the comparison table on each case. As the result of the comparison table,
Case 2-2 is the most optimal plan in the master plan. Only looking at the cost comparison,
Case 2-1 is the lowest. However, it is too early to apply curbside collection in this city
based on the current waste disposal manner by residents. Disposal method needs to be
controlled by GWMC.
Table 4.4.8 Comparison Table on Each Case
Item Case 2-1 Case 2-2 Case 2-3
Environmental Impact Bad Better Fair
Workload Fair Better Good
Cost Comparison Better Good Fair
Evaluation Result Fair Better Good
Optimal Plan for Waste Collection and Transportation on a Wide Street (b)
Case 2-2 is the most economical and environmental friendly collection method in three cases.
Thus, the combination of a small container and a middle compactor is applied in this master
plan. Construction of the transfer station is not applied in this case.

Project for Integrated Solid Waste Management
Master Plan in Gujranwala
Draft Final Report
Volume 1 Main Report
CTI Engineering International Co., Ltd. NJS Consultants Co., Ltd.
EX Research Institute Ltd.
125
(6) Planned Waste Collection Amount
Based on the planned waste collection population, area and amount, the number of planned waste
collection and transportation vehicles is decided. The number of vehicles and containers has to
meet the necessary waste collection amount in each year.
Currently, waste collection is conducted in 64 UCs. Figure 4.4.4 shows the planned waste
collection area. GWMC is divided into 8 zones in 64 UCs and collects waste in each zone. In this
master plan, waste collection area is expanded and it covers 100% collection in 64 UCs in 2018.
Waste collecting operation starts in 34 UCs in 2019 and covers 100% in 2030. 34 UCs are also
divided into 8 zones. Zone 9 and Zone 10 are set as street sweeping areas. Collection zones are also
expanded from 8 zones to 16 zones. The population in 98 UCs will be 5,373,752 in 2030, and the
collection area and its population in each zone are presented in Volume 2, Supporting Report,
Section B: Waste Collection and Transportation, Table B.4.9 to Table B.4.11.
Table 4.4.9 to Table 4.4.12 show the summary of planned waste collection population and
amount. Total waste collection amount in 98 UCs is 3,904 tons/ day in 2030 on the assumption that
waste generation per capita is related with the economic growth and 1% increment in each year is
estimated and added on waste amount per capita. Also, it is assumed that commercial and other
economic activities will increase in the city in the future. The detailed discussion is made in
Volume 2, Supporting Report, Section B: Waste Collection and Transportation, Subsection
4.1.6.
Figure 4.4.4 Planned Waste Collection Area

Draft Final Report
Volume 1 Main Report
Project for Integrated Solid Waste Management
Master Plan in Gujranwala
126
CTI Engineering International Co., Ltd. NJS Consultants Co., Ltd.
EX Research Institute Ltd.
Table 4.4.9 Summary of Planned Waste Collection Population and Amount (Year 2014-2018)
Item 2014 2015 2016 2017 2018
64 UCs
(1) Population 2,053,665 2,131,495 2,212,272 2,296,117 2,383,140
(2) Waste amount per capita per day (kg/day) 0.4 0.404 0.408 0.412 0.416
(3) Waste generation amount (ton/day) (3) = [(1)×(2)]/1,000
821 861 903 946 991
(4) Collection ratio (domestic) (%) 43 57 71 85 100
(5) Waste collection amount-Domestic (ton/day) (5) = [(3)×(4)]/100
353 491 641 804 991
(6) Commercial ratio (%) 14 15 16 17 18
(7) Commercial waste (ton/day) (7) = {(3)/[100 - (6)]/100×(6)}
57 86 121 164 217
(8) Total waste collection amount (ton/day) (8) = (5)+(7)
410 577 762 968 1,208
(9) Required waste collection amount (ton/day) (9) = (8)/(6/7)
478 673 889 1,129 1,410
34 UCs
(1) Population 909,749 944,230 980,015 1,017,159 1,055,710
(2) Waste amount per capita per day (kg/day) 0.35 0.354 0.358 0.362 0.366
(3) Waste generation amount (ton/day) (3) = [(1)×(2)]/1,000
318 334 351 368 386
(4) Collection ratio (domestic) (%) 0 0 0 0 0
(5) Waste collection amount-Domestic (ton/day) (5) = [(3)×(4)]/100
0 0 0 0 0
(6) Commercial ratio (%) 12 13 14 15 16
(7) Commercial waste (ton/day) (7) = {(3)/[100 - (6)]/100×(6)}
0 0 0 0 0
(8) Total waste collection amount (ton/day) (8) = (5)+(7)
0 0 0 0 0
(9) Required waste collection amount (ton/day) (9) = (8)/(6/7)
0 0 0 0 0
98 UCs
(10) Total waste collection amount (ton/day) (10) = 64UCs(8)+34UCs(8)
410 577 762 968 1,208
(11) Required waste collection amount (ton/day) (11) = 64UCs(9)+34UCs(9)
478 673 889 1,129 1,410
(12) Waste collection rate* (%) (12) = (10)/(11)
43 57 71 85 100
Note:* Target waste collection area from 2014 to 2018 is 64 UCs. Thus, the waste collection rate shown on this table is for 64 UCs.
Table 4.4.10 Summary of Planned Waste Collection Population and Amount (Year 2019-2022)
Item 2019 2020 2021 2022
64 UCs
(1) Population 2,473,459 2,567,203 2,664,502 2,765,486
(2) Waste amount per capita per day (kg/day) 0.42 0.424 0.428 0.432
(3) Waste generation amount (ton/day) (3) = [(1)×(2)]/1,000
1,039 1,089 1,140 1,195
(4) Collection ratio (domestic) (%) 100 100 100 100
(5) Waste collection amount-Domestic (ton/day) (5) = [(3)×(4)]/100
1,039 1,089 1,140 1,195
(6) Commercial ratio (%) 19 20 21 22
(7) Commercial waste (ton/day) (7) = {(3)/[100 - (6)]/100×(6)}
243 271 302 336
(8) Total waste collection amount (ton/day) (8) = (5)+(7)
1,282 1,360 1,442 1,531
(9) Required waste collection amount (ton/day) (9) = (8)/(6/7)
1,496 1,586 1,683 1,786
34 UCs (1) Population 1,095,723 1,137,253 1,180,352 1,225,086
(2) Waste amount per capita per day (kg/day) 0.37 0.374 0.378 0.382
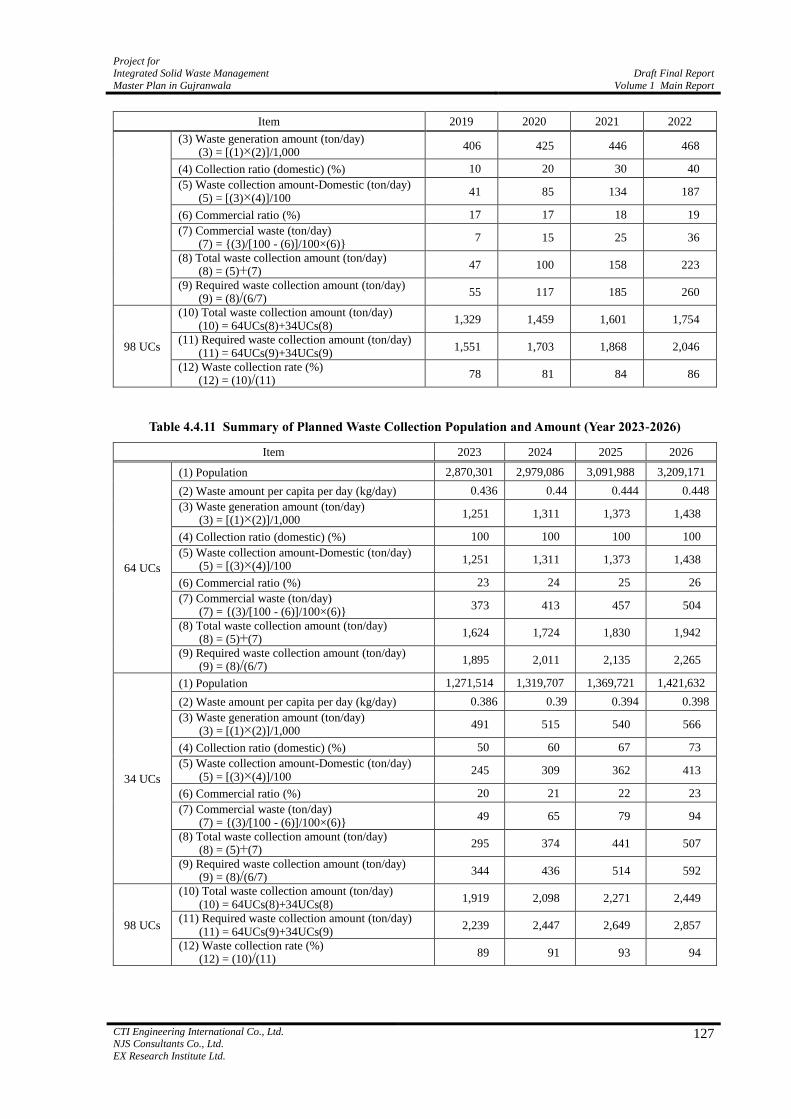
Project for Integrated Solid Waste Management
Master Plan in Gujranwala
Draft Final Report
Volume 1 Main Report
CTI Engineering International Co., Ltd. NJS Consultants Co., Ltd.
EX Research Institute Ltd.
127
Item 2019 2020 2021 2022
(3) Waste generation amount (ton/day) (3) = [(1)×(2)]/1,000
406 425 446 468
(4) Collection ratio (domestic) (%) 10 20 30 40
(5) Waste collection amount-Domestic (ton/day) (5) = [(3)×(4)]/100
41 85 134 187
(6) Commercial ratio (%) 17 17 18 19
(7) Commercial waste (ton/day) (7) = {(3)/[100 - (6)]/100×(6)}
7 15 25 36
(8) Total waste collection amount (ton/day) (8) = (5)+(7)
47 100 158 223
(9) Required waste collection amount (ton/day) (9) = (8)/(6/7)
55 117 185 260
98 UCs
(10) Total waste collection amount (ton/day) (10) = 64UCs(8)+34UCs(8)
1,329 1,459 1,601 1,754
(11) Required waste collection amount (ton/day) (11) = 64UCs(9)+34UCs(9)
1,551 1,703 1,868 2,046
(12) Waste collection rate (%) (12) = (10)/(11)
78 81 84 86
Table 4.4.11 Summary of Planned Waste Collection Population and Amount (Year 2023-2026)
Item 2023 2024 2025 2026
64 UCs
(1) Population 2,870,301 2,979,086 3,091,988 3,209,171
(2) Waste amount per capita per day (kg/day) 0.436 0.44 0.444 0.448
(3) Waste generation amount (ton/day) (3) = [(1)×(2)]/1,000
1,251 1,311 1,373 1,438
(4) Collection ratio (domestic) (%) 100 100 100 100
(5) Waste collection amount-Domestic (ton/day) (5) = [(3)×(4)]/100
1,251 1,311 1,373 1,438
(6) Commercial ratio (%) 23 24 25 26
(7) Commercial waste (ton/day) (7) = {(3)/[100 - (6)]/100×(6)}
373 413 457 504
(8) Total waste collection amount (ton/day) (8) = (5)+(7)
1,624 1,724 1,830 1,942
(9) Required waste collection amount (ton/day) (9) = (8)/(6/7)
1,895 2,011 2,135 2,265
34 UCs
(1) Population 1,271,514 1,319,707 1,369,721 1,421,632
(2) Waste amount per capita per day (kg/day) 0.386 0.39 0.394 0.398
(3) Waste generation amount (ton/day) (3) = [(1)×(2)]/1,000
491 515 540 566
(4) Collection ratio (domestic) (%) 50 60 67 73
(5) Waste collection amount-Domestic (ton/day) (5) = [(3)×(4)]/100
245 309 362 413
(6) Commercial ratio (%) 20 21 22 23
(7) Commercial waste (ton/day) (7) = {(3)/[100 - (6)]/100×(6)}
49 65 79 94
(8) Total waste collection amount (ton/day) (8) = (5)+(7)
295 374 441 507
(9) Required waste collection amount (ton/day) (9) = (8)/(6/7)
344 436 514 592
98 UCs
(10) Total waste collection amount (ton/day) (10) = 64UCs(8)+34UCs(8)
1,919 2,098 2,271 2,449
(11) Required waste collection amount (ton/day) (11) = 64UCs(9)+34UCs(9)
2,239 2,447 2,649 2,857
(12) Waste collection rate (%) (12) = (10)/(11)
89 91 93 94

Draft Final Report
Volume 1 Main Report
Project for Integrated Solid Waste Management
Master Plan in Gujranwala
128
CTI Engineering International Co., Ltd. NJS Consultants Co., Ltd.
EX Research Institute Ltd.
Table 4.4.12 Summary of Planned Waste Collection Population and Amount (Year 2027-2030)
Item 2027 2028 2029 2030
64 UCs
(1) Population 3,330,800 3,457,034 3,588,055 3,724,039
(2) Waste amount per capita per day (kg/day) 0.452 0.457 0.462 0.467
(3) Waste generation amount (ton/day) (3) = [(1)×(2)]/1,000
1,506 1,580 1,658 1,739
(4) Collection ratio (domestic) (%) 100 100 100 100
(5) Waste collection amount-Domestic (ton/day) (5) = [(3)×(4)]/100
1,506 1,580 1,658 1,739
(6) Commercial ratio (%) 27 28 29 30
(7) Commercial waste (ton/day) (7) = {(3)/[100 - (6)]/100×(6)}
556 614 677 745
(8) Total waste collection amount (ton/day) (8) = (5)+(7)
2,062 2,194 2,335 2,484
(9) Required waste collection amount (ton/day) (9) = (8)/(6/7)
2,405 2,560 2,724 2,898
34 UCs
(1) Population 1,475,513 1,531,433 1,589,474 1,649,713
(2) Waste amount per capita per day (kg/day) 0.402 0.406 0.41 0.414
(3) Waste generation amount (ton/day) (3) = [(1)×(2)]/1,000
593 622 652 683
(4) Collection ratio (domestic) (%) 80 87 93 100
(5) Waste collection amount-Domestic (ton/day) (5) = [(3)×(4)]/100
474 541 606 683
(6) Commercial ratio (%) 24 24 25 26
(7) Commercial waste (ton/day) (7) = {(3)/[100 - (6)]/100×(6)}
112 132 154 179
(8) Total waste collection amount (ton/day) (8) = (5)+(7)
586 673 760 862
(9) Required waste collection amount (ton/day) (9) = (8)/(6/7)
684 786 886 1,006
98 UCs
(10) Total waste collection amount (ton/day) (10) = 64UCs(8)+34UCs(8)
2,648 2,867 3,094 3,346
(11) Required waste collection amount (ton/day) (11) = 64UCs(9)+34UCs(9)
3,089 3,345 3,610 3,904
(12) Waste collection rate (%) (12) = (10)/(11)
96 97 99 100
(7) Required Number of Planned Waste Collection Vehicles, Containers and Workers
for Waste Collection and Transportation
Proposed Type of Waste Collection Vehicles (a)
GWMC operates 5 cubic metre (5m3) arm-roll truck, 10m
3 arm-roll truck, tractor trolley and
mini-dumper for waste collection and transportation. Table 4.4.13 shows the type of vehicles
in use. Most vehicles are used for waste
transfer except mini-dumpers. Only
5 mini-dumpers directly haul the waste to the
landfill site.
Most of the vehicles were procured in
approximately the year 2000. Duration year
of the vehicles is expired. However, GWMC
repairs when a vehicle breaks down and
continues to utilise them up to now. In this
master plan, five types of collection methods
are utilised as follows:
Table 4.4.13 Type of Vehicles in Use
Type of Vehicles Number of vehicles
Arm-roll truck (10 m3) 4
Arm-roll truck (5 m3) 22
Tractor trolley 37
Mini-dumper 5 (35)
Note: Total number of mini-dumper is 35. However, five mini-dumpers go to the landfill site directly after waste collection from each UC.

Project for Integrated Solid Waste Management
Master Plan in Gujranwala
Draft Final Report
Volume 1 Main Report
CTI Engineering International Co., Ltd. NJS Consultants Co., Ltd.
EX Research Institute Ltd.
129
Narrow Street (road width approximately 4 metres, Case 1-5) – Compactor (4m3);
Wide Street (road width more than 4 metres, Case 2-2) – Compactor (7m3) + 0.8m
3
Container;
Major Road (G.T. Road and Bypass road, etc.) – Compactor (13m3) + 0.8m
3 Container;
Narrow Street in densely populated area (road width less than 3 metres) – Mini-dumper +
Door-to-Door collection; and
Large Waste Generators – Arm-Roll Truck (5m3) + 5m
3 Container.
Table 4.4.14 shows the vehicles applied to
waste collection and transportation in the
master plan. Three types of compactors
conduct waste collection and transfer the
waste in the city in the master plan. The
detailed discussion is made to determine the
necessary number of collection vehicles in
Volume 2, Supporting Report, Section B:
Waste Collection and Transportation, Subsection 4.1.7, Item (1).
Waste Loading Capacity and Number of Trips (b)
Table 4.4.15 shows waste loading capacity and number of trips of each vehicle. The bulk
specific gravity is set as 0.5m3 per ton. According to the interview survey to a GWMC Waste
Manager, the bulk specific gravity of the waste coming to the landfill site is 0.5m3 per ton. This
ratio is applied in the master plan. The detailed discussion on each condition is made in
Volume 3, Supporting Report, Section B: Waste Collection and Transportation, Subsection
4.1.7, Item (2).
Table 4.4.15 Waste Loading Capacity and Number of Trips of Each Vehicle
Item Waste Loading Capacity (ton/vehicle) Number of trips
Arm-roll truck (5 m3) 2.5 5
Arm-roll truck (10 m3) 5.0 5
Tractor Trolley 1.6 3
Compactor (13 m3) 6.5 1
Compactor (7 m3) 3.5 2
Compactor (4 m3) 2.0 3
Mini-dumper (1 m3) 1.0 4
Necessary Number of Waste Collection Vehicles (c)
Table 4.4.16 and Table 4.4.17 show the total number of vehicles in 64 UCs and 34 UCs,
respectively. The total number of vehicles in 64 UCs becomes 449 in 2030 while that of 34
UCs is 151 in 2030. The detailed discussion is made in Volume 2, Supporting Report,
Section B: Waste Collection and Transportation, Subsection 4.1.7, Item (3).
Table 4.4.16 Total Number of Vehicles Required in 64 UCs (Year 2016-2030)
64 UCs 2016 2017 2018 2019 2020 2021 2022 2023 2024 2025 2026 2027 2028 2029 2030
Existing
Arm-roll truck 10.0 m3 4 4 4 0 0 0 0 0 0 0 0 0 0 0 0
Arm-roll truck 5.0 m3 22 22 22 0 0 0 0 0 0 0 0 0 0 0 0
Tractor trolley 3.2 m3 37 37 37 0 0 0 0 0 0 0 0 0 0 0 0
Mini-dumper 1.0 m3 35 35 35 35 35 35 35 28 24 21 17 14 10 6 3
Master
Plan
Arm-roll truck 10.0 m3 0 0 0 0 0 0 0 0 0 0 0 0 0 0 0
Arm-roll truck 5.0 m3 0 0 0 5 5 5 5 5 5 5 6 6 6 6 6
Table 4.4.14 Vehicles Applied to Waste Collection
and Transportation in the Master Plan
Type of Vehicles Carrying Capacity (ton)
Compactor (13 m3) 6.5
Compactor (7 m3) 3.5
Compactor (4 m3) 2.0

Draft Final Report
Volume 1 Main Report
Project for Integrated Solid Waste Management
Master Plan in Gujranwala
130
CTI Engineering International Co., Ltd. NJS Consultants Co., Ltd.
EX Research Institute Ltd.
64 UCs 2016 2017 2018 2019 2020 2021 2022 2023 2024 2025 2026 2027 2028 2029 2030
Compactor 13.0 m3 13 28 68 78 93 93 108 117 128 140 148 160 171 189 206
Compactor 7.0 m3 38 58 98 98 98 112 112 120 126 135 145 153 164 172 181
Compactor 4.0 m3 0 0 40 40 40 40 40 40 40 40 40 40 40 40 40
Mini-dumper 1.0 m3 0 0 0 0 0 0 0 0 0 0 0 2 6 10 13
Total 149 183 303 256 271 285 300 310 323 341 356 375 397 423 449
Table 4.4.17 Total Number of Vehicles Required in 34 UCs (Year 2016-2030)
34 UCs 2016 2017 2018 2019 2020 2021 2022 2023 2024 2025 2026 2027 2028 2029 2030
Existing
Arm-roll truck 10.0 m3 0 0 0 4 4 4 0 0 0 0 0 0 0 0 0
Arm-roll truck 5.0 m3 0 0 0 22 22 22 0 0 0 0 0 0 0 0 0
Tractor trolley 3.2 m3 0 0 0 37 37 37 0 0 0 0 0 0 0 0 0
Mini-dumper 1.0 m3 0 0 0 0 0 0 0 0 0 0 0 0 0 0 0
Master
Plan
Arm-roll truck 10.0 m3 0 0 0 0 0 0 0 0 0 0 0 0 0 0 0
Arm-roll truck 5.0 m3 0 0 0 0 0 0 0 0 0 0 0 0 0 0 0
Compactor 13.0 m3 0 0 0 0 0 12 24 29 36 42 48 54 61 66 73
Compactor 7.0 m3 0 0 0 0 0 15 15 23 30 35 40 46 53 61 70
Compactor 4.0 m3 0 0 0 0 0 0 0 0 0 0 1 3 4 6 8
Mini-dumper 1.0 m3 0 0 0 0 0 0 0 0 0 0 0 0 0 0 0
Total 0 0 0 63 63 90 39 52 66 77 89 106 118 133 151
Necessary Number of Waste Containers (d)
A container of 0.8 cubic metre (m3) with lid is applied in the master plan. Currently, 5m
3
containers and 10m3 containers are deployed by GWMC in waste collection area. Large sized
containers can receive a large amount of waste, but the size of these containers is a
disadvantage to waste collection. They require larger space on site so that it is sometimes
difficult to find a place for the container or there is no space in certain areas.
Another issue on the containers is that they do not have a lid at the top. Therefore, foul odour
is not prevented from the containers and it may cause complaints from the nearby residents.
For solving this issue, a container with lid is applied in the master plan to prevent emission of
foul odour.
The size of the container is much smaller than the large container so that there is no issue in
considering the location of the container on the street. Durable year of the container is set as
five years. After 5 years, 10% of the containers are replaced.
Some of the 5m3 containers are stationed at large discharge points such as commercial area or
shopping malls in the city.
Table 4.4.18 shows the existing containers in the city and the applied container in the master
plan. The concept of bulk specific gravity is the same as the waste collection and
transportation vehicles.
Table 4.4.18 Existing Containers in the City
Item Capacity (m3) Capacity (ton)
Existing Containers in the city 5.0 2.5
10.0 5.0
Applied Containers in the Master Plan 0.8 0.4
The number of required containers is estimated from the waste collection amount necessary in
each year. However, the existing containers and waste collection vehicles are deployed in

Project for Integrated Solid Waste Management
Master Plan in Gujranwala
Draft Final Report
Volume 1 Main Report
CTI Engineering International Co., Ltd. NJS Consultants Co., Ltd.
EX Research Institute Ltd.
131
64 UCs from 2016 to 2018, and 34 UCs from 2019 to 2021. Necessary waste collection
amount in a small container needs to consider the collection amount from existing containers
and vehicles. Following is the calculation method for estimating the required number of
containers.
(Necessary waste collection amount - Waste collection amount by existing containers and
vehicles) / small container capacity = Required number of containers
Table 4.4.19 and Table 4.4.20 show the total number of containers in 64 UCs and 34 UCs,
respectively. The total collection capacity of containers on-site has to exceed the necessary
waste collection amount in each year. In 2030, the total number of containers in 98 UCs is
9,927. The detailed discussion is made in Volume 2, Supporting Report, Section B: Waste
Collection and Transportation, Subsection 4.1.7, Item (4).
Table 4.4.19 Total Number of Containers Required in 64 UCs (Year 2016-2030)
64 UCs 2016 2017 2018 2019 2020 2021 2022 2023 2024 2025 2026 2027 2028 2029 2030
Existing 10.0 m3 6 6 6 0 0 0 0 0 0 0 0 0 0 0 0
5.0 m3 195 195 195 30 30 30 30 0 0 0 0 0 0 0 0
Master
Plan
10.0 m3 4 4 4 0 0 0 0 0 0 0 0 0 0 0 0
5.0 m3 0 0 0 0 0 0 0 30 30 30 30 30 30 30 30
0.8 m3 950 1,650 2,250 3,600 3,815 4,070 4,325 4,600 4,890 5,205 5,545 5,883 6,271 6,694 7,362
Total 1,155 1,855 2,455 3,630 3,845 4,100 4,355 4,630 4,920 5,235 5,575 5,913 6,301 6,724 7,392
Table 4.4.20 Total Number of Containers Required in 34 UCs (Year 2016-2030)
34 UCs 2016 2017 2018 2019 2020 2021 2022 2023 2024 2025 2026 2027 2028 2029 2030
Existing 10.0 m3 0 0 0 10 10 10 0 0 0 0 0 0 0 0 0
5.0 m3 0 0 0 90 80 70 0 0 0 0 0 0 0 0 0
Master
Plan
10.0 m3 0 0 0 0 0 0 0 0 0 0 0 0 0 0 0
5.0 m3 0 0 0 0 0 0 0 0 0 0 0 0 0 0 0
0.8 m3 0 0 0 0 0 300 750 900 1,105 1,350 1,505 1,730 1,990 2,225 2,520
Total 0 0 0 100 90 380 750 900 1,105 1,350 1,505 1,730 1,990 2,225 2,520
Necessary Number of Workers for Waste collection (e)
Based on the necessity of collection vehicles, the total number of workers is estimated for the
master plan. For estimating the number of workers, four types of workers are set: (i) Sanitary
inspector, (ii) Sanitary supervisor, (iii) Driver, and (iv) Sanitary worker.
Table 4.4.21 shows the necessary number of workers for waste collection. For achieving the
waste collection and transportation, GWMC requires 390 workers in 2016 and 1,852 workers
in 2030. The total number of workers in 2022 temporarily decreases compared with the total
number of workers in 2021 because all existing vehicles are passed out in 2022 and total
necessary number of vehicles is decreased.
Table 4.4.21 Necessary Number of Workers for Waste Collection (Year 2016-2030)
Item 2016 2017 2018 2019 2020 2021 2022 2023 2024 2025 2026 2027 2028 2029 2030
64 UCs
Driver 155 190 270 216 231 245 256 270 283 301 316 335 357 383 409
Sanitary Worker 163 233 473 472 502 530 556 587 617 656 689 728 772 824 876
Sanitary Supervisor 64 64 64 64 64 64 64 64 64 64 64 64 64 64 64
Sanitary Inspector 8 8 8 8 8 8 8 8 8 8 8 8 8 8 8
34 UCs Driver 0 0 0 63 63 90 39 52 66 77 89 103 118 133 151
Sanitary Worker 0 0 0 26 26 80 78 104 132 154 178 206 236 266 302

Draft Final Report
Volume 1 Main Report
Project for Integrated Solid Waste Management
Master Plan in Gujranwala
132
CTI Engineering International Co., Ltd. NJS Consultants Co., Ltd.
EX Research Institute Ltd.
Item 2016 2017 2018 2019 2020 2021 2022 2023 2024 2025 2026 2027 2028 2029 2030
Sanitary Supervisor 0 0 0 34 34 34 34 34 34 34 34 34 34 34 34
Sanitary Inspector 0 0 0 8 8 8 8 8 8 8 8 8 8 8 8
Total
Driver 155 190 270 279 294 355 295 322 349 378 405 438 475 516 560
Sanitary Worker 163 233 473 498 528 610 634 691 749 810 867 934 1,008 1,190 1,178
Sanitary Supervisor 64 64 64 98 98 98 98 98 98 98 98 98 98 98 98
Sanitary Inspector 8 8 8 16 16 16 16 16 16 16 16 16 16 16 16
Grand Total 309 495 815 891 936 1,059 1,043 1,127 1,212 1,302 1,386 1,486 1,597 1,720 1,852
Implementation Cost for Waste Collection and Transportation (f)
Tables 4.4.22 and 4.4.23 show the total cost of waste collection and transportation vehicles
and containers. Total cost of waste collection and transportation vehicles is
Rs. 11,891,465,000 in the master plan while total cost of waste collection and transportation
container is Rs. 574,308,000 in the master plan. The detailed discussion is made in Volume 2,
Supporting Report, Section B: Waste Collection and Transportation, Subsection 4.1.7,
Items (6), (7) and (8).
Table 4.4.22 Total Cost of Waste Collection and Transportation Vehicles and Containers (Year 2016-2023)
(Unit: thousand Rs.)
Year 2016 2017 2018 2019 2020 2021 2022 2023
Vehicle
Procurement Cost 173,000 228,000 688,000 92,000 138,000 240,900 248,400 237,200
Maintenance Cost 27,605 41,387 76,627 72,595 79,786 92,828 105,825 116,610
Operating Cost 121,564 146,175 235,964 261, 758 276,109 302,350 277,837 297,687
Total 322,169 415,562 1,000,591 426,173 493,905 636,078 632,062 651,497
Container
Procurement cost 16,800 19,600 16,800 37,800 7,000 22,400 20,160 24,200
Maintenance Cost 1,402 2,382 3,222 5,040 5,341 6,328 7,105 8,000
Total 18,202 21,982 20,022 42,840 12,341 28,728 27,265 32,200
Table 4.4.23 Total Cost of Waste Collection and Transportation Vehicles (Year 2024-2030)
(Unit: thousand Rs.) Year 2024 2025 2026 2027 2028 2029 2030 Total
Vehicle
Procurement cost 278,6500 337,800 451,600 512,800 537,200 624,600 651,200 5,439,200
Maintenance Cost 128,371 140,372 151, 030 163,548 176,960 192,412 209,200 1,776,568
Operating Cost 319,308 342,025 362,767 388, 212 415,493 447,381 481,247 4, 675,697
Total 726,179 820,197 965,397 1,064,560 1,129,653 1,264,393 1,341,647 11,891,465
Container
Procurement cost 25,200 25,200 26,880 30,800 35,600 65,800 83,100 457,340
Maintenance Cost 8,756 9,477 10,170 10,958 11,865 12,787 14,135 116,968
Total 33,956 34,677 37,050 41,758 47,465 78,587 97,235 574,308
(8) Street Cleaning
According the interview survey with a waste manager, GWMC conducts street sweeping on middle
sized roads manually. Sanitary workers conduct the street sweeping early in the morning for 6 days
to avoid the heavy traffic in the city in the daytime. GWMC also conduct mechanical road
sweeping on major streets such as G.T. Road. There is no official record for working area except

Project for Integrated Solid Waste Management
Master Plan in Gujranwala
Draft Final Report
Volume 1 Main Report
CTI Engineering International Co., Ltd. NJS Consultants Co., Ltd.
EX Research Institute Ltd.
133
Zone 9 and Zone 10 covered with 64UCs so that the total length of the mechanical and manual
sweeping is not grasped by GWMC.
Street Cleaning Length (a)
In this master plan, the necessary length for street sweeping has been estimated by
measurement from the map in Google Earth. Based on the result of the measurement, targeted
length for street cleaning is estimated at 2,600 km. (See detail in Volume 2, Supporting
Report, Section B: Waste Collection and Transportation, Subsection 4.1.8, Item (1).)
Necessary Number of Vehicles for Street Cleaning (b)
Traffic on major roads such as G.T. Road and Bypass road is heavy but it is necessary to clean
them portion by portion once a week. Traffic on roads in the city area is also heavy but not as
heavy as the major roads and hence sufficient to conduct street cleaning portion by portion
once in every two weeks. The street sweeper is applied for major roads and road washing
machine is applied for other roads. Table 4.4.24 shows the number of street cleaning
equipment. Two mechanical sweepers and four road washers are deployed in the master plan.
Table 4.4.24 Number of Street Cleaning Equipment
Item Number of Vehicles
Cleaning Length per Vehicle (km/month)
Cleaning Length per Vehicle (km/month)
Total Length of Road (km)
Frequency of Cleaning per
Location
Street sweeper 2 1,248 2,496 665 Once a week
Road washer 4 1,248 4,992 2,600 Once in two
weeks
Table 4.4.25 show the number of vehicles for street cleaning in each year. It is assumed that
major roads and other roads will be extended and improved in the future. For meeting the
future situation, 6 street sweepers and 6 road washers are deployed in 2030.
Table 4.4.25 Number of Vehicles for Street Cleaning (Year 2016-2030)
Item 2016-2020 2021-2025 2026-2030
Street sweeper 2 4 6
Road washer 4 4 6
Currently, GWMC utilises 980 street sweepers on site who are involved cleaning in main
roads and they will shift to cleaning work for narrow streets. The labour cost for street
sweepers are approximately Rs. 200 million per year and it will be continuously paid by
CDGG. Therefore, this expense is excluded from financial analysis in the master plan.
Implementation Cost for Street Cleaning (c)
Table 4.4.26 and Table 4.4.28 show the total cost of street cleaning. The total cost for street
cleaning is Rs. 316,398 thousand in total. (See detail in Volume 2, Supporting Report,
Section B: Waste Collection and Transportation, Subsection 4.1.8, Items (3) and (4).)
Table 4.4.26 Total Cost of Street Sweeping (Year 2016-2023) (Unit: thousand Rs.)
Item 2016 2017 2018 2019 2020 2021 2022 2023
Procurement Cost 60,800 0 0 0 0 24,000 0 0
Maintenance Cost 2,780 2,780 2,780 2,780 2,780 3,160 3,160 3,160
Operating Cost 3,748 3,748 3,748 3,748 3,748 5,237 5,237 5,237

Draft Final Report
Volume 1 Main Report
Project for Integrated Solid Waste Management
Master Plan in Gujranwala
134
CTI Engineering International Co., Ltd. NJS Consultants Co., Ltd.
EX Research Institute Ltd.
Item 2016 2017 2018 2019 2020 2021 2022 2023
Total 67,328 6,528 6,528 6,528 6,528 32,397 8,397 8,397
Table 4.4.27 Total Cost of Street Sweeping (Year 2024-2030) (Unit: thousand Rs.)
Item 2024 2025 2026 2027 2028 2029 2030 Total
Procurement Cost 21,200 0 42,400 9,200 0 12,000 9,200 178,800
Maintenance Cost 3,160 3,160 4,740 4,740 4,740 4,740 4,740 53,400
Operating Cost 5,237 5,237 7,855 7,855 7,855 7,855 7,855 84,200
Total 29,597 8,397 54,995 21,795 12,595 24,595 21,795 316,400
(9) Bulky Waste
There are 36 public parks in Gujranwala and the total area is approximately 580,000 square
metres (m2). The largest park in the city is Gulshan-e-Iqbal Park (106,000 m
2) abutted on
G.T. Road. There are also trees along the street. Green waste is generated from the park and the
street. Bulky wastes generated from tree trimming, old furniture, etc., need to be considered for
waste collection. They are not occasionally generated from the source so that necessary vehicles
and workers for these wastes are deployed separately from the regular collection in the master plan.
Necessary Vehicles and Workers for Bulky Waste (a)
Two 5-ton trucks and one wheel loader are deployed for the collection of bulky wastes. One
driver and one sanitary worker are deployed per 5-ton truck and one driver is deployed on the
wheel loader. The workers are deployed as one team and work in 6 days (Monday to
Saturday). Basically, the team collects green waste such as tree trimmings. However, if a
sanitary supervisor or sanitary inspector orders them to collect bulky waste from households,
they collect them from the source.
Implementation Cost for Bulky Waste (b)
Table 4.4.28 and Table 4.4.29 show the project cost for bulky waste. The total cost for
collecting bulky waste is Rs. 97,343 thousand in total. (See detail in Volume 2, Supporting
Report, Section B: Waste Collection and Transportation, Subsection 4.1.9.)
Table 4.4.28 Implementation Cost for Bulky Waste (Year 2016-2023) Unit: thousand Rs.
Item 2016 2017 2018 2019 2020 2021 2022 2023
Procurement Cost 19,600 0 0 0 0 0 0 0
Maintenance Cost 980 980 980 980 980 980 980 980
Operation Cost 3,150 3,150 3,150 3,150 3,150 3,150 3,150 3,150
Total 23,730 4,130 4,130 4,130 4,130 4,130 4,130 4,130
Table 4.4.29 Implementation Cost for Bulky Waste (Year 2024-2030) Unit: thousand Rs.
Item 2024 2025 2026 2027 2028 2029 2030 Total
Procurement Cost 15,800 0 0 0 0 0 0 35,400
Maintenance Cost 980 980 980 980 980 980 980 14,700
Operation Cost 3,150 3,150 3,150 3,150 3,150 3,150 3,150 47,250
Total 19,930 4,130 4,130 4,130 4,130 4,130 4,130 97,350

Project for Integrated Solid Waste Management
Master Plan in Gujranwala
Draft Final Report
Volume 1 Main Report
CTI Engineering International Co., Ltd. NJS Consultants Co., Ltd.
EX Research Institute Ltd.
135
(10) Illegal Dumping Site
There are nearly 800 illegal dumping sites in Gujranwala City. Some these illegal dumping sites are
large and some are small consisting of some heaps of garbage scattered over an open plot. The
illegal dumping site cause not only the issue of appearance but also the issue of sanitary conditions
such as bad odour and disease. Thus, urgent countermeasure is one of the important activities of
solid waste management. The clearing of illegal dumping site is one of the most urgent issues to be
tackled by GWMC.
GWMC tried to outsource and conduct bidding for cleaning of the illegal dumping sites in the city
on May 2014, but the price offered by the Contractor was above the budget and hence ended in
failure. For solving the situation, GWMC has been conducting One-Time Cleaning operation
(hereafter referred to as “OTC”) since September 2014. Two tractor trolleys and one wheel loader
are deployed on weekdays separately from the regular waste collection, and eight to ten arm-roll
trucks and one wheel loader every Sunday.
Amount of Waste of Illegal Dumping Sites in the City (a)
Waste managers in GWMC conducted a survey on the location and amount of wastes in the
illegal dumping sites in the city on August 2015. According to the survey, there are 799 illegal
dumping sites and the total amount of waste is 31,385 tons. It seems that the amount of waste
in the sites has decreased. However, illegal dumping occurs at the same location after two or
three weeks. One site has been totally cleaned by OTC. As a result of estimation, there are still
21,739 tons of waste at the sites, which should be the target collection amount of illegal
dumping sites. (See detail in Volume 2, Supporting Report, Section B: Waste Collection and
Transportation, Subsection 4.1.10, Item (1).) The waste collection amount from illegal
dumping sites are not taken into account for the incoming waste amount of the final landfill
site because the estimated total waste amount of illegal dumpings are negligible compared to
the daily incoming waste amount.
Time Duration for Cleaning the Sites (b)
In this master plan, the period of cleaning the illegal dumping sites is set as three years. The
work is planned to start in 2016 and finished in 2018. At the end of 2018, the waste collection
in 64 UCs should be 100% in the master plan in accordance with the waste collection plan.
The Optimal Plan for Cleaning Illegal Dumping Sites (c)
There are two possibilities to solve this issue: (i) GWMC conducts the cleaning of illegal
dumping sites and (ii) GWMC hires a contractor for cleaning of illegal dumping sites. Based
on comparing the cost comparison, the optimal plan for cleaning illegal dumping site is
selected in the master plan. The detailed discussion is made in Volume 2, Supporting Report,
Section B: Waste Collection and Transportation, Subsection 4.1.10, Item (3).
(i) Cleaning of Illegal Dumping Sites by GWMC
In this case, GWMC procures adequate vehicles and workers for cleaning the sites in the
city. Two 5-ton trucks, one wheel loader and two workers are needed for the work. The
assigned vehicles and workers conduct only the cleaning work and are excluded from the
regular waste collection work.
(ii) Cleaning of Illegal Dumping Sites by a Hired Contractor
In this case, GWMC hires a contractor for cleaning the sites in the city. The contractor is
obliged to hire the necessary number of vehicles for cleaning up illegal dumping sites in the
city.

Draft Final Report
Volume 1 Main Report
Project for Integrated Solid Waste Management
Master Plan in Gujranwala
136
CTI Engineering International Co., Ltd. NJS Consultants Co., Ltd.
EX Research Institute Ltd.
(iii) Cost Comparison of the Two Options
Based on the necessary vehicles and workers, cleaning cost for illegal dumping sites in the
city is estimated for the both cases. Table 4.4.30 shows the comparison of cost for the
cleaning work. The cost of outsourcing of cleaning the sites is more expensive than the
work GWMC conducts by itself. The master plan adopts conducting the work of cleaning
of illegal dumping sites by GWMC. The project cost is therefore Rs. 23,773,000 as shown
in Table 4.4.31.
Table 4.4.30 Comparison of Cost for the Cleaning Work
(Unit: thousand Rs.) Item Total Cost in three years
Work conducted by GWMC 23,773
Outsourced work 34,022
Table 4.4.31 Project Cost for Cleaning the Illegal Dumping Sites in the City (Year 2016-2018)
(Unit: thousand Rs.)
Item 2016 2017 Total
Clean-up of illegal dumping sites 22,382 1,391 23,773
(11) Construction and Demolition Waste
The collection and disposal of construction and demolition waste (C&D waste) is a part of
GWMC’s obligation according to the survey conducted by the JICA Project Team. C&D waste
collection is also a part of the Master plan.
According to the LWMC report, the daily generation amount of the waste is 141 tons. However, it
is difficult to assume the actual generated amount of C&D waste since the waste is collected with
another type of wastes and abandoned C&D waste is scattered all over the city. Another reason for
the difficulty of assumption is that C&D waste is not discharged in a particular place or particular
amount. C&D waste generation is related to the process of land development by public and private
sectors so that it is also unpredictable for GWMC to foresee the future development plan. In this
master plan, C&D waste is collected separately.
Fee for Collection of C&D Waste and Outsourcing the Waste Collection (a)
GWMC needs to set the schedule for charges on C&D waste. GWMC considers that collection
of C&D waste is outsourced to a private company.
Currently, C&D waste collection fee is not taken from building contractors or land developers,
and GWMC collects the waste for free. Most of C&D waste generated from construction sites
is taken to the borrow pits in the city. However, others are dumped on the roadsides or open
plots illegally and GWMC manages to take the waste to the landfill site for free.
C&D waste is generated from commercial activity. Most of them are rocks, sand, concrete and
reinforced bar and the character of the waste is totally different from domestic waste or other
commercial waste. A special vehicle for the waste collection and transportation is necessary
for conducting the work. For acquiring the cost of operating and maintaining the vehicles,
setting the schedules for charges is necessary. For instance, GWMC estimates the necessary
cost such as fuel cost etc. for C&D waste carriage per ton. Once collected C&D waste is
collected and measured on weighbridge at landfill site, a contractor will pay the bill at GWMC
head office.
GWMC needs to take time for collecting domestic and commercial waste for now and it is
difficult for GWMC to handle C&D waste collection. GWMC has to focus on the current

Project for Integrated Solid Waste Management
Master Plan in Gujranwala
Draft Final Report
Volume 1 Main Report
CTI Engineering International Co., Ltd. NJS Consultants Co., Ltd.
EX Research Institute Ltd.
137
waste collection work. Outsourcing the collection of C&D waste to a private company is to
disburden the work load on GWMC.
Implementation Cost (b)
C&D waste consists of rocks, sand and concrete, etc., generated from construction sites so that
the compactor is not suitable for C&D waste collection. The waste becomes a large heap and
loading C&D waste is an arduous job for sanitary workers. It is necessary to deploy a wheel
loader for loading the waste. For reducing the idle time on trucks, three 5-ton trucks and one
wheel loader for the collection work are deployed.
Based on the necessary number of vehicles and workers, C&D waste collection cost is
estimated at Rs. 7,690,126 per annum. Based on the implementation cost, GWMC should
consider outsourcing of the C&D waste collection work to a private company and set the
schedules for charges of C&D waste.
(12) Parking Area
The number of collection vehicles has been increasing and the collection rate has improved. An
additional parking area for procured vehicles is necessary in the future.
GWMC has its own their parking area/garage in the centre of the city. The garage can
accommodate approximately 100 vehicles. There is no expansion plan or additional parking plan in
GWMC. The current garage has a limited area so that construction of additional car parking areas is
necessary for the collection operation.
In this master plan, the number of parking areas is planned to be gradually increased based on the
total number of collection vehicles from 2016 to 2030. Based on the annual number of vehicles in
the master plan including waste collection and transportation vehicles, vehicles for bulky waste and
vehicles for street sweeping, the required number of parking area is estimated.
The existing garage could accommodate only approximately 100 vehicles; therefore, the same
capacity as the existing parking area will be secured. The existing garage has no pavement and no
roofing in parking area, so the repair work should be performed in the existing garage. As for new
parking garages, for security reasons, one guardhouse is built and steel fence is installed around the
facility. The place where vehicles are parked is to be covered with a steel skeleton building for
protection against rain and its area with asphalt-pavement is to be 600 m2. The annual number of
vehicles and required number of parking area is estimated as shown in Table 4.4.32. The detailed
discussion is made in Volume 2, Supporting Report, Section B: Waste Collection and
Transportation, Subsection 4.1.12.
Table 4.4.32 Annual Number of Vehicles in the Master Plan (Year 2014-2030)
Year 2014 2015 2016 2017 2018 2019 2020 2021 2022 2023 2024 2025 2026 2027 2028 2029 2030
Number of Waste
Collection Vehicles 96 121 155 190 310 325 340 383 343 370 397 426 457 490 527 568 612
Required Number of Parking Area
2 2 4 4 4 4 4 4 4 4 4 5 5 5 6 6 6
Based on the necessary items, the procurement cost, and operation and maintenance cost for the
parking area are estimated. In this master plan, 10% of land rental is set as the operating cost. Due
to weather condition or status of use in the parking area, the maintenance cost varies. Thus, 5% of
procurement cost is set as the maintenance cost in this master plan. Table 4.4.33 and Table 4.4.35
show the implementation cost of the parking area. The detailed discussion is made in Volume 2,
Supporting Report, Section B: Waste Collection and Transportation, Subsection 4.1.12, Item (1).

Draft Final Report
Volume 1 Main Report
Project for Integrated Solid Waste Management
Master Plan in Gujranwala
138
CTI Engineering International Co., Ltd. NJS Consultants Co., Ltd.
EX Research Institute Ltd.
Table 4.4.33 Implementation Cost of the Parking Area (Year 2016-2023)
(Unit: thousand Rs.) Item 2016 2017 2018 2019 2020 2021 2022 2023
Procurement Cost 118,582 0 388,848 0 0 0 0 0
Maintenance Cost 6,726 2,430 2,430 2,430 2,430 2,430 2,430 2,430
Operating Cost 1,116 1,116 2,232 2,232 2,232 2,232 2,232 2,232
Total 126,424 3,546 393,510 4,662 4,662 4,662 4,662 4,662
Table 4.4.34 Implementation Cost of the Parking Area (Year 2024-2030)
(Unit: thousand Rs.) Item 2024 2025 2026 2027 2028 2029 2030 Total
Procurement Cost 0 243,030 0 0 291,636 0 0 1,090,096
Maintenance Cost 2,430 2,430 2,430 2,430 2,430 2,430 2,430 40,746
Operating Cost 2,232 2,790 2,790 2,790 3,348 3,348 3,348 36,270
Total 4,662 248,250 5,220 5,220 297,414 5,778 5,778 1,119,112
(13) Project Cost
As a result of the above estimation, Table 4.4.35 and Table 4.4.36 show the project cost of waste
collection and transportation. The total cost of waste collection and transportation is
Rs. 14,020,790,000 in the master plan.
Table 4.4.35 Project Cost of Waste Collection and Transportation (Year 2016-2023)
(Unit: thousand Rs.)
Year 2016 2017 2018 2019 2020 2021 2022 2023
Procurement Cost 408,382 247,600 1,093,648 129,800 145,000 231,800 230,760 244,400
Maintenance Cost 40,283 47,972 8,817 78,785 85,986 98,768 112,395 123,180
Operating Cost 139,260 162,875 252,784 278,398 292,929 320,659 296,146 315,996
Total 587,925 458,447 1,429,249 486,983 523,915 707,357 677,101 700,576
Table 4.4.36 Project Cost of Waste Collection and Transportation (Year 2024-2030)
(Unit: thousand Rs.) Year 2024 2025 2026 2027 2028 2029 2030 Total
Procurement Cost 314,700 606,030 520,880 552,800 864,436 702,400 743,500 7,172,436
Maintenance Cost 134,941 146,942 159,180 171,698 185,110 200,562 217,350 1,886,599
Operating Cost 337,617 360,892 384,252 409,697 437,536 469,424 503,290 4,961,755
Total 813,258 1,113,864 1,064,312 1,134,195 1,487,082 1,372,386 1,464,140 14,020,790
4.4.2 Evaluation of Alternatives
(1) Planning Concept
Door-to-door collection and container collection are proposed in the waste collection and
transportation plan of the Master Plan. To adapt the waste collection and transportation system with
the other ISWM activities especially the Intermediate Treatment and 3R Promotion Plan, the
introduction of separate waste collection must be evaluated. Alternate-day collection shall also be
evaluated to analise the efficiency of waste collection and transportation operation and cost
effectiveness.

Project for Integrated Solid Waste Management
Master Plan in Gujranwala
Draft Final Report
Volume 1 Main Report
CTI Engineering International Co., Ltd. NJS Consultants Co., Ltd.
EX Research Institute Ltd.
139
(2) Options for Mixed Waste Collection and Separate Waste Collection
Source separation is adopted in the master plan. For evaluating source separation in the master plan,
two alternatives are set: No Separation at Source and Zero Option.
Separation at Source (a)
Separation at source is conducted by each household. The activity starts in 2019. Two types of
waste containers are applied to the plan. One is for disposing organic waste such as kitchen
waste and market waste; the other is for disposing other waste except organic waste. These two
containers are distinguished by painting them in two different colours for the residents to
easily identify the
appropriate container.
Wastes from these containers
are collected on alternate
days. For example, organic
waste is collected on
Monday, Wednesday and
Friday, and the other
container is collected on
Tuesday and Thursday. The
containers of 5m3 are placed
at the large waste discharge points such as shopping malls or markets in the city. The
containers are collected once the container is full of waste. Although it is an arduous work for
the residents to separate waste for the first time and it takes time for them to understand the
separation of wastes in the right way, the city would become cleaner and this option is
compatible to the 3R plan in the master plan. Table 4.4.37 shows the result of environmental
and social survey on separation at source. The result of the survey shows that the separation at
source gives positive impact. Separation at source is good from the environmental and social
aspects.
No Separation at Source (b)
No separation at source means that separation is not conducted by each household. Mixed
waste is directly disposed into the container. Since the waste disposal method is not changed
although it is easy for the residents
to understand the disposal
method, this option is not
compatible with the 3R plan in the
master plan. Table 4.4.38 shows
the result of environmental and
social survey on the no source
separation method. It is difficult to
separate organic waste after the
collection of waste. The result of
the survey shows that no
separation at source presents a
negative impact. The city
becomes cleaner but mixed waste is collected and transferred to the landfill site. This option is
not suitable for the 3R plan.
Table 4.4.37 Result of Environmental and Social Survey
on Source Separation
Item Environmental Impact
Soil Minor Positive Impact
Waste Moderate Positive Impact
Ecosystems Minor Positive Impact
Employment & Livelihood Moderate Positive Impact
Utilisation of Land & Local Resources Moderate Positive Impact
Infectious Diseases Moderate Positive Impact
Table 4.4.38 Result of Environmental and Social Survey
on No Separation at Source
Item Environmental Impact
Soil Minor Negative Impact
Waste Moderate Negative Impact
Ecosystems Minor Negative Impact
Involuntary Settlement Moderate Negative Impact
Employment & Livelihood Moderate Positive Impact
Utilisation of Land & Local Resources Major Negative Impact
Infectious Diseases Moderate Negative Impact

Draft Final Report
Volume 1 Main Report
Project for Integrated Solid Waste Management
Master Plan in Gujranwala
140
CTI Engineering International Co., Ltd. NJS Consultants Co., Ltd.
EX Research Institute Ltd.
Zero Option (c)
This option is the case where GWMC does not conduct any of the plans suggested in this
master plan. There is no separation at source conducted by the residents. Waste collection area
in the city is limited and uncollected waste is scattered on the open plots. The sanitation
condition in the city deteriorates by waste. Currently, there is no separation at source
conducted by the residents so that the result of environmental and social impact is negative in
this case. The sanitation condition in the city therefore gets worse.
Advantages and Disadvantages of Each Option (d)
Table 4.4.39 shows the advantages and disadvantages of each alternative measure. Both
separation at source and no source separation systems will make the city cleaner. Source
separation is better if 3R activity is considered in the master plan but “no separation” is not
compatible with the 3R plan. It takes time and cost for the separation of organic waste from
mixed waste.
Table 4.4.39 Advantages and Disadvantages of Each Alternative
Option Advantages Disadvantages Project Cost
(Rs. million) Evaluation
Separation
at Source
- The city becomes cleaner.
- The system has positive
impacts on environmental
and social condition.
- The system is compatible with the 3R system.
- It takes time for residents to
accustom themselves with
waste separation.
- Some residents may dispose
waste in a wrong container.
14,021 Better
No Source
Separation
- Residents do not need to
change their disposal method.
- The city becomes cleaner.
- All types of waste are
disposed in one container.
- No need to procure arm-roll
trucks and large containers.
Therefore, the project cost is
cheaper than that of
separation at source.
- The environmental condition
does not change.
- The system has a negative
impact on environmental and
social conditions.
- The system does not
correspond to the 3R system.
14,017 Fair
Zero Option
- Residents do not need to
change their disposing
method.
- The environmental condition
does not change or gets
worse.
- The system has a negative
impact on environmental and social conditions.
3,624 Bad
Selection of the Optimum Option (e)
Source separation is adopted in the master plan by reasons as follows:
The city becomes cleaner;
Source separation can omit the waste separation process at the landfill site, if collected
waste is utilised for waste recovery such as composting, RDF, etc.;
Source separation is compatible with Intermediate Treatment and 3R Promotion Plan;
Source separation gives positive impact on environment; and
Other separation systems may be easily applied after the adoption of source separation by
the residents.

Project for Integrated Solid Waste Management
Master Plan in Gujranwala
Draft Final Report
Volume 1 Main Report
CTI Engineering International Co., Ltd. NJS Consultants Co., Ltd.
EX Research Institute Ltd.
141
(3) Options for Daily Collection and Alternate-Day Collection
Currently, GWMC provides the waste collection and transportation service on a daily basis. The
application of alternate-day waste collection is, therefore, a new system for the city. For
comparison, the advantages and disadvantages of daily collection and alternate-day collection are
shown in Table 4.4.40 below. As shown in this table, the most advantageous feature of the
alternate-day collection is its economical aspect; that is, fuel consumption in the alternate-day
collection is almost half of that of the daily collection, since the travel distance by the alternate-day
collection within the collection area is almost one-half of that of the daily collection.
According to the results of the Time and Motion Study, the total travel distance of tractor trolley is
44km per day in two trips for collection. Out of 50km, the travel distance for collection work is
3km. Also, based on the same survey results, the travel distance ratio of waste collection operation
to the total distance in one day is 3km/44km; say: 7%. Therefore, about 3.5% of collection distance
can be saved with the introduction of alternate-day collection of waste. Once the collection
vehicles are replaced with compactors, the benefit of alternate-day collection will increase
significantly for more savings on fuel cost.
Table 4.4.40 Advantages and Disadvantages of Daily Collection and Alternate-Day Collection of Waste
Option Advantages Disadvantages
Daily Collection
- Container collection is carried out before
garbage generates odour.
- By the door-to-door collection service,
only one day amount of waste is stored by
household residents in their houses.
- Collection vehicle travels more distance for
loading waste to the full capacity.
- Daily collection operation could be nuisance
to the residents.
Alternate-Day
Collection
- Collection vehicle travels less distance for
loading waste to the full capacity.
- Residents are free from the nuisance of
daily collection operation.
- Odour might be generated from the
containers in the 2nd day.
- By the door-to-door collection service, the
household residents must store garbage for two days in their houses.
(4) Necessity of Implementation of a Pilot Project for the Introduction of Separate
Collection and Alternate-Day Collection
A challenging attempt has to be carried out for the improvement of waste collection service of
GWMC in relation to the implementation of relevant projects. Separate collection and alternate-day
collection are the new attempts to upgrade the SWM services under the ISWM master plan in
Gujranwala.
In the Intermediate Treatment and 3R Promotion Plan, a compost plant is proposed to start
operation in Year 2020 (see Subsection 4.6.2). To assure a certain level of quality of the produced
compost, organic waste must be segregated from the discharged wastes from the households. The
introduction of separate collection is thus strongly recommended.
Separate collection is a totally new system to the residents of Gujranwala. Considering the low
awareness of the public regarding SWM, it is recommended that a small scale of separate collection
will firstly be carried out as a pilot project in a selected area before the new system is applied to the
whole city. The separate collection is therefore scheduled to start in 2019 with the use of organic
waste at the new compost plant that will be operated from 2020. As for the separate collection of
combustible waste, the pilot operation will start in 2028 and shall last for one year to prepare for the
full operation in the following year since combustible waste separate collection of raw materials for
the RDF is scheduled to start in 2029.
Regarding alternate-day collection, GWMC should also prepare for the introduction of this new
collection service in addition to the implementation of the pilot separate collection project. A

Draft Final Report
Volume 1 Main Report
Project for Integrated Solid Waste Management
Master Plan in Gujranwala
142
CTI Engineering International Co., Ltd. NJS Consultants Co., Ltd.
EX Research Institute Ltd.
representative collection area in terms of development status of town shall be selected as the model
area to conduct the pilot operation in 2016.
The pilot operation for separate collection and alternate-day collection needs the cooperation of all
waste generators such as households, workplaces and so on in the pilot operation area.
Environmental education programmes and orientation/guidance programmes in relation to specific
methods of separate collection and alternated-day collection should be carried out in the
communities prior to the pilot operation. The pilot operation must be evaluated upon completion
and feedbacks shall be gathered for improving the methods, as required. After establishment of a
good practice model, the procedure should be introduced to the adjacent area and then, gradually to
all areas. Detailed plan for Implementation of a Pilot Project for the Introduction of Separate
Collection and Alternate-Day Collection is described in Subsection 6.2.2 Project for Introduction
of Separate Collection and Alternate-Day Collection through Implementation of a Pilot Project.
4.4.3 Identification of Project Components for Waste Collection and Transportation
Plan
(1) Short-Term Plan (2016-2018)
The projects in the Short-Term period, i.e., from 2016 to 2018, are described as the action plans or
Priority Projects in Chapter 6. The proposed projects are as follows:
Introduction of Separate Collection and Alternate day Collection through Implementation of
Pilot Project
Increase of Waste Collection Rate in 64 UCs up to 100% in 2018
Conducting Street Cleaning in 64 UCs
Collection of Bulky Waste
Cleaning Up of Illegal Dumping sites in 64 UCs
Construction and Demolition Waste Collection
Construction of Parking Area
(2) Mid-Term Plan (2019-2024)
Planning/Implementing for the Method of Separate Collection in 98 UCs (a)
The new collection system of separate collection and alternate-day collection is to be
introduced in all the collection zones in accordance with the good practices established in
collection Zone 6. The implementation of the new system in 2019 is intended as the activity in
the transition period toward full-scale operation prior to the start of operation of the compost
plant in 2020. Separate collection will be practiced basically for i) biodegradable waste,
ii) recyclable materials (paper, plastics, glass and metals), and iii) other residual waste. Two
types of waste container are allocated for separate collection. One is for biodegradable waste,
and the other is for recyclable materials and other residual wastes. The
planning/implementation shall be carried out by the following key factors for the
implementation in 98 UCs.
Determination of type of recyclable materials for segregation at source;
Consideration of method of discharging/recovering the objective resource materials;
Selection of the type, size and number of receptacles/containers for temporary storage
depending on the recovery sites and discharge amount (for example, biodegradable waste
put in a 5m3 container for fresh market, 20-50 litre container for large waste generators of
biodegradable waste, and a 0.8m3 container for general domestic waste generators.);
Determination of the method and frequency of recovery and transportation, and delivery
Project for Integrated Solid Waste Management
Master Plan in Gujranwala
Draft Final Report
Volume 1 Main Report
CTI Engineering International Co., Ltd. NJS Consultants Co., Ltd.
EX Research Institute Ltd.
143
sites of each resource materials;
Orientation/education of participating waste generators;
Dissemination of the activity in 98 UCs;
Procurement and/or dispatch of vehicles, receptacles/containers, and staffing for separate
collection operation; and
Evaluation of the project implementation and feed-back for improvement.
Increase of Waste Collection Rate in 34 UCs from 0% to 60% in 2024 (b)
GWMC has to expand the waste collection area from the 64 UCs to the 34 UCs in the
peri-urban area. GWMC has to prepare necessary waste collection vehicles and the waste
containers deployment plan for 8 zones of the peri-urban area.
Sustaining the Waste Collection Rate in 64 UCs with 100% in 2024 (c)
GWMC needs to sustain 100% of waste collection rate in the 64 UCs. GWMC has to monitor
the deployment of waste collection vehicles and containers in the service area. If the
deployment of waste vehicles and/or waste containers is not adequate, GWMC has to employ
measures to rectify the situation.
Procurement of Waste Collection Vehicles and Containers in 98 UCs (d)
GWMC has to procure the necessary waste collection vehicles and containers with the
approval of the Punjab Government from 2019 to 2024.
Monitoring of Improvement of Waste Collection and Transportation in (e)
98 UCs
GWMC continuously requires carrying out regular monitoring of waste collection amount and
waste collection rate. GWMC also needs to monitor the waste collection vehicles and waste
containers in 2023. GWMC needs to take measures to improve of collecting waste if the actual
waste collection rate does not achieve the target waste collection rate and waste amount. In
addition, GWMC needs to monitor the implementation status of source separation during the
waste collection.
Conducting Street Cleaning in 64 UCs (f)
GWMC is obliged to conduct street cleaning in the 64 UCs. GWMC has to procure the
necessary street cleaning vehicles.
Collection of Bulky Waste (g)
GWMC is continuously obliged to conduct collection of bulky waste. GWMC has to prepare
the necessary waste collection vehicles for bulky waste.
Collection of Construction and Demolition Waste (h)
GWMC is obliged to collect construction waste generated from construction sites. The
collection work is separate from ordinary collection of waste. Necessary collection vehicles
and equipment shall be deployed for the work. GWMC has to revise the fee schedule for
construction and demolition waste if the economic situation in the city changes.
Construction of Parking Area (i)
GWMC is obliged to construct necessary parking areas. Collection vehicles will increase
gradually for the waste collection activity. Necessary facilities shall be allocated by GWMC.

Draft Final Report
Volume 1 Main Report
Project for Integrated Solid Waste Management
Master Plan in Gujranwala
144
CTI Engineering International Co., Ltd. NJS Consultants Co., Ltd.
EX Research Institute Ltd.
(3) Long-Term Plan (2025-2030)
Introduction of Separate Collection through the Implementation of (a)
Designated Pilot Project Area in 2028 and Promotion of Separate Collection to
Other Zones in 2029
GWMC has to introduce the separate collection of combustible wastes in the designated area
on the short term. This additional separation method is to be introduced in 2028 since the
separate collection of wastes targeted for the waste collection and transportation will start on a
full scale in 2029 when the RDF facility starts operation. Once the optimum promotion
method is established during probation period, it is introduced to the other areas from 2029.
Increase of Waste Collection Rate in 34 UCs to 100% in 2030 (b)
GWMC has to expand the waste collection area in 34 UCs, which are in peri-urban areas.
GWMC has to prepare the necessary waste collection vehicles and the waste containers
deployment plan for 8 zones in the peri-urban areas.
Sustaining Waste Collection Rate in 64 UCs from the Present to 100% in 2030 (c)
GWMC needs to sustain 100% of waste collection rate in 64 UCs. GWMC has to monitor
whether waste vehicles and containers are deployed adequately in the service area. If the
deployment of waste vehicles and/or waste containers is inadequate, GWMC has to employ
measures to rectify the situation.
Procurement of Waste Collection Vehicles and Containers in 98 UCs (d)
GWMC shall continuously procure necessary waste collection vehicles and containers with
the approval of the Punjab Government from 2025 to 2030.
Monitoring of Improvement of Waste Collection and Transportation in (e)
98 UCs
GWMC continuously requires carrying out regular monitoring on waste collection amount and
waste collection rate. GWMC also needs to monitor waste collection vehicles and waste
containers in 2030. GWMC needs to take measures to improve the collection of waste if the
actual waste collection rate does not achieve the target waste collection rate and waste amount.
In addition, GWMC needs to monitor the implementation status of source separation during
waste collection.
Conducting Street Cleaning in 64 UCs (f)
GWMC is obliged to conduct street cleaning in 64 UCs. GWMC has to procure the necessary
street cleaning vehicles.
Collection of Bulky Waste (g)
GWMC is obliged to collect bulky waste. GWMC has to procure necessary waste collection
vehicles for bulky waste.
Outsourcing of Waste Collection and Transportation Services to a Private (h)
Company in 2025
GWMC needs to consider outsourcing the waste collection and transportation service to a
private company. Due to the expansion of the waste collection service area, served population
would become the number of population in half of Lahore City in the year of 2025. LWMC

Project for Integrated Solid Waste Management
Master Plan in Gujranwala
Draft Final Report
Volume 1 Main Report
CTI Engineering International Co., Ltd. NJS Consultants Co., Ltd.
EX Research Institute Ltd.
145
practices outsourcing of waste collection and transportation service to a Turkish private
company and achieve satisfactory outcome of the services. GWMC should consider this
option for the waste collection and transportation service. Preparation for the tender of
outsourcing, conducting the tender and selection of the contractor shall be conducted by
GWMC as the part of their daily work. Procurement cost for necessary numbers of waste
collection equipment is allocated on Item (d) above.
Collection of Construction and Demolition Waste (i)
GWMC is obliged to collect construction waste generated from construction sites. The
collection work is separate from the ordinary waste collection activities. Necessary collection
vehicles and equipment are deployed for the work. GWMC has to revise the fee schedule for
construction and demolition waste if the economic situation in the city is changed.
Construction of Parking Area (j)
GWMC is obliged to construct necessary parking areas. Collection vehicles increase gradually
for the waste collection activity. Necessary facilities shall be allocated by GWMC.
4.4.4 Implementation Schedule of Waste Collection and Transportation Plan
Figure 4.4.5 shows the implementation plan for the master plan. GWMC needs to monitor the waste
collection and transportation work from 2016 to 2030.
Figure 4.4.5 Implementation Schedule of the Waste Collection and Transportation Plan
2019 2020 2021 2022 2023 2024 2025 2026 2027 2028 2029 2030
Q1 Q2 Q3 Q4 Q1 Q2 Q3 Q4 Q1 Q2 Q3 Q4
WBS for Short-Term Plan
S-1-1
Introduction of Separate Collection and Alternate-Day Collection
through Implementation of Pilot Project
S-1-2 Increase of Waste Collection Rate in 64 UCs up to 100% in 2018
S-1-3 Conducting Street Cleaning in 64 UCs
S-1-4 Collection of Bulky Waste
S-1-5 Cleaning up of Illegal Dumping Sites in 64 UCs
S-1-6 Collection of Construction and Demolition Waste
S-1-7 Construction of Parking Area
M-1-1
Planning/Implementing for the Method of Separate Collection in
98 UCs
M-1-2
Increase of Waste Collection Rate in 34 UCs from 0% to 60% in
2024
M-1-3
Sustaining the Waste Collection Rate in 64 UCs with 100% in
2024
M-1-4
Procurement of Waste Collection Vehicles and Containers in 98
UCs
M-1-5
Monitoring on Improvement of Waste Collection and
Transportation in 98 UCs
M-1-6 Conducting Street Cleaning in 64 UCs
M-1-7 Collection of Bulky Waste
M-1-8 Collection of Construction and Demolition Waste
M-1-9 Construction of Parking Area
L-1-1
Introduction of Separate Collection through Implementation of
Designated Pilot Project Area in 2028 and Promotion of Separate
Collection to Other Zones in 2029
L-1-2 Increase of Waste Collection Rate in 34 UCs to 100% in 2030
L-1-3
Sustaining Waste Collection Rate in 64 UCs from the Current
with 100% in 2030
L-1-4
Procurement of Waste Collection Vehicles and Containers in 98
UCs
L-1-5
Monitoring on Improvement of Waste Collection and
Transportation in 98 UCs
L-1-6 Conducting Street Cleaning in 64 UCs
L-1-7 Collection of Bulky Waste
L-1-8
Outsourcing the Waste Collection and Transportation Service to
a Private Company in 2025
L-1-9 Collection of Construction and Demolition Waste
L-1-10 Construction of Parking Areas
Quarter
WBS for Mid-Term Plan
WBA for Long-Term Plan
Time Framework of the Master Plan Short-Term Plan Period Mid-Term Plan Period Long-Term Plan Period
Year 2016 2017 2018

Draft Final Report
Volume 1 Main Report
Project for Integrated Solid Waste Management
Master Plan in Gujranwala
146
CTI Engineering International Co., Ltd. NJS Consultants Co., Ltd.
EX Research Institute Ltd.
4.4.5 Project Cost of Waste Collection and Transportation Plan
Table 4.4.41 shows the project cost for the Master Plan. The total cost of waste collection and
transportation is Rs. 14,021 million.
Table 4.4.41 Total Cost of the Waste Collection and Transportation Plan
4.5 Final Disposal Plan
4.5.1 Urgent Improvement of the Current Landfill Operation in Gondlanwala
In the site visits, the JICA Project Team observed that the landfill operation started in March 2014 at the
landfill site in Gondlanwala has a potential risk of environmental degradation. It is needless to say that
the improvement plan of the provisional landfill in Gondlanwala is due to be included as one of the
major projects to compose the final disposal plan for tackling the immediate measures against the
current situation of environmental impacts.
In view of this situation, prior to the formulation of the master plan, the JICA Project Team decided to
prepare a brief proposal, “Proposal on Urgent/Preliminary Improvement of Gondlanwala Dump Site,”
for the improvement work of landfill in Gujranwala and submitted it to GWMC on the 7th of April 2014.
The proposal contains several key measures to be taken by the GWMC for reducing the environmental
2016 2017 2018 2019 2020 2021 2022 2023 2024 2025 2026 2027 2028 2029 2030
S-1-1
Introduction of Separate Collection and Alternate day
collection through Implementation of Pilot Project
143,525 52,343 40,523 50,659
S-1-2
Increase of Waste Collection Rate in 64 UCs up to 100% in
2018
1,649,399 288,028 394,639 966,732
S-1-3 Conducting Street Cleaning in 64 UCs 80,384 67,328 6,528 6,528
S-1-4 Collection of Bulky Waste 31,990 23,730 4,130 4,130
S-1-5 Cleaning Up of Illegal Dumping Sites in 64 UCs 23,773 22,382 1,391
S-1-6 Collection of Construction and Demolition Waste 23,070 7,690 7,690 7,690
S-1-7 Construction of Parking Area 523,480 126,424 3,546 393,510
Sub-Total 2,475,621 587,925 458,447 1,429,249
M-1-1
Planning/Implementing for the Method of Separate
Collection in 98 UCs
GWMC
M-1-2
Increase of Waste Collection Rate in 34 UCs from 0% to
60% in 2024
GWMC
M-1-3
Sustaining Waste Collection Rate in 64 UCs with 100% in
2024
GWMC
M-1-4
Procurement of Waste Collection Vehicles and Containers
in 98 UCs
3,702,654 463,973 500,905 658,478 652,222 675,697 751,379
M-1-5
Monitoring on Improvement of Waste Collection and
Transportation in 98 UCs
GWMC
M-1-6 Conducting Street Cleaning in 64 UCs 91,844 6,528 6,528 32,397 8,397 8,397 29,597
M-1-7 Collection of Bulky Waste 40,580 4,130 4,130 4,130 4,130 4,130 19,930
M-1-8 Collection of Construction and Demolition Waste 46,140 7,690 7,690 7,690 7,690 7,690 7,690
M-1-9 Construction of Parking Area 27,972 4,662 4,662 4,662 4,662 4,662 4,662
Sub-Total 3,909,190 486,983 523,915 707,357 677,101 700,576 813,258
L-1-1
Introduction of Separate Collection through Implementation
of Designated Pilot Project Area in 2028 and Promotion of
Separate Collection to Other Zones in 2029
GWMC
L-1-2
Increase of Waste Collection Rate in 34 UCs to 100% in
2030
GWMC
L-1-3
Sustaining Waste Collection Rate in 64 UCs from the
Current with 100% in 2030
GWMC
L-1-4
Procurement of Waste Collection Vehicles and Containers
in 98 UCs
6,853,227 845,397 992,277 1,095,360 1,165,253 1,330,193 1,424,747
L-1-5
Monitoring on Improvement of Waste Collection and
Transportation in 98 UCs
GWMC
L-1-6 Conducting Street Cleaning in 64 UCs 144,172 8,397 54,995 21,795 12,595 24,595 21,795
L-1-7 Collection of Bulky Waste 24,780 4,130 4,130 4,130 4,130 4,130 4,130
L-1-8
Outsourcing the Waste Collection and Transportation
Service to a Private Company in 2025
GWMC
L-1-9 Collection of Construction and Demolition Waste 46,140 7,690 7,690 7,690 7,690 7,690 7,690
L-1-10 Construction of Parking Area 567,660 248,250 5,220 5,220 297,414 5,778 5,778
Sub-Total 7,635,979 1,113,864 1,064,312 1,134,195 1,487,082 1,372,386 1,464,140
Grand Total 14,020,790 587,925 458,447 1,429,249 486,983 523,915 707,357 677,101 700,576 813,258 1,113,864 1,064,312 1,134,195 1,487,082 1,372,386 1,464,140
Annual Cost
Short-Term Plan
Mid-Term Plan
Long-Term Plan
Programme 1: Waste Collection and Transportation Plan
WBS
No.
WBSTotal Budget
(Thousand Rs.)

Project for Integrated Solid Waste Management
Master Plan in Gujranwala
Draft Final Report
Volume 1 Main Report
CTI Engineering International Co., Ltd. NJS Consultants Co., Ltd.
EX Research Institute Ltd.
147
impacts immediately. The following items describe the contents of the proposal and the subsequent
recommendations taking into consideration the situation thereafter.
(1) Proposal Submitted for Urgent Improvement of Gondlanwala Landfill Site
The proposal presents the measures for improving the existing open dumpsite at Gondlanwala to
mitigate possible groundwater pollution and scattered dust and offensive odour taking place in the
vicinity. The improvement work of the Gondlanwala Dump Site will be prepared as a part of the
action plan in the Master Plan. However, since the action plan will be formulated in the end of the
Project period according to the Project Schedule, it is predictable that such negative impacts at
Gondlanwala will become worse in the latter stage. In order to avoid worse condition of the dump
site, this paper urges immediate actions to tackle with the implementation of improvement work as
urgently and preliminarily required. The urgent/preliminary improvement work of the open dump
site consists of the following measures.
Improvement of Existing Ramp or Approach Road and Construction of (a)
Unloading Area
The ramp leading to the bottom of the dump site is partly collapsed (see Photo 4.5.1) due to
rainwater and the collapse of side slope will become a cause of incoming vehicles falling from
the ramp. This collapse will become worse when the rainy season starts. The following
measures will be effective to prevent the slope from collapsing:
Bring clayey earth from the other corner of the dumpsite or purchase it from a nearby
borrow pit;
Fill the collapsed slope area shown in Photo 4.5.1 and Figure 4.5.1 with clayey earth and
perform watering to bind the sand or remove voids in the filled earth to accelerate its
stability;
Tamper the slope well by machine or by hand; and
Seed the slope area with fast-growing type of weeds to prevent erosion of the surface soil.
Filling Water Area in the Dumpsite by Clayey Earth (b)
The bottom of dumping area is filled with water and it may cause groundwater contamination
in the course of waste dumping in the water area. It is assumed that the existing water table will
rise by 1.5m or so, and dumped waste soaked in water will generate methane gas under the
anaerobic condition. To avoid dumping waste in the water area, the following measures will
be effective:
Bring clayey earth from the other corner of the dumpsite or purchase it from a nearby
borrow pit and put it onto the bottom of the dumping area; and
Fill the earth at least 2.0 m above the existing water table and compact well to minimise
infiltration of contaminated water or leachate into the underground.
Temporary Leachate Control System (c)
Leachate in the dumping area shall be collected by leachate mains to be installed on the bottom
of the dumping area and conveyed to a leachate pond to be constructed in the corner of
dumpsite at the place shown in Photo 4.5.2 and in Figure 4.5.1. Leachate in the pond shall be
circulated in the dumpsite by a temporary pump and hose for reducing leachate amount by
evaporation. Major work item procedures are as follows:
Place the leachate mains of 200 mm dia. or larger diametre PVC (Polyvinyl-Chloride) or
HDPE (High Density Polyethylene) perforated pipes on the bottom of the dumpsite with
a minimum slope of 5/1,000. The end of the leachate mains shall be connected to the
Draft Final Report
Volume 1 Main Report
Project for Integrated Solid Waste Management
Master Plan in Gujranwala
148
CTI Engineering International Co., Ltd. NJS Consultants Co., Ltd.
EX Research Institute Ltd.
leachate pond;
Cover the leachate mains with gravel, as shown in the attached Figure 4.5.1;
Construct an earthen pond lined with concrete or HDPE with the storage volume of
minimum 100m3; and
Install a temporary pump unit and hose in the pond for circulation of leachate within the
dumpsite area and operate a submerged pump. The pump unit shall be operated for 1-2
hours after the daily landfill operation is finished to lower the water level in the leachate
pond and withdraw the leachate effectively.
Waste Dumping on the Bottom of Dumpsite (d)
Waste dumping from the top of the dike has the risk of vehicles falling to the dumpsite. Waste
dumping or unloading of waste shall be carried out from the bottom of the dumpsite. To
unload the waste on the bottom of the dumpsite, the following work procedures, at least, shall
be required:
Construct a temporary approach road leading to the landfill area. The minimum width
shall be 3m roadway with one (1) metre shoulders;
Construct a platform or working area for unloading and turning of the vehicles with the
minimum dimension of 15m by 15m wide; and
Designate the working area for landfill work within the low earthen dike cell constructed
with 1 to 2m high and for the volume of approximately one (1) month landfill work.
Regular Earth Covering onto the Dumped Waste (e)
Regular earth covering is effective for minimising breeding of vectors, especially flies and
also reducing the offensive odour. Unloaded waste in the working cell shall be spread
horizontally and compacted well. Regular earth covering by soil excavated from the
north-east side of the dumping area would be available.
Control of Waste Pickers (f)
Waste pickers pick out recyclable materials from the dumpsite. They sometimes disturb the
unloading and landfill work. They are by themselves at risk working in the waste dumping
area. Banning of recovery work is preferable but if not possible, they may be allowed after the
waste dumping hours for the day.
(2) Additional Proposal for Urgent Improvement of Gondlanwala Landfill Site
Measures to Lower the Ponding Water Level at the Bottom of Landfill Area (a)
Stagnant leachate water at the bottom of the landfill area has raised the water level in
September due to heavy rainfall during the monsoon season. Rise of water level in the landfill
area causes the leachate flow into the groundwater aquifer in the peripheral zone and bring
about the risk of groundwater contamination. If the groundwater level in the peripheral area is
higher than that of the landfill site, the groundwater in the surrounding wells receive fresh
groundwater recharge from the outer zone. Therefore, the measures to lower the water level
(groundwater table) in the landfill area by installation of a pumping system and its operation
are effective to direct the groundwater flow from the peripheral zone to the side of the landfill
site. The system shall be comprised of a pump well, leachate drainage piping, and the leachate
circulation and evaporation system. The water level in the pump well must be targeted to
maintain approximately 1m lower than the bottom elevation of the landfill site. With too much
pumping below the water level in the pump well, the groundwater level will drop too low in
the peripheral zone and will cause dry-up of, especially, the hand pump wells.

Project for Integrated Solid Waste Management
Master Plan in Gujranwala
Draft Final Report
Volume 1 Main Report
CTI Engineering International Co., Ltd. NJS Consultants Co., Ltd.
EX Research Institute Ltd.
149
Pest Control, Odour Control and Dust Control (b)
Currently, in the landfill site, the adjacent house, operators of weighbridge, collection vehicle
drivers, etc., are suffering from the outbreak of flies, offensive odour and dust. The situation is
unsanitary and the risk of health hazard occurs. These environmental conditions must be
improved immediately based on the following recommendations:
Eradicate the flies by spraying environment-friendly pesticide;
Conducting regular soil cover, at the same time, to eliminate the breeding sites of flies
and to prevent generation of offensive odour;
Periodic spraying onto the unloading waste by deodorant agent made from useful bacteria
like lactic acid, enzymes, etc., to decompose offensive odour substance; and
Periodic spraying of water to the approach road of vehicles and the weighbridge site to
prevent the dust from winding up.
As of March 2015, some of the operational measures of the proposed urgent project for earth cover, pest
control, etc. have been carried out by GWMC for controlling the waste dumping operation. However, it
has not yet implemented the urgent improvement work which requires a relatively large amount of
money due to shortage of funds of GWMC. The proposal still remains the same for implementing
immediately the improvement work through funding with a special budget, if available. In the
meantime, more effective measures will be proposed as a part of the project under the short-term
development plan of final disposal.

Draft Final Report
Volume 1 Main Report
Project for Integrated Solid Waste Management
Master Plan in Gujranwala
150
CTI Engineering International Co., Ltd. NJS Consultants Co., Ltd.
EX Research Institute Ltd.
Photo 4.5.1 Collapse of Gondlanwala Landfill Site
Fill the collapsed area for safety
of the vehicle traffic
Collapsed Ramp
Collapsed area to fill-up and
repair slope of the ramp

Project for Integrated Solid Waste Management
Master Plan in Gujranwala
Draft Final Report
Volume 1 Main Report
CTI Engineering International Co., Ltd. NJS Consultants Co., Ltd.
EX Research Institute Ltd.
151
Photo 4.5.2 Leachate Condition of Gondlanwala Landfill Site
Water area to fill-up by clayey
sand by 2m from the present
water table
Water area to fill-up by clayey sand about
2m from the present water table
Location of leachate pond
and temporary pump sump
Ramp to be repaired
This debris may be available
for filling material

Draft Final Report
Volume 1 Main Report
Project for Integrated Solid Waste Management
Master Plan in Gujranwala
152
CTI Engineering International Co., Ltd. NJS Consultants Co., Ltd.
EX Research Institute Ltd.
Figure 4.5.1 Urgent Improvement Plan for Gondlanwala Landfill Site

Project for Integrated Solid Waste Management
Master Plan in Gujranwala
Draft Final Report
Volume 1 Main Report
CTI Engineering International Co., Ltd. NJS Consultants Co., Ltd.
EX Research Institute Ltd.
153
4.5.2 Development of Alternatives for the Final Disposal Plan
(1) Waste Disposal Amount
Waste disposal amount is computed in accordance with the integrated municipal solid waste
management flow. More concretely, the waste disposal amount is calculated from the waste
generation amount presented in Section 4.3 by reducing the following waste amounts:
Un-collected waste amount;
Waste generation prevention amount;
Resource recovery amount by waste pickers in town and recycling industries;
Organic waste recovery by home, community and central composting; and
Combustible waste recovery by RDF plant.
The estimation of waste disposal amount is carried out in three (3) cases, i.e., 1) waste disposal
amount with 3R activities and intermediate treatment; 2) waste disposal amount without 3R and
intermediate treatment; and 3) waste disposal amount without any new project (Zero option). The
result of computation is summarised in Table 4.5.1. From the table, the daily waste disposal
amount of 406 t/d in 2014 increases drastically up to 2,013 t/d or 2,724 t/d in 2030 by the cases of
with/without the activities of 3R and intermediate treatment. Meanwhile, the annual waste disposal
amount of 148,000 t/year in 2014 increases to 735,000 t/year or 994,000 t/year for the cases of
with/without 3R and intermediate treatment.
Table 4.5.1 Estimated Waste Disposal Amount by Cases
Daily Waste Disposal Amount (t/d)
Case 2014 2015 2016 2017 2018 2019 2020 2021 2022 2023 2024 2025 2026 2027 2028 2029 2030
With 3R 406 500 658 833 1,035 1,133 991 1,105 1,227 1,359 1,500 1,612 1,724 1,848 1,981 2,115 2,013
Without 3R 406 500 658 833 1,035 1,133 1,241 1,356 1,478 1,610 1,752 1,888 2,027 2,182 2,353 2,528 2,724
Without Projects 406 406 406 406 406 406 406 406 406 406 406 406 406 406 406 406 406
Annual Waste Disposal Amount (1,000 t/year)
UCs 2014 2015 2016 2017 2018 2019 2020 2021 2022 2023 2024 2025 2026 2027 2028 2029 2030
With 3R 148 183 241 304 378 414 363 403 448 496 549 589 629 674 725 772 735
Without 3R 148 183 241 304 378 414 454 495 540 588 641 689 740 797 861 923 994
Without Projects 148 148 148 148 148 148 148 148 148 148 148 148 148 148 148 148 148
Source: JICA Project Team
(2) Annual Landfill Volume
The landfill volume is estimated through conversion of waste amount in ton to volume in cubic
metre (m3) by the bulk density of filled waste layer obtained from the bulk density survey
conducted at Chianwali and Gondlanwala disposal site. As mentioned earlier, the bulk density of
0.9 ton/m3 was used for estimating the residual lifetime of the Gondlanwala disposal site. The bulk
density of 1.0 ton/m3 is used for the design of proposed Bhakhraywali landfill facilities considering
the longer lifetime compared with that of the Gondlanwala site. Then, the cover soil volume of 20%
to the waste volume is added to estimate the total landfill volume.
The result of landfill volume computation is tabulated in Table 4.5.2 for the annual waste disposal
volume together with the cover soil volume. The annual landfill volume is also divided into the two
disposal sites: at Gondlanwala (2014-2017) and at Bhakhraywali (2018-2030). In addition, the
landfill volume of Gondlanwala disposal site in 2014 has adjusted with the volume for 10 months
since the landfill operation started in March 2014. In Gondlanwala disposal site, the annual waste
disposal volume including waste disposal volume and cover soil volume increases to 365,000
m3/year in 2017 from 148,000 m
3/year in 2014. In Bhakhraywali disposal site, the landfill volume

Draft Final Report
Volume 1 Main Report
Project for Integrated Solid Waste Management
Master Plan in Gujranwala
154
CTI Engineering International Co., Ltd. NJS Consultants Co., Ltd.
EX Research Institute Ltd.
of 453,000 m3/year in 2018 increases up to 882,000 m
3/year or 1,193,000 m
3/year in 2030 for
with/without the 3R and intermediate treatment cases.
Table 4.5.2 Estimated Annual Landfill Volume by Cases
Annual Waste Disposal Volume (1,000 m3/year)
Case 2014 2015 2016 2017 2018 2019 2020 2021 2022 2023 2024 2025 2026 2027 2028 2029 2030
With 3R
(Gondlanwala) 123 183 241 304
With 3R (Bhakhraywali)
378 414 363 403 448 496 549 589 629 674 725 772 735
Without 3R
(Bhakhraywali) 378 414 454 495 540 588 641 689 740 797 861 923 994
Without New Projects
123 148 148 148 148 148 148 148 148 148 148 148 148 148 148 148 148
Annual Cover Soil Volume (1,000 m3/year)
UCs 2014 2015 2016 2017 2018 2019 2020 2021 2022 2023 2024 2025 2026 2027 2028 2029 2030
With 3R
(Gondlanwala) 25 37 48 61
With 3R
(Bhakhraywali) 76 83 73 81 90 99 110 118 126 135 145 154 147
Without 3R (Bhakhraywali)
76 83 91 99 108 118 128 138 148 159 172 185 199
Without
New Projects 25 30 30 30 30 30 30 30 30 30 30 30 30 30 30 30 30
Annual Landfill Volume (1,000 m3/year)
With 3R (Gondlanwala)
148 219 289 365
With 3R
(Bhakhraywali) 453 496 435 484 538 595 659 706 755 809 870 926 882
Without 3R (Bhakhraywali)
453 496 545 594 648 705 770 827 888 956 1,033 1,107 1,193
Without
New Projects 148 178 178 178 178 178 178 178 178 178 178 178 178 178 178 178 178
Source: JICA Project Team Note: The landfill volume of Gondlanwala in 2014 has adjusted with the volume for 10 months since the landfill operation started in March 2014.
(3) Cumulative Landfill Volume
The cumulated annual landfill volume for each year is as shown in Table 4.5.3 and the annual trend
graph is shown in Figure 4.5.2. The cumulative landfill volume at Gondlanwala disposal site will
become 1.0 million cubic metres in the end of 2017. The cumulative landfill volume for
with/without 3R and intermediate treatment during the period from 2018 to 2030 will become
8.6 million cubic metres and 10.2 million cubic metres respectively. In case of “Zero Option” or no
implementation of new projects, the cumulative landfill volume will become about 3 million cubic
metres.
Table 4.5.3 Estimated Cumulative Landfill Volume by Cases
Cumulative Landfill Volume (m3)
Case Year 2014 2015 2016 2017 2018 2019 2020 2021 2022 2023 2024 2025 2026 2027 2028 2029 2030
With 3R
(Gondlanwala) 148 367 656 1,020
With 3R
(Bhakhraywali)
453 948 1,381 1,863 2,399 2,992 3,648 4,351 5,103 5,909 6,775 7,697 8,573
Without 3R
(Bhakhraywali)
453 948 1,491 2,083 2,728 3,431 4,198 5,022 5,907 6,860 7,889 8,992 10,179
Without
New Projects 148 326 504 682 859 1,037 1,215 1,393 1,571 1,748 1,926 2,104 2,282 2,460 2,637 2,815 2,993
Source: JICA Project Team

Project for Integrated Solid Waste Management
Master Plan in Gujranwala
Draft Final Report
Volume 1 Main Report
CTI Engineering International Co., Ltd. NJS Consultants Co., Ltd.
EX Research Institute Ltd.
155
Source: JICA Project Team
Figure 4.5.2 Increasing Trend of Cumulative Landfill Volume by Cases (1,000 m3)
(4) Landfill Development Plan
Available Landfill Volume and Lifetime of Disposal Site (a)
The available landfill volume for Gondlanwala and Bhakhraywali disposal site are computed
at 510,000 m3 and 1,600,000 m
3 for filling up to the existing ground, respectively. Judging
from the available landfill volume of each site, the lifetime of Gondlanwala disposal site will
end in 2016 based on the cumulative landfill volume indicated in Table 4.5.3 or in Figure
4.5.2 above. On the other hand, the lifetime of Bhakhraywali which will start landfill
operation in 2018 will end in 2021 for the case of with or without 3R and intermediate
treatment. Development alternatives of landfill sites are proposed in the following subsections
based on the estimated lifetime of each disposal site described above.
Alternative Landfill Development for Gondlanwala Site (b)
The alternative landfill development of Gondlanwala is prepared to accommodate waste
disposal up to the end of 2017 when the Bhakhraywali landfill site will become operational in
2018. The following four options in Table 4.5.4 are proposed for the Gondlanwala site taking
into account the circumstance of the neighbouring area.

Draft Final Report
Volume 1 Main Report
Project for Integrated Solid Waste Management
Master Plan in Gujranwala
156
CTI Engineering International Co., Ltd. NJS Consultants Co., Ltd.
EX Research Institute Ltd.
Table 4.5.4 Landfill Development Options for Gondlanwala
Options Existing Site New Site Waste Transfer
Option-1 Landfill waste up to the ground level with 510,000 m3. Piling up about 8 m high from the ground level to accommodate another 510,000 m3. Total 1,020,000 m3 to dispose waste until the end of 2017.
None None
Option-2 Landfill waste up to the ground level with 510,000 m3. Piling up about 3 m high from the ground level to accommodate about 180,000 m3. Total 690,000 m3 to dispose waste until the middle of 2016.
Procure about 8 ha of land and use 80% of the area for landfill. Landfill 3m deep from the ground level and pile up 3m waste layer above the ground to receive waste from the middle of 2016 to the end of 2017.
None
Option-3 Same as Option-1 None Transfer waste to the Bhakhraywali disposal site after completion of the landfill facilities.
Option-4 Landfill waste up to the ground level by the volume of 510,000 m3.
None Use the open space of Bhakhraywali landfill site for temporary storage for 1-2 years then transfer waste to the Bhakhraywali landfill site after completion of the landfill facilities.
Source: JICA Project Team
The options were evaluated from environmental, technical and economic aspects and
concluded that Option-4 is the most realistic and preferable followed by Option-3. Option-4
implicates the operational uncertain factors depending on the development schedule and work
plan of the Bhakhraywali landfill facilities. If the timing of the development work cannot
accept the temporary waste storage, then Option-3 shall be practiced.
Alternative Landfill Development for Bhakhraywali Site (c)
The alternative landfill development of Bhakhraywali is prepared to accommodate waste
disposed from 2018 to 2030 until the end of the Master Plan period. The two options in Table
4.5.5 are proposed for the Bhakhraywali site taking into account the circumstance of the
neighbouring area.
Table 4.5.5 Landfill Development Options for Bhakhraywali
Options Existing Site New Site
Option-1
Stage-1: Development: Landfill waste up to the ground level with the volume of 1,600,000 m3. Piling up about 11 m high from the ground level to accommodate another 2,200,000 m3. Disposed waste until the middle of 2024 is 3,800,000 m3 in total.
Procurement of 50 ha of land and use 80% or 40 ha for the landfill area. Landfill 3 m deep down from the ground level and pile up 11 m from the ground level.
Stage-2: Development: Development of 20 ha landfill area to secure new volume of about 2,800,000 m3or the cumulative volume of 6,600,000 m3 to accommodate landfill from the middle of 2024 to the middle of 2028.
Stage-3: Development: Development of 20 ha landfill area to secure 2,800,000 m3or the cumulative volume of 9,400,000 m3 to accommodate landfill from 2028 to 2030 and after.
Option-2
Stage-1: Development: Landfill waste up to the ground level with the volume of 1,600,000 m3. Piling up about 8 m high from the ground level to accommodate another 1,600,000 m3. Disposed waste until the beginning of 2024 is 3,200,000 m3 in total.
Procurement of 75 ha of land and use 80% or 60 ha for the landfill area. Landfill 3 m deep down from the ground level and pile up 8 m from the ground level.
Stage-2: Development: Development of 30 ha landfill area to secure new volume of about 3,300,000 m3 or the cumulative volume of 6,500,000 m3 to accommodate landfill from the beginning of 2024 to the middle of 2027.
Stage-3: Development: Development of 30 ha landfill area to secure 3,300,000 m3 or the cumulative volume of 9,800,000 m3 to accommodate landfill from the middle of 2027 to 2030 and after.
Source: JICA Project Team

Project for Integrated Solid Waste Management
Master Plan in Gujranwala
Draft Final Report
Volume 1 Main Report
CTI Engineering International Co., Ltd. NJS Consultants Co., Ltd.
EX Research Institute Ltd.
157
The respective options are feasible from the environmental, technical and economic aspects.
However, Option-1 is superior to Option-2 from the viewpoint of possibility of land
procurement and environmental issues. The rapid increase of incoming waste to the disposal
site caused difficulties for the waste disposal plan. The best option of the disposal plan would
be the implementation of more active 3R and intermediate plan to divert waste from the waste
disposal through the financial support of the Punjab Government.
(5) Development of Design Alternatives for Final Disposal
The final disposal plan includes improvement plan of the existing disposal site in Gondlanwala and
safety closure of Chianwali disposal site in addition to the construction of landfill facilities in
Bhakhraywali. The plan for Gondlanwala and Chianwali shall be formulated to the satisfactory
level to mitigate current and future possible negative impacts in consideration of economic
efficiency. Accordingly, the alternative study for the sites in Gondlanwala and Chianwali is not
conducted in this subsection and the following discussions are the matters related with development
of the landfill facilities in Bhakhraywali.
The waste management hierarchy begins with waste discharge. Final disposal is the last preferable
option for storing eternally and safely the waste of no value. Landfill type is classified by the kind
of waste to be disposed. The landfill types for municipal solid waste generally practiced in the
developing countries can be divided into the following:
Open dump site;
Controlled open dump site; and
Engineered landfill.
The definition of the landfill types listed above is different by countries and clear technical
standards are not established.
There are several legal frameworks in the world stipulating landfill types and technical standards.
According to the Directive 1999/31/EC on the landfill of waste, landfill types are divided into the
three classes given below.
Landfill for hazardous waste;
Landfill for non-hazardous waste; and
Landfill for inert waste.
The type of landfill for non-hazardous waste is intended for municipal solid waste. The said
division of landfill type is also prescribed in the Waste Management Law in Japan, namely; the
landfill types are:
Stabilisation type;
Management type; and
Closed type.
The management type is applied for municipal solid waste in Japan and constructed by most of the
local governments for final disposal facilities.
In Pakistan, the landfill types are categorised under the Punjab Municipal Solid Waste Management
Guidelines. The types are divided by the tonnage of waste amount received as follows:
Class A: Daily municipal solid waste of more than 1,000 tons
Class B: Daily municipal solid waste of more than 500 tons and less than 1,000 tons
Class C: Daily municipal solid waste of more than 100 tons and less than 500 tons
Class D: daily municipal solid waste of less than 100 tons. (Stabilisation type)

Draft Final Report
Volume 1 Main Report
Project for Integrated Solid Waste Management
Master Plan in Gujranwala
158
CTI Engineering International Co., Ltd. NJS Consultants Co., Ltd.
EX Research Institute Ltd.
The Guidelines also stipulates the requirements for landfill liner system, leachate management
system, final cover system, etc., which shall be applied for municipal waste landfill. Requirements
stated in the Guidelines are comparatively strict and the requirements are equivalent to the landfill
type called for sanitary landfills practiced at many local governments in Japan.
4.5.3 Evaluation of Design Alternatives
Evaluation of final disposal alternatives generally begins with the construction of site alternatives. For
this project, the landfill site selection survey conducted for 19 sites as delineated in Section 2.4 has
selected Bhakhraywali as the construction site of landfill facilities. The selected construction site is
superior to other sites in terms of geographical, technical and environmental point of view and
considered appropriate for the proposed construction site. Accordingly, the evaluation of the
construction site alternative is not discussed anymore under this subsection.
The type of landfill for municipal solid waste has almost no option and the sanitary landfill becomes the
most preferable options as mentioned in Subsection 4.5.2. However, there are some levels or grade of
sanitary landfill system for consideration in the course of design of landfill facilities as discussed in the
following subsections.
(1) Level of Sanitary Landfill Facilities
The level of Sanitary landfill can be defined or classified by the function of the facilities
constructed and operation and maintenance procedures. Four levels of sanitary landfill are
proposed, as follows:
Level 1: Incoming waste recording and unloading control
Level 2: Level 1 plus regular cover soil
Level 3: Level 2 plus effluent control of leachate
Level 4: Level 3 plus leachate treatment system
Level 1: Incoming waste recording and unloading control
The minimum requirements of the Level 1 landfill are the impermeable liner system for landfill
waste containment, recording of incoming waste by weighbridge and control of waste unloading to
the designated landfill area for the day.
Level 2: Level 1 plus regular cover soil
The minimum requirements of Level 2 are regular and daily filling with cover soil as the most
preferable operation, in addition to the facilities and operation meeting the requirements of Level 1
landfill.
Level 3: Level 2 plus effluent control of leachate
The minimum requirements of Level 3 are the effluent control system of leachate including
installation of leachate collection system and leachate pond, in addition to the facilities and
operation meeting with the requirements of Level 2 landfill.
Level 4: Level 3 plus leachate treatment system
The minimum requirements of Level 4 are the leachate treatment system in addition to the facilities
and operation meeting the requirements of Level 3 landfill.
The selection of sanitary landfill level among those defined above is made basically depending on
the probable environmental impact of the landfill site to the natural and social conditions in the
surrounding area. The area surrounding the proposed site in Bhakhraywali is agricultural area and
the nearest residential area is located at approximately 1 km away from the proposed site. Based on
the conditions mentioned above, the function of landfill facilities and operation for Level 3 landfill

Project for Integrated Solid Waste Management
Master Plan in Gujranwala
Draft Final Report
Volume 1 Main Report
CTI Engineering International Co., Ltd. NJS Consultants Co., Ltd.
EX Research Institute Ltd.
159
will be proposed to satisfy the requirements for a new sanitary landfill from the environmental and
economic viewpoints.
(2) Design Option for Semi-Aerobic Sanitary Landfill
Article 26 of The Punjab Waste Management Act of 2013 prescribes in the “Standards for Landfill”
that the technical design of landfill shall meet the standards required by the authorised office and
some of the technical requirements are specified. The design of Bhakhraywali sanitary landfill
complies basically with the requirements specified under Article 26.
Furthermore, the Bhakhraywali sanitary landfill facilities shall have the function to facilitate
semi-aerobic type landfill. The semi-aerobic type landfill can promote decomposition of organic
waste for prompting early stabilisation and reducing generation amount of methane. In order to
have the function of semi-aerobic landfill, the installation of leachate collection system, leachate
pond, leachate pump well, and landfill gas vents is required. In particular, the size of the leachate
collection conduit or pipes shall be large enough to entrain air into the conduit or the pipes in
addition to the special design at the outlet section of the leachate collection system to the leachate
pond designed to open to the air intermittently.
4.5.4 Identification of Project Components for Final Disposal Plan
(1) Project Components for Final Disposal Plan
The project components for final disposal are formulated to tackle the measures against the
problems and issues defined in Subsection 2.4.10. The problems and issues pointed out three areas
for taking measures for the final disposal plan. The first priority is given to the development of
sanitary land facilities. The Urban Unit (UU) carried out the study for landfill site selection and
prepared the report as described in Section 2.4. The evaluation factors for siting adopted in the
report composed of the key items derived from the provisions in “Punjab Waste Management Act
2013”. These evaluation factors are the field of area size, location, environment, society and
economy, and so forth. Studying the site selection procedures and the conclusions of the report, it is
considered that the site at Bhakhraywali is the most feasible site for development of sanitary
landfill facilities.
The second priority is given to the improvement work of Gondlanwala existing disposal site and
lastly to the safety closure of Chianwali disposal site. The plan is formulated in 3 phases, short-term
from 2016 to 2018, mid-term from 2019 to 2024, and long-term from 2025 to 2030 as shown in the
contents of the projects summarised in the following subsections. The project location of the three
sites is shown in Figure 4.5.3 to Figure 4.5.6.

Draft Final Report
Volume 1 Main Report
Project for Integrated Solid Waste Management
Master Plan in Gujranwala
160
CTI Engineering International Co., Ltd. NJS Consultants Co., Ltd.
EX Research Institute Ltd.
Figure 4.5.3 Location of Bhakhraywali Sanitary Landfill Development Project
Figure 4.5.4 Access Road of Bhakhraywali Sanitary Landfill Facility
Bhakhraywali
Sanitary Landfill
Site

Project for Integrated Solid Waste Management
Master Plan in Gujranwala
Draft Final Report
Volume 1 Main Report
CTI Engineering International Co., Ltd. NJS Consultants Co., Ltd.
EX Research Institute Ltd.
161
Figure 4.5.5 Location of Gondlanwala Disposal Site Improvement Project
Figure 4.5.6 Location of Chianwali Safe Closure Project

Draft Final Report
Volume 1 Main Report
Project for Integrated Solid Waste Management
Master Plan in Gujranwala
162
CTI Engineering International Co., Ltd. NJS Consultants Co., Ltd.
EX Research Institute Ltd.
(2) Short-Term Plan (2016-2018)
The projects in the Short-Term period, i.e., from 2016 to 2018, are described as the Action Plans of
Priority Projects in Chapter 6. The proposed projects are as follows:
Procurement of Sanitary Landfill Site
Engineering Service for Sanitary Landfill Facilities (Stage 1)
Construction of Sanitary Landfill Facilities (Stage 1) in Bhakhraywali
Procurement of Landfill Machinery
Operation and Maintenance of Landfill Facilities
Improvement Work of the Existing Landfill in Gondlanwala
Safe Closure of the Landfill Site in Gondlanwala
Safe Closure of the Landfill Site in Chianwali
Monitoring of Final Disposal in Bhakhraywali
Post-Closure Monitoring of Gondlanwala and Chianwali Landfill Sites
(3) Mid-Term Plan (2019-2024)
Operation and Maintenance of Landfill Facilities (a)
The operation and maintenance of the sanitary landfill facilities shall be in accordance with the
requirements stated in the Project for Operation and Maintenance of Landfill Facilities in
Chapter 6.
Monitoring of Final Disposal in Bhakhraywali (b)
Monitoring of the final disposal activities shall be in accordance with the requirements stated
in the Project for Monitoring of Final Disposal in Bhakhraywali in Chapter 6.
Post-Closure Monitoring of Gondlanwala and Chianwali Landfill Sites (c)
Monitoring and maintenance of the closed sites shall be in accordance with the requirements
stated in the Project for Post-closure Monitoring of Gondlanwala and Chianwali in
Chapter 6.
Engineering Service for Sanitary Landfill Facilities (Stage 2) (d)
Engineering service shall be carried out in or before 2021. The site shall be divided into three
sections for the phased development of Stage 2 to Stage 3 sanitary landfill facilities. Then the
engineering service shall be carried out for the area of Stage 2 sanitary landfill facilities. The
engineering company shall carry out the services in accordance with the requirements stated in
the Project for Engineering Service for Sanitary Landfill Facilities (Stage 1) in
Chapter 6.
Construction of Sanitary Landfill Facilities (Stage 2) (e)
GWMC shall call the tender for the construction of Stage 2 sanitary landfill facilities in 2021
and complete the facilities by the end of 2023. The construction work shall be carried out in
accordance with the requirements stated in the Project for Construction of Sanitary
Landfill Facilities (Stage 1) in Chapter 6.

Project for Integrated Solid Waste Management
Master Plan in Gujranwala
Draft Final Report
Volume 1 Main Report
CTI Engineering International Co., Ltd. NJS Consultants Co., Ltd.
EX Research Institute Ltd.
163
Procurement of Additional Landfill Machinery (f)
Procurement of additional landfill machine is required to dispose of the increased incoming
waste amount. In addition, the superannuated landfill machines shall be replaced as well. The
types of landfill machines and the number of units for procurement are listed as follows:
Two (2) units of Bulldozer (Chain Dozer);
One (1) unit of Wheel Dozer;
One (1) unit of Excavator; and
Three (3) units of Bucket Tractor for replacement.
Site Selection of Sanitary Landfill Site (Stage 2 and Stage 3) (g)
Prior to the commencement of the activities of Item (d), Engineering Service for Sanitary
Landfill Facilities (Stage 2), GWMC shall procure the land of 50-75 ha for development of
Stage 2 to Stage 3 sanitary landfill facilities in the adjacent area or the area nearby the Stage 1
site. The site selection must be started in or before 2020 and completed in the middle of 2020.
Procurement of Sanitary Landfill Site (Stage 2 and Stage 3) (h)
Procurement of site for development of sanitary landfill facilities for Stage 2 and Stage 3 shall
be completed by the middle of 2021 to enable the start of engineering services on time.
(4) Long-Term Plan (2025-2030)
Operation and Maintenance of Landfill Facilities (a)
Operation and maintenance of the sanitary landfill facilities shall be in accordance with the
requirements stated in the Project for Operation and Maintenance of Landfill Facilities in
Chapter 6.
Monitoring of Final Disposal in Bhakhraywali (b)
Monitoring of the final disposal activities shall be in accordance with the requirements stated
in the Project for Monitoring of Final Disposal in Bhakhraywali in Chapter 6.
Post-Closure Monitoring of Gondlanwala and Chianwali Landfill Sites (c)
Monitoring and maintenance of the closed sites shall be in accordance with the requirements
stated in the Project for Post-Closure Monitoring of Gondlanwala and Chianwali in
Chapter 6.
Engineering Service for Sanitary Landfill Facilities (Stage 3) (d)
Engineering service shall be carried out in or before 2025 for Stage 3 sanitary landfill
facilities. The engineering company shall carry out the services in accordance with the
requirements stated in the Project for Engineering Service for Sanitary Landfill Facilities
(Stage 1) in Chapter 6.
Construction of Sanitary Landfill Facilities (Stage 3) (e)
GWMC shall call the tender for construction of Stage 3 sanitary landfill facilities by the
middle of 2025 and complete the facilities by the end of 2026. The construction work shall be
carried out in accordance with the requirements stated in the Project for Construction of
Sanitary Landfill Facilities (Stage 1) in Chapter 6.
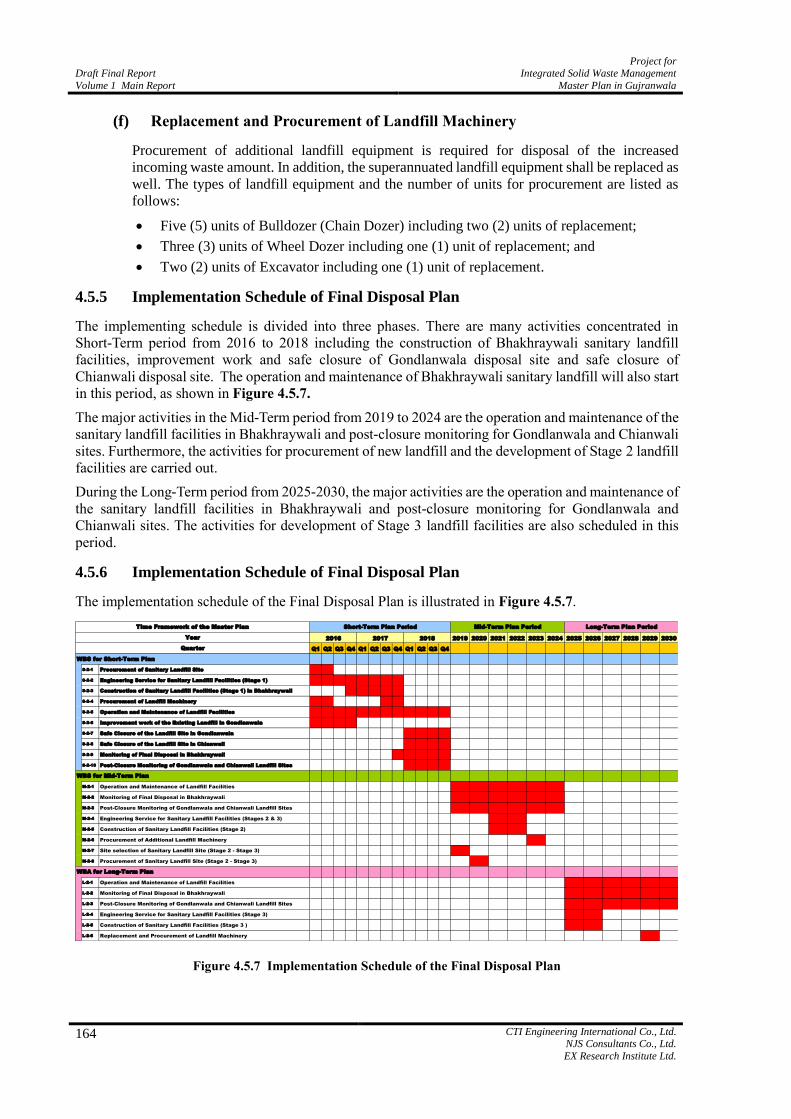
Draft Final Report
Volume 1 Main Report
Project for Integrated Solid Waste Management
Master Plan in Gujranwala
164
CTI Engineering International Co., Ltd. NJS Consultants Co., Ltd.
EX Research Institute Ltd.
Replacement and Procurement of Landfill Machinery (f)
Procurement of additional landfill equipment is required for disposal of the increased
incoming waste amount. In addition, the superannuated landfill equipment shall be replaced as
well. The types of landfill equipment and the number of units for procurement are listed as
follows:
Five (5) units of Bulldozer (Chain Dozer) including two (2) units of replacement;
Three (3) units of Wheel Dozer including one (1) unit of replacement; and
Two (2) units of Excavator including one (1) unit of replacement.
4.5.5 Implementation Schedule of Final Disposal Plan
The implementing schedule is divided into three phases. There are many activities concentrated in
Short-Term period from 2016 to 2018 including the construction of Bhakhraywali sanitary landfill
facilities, improvement work and safe closure of Gondlanwala disposal site and safe closure of
Chianwali disposal site. The operation and maintenance of Bhakhraywali sanitary landfill will also start
in this period, as shown in Figure 4.5.7.
The major activities in the Mid-Term period from 2019 to 2024 are the operation and maintenance of the
sanitary landfill facilities in Bhakhraywali and post-closure monitoring for Gondlanwala and Chianwali
sites. Furthermore, the activities for procurement of new landfill and the development of Stage 2 landfill
facilities are carried out.
During the Long-Term period from 2025-2030, the major activities are the operation and maintenance of
the sanitary landfill facilities in Bhakhraywali and post-closure monitoring for Gondlanwala and
Chianwali sites. The activities for development of Stage 3 landfill facilities are also scheduled in this
period.
4.5.6 Implementation Schedule of Final Disposal Plan
The implementation schedule of the Final Disposal Plan is illustrated in Figure 4.5.7.
Figure 4.5.7 Implementation Schedule of the Final Disposal Plan
2019 2020 2021 2022 2023 2024 2025 2026 2027 2028 2029 2030
Q1 Q2 Q3 Q4 Q1 Q2 Q3 Q4 Q1 Q2 Q3 Q4
WBS for Short-Term Plan
S-2-1 Procurement of Sanitary Landfill Site
S-2-2 Engineering Service for Sanitary Landfill Facilities (Stage 1)
S-2-3 Construction of Sanitary Landfill Facilities (Stage 1) in Bhakhraywali
S-2-4 Procurement of Landfill Machinery
S-2-5 Operation and Maintenance of Landfill Facilities
S-2-6 Improvement work of the Existing Landfill in Gondlanwala
S-2-7 Safe Closure of the Landfill Site in Gondlanwala
S-2-8 Safe Closure of the Landfill Site in Chianwali
S-2-9 Monitoring of Final Disposal in Bhakhraywali
S-2-10 Post-Closure Monitoring of Gondlanwala and Chianwali Landfill Sites
M-2-1 Operation and Maintenance of Landfill Facilities
M-2-2 Monitoring of Final Disposal in Bhakhraywali
M-2-3 Post-Closure Monitoring of Gondlanwala and Chianwali Landfill Sites
M-2-4 Engineering Service for Sanitary Landfill Facilities (Stages 2 & 3)
M-2-5 Construction of Sanitary Landfill Facilities (Stage 2)
M-2-6 Procurement of Additional Landfill Machinery
M-2-7 Site selection of Sanitary Landfill Site (Stage 2 - Stage 3)
M-2-8 Procurement of Sanitary Landfill Site (Stage 2 - Stage 3)
L-2-1 Operation and Maintenance of Landfill Facilities
L-2-2 Monitoring of Final Disposal in Bhakhraywali
L-2-3 Post-Closure Monitoring of Gondlanwala and Chianwali Landfill Sites
L-2-4 Engineering Service for Sanitary Landfill Facilities (Stage 3)
L-2-5 Construction of Sanitary Landfill Facilities (Stage 3 )
L-2-6 Replacement and Procurement of Landfill Machinery
Quarter
WBS for Mid-Term Plan
WBA for Long-Term Plan
Year 2016 2017
Long-Term Plan PeriodTime Framework of the Master Plan
2018
Short-Term Plan Period Mid-Term Plan Period

Project for Integrated Solid Waste Management
Master Plan in Gujranwala
Draft Final Report
Volume 1 Main Report
CTI Engineering International Co., Ltd. NJS Consultants Co., Ltd.
EX Research Institute Ltd.
165
4.5.7 Project Cost of Final Disposal Plan
Investment cost, and operation and maintenance cost for the period from 2016 to 2030 are shown in
Table 4.5.6. The estimated total cost of the Final Disposal Plan for 15 years is estimated at
Rs. 4,883 million.
Table 4.5.6 Total Cost of the Final Disposal Plan
4.6 Intermediate Treatment and 3R Promotion Plan
As stated earlier in Chapters 2 and 3, the intermediate and treatment and 3R (Reduce, Reuse, Recycle)
of current condition were studied and evaluated in Section 2.5 including existing 3R activities in the
city and peri-urban area, and current problem identification. Then, the planning directions of the master
plan were described in terms of objectives, planning policies and strategies in Subsection 3.4.1,
Item (3). Based on the results of the study on the Project, the Intermediate Treatment and 3R Promotion
Plan will be formulated in consideration of the applicable technology in Gujranwala, the Punjab
Province and with the involvement of stakeholders through the utilisation of existing functions to the
maximum extent including improvement.
2016 2017 2018 2019 2020 2021 2022 2023 2024 2025 2026 2027 2028 2029 2030
S-2-1 Procurement of Sanitary Landfill Site 150,000 150,000
S-2-2 Engineering Service for Sanitary Landfill Facilities (Stage 1) 99,680 49,840 49,840
S-2-3 Construction of Sanitary Landfill Facilities (Stage 1) in Bhakhraywali 996,802 492,751 504,051
S-2-4 Procurement of Landfill Machinery 70,350 31,500 38,850
S-2-5 Operation and Maintenance of Landfill Facilities 72,151 18,669 21,859 31,623
S-2-6 Improvement Work of the Existing Landfill in Gondlanwala 55,902 55,902
S-2-7 Safe Closure of the Landfill Site in Gondlanwala 26,196 26,196
S-2-8 Safe Closure of the Landfill Site in Chianwali 34,544 34,544
S-2-9 Monitoring of Final Disposal in Bhakhraywali GWMC
S-2-10 Post-Closure Monitoring of Gondlanwala and Chianwali Landfill Sites GWMC
Sub-Total 1,505,625 798,662 614,600 92,363
M-2-1 Operation and Maintenance of Landfill Facilities 268,887 32,831 31,547 32,553 33,637 94,533 43,786
M-2-2 Monitoring of Final Disposal in Bhakhraywali GWMC
M-2-3 Post-Closure Monitoring of Gondlanwala and Chianwali Disposal Sites GWMC
M-2-4 Engineering Service for Sanitary Landfill Facilities (Stage 2) 97,408 48,704 48,704
M-2-5 Construction of Sanitary Landfill Facilities (Stage 2) 996,802 492,751 504,051
M-2-6 Procurement of Additional Landfill Machinery 87,450 87,450
M-2-7 Site Selection of Sanitary Landfill Site (Stage 2 - Stage 3) GWMC
M-2-8 Procurement of Sanitary Landfill Site (Stage 2 - Stage 3) 300,000 300,000
Sub-Total 1,750,548 32,831 331,547 574,008 586,392 181,983 43,786
L-2-1 Operation and Maintenance of Landfill Facilities 357,879 44,779 45,766 106,587 50,431 51,606 58,710
L-2-2 Monitoring of Final Disposal in Bhakhraywali GWMC
L-2-3 Post-Closure Monitoring of Gondlanwala and Chianwali Landfill Sites GWMC
L-2-4 Engineering Service for Sanitary Landfill Facilities (Stage 3) 97,408 48,704 48,704
L-2-5 Construction of Sanitary Landfill Facilities (Stage 3 ) 996,802 492,751 504,051
L-2-6 Replacement and Procurement of Landfill Machinery 174,300 174,300
Sub-Total 1,626,389 586,234 598,521 106,587 50,431 225,906 58,710
Grand Total 4,882,562 798,662 614,600 92,363 32,831 331,547 574,008 586,392 181,983 43,786 586,234 598,521 106,587 50,431 225,906 58,710
WBS
Long-Term Plan
Total Budget
(Thousand Rs.)
Annual Cost
Programme 2: Final Disposal Plan
Short-Term Plan
Mid-Term Plan
WBS
No.

Draft Final Report
Volume 1 Main Report
Project for Integrated Solid Waste Management
Master Plan in Gujranwala
166
CTI Engineering International Co., Ltd. NJS Consultants Co., Ltd.
EX Research Institute Ltd.
4.6.1 Development of Alternatives for Intermediate Treatment and 3R Plan
(1) Intermediate Treatment Plan
Outline of Proposed Intermediate Treatment Plan (a)
Considering the overall financial constraint against the solid waste management by GWMC,
the ISWM Master Plan is to be formulated with the required minimum system to be developed,
especially, for waste collection services and waste disposal. However, as stated by the
Managing Director of GWMC, the development of intermediate treatment shall be a
privatisation option at this stage. The intermediate treatment facilities are indispensable for
the establishment of an integrated solid waste management system for Gujranwala City.
Therefore, studies should be carried out for several intermediate treatment options towards
future development in consideration of the result of waste composition analysis, as described
in the following subsections. The flowchart of selection of the intermediate treatment and 3R
activities is shown in Figure 4.6.1.
Figure 4.6.1 Flowchart of Selection of Intermediate Treatment and 3R Activity

Project for Integrated Solid Waste Management
Master Plan in Gujranwala
Draft Final Report
Volume 1 Main Report
CTI Engineering International Co., Ltd. NJS Consultants Co., Ltd.
EX Research Institute Ltd.
167
Proposed Technical Options of Intermediate Treatment (b)
In view of the technical options commonly discussed nowadays among the people concerned,
the six (6) technical options including Option 1, No Treatment; Option 2, Composting;
Option 3, MRF (Material Recovery Facility); Option 4, Incineration; Option 5, RDF; and
Option 6, Bio-gas were selected and considered for evaluating the most appropriate
intermediate treatment facilities for Gujranwala, Punjab. These technical options were
evaluated according to factors such as waste characteristics, progress and process of “waste to
compost, to energy” projects in Gujranwala City, practices in other countries, quantitative
economic factor, etc. The following descriptions present the development of the plan and the
evaluation for selecting the best option of intermediate treatment facility.
Qualitative Evaluation of Intermediate Treatment Options (c)
Table 4.6.1 summarises the qualitative evaluation of the six (6) potential options for
intermediate treatment which could be considered for the intermediate treatment facilities of
Gujranwala City. Details of each option are discussed in Volume 2, Supporting Report,
Section D: Intermediate Treatment and 3R Promotion, Subsection 4.1.1. As a whole, 1)
waste characteristics; 2) higher water content due to high ratio of commingled food waste
gives an advantage to composting in municipal waste; 3) actual performance results; and
4) GWMC’s policy on intermediate treatment, are the key to choose the best alternative.
Municipal waste incineration in Gujranwala City is disadvantageous. Considering the impacts
to environment, Option 2: Composting, and Option 5: RDF, are the more
environment-friendly intermediate treatment systems. As stated earlier, the development of
intermediate treatment is obliged to take consideration of the privatisation. As for sales and
marketing of the RDF products of the proposed Gujranwala compost/RDF company, it is
necessary for GWMC/SPV to push forward the contract negotiation with the existing or new
cement companies in near future (by year 2019). The costs for investment, operation and
maintenance in Option 3, Option 4 and Option 6 seem not affordable to private companies for
the intermediate treatment and 3R activities.
Table 4.6.1 Qualitative Evaluation of Intermediate Treatment Options
Evaluation Items
Option 1:
No Treatment
(Current
condition)
Option 2:
Composting
Option 3:
MRF
Option 4:
Incineration
Option 5:
RDF
Option 6:
Bio-gas
Objective Waste Mixed waste Biodegradable
waste
Sorted waste
for recycling
Combustible Combustible
(plastic, paper)
Biodegradable
Cost of Facility No cost due to
no facility
Cheaper Cheaper Very expensive Cheaper Moderate
- A A B A A
Environmental
Aspect
Need removal
of illegal waste
disposals and
pollutants in
64 UCs and
34 UCs
Odour in
mis-operation
Odour in
mis-operation
Need removal
of pollutants
from
combustion gas
emission
Need removal
of pollutants
from
combustion gas
emission
Odour in
mis-operation
Hard disposal of
digestive liquid
after having
gasified.
B A A A A A
Applicability - Small towns to
large cities
Small
communities to
middle cities
Small towns to
large cities
Small towns to
large cities
Villages /small
towns in rural
areas
B A B B A B

Draft Final Report
Volume 1 Main Report
Project for Integrated Solid Waste Management
Master Plan in Gujranwala
168
CTI Engineering International Co., Ltd. NJS Consultants Co., Ltd.
EX Research Institute Ltd.
Evaluation Items
Option 1:
No Treatment
(Current
condition)
Option 2:
Composting
Option 3:
MRF
Option 4:
Incineration
Option 5:
RDF
Option 6:
Bio-gas
Actual Practical
Experiences in
Punjab
- There is Lahore
Compost
Company.
There is no
MRF in
Gujranwala.
There is no
incineration
plant for
municipal
waste
treatment.
There are
cement plants
using RDF as
fuel in D.G.
Khan Cement
Company, and
Lafarge/Fauji
Cement
companies.
To date,
NRSP*
installed 197
biogas plants
for cooking,
reduce
household
expenses, etc.
in the
country.**
B A B B A A
Recommendations
for application to
Gujranwala solid
waste
intermediate
treatment facilities
- Highly
applicable
Less attractive
than
composting &
RDF.
More attractive
composting &
RDF than
incineration.
Highly
applicable
Not now. In
particular,
recommended
in future in
rural areas.
- A B B A B
Policy of GWMC GWMC recommends Option 2: Composting, and Option 5: RDF, as the most practical/reliable
intermediate treatment facilities through privatisation in Gujranwala.
- A B B A B
Evaluation
Results - A B B A B
Legend: A:Suitable, B: Not suitable
Source: JICA Project Team, GWMC
Note:* NRSP stands for National Rural Support Programme (NGO).
** NRSP, Monitoring, Evaluation & Research Section, “Renewable Energy: Evaluation of Biogas Initiative in Punjab” August 2011.
(2) 3R Promotion Plan
Outline of Development of 3R Promotion Plan (a)
The programmes under the 3R promotion plan were formulated basically with soft component
programmes defining the roles, responsibilities and activities of each party including GWMC,
waste generators and CDGG. The implementation of programmes should be carried out
through the primary initiative and effort of GWMC while the intermediate treatment facility is
to be owned and managed by the private sector and not GWMC. There are many programmes
commonly practiced in the world for 3R activities which can be categorised with waste
generation source control, waste discharge control, waste recovery and reuse, and recycling of
materials. These programmes are also applicable for the 3R activities in Gujranwala City. The
programmes and activities will be performed mostly with the raising of awareness of waste
generators and stakeholders through public campaigns, formal and school education, pilot
projects and capacity development of the GWMC staff concerned. In fact, it is revealed that
the recovery of recyclable materials is highly activated by the development of material
recovery facilities. Each programme under the 3R promotion plan is as elaborated below.
Proposed Technical Options of 3R Promotion (b)
Basically, the 3R scheme is composed of many kinds of soft component programmes for waste
reduction, recovery, re-use and recycling to promote 3R activities among the parties
concerned. The plan should be implemented comprehensively with all the possibly effective

Project for Integrated Solid Waste Management
Master Plan in Gujranwala
Draft Final Report
Volume 1 Main Report
CTI Engineering International Co., Ltd. NJS Consultants Co., Ltd.
EX Research Institute Ltd.
169
programmes which are divided into the four categories summarised below. The 3R
programmes in the four categories are inter-related, and should be implemented to achieve the
goals of 3R.
Waste Generation Source Control for Waste Reduction
Waste Discharge Control for Recovery and Waste Diversion
Recovery of Recyclables at Sources and Reuse
Recycling of Recyclable Materials
(i) Waste Generation Source Control for Waste Reduction
The programmes under the waste generation source control target the activities to minimise
the generation of waste through the production of durable goods and the avoidance of
over-packaging in distribution and sale, and by motivating and changing the awareness of
waste generators toward a lifestyle of resource and environmental conservation. These
activities should be implemented in five sub-programmes: production control, distribution
and sale control, consumer control, waste charge control, and commercial and institutional
waste control.
(ii) Waste Discharge Control for Recovery and Waste Diversion
Waste discharge control aims at reducing the amount of waste discharged by individual
waste generation sources through self-disposal at the backyard, converting organic waste
into compost, repair and reuse of broken instruments and appliances, and exchange or sale
of reusable goods within the community. These activities should be carried out at the waste
generation sources.
(iii) Recovery of Recyclables at Sources and Reuse
Activities under this programme intend to enhance the recovery of recyclable materials
through segregation at waste generation sources, recovery of recyclable materials before
the waste is discharged to the waste collection service, securing the routes for recovery and
trading of recyclable materials, etc. These activities require extensive participation of the
stakeholders and the communities.
(iv) Recycling of Recyclable Materials
Recycling industries or the recyclers or private shops/dealers should take the primary role
in the activities of this programme by performing regular and constant recovery of
recyclable materials and utilising the recovered materials for the production of goods.
Gujranwala City has very activated formal and informal commercial and industrial
societies for recycling of recyclable materials.
Figure 4.6.2 shows the conceptual flow of the four programmes and sub-programmes for
easier understanding of the 3R activities.
The increase of efficiency in recovering recyclable materials and securing a storage area, a
distribution centre, networking, etc., are also indispensable for the sustainability of 3R
activities. The following subsections explain these key elements and the proposed target
level associated with the 3R Promotion Plan for Gujranwala City.

Draft Final Report
Volume 1 Main Report
Project for Integrated Solid Waste Management
Master Plan in Gujranwala
170
CTI Engineering International Co., Ltd. NJS Consultants Co., Ltd.
EX Research Institute Ltd.
Figure 4.6.2 Conceptual Flow of Implementation of 3R Programmes
Technical Options of Resource Recovery (c)
In the process of recovery of recyclable materials from municipal waste in Gujranwala, the
following two technical options are considered depending on the waste segregation condition
summarised in Table 4.6.2. Those technical options are described in the following paragraphs.
Table 4.6.2 Technical Option for Recovery of Recycle Waste
Technical Option Segregation Condition Remarks
Option 1 Mixed waste and Recovery by sanitary workers and waste
pickers in the course of collection services and final disposal.
Without the
Project
Option 2 First and secondary segregation at generation sources, and final
sorting at the Proposed Central Compost Plant before processing of compost and RDF product
With the Project
Note: While Option 1 does not change the current condition, Option 2 may be able to improve the current condition of SWM
in the city economically and environmentally.
Option 1
This option is set in the highest hierarchy of resource recovery since the most challenging
segregation activities at generation sources require the involvement or active participation of
waste generators in the solid waste management system of the GWMC. Source separation is
practiced partly in Gujranwala and street hawkers working in town collect the recyclable
materials directly from the waste generators. Segregation at source shall be set up for a base as
GWMC implements resource recovery from waste. Option 1 stands on the fact that waste as
Production ControlPromotion of Self-disposal
& Recovery
Distribution & Sale Control
Consumer ControlRecovery and Reuse by
Residents & Communities
Waste Charge Control
Commercial & Institutional
Waste Control
Utilisation of Recyclables
by the Recyclers/Factories
Waste Discharge Control for
Recovery and Waste DiversionWaste Generation Source Control for
Waste Reduction
Recovery of Recyclable Materials at
Generation Sources and Reuse
Recycling of Recyclable Materials
3R Programs
Waste Discharge Control for
Recovery and Waste Diversion
Recovery of Recyclable Materials at
Generation Sources and Reuse
Recycling of Recyclable Materials
3R Programs
Waste Discharge Control for
Recovery and Waste Diversion
Recovery of Recyclable Materials at
Generation Sources and Reuse
Recycling of Recyclable Materials
3R Programs
Waste Discharge Control for
Recovery and Waste Diversion
Recycling of Recyclable Materials
3R Programmes
Recovery of Recyclable Materials at
Generation Sources and Reuse

Project for Integrated Solid Waste Management
Master Plan in Gujranwala
Draft Final Report
Volume 1 Main Report
CTI Engineering International Co., Ltd. NJS Consultants Co., Ltd.
EX Research Institute Ltd.
171
mixed is only waste but wastes as segregated become resources and are expectable for the
recovery of more amounts of recyclable materials.
Option 2
Recyclable materials are picked out from mixed waste as in Option 1. However, the key
player for recovery at the primary/secondary waste collections is the sanitary worker/waste
pickers at the transfer stations/collection enclosures, which are commonly practiced today in
the course of waste collection service. Recovered recyclable wastes collected are then brought
to the dealers handling waste. Final waste collection is to be carried out at sorting process at
the Central Compost Plant. Due to the picking-out action for recyclable materials in the course
of loading waste to the vehicles and sorting process at the Plant, the efficiency of waste
collection as a whole becomes improved.
Initiatives of GWMC for 3R Promotion Activities (d)
In order to implement the 3R activities effectively and efficiently, GWMC shall take the
primary role to set up the implementing policies, purposes, strategies, and the phased target
levels in addition to the coordination role for the parties concerned, such as stakeholders,
NGOs, and so on. It will be required to formulate the implementation plans and programmes
of 3R including public campaign, school and formal education, the encouragement of
residents, support/assistance, and the coordination to form a linkage among the residents,
NGOs, other community groups, waste pickers and private shops and dealers in the city. A
special task force shall be composed of experts in the field of solid waste management and
social services and the office staff to support the expert staff.
Enhancement of 3R Promotion Activities (e)
More recyclable materials will be recovered as segregation is carried out at residential houses
and workplaces of the establishments. For the purpose of recycling, the recovery of recyclable
materials shall be enforced and enhanced as social activities. The segregation and recovery of
recyclables at the waste generation sources will need the active participation of waste
generators so that the following activities shall be included in the implementation of 3R
including the enhancement of resource recovery:
Demonstration of 3R at pilot areas (50-100 target households and communities) which
shall involve the waste generators, waste pickers, private shops and so on;
Demonstration of 3R at pilot workplaces (around 10 target markets/hotels/restaurants for
organic wastes, and 50 establishments/shops/schools etc.) with the participation of all
staff of establishments;
Raising awareness through education and public campaign to encourage the participation
of waste generators in the 3R activities;
Support of GWMC on the recovery activities by providing transportation for recyclable
materials to the private shops or to the recycling factories; and
Promotion of recovery of food waste and biodegradable waste for home composting and
community level composting.
As for the above, the number of the demonstration of 3R at both pilot areas and pilot
workplaces is to be discussed and determined by GWMC. For instance, as a pilot UC of Zone
6, the pilot area has 50-100 households per group and 5 groups per UC. Similarly, the pilot
workplace has around 10 markets/hotels/restaurants for organic wastes, and 50
establishments/shops/schools etc. for recyclables.

Draft Final Report
Volume 1 Main Report
Project for Integrated Solid Waste Management
Master Plan in Gujranwala
172
CTI Engineering International Co., Ltd. NJS Consultants Co., Ltd.
EX Research Institute Ltd.
Flow of Recyclables in Gujranwala (f)
Based on the Waste Picker Survey (2015) described in Subsection 2.5.1 of this report and the
municipal waste flow analysis for the Project, a flow of recyclables in Gujranwala is assumed
as shown in Figure 4.6.3.
Figure 4.6.3 Flow of Recyclables in Gujranwala
The total amount of recyclables collected by waste pickers are estimated at about 70 ton/day
based on the Waste Picker Survey Report in 2015 in Gujranwala. From the total recyclable
amounts of approximately 70 ton/day, the results of WACS (2014/2015) and records of
weighbridge at Gondlanwala, approximately 122 ton/day of potential amount of recyclables
are assumed to be segregated collected in 64 UCs.
4.6.2 Evaluation of the Alternatives
Two (2) technical alternatives are selected for the intermediate treatment facilities in Gujranwala,
namely; Alternative-1: Central Compost and RDF Plant, and Alternative 2: No intermediate treatment
facility. The two alternatives are as compared below.

Project for Integrated Solid Waste Management
Master Plan in Gujranwala
Draft Final Report
Volume 1 Main Report
CTI Engineering International Co., Ltd. NJS Consultants Co., Ltd.
EX Research Institute Ltd.
173
Table 4.6.3 Technical Alternatives for Intermediate Treatment Facility and 3R
Technical Alternatives Description Remarks
Alternative-1: Central Compost and RDF Plant
The proposed Central Compost and RDF Plant were selected as an appropriate facility for Intermediate Treatment and 3R plan.
Composting process is to be demonstrated regularly as 3R activities for stakeholders.
Alternative 2:
No intermediate treatment facility
If there is no intermediate treatment facility including 3R activities, cumulative disposal amount without the intermediate treatment and 3R plan may become about 9.36 million tons per year in 2030, which is bigger than the 8 million ton/year for with-the plan.
Therefore, Alternative-1: Central Compost and RDF Plant with 3R plan, is required for the ISWM in
Gujranwala as presented below.
(1) Proposed Central Compost and RDF Plant in Gujranwala
Simulation Study on Feasible Compost Amounts and RDF Amounts for the (a)
Proposed Plant
Feasible input waste amounts for composting are estimated at 250 ton/day while RDF
production in two cases, 250 ton/day and 500 ton/day, is not feasible. Therefore, a subsidy
may be necessary to promote the RDF. Simulation results of the proposed Central Compost
Plant including RDF product in Gujranwala are presented in Table 4.6.4. The input waste
amount of 250 ton/day is basically derived from the experience of the Lahore Compost Plant,
and 20 ton/day is assumed as the small scaled amount for the compost plant for reference. Two
(2) different cases for the RDF plant were simulated, 250 ton/day and 500 ton/day.
Table 4.6.4 Simulation Results of Proposed Central Compost Plant and RDF Plant in Gujranwala
Proposed Intermediate
Treatment Plant
Input Waste Amount
(ton/day)
Production Amount
(ton/day)
IRR Evaluation
(%) Remarks
Central Compost Plant 250 125 17.2 OK.
20* 10 3.7 -
RDF Plant 250 100 N.G. Subsidy may be
required. 500 200 N.G.
Notes: N.G. means there is no computation result. * An input of 20 ton/day waste amount was proposed to simulate IRR evaluation as a small scale initial production
of composting but it was not feasible. Base on the interview results with the Lahore Compost Company (LCC) or the D.G. Khan Cement Company
(DGKCC), the rates of production amount by input amount at plant are given as approximately 50% for compost from the LCC and approximately 40% for RDF from the DGKCC, respectively.
Location and Required Area of the Proposed Plant (b)
The proposed central compost and RDF plant is to be built adjacent to the proposed landfill
site in Bhakhraywali and adjoining vacant lands, according to the Managing Director (MD) of
GWMC. The required land area of the proposed facilities is about 7 hectares (ha) including
land spaces for office, parking, workshop, store house, bagging unit, composting/RDF plant,
windrows field, etc.as a final development scale of the plant. Major factors are considered
during the landfill site selection as follows: airports, flood plains, wetlands, fault zones,
seismic zones, unstable areas, and environmental degradation (see details in Volume 2,
Supporting Report, Section C: Final Disposal, Subsection 2.8.1.). It is recommended that
the required land area of 7ha should be procured at the initial stage of the planning of the
proposed facilities in 2019.

Draft Final Report
Volume 1 Main Report
Project for Integrated Solid Waste Management
Master Plan in Gujranwala
174
CTI Engineering International Co., Ltd. NJS Consultants Co., Ltd.
EX Research Institute Ltd.
Necessity of Proper Quality Control of the Products and IEC Activities (c)
Saleability of the compost produced by the Lahore Compost Company (LCC) seems to be
poor. According to the results of the interview survey with the farmers at Bhakhraywali, one of
the reasons seems to include the lack of trust of the farmers due to lack of information on the
produced composts. In other words, securing proper quality of the products of composting and
disseminating their advantages is indispensable to obtain the trust of users. To ensure the
quality of compost products, the following measures should be taken into consideration:
Collection of organic materials by separation at source;
Establishment of a test farm for quality control of compost and IEC activities; and
Accreditation of the products by official certificates.
Regarding public relations, information, education and communication (IEC) activities are
required through the operation of a test farm since the primary target of dissemination are the
farmers. Details of the above measures are given in Volume 2, Supporting Report, Section D:
Intermediate Treatment and 3R Promotion, Subsections 5.2.1 and 5.2.2 and summarised as
follows:
(i) Collection of Organic Materials by Separation at Source
Organic waste is to be separated and collected by source separation in each household and
this activity of separate collection system shall start in 2019 based on the Waste Collection
and Transportation Plan described in Volume 2, Supporting Report, Section B, Subsection
4.2.2. The separate collection system will be conducted mainly with the installation of
containers in the main markets, restaurants, hotels, parks and roadsides for the organic
wastes from the residential houses. To introduce this new system, firstly, a pilot project
shall be carried out in Zone 6.
(ii) Establishment of a Test Farm for Quality Control of Compost and IEC
Activities
It is proposed that a small scaled pilot farm having approximately 1,000m2 is built within
the premises of the plant to test the growth of crops including the effect of compost and the
issues on crop cultivation for the purpose of quality control of the compost. The quality
control should be carried out in the test farm to remove foreign matter as well as manage
the moisture content, composting temperature, oxygen concentration in compost heaps,
maturation degree, etc., in order to propose a plan for the efficient production of a good
compost. Farmers are to be invited to the farm to witness the effects of compost and learn
how the compost quality is controlled in the production process. This procedure is expected
to result in the recognition of the effectiveness of composts and make them acceptable to
the farmers based on the yield and quality of the crops in the test farm and of course
depending on the price of compost. The effectiveness of compost will be tested for about
one year period. However, the pilot farm will be extended more and continued to further
crop cultivation for quality control of the compost, if the owner of the proposed compost
plant, i.e., Special Purpose Vehicle (SPV) wishes.
(iii) Accreditation of the Products by Official Certificates
It is indispensable to assure the quality of compost products periodically and officially to
widen the acceptability of compost as soil conditioner used together with chemical
fertilizers. The LCC has a licence for compost production issued by the Soil Fertility
Department, Agricultural Department Directorate of the Government of the Punjab. The
proposed SPV (Special Purpose Vehicle) for the proposed Gujranwala Central Compost
Company is thus also obliged to obtain a licence for compost production from the above

Project for Integrated Solid Waste Management
Master Plan in Gujranwala
Draft Final Report
Volume 1 Main Report
CTI Engineering International Co., Ltd. NJS Consultants Co., Ltd.
EX Research Institute Ltd.
175
Department. With regard to the test certificate, there are some private laboratories and
agencies of quality assurance tests like the PCSIR (Pakistan Council of Scientific &
Industrial Research). The establishment of an official quality assurance system would
make the farmers understand that the use of compost is effective and safe.
In terms of RDF products, the quality is important as well. At the Lahore Compost Plant, some
foreign matters are observed in the final product of RDF/RPF and they reduce the calorific
value. According to the waste segregation programme to be performed by GWMC in the
master plan, well-segregated waste is supposed to be transported to the proposed Gujranwala
Compost/RDF plant which shall start production of RDF in 2030. It is, therefore, emphasised
as the experience obtained from the Lahore RDF/RPF plant that the waste materials of paper
and plastics after separation should be segregated again at the plant in Gujranwala.
Operation Schedule of the Proposed Plant (d)
According to the proposed waste flow plan of the ISWM in Gujranwala City, for the waste
recovery amount with high organic content, the proposed central compost plant is designed to
receive 250 ton/day of wastes including market biodegradable wastes for the final sorting
process by 2018 and construction in the Year 2019. The 250 ton/day of waste is possible to be
derived from the actual organic waste recovery amount in the LCC whose operation started in
2006 for the production of compost and RDF.
The proposed central compost plant in Gujranwala is composed of various types of equipment
such as sorting conveyor, magnetic separator, trammel screen, and sieving screen at the plant,
bagging unit near storehouse, turner at windrow, etc. Similarly, the same sorting unit and
baling unit for 250 ton/day will also be used in the proposed RDF plant after enlargement of
the proposed Gujranwala central compost plant in 2030. Raw materials for the RDF consist of
papers and plastics and are planned to be separated as combustibles in 2030 when the RDF
plant starts operation. Details including investment cost and operation and maintenance cost
are given in Volume 2, Supporting Report, Section D: Intermediate Treatment and 3R
Promotion, Section 4.5.
Preliminary Cost Estimates for the Plant (e)
(i) Compost Section
The equipment to be used at the plant will be considered based on the equipment of the
plant managed by Lahore Compost Company (LCC). The total project cost for compost
production estimated with preliminary specifications is approximately Rs. 1,025 million up
to the year of 2030. The initial investment cost in 2018-2019 is assumed to be about Rs. 442
million and the second investment cost for enlargement including the cost for detailed
design in 2028-2029 will be around Rs. 74 million while annual cost for operation and
maintenance expenses will be about Rs. 46 million.
(ii) RDF Section
The RDF project cost estimated with the preliminary specifications seems to be
approximately Rs. 140 million [the initial investment cost of about Rs. 44 million (10
years)], annual about Rs. 17 million of the administrative and maintenance expenses. RDF
products will be sold to the cement factories. The current selling price of RDF products by
an ex-factory in LWMC is Rs. 53 per ton. The transport cost of RDF products to the cement
factory in Kallar Kahar is Rs. 900/ton and the cement factory in Multan sells them at Rs.
5,000/ton. The transportation cost in Gujranwala shall be determined depending on the
terms and conditions of the contract.

Draft Final Report
Volume 1 Main Report
Project for Integrated Solid Waste Management
Master Plan in Gujranwala
176
CTI Engineering International Co., Ltd. NJS Consultants Co., Ltd.
EX Research Institute Ltd.
Application of PPP Scheme (f)
The MD of GWMC has informed that GWMC intends that the proposed central compost and
RDF plant managed by the SPV (Special Purpose Vehicle) in Gujranwala is to be setup and
managed by privatisation. Composting is globally well recognised as an environmentally
friendly practice with no side effect. Once residents realise its benefit and usefulness, it is
possible for the private sector to make profit.
In order to promote composting, public involvement is essential. The simulation results of
economic internal rate of return (EIRR) as presented in the above Item (a) show that the
establishment of a central compost plant will be feasible if the production capacity is
satisfactory and the quality of products is assured. Therefore, instead of the PPP as the
optimum private sector involvement plan of the central compost and RDF plant in Gujranwala,
BOT (Build-Operate-Transfer) is recommended. Following the case of LCC as the pioneer
compost plant company based on the BOT in Pakistan, it is suggested that GWMC should
provide the land and a certain amount of organic waste in turn for a certain percentage of the
annual profit under the newly contracted company for the compost plant enterprise. The same
can be applied to the RDF plant.
Salient Features of the Proposed Central Compost and RDF Plant by SPV (g)
Salient features of the proposed Gujranwala central compost plant managed by the SPV are
shown in Table 4.6.5.
Table 4.6.5 Salient Features of Proposed Gujranwala Central Compost and RDF Plant by SPV
Project Name Project Overview Descriptions
Proposed Gujranwala central compost and RDF plant by SPV
Contracting parties GWMC, and a special purpose vehicle (SPV) for a central compost and RDF plant
Location in and/or around the proposed final landfill site in Bhakhraywali
Selection of PPP* BOT*basis between GWMC and the private sector is recommended.
Compost Section
Total land area for the Plant 7 hectares
Description of service Establishment of compost plant in 2020 including RDF from 2030
Operation period 2020 – 2035 (16 years: Service lifespan of the plant) )
Plant capacity Input waste: 250 tons/day
Staff involved Project manager, supervisor, mechanics, engineers, biochemist, marketing representative, labour, etc.
Equipment Imported plant containing all equipment sorting conveyors, trammel screen, shredder, turner, bagging unit, etc.
Facilities Administrative office, screening bagging and store unit, waste sorting unit, RFID and weight record room with weight bridge platform, windrow field, laboratory, guard office, car parking area, fencing, green belt zone, pilot farm field, etc.
Machinery Wheel loader, tractor and trolley, stitching and bagging unit, generating set, etc.
Compost preparation time 60~90 days
Production amount 125 tons/day of compost
Compost and RDF Section
Total plant area 7 hectares (no extension area for RDF, the same area as compost)
Operation period 2030 -
Description of service Extension work for RDF section of the waste sorting house from 2030
Plant capacity Input waste: 250 tons/day for compost, 250 tons/day for RDF
Staff involved Project manager, supervisor, mechanics, engineers, marketing representative, labour, etc.
Additional equipment Equipment of sorting line conveyors, baler, shredder, etc.
Additional extension facilities Extension work for waste sorting house for RDF production
Production amount 125 tons/day of compost, 100 tons/day of RDF
Notes: This proposed Gujranwala Central Compost & RDF Plant is planned to have a composting section and an RDF section in the same plant site after the year of 2030.
Construction of the proposed Gujranwala Central Compost & RDF Plant for producing compost and RDF may require an EIA/IEE based on the final decision of the Environment Protection Department (EPD) of the Government of the Punjab.

Project for Integrated Solid Waste Management
Master Plan in Gujranwala
Draft Final Report
Volume 1 Main Report
CTI Engineering International Co., Ltd. NJS Consultants Co., Ltd.
EX Research Institute Ltd.
177
(2) Home and Community Composting in 34 UCs
Although home composting and community composting will not be conducted so much in 64 UCs,
they will be carried out mainly in the 34 UCs. Home composting is to be made in each house and
community composting with the group composting. Home and community composting in the 34
UCs is to be carried out through the self-disposal system in collaboration with the community level
in Sadar Tehsil in Gujranwala. According to the proposed waste flow in the 34 UCs, organic waste
recovery amounts are to be produced for small-scaled composting starting from a small amount in
2019, less than 1 ton/day in 2023 to 1 ton/day in 2024 of the Mid-Term, and from 2 ton/day in 2025
to 5 ton/day in 2030 of the Long-Term. A new Gujranwala central compost company which shall be
fully responsible for the management of the new compost company is to be responsible for selling
compost as assistance to GWMC. Therefore, the central compost plant enterprise with GWMC will
be assigned to advise the related consumers such as households, communities, etc. in the 34 UCs.
Sadar Tehsil Municipal Administration (TMA) is to manage the activity of not only composting but
also segregation of recyclable materials at sources and primary waste collection in designated
areas, and the community-based composting through IEC (Information, Education and
Communication) campaign.
4.6.3 Identification of Project Components for Intermediate Treatment and 3R
Promotion Plan
(1) Short-Term Plan (2016-2018)
The projects in the Short-Term period, i.e., from 2016 to 2018, are described as the Action Plans of
Priority Projects in Chapter 6. The proposed projects are as follows:
Awareness and IEC Campaign on Resource Recovery
Implementation of Simplified WACS
Preparation for PPP and Formation of a Committee of the BOD of GWMC
Implementation of Land Preparation by GWMC
Engineering Service for Detailed Design of a Compost Plant by SPV
(2) Mid-Term Plan (2019-2024)
IEC Campaign on Resource Recovery at Source/Registration of Waste Pickers (a)
and Recycling Industries
During the Mid-Term Plan (2019-2024), the IEC campaign on resource recovery at source is
to be conducted together with the Communication Unit of GWMC under the Environmental
Education and Public Awareness Raising Plan in the IWSM master plan. The Communication
Unit, the focal point of GWMC, is the leading agency on the necessity of IEC campaign on 3R,
resource recovery, targeting expanded numbers of primary school teachers and students and
the general public than cases in the Short-Term Plan. This unit will serve as both information
dissemination point and where the general public can make inquiries about solid waste
management in GWMC. The details of staffing and costing of the Communication Unit are as
given in Volume 2, Supporting Report, Section E: Environmental Education and Public
Awareness Raising Plan, Subsection 4.3.3.
As for the registration of waste pickers, it is required to organise an informal sector of waste
picking by creating a centralised database of waste pickers and designing and issuing identity
cards to all of them. It will help to authorise waste pickers to collect waste and therefore
protect their source of living against harassment from the police, municipal workers and the
public. It may also be possible to introduce the social security schemes for the waste pickers,

Draft Final Report
Volume 1 Main Report
Project for Integrated Solid Waste Management
Master Plan in Gujranwala
178
CTI Engineering International Co., Ltd. NJS Consultants Co., Ltd.
EX Research Institute Ltd.
and the education scholarship scheme for children of waste pickers. This will help integrate
waste pickers into the door-to-door collection system of solid waste management.
Purchase of Land for the Compost Plant (b)
Following the action in the Short-Term Period for GWMC’s implementation of land
preparation (approximately 7 ha) for the compost plant project, the Board of Directors (BOD)
of GWMC has to settle the payment issue with the owners of the above land by the beginning
of 2019 based on the TOR which shall be prepared by the BOD of GWMC in 2017, so that the
new compost company (the SPV: Special Purpose Vehicle) will be able to start the
construction work for the compost plant in the payment settled land area without any delay in
its implementation.
Construction Work for the Gujranwala Compost Plant owned by SPV (c)
including Procurement of Equipment
The SPV shall require the contractor to start the civil and appurtenant works and the
procurement of equipment in the compost plant area in Bhakhraywali and complete them by
the end of 2019, so that all the required buildings and appurtenant facilities including
necessary equipment are ready for operation in 2020.
Operation and Maintenance of the Compost Plant (d)
Operation and maintenance (O&M) of the compost plant in Bhakhraywali shall be in
accordance with the requirements stated in the O&M manuals (2020-2024). The manuals are
to be prepared in the detailed design stage during the Short-Term Plan.
Monitoring of Implementation of the Compost Plant (e)
Monitoring of the implementation of the compost plant facilities shall be in accordance with
the requirements of a checklist of the operation and maintenance work in the Mid-Term
Plan (2019-2024). The checklist shall be prepared during the detailed design in 2018.
(3) Long-Term Plan (2025-2030)
IEC Campaign on Resource Recovery at Source/Registration of Waste Pickers (a)
and Recycling Industries
Refer to the contents of the above Item (2), Mid-Term Plan (a) for the Long-Term Plan.
Engineering Service for Detailed Design of the RDF Plant owned by SPV (b)
Engineering services including detailed design of the extension works for the waste sorting
facility for the RDF in Bhakhraywali and preparation of tender documents for the contractor
shall be carried out in 2028 in the Long-Term Period (2025-2030).
Construction of the RDF Plant owned by SPV including Procurement of (c)
Equipment
Following the detailed design in Item (2), construction of the extension works required for the
additional part of the waste sorting facility in Bhakhraywali is to be started in 2029 and
completed by the end of 2029. In addition to the extension of civil works for the waste sorting
facility for the RDF, procurement of additional equipment for the RDF is to be carried out
within the year of 2029, so that the plant will be ready to start the RDF operation in 2030.

Project for Integrated Solid Waste Management
Master Plan in Gujranwala
Draft Final Report
Volume 1 Main Report
CTI Engineering International Co., Ltd. NJS Consultants Co., Ltd.
EX Research Institute Ltd.
179
Operation and Maintenance of the Compost & RDF Plant (d)
The operation and maintenance of the compost and RDF plant shall be in accordance with the
requirements stated in the operation and maintenance manuals for the project after 2030. In
order to conduct operation and maintenance properly, the manuals shall be prepared in
accordance with the requirement of the plant under the TOR for SPV basis.
Monitoring of Implementation of the Compost & RDF Plant (e)
Monitoring of the compost plant is to be carried out during the Long-Term Period. The
maintenance work schedule is to start in 2025 in Bhakhraywali and for RDF production will
commence in 2030. The monitoring work shall consist of the activities of regular observation
on mainly the safety of workers and environmental monitoring for the plant and windrow
field, test farm, odour, water drain, environmental and social considerations, etc. in the
complex of the plant site, based on the environmental checkpoint sheet.
Preparation and Enacting of Recycling Laws in Punjab, Pakistan (f)
Even though policies, draft acts, guidelines, regulations, and ordinances related to solid waste
management exist, currently there is no recycling law in Gujranwala and the Punjab, Pakistan.
From the perspective of residents, it seems that most residents are not even aware of the
existence of laws and regulations. More frequent awareness raising and IEC campaigns should
be conducted for the public including school teachers and students.
In Japan, the Ministry of Environment enforces several laws and regulations for establishing a
recycling-based society, such as the Basic Environment Law (legislated in November 1993),
the Basic Act for Establishing the Sound Material-Cycle Society (legislated in June 2000) and
the Law for Promotion of Effective Utilisation of Resources (legislated in April 2006). Most
of these recycling laws and acts were enacted in Year 2000 or later, while the Basic
Environmental Law was legislated in 1993. In the Punjab, therefore, it will take some time to
legislate and enact recycling laws and acts after the Municipal Solid Waste Rules is legislated.
Although awareness raising and IEC campaign on 3R must be exercised continuously, it is
assumed that the recycling law might be legislated in 2025 and 2026 of the Long-Term Period.
4.6.4 Implementation Schedule of Intermediate Treatment and 3R Promotion Plan
The implementation schedule of the Intermediate Treatment and 3R Promotion Plan is illustrated in
Figure 4.6.4.

Draft Final Report
Volume 1 Main Report
Project for Integrated Solid Waste Management
Master Plan in Gujranwala
180
CTI Engineering International Co., Ltd. NJS Consultants Co., Ltd.
EX Research Institute Ltd.
Figure 4.6.4 Implementation Schedule of the Intermediate Treatment and 3R Promotion Plan
4.6.5 Project Cost of Intermediate Treatment and 3R Promotion Plan
Table 4.6.6 shows the project cost for the Master Plan. The total cost of the Intermediate Treatment and
3R Promotion Plan is Rs. 1,025 million. It is assumed that Rs.1,025 million of the total project cost of
the Intermediate Treatment and 3R Promotion Plan in the Master Plan consists of Rs. 42 million by local
fund or GWMC’s own resources and Rs. 983 million by Special Purpose Vehicle (SPV).
2019 2020 2021 2022 2023 2024 2025 2026 2027 2028 2029 2030
Q1 Q2 Q3 Q4 Q1 Q2 Q3 Q4 Q1 Q2 Q3 Q4
WBS (Work Breakdown Structure) for Short-Term Plan
S-3-1 Awareness & IEC Campaign on Resources Recovery
S-3-2 Implementation of Simplified WACS
S-3-3
Preparation for PPP & Formation of a Committee of the BOD of
GWMC
S-3-4 Implementation of Land Preparation by GWMC
S-3-5
Engineering Service for Detailed Design of the Compost Plant by
SPV
M-3-1
IEC Campaign for Resource Recovery at Source/ Registration of
Waste Pickers and Recycling Industries
M-3-2 Purchase of Land for the Compost Plant
M-3-3
Construction Work for the Gujranwala Compost Plant owned by
SPV including Procurement of Equipment
M-3-4 Operation and Maintenance of the Compost Plant
M-3-5 Monitoring of Implementation of the Compost Plant
L-3-1
IEC Campaign for Resource Recovery at Source/ Registration of
Waste Pickers and Recycling Industries
L-3-2 Engineering Service for Detailed Design of RDF Plant own by SPV
L-3-3
Construction of the RDF Plant owned by SPV including
Procurement of Equipment
L-3-4 Operation and Maintenance of the Compost & RDF Pant
L-3-5 Monitoring of Implementation of the Compost & RDF Plant
L-3-6 Preparation and Enacting of Recycling Laws in Punjab, Pakistan
Quarter
WBS (Work Breakdown Structure) for Mid-Term Plan
WBS (Work Breakdown Structure) for Long-Term Plan
Time Framework of the Master Plan Short-Term Plan Period Mid-Term Plan Period Long-Term Plan Period
Year 2016 2017 2018

Project for Integrated Solid Waste Management
Master Plan in Gujranwala
Draft Final Report
Volume 1 Main Report
CTI Engineering International Co., Ltd. NJS Consultants Co., Ltd.
EX Research Institute Ltd.
181
Table 4.6.6 Total Cost of the Intermediate Treatment and 3R Promotion Plan
4.7 Environmental Education and Public Awareness Raising Plan
Result of the awareness survey may alter/modify the direction in environmental education plan.
However, (1) framework to backup government’s efforts and mechanism or strategy to coordinate
among relevant bodies; (2) awareness raising activities targeting general public, school children
especially primary students, and business establishment through regular programmes/campaign; and
(3) in collaboration with community groups, feminist groups, and religious places (mosques) can be
focused in the Plan.
Topics shall include, but not limited to, environmental awareness, waste collection/transportation/
disposal, source separation, 3R (Reduce, Reuse, Recycle), composting, and others.
4.7.1 Development of Alternatives for Environmental Education and Awareness
Raising Plan
When considering environmental education and awareness raising plan, selecting the target population
is one of the very important elements, not to mention what to teach/sensitise the population. Population
can be targeted through a group or organization that the population belongs to, ranging from each
household to religious group, to school or business entities, etc. How to reach the population is also a
key element in developing the environmental education and awareness raising plan.
In these viewpoints, there are mainly four components to develop the plan. Those are formal education,
informal education, mass media, and periodical events. Each component has its own characteristics
which are discussed below.
2016 2017 2018 2019 2020 2021 2022 2023 2024 2025 2026 2027 2028 2029 2030
S-3-1 Awareness & IEC Campaign on Resources Recovery 0 0 0 0
S-3-2 Implementation of Simplified WACS 0 0 0 0
S-3-3
Preparation for PPP & Formation of a Committee of the BOD
of GWMC
BOD/GWMC 0 0 0
S-3-4 Implementation of Land Preparation by GWMC BOD/GWMC 0 0 0
S-3-5
Engineering Service for Detailed Design of a Compost Plant
by SPV
40,000 0 0 40,000
Sub-Total 40,000 0 0 40,000
M-3-1
IEC Campaign on Resource Recovery at Source/Registration
of Waste Pickers and Recycling Industries
0 0 0 0 0 0 0
M-3-2 Purchase of Land for the Compost Plant 42,000 42,000 0 0 0 0 0
M-3-3
Construction Work for the Gujranwala Compost Plant owned
by SPV including Procurement of Equipment
360,000 360,000 0 0 0 0 0
M-3-4 Operation and Maintenance of the Compost Plant 215,695 0 39,239 42,415 43,376 44,799 45,866
M-3-5 Monitoring of Implementation of the Compost Plant SPV 0 0 0 0 0 0
Sub-Total 617,695 402,000 39,239 42,415 43,376 44,799 45,866
L-3-1
IEC Campaign on Resource Recovery at Source/Registration
of Waste Pickers and Recycling Industries
GWMC 0 0 0 0 0 0
L-3-2
Engineering Service for Detailed Design of RDF Plant owned
by SPV
4,000 0 0 0 4,000 0 0
L-3-3
Construction of the RDF Plant owned by SPV including
Procurement of Equipment
70,000 0 0 0 0 70,000 0
L-3-4 Operation and Maintenance of the Compost & RDF Plant 293,216 45,866 45,866 45,866 45,866 45,866 63,886
L-3-5 Monitoring of Implementation of the Compost & RDF Plant SPV 0 0 0 0 0 0
L-3-6
Preparation and Enacting of Recycling Laws in Punjab,
Pakistan
Gov. of
Punjab
0 0 0 0 0 0
Sub-Total 367,216 45,866 45,866 45,866 49,866 115,866 63,886
Grand Total 1,024,911 0 0 40,000 402,000 39,239 42,415 43,376 44,799 45,866 45,866 45,866 45,866 49,866 115,866 63,886
Annual Cost
Short-Term Plan
Mid-Term Plan
Long-Term Plan
Programme 3: Intermediate Treatment and 3R Promotion Plan
WBS
No.
WBS
Total
Budget
(Thousand Rs.)

Draft Final Report
Volume 1 Main Report
Project for Integrated Solid Waste Management
Master Plan in Gujranwala
182
CTI Engineering International Co., Ltd. NJS Consultants Co., Ltd.
EX Research Institute Ltd.
(1) Formal Education
Formal education is defined as the education given in a classroom to the student on a structured
system provided by trained teachers under the supervision of the Board of Education of Punjab
Province. In the context of environmental education in SWM, a) primary schools and b) higher
education can be highlighted. Private and public schools exist in Gujranwala, and public schools,
inevitably, have less focuses on environment than private schools.
Primary School (a)
Except for a small number of unfortunate children, almost all small children in Gujranwala go
to either public or private primary schools. Currently, there is no formal programme dedicated
to environmental education under the education board.
Solid waste can be dealt as part of an integrated environmental education when adopted in
formal curriculum as it is an excellent educational material to: a) notice or show interest on the
environment and its associated problem, b) acquire knowledge, c) aware of the solutions, and
d) motivated to solve them.
The programme that covers the above contents requires not only very careful coordination
with the authority concerned and other relevant bodies but also detailed study on the contents
and how to integrate it with other subjects in the schools.
Higher Education (b)
Some colleges and universities already offer environmental education from environmental
science to environmental laws. Those courses are helping to grow environmental specialists in
the area; however, the impacts are very limited and do not necessarily stay within Gujranwala.
Collaboration with scholars specialising in solid waste management can be sought.
(2) Informal Education
Informal education is a type of education outside of the official school curriculum. It can be offered
in a school setting, of course, but also in other parts of society, i.e., it can also be called social
education where all parts of a social unit from each household to neighbourhood/community group,
religious group, etc.
Schools (a)
Primary schools in Gujranwala have some school activities outside of the official curriculum.
GWMC can, in close coordination with schools and relevant bodies, offer an education
programme delivered to each school. In the delivery programme, GWMC staff can visit
schools and teach pupils about SWM.
In Gujranwala, many schools have recreational or orientation field trips visiting some local
landmarks like historical monuments or museums. During this field trip, school students can
visit one of the waste management facility or waste management activities on the ground.
Waste management educational facility can be established either within city, waste collection
points or landfill site where visitors can learn about SWM through various displays,
observation, or hands-on experience. This educational facility can be a building/house, but
most likely can start with a single room or two, provided there is enough space to hold a class
of students (approximately 30 students or so). On the walls inside the room, various
explanations about waste management in the city can be displayed with samples. In the centre
of the room, the students can sit and listen to the GWMC staff or practice how to separate
recyclables using actual samples, for instance. Depending upon the size of a class, some

Project for Integrated Solid Waste Management
Master Plan in Gujranwala
Draft Final Report
Volume 1 Main Report
CTI Engineering International Co., Ltd. NJS Consultants Co., Ltd.
EX Research Institute Ltd.
183
creative activities can be also carried out in this space, like making artworks from recyclables,
and let students think how to improve their environment though proper waste management.
Topic of the informal education at schools can include proper management of waste,
separation of waste, 3R, compost, hygiene, and others.
Social Group (b)
Households play an important role in informal education since it is a basic unit of social
structure. In general, a child learns various values and behaviours from his/her parents/siblings
and other members of his family. Raising awareness of a household member can influence the
entire household members and yield long-term impacts.
Other social groups, including neighbourhood/community groups, religious (mosque), labour
union, teacher’s union, transport union, doctor’s group or other organization, can also play
important roles since they have their own influence in society. By closely coordinating with
those groups, GWMC can help in their environmental activities and also work as entry point to
spread the environmental message to the residents.
Agency/ Business Establishments (c)
Environmental education can be targeted for the manager/owner and staff. It can be also
carried out at each agency, business establishment or association for its prospective staffs.
Industries that general customers/consumers visit like shopping malls and banks can raise
environmental awareness of their customers/consumers.
Likewise, GWMC should raise awareness of its own staff, i.e., office staff/sanitary workers,
through appropriate environmental awareness trainings.
(3) Mass Media
There are mainly two ways to implement environmental education using mass media. One is to
have an environmental programme focusing on SWM broadcasted by TV station or radio station.
Another is to use them as a medium to spread environmental message or publicity to the public.
Structured Programme (a)
An educational programme focusing on the environment can be created or small portion of
another programme can be delicate for the environmental topic in an existing programme.
Either way, programme needs to be systematically developed and continuously broadcasted
for optimal effect. Similar to formal education in schools, the process needs careful
consideration.
Area and population covered are very large and impact is quick. Depending upon the time of
day, target population can be fairly selective. However, as in any educational activity, the
efforts must be conscious to raise and keep the awareness among recipient population.
Advert (b)
Another form of environmental education for using mass media is the advert type of PR
activities. Using electronic media like TV, radio, SNS, and SMS, various types of
environmental information can be disseminated. Billboards or advertisement space in
buildings, public transportation like bus or tuku-tuku can also effectively disseminate
environmental message to general public at large.
The message can be spread quickly and widely. Pictorials can be utilised for visually sending
out the message at ease.

Draft Final Report
Volume 1 Main Report
Project for Integrated Solid Waste Management
Master Plan in Gujranwala
184
CTI Engineering International Co., Ltd. NJS Consultants Co., Ltd.
EX Research Institute Ltd.
Advert does not have to be continuous and can be used in the specific period, like just before
the day of awareness raising campaign.
(4) Periodical Environmental Event (such as Earth Day)
Environmental education also can be carried out at the time of periodical event. Earth Day which is
held annually is a good example. Alternatively, GWMC can also establish and host some periodic
events like SWM day/week, or utilise awareness raising activities in another event.
Periodical Environmental Events (a)
In this case, target population is not necessarily limited to school students or certain group, but
also general public can raise their awareness on environment. Participants of the Earth day
event are, naturally, environmentally conscious and thus it is easier to spread the message
across.
During the event, GWMC can set up a booth to disseminate various information regarding
solid waste management, recycling, 3R, composting, and others. Also it can provide hands on
experience opportunity for the participants; for example, participants can separate wastes by
types.
GWMC can also host a certain event, like SWM week whereby various stakeholders gather
and raise awareness of the public.
Public Gatherings not related to Environment (b)
Educational opportunities are laid in other non-environmentally related events. For instance,
religious event or festivals like Eid-ul-fitr day or Eid ul-Azha day would attract unspecified
number of residents to gather in which environmental education can be carried out through the
use of printed materials like brochure/flyer distribution or let public experience actual
environmental conscious activities like separation of waste.
4.7.2 Evaluation of Alternatives for Environmental Education Plan
(1) Formal Education
Primary (a)
SWM education should be a part of a larger integrated environmental education programme
that requires in-depth consideration and coordination with relevant bodies including authority.
Important impact can be expected but requires understanding of the society for not only about
solid waste but also for other elements of environment.
Higher Education (b)
Environmental programmes have already existed in selected colleges/universities. Students
have learnt the subject in-depth, but the number of residents who enrolled in the programme is,
inevitably, very limited.
(2) Informal Education
Schools (a)
If the awareness of small children is successfully raised in primary schools, the impact can
spread to his/her households and be fruitful on the long-term since those children would lead
the society in the future and thus influence the entire community.

Project for Integrated Solid Waste Management
Master Plan in Gujranwala
Draft Final Report
Volume 1 Main Report
CTI Engineering International Co., Ltd. NJS Consultants Co., Ltd.
EX Research Institute Ltd.
185
It is also easier for GWMC to introduce environmental education on SWM to small children
than going through formal education since GWMC can entirely host the programme.
Social Groups (b)
Various community groups exist in Gujranwala from town level to union council level. They
are, in general, rooted on the local community and thus hold important impacts on their
community members. There are a numerous number of such groups and interest in
environmental issues also varies. Those social groups may be good entry point to community.
Agency/Business Establishments (c)
Governmental agency should play a leading role in proper solid waste management in
Gujranwala. Consensus must be reached within all governmental bodies.
Business establishment can also influence the SWM activities in the city, but types, volume,
and frequency of waste differs greatly depending upon the business type.
(3) Environmental Education using Mass Media
Structured Programme (a)
Creating a structured programme for environmental education in mass media can expect
immediate and huge impacts to population across the city. Nonetheless, the cost is extremely
high and the impact may well be eroded away as quickly as it reaches the population. There is
a need to come up continuously with such huge cost in order to sustain a realistic and proper
environmental education.
Advert (b)
Advert type of mass media can be very useful in spreading messages quickly and widely. It
should be used for publicity purpose only and not for continuous awareness raising media.
(4) Periodical Environmental Event (such as Earth Day)
Periodical Environmental Events & Public Gatherings not related to (a)
Environment
Periodical environmental events can reach a wide range of population at one time. By
consciously holding the same event or campaign, the message would be imbedded to the
residents. Table 4.7.1 gives a summary of the alternatives.

Draft Final Report
Volume 1 Main Report
Project for Integrated Solid Waste Management
Master Plan in Gujranwala
186
CTI Engineering International Co., Ltd. NJS Consultants Co., Ltd.
EX Research Institute Ltd.
Table 4.7.1 Comparison of Alternatives of Environmental Education and
Public Awareness Raising Activities
Options Target Recipient Number Impact Remarks
1) Formal a) Primary Small kids Limited, but covers all students
Long-term Influence in household as well
b) Higher education
Young adults Limited Long-term Specialists
2) Informal a) School Small kids Limited, but covers good portion of students
Long-term Influence in household as well
b) Social All member of society
Large Long-term Requires understanding from all parties
c) Agency / business
Staff/ employees Limited to specific body
Short-long term
3) Mass media a) Structured General public Large Quick Expensive
b) Advert General public Large Quick Affordable if limited duration
4) Periodical event
a) Periodical General public Large Short-long term Participants are environmentally conscious
b) Public gatherings
General public large Short – long term Can reach non- environmentally conscious people
(5) Conclusion
Each option has its own unique characteristics. A summary of each option is as follows:
Formal education is a solid way but requires extensive consideration and coordination with all
parties involved.
Informal education, on the other hand, can be carried out relatively easily since GWMC can
control the content and activities on its own.
Mass media have huge impact but requires large amount of fund to be effective in long term;
therefore, it should be limited to advert type of utilisation.
Periodical event, like Earth Day, can be an excellent opportunity to reach general population.
4.7.3 Identification of Project Components for Environmental Education and Public
Awareness Raising Plan
In identifying the project components for environmental education and public awareness raising,
a) target, b) impact, and how easily the activities can be carried out by GWMC were considered. Ideally
an activity can reach all population in the city with long lasting impact at minimum cost. This is
important because this activity is a type of component that cannot expect immediate effect or sudden
change in people’s behaviour.
Therefore, there are mainly two projects to proceed; specifically, one is informal education in schools
targeting primary students, and the other is periodical events targeting general population. Following is
the approximate schedule for each activity.
(1) Informal Education in Schools
There are approximately 161,000 students in 273 public and 437 private schools in Gujranwala.
Among them, class 4 students are approximately 21,000. (Class 4 is picked since it consists of
about 10 years old children who are old enough to understand the importance of environmental
education and to think how to digest the knowledge and information received and put them into

Project for Integrated Solid Waste Management
Master Plan in Gujranwala
Draft Final Report
Volume 1 Main Report
CTI Engineering International Co., Ltd. NJS Consultants Co., Ltd.
EX Research Institute Ltd.
187
practice.) In order to cover all class 4 students in the city by the end of 2030, the following targets
were set.
Table 4.7.2 Target of Students Covered by Informal Education in Schools by Terms
Short-Term (~ 2018)
Mid-Term (~2024)
Long-Term (~2030)
Target Approx. 15% Approx. 60% 100%
Number of Students 3,000 12,000 21,300
Components of Informal Education Programmes (a)
In informal education in schools, there are two approaches GWMC can take to reach the
students. One of them is to deliver the programme to the schools, and the other one is to
receive students at appropriate facility to teach and let them experience in practice.
In the short term (2016–2018), informal education should be focused on delivery of lectures in
each school in order to build bases for understanding the importance of proper waste
management. In the delivery programme, a team of GWMC communication unit can visit each
school and hold a session targeting class 4 students of that school. Topic would include
a) general information about solid waste, b) current status of SWM in the city, c) what can be
done and their effects, and d) other related topics.
In the environmental facility side which can be implemented in mid-term plan, GWMC can
establish a facility to accept visitors from schools. The facility can be first set up within the
city where schools can easily access but later on can be set up in landfill site where student can
observe the actual condition of SWM.
In order to realise the above, the following components are necessary:
Establishment of communication unit
Establishment of SWM environmental education facility
Development of materials for trainers (teachers) and for students
Develop and implement Pilot Project for environmental education at schools
(i) Establishment of Communication Unit
Volume of work is expected to be carried out by the communication team; therefore, a
number of new staff should be newly recruited in addition to the current manager and
assistant manager of communication. Main responsibility of the communication unit
include, a) coordination among relative bodies, b) preparation of training materials for
trainers/ trainees, c) lecture to the students, and d) management of environment facility.
A team of five (5) members with two (2) drivers can start the programme in the short-term
period, and gradually increasing these members as target students grow. Table 4.7.3 shows
a summary of number of students and communication team members in the school
programme.
Table 4.7.3 Relationship between Number of Visiting Schools and Communication Members (Year 2016-2030)
Term/Year Short-Term Mid-Term Long-Term
2016 2017 2018 2019 2020 2021 2022 2023 2024 2025 2026 2027 2028 2029 2030
Number of Schools 70 80 100 100 200 200 300 300 400 400 500 500 600 600 710
Number of Students 2,100 2,400 3,000 3,000 6,000 6,000 9,000 9,000 12,000 12,000 15,000 15,000 18,000 18,000 21,300
Staff (No.) 7 7 7 7 7 8 21 21 21 21 22 22 28 28 28

Draft Final Report
Volume 1 Main Report
Project for Integrated Solid Waste Management
Master Plan in Gujranwala
188
CTI Engineering International Co., Ltd. NJS Consultants Co., Ltd.
EX Research Institute Ltd.
(ii) Establishment of Environmental Facility
In Gujranwala, schools commonly organize field trips for either recreational or orientations
purpose and visit historical monuments or museums. During this field trip, students can
visit the environmental education facility to learn about solid waste management, through
displays, materials, observation, or hands-on experience. Examples of these contents
would include: a) a display showing waste flows in Gujranwala, b) actual waste and
recyclable materials and how they are treated, and c) experience in separating recyclables
through games.
The communication team needs to come up with those display or materials interesting
enough for students.
Number of schools (students) that visit and GWMC staff who manage the facility can be
shared with: i) the above, meaning some schools targeted for the delivery programme can
actually visit the environmental facility and one of the five (5) communication team
members can manage this facility.
The facility does not have to limit its usage to school students but also open to the general
public. This would help PR the GWMC’s work to the public. This environmental facility
can be established in mid-term, or in 2021, of the Master Plan to support the informal
education program in schools as well as general public. Before opening up this facility, a)
careful design, b) developing materials and guidelines similar to school program, and c)
operation/coordination plan should be prepared.
(iii) Development of Materials for Lecturer (GWMC Staff)
In order to facilitate the above components, GWMC has to develop the following:
A detailed action plan to implement the activities;
Materials to be used in the programme; and
Guidelines (or lecture syllabus) to be used in a) coordinating with other entities and b)
lecturing in school and environment facility.
Materials should be carefully developed to not only disseminate information about SWM
in Gujranwala but also to help the recipient think about how waste is related to his life. For
instance, the manner to separate recyclables from the waste stream in a household is good
information itself, but can be much more meaningful if the method on which recycling
could help conserve the environment or what would be the impact if thrown away into the
environment were known.
The materials need to be developed by GWMC in the first period or within the short-term
period (2016-2018), but needs to be regularly updated.
(iv) Pilot Project for Schools
In order to use the informal education in schools and use the material/plan developed in
(i) to (iii) above, GWMC should start targeting certain areas and implement the programme
as a pilot project.
The programme should target a certain town in the action plan and then gradually widen the
target area. In this way, it will be easier to manage the programme and impacts may be
more visible than targeting the entire city from the beginning.
In order to realise these activities, communication team needs to come up with proper
materials, syllabus or training material for GWMC’s trainers, coordination mechanisms, as
well as means of transportation.
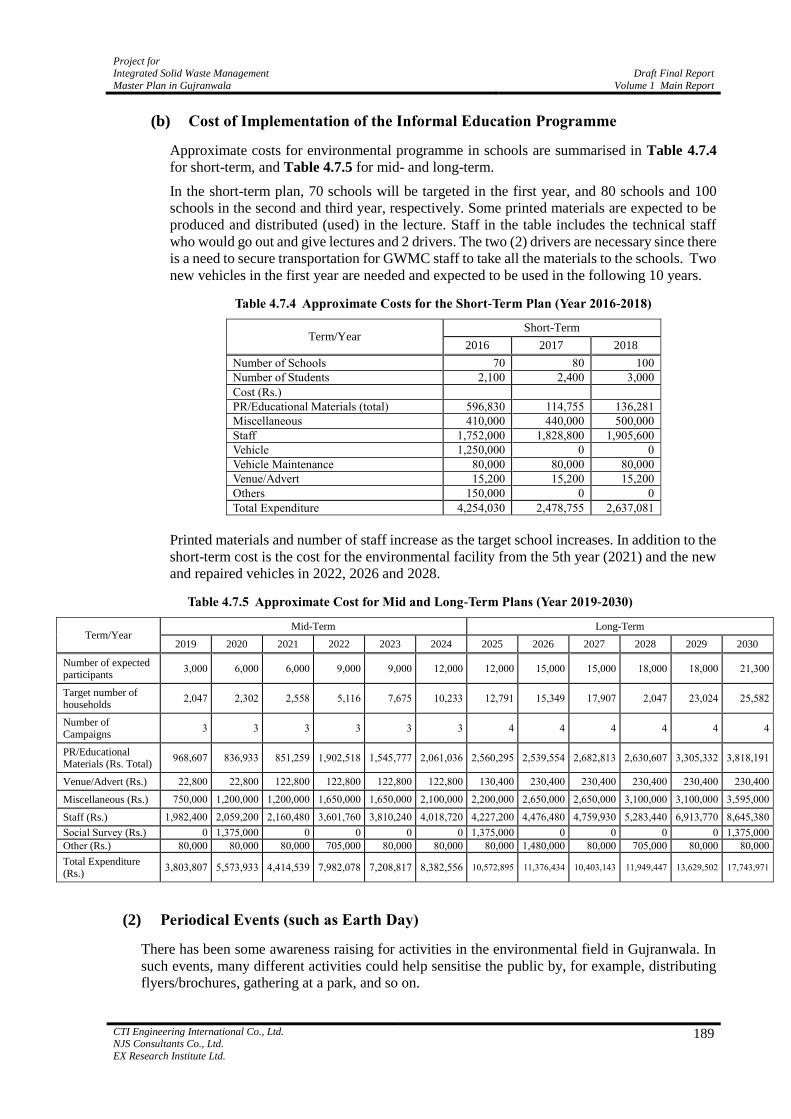
Project for Integrated Solid Waste Management
Master Plan in Gujranwala
Draft Final Report
Volume 1 Main Report
CTI Engineering International Co., Ltd. NJS Consultants Co., Ltd.
EX Research Institute Ltd.
189
Cost of Implementation of the Informal Education Programme (b)
Approximate costs for environmental programme in schools are summarised in Table 4.7.4
for short-term, and Table 4.7.5 for mid- and long-term.
In the short-term plan, 70 schools will be targeted in the first year, and 80 schools and 100
schools in the second and third year, respectively. Some printed materials are expected to be
produced and distributed (used) in the lecture. Staff in the table includes the technical staff
who would go out and give lectures and 2 drivers. The two (2) drivers are necessary since there
is a need to secure transportation for GWMC staff to take all the materials to the schools. Two
new vehicles in the first year are needed and expected to be used in the following 10 years.
Table 4.7.4 Approximate Costs for the Short-Term Plan (Year 2016-2018)
Term/Year Short-Term
2016 2017 2018
Number of Schools 70 80 100
Number of Students 2,100 2,400 3,000
Cost (Rs.)
PR/Educational Materials (total) 596,830 114,755 136,281
Miscellaneous 410,000 440,000 500,000
Staff 1,752,000 1,828,800 1,905,600
Vehicle 1,250,000 0 0
Vehicle Maintenance 80,000 80,000 80,000
Venue/Advert 15,200 15,200 15,200
Others 150,000 0 0
Total Expenditure 4,254,030 2,478,755 2,637,081
Printed materials and number of staff increase as the target school increases. In addition to the
short-term cost is the cost for the environmental facility from the 5th year (2021) and the new
and repaired vehicles in 2022, 2026 and 2028.
Table 4.7.5 Approximate Cost for Mid and Long-Term Plans (Year 2019-2030)
Term/Year Mid-Term Long-Term
2019 2020 2021 2022 2023 2024 2025 2026 2027 2028 2029 2030
Number of expected participants
3,000 6,000 6,000 9,000 9,000 12,000 12,000 15,000 15,000 18,000 18,000 21,300
Target number of households
2,047 2,302 2,558 5,116 7,675 10,233 12,791 15,349 17,907 2,047 23,024 25,582
Number of Campaigns
3 3 3 3 3 3 4 4 4 4 4 4
PR/Educational Materials (Rs. Total)
968,607 836,933 851,259 1,902,518 1,545,777 2,061,036 2,560,295 2,539,554 2,682,813 2,630,607 3,305,332 3,818,191
Venue/Advert (Rs.) 22,800 22,800 122,800 122,800 122,800 122,800 130,400 230,400 230,400 230,400 230,400 230,400
Miscellaneous (Rs.) 750,000 1,200,000 1,200,000 1,650,000 1,650,000 2,100,000 2,200,000 2,650,000 2,650,000 3,100,000 3,100,000 3,595,000
Staff (Rs.) 1,982,400 2,059,200 2,160,480 3,601,760 3,810,240 4,018,720 4,227,200 4,476,480 4,759,930 5,283,440 6,913,770 8,645,380
Social Survey (Rs.) 0 1,375,000 0 0 0 0 1,375,000 0 0 0 0 1,375,000
Other (Rs.) 80,000 80,000 80,000 705,000 80,000 80,000 80,000 1,480,000 80,000 705,000 80,000 80,000
Total Expenditure (Rs.)
3,803,807 5,573,933 4,414,539 7,982,078 7,208,817 8,382,556 10,572,895 11,376,434 10,403,143 11,949,447 13,629,502 17,743,971
(2) Periodical Events (such as Earth Day)
There has been some awareness raising for activities in the environmental field in Gujranwala. In
such events, many different activities could help sensitise the public by, for example, distributing
flyers/brochures, gathering at a park, and so on.

Draft Final Report
Volume 1 Main Report
Project for Integrated Solid Waste Management
Master Plan in Gujranwala
190
CTI Engineering International Co., Ltd. NJS Consultants Co., Ltd.
EX Research Institute Ltd.
In addition, GWMC can carry out SWM day (or week) at certain times of the day, just like the
awareness raising activity carried out in May 2014. This type of activity can target a large number
of the general public and by periodically and repeatedly sending out the same message again and
again until they become well aware of the consequences of unattended waste.
Components of the Event (a)
In periodical events, both in environmental events such as Earth day and non-environmental
day such as Eid-ul-Fitr day or SWM day, GWMC can approach the general public in various
ways. Components of this plan could be the following:
Development of coordination plan for relevant bodies.
Development of materials.
Development of activity plan for periodic event.
(i) Development of Coordination Plan for Relevant Bodies
Earth day events involve many people; therefore, close coordination is necessary to
successfully disseminate GWMC’s message to the public. This would include not only the
organizer of the event per se, but also the various media since this event is one of the key to
let the public know the involvement of GWMC.
(ii) Development of Materials
The Communication Unit has to develop materials to be used during the periodical event.
Topics should be similar to those of informal education in schools, aside from the
information on how GWMC is working on solid waste management in the city.
(iii) Development of Activity Plan for Periodic Event
Activity plans include the planning stage up to actual content, evaluation, and review. The
planning stage includes procedure and to whom the communication unit has to coordinate,
while actual contents may include what and how to distribute the printed materials and how
to attract the general public to participate in the GWMC work. The topic may be a) the current SWM condition in the city, b) GWMC’s progress in SWM, and c) how to separate
or practical advice for waste management.
Cost of Implementation of the Event (b)
Approximate cost for short term periodical events is shown in Table 4.7.6. This cost includes
the printing of materials for distribution to the participants. Venue/advert is the cost for the
specific venues if needed and advert cost for the event. This advert is assumed to be held for
some electronic media like radio, SNS (Social Networking Service), and SMS (Short Message
Service), as well as posters and advertisement space in public transportation. Any additional
cost, such as cost involved in setting up a tent, if needed, should be covered by
“miscellaneous” cost.
Table 4.7.6 Approximate Cost for Short-Term Periodical Events (2016–2018)
Short-Term
2016 2017 2018
Printing of Materials (Rs.) 71,630 85,955 100,281
Venue/Advert (Rs.) 15,200 15,200 15,200
Miscellaneous (Rs.) 200,000 200,000 200,000
Total Expenditure (Rs.) 286,830 301,155 315,481

Project for Integrated Solid Waste Management
Master Plan in Gujranwala
Draft Final Report
Volume 1 Main Report
CTI Engineering International Co., Ltd. NJS Consultants Co., Ltd.
EX Research Institute Ltd.
191
Approximate cost for the mid- and long-term plan is shown in Table 4.7.7. Number of
expected participants and target households were derived from the current estimated number
of households in Gujranwala, which is 255,819. In this calculation, 10% of households are
expected to be a part of this effort by the end of the long-term plan (the year 2030).
Table 4.7.7 Approximate Cost for Periodical Events in the Mid and Long-Term Plan (2019–2030)
Term/Year Mid-Term Long-Term
2019 2020 2021 2022 2023 2024 2025 2026 2027 2028 2029 2030
Target number of households
2,047 2,302 2,558 5,116 7,675 10,233 12,791 15,349 17,907 2,047 23,024 25,582
Number of Campaigns 3 3 3 3 3 3 4 4 4 4 4 4
Printing of Materials (Rs. Total)
114,607 128,933 143,259 286,518 429,777 573,036 716,295 859,554 1,002,813 114,607 1,289,332 1,432,591
Venue/Advert (Rs.) 22,800 22,800 22,800 22,800 22,800 22,800 30,400 30,400 30,400 30,400 30,400 30,400
Miscellaneous (Rs.) 300,000 300,000 300,000 300,000 300,000 300,000 400,000 400,000 400,000 400,000 400,000 400,000
Staff (Rs.) 0 0 0 140,000 151,200 162,400 173,600 184,800 199,570 214,340 229,110 243,880
Total Expenditure (Rs.)
437,407 451,733 466,059 749,318 903,777 1,058,236 1,320,295 1,474,754 1,632,783 759,347 1,948,842 2,106,871
(3) Total Project Cost for Implementation of Environmental Education and Public
Awareness Raising Plan
Based on the above, the total project cost of Environmental Education and Public Awareness
Raising Plan between 2016 and 2030 is estimated at approximately Rs. 65 million and summarised
as shown in Table 4.7.8.
Table 4.7.8 Project Cost for Implementation of Environmental Education
and Public Awareness Raising Plan
Unit: thousand Rs.
Term/Year Short-Term Mid-Term Long-Term
Total 2016 2017 2018 2019 2020 2021 2022 2023 2024 2025 2026 2027 2028 2029 2030
Informal Education 3,967 2,178 2,322 3,366 3,747 3,948 7,233 6,305 7,324 7,878 9,902 8,770 11,190 11,681 14,262 104,073
Periodical Events 287 301 315 437 452 466 749 904 1,058 1,320 1,475 1,633 759 1,949 2,107 14,213
Social Survey 0 0 0 0 1,375 0 0 0 0 1,375 0 0 0 0 1,375 4,125
Total 4,254 2,479 2,637 3,804 5,574 4,415 7,982 7,209 8,383 10,573 11,376 10,403 11,949 13,630 17,744 122,411
Note: Totals may not always be equal to the sum of the subjected column or row due to rounding off.
4.7.1 Implementation Schedule of Environmental Education and Public Awareness
Raising Plan
The implementation schedule of the Environmental Education and Public Awareness Raising Plan is
illustrated in Figure 4.7.1.

Draft Final Report
Volume 1 Main Report
Project for Integrated Solid Waste Management
Master Plan in Gujranwala
192
CTI Engineering International Co., Ltd. NJS Consultants Co., Ltd.
EX Research Institute Ltd.
Figure 4.7.1 Implementation Schedule of Environmental Education and Public Awareness Raising Plan
4.7.2 Project Cost of Environmental Education and Public Awareness Raising Plan
Table 4.7.9 shows the project cost for the Master Plan. The total cost of the Environmental Education
and Public Awareness Raising Plan is Rs. 122 million.
Table 4.7.9 Total Cost of the Environmental Education and Public Awareness Raising Plan
2019 2020 2021 2022 2023 2024 2025 2026 2027 2028 2029 2030
Q1 Q2 Q3 Q4 Q1 Q2 Q3 Q4 Q1 Q2 Q3 Q4
WBS for Short-Term Plan
S-4-1
Capacity Development of Communication Unit to Strengthen the
Coordination among Relevant Bodies
S-4-2
Development and Implementation of Educational Programmes Targeting
Primary School Teachers and Students
S-4-3
Development and Implementation of Educational Programmes Targeting
General Public
M-4-1
Capacity Development of Communication Unit to Strengthen the
Coordination among Relevant Bodies
M-4-2
Development and Implementation of Educational Programmes Targeting
Primary School Teachers and Students
M-4-3
Development and Implementation of Educational Programmes Targeting
General Public
M-4-4 Development and Implementation of Monitoring Plan
M-4-5 Development of Environmental Education Facility and its Utilisation Plan
L-4-1
Capacity Development of Communication Unit to Strengthen the
Coordination among Relevant Bodies
L-4-2
Development and Implementation of Educational Programmes Targeting
Primary School Teachers and Students
L-4-3
Development and Implementation of Educational Programmes Targeting
General Public
L-4-4 Development and Implementation of Monitoring Plan
L-4-5 Managment of Environmental Education Facility and its Utilisation
Quarter
WBS for Mid-Term Plan
WBA for Long-Term Plan
Year 2016 2017 2018
2016 2017 2018 2019 2020 2021 2022 2023 2024 2025 2026 2027 2028 2029 2030
S-4-1
Capacity Development of Communication Unit to Strengthen the
Coordination among Relevant Bodies
6,736 3,002 1,829 1,906
S-4-2
Development and Implementation of Educational Programmes
Targeting Primary School Teachers and Students
1,730 965 349 416
S-4-3
Development and Implementation of Educational Programmes
Targeting General Public
903 287 301 315
Sub-Total 9,370 4,254 2,479 2,637
M-4-1
Capacity Development of Communication Unit to Strengthen the
Coordination among Relevant Bodies
18,738 2,062 2,139 2,240 4,307 3,890 4,099
M-4-2
Development and Implementation of Educational Programmes
Targeting Primary School Teachers and Students
13,240 1,304 1,608 1,608 2,966 2,466 3,288
M-4-3
Development and Implementation of Educational Programmes
Targeting General Public
3,613 437 452 466 609 753 896
M-4-4 Development and Implementation of Monitoring Plan 1,375 0 1,375 0 0 0 0
M-4-5
Development of Environmental Education Facility and its Utilisation
Plan
400 0 0 100 100 100 100
Sub-Total 37,366 3,804 5,574 4,415 7,982 7,209 8,383
L-4-1
Capacity Development of Communication Unit to Strengthen the
Coordination among Relevant Bodies
36,661 4,307 5,806 4,840 5,988 6,994 8,725
L-4-2
Development and Implementation of Educational Programmes
Targeting Primary School Teachers and Students
27,167 3,644 4,080 3,930 5,216 4,716 5,581
L-4-3
Development and Implementation of Educational Programmes
Targeting General Public
7,998 1,147 1,290 1,433 545 1,720 1,863
L-4-4 Development and Implementation of Monitoring Plan 2,750 1,375 0 0 0 0 1,375
L-4-5 Managment of Environmental Education Facility and its Utilisation 1,100 100 200 200 200 200 200
Sub-Total 75,675 10,573 11,376 10,403 11,949 13,630 17,744
Grand Total 122,410 4,254 2,479 2,637 3,804 5,574 4,415 7,982 7,209 8,383 10,573 11,376 10,403 11,949 13,630 17,744
WBS
No.
WBSTotal Budget
(Thousand Rs.)
Long-Term Plan
Annual Cost
Programme 4: Environmental Education and Public Awarenss Raising
Plan
Short-Term Plan
Mid-Term Plan

Project for Integrated Solid Waste Management
Master Plan in Gujranwala
Draft Final Report
Volume 1 Main Report
CTI Engineering International Co., Ltd. NJS Consultants Co., Ltd.
EX Research Institute Ltd.
193
4.8 Economic and Financial Plan
4.8.1 Development of Alternatives for Economic and Financial Plan
(1) Alternative Options for Cost Recovery
Basic Principles for Cost Recovery (a)
The optimum cost recovery can be attained by promoting GWMC’s rational uses of financial
resources, thereby efficiently providing better SWM services. In order to achieve this
objective, the following basic principles for the cost recovery should be satisfied.
The tariffs for SWM services should cover at least the operating cost, desirably the
depreciation for replacement cost of existing facilities and part of the debt service
obligations for the future investment cost. The tariff should be accurately calculated by
making use of the latest financial data and information available.
For optimum cost recovery, the tariff level should send clear signals to waste generators
as well as GWMC, thereby efficiently providing SWM services. Users shall adjust their
waste generation amount to the tariff level. At the same time, the cost recovery level
should be periodically readjusted to reflect the real cost of SWM services.
The demand side such as users’ affordability and willingness to pay for SWM services
should be properly taken into account, when the cost recovery level is projected based on
the proper tariff system.
Alternative Options for Cost Recovery (b)
The major components to estimate costs for SWM services by which the cost recovery will be
studied are as shown below.
Operating costs, often called operating and maintenance expenditures, are costs of regular
operation of services and performing routine maintenance of the related assets. The
overhead and administrative expenses are also included.
Replacement costs are often expressed as the depreciations of the capital replacement of
existing facilities.
Capital investment costs include costs of land, building facilities and procurement of
equipment required for SWM services.
Based on the scope of costs mentioned above, the alternative options for the cost recovery
include 3-step scenarios as below.
1st Step: Operating costs, often called operating and maintenance expenditures, will be
covered by the total revenue.
2nd
Step: Operating costs plus replacement costs often expressed as the depreciation of
the capital replacement of existing facilities will be covered by the total revenue.
3rd
Step: Operating costs plus the depreciations of the capital replacement of existing
facilities and part of new capital investment costs will be covered by the total revenue.
(2) Alternative Options for Costing Methods
In order to provide the cost recovery analysis based on the accurately estimated costs for SWM
services, the following costing methods are regarded as the alternative options.

Draft Final Report
Volume 1 Main Report
Project for Integrated Solid Waste Management
Master Plan in Gujranwala
194
CTI Engineering International Co., Ltd. NJS Consultants Co., Ltd.
EX Research Institute Ltd.
Average Cost Approach (a)
The average cost is simply calculated from the sum of the required operation and maintenance
cost, replacement cost and investment cost for the entire period of the master plan. The
average cost reflects the total planned investment cost and the replacement cost in addition to
the total planned operation and maintenance cost of each project year in the entire period of the
master plan.
Marginal Cost Approach (b)
The marginal cost is the increase in total cost as a result of providing one more unit of SWM
services. Since certain overhead costs are fixed, the marginal cost is almost always less than
the total per-unit cost of providing SWM services averaged over the same services provided.
The marginal cost achieves two goals: the efficient use of financial resources when operating
at less than the full capacity and providing the signal to invest on the additional capacity of
facilities.
In SWM services, the marginal cost pricing is problematic because of the relatively high
start-up investment cost in comparison with the relatively low operation and maintenance cost.
Significant fluctuations of the tariff would occur based on purely marginal cost calculations.
Therefore, the marginal cost can be applied only to the phase in which the investment cost is
borne as the project cost.
(3) Alternative Options for Tariff Charging System
Basic Principles for Tariff Charging System (a)
A tariff charging system for SWM services has several objectives: cost recovery, financial
sustainability, efficient allocation of scarce resources and income distribution. It is unlikely
that all these objectives can be met, so even the most carefully designed tariff will require
trade-offs.
The principle underlying the imposition of direct user charges for SWM services is that the
cost of the services should be recovered from users. A well-designed tariff structure is a major
part of ensuring an efficient SWM services. Advantages and disadvantages of each tariff
charging option should be streamlined for the selection of the optimum option.
Alternative tariff charging mechanisms for providing SWM services affect the efficiency,
equity and sustainability. The following principles should be adopted in shaping the design of
the user charging system for SWM services. The details of each principle are explained in
Volume 2, Supporting Report, Section F: Economic and Financial Aspect, Subsection
4.1.3, Item (1).
Efficient allocation of resources
Efficient supply of services
Cost recovery
Financial viability
Horizontal equity
Vertical equity and poverty alleviation
Administrative and technical feasibility
Polluter pays
Avoiding illegal dumping
Proportionality
Transparency
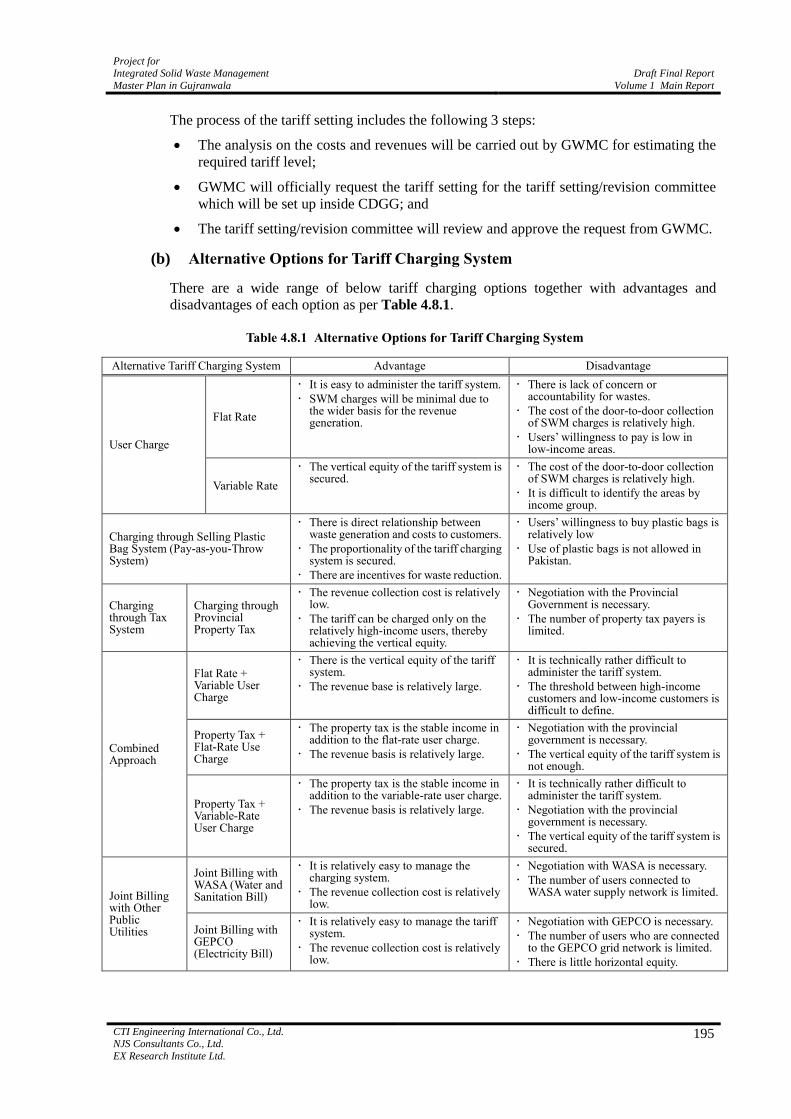
Project for Integrated Solid Waste Management
Master Plan in Gujranwala
Draft Final Report
Volume 1 Main Report
CTI Engineering International Co., Ltd. NJS Consultants Co., Ltd.
EX Research Institute Ltd.
195
The process of the tariff setting includes the following 3 steps:
The analysis on the costs and revenues will be carried out by GWMC for estimating the
required tariff level;
GWMC will officially request the tariff setting for the tariff setting/revision committee
which will be set up inside CDGG; and
The tariff setting/revision committee will review and approve the request from GWMC.
Alternative Options for Tariff Charging System (b)
There are a wide range of below tariff charging options together with advantages and
disadvantages of each option as per Table 4.8.1.
Table 4.8.1 Alternative Options for Tariff Charging System
Alternative Tariff Charging System Advantage Disadvantage
User Charge
Flat Rate
It is easy to administer the tariff system.
SWM charges will be minimal due to the wider basis for the revenue generation.
There is lack of concern or accountability for wastes.
The cost of the door-to-door collection of SWM charges is relatively high.
Users’ willingness to pay is low in low-income areas.
Variable Rate
The vertical equity of the tariff system is secured.
The cost of the door-to-door collection of SWM charges is relatively high.
It is difficult to identify the areas by income group.
Charging through Selling Plastic Bag System (Pay-as-you-Throw System)
There is direct relationship between waste generation and costs to customers.
The proportionality of the tariff charging system is secured.
There are incentives for waste reduction.
Users’ willingness to buy plastic bags is relatively low
Use of plastic bags is not allowed in Pakistan.
Charging through Tax System
Charging through Provincial Property Tax
The revenue collection cost is relatively low.
The tariff can be charged only on the relatively high-income users, thereby achieving the vertical equity.
Negotiation with the Provincial Government is necessary.
The number of property tax payers is limited.
Combined Approach
Flat Rate + Variable User Charge
There is the vertical equity of the tariff system.
The revenue base is relatively large.
It is technically rather difficult to administer the tariff system.
The threshold between high-income customers and low-income customers is difficult to define.
Property Tax + Flat-Rate Use Charge
The property tax is the stable income in addition to the flat-rate user charge.
The revenue basis is relatively large.
Negotiation with the provincial government is necessary.
The vertical equity of the tariff system is not enough.
Property Tax + Variable-Rate User Charge
The property tax is the stable income in addition to the variable-rate user charge.
The revenue basis is relatively large.
It is technically rather difficult to administer the tariff system.
Negotiation with the provincial government is necessary.
The vertical equity of the tariff system is secured.
Joint Billing with Other Public Utilities
Joint Billing with WASA (Water and Sanitation Bill)
It is relatively easy to manage the charging system.
The revenue collection cost is relatively low.
Negotiation with WASA is necessary.
The number of users connected to WASA water supply network is limited.
Joint Billing with GEPCO (Electricity Bill)
It is relatively easy to manage the tariff system.
The revenue collection cost is relatively low.
Negotiation with GEPCO is necessary.
The number of users who are connected to the GEPCO grid network is limited.
There is little horizontal equity.

Draft Final Report
Volume 1 Main Report
Project for Integrated Solid Waste Management
Master Plan in Gujranwala
196
CTI Engineering International Co., Ltd. NJS Consultants Co., Ltd.
EX Research Institute Ltd.
Alternative Options for Tariff Revision Mechanism (c)
In addition to the tariff setting mechanism, the alternative options for the tariff revision
mechanism should be also assumed. There are mainly three (3) options for regulating the
overall tariff level: rate of return regulation, yardstick regulation and price cap regulation. The
detailed discussion is made in Volume 2, Supporting Report, Section F: Economic and
Financial Aspect, Subsection 4.1.3, Item (3).
(i) Rate of Return Regulation
Rate of return regulation adjusts overall tariff levels to the operator’s total accounting costs
and cost of capital. The regulator reviews a service provider’s overall tariff level in
response to a claim that the expected rate of return is less than its cost of capital. The
detailed discussion is made
(ii) Yardstick Regulation
Yardstick regulation is a regulation method that a SWM service operator’s (GWMC’s in
this case) performance is compared to other operators’ performance such as SWM service
operators in other cities of Punjab Province (LWMC, etc.) and other public utility operators
like the water/sewerage sector and the power sector.
(iii) Price Cap Regulation
It has been widely used as a regulatory rule for limiting abuse of market power by a
dominant supplier of public utility services after a service provider’s obtaining sufficient
operating profits. Eventually, the price cap regulation would give a service operator more
incentives to achieve and improve productive efficiency. Unlike the rate-of-return
regulation, the price cap regulation does not require frequent arbitrary measures of a rate of
return on capital.
(4) Alternative Options of Financial Arrangement for Private Sector Involvement
Basic Principles for Private Sector Involvement (a)
During the long-term period from 2025 to 2030, the private sector involvement will be started
for the collection and transport services. The financial arrangement of each private sector
involvement option is evaluated in terms of the economic efficiency and profitability under the
following principles.
The major economic reason for involving the private sector in SWM services is the
enhancement of the efficiency of operations through competition. Private sector
involvement through a competitive bidding can improve the efficiency of SWM services.
By using the private sector’s cost-saving expertise, outsourcing to the private sector will
significantly reduce the financial burden on a public service provider.
The involvement of the private sector can also enlarge the access to capital or financial
resources for procurement of collection vehicles as well as human capital for expertise
and skills. The degree of the accessibility to those financial and human capitals by the
public sector is one of the important motivations for the private sector involvement.
Alternative Options for Private Sector Involvement in terms of Financial (b)
Arrangement
Licensing: Licensing or private subscription allows qualified private service providers
licensed by an authority to compete for the delivery of SWM solid services in a specific
zone. Under this arrangement, waste generators make contracts with individual private

Project for Integrated Solid Waste Management
Master Plan in Gujranwala
Draft Final Report
Volume 1 Main Report
CTI Engineering International Co., Ltd. NJS Consultants Co., Ltd.
EX Research Institute Ltd.
197
service providers.
Service Contract: Service contract is a finite-term contract to a private service provider to
render SWM services, and an authority pays the private service provider for charges in
response to the services to be delivered. Part of SWM services such as collection and
transportation of wastes and management of a sanitary landfill site can be contracted out
to a private operator for a certain period.
Management Contract: Management contract is a contract entrusting specific solid
SWM services under private management for a certain period of time, for which a
management fee is paid to the management contractor.
Lease Contract: Lease contract grants a private operator full control over delivering
specific SWM services in exchange for use of the fixed assets whose ownership and
responsibilities belong to the authority.
Concession: Concession is a long-term contractual arrangement in which a private
operator is awarded an official license to provide specific SWM services over a longer
period of time in exchange for a negotiated fee.
4.8.2 Evaluation of the Alternatives
(1) Alternative Options for Cost Recovery
By applying both of the revenue increase efforts and cost reduction efforts, the alternative options
for the cost recovery through the following steps are selected:
To apply the revenue increase efforts, thereby shifting the revenue line upward.
To apply the cost reduction efforts, thereby shifting the operating cost line downward.
To shift the break-even point leftward, thereby shortening the overall cost recovery years.
To identify the optimum cost recovery level under the new break-even point.
Based on the above assumptions, out of 3 alternative options for the cost recovery, the first option
to cover the operation and maintenance cost is realistic and optimum option for the cost recovery
for the evaluation in the master plan.
(2) Alternative Options for Costing Methods
The costing method to be employed for the cost recovery is different in response to each phase of
the cost recovery.
The costing method required for the phase where the cost recovery is only achieved to cover the
operation and maintenance cost is the average cost method. On the other hand, the marginal cost
includes the depreciation of assets. The cost of long-term investments in capital assets must be
included in the cost-recovery applications.
Since the master plan is regarded as the first step/phase which only seeks for covering part of the
operation and maintenance cost, the average costing method is employed for the appropriate option
as the costing method. A key difference between the average cost and the marginal cost is that the
former is concerned with the revenues needed to ensure the financial viability while the latter is
concerned with relaying the appropriate price signals to consumers. The tariff level must be high
enough to cover the average cost over the entire period of the master plan. Table 4.8.2 shows
alternative options for costing methods.

Draft Final Report
Volume 1 Main Report
Project for Integrated Solid Waste Management
Master Plan in Gujranwala
198
CTI Engineering International Co., Ltd. NJS Consultants Co., Ltd.
EX Research Institute Ltd.
Table 4.8.2 Alternative Options for Costing Methods
Phase of Cost Recovery
1st Step 2nd Step 3rd Step
Cost Recovery Operation and
Maintenance Cost
Operation and Maintenance Cost + Capital Charge on
Replacement Cost
Operation and Maintenance Cost + Capital Charge on
Replacement Cost + Part of New Investment
Cost
Average Costing Pricing Method
Yes No No
Marginal Cost Pricing Method
No Yes Yes
(3) Alternative Options for Tariff Charging System
Tariff Charging System (a)
Out of the alternative options for the tariff charging system listed in Table 4.8.1, the
combination of the provincial property tax as the baseline stable revenue and the variable user
charge system as the additional revenue from high-income households is recommended as the
optimum alternative option due to the following reasons.
The variable-rate user charge can secure the vertical equity, since the majority of the
households in Gujranwala are low-income households, and the flat-rate user charge does
not secure the vertical equity.
The affordability to pay for the high-income areas are more than their willingness to pay,
and, therefore, the revenues through the property tax can be generated from high-income
households.
The revenue collection cost is relatively low for the provincial property tax, and the
baseline income can be stable.
The negotiation with the provincial government is much easier, compared with the
negotiation with WASA and GEPCO, since they are more profit-oriented, and, therefore,
they are much reluctant to add the SWM bill to their own bills.
In addition to the optimum option for the tariff charging system, the following arrangements
for the introduction of the system are also recommended.
Three-year preparation period (2019-2021) in the high-income and middle-income areas
in the latter half of the mid-term period of the master plan should be assumed to secure the
period for raising users’ willingness to pay.
Three-year trial period (2022-2024) in the former half of the long-term period of the
master plan should be assumed to smoothly introduce the tariff charging system. During
this trial period, the tariff will be exempted for low-income households.
The negotiation with the excise and taxation department of the provincial government
should be commenced from 2016 to adjust the rate of the provincial property rate so as to
add the surcharge for generating baseline stable revenue to fill the gap between the tariff
revenue and the required revenue, thereby covering the operation and maintenance cost.
In case of the non-payment of waste collection charges under the proposed tariff charging
system, it should be explored that a sort of penalty for non-payers will be enforced so as to
secure the horizontal equity among beneficiaries.
The full-scale introduction of the recommended tariff charging system in all areas will be
started from 2025.
Project for Integrated Solid Waste Management
Master Plan in Gujranwala
Draft Final Report
Volume 1 Main Report
CTI Engineering International Co., Ltd. NJS Consultants Co., Ltd.
EX Research Institute Ltd.
199
Regarding the concrete tariff collection methods, since the variable-rate user charge system
requires the identification of the income level, it is technically difficult to accurately grasp the
income level of each household. Therefore, the following 2 options are recommended as
possible concrete tariff collection methods under the variable-rate user charge system or
flat-rate user charge system:
To divide the entire project area into 3 zones in accordance with the results of the social
survey (low-income area, middle-income area and high income area), thereby
introducing the zone-wise variable-rate user charge system by dividing; and
To estimate the weighted average tariff level in accordance with the results of the tariff
review analysis under the financial evaluation, thereby introducing the flat-rate user
charge system.
However, since the willingness to pay for SWM service charges is extremely low in the
low-income area, the latter option to introduce the flat rate user charge system is not realistic.
Tariff Revision Mechanism (b)
In addition to the tariff charging system, the best option for the tariff revision mechanism
should be also selected.
Since the current capital investment costs of GWMC are substantially borne by the external
financial sources, the rate of return regulation could be “total costing regulation” without the
cost of capital. Although the traditional rate-of-return regulation has been criticised on the
grounds that it deteriorates incentives for cost efficiency, the monitoring on the management
efficiency through the performance monitoring indicators will be alternative measures to
strengthen incentives for cost efficiency.
Yardstick regulation depends on a wide range of data to provide indicative information on
relative performance of similar SWM service operators and other public utilities service
providers such as the power sector. In practice, information requirements in other service
providers might be obstacles to the implementation of yardstick competition. Yardstick
competition is the most effective when those service providers face similar conditions.
Therefore, the yardstick regulation is not suitable for the tariff revision mechanism, since other
service providers are operating in different management conditions.
On the other hand, the price cap regulation could be employed for the period only after
achieving the cost recovery of operation and maintenance cost as well as the depreciation of
the replacement cost.
In conclusion, “the rate of return” regulation is the recommended option for the tariff revision
mechanism.
(4) Alternative Options for Private Sector Involvement
As it will be described in the following Subsection 4.10.2, Item (3) Selection of General
Framework for PPP, when GWMC introduces the service contract in the cource of
implementation of the master plan, the problems, such as scale of the population, cheap local costs
and low willingness to pay, should be overcome. The optimum option for the private sector
involvement is thus selected in consideration of the economic aspects such as form of management,
tariff collection, contract term, status of monopoly, and ownership of assets. The step-wise service
contract in the field of collection and transport is the best option for the private sector involvement
due to the following reasons.
There are many low-income areas with extremely low customers’ willingness to pay, and,
therefore, “licensing” and “concession”, in which the tariff collection by the private sector is
required, will be excluded.

Draft Final Report
Volume 1 Main Report
Project for Integrated Solid Waste Management
Master Plan in Gujranwala
200
CTI Engineering International Co., Ltd. NJS Consultants Co., Ltd.
EX Research Institute Ltd.
Since GWMC is required to put the management of SWM services under control,
“management contract” will be excluded.
On the other hand, “lease contract” will be excluded due to the fact that GWMC cannot
effectively utilise the current sanitation workers for the economy of scale.
Unlike the concession, under the service contract, GWMC can finally decide the level of the
tariff.
Furthermore, there will be positive and negative effects of introducing the service contract through
the private sector involvement in the field of collection and transport of wastes. Table 4.8.3
indicates the positive and negative effects of the service contract with the private sector. In
conclusion, it is estimated that the net effect of the service contract with the private sector is
approximately 10 per cent compared with the current GWMC’s direct service.
Table 4.8.3 Positive and Negative Effects of Service Contract with Private Sector
Item
Positive Effect
(Reduction of Cost by Service Contract Compared with
GWMC’s Own Service)
Negative Effect
(Increase of Cost by Service Contract Compared with
GWMC’s Own Service)
Net Effect
(Reduction of Cost by Service Contract Compared with
GWMC’s Own Service)
Utilization of Facilities and Equipment of Private Service Providers
10.0% 0.0% 10.0%
Collection Efficiency of Wastes 10.0% 0.0% 10.0%
Collection Efficiency of Waste Charges 5.0% 0.0% 5.0%
Underutilization of Staff and Workers 0.0% 15.0% -15.0%
Total 25.0% 15.0% 10.0%
4.8.3 Identification of Project Components for Economic and Financial Plan
(1) Short-Term Plan (2016-2018)
The projects in the Short-Term period, i.e., from 2016 to 2018, are described as the Action Plans of
Priority Projects in Chapter 6. The proposed projects are as follows:
Establishment of Sustainable Cost Recovery
Implementation of Accurate Total Costing
Introduction of Proper Tariff Charging System
Implementation of Financially Efficient Private Sector Involvement
(2) Mid-Term Plan (2019-2024)
Establishment of Sustainable Cost Recovery (a)
During the mid-term period from 2019 to 2024, in response to the preparatory activities for the
cost recovery conducted during the short-term period, a wide range of activities to accelerate
the cost recovery in SWM services will be carried out. Especially, the mid-term financial
monitoring is a key to the sustainable cost recovery in the long-term period.
The mid-term financial monitoring system will significantly contribute to the feedback
mechanisms for rectifying the financial performance of GWMC. GWMC is requested to
monitor whether or not SWM services are actually and properly being delivered by the
efficient manner.

Project for Integrated Solid Waste Management
Master Plan in Gujranwala
Draft Final Report
Volume 1 Main Report
CTI Engineering International Co., Ltd. NJS Consultants Co., Ltd.
EX Research Institute Ltd.
201
Implementation of Accurate Total Costing (b)
During the mid-term period from 2019 to 2024, the tariff will be partially charged in only
high-income and middle-income areas from 2022, and therefore, the situation of the cost
recovery will be slightly improved. During this period, there are various activities for the cost
centre to support the cost recovery by estimating the total operation and maintenance cost.
Although the full-scale establishment of the cost recovery system in SWM services will be
started from the long-term period, even during the mid-term period, the absence of the cost
recovery will be replenished by the subsidies or the revenues from the provincial property tax.
The activities of the cost centre will be a basis for the explanation to the provincial government
and users for raising funds from the provincial property tax and the tariff system.
Introduction of Proper Tariff Charging System (c)
During the mid-term period from 2019 to 2024, the tariff will be partially charged in only
high-income and middle-income areas from 2022. There is a wide spectrum of activities in the
field of preparatory activities for the partial introduction of the tariff system from 2022. The
study on the tariff level based on the affordability to pay survey and the willingness to pay
survey should be carried out during the early mid-term period.
To set up a regulatory organization on imposing and revising the tariff is another critical action
to be taken during the early mid-term period. Since there is currently no official tariff system
for SWM services in Punjab, the tariff setting and revision for SWM services is not being
regulated by an independent organization of the provincial government.
The cross-subsidy system which provides financial assistance to poor households through
transferring user charges from well-off households to poor households should be also studied
by setting the tariff based on the proposed income-wise variable-rate user charges.
Implementation of Financially Efficient Private Sector Involvement (d)
During the mid-term period from 2019 to 2024, there will be a wide range of preparatory
activities of the outsourcing by GWMC in the form of the service contract with the selected
private service provider, which will be actually carried out from 2025. The monitoring system
which contributes to the feedback mechanisms for improving the performance of the selected
service provider will be established during the mid-term period.
(3) Long-Term Plan (2025-2030)
Establishment of Sustainable Cost Recovery (a)
During the long-term period from 2025 to 2030, the full-scale tariff system will be introduced
from 2025 in all areas, and, therefore, the cost recovery for the operation of SWM services will
be significantly attained. Accordingly, the cost recovery for the operation and maintenance
cost in SWM services will be to a significant extent enhanced during the long-term period. The
actual cost recovery should be partially achieved in accordance with the long-term cost
recovery plan during the long-term period. In spite of the partial cost recovery, CDGG’s
financial support for the recurrent cost as well as the provincial government’s subsidies for the
investment cost will be still required.
Based on the tariff actually collected, the actual cost recovery level should be accordingly
updated. The gap between the actual operation and maintenance cost and the tariff actually
collected should be replenished the revenue from the subsidies or the provincial property tax
revenues from the provincial government.

Draft Final Report
Volume 1 Main Report
Project for Integrated Solid Waste Management
Master Plan in Gujranwala
202
CTI Engineering International Co., Ltd. NJS Consultants Co., Ltd.
EX Research Institute Ltd.
Implementation of Accurate Total Costing (b)
During the long-term period from 2025 to 2030, in response to the full-scale introduction of
the tariff system from 2025, the cost centre of GWMC is requested to implement its full-scale
operations. It is extremely important for the cost centre to identify the costs in the long-term
period in which the tariff will be actually imposed, thereby updating the planned cost recovery
rate under the official tariff charging system. At the same time, the cost minimisation plan by
GWMC is critical for transparency and accountability of the tariff system, since the tariff will
be actually charged on users during the long-term period.
Introduction of Proper Tariff Charging System (c)
During the long-term period from 2025 to 2030, the proposed tariff system will be actually
introduced to partially cover the operation and maintenance cost for SWM services. The said
partial cost recovery will be started from 2022 with the activities related to the introduction of
the proper tariff system.
The trial introduction of the tariff system from 2022 will be carried out only in high-income
and middle-income areas, while the full-scale introduction of the tariff system will be
implemented from 2025, the former half of the long-term period. The collection efficiency as
well as the actually collected amount of user charges will be continuously monitored for
verifying the optimum tariff level for the full cost recovery of the operation and maintenance
cost during the long-term period. The tariff level should be also adjusted to the total cost
including the outsourcing costs for the collection and transport services to the selected private
service provider.
Implementation of Financially Efficient Private Sector Involvement (d)
During the long-term period from 2025 to 2030, the outsourcing by GWMC in the form of the
service contract with the selected private service provider will be actually carried out from
2025 with the following actions:
To manage the tender procedure for the service contract;
To monitor the financial performance of the selected private service provider by the
financial KPIs which are separated from those of GWMC;
To provide the auditing services for the selected private service provider; and
To properly manage the outsourced service zone.
4.8.4 Implementation Schedule of Economic and Financial Plan
The implementation schedule of the Economic and Financial Plan is illustrated in Figure 4.8.1.
2019 2020 2021 2022 2023 2024 2025 2026 2027 2028 2029 2030
Q1 Q2 Q3 Q4 Q1 Q2 Q3 Q4 Q1 Q2 Q3 Q4
WBS for Short-Term Plan
S-5-1 Establishment of Sustainable Cost Recovery (Preparatory Phase)
S-5-2 Implementation of Accurate Total Costing (Preparatory Phase)
S-5-3 Introduction of Proper Tariff Charging System (Preparatory Phase)
S-5-4
Implementation of Financially Efficient Private Sector Involvement
(Preparatory Phase)
M-5-1 Establishment of Sustainable Cost Recovery (Phase 1)
M-5-2 Implementation of Accurate Total Costing (Phase 1)
M-5-3 Introduction of Proper Tariff Charging System (Phase 1)
M-5-4
Implementation of Financially Efficient Private Sector Involvement (Phase
1)
L-5-1 Establishment of Sustainable Cost Recovery (Phase 2)
L-5-2 Implementation of Accurate Total Costing (Phase 2)
L-5-3 Introduction of Proper Tariff Charging System (Phase 2)
L-5-4
Implementation of Financially Efficient Private Sector Involvement (Phase
2)
Quarter
WBS for Mid-Term Plan
WBA for Long-Term Plan
Year 2016 2017
Long-Term Plan PeriodTime Framework of the Master Plan
2018
Short-Term Plan Period Mid-Term Plan Period
Figure 4.8.1 Implementation Schedule of the Economic and Financial Plan

Project for Integrated Solid Waste Management
Master Plan in Gujranwala
Draft Final Report
Volume 1 Main Report
CTI Engineering International Co., Ltd. NJS Consultants Co., Ltd.
EX Research Institute Ltd.
203
4.8.5 Project Cost of Economic and Financial Plan
Table 4.8.4 shows the project cost for the Master Plan. The total cost of the Economic and Financial
Plan is Rs. 2 million.
Table 4.8.4 Total Cost of the Economic and Financial Plan
4.9 Environmental Monitoring Plan
4.9.1 Necessity of Environmental Monitoring
The environmental management is essential to specify the monitoring work for finding problems and
improvement points that would be predictable in the field of the disposal sites, namely Bhakhlaywali,
Gondlanwala and Chianwali, collection and transport, and composting. Contents of monitoring listed
and implementation schedule is presented at the end of this section.
Regarding the new landfill site at Bhakhlaywali, GWMC, the responsible agency of the landfill
management, will prepare quarterly environmental compliance and a project performance report in
order to foresee the environmental and social impacts of the new landfill site. Major issues of the
internal reports are health, safety, and environmental performance of the landfill site. The reports must
be filed as a part of project archives and environmental database as an EIA Report. EIA is required for
construction of the final disposal site, and the construction of the proposed compost/RDF plant may
require an EIA/IEE although the Environment Protection Department (EPD) of Punjab will be finally
judged.
2016 2017 2018 2019 2020 2021 2022 2023 2024 2025 2026 2027 2028 2029 2030
S-5-1
Establishment of Sustainable Cost Recovery (Preparatory
Phase)
GWMC
S-5-2
Implementation of Accurate Total Costing (Preparatory
Phase)
GWMC
S-5-3
Introduction of Proper Tariff Charging System (Preparatory
Phase)
186 (Included in GWMC's
Staff Training Budget:
Module 6)
62 62 62
S-5-4
Implementation of Financially Efficient Private Sector
Involvement (Preparatory Phase)
196 (Included in GWMC's
Staff Training Budget:
Module 5)
196
Sub-Total
382 (Included in GWMC's
Staff Training Budget: Module
5 and 6)
62 62 258 0 0 0 0 0 0 0 0 0 0 0 0
M-5-1
Establishment of Sustainable Cost Recovery
(Phase 1)
GWMC
M-5-1 Implementation of Accurate Total Costing (Phase 1) GWMC
M-5-3 Introduction of Proper Tariff Charging System (Phase 1)
624 (Included in GWMC's
Staff Training Budget:
Module 6)
104 104 104 104 104 104
M-5-4
Implementation of Financially Efficient Private Sector
Involvement (Phase 1)
726 (Included in GWMC's
Staff Training Budget:
Module 5)
121 121 121 121 121 121
Sub-Total
1,350 (Included in
GWMC's Staff Training
Budget: Module 5 and 6)
0 0 0 225 225 225 225 225 225 0 0 0 0 0 0
L-5-1
Establishment of Sustainable Cost Recovery
(Phase 2)
GWMC
L-5-2 Implementation of Accurate Total Costing (Phase 2) GWMC
L-5-3
Introduction of Proper Tariff Charging System
(Phase 2)
504
(Included in GWMC's Staff
Training Budget: Module
6)
84 84 84 84 84 84
L-5-4
Implementation of Financially Efficient Private Sector
Involvement (Phase 2)
GWMC
Sub-Total
504 (Included in GWMC's
Staff Training Budget:
Module 6)
0 0 0 0 0 0 0 0 0 84 84 84 84 84 84
Grand Total
2,236 (Included in
GWMC's Staff Training
Budget: Module 5 and 6)
62 62 258 225 225 225 225 225 225 84 84 84 84 84 84
Annual Cost
Programme 5: Economic and Financial Plan
Short-Term Plan
Mid-Term Plan
Long-Term Plan
WBS
No.
WBSTotal Budget
(Thousand Rs.)

Draft Final Report
Volume 1 Main Report
Project for Integrated Solid Waste Management
Master Plan in Gujranwala
204
CTI Engineering International Co., Ltd. NJS Consultants Co., Ltd.
EX Research Institute Ltd.
In EIA, specific environmental monitoring items are recommended to be measured by professional
environmental consultancy. Proposed items are air quality, water quality, noise level, smelly gas (landfill
gases), treated wastewater effluent, leachate, vegetation/plantation, and safety and traffic. Most of these
items should be monitored quarterly except for vegetation and plantation, and safety and traffic that are
measured annually as shown in Table 4.9.1. This proposed plan seems to be an operation phase of the
proposed landfill site.
However, detail of Environmental Monitoring Plan is not shown in the EIA report, one of proposed
Environmental Monitoring in the landfill site is described in the following Subsection 4.9.2.
Table 4.9.1 Proposed Environmental Monitoring Plan in EIA Report for Bhakhlaywali
Environmental Component
Parametres Standard Frequency
Ambient Air Quality
SPM, PM10, SO2, NO2, CO, CO2, Vapours NEQS
NSDWQ Quarterly
Groundwater Quality
pH, Temperature, TDS, Conductivity, Fluoride, Nitrate, DO, Hardness, Turbidity, Colour, Chloride, Arsenic, etc.
NEQS NSDWQ
Quarterly
Noise Level dB(A) N/A Quarterly
Smelly Gases (Landfill Gasses)
SO2, H2S, CH4 NEQS Quarterly
Effluent to Leachate Pond
BOD, COD, TOC, TSS, DO, Chloride, Sulphate, Turbidity, Conductivity, Oil and Grease, Colour, TIN, Heavy metals
NEQS Quarterly
Influent to Leachate Pond
BOD, COD, TOC, TSS, DO, Chloride, Sulphate, Turbidity, Conductivity, Oil and Grease, Colour, TIN, Heavy metals
NEQS Quarterly
Vegetation and Plantation
Visual inspection of plant species survival rate and status of maintenance
N/A Annual Report
Safety and Traffic 1) Inspection of Signage 2) Faulty, overloaded and speeding of vehicles
N/A Annual Report
NEQS: National Environmental Quality Standard, Pakistan NSDWQ: National Standards for Drinking Water Quality N/A: Not applicable Source: EIA Report
4.9.2 Environmental Monitoring for the Final Disposal Site
(1) Monitoring of Leachate and Surface Water
Water quality of leachate and surface water is one of the most important factors in environmental
monitoring for the final disposal site and shall be monitored and analysed periodically in order to
determine the conditions of the landfill and the potential impact to the environment. The water
quality data of leachate can also be used to determine the state of stabilisation of the landfill.
Monitoring Points of Leachate and Receiving Water Body (a)
Monitoring point(s) of leachate shall be the outlet point(s) of leachate from the landfill site and
outlet point(s) of leachate treatment facilities and/or recirculation facilities. In addition,
several monitoring points shall be determined at the water receiving body to check the
influence of discharge of leachate. The recommended leachate monitoring points are
indicated but not limited to the following sites:

Project for Integrated Solid Waste Management
Master Plan in Gujranwala
Draft Final Report
Volume 1 Main Report
CTI Engineering International Co., Ltd. NJS Consultants Co., Ltd.
EX Research Institute Ltd.
205
Raw Leachate Quality
Outflow/Outlet points from the landfill site or influent water of the leachate
treatment/recirculation facilities
Leachate of instantaneous and total flows must be recorded according to Punjab Solid
Waste Management Guidelines (2011).
Treated/Recirculation Leachate Quality
Outlet points of leachate treatment/recirculation facilities or effluent water
Leachate Influence to the Water receiving Body
Upstream and downstream side of outfall of leachate to the water receiving body
Sampling/Monitoring Conditions (b)
Leachate quality shall be monitored periodically at the regular sampling points. In addition,
the leachate quality under the maximum/minimum flows shall be monitored. Sampling day of
leachate for periodical/regular monitoring may be determined on a day after consecutive
fine/cloudy days or more than 24 hours after stop of falling rain to minimise the influence of
rain.
The conditions of monitoring/sampling shall be recorded to include at least the following
conditions:
Name of person in charge
Name of sampling points
Date and time
Weather conditions
Water temperature and ambient temperature
Flow rate as required
Photos of sampling work
Table 4.9.2 shows the required parametres that are described in the EIA report and
recommended parametres as well. The water quality parametres shall be analysed by the
accredited laboratory.
Table 4.9.2 Parametres for Leachate Monitoring
Parametres Specified in EIA Report* Recommended Parametres
General
Items
COD, BOD5, Total Suspended Solids,
Electric Conductivity, Oil/Grease,
Sulphate, Turbidity, Colour, TIN
Water Temperature, pH, Settleable Solids, Total
Dissolved Solids, Surfactants (MBAS), Phenolic
Substances as Phenols, Total Coliform Count
Heavy
Metals
Name of parametres are not specified Arsenic, Cadmium, Chromium (hexavalent), Cyanide,
Lead, Mercury (Tot.), PCB, Formaldehyde
Source: EIA report
Frequency of Monitoring (c)
The minimum frequency of monitoring of leachate is four (4) times in a year or quarterly basis.
(2) Monitoring of Groundwater Quality
Poor lining system and inappropriate leachate control will cause a potential contamination source
of groundwater quality. A sign of groundwater contamination appears to the change of water

Draft Final Report
Volume 1 Main Report
Project for Integrated Solid Waste Management
Master Plan in Gujranwala
206
CTI Engineering International Co., Ltd. NJS Consultants Co., Ltd.
EX Research Institute Ltd.
quality parametres. Accordingly, the groundwater quality shall be monitored periodically for the
representative water quality parametres and analysed series of recorded data to grasp a significant
change of groundwater quality.
Monitoring Points of Groundwater (a)
Monitoring of groundwater should consist of the following items according to the Punjab
Solid Waste Management Guidelines (2011):
At least one groundwater monitoring well should be installed hydraulically above the
gradient of the landfill and at least three monitoring wells should be installed
hydraulically below the gradient direction;
The monitoring well system should include a sufficient number of multi-level well nests
for measurement of vertical gradients;
Locations of the monitoring wells should be sufficiently close to the active disposal area
to allow early detection of contamination and implementation of remedial measures; and
The monitoring wells are to be retained throughout the lifespan of the facility.
Sampling/Monitoring Conditions (b)
Groundwater quality shall be monitored periodically under the maximum/minimum
groundwater table. Special sampling tools shall be used to take the groundwater to meet with
the type of wells and springs. Specified parametres in EIA are pH, Temperature, TDS,
Conductivity, Fluoride, Nitrate, DO, Hardness, Turbidity, Colour, Chloride, and Arsenic (see
Table 4.9.2).
Frequency of Monitoring (c)
Frequency of monitoring of groundwater shall be at least on quarterly basis. Water quality
parametres shall be determined with reference to the drinking water quality.
(3) Monitoring of Landfill Gases
Landfill gasses include harmful substances such as hydrogen sulphide, methane gas, etc.
Monitoring of landfill gasses is essentially required to protect the health and safety of operation
staff and the neighbouring residents. The concentration and odour from the gasses shall be
monitored and analysed periodically in order to grasp the conditions of the landfill and the potential
impact to the environment. The data can also be used to determine the state of stabilisation of the
landfill.
Monitoring Points (a)
Monitoring of landfill gasses shall be made at the final disposal site and the detailed measuring
points will be decided in the action plan.
Sampling/Monitoring Conditions (b)
Monitoring of landfill gasses shall be carried out by a portable gas detector, sampling at site
and laboratory analysis. Special monitoring on a calm day after the rain may be required. The
monitoring/sampling conditions shall be recorded in conformity with the requirements
stipulated. Specified parametres in EIA are hydrogen sulphide (H2S), methane gas (CH4) and
ammonia (NH3).
Project for Integrated Solid Waste Management
Master Plan in Gujranwala
Draft Final Report
Volume 1 Main Report
CTI Engineering International Co., Ltd. NJS Consultants Co., Ltd.
EX Research Institute Ltd.
207
Frequency of Monitoring (c)
Frequency of monitoring of landfill gasses shall be at least on a quarterly basis. In addition,
the daily observation of odour and gas by smelling is important for the operators during
implementation of the landfill work.
(4) Monitoring of Odour
The landfill activities should be carried out properly and managed effectively to reduce the
emission of the unpleasant odour and minimise the impact to the surrounding residents.
Monitoring Points (a)
The state or degree of unpleasantness can only be determined by smelling the air depending on
the prevailing atmospheric conditions. The measurement of odour can only be expressed in
distance from the source where the odour can be detected.
Sampling/Monitoring Conditions (b)
The smell or unpleasantness will have to be determined by odour concentration and substance,
i.e., how bad it smells and what does it smell like.
Frequency of Monitoring (c)
Offensive odour shall be monitored daily by smelling or as-and-when necessary for some
specific offensive odour substances as long as it is not having a major impact or nuisance to the
communities.
(5) Monitoring of Noise and Vibrations
The landfill activities should be carried out properly and managed effectively to reduce the
excessive noise and vibration caused by the vehicles and operation of machinery and landfill
equipment. The noise and vibration levels should be minimal and comply with the relevant
regulation as set out for the protection of occupational safety and health. The measurement method
must be in accordance with internationally accepted protocols and procedures.
Monitoring Point (a)
The noise and vibration monitoring measurement should be carried out at or near the
generation source. Other monitoring locations could be along the perimetre of the landfill or at
nearby residential areas.
Sampling/Monitoring Conditions (b)
Sampling and monitoring conditions for noise and vibration shall be decided in the action
plan.
Frequency of Monitoring (c)
The recommended frequency of monitoring should be carried out not less than once a year.
Quarterly monitoring is recommended in the EIA.
4.9.3 Environmental Monitoring for the Safe Post-Closure of Final Disposal Sites in
Gondlanwala and Chianwali
Post-closure monitoring shall be applied for Gondlanwala and Chianwali sites after the completion of
the safety closure process. According to the Punjab Solid Waste Management Guideline 2011, the

Draft Final Report
Volume 1 Main Report
Project for Integrated Solid Waste Management
Master Plan in Gujranwala
208
CTI Engineering International Co., Ltd. NJS Consultants Co., Ltd.
EX Research Institute Ltd.
duration of post-closure monitoring is 25 years, and the specified monitoring items are groundwater,
surface water, landfill gas, and erosion and settlement. Frequency of monitoring is not mentioned in the
Guideline, so that it can be suggested once in a year. Monitoring method and sampling point is same as
the operational phase.
4.9.4 Environmental Monitoring for the Collection and Transport Work
For the collection and transport work, a clean environment around garbage containers is important.
Dirty environment with garbage scattered around the containers takes more time for collection and
transport compared to the container and its neighbouring area kept clean. Another problem is that dirty
containers and unsanitary environment around the container can be the origin of foul odour and vectors.
Waste separation at household level is essential for separate collection and intermediate treatment.
Practice of waste separation at household level will be gradually increased during implementation of the
Master Plan. Therefore, ratio of waste separation at household level is recorded periodically, and the
monitoring result shall be utilised for the planning of awareness programme.
(1) Monitoring of Cleanness of Garbage Container
Monitoring Points (a)
All or selected garbage containers in Gujranwala will be monitored.
Sampling/Monitoring Conditions (b)
Sanitary workers and UC members in each area can be in charge of this monitoring. Problems
and feedback will be given to residents by UC members.
Frequency of Monitoring (c)
The recommended frequency of monitoring is daily.
(2) Monitoring of Waste Separation at Household Level
Monitoring Points (a)
Monitoring points shall be selected in the urban and pre-urban areas. Different type of areas
should be monitored, such as high/low density area.
Sampling/Monitoring Conditions (b)
Samples are selected by gender, age, income level, and area.
Frequency of Monitoring (c)
The recommended frequency of monitoring should be annually. Residents practicing waste
separation in their household will be interviewed. Whether or not the respondent agrees or
disagrees with waste separation, his reason or opinion shall be utilized for the awareness
programme.
4.9.5 Environmental Monitoring for Intermediate Treatment (Compost Facility)
In this section, the environmental monitoring of intermediate processes is discussed, especially about
the compost facility. Basically, the compost facility is harmless to the environment, and not dangerous in
the labours working process. However, odour (ammonia, etc.) from the facility shall be monitored.

Project for Integrated Solid Waste Management
Master Plan in Gujranwala
Draft Final Report
Volume 1 Main Report
CTI Engineering International Co., Ltd. NJS Consultants Co., Ltd.
EX Research Institute Ltd.
209
(1) Monitoring of Odour (Ammonia Odour)
Monitoring Points (a)
The odour of ammonia shall be measured around the compost facility.
Sampling/Monitoring Conditions (b)
The measurement method must be in accordance with the internationally accepted protocols
and procedures. Sampling and monitoring conditions for odour will be decided in the action
plan.
Frequency of Monitoring (c)
The recommended frequency of monitoring is quarterly, probably the same with the quarterly
monitoring in the landfill site.
4.9.6 Implementation Schedule of Environmental Monitoring Plan
The implementation schedule of the Environmental Monitoring Plan is illustrated in Figure 4.9.1.
Timing of monitoring implementation is the same as the timing of service or start of operation.
Figure 4.9.1 Implementation Schedule of the Environmental Monitoring Plan
4.9.7 Project Cost of Environmental Monitoring Plan
Table 4.9.3 shows the project cost for the Master Plan. The total cost of the Environmental Monitoring
Plan is Rs. 22 million.
2019 2020 2021 2022 2023 2024 2025 2026 2027 2028 2029 2030
Q1 Q2 Q3 Q4 Q1 Q2 Q3 Q4 Q1 Q2 Q3 Q4
WBS for Short-Term Plan
S-6-1 Monitoring of Collection and Transport Work
S-6-2 Monitoring of Final Disposal Site in Bhakhraywali
S-6-3
Monitoring of Post-Closure Final Disposal Sites in Gondlanwala and
Chianwali
M-6-1 Monitoring of Collection and Transport Work
M-6-2 Monitoring of Final Disposal Site in Bhakhraywali
M-6-3 Post-Closure Monitoring of Gondlanwala and Chianwali Landfill Sites
M-6-4 Monitoring of Intermidiate Process (Compost Facility)
L-6-1 Monitoring of Collection and Transport Work
L-6-2 Monitoring of Final Disposal Site in Bhakhraywali
L-6-3 Post-Closure Monitoring of Gondlanwala and Chianwali Landfill Sites
L-6-4 Monitoring of Intermidiate Process (Compost Facility)
2016 2017
Long-Term Plan PeriodTime Framework of the Master Plan
2018
Short-Term Plan Period Mid-Term Plan Period
Quarter
WBS for Mid-Term Plan
WBA for Long-Term Plan
Year
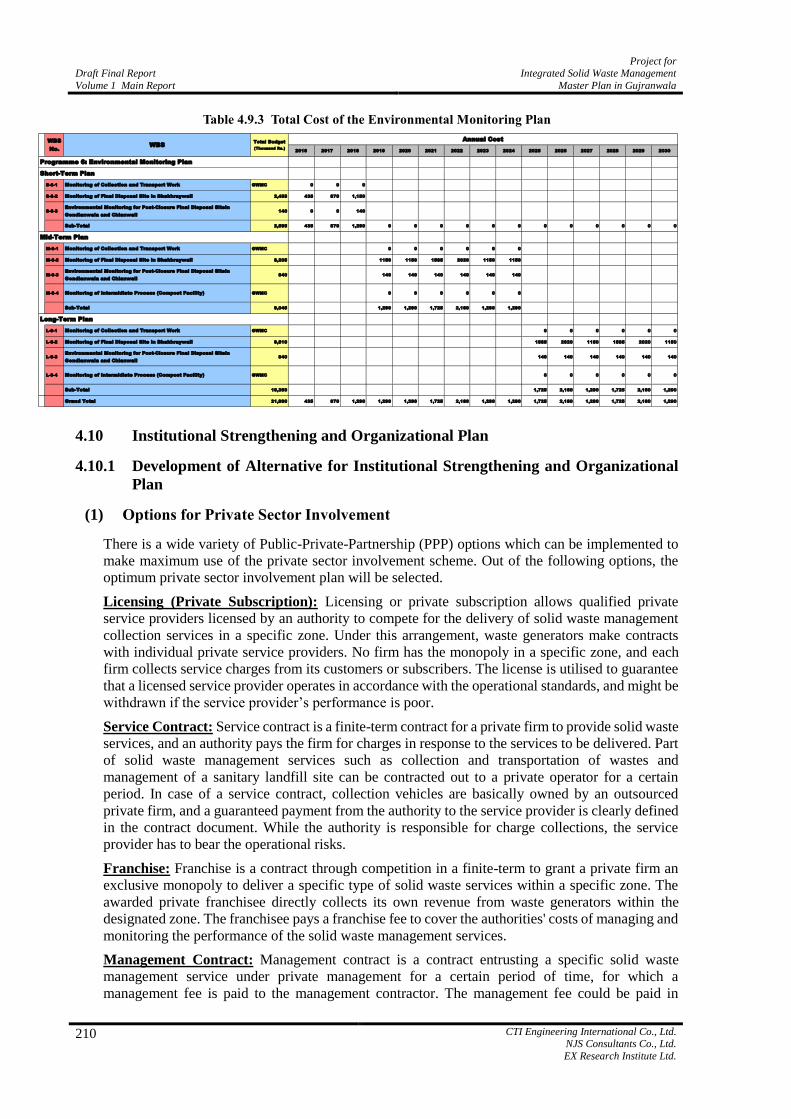
Draft Final Report
Volume 1 Main Report
Project for Integrated Solid Waste Management
Master Plan in Gujranwala
210
CTI Engineering International Co., Ltd. NJS Consultants Co., Ltd.
EX Research Institute Ltd.
Table 4.9.3 Total Cost of the Environmental Monitoring Plan
4.10 Institutional Strengthening and Organizational Plan
4.10.1 Development of Alternative for Institutional Strengthening and Organizational
Plan
(1) Options for Private Sector Involvement
There is a wide variety of Public-Private-Partnership (PPP) options which can be implemented to
make maximum use of the private sector involvement scheme. Out of the following options, the
optimum private sector involvement plan will be selected.
Licensing (Private Subscription): Licensing or private subscription allows qualified private
service providers licensed by an authority to compete for the delivery of solid waste management
collection services in a specific zone. Under this arrangement, waste generators make contracts
with individual private service providers. No firm has the monopoly in a specific zone, and each
firm collects service charges from its customers or subscribers. The license is utilised to guarantee
that a licensed service provider operates in accordance with the operational standards, and might be
withdrawn if the service provider’s performance is poor.
Service Contract: Service contract is a finite-term contract for a private firm to provide solid waste
services, and an authority pays the firm for charges in response to the services to be delivered. Part
of solid waste management services such as collection and transportation of wastes and
management of a sanitary landfill site can be contracted out to a private operator for a certain
period. In case of a service contract, collection vehicles are basically owned by an outsourced
private firm, and a guaranteed payment from the authority to the service provider is clearly defined
in the contract document. While the authority is responsible for charge collections, the service
provider has to bear the operational risks.
Franchise: Franchise is a contract through competition in a finite-term to grant a private firm an
exclusive monopoly to deliver a specific type of solid waste services within a specific zone. The
awarded private franchisee directly collects its own revenue from waste generators within the
designated zone. The franchisee pays a franchise fee to cover the authorities' costs of managing and
monitoring the performance of the solid waste management services.
Management Contract: Management contract is a contract entrusting a specific solid waste
management service under private management for a certain period of time, for which a
management fee is paid to the management contractor. The management fee could be paid in
2016 2017 2018 2019 2020 2021 2022 2023 2024 2025 2026 2027 2028 2029 2030
S-6-1 Monitoring of Collection and Transport Work GWMC 0 0 0
S-6-2 Monitoring of Final Disposal Site in Bhakhraywali 2,455 435 870 1,150
S-6-3
Environmental Monitoring for Post-Closure Final Disposal Sitein
Gondlanwala and Chianwali
140 0 0 140
Sub-Total 2,595 435 870 1,290 0 0 0 0 0 0 0 0 0 0 0 0
M-6-1 Monitoring of Collection and Transport Work GWMC 0 0 0 0 0 0
M-6-2 Monitoring of Final Disposal Site in Bhakhraywali 8,205 1150 1150 1585 2020 1150 1150
M-6-3
Environmental Monitoring for Post-Closure Final Disposal Sitein
Gondlanwala and Chianwali
840 140 140 140 140 140 140
M-6-4 Monitoring of Intermidiate Process (Compost Facility) GWMC 0 0 0 0 0 0
Sub-Total 9,045 1,290 1,290 1,725 2,160 1,290 1,290
L-6-1 Monitoring of Collection and Transport Work GWMC 0 0 0 0 0 0
L-6-2 Monitoring of Final Disposal Site in Bhakhraywali 9,510 1585 2020 1150 1585 2020 1150
L-6-3
Environmental Monitoring for Post-Closure Final Disposal Sitein
Gondlanwala and Chianwali
840 140 140 140 140 140 140
L-6-4 Monitoring of Intermidiate Process (Compost Facility) GWMC 0 0 0 0 0 0
Sub-Total 10,350 1,725 2,160 1,290 1,725 2,160 1,290
Grand Total 21,990 435 870 1,290 1,290 1,290 1,725 2,160 1,290 1,290 1,725 2,160 1,290 1,725 2,160 1,290
Annual Cost
Programme 6: Environmental Monitoring Plan
Short-Term Plan
Mid-Term Plan
Long-Term Plan
WBS
No.
WBSTotal Budget
(Thousand Rs.)
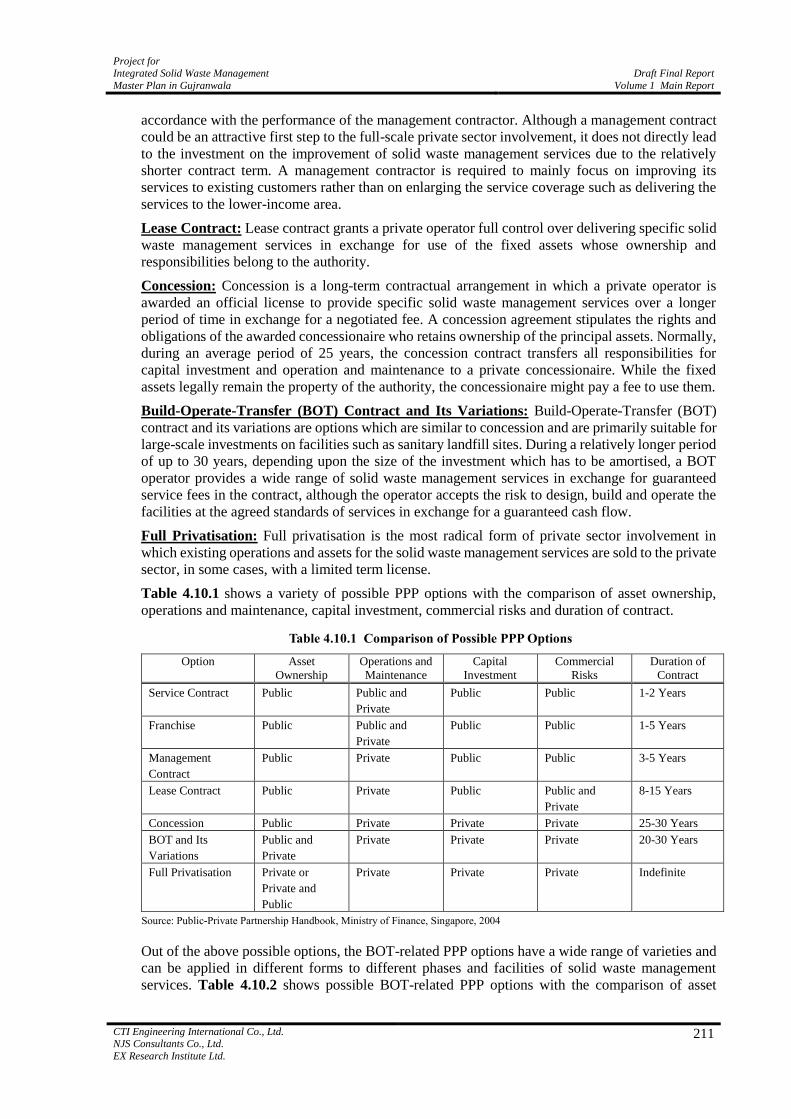
Project for Integrated Solid Waste Management
Master Plan in Gujranwala
Draft Final Report
Volume 1 Main Report
CTI Engineering International Co., Ltd. NJS Consultants Co., Ltd.
EX Research Institute Ltd.
211
accordance with the performance of the management contractor. Although a management contract
could be an attractive first step to the full-scale private sector involvement, it does not directly lead
to the investment on the improvement of solid waste management services due to the relatively
shorter contract term. A management contractor is required to mainly focus on improving its
services to existing customers rather than on enlarging the service coverage such as delivering the
services to the lower-income area.
Lease Contract: Lease contract grants a private operator full control over delivering specific solid
waste management services in exchange for use of the fixed assets whose ownership and
responsibilities belong to the authority.
Concession: Concession is a long-term contractual arrangement in which a private operator is
awarded an official license to provide specific solid waste management services over a longer
period of time in exchange for a negotiated fee. A concession agreement stipulates the rights and
obligations of the awarded concessionaire who retains ownership of the principal assets. Normally,
during an average period of 25 years, the concession contract transfers all responsibilities for
capital investment and operation and maintenance to a private concessionaire. While the fixed
assets legally remain the property of the authority, the concessionaire might pay a fee to use them.
Build-Operate-Transfer (BOT) Contract and Its Variations: Build-Operate-Transfer (BOT)
contract and its variations are options which are similar to concession and are primarily suitable for
large-scale investments on facilities such as sanitary landfill sites. During a relatively longer period
of up to 30 years, depending upon the size of the investment which has to be amortised, a BOT
operator provides a wide range of solid waste management services in exchange for guaranteed
service fees in the contract, although the operator accepts the risk to design, build and operate the
facilities at the agreed standards of services in exchange for a guaranteed cash flow.
Full Privatisation: Full privatisation is the most radical form of private sector involvement in
which existing operations and assets for the solid waste management services are sold to the private
sector, in some cases, with a limited term license.
Table 4.10.1 shows a variety of possible PPP options with the comparison of asset ownership,
operations and maintenance, capital investment, commercial risks and duration of contract.
Table 4.10.1 Comparison of Possible PPP Options
Option Asset
Ownership
Operations and
Maintenance
Capital
Investment
Commercial
Risks
Duration of
Contract
Service Contract Public Public and
Private
Public Public 1-2 Years
Franchise Public Public and
Private
Public Public 1-5 Years
Management
Contract
Public Private Public Public 3-5 Years
Lease Contract Public Private Public Public and
Private
8-15 Years
Concession Public Private Private Private 25-30 Years
BOT and Its
Variations
Public and
Private
Private Private Private 20-30 Years
Full Privatisation Private or
Private and
Public
Private Private Private Indefinite
Source: Public-Private Partnership Handbook, Ministry of Finance, Singapore, 2004
Out of the above possible options, the BOT-related PPP options have a wide range of varieties and
can be applied in different forms to different phases and facilities of solid waste management
services. Table 4.10.2 shows possible BOT-related PPP options with the comparison of asset

Draft Final Report
Volume 1 Main Report
Project for Integrated Solid Waste Management
Master Plan in Gujranwala
212
CTI Engineering International Co., Ltd. NJS Consultants Co., Ltd.
EX Research Institute Ltd.
ownership, operations and maintenance, capital investment, commercial risks and duration of
contract.
Table 4.10.2 Comparison of Options for BOT and Its Variations
Acronym Name of Option Brief contents of the option
DB Design-Build One entity enters a contract with the owner to provide both
architectural/engineering design services and construction services.
BOT Build-Operate-Transfer A concession is granted to a constructor to design, finance, maintain, and
operate a facility for a period of time. The constructor recoups the cost of
the project by collecting tolls during the life of the concession period.
BTO Build-Transfer-Operate A private developer finances and builds a facility and, upon completion,
transfers legal ownership to the sponsoring government agency. The
agency then leases the facility back to the developer under a long-term
lease. During the lease, the developer operates the facility and earns a
reasonable return from user charges.
BOOT Build-Own-Operate-Transfer Ownership of the facility rests with the constructor until the end of the
concession period, at which point ownership and operating rights are
transferred to the host government.
BOO Build-Own-Operate Resembles outright privatisation. Projects of this type are often let with no
provision for the return of ownership to government.
DBO Design-Build-Operate The contractor is responsible for the design and construction of a facility.
Upon completion transfer of legal ownership to the sponsoring
government agency. The contractor is also responsible for Operating and
Maintaining the facility for the stipulated period.
DBFO Design-Build-Finance-
Operate
A constructor is responsible for the design, construction, maintenance, and
financing. The constructor is compensated by specific service payments
from government during the life of the project.
BLTM Build-Lease-
Transfer-Maintain
In this type of arrangement, a facility is typically designed, financed, and
constructed by the private sector and is then leased back to government for
some predetermined period of time at a pre-agreed rental.
LROT Lease-Renovate-Operate-
Transfer
This model is for facilities that need to be modernised. The private sector
constructor pays a rental to government and agrees to renovate the facility.
In exchange, the constructor is granted a concession to operate the facility
for a fixed period of time and to charge a fee for the service.
Source: NETAP Regional Solid Waste Management Project: Regional Guideline
4.10.2 Evaluation of Alternatives
(1) Criteria for Selecting Optimum PPP Scheme
The following criteria are employed in an attempt to select the best and optimum option for the
private sector involvement scheme in providing the solid waste management services. However,
when applying these criteria, the current site-specific conditions of Gujranwala City should be
carefully taken into account. Choosing the optimum private sector involvement option is one of the
most crucial decisions before formulating the organizational and legal contents of the Master Plan
as it indicatively defines the major conditions between the public sector and private sector.
However, as the decision-making process depends on various factors, no substantial solution can be
applied. A broad range of the past experiences indicate that a mere copying of approaches that have
been successful in other countries will tend to fail when they are not properly adapted to the local
and site-specific situation.
Effectiveness: Effectiveness is the quantitative degree of increasing the service coverage and
qualitative significance of improving the quality of services through involving the private sector.

Project for Integrated Solid Waste Management
Master Plan in Gujranwala
Draft Final Report
Volume 1 Main Report
CTI Engineering International Co., Ltd. NJS Consultants Co., Ltd.
EX Research Institute Ltd.
213
Competition and Efficiency: By using the private sector expertise and experiences on cost saving,
the private sector involvement will significantly improve the efficiency of SM services through a
competitive business environment.
Accessibility to Capital Investment: The private sector involvement can enlarge the access to
capital and financial resources for procurement of collection vehicles as well as human capital for
expertise and skills.
Accountability and Transparency: Accountability and transparency under the private sector
involvement depends on the degree to which the procurement process is open to competitive
market forces.
Sustainability: By properly sharing the risk factors between the public sector and the private
sector, the private sector involvement will sustainably function in the long run.
Equity: The level of equity in universally providing SWM services to all uses under the private
sector involvement is also one of the important evaluation criteria.
However, when applying the above criteria for selecting the optimum private sector involvement
option, the current site-specific conditions of Gujranwala City and beneficiaries should be carefully
taken into account. For example, it has been already found that the willingness to pay for SWM
services in Gujranwala is relatively lower than in Lahore. Therefore, it is easily envisaged that the
full-scale private sector involvement option which requires the introduction of the relatively higher
level of the user charging system will be rather difficult in Gujranwala where beneficiaries’
willingness to pay is low.
Since the selection of the optimum private sector involvement option is closely related to the
formulation of the appropriate organizational and legal mechanisms for providing the sustainable
SWM services, the success of the private sector involvement by LWMC should not be simply
replicated by GWMC. In this sense, the progress of the consultancy works rendered by LWMC in
the field of the private sector involvement should be carefully monitored in the course of the
subsequent study.
(2) Factors to Consider for Designing Optimum PPP Scheme
The following factors should be carefully taken into account in designing a full-scale private sector
involvement plan.
Duration of Contract: The contract period should be in such a term which allows the depreciation
of vehicles and equipment used to achieve the service level in the contract. A limited contract
period would be a disincentive for the service provider to make investment on new and replaced
vehicles as it feels the risk of termination of the contract before depreciating vehicles and
repayment of its loans.
Mitigation of Long-Term Risk: Although the duration of a contract should be reasonably long,
another risk on the contract term to be considered would be the long-term contract risk. If a private
service provider is awarded a long-term contract, it might put the private company into a monopoly
position so that there will be no alternative service providers where it is rather difficult for the
authority to keep the service level satisfactory.
Step-wise Approach: It is better to start the private sector involvement with a step-wise approach,
and expand the degree of the involvement of private companies in a gradual manner, so that the
financial and service-quality risks by the private sector involvement can be minimised and
subsequent contractual arrangements can be modified to improve the performance of the private
operator.
Continuous Competition: Competition is widely regarded as a key to successful private sector
involvement. Continuous competition in the tendering process ensures competitively-priced
services by the private service provider. It is beneficial to divide a large-scale city-wide service into

Draft Final Report
Volume 1 Main Report
Project for Integrated Solid Waste Management
Master Plan in Gujranwala
214
CTI Engineering International Co., Ltd. NJS Consultants Co., Ltd.
EX Research Institute Ltd.
several zone-based contracts so that there will be competition among the private service providers.
If private service providers compete with each other in different zones, the performance and level
of services can be compared, and if one service provider fails, others can take over the service.
Size of Zone: It is also important to take into account the size of the service zone to be outsourced
to a private service operator.
(3) Selection of General Framework for PPP
Service Contract for Collection and Transport (a)
GWMC once tried to introduce the service contract following the LWMC model. However,
due to the following reasons, GWMC gave up outsourcing and continues to provide the
collection and transportation service by itself directly.
One reason is too little population for scale of economy to work. As a result, for a contractor to
make a profit the contract amount has to be relatively higher than that of LWMC. Thus, it is
necessary to wait for the population of Gujranwala to reach a certain level where economy of
scale works. Taking into account of the Lahore case where one collection and transportation
zone has approximately 4.5 million of population, it is advisable to start outsourcing in 2025
when the population of Gujranwala reaches approximately 4.5 million according to population
projection.
Another reason is the very cheap local cost compared to outsourcing cost to a foreign
company, not only because the market of Gujranwala is too small for economy of scale to
work, but the local cost of labour is fundamentally cheap in Gujranwala. Currently, there is no
private provider for collection and transport. This means that if GWMC outsources the
service, it is necessary to contract out the service to a Lahore or international company whose
service is far more expensive than that of direct service. Thus, for now it is cheaper for GWMC
to provide the service directly. However, as the production of machinery and equipment is
localised and gets cheaper, it will become possible for Lahore or international companies to
provide service at cheaper rate in the future.
The last reason is too low willingness to pay. According to the survey, it is less than 50 rupees
per month which is too little for the private sector to run its business. In order to introduce
outsourcing, public awareness-raising is essential. Thus, targeting at the year of 2025, it is
quite important to carry out the awareness raising programme intensively so that WTP will at
least reach the level where outsourcing is possible.
Considering the reasons mentioned above, these current constraints should be eliminated to
introduce the PPP scheme into the ISWM projects in Gujranwala. Firstly, the population of
Gujranwala is predicted to reach 4.5 million in 2025, which is almost equivalent to that of one
waste collection zone at the time when a private service provider started operation in Lahore.
Thus, it can be said that it will be feasible to introduce the service contract system for waste
collection and transportation since the economy of scale starts to function at this population
level, i.e., the year 2025. If some sort of the economy of scale is secured, private collectors
who are interested in the SWM business will come to Gujranwala. Lastly, public awareness
raising programmes that are proposed to start from 2016 will enhance the residents’ as well as
commercial entities’ moral consciousness and intention towards improvement of the
environment, and it will result in the increase of their WTP to a certain level.
Therefore, it is recommended to introduce service contract for collection and transportation
service from year 2025. The service contract may be the key instrument used in municipal
SWM after the operations are unbundled, enabling the municipality to let areas or parts of the
service to small- and medium-sized enterprises. In relation to SWM, a service contract is often
the preferred method of contracting an operator for collection services in middle-income areas.

Project for Integrated Solid Waste Management
Master Plan in Gujranwala
Draft Final Report
Volume 1 Main Report
CTI Engineering International Co., Ltd. NJS Consultants Co., Ltd.
EX Research Institute Ltd.
215
The service contract is not ambitious: It is often short in duration (1-3 years), and control is
still firmly lodged with the municipality. Duration must be sufficient to allow contractors to
fully write-off the cost of any equipment purchased (such as collection vehicles). Conversely,
the duration will determine the level of investment and therefore the standard of service
provided.
The municipality retains ownership and control of all capital assets and property, and must
finance fixed assets and working capital. The municipality establishes the performance
criteria, evaluates the bids, selects and supervises the contractor and monitors the work to be
carried out to ensure that the contractor meets the performance specification. For the
contracting of solid waste collection services (that do not always raise revenue), the
municipality must ensure that it has sufficient revenue to pay the contractor. This must be
calculated to include depreciation, interest on borrowing, salaries, consumables, insurance and
profit.
Under the service contract, the contractor is normally responsible for managing personnel and
services. To ensure the service contract results in greater efficiency, it should be awarded
through competitive bidding, and this can be compared against the public sector costs through
a benchmarking process. The selected contractor is obliged to carry out the service to the
specification established in the agreement, and agrees to a fee for the service on a lump sum,
unit cost or other basis. Unlike more complex forms of private sector participation, to the
contractor, the municipality is still the client and the source of payments. The commercial risk
for the private operator is that the municipality may default on payment.
The service contract is relatively simple to arrange, resembling the traditional construction
contracts with which municipal engineering departments are familiar. The service contract
does not bring with it the risk, and therefore does not need the complex regulatory
environment critical to the concession. Municipalities are therefore able to embark on
improvements much more quickly and not be concerned with the impact of the operating
environment outside their control. The short duration means they can review the work done
and make decisions easily, and the timeframe can adapt to electoral cycles.
Direct Management by GWMC of Final Disposal (b)
For final disposal, management of new landfill site, it is recommended to keep the direct
management by GWMC. It is because the private sector tends to prioritise the economic
benefits to environmental protection. Naturally, the private sector pursues to maximise its
profit by minimising the cost which, in this case, the management cost of landfill site. As a
result, poorly managed landfills have the potential of causing a number of issues. One is
pollution of the local environment such as contamination of groundwater or aquifers or soil
contamination by leachate. The local roads and water courses can also be contaminated by
wheels of collection vehicles when they leave poorly managed landfills. Another is de-facto
open dumping. This may occur if the private sector accepts waste without limit and keeps it for
a long time.
BOT for Intermediate Treatment (c)
Currently, composting is not a common practice in Gujranwala. Due to the lack of awareness
and understanding on compost, the market price of compost is low compared to its production
cost. As a result, farmers are not willing to produce compost. However, composting is globally
well recognised environmentally friendly practice with no side effect. This means once
residents realise its benefit and usefulness, it is possible for the private sector to make profit.
Therefore, in order to promote composting, public involvement is essential. The simulation
results of economic internal rate of return (EIRR) as presented in Subsection 4.6.2 show that
the establishment of a central compost plan will be feasible if the production capacity is

Draft Final Report
Volume 1 Main Report
Project for Integrated Solid Waste Management
Master Plan in Gujranwala
216
CTI Engineering International Co., Ltd. NJS Consultants Co., Ltd.
EX Research Institute Ltd.
satisfactory although the quality of the products should be assured. Thus, for composting,
BOT between GWMC and the private sector is recommended. Following the case of Lahore,
GWMC should provide a land and certain amount of organic waste in return for a certain
percentage of the annual profit. The same can be applied to the RDF plant.
4.10.3 Identification of Project Components for Institutional and Organizational
Restructuring Plan
(1) Organizational Restructuring
Basic Direction of Organizational Restructuring (a)
In order to implement the Master Plan, it is necessary to restructure and strengthen the
organization of GWMC. Basic direction is summarised as follows.
Strengthening of Operation (Field) Unit
As the zone coverage of waste collection and transportation expands from 8 to 16 zones, it is
necessary to increase senior (Sr.) managerial positions from two (2) to four (4) and
assistant (Asst.) managers from 11 to 28, as shown in Table 4.10.3 below.
Table 4.10.3 Proposed Number of Staff in the Operation Unit
Number of
Personnel
Position Responsibility
4 Manager 4 zones for each Manager
20 Asst. Manager 1 zone for each Asst. Manager plus 4
additional zones
6 Asst. Manager Road: 4 Asst. Managers in urban and 2 in
rural area
2 Asst. Manager Maintenance
Establishment of Manager Complaint Management under GM Operations
Currently, the Manager Communication Unit is in charge of complaint management. It is
recommended to establish a Manager Complaint Management Unit to be in charge of the call
centre which is directly under GM Operations. In this way, GM Operations can handle
complaints directly and thus promptly. In addition, this call centre function should be
outsourced and the Manager Complaint Management Unit concentrates on management and
supervision.
Establishment of Intermediate Treatment Unit under Operations Department
Though full privatisation is proposed by the MP, it is still necessary for GWMC to supervise
intermediate treatment facilities such as compost and RDF plants. Accordingly, it is
recommended to rename the Sr. Manager for Landfill position into Sr. Manager for Disposal
position and establish the Asst. Manager for Landfill and Asst. Manager for Intermediate
Treatment positions under him/her.
Establishment of Communication Unit under GM Operations (Shift from Human Resources
and Administration Department)
The Master Plan emphasises the necessity of public awareness raising especially at schools. It
is advisable to establish the Environmental Education Unit led by the Assistant Manager for
Environmental Education specifically in charge of public awareness raising. Another
Assistant Manager (for Public Relations) shall concentrate more on general public
communications such as media relations.

Project for Integrated Solid Waste Management
Master Plan in Gujranwala
Draft Final Report
Volume 1 Main Report
CTI Engineering International Co., Ltd. NJS Consultants Co., Ltd.
EX Research Institute Ltd.
217
Strengthening of P&C Department for PPP Introduction of Collection and Transport
To commence the service contract from 2025, strengthening of the procurement and contract
division is required for establishment of management system for tender preparation, selection
of service providers, contracting with the selected tenderer and so on. Thus, it is necessary to
assign one Sr. Manager for PPP and three (3) Asst. Managers for PPP to handle this system.
Establishment of Monitoring and Evaluation Department under GM
The Monitoring and Evaluation Department should be totally independent from other
departments to carry out its function as a focal point to check performance of GWMC. It is
advisable to assign three (3) Managers in charge of 1) KPI, 2) Finance and 3) Environmental
monitoring. In order to establish a mechanism of feedback, it is also recommended to have
regular meetings of Directors to review the monitoring results and to take countermeasures.
The organograms of GWMC management sections in years 2018 (completion of the Action
Plan), 2022 (start of preparation of service contract and tariff charging system) and 2030
(completion of the Master Plan) are shown in Figure 4.10.1 to Figure 4.10.3. GWMC is
basically in charge of management part of the SWM services only whereas the operation part
is done by CDGG staff. Even though the work load of GWMC might decrease slightly if the
collection and transportation work is contracted out to private sector, it is difficult to predict
how many staff members can be reduced from this action. Therefore, keeping the status quo,
the required number of GWMC staff and total number of GWMC staff by implementation of
the master plan is estimated as presented in Table 4.10.4. Apart from road sweepers whose
salaries are paid by CDGG, this table shows that the number of GWMC staff in 2030 will
increase 5 times as many as that of the current numbers.
Table 4.10.4 Required Number of Managers and Total Number of GWMC Staff
for Implementation of the Master Plan
Year 2015
(present) 2018 2020 2022 2030
Management Staff 46 66 70 72 75
Managing Director 1 1 1 1 1
General Managers 5 7 7 7 7
Managers 12 21 21 22 22
Assistant Managers 28 37 41 42 45
Operation and Maintenance Staff
for Sanitary Landfill Management 15 24 24 24 34
Workers for Waste Collection 307 830 951 1,060 1,875
Total 368 920 1,139 1,156 1,984
Note: The number of “Workers for Waste Collection” indicates the number on the assumption that GWMC would carry out the
waste collection and transportation services continuously and varies depending on the number of waste collection
workers on private contractors.

Draft Final Report
Volume 1 Main Report
Project for Integrated Solid Waste Management
Master Plan in Gujranwala
218
CTI Engineering International Co., Ltd. NJS Consultants Co., Ltd.
EX Research Institute Ltd.
Fig
ure
4.1
0.1
P
roje
ct
Org
an
iza
tio
n o
f G
WM
C 2
018

Project for Integrated Solid Waste Management
Master Plan in Gujranwala
Draft Final Report
Volume 1 Main Report
CTI Engineering International Co., Ltd. NJS Consultants Co., Ltd.
EX Research Institute Ltd.
219
Fig
ure
4.1
0.2
P
roje
ct
Org
an
iza
tio
n o
f G
WM
C 2
022

Draft Final Report
Volume 1 Main Report
Project for Integrated Solid Waste Management
Master Plan in Gujranwala
220
CTI Engineering International Co., Ltd. NJS Consultants Co., Ltd.
EX Research Institute Ltd.
Fig
ure
4.1
0.3
P
roje
ct
Org
an
iza
tio
n o
f G
WM
C 2
030

Project for Integrated Solid Waste Management
Master Plan in Gujranwala
Draft Final Report
Volume 1 Main Report
CTI Engineering International Co., Ltd. NJS Consultants Co., Ltd.
EX Research Institute Ltd.
221
Improvement of Working Environment for Managerial Staff (b)
Currently, GWMC is suffering from the lack of human resources as well as the capacity of
existing human resources. Most of competent persons prefer to work in Lahore than in
Gujranwala. Thus GWMC must overcome this challenge. In order to attract human resources
with adequate expertise on solid waste management in this competitive market, the working
environment must be attractive enough. Therefore, it is advisable to introduce the following
systems.
(i) Performance Based Salary
Currently, GWMC just adapted the LWMC salary scale and there is an annual salary
increase automatically. This situation can be described as socialistic. Therefore, in order to
motivate staff by bringing in competition and eventually providing better service, GWMC
should come up with its own salary scale and performance measurement system. As a
result, staff working harder can receive higher salary and feel more appreciated. In this
way, GWMC should grow out from seniority to merit oriented system.
(ii) Provision of Social Welfare and Old Age Benefits to Secure the Minimum
Quality of Life of Workers
In addition to awarding outstanding performance, it is also important to provide enough
social welfare in order to secure the minimum quality of life of staff. In this way, workers
can concentrate on working and not worrying about immediate needs.
Improvement of Working Environment for Technical Staff (c)
(i) Performance Based Salary
Similar to the case of managerial staff, it is advisable to introduce performance based salary
in technical staff. For now, however, as technical personnel still belong to CDGG, it is
difficult to change their salary scale. Thus, first of all it is necessary to wait for CDGG staff
to retire and to outsource the service to contractors gradually. In this way, GWMC can
measure their performance directly and change a contractor if the contractor fails to fulfil
its mandate.
(ii) Organization of Sanitary Staff
Currently, there are more than 1,600 sanitary workers but there is no organizational
structure. This situation is not preferable as there is no reporting line. In order to organize
the sanitary workers and supervise and measure their performance, it is recommended to
group sanitary workers into about 20 and one of them becomes the leader. It is also
preferable if the groups are allocated according to each Urban Unit. Accordingly, in order
to streamline their workflow, it is necessary to review collection routes.
In addition, it is also necessary to make a guideline for technical staff to provide uniform
service to all residents. This guideline should include the following items:
Filling out daily driving report
Safe driving
Safe operation
Response to vehicle accidents, breakdowns and fires

Draft Final Report
Volume 1 Main Report
Project for Integrated Solid Waste Management
Master Plan in Gujranwala
222
CTI Engineering International Co., Ltd. NJS Consultants Co., Ltd.
EX Research Institute Ltd.
(iii) Provision of Incentives Such as Monthly Award for Outstanding
Performance
In addition to performance based salary system, it is also effective to provide special
incentives such as monthly award for outstanding sanitary workers. Currently there are
more than 1,600 sanitary workers and they are not evaluated personally. As a result, they
do not pay much attention to their work. In order to prevent this situation, it is advisable to
group them as mentioned above and give the best sanitary workers’ award monthly or
annually based on their performance. In addition, to appreciate sanitary worker leaders, it is
also advisable to give him/her small gifts as a leader such as photo display in the entrance
of GWMC.
(iv) Gifts and Incentives on Eid and Christmas
In general, festive seasons are difficult to afford with technical workers who are
low-incomers. Thus even if small, gifts on Eid and Christmas are very much appreciated
and foster affection to GWMC.
(v) Provision of Social Welfare and Old Age Benefits to Secure the Minimum
Quality of Life of Workers
One of the main reasons why sanitary workers of CDGG are not willing to be transferred to
GWMC is because of generous social welfare and pension promised by CDGG. In order to
facilitate the smooth transfer of CDGG sanitary workers to GWMC, it is recommended that
equivalent social welfare and pension system be provided.
(vi) Health Screening and Other Facilities
Waste collection is a heavy manual labour and involves risks of injuries and infections.
Therefore, it is also important to protect and promote workers’ health condition by
providing regular health check-ups and health facilities such as rest rooms.
(2) Human Resources Development through Implementation of Comprehensive
Capacity Development Programme (CCDP)
A major challenge to the human resources development plan in the Master Plan is how to
incorporate the improvement of individual capacities into the organizational capacities of GWMC
required for providing the service contract system. Another challenge is how to upgrade the
capacities and motivation of the staff of GWMC in response to the massive human resources
development demand of the new organization. Based on the wide range of capacity gap assessment
on human resources for the improvement of the current solid waste management system, the human
resources development plan has been identified as a comprehensive capacity development
programme required for the restructuring of GWMC, thereby identifying the following eight (8)
modular human resources development projects.
However, it is acknowledged that “human resources development project approach” based on a
single human resource development project alone does not comprehensively solve the constraints
of the solid waste management services. Since “human resources development programme
approach” is the process of managing a portfolio of multiple inter-dependent projects, the
programme approach can be used for the management of the identified multiple modular projects.
The programme approach provides the human resources development plan with a common
platform to implement these modular projects under the Comprehensive Capacity Development
Programme (CCDP). The CCDP acts as a key pre-condition to maximise the sustainability of the
city-wide solid waste management services.

Project for Integrated Solid Waste Management
Master Plan in Gujranwala
Draft Final Report
Volume 1 Main Report
CTI Engineering International Co., Ltd. NJS Consultants Co., Ltd.
EX Research Institute Ltd.
223
The proposed CCDP should be implemented with full-scale technical assistance by an external
donor organization. The overall goals of the proposed CCDP are to create the new organizational
structure of the GWMC as well as to upgrade the technical and managerial capacities for the staff of
the GWMC, thereby upgrading the comprehensive capacity to implement the Master Plan.
The outline of the proposed Comprehensive Capacity Development Programme (CCDP) is given
in Table 4.10.5. The concept of detailed modular training projects under the CCDP is shown in
Volume 2, Supporting Report, Section G: Institutional Strengthening and Organizational
Restructuring, Subsection 4.3.2. The cost of implementation of the CCDP is estimated at
approximately Rs. 77 million.
Table 4.10.5 Outline of the Proposed Comprehensive Capacity Development Programme (CCDP)
Item
No.
Modular
HRD Project
Training
No.
Specific Subjects for Human Resources
Development
Target
GWMC
Managerial
Staff
Sanitary
Worker
Leader
Private
Sector
CBO
NGO
1 Overall
Management
1-a Overall capacity for SWM ●
1-b Capacity for SWM information system ● ●
2 Collection and
Transport
2-a Capacity to efficiently operate collection
and transport services
● ●
2-b Capacity to maintain collection vehicles
and equipment
● ●
3
Intermediate
Treatment and
3R Promotion
3-a Capacity to implement 3R ● ● ●
3-b Capacity to operate intermediate treatment
facilities
●
3-c Capacity to maintain intermediate
treatment facilities
●
4
Sanitary
Landfill Site
Management
4-a Capacity to select candidate sanitary
landfill sites
●
4-b Capacity to operate sanitary landfill sites ●
4-c Capacity to implement EIA and monitor
environment for sanitary landfill sites
●
4-d Capacity to design sanitary landfill sites ●
5
Public –
Private
Partnership
5-a Capacity to manage PPP tender and
procurement procedures
● ●
5-b Capacity to provide franchised collection
services
● ●
5-c Capacity to provide service contracts for
sanitary landfill management
●
6 Financial
Management
6-a Capacity to implement proper financial
management
●
6-b Capacity to finance SWM projects ●
6-c Capacity to collect and manage service
fees
●
6-d Capacity to manage SWM special account
and revolving funds
●
7
Organizational
and Legal
Improvement
7-a Capacity to improve organization for
SWM
●
7-b Capacity to improve legal system for
SWM
●
7-c Capacity to monitor and enforce SWM
regulations
●
8 Community
Participation 8-a
Capacity to primary collection at
community and raise public awareness ● ● ●

Draft Final Report
Volume 1 Main Report
Project for Integrated Solid Waste Management
Master Plan in Gujranwala
224
CTI Engineering International Co., Ltd. NJS Consultants Co., Ltd.
EX Research Institute Ltd.
(3) Legal and Institutional Reform
Currently there is no single comprehensive by-law in Gujranwala and the Committee of the Punjab
Province is drafting a solid waste management law based on the Municipal Solid Waste Rules
2014 (Draft) of India. This law should integrate the latest version of laws and regulations related to
solid waste management in Punjab Province as well as adapt applicable clauses from Indian MSW
rules so that it becomes one single comprehensive law to comply with.
In order to enforce the laws and regulations, first of all, CDGG/GWMC officials should have
enough understanding of the legal matters involved. Therefore, it is necessary to provide training
on legal matters to CDGG and GWMC staff.
From the perspective of residents, it seems that most of residents are not aware of even the
existence of laws and regulations. Therefore, in order to make them understand and comply with
the law, it is advisable to interpret the law in Urdu.
In addition to awareness-raising, it is necessary to exercise enforcement power for punishment of
offences against the laws and regulations in order to prevent free riders of solid waste management
services. For this purpose, CDGG/GWMC should procure some enforcement officers.
4.10.4 Implementation Schedule of Institutional Strengthening and Organizational
Plan
The implementation schedule of the Institutional Strengthening and Organizational Plan is illustrated in
Figure 4.10.4.
Figure 4.10.4 Implementation Schedule of the Institutional Strengthening and Organizational Plan
4.10.5 Project Cost of Institutional Strengthening and Organizational Plan
Table 4.10.6 shows the project cost for the Master Plan. The total cost of the Institutional Strengthening
and Organizational Plan is Rs. 424 million.
2019 2020 2021 2022 2023 2024 2025 2026 2027 2028 2029 2030
Q1 Q2 Q3 Q4 Q1 Q2 Q3 Q4 Q1 Q2 Q3 Q4
WBS for Short-Term Plan
S-7-1 Improvement of Organisational Restructuring of GWMC
S-7-2 Capacity Development of GWMC Staff
S-7-3 Establishment of Gujuranwala Solid Waste Management By-Law
M-7-1 Improvement of Organisational Restructuring of GWMC
M-7-2 Capacity Development of GWMC Staff
M-7-3 Establishment of Gujuranwala Solid Waste Management By-Law
L-7-1 Improvement of Organisational Restructuring of GWMC
L-7-2 Project for Capacity Development of GWMC Staff
Quarter
WBS for Mid-Term Plan
WBA for Long-Term Plan
Year 2016 2017
Long-Term Plan PeriodTime Framework of the Master Plan
2018
Short-Term Plan Period Mid-Term Plan Period

Project for Integrated Solid Waste Management
Master Plan in Gujranwala
Draft Final Report
Volume 1 Main Report
CTI Engineering International Co., Ltd. NJS Consultants Co., Ltd.
EX Research Institute Ltd.
225
Table 4.10.6 Total Cost of the Institutional Strengthening and Organizational Plan
4.11 Recommendations on Hospital, Industrial, and Construction and Demolition
Waste Management
4.11.1 Hospital Waste Management
Recommendations in hospital waste management are as follows:
It is necessary to treat infectious waste separately from domestic waste. The inappropriate disposal
of infectious waste not only causes direct damage to the health of waste collection staff in hospitals
and waste pickers, etc., on disposal sites, but also the re-use of medical implements such as syringes,
etc., can adversely affect ordinary patients.
Segregating potentially infectious material from municipal solid waste at the point of generation
may apply and in this way both volume and cost can be reduced.
The Gujranwala Waste Management Company (GWMC) should make plans/guidelines and provide
the services to the medical facilities by charging service fee. In this way GWMC can generate
revenue.
Training should be given to the sweepers on how to handle hospital wastes since these are toxic and
hazardous. Sweepers are unaware of the diseases spread through direct contact with medical waste;
if they know they will definitely use personal protective equipment.
From 2016, based on the estimation of unit cost for collecting and disposing hospital wastes,
GWMC should prepare the tariff setting plan for the hospital waste management with reference to
waste generators’ willingness to pay. The tariff collection method will be a direct collection system
from waste generators by charging the individual tariff calculated from the estimated unit cost and
the generated hospital waste amount.
4.11.2 Industrial Waste Management
Recommendation in industrial waste management is as follows:
GWMC should prepare plans/guidelines and provide waste collection services to industries by
charging some fee from the industries.
From 2016, based on the estimation of unit cost for collecting and disposing industrial wastes,
GWMC should prepare the tariff setting plan for the industrial waste management with reference to
2016 2017 2018 2019 2020 2021 2022 2023 2024 2025 2026 2027 2028 2029 2030
S-7-1 Improvement of Organisational Restructuring of GWMC 38,858 8,180 13,234 17,443
S-7-2 Capacity Development of GWMC Staff 8,695 6,109 1,284 1,302
S-7-3 Establishment of Gujuranwala Solid Waste Management By-Law 0
Sub-Total 47,552 14,289 14,518 18,745
M-7-1 Improvement of Organisational Restructuring of GWMC 120,472 16,989 17,833 19,316 20,938 21,941 23,456
M-7-2 Capacity Development of GWMC Staff 30,594 12,447 382 385 15,063 1,168 1,148
M-7-3 Establishment of Gujuranwala Solid Waste Management By-Law 844 60 784
Sub-Total 151,910 29,496 18,999 19,701 36,001 23,109 24,604
L-7-1 Improvement of Organisational Restructuring of GWMC 187,379 24,977 28,662 29,668 31,841 34,034 38,198
L-7-2 Capacity Development of GWMC Staff 37,605 16,914 1,759 1,181 17,752
Sub-Total 224,984 41,891 30,420 30,848 49,592 34,034 38,198
Grand Total 424,447 14,289 14,518 18,745 29,496 18,999 19,701 36,001 23,109 24,604 41,891 30,420 30,848 49,592 34,034 38,198
Annual Cost
Programme 7: Institutional Strengthening and Organizational
Restructuring
Short-Term Plan
Mid-Term Plan
Long-Term Plan
WBS
No.
WBSTotal Budget
(Thousand Rs.)

Draft Final Report
Volume 1 Main Report
Project for Integrated Solid Waste Management
Master Plan in Gujranwala
226
CTI Engineering International Co., Ltd. NJS Consultants Co., Ltd.
EX Research Institute Ltd.
waste generators’ willingness to pay. The tariff collection method will be a direct collection system
from waste generators by charging the individual tariff calculated from the estimated unit cost and
the generated industrial waste amount.
4.11.3 Construction and Demolition Waste Management
Recommendations in hospital waste management are as follows:
On the basis of situation analysis it is recommended that provincial government should make some
rule and regulations for Construction and Demolition (C&D) waste management in which rules and
responsibilities should be clearly defined.
As the generator itself is responsible for the management of C&D waste, the Lahore Waste
Management Company (LWMC) propose to set a tariff for the C&D waste collection service to the
generator. Therefore, it is important that the provincial government or the city district government
make some laws or by-laws to provide legal shelter for the GWMC and the penalties should be also
incorporated in the laws or by-laws.
LWMC proposed one time cleaning of the 46 sites filled with C&D waste by itself or by private
contractor or to outsource the operations for the C&D waste collection. GWMC should use
LWMC’s per ton and per kilometre calculated cost for the C&D waste from all the four towns of the
city and also use recommendations from the LWMC plan stated below.
It is recommended that the City District Government Gujranwala and GWMC shall engage
demolition contractors who have expertise, new techniques, tools, proper demolishing system, and
health safety and environment working systems on board. For this, bidders shall be qualified
technically in all towns and shall be called upon to bid on reserve prices set by the concerned
department after having input from engineering wing.
The demolition contractors shall be bound to barricade properly and dump the debris to the GWMC
designated crushing site. This would be the stage when actual estimation of C&D waste should be
designated by considering the following data:
1. Amount of area demolished
2. Exact percentage range for demolished material
3. Exact percentage range for recycled material
4. Exact percentage range for reusable material
5. Revenue detail and bringing this demolishing activity in tax net in future
After at least 2.5 years to 3.0 years, the exact form of data regarding Construction and Demolition
Waste shall start to be developed.
From 2016, based on the estimation of unit cost for collecting and disposing construction and
demolition wastes, GWMC should prepare the tariff setting plan for the construction and demolition
waste management with reference to waste generators’ willingness to pay. The tariff collection
method will be a direct collection system from waste generators by charging the individual tariff
calculated from the estimated unit cost and the generated construction and demolition waste
amount.
4.12 Development of the Master Plan Alternatives
4.12.1 Optimum Options for Each Component of the Master Plan
Based on the preconditions mentioned in the preceding sections, the ISWM Master Plan will be
formulated. The ISWM Master Plan, as described in Section 3.4, is composed of seven programmes in
technical, and institutional and financial arrangement. To develop the Master Plan alternatives, the
optimum options for each component will be selected by focusing on four (4) components, i.e., (1) the
waste collection and transportation plan; (2) the final disposal plans; (3) the intermediate treatment and
3R promotion plan; and (4) the environmental education and public awareness raising plan, as presented
in the following:

Project for Integrated Solid Waste Management
Master Plan in Gujranwala
Draft Final Report
Volume 1 Main Report
CTI Engineering International Co., Ltd. NJS Consultants Co., Ltd.
EX Research Institute Ltd.
227
(1) Waste Collection and Transportation Plan
The waste collection and transportation plan will be formulated depending primarily on the way of
waste discharge from the generation sources. There is no doubt that the waste separation at source
is the preferable option in the initial stage of the ISWM scheme. Although the detailed discussions
in terms of comparative study for selection of the optimum alternatives are made in Section 4.4, the
following three options are considered:
Door-to-door collection by using mini-compactors (Narrow streets); and Waste container
(small type) by using compactor (Wide streets) based on waste separation at source.
Door-to-door collection by using mini-compactors (Narrow streets); and Waste container
(small type) by using compactor (Wide street), based on no waste separation at source.
No other additional vehicles for waste collection and transportation (status quo).
(2) Final Disposal Plan
As presented in Section 2.4, the Pakistani side already selected Bhakhraywali as a new final
disposal site for Gujranwala city after comparisons of some of candidate sites. A preliminary
design for Bhakhraywali site is presented in Section 4.5, and the option of the final disposal plan
will be the following two:
Construction of a new final disposal site at Bhakhraywali
No construction of any new final disposal sites (status quo)
(3) Intermediate Treatment and 3R Promotion Plan
Since the optimum alternatives in terms of intermediate treatment and 3R promotion are limited in
view of the past experiences in Gujranwala and the surrounding cities, workability of technologies
and economic feasibility, two options will be listed in the comparison of the master plan
alternatives. The detailed study is carried out in Section 4.6.
Composting and RDF
No intermediate treatment and 3R promotion activities (status quo)
(4) Environmental Education and Public Awareness Raising Plan
Environmental education and public awareness raising activities are indispensable for
implementation of the ISWM Master Plan because most residents in Gujranwala are indifferent to
SWM as shown in the result of the Public Awareness Survey (see Section 2.6). Educating the
people and raising their awareness towards improvement of the public health and SWM in the city
is crucial to achieve the vision, mission and goal of ISWM in Gujranwala. Thus, the options to be
considered are “with” and “without” these actions in this case while the plan of environmental
education and public awareness raising activities is discussed in Section 4.7.
Implementation of environmental education and public awareness raising activities
No environmental education and public awareness raising activities (status quo)
4.12.2 Master Plan Alternatives by Combination of the Optimum Options for Each
Component
The optimum options for each component to be selected are to be combined and the master plan
alternatives are then developed accordingly. The following five (5) cases as shown in Table 4.12.1
below will be evaluated in the next section.

Draft Final Report
Volume 1 Main Report
Project for Integrated Solid Waste Management
Master Plan in Gujranwala
228
CTI Engineering International Co., Ltd. NJS Consultants Co., Ltd.
EX Research Institute Ltd.
Table 4.12.1 Master Plan Alternatives by Combination of the Optimum Options for Each Component
Master Plan
(MP) Options
Waste Collection & Transportation Final Disposal Intermediate Treatment
& 3R Promotion
Environmental
Education & Public
Awareness Raising Separation
at Source
Collection &
Transportation
Method
MP Option A Done Door-to-door +
Mini-compactor
(narrow street)
Small container +
Compactor
(wide street)
Construction of a new
final disposal site at
Bhakhraywali
None (Status quo) Environmental
education & public
awareness raising
activities
MP Option B Done -ditto- -ditto- Composting & RDF -ditto-
MP Option C None -ditto- -ditto- None (Status quo) -ditto-
MP Option D None -ditto- -ditto- Composting & RDF -ditto-
MP Option Z
(Zero Option)
None None
(Status quo)
None
(Status quo)
None
(Status quo)
None
(Status quo)
4.13 Evaluation of the Master Plan Alternatives
The master plan alternatives developed in the previous section are evaluated by the following aspects:
Technical Aspects: The technical aspects are evaluated in terms of workability, stability and ease of
operation and maintenance (O&M) of the applied technology, and so forth. The past experiences in
Gujranwala and the surrounding cities should also be considered.
Environmental and Social Impact Aspects: The environmental and social impact aspects are
evaluated based on the result of the Environmental and Social Consideration Survey (E&S Survey).
The E&S Survey was carried out on the conditions that the expected locations for transfer stations
for waste collection and transportation, composting facilities and RDF plants are assumed. Details
of the environmental and social considerations are described in Chapter 5.
Economic and Financial Aspects: The rough scale of initial investment and O&M costs required for
each option are relatively judged for comparison. The detailed economic and financial evaluation
will be conducted only for the optimum master plan and presented in the next Section 4.14.
Institutional and Organizational Aspects: The vehicles additionally procured for the waste collection
and transportation, for example, necessitate additional human resources and sometimes creation of new
divisions or departments. Also, new or amended laws and regulations might be required for
enforcement of the introduction of the new system.
Table 4.13.1 shows the result of evaluation of each alternative and concludes that the Master Plan
Option B is the optimum master plan. The reasons this option is chosen are summarised as follows:
Technically speaking, by applying the waste separation at source, it will be easier to collect and
transport the waste, and promote intermediate treatment and 3R activities. In addition, the waste
disposal amount will be reduced and it will result in longer life of the final disposal site;
In terms of environmental and social consideration, the waste separation, and intermediate treatment
and 3R activities will bring a good impact on residents’ awareness and cooperation with proper
SWM in the community level. The reduction of landfill gas emission will also be expected in
accordance with the waste amount reduction;
The initial investment required for provision of new collection vehicles and construction of a new
landfill site is large; however, more economically efficient SWM services can be provided
compared to “Zero Option (MP Option Z)”;
The life cycle cost of construction of the final disposal site might be the cheapest; that is, this option
will be the most economically feasible because the cost of the construction is dominantly huge
amount in the total project cost; and

Project for Integrated Solid Waste Management
Master Plan in Gujranwala
Draft Final Report
Volume 1 Main Report
CTI Engineering International Co., Ltd. NJS Consultants Co., Ltd.
EX Research Institute Ltd.
229
Although introduction of waste separation at source and Composting & RDF requires
organizational strengthening and institutional arrangements additionally, these inputs are also
crucial to the other option and this is therefore not a serious disadvantage.


Project for Integrated Solid Waste Management
Master Plan in Gujranwala
Draft Final Report
Volume 1 Main Report
CTI Engineering International Co., Ltd.
NJS Consultants Co., Ltd.
EX Research Institute Ltd.
231
Table 4.13.1 Evaluation of the Master Plan Alternatives
Master Plan (MP) Options MP Option A MP Option B MP Option C MP Option D MP Option Z
(Zero Option)
Outline of
the Option
Separation at Source Done Done None None None
Collection &
Transportation Method
Door-to-door + Mini-compactor
(narrow street)
Small container + Compactor (wide street)
Door-to-door + Mini-compactor
(narrow street)
Small container + Compactor (wide street)
Door-to-door + Mini-compactor
(narrow street)
Small container + Compactor (wide street)
Door-to-door + Mini-compactor
(narrow street)
Small container + Compactor (wide street)
None (status quo)
Final Disposal Construction of a new final disposal site at
Bhakhraywali
Construction of a new final disposal site at
Bhakhraywali
Construction of a new final disposal site at
Bhakhraywali
Construction of a new final disposal site at
Bhakhraywali
None (status quo)
Intermediate
Treatment & 3R
None (status quo) Composting & RDF None (status quo) Composting & RDF None (status quo)
Environmental
Education & Public Awareness Raising
Environmental education & public awareness
raising activities
Environmental education & public awareness
raising activities
Environmental education & public awareness
raising activities
Environmental education & public awareness
raising activities
None (status quo)
Technical Aspects It is easier to collect and transport waste
because the waste is already separated.
Staff of GWMC supervises and monitors
the way of waste discharge, and it will
bring deterrence of scattering waste around
the container.
Reduction of waste disposal amount or
waste diversion is not expected.
It is easier to collect and transport waste
and apply intermediate treatment and 3R
promotion activities because the waste is
already separated.
Staff of GWMC supervises and monitors
the way of waste discharge, and it will
bring deterrence of scattering waste around
the container.
Reduction of waste disposal amount is
expected by implementation of the
intermediate treatment, and the lifetime of
final disposal facilities will therefore be
prolonged.
The stabilisation of landfill will be
promoted through diversion of organic waste by composting.
The same waste discharge method does not
necessarily require introduction of any
new waste collection and transportation
scheme. This may not cause any
improvement of scattered waste around the
container.
Reduction of waste disposal amount or
waste diversion is not expected.
The same waste discharge method does not
necessarily require introduction of any
new waste collection and transportation
scheme. This may not cause any
improvement of scattered waste around the
container.
No waste separation will make difficult to
implement intermediate treatment and 3R.
Reduction of waste disposal amount is
expected by implementation of the
intermediate treatment, and the lifetime of
final disposal facilities will therefore be
prolonged.
The stabilisation of landfill will be
promoted through diversion of organic waste by composting.
The present waste collection and
transportation services cannot cover the
jurisdictional area of Gujranwala and the
final disposal site at Gondlanwala will be
filled up in less than two years. Although
no technical difficulty can be seen, it will
not bring any improvement of the current
situation.
Reduction of waste disposal amount or
waste diversion is not expected and huge
land areas are filled with waste.
Open dumping landfill will cause
environmental degradation in the
surrounding area.
Environmental and Social Aspects Waste separation has good feature for
natural and social environment and results
in heightening public awareness especially
related to 3R activities although it requires
residents’ cooperation.
No Composting & RDF will lose
opportunity to utilisation of local resources
(organic waste), waste reduction, and
longer operation for the final disposal site.
The combination of waste separation with
no composting & RDF means that the
separated waste is not utilised and the
separation process does not make sense. It
may cause complains by the residents for
nullifying their contribution.
Waste separation has good feature for
natural and social environment and results
in heightening the public awareness
especially related to 3R activities although
it requires residents’ cooperation.
Composting & RDF has good feature for
environment, especially for utilisation of
local resource, waste reduction, and longer
operation of the Final Disposal Site.
The combination of waste separation with
Compost & RDF is valuable since it has a
process that the separated wastes are
utilised for composting/RDF easily, and
the total process effectively can work for
utilisation of local resource, waste
reduction and longer operation of the final
disposal site.
The waste amount reduction by Compost
& RDF will contribute to the reduction of
greenhouse effects through reduction of
generation amount of LFG (landfill gasses).
No separation will make it difficult to
implement 3R, and no waste reduction is
expected. This situation reveals negative
impact to environment and society, such as
more frequent garbage collection and more
generation of landfill gasses
No composting & RDF will lose
opportunity to utilisation of local resource
(organic waste), waste reduction, and
longer operation for the final disposal site.
The combination of no waste separation
without composting & RDF cannot expect
utilisation of local resource, reduction of
waste amount, and it will lose a chance for
saving natural resources and led to
environmental degradation.
No separation will make it difficult to
implement 3R, and no waste reduction is
expected. This situation reveals negative
impact to environment and society, such as
more frequent garbage collection and more
generation of landfill gasses.
Composting & RDF has good feature for
environment, especially for utilisation of
local resources, waste reduction, and
longer operation of the final disposal site.
Composting/RDF without separation
require time-energy consuming process in
selecting materials for recycling.
The waste amount reduction by Compost
& RDF will contribute to the reduction of
greenhouse effects through reduction of
generation amount of LFG.
It will result in negative impacts on the
society as described in scattered waste and
illegal dumping.
Without the Final Disposal site, open
dumping will continue and the situation
reveal environmental and social problems,
such as soil and water contamination, bad
scenery, and odour makes local residents’
life difficult.
The complaints of the residents will spread
in Gujranwala because of the
environmental and sanitation degradation
caused by uncollected waste scattering in
the daily life spaces.
Final disposal site become the source of
LFG which will influence to the global
warming.
Economic and Financial Aspects Although the initial investments on
facilities and equipment for the final
disposal and the collection and transport
are large, more economically efficient
SWM services can be provided.
Although the initial investments on
facilities and equipment for the final
disposal and the collection and transport
are large, more economically efficient
SWM services can be provided.
Although the initial investments on
facilities and equipment for the final
disposal and the collection and transport
are large, more economically efficient
SWM services can be provided.
Although the initial investments on
facilities and equipment for the final
disposal and the collection and transport
are large, more economically efficient
SWM services can be provided.
Due to the absence of new investments on
facilities and equipment for the final
disposal and collection and transport, the
SWM services remain inefficient.
The cost for providing SWM services will

Draft Final Report
Volume 1 Main Report
Project for Integrated Solid Waste Management
Master Plan in Gujranwala
232
CTI Engineering International Co., Ltd.
NJS Consultants Co., Ltd.
EX Research Institute Ltd.
Master Plan (MP) Options MP Option A MP Option B MP Option C MP Option D MP Option Z
(Zero Option)
The operation costs for the final disposal
and the collection and transport are
relatively low due to the separation at
source.
The benefits accrued from the material
recovery are less due to the absence of new
investments on the intermediate treatment
and 3R.
The longer life of the final disposal site
makes the life cycle cost of final disposal
decrease.
The operation cost for the final disposal
and the collection and transport are
relatively low due to the separation at
source.
The benefits accrued from the material
recovery through 3R activities will be
significantly increased.
The operation cost for the final disposal
and the collection and transport are
relatively high due to the absence of
separation at source.
The benefits accrued from the material
recovery are less due to the absence of new
investments on the intermediate treatment
and 3R.
The longer life of the final disposal site
makes the life cycle cost of final disposal
decrease.
The operation cost for the final disposal
and the collection and transport are
relatively high due to the absence of
separation at source.
The benefits accrued from the material
recovery through 3R activities will be
significantly increased.
be relatively high due to the huge amount
of illegal dumped wastes.
The operation cost for the final disposal
and the collection and transport are
relatively high due to the absence of
separation at source
The benefits accrued from the material
recovery are less due to the absence of new
investments on the intermediate treatment
and 3R.
Due to the absence of the public awareness
raising activities, citizen’s WTP will not be
improved, thereby making it difficult to
introduce the tariff system.
Institutional and Organizational
Aspects It is necessary to establish a by-law
including a provision on the separation at
source and enforcement.
Enhancement of waste separation at source
requires organizational strengthening
including establishment of a new
department and unit to deal with this new
system of the society.
Introduction of vehicle collection
necessitates capacity development on
preparation of collection routes and
vehicle management.
It is necessary to develop capacity on the
management of a sanitary landfill site.
Implementation of public awareness
raising and environmental education
requires establishment of a new unit
specifically in charge of its activities.
It is necessary to establish a by-law
including a provision on separation at
source and enforcement.
Enhancement of waste separation at source
requires organizational strengthening
including establishment of a new
department and unit to deal with this new
system of the society.
Introduction of vehicle collection
necessitates capacity development on
preparation of collection routes and
vehicle management.
It is necessary to develop capacity on the
management of a sanitary landfill site.
Even if the composting and RDF is
partially privatised, institutional
arrangements will be necessitated to some
extent to secure and develop the market of
composting material and products of RDF.
Implementation of public awareness
raising and environmental education
requires establishment of a new unit specifically in charge of its activities.
Introduction of vehicle collection
necessitates capacity development on the
preparation of collection routes and
vehicle management.
It is necessary to develop capacity on the
management of a sanitary landfill site.
Implementation of public awareness
raising and environmental education
requires establishment of a new unit to be
specifically in charge of its activities.
Introduction of vehicle collection
necessitates capacity development on the
preparation of collection routes and
vehicle management.
It is necessary to develop capacity on the management of a sanitary landfill site.
Even if the composting and RDF is
partially privatised, institutional
arrangements will be necessitated to some
extent to secure and develop the market of composting material and products of RDF.
Implementation of public awareness
raising and environmental education
requires establishment of a new unit
specifically in charge of its activities.
Without improvement of waste collection
& transportation and final disposal,
GWMC cannot fulfil its mandate and
objectives stipulated in the laws and
regulations.
Comprehensive Evaluation Introduction of the source separation
brings technical advantages especially for
waste collection and transportation
method. Additionally, it may also result in
positive impacts on heightening public
awareness and residents’ cooperation on
the ground.
However, the absence of intermediate
treatment and 3R promotion activities
lacks one of integral ingredients of ISWM
master plan as a whole.
Combination of waste separation at source,
and intermediate treatment and 3R
activities, such as promotion of
Composting & RDF, results in a wide
variety of advantages of not only technical
and environmental but also financial and
economic aspects.
As an ISWM master plan, concept of
intermediate treatment and 3R promotion
is indispensable, and side effects are
proactively expected like public awareness
raising on environment and more assertive
residents’ cooperation for introduction of
waste charges in future.
The life cycle cost of construction of the
final disposal site might be the cheapest;
that is, this option will be the most
economically feasible because the cost of
the construction is dominantly huge
amount in the total project cost.
This option is the most recommendable
alternative in this evaluation.
The absence of consideration of
intermediate treatment and 3R as well as
source separation has no positive impacts
on environment and society.
Without consideration of intermediate
treatment and 3R, the ISWM master plan is
incomplete.
Although intermediate treatment and 3R
activities are introduced, the absence of
source separation does not give any
advantage in terms of improvement of
waste collection and transportation
method, and public awareness
enhancement.
In this sense, this option is inferior to
Option B.
No action makes any improvement
although new investment is not required.

Project for Integrated Solid Waste Management
Master Plan in Gujranwala
Draft Final Report
Volume 1 Main Report
CTI Engineering International Co., Ltd.
NJS Consultants Co., Ltd. EX Research Institute Ltd.
233
4.14 Evaluation of the Optimum Master Plan
4.14.1 Technical Evaluation
Based on the detailed comparative study discussed in Section 4.4, the collection and transportation plan
in Option B does not include large-scale civil works unlike the final disposal sector. The proposed
collection and transportation system is to be a combination of use of mini-dumpers for narrow streets
and compactors for wide streets depending on the road width. Since private waste collectors have not
been operating in Gujranwala, these vehicles should be procured by GWMC through subsidy from the
local government and operated under the management of GWMC at the beginning. Therefore, the
system to be newly introduced in the city should be workable and sustainable under the local conditions,
accordingly. In this respect, it is judged that the proposed waste collection and transportation system
meets these requirements.
The only concern in terms of the new system of collection and haulage of waste is the commencement of
waste separation at source. Although it seems to be difficult to disseminate this new idea widely at the
grassroots level from the beginning, GWMC should take a strong leadership by supporting the local
government and provincial government organize and manage an environmental education programme
and public awareness heightening campaign. This is an integral part of the ISWM Master Plan and a key
of success of implementation of the Master Plan.
Promotion of 3R is also a key issue for ISWM. Considering the local condition of Gujranwala,
promotion of composting is the best option because composting does not require any special
mechanisation and huge investment. Moreover, a private company in Lahore has produced composting
material by using incoming waste to the final disposal site. Based on this experience and with
appropriate institutional arrangements including government support, composting plants will be
introduced depending on socio-economic circumstances such as income level, types of housing, and
location and volume of waste. RDF that is also operated in Lahore by private involvement will be
programmed after segregation of waste to provide the suitable waste for the plant in the late stage of the
Master Plan.
To minimise negative impacts on the environment, the present official disposal site in Gondlanwala
should be operated properly until the end of its life and the former disposal site in Chianwali should be
decommissioned in the right manner. Simultaneously, preparation for a new landfill site in
Bhakhraywali should be started while another new site will be additionally required in the long run. The
process of decision making and budget allocation is always delayed like EIA for example, and so the
earliest preparation and actions will be necessary at any rate.
4.14.2 Environmental and Social Impact Evaluation
Environmental and social considerations are carried out for Master Plan Option B. The detailed
evaluation is presented in Chapter 5, and the result of the evaluation is summarised that Option B has a
great combination of the processes involved in waste management and good features for natural and
social environment through Separate Collection, Composting and RDF.
4.14.3 Financial and Economic Evaluation
(1) Financial Evaluation
Objective (a)
The purpose of the financial evaluation is to ensure the long-term financial sustainability of the
implementation of the master plan, which implies the following:
Estimation of the project revenues and costs on the market price basis and their
implications in terms of cash flow;
Definition of the project financing structure as well as its financial viability; and
Verification of the sufficiency of the projected cash flow to ensure the adequate operation
of the SWM services.

Draft Final Report
Volume 1 Main Report
Project for Integrated Solid Waste Management
Master Plan in Gujranwala
234 CTI Engineering International Co., Ltd.
NJS Consultants Co., Ltd. EX Research Institute Ltd.
For the purpose of preparation of the application for funding, the financial evaluation is
necessary in order to provide the basis for the calculation of the funding gap of the selected
option of the master plan. The verification of the project financial sustainability implies a
cumulative positive cash flow for each year of the selected option.
Presumptions (b)
(i) Project Life
The period for the financial evaluation of the master plan is assumed to be 15 years from
2016 to 2030.
(ii) Prices
The prices employed for the financial evaluation are all market prices as of August 2015.
(iii) Cut-off Rate
The cut-off rate for the economic evaluation is 7.0 per cent*, being equivalent to the
reverse repo rate of the State Bank of Pakistan as of August 2015, which is also known as
the policy rate or the discount rate of Pakistan (Note:* Web Site for the State Bank of
Pakistan: http://www.sbp.org.pk).
Identification of Financial Costs (c)
(i) Investment Cost
The investment cost for the master plan on the financial price basis is estimated at Rs.
10,848 million for the period of 15 years from 2016 to 2030. The investment cost is
composed of a wide range of facilities and equipment required for the improvement of the
final disposal, the collection and transport system, the intermediate treatment and 3R, the
environmental education, the environmental monitoring and the strengthening of the
headquarter of GWMC. The detailed financial investment cost for the entire period of the
master plan is as shown in Table 4.14.1.
Table 4.14.1 Financial Investment Cost for the Master Plan
Year
Investment Cost (Rs. 1000)
Total Final Disposal
Collection and
Transport
Intermediate Treatment
and 3R
Environmental Education
Environmental Monitoring
GWMC’s Headquarters
2016 779,993 408,382 0 1,400 0 3,500 1,193,275
2017 592,741 247,600 0 0 0 3,500 843,841
2018 60,740 1.093,648 40,000 0 0 3,000 1,197, 883
2019 0 129,800 402,000 0 0 1,000 532,800
2020 0 144,020 0 0 0 500 144,520
2021 541,455 284,640 0 0 0 500 826,595
2022 552,755 263,940 0 625 0 500 817,820
2023 127,458 236,900 0 0 0 0 364,358
2024 300,000 266,420 0 0 0 0 566,420
2025 541,455 540,650 0 0 0 0 1,082,105
2026 552,755 384,460 0 0 0 1,000 938,215
2027 57,333 392,464 0 0 0 0 449,797
2028 0 706,180 4,000 625 0 0 710,805
2029 105,000 481,344 70,000 0 0 0 656,344
2030 0 523,084 0 0 0 1,000 524,084
Total 4,211,685 6,103,532 516,000 2,650 0 14,500 10,848,367

Project for Integrated Solid Waste Management
Master Plan in Gujranwala
Draft Final Report
Volume 1 Main Report
CTI Engineering International Co., Ltd.
NJS Consultants Co., Ltd. EX Research Institute Ltd.
235
(i) Operation and Maintenance Cost
The operation and maintenance cost for the master plan on the financial price basis is
estimated at Rs. 8,490 million for the period of 15 years from 2016 to 2030. The operation
and maintenance cost is composed of personnel costs, operating costs and maintenance
costs of a wide range of facilities and equipment required for the improvement of the final
disposal, the collection and transport system, the intermediate treatment and 3R, the
environmental education, the environmental monitoring and the strengthening of the
headquarter of GWMC. The detailed financial operation and maintenance cost for the
entire period of the master plan is as shown in Table F.4.4 in Volume 2, Supporting
Report, Section F: Economic and Financial Aspect.
(ii) Replacement Cost
The replacement cost for the master plan on the financial price basis is estimated at Rs.
1,158 million for the period of 15 years from 2016 to 2030. The replacement cost is
composed of the replacement of a wide range of facilities and equipment required for the
improvement of the final disposal, the collection and transport system, the intermediate
treatment and 3R, the environmental education, the environmental monitoring and the
strengthening of the headquarter of GWMC. The detailed financial replacement cost for the
entire period of the master plan is as shown in Table F.4.5 in Volume 2, Supporting
Report, Section F: Economic and Financial Aspect.
(iii) Total Project Cost
The total cost for the master plan on the financial price basis is estimated at Rs. 20,497
million for the period of 15 years from 2016 to 2030, summing up the investment cost, the
operation and maintenance cost and the replacement cost of all project components. The
contingencies for the project cost are separately added. The detailed total financial project
cost for the entire period of the master plan is as shown in Table 4.14.2.
Table 4.14.2 Total Financial Project Cost for the Master Plan
Year
Total Cost (Rs. 1000)
Total Final Disposal
Collection and
Transport
Intermediate Treatment
and 3R
Environmental Education
Environmental Monitoring
GWMC’s Headquarters
2016 798,662 587,925 0 4,254 435 14,289 1,405,565
2017 614,600 458,447 0 2,479 870 14,518 1,090,914
2018 92,363 1,429,249 40,000 2,637 1,290 18,745 1,584,284
2019 32,831 486,983 402,000 3,803 1,290 29,496 956,403
2020 31,547 523,915 39,239 5,574 1,290 18,999 620,563
2021 574,008 707,357 42,415 4,414 1,725 19,701 1,349,620
2022 586,392 677,101 43,376 7,982 2,160 36,001 1,353,012
2023 181,983 700,576 44,799 7,209 1,290 23,109 958,966
2024 343,786 813,258 45,866 8,383 1,290 24,604 1,237,188
2025 586,234 1,113,864 45,866 10,573 1,725 41,891 1,800,154
2026 598,521 1,064,312 45,866 11,376 2,160 30,420 1,752,655
2027 106,587 1,134,195 45,866 10,403 1,290 30,848 1,329,189
2028 50,431 1,487,082 49,866 11,949 1,725 49,592 1,650,646
2029 225,906 1,372,386 115,866 13,630 2,160 34,034 1,763,982
2030 58,710 1,464,140 63,886 17,744 1,290 38,198 1,643,967
Total 4,882,562 14,020,790 1,024,911 122,410 21,990 424,447 20,497,110

Draft Final Report
Volume 1 Main Report
Project for Integrated Solid Waste Management
Master Plan in Gujranwala
236 CTI Engineering International Co., Ltd.
NJS Consultants Co., Ltd. EX Research Institute Ltd.
Identification of Financial Benefits (d)
The financial project benefits of the master plan are calculated based on the market prices as of
August 2015. The benefit accrued from the methane gas reduction is excluded from the
financial project benefits, since the benefit cannot actually be converted into real monetary
values. Other unquantifiable benefits are also excluded from the financial project benefits.
The total benefit of the master plan on the financial price basis is estimated at Rs. 25,139
million for the period of 15 years from 2016 to 2030, summing up a wide range of the
economic benefits, social benefits and environmental benefits. The detailed total financial
benefits for the entire period of the master plan are as shown in Table F.4.7 in Volume 2,
Supporting Report, Section F: Economic and Financial Aspect.
The following factors are taken into account when the benefits are calculated.
The monetary-based benefit on the market price accrued from the total saved cost for the
final disposal is based on the unit saved waste disposal cost as well as the related cost of
Rs. 625.7 per ton.
The above unit saved waste disposal cost as well as the related cost is estimated by the
calculation based on the 5-percent increase of the unit cost of Rs. 595.9 with the master
plan.
The unit waste disposal cost of Rs. 595.9 in case of the implementation of the master plan
is calculated based on the following formula:
Unit Waste Disposal Cost in case of Implementation of Master Plan = Total Disposal
and Related Cost for Entire Period of Master Plan (2016-2030) / Total Disposed
Amount of Waste for Entire Period of Master Plan (2016-2030)
The 5-percent increase of the unit waste disposal cost of Rs. 595.9 with the master plan is
accrued from the inefficient waste management through illegal dumping of uncollected
wastes under the absence of the implementation of the master plan. This inefficient waste
management is caused by the scattered collection points as well as the increase in the
collection frequency in association with the ado-hoc collection of wastes due mainly to
the said illegal dumping without the master plan. The said 5-percent increase is estimated
by the final disposal expert of the study team based on the collection inefficiency and the
collection routes under the absence of the implementation of the master plan.
The monetary-based benefit on the market price accrued from the total saved cost for the
collection and transport is based on the unit saved cost for the collection and transport of
Rs. 1,354.7 per ton.
The above unit saved waste collection and transport cost is estimated by the calculation
based on the 5-percent increase of the unit cost of Rs. 1,290.2 with the master plan.
The unit waste collection and transport cost of Rs. 1,290.2 in case of the implementation
of the master plan is calculated based on the following formula:
Unit Waste Collection and Transport Cost in case of Implementation of Master Plan
= Total Collection and Transport Cost for Entire Period of Master Plan (2016-2030)
/ Total Collection and Transport Amount of Wastes for Entire Period of Master Plan
(2016-2030)
The 5-percent increase of the unit waste collection and transport cost of Rs. 1,290.2 with
the master plan is accrued from the inefficient waste management through illegal
dumping of uncollected wastes under the absence of the implementation of the master
plan. This inefficient waste management is caused by the scattered collection points as
well as the increase in the collection frequency in association with the ado-hoc collection
of wastes due mainly to the said illegal dumping without the master plan. The said

Project for Integrated Solid Waste Management
Master Plan in Gujranwala
Draft Final Report
Volume 1 Main Report
CTI Engineering International Co., Ltd.
NJS Consultants Co., Ltd. EX Research Institute Ltd.
237
5-percent increase is estimated by the collection and transport expert of the study team
based on the collection inefficiency and the collection routes under the absence of the
implementation of the master plan.
The monetary-based benefit accrued from the recycling is based on the condition that the
unit cost per recovered material, the unit cost per compost product, and the unit cost per
combustible waste is Rs. 27.38 per kg, Rs. 5.00 per kg, and Rs. 52.50 per ton,
respectively.
The unit cost of Rs. 27.38 per kg per recovered material is estimated by the latest
weighted average of market prices of various recovered materials in Gujranwala, which is
tabulated in Table 4.14.3.
Table 4.14.3 Estimated Weighted Average of Selling Prices of Various Recyclables
Recyclables
Average Unit
Selling Prices
(Rs./kg)
Percentage of
Each Recyclable
(%)
Weighted Average of
Selling Prices of
Recyclables (Rs./Kg)
Cardboard 8.0 26.0 2.08
Paper (Others) 8.0 8.0 0.64
Plastic 23.0 13.0 2.99
Plastic (Others) 12.0 15.0 1.80
Metal (Others) 62.0 29.0 17.98
Metal (Steel) 30.0 6.0 1.80
Glass 3.0 3.0 0.09
Total - 100.0 27.38
Source: Field Survey in Gujranwala, August 2015
The unit cost of Rs. 5.00 per kg per compost product is estimated by the latest market
price in August 2015, which is based on the information collected from the compost plant
in Lahore.
The unit cost of Rs. 52.50 per ton per RDF product is estimated by the latest market price
in August 2015, which is based on the information collected from the RDF plant in
Lahore.
The social benefit accrued from the willingness to pay is based on the condition that the
willingness to pay for SWM services in low-income areas, middle-income areas, and
high-income areas is Rs. 25 per month per household, Rs. 50 per month per household,
and Rs. 100 per month per household, respectively.
Cases of Evaluation (e)
The timing of the introduction of the tariff system and the involvement of the private sector
through outsourcing are major variations to affect the financial viability of the master plan.
The following 3 cases including the base case (Case A) together with 2 variations are the cases
of the financial evaluation in the master plan.
Case A: Base Case of Master Plan
Case B: Based on the current level of users’ willingness to pay, the tariff system will be
introduced from 2019 at the early stage of the master plan.
Case C: Outsourcing to the private sector (service contract of the collection and transport)
will be introduced from 2025 based on the basic organizational and institutional setting
up of the master plan.

Draft Final Report
Volume 1 Main Report
Project for Integrated Solid Waste Management
Master Plan in Gujranwala
238 CTI Engineering International Co., Ltd.
NJS Consultants Co., Ltd. EX Research Institute Ltd.
Results of Financial Evaluation (f)
(i) FIRR and NPV
The results of the calculations of financial internal rate of return (FIRR) and net present
value (NPV) for 3 cases for the financial evaluation are as per Table F.4.9 in Volume 2,
Supporting Report, Section F: Economic and Financial Aspect., and the major findings
are as below. The detailed cost and benefit streams for the financial evaluation of the base
case of the master plan are as shown in Table F.4.10 in Volume 2, Supporting Report,
Section F: Economic and Financial Aspect.
For Case A, the base case of the master plan, in which the full-scale tariff system will
be introduced in all areas from 2025 and the outsourcing to the private sector will not
be carried out, the FIRR and the NPV are estimated at 9.18 per cent and Rs. 1,022
million, respectively.
For Case B in which the full-scale tariff system will be introduced from 2019 at the
early stage of the master plan from and the outsourcing to the private sector will not be
carried out, the FIRR and the NPV are estimated at 9.65 per cent and Rs. 1,123 million,
respectively.
For Case C in which the full-scale tariff system will be introduced in all areas from
2025 and the outsourcing to the private sector will be carried out from 2025, the FIRR
and the NPV are estimated at 10.42 per cent and Rs. 1,502 million, respectively.
(ii) Sensitivity Analysis
Table 4.14.4 indicates the results of the financial evaluation together with the assumptions
for risk factors of each option applied for the sensitivity analysis to measure the impacts
caused by 10 per cent increase in costs and 10 per cent decrease in benefits.
Since the initial investment, especially the investment on the final disposal component, is
large at the early stage of the master plan, the project is vulnerable to the both the increase
of costs and the decrease of benefits in all cases. Especially, when the cost increase and the
benefit decrease simultaneously hit the project, all the FIRRs for Case A, Case B and
Case C will sharply fall to the negative figures which are all below the cut-off rate.
Table 4.14.4 Results of Financial Evaluation and Sensitivity Analysis
Case Case No. Scenario FIRR
(Per cent)
Base Case
A-1 No Risk Factor 9.18
A-2 Cost 10 % increase 4.72
A-3 Benefit 10% decrease 4.23
A-4 Cost 10% increase and benefit 10% decrease -0.74
Introduction of
Full-scale Tariff
System from 2019
B-1 No Risk Factor 9.65
B-2 Cost 10 % increase 4.88
B-3 Benefit 10% decrease 4.35
B-4 Cost 10% increase and benefit 10% decrease -1.06
Private Sector
Involvement from
2025
C-1 No Risk Factor 10.42
C-2 Cost 10 % increase 6.33
C-3 Benefit 10% decrease 5.89
C-4 Cost 10% increase and benefit 10% decrease 1.50

Project for Integrated Solid Waste Management
Master Plan in Gujranwala
Draft Final Report
Volume 1 Main Report
CTI Engineering International Co., Ltd.
NJS Consultants Co., Ltd. EX Research Institute Ltd.
239
(2) Tariff Review
Objective and Scenarios (a)
The purpose of the tariff review is to provide the additional financial evaluation for verifying
an optimum level of the tariff for SWM services, thereby achieving the long-term financial
sustainability of the master plan.
There are mainly three (3) scenarios for the cost recovery of SWM projects in accordance with
the scope of the cost coverage including the capital investment cost, operation and
maintenance cost and replacement cost.
Scenario 1: The operation and maintenance cost will be covered by the total revenue.
Scenario 2: The operation and maintenance cost plus the depreciations for replacement of
existing facilities will be covered by the total revenue.
Scenario 3: The operating cost and maintenance cost plus the depreciations for
replacement of existing facilities and part of new investment will be covered by the total
revenue.
Scenario 1 is the most realistic scenario for the tariff review, taking into account the expected
cost coverage based on the current willingness to pay for SWM services.
Cases of Evaluation (b)
The cases of the tariff review analysis are the following 4 cases to be assumed based on the
variations of 2 variables: i) the collection efficiency of the tariff; and ii) the timing for the
full-scale introduction of the tariff system, and their combinations as tabulated in Table 4.14.5
with the following descriptions.
Table 4.14.5 Cases of Evaluation for Tariff Review Analysis
Case
Willingness to Pay (Rs. per month per household)
Collection Efficiency (Per cent)
Full-scale Tariff Introduction Timing
Low Medium High Low Medium High 2022 2025
Case 1 25 50 100 50.0 60.0 70.0 X
Case 2 25 50 100 60.0 70.0 80.0 X
Case 3 25 50 100 50.0 60.0 70.0 X
Case 4 25 50 100 60.0 70.0 80.0 X
Results of Tariff Review (c)
(i) Cost Recovery Rate
The results of the analysis on the cost recovery for the above 4 cases are tabulated in Table
F.4.13 to Table F.4.16 in Volume 2, Supporting Report, Section F: Economic and
Financial Aspect, and the major findings are as follows:
For Case 1, in which the collection efficiency of the tariff is relatively lower and the
full-scale introduction of the tariff system in all areas will start from 2025 in the first
year of the long-term period, the cost recovery rate against the full recovery of the
operation and maintenance cost is estimated at 32.4 per cent.
For Case 2, in which the collection efficiency of the tariff is relatively higher and the
full-scale introduction of the tariff system in all areas will start from 2025 in the first
year of the long-term period, the cost recovery rate against the full recovery of the
operation and maintenance cost is estimated at 37.9 per cent.
For Case 3, in which the collection efficiency of the tariff is relatively lower and the
full-scale introduction of the tariff system in all areas will start from 2022 in the fourth

Draft Final Report
Volume 1 Main Report
Project for Integrated Solid Waste Management
Master Plan in Gujranwala
240 CTI Engineering International Co., Ltd.
NJS Consultants Co., Ltd. EX Research Institute Ltd.
year of the mid-term period, the cost recovery rate against the full recovery of the
operation and maintenance cost is estimated at 35.8 per cent.
For Case 4, in which the collection efficiency of the tariff is relatively higher and the
full-scale introduction of the tariff system in all areas will start from 2022 in the fourth
year of the mid-term period, the cost recovery rate against the full recovery of the
operation and maintenance cost is estimated at 42.0 per cent.
(ii) Required Tariff Level for Full Cost Recovery
Since it is obvious that the cost recovery rate is 32.4 per cent out of the total operation and
maintenance cost in 2025 even after the introduction of the tariff system which is in line
with the current willingness to pay, the remaining balance should be replenished by other
stable financial sources and/or subsidies from the provincial government. In this section,
the required tariff level for the full coverage of the total operation and maintenance cost by
the tariff alone will be estimated for all 4 cases. Table 4.14.6 tabulates the required tariff
level for the full recovery of the operation and maintenance cost at the commencement of
the introduction of the tariff system.
Taking an example of Case 1, the required monthly tariff level for the full recovery of the
operation and maintenance cost is estimated at Rs. 77.2 per month per household in
low-income areas, Rs. 154.4 per month per household in middle-income areas, Rs. 308.8
per month per household in high-income areas, respectively. The said tariff level in case of
low-income areas is 3.09 times as much as the assumed level of the tariff of Rs. 25.0 based
on the social study.
Table 4.14.6 Required Tariff Level for Full Recovery of Operation and Maintenance Cost at
Commencement of Full-scale Tariff System
Case Area
Generated Revenue at Commencement of
Tariff System (Rs.1000)
Required Revenue for Full Recovery of Operation and Maintenance Cost at
Commencement of Tariff System (Rs.1000)
Required Tariff for Full Recovery of Operation and Maintenance Cost at Commencement of Full-scale Tariff
System (Rs. per month per household)
Case 1
Low 58,035 179,211 77.2
Middle 110,383 340,860 154.4
High 36,431 112,499 308.8
Total 204,849 632,569 Not Applicable (n.a.)
Case 2
Low 69,642 183,512 58.9
Middle 128,780 339,345 117.8
High 41,636 109,713 235.7
Total 240,058 632,569 n.a.
Case 3
Low 51,906 144,903 62.4
Middle 98,727 275,607 124.8
High 32,584 90,962 249.7
Total 183,217 511,472 n.a.
Case 4
Low 77,864 148,380 47.6
Middle 143,984 274,382 95.3
High 46,551 88,710 190.6
Total 268,399 511,472 n.a.

Project for Integrated Solid Waste Management
Master Plan in Gujranwala
Draft Final Report
Volume 1 Main Report
CTI Engineering International Co., Ltd.
NJS Consultants Co., Ltd. EX Research Institute Ltd.
241
(3) Economic Evaluation
Objective (a)
The purpose of the economic evaluation is to ensure that the project has a positive net
contribution to the improvement in welfare and SWM services in Gujranwala, thereby being
worth to be financed. Economic efficiency is a fundamental criterion for the public investment
on the SWM sector, which means that benefits must outweigh costs of using scarce resources.
The benefits in the cost-benefit analysis should be converted to monetary values. Total
benefits are calculated based on three sub-groups: economic, social and environmental
benefits.
Presumptions (b)
(i) Project Life
The period for the economic evaluation of the master plan is assumed to be 15 years from
2016 to 2030.
(ii) Prices
Taxes, Customs duties, government subsidies, etc., are not inherent cost items incurred in
the project. These transfer items should be excluded from the project cost. The project cost
is estimated by the prices as of August 2015. The inflationary cost elements incurred during
the construction period should be excluded, since these are external factors for the project.
(iii) Cut-off Rate
The cut-off rate for the economic evaluation is 7.0 per cent, being equivalent to the reverse
repo rate of the State Bank of Pakistan as of August 2015, which is also known as the policy
rate or the discount rate of Pakistan.
(iv) Standard Conversion Factor
The local currency portion for facilities and equipment related to the project should be
converted into economic prices by applying the standard conversion factor, because this
portion is usually evaluated within Pakistan and the prices are distorted due to the
inefficient markets. Consequently, they do not reflect international market prices. In this
master plan, the standard conversion factor employed is 0.904.
(v) Opportunity Cost of Unskilled Labour
The skilled labour cost is considered to reflect the market price. However, the unskilled
labour cost is not considered to reflect the market price because of the lack of liquidity of
workers which is the surplus of workers caused by the rate of unemployment or potential
unemployment in Pakistan. The unskilled labour cost is necessary to be revised by the
opportunity cost. Hence, the opportunity cost of the unskilled labour is assumed to be 0.750
of the financial price as the conversion factor by taking into account the unemployment rate
of Pakistan.
(vi) Physical Contingency
The physical contingency is calculated as 10 per cent of the relevant construction cost of
the final disposal site including civil works and facilities.
Identification of Economic Costs (c)
The economic costs are estimated based on the financial costs required for extending the
improved SWM services in the master plan. The economic costs consist of all resources
required to put in place and maintain SWM services in the selected master plan as well as other

Draft Final Report
Volume 1 Main Report
Project for Integrated Solid Waste Management
Master Plan in Gujranwala
242 CTI Engineering International Co., Ltd.
NJS Consultants Co., Ltd. EX Research Institute Ltd.
costs that result from the implementation of the master plan. These costs include investment
cost, operation and maintenance costs, and replacement costs.
(i) Investment Cost
The investment cost for the master plan on the economic price basis is estimated at
Rs. 8,417 million for the period of 15 years from 2016 to 2030. The investment cost is
composed of a wide range of facilities and equipment required for the improvement of the
final disposal, the collection and transport system, the intermediate treatment and 3R, the
environmental education, the environmental monitoring and the strengthening of the
headquarters (HQ) of GWMC. The detailed investment cost for the entire period of the
master plan is as shown in Table 4.14.7.
Table 4.14.7 Economic Investment Cost for the Master Plan
Year
Investment Cost (Rs. 1000)
Total Final Disposal
Collection and
Transport
Intermediate Treatment and
3R
Environmental Education
Environmental Monitoring
GWMC’s HQ
2016 605,245 313,229 0 1,109 0 2,685 922,267
2017 463,253 189,909 0 0 0 2,685 650,477
2018 46,588 838,828 30,680 0 0 2,301 918,397
2019 0 99,557 340,954 0 0 767 441,278
2020 0 110,463 0 0 0 384 110,847
2021 415,296 218,319 0 0 0 384 633,998
2022 423,963 202,442 0 479 0 384 627,268
2023 113,139 181,702 0 0 0 0 294,841
2024 230,100 204,344 0 0 0 0 434,444
2025 415,296 414,679 0 0 0 0 829,974
2026 423,963 294,881 0 0 0 767 719,611
2027 43,975 301,020 0 0 0 0 344,995
2028 0 541,640 3,068 479 0 0 545,187
2029 103,835 369,191 63,476 0 0 0 536,502
2030 0 401,205 0 0 0 767 401,972
Total 3,284,651 4,681,409 438,178 2,068 0 11,122 8,417,427
(ii) Operation and Maintenance Cost
The operation and maintenance cost for the master plan on the economic price basis is
estimated at Rs. 6,588 million for the period of 15 years from 2016 to 2030. The operation
and maintenance cost is composed of personnel costs, operating costs and maintenance
costs of a wide range of facilities and equipment required for the improvement of the final
disposal, the collection and transport system, the intermediate treatment and 3R, the
environmental education, the environmental monitoring and the strengthening of the
headquarter of GWMC. The detailed operation and maintenance cost for the entire period
of the master plan is as shown in Table F.4.18 in Volume 2, Supporting Report, Section
F: Economic and Financial Aspect.
(iii) Replacement Cost
The replacement cost for the master plan on the economic price basis is estimated at Rs.
907 million for the period of 15 years from 2016 to 2030. The replacement cost is
composed of the replacement of a wide range of facilities and equipment required for the
improvement of the final disposal, the collection and transport system, the intermediate
treatment and 3R, the environmental education, the environmental monitoring and the
strengthening of the headquarter of GWMC. The detailed replacement cost plan for the

Project for Integrated Solid Waste Management
Master Plan in Gujranwala
Draft Final Report
Volume 1 Main Report
CTI Engineering International Co., Ltd.
NJS Consultants Co., Ltd. EX Research Institute Ltd.
243
entire period of the master plan is as shown in Table F.4.19 in Volume 2, Supporting
Report, Section F: Economic and Financial Aspect.
(iv) Total Project Cost
The total cost for the master plan on the economic price basis is estimated at
Rs. 15,913 million for the period of 15 years from 2016 to 2030, summing up the
investment cost, the operation and maintenance cost, and the replacement cost of all project
components. The contingencies for the project cost are also included. The detailed total
economic project cost for the entire period of the master plan is as shown in Table 4.14.8.
Table 4.14.8 Total Economic Project Cost for the Master Plan
Year
Total Cost (Rs. 1000)
Total Final Disposal
Collection and
Transport
Intermediate Treatment and
3R
Environmental Education
Environmental Monitoring
GWMC’s HQ
2016 620,561 449,761 0 3,508 334 12,050 1,086,213
2017 481,017 350,238 0 2,130 667 13,403 847,455
2018 72,340 1,093,913 30,680 2,269 989 17,743 1,217,934
2019 26,679 370,841 340,954 3,181 989 26,349 768,992
2020 25,694 399,021 30,814 4,557 989 18,610 479,685
2021 441,762 539,483 33,434 3,691 1,323 19,495 1,039,188
2022 451,260 516,350 34,192 6,763 1,657 32,375 1,042,598
2023 160,301 534,180 35,335 6,219 989 22,837 759,861
2024 265,573 620,410 36,216 7,168 989 24,337 954,693
2025 451,531 850,764 36,216 8,896 1,323 37,950 1,386,680
2026 460,954 812,555 36,216 9,605 1,657 29,778 1,350,765
2027 83,641 865,915 36,216 8,890 989 30,573 1,026,225
2028 40,570 1,136,324 39,284 10,198 1,323 45,456 1,273,154
2029 213,837 1,048,048 99,692 11,867 1,657 34,034 1,409,135
2030 47,506 1,118,103 50,378 15,426 989 37,965 1,270,368
Total 3,843,226 10,705,905 839,626 104,368 16,866 402,955 15,912,947
Identification of Economic Benefits (d)
(i) Economic Benefits
The economic benefits which will be converted to the monetary values would include the
following three (3) categories of benefits.
Saving in Disposal Costs of Wastes: Waste disposal costs can be significantly
reduced by introducing more efficient disposal and segregating wastes in the master
plan. The unit saved cost per ton to dispose wastes is estimated at Rs. 625.7 per ton of
wastes on the financial price basis. The said unit cost is applied to the waste amount to
be disposed of each project year.
Saving in Collection and Transport Costs of Wastes: Waste collection and transport
costs can be significantly reduced by introducing more efficient collection and
transport in the master plan. The unit saved cost per ton to collect and transport wastes
is estimated at Rs. 1,354.7 per ton of wastes on the financial price basis. The said unit
cost is applied to the waste amount to be disposed of each project year.
Saving through Resource Cost Recovery: Cost savings can be also achieved through
various types of resource cost recovery which enables waste generators to recover
monetary values by selling them in the markets. When reusing reclaimed materials on
site, purchase costs of new materials avoided can become economic benefits to the
project. The resource cost recovery includes a wide range of the material recovery, the
biodegradable waste recovery and the combustible waste recovery. The average

Draft Final Report
Volume 1 Main Report
Project for Integrated Solid Waste Management
Master Plan in Gujranwala
244 CTI Engineering International Co., Ltd.
NJS Consultants Co., Ltd. EX Research Institute Ltd.
values employed for the economic evaluation of the material recovery, the
biodegradable waste recovery, and the combustible waste recovery are estimated at
Rs. 27.38 per kg, Rs. 5.0 per kg, and Rs. 52.5 per ton, respectively.
(ii) Social Benefits
The social acceptance of a SWM project is generally expressed in the form of users’
Willingness to Pay (WTP) for the improvement of SWM services. This is the so-called
demand side of the project benefit. In the cost-benefit analysis of the SWM sector, the WTP
can be included in the financial and economic benefits only after the said WTP can be
converted to real waste collection charges as monetary values under the tariff system.
Although Contingent Valuation Method (CVM) is one of the methodologies which enable
to convert beneficiaries’ WTP to monetary values of environmental benefits, there is
uncertainty that the results of the CVM represent the accurate monetary values of a SWM
project. Therefore, the WTP in the financial and economic evaluation of the master plan
will not be employed as monetary values unless the official tariff system is introduced from
2022. The social study in this project revealed that the average WTP is approximately
Rs. 25 per month per household in low-income areas, Rs. 50 per month per household in
middle-income areas, and Rs. 100 per month per household in high-income areas.
(iii) Environmental Benefits
Although it is rather difficult to convert to monetary values, the benefits in the master plan
would also include the environmental benefits derived from the reduction of
GHG (Greenhouse Gas) emissions. The said environmental benefits can be converted to
the theoretical monetary values by using the carbon price in the international market under
CDM (Clean Development Mechanism).
Carbon credits under CDM provide an opportunity for an extra source of revenue for SWM
projects in developing countries. The main idea is that developed countries will pay for
projects in developing countries that contribute to the reduction of GHG emissions. Given
that solid waste is a significant source of pollution such as emissions of methane gas by
anaerobic degradation, carbon finance represents a good opportunity for SWM projects in
developing countries. Actually, methane gas is the most critical GHG emission to air from
landfills.
However, carbon credits are difficult to originate due to all the stringent requirements and
long scrutiny processes that the project has to go through. Therefore, it would not be
realistic to assume that the project is certain to receive an income from carbon credits. For
this reason, this analysis will not present scenarios including revenues from carbon credits
as financial values in the financial evaluation, while the theoretical economic values based
on the current carbon price can be counted in the economic evaluation.
The environmental benefits of the reduced methane gas, one of major GHG emissions
should be incorporated into the calculation of environmental benefits in the economic
evaluation, which can be traced from the avoidance of methane gas through the
construction of the well-controlled landfill site as well as the abolishment of the current
badly-managed landfill site based on the following concepts.
A sanitary landfill with a combination of liners, leak detection and leachate collection
systems would significantly decrease the amount of methane gas. On the other hand, the
current uncontrolled open dumping of wastes releases much methane gas into the
environment. Therefore, switching from an open dumping and an ill-managed landfill site
to a well-controlled landfill site will significantly reduce the methane gas emission.
The benefits accrued from the reduction of methane gas emissions can be included in the
economic analysis alone by applying theoretical monetary values of carbons. The unit
economic value of methane gas reduction per ton is estimated at Rs. 7,565.3 based on the

Project for Integrated Solid Waste Management
Master Plan in Gujranwala
Draft Final Report
Volume 1 Main Report
CTI Engineering International Co., Ltd.
NJS Consultants Co., Ltd. EX Research Institute Ltd.
245
recent record-low unit carbon price of €2.75 per ton, which was traded in April 2013 in the
international market.
The calculation formula for estimating the unit economic value of methane gas reduction
per ton is as follows:
Unit Economic Value of Methane Gas Reduction Rs. 7,565.3 =
Applied Unit Carbon Price of €2.75 x× Exchange Rate 110.04 of Euro to Pakistan Rupee in
August 2015 × Global Warming Potential of 25.0
Methane generation amount in anaerobic landfill waste is estimated as shown in Section
4.6.3 (4) (c) and Table F.4.25 in Volume 2, Supporting Report, Section F: Economic and
Financial Aspect. The sanitary landfill site planned in the master plan will significantly
reduce the methane generation amount of 38.1 kg CH4 per ton-waste by 50 per cent, which
leads to the sizable environmental benefit.
The benefits accrued from the reduction of methane gas emissions can be included in the
economic analysis alone by applying theoretical monetary values of carbons. The unit
economic value of methane gas reduction per ton is estimated at Rs. 6,354.8 based on the
recent record-low unit carbon price of €2.75 per ton in the international market.
Methane generation amount in anaerobic landfill waste is estimated as shown in Table
F.4.21 in Volume 2, Supporting Report, Section F: Economic and Financial Aspect. The
sanitary landfill site planned in the master plan will significantly reduce the methane
generation amount of 38.1 kg-CH4 per ton-waste by 50 per cent, which leads to the sizable
environmental benefit.
(iv) Unquantifiable Benefits
The economic evaluation on a SWM project generally identifies and quantifies relevant
benefits by using appropriate measurement and valuation methods. Although it is relatively
difficult to convert them into monetary values, the project benefits accrued from the master
plan would also include the following unquantifiable social and environmental benefits.
It is widely recognised that the inclusion of these unquantifiable benefits contributes to the
indicators of the economic evaluation which frequently underestimates potential positive
impacts of a SWM project. Although there are a handful of unquantifiable benefits which
might be regarded as rather difficult to be converted into monetary values, it is extremely
important to identify and describe the following unquantifiable benefits accrued from the
implementation of the master plan.
Direct Benefits Related to Health Improvement
Indirect Benefits Related to Health Improvement
Increase in Land Value
(v) Total Benefits
The total benefit for the master plan on the economic price basis is estimated at
Rs. 20,232 million for the period of 15 years from 2016 to 2030, summing up a wide range
of the economic, social and environmental benefits. The detailed total economic benefits
for the entire period of the master plan are as per Table F.4.21 in Volume 2, Supporting
Report, Section F: Economic and Financial Aspect.
Cases of Evaluation (e)
The timing of the introduction of the tariff system and the involvement of the private sector
through outsourcing are major variations to affect the economic viability of the master plan.
The following three (3) cases including the base case (Case A) together with two (2) variations
are the cases of the economic evaluation in the master plan.

Draft Final Report
Volume 1 Main Report
Project for Integrated Solid Waste Management
Master Plan in Gujranwala
246 CTI Engineering International Co., Ltd.
NJS Consultants Co., Ltd. EX Research Institute Ltd.
Case A: Base Case of Master Plan
Case B: Based on the current level of users’ willingness to pay, the tariff system will be
introduced from 2019 at the early stage of the master plan.
Case C: Outsourcing to the private sector (service contract of the collection and transport)
will be introduced from 2025 based on the basic organizational and institutional setting
up of the master plan.
Results of Economic Evaluation (f)
(i) EIRR and NPV
The results of the calculations of economic internal rate of return (EIRR) and net present
value (NPV) for 3 cases for the economic evaluation are as per Table F.4.23 in Volume 2,
Supporting Report, Section F: Economic and Financial Aspect, and the major findings
are as below. The detailed cost and benefit streams for the economic evaluation of the base
case of the master plan are as shown in Table F.4.24 in Volume 2, Supporting Report,
Section F: Economic and Financial Aspect.
For Case A, the base case of the master plan, in which the full-scale tariff system will
be introduced in all areas from 2025 and the outsourcing to the private sector will not
be carried out, the EIRR and the NPV are estimated at 10.88 per cent and
Rs. 1,257 million, respectively.
For Case B in which the full-scale tariff system will be introduced in all areas at the
early stage of the master plan from 2019 and the outsourcing to the private sector will
not be carried out, the EIRR and the NPV are estimated at 11.36 per cent and
Rs. 1,312 million, respectively.
For Case C in which the full-scale tariff system will be introduced in all areas from
2025 and the outsourcing to the private sector will be carried out from 2025, the EIRR
and the NPV are estimated at 11.79 per cent and Rs. 1,561 million, respectively.
(ii) Sensitivity Analysis
Table 4.14.9 indicates the results of the economic evaluation together with the assumptions
for risk factors of each option applied for the sensitivity analysis to measure the impacts
caused by 10 per cent increase in costs and 10 per cent decrease in benefits.
Since the initial investment, especially the investment on the final disposal component, is
large at the early stage of the master plan, the project is vulnerable to the both the increase
of costs and the decrease of benefits in all cases. Especially, when the cost increase and the
benefit decrease simultaneously hit the project, all the EIRRs for Case A, Case B and
Case C will sharply fall to the figures close to zero which are all below the cut-off rate.

Project for Integrated Solid Waste Management
Master Plan in Gujranwala
Draft Final Report
Volume 1 Main Report
CTI Engineering International Co., Ltd.
NJS Consultants Co., Ltd. EX Research Institute Ltd.
247
Table 4.14.9 Results of Economic Evaluation and Sensitivity Analysis
Case Case No. Scenario EIRR
(Per cent)
Base Case A-1 Base Case 10.88
A-2 Cost 10 % increase 6.50
A-3 Benefit 10% decrease 6.03
A-4 Cost 10% increase and benefit 10%
decrease
1.24
Introduction of Full-scale
Tariff System from 2019
B-1 Base Case 11.36
B-2 Cost 10 % increase 6.69
B-3 Benefit 10% decrease 6.17
B-4 Cost 10% increase and benefit 10%
decrease
0.98
Private Sector
Involvement from 2025
C-1 Base Case 11.79
C-2 Cost 10 % increase 7.71
C-3 Benefit 10% decrease 7.26
C-4 Cost 10% increase and benefit 10%
decrease 2.92
Conclusion (g)
For Case A-1, although the net economic benefit would be negative during the period from
2016 to 2018, immediately after the full-scale operation of the new landfill site, the net
economic benefit would be positive. The total net economic benefit is estimated at
Rs. 4,052 million. While the EIRR for Case A-1 is calculated at 10.88 per cent which is
slightly over the cut-off rate of 7.0 per cent, the NPV for Case A-1 is estimated at
Rs. 1,257 million. The result proved that the implementation of the master plan is
economically feasible.
For Case B-1, although the net economic benefit would be negative during the period from
2016 to 2018, immediately after the full-scale operation of the new landfill site, the net
economic benefit would be positive. The total net financial benefit is estimated at
Rs. 3,928 million. While the FIRR for Case B-1 is calculated at 11.36 per cent which is
significantly over the cut-off rate of 7.0 per cent, the NPV for Case B-1 is estimated at
Rs. 1,311 million. The result proved that the implementation of the master plan, if the tariff
system would be introduced at the early stage of the master plan from 2019, the economic
feasibility would be more favourable than the Case A-1.
For Case C-1, although the net economic benefit would be negative during the period from
2016 to 2018, immediately after the full-scale operation of the new landfill site, the net
economic benefit would be positive. The total net financial benefit is estimated at
Rs. 4,382 million. While the FIRR for Case C-1 is calculated at 11.33 per cent which is
slightly over the cut-off rate of 7.0 per cent, the NPV for Case C-1 is estimated at
Rs. 1,016 million. The result proved that the implementation of the master plan, if the private
sector involvement would be started from 2025, the economic feasibility would be slightly
favourable than the Case A-1.
The sensitivity analysis proved that, in every case, the implementation of the master plan is
economically vulnerable to the cost increase and the benefit decrease. Especially, the financial
viability will be significantly reduced when the cost increase and the benefit decrease take
place at the same time.

Draft Final Report
Volume 1 Main Report
Project for Integrated Solid Waste Management
Master Plan in Gujranwala
248 CTI Engineering International Co., Ltd.
NJS Consultants Co., Ltd. EX Research Institute Ltd.
(4) Overall Conclusion for Financial and Economic Evaluation
Project Feasibility (a)
The results of the economic evaluation show that the implementation of the selected option of
the master plan might be economically feasible and financially viable on the condition that the
following recommendations will be taken into account for the implementation of the master
plan. The sensitivity analysis reveals that the master plan is financially and economically
vulnerable to the increase of costs and the decrease of benefits. The cost recovery levels for the
full coverage of the operation and maintenance costs remain approximately one-third of those
costs, implying the necessity of other alternative stable financial sources. However, taking into
account a spectrum of various unquantifiable benefits which cannot be converted to monetary
values, the selected option of the master plan might be economically feasible and financially
viable thereby the master plan is worth implementing.
Recommendations (b)
In order to implement the selected optimum option of the master plan, the following
recommendations should be taken into account in terms of economic feasibility and financial
viability.
Although the selected option of the master plan proves to be economically feasible and
financially viable, the capital investment should be funded by subsidies from the
provincial government and/or a sort of concessional loan whose interest rate is relatively
lower than those of commercial banks.
Since the project is rather vulnerable to such risks as the increase of costs as well as the
decrease of benefits, the financial statements such as cash flow statements should be
continuously monitored by GWMC. The continuous financial monitoring on revenues,
expenditures and the cost recovery rate by GWMC is absolutely necessary to avoid any
risks to enlarge the gap between the projected cash flow and the actual cash flow.
GWMC’s headquarters should be institutionally strengthened so that the financial
statements would be readily prepared in comparison with the original calculation tables
of the FIRRs.
The construction of the final disposal site should not be delayed to generate the project
benefits at least from 2018 which is the last year of the short-term period, since the project
is extremely vulnerable to the cost increase in the early stage of the master plan.
It is revealed that the earlier the introduction of the tariff system is, the higher the EIRR
and FIRR are, implying that the early introduction of the proposed tariff system is a key
to the financial stability of the master plan.
The cost recovery by the introduction of the optimum variable-rate user charge system is
not sufficient to fully cover the operation and maintenance cost required for the
implementation of the master plan.
The cost recovery rate is 32.4 percent out of the total operation and maintenance cost in
2025 even after the full-scale introduction of the tariff system in all areas which is in line
with the current willingness to pay, and the remaining 67.6 percent of the total operation
and maintenance cost should be replenished by other stable financial sources and/or
subsidies from the provincial government.
In order to fully cover the total operation and maintenance cost in 2025 which is the first
year of the full-scale introduction of the tariff system in all areas, the required tariff level
per month per household is estimated at approximately 3 times as much as the current
level of the users’ willingness to pay.
The introduction of the revenue generation through the provincial property tax as the
stable financial source should be urgently explored to cover the shortage of revenues. The

Project for Integrated Solid Waste Management
Master Plan in Gujranwala
Draft Final Report
Volume 1 Main Report
CTI Engineering International Co., Ltd.
NJS Consultants Co., Ltd. EX Research Institute Ltd.
249
negotiation with the provincial government on this revenue generation through the
provincial property tax should be commenced as soon as possible.
The users’ willingness to pay should be transformed into the actual payment of user
charges under the official tariff table so that the stable revenue generation for SWM
services can be secured. However, the user charge system in low-income areas whose
willingness to pay is extremely low should be carefully introduced by the delayed timing
of implementation of the full-scale tariff system in all areas.
The budget request to the provincial government for the capital investment cost as well as
the request to CDGG for the recurrent cost should be applied in time for each financial
year of GWMC, and those requests should be based on the cash flow statement of the
master plan.
The financial key performance indicators (KPIs) should be monitored by the
management information system (MIS) unit to keep the financial performance well
controlled by the management of GWMC.
The recurrent cost such as operating, personnel and maintenance costs should be
minimised based on the cost minimisation plan by GWMC.
Since the benefits accrued from the methane gas reduction cannot be converted into
the actual cash flow due to the current situation of the CDM as well as the international
market of carbon prices, the financial IRR is relatively low. However, in addition to the
environmental monitoring, the traded price level of carbon credits in the international
market should be continuously monitored for the identification of the environmental
impacts by monetary values.
4.14.4 Institutional and Organizational Evaluation
(1) Evaluation of Option B
From the perspective of institutional and organizational aspect, Option B is most preferable. This is
because it is most important for GWMC/CDGG to comply with laws and regulations that is the
provision of waste collection and transportation services in City and Sadar areas. For this purpose,
although it requires initial investment, it is essential to solve the problems of collection and
transportation and final disposal. Introduction of separation at source and intermediate treatment is
recommended as it decreases the running cost of collection & transport and final disposal.
The necessary arrangements in terms of institution and organization include the following:
Establishment of Gujranwala Solid Waste Management By-Law (a)
Currently, there is no comprehensive by-law in Gujranwala and there are no rules and
regulations on separation at source. Therefore, in order to implement Option B, the
Gujranwala Solid Waste Management By-law should be established and include clauses on
separation at source.
Organizational Restructure of GWMC (b)
Implementation of Option B requires the following organizational restructuring activities:
Strengthening of Operation Unit
Establishment of Intermediate Treatment Unit under Operation Department
Establishment of Communication Unit under Operation Department
Strengthening of Procurement & Contracts (P&C) Department for PPP introduction of
collection and transport
Establishment of Monitoring & Evaluation Department under General Manager

Draft Final Report
Volume 1 Main Report
Project for Integrated Solid Waste Management
Master Plan in Gujranwala
250 CTI Engineering International Co., Ltd.
NJS Consultants Co., Ltd. EX Research Institute Ltd.
Capacity Development of GWMC Staff (c)
Implementation of Option B requires hiring new staff as well as developing capacity of
existing staff of the above mentioned departments and units. Hiring new capable staff requires
more attractive working environment. Capacity development includes provision of regular
training based on needs assessment and monitoring result of Monitoring & Evaluation
Department.
(2) Issues for Consideration
Implementation and enforcement of the by-law depends on understanding and awareness of
residents.
Organizational structure and capacity should be periodically monitored and evaluated.
4.14.5 Overall Evaluation
The target collection rate of 100% for covering 98 UCs in year 2030 is an ideal goal for all the residents
of Gujranwala, so that the plans for pursuing this goal should be carried out with dedication and
dispatch. To realise the Vision of ISWM for Gujranwala City, the proposed projects in the Master Plan
should be carried out since implementation of these projects will bring large benefits to the residents of
Gujranwala.
A significant feature of public awareness in Gujranwala is characterised that the residents are displaying
indifference towards SWM issues. GWMC, therefore, should conduct firstly all technical
improvements as well as support for start-up of environmental education and public awareness raising
programmes. The 3R promotion activities should be initiated from introduction of waste separation at
source that is a basis of the new collection and transportation scheme, and they are integral parts of the
new ISWM Master Plan. Public awareness raising and the implementation of environmental education
are thus indispensable for the promotion of 3R even if the visible effects on ISWM will take quite a long
time to appear.
In order to establish effective and sustainable provision of SWM services, financial stability of GWMC
is required. However, GWMC cannot collect waste charges or tariff from the residents due to
uncooperative people and political issues. In addition, since private involvement has not been matured in
the sector of SWM, GWMC should take lead to carry out the required actions in the early stage of the
Master Plan, based on the subsidy of the local government and the provincial government.
A new final disposal site is necessary to secure the proposed ISWM system in any cases and needs a
huge amount of money. Therefore, the Government of Pakistan, including the Government of the
Punjab, should consider that some financial arrangements are indispensable for the implementation of
the action plans. It should also be recognised that the implementation of a proper SWM requires to some
extent a financial burden from the government, but the responsibility should be shared equally by the
government or public sector, the private collectors or private sector, and the residents or people.
4.15 Future Waste Stream of the ISWM Master Pan
In 2030, the waste amount in each stage increases drastically as 3,346 t/d for waste generation, 0 t/d for
uncollected waste amount, 602 t/d for recovery amount of recyclable materials in town, 510 t/d for
intermediate treatment, 2,033 t/d for waste collection and 2,013 t/d for final disposal after reduction of
recovery of recyclable materials of 20 t/d at the disposal site. The flow and waste amount from 2018 to
2030 are shown in Table 4.15.1 and Figure 4.15.1 to Figure 4.15.3.

Project for Integrated Solid Waste Management
Master Plan in Gujranwala
Draft Final Report
Volume 1 Main Report
CTI Engineering International Co., Ltd.
NJS Consultants Co., Ltd. EX Research Institute Ltd.
251
Table 4.15.1 Waste Amount for Major Elements in Waste Management Stream from 2018 to 2030
Item 2018 2020 2024 2030
Total Waste Generation Amount in 98 UCs (t/d) 1,600 1,800 2,304 3,346
Uncollected Waste Amount in 98UCs (t/d) 391 340 206 0
Waste Collection Ratio in 64 Urban UCs (%) 100 100 100 100
Waste Collection Ratio in 34 Peri-urban UCs (%) 0 20 64 100
Waste Discharge Amount for Collection (t/d) 1,209 1,460 2,098 3,346
Waste Generation Prevention Amount (t/d) 0 0 0 201
Recovery Amount of Resource Materials (t/d) 163 208 330 602
Intermediate Treatment Amount (Composting/RDF) (t/d) 0 250 252 510
Waste Collection Amount (t/d) 1,046 1,252 1,515 2,033
Recovery of Resource Materials at Disposal Site (t/d) 10 10 15 20
Waste Disposal Amount (t/d) 1,036 1,242 1,500 2,013
Total Waste Diversion Amount (t/d) 174 468 598 1,334
Waste Diversion Rate (%) 14 32 28 40
Figure 4.15.1 Waste Management Flow and Estimated Waste Amount in 2018
Figure 4.15.2 Waste Management Flow and Estimated Waste Amount in 2024
1,600 1,209
10163
1,0361,046
391
Waste generation Collection amountFinal disposal amount
Recycling amountRecovery amount
Illegal dumping/Self-disposal
Discharge amount
Unit:ton/day
2,304 2,098
15330
1,5001,515
206
Waste generation Collection amountFinal disposal amount
Recycling amountRecovery amount
Illegal dumping/Self-disposal
Discharge amount
Unit:ton/day
252
Composting amount

Draft Final Report
Volume 1 Main Report
Project for Integrated Solid Waste Management
Master Plan in Gujranwala
252 CTI Engineering International Co., Ltd.
NJS Consultants Co., Ltd. EX Research Institute Ltd.
Figure 4.15.3 Waste Management Flow and Estimated Waste Amount in 2030
Based on the proposed future waste stream of this master plan illustrated above, the target levels are set
out as shown in Table 4.15.2.
Table 4.15.2 Present and Future Waste Reduction, Material Recovery and Waste Diversion Rate
3R Activities/Year 2014 2018 2024 2030
Waste Reduction 0% 0% 0% 6%
Material Recovery 15% 14% 16% 19%
Biodegradable Waste Recovery 0% 0% 12% 15%
Waste Diversion for Final Disposal 15% 14% 28% 40%
4.16 Operation and Effect Indicators for Project Evaluation
Monitorable operation and effect indicators of the Project or activities formulated in the ISWM Master
Plan were determined through consultations with the Pakistani side. The following subsection proposes
the operation and effect indicators for the activities in each programme as well as the current
(2014/2015), 2020 and 2030 values for monitoring.
4.16.1 Proposed Operation and Effect Indicators for Monitoring and Evaluation of the
Projects
The operation and effect indicators proposed for monitoring and evaluation of the activities for each
programme are as presented in Table 4.16.1 below.
Table 4.16.1 Method for Calculation and Evaluation of Operation and Effect Indicators
Programme/Operation and Effect
Indicator
Calculation/Evaluation Method
Programme 1: Waste Collection and Transportation Plan
Waste Collection and
Transportation Amount (t/day)
1. Analyse the truck scale records to calculate the daily average value.
2. Calculate the waste collection achievement rate (%) by taking the planned value as the
denominator.
3. Evaluate by the achievement rate. The higher achievement rate shows that the collection and
transportation activity has been carried out in accordance with the plan.
Waste Collection Service Rate (%) 1. Analyse the truck scale records to calculate the daily average value.
3,346 3,346
20602
2,0132,033
0
Waste generation Collection amount
Recycling amount
Illegal dumping/Self-disposal
Discharge amount
Unit:ton/day
510
Composting amount
Prevention amountat source
201

Project for Integrated Solid Waste Management
Master Plan in Gujranwala
Draft Final Report
Volume 1 Main Report
CTI Engineering International Co., Ltd.
NJS Consultants Co., Ltd. EX Research Institute Ltd.
253
Programme/Operation and Effect
Indicator
Calculation/Evaluation Method
2. Calculate the waste collection rate (%) by taking the planned waste generation amount value as
the denominator.
3. The higher waste collection rate shows that the collection and transportation activity has been
carried out in accordance with the plan.
Status of Illegal Dumping
(Collection amount of waste from
the illegal dump sites) (t/day)
1. Analyse the truck scale records to calculate the average value of the discarded waste by the
OTC (One Time Cleaning) activity.
2. Calculate the achievement rate (%) by taking the current collection amount as the denominator.
3. The higher achievement rate shows that the OTC activity has been promoted.
Rate of Remaining Number of
Illegal Dump Site (%)
(Alternative)
1. Carry out the field reconnaissance and record the status of all the remaining illegal dump sites.
2. Calculate the remaining rate of illegal dump sites by taking the current number of illegal dump
sites (799 lots) as the denominator.
3. The lower remaining rate shows that the OTC activity has been promoted.
Programme 2: Final Disposal Plan
Final Waste Disposal Amount
(t/day)
1. Analyse the truck scale data to calculate the average incoming waste amount per day.
2. Calculate the achievement rate by taking the planned waste disposal amount as the
denominator.
3. The higher achievement rate shows that the waste disposal plan including 3R and waste
collection plan has been carried out in accordance with the ISWM plan.
Waste Diversion Rate (%) 1. Carry out the interview survey to the recyclers/junk shops/waste pickers to estimate the
resource material recovery amount.
2. Estimate the waste discharge amount by adding the waste collection amount and the resource
recovery amount.
3. Calculate the waste diversion rate by dividing the resource recovery amount with the waste
discharge amount.
4. Calculate the achievement rate by taking the planned waste diversion rate as the denominator
5. The higher achievement level shows that the waste reduction has been carried out as intended.
Programme 3: Intermediate Treatment and 3R Promotion Plan
Per Capita Waste Generation
Amount (g/c/day)
1. Carry out the Waste Amount and Composition Survey (WACS) to estimate the per capita
domestic waste generation amount.
2. Calculate the achievement rate by taking the planned per capita waste generation amount by the
denominator.
3. The results of achievement rate close at 100% shows that the estimation in the plan was
appropriate.
4. The higher achievement rate shows that the waste reduction at source has not yet promoted.
Resource Material Recovery
Amount (t/day)
1. Carry out the interview survey to the recyclers/junk shops/waste pickers to obtain the resource
material recovery amount.
2. Estimate the total resource material recovery amount by the survey results.
3. Calculate the achievement rate by taking the planned recovery amount as the denominator.
4. The higher achievement rate shows that the recovery of resource material has been promoted as
planned.
Compost Plant Input Waste
Amount (t/day)
1. Analyse the truck scale record to calculate the average incoming raw material amount to the
plant.
2. Calculate the achievement rate by taking the planned input amount as the denominator.
3. The results of achievement rate close at 100% shows that the plant operation has been carried
out as planned.
Status of Compost Production –
Production Amount (t/day)
1. Analyse the truck scale record to calculate the average amount of final compost product.
2. Calculate the achievement rate by taking the planned production amount as the denominator.
3. The results of achievement rate close at 100% shows that the production of compost has been
carried out as planned.
Status of Compost Production –
Sold Amount (t/day) (Alternative)
1. Analyse the truck scale record to calculate the average shipping amount of compost product.
2. Calculate the achievement rate by taking the planned shipping amount as the denominator.
3. The results of achievement rate close at 100% shows that the sale of compost has been carried
out as planned.
Programme 4: Environmental Education and Public Awareness Raising Plan
No. of School Classes for
Environmental Education
(class/year)
1. Record the number of classes that carried out the environmental education programme.
2. Calculate the achievement rate by taking the planned number of classes as the denominator.
3. The result of achievement rate close to 100% shows that the school education programme
has been carried out as planned.

Draft Final Report
Volume 1 Main Report
Project for Integrated Solid Waste Management
Master Plan in Gujranwala
254 CTI Engineering International Co., Ltd.
NJS Consultants Co., Ltd. EX Research Institute Ltd.
Programme/Operation and Effect
Indicator
Calculation/Evaluation Method
No. of Education Programmes for
General Public (times/year)
1. Record the number of environmental education programmes carried out for the general
public.
2. Calculate the achievement rate by taking the planned number of public education programme
as the denominator.
3. The result of achievement rate close to 100% shows that the environmental education for the
general public has been carried out as planned.
Raising Public Awareness (%) 1. Carry out the public awareness survey and analyse the awareness of the residents for the
SWM services.
2. Calculate the achievement rate by taking the planned rate of public awareness as the
denominator.
3. The higher achievement rate of public awareness shows that the public awareness
programme has been effective for raising awareness of the residents.
Programme 5: Economic and Financial Plan
FIRR (Financial Rate of Return)
(%)
1. Collect the actual annual cost and income up to the previous evaluation year.
2. Input the actual annual cost and income into the FIRR Calculation Sheet to recalculate the
FIRR.
3. The higher FIRR estimated shows that the proposed plan financially viable.
EIRR (Economical Rate of Return)
(%)
1. Collect the economic annual cost and gross benefits up to the previous evaluation year.
2. Input the economic annual cost and income into the EIRR Calculation Sheet to recalculate the
EIRR.
3. The higher EIRR estimated shows that the proposed plan economically feasible.
Required Amount of Subsidy for
O&M Cost (1000 Rs.)
1. Collect the actual annual cost and income up to the previous year.
2. Input the actual cost and income into the Cost Recovery Rate Calculation Sheet to recalculate
the rate.
3. Calculate the achievement rate by taking the planned cost recovery rate as the denominator.
4. The result of achievement close to 100% shows that the cost recovery has been carried out as
planned.
Level of Waste Fee for Recovering
100% O&M Cost (Low-income
Area)(Rs./month/household)
Since the collection of waste fee starts in 2025, recalculate the level of waste fee required in 2020
based on the actual cost and income up to 2019.
Level of Waste Fee for Recovering
100% O&M Cost (Middle-income
Area)(Rs./month/household)
Since the collection of waste fee starts in 2022, recalculate the level of waste fee required in 2020
based on the actual cost and income up to 2019.
Level of Waste Fee for Recovering
100% O&M Cost (High-income
Area)(Rs./month/household)
Since the collection of waste fee starts in 2022, recalculate the level of waste fee required in 2020
based on the actual cost and income up to 2019.
Programme 6: Environmental Monitoring Plan
Number of Environmental
Monitoring at Bhakhraywali
(times/year)
1. Record the number of environmental monitoring surveys implemented per year.
2. Calculate the achievement rate by taking the planned number of times as the denominator.
3. Achievement rate at 100% shows that the environmental monitoring has been carried out as
planned.
Number of Monitoring at
Gondlanwala (times/year)
1. Record the number of environmental monitoring surveys implemented per year.
2. Calculate the achievement rate by taking the planned number of times as the denominator.
3. Achievement rate at 100% shows that the environmental monitoring has been carried out as
planned.
Number of Monitoring at
Chianwali (times/year)
1. Record the number of monitoring surveys implemented per year.
2. Calculate the achievement rate by taking the planned number of times as the denominator.
3. Achievement rate at 100% shows that the environmental monitoring has been carried out as
planned.
Programme 7: Institutional Strengthening and Organization Plan
Number of Capacity Development
Programmes (Unit: cumulative
number of trainings)
1. Record the number of respective training courses implemented and obtain the cumulative
number of times.
2. Calculate the achievement rate by taking the planned cumulated number of times as the
denominator.
3. Achievement rate at 100% shows that the training programmes have been carried out as
planned.
Number of Management Staff of
the Organization (Unit: person)
1. Count and record the total number of management staff of the organization.
2. Calculate the sufficiency rate by taking the planned number of the management staff as the

Project for Integrated Solid Waste Management
Master Plan in Gujranwala
Draft Final Report
Volume 1 Main Report
CTI Engineering International Co., Ltd.
NJS Consultants Co., Ltd. EX Research Institute Ltd.
255
Programme/Operation and Effect
Indicator
Calculation/Evaluation Method
denominator,
3. The sufficiency rate at 100 % shows that the number of management staff has been deployed as
planned,
4.16.2 Current Value and Planned Value of Operation and Effect Indicator
Table 4.16.2 shows the values of operation and effect indicators in the current year (2014/2015) and the
planned values for the years 2020 and 2030. The values in 2020 and 2030 shown in the table are the base
values for comparison with the values in the evaluation year to be calculated by the method mentioned
above.
Table 4.16.2 Current and Planned Value of Operation and Effect Indicator
Planned Project/ Operation and Effect
Indicator
Current Value
(2014/2015)
Planned Value in
2020
Planned Value in
2030
Reference (Table No. and/or
Section No. showing the value)
Programme 1: Waste Collection and Transportation Plan
Waste Collection and Transportation
Amount (t/day) 410 1,459 3,346 Table 4.4.23 – Table 4.4.26
Waste Collection Service Rate (%)
Urban UC: 43
Peri Urban: 0
98UC Avg.: 34
Urban UC: 100
Peri-Urban: 20
98UC Avg.: 81
Urban UC: 100
Peri-Urban: 100
98UC Avg.: 100
Table 4.4.12 - Table 4.4.13 or
Table 4.4.23 - Table 4.4.26
Status of Illegal Dumping (Collection
amount of waste from the illegal dump
sites) (t/day)
60 0 0 Table 2.3.9
Rate of Remaining Number of Illegal
Dump Sites (%) (Alternative) 100 0 0 Table 2.3.10
Programme 2: Final Disposal Plan
Final Waste Disposal Amount (t/day) 406 991 2,013 Table 4.5.1
Waste Diversion Rate (%) 15 32 40 Table 4.15.1
Programme 3: Intermediate Treatment and 3R Promotion Plan
Per Capita Waste Generation Amount
(g/c/day)
Urban UC:400
Peri-Urban:350
Urban UC:424
Peri-Urban:374
Urban UC:467
Peri-Urban:414 Table 4.3.5
Resource Material Recovery Amount
(t/day) 70 218 622 Table 4.15.1
Compost Plant Input Waste Amount
(t/day) 0 250 250
Table D.4.5, Figure D.4.4
Status of Compost Production -
Production Amount (t/day) 0 125 125
Table D.4.5, Figure D.4.4
Programme 4: Environmental Education and Public Awareness Raising Plan
No. of School Classes for Environmental
Education (class/year) 0 200 710 Table 4.7.5
No. of Education Programmes for
General Public (times/year) 1 3 4 Table 4.7.7
Raising Public Awareness (%) 38 60 80 Figure 2.6.4, Average of the
whole project area
Programme 5: Economic and Financial Plan
FIRR (Financial Rate of Return) (%) 9.18 9.18 9.18 Table 4.14.3
EIRR (Economic Rate of Return) (%) 10.88 10.88 10.88 Table 4.14.8
Required Amount of Subsidy for O&M
Cost (1000 Rs.) 212,290 475,063 629,544 Table F.4.13
Level of Waste Fee for Recovering 100%
O&M Cost (Low-income
Area)(Rs./month/household)
77.2 77.2 77.2 Table 4.14.5
Level of Waste Fee for Recovering 100%
O&M Cost (Middle-income
Area)(Rs./month/household)
154.4 154.4 154.4 Table 4.14.5
Level of Waste Fee for Recovering 100% 308.8 308.8 308.8 Table 4.14.5

Draft Final Report
Volume 1 Main Report
Project for Integrated Solid Waste Management
Master Plan in Gujranwala
256 CTI Engineering International Co., Ltd.
NJS Consultants Co., Ltd. EX Research Institute Ltd.
Planned Project/ Operation and Effect
Indicator
Current Value
(2014/2015)
Planned Value in
2020
Planned Value in
2030
Reference (Table No. and/or
Section No. showing the value)
O&M Cost (High-income
Area)(Rs./month/household)
Programme 6: Environmental Monitoring Plan
Number of Environmental Monitoring at
Bhakhraywali (times/year) 0 4 4 Table H.5.1
Number of Monitoring at Gondlanwala
(times/year) 0 1 1 Table H.5.2
Number of Monitoring at Chianwali
(times/year) 0 1 1 Table H.5.2
Programme 7: Institutional Strengthening and Organization Plan
Number of Capacity Development
Programs (Unit: cumulative number of
training)
0 11 27 Figure G.4.4
Number of Management Staff of the
Organization (Unit: person) 46 70 76
Figure 2.8.3, Figure 4.10.1
Figure 4.10.2, Figure 4.10.3, or
Table G.5.1
4.16.3 Number of Direct and Indirect Beneficiaries of the Project
(1) Project Area Population - Waste Collection Target Area Population (Direct
Beneficiaries)
The Project will impact directly on the Project Area, i.e., the waste collection target area, and its
population of the current year (2014), 2020 and 2030 is estimated at 2,964 thousand, 3704 thousand
and 5,373 thousand, respectively on the basis of the 1998 Census population. (Refer to Table 4.2.3)
(2) Gujranwala District Population (Indirect Beneficiaries)
The Project can be realised to contribute to the Gujranwala District indirectly since the increase of
the waste collection rate up to 100% in the urban UCs by 2018 followed by the peri-urban UCs by
2030 will impact on the remaining areas of the District. The current population of Gujranwala
District in 2014 based on the 1998 Population Census is estimated at 4,667 thousand (Source: page
287, Punjab Development Statistics 2014, http://www.bos.gop.pk/system/files/Dev-2014.pdf).
4.17 Implementation Schedule and Cost, and Plan of Operation
Actions and costs required for the implementation of each component of the Master Plan are
summarised in Figures 4.17.1 and 4.17.2.
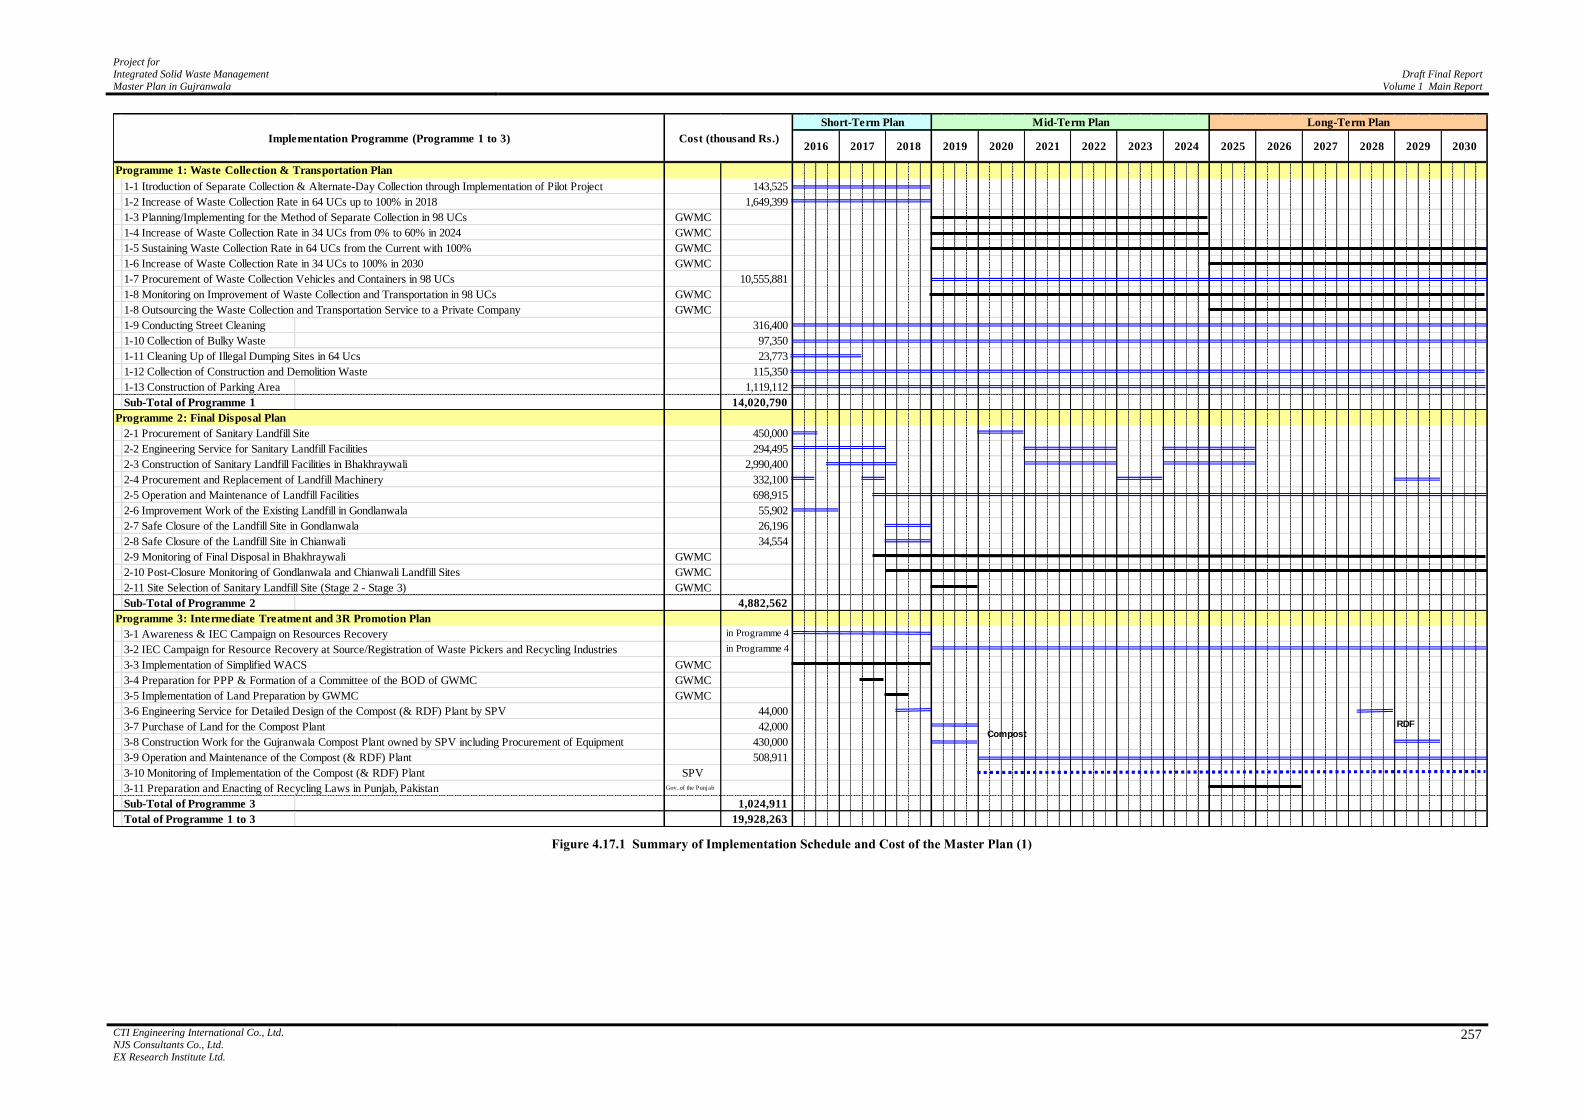
Project for Integrated Solid Waste Management
Master Plan in Gujranwala
Draft Final Report
Volume 1 Main Report
CTI Engineering International Co., Ltd.
NJS Consultants Co., Ltd.
EX Research Institute Ltd.
257
Figure 4.17.1 Summary of Implementation Schedule and Cost of the Master Plan (1)
Programme 1: Waste Collection & Transportation Plan
1-1 Itroduction of Separate Collection & Alternate-Day Collection through Implementation of Pilot Project 143,525
1-2 Increase of Waste Collection Rate in 64 UCs up to 100% in 2018 1,649,399
1-3 Planning/Implementing for the Method of Separate Collection in 98 UCs GWMC
1-4 Increase of Waste Collection Rate in 34 UCs from 0% to 60% in 2024 GWMC
1-5 Sustaining Waste Collection Rate in 64 UCs from the Current with 100% GWMC
1-6 Increase of Waste Collection Rate in 34 UCs to 100% in 2030 GWMC
1-7 Procurement of Waste Collection Vehicles and Containers in 98 UCs 10,555,881
1-8 Monitoring on Improvement of Waste Collection and Transportation in 98 UCs GWMC
1-8 Outsourcing the Waste Collection and Transportation Service to a Private Company GWMC
1-9 Conducting Street Cleaning 316,400
1-10 Collection of Bulky Waste 97,350
1-11 Cleaning Up of Illegal Dumping Sites in 64 Ucs 23,773
1-12 Collection of Construction and Demolition Waste 115,350
1-13 Construction of Parking Area 1,119,112
Sub-Total of Programme 1 14,020,790
2-1 Procurement of Sanitary Landfill Site 450,000
2-2 Engineering Service for Sanitary Landfill Facilities 294,495
2-3 Construction of Sanitary Landfill Facilities in Bhakhraywali 2,990,400
2-4 Procurement and Replacement of Landfill Machinery 332,100
2-5 Operation and Maintenance of Landfill Facilities 698,915
2-6 Improvement Work of the Existing Landfill in Gondlanwala 55,902
2-7 Safe Closure of the Landfill Site in Gondlanwala 26,196
2-8 Safe Closure of the Landfill Site in Chianwali 34,554
2-9 Monitoring of Final Disposal in Bhakhraywali GWMC
2-10 Post-Closure Monitoring of Gondlanwala and Chianwali Landfill Sites GWMC
2-11 Site Selection of Sanitary Landfill Site (Stage 2 - Stage 3) GWMC
Sub-Total of Programme 2 4,882,562
Programme 3: Intermediate Treatment and 3R Promotion Plan
3-1 Awareness & IEC Campaign on Resources Recovery in Programme 4
in Programme 4
GWMC
GWMC
GWMC
44,000
42,000
3-8 Construction Work for the Gujranwala Compost Plant owned by SPV including Procurement of Equipment 430,000
3-9 Operation and Maintenance of the Compost (& RDF) Plant 508,911
3-10 Monitoring of Implementation of the Compost (& RDF) Plant SPV
3-11 Preparation and Enacting of Recycling Laws in Punjab, Pakistan Gov..of the Punjab
Sub-Total of Programme 3 1,024,911
Total of Programme 1 to 3 19,928,263
2016 2017 2020 2021Cost (thousand Rs.)
3-5 Implementation of Land Preparation by GWMC
3-7 Purchase of Land for the Compost Plant
3-6 Engineering Service for Detailed Design of the Compost (& RDF) Plant by SPV
2023Implementation Programme (Programme 1 to 3)
Short-Term Plan
2025 2026
Mid-Term Plan Long-Term Plan
20192018
3-3 Implementation of Simplified WACS
3-2 IEC Campaign for Resource Recovery at Source/Registration of Waste Pickers and Recycling Industries
3-4 Preparation for PPP & Formation of a Committee of the BOD of GWMC
2028 2029 2030202720242022
Programme 2: Final Disposal Plan
CompostRDF

Draft Final Report
Volume 1 Main Report
Project for Integrated Solid Waste Management
Master Plan in Gujranwala
258 CTI Engineering International Co., Ltd.
NJS Consultants Co., Ltd.
EX Research Institute Ltd.
Figure 4.17.2 Summary of Implementation Schedule and Cost of the Master Plan (2)
62,135
42,136
12,514
4,125
400
1,100
Sub-Total of Programme 4 122,410
GWMC
GWMC
in Programme 7
GWMC in Programme 7
Sub-Total of Programme 5
GWMC
20,170
1,820
GWMC
Sub-Total of Programme 7 21,990
7-1 Improvement of Organisational Restructuring of GWMC 346,709
7-2 Capacity Development of GWMC Staff 76,894
7-3 Establishment of Gujuranwala Solid Waste Management By-Law 844
Sub-Total of Programme 7 0 424,447
Total of Programme 4 to 7 0 568,847
Grand Total 0 20,497,110
To be conducted by local fund
To be conducted by Special Purpose Vehicle (SPV)
To be conducted by the GWMC's own resources
Programme 7: Institutional Strengthening and Organizational Plan
6-3 Monitoring of Post-Closure Final Disposal Sites in Gondlanwala and Chianwali
5-3 Introduction of Proper Tariff Charging System
5-4 Implementation of Financially Efficient Private Sector Involvement
6-1 Monitoring of Collection and Transport Work
Programme 6: Environmental Monitoring Plan
6-2 Monitoring of Final Disposal Site in Bhakhraywali
Programme 5: Economic and Financial Plan
4-3 Development and Implementation of Educational Programmes Targeting General Public
4-1 Capacity Development of Communication Unit to Strengthen the Coordination among Relevant Bodies
4-2 Development and Implementation of Educational Programmes Targeting Primary School Teachers and Students
Cost (thousand KSh)
5-1 Establishment of Sustainable Cost Recovery
5-2 Implementation of Accurate Total Costing
4-5 Development of Environmental Education Facility and its Utilisation Plan
4-6 Managment of Environmental Education Facility and its Utilisation
Implementation Programme (Programme 4 to 7)
Programme 4: Environmental Education and Public Awareness Raising Plan
Short-Term Plan Mid-Term Plan Long-Term Plan
2016 2017 2024 202520232018 2019 2020 2030
6-4 Monitoring of Intermidiate Process (Compost Facility)
2028 20292026 20272021 2022
4-4 Development and Implementation of Monitoring Plan

Project for Integrated Solid Waste Management
Master Plan in Gujranwala
Draft Final Report
Volume 1 Main Report
CTI Engineering International Co., Ltd.
NJS Consultants Co., Ltd. EX Research Institute Ltd.
259
4.18 Selection of Priority Projects
The priority projects are defined as projects for the short-term period of the Master Plan which will be
developed to the action plans in the next stage. Based on the detail discussions described in Sections 4.4
to 4.10, the following projects are thus selected as the priority projects:
1. Waste Collection and Transportation Plan
1-1 Introduction of Separate Collection and Alternate day Collection through Implementation of
Pilot Project
1-2 Increase of Waste Collection Rate in 64 UCs up to 100% in 2018
1-3 Conducting Street Cleaning in 64 UCs
1-4 Collection of Bulky Waste
1-5 Cleaning up of Illegal Dumping sites in 64 UCs
1-6 Construction and Demolition Waste Collection
1-7 Construction of Parking Area
2. Final Disposal Plan
2-1 Procurement of Sanitary Landfill Site
2-2 Engineering Service for Sanitary Landfill Facilities (Stage 1)
2-3 Construction of Sanitary Landfill Facilities (Stage 1) in Bhakhraywali
2-4 Procurement of Landfill Machinery
2-5 Operation and Maintenance of Landfill Facilities
2-6 Improvement Work of the Existing Landfill in Gondlanwala
2-7 Safe Closure of the Landfill Site in Gondlanwala
2-8 Safe Closure of the Landfill Site in Chianwali
2-9 Monitoring of Final Disposal in Bhakhraywali
2-10 Post-Closure Monitoring of Gondlanwala and Chianwali Landfill Sites
3. Intermediate Treatment and 3R Promotion Plan
3-1 Awareness and IEC (Information, Education and Communication) Campaign on Resource
Recovery
3-2 Implementation of Simplified WACS
3-3 Preparation for PPP and Formation of a Committee of the BOD of GWMC
3-4 Implementation of Land Preparation by GWMC
3-5 Engineering Service for Detailed Design of a Compost Plant by SPV
4. Environmental Education and Public Awareness Raising Plan
4-1 Capacity Development of Communication Unit to Strengthen Coordination among Relevant
Bodies
4-2 Development and Implementation of Educational Programmes Targeting Primary School
Teachers and Students to Enhance Knowledge/Awareness on SWM and 3R Promotion

Draft Final Report
Volume 1 Main Report
Project for Integrated Solid Waste Management
Master Plan in Gujranwala
260 CTI Engineering International Co., Ltd.
NJS Consultants Co., Ltd. EX Research Institute Ltd.
4-3 Development and Implementation of Educational Programmes Targeting General Public to
Enhance Knowledge/Awareness on SWM and 3R Promotion
4-4 Development of Environmental Education Facility and its Utilisation Plan including the
Content of Educational Programmes
5. Economic and Financial Plan
5-1 Establishment of Sustainable Cost Recovery
5-2 Implementation of Accurate Total Costing
5-3 Introduction of Proper Tariff Charging System
5-4 Implementation of Financially Efficient Private Sector Involvement
6. Environmental Monitoring Plan
6-1 Environmental Monitoring for the Collection and Transportation Work
6-2 Environmental Monitoring for the Final Disposal Site in Bhakhraywali
6-3 Environmental Monitoring for the Safe Post-Closure of Final Disposal Sites in Gondlanwala
and Chianwali
7. Institutional Strengthening and Organizational Plan
7-1 Organizational Restructuring of GWMC
7-2 Capacity Development of GWMC Staff
7-3 Establishment of Gujranwala Solid Waste Management By-Law

Project for Integrated Solid Waste Management
Master Plan in Gujranwala
Draft Final Report
Volume 1 Main Report
CTI Engineering International Co., Ltd.
NJS Consultants Co., Ltd. EX Research Institute Ltd.
261
CHAPTER 5. ENVIRONMENTAL AND SOCIAL CONSIDERATIONS
5.1 Introduction
The ISWM Master Plan is formulated by using the Strategic Environmental Assessment (SEA)
technique. Environmental and social issues are taken into consideration to select the preferable options
of each technical sector (collection & transportation, 3R & intermediate treatment, and final disposal) in
the ISWM for mitigating the probable impacts to the neighbouring area in the course of project
implementation. Furthermore, in the formulation of the Master Plan which is a combination of the
selected technical options, the environmental and social perspectives are taken into account in addition
to the factors of technology, economy and finance, institutional and organizational aspects for selecting
the best combination for Option B.
In this Chapter 5, the qualitative impacts to the environment and society are discussed in practicing the
construction project of the technical sector of the selected master plan Option B and in the scoping for
implementing the Environmental Impact Assessment (EIA) or IEE (Initial Environmental Examination)
for the project(s) is prepared.
5.2 Planning Procedures and Selection of Optimum Master Plan
5.2.1 Planning Procedures for Development of the Master Plan
The SEA principle is conducted on the IEE level (Category B of the JICA Guidelines) to apply for
decision-making of planning in the formulation of the master plan. Though both EIA and SEA are the
tools for assessment of environmental and social impacts, in most cases, EIA deals with impacts from a
single project. On the other hand, SEA deals with the comprehensive impacts of projects which cover a
wide area (such as the master plan), and complicated impacts from a combination of plural projects, so
that public consultation is significant.
One of the important principles in SEA is the “Zero Option”. SEA provides an alternative option for the
project, and it always has to take into account the case of “no project” implemented in the process of
preparing the alternatives.
Figure 5.2.1 shows the planning procedures of the master plan of this project. In the whole process,
selection and decision-making, environmental and social considerations are carried out using the JICA
Environmental Checklist for Waste Management.
Firstly, possible options are listed in each technical sector; namely, Collection and Transportation,
Intermediate Treatment and 3R, and Final Disposal. According to the SEA strategy, each approach must
have a “Zero Option” which means no action will be made. For example, “Collection and
Transportation” has the options of “Present Level Collection and Transport”, “Direct Transport”, “No
Transfer Station for Mini-dumpers,” and “No Intermediate Treatment Facilities and No 3R activities by
GWMC”, and so on.
Secondly, the best options are selected from each sector in terms of SEA. All the selected options shall
satisfy the check items in the Environmental and Social Considerations. Thirdly, some drafts of the
Master Plan are formulated in combination with the options selected by the previous process. Needless
to say, one of the drafts of the Master Plan is “Zero Option”. Fourthly, the best Master Plan is formed.
Finally, the “Action Plan”, which is defined as priority projects to be implemented in the short-term
period, is prepared, i.e., from year 2016 to year 2018 in this project. The Master Plan includes many
main- and sub-projects which break the components of the Master Plan down to the feasible action level.
Therefore, a schedule of timing, cost and executing agencies is necessary for the implementation of
these main- and sub-projects, and the projects showing these details are called “Action Plan”.

Draft Final Report
Volume 1 Main Report
Project for Integrated Solid Waste Management
Master Plan in Gujranwala
262 CTI Engineering International Co., Ltd.
NJS Consultants Co., Ltd. EX Research Institute Ltd.
Figure 5.2.1 Planning Procedure of the Master Plan with Environmental and Social Considerations
5.2.2 Selection of Optimum Master Plan
The master plan study options including the selection of Option B as the optimum combination from the
technical, environmental, social, financial, institutional and organizational viewpoints have been
Z: No New Landfill Site
A: Candidate Site 1
C: Candidate Site 3
B: Candidate Site 2
Z: No Collection &
Transport
B: Transfer Station
(T/S)
A: Separation
Z: No SeparationA: Composting
C: MRF
D: Incineration
E: RDF
F: Bio-Gas
Z: No Treatment
A: Direct Transport
Waste Discharge
Option (Example)
Collection & Transport
Option (Example)
Intermediate
Treatment & 3 R
Option (Example)
M/P Option (Example)
M/P Option A (Example):Waste Discharge Option A
Collection & Transportation Option B
Intermediate & 3R Option C
New Final Disposal Site: Bhakhraywali
M/P Option B (Example):Waste Discharge Option B
Collection & Transportation Option C
Intermediate & 3R Option B
New Final Disposal Site: Bhakhraywali
M/P Option C (Example):Waste Discharge Option B
Collection & Transportation Option C
Intermediate & 3R Option E
New Final Disposal Site: Bhakhraywali
M/P Option Z (Zero Option):Waste Discharge Option Z
Collection & Transportation Option Z
Intermediate & 3R Option Z
Final Disposal Site Option Z
Proposed Projects (Example)1. Waste Discharge Plan
Project 1A,1B, 1C, …..
2. Collection & Transportation Plan
Project 2A,2B, 2C, ….
3. Intermediate & 3R Plan
Project 3A,3B, 3C, ….
4. New Final Disposal Plan
5. Institutional Strengthening Plan
6. Oranisational Structure Plan
7. Private Involvement Promotion Plan
8. Environmental Education and Public
Awareness Heightening Plan ……..
Selected Master Plan
Selection of Priority Projects (Example)
Action Plan
Final Disposal Site
Option (Example)
X: Candidate Site X
・・・・
Selected Option of
Final Disposal Site:
Bhakhraywali
Selected Option(s) Selected Option(s) Selected Option(s)
Evaluation by SEA based on Environment & Social (E&S) Consideration
Evaluation by SEA based on E&S Consideration
RemarksSEA: Strategic Environmental AssessmentEIA: Environmental Impact Assessment E&S Consideration: Environmental and Social Consideration based on JICA guidelines
Stage1Identification
of Alternatives
for Each
Technical Component
Stage 2Evaluation of Alternatives
Stage 3Establishment
ofM/P
Alternatives
Stage 4Formulation
of the Optimum
M/P and Selection
of Priority Projects
Stage 5Development of Action Plan
Implemented by the Urban Unit with supported by JICA Project Team
Evaluation by EIA in consideration of E&S
Consideration
1. Project 4B
2. Project 1A,
3. Project 3C
4. Project 2A
5. Project 6C
6. ……..
7. ……..
8. ……..

Project for Integrated Solid Waste Management
Master Plan in Gujranwala
Draft Final Report
Volume 1 Main Report
CTI Engineering International Co., Ltd.
NJS Consultants Co., Ltd. EX Research Institute Ltd.
263
discussed in the preceding Chapter 4. This Option B consists of the development plans, programmes
and projects listed below.
(1) Proposed Development Plans and Programmes
The environmental and social considerations should be carried out in the course of formulation of
the Gujranwala Integrated Solid Waste Management Master Plan. The Master Plan is composed of
the following seven programmes which are described in detail in Chapter 4.
Programme 1: Waste Collection and Transportation Plan
Programme 2: Final Disposal Plan
Programme 3: Intermediate Treatment and 3R Promotion Plan
Programme 4: Environmental Education and Public Awareness Raising Plan
Programme 5: Economic and Financial Plan
Programme 6: Environmental Monitoring Plan
Programme 7: Institutional Strengthening and Organizational Plan
(2) Proposed Technical Options for Achieving Targets of the Master Plan
The technical options that shall be implemented to achieve the targets for setting the master plan are
as follows:
Separate collection;
Construction and operation of a new final disposal site at Bhakhraywali;
Improvement work and closure of the existing landfill site in Gondlanwala;
Closure of the former landfill site in Chianwali;
Construction and operation of a central compost plant; and
Construction and operation of a RDF plant.
5.3 Baseline of Environmental and Social Condition
It is essentially required to consider the utmost mitigation of probable impacts to the environmental and
social aspects in practicing the projects of the selected technical option indicated in Section 5.2. Under
this Section 5.3, the natural and social conditions of the project site and the vicinities are collected and
outlined for the baseline information taken into consideration for carrying out the EIA or IEE for the
project(s).
The baseline of environmental and social considerations in this project is summarised based on the EIA
report on the construction of a new final disposal site at Bhakhraywali and the result of the
Environmental and Social Consideration Survey (E&S Survey).
The EIA report was drafted in February 2015 by the Urban Unit and submitted to the Federal Agency in
March 2015. After the submission, the Public Hearing and Review was carried out on 17 August 2015,
and Decision will be made by the Federal Agency. The EIA and the details of the EIA of the project are
described in the following Section 5.4. On the other hand, the E&S survey was carried out in November
2014.
5.3.1 Natural Condition
(1) Climate
Gujranwala has a tropical hot dry climate with long summers when temperature rises to maximum
up to 48 degrees Celsius in the months of June and July, and 4 degrees Celsius in the months of
December and January. The summer season starts from April and continues until the end of
September, the winter season starts from November and continues until February, and Monsoon
starts from the later part of June and lasts over the period of two-and-a-half months.

Draft Final Report
Volume 1 Main Report
Project for Integrated Solid Waste Management
Master Plan in Gujranwala
264 CTI Engineering International Co., Ltd.
NJS Consultants Co., Ltd. EX Research Institute Ltd.
(2) Water
Surface water: The Chenab River is the only river in the district. The Chenab River forming the
northern boundary has been described as a broad shallow stream. There are several nullahs (canals)
in the district which form channels for floodwater in the rainy season. The most important of them
are Palkhu, Aik, Khot, Beghwala and Dekh.
Groundwater: Groundwater is mainly used for drinking and irrigation in Gujranwala. For
drinking, the local population is generally reliant on supply from the hand pumps in rural areas
while in urban areas population use drinking water from the piped water supply scheme.
(3) Fauna and Flora
Fauna: Due to the extensive cultivation, high population and human activities, there is little
wildlife in the project area. However, the Wildlife Department has reported some fauna.
Flora: The project area, which is an agricultural land, is the habitat of several flora species.
Common flora species with rooted vegetation are also present near most of the water bodies of the
area.
(4) Land-use
The project site of the proposed landfill is an agricultural land with 10-15% uneven land left after
the exaction activities.
(5) Air and Noise
During the survey at the site, no air pollution or generation of noise was noted.
5.3.2 Socio-economic Condition
(1) Population
The total population of Gujranwala District is 3,400,940 as estimated in March 1998. The 1998
Census show that the population of the district consists of Muslims (95%), Christians (4%), and
Hindu and others (less than 1%).
(2) Economic Activities
Gujranwala is a vibrant economic city of the Punjab with palpable contribution in agriculture and
the industrial sector. It is one of the major wheat and rice producers in the Punjab. In terms of
industrial sector, Gujranwala is one of the important commercial and industrial nerve centres of
Pakistan. Production of good quality ceramics is also one of the most important sectors in
Gujranwala.
(3) Sanitation
Thirty-five point three percent (35.3%) of households have no sanitation facility, and 42.8% have
flush toilet in dwelling while 21.9% have flush toilet in premises. Infant morbidity rate is 67/1,000
live births.
(4) Health Condition
Acute respiratory infection is the frequent health problem.
5.3.3 Public Consultation
As a component of public consultation, 74 stakeholders were interviewed. As many as 11 stakeholders
selected from public institutions, such as the Irrigation Department, Agriculture Department,
Environment Protection Department, City District Government Gujranwala, Gujranwala Environmental
Organization, and Chaon Foundation, were interviewed, and the remaining 63 residents/landowners
were interviewed as well.

Project for Integrated Solid Waste Management
Master Plan in Gujranwala
Draft Final Report
Volume 1 Main Report
CTI Engineering International Co., Ltd.
NJS Consultants Co., Ltd. EX Research Institute Ltd.
265
Positive Perceptions: Stakeholders showed affirmative standpoint for the sanitary landfill in
Bhakhlaiwali in terms of public health and environmental benefit.
Negative Perceptions: The common viewpoint is GMWC’s negligence of required procedures and the
guidelines create new environmental constraint and hazards. Lack of community inclusion and public
disclosure is pointed out as well.
5.4 Confirmation of Environmental and Social Considerations Systems and
Organizations in Pakistan
5.4.1 Laws and Regulations Related to Environmental and Social Considerations
Table 5.4.1 specifies the Pakistan laws related to comprehensive environmental issues and Table 5.4.2
shows the policy, guidelines, and rules of solid waste management nationwide/provincial-wise.
Table 5.4.1 Environmental Laws in Pakistan
Title of the Law Contents
Pakistan Environmental Protection Act
This act provides for the protection, conservation, rehabilitation and
improvement of the environment, for the prevention and control of
pollution, and promotion of sustainable development.
EIA is mentioned in Section 12.
National Environmental Quality
Standards (NEQS)
NEQS consists of two parts:
List of laws and regulations in 14 sectors such as
Environmental Protection, Land Use, Water Quality and
Resource, Solid Waste Management, and so on.
Description of National standards
Pakistan Environmental Protection
Agency (Review of IEE & EIA)
Regulations 2000
Process of IEE and EIA is described.
National Environmental Policy
The Policy provides an overarching framework for addressing the
environmental issues facing Pakistan, particular pollution of fresh
water bodies and coastal waters, air pollution, lack of proper waste
management, deforestation, loss of biodiversity, desertification,
natural disasters and climate change. Guidelines are shown in each
sector, and one of such sector is “Waste Management”.
Table 5.4.2 Policy, Guidelines, and Rules on Solid Waste Management Nationwide/Provincial-Wise
Name Contents
National Sanitation Policy 2006
The policy stipulates that one of its objectives is to develop and
implement strategies for integrated management of municipal,
industrial, hazardous and hospital and clinical wastes of national,
provincial and local level.
Punjab Municipal Solid Waste
Management Guidelines 2011 Various issues in waste management are covered.
Hospital Waste Management Rules 2005 Rules for the management of medical waste generated in hospital are
described.
5.4.2 Organizations and Functions Related to Environmental and Social
Considerations
The Ministry of Environment is the main government organization responsible for protection of the
environment and conservation of resources. There are many governmental institutions organized and

Draft Final Report
Volume 1 Main Report
Project for Integrated Solid Waste Management
Master Plan in Gujranwala
266 CTI Engineering International Co., Ltd.
NJS Consultants Co., Ltd. EX Research Institute Ltd.
enforcing the laws and regulations together with the Ministry of Environment as shown in the following
Table 5.4.3.
Table 5.4.3 Framework of Environmental Institutions in Pakistan
Functions, Policy, Plans, Strategies and
Programmes
Status (as of February 2015)
Environmental pollution, ecology,
forestry, wildlife, biodiversity, climate
change and desertification
Assigned to the Planning and Development (P&D) Department, but
the function was later absorbed by the Ministry of National Disaster
Management (NDM). The NDM is named as the Ministry of
Climate Change with the same functions at present.
Improvement in environmental
conditions of air, water and land
Devolved
Incorporation of environmental
concerns in development schemes and
energy conservation
Devolved
Coordination, monitoring and
implementation of environmental
agreements with other countries,
international agencies and forums
Assigned to the Planning and Development (P&D) Department, but
the function was later absorbed by the Ministry of National Disaster
Management (NDM). The NDM is named as the Ministry of
Climate Change with the same functions at present.
Pakistan Environmental Protection
Agency (Federal EPA)
Assigned to the Capital P&D Department, but the function was later
absorbed by the Ministry of National Disaster Management
(NDM). The NDM is named as the Ministry of Climate Change
with the same functions at present and the domain of the Federal
EPA is limited to the Federal Area.
Secretariat of Pakistan Environmental
Protection Council established under
the PEPA97 (XXXIV of 1997)
Assigned to the Inter-Provincial Coordination (IPC) Department,
but the function was later absorbed by the Ministry of National
Disaster Management (NDM). The NDM is named as the Ministry
of Climate Change with the same functions at present.
National Council for Conservation of
Wildlife (NCCW)
Devolved; the council members were transferred to the P&D
Department and later to the Ministry of National Disaster
Management which is named as the Ministry of Climate Change at
present. The staff members of the defunct NCCW work in the
Forestry Wing of MoE.
National Energy Conservation Centre
(ENERCON)
Assigned to the Ministry of Water and Power.
Zoological Survey Department (ZSD) Assigned to Ministry of Science and Technology, but the function
was later absorbed by the Ministry of National Disaster
Management (NDM). The NDM is named as the Ministry of
Climate Change with the same functions at present.
Forestry Wing of MoE Staff members were transferred to the P&D Department and later to
the new Ministry of National Disaster Management (NDM). The
NDM is named as the Ministry of Climate Change with the same
functions at present.
5.4.3 Projects Requiring an EIA in Pakistan
The Environmental Protection Act of 1997 and the Pakistan Environmental Assessment Procedures of
1997 stipulate the conditions that would require EIA for the project site. The process of EIA is described
in “Pakistan Environmental Protection Agency (Review of IEE & EIA) Regulations 2000.” The case is
filed in the Federal Agency, and the Agency decides whether the case is IEE (Initial Environmental
Evaluation) or EIA. According to the Regulations, EIA is required in view of waste management as
follows:

Project for Integrated Solid Waste Management
Master Plan in Gujranwala
Draft Final Report
Volume 1 Main Report
CTI Engineering International Co., Ltd.
NJS Consultants Co., Ltd. EX Research Institute Ltd.
267
Waste disposal and/or storage of hazardous or toxic wastes (including landfill state, incineration of
hospital toxic waste) (for EIA)
Waste disposal facilities for domestic or industrial wastes, with annual capacity more than
10,000 cubic metres (for EIA)
Waste disposal facilities for domestic or industrial wastes, with annual capacity less than
10,000 cubic metres (for IEE)
Waste-to-energy generation projects (for IEE)
5.4.4 EIA Process in Pakistan
Figure 5.4.1 shows the process of EIA in Pakistan. Once the report is submitted, within 10 working
days of application for EIA, the Federal Agency proceeds to the “Preliminary Scrutiny.” After “Public
Participation” is done, the Federal Agency will carry out its “Review” within 90 days of application for
EIA. Upon completion of the Review, the “Decision” of the Federal Agency will be communicated to
the proponent.
5.4.5 EIA of this Project
The Urban Sector Planning and Management Services Unit Ltd. (The Urban Unit) in partnership with
the Gujranwala Waste Management Company (GWMC) conducted the Environmental Impact
Assessment (EIA) for the proposed Bhakhraywali landfill site. The actual survey was carried out by
local consultants from 15 August 2014 and the final EIA Public Hearing was carried out on 17 August
2015. The major contents are shown in Figure 5.4.2.
Figure 5.4.1 Process of EIA in Pakistan by the “Pakistan Environmental Protection Agency
(Review of IEE & EIA) Regulations 2000”

Draft Final Report
Volume 1 Main Report
Project for Integrated Solid Waste Management
Master Plan in Gujranwala
268 CTI Engineering International Co., Ltd.
NJS Consultants Co., Ltd. EX Research Institute Ltd.
Figure 5.4.2 Major Contents of EIA Report (Planned)
5.4.6 JICA Environmental Checklist for Waste Management
This project which is categorised as “Category B” based on the JICA Guidelines follows the JICA
Guidelines for Environmental and Social Considerations as well as the Pakistani laws and regulations.
Categorisation is made based on sector, scale, characteristics and location of the project, and
“Category B” is defined as “Less adverse impact than “Category A” (significant adverse impact)”.
The JICA Environmental Checklist is issued under the JICA Guidelines, and the Checklist mentions
detailed issues and items for avoiding negative impacts to community from the project. The JICA
Checklist is a list of conditions which a JICA-funded project needs to follow so as to satisfy the desired
quality of the project. For this project, the JICA Environmental Checklist for Waste Management is
applied. The Checklist consists of six categories: Permits and Explanation, Pollution Control, Natural
Environment, Social Environment, Others, and Note.
According to the comparison between the Pakistani laws and the JICA Environmental Checklist for
Waste Management (see Table 5.4.4), some issues show that there is no conflict between the JICA
Checklist and Pakistani laws; for example, both require EIA for project implementation. On the other
hand, some differences are identified in the category; for example, “Social Condition” of the JICA
Checklist. “Social Conditions” in the JICA Checklist requires consideration of living and livelihood of
stakeholders and working condition at the project site. These issues are not clearly mentioned in the
Pakistani laws.
Application of the JICA Checklist to the project will make a better situation for the future waste
management in Gujranwala. The Checklist will contribute especially in the field of social consideration.
Chapter 1: Introduction
Chapter 2: National and International Policy, Legal and Institutional Framework
Chapter 3: Project Description
Chapter 4: Analysis of the Alternatives
Chapter 5: Baseline Environment and Social Conditions
Chapter 6: Stakeholder Consultation
Chapter 7: Impact Assessment and Mitigation Measures
Chapter 8: Environmental Management Monitoring Plan
Chapter 9: Conclusion

Project for Integrated Solid Waste Management
Master Plan in Gujranwala
Draft Final Report
Volume 1 Main Report
CTI Engineering International Co., Ltd.
NJS Consultants Co., Ltd. EX Research Institute Ltd.
269
Table 5.4.4 Comparison of Pakistani Laws and Regulations Related to Environmental Protection and
Waste Management and JICA Environmental Checklist for Waste Management
Category Environmental Item in JICA Environmental Checklist for Waste Management
Comparison with Pakistan Laws and Regulations
1. Permits and Explanation
1) EIA and Environmental Permits
2) Explanation to the Local Stakeholders
3) Examination of Alternatives
[Result of Comparison]
No Major Conflict between the JICA Checklist and Pakistan laws and regulations [Related Laws/Regulations]
Guidelines for the Preparation and Review of Environmental Reports (1997)
Pakistan Environmental Protection Agency (Review of IEE & EIA) regulations 2000
National Environmental Quality Standards (NEQS) Building Regulation (2007)
Punjab Municipal Solid Waste Management Guidelines 2011 Guidelines for Public Consultation (1997)
2. Pollution Control 1) Air Quality 2) Water Quality 3) Wastes 4) Soil Contamination 5) Noise and Vibration 6) Odour
[Result of Comparison]
Treatment and disposal process of other hazardous and dangerous waste may not be defined.
Noise generated by vehicles shall comply with the National Environmental Quality Standard. Noise generated by Facility operation may not be defined. Vibration level by vehicles or facility operation may not be defined.
[Related Laws/Regulation]
National Environmental Quality Standards (NEQS) Punjab Municipal Solid Waste Management Guidelines 2011 Hospital Waste Management Rules (2005)
3. Natural Environment
1) Protected Areas 2) Ecosystem
3) Management of Abandoned Site
[Result of Comparison]
No Major Conflict between the JICA Checklist and Pakistan laws and regulations [Related Laws/Regulation]
Guidelines for Sensitive and Critical Area (1997) Punjab Municipal Solid Waste Management Guidelines 2011
4. Social Environment
1) Resettlement
2) Living and Livelihood
3) Heritage 4) Landscape
5) Ethnic Minorities and Indigenous People
6) Working Conditions
[Result of Comparison]
No conflict, basically, but social and environmental considerations shall be accorded to waste pickers in the existing system in accordance with the JICA guidelines.
Measures for local landscape protection are not defined in Pakistani laws and regulations.
Working condition and environment is not clearly defined in Pakistani laws and regulations although the Labour Policy (2010) mentions labourers’ human rights, health and social welfare.
[Related Laws/Regulation]
Guidelines for the Preparation and Review of Environmental Reports (1997) Labour Policy (2010) Antique Act (1975) Punjab Special Premises (Preservation) Ordinance (1985) Guidelines for Sensitive and Critical Area (1997) Punjab Municipal Solid Waste Management Guidelines 2011
National Environmental Policy The World Bank Environmental Assessment Sourcebook Volume I
5. Others
1) Impacts during Construction
2) Monitoring
[Result of Comparison]
No Major Conflict between the JICA Checklist and Pakistani laws and regulations
[Related Laws/Regulations]
Guidelines for the Preparation and Review of Environmental Reports (1997) Punjab Municipal Solid Waste Management Guidelines 2011
6. Note
1) Reference to Checklist of Other Sectors
2) Note on Using Environmental Checklist
[Situation]
This issue is not mentioned in Pakistani laws; therefore, The World Bank Environmental Assessment Sourcebook, Volume I, shall be applied, if necessary.
[Related Laws/Regulations]
Guidelines for the preparation and review of Environmental Reports (1997) The World Bank Environmental Assessment Sourcebook, Volume I
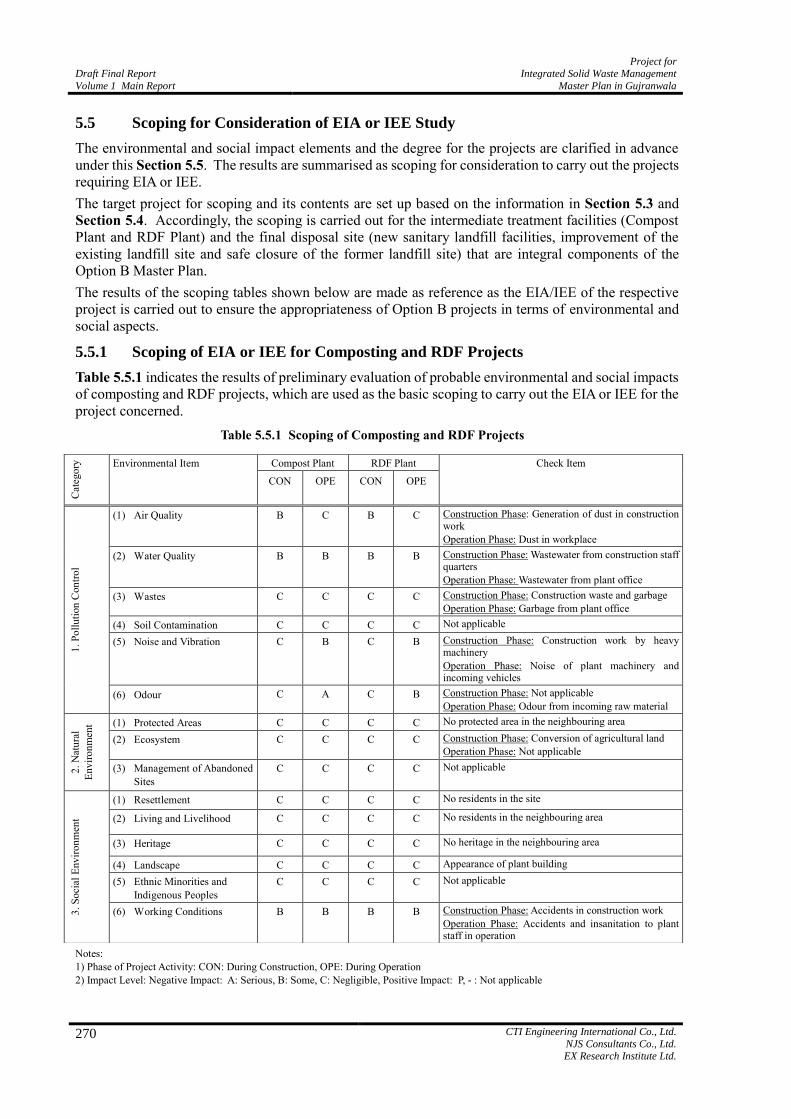
Draft Final Report
Volume 1 Main Report
Project for Integrated Solid Waste Management
Master Plan in Gujranwala
270 CTI Engineering International Co., Ltd.
NJS Consultants Co., Ltd. EX Research Institute Ltd.
5.5 Scoping for Consideration of EIA or IEE Study
The environmental and social impact elements and the degree for the projects are clarified in advance
under this Section 5.5. The results are summarised as scoping for consideration to carry out the projects
requiring EIA or IEE.
The target project for scoping and its contents are set up based on the information in Section 5.3 and
Section 5.4. Accordingly, the scoping is carried out for the intermediate treatment facilities (Compost
Plant and RDF Plant) and the final disposal site (new sanitary landfill facilities, improvement of the
existing landfill site and safe closure of the former landfill site) that are integral components of the
Option B Master Plan.
The results of the scoping tables shown below are made as reference as the EIA/IEE of the respective
project is carried out to ensure the appropriateness of Option B projects in terms of environmental and
social aspects.
5.5.1 Scoping of EIA or IEE for Composting and RDF Projects
Table 5.5.1 indicates the results of preliminary evaluation of probable environmental and social impacts
of composting and RDF projects, which are used as the basic scoping to carry out the EIA or IEE for the
project concerned.
Table 5.5.1 Scoping of Composting and RDF Projects
Notes:
1) Phase of Project Activity: CON: During Construction, OPE: During Operation
2) Impact Level: Negative Impact: A: Serious, B: Some, C: Negligible, Positive Impact: P, - : Not applicable
Cat
ego
ry
Environmental Item Compost Plant RDF Plant Check Item
CON OPE CON OPE
1.
Po
llu
tion
Con
tro
l
(1) Air Quality B C B C Construction Phase: Generation of dust in construction work
Operation Phase: Dust in workplace
(2) Water Quality B B B B Construction Phase: Wastewater from construction staff quarters
Operation Phase: Wastewater from plant office
(3) Wastes C C C C Construction Phase: Construction waste and garbage
Operation Phase: Garbage from plant office
(4) Soil Contamination C C C C Not applicable
(5) Noise and Vibration C B
C B
Construction Phase: Construction work by heavy machinery
Operation Phase: Noise of plant machinery and incoming vehicles
(6) Odour C A C B Construction Phase: Not applicable
Operation Phase: Odour from incoming raw material
2.
Nat
ura
l
Env
iro
nm
ent (1) Protected Areas C C C C No protected area in the neighbouring area
(2) Ecosystem C C C C Construction Phase: Conversion of agricultural land
Operation Phase: Not applicable
(3) Management of Abandoned
Sites
C C C C Not applicable
3.
So
cial
Env
iro
nm
ent
(1) Resettlement C C C C No residents in the site
(2) Living and Livelihood C C C C No residents in the neighbouring area
(3) Heritage C C C C No heritage in the neighbouring area
(4) Landscape C C C C Appearance of plant building
(5) Ethnic Minorities and
Indigenous Peoples
C C C C Not applicable
(6) Working Conditions B B B B Construction Phase: Accidents in construction work
Operation Phase: Accidents and insanitation to plant staff in operation

Project for Integrated Solid Waste Management
Master Plan in Gujranwala
Draft Final Report
Volume 1 Main Report
CTI Engineering International Co., Ltd.
NJS Consultants Co., Ltd. EX Research Institute Ltd.
271
5.5.2 Scoping of EIA or IEE for Waste Disposal Projects
Table 5.5.2 shows the results of preliminary evaluation of probable environmental and social impacts of
the final disposal projects at Bhakhraywali, Gondlanwala and Chianwali, which are used for the basic
scoping to carry out the EIA or IEE of the project concerned.
Table 5.5.2 Scoping of Bhakhraywali, Gondlanwala and Chianwali Landfill Projects
Notes: 1) Phase of Project Activity: CON: During Construction, OPE: During Operation
2) Impact Level: Negative Impact: A: Serious, B: Some, C: Negligible, Positive Impact: P: Not applicable
5.6 Impact Forecast
Prior to the forecasting of potential environmental impact of the projects, field surveys were conducted
in addition to collection of the baseline data described in Section 5.3 for clarifying the background
conditions of the candidate sites and the surrounding areas. Those surveys include the impacts caused in
the construction and operation phases of the facilities by factors influencing daily life (e.g., bad odour,
Cat
ego
ry
Environmental Items
Bhakhraywali
Sanitary
Landfill
Gondlanwala
Improvement
of Existing
Landfill
Chianwali
Closure of
Former Landfill
Check Items
CON OPE CON OPE CON OPE
1.
Po
llu
tion
Con
tro
l
(1) Air Quality B B B B B B Construction Phase: Generation of dust in construction work
Operation Phase: Generation of dust in landfill work. Generation of landfill gases.
(2) Water Quality B A B A B B Construction Phase:
Wastewater from construction staff quarters
Operation Phase: Wastewater from plant office; Leachate from the landfill area
(3) Wastes C C C C C C Construction Phase: Construction waste and garbage
Operation Phase: Garbage from plant office
(4) Soil
Contamination
C C C B C B Operation Phase: Contamination by heavy metals in waste.
(5) Noise and
Vibration
B B B B B C Construction Phase: Construction work by heavy machinery
Operation Phase: Noise of landfill machine and incoming vehicles
(6) Odour C A B A B B Construction Phase: Odour from the existing landfill site
Operation Phase: Odour from incoming waste
2.
Nat
ura
l
Env
iro
nm
ent (1) Protected Areas C C C C C C No protected area in the neighbouring area
(2) Ecosystem C C C C C C Construction Phase: Conversion of agricultural land
Operation Phase: Not applicable
(3) Management of
Abandoned Sites
- B - B - B Operation Phase: Safe closure and post-closure management and monitoring of the landfill site.
3.
So
cial
Env
iro
nm
ent
(1) Resettlement C C C C C C No residents in the site
(2) Living and
Livelihood
C C A A C C Measures for two residential houses at Gondlanwala landfill site.
(3) Heritage C C C C C C No heritage in the neighbouring area
(4) Landscape C B B B B P Appearance of the landfill site to the passersby.
(5) Ethnic Minorities
and Indigenous
Peoples
C C C C C C Not applicable
(6) Working
Conditions
B A B A B C Construction Phase: Accidents in construction work
Operation Phase: Accidents and insanitation to landfill operation staff
(7) Waste Pickers in
Landfill Site
- A B A - - Construction Phase: Accidents in construction work
Operation Phase: Accidents and insanitation to landfill operation staff

Draft Final Report
Volume 1 Main Report
Project for Integrated Solid Waste Management
Master Plan in Gujranwala
272 CTI Engineering International Co., Ltd.
NJS Consultants Co., Ltd. EX Research Institute Ltd.
flies and vectors, traffic jam caused by garbage collection vehicles, garbage falling down from
collection vehicles without cover on the way to the landfill site) and environmental issues (e.g., water
quality, air quality, hydrogeological situation, soil contamination, noise and vibration). In addition to the
environmental factors, the opinions of neighbouring residents and waste pickers who are the “key
stakeholders” in the waste management system were collected for analysing the impacts to the
communities.
Based on the data and information gathered through the surveys, this section examines the impacts of
major influencing factors among the impacts to the environment and social aspects, which are clarified
in the scoping of each facility in the preceding Section 5.5.
5.6.1 Construction and Operation of Central Compost Plant
(1) Outline of Compost Plant Project
Location of Construction Site : East side of Bhakhraywali Landfill Site
Site Area : 5ha
Plant Capacity : 250t/day
Plant System : Pre-treatment and windrow type composting process
Input Material : Separated organic waste
(2) Environmental and Social Impact Elements of Compost Plant Project
Air Quality
Similar to other construction projects, dust is generated during the construction work. The
construction work, especially earth work for foundation will cause a dust problem. The surface soil
in the project site consists of sandy silt to silty sand, and the small particles of surface soil are easily
blown by wind and suspended in the air.
The compost plant does not have a process to exhaust air pollutants. However, during operation,
dust could be generated in the segregation of raw materials and turning them into compost. The
dust problem during operation will result in insanitary conditions to the operation staff of the plant.
Water Quality
Generally, a camp or quarters for the construction workers is built in or nearby the construction site.
During the construction phase, wastewater discharge from kitchen, toilet and bath become a
potential source for water pollution in the neighbouring area. In the operation phase, conditions
similar with the construction phase can be seen, so that the wastewater discharged from toilet and
bath by plant operation staff is a potential source of water contamination.
Odour
The construction work does not cause odour. Raw materials for composting are derived from
organic waste of municipal waste mostly consisting of fresh market waste, kitchen waste, garden
waste, etc., which generate odour especially under the anaerobic decomposition process.
Working Conditions
Risk of accidents such as falling of objects, collapse of temporary work, and miss-operation of
construction machinery always exists among the construction workers and the passersby. During
operation of the compost plant, the risks exist in the operation of machinery and sanitation or health
risk also exists among the plant staff handling the raw materials.
5.6.2 Construction and Operation of Compost/RDF Plant
(1) Outline of Compost/RDF Plant Project
Location of Construction Site : East side of Bhakhraywali Landfill Site
Site Area : 7ha

Project for Integrated Solid Waste Management
Master Plan in Gujranwala
Draft Final Report
Volume 1 Main Report
CTI Engineering International Co., Ltd.
NJS Consultants Co., Ltd. EX Research Institute Ltd.
273
Plant Capacity (Compost Plant) : 250t/day
Plant Capacity (RDF Plant) : 250t/day
Plant System (Compost Plant) : Pre-treatment and windrow type composting process
Plant System (RDF Plant) : Pre-treatment and bailing process
Input Material (Compost Plant) : Separated organic waste
Input Material (RDF Plant) : Separated combustible waste (plastics &Paper)
(2) Environmental and Social Impact Elements of Compost/RDF Plant
Air Quality
Similar conditions with the construction of compost plant.
Water Quality
Similar conditions with the construction of compost plant.
Odour
Similar conditions with the construction of compost plant. Input raw materials to the RDF and
segregated combustible materials have less impact of odour compared with the raw material of
compost plant.
Working Conditions
Similar conditions with the construction of compost plant. Segregated combustible materials have
less odour impact compared with the raw material of compost plant.
5.6.3 Construction and Operation of New Final Disposal Facility at Bhakhraywali
(1) Outline of New Final Disposal Facility at Bhakhraywali
Location of Construction Site : Bhakhraywali, Northwest of the city, approximately 11km
from the city centre
Site Area : 26ha (First phase)
Incoming Waste Amount : 1,000t/d in 2018, 1,500t/d in 2024 and 2,000t/d in 2030
Type of Incoming Waste : Municipal solid waste (Residual waste)
Type of Landfill : Semi-aerobic type sanitary landfill
(2) Environmental and Social Impact Elements of New Final Disposal Facility at
Bhakhraywali
Air Quality
Similar to other construction projects, dust is generated during the construction work. The
construction work, especially earth work for the construction of waste containment and roads will
cause a dust problem, since surface soil in the project site consists of sandy silt to silty sand, and the
small particles of surface soil are easily blown by wind and suspended in the air.
The landfill facility does not have a process of exhausting air pollutants. However, the
biodegradable wastes in filled waste turn to landfill gas in the course of degradation. Landfill gas
includes carbon dioxide and/or methane gas, which is a cause of global warming.
Water Quality
During the construction phase, wastewater discharged from kitchen, toilet and bath become a
potential source for water contamination in the neighbouring area. In the operation phase, similar
condition with the construction phase can be seen, so that wastewater discharged from toilet and
bath by plant operation staff is a potential source of water contamination. In addition, wastewater or
leachate is generated from the waste layer and this may also bring water pollution.

Draft Final Report
Volume 1 Main Report
Project for Integrated Solid Waste Management
Master Plan in Gujranwala
274 CTI Engineering International Co., Ltd.
NJS Consultants Co., Ltd. EX Research Institute Ltd.
Soil Contamination
In the operation phase, domestic hazardous waste mixed in municipal solid waste has a potential to
cause underground soil contamination.
Noise and Vibration
A large number of construction machines and vehicles are deployed during the construction period.
These machines and vehicles will be the sources of noise and vibration in daytime. In the operation
phase, collection vehicles in/out of the disposal site and landfill machines will be potential sources
of noise and vibration problems.
Odour
The construction work will not be an odour source. In the operation phase, the decomposition of
organic waste in incoming disposal waste becomes a potential cause of odour generation.
Management of Abandoned Site
Even after completion of the landfill, the environmental impact elements represented by leachate
and landfill gas remain for years.
Landscape
Configuration of the land will change from cultivated land to landfill site. Upon completion of the
landfill, the landfill area will become higher than the surrounding area.
Working Conditions
Accidents involving the construction workers and the passersby such as falling of objects, collapse
of temporary work and miss-operation of construction machinery always exist during the
construction work. In the landfill operation, there also exist the risks of accidents by landfill
machines and health and sanitation risks to the operation staff in handling waste.
Waste Pickers in Landfill Site
If the waste pickers are allowed access to the landfill area, work accidents and health risks are
assumed causes by poor working environment in the working area.
5.6.4 Improvement Work of the Existing Landfill Facility in Gondlanwala
(1) Outline of Existing Landfill Facility in Gondlanwala
Location of Construction Site : Gondlanwala, North of the city, approximately 10km from the
city centre
Site Area : 5ha
Incoming Waste Amount : 660t/d in 2016, 830t/d in 2017
Type of Incoming Waste : Municipal Solid Waste
Type of Landfill : Controlled open dumping
(2) Environmental and Social Impact Elements of the Existing Disposal Facility in
Gondlanwala
Air Quality
Similar conditions with the construction work of new landfill facility in Bhakhraywali.
Water Quality
Similar conditions with the construction work of new landfill facility in Bhakhraywali.
Soil Contamination
Similar conditions with the construction work of new landfill facility in Bhakhraywali.

Project for Integrated Solid Waste Management
Master Plan in Gujranwala
Draft Final Report
Volume 1 Main Report
CTI Engineering International Co., Ltd.
NJS Consultants Co., Ltd. EX Research Institute Ltd.
275
Noise and Vibration
Similar conditions with the construction work of new landfill facility in Bhakhraywali.
Odour
Similar conditions with the construction work of new landfill facility in Bhakhraywali.
Management of Abandoned Site
Similar conditions with the construction work of new landfill facility in Bhakhraywali.
Living and Livelihood
There are two residential houses located in the adjacent area of landfill site. Families residing in the
houses will suffer to some extent from the construction work and landfill operation.
Landscape
Similar conditions with the construction work of new landfill facility in Bhakhraywali.
Working Conditions
Similar conditions with the construction work of new landfill facility in Bhakhraywali.
Waste Pickers in Landfill Area
Similar conditions with the construction work of new landfill facility in Bhakhraywali.
5.6.5 Closure of the Former Landfill Site in Chianwali
(1) Outline of Former Landfill Site in Chianwali
Location of Construction Site : Chianwali, South of the city, approximately 14km from the city
centre
Site Area : 5ha
Incoming Waste Amount : Landfill finished
Type of Filled Waste : Municipal Solid Waste
Type of Landfill : Open dumping
(2) Environmental and Social Impact Elements of Former Landfill Site in Chianwali
Air Quality
Similar conditions with the construction work of new landfill facility in Bhakhraywali.
Water Quality
Similar conditions with the construction work of new landfill facility in Bhakhraywali.
Soil Contamination
Similar conditions with the construction work of new landfill facility in Bhakhraywali.
Noise and Vibration
Similar conditions with the construction work of new landfill facility in Bhakhraywali.
Odour
Similar conditions with the construction work of new landfill facility in Bhakhraywali.
Management of Abandoned Site
Similar conditions with the construction work of new landfill facility in Bhakhraywali.
Landscape
Positive effect is foreseen due to final earth cover and safe closure work.

Draft Final Report
Volume 1 Main Report
Project for Integrated Solid Waste Management
Master Plan in Gujranwala
276 CTI Engineering International Co., Ltd.
NJS Consultants Co., Ltd. EX Research Institute Ltd.
Working Conditions
Similar conditions with the construction work of new landfill facility in Bhakhraywali.
5.7 Impact Assessment and Review of the Proposed Project
Under this Section 5.7, the preliminary impact assessment is carried out for the environmental impact
elements discussed in Section 5.6, and the appropriateness of the selected Master Plan Option B in the
environmental and social consideration aspects is described.
5.7.1 Impact Assessment of Each Project
Impact from the project in the construction phase and the operation phase is evaluated. Impact in the
current situation as well as in the situation that possible measures are implemented is also considered.
Major residual impacts of negative and positive aspects are summarised below.
(1) Construction and Operation of Central Compost Plant
Construction Phase: Similar to the construction work of compost plant, the most negative impacts
is the dust problem. Surface water contamination by staff quarters and the working condition of
construction workers will also cause the impacts of the project. On the other hand, the increase of
employment opportunity and community development will be counted as positive impact.
Operational Phase: Odour, noise and vibration problem due to incoming vehicles to the plant will
also be the cause of environmental impacts of plant operation. On the other hand, employment
opportunity will be the positive impact.
(2) Construction and Operation of Central Compost/RDF Plant
Construction Phase: The most negative impact will be the dust problem. In addition, surface water
contamination and working condition of the construction workers will also be cause of impacts of
the project. On the other hand, the increase of employment opportunity and community
development will be counted as positive impact.
Operational Phase: Odour problem due to handling of organic waste is the most negative impact.
In addition, noise and vibration problem due to incoming vehicles to the plant will also be the cause
of environmental impacts of plant operation. On the other hand, employment opportunity will be
the positive impact.
(3) Construction and Operation of New Final Disposal Facility at Bhakhraywali
Construction Phase: The most negative impact is the dust problem. In addition, surface water
contamination by staff quarters, noise and vibration by construction machinery, and working
condition of workers will become cause of environmental and social problems. On the other hand,
the increase of employment opportunity and community development are counted as positive
impact.
Operational Phase: Leachate and odour will become the most concerned environmental impact
elements for taking appropriate measures. Working at the disposal site increases risks of accidents
and health problems to the landfill operation workers and the waste pickers. On the other hand,
employment opportunity will be the positive impact.
(4) Improvement Work of the Existing Landfill Facility in Gondlanwala
Construction Phase: Similar to the construction work of new landfill facility in Bhakhraywali, the
negative impact will be the dust problem, surface water contamination, noise and vibration, and
working condition of the construction workers. On the other hand, the increase of employment
opportunity and community development are counted as positive impact.
Operational Phase: Similar to the landfill operation at the new landfill facility in Bhakhraywali,
the major environmental and social impacts will be generated from leachate, odour, risks of

Project for Integrated Solid Waste Management
Master Plan in Gujranwala
Draft Final Report
Volume 1 Main Report
CTI Engineering International Co., Ltd.
NJS Consultants Co., Ltd. EX Research Institute Ltd.
277
accidents, and health of the landfill operation staff and waste pickers. On the other hand,
employment opportunity will be the positive impact.
(5) Closure of the Former Landfill Site in Chianwali
Construction Phase: The most negative impacts are the dust problem. In addition, surface water
contamination, noise and vibration, working condition of the construction workers will also
become impacts to the environment and to human beings. On the other hand, the increase of
employment opportunity is counted as positive impact.
Post-closure Phase: Groundwater contamination by leachate will be the most negative impact. In
addition, the generation of landfill gasses and soil contamination by domestic hazardous waste will
be considered as the environmental and social impact elements. On the other hand, safe closure
with final earth cover and fencing will be the positive impact.
5.7.2 Review of the Impact Assessment in Environmental and Social Aspects
In this subsection, environmental and social considerations are carried out for the Master Plan Option B
that was selected as the optimum option by evaluating technical, economic and financial aspects.
Firstly, the components of Option B, specifically Composting, RDF and Final Disposal, are evaluated in
environmental and social aspects. Secondly, evaluation of Option B in terms of environmental and social
considerations is summarised.
(1) Construction and Operation of Central Compost Plant
Composting has good features for natural and social environment. Since organic waste is
biodegraded by the composting procedure, the amount of waste will be reduced. Reduction of the
amount of organic waste contributes to the reduction of negative environmental impact and
environmental load in the landfill site. Less amount of organic waste means less generation of
odour, vectors and methane gas in the landfill site. These make the lifetime of landfill site longer.
Other feature of composting is utilisation of local resource. Currently, it is planned that 125 tons of
compost will be produced by 250 tons of organic waste in the proposed compost facility. Using
natural compost is environmental friendly and it may avoid soil contamination by agricultural
activities compared to chemical fertilizer. However, using natural compost in agriculture is not
popular in Gujranwala currently, so that awareness campaign and development of end-market are
necessary to be developed.
Basically, compost facilities are environmentally safe and have no specific risk in the working
process, but odour, especially ammonia odour, would be a problem. This problem must be carefully
considered in case a compost facility is to be constructed in a residential area. However, in the
proposed Option B, the composting facility is constructed in the compound of the landfill site, and
the site is distant from the neighbouring community. Therefore, odour from the compost facility
would not be a problem to residents’ life in the situation of Option B.
For the application of compositing in ISWM, the separate collection at waste generation point is
preferably applied in advance. Organic waste that is collected separately could apply for
composting process directly. On the other hand, collecting organic waste in mixed waste is
time-taking and requires additional working process and labour force. Mixed waste
wait-to-be-separated have to be carefully controlled; otherwise, odour and dirty environment will
be a problem.
(2) Construction and Operation of RDF Plant
RDF has a good feature for waste management. It has a positive impact to waste management and
contributes to utilisation of local resource because the RDF process transforms useless material to
solid fuel. In addition, introducing a new system like RDF may stimulate residents’ interest on solid
waste management. RDF also requires separate collection in advance because the production of
RDF utilises the waste that organic materials are separated.

Draft Final Report
Volume 1 Main Report
Project for Integrated Solid Waste Management
Master Plan in Gujranwala
278 CTI Engineering International Co., Ltd.
NJS Consultants Co., Ltd. EX Research Institute Ltd.
There are some difficulties in the operation of RDF facilities. Since RDF is a relatively new
technology, producing RDF is high-cost and quality of RDF is relatively low compared to other
solid fuels. The end market where the RDF could be sold and who will buy RDF must be carefully
considered because RDF is not competitive in the market with regard to solid fuel quality. Storage
of RDF must be carefully controlled because of the possibility of fire accident. Once fire accident
happens in the storage, fire extinction takes a long time and dangerous since RDF is a type of fuel.
It is strongly recommended that difficulties are discussed with Lahore Compost, the compost
company operating the RDF in Lahore, before the implementation of RDF starts in Gujranwala.
(3) Construction and Operation of New Final Disposal Site at Bhakhraywali
Although the proposed construction site is surrounded by farmland, the site is located in a remote
area far away from the residential area, which is the most important factor for siting the
construction site. The landfill facility is designed as what is called sanitary landfill. The sanitary
landfill is superior to the conventional landfill types practiced in Pakistan. While the introduction of
sanitary landfill is required to minimise the environmental and social impacts, it becomes possible
to realise the functions of the facilities and to practice suitable landfill management.
The design of the proposed sanitary landfill facility shall have the following basic requirements to
mitigate the impacts caused by the project:
Waste containment, approach road and unloading platform for waste vehicles;
Perimeter road for monitoring, inspection and maintenance of the facilities;
Perimeter drainage to prevent surface runoff entering to the landfill containment;
Liner system to prevent leachate infiltration into the groundwater aquifer;
Leachate collection and circulation system for evaporation within the landfill area;
Buffer zone and peripheral wall to isolate the landfill area from the public road, and
Buildings for site office, weighbridge equipment, parking, etc.
The landfill operation is carried out in accordance with the requirements in the Operation Manual to
be prepared by GWMC and regulated on a daily, weekly and monthly basis. The contents of the
Operation Manual shall include, at least, the following:
Incoming waste control for measuring, recording and analysis of waste disposal;
Designation of landfill area for the day, week and month;
Regular earth covering work;
Control of leachate circulation system;
Control of odour;
Control of landfill gases;
Regular health check of the landfill operation staff;
Regular monitoring and maintenance of the facilities, and
Environmental monitoring in the site and the surrounding area.
These functions and operation works shall be assured by at least a supervisor and inspector(s)
deployed for monitoring, inspection and restoration of defective works and operation to meet the
requirements for a sanitary landfill.
By fulfilling the proposed means, the sanitary landfill in Bhakhraywali will become a successful
model for publicising this type to the other municipalities in the Punjab and in Pakistan.
(4) Improvement Work and Closure of the Existing Landfill Site in Gondlanwala
According to the result of the interview survey conducted in the E&S Survey, the opinion of
stakeholders in the vicinity of Gondlanwala and Chianwali disposal sites are similar. The opinion

Project for Integrated Solid Waste Management
Master Plan in Gujranwala
Draft Final Report
Volume 1 Main Report
CTI Engineering International Co., Ltd.
NJS Consultants Co., Ltd. EX Research Institute Ltd.
279
of the stakeholders represented by the neighbouring residents, GWMC staff and the waste pickers
are summarised in the following paragraphs.
All the stakeholders in both sites answered that they have experienced problems related to the
disposal site. Dirty access roads, odour and flies, and environmental pollution especially
groundwater degradation are the common responses. In terms of benefit of waste collection system,
a majority of them recognise that the disposal site is beneficial for Gujranwala, and the benefit is
“Collection system keeps avoiding the waste from spreading around” and “Waste does not have to
be treated or carried to any disposal point by each household separately.” On the other hand, some
negative opinions are also recorded such as “It (disposal site) creates environmental problems.”
About the management staff of GWMC, the major opinion is addressed to the current situation that
there is no soil cover to the site resulting in landscape deterioration and that the sprayed for
insecticide is of bad quality.
The issue on waste pickers is a common in solid waste management in developing countries*.
(Note:* World Bank (1999), What a Waste: Solid Waste Management in Asia. http://web.mit.edu/
urbanupgrading/ urbanenvironment/ resources/references/pdfs/ What A Waste Asia. pdf [Last visit:
August 20, 2015]) It is estimated that 35 to 40 waste pickers work regularly in the current disposal
site at Gondlanwala. Their working environment is dangerous: They do not have any protective
gear, such as gloves and proper shoes, and dirty environment increases their health risk. Since the
waste pickers do not have an alternative way to earn, they go back to the disposal site although the
authorities prohibit their activity. The efforts trying to drive them away without giving alternative
income sources has resulted in failure in other developing countries. Therefore, in order to consider
a long-term solution, supporting efforts are required to cope with the waste pickers issue instead of
just trying to drive them away from the project site.
In fact, there are many difficulties toward the satisfactory improvement of the existing landfill due
to the current situation of the widely spread landfill area. However, the proposed improvement plan
will be effective to mitigate the environmental and social impacts to the minimum. The
improvement plan is to be carried out similarly as the development plan of the Bhakhraywali
sanitary landfill system. The basic measures with the improvement or construction of the facilities
are outlined as follows:
Prevention of surface runoff entering the landfill containment;
Collection of leachate and circulation within the landfill area for evaporation, and
Installation of landfill gas vent.
Similar to the landfill operation proposed for Bhakhraywali, the landfill operation shall be
improved through regulating the daily, weekly and monthly operation, monitoring and
maintenance.
By those technical and operational measures, the Gondlanwala landfill site will revive the
environment and erase the complaints of the stakeholders described above.
The improvement work of the existing landfill to mitigate the environmental and social problems in
Gondlanwala could be a model case for the other municipalities in the Punjab and in Pakistan.
(5) Closure of the Former Landfill Site in Chianwali
The site is situated along the G.T. Road that enters the city area of Gujranwala. Heaps of discarded
waste heaps were easily visible from the cars and the passers. Although the odour problem from the
disposal site has decreased since the suspension of waste dumping, organic matter in the filled
waste layer has not completely decomposed and still cause odour and leachate problems to the
surrounding area. In order to mitigate the problems, the site has to be closed properly by
constructing/installing major facilities to prevent it from generating any pollution source, as
follows:
Grading and final earth covering of the site;

Draft Final Report
Volume 1 Main Report
Project for Integrated Solid Waste Management
Master Plan in Gujranwala
280 CTI Engineering International Co., Ltd.
NJS Consultants Co., Ltd. EX Research Institute Ltd.
Installation of landfill gas vents;
Construction of premise road for maintenance and monitoring;
Installation of leachate collection pipes, leachate pump well and leachate circulation piping;
and
Improvement of peripheral wall.
Regular environmental monitoring is to be carried out to check the degree of environmental
impacts for consideration of the necessary countermeasures for the repair and restoration of
installed facilities.
Appearance of the site has to be improved through the safe closure of the abandoned landfill site
and maintained through the monitoring plan.
5.7.3 Overall Evaluation of Selected Master Plan Option B
Option B has a great combination of the processes involved in waste management; namely, separate
collection, composting and RDF. In this combination of the three processes, the following good features
are expected, and some issues need to be considered for reducing negative impacts in future.
(1) Expected Positive Impact
The technical process mutually contributes to each other in that separate collection contributes
to the easiest application of waste to Composting/RDF, and Composting/RDF utilises
separated waste to make useful materials such as natural compost and one type of fuel;
This combination effectively contributes to reduce the amount of waste;
It reduces negative environmental impact, such as odour, vectors and methane gas;
It makes life longer for the final disposal site;
Separate Collection and Composting are not environmentally harmful and have no serious
negative impact;
Composting/RDF contributes to utilisation of local materials;
Using natural compost in agriculture will contribute to reduce environmental load compared to
chemical fertilizers; and
Separated waste is easy to control compared to mixed waste; and
Separated organic waste reduces generation of odour and vectors.
(2) Issues for Consideration
The effectiveness of the combination depends on the residents’ cooperation regarding waste
separation at household level. Awareness and environmental education become very
important;
Development of end-market of natural compost produced by the compost facility and RDF is
necessary; and
Generation of dioxin and other difficulties in the production of RDF are to be controlled before
the implementation of RDF in Gujranwala.

Project for Integrated Solid Waste Management
Master Plan in Gujranwala
Draft Final Report
Volume 1 Main Report
CTI Engineering International Co., Ltd.
NJS Consultants Co., Ltd. EX Research Institute Ltd.
281
5.8 Stakeholder Meeting
5.8.1 First Stakeholder Meeting
The first stakeholder meeting was held on
23 September 2014 at Mugal Mahal Hotel in
Gujranwala (Photo 5.8.1).
A summary of the meeting is shown in Table
5.8.1. In addition to the major stakeholders who
are landowners and residents in the project site,
related organizations participated in the meeting.
Contents of the Project, current situation of waste
management in Gujranwala, and point of
environmental and social considerations in the
Project were discussed at the meeting. According
to the discussions, stakeholders are interested in
the direction of waste management in
Gujranwala.
Table 5.8.1 Summary of the First Stakeholder Meeting
Date and Venue 23 September 2014
Mugal Mahal Hotel, Gujranwala
Participants
(Participating Organizations)
Residents/Landowners in the project site, Gujranwala Waste Management
Company (GWMC), JICA Pakistan Office, City District Government Gujranwala (CDGG), Local NGOs
Number of Participants 32 persons
Presentation Title
- Project Introduction by the Managing Director of GWMC (Dr. Haq, Managing
Director of Gujranwala Waste Management Company)
- Brief Overview of the JICA Project for Integrated Solid Waste Management in
Gujranwala (Mr. Takasugi, JICA Expert for Final Disposal Plan)
- Applying JICA Environmental Checklist for Waste Management (Ms. Tsutsui,
JICA Expert for Environmental and Social Considerations)
Discussion/List of questions
from the participants
(selected)
- Will GWMC implement the JICA Master Plan & what can be the constraints for its
implementation?
- What is the status of dump sites?
- How will GWMC utilise waste in future?
- What is the plan of GWMC for at source separation?
- Which step has GWMC taken for better unloading of waste by handcarts into the
waste containers?
- What is GWMC’s strategy to avoid waste littering during its transportation and to
guide the sanitary workers at their assigned duty place?
- What are the plans to monitor sanitary workers by operational staff?
5.8.2 Second Stakeholder Meeting
The second stakeholder meeting was held on the 9th
of June 2015 at Rachna Hotel in Gujranwala (Photo
5.8.2). A summary of the meeting is shown in Table 5.8.2. Contents of the Project, collection and
transportation plan, and disposal plan in the Project were discussed at the meeting.
Photo 5.8.1 First Stakeholder Meeting
(23 September 2014)

Draft Final Report
Volume 1 Main Report
Project for Integrated Solid Waste Management
Master Plan in Gujranwala
282 CTI Engineering International Co., Ltd.
NJS Consultants Co., Ltd. EX Research Institute Ltd.
Photo 5.8.2 Second Stakeholder Meeting
(9 June 2015)
Table 5.8.2 Summary of the Second Stakeholder Meeting
Date and Venue 9 June 2015
Rachna Hotel, Gujranwala
Participants
(Participating Organizations)
- Gujranwala Waste Management Company (GWMC)
- Landowners and residents
- JICA Pakistan Office
- Lahore Waste Management Company (LWMC)
- Urban Unit
- City District Government Gujranwala (CDGG)
- Local NGOs, Consulting companies, etc.
Number of Participants 79 persons
Presentation Title
- Outline of the project (Mr. Maeda)
- Collection and transportation plan presentation (Mr. Nakamura)
- Disposal Plan Presentation (Mr. Takasugi)
Discussion/List of questions
from the participants
(selected)
- Would the JICA Project be sustainable with political influence?
- How the involvement of the sanitary workers, being the basic unit of SWM system,
will be ensured?
- What procedure is being followed by GWMC?

Project for Integrated Solid Waste Management
Master Plan in Gujranwala
Draft Final Report
Volume 1 Main Report
CTI Engineering International Co., Ltd.
NJS Consultants Co., Ltd. EX Research Institute Ltd.
283
CHAPTER 6. PROPOSAL FOR THE ACTION PLAN
6.1 Introduction
In Chapter 4, the ISWM Master Plan has been formulated and evaluated in consideration of technical,
economic and financial, institutional and organizational aspects while the environmental and social
issues have been presented separately in Chapter 5.
The Master Plan is composed of three staged plans; namely, Short-Term Plan, Mid-Term Plan and
Long-Term Plan. The Short-Term Plan covering the period between 2016 and 2018 has been formulated
as the priority projects and each priority project is to be developed into an action plan. In this Chapter 6
the action plan proposed for each component of the Master Plan is presented in more details, including
the “what”, “when”, “how” and “who” are going to carry out the projects, as well as the required costs.
6.2 Action Plan for Waste Collection and Transportation
6.2.1 Priority Projects of Waste Collection and Transportation
Priority projects are defined as the projects proposed for the short-term period of the Master Plan and
they will be developed into the action plans in this chapter. Based on the discussions in Chapter 4, the
following are selected as the priority projects of waste collection and transportation:
Project for Introduction of Separate Collection through Implementation of a Pilot Project
Project for Increase of Waste Collection Rate in 64 UCs up to 100% in 2018
Project for Conducting Street Cleaning in 64 UCs
Project for Collection of Bulky Waste
Project for Cleaning up of Illegal Dumping Sites in 64 UCs
Project for Construction and Demolition Waste Collection
Project for Construction of Parking Area
6.2.2 Project for Introduction of Separate Collection and Alternate-Day Collection
through Implementation of a Pilot Project
(1) Formulation of Detailed Plan for the Pilot Project Area
As mentioned in Section 4.2, separate waste collection and alternate-day collection are to be
applied as the pilot project. One of the eight zones in the 64 UCs has been selected as the pilot
project area and a detailed plan is formulated for the implementation. Separation at source and
alternate-day collection are to be introduced for the first time in the city and it takes some time for
the residents to acknowledge the conduct of these new activities. GWMC needs to establish an
optimum promotion method through operation in the pilot project area. The detailed plan should
thus include a) the necessary number of collection vehicles and containers, b) the allocation of
vehicles and containers, c) specifications of required vehicles and containers, d) organization for
operation and management, and e) method of monitoring and feedback of the operations.
Commencement of separate collection and alternate-day collection all over the city, i.e., in 98 UCs,
are planned to start in 2019 in order to prepare for operation of the composting facility that has to be
started in 2020. Based on the lessons learned from the result of the pilot project, the method of
promoting the new activities in the pilot project zone shall be disseminated to the other zones in
order to spread the practice of separation at source and alternate-day collection throughout the
whole city.
Selection of Pilot Project Area (a)
The candidate zone for the pilot project should contain various types of land use and the city of
Gujranwala as a whole has various types of land use. Zone 6 is selected as a pilot project zone

Draft Final Report
Volume 1 Main Report
Project for Integrated Solid Waste Management
Master Plan in Gujranwala
284 CTI Engineering International Co., Ltd.
NJS Consultants Co., Ltd. EX Research Institute Ltd.
because this zone is congested with both residential and vacant areas such as farmland, i.e.,
several land use types can be seen in the zone.
Method of Separate Collection and Alternate-Day Collection (b)
Several units of waste containers are to be placed in each container location to conduct the
separate collection of waste. If a total of four containers are required to be placed at one site,
two containers shall be utilised for organic waste and the other two for the other wastes such as
paper or plastic waste etc. These two types of containers should be painted with different
colours to distinguish the type of waste to be discharged; for instance, a container for organic
waste is painted green and the other is painted yellow.
Simultaneously, alternate-day waste collection is also proposed in the waste collection and
transportation action plan. The alternate-day collection starts in Zone 6 as a pilot case in 2016
for establishing a good practice model. For example, the alternate-day collection will be
started by dividing the collection zone into two collection areas: one for the collection service
on Monday, Wednesday and Friday, and the other area on Tuesday and Thursday. After
establishing a good practice model by the operation in Zone 6, this model will be duplicated in
other waste collection zones from year of 2019.
In the alternate-day collection, the discharged waste which varies in amount is stored at the
container for two days. It is therefore necessary to check the waste storage condition of the
containers for adjusting the number of containers placed at each container location to meet the
actual condition.
Public announcements and public awareness campaigns on the new system are crucial to
promote acknowledgement of all the waste generators including residents and commercial
establishments. Public acknowledgement by the residents is inevitable especially for people
residing along the narrow streets where door-to-door collection is practiced for achieving the
alternate-day separate collection. Once the separate waste collection is established in Zone 6, it
could be promoted easily in the other waste collection zones.
Placement of Waste Collection Containers in the Pilot Project (c)
Two sizes of waste containers, i.e., 5m3 and 0.8m
3 containers, are to be used in the pilot
project. Each container is set to have the optimum waste collected from the source. Since the
purpose of posting the 5m3 container is to collect a large amount of waste from the source, they
are placed in a large waste discharge point such as a shopping mall, shopping centre, school,
public office and market. The purpose of the 0.8m3 container, on the other hand, is to collect
waste from households. Based on the detailed design formulated in Item (1), the necessary
number of waste containers needs to be allocated in Zone 6 by GWMC.
Zone 6 consists of farmland and residential areas and it is difficult to find an open space for the
installation of containers. Therefore, it is recommended that a large number of containers shall
be allocated at each site. In consideration of accessibility to the containers and the required
area for their placement, four units are to be installed at each site in the plan. Table 6.2.1
shows the necessary number of waste collection vehicles and containers; that is, 240 units of
containers are necessary for Zone 6 in 2018. The detailed discussion is made in Volume 2,
Supporting Report, Section B: Waste Collection and Transportation, Subsection 5.2.3.
Table 6.2.1 Necessary Number of Waste Collection Containers in Zone 6
Item 2016 2017 2018
5m3 Container 24 24 24
0.8m3 Container 110 170 240

Project for Integrated Solid Waste Management
Master Plan in Gujranwala
Draft Final Report
Volume 1 Main Report
CTI Engineering International Co., Ltd.
NJS Consultants Co., Ltd. EX Research Institute Ltd.
285
Figure 6.2.1 shows the
allocation plan of waste
containers in Zone 6. Since
4 units of containers are to be
dispatched in one location, the
waste containers are located in
60 locations (240/4=60
locations). These container
locations need to be relocated
flexibly during the operation if
there are requests from the
residents or an optimal container
location is found during the
waste collection operation.
Waste Collection Vehicle Fleet Allocation in the Pilot Project (d)
For secondary collection, a combination of 13m3 compactor, 7m
3 compactor and 4m
3
compactor is to be utilised to support a 1m3 mini-dumper. The area for each collection vehicle
is defined as follows:
13m3 compactor: these vehicles are dispatched for large streets such as Bypass Road and
other major streets.
7m3 compactor: these vehicles are dispatched for wide streets and major streets except the
above.
4m3 compactor: these vehicles are dispatched for narrow streets.
1m3 mini-dumper: these vehicles are dispatched for narrow streets to assist in the
secondary collection.
5m3 arm-roll truck: these vehicles are dispatched for collecting waste from markets and
shopping centres.
Tractor trolley: these vehicles are dispatched for narrow streets.
Based on the detailed design formulated in the above Item (1), the necessary number of waste
collection vehicles need to be allocated in Zone 6 by GWMC.
Zone 6 consists of main streets such as Bypass Road, wide streets and narrow streets.
Considering these street conditions, adequate type of vehicles has to be dispatched to the zone.
Table 6.2.2 shows the necessary number of waste collection vehicles for Zone 6 (see detail in
Volume 2, Supporting Report, Section B: Waste Collection and Transportation, Subsection
5.2.4.). As many as 37 units of waste collection vehicles are required in 2018.
Table 6.2.2 Necessary Number of Waste Collection Vehicles in Zone 6
Item 2016 2017 2018
5m3 Arm-Roll Truck 3 3 3
Tractor Trolley 4 4 4
13m3 Compactor 2 2 10
7m3 Compactor 5 8 10
4m3 Compactor - - 5
1m3 Mini-Dumper 5 5 5
Total 19 22 37
Figure 6.2.1 Waste Container Allocation Plan in Zone 6

Draft Final Report
Volume 1 Main Report
Project for Integrated Solid Waste Management
Master Plan in Gujranwala
286 CTI Engineering International Co., Ltd.
NJS Consultants Co., Ltd. EX Research Institute Ltd.
Figure 6.2.2 shows the dispatch
of waste collection vehicles in
Zone 6. The 13m3 and 7m
3
compactors are dispatched on the
main street (green zone). In
addition, since most of the
markets or shopping centres are
situated along the main street,
arm-roll trucks are also allocated.
On the other hand, most parts of
the residential area are congested
and the streets consist of wide and
narrow streets. It is, therefore,
difficult to dispatch a specific
type of waste collection vehicle
and hence 7m3 compactors, 4m
3
compactors and mini-dumpers are
applied in the area (blue zone).
Moreover, there are some vacant
areas in Zone 6, and houses are sparsely-distributed. Besides, the width of road is relatively wide in
these areas and hence 7m3 compactors are dispatched (red zone). The allocation plan should be
modified from time to time to obtain the optimum efficiency during operation.
(2) Procurement of Waste Collection Vehicles and Containers for the Pilot Project
Based on the detailed waste collection and transportation plan formulated in Item (1), the necessary
number of waste collection vehicles and containers needs to be procured by GWMC. Some 13m3
compactors, 7m3 compactors, 4m
3 compactors are utilised for waste collection and mini-dumpers
are utilised to assist in the primary collection. Additionally, 5m3 containers and 8m
3 containers are
utilised for waste collection. For reference, the general specifications of each vehicle and container
coming from local manufacturers are presented in Volume 2, Supporting Report, Section B: Waste
Collection and Transportation, Subsection 5.2.2.
GWMC shall procure the equipment from 2016 up to 2018 based on the plan. For this purpose,
GWMC has to prepare documents and submit them to the Provincial Government for the annual
budgetary arrangement for procurement of waste collection vehicles and waste containers.
(3) Operation of Waste Collection and Transportation Services in the Pilot Project
For implementing the waste collection and transportation work in the pilot project, the task of each
staff must be defined clearly. The job description for each appointment is as follows:
General Manager Operation: The General Manager Operation is responsible for the overall
operation of the waste collection and transportation services. The General Manager receives reports
from the Senior Manager and submits them to the Managing Director. He is also responsible for
giving instructions to the Senior Manager for solving problems on daily waste collection and
transportation operation.
Senior Manager: The Senior Manager is responsible for receiving the reports from the Assistant
Manager and forwards them to the General Manager Operation. The Senior Manager also gives
instructions to the Assistant Manager for solving problems on the matter concerned.
Assistant Manager: The Assistant Manager is responsible for reporting the situation to the
General Manager Operation once the Assistant Manager receives the report from the Inspector(s).
In addition, the Assistant Manager conveys the instructions from the General Manager Operation to
the Inspector(s).
Figure 6.2.2 Vehicle Fleet Allocation Plan in Zone 6

Project for Integrated Solid Waste Management
Master Plan in Gujranwala
Draft Final Report
Volume 1 Main Report
CTI Engineering International Co., Ltd.
NJS Consultants Co., Ltd. EX Research Institute Ltd.
287
Inspector: The Inspector is responsible for grasping the condition of waste collection and
transportation on each waste collection zone reported by the Supervisor, and reports it to the
Assistant Manager. The Inspector consults with the Assistant Manager and obtains direction from
the Assistant Manager over field work problems encountered at site. The Inspector together with
the Supervisor solves the problems through instruction and guidance to the Supervisor.
An operation manual of waste collection and transportation should be prepared by a task force
organized by the representative staff of GWMC. The manual must be completed by the beginning
of 2016. The manual may be revised as necessary to meet the actual condition in consideration of
effectiveness and efficiency of the work. The contents of the waste collection and transportation
manual are described in Volume 2, Supporting Report, Section B: Waste Collection and
Transportation, Subsection 5.2.7.
The manual has to be compiled in a booklet form and copies of the manual provided to all waste
collection workers. All waste collection workers have to follow the work procedures stated in the
manual to carry out the services more efficiently. In addition, regular training sessions for workers
must be conducted for assuring/enhancing the knowledge on waste collection operation under the
Comprehensive Capacity Development Programme (CCDP) proposed in Volume 2, Supporting
Report, Section G: Institutional Strengthening and Organizational Restructuring, Subsection
4.3.2.
(4) Monitoring and Feedback of Pilot Project Operation
Regular monitoring of waste collection amount and waste collection rate must be carried out by
GWMC for evaluating performance of the waste collection and transportation service in the pilot
project. The monitoring of waste collection vehicles and waste containers is not only to check the
operation status of daily waste collection work, but also to improve the waste collection efficiency
and effectiveness by feedback from the information on the daily work. Especially, the allocation of
waste collection vehicles and waste collection containers should be monitored carefully since it is
linked with the waste collection efficiency and effectiveness.
Monitoring items are stipulated in the operation manual prepared under the activities of the above
Item (3), and the monitoring items and method must be established in the beginning of 2016. The
required minimum monitoring items for waste collection and transportation are proposed as
follows:
Weighbridge record for analysis of waste collection amount and collection service rate;
Sanitation condition around the waste containers;
Status of operation condition of separate collection;
Status of operation condition of regular time collection and alternate-day collection;
Working status of waste collection vehicles and waste containers; and
Allocation of waste collection vehicles and waste collection containers.
6.2.3 Project for Increase of Waste Collection Rate in 64 UCs up to 100% in 2018
(1) Formulation of Detailed Waste Collection and Transportation Plan for Waste
Collection Rate in 64 UCs up to 100% in 2018
Increasing the waste collection rate in 64 UCs up to 100% in 2018 is the ultimate target for the
short-term period of the Master Plan. To achieve the target, it is necessary to formulate a detailed
waste collection and transportation plan in the early part of 2016. The contents of the detailed plan
should include an allocation plan for the adequate number of waste collection vehicles, waste
containers and sanitary workers on each zone in 64 UCs. Once the waste collection vehicles, waste
containers and sanitary workers are in operation on site based on the plan, GWMC needs to acquire
feedback and update the allocation of equipment and human resources on each zone if something

Draft Final Report
Volume 1 Main Report
Project for Integrated Solid Waste Management
Master Plan in Gujranwala
288 CTI Engineering International Co., Ltd.
NJS Consultants Co., Ltd. EX Research Institute Ltd.
has to be improved. The optimum waste collection and transportation plan, therefore, shall be
established during the operation phase.
(2) Necessary Number of Waste Collection Vehicles and Containers in 64 UCs
For allocating the waste collection vehicles and waste collection containers, necessary number of
waste collection vehicles and waste collection containers are distributed based on the waste
generation amount in each zone and the total number of waste collection vehicles and waste
collection containers except Zone 6. Table 6.2.3 shows the necessary number of waste collection
vehicles and containers in other zones from 2016 to 2018. The actual number/type of waste
collection vehicles and containers for the respective zones except Zone 6 shall be distributed and
adjusted in consideration of the site conditions, such as road width and surrounding land use, etc.,
although the required number of waste collection vehicles and containers for each zone is presented
in Volume 2, Supporting Report, Section B: Waste Collection and Transportation, Subsection
5.3.1.
Table 6.2.3 Necessary Number of Waste Collection Vehicles and Containers in Other Zones
(2016-2018)
Item 2016 2017 2018
Vehicle 10m3 Arm-Roll Truck 4 4 4
5m3 Arm-Roll Truck 19 19 19
Tractor Trolley 33 33 33
13m3 Compactor 12 27 67
7m3 Compactor 33 49 89
4m3 Compactor 0 0 35
1m3 Mini-Dumper 30 30 30
Container 10m3 Container 10 10 10
5m3 Container 171 171 171
0.8m3 Container 850 1,490 2,010
(3) Procurement of Waste Collection Vehicles and Containers in 64 UCs
Based on the distribution of waste collection vehicles and containers shown in the above Item (2),
the necessary number of waste collection vehicles and containers needs to be procured by GWMC
between 2016 and 2018. The general specifications of each vehicle and container are the same as
those of Zone 6 (see detail in Volume 2, Supporting Report, Section B: Waste Collection and
Transportation, Subsection 5.2.2.).
(4) Operation of Waste Collection and Transportation Services in 64 UCs
GWMC also requires commencement of the waste collection and transportation operation not only
in Zone 6 but also in other zones in 2016. The operation and management of waste collection and
transportation services are the same as those of Zone 6 mentioned in Subsection 6.2.2, Item (3).
However, separation at source starts in the other zones from 2019, so that items required for
separation at source are not needed to be included during the operation in other zones until end of
2018.
(5) Monitoring and Feedback of Operation in 64 UCs
Monitoring and feedback of the waste collection and transportation work are conducted in other
zones. As mentioned in Subsection 6.2.2, Item (4), regular monitoring of waste collection amount
and waste collection rate is also necessary to be carried out by GWMC for evaluating performance
of the waste collection and transportation service. The contents of monitoring items are the same as
those of Zone 6; however, items required for separation at source are not needed to be monitored on
site as mentioned in Subsection 6.2.2, Item (4).

Project for Integrated Solid Waste Management
Master Plan in Gujranwala
Draft Final Report
Volume 1 Main Report
CTI Engineering International Co., Ltd.
NJS Consultants Co., Ltd. EX Research Institute Ltd.
289
6.2.4 Project for Conducting Street Cleaning in 64 UCs
(1) Plan for Conducting Street Cleaning
The necessary length for street cleaning is determined at 2,600 km based on the measurement by
using a satellite map, as presented in Subsection 4.4.1, Item (8). Also, as mentioned in the same
subsection, the street sweeper is applied for major roads like G.T. Road and Bypass Road in
Zones 9 and 10 while the road washing machine is applied for roads in the other zones.
The speed of the street sweeper is assumed to be 6 km per hour in average and the vehicle travels
8 hours per day. Thus, total travel distance of a street sweeper in a day is 48km per vehicle per day.
If GWMC covers Zones 9 and 10 with a total road length of 665 km for street cleaning, one vehicle
shall be dispatched on each zone and two vehicles are necessary for the street cleaning in total.
Calculation of the street cleaning frequency by street sweepers is as follows:
665 km / 48 (km/day) / 2 vehicles = 6.9 days = 7 days (once a week)
Therefore, the street cleaning on the same place in Zones 9 and 10 is conducted once a week.
If GWMC dispatches four vehicles for street cleaning by road washers, calculation of the street
cleaning frequency is as follows:
2,600 km / 48 (km/day) / 4 vehicles = 13.5 days = 14 days (once in two weeks)
Therefore, the street cleaning on the same place in the other zones is conducted once in two weeks.
(2) Necessary Number of Vehicles for Street Cleaning
GWMC is obliged to conduct street cleaning in all the 64 UCs within the short-term period. The
necessary number of vehicles in this period is estimated at two street sweepers and four road
washers.
(3) Specifications of Street Cleaning Vehicles
The street sweeper is a truck of 8.8 gross tonnes with a 4m3 of waste storage tank and a 1,000 litre
water tank. Brushes are equipped at both sides of the body for cleaning road surfaces and curbs by
sprayed water. The road washer is larger than the street sweeper. The general specifications of
each street cleaning vehicle are presented in Volume 2, Supporting Report, Section B: Waste
Collection and Transportation, Subsection 5.4.3, and the typical shape of each vehicle is as shown
in Photo 6.2.1 below.
Street Sweeper Road Washer
Photo 6.2.1 Typical Shape of Street Cleaning Vehicles
6.2.5 Project for Collection of Bulky Waste
(1) Plan for Conducting Bulky Waste Collection
The purpose of the project for collection of bulky waste is the collection of green waste from parks
in the city and old furniture from households. There are 36 public parks in Gujranwala and the total

Draft Final Report
Volume 1 Main Report
Project for Integrated Solid Waste Management
Master Plan in Gujranwala
290 CTI Engineering International Co., Ltd.
NJS Consultants Co., Ltd. EX Research Institute Ltd.
area is approximately 580,000 square metres (m2). All parks are shown in Volume 2, Supporting
Report, Section B: Waste Collection and Transportation, Table B.5.15. The largest park in the
city is the Gulshan-e-Iqbal Park (106,000 m2) abutted on G.T. Road. There are also trees along the
streets. Green waste is generated from the parks and the streets. The project is to start in 2016 and it
continues until 2030.
Bulky waste is not occasionally generated from the source so that necessary vehicles and workers
for these wastes are deployed separately from the regular collection by GWMC. GWMC needs to
travel and collect green waste from parks in the city on regular basis starting from 2016. However,
old furniture is collected by GWMC when a concerned resident calls up for the waste collection.
GWMC should set the price schedule for bulky waste collection such as old furniture, etc.
GWMC operates 6 days in a week, so that 36 parks/ 6 days = 6 parks/day. GWMC is able to collect
green waste from 6 parks in a day. If a resident needs to dispose bulky waste, GWMC also collects
the waste during the operation.
(2) Necessary Number of Vehicles for Bulky Waste
As planned in the master plan stated in Chapter 4, two units of 5-ton trucks and one wheel loader
are deployed for the collection of bulky wastes. The workers are deployed as one team comprised of
one driver and one sanitary worker per 5-ton truck and one driver for a wheel loader. The team
works in 6 days from Monday to Saturday.
(3) Specifications of the Bulky Waste Collection Vehicles
The maximum lifting capacity of 8 to 10 ton and 2,800 to 3,000 kg is required for a 5-ton truck and
a wheel loader for the bulky waste collection and transportation, respectively. The general
specifications of each vehicle are presented in Volume 2, Supporting Report, Section B: Waste
Collection and Transportation, Subsection 5.5.3.
6.2.6 Project for Cleaning Up of Illegal Dumping Sites in 64 UCs
(1) Plan for Cleaning Up the Illegal Dumping Sites
GWMC needs to eliminate all illegal dumping sites in the city between 2016 and 2018. To achieve
this goal, GWMC should firstly examine all locations of illegal dumping sites in the city.
Planning the Clean-Up Schedule and Formation of Clean-Up Team (a)
The number of illegal dumping sites is estimated at 799 locations as of August 2014 based on
the survey conducted by GWMC Waste Managers. The number of illegal dumping sites to be
cleaned is set as follows:
799 locations / 6 days /4 weeks /12 months / 3years = 0.9 location/day; that is, GWMC has to
clean one illegal dumping site per day if GWMC considers to eliminate all the illegal dumping
sites in the city in three years. However, GWMC has to provide ordinary waste collection
services for households and commercial establishments on a daily basis so that a clean-up
team is to be established exclusively for cleaning the illegal dumping sites in this action plan.
The composition and capacity of the clean-up team are determined under the following
procedures:
Step 1: The number of trips for a 5-ton truck is set at 5 based on the number of trips of arm-roll
truck in the result of Time and Motion Study because both types of truck are similar in
machinery.
Step 2: Two units of 5-ton truck are dispatched for cleaning up the illegal dumping sites
because one truck is loaded with waste while the other truck hauls the waste to the landfill site.
For loading waste to a 5-ton truck, one wheel loader is deployed.
Step 3: The loading capacity is assumed to be 5 tons per vehicle. Therefore, 5 tons × 5
trips/day × 2 vehicles = 50 ton/day = 1,200 ton/month (6 working days, 4 weeks).

Project for Integrated Solid Waste Management
Master Plan in Gujranwala
Draft Final Report
Volume 1 Main Report
CTI Engineering International Co., Ltd.
NJS Consultants Co., Ltd. EX Research Institute Ltd.
291
Step 4: Minimum waste collection amount is calculated at 604 ton/month (remaining waste:
21,739 tons/36 months).
Step 5: If only one 5-ton truck is deployed for the work, the waste collection amount per month
is 600 ton/month (5 ton × 5 trips/day × 1 vehicle = 25 ton/day = 600 ton/month (6 working
days, 4 weeks). This amount is less than the required minimum amount.
Step 6: Therefore, the clean-up vehicles should be composed of two 5-ton trucks and one
wheel loader.
Step 7: In this case, the duration of clean-up is 21,739 (ton) /1,200 (ton/month) = 18 months.
The clean-up work is finished in around one-and-a-half year.
Monitoring the Cleaned Sites after Conducting the Activity (b)
Once the cleaning activity is conducted on a site, GWMC should monitor the site consistently
through patrol by an inspector and/or a sanitation supervisor. If illegal dumping activity is seen
on site, they have to stop the activity.
Conducting Public Awareness Campaign and Posting of Signboard (c)
Not only patrol of the site but also public awareness campaign is indispensable for keeping
cleanliness at the site. For instance, a signboard is installed to warn that illegal dumping of
waste is prohibited at the site.
(2) Necessary Number of Vehicles for the Clean-Up of Illegal Dumping Sites
Two units of 5-ton trucks, one wheel loader and two workers are required for the work. The
assigned vehicles and workers conduct only the cleaning work and are excluded from the regular
waste collection work.
(3) Specifications of Vehicles for Clean-Up of Illegal Dumping Sites
The specifications of 5-ton truck and wheel loader are the same as those in the preceding
Subsection 6.2.5, Item (3).
6.2.7 Project for Construction and Demolition Waste Collection
(1) Plan for C&D Waste Collection
As mentioned in Subsection 4.4.1, Item (11), the collection and disposal of construction and
demolition waste (C&D waste) is a part of GWMC’s obligation according to the survey conducted
by the JICA Project Team, while disposal is the responsibility of generators of C&D waste.
Necessary number of C&D waste collection vehicles is taken into account for the action plan
starting from 2016 and it continues until 2030 in the master plan. Since C&D waste is consisted of
construction materials such as rocks, sand, concrete, reinforcement bar, brick, etc., a waste
compactor is not suitable for the collection work and the work is to be carried out separately from
the ordinary waste collection services.
In addition, C&D waste is generated from commercial activity and its collection should be
conducted primarily by private waste collection companies with GWMC’s supervision, if
necessary. However, the current situation demands that GWMC has to conduct the work
immediately. Thus, the schedules of collection charges by GWMC should be determined based on
the estimation of costs of operating and maintaining the vehicles and manpower.
(2) Necessary Number of Vehicles for C&D Waste Collection
Target waste is so heavy that it is difficult for a sanitary worker to load the waste. Thus, one unit of
wheel loader is deployed for C&D waste loading and three units of 5-ton trucks are also deployed
for the transportation of waste.

Draft Final Report
Volume 1 Main Report
Project for Integrated Solid Waste Management
Master Plan in Gujranwala
292 CTI Engineering International Co., Ltd.
NJS Consultants Co., Ltd. EX Research Institute Ltd.
(3) Specifications of Vehicles for C&D Waste Collection
The specifications of the 5-ton truck and wheel loader are the same as those of the preceding
Subsection 6.2.5, Item (3).
6.2.8 Project for Construction of Parking Area
(1) Plan for Construction of Parking Area
The function of a parking area is to store collection vehicles at night after waste collection and
transportation work. The number of collection vehicles has been increasing and the collection rate
has improved, so that additional parking areas for procured vehicles are necessary in the future. The
project starts in 2016 and it continues until 2030.
The parking area does not have the minimum function of repair work because the garage has the
capability of repair work and it is centralised for efficiency.
(2) Necessary Number of Parking Areas
In 2030, the total number of vehicles becomes 612 vehicles. However, the existing garage could
accommodate only approximately 100 vehicles. Hence, the designated number of vehicles in one
parking area is set as 100 vehicles. This number has the same capacity as the existing parking area.
Necessary number of parking areas is calculated as follows:
Total number of vehicles 612 / 100 vehicles per parking area = 6 parking areas.
Therefore, 612/6 = 102 vehicles per parking area.
Based on the calculation, the capacity of parking area is designed for the parking capacity of 102
vehicles. The function of the parking area is only to park vehicles. The repair work is performed in
the existing garage.
Table 6.2.3 shows the annual number of vehicles (for years 2016 to 2018). As mentioned in
Subsection 4.1.10, Construction of Parking Area, parking area needs to accommodate 100
vehicles and the average parking area is set as 600 sq. metres. However, the total area varies
depending on the acquisition and/or location of the area.
Table 6.2.4 Annual Number of Vehicles (Year 2016-2018)
Year 2016 2017 2018
Number of Waste Collection Vehicles 161 196 316
Number of Parking Area 2 2 4
The existing garage has a limited roofed area so that most of the vehicles are soaked with rainwater,
especially in the monsoon season. To prevent the situation, roofing is set for the parking area. In
addition, installation of roofing is required for the existing garage.
Pavement is also required for the new parking area and existing garage to improve work efficiency
and condition.
(3) Specifications of the Parking Area
Based on the following specifications of the new parking, GWMC needs to build new parking areas
for waste collection vehicles:
Size of the area: 6,000m2
Parking area: The area could accommodate 102 vehicles.
Roofing: Steel skeleton structure
Pavement: Asphalt-paved, 30mm thick
Security system: 1 unit of guardhouse; fencing around the parking area

Project for Integrated Solid Waste Management
Master Plan in Gujranwala
Draft Final Report
Volume 1 Main Report
CTI Engineering International Co., Ltd.
NJS Consultants Co., Ltd. EX Research Institute Ltd.
293
For security reasons, one guardhouse is built and steel fence is installed around the facility. The
place where vehicles are parked is covered with a steel skeleton building for protection against rain.
The existing garage has no pavement and no roofing in parking area. The cost for improvement of
the garage is included in the plan.
Necessary pavement area on existing garage: 30mm thick, 3,735m2
Necessary roofing area on existing garage: steel skeleton structure, 1,344m2
6.2.9 Implementation Schedule and Costs
Actions and costs required for the implementation of the Action Plan for Waste Collection and
Transportation are summarised in Figure 6.2.3 and Table 6.2.5.
Figure 6.2.3 Implementation Schedule of the Action Plan for Waste Collection and Transportation
Q1 Q2 Q3 Q4 Q1 Q2 Q3 Q4 Q1 Q2 Q3 Q4
WBS for Short-Term Plan
S-1-1
Introduction of Separate Collection and Alternate day collection through
Implementation of Pilot Project
S-1-1-1 Formulation of Detailed Plan for the Pilot Project Area
S-1-1-2 Procurement of Waste Collection Vehicles and Containers for Pilot Project
S-1-1-3 Operation of Waste Collection and Container
S-1-1-4 Monitoring and Feedback of the Pilot Project Operation
S-1-2 Increasing of Waste Collection Ratio in 64 UCs up to 100% in 2018
S-1-2-1
Formulation of Detailed Design for Waste Collection Ratio in 64 UCs up to 100%
in 2018
S-1-2-2 Procurement of Waste Collection Vehicles and Containers in 64UCs
S-1-2-3 Operation of Waste Collection and Container
S-1-2-4 Monitoring and Feedback of the Operation
S-1-3 Conducting Street Cleaning in 64UCs
S-1-3-1 Plan for conducting Street Cleaning in 64UCs
S-1-3-2 Procurement of Waste Collection for Street Cleaning
S-1-3-3 Conducting Street Cleaning in 64UCs
S-1-4 Collection of bulky waste
S-1-4-1 Procurement of Waste Collection for Bulky Waste
S-1-4-2 Collection of bulky waste
S-1-5 Cleaning up of illegal dumping sites in 64 UCs
S-1-5-1 Procurement of Waste Collection illegal dumping sites in 64UCs
S-1-5-2 Cleaning up of illegal dumping sites in 64 Ucs
S-1-6 Collection of Construction and Demolition Waste
S-1-6-1 Plan for Collection of Construction and Demolition Waste
S-1-6-2 Collection of Construction and Demolition Waste
S-1-7 Construction of Parking area
S-1-7-1 Construction of Paking area
Quarter
Time Framework of the Master Plan Short-Term Plan Period
Year2016 2017 2018

Draft Final Report
Volume 1 Main Report
Project for Integrated Solid Waste Management
Master Plan in Gujranwala
294 CTI Engineering International Co., Ltd.
NJS Consultants Co., Ltd. EX Research Institute Ltd.
Table 6.2.5 Implementation Cost of the Action Plan for Waste Collection and Transportation
6.3 Action Plan for Final Disposal
6.3.1 Priority Projects of Final Disposal
Priority projects are defined as the projects proposed for the short-term period of the Master Plan and
they are to be developed as action plans in this chapter. Based on the discussions in Chapter 4, the
following are selected as the priority projects of final disposal:
Project for Procurement of Sanitary Landfill Site
Project for Engineering Service for Sanitary Landfill Facilities (Stage 1)
Project for Construction of Sanitary Landfill Facilities (Stage 1) in Bhakhraywali
Project for Procurement of Landfill Machinery
Project for Operation and Maintenance of Landfill Facilities
Project for Improvement Work of the Existing Landfill in Gondlanwala
2016 2017 2018
S-1-1
Introduction of Separate Collection and Alternate day collection through
Implementation of Pilot Project
143,525 52,343 40,523 50,659
S-1-1-1 Formulation of Detailed Plan for the Pilot Project Area GWMC
S-1-1-2 Procurement of Waste Collection Vehicles and Containers for Pilot Project 78,420 34,500 19,680 24,240
S-1-1-3 Operation of Waste Collection and Container 65,105 17,843 20,843 26,419
S-1-1-4 Monitoring and Feedback of the Pilot Project Operation GWMC
S-1-2 Increasing of Waste Collection Ratio in 64 UCs up to 100% in 2018 1,649,399 288,028 394,639 966,732
S-1-2-1 Formulation of Detailed Design for Waste Collection Ratio in 64 UCs up to 100% in 2018 GWMC
S-1-2-2 Procurement of Waste Collection Vehicles and Containers in 64UCs 998,675 137,457 207,077 654,141
S-1-2-3 Operation of Waste Collection and Container 650,724 150,571 187,562 312,591
S-1-2-4 Monitoring and Feedback of the Operation GWMC
S-1-3 Conducting Street Cleaning in 64UCs 80,384 67,328 6,528 6,528
S-1-3-1 Plan for conducting Street Cleaning in 64UCs GWMC
S-1-3-2 Procurement of Waste Collection for Street Cleaning 60,800 60,800
S-1-3-3 Conducting Street Cleaning in 64UCs 19,584 6,528 6,528 6,528
S-1-4 Collection of bulky waste 31,990 23,730 4,130 4,130
S-1-4-1 Procurement of Waste Collection for Bulky Waste 19,600 19,600
S-1-4-2 Collection of bulky waste 12,390 4,130 4,130 4,130
S-1-5 Cleaning up of illegal dumping sites in 64 UCs 23,773 22,382 1,391
S-1-5-1 Procurement of Waste Collection illegal dumping sites in 64UCs 19,600 19,600
S-1-5-2 Cleaning up of illegal dumping sites in 64 Ucs 4,173 2,782 1,391
S-1-6 Collection of Construction and Demolition Waste 23,070 7,690 7,690 7,690
S-1-6-1 Plan for Collection of Construction and Demolition Waste GWMC
S-1-6-2 Collection of Construction and Demolition Waste 23,070 7,690 7,690 7,690
S-1-7 Construction of Parking area 523,480 126,424 3,546 393,510
S-1-7-1 Construction of Paking area 523,480 126,424 3,546 393,510
Total (Short-Term) 2,475,621 587,925 458,447 1,429,249
Annual Cost
Programme 1: Waste Collection and Transportation Plan
Short-Term Plan
WBS
No.
WBS
Total Budget
(Thousand Rs.)

Project for Integrated Solid Waste Management
Master Plan in Gujranwala
Draft Final Report
Volume 1 Main Report
CTI Engineering International Co., Ltd.
NJS Consultants Co., Ltd. EX Research Institute Ltd.
295
Project for Safe Closure of the Landfill Site in Gondlanwala
Project for Safe Closure of the Landfill Site in Chianwali
Project for Monitoring of Final Disposal in Bhakhraywali
Project for Post-Closure Monitoring of Gondlanwala and Chianwali Landfill Sites
6.3.2 Project for Procurement of Sanitary Landfill Site
Negotiation for the acquisition of construction site has been made and agreement has almost been
reached. However, the boundary line shown in Figure 4.5.3 is suspected to lack credibility because there
is a part that is not along the existing farmland. Confirmation of the boundary line shall thus be carried
out again in the presence of the landlord(s), because acceptance of the site boundary is necassary as
advance preparation before proceeding with the signing of acquisition contract and payment
immediately after approval of the 2015/2016 budget.
The road at both side banks along the irrigation canal (canal bank road) from Ali-Pur Chatha Road as
shown in Figure 4.5.4 is used for access road. One-way traffic will be imposed, using the south-side
road for access and the north-side road for exit. Since the width of the existing bridge over the irrigation
canal is narrow and not suitable for passage of large vehicles, a new bridge with a minimum 40-ton
traffic load is constructed across the irrigation canal. In addition, since several sections of the north-side
road are narrow, a field survey shall be carried out carefully to determine the boundary for the road
improvement work. Approval of the Irrigation Department is a must for the road improvement work,
including the construction of bridge and use of the road for the purpose of waste management services.
By the end of July 2015, an application has been submitted to obtain the approval. All the processes for
the approval and/or agreement have to be completed as the requirement for allocation of the project
budget.
6.3.3 Project for Engineering Service for Sanitary Landfill Facilities (Stage 1)
GWMC shall organize a project management unit (PMU) with the deployment of one chief engineer,
two assistant engineers and two office clerks. The PMU shall firstly enter into a consulting service
contract with an engineering service company for performing the role of project consultant which will
conduct on behalf of the project proponent a series of step-wise works required for implementation and
management of the construction project of Bhakhraywali sanitary landfill (SLF) facilities. The
consultant will also advice, assist and support the project proponent to make timely and appropriate
approval required from time to time in the course of implementation of the project. The construction
project of Bhakhraywali will be implemented mainly by three parties: GWMC, consultants and
contractors.
Major activities in this Project are described below and details of each component are presented in
Volume 2, Supporting Report, Section C: Final Disposal, Section 5.3.
(1) Preliminary and Detail Design Works
The consultant shall perform the preliminary design based on the conceptual design of the Action
Plan that is presented in detail in Volume 2, Supporting Report, Section C: Final Disposal. The
preliminary design must be subject to approval by the project proponent, GWMC. Based on the
approved preliminary design drawings, the consultant will prepare the detail design drawings that
make up the tender document to facilitate accurate cost estimates for the construction contract
tender. The detail design work shall include preparation of quantity take-off, unit cost analysis,
priced bill of quantities, design criteria, report and calculation in addition to the tender drawings.
The conceptual design drawings of Bhakhraywali SLF facilities are presented from Figure 6.3.1 to
Figure 6.3.3.
(2) Preparation of Tender Document
The consultant is to prepare the document for competitive bidding of the construction of
Bhakhraywali sanitary landfill facilities in the final stage of the design work. With regard to the

Draft Final Report
Volume 1 Main Report
Project for Integrated Solid Waste Management
Master Plan in Gujranwala
296 CTI Engineering International Co., Ltd.
NJS Consultants Co., Ltd. EX Research Institute Ltd.
preparation of contract documents and general conditions of contract, it is preferable to take into
consideration the conditions of standard contract of GWMC as much as possible.
(3) Preparation of Bill of Quantities
Calculation of the Bill of Quantities shall commence with the preparation of construction quantity
take-off sheets of the facilities, equipment, devices and temporary works required to construct,
install and procure for completing the construction work as intended in the design. Each item
composing the Bill of Quantities shall be itemised to coincide with the regular payment items for
the work done. The consultant will also prepare the unit cost analysis/estimates for each item of the
Bill of Quantities with reference to the latest market price announced by the government and the
quotation from the manufacturers.
(4) Support for Tender Evaluation
The consultant shall support the tender evaluation in each process from pre-qualification of the
interested bidders until signing of the construction work contract.
(5) Construction Supervision
The consultant shall supervise the construction work in the construction stage and to assist/advice
GWMC and the contractor to perform the construction work in accordance with the drawings,
specifications and the construction time schedule.
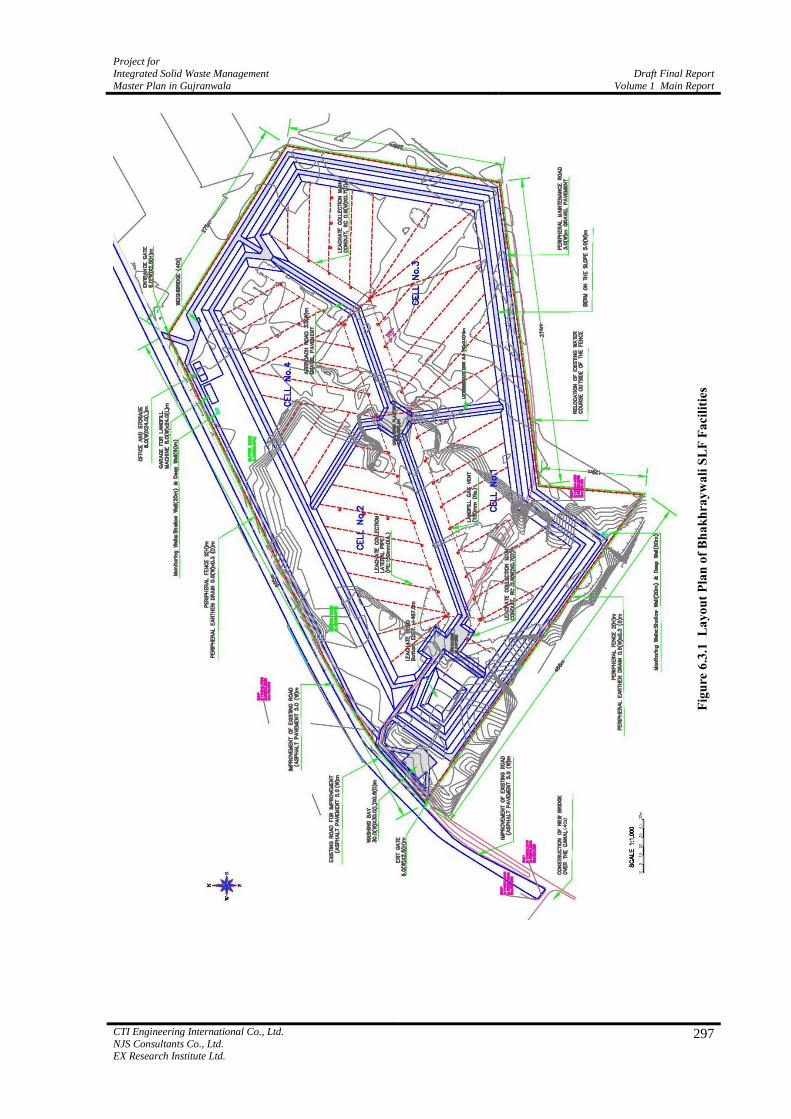
Project for Integrated Solid Waste Management
Master Plan in Gujranwala
Draft Final Report
Volume 1 Main Report
CTI Engineering International Co., Ltd.
NJS Consultants Co., Ltd. EX Research Institute Ltd.
297
Fig
ure
6.3
.1
La
yo
ut
Pla
n o
f B
ha
kh
ray
wa
li S
LF
Fa
cili
ties

Draft Final Report
Volume 1 Main Report
Project for Integrated Solid Waste Management
Master Plan in Gujranwala
298 CTI Engineering International Co., Ltd.
NJS Consultants Co., Ltd. EX Research Institute Ltd.
Fig
ure
6.3
.2
Pro
file
of
Bh
ak
hra
yw
ali
SL
F F
aci
liti
es

Project for Integrated Solid Waste Management
Master Plan in Gujranwala
Draft Final Report
Volume 1 Main Report
CTI Engineering International Co., Ltd.
NJS Consultants Co., Ltd. EX Research Institute Ltd.
299
Fig
ure
6.3
.3
Det
ail
s o
f M
ajo
r F
aci
liti
es o
f B
ha
kh
ray
wa
li S
LF
Fa
cili
ties

Draft Final Report
Volume 1 Main Report
Project for Integrated Solid Waste Management
Master Plan in Gujranwala
300 CTI Engineering International Co., Ltd.
NJS Consultants Co., Ltd. EX Research Institute Ltd.
6.3.4 Project for Construction of Sanitary Landfill Facilities (Stage 1) in
Bhakhraywali
Development of sanitary landfill facilities is divided into three (3) stages under the Master Plan period
from 2016 to 2018. In the first stage of development or the action plan, the landfill containment of
20 hectares is constructed together with the associated facilities. In addition, improvement of the
existing canal bank road on both sides of the main irrigation canal and construction of the new bridge are
included in the first stage of development work. The construction work period will take 15 to 18 months
and the contractor shall complete the construction work by the end of 2017 or at the latest in early 2018.
The contractor shall construct, install and procure all the works in consideration of the items described in
Volume 2, Supporting Report, Section C: Final Disposal, Section 5.4.
6.3.5 Project for Procurement of Landfill Machinery
(1) Preparation of Tender Document
In total, seven (7) units of landfill machine are required in 2018. Since three (3) units of bucket
tractors exist as of May 2015, an additional of four (4) units shall be procured by 2018. Preparation
of the tender documents will be carried out by the consultant hired for the procurement of landfill
machine. The required tender document will be similar to the document prepared for the
construction work of Bhakhraywali SLF facilities presented in Volume 2, Supporting Report,
Section C: Final Disposal, Section 5.5.
(2) Procurement and Inspection
During the short-term period from 2016 to 2018, the procurement of landfill machinery will be
executed twice in 2016 and in 2017 as listed in Table 6.3.1. The landfill machinery shall be
inspected upon delivery at site and operation instructions shall be provided by the
supplier/manufacturer.
Table 6.3.1 Landfill Machine Procured in the Short-Term Period
6.3.6 Project for Operation and Maintenance of Landfill Facilities
(1) Preparation of Operation and Maintenance Manual
Landfill operation is scheduled to start in the beginning of 2018 at Bhakhraywali. Accordingly, a
landfill plan and a landfill operation and maintenance manual shall be prepared in advance of the
commencement of landfill operation. The manual shall be prepared based on the relevant rules,
regulations and guidelines in consideration of the specific conditions of the Bhakhraywali landfill
site. The contents of Landfill Operation and Maintenance Manual are shown as example in
Volume 2, Supporting Report, Section C: Final Disposal, Subsection 5.6.1.
(2) Operation and Maintenance of Landfill Facilities
In order to carry out appropriate landfill operation and maintenance of the landfill facilities, the key
issues are input with capable human resources, sufficient number of staff and landfill
machine/equipment and adequate financing for operation and management. Some of the key factors
and major activities for the landfill operation and maintenance of Bhakhraywali landfill facilities
are as follows and the detailed discussion of each factor are made in Volume 2, Supporting Report,
Section C: Final Disposal, Subsection 5.6.2.
Landfill
Machine
Procurement Year Specifications
2016 2017
Wheel Loader 1
Bucket Size 3.3m3, Output Capacity 149kW or 202hp
Excavator 1
Bucket Size 1.5m3, Output Capacity 200kW or 272hp
Bulldozer 2 Chain Dozer, Blade Width 3.9m or wider, Output Capacity 165kW or 220hp

Project for Integrated Solid Waste Management
Master Plan in Gujranwala
Draft Final Report
Volume 1 Main Report
CTI Engineering International Co., Ltd.
NJS Consultants Co., Ltd. EX Research Institute Ltd.
301
Staffing for Operation and Maintenance of Bhakhraywali SLF Facilities
Basic Conditions of Landfill Operation
Measuring Incoming Waste Amount
Management of Landfill Work in General
Landfill Operation
Landfill Operation Records and Reports
Regular Monitoring, Inspection, Maintenance and Repair of Facilities
6.3.7 Project for Improvement Works of the Existing Landfill in Gondlanwala
(1) Design of Improvement Works
Improvement works are carried out to provide the required minimum functionality to the existing
disposal site for upgrading the landfill work. The main purpose of the improvement works is to
change the existing open dumping method from the top of the landfill area to the method of
unloading waste in the bottom of the landfill area and piling up of the waste layer. The
improvement works will be carried out mainly by GWMC and partly by the hired contractor for
some special works. Based on this concept, the consultant shall prepare the work drawings in
accordance with the conceptual design of the Action Plan which is presented in Figure 6.3.4. The
other details, such as hydraulic profile for leachate circulation system, required facilities,
specifications and dimension for improvement of the current landfill operation are described in
Volume 2, Supporting Report, Section C: Final Disposal, Subsection 5.7.1.
(2) Implementation of Improvement Works
The improvement works will be carried out mainly by GWMC staff responsible for landfill
operation. The works will be carried out as free time or idling time and extra work of the staff.
Some of the special works such as installation of leachate collection conduit, leachate pump well,
piping, power supply, landfill gas venting system, etc. may be carried out by the construction
contractor hired by GWMC as required. The improvement work to be conducted by the
contractor(s) shall follow the requirements similar to the description in Subsection 6.3.4, Project
for Construction of Sanitary Landfill Facilities (Stage 1) in Bhakhraywali. Funding of this
project shall be secured by the annual budget of GWMC or the project funding by the Government
of the Punjab.

Draft Final Report
Volume 1 Main Report
Project for Integrated Solid Waste Management
Master Plan in Gujranwala
302 CTI Engineering International Co., Ltd.
NJS Consultants Co., Ltd. EX Research Institute Ltd.
Fig
ure
6.3
.4
La
yo
ut
Pla
n o
f Im
pro
vem
en
t W
ork
at
Go
nd
lan
wa
la E
xis
tin
g D
isp
osa
l S
ite

Project for Integrated Solid Waste Management
Master Plan in Gujranwala
Draft Final Report
Volume 1 Main Report
CTI Engineering International Co., Ltd.
NJS Consultants Co., Ltd. EX Research Institute Ltd.
303
6.3.8 Project for Safe Closure of Landfill Site in Gondlanwala
(1) Design of Safe Closure Work of Gondlanwala Disposal Site
Safe closure work of Gondlanwala is scheduled in 2018 after the Bhakhraywali SLF facilities
become operational. If the proposed improvement work is carried out properly, it is not necessary to
implement a special safe closure work except the requirement for final soil cover and extension of
gas vent pipes. Accordingly, the design of safe closure work of Gondlanwala will be carried out by
GWMC with reference to the description, specifications and dimension as shown in Volume 2,
Supporting Report, Section C: Final Disposal, Subsection 5.8.1.
(2) Implementation of Safe Closure Work of Gondlanwala Disposal Site
The safe closure work of Gondlanwala will be carried out mainly by the landfill operation staff of
GWMC as free time or idling time and extra work. Some of the special works such as extension of
gas vent pipes may be carried out by the construction contractor hired by GWMC as required. The
closure work to be conducted by the contractor(s) shall follow the requirements similar to the
description in Subsection 6.3.4, Project for Construction of Sanitary Landfill Facilities (Stage 1)
in Bhakhraywali. Funding of this project shall be secured under the annual budget of GWMC or
the project funding by the Government of the Punjab.
6.3.9 Project for Safe Closure of Landfill Site in Chianwali
(1) Design of Safe Closure Work of Chianwali Disposal Site
Safe closure work is carried out to provide the required minimum facilities and work to the former
Chianwali landfill site. The main purpose of this closure work is to facilitate safe closure of the
former landfill site to mitigate the probable negative environmental impacts in the surrounding
area. The closure work will be carried out mainly by GWMC and partly by the hired contractor for
some special works. The consultant shall prepare the work drawings based on this conceptual
design of the Action Plan which is presented in the following subsections together with the
descriptions of required facilities, specifications and dimensions for safe closure of the former
landfill site in Chianwali. The conceptual design drawings of safe closure work of the former
Chianwali disposal site are presented in Figure 6.3.5. (See detail in Volume 2, Supporting Report,
Section C: Final Disposal, Subsection 5.9.1.)
(2) Implementation of Safe Closure Work of Chianwali Disposal Site
The closure work will be carried out mainly by GWMC staff responsible for landfill operation. The
work will be carried out as free time or idling time and extra work of the staff. Some of the special
works such as installation of leachate collection pipes, leachate pump well, leachate circulation
force main, power supply, landfill gas venting system, etc. shall be carried out by the construction
contractor hired by GWMC as required. The closure work to be conducted by the contractor(s) shall
follow the requirements similar to the description in Subsection 6.3.4, Project for Construction of
Sanitary Landfill Facilities (Stage 1) in Bhakhraywali. Funding of this project shall be secured
under the annual budget of GWMC or the project funding by the Government of the Punjab.

Draft Final Report
Volume 1 Main Report
Project for Integrated Solid Waste Management
Master Plan in Gujranwala
304 CTI Engineering International Co., Ltd.
NJS Consultants Co., Ltd. EX Research Institute Ltd.
Fig
ure
6.3
.5
La
yo
ut
Pla
n o
f S
afe
Clo
sure
Wo
rk a
t C
hia
nw
ali
Fo
rmer
Dis
po
sal
Sit
e

Project for Integrated Solid Waste Management
Master Plan in Gujranwala
Draft Final Report
Volume 1 Main Report
CTI Engineering International Co., Ltd.
NJS Consultants Co., Ltd. EX Research Institute Ltd.
305
6.3.10 Project for Monitoring of Final Disposal in Bhakhraywali
Monitoring of landfill work and waste disposal facilities is an integral part of operation and maintenance
of final disposal activities. The series of activities for monitoring, inspection and restoration work plays
an important role in practicing the sanitary landfill operation. The monitoring plan being proposed
hereunder consists of monitoring of landfill facilities and the environmental elements closely related
with conducting waste disposal operation and evaluating the stability of landfill layer. The
environmental monitoring related with compliance of EIA and the relevant laws, rules and regulations
will be stated separately under Section 5.4.
(1) Preparation of Monitoring Plan of Landfill Facilities
GWMC shall prepare a monitoring plan having items of regular monitoring and inspection for the
main landfill facilities and associated facilities, such as access road, waste containment facility,
stormwater drainage, impermeable liner system, leachate collection and circulation system, landfill
gas vent, weighbridge, power supply and so on. The actual monitoring/inspection plan of each
facility stated above shall also be prepared. In addition, landfill status shall be monitored by the
major parameters like incoming waste amount, rate of subsidence, leachate quality, and
temperature of landfill layer. (See detailed in Volume 2, Supporting Report, Section C: Final
Disposal, Subsection 5.10.1.)
(2) Monitoring of Landfill Facilities and the Environment
Monitoring/Inspection of the landfill facilities, status of landfill and environmental monitoring will
be carried out under the responsibilities of assistant landfill manager and landfill supervisors.
Conducting facility monitoring and inspection is an essential part of maintaining the function of
sanitary landfill facilities. All facilities and equipment comprising the waste disposal facility shall
be monitored/inspected/checked regularly, daily, weekly or monthly depending on the facility, and
measures evaluated repaired and/or restored to maintain the functionality of facilities and for
preventive measures. Environmental and social impacts caused by the landfill facilities and landfill
work will be monitored and evaluated separately under the activities of Volume 2, Supporting
Report, Section H: Environmental and Social Considerations, Section 5.3.
6.3.11 Project for Post-Closure Monitoring of Gondlanwala and Chianwali Disposal
Sites
After the completion of safe closure work, the assistant landfill manager and his team members will
carry out the post closure monitoring based on the requirements stated in the Landfill Operation and
Maintenance Manual in which some of the details are described in Volume 2, Supporting Report,
Section C: Final Disposal, Section 5.11. In addition, the post closure monitoring of environmental and
social impacts will be carried out in accordance with the requirements proposed under Volume 2,
Supporting Report, Section H: Environmental and Social Considerations, Section 5.4.
(1) Overview of Management of Post Closure Landfill Site
Post closure monitoring is carried out for the purpose of avoiding the negative environmental
impacts and risks attributed to the closed landfill site. Accordingly, the administrator of the site
must ensure that public health and the environment are protected by instituting appropriate
measures in monitoring, analysing problems and restoration work of the abandoned landfill site.
The overview for management of post closure monitoring will include but not limited to the
following items:
Basic Concepts of Safe Closure;
Disposal Site Stability Indicator;
Utilisation of Post-Closure Land;
Legal Process of Safe Closure of Disposal Sites; and

Draft Final Report
Volume 1 Main Report
Project for Integrated Solid Waste Management
Master Plan in Gujranwala
306 CTI Engineering International Co., Ltd.
NJS Consultants Co., Ltd. EX Research Institute Ltd.
Roles of Stakeholders.
(2) Control of Leachate and Landfill Gas
Generation of leachate and landfill gas will continue for a considerably long period after closure of
the landfill site. Operation, maintenance, monitoring and restoration work will be required for the
purpose of limiting and controlling the negative impacts of the closed site. The post monitoring
team will be required to carry out the activities, at least, of the following items:
Operation and maintenance of leachate circulation system;
Maintenance of stormwater drainage system and restoration as required;
Maintenance of landfill gas vent system and repair as required; and
Monitoring of leachate quality and landfill gas concentration (Refer to Volume 2, Supporting
Report, Section H: Environmental and Social Considerations, Table H.5.4).
(3) Control of Land Subsidence
Monitoring the status of the facility and final soil cover and the measures shall be taken against the
influence of subsidence caused by decomposition of the waste layer. The major activities include
the following:
Monitoring and analysis of subsidence of original ground;
Monitoring and analysis of subsidence of waste/final cover layer; and
Restoration of subsidence to meet the requirements of post closure use of the site.
(4) Monitoring the State of Stabilisation of Landfill
Several parameters must be determined for evaluating the stabilisation status of the landfill site.
Site abolition procedures will be made after ensuring the stabilisation of the landfill site. The main
parameters and activities for monitoring and evaluating the status of stabilisation are listed below:
Preparation of closure criteria of landfill site;
Determination of parameters for monitoring the stabilisation (leachate quality, groundwater
quality, landfill gas concentration, rate of subsidence of landfill site, etc.);
Monitoring and analysis of the parameters; and
Evaluation of the annual trends of monitoring record of the parameters.
(5) Utilisation and Management of Safe Post-Closure of Landfill Site
Safe closure and maintenance plan is formulated in response to the purpose of utilisation of the
disposal site in addition to closing the site safely against the probable pollution source. With regard
to the post closure site use planning, as well as the maintenance work until ensuring the site
stability, the management work during the period shall be carried out based on the following key
activities:
Preparation of post closure site plan in compliance with the land use plan of CDGG;
Evaluation of stabilisation parameters monitored;
Development of the site to meet with the post closure utilisation plan.
6.3.12 Implementation Schedule and Costs
Actions and costs required for the implementation of the Action Plan for Final Disposal are summarised
in Figure 6.3.6 and Table 6.3.2.

Project for Integrated Solid Waste Management
Master Plan in Gujranwala
Draft Final Report
Volume 1 Main Report
CTI Engineering International Co., Ltd.
NJS Consultants Co., Ltd. EX Research Institute Ltd.
307
Figure 6.3.6 Implementation Schedule of the Action Plan for Final Disposal
Q1 Q2 Q3 Q4 Q1 Q2 Q3 Q4 Q1 Q2 Q3 Q4
WBS for Short-Term Plan
S-2-1 Procurement of Sanitary Landfill Site
S-2-2 Engineering Service for Sanitary Landfill Facilities (Stage 1)
S-2-2-1 Preliminary Design & Detail Design
S-2-2-2 Preparation of Tender Document
S-2-2-3 Preparation of Bill of Quantities
S-2-2-4 Support for Tender Evaluation
S-2-2-5 Construction Supervision
S-2-3 Construction of Sanitary Landfill Facilities (Stage 1) in Bhakhraywali
S-2-3-1 Implementation of Construction Work
S-2-3-2 Management of Construction Work and Workmanship
S-2-4 Procurement of Landfill Machinery
S-2-4-1 Preparation of Tender Document
S-2-4-2 Procurement and Inspection
S-2-5 Operation and Maintenance of Landfill Facilities
S-2-5-1 Preparation of Operation and Maintenance Manual
S-2-5-2 Landfill Operation and Maintenance of Landfill Facilities
S-2-6 Improvement Work of the Existing Landfill in Gondlanwala
S-2-6-1 Design of Improvement Work of Gondlanwala Disposal Site
S-2-6-2 Implementation of Improvement Work of Gondlanwala Disposal Site
S-2-7 Safe Closure of Landfill Site in Gondlanwala
S-2-7-1 Design of Safe Colosure Work
S-2-7-2 Implementation of Safe Closure Work
S-2-8 Safe Closure of Landfill Site in Chianwali
S-2-8-1 Design of Safe Colosure Work of Chianwali Disposal Site
S-2-8-2 Implementation of Safe Closure Work of Chianwali Disposal Site
S-2-9 Monitoring of Final Disposal in Bhakhraywali
S-2-9-1 Preparation of Monitoring Plan of Landfill Facilities
S-2-9-2 Monitoring of Landfill Facilities and the Environment
S-2-10 Post-Closure Monitoring of Gondlanwala and Chianwali Disposal Sites
Quarter
2018
Short-Term Plan Period
Year
Time Framework of the Action Plan
2016 2017

Draft Final Report
Volume 1 Main Report
Project for Integrated Solid Waste Management
Master Plan in Gujranwala
308 CTI Engineering International Co., Ltd.
NJS Consultants Co., Ltd. EX Research Institute Ltd.
Table 6.3.2 Implementation Cost of the Action Plan for Final Disposal
6.4 Action Plan for Intermediate Treatment and 3R Promotion
6.4.1 Priority Projects of Intermediate Treatment and 3R Promotion
Priority projects are defined as the projects proposed for the short-term period of the Master Plan and
they will be developed into the action plans in this chapter. Based on the discussions in Chapter 4, the
following are selected as the priority projects of intermediate treatment and 3R promotion:
Project for Awareness and IEC (Information, Education and Communication) Campaign on
Resource Recovery
Project for Implementation of Simplified WACS
Project for Preparation for PPP and Formation of a Committee of the BOD of GWMC
2016 2017 2018
S-2-1 Procurement of Sanitary Landfill Site 150,000 150,000
S-2-2 Engineering service for Sanitary Landfill Facilities (Stage 1) 99,680 49,840 49,840
S-2-2-1 Preliminary Design & Detail Design
S-2-2-2 Preparation of Tender Document
S-2-2-3 Preparation of Bill of Quantities
S-2-2-4 Support for Tender Evaluation
S-2-2-5 Construction Supervision 49,840 24,920 24,920
S-2-3 Construction of Sanitary Landfill Facilities (Stage 1) in Bhakhraywali 996,802 492,751 504,051
S-2-3-1 Implementation of Construction Work 897,122 443,476 453,646
S-2-3-2 Management of Construction Work and Workmanship 99,680 49,275 50,405
S-2-4 Procurement of Landfill Machinery 70,350 31,500 38,850
S-2-4-1 Preparation of Tender Document 3,350 1,500 1,850
S-2-4-2 Procurement and Inspection 67,000 30,000 37,000
S-2-5 Operation and Maintenance of Landfill Facilities 72,151 18,669 21,859 31,623
S-2-5-1 Preparation of Operation and Maintenance Manual
S-2-5-2 Landfill Operation and Maintenance of Landfill Facilities
S-2-6 Improvement Work of the Existing Landfill in Gondlanwala 55,902 55,902
S-2-6-1 Design of Improvement Work of Gondlanwala Disposal Site 5,082 5,082
S-2-6-2 Implementation of Improvement Work of Gondlanwala Disposal Site 50,820 50,820
S-2-7 Safe Closure of the Landfill Site in Gondlanwala 26,196 26,196
S-2-7-1 Design of Safe Closure Work 2,381 2,381
S-2-7-2 Implementation of Safe Closure Work 23,815 23,815
S-2-8 Safe Closure of the Landfill Site in Chianwali 34,544 34,544
S-2-8-1 Design of Safe Closure Work of Chianwali Disposal Site 3,140 3,140
S-2-8-2 Implementation of Safe Closure Work of Chianwali Disposal Site 31,404 31,404
S-2-9 Monitoring of Final Disposal in Bhakhraywali GWMC
S-2-9-1 Preparation of Monitoring Plan of Landfill Facilities GWMC
S-2-9-2 Monitoring of Landfill Facilities and the Environment GWMC
S-2-10 Post-Closure Monitoring of Gondlanwala and Chianwali Disposal Sites GWMC
Total (Short-Term) 1,505,625 798,662 614,600 92,363
72,151 18,669 21,859 31,623
WBS
No.
WBS
Programme 2: Final Disposal Plan
Short-Term Plan
49,840 24,920
Total Budget
(Thousand Rs.)
Annual Cost
24,920

Project for Integrated Solid Waste Management
Master Plan in Gujranwala
Draft Final Report
Volume 1 Main Report
CTI Engineering International Co., Ltd.
NJS Consultants Co., Ltd. EX Research Institute Ltd.
309
Project for Implementation of Land Preparation by GWMC
Project for Engineering Service for Detailed Design of a Compost Plant by SPV
6.4.2 Project for Awareness and IEC Campaign on Resource Recovery
During the Short-Term Plan (2016-2018), awareness raising and IEC (Information, Education and
Communication) campaign on 3R (Reduce, Reuse, Recycle) is to be conducted together with the action
plan project for development and implementation of educational programmes to enhance
knowledge/awareness on solid waste management (SWM) and 3R promotion. These programmes are to
target primary school teachers, students, and the general public in Gujranwala under the Environmental
Education and Public Awareness Raising Plan presented in the following Section 6.5.
GWMC has the important role of 3R resource recovery during not only the Short-Term Plan
(2016-2018), but also the Mid-Term Plan (2019-2014) and the Long-Term Plan (2015-2030). The
Communication Unit will be the focal point of GWMC when it comes to public relations. This unit will
serve as the information dissemination point and where the general public makes inquiries about SWM
in GWMC. The staffing of the Communication Unit is discussed in more detail in Volume 2, Supporting
Report, Section E: Environmental Education and Public Awareness Raising Plan, Section 5.2.
Proposed activities such as 1) development of manual for environmental education programmes at
schools; 2) development of educational materials for school programmes; 3) selection of target schools;
and 4) implementation of the environmental education programmes at schools, are presented in more
detail in Volume 2, Supporting Report, Section E: Environmental Education and Public Awareness
Raising Plan, Section 5.3.
6.4.3 Project for Implementation of Simplified WACS
The Solid Waste Amount and Composition Survey (WACS) was conducted in 2014 as a part of the
project to identify the amounts and composition of different types of waste generated in Gujranwala
City. The results and analysis of the WACS are to be used for the basic data to formulate the waste
collection, 3R, intermediate treatment and waste disposal plans for the review, updating and formulation
of the SWM Master Plan.
The WACS is to be conducted once a year during the Short-Term Period (2016-2018) by GWMC.
GWMC has a number of experienced staff for WACS who worked with the JICA Project Team in 2014
and 2015; for instance, 5 waste managers and 3 research assistants have had experiences and possess the
knowhow to conduct the survey and to compile the data. They will be the main members of the team to
conduct the WACS three times during the Short-Term Period (2016-2018). The survey items and
contents are also basically the same as the WACS conducted during the JICA Study in 2014 and 2015 as
follows:
Waste Amount Survey;
Waste Composition Survey; and
Three (3) Component Analysis, Carbon and Nitrogen Analysis, and Moisture Contents Analysis.
6.4.4 Project for Preparation for PPP and Formation of a Committee of the BOD of
GWMC
A new compost company which is tentatively called “Gujranwala Central Compost and RDF Plant” is
proposed to start its operation in 2020 during the mid-term period (2019 to 2024). The new company
which is under the PPP (Public-Private-Partnership) scheme, BOT (Build-Operate-Transfer) basis is
recommended in the Master Plan.
In order to establish the new compost company in Gujranwala, it is necessary for the SPV (Special
Purpose Vehicle) to ensure the steps of preparing for the private service contract under BOT basis
during the short-time period (2016-2018) as follows:
Step 1: Approval by the Board of Directors (BOD) of GWMC on the advertisement and the Terms of
Reference (TOR) for PPP and formation of the BOD committee (one month);
Draft Final Report
Volume 1 Main Report
Project for Integrated Solid Waste Management
Master Plan in Gujranwala
310 CTI Engineering International Co., Ltd.
NJS Consultants Co., Ltd. EX Research Institute Ltd.
Step 2: Invitation for Expression of Interest (EOI) to participate in the PPP, formation of the
Committee and pre-qualification of companies/bidders;
Step 3: Shortlisting and verification of credentials of participating companies/bidders; preparation
of tender documents;
Step 4: Bidding necessary for the SPV;
Step 5: Holding of committee meeting to discuss and approve the shortlisted companies;
Step 6: Presentation of shortlisted companies to the BOD of GWMC;
Step 7: Finalisation of an approved company;
Step 8: Award of Contract; and
Step 9: Conduct of TOR by awarded SPV.
According to the MD of GWMC, the whole process will take about 6 months (Step 1 to Step 7) and
finished by the year 2017 before the preparation for procurement of the land (7 ha) for the compost plant
and the engineering detailed design of the plant. The awarded company will thus be the SPV during the
contract period and hence the owner of the compost plant in the project. All the required terms for the
awarded SPV are to be stipulated in the TOR signed between GMWC and SPV, as shown in detail in
Volume 2, Supporting Report, Section D: Intermediate Treatment and 3R Promotion Plan, Section
5.4.
6.4.5 Project for Implementation of Land Preparation by GWMC
The BOD of GWMC will prepare the plan for the procurement of the land for the compost plant project
based on the TOR. The TOR shall specify that the required land is to be procured and provided for the
SPV before the start of construction of the compost plant project in 2019 and the start for the detailed
design engineering services in 2018. The land area of approximately 7 ha shall be located in flat fields
and adjacent to the first phase compound of the final landfill site at Bhakhraywali in accordance with the
master plan. So far, there has been no actual action taken by GWMC for the land yet, because
preparation of the development plan of the final landfill site is still in progress.
6.4.6 Project for Engineering Services for the Detailed Design of a Compost Plant by
SPV
(1) Assumed General Arrangement and Detailed Design of the SPV Project
The detailed design of the compost plant by SPV is to be started and completed within 2018.
Effective performance monitoring requires that the SPV is responsible for the operation and
management of the compost plant project and the BOD of GWMC may also be required to conduct
joint monitoring, whether or not the service contract is actually and properly delivered financially.
This matter has to be stipulated in the TOR.
Although the contents of the TOR are not available at this moment and no award has yet been made
to the SPV, general requirements for preparation of the tender documents, bill of quantities, tender
evaluation, and construction supervision are required for the SPV’s project in general. Some points
for each issue are addressed in Volume 2, Supporting Report, Section D: Intermediate Treatment
and 3R Promotion Plan, Subsection 5.6.1.
(2) Quality Control of SPV’s Compost
As mentioned in Section 2.4, the quality control of compost production of the SPV’s project is not
satisfactory for the farmers’ requirement. In this context, compost production by the SPV should be
satisfactory for the farmers’ needs and the following should be described clearly in the contract and
the technical specifications between the SPV and the BOD of GWMC as mentioned in the TOR:
Organic matters of compost from the SPV should be 35%~45% or more, and the bulk density

Project for Integrated Solid Waste Management
Master Plan in Gujranwala
Draft Final Report
Volume 1 Main Report
CTI Engineering International Co., Ltd.
NJS Consultants Co., Ltd. EX Research Institute Ltd.
311
of compost produced by Gujranwala Compost Company should be generally about 0.5~0.8
t/m3;
A mix of organic matters and cow-dung should be used for the SPV’s mature compost and the
SPV should search for a proper mix proportion of compost. Cow-dung is more available in
Gujranwala City and its surrounding areas than in Lahore. It is therefore expected that better
mature compost production with more organic contents in Gujranwala can be produced;
It is also advised that the expected pilot farm in the complex of the SPV’s plant area should be
managed and be well-organized by SPV, and be open to the public for revealing the effective
result of compost at the field;
The SPV shall get a licence for compost production from the Agricultural Department
Directorate of Soil Fertility, Lahore, Government of the Punjab. However, it is recommended
that quality control of the SPV’s compost should be maintained and improved effectively;
Compost production should be recorded properly to measure how much kilogramme of
compost is sold or unsold daily, including searching for a good market of compost; and
Besides being required for the quality control of SPV’s compost, IEC programmes on
effectiveness and safety of SPV’s compost is further needed for the famers/residents.
6.4.7 Implementation Schedule and Costs
Actions and costs required for the implementation of the Action Plan for Intermediate Treatment and 3R
Promotion are summarised in Figure 6.4.1 and Table 6.4.1.
Figure 6.4.1 Implementation Schedule of the Action Plan for Intermediate Treatment and 3R Promotion
Table 6.4.1 Implementation Cost of the Action Plan for Intermediate Treatment and 3R Promotion
Q1 Q2 Q3 Q4 Q1 Q2 Q3 Q4 Q1 Q2 Q3 Q4
WBS for Short-Term Plan
S-3-1 Awareness & IEC Campaign on Resources Recovery
S-3-2 Implementation of Simplified WACS
S-3-3 Preparation for PPP & Formation of a Committee of the BOD of GWMC
S-3-4 Implementation of Land Preparation by GWMC
S-3-5 Engineering Service for Detailed Design of the Compost Plant by SPV
Quarter
Time Framework of the Master Plan Short-Term Plan Period
Year2016 2017 2018
2016 2017 2018
S-3-1 Awareness & IEC Campaign on Resources Recovery GWMC 0 0 0
S-3-2 Implementation of Simplified WACS GWMC 0 0 0
S-3-3 Preparation for PPP & Formation of a Committee of the BOD of GWMC BOD/GWMC 0 0 0
S-3-4 Implementation of Land Preparation by GWMC BOD/GWMC 0 0 0
S-3-5 Engineering Service for Detailed Design of the Compost Plant by SPV 40,000 0 0 40,000
Total (Short-Term) 40,000 0 0 40,000
Total Budget
(Thousand Rs.)
Annual Cost
Programme 2: Intermediate Treatment and 3R promotion Plan
Short-Term Plan
WBS
No.
WBS

Draft Final Report
Volume 1 Main Report
Project for Integrated Solid Waste Management
Master Plan in Gujranwala
312 CTI Engineering International Co., Ltd.
NJS Consultants Co., Ltd. EX Research Institute Ltd.
6.5 Action Plan for Environmental Education and Public Awareness Raising
6.5.1 Priority Projects of Environmental Education and Public Awareness Raising
Priority projects are defined as the projects proposed for the short-term period of the Master Plan and
they will be developed into the action plans in this chapter. Based on the discussions in Chapter 4, the
following are selected as the priority projects of environmental education and public awareness raising:
Project for Capacity Development of Communication Unit to Strengthen Coordination among
Relevant Bodies
Project for Development and Implementation of Educational Programmes Targeting Primary
School Teachers and Students to Enhance Knowledge/Awareness on SWM and 3R Promotion
Project for Development and Implementation of Educational Programmes Targeting the General
Public to Enhance Knowledge/Awareness on SWM and 3R Promotion
6.5.2 Project for Capacity Development of Communication Unit to Strengthen
Coordination among Relevant Bodies
(1) Establishment of the Communication Unit
The Communication Unit will be the focal point of GWMC when it comes to public relations. This
unit will serves as the information dissemination point and where the general public can make
inquiries about solid waste management in GWMC. The Unit will work closely with the Waste
Managers of GWMC.
The Communication Unit should be composed of eight (8) staff of GWMC; namely, one (1)
Senior/Manager Communication; one (1) Assistant/Deputy Manager Public Relations; one (1)
Assistant/Deputy Manager Environmental Education, and a team of five (5) officers for field
operations with diploma as environmentalist, sociologist or public health. It should be noted,
however, that the staff in this unit should not only have environmental/hygienic background but
also have good people’s skill. The team of field officers should be increased as activity areas
expand in the future.
As mentioned above, the Communication Unit is the unit which goes out from the GWMC office
and disseminates various types of information, i.e., implementing body of environmental
communication. In the short-term period, the Unit will implement environmental education
programmes in elementary schools targeting small children and their teachers, and environmental
programmes targeting the general public in periodical events. In order to mobilise this, the Unit will
need vehicles and subsequent drivers. Table 6.5.1 below shows the estimated salary cost for the
Communication Unit for this period.
Table 6.5.1 Estimated Salary for Newly Recruited Staff of the Communication Unit
in the Short-Term Period Unit: Rs./year
Position Number
of Staff
2016 2017 2018
Field officers* 4 960,000 1,036,800 1,113,600
Drivers 2 792,000 792,000 792,000
Total 1,752,000 1,828,800 1,905,600
Note:* One of the current waste managers will lead the team; therefore, the number of first recruits will be 4.
An important role of the Communication Unit is to coordinate the programme with relevant bodies.
In the school programme, for example, the Unit needs to coordinate not only with target schools but
also all the authorities concerned. Likewise, the coordination in implementing the environmental
programmes targeting the general public requires careful coordination with community groups,
labour union, NGOs for collaboration efforts, TV / radio stations or various advertising media on
bus or street billboards, etc., for publicity purpose, and editors and printing companies for preparing

Project for Integrated Solid Waste Management
Master Plan in Gujranwala
Draft Final Report
Volume 1 Main Report
CTI Engineering International Co., Ltd.
NJS Consultants Co., Ltd. EX Research Institute Ltd.
313
these materials to be used in the programmes. In order to facilitate these, the Unit must develop a
list of contact information and mechanisms to maintain and update the list.
6.5.3 Project for Development and Implementation of Educational Programmes
Targeting Primary School Teachers and Students to Enhance
Knowledge/Awareness on SWM and 3R Promotion
(1) Development of Manuals for Environmental Education Programme in Schools
It is proposed to develop manuals for the environmental education programme in schools. This
manual will be used by the field personnel who go out and give lectures to the elementary students
and teachers. The contents of the manual shall include a) purpose of the manual and objective of
the programme, b) planning the programme, c) carrying out the programme, and d) reference data.
The manual should be written in a way that the Communication Unit staff can learn how to develop
or modify an attractive programme for elementary schools and carry out lectures attractive to the
students. It should also include background information on proper SWM practices or 3R, so that the
staff can easily find the right information. The manual should be prepared by the Waste Managers
led by the Communication Unit.
(2) Development of Educational Materials for the School Programme
It is proposed to produce a short video clip, explaining the overall SWM and 3R efforts in
Gujranwala. The production of the video should be entrusted to a production company specialising
in PR material production under the supervision of the Communication Unit. The video should
cover the current SWM in Gujranwala and the issues to be solved.
Besides the video clip, a printed material should be developed to be used and distributed during the
programme. The contents of the printed material should include proper SWM practices and
promotion of 3R. Topics should be dealt from the viewpoint of everyday life of target
students/teachers. For the Short-Term Period, a total of 75,000 copies will be necessary.
(3) Selection of Target Schools
The Communication Unit should select a target area or UC to implement the school environmental
education programme. The area should preferably be coincided with other programmes, such as,
the separate collection pilot project in Zone 6, to implement the programme effectively.
Firstly, all public and private elementary schools in the area should be listed, together with the
number of students and contact information. Secondly, target schools should be selected in
consideration of the number of students and the degree of cooperativeness of the schools. Then with
careful coordination with school representatives, a schedule to visit is planned. The number of
expected target schools and students for the Short-Term Period is as shown below.
Table 6.5.2 Number of Schools and Students Targeted for the Environmental
Education Programme in the Short-Term Period
Year 2016 2017 2018
No. of Schools 70 80 100
No. of Students 2,100 2,400 3,000
(4) Implementation of the Environmental Education Programme at Schools
Based on the list of schools and schedule of the programme developed in Item (3) above,
coordination with the school principal or teacher in charge prior to implementation of the
programme is indispensable to confirm how will be carried out, including, but not limited to, size of
room, availability of power and lights, space to display materials, etc. For example, depending upon
the school condition, a large number of students may be given the programme in the same room, but
later divided into 5 smaller groups for more detailed discussions. In general, it is more effective to

Draft Final Report
Volume 1 Main Report
Project for Integrated Solid Waste Management
Master Plan in Gujranwala
314 CTI Engineering International Co., Ltd.
NJS Consultants Co., Ltd. EX Research Institute Ltd.
have an environmental programme in smaller groups for better control and enough attention to each
student and thus bring a more meaningful programme than in a large group.
6.5.4 Project for Development and Implementation of Educational Programmes
Targeting the General Public to Enhance Knowledge/Awareness on SWM and
3R Promotion
Following activities are proposed: 1) development of guideline for environmental education
programmes for the general public; 2) development of educational materials; 3) development of
schedule for public environmental education; and 4) implementation of the environmental education
programmes for the public. Explanation of each activity is presented below.
(1) Development of Guideline for Environmental Education Programmes for the
General Public
A guideline for the environmental education programme for the general public is proposed to be
developed. This guideline will be used by the field staff that go out and raise awareness among the
public in periodical events like the Earth Day and Eid-ul-Fitr Day. The contents of the guideline
shall include a) purpose of the guideline and objective of the programme, b) planning of the
programme, c) carrying out of the programme, and d) references including data and contacts
information about possible collaborating partners.
The programme should be written in a way that staff of the Communication Unit can plan how to
develop or modify the programme to make it attractive to the general public. It should also include
background information on proper SWM practices or 3R, so that the staff can easily find the right
information. The target population is different from that of the school educational programme;
therefore, broader viewpoints are necessary when developing this guideline. For instance, budget
allocation and how they are used in GWMC operation is good information for adults who pay for
his/her SWM. The manual should be prepared by the Waste Managers led by the Communication
Unit.
(2) Development of Educational Materials for the General Public
Some printed materials should be developed for use and distribution during implementation of the
programme. Contents of the printed materials should include proper SWM practices and promotion
of 3R, as well as information necessary to gain confidence among the general public on the
GWMC’s operation. Such information shall include budget allocation and how they are used in
GWMC operations since it is vital information to gain confidence from the adults who pay for
his/her SWM. For the Short-Term Period, a total of 5,000 copies will be necessary.
Besides the printed materials, some displays which show waste flow in Gujranwala or items which
can be recycled should be prepared, along with actual recyclable or recycled materials so that the
general public can touch and easily understand them.
(3) Implementation of Environmental Education Programmes in Periodical Events
In the implementation of the programme, close coordination should be made among the other
relevant bodies listed in the guideline prepared in Item (1) above. Coordination may include
co-hosting awareness raising programmes activities. It can be worth considering to having support
from local and influential leaders, such as religious leaders, head of labour union, and
neighbourhood groups and alike. This gives the residents additional reasons why their cooperation
in SWM makes sense.
6.5.5 Implementation Schedule and Costs
Actions and costs required for the implementation of the Action Plan for Environmental Education and
Public Awareness Raising are summarised in Figure 6.5.1 and Table 6.5.3.

Project for Integrated Solid Waste Management
Master Plan in Gujranwala
Draft Final Report
Volume 1 Main Report
CTI Engineering International Co., Ltd.
NJS Consultants Co., Ltd. EX Research Institute Ltd.
315
Figure 6.5.1 Implementation Schedule of the Action Plan for Environmental Education
and Public Awareness Raising
Table 6.5.3 Implementation Cost of the Action Plan for Environmental Education
and Public Awareness Raising
Q1 Q2 Q3 Q4 Q1 Q2 Q3 Q4 Q1 Q2 Q3 Q4
WBS for Short-Term Plan
S-4-1
Capacity Development of Communication Unit to Strengthen the Coordination among
Relevant Bodies
S-4-1-1 Preparation of new staff recruitement
S-4-1-2 Listing of all relevant bodies and formulation of mechanism to maintain/update the listing
S-4-1-3 Procurement of new vehicle
S-4-2
Development and Implementation of Educational Programmes Targeting Primary School
Teachers and Students
S-4-2-1 Development of manuals for environmental education program in schools
S-4-2-2 Development of the educational materials for school program
S-4-2-3 Selection of target schools
S-4-2-4 Implementation of the environmental education programs at schools
S-4-3 Development and Implementation of Educational Programmes Targeting General Public
S-4-3-1 Development of guideline for environmental education programs for general public
S-4-3-2 Development of the educational materials for general public
S-4-3-3 Implementation of the environmental education programs in periodical events
Quarter
2018
Short-Term Plan Period
Year
Time Framework of the Master Plan
2016 2017
2016 2017 2018
S-4-1
Capacity Development of Communication Unit to Strengthen the Coordination among Relevant
Bodies
6,736 3,002 1,829 1,906
S-4-1-1 Preparation of new staff recruitement
S-4-1-2 Listing of all relevant bodies and formulation of mechanism to maintain/update the listing
S-4-1-3 Procurement of new vehicle 1,250 1,250
S-4-2
Development and Implementation of Educational Programmes Targeting Primary School Teachers
and Students
1,730 965 349 416
S-4-2-1 Development of manuals for environmental education program in schools
S-4-2-2 Development of the educational materials for school program
S-4-2-3 Selection of target schools
S-4-2-4 Implementation of the environmental education programs at schools 990 290 320 380
S-4-3 Development and Implementation of Educational Programmes Targeting General Public 903 287 301 315
S-4-3-1 Development of guideline for environmental education programs for general public
S-4-3-2 Development of the educational materials for general public
S-4-3-3 Implementation of the environmental education programs in periodical events 646 215 215 215
Total (Short-Term) 9,370 798,662 614,600 92,363
WBS
No.
WBS
Total Budget
(Thousand Rs.)
Annual Cost
72 86 100258
Programme 4: Environmental Education and Public Awarenss Raising Plan
Short-Term Plan
5,486 1,752 1,829 1,906
675.2 28.8 36740

Draft Final Report
Volume 1 Main Report
Project for Integrated Solid Waste Management
Master Plan in Gujranwala
316 CTI Engineering International Co., Ltd.
NJS Consultants Co., Ltd. EX Research Institute Ltd.
6.6 Action Plan for Economic and Financial Aspect
6.6.1 Priority Projects of Economic and Financial Aspect
Priority projects are defined as the projects proposed for the short-term period of the Master Plan and
they will be developed into the action plans in this chapter. Based on the discussions in Chapter 4, the
following are selected as the priority projects of economic and financial aspect:
Project for Establishment of Sustainable Cost Recovery
Project for Implementation of Accurate Total Costing
Project for Introduction of Proper Tariff System
Project for Implementation of Financially Efficient Private Sector Involvement
6.6.2 Project for Establishment of Sustainable Cost Recovery
During the Short-Term Period from 2016 to 2018, in order to prepare for the establishment of the future
sustainable cost recovery, a wide spectrum of below actions shall be carried out:
To establish the long-term cost recovery strategies for the operation and maintenance costs to
provide SWM services;
To establish the financial monitoring system through a wide range of financial key performance
indicators (KPI) related to cost recovery;
To establish the standard procedure for monitoring the cost recovery;
To prepare a manual for the management of cost recovery;
To train GWMC’s staff in charge of managing the cost recovery;
To prepare a 3-year recurrent cost rolling plan to request CDGG for budgetary arrangement; and
To prepare a 3-year capital investment cost rolling plan to request the provincial government for the
budgetary arrangement.
The above preparatory actions for the establishment of sustainable cost recovery will start from the first
quarter of 2016 with the more detailed plan of operations indicated in Volume 2, Supporting Report,
Section F: Economic and Financial Aspect, Figure F.5.1.
6.6.3 Project for Implementation of Accurate Total Costing
Although tariff will not be charged during the Short-Term Period from 2016 to 2018, it is absolutely
necessary to grasp the total cost accurately based on the selected methodologies for the future
monitoring of cost recovery after full-scale introduction of the tariff system from 2025. There is a wide
range of actions to be taken for grasping the total cost as well as the cost structure of providing SWM
services, as follows:
To establish the cost centre inside the financial department of GWMC;
To monitor and streamline the latest operating and maintenance costs for SWM services;
To carry out the break-even point analysis as well as the breakdown of operation and maintenance
costs by fixed costs and variable costs;
To estimate the average cost and the marginal cost per unit amount of the disposed wastes;
To prepare and start the cost minimisation plan for SWM services;
To prepare the operation manual for standard procedures for the Cost Centre; and
To train the staff of the Cost Centre in the estimation of various costs for SWM services.
The Cost Centre shall be established under the Financial Department of GWMC. It shall manage the
GWMC under a convenient mechanism to determine the proper tariff level to recover the total operation
and maintenance costs required for providing the SWM services.
Another important action to be taken is to minimise the cost of providing SWM services by the
financially efficient manner under the cost minimisation plan of GWMC. The organizational assessment

Project for Integrated Solid Waste Management
Master Plan in Gujranwala
Draft Final Report
Volume 1 Main Report
CTI Engineering International Co., Ltd.
NJS Consultants Co., Ltd. EX Research Institute Ltd.
317
has been carried out in the master plan, and the most efficient organizational structure was proposed.
The purpose of organizational assessment is to realign the organization’s resources in a way that GWMC
will be able to achieve the best performance and SWM services and thus minimising the operating costs.
The cost minimisation plan being jointly prepared by the Financial Department and the Human
Resources Development Department of GWMC will include a series of actions to significantly reduce
operating costs and bring improvements in service delivery efficiency such as the operation of sanitary
landfill, the operation of collection and transport, billing and collection, and fuel and repair of collection
vehicles, the overhead cost of the headquarters, etc.
In addition, the preventive maintenance programme will help identify possible inefficiency in the
operation of the sanitary landfill as well as the collection and transport of wastes with minimum
expenses and thus saving major repairs and maintenance costs. The efficient collection route should be
continuously reviewed in each service zone to bring more efficiency in the operations and thus reduce
costs.
The above preparatory actions for the implementation of the accurate total costing will start from the
first quarter of 2016 with the more detailed plan of operations indicated in Volume 2, Supporting
Report, Section F: Economic and Financial Aspect, Figure F.5.1.
6.6.4 Project for Introduction of Proper Tariff Charging System
During the Short-Term Period from 2016 to 2018, the tariff system will not be introduced. Therefore,
cost recovery for the SWM services through introduction of the tariff system will not be actually started.
However, there is a wide spectrum of activities in the field of preparatory activities for introduction of
the tariff system as given below. The partial establishment of cost recovery through introduction of the
optimum tariff system will be commenced from 2022 in high and middle income areas during the
Mid-Term Period. For the time being, the absence of cost recovery will be replenished by the CDGG’s
financial support for the recurrent costs and the provincial government’s subsidies for the investment
and replacement of facilities and equipment required for the SWM services:
To forecast the cost recovery rate and the optimum tariff level as well as the required amount to be
covered by the provincial property tax;
To roughly establish the tariff table in low-income, middle-income and high-income areas;
To establish the standard procedure for the tariff setting;
To carry out the survey on customers’ willingness to pay by income group;
To carry out the survey on customers’ affordability to pay by income group;
To train the staff in charge of establishing and operating the financial monitoring system; and
To start the negotiation with the provincial government for exploring the required legal actions for
introduction of the additional surcharge of the provincial property tax.
It is essential to set the SWM tariff at the level for which users can actually afford to pay. In this
connection, the concept of ATP (Affordability to Pay) is frequently used. ATP is defined as the amount
which beneficiaries can pay for certain public utility services, being calculated with reference to
household income and composition of household expenditures in the service areas. There are various
methodologies employed for estimating ATP. A typical methodology is to determine ATP as a certain
share of a household’s disposable income based on a household economy survey. The survey on the
household economy for estimating ATP should be periodically carried out during the early stage of the
short-term period.
WTP (Willingness to Pay) is another consideration factor of the demand side, which is the amount
expressed by respondents on the monetary value on users’ degree of payment willingness for SWM
services. WTP can be measured through a questionnaire survey such as CVM (Contingent Valuation
Method).
Based on the survey results of the updated level of ATP and WTP, the optimum level of tariff as well as
the required revenue to be covered by the provincial property tax will be estimated.

Draft Final Report
Volume 1 Main Report
Project for Integrated Solid Waste Management
Master Plan in Gujranwala
318 CTI Engineering International Co., Ltd.
NJS Consultants Co., Ltd. EX Research Institute Ltd.
Although the actual tariff charging system is introduced from 2022 which is the fourth year of the
mid-term period, the above preparatory actions for introduction of the proper tariff charging system will
start from the first quarter of 2016 with the detailed plan of operations indicated in Volume 2,
Supporting Report, Section F: Economic and Financial Aspect, Figure F.5.1.
6.6.5 Project for Implementation of Financially Efficient Private Sector Involvement
During the Short-Term Period from 2016 to 2018, private sector involvement will not be started.
However, there is a wide range of preparation activities for the future commencement of efficient private
sector involvement for the collection and transport as below. The outline of the service contract to be
outsourced including area, scope and criteria to select the private service providers will be clarified.
To study the tender procedure for the service contract;
To study the area and scope of the service contract; and
To review the unit cost of outsourcing.
Although actual private sector involvement through the service contract will be introduced from 2028
which is the fourth year of the long-term period, the above preparatory actions for the implementation of
financially efficient private sector involvement will start from the first quarter of 2018 with the detailed
plan of operations indicated in Volume 2, Supporting Report, Section F: Economic and Financial
Aspect, Figure F.5.1.
6.6.6 Implementation Schedule and Costs
Actions and costs required for the implementation of the Action Plan for Economic and Financial
Aspect are summarised in Figure 6.6.1 and Table 6.6.1.

Project for Integrated Solid Waste Management
Master Plan in Gujranwala
Draft Final Report
Volume 1 Main Report
CTI Engineering International Co., Ltd.
NJS Consultants Co., Ltd. EX Research Institute Ltd.
319
Figure 6.6.1 Implementation Schedule of the Action Plan for Economic and Financial Aspect
Q1 Q2 Q3 Q4 Q1 Q2 Q3 Q4 Q1 Q2 Q3 Q4
WBS for Short-Term Plan
S-5-1 Establishment of Sustainable Cost Recovery (Preparatory Phase)
S-5-1-1 Establishment of Long-term Cost Recovery Strategies
S-5-1-2 Establishment of Financial Monitoring System through KPIs
S-5-1-3 Establishement of Standard Procedures for Monitoring Cost Recovery
S-5-1-4 Preparation of Manual for Management of Cost Recovery
S-5-1-5 Training of GWMC's Staff in Charge of Management of Cost Recovery
S-5-1-6 Preparation of 3-Year Recurrent Cost Rolling Plan for Budgetary Arrangement by CDGG
S-5-1-7
Preparation of 3-Year Capital Investment Cost Rolling Plan for Budgetary Arrangement by
GOPb.
S-5-2 Implementation of Accurate Total Costing (Preparatory Phase)
S-5-2-1 Establishment of Cost Centre inside Financial Department of GWMC
S-5-2-2 Monitoring and Streamlining of Latest Operating and Maintenance Cost for SWM Services
S-5-2-3 Implementation of Break-even Point Analysis
S-5-2-4 Estimation of Average and Marginal Costs per Unit Amount of Wastes
S-5-2-5 Preparation of Cost Minimisation Plan
S-5-2-6 Preparation of Operation Manual for Standard Procedure for Cost Centre
S-5-2-7 Training of Staff of Cost Centre
S-5-3 Introduction of Proper Tariff Charging System (Preparatory Phase)
S-5-3-1 Forecasting Cost Recovery Level, Optimum Tariff Level and Required Amount of Subsidies
S-5-3-2 Establishment of Draft Tariff Table for SWM Services
S-5-3-3 Establishment of Standard Procedure for Tariff Setting
S-5-3-4 Implementation of Customers' Willingness to Pay (WTP) Survey
S-5-3-5 Implementation of Customers' Affordability to Pay (ATP) Survey
S-5-3-6 Training of GWMC's Staff for Tariff Management
S-5-3-7 Negotiation with GOPb for Exploring Additional Surcharge of Provincial Property Tax
S-5-4 Implementation of Financially Efficient Private Sector Involvement (Preparatory Phase)
S-5-4-1 Study of Tender Procedures for Service Contract
S-5-4-2 Study of Area and Scope of Service Contract
S-5-4-3 Review of Unit Cost of Outsourcing
Quarter
2018
Short-Term Plan Period
Year
Time Framework of the Master Plan
2016 2017

Draft Final Report
Volume 1 Main Report
Project for Integrated Solid Waste Management
Master Plan in Gujranwala
320 CTI Engineering International Co., Ltd.
NJS Consultants Co., Ltd. EX Research Institute Ltd.
Table 6.6.1 Implementation Cost of the Action Plan for Economic and Financial Aspect
6.7 Action Plan for Environmental Monitoring
6.7.1 Priority Projects of Environmental Monitoring
Priority projects are defined as the projects proposed for the short-term period of the Master Plan and
they will be developed into the action plans in this chapter. Based on the discussions in Chapter 4, the
following are selected as the priority projects of environmental monitoring:
Project for Environmental Monitoring for the Collection and Transportation Work
Project for Environmental Monitoring for the Final Disposal Site in Bhakhraywali
2016 2017 2018
S-5-1 Establishment of Sustainable Cost Recovery (Preparatory Phase)
S-5-1-1 Establishment of Long-term Cost Recovery Strategies GWMC
S-5-1-2 Establishment of Financial Monitoring System through KPIs GWMC
S-5-1-3 Establishement of Standard Procedures for Monitoring Cost Recovery GWMC
S-5-1-4 Preparation of Manual for Management of Cost Recovery GWMC
S-5-1-5 Training of GWMC's Staff in Charge of Management of Cost Recovery GWMC
S-5-1-6 Preparation of 3-Year Recurrent Cost Rolling Plan for Budgetary Arrangement by CDGG GWMC
S-5-1-7 Preparation of 3-Year Capital Investment Cost Rolling Plan for Budgetary Arrangement by GOPb. GWMC
S-5-2 Implementation of Accurate Total Costing (Preparatory Phase)
S-5-2-1 Establishment of Cost Centre inside Financial Department of GWMC GWMC
S-5-2-2 Monitoring and Streamlining of Latest Operating and Maintenance Cost for SWM Services GWMC
S-5-2-3 Implementation of Break-even Point Analysis GWMC
S-5-2-4 Estimation of Average and Marginal Costs per Unit Amount of Wastes GWMC
S-5-2-5 Preparation of Cost Minimisation Plan GWMC
S-5-2-6 Preparation of Operation Manual for Standard Procedure for Cost Centre GWMC
S-5-2-7 Training of Staff of Cost Centre GWMC
S-5-3 Introduction of Proper Tariff Introduction (Preparatory Phase)
S-5-3-1 Forecasting Cost Recovery Level, Optimum Tariff Level and Required Amount of Subsidies GWMC
S-5-3-2 Establishment of Draft Tariff Table for SWM Services GWMC
S-5-3-3 Establishment of Standard Procedure for Tariff Setting GWMC
S-5-3-4 Implementation of Customers' Willingness to Pay (WTP) Survey GWMC
S-5-3-5 Implementation of Customers' Affordability to Pay (ATP) Survey GWMC
S-5-3-6 Training of GWMC's Staff for Tariff Management
186 (Included in
GWMC's Staff
Training Budget:
Module 6)
62 62 62
S-5-3-7 Negotiation with GOPb for Exploring Additional Surcharge of Provincial Property Tax GWMC
S-5-4 Implementation of Financially Efficient Private Sector Involvement
S-5-4-1 Study of Tender Procedures for Service Contract
196 (Included in
GWMC's Staff
Training Budget:
Module 5)
196
S-5-4-2 Study of Area and Scope of Service Contract GWMC
S-5-4-3 Review of Unit Cost of Outsourcing GWMC
Total (Short-Term)
382 (Included in
GWMC's Staff
Training Budget:
Module 5 and 6)
62 62 258
Total Budget
(Thousand Rs.)
Annual Cost
Programme 5: Economic and Financial Plan
Short-Term Plan
WBS
No.
WBS
Project for Integrated Solid Waste Management
Master Plan in Gujranwala
Draft Final Report
Volume 1 Main Report
CTI Engineering International Co., Ltd.
NJS Consultants Co., Ltd. EX Research Institute Ltd.
321
Project for Environmental Monitoring for the Safe Post-Closure of Final Disposal Sites in
Gondlanwala and Chianwali
6.7.2 Project for Environmental Monitoring for the Collection and Transportation
Work
(1) Monitoring of Cleanness of Garbage Container
Objectives of the Monitoring (a)
This monitoring is carried out for making well-organized waste collection spaces and keeping
clean environment for the following purposes:
To avoid vector and odour;
To keep the clean and aesthetic view of the vicinity; and
To avoid dirty environment with garbage scattered around the containers.
Methodology of the Monitoring (b)
Location of Monitoring
This monitoring is to be carried out all over Gujranwala City, but it is actually made at the
locations of containers. For example, nearly 100 container locations have been identified in
Zone 6 and they should be targets for monitoring. The container locations in Zone 6 are as
indicated in Figure 6.2.1 of Section 6.2.
Monitoring Items
Following items will be monitored:
Cleanness of container;
Whether or not any waste is scattered around the container; and
Whether waste is separately collected or mixed.
Monitoring Data Collection System
Data is collected through everyday inspection of containers by sanitary workers who shall
record the situation in a monitoring format prepared by the Operation Unit of GWMC. This
activity will start by the beginning of 2016.
Monitoring Feedback System
Sanitary workers shall monitor their working area everyday. They shall check the garbage
containers in their individual working areas and record the situation in the monitoring format.
Inspectors will check the record, and the record will be submitted to the Assistant Manager
Operation who should file and control the data. In case the dirty situation of garbage container
and its environment is serious, the case shall be reported to the Senior Manager Operation, and
immediate measures should be implemented on a timely manner.
Cost of Monitoring (c)
The monitoring work will be carried out as a part of daily work for sanitary workers so that no
extra cost is required for the implementation of monitoring.
(2) Monitoring of Waste Separation at Household Level
Objectives of the Monitoring (a)
Waste separation at household level is an essential issue for building the 3R system that will
result in the efficient and effective waste collection and transportation work. However,
currently, residents do not have the custom of waste separation and implementation may have
some difficulties and confusion. Therefore, this monitoring shall be conducted with the
following objectives:

Draft Final Report
Volume 1 Main Report
Project for Integrated Solid Waste Management
Master Plan in Gujranwala
322 CTI Engineering International Co., Ltd.
NJS Consultants Co., Ltd. EX Research Institute Ltd.
To keep records on how households separate wastes in daily life;
To evaluate the degree of diffusion of waste separation at household level; and
To utilise the result of the evaluation for the awareness programme formulation.
Methodology of the Monitoring (b)
Location of Monitoring
Targets of household monitoring will be selected in all Gujranwala. As the first stage of
monitoring, 100 households will be selected as monitoring samples from the 64 Urban Union
Councils (UCs) that belong to the four major towns, Qila Didar Signh, Khiali Shah Pur, Aroop
and Nandi Pur, and 25 households in each town will be selected.
Monitoring Items
The situation of residents’ waste separation at households shall be monitored. In the
Short-Term Period, the monitoring shall focus on three items; namely, (1) Kitchen waste; (2)
Paper and plastic bags; and (3) Recyclable waste (e.g. valuable metal).
Monitoring Data Collection System
This monitoring shall be carried out once a year. The Assistant Manager Environmental
Education will select the respondents and prepare the questionnaire, and field operation staff
members will conduct the interviews. Data will be compiled and summarised by the Assistant
Manage Environmental Education and the result will be submitted to the Senior Manager
Communication. The result of monitoring will be utilised for public awareness activities to
improve the achievement of separate waste collection.
Since one of the major public awareness programmes is planned in every April, the
preparation for monitoring will be started in January 2016 and the interviews will be carried
out in January. Preparation for the monitoring should start in January 2016 and the result shall
be summarised by the middle of March.
Monitoring Feedback System
Monitoring results will be filed in the section of Environmental Education under the
Communication Unit for utilisation in the awareness programmes. After the results are
summarised by the Assistant Manager of the Environmental Education Section, Manager
Communication and Assistant Manager Communication in GWMC will review the result and
feedback some of the results to the contents of public awareness programmes.
Cost of the Monitoring (c)
This monitoring will be carried out by GWMC employees, so that no extra cost is required for
the implementation of monitoring.
6.7.3 Project for Environmental Monitoring for Final Disposal Site in Bhakhraywali
(1) Objectives of the Monitoring
The objectives of the monitoring are as follows:
To monitor and record the environmental situation in Bhakhraywali site; and
To take countermeasures in case any negative impact is recorded to reduce environmental
damage.
(2) Methodology of the Monitoring
Since GWMC does not have facility for the measurement and analysis of environmental quality, the
actual monitoring will be outsourced to an environmental monitoring laboratory (a private
company). GWMC shall manage the contract for the monitoring work, the feedback of monitoring
results and documentation.

Project for Integrated Solid Waste Management
Master Plan in Gujranwala
Draft Final Report
Volume 1 Main Report
CTI Engineering International Co., Ltd.
NJS Consultants Co., Ltd. EX Research Institute Ltd.
323
Location of Monitoring (a)
Leachate in leachate pond shall be monitored. Two kinds of groundwater will be monitored:
groundwater from shallow aquifer of about 20m in depth and from deep aquifer of about 60m
in depth. Considering the water flow of a canal at the north side of the Bhakhraywali site,
groundwater may flow from north to south. Therefore, one pair of sampler will be set at the
north side of the disposal site, around the office and storage, and another pair will be set at the
south side of the site. In the north side, the sampling location will be set at 50m distance from
the office and storage because human drainage water from the office will be mixed in shallow
aquifer. Monitoring for vegetation and plantation will be carried out in the Bhakhraywali site
and its vicinity, and monitoring for safety and traffic will be targeted to access roads into the
Bhakhraywali site. Location of the monitoring is shown in Volume 2, Supporting Report,
Section H: Environmental and Social Considerations, Figure H.5.2.
Monitoring Items (b)
The monitoring items together with their frequency and location in the project are summarised
in Table 6.7.1 below.
Table 6.7.1 Monitoring Items with Their Frequency and Location for Final Disposal Site in Bhakhraywali
Type of Monitoring Frequency of Monitoring
Location of Monitoring Parameters (Monitoring Items)
Ambient Air Quality
4 times in a year (January, April, July and October)
Four corners of the site SPM, PM10, SO2, NO2, CO, CO2, Vapours
Groundwater Quality
North side of the disposal site around the office and storage; and South side of the site
pH, Temperature, TDS, Conductivity, Fluoride, Nitrate, DO, Hardness, Turbidity, Colour, Chloride, Arsenic, etc.
Noise Level Four corners of the site dB(A)
Smelly Gas Quality (Landfill Gasses)
At the pit in the pump station
SO2, H2S, CH4
Treated Wastewater Effluent (Leachate Pond Effluent) Quality
At the exit of leachate pond
BOD, COD, TOC, TSS, DO, Chloride, Sulphate, Turbidity, Conductivity, Oil and Grease, Colour, TIN, Heavy metals
Leachate (Leachate Pond Influent) Quality
At the pit in the pump station
BOD, COD, TOC, TSS, DO, Chloride, Sulphate, Turbidity, Conductivity, Oil and Grease, Colour, TKN, Heavy metals
Situation of Vegetation and Plantation
Once a year (April)
Vicinity of the site Visual inspection of plant species survival rate and status of maintenance
Situation of Safety and Traffic Vicinity of the site 1) Inspection of Signage
2) Faulty, overloaded and speeding of vehicles
Monitoring Data Collection System (c)
Data will be collected by a private environmental laboratory, and the report is submitted to the
Senior Manager Operations of GWMC. Frequency of the monitoring of data collection system
is 4 times in a year (quarterly) except the “Situation of Vegetation and Plantation” and
“Situation of Safety and Traffic”. These two items will be carried out only once a year since
these situations may not change drastically and therefore annual measurement will be enough.
All monitoring in the year 2016 will be half since the construction work will start in
Bhakhraiwali from the second half of 2016.
Monitoring Feedback System (d)
After the result of monitoring is sent to GWMC, the Assistant Manager Operations shall check
the results. If any serious environmental problem is found in the results, the Assistant Manager
Operation will inform the Senior Manager Operations of the problems and provide solutions in
consultation with the Senior Manager Operations and other related managers. In case no major

Draft Final Report
Volume 1 Main Report
Project for Integrated Solid Waste Management
Master Plan in Gujranwala
324 CTI Engineering International Co., Ltd.
NJS Consultants Co., Ltd. EX Research Institute Ltd.
problem is reported, the results shall be reviewed by the Managing Director and filed in the
Operation Section.
(3) Cost of Monitoring
The total cost of the project is estimated at Rs. 2,455,000. Cost estimate for the project is shown in
Volume 2, Supporting Report, Section H: Environmental and Social Considerations, Table
H.5.3 while the unit price of each monitoring item is referred to Environmental Monitoring Plan in
the EIA report (Source: Urban Unit, "Environmental Impact Assessment (EIA) of Proposed Landfill
Site at Gujranwala", 2015, Table 8-2: Environmental Monitoring Plan, pp. 223-225.). Monitoring
items in the construction stage are different from those of the operation stage. The monitoring items
in the construction stage are “Ambient Air Quality”, “Groundwater Quality”, “Noise Level”,
“Situation of Vegetation and Plantation”, and “Situation of Safety and Traffic”. On the other hand,
the item of “Smelly Gas Quality”, “Treated Wastewater Effluent Quality”, and “Leachate Quality”
will be additionally measured in the operation stage.
6.7.4 Project for Environmental Monitoring for Safe Post-Closure Final Disposal Sites
in Gondlanwala and Chianwali
(1) Objectives of the Monitoring
There are three objectives of the monitoring:
To record the environmental situation for the safe post-closure of disposal sites;
To monitor safety of the closure process; and
To take countermeasures in case any negative impact is recorded to reduce environmental
damage.
(2) Methodology of the Monitoring
As in the previous project, the monitoring will be outsourced to an environmental monitoring
laboratory (private company) due to lack of measurement equipment in GWMC. GWMC shall
supervise the monitoring, feedback and documentation.
Location of Monitoring (a)
Two kinds of groundwater will be monitored: groundwater from shallow aquifer of about 20m
in depth and deep aquifer of about 60m in depth. Regarding landfill gas and leachate,
construction of a pumping station with a man-hole is to be planned for the clearing purpose
and landfill gases and leachate is collected from the man-hole. Therefore, the sampling point
of landfill gases and leachate is the same as the location of pump station. All the sampling
locations in Gondlanwala and Chianwali are shown in Figure H.5.3 and Figure H.5.4,
respectively in Volume 2, Supporting Report, Section H: Environmental and Social
Considerations.
Monitoring Items (b)
For the safe post-closure monitoring, “Groundwater Quality”, “Smelly Gas Quality” and
“Leachate Quality” are selected since the impact to environment will be low compared to the
operation stage of disposal site. Table 6.7.2 shows the monitoring items of the project.

Project for Integrated Solid Waste Management
Master Plan in Gujranwala
Draft Final Report
Volume 1 Main Report
CTI Engineering International Co., Ltd.
NJS Consultants Co., Ltd. EX Research Institute Ltd.
325
Table 6.7.2 Monitoring Items with Their Frequency and Location for Post-Closure Final Disposal Site in
Gondlanwala and Chianwali
Type of Monitoring
Frequency of Monitoring
Location of Monitoring Parameters (Monitoring Items)
Gondlanwala Chianwali
Groundwater Quality
Once a year (April)
Around the office/weight bridge
At the north-west corner of the site
pH, Temperature, TDS, Conductivity, Fluoride, Nitrate, DO, Hardness, Turbidity, Colour, Chloride, Arsenic, etc.
Smelly Gas Quality (Landfill Gasses)
At the leachate pump station
At the leachate pump station SO2, H2S, CH4
Leachate Quality
4 times in a year (January, April, July and October)
At the leachate pump station
At the leachate pump station
BOD, COD, TOC, TSS, DO, Chloride, Sulphate, Turbidity, Conductivity, Oil and Grease, Colour, TKN, Heavy metals
Monitoring Data Collection System (c)
Data will be collected by a private environmental laboratory, and the report is submitted to the
Senior Manager Operations of GWMC. The monitoring will be carried out in April since this
month is between the dry season and the rainy season. This monitoring will start in April 2016.
Monitoring Feedback System (d)
The monitoring feedback system follows the same procedures as the previous project (see
Item (d), Subsection 6.7.3).
(3) Cost of Monitoring
The total cost of the project is estimated at Rs. 2,595,000. The breakdown of cost estimate for the
project is shown in Volume 2, Supporting Report, Section H: Environmental and Social
Considerations, Table H.5.5 while the unit price of each monitoring item is referred to the
Environmental Monitoring Plan in the EIA report.
6.7.5 Implementation Schedule and Costs
Actions and costs required for the implementation of the Action Plan for Environmental Monitoring are
summarised in Figure 6.7.1 and Table 6.7.3.

Draft Final Report
Volume 1 Main Report
Project for Integrated Solid Waste Management
Master Plan in Gujranwala
326 CTI Engineering International Co., Ltd.
NJS Consultants Co., Ltd. EX Research Institute Ltd.
Figure 6.7.1 Implementation Schedule of the Action Plan for Environmental Monitoring
Table 6.7.3 Implementation Cost of the Action Plan for Environmental Monitoring
Q1 Q2 Q3 Q4 Q1 Q2 Q3 Q4 Q1 Q2 Q3 Q4
WBS for Short-Term Plan
S-6-1 Environmental Monitoring for Collection and Transport Work
S-6-1-1 Monitoring of Cleanness of Garbage Container
S-6-1-2 Monitoring of Waste Separation at Household Level
S-6-2 Environmental Monitoring for Final Disposal Site in Bhakhraywali
S-6-2-1 Monitoring of Ambient Air Quality
S-6-2-2 Monitoring of Groundwater Quality
S-6-2-3 Monitoring of Noise and Vibrations
S-6-2-4 Monitoring of Smelly gases
S-6-2-5 Monitoring of Treated Waste Water Effluent
S-6-2-6 Monitoring of Leachate
S-6-2-7 Monitoring of Vegetation Plantation
S-2-6-8 Monitoring of Safety and Traffic
S-6-3
Environmental Monitoring for Post-Closure Final Disposal Sites
in Gondlanwala and Chianwali
S-6-3-1 Monitoring of Leachate and Surface Water
S-6-3-2 Monitoring of Groundwater Quality
S-6-3-3 Monitoring of Landfill Gases
Quarter
2018
Short-Term Plan Period
Year
Time Framework of the Master Plan
2016 2017
2016 2017 2018
S-6-1 Environmental Monitoring for Collection and Transport Work 0 0 0 0
S-6-1-1 Monitoring of Cleanness of Garbage Container 0 0 0 0
S-6-1-2 Monitoring of Waste Separation at Household Level 0 0 0 0
S-6-2 Environmental Monitoring for Final Disposal Site in Bhakhraywali 2,455 435 870 1,150
S-6-2-1 Monitoring of Ambient Air Quality 400 80 160 160
S-6-2-2 Monitoring of Groundwater Quality 300 60 120 120
S-6-2-3 Monitoring of Noise and Vibrations 100 20 40 40
S-6-2-4 Monitoring of Smelly gases 40 0 0 40
S-6-2-5 Monitoring of Treated Waste Water Effluent 120 0 0 120
S-6-2-6 Monitoring of Leachate 120 0 0 120
S-2-6-7 Monitoring of Vegetation Plantation 1,250 250 500 500
S-2-6-8 Monitoring of Safety and Traffic 125 25 50 50
S-6-3
Environmental Monitoring for Post-Closure Final Disposal Sites
in Gondlanwala and Chianwali
140 0 0 140
S-6-3-1 Monitoring of Leachate and Surface Water 60 0 0 60
S-6-3-2 Monitoring of Groundwater Quality 20 0 0 20
S-6-3-3 Monitoring of Landfill Gases 60 0 0 60
Total (Short-Term) 2,595 435 870 1,290
Total Budget
(Thousand Rs.)
Annual Cost
Programme 6: Environmental Monitoring Plan
Short-Term Plan
WBS
No.
WBS

Project for Integrated Solid Waste Management
Master Plan in Gujranwala
Draft Final Report
Volume 1 Main Report
CTI Engineering International Co., Ltd.
NJS Consultants Co., Ltd. EX Research Institute Ltd.
327
6.8 Action Plan for Institutional Strengthening and Organizational Restructuring
6.8.1 Priority Projects of Institutional Strengthening and Organizational
Restructuring
Priority projects are defined as the projects proposed for the short-term period of the Master Plan and
they will be developed into the action plans in this chapter. Based on the discussions in Chapter 4, the
following are selected as the priority projects of institutional strengthening and organizational
restructuring:
Project for Organizational Restructuring of GWMC;
Project for Capacity Development of GWMC Staff; and
Project for Establishment of Gujranwala Solid Waste Management By-Law.
6.8.2 Project for Organizational Restructuring of GWMC
As shown in Subsection 4.10.3, the organizational restructuring realises the creation of new
departments and the reinforcement of personnel. The required actions are presented as follows:
To strengthen the Operation (Field) Unit by allocating 7 additional Assistant Managers Operations
until 2018;
To establish the Manager Complaint Management post under GM Operations and allocate the
manager until 2018;
To establish the Intermediate Treatment Unit under the Operations Department and allocate an
Assistant Manager Intermediate Treatment until 2018;
To establish the Communication Unit under the GM Operations by shifting the Manager
Communication and the Assistant Manager Communication from the Human Resources and
Administration Department;
To strengthen the Procurement and Contract Department for PPP Introduction of Collection and
Transport; and
To establish the Monitoring and Evaluation Department under the GM Operations and allocate the
General Manager Monitoring and Evaluation and 3 Managers Monitoring and Evaluation (KPI,
Finance and Environment) until 2018.
As shown in Table 4.10.4 of Subsection 4.10.3, the required number of GWMC staff in the first three
years of the short-term period is estimated at 66 or an increase of 20 personnel from the current number,
46.
GWMC should ensure the budget to cover the whole activities of recruitment, such as publicity,
selection and employment, and shall carry out a series of adoption continuously. At the same time, it is
necessary that GWMC shall plan the layout of office spaces and equipment with the increase in the
number of staff. In addition, the compensation structure which depends on individual title, capacity and
job tenure, and welfare should be reviewed from time to time.
6.8.3 Project for Capacity Development of GWMC Staff
Detail of eight (8) modules for capacity development programmes as the human resources development
is discussed in Subsection 4.3.2. In this project, it is recommended that all the modules should start from
the beginning of the short-term period as the following activities for three years:
Two (2) 2-day sessions of Overall Management Capacity for SWM programme (Module 1) for
GWMC managerial staff in 2016;
Four (4) 1-day sessions of Capacities for Collection and Transport programme (Module 2) for
GWMC managerial staff from 2016 to 2017;
One (1) 1-day session of Seminar for Sanitary Worker programme (Module 1&2) for sanitary
workers in 2016;

Draft Final Report
Volume 1 Main Report
Project for Integrated Solid Waste Management
Master Plan in Gujranwala
328 CTI Engineering International Co., Ltd.
NJS Consultants Co., Ltd. EX Research Institute Ltd.
Two (2) 2-day sessions of Capacity on Intermediate Treatment and 3R Promotion programme
(Module 3) for GWMC managerial staff in 2018;
Twelve (12) 2-day sessions of Sanitary Landfill Site Management programme (Module 4) for
GWMC managerial staff from 2016 to 2018;
Four (4) 1-day sessions of Public-Private Partnership programme (Module 5) for GWMC
managerial staff and personnel of private sector from 2017 to 2018;
Four (4) 2-day sessions of Financial Management programme (Module 6) for GWMC managerial
staff from 2017 to 2018;
Two (2) 2-day sessions of Organizational and Legal Improvement programme (Module 7) for
GWMC managerial staff in 2017; and
Six (6) 2-day sessions of Community Participation programme (Module 8) for GWMC managerial
staff, personnel of the private sector, personnel of CBO and personnel of NGO from 2016 to 2018.
GWMC is going to entrust a part of the business to the private sector; therefore, its participation in some
training programmes is necessary. Additionally, some training programmes which will invite many
participants and the training programme for managers should be scheduled not to disturb the daily
operations.
6.8.4 Project for Establishment of Gujranwala Solid Waste Management By-Law
CDGG/GWMC had already embarked on drafting the by-law and shall continue the task towards its
enactment. In the process of finalising of the by-law, a series of public hearings will be held in the
8 districts of Gujranwala City to exchange opinions about the contents to be included in the by-law.
Since the current by-law is in English, it should be translated into Urdu language for easier
understanding of Gujranwala citizens.
The approved by-law can be an important official document to support the implementation of the Master
Plan. In the meantime and since it might take a long time to establish the by-law, GWMC has to manage
all the related organizations, especially the CDGG side schedule towards the establishment. However
approval of the by-law is not expected during the short-term. Therefore, the first three years of this
project does not need a budget.
6.8.5 Implementation Schedule and Costs
Actions and costs required for implementation of the Action Plan for Institutional Strengthening and
Organizational Restructuring are summarised in Figure 6.7.1 and Table 6.7.1.

Project for Integrated Solid Waste Management
Master Plan in Gujranwala
Draft Final Report
Volume 1 Main Report
CTI Engineering International Co., Ltd.
NJS Consultants Co., Ltd. EX Research Institute Ltd.
329
Figure 6.8.1 Implementation Schedule of the Action Plan for Institutional Strengthening and
Organizational Restructuring
Q1 Q2 Q3 Q4 Q1 Q2 Q3 Q4 Q1 Q2 Q3 Q4
WBS for Short-Term Plan
S-7-1 Improvement of Organisational Restructuring of GWMC
S-7-1-1
Establishment of New Posts (Mgr. Complaint Management, Intermediate Treatment Unit,
Communication Unit and Monitoring & Evaluation Dept.)
S-7-1-2 Public Offering the Posts
S-7-1-3 Selection and Adoption
S-7-1-4 Orientation and OJT
S-7-2 Capacity Development of GWMC Staff
S-7-2-1 Training Programme of Overall Management Capacity for SWM
S-7-2-2 Training Programme of Capacities for Collection and Transport
S-7-2-3 Training Programme of Capacity on Intermediate Treatment and 3R Promotion
S-7-2-4 Training Programme of Sanitary landfill Site Management
S-7-2-5 Training Programme of Public-Private Partnership
S-7-2-6 Training Programme of Financial Management
S-7-2-7 Training Programme of Organisational and Legal Improvement
S-7-2-8 Training Programme of Community Participation
S-7-3 Establishment of Gujuranwala Solid Waste Management By-Law
S-7-3-1 Finalisation of Draft By-Law
S-7-3-2 Establishment of Related Regulation
Quarter
2018
Short-Term Plan Period
Year
Time Framework of the Master Plan
2016 2017

Draft Final Report
Volume 1 Main Report
Project for Integrated Solid Waste Management
Master Plan in Gujranwala
330 CTI Engineering International Co., Ltd.
NJS Consultants Co., Ltd. EX Research Institute Ltd.
Table 6.8.1 Implementation Cost of the Action Plan for Institutional Strengthening and
Organizational Restructuring
2016 2017 2018
S-7-1 Improvement of Organisational Restructuring of GWMC 38,858 8,180 13,234 17,443
S-7-1-1
Establishment of New Posts (Mgr. Complaint Management, Intermediate Treatment Unit,
Communication Unit and Monitoring & Evaluation Dept.)
GWMC
S-7-1-2 Public Offering the Posts GWMC
S-7-1-3 Selection and Adoption GWMC
S-7-1-4 Orientation and OJT 38,858 8,180 13,234 17,443
S-7-2 Capacity Development of GWMC Staff 8,695 6,109 1,284 1,302
S-7-2-1 Training Programme of Overall Management Capacity for SWM 679 679 0 0
S-7-2-2 Training Programme of Capacities for Collection and Transport 5,065 4,740 173 153
S-7-2-3 Training Programme of Capacity on Intermediate Treatment and 3R Promotion 309 0 0 309
S-7-2-4 Training Programme of Sanitary landfill Site Management 896 312 292 292
S-7-2-5 Training Programme of Public-Private Partnership 196 0 98 98
S-7-2-6 Training Programme of Financial Management 186 0 93 93
S-7-2-7 Training Programme of Organisational and Legal Improvement 270 0 270 0
S-7-2-8 Training Programme of Community Participation 1,094 378 358 358
S-7-3 Establishment of Gujuranwala Solid Waste Management By-Law 0 0 0 0
S-7-3-1 Finalisation of Draft By-Law GWMC
S-7-3-2 Establishment of Related Regulation Gov. of the Punjab
Total (Short-Term) 47,552 14,289 14,518 18,745
Total Budget
(Thousand Rs.)
Annual CostWBS
No.
WBS
Programme 7: Institutional Strengthening and Organizational Restructuring
Short-Term Plan

Project for Integrated Solid Waste Management
Master Plan in Gujranwala
Draft Final Report
Volume 1 Main Report
CTI Engineering International Co., Ltd.
NJS Consultants Co., Ltd. EX Research Institute Ltd.
331
CHAPTER 7. CONCLUSION
The Vision of solid waste management for Gujranwala City, i.e., “Transformation of Gujranwala to the
Cleanest City of Punjab”, is the ultimate goal for all the residents of Gujranwala. To realise it, the target
collection rate of 100% for the area of 64 urban UCs in year 2018 and for the area of 34 peri-urban UCs
in addition to the 64 UCs in 2030 should firstly be achieved with dedication and dispatch. For pursuing
this goal, the proposed projects in the Master Plan should be carried out as well and implementation of
these projects will bring large benefits to the Gujranwala citizens.
The total project cost of the Master Plan is Rs. 20,497 million for the period of 15 years from 2016 to
2030, summing up the investment cost of Rs. 10,848 million, the operation and maintenance cost of Rs.
8,490 million and the replacement cost of Rs. 1,158 million for all project components. Although it
seems to be huge costs, the total benefit of the Master Plan is estimated at Rs. 25,139 million for the 15
years which is larger than that of project cost, and the results of the economic evaluation show that the
implementation of the the Master Plan might be economically feasible and financially viable.
Introduction of the proposed waste collection and transportation system is based on the waste separation
at source and reuires the residents’ understanding of importance of 3R and their cooperation.
Considering the low level of public awareness on integrated solid waste management (ISWM) of the
residents in Gujranwala, public awareness raising and the implementation of environmental education
are indispensable for the promotion of 3R even if the visible effects on ISWM will take quite a long time
to appear.
Since any waste should finally go to a final disposal site even whatever disposal method is adopted, the
new landfill site in Bhakhraywali, therefore, shall be secured appropriately before the existing disposal
site in Gondlanwala is filled up. In accordance with the increase of waste collection amount, the life of
the Bhakhraywali site will be shortened; that is, construction of another new disposal site is additionally
necessary by the end of 2023.
With regard to the sustainability of ISWM, the Master Plan proposes the introduction of the proper traiff
charging system. Since there is currently no official tariff system for ISWM services in Punjab and this
seems to be a political issue to some extent, it is suggested that the traiff will be partially charged in
high-income and middle-income areas from 2022 and extened to the low-income areas from 2025. To
collect the user charges, the residents should fully understand the necessity of the proper ISWM.
One of the integral parts of the ISWM in Gujranwala through the PPP scheme is to introduce service
contract for waste collection and transportation service from 2025 and establish and operate a central
compost plant managed by the SPV (Special Purpose Vehicle) from 2020. As long as the outsourcing of
the waste collection and transportation service, and opeartion of the compost plant in Lahore are
observed, this private sector involvement option will be workable in Gujranwala.
Simultaneously, the Government of the Punjab, including the City District Government
Gujranwala (CDGG) and the Gujranwala Waste Management Company (GWMC), should consider that
some financial arrangements are indispensable for the implementation of the action plans. It should also
be recognised that the implementation of a proper ISWM requires a financial burden primarily from the
government, but the responsibility should be shared equally by the government or public sector, the
private collectors or private sector, and the residents or people. In this sense, the environmental
education and public awareness raising on the ISWM is crucial to the success of the projects.

Draft Final Report
Volume 1 Main Report
Project for Integrated Solid Waste Management
Master Plan in Gujranwala
332 CTI Engineering International Co., Ltd.
NJS Consultants Co., Ltd. EX Research Institute Ltd.
CHAPTER 8. RECOMMENDATIONS
The JICA Project Team recommends that the Government of the Punjab (GOPb), the City District
Government Gujranwala (CDGG) and the Gujranwala Waste Management Company (GWMC) should
carry out the action plans in the ISWM Master Plan from year 2016. To achieve 100% waste collection
for the area of the 64 UCs at first, the required number of waste collection vehicles and containers shall
be procured appropriately. Also, since the waste collection and transportation system is proposed based
on the waste separation at source, the project for introduction of separate collection through
implementation of a pilot project shall be carried out simultaneouly.
The construction of the new final disposal site is inevitable by 2018, so that the land aquisition at
Bhakhraywali should be completed immediately, and the design and engineering works should be
started accordingly. Safe post-closure works for the former landfill site in Chianwali and improvement
work for the existing landfill site in Gondlanwala should also be conducted by using the Government
and GWMC’s own budget to mitigate the negative impacts on the surrounding environment.
In addition, the GOPb, the CDGG and the GWMC should commence the environmental education
programmes and public awareness raising campaigns that are the bottom line of the ISWM in order to
disseminate the waste separation at source and to proceed to the next stage of project implementation
smoothly such as the construction of compost plant and introduction of waste charges.
With regard to project implementation apart from the mentioned above, the more detailed study
including the situation analysis should be carried out in terms of hospital, industrial, and construction
and demolition waste management since it is out of scope of this project but closely related to the current
operation by GWMC.

ANNEXES

ANNEX 1


A-1

A-2

A-3

A-4

A-5

A-6

A-7

A-8

A-9

A-10

A-11

A-12

A-13

A-14

A-15

A-16

A-17

A-18

A-19

A-20

A-21

A-22

A-23

A-24
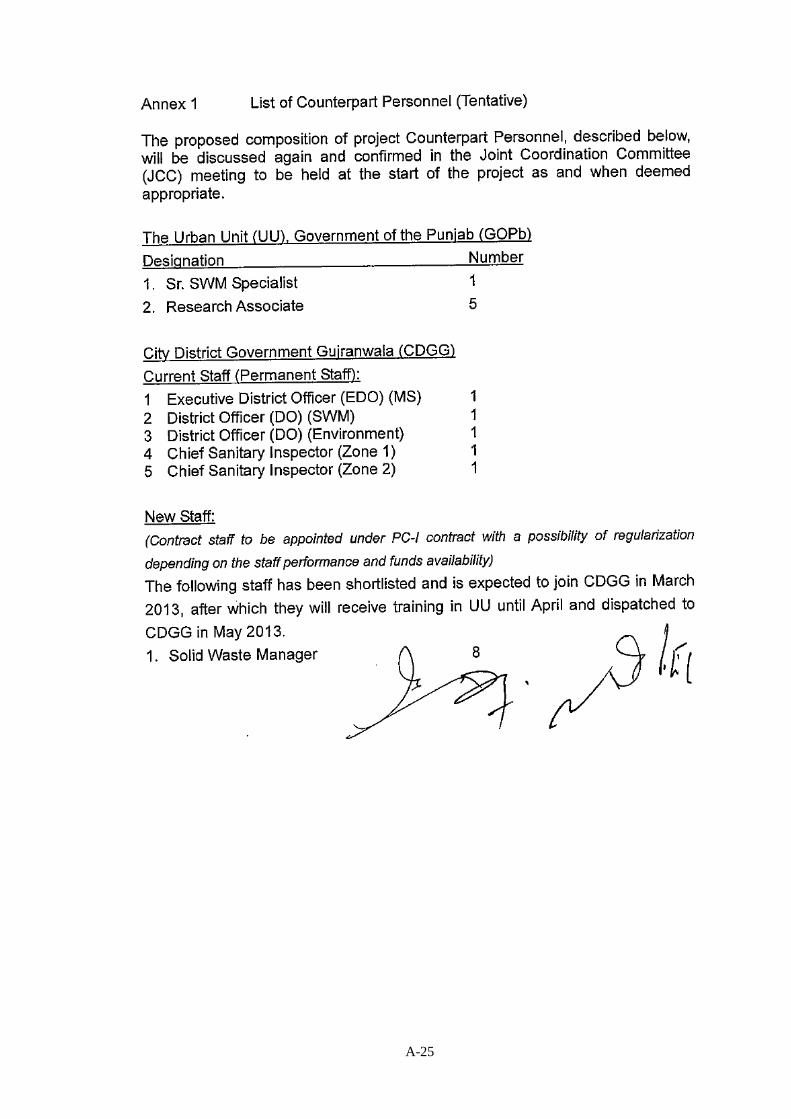
A-25


ANNEX 2

A-27

A-28

A-29

A-30

ANNEX 3

A-31

A-32

A-33

A-34

A-35


ANNEX 4


A-37

A-38

A-39

A-40

ANNEX 5


A-41
A-42

A-43

A-44

A-45