Prognostic and oncogenic relevance of TLX1/HOX11 expression level in T-ALLs
25
doi:10.1182/blood-2007-04-079988 Prepublished online July 3, 2007; Paola Ballerini, Xavier Thomas, Jean Soulier, Herve Dombret, Elizabeth A. Macintyre and Vahid Asnafi Julie Bergeron, Emmanuelle Clappier, Isabelle Radford, Agnes Buzyn, Corinne Millien, Gwendoline Soler, T-ALLs Prognostic and oncogenic relevance of TLX1/HOX11 expression level in (3716 articles) Clinical Trials and Observations Articles on similar topics can be found in the following Blood collections http://bloodjournal.hematologylibrary.org/site/misc/rights.xhtml#repub_requests Information about reproducing this article in parts or in its entirety may be found online at: http://bloodjournal.hematologylibrary.org/site/misc/rights.xhtml#reprints Information about ordering reprints may be found online at: http://bloodjournal.hematologylibrary.org/site/subscriptions/index.xhtml Information about subscriptions and ASH membership may be found online at: digital object identifier (DOIs) and date of initial publication. the indexed by PubMed from initial publication. Citations to Advance online articles must include final publication). Advance online articles are citable and establish publication priority; they are appeared in the paper journal (edited, typeset versions may be posted when available prior to Advance online articles have been peer reviewed and accepted for publication but have not yet Copyright 2011 by The American Society of Hematology; all rights reserved. 20036. the American Society of Hematology, 2021 L St, NW, Suite 900, Washington DC Blood (print ISSN 0006-4971, online ISSN 1528-0020), is published weekly by For personal use only. by guest on June 5, 2013. bloodjournal.hematologylibrary.org From
-
Upload
independent -
Category
Documents
-
view
0 -
download
0
Transcript of Prognostic and oncogenic relevance of TLX1/HOX11 expression level in T-ALLs
doi:10.1182/blood-2007-04-079988Prepublished online July 3, 2007;
Paola Ballerini, Xavier Thomas, Jean Soulier, Herve Dombret, Elizabeth A. Macintyre and Vahid AsnafiJulie Bergeron, Emmanuelle Clappier, Isabelle Radford, Agnes Buzyn, Corinne Millien, Gwendoline Soler, T-ALLsPrognostic and oncogenic relevance of TLX1/HOX11 expression level in
(3716 articles)Clinical Trials and Observations �Articles on similar topics can be found in the following Blood collections
http://bloodjournal.hematologylibrary.org/site/misc/rights.xhtml#repub_requestsInformation about reproducing this article in parts or in its entirety may be found online at:
http://bloodjournal.hematologylibrary.org/site/misc/rights.xhtml#reprintsInformation about ordering reprints may be found online at:
http://bloodjournal.hematologylibrary.org/site/subscriptions/index.xhtmlInformation about subscriptions and ASH membership may be found online at:
digital object identifier (DOIs) and date of initial publication. theindexed by PubMed from initial publication. Citations to Advance online articles must include
final publication). Advance online articles are citable and establish publication priority; they areappeared in the paper journal (edited, typeset versions may be posted when available prior to Advance online articles have been peer reviewed and accepted for publication but have not yet
Copyright 2011 by The American Society of Hematology; all rights reserved.20036.the American Society of Hematology, 2021 L St, NW, Suite 900, Washington DC Blood (print ISSN 0006-4971, online ISSN 1528-0020), is published weekly by
For personal use only. by guest on June 5, 2013. bloodjournal.hematologylibrary.orgFrom

Prognostic and Oncogenic Relevance of TLX1/HOX11 Expression Level in T-ALLs
Julie Bergeron, Emmanuelle Clappier, Isabelle Radford, Agnès Buzyn, Corinne Millien,
Gwendoline Soler, Paola Ballerini, Xavier Thomas, Jean Soulier, Hervé Dombret, Elizabeth
A. Macintyre and Vahid Asnafi.
Affiliations: From the Université Paris V René Descartes, Institut National de la Santé et de la Recherche Médicale (INSERM) EMI0210 and Assistance Publique-Hôpitaux de Paris (AP-HP) Hôpital Necker-Enfants-Malades, Paris, France; INSERM U728 IUH and Hematology Laboratory AP-HP Hôpital St-Louis, Paris, France; Hematology Department Hôpital Necker-Enfants-Malades, Paris, France; Service d'hématologie biologique Hôpital Armand Trousseau, Paris, France; Department of Hematology Hôpital Edouard Herriot, Lyon, France; and Hematology Department Hôpital St-Louis, Paris, France. Correspondance and Reprints: Vahid Asnafi, Hôpital Necker Enfants Malades, Tour Pasteur 2e étage, Laboratoire d’hématologie, 149 rue de Sèvres, 75015 Paris, France, e-mail: [email protected]. Supported by grants from the Fondation de France (UB : 032145 ; N° Engt : 2005006547) and the Association de Recherche contre le Cancer (N. 3136). Julie Bergeron is a Fellow of the National Cancer Institute of Canada (NCIC) through an award from the Terry Fox Foundation (TFF).
Partial results were presented in abstract form at the 48th annual meeting of the American
Society of Hematology, Orlando, FL, December 10, 2006.
The online version of the article contains a data supplement
Blood First Edition Paper, prepublished online July 3, 2007; DOI 10.1182/blood-2007-04-079988
Copyright © 2007 American Society of Hematology
For personal use only. by guest on June 5, 2013. bloodjournal.hematologylibrary.orgFrom

Abstract:
TLX1 is a homeodomain transcription factor generally associated with a favourable outcome in T-ALL. However, the molecular mechanisms of TLX1 deregulation remain unclear and various transcript levels in the absence of 10q24 abnormalities have been reported. A reproducible and accurate delineation of TLX1+ T-ALL will be necessary for proper therapeutic stratification. We have studied 264 unselected T-ALLs (171 adults and 93 children) and show that T-ALLs expressing high levels of TLX1 (n=35, 13%), defined as a RQ-PCR ratio of TLX1>1.00E+00 ABL, form a homogeneous oncogenic group, based on their uniform stage of maturation arrest and oncogenetic and transcriptional profiles. Furthermore, TLX1-high T-ALLs harbour molecular TLX1 locus abnormalities in the vast majority (31/33), a proportion largely underestimated by standard karyotypic screening. T-ALLs expressing TLX1 at lower levels (n=57, 22%) do not share these characteristics. Prognostic analysis within the adult LALA94 and GRAALL03 prospective protocols demonstrate a better event-free (p=0,035) and a marked trend for longer overall survival (p=0,059) for TLX1-high T-ALLs, while the expression of lower levels of TLX1 does not impact on prognosis. We propose that TLX1+ T-ALLs be defined as cases expressing TLX1/ABL ratios >1 and/or demonstrating TLX1 rearrangement. Therapeutic modification should be considered for those patients.
For personal use only. by guest on June 5, 2013. bloodjournal.hematologylibrary.orgFrom

Introduction:
A large proportion of T-cell Acute Lymphoblastic Leukemias (T-ALLs) show a normal (30-
40%) or failed (15-20%) karyotype.1,2 Molecular cytogenetic approaches have allowed
identification an increasing number of oncogenetic lesions in this disease.3,4 Oncogenes
such as TLX1/HOX11, TLX3/HOX11L2, TAL1 and the CALM-AF10 and MLL fusion
transcripts appear lineage and stage of maturation arrest-specific and as such are likely to
represent key leukemogenic features.5-8 More recently, evidence of NOTCH1 mutations in
about half of T-ALLs has further enhanced the biological heterogeneity of T-ALLs.9
However, few of these known oncogenetic markers have demonstrated clear prognostic
significance. Conflicting outcomes have been associated with HOX11L2, TAL1
deregulation and NOTCH1 mutations.7,10-14 TLX1 overexpression and/or translocation
generally confers a better prognosis but this association, when found, varies between
series.11,12,15-18
Deregulated expression of the TLX1gene, situated on chromosome 10q24, is reported in 20-
30% of T-ALLs but only 14% of adults and 4-7% of childhood T-ALLs show a 10q24
translocation when evaluated by standard karyotypic methods.15-17-19 The stringency of the
association between TLX1 expression and the presence of a translocation has therefore
been questioned.18 Observed levels of expression, assessed by Real Time Quantitative PCR
(RQ-PCR), vary greatly between samples.11,18 The reference genes used and RQ-PCR-
defined thresholds for ‘high level’ TLX1 expression differ between authors, which makes
data comparison difficult. It has been proposed that adults with a T-ALL expressing
elevated levels of TLX1 should not undergo bone marrow transplantation during first
remission.17 A stringent and standardised definition of TLX1(+) T-ALL is therefore
important if it is to be used for therapeutic stratification.
We undertook this study to clarify the biological and clinical significance of TLX1 levels of
expression in 264 (93 pediatric and 171 adult) T-ALLs which have undergone extensive
conventional and molecular cytogenetic, immunophenotypic and oncogenetic analysis.
For personal use only. by guest on June 5, 2013. bloodjournal.hematologylibrary.orgFrom

Materials and Methods:
Patients and diagnostic analysis
Diagnostic peripheral blood or bone marrow samples from: 264 T-ALLs, defined by
expression of cytoplasmic and/or surface CD3, CD7 and negativity for CD19 and MPO; 30
B-ALLs and 21 acute myeloid leukemias (AMLs) were analyzed after the patients provided
informed consent according to the Declaration of Helsinki. Approval for these studies was
obtained from the Comite Consultatif de Protection des Personnes dans la Recherche
Biomedicale Lyon B (CCPPRB) Institutional Review Board. Patients were considered
adults when older than 15 years. Ninety-eight Adult T-ALLs were treated within the
LALA-94 multicenter trial and 33 within the GRAALL-2003 trial. Details of patients
classification, DNA and RNA extraction, immunophenotype, and TCR analysis were
described previously.5,20,21
cDNA synthesis was performed centrally at the Necker facility, and RNA quality assessed
and normalized by quantification of ABL on an ABI PRISM 7700 or 7000 (Perkin-Elmer
Applied Biosystems, Branchburg, NJ), using guidelines from the Europe Against Cancer
program.22 Samples with an ABL cycle threshold (Ct) above 32 were excluded from
analysis. Each experiment included 2 nontemplate controls for contamination and all RQ-
PCRs were performed in duplicate. All primers spanned an intron and absence of genomic
amplification was confirmed by RQ-PCR from peripheral blood lymphocyte (PBL) DNA.
Transcript quantification was performed after normalization by the ABL housekeeping gene
from the standard curves using the delta of delta Ct method. Primers and RQ-PCR probes
have been previously reported.8,23
Assessment of RQ-PCR amplification efficiency of TLX1 and ABL
Logarithmic TLX1 plasmid dilutions were conducted and quantified by RQ-PCR. Efficiency
slopes for TLX1 and ABL dilutions were comparable with respective slope values of -3,53
and -3,45. In reproducibility experiments (n=10), the Ct of detection for a dilution
corresponding to one TLX1 copy per well was inconstant and varied between 38,04 and
41,1 (figure S1 on the Blood website). Hence, we considered that Cts above 38 were not
quantitative and were classified as TLX1-negative.
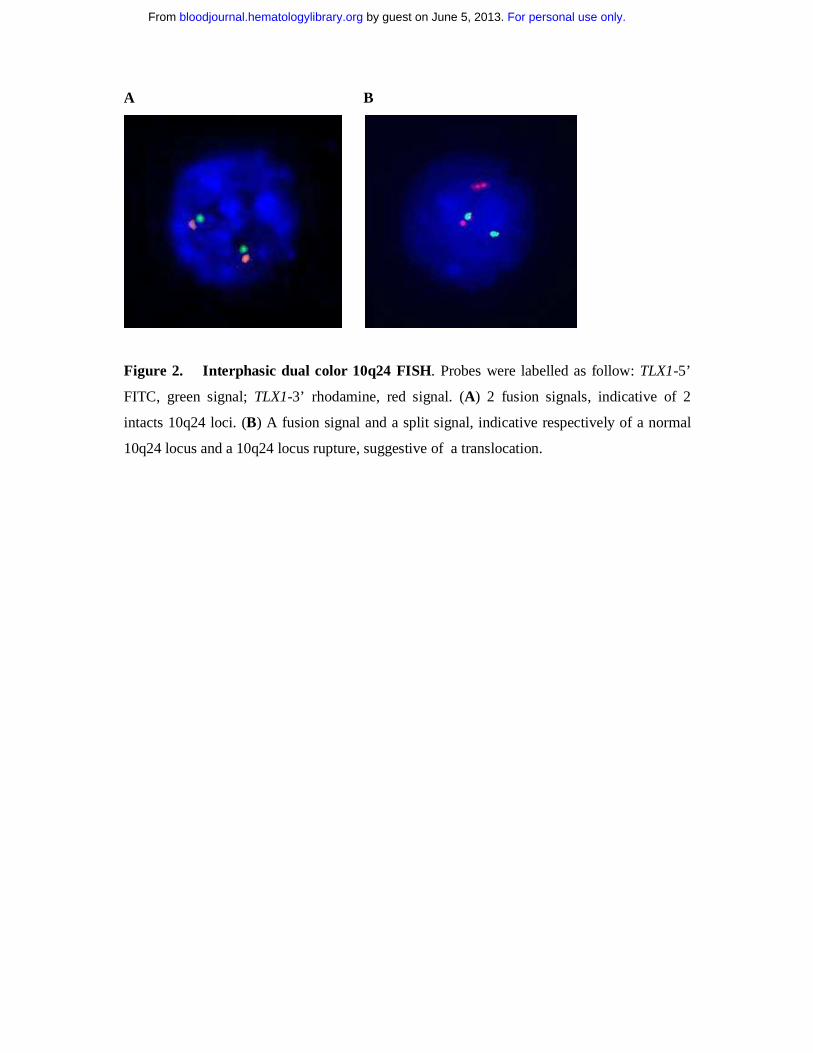
FISH analysis
Dual color FISH experiments were performed with two sets of overlapping probes flanking
the TLX1 locus on each side of the breakpoint: 5’ RP11-179B2 and RP11-1031N22 labeled
with FITC-dUTP and 3’ RP11-324L3 and RP11-119018 labeled with Rhodamine-dUTP
For personal use only. by guest on June 5, 2013. bloodjournal.hematologylibrary.orgFrom

(Figure S2). A normal TLX1 locus yields a fusion signal (Figure 2A). A TLX1 translocation
yields a split signal (Figure 2B).
Ligation-Mediated PCR (LM-PCR)
LM-PCR was performed using a Jδ1 or Dδ3 probe, as described.24 Briefly, 1µg of DNA
was digested with 2 blunt end restriction enzymes, DraI and PvuII. Ligation of 50pmol of
an adaptor to both ends of the restriction fragments was followed by two rounds of PCR
using nested adaptator-specific primers and the Jδ1 or Dδ3 specific primers respectively 5’-
gTTCCACAgTCACgggTTC-3’ and 5’-TgggACCCAgggTgAggATAT-3’. The LM-PCR
products were sequenced in both directions using the Jδ1 primer and the nested adaptor
specific primer. The sequences were blasted in the NCBI nucleotide database.
(http://www.ncbi.nlm.nih.gov/BLAST) and on the Ensembl genome browser tool
(http://www.ensembl.org/Multi/blastview). Results obtained by LM-PCR were confirmed
with a designed primer set.
TLX1-TCRD junction screen:
A multiplex PCR reaction was performed using the 10q24 5’-
gACATCCCTTCCTCAgACgC-3’ and the TCRD 3’ Jδ1 and Dδ3 aforementioned primers.
Briefly, 100ng of DNA was amplified for 40 cycles in the presence of 0,2nM each primer,
2mM MgCl2, 200µM dNTP, ABI Buffer II and 1 U Taq Gold (Perkin Elmer). Cycling
parameters included: preactivation 7min at 94oC followed by denaturation for 45sec at
94oC, annealing for 1min at 57oC and extension for 90 sec at 72oC for 40 cycles and a final
extension for 10min at 72oC.
Alleleic expression analysis:
PCR amplification and sequencing of genomic DNA identified polymorphic markers in the
3’ untranslated region (3’UTR) of TLX1, as described.25 DNAse-treated mRNA from
heterozygous samples was reverse transcribed, amplified and sequenced. The mono- or bi-
allelic expression pattern was determined by sequence analysis.
Large scale expression analysis :
An independent series of 92 T-ALL samples from Saint-Louis Hospital (Paris, France),
including 56 children (median age 9 years; range 1 to 15) and 36 adults (median age 27;
range 17 to 66) was previously analysed by large scale expression analysis using
For personal use only. by guest on June 5, 2013. bloodjournal.hematologylibrary.orgFrom

Affymetrix U133A arrays. Clinical, immunological and oncogenic group of these cases
have been described.8
LALA-94 and GRAALL-2003 trials
Ninety eight adults from the LALA-9421 and 33 from the GRAALL-2003 clinical protocols
could be classified into TLX1-high, -low and -negative based on RQ-PCR-defined criteria.
The LALA-94 multi-center prospective randomized trial was reported and discussed
previously. The complete remission (CR) rate (86%), survival outcome (median, 28
months), and follow up (median, 43 months) of the 98 LALA-94 patients T-ALLs with
available cDNA did not differ significantly from the 236 T-ALLs included in the LALA94
protocol. The GRAALL-2003 protocol was a pediatric-inspired Phase 2 trial which enrolled
224 adults with Ph-negative ALL between November 2003 and November 2005.
Preliminary results have been presented recently, with a median follow-up of 18 months.26
We report here on 33 patients with available cDNA for our analysis. The outcome for these
33 patients did not differ from the overall 74 T-ALLs included in the GRAALL-2003.
Statistical analysis
Patient characteristics and CR rates were compared using the Fisher exact test while median
comparisons were performed with the Mann-Whitney test. Overall survival (OS) was
calculated from the date of randomization until the date of death or last contact. Event-free
survival (EFS) was calculated from the date of randomization until the date of induction
failure, first relapse, death, or last contact. OS and EFS were estimated by the Kaplan-Meier
method, 27 then compared by the log-rank test. 28 For OS and EFS estimations and
comparisons, all patients who received an allogeneic stem cell transplantation (SCT) were
censored at SCT time. Adjustments were performed using the Cox model and tested by the
log likelihood ratio test. All calculations were performed using the STATA software,
version 9.0 (Stata Corporation, College Station, TX, USA).
RESULTS:
RQ-PCR TLX1 quantification defines 3 groups of T-ALL:
RQ-PCR quantification of TLX1 from 264 T-ALLs (171 adults and 93 children) was
performed centrally and expressed as a TLX1/ABL ratio (Figure 1). Results range from 4.0 x
10E+2 to undetectable. Thirty-five samples expressed TLX1 at high level with ratios of
TLX1 over ABL greater than 1 (range 2.0 to 4.0 x 10E+2). For the purpose of this
For personal use only. by guest on June 5, 2013. bloodjournal.hematologylibrary.orgFrom

manuscript, these T-ALLs are designated as the ‘TLX1-high’ group. Fifty-seven cases
expressed TLX1 at a lower level, with a median TLX1 value of 8.0 x 10E-04 (range 1.0 x
10E-05 to 1.0 x 10E-01) and are designated as the ‘TLX1-low’ group. One hundred and
seventy-two samples were classified in the TLX1-negative group. Strikingly, the TLX1-
high and TLX1-low group do not overlap and are separated by at least 1 log of TLX1 level
of expression (figure 1). As reported, no B-cell ALL nor AML expressed high levels of
TLX1 but low levels were observed for 3/30 B-ALLs and 4/21 AMLs. Low TLX1
expression was also found in the B-ALL (RS 4;11, RAJI, REH), Myeloblastic (Kasumi and
K562) and T-ALL (RPMI, MOLT4, CEM, MOLT13, MKB1, Jurkat, HBP-ALL) cell lines
(data not shown). TLX1 was not expressed in 5 control bone marrows, 10 normal peripheral
blood lymphocytes and 5 normal neonatal thymi.
>90% of TLX1-high T-ALLs have an abnormal 10q24 locus and show monoallelic
TLX1 expression:
Karyotype results were available for 175 cases (22 failed and 67 unavailable). Eleven (6%)
show clonal 10q24 abnomalities, all 11 cases belonged to the TLX1-high group. However,
17 TLX1-high T-ALLs with successful karyotypes did not demonstrate 10q24
rearrangement (Table 1). The remaining 7 TLX1-high samples did not have karyotpic data
available. Among these 24 TLX1-high samples without evident karyotypic 10q24
abnormality, 2 could not be explored by molecular techniques due to the absence of
appropriate material. Of the 22 evaluable samples, 20 demonstrated either a split 10q24
locus by FISH (Figure 2A), suggestive of a translocation (n=16), or a TLX1-TCRD junction
by LM-PCR (n=4). Two samples showed a normal (fusion) FISH pattern (figure 2B), with
no evidence of a TCR-TLX1 junction by LM-PCR. Overall, of 33 TLX1-high T-ALLs with
cytogenetic and/or DNA available for appropriate analysis, 31 (94%) demonstrated a TLX1
cytogenetic aberration.
Twelve of 15 TLX1-high samples tested were informative (heterozygous) for a single
nucleotide polymorphism in the 3’UTR region of TLX1. Monoallelic expression of TLX1
was observed in all 12. Of note, one of the two TLX1-high samples for whom no TLX1
cytogenetic lesion was evidenced by FISH or LM-PCR was evaluable for allele-specific
expression and showed a monoallelic pattern of TLX1 expression.
TLX1-low T-ALLs have an intact 10q24 locus :
For personal use only. by guest on June 5, 2013. bloodjournal.hematologylibrary.orgFrom

Among the 42 TLX1-low T-ALLs with an available karyotype, none showed karyotypic
10q24 abnormalities (Table 1). FISH analysis was performed for 14 TLX1-low T-ALLs.
The TLX1 locus appeared intact in all of these cases, including the 3 patients expressing the
highest TLX1 levels of the TLX1-low group. FISH was also performed on 11 cell lines
expressing low levels of TLX1 and all showed normal TLX1 loci. Among TLX1-high
samples, the sequenced translocation breakpoints on chromosome 10, identified by LM-
PCR, were relatively clustered (full details of this cluster will be published in detail
elsewhere). One particular set of primers successfully amplified 30% of the TLX1-TCR
junctions among the 21 TLX1-high samples tested. The sensitivity of this primer set was
evaluated at 10 x 10E-3/-4 log dilution (Figure 3). In order to verify whether we could
evidence a minor TCRD-TLX1 subclone causing the low TLX1 expression in the TLX1-low
T-ALLs, we searched the TLX1-low samples for TCRD-TLX1 rearrangements with this
designed PCR primer set. A total of 30 TLX1-low T-ALLs were tested but no TLX1-TCRD
junctions were amplified. For allele specific expression analysis, it was not possible to
amplify sufficient cDNA from the 3’UTR region of a significant number of TLX1-low
samples in order to reliably study their allelic expression.
TLX1-high but not TLX1-Low T-ALL share common immuno-genotypic and
transcriptional features:
Of the 264 T-ALLs, 241 cases have undergone TCR expression and rearrangement analysis
and have been TCR classified as described.20 All 32 TLX1-high tested demonstrated TCRB
V(D)J rearrangement on at least one allele and an uniform CD34- (31/32, 97%) CD1a+
(32/32, 100%) CD4/8 DP (28/32, 87%) cortical phenotype. They were closely correlated
(90%) to an IMB/pre-AB stage of maturation arrest (Table 2).20 TLX1-low and TLX1-neg
T-ALLs were not tightly linked to any specific stage of maturation arrest although the
TLX1-low group harbours less TCR-expressing cases compared to the TLX1-neg group
(p=0.01).
TLX1-high T-ALLs expressed TLX1 by definition and were uniformly negative for TLX3,
CALM-AF10 or SIL-TAL1 (table 3). In contrast, TLX1-low T-ALLs constituted a
heterogeneous oncogenic subgroup. Interestingly more “HOX” expressing cases such as
TLX3+ or CALM-AF10+ samples29 were found among the TLX1-low samples (p<0.05)
compared to the TLX1-negative T-ALLs.
TLX1 and array analysis of an independent series of 92 T-ALLS
For personal use only. by guest on June 5, 2013. bloodjournal.hematologylibrary.orgFrom
Homogeneous T-ALL oncogenic subgroups (TAL-RA, TAL-RB, MLL, CALM-AF10,
HOXA-t, TLX1, TLX3, and Immature) have been defined by gene expression profiling
from an independent series of 92 T-ALL samples, using unsupervised clustering (U133A
Affymetrix microarray) and correlation with immunological and oncogenic transcript
expression data.8 We measured TLX1 expression levels in these cases by RQ-PCR using
identical conditions and classified cases as TLX1-high, -low, and -negative cases as
described above. Distribution of the cases within the oncogenic subgroups was analysed
with respect to the TLX1 status. As expected, all TLX1-high cases shared a homogeneous
gene expression profile and clustered in the TLX1 subgroup. In contrast, TLX1-low cases
were distributed amongst the other subgroups (Figure 4), as were TLX1-negative cases.
Moreover, there was no case in the so-called HOX-R branch that had low TLX1 expression
as sole homeobox gene expression (i.e. all cases in this unsupervised branch expressed
HOXA, TLX1-high, or TLX3), suggesting that low TLX1 expression cannot trigger the
biological profile defining this branch. These data reinforce the view that whereas TLX1-
high cases represent a homogeneous oncogenic subgroup with biological significance, low
TLX1 expression does not trigger oncogenic pathways.
Prognostic value of TLX1-high versus TLX1-low expression within the adult LALA-94
and GRAALL-2003 therapeutic protocols:
Ninety-eight patients from the LALA-94 and 33 from the GRAALL-2003 protocol were
included. The median age of the included patients was 29 (range 16-58). The median white
blood cell count at diagnosis of all included patients was 21,4 x 10⁹ cells/mm3 (0.2-759).
There were 20 TLX1-high, 37 TLX1-low and 74 TLX1-neg samples. Patient characteristics
among the three subgroups are shown in Table 4. Overall, 118/131 patients (90%) achieved
CR including 20/20 patients in the TLX1-high, 30/37 in the TLX1-low and 68/74 in the
TLX1-neg subgroup. However, the achievement of CR at first induction was greater in the
TLX1-high subgroup as compared to combined TLX1-low and TLX1-neg subgroups (Table
4). Median EFS of all 131 patients was 23 months. EFS events were induction death in 5
patients (3, 2, and 0 in the TLX1-neg, -low, and –high subset, respectively), resistance to
induction in 8 patients (3, 5, and 0 in the TLX1-neg, -low, and –high subset, respectively),
relapse in 54 patients (32, 15, and 7 in the TLX1-neg, -low, and –high subset, respectively;
including 1 relapse after SCT), and death in first CR in 6 patients (3, 2, and 1 in the TLX1-
neg, -low, and –high subset, respectively; including 4 deaths after SCT). After censoring at
stem cell transplantation (SCT) time, median EFS of TLX1-neg, -low, and –high patients
was 20 months, 16 months, and not reached, respectively (Figure 5A, P=0.04 by log-rank
For personal use only. by guest on June 5, 2013. bloodjournal.hematologylibrary.orgFrom

test). After adjustment on trial and age, the difference between TLX1-high patients and
TLX1-low/-neg patients was statistically significant (hazard ratio in the TLX1-low/-neg
subgroup, 1.53 (95% CI: 1.03-2.27; P=0.035). Median OS of all 131 patients was 43
months. After censoring at SCT time, median OS of TLX1-neg, -low, and –high patients
was 31 months, 28 months, and not reached, respectively (Figure 5B, P=0.08 by log-rank
test). After adjustment on trial and age, there was a marked trend for longer OS in TLX1-
high patients as compared to TLX1-low/-neg patients (hazard ratio in the TLX1-low/-neg
subgroup, 1.56 (95% CI: 0.98-2.48; P=0.059).
Discussion:
In this study, we sought to determine the onco-biological and clinical significance of TLX1
expression in T-ALL, since published data on the subject were conflicting. We show that
two independent groups of TLX1-expressing T-ALLs exist: a homogenous good prognosis
group with high level TLX1 expression, due to TLX1-TCR juxtapositioning in the majority,
and a heterogeneous group with low level TLX1 expression and neutral prognostic impact.
Therapeutic stratification of TLX1+ T-ALL is increasingly envisaged; this will require
reproducible distinction of TLX1-high and TLX1-low T-ALL within the different
prospective adult and pediatric T-ALL trials.
High level expression was defined as TLX1/ABL RQ-PCR ratios greater than 1
(TLX1>1.E+00 ABL), with a clear demarcation of at least one log from TLX1-low cases.
Distinction of low level expression from TLX1 negativity depends on the sensitivity of the
technique. We considered samples with an absolute TLX1 Ct higher than 38 to be TLX1-
negative, based on reproducibility experiments conducted with TLX1 plasmid dilutions.
This ensured that the TLX1-low group expressed reasonably quantificable TLX1 amounts.
The fact that no TLX1 was detected in normal peripheral blood, bone marrow, thymic
cDNA or genomic DNA confirms the leukemic origin of these low level TLX1 transcripts.
This bi-modal pattern of TLX1 expression in T-ALL has been reported but its biological
significance was unexplored11. Multicenter reproducibility of these RQ-PCR criteria needs
to be evaluated.
TLX1-high T-ALLs corresponded to 18% of adult and 5% of pediatric cases, in
keeping with similar estimates11,23, but lower than reported by other authors17,18. Only 39%
demonstrated karyotypic 10q24 abnormalities, despite the fact that the incidence of 10q24
abnormalities (1/56 ; 2% of pediatric and 10/119 ; 8% of adult T-ALLs) and the overall
karyotype failure rate (22/197 ; 11%) approximated published prevalences17,18. Combined
For personal use only. by guest on June 5, 2013. bloodjournal.hematologylibrary.orgFrom

interphase FISH and TCRD LM-PCR analyses demonstrated that the vast majority of cases
without 10q24 karyotypic abnormalities were due to TLX1 rearrangement. Given that
neither TCRA/D-TLX1 t(10;14), nor TCRB-TLX1 t(7;14) are cryptic, the low detection rate
is likely to result from difficulty in obtaining representative mitosis from T-ALL blasts,
although half of the TLX1-high cases without apparent 10q24 rearrangements did
demonstrate clonal abnormalities. The two TLX1-high T-ALLs which demonstrated no
TLX1 rearrangement by FISH or TCRD LM-PCR may bear 10q24 abnormalities that are
beyond the scope of the molecular approaches used, such as intragenic insertion of a
transcriptional deregulator other than TCRD. The mono-allelic expression of TLX1 in one of
these cases is in keeping with deregulation in cis. This 6% false negative rate by FISH/ LM-
PCR (2/33 fully analysed TLX1-high T-ALLs) suggests that standardised RQ-PCR is the
most appropriate method for initial screening, if therapeutic stratification is to be envisaged.
Such an approach is, however, entirely dependent on a reproducible capacity to distinguish
TLX1-high from TLX1-low cases, and a combined RQ-PCR and FISH approach is optimal.
Based on the data presented here, cases with a TLX1/ABL ratio greater than 1 are likely to
be associated with a TLX1 rearrangement, those with TLX1/ABL ratios below 0.1 are
unlikely to have TLX1 rearrangement if the sample is representative of the leukaemia, and
those with intermediate ratios should be analysed by FISH with TLX1 and TCR probes.
TLX1-high T-ALLs demonstrated a homogenous stage of maturation arrest (IMB,
pre-AB) characteristic of cortical thymocytes arrested around the TCRβ selection30, a
correspondingly distinct gene expression profile8 and were mutually exclusive of the other
major T-ALL oncogenic markers : TLX3, CALM-AF10 and SIL-TAL1, in marked contrast to
TLX1-low T-ALLs. Taken together, TLX1-high T-ALL represent a distinct oncogenic
group, biologically different from TLX1-low T-ALLs.
The survival curves of the combined LALA-94 and GRAALL-2003 adult trials
reported here clearly show that only high levels of TLX1 expression confer a better
prognosis. TLX1 translocation or expression has generally been associated with a better
prognosis, although the strength of the association varies between series and small patient
numbers often preclude appropriate prognostic evaluation1,11,15 The absence of a
standardised PCR definition of TLX1-positive T-ALLs also makes data comparison
difficult. Notably, the trend towards better prognosis seems to be more pronounced when
authors consider ‘high’ TLX1 expressors or TLX1-translocated samples.11,17,18 A better
leukemia-free survival in adult T-ALL was associated with high TLX1 expression in the
study by Ferrando et al.17 A trend for a better outcome was observed in pediatric T-ALL by
Kees and al.18 , when 19.7% of the cohort was classified as TLX1-high, compared to only
For personal use only. by guest on June 5, 2013. bloodjournal.hematologylibrary.orgFrom
5% in the present series. It is possible that the use of a higher threshold to define TLX1-
high T-ALL would have allowed even better prognosis discrimination, although performing
such an analysis in pediatric protocols would require large patient numbers, given the
relative rarity of pediatric TLX1-high T-ALL, as defined here. Since all T-ALLs with
10q24 abnormalities correspond to TLX1-high cases, the t(10;14) is associated with a trend
toward better EFS even with limited patient numbers in both pediatic and adult T-ALL.11,15
TLX1-low T-ALLs are not a homogeneous group, since they demonstrated variable
immunophenotypic, oncogenotypic and transcriptional features and a similar response to
treatment as TLX1-negative cases. We cannot formally eliminate the possibility of minor
TCR-TLX1 subclones in these cases but consider this to be unlikely since no TLX1-TCR
junction could be identified amongst 30 TLX1-low samples tested with a sensitivity of
10×E-3/-4. Given that most of the ‘TLX1-low’ T-ALLs demonstrate other oncogenic
markers, oncogenic cooperation involving low levels of TLX1 is possible, as proposed for
NOTCH1 mutations.31 TLX1-low T-ALLs did, however, tend to correlate with an immature
stage of maturation arrest and, more particularly, the “HOXA” associated oncogenic
markers CALM-AF10, MLL and HOXA-TCR8,29, compared to TCR+, SIL-TAL+ or TAL-
RA T-ALLs. This low expression of TLX1 could reflect an underlying global homeodomain
gene deregulation program32,33 with low level transcription of TLX1 occurring as some kind
of leakage effect. While such considerations are beyond the scope of this manuscript, if
such a mechanisms occurs, it is unlikely to be restricted to T-ALL, since low TLX1
expression was also seen in B lineage ALL and AML.
Taken together, the importance of a standardized definition of TLX1 positivity can
not be overstressed if, as suggested in adult T-ALL,17 TLX1 status is to be used to dictate
therapeutic decisions such as bone marrow transplantation. As detailed above, we propose
that TLX1-high T-ALLs should be defined by a molecular RQ-PCR approach, refined when
necessary by FISH, although initial FISH screening will detect the majority of cases and
will need to be considered if RQ-PCR classification does not prove reproducible in inter-
laboratory comparisons within prospective clinical trials. We also propose that within adult
T-ALL, TLX1 positivity be restricted to cases with 10q24 rearrangement and/or TLX1/ABL
RQ-PCR ratios >1 and that such cases be stratified as low risk acute leukemia. All adult
cases with lower RQ-PCR ratios and absence of 10q24 rearrangements by FISH with
appropriate probes should be considered TLX1-negative. It is probable that similar criteria
will be appropriate in pediatric T-ALL, but this will require assessment within prospective
large scale trials.
For personal use only. by guest on June 5, 2013. bloodjournal.hematologylibrary.orgFrom

Acknowledgments: We thank all participants in the LALA94, GRAALL and FRALLE trials for collecting and providing data and samples, especially Véronique Lhéritier, data manager, Christine Pérot and Jacqueline Van Den Akker. Statement of authorship: V.A. and E.A.M. designed and supervised the research; J.B., E.C., C.M. and P.B. performed molecular analyses; J.B., I.R. and G.S. performed cytogenetic analyses; H.D. and X.T. performed clinical data analyses; J.B., V.A., E.A.M., HD and J.S. wrote the paper.
1. Schneider NR, Carroll AJ, Shuster JJ, Pullen DJ, Link MP, Borowitz MJ, Camitta BM, Katz JA, Amylon MD. New recurring cytogenetic abnormalities and association of blast cell karyotypes with prognosis in childhood T-cell acute lymphoblastic leukemia: a pediatric oncology group report of 343 cases. Blood. 2000;96:2543-2549 2. Harrison CJ, Foroni L. Cytogenetics and molecular genetics of acute lymphoblastic leukemia. Rev Clin Exp Hematol. 2002;6:91-113; discussion 200-112 3. Graux C, Cools J, Michaux L, Vandenberghe P, Hagemeijer A. Cytogenetics and molecular genetics of T-cell acute lymphoblastic leukemia: from thymocyte to lymphoblast. Leukemia. 2006;20:1496-1510 4. Poppe B, Cauwelier B, Van Limbergen H, Yigit N, Philippe J, Verhasselt B, De Paepe A, Benoit Y, Speleman F. Novel cryptic chromosomal rearrangements in childhood acute lymphoblastic leukemia detected by multiple color fluorescent in situ hybridization. Haematologica. 2005;90:1179-1185 5. Asnafi V, Radford-Weiss I, Dastugue N, Bayle C, Leboeuf D, Charrin C, Garand R, Lafage-Pochitaloff M, Delabesse E, Buzyn A, Troussard X, Macintyre E. CALM-AF10 is a common fusion transcript in T-ALL and is specific to the TCRgammadelta lineage. Blood. 2003;102:1000-1006 6. Bernard OA, Busson-LeConiat M, Ballerini P, Mauchauffe M, Della Valle V, Monni R, Nguyen Khac F, Mercher T, Penard-Lacronique V, Pasturaud P, Gressin L, Heilig R, Daniel MT, Lessard M, Berger R. A new recurrent and specific cryptic translocation, t(5;14)(q35;q32), is associated with expression of the Hox11L2 gene in T acute lymphoblastic leukemia. Leukemia. 2001;15:1495-1504 7. Ferrando AA, Neuberg DS, Staunton J, Loh ML, Huard C, Raimondi SC, Behm FG, Pui CH, Downing JR, Gilliland DG, Lander ES, Golub TR, Look AT. Gene expression signatures define novel oncogenic pathways in T cell acute lymphoblastic leukemia. Cancer Cell. 2002;1:75-87 8. Soulier J, Clappier E, Cayuela JM, Regnault A, Garcia-Peydro M, Dombret H, Baruchel A, Toribio ML, Sigaux F. HOXA genes are included in genetic and biologic networks defining human acute T-cell leukemia (T-ALL). Blood. 2005;106:274-286 9. Weng AP, Ferrando AA, Lee W, Morris JPt, Silverman LB, Sanchez-Irizarry C, Blacklow SC, Look AT, Aster JC. Activating mutations of NOTCH1 in human T cell acute lymphoblastic leukemia. Science. 2004;306:269-271 10. Ballerini P, Blaise A, Busson-Le Coniat M, Su XY, Zucman-Rossi J, Adam M, van den Akker J, Perot C, Pellegrino B, Landman-Parker J, Douay L, Berger R, Bernard
For personal use only. by guest on June 5, 2013. bloodjournal.hematologylibrary.orgFrom
OA. HOX11L2 expression defines a clinical subtype of pediatric T-ALL associated with poor prognosis. Blood. 2002;100:991-997 11. Cave H, Suciu S, Preudhomme C, Poppe B, Robert A, Uyttebroeck A, Malet M, Boutard P, Benoit Y, Mauvieux L, Lutz P, Mechinaud F, Grardel N, Mazingue F, Dupont M, Margueritte G, Pages MP, Bertrand Y, Plouvier E, Brunie G, Bastard C, Plantaz D, Vande Velde I, Hagemeijer A, Speleman F, Lessard M, Otten J, Vilmer E, Dastugue N. Clinical significance of HOX11L2 expression linked to t(5;14)(q35;q32), of HOX11 expression, and of SIL-TAL fusion in childhood T-cell malignancies: results of EORTC studies 58881 and 58951. Blood. 2004;103:442-450 12. Gottardo NG, Jacoby PA, Sather HN, Reaman GH, Baker DL, Kees UR. Significance of HOX11L2/TLX3 expression in children with T-cell acute lymphoblastic leukemia treated on Children's Cancer Group protocols. Leukemia. 2005;19:1705-1708 13. Breit S, Stanulla M, Flohr T, Schrappe M, Ludwig WD, Tolle G, Happich M, Muckenthaler MU, Kulozik AE. Activating NOTCH1 mutations predict favorable early treatment response and long-term outcome in childhood precursor T-cell lymphoblastic leukemia. Blood. 2006;108:1151-1157 14. Zhu YM, Zhao WL, Fu JF, Shi JY, Pan Q, Hu J, Gao XD, Chen B, Li JM, Xiong SM, Gu LJ, Tang JY, Liang H, Jiang H, Xue YQ, Shen ZX, Chen Z, Chen SJ. NOTCH1 mutations in T-cell acute lymphoblastic leukemia: prognostic significance and implication in multifactorial leukemogenesis. Clin Cancer Res. 2006;12:3043-3049 15. Cytogenetic abnormalities in adult acute lymphoblastic leukemia: correlations with hematologic findings outcome. A Collaborative Study of the Group Francais de Cytogenetique Hematologique. Blood. 1996;87:3135-3142 16. Baldus CD, Burmeister T, Martus P, Schwartz S, Gokbuget N, Bloomfield CD, Hoelzer D, Thiel E, Hofmann WK. High expression of the ETS transcription factor ERG predicts adverse outcome in acute T-lymphoblastic leukemia in adults. J Clin Oncol. 2006;24:4714-4720 17. Ferrando AA, Neuberg DS, Dodge RK, Paietta E, Larson RA, Wiernik PH, Rowe JM, Caligiuri MA, Bloomfield CD, Look AT. Prognostic importance of TLX1 (HOX11) oncogene expression in adults with T-cell acute lymphoblastic leukaemia. Lancet. 2004;363:535-536 18. Kees UR, Heerema NA, Kumar R, Watt PM, Baker DL, La MK, Uckun FM, Sather HN. Expression of HOX11 in childhood T-lineage acute lymphoblastic leukaemia can occur in the absence of cytogenetic aberration at 10q24: a study from the Children's Cancer Group (CCG). Leukemia. 2003;17:887-893 19. Hatano M, Roberts CW, Minden M, Crist WM, Korsmeyer SJ. Deregulation of a homeobox gene, HOX11, by the t(10;14) in T cell leukemia. Science. 1991;253:79-82 20. Asnafi V, Beldjord K, Boulanger E, Comba B, Le Tutour P, Estienne MH, Davi F, Landman-Parker J, Quartier P, Buzyn A, Delabesse E, Valensi F, Macintyre E. Analysis of TCR, pT alpha, and RAG-1 in T-acute lymphoblastic leukemias improves understanding of early human T-lymphoid lineage commitment. Blood. 2003;101:2693-2703 21. Thomas X, Boiron JM, Huguet F, Dombret H, Bradstock K, Vey N, Kovacsovics T, Delannoy A, Fegueux N, Fenaux P, Stamatoullas A, Vernant JP, Tournilhac O, Buzyn A, Reman O, Charrin C, Boucheix C, Gabert J, Lheritier V, Fiere D. Outcome of treatment in adults with acute lymphoblastic leukemia: analysis of the LALA-94 trial. J Clin Oncol. 2004;22:4075-4086 22. Beillard E, Pallisgaard N, van der Velden VH, Bi W, Dee R, van der Schoot E, Delabesse E, Macintyre E, Gottardi E, Saglio G, Watzinger F, Lion T, van Dongen JJ, Hokland P, Gabert J. Evaluation of candidate control genes for diagnosis and residual disease detection in leukemic patients using 'real-time' quantitative reverse-transcriptase polymerase chain reaction (RQ-PCR) - a Europe against cancer program. Leukemia. 2003;17:2474-2486
For personal use only. by guest on June 5, 2013. bloodjournal.hematologylibrary.orgFrom

23. Asnafi V, Beldjord K, Libura M, Villarese P, Millien C, Ballerini P, Kuhlein E, Lafage-Pochitaloff M, Delabesse E, Bernard O, Macintyre E. Age-related phenotypic and oncogenic differences in T-cell acute lymphoblastic leukemias may reflect thymic atrophy. Blood. 2004;104:4173-4180 24. Przybylski GK, Dik WA, Wanzeck J, Grabarczyk P, Majunke S, Martin-Subero JI, Siebert R, Dolken G, Ludwig WD, Verhaaf B, van Dongen JJ, Schmidt CA, Langerak AW. Disruption of the BCL11B gene through inv(14)(q11.2q32.31) results in the expression of BCL11B-TRDC fusion transcripts and is associated with the absence of wild-type BCL11B transcripts in T-ALL. Leukemia. 2005;19:201-208 25. Ferrando AA, Herblot S, Palomero T, Hansen M, Hoang T, Fox EA, Look AT. Biallelic transcriptional activation of oncogenic transcription factors in T-cell acute lymphoblastic leukemia. Blood. 2004;103:1909-1911 26. Huguet F, Raffoux E, Thomas X, Leguay T, Chevallier P, Escoffre M, Reman O, Caillot D, Vey N, Boissel N, Hunault N, Buzyn A, Chalandon Y, Delannoy A, Vernant JP, Lheritier V, Bene M-C, Macintyre E, Ifrah N, Dombret H. Towards a Pediatric Approach in Adults with Acute Lymphoblastic Leukemia (ALL): The GRAALL-2003 Study. Blood. 2006;108 27. Kaplan E MP. Nonparametric Estimation from incomplete observations. J Am Stat Assoc. 1958;53:457-481 28. Peto R PJ. Assymptotically efficient rank invariant test procedures. J R Stat Soc. 1972;135:185-206 29. Dik WA, Brahim W, Braun C, Asnafi V, Dastugue N, Bernard OA, van Dongen JJ, Langerak AW, Macintyre EA, Delabesse E. CALM-AF10+ T-ALL expression profiles are characterized by overexpression of HOXA and BMI1 oncogenes. Leukemia. 2005;19:1948-1957 30. Asnafi V, Buzyn A, Thomas X, Huguet F, Vey N, Boiron JM, Reman O, Cayuela JM, Lheritier V, Vernant JP, Fiere D, Macintyre E, Dombret H. Impact of TCR status and genotype on outcome in adult T-cell acute lymphoblastic leukemia: a LALA-94 study. Blood. 2005;105:3072-3078 31. Grabher C, von Boehmer H, Look AT. Notch 1 activation in the molecular pathogenesis of T-cell acute lymphoblastic leukaemia. Nat Rev Cancer. 2006;6:347-359 32. Brake RL, Kees UR, Watt PM. A complex containing PBX2 contributes to activation of the proto-oncogene HOX11. Biochem Biophys Res Commun. 2002;294:23-34 33. Watt PM, Kumar R, Kees UR. Promoter demethylation accompanies reactivation of the HOX11 proto-oncogene in leukemia. Genes Chromosomes Cancer. 2000;29:371-377
For personal use only. by guest on June 5, 2013. bloodjournal.hematologylibrary.orgFrom
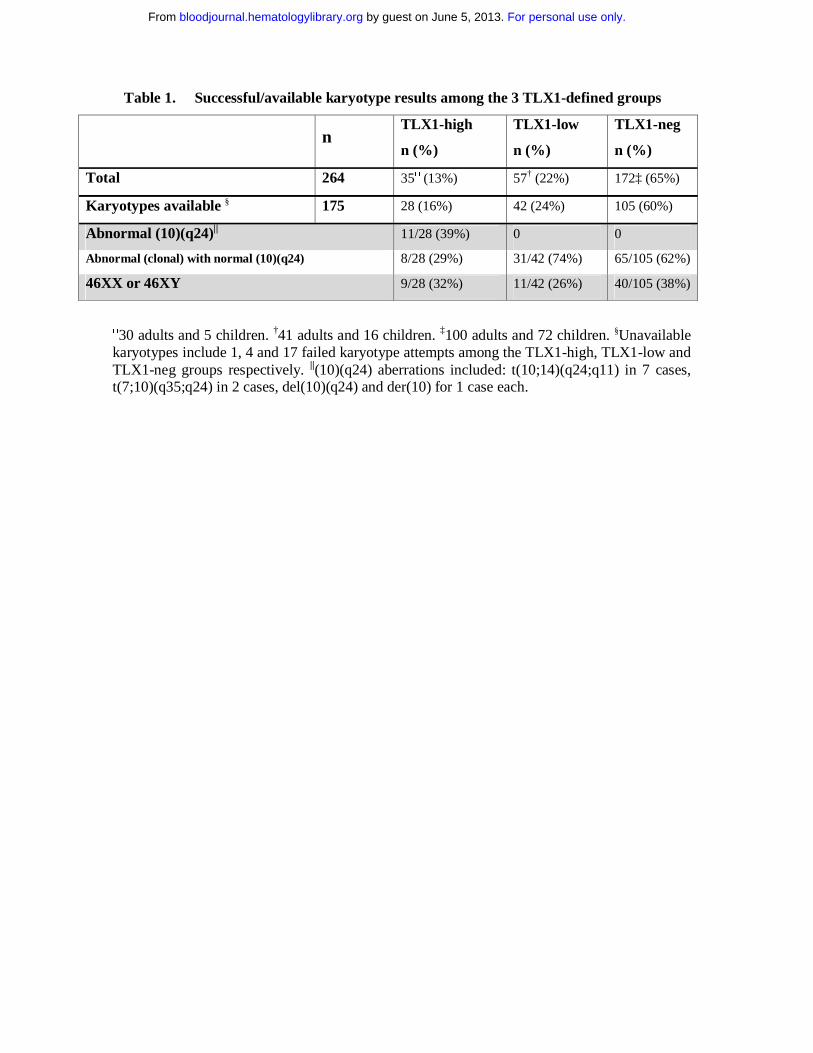
Table 1. Successful/available karyotype results among the 3 TLX1-defined groups
n TLX1-high
n (%)
TLX1-low
n (%)
TLX1-neg
n (%)
Total 264 35□ (13%) 57† (22%) 172‡ (65%)
Karyotypes available § 175 28 (16%) 42 (24%) 105 (60%)
Abnormal (10)(q24)|| 11/28 (39%) 0 0
Abnormal (clonal) with normal (10)(q24) 8/28 (29%) 31/42 (74%) 65/105 (62%)
46XX or 46XY 9/28 (32%) 11/42 (26%) 40/105 (38%)
□30 adults and 5 children. †41 adults and 16 children. ‡100 adults and 72 children. §Unavailable karyotypes include 1, 4 and 17 failed karyotype attempts among the TLX1-high, TLX1-low and TLX1-neg groups respectively. ||(10)(q24) aberrations included: t(10;14)(q24;q11) in 7 cases, t(7;10)(q35;q24) in 2 cases, del(10)(q24) and der(10) for 1 case each.
For personal use only. by guest on June 5, 2013. bloodjournal.hematologylibrary.orgFrom
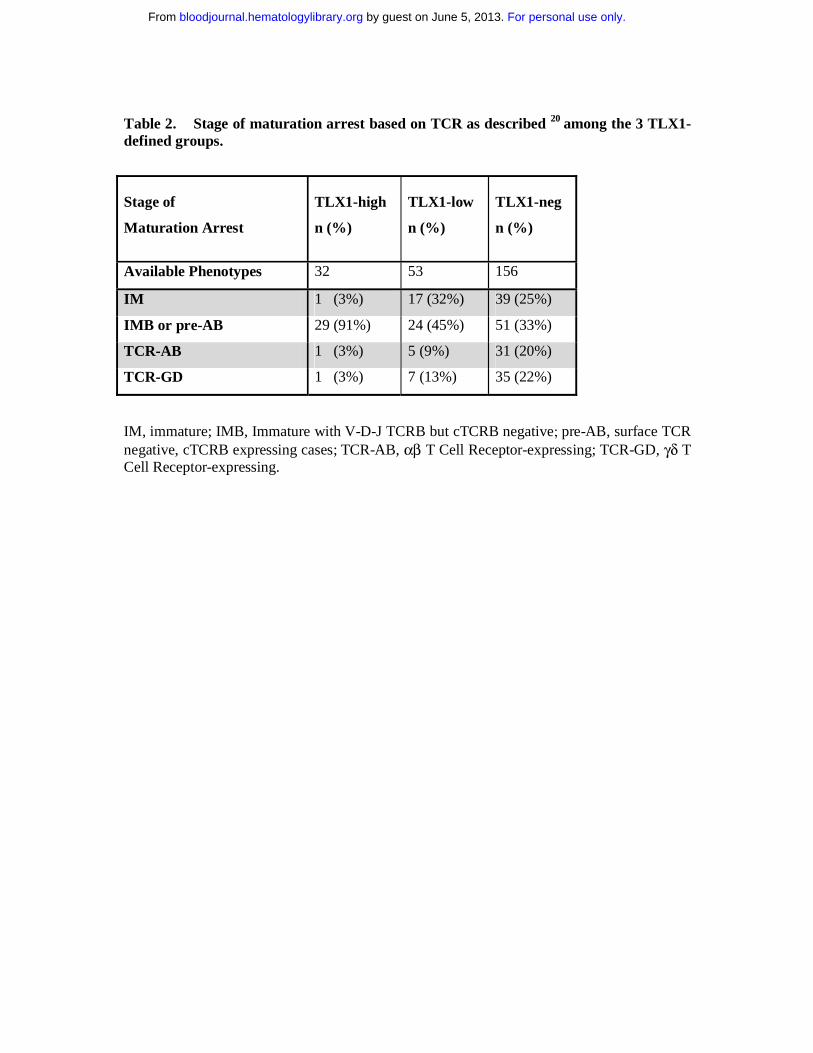
Table 2. Stage of maturation arrest based on TCR as described 20 among the 3 TLX1-defined groups.
Stage of
Maturation Arrest
TLX1-high
n (%)
TLX1-low
n (%)
TLX1-neg
n (%)
Available Phenotypes 32 53 156
IM 1 (3%) 17 (32%) 39 (25%)
IMB or pre-AB 29 (91%) 24 (45%) 51 (33%)
TCR-AB 1 (3%) 5 (9%) 31 (20%)
TCR-GD 1 (3%) 7 (13%) 35 (22%)
IM, immature; IMB, Immature with V-D-J TCRB but cTCRB negative; pre-AB, surface TCR negative, cTCRB expressing cases; TCR-AB, αβ T Cell Receptor-expressing; TCR-GD, γδ T Cell Receptor-expressing.
For personal use only. by guest on June 5, 2013. bloodjournal.hematologylibrary.orgFrom
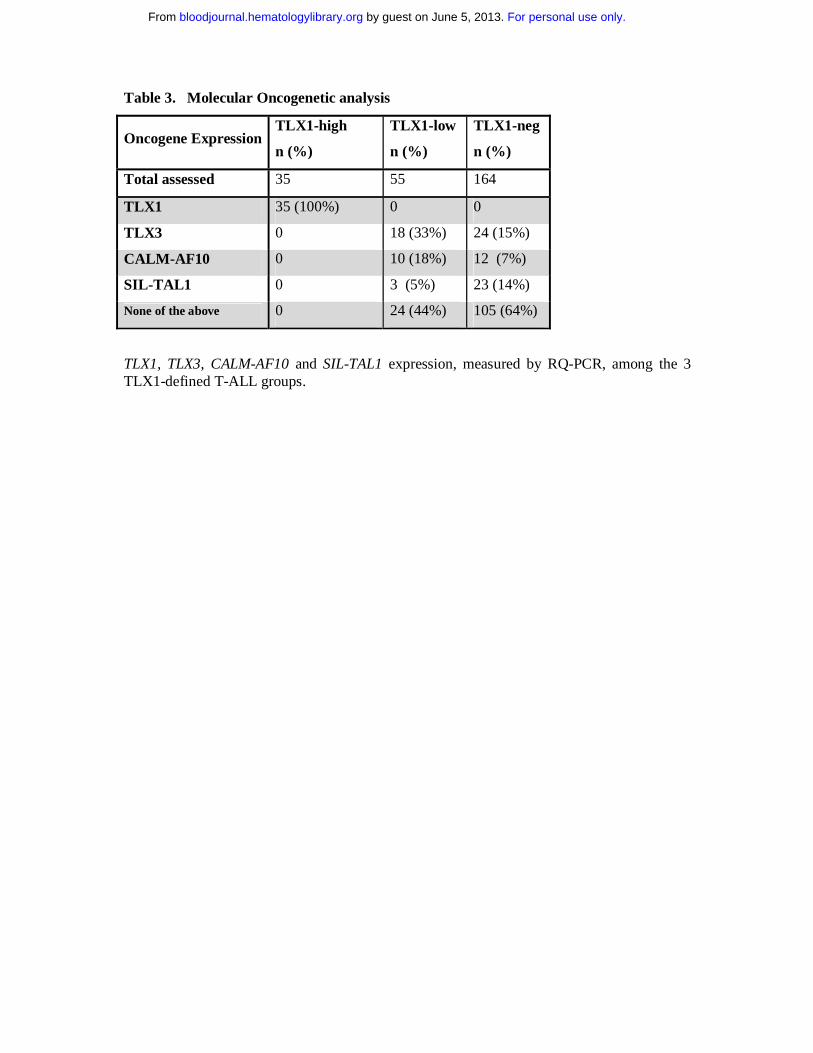
Table 3. Molecular Oncogenetic analysis
Oncogene Expression TLX1-high
n (%)
TLX1-low
n (%)
TLX1-neg
n (%)
Total assessed 35 55 164
TLX1 35 (100%) 0 0
TLX3 0 18 (33%) 24 (15%)
CALM-AF10 0 10 (18%) 12 (7%)
SIL-TAL1 0 3 (5%) 23 (14%)
None of the above 0 24 (44%) 105 (64%)
TLX1, TLX3, CALM-AF10 and SIL-TAL1 expression, measured by RQ-PCR, among the 3 TLX1-defined T-ALL groups.
For personal use only. by guest on June 5, 2013. bloodjournal.hematologylibrary.orgFrom

Table 4: Clinical Characteristics of the GRAALL2003 and LALA94 Patients
TLX1-high TLX1-low TLX1-neg P value
Patients (N) 20 37 74 Trial (LALA/GRAALL)
14/6 29/8 55/19 0.78
Median age (years)
35.5 (17-51) 32 (17-54) 26 (16-58) 0.06
Gender (M/F)
17/3 27/10 61/13 0.42
Median WBC (G/L)
19.0 (1.1-179) 12.6 (1.1-320) 22.6 (0.2-759) 0.36
CR rate in one course
20 (100%) 26 (70%) 57 (77%) 0.007 **
Overall CR rate 20 (100%) 30 (81%) 68 (92%) 0.22 ** EFS at 3 years * [95% CI]
54% [24-76] 24% [9-42] 36% [23-49] 0.035 **
OS at 3 years * [95% CI]
64% [32-84] 36% [17-55] 48% [34-62] 0.059 **
* All patients who received SCT were censored at SCT time. ** Outcome comparisons were performed for the TLX1-high versus TLX1-neg/-low subgroup and adjusted on treatment protocol and age.
For personal use only. by guest on June 5, 2013. bloodjournal.hematologylibrary.orgFrom

Figure 1. TLX1 level of expression. RQ-PCR quantification of TLX1 transcripts normalised for ABL in: 171 adults (□) and 93 children (○) T-ALL samples, 30 B-ALLs ( ), 21 AMLs ( ), 5 normal bone marrows ( ), 10 normal peripheral blood lymphocytes (-) and 5 normal Thymi (+). Results are expressed as a TLX1/ABL ratio and displayed on a logarithmic scale. A clear separation of a minimum of one log fold expression separates the TLX1-high from the TLX1-low samples. The cut-off value of >1.0E+00 is displayed [ ]. Samples with a detectable TLX1 signal but inferior to 1.00E-05 were considered negative, based on plasmid dilutions experiments.
<1.00E-05
1.00E-04
1.00E-03
1.00E-02
1.00E-01
1.00E+00
1.00E+01
1.00E+02
1.00E+03
For personal use only. by guest on June 5, 2013. bloodjournal.hematologylibrary.orgFrom
A B
Figure 2. Interphasic dual color 10q24 FISH. Probes were labelled as follow: TLX1-5’
FITC, green signal; TLX1-3’ rhodamine, red signal. (A) 2 fusion signals, indicative of 2
intacts 10q24 loci. (B) A fusion signal and a split signal, indicative respectively of a normal
10q24 locus and a 10q24 locus rupture, suggestive of a translocation.
For personal use only. by guest on June 5, 2013. bloodjournal.hematologylibrary.orgFrom
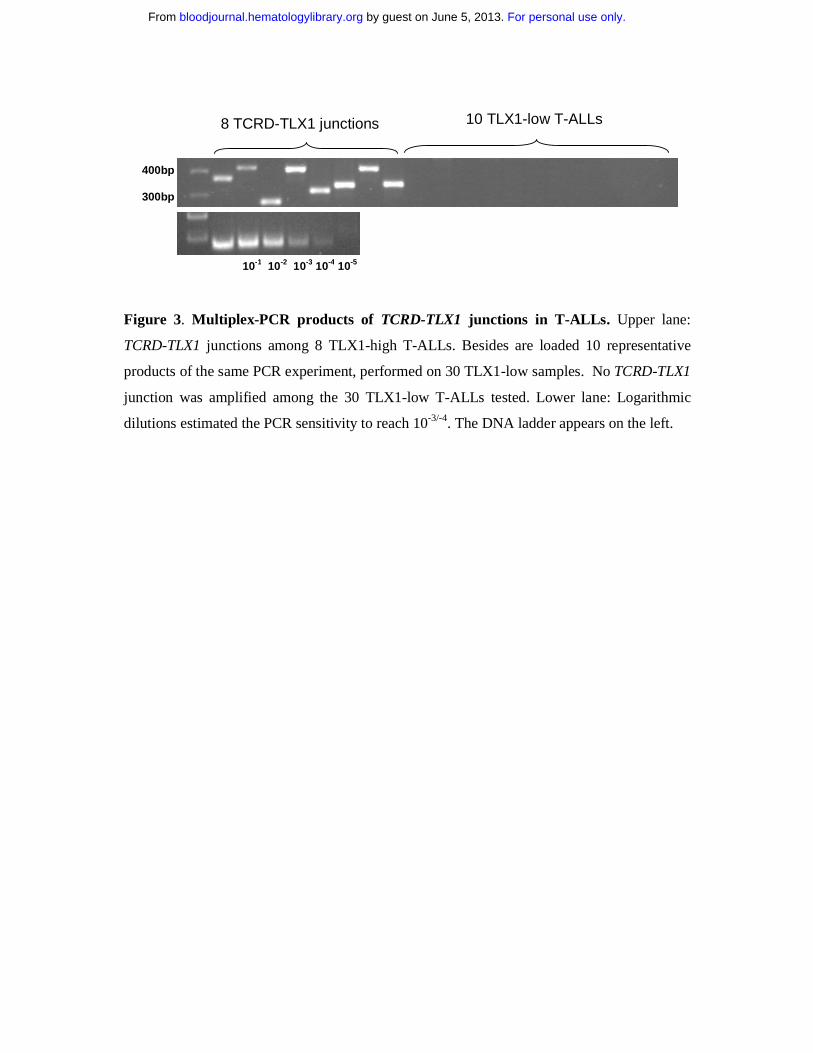
Figure 3. Multiplex-PCR products of TCRD-TLX1 junctions in T-ALLs. Upper lane:
TCRD-TLX1 junctions among 8 TLX1-high T-ALLs. Besides are loaded 10 representative
products of the same PCR experiment, performed on 30 TLX1-low samples. No TCRD-TLX1
junction was amplified among the 30 TLX1-low T-ALLs tested. Lower lane: Logarithmic
dilutions estimated the PCR sensitivity to reach 10-3/-4. The DNA ladder appears on the left.
400bp 300bp
8 TCRD-TLX1 junctions 10 TLX1-low T-ALLs
10-1 10-2 10-3 10-4 10-5
For personal use only. by guest on June 5, 2013. bloodjournal.hematologylibrary.orgFrom

<1,00E-05
1,00E-04
1,00E-03
1,00E-02
1,00E-01
1,00E+00
1,00E+01
1,00E+02
1,00E+03
TAL-RA
TAL-RB
MLL
CALM-A
F10
HOXA-RTLX1
TLX3
Imm
ature
n = 18 n = 4n = 18
n = 3
n = 6
n = 16n = 13
n = 11
<1,00E-05
1,00E-04
1,00E-03
1,00E-02
1,00E-01
1,00E+00
1,00E+01
1,00E+02
1,00E+03
TAL-RA
TAL-RB
MLL
CALM-A
F10
HOXA-RTLX1
TLX3
Imm
ature
n = 18 n = 4n = 18
n = 3
n = 6
n = 16n = 13
n = 11
<1,00E-05
1,00E-04
1,00E-03
1,00E-02
1,00E-01
1,00E+00
1,00E+01
1,00E+02
1,00E+03
TAL-RA
TAL-RB
MLL
CALM-A
F10
HOXA-RTLX1
TLX3
Imm
ature
n = 18 n = 4n = 18
n = 3
n = 6
n = 16n = 13
n = 11
Figure 4. TLX1 level of expression measured by RQ-PCR among the different oncogenic
groups as defined by transcriptional profile. Levels of TLX1 were normalised for ABL and
displayed on a logarithmic scale. The total number of cases in each group is indicated. All
TLX1-high samples co-cluster.
For personal use only. by guest on June 5, 2013. bloodjournal.hematologylibrary.orgFrom

A
0.00
0.20
0.40
0.60
0.80
1.00
prob
abili
tyof
even
tfre
esu
rviv
al
0 1 2 3 4 5
years
hox11 = negativehox11 = lowhox11 = high
EFS (censored at SCT)
0.00
0.20
0.40
0.60
0.80
1.00
prob
abili
tyof
even
tfre
esu
rviv
al
0 1 2 3 4 5
years
hox11 = negativehox11 = lowhox11 = high
EFS (censored at SCT)
B
0.00
0.20
0.40
0.60
0.80
1.00
prob
abili
tyof
surv
ival
0 1 2 3 4 5years
hox11 = negativehox11 = lowhox11 = high
Overall Survival (censored at SCT)
0.00
0.20
0.40
0.60
0.80
1.00
prob
abili
tyof
surv
ival
0 1 2 3 4 5years
hox11 = negativehox11 = lowhox11 = high
Overall Survival (censored at SCT)
Figure 5. Prognostic analysis. (A) Event-free survival, censored at stem cell transplantation time (P=0.04 by log-rank test); after adjustment for trial and age, the P value for the TLX1-high vs TLX1-low/-neg comparison was 0.035. (B) Overall survival, censored at stem cell transplantation time (P=0.08 by log-rank test); after adjustment for trial and age, the P value for the TLX1-high vs TLX1-low/-neg comparison was 0.059.
For personal use only. by guest on June 5, 2013. bloodjournal.hematologylibrary.orgFrom