
A Multi-State Diagnosis and Prognosis Framework with ... - arXiv
Upload
khangminh22Category
view
3download
0
1
Prognosis of angina and myocardial infarction in
South Asian and White populations in the United
Kingdom
M Justin S Zaman
A thesis submitted to University College London
for the degree of
DOCTOR OF PHILOSOPHY
Department of Epidemiology and Public Health
University College London
March 2009

2
I, Justin Zaman, confirm that the work presented in
this thesis is my own. Where information has been
derived from other sources, I confirm that this has
been indicated in the thesis.

3
Abstract Background
Coronary mortality rates amongst South Asian populations are higher than in White populations
in the UK. The contribution of incidence and prognosis of coronary disease to the higher coronary
mortality rates amongst South Asian populations is unknown. Incident coronary disease
commonly presents as angina and non-fatal myocardial infarction rather than as fatal events.
Aim
This thesis sought to investigate the incidence and prognosis of differing clinical presentations of
coronary disease such as angina and myocardial infarction in South Asian compared to White
populations in the UK.
Methods
Four new prospective studies, one aetiologic (South Asian N=580 initially healthy) and three
prognostic (N=2189 with suspected new-onset stable angina, N=502 undergoing coronary
angiography and N=3037 with acute coronary syndromes) were examined, using multi-variate
regression analyses. A systematic review and meta-analysis of these and previously published
studies was performed.
Results
• Incidence of angina was higher in South Asian than in White people in a healthy
population, and angina was similarly valid in predicting a poor prognosis in both
ethnic groups compared to those with no chest pain.
• In those with chronic angina, South Asian patients did not have a higher future risk of
myocardial infarction and death than White patients, but had a worse symptomatic
prognosis following coronary revascularisation when compared to White patients.
• South Asian patients had no worse a prognosis for mortality than White patients after
myocardial infarction
• On meta-analysis, incidence of fatal and non-fatal coronary disease was higher in South
Asian populations compared to White populations whilst prognosis of coronary
disease in South Asian populations was not worse than in White populations.
Conclusions
Increased coronary mortality rates in South Asian populations compared to the White
populations are due to the higher incidence of fatal and non-fatal coronary disease in South Asian
people, as the prognosis of manifest coronary disease in South Asian people is not worse than in
White people.

4
Contents
ABSTRACT ............................................................................................................................................................ 3
I. LIST OF TABLES .........................................................................................................................................................11
II. LIST OF FIGURES........................................................................................................................................................14
III. STATEMENT OF CONTRIBUTION TO THE RESEARCH ............................................................................................15
IV. ACKNOWLEDGEMENTS.............................................................................................................................................16
V. ABBREVIATIONS........................................................................................................................................................17
1 INTRODUCTION ......................................................................................................................................18
1.1 THE HIGHER CORONARY MORTALITY IN SOUTH ASIAN COMPARED TO WHITE POPULATIONS...............18
1.2 EXPLAINING ETHNIC DIFFERENCES IN CORONARY MORTALITY....................................................................19
1.3 ETHNICITY ............................................................................................................................................................20
1.3.1 South Asian populations .........................................................................................................................21
1.3.2 White populations .....................................................................................................................................22
1.3.3 Assessment of ethnicity ...........................................................................................................................23
1.4 THE MIGRATION HISTORY OF SOUTH ASIAN PEOPLE TO THE UNITED KINGDOM .....................................23
1.4.1 Moving to the United Kingdom ............................................................................................................23
1.4.2 Geographical origins of migrants .......................................................................................................24
1.5 THE PATHOLOGY OF THE STAGES OF CORONARY DISEASE UNDERLYING ITS DIFFERING CLINICAL
PRESENTATIONS...................................................................................................................................................................25
1.5.1 Asymptomatic coronary atheroma ....................................................................................................25
1.5.2 Exertional angina and the fibrous plaque .......................................................................................25
1.5.3 The acute coronary syndrome and the ruptured plaque ...........................................................26
1.5.4 Prediction of outcomes at differing clinical presentations of coronary disease...............27
1.5.5 Other presentations of ischaemic heart disease............................................................................27
1.6 ANGINA .................................................................................................................................................................28
1.6.1 Definition of angina..................................................................................................................................28 1.6.1.1 Diamond and Forrester definition............................................................................................................. 28 1.6.1.2 European Task Force definition.................................................................................................................. 29 1.6.1.3 The Rose angina questionnaire................................................................................................................... 30
1.6.2 Measuring angina .....................................................................................................................................31 1.6.2.1 Typicality of angina........................................................................................................................................... 31 1.6.2.2 Severity of angina............................................................................................................................................... 32
1.6.3 Prevalence of angina................................................................................................................................33 1.6.3.1 Prevalence of angina by minority ethnic group .................................................................................. 34
1.6.4 Treatment of angina ................................................................................................................................35
1.6.5 Prognosis of angina ..................................................................................................................................36 1.6.5.1 Risk of future myocardial infarction and coronary death.............................................................. 36 1.6.5.2 Risk of future recurrent angina................................................................................................................... 37
1.7 MYOCARDIAL INFARCTION.................................................................................................................................38
1.7.1 Definition of myocardial infarction....................................................................................................38
1.7.2 Prevalence of myocardial infarction..................................................................................................39 1.7.2.1 Prevalence of myocardial infarction by minority ethnic group................................................... 40
1.7.3 Treatment of myocardial infarction ..................................................................................................40
1.7.4 Prognosis of acute coronary syndromes...........................................................................................41
1.8 FACTORS DETERMINING PROGNOSIS OF ANGINA AND MYOCARDIAL INFARCTION ....................................42
1.8.1 Risk factors...................................................................................................................................................42
1.8.2 Disease severity ..........................................................................................................................................43 1.8.2.1 Anatomical severity .......................................................................................................................................... 43 1.8.2.2 Functional severity............................................................................................................................................ 44
5
1.8.2.3 Symptomatic severity ...................................................................................................................................... 44
1.8.3 Social environment ...................................................................................................................................44 1.8.3.1 Deprivation ........................................................................................................................................................... 44 1.8.3.2 Access to care....................................................................................................................................................... 44
1.8.4 Clinical management ...............................................................................................................................45 1.8.4.1 Secondary prevention drugs ........................................................................................................................ 45 1.8.4.2 Specialist investigation and treatment.................................................................................................... 45
1.9 RELATIONSHIP BETWEEN HEALTHY INDIVIDUALS AND THOSE WITH CORONARY DISEASE, AND FACTORS
AFFECTING INCIDENCE AND PROGNOSIS...........................................................................................................................46
2 AIMS AND OBJECTIVES.........................................................................................................................48
2.1 AIM ........................................................................................................................................................................48
2.2 SPECIFIC RESEARCH OBJECTIVES.......................................................................................................................48
3 SYSTEMATIC LITERATURE REVIEW................................................................................................49
3.1 SUMMARY OF CHAPTER ......................................................................................................................................49
3.2 INTRODUCTION ....................................................................................................................................................50
3.3 RESEARCH OBJECTIVE TO BE INVESTIGATED...................................................................................................50
3.4 SPECIFIC RESEARCH QUESTIONS .......................................................................................................................50
3.5 METHODS..............................................................................................................................................................51
3.5.1 Search strategy...........................................................................................................................................51
3.5.2 Inclusion criteria........................................................................................................................................51
3.5.3 Data extracted ............................................................................................................................................52
3.5.4 Incidence of coronary disease...............................................................................................................52 3.5.4.1 Papers excluded after reviewing titles and abstracts ...................................................................... 52 3.5.4.2 Papers excluded after review of full text ................................................................................................ 55 3.5.4.3 Flow diagram of search................................................................................................................................... 57
3.5.5 Prognosis of coronary disease ..............................................................................................................57 3.5.5.1 Papers excluded after reviewing titles and abstracts ...................................................................... 57 3.5.5.2 Papers excluded after review of full text ................................................................................................ 58 3.5.5.3 Flow diagram of search................................................................................................................................... 59
3.6 RESULTS................................................................................................................................................................59
3.6.1 Studies included on incidence of coronary disease.......................................................................59 3.6.1.1 Fatal outcomes .................................................................................................................................................... 59 3.6.1.2 Non-fatal outcomes........................................................................................................................................... 60
3.6.2 Studies included on prognosis of coronary disease......................................................................63 3.6.2.1 Outcomes from myocardial infarction..................................................................................................... 63 3.6.2.2 Outcomes from angina..................................................................................................................................... 66 3.6.2.3 Non-fatal outcomes........................................................................................................................................... 66
3.7 DISCUSSION ..........................................................................................................................................................68
3.7.1 Incident disease ..........................................................................................................................................68
3.7.2 Prognosis of disease..................................................................................................................................68
3.7.3 Implications .................................................................................................................................................69 3.7.3.1 Incidence of coronary disease ..................................................................................................................... 69 3.7.3.2 Prognosis of coronary disease..................................................................................................................... 69
3.8 CONCLUSION.........................................................................................................................................................69
4 DATA IN FOUR COHORTS USED FOR THIS PHD...........................................................................70
4.1 SUMMARY OF CHAPTER ......................................................................................................................................70
4.2 THE COHORTS ......................................................................................................................................................71
4.2.1 Healthy population cohort.....................................................................................................................71
4.2.2 Chest pain clinic cohort...........................................................................................................................71

6
4.2.3 Coronary angiography cohort..............................................................................................................72
4.2.4 Acute coronary syndrome cohort........................................................................................................73
4.3 ASSESSMENT OF DATA QUALITY IN EACH COHORT .........................................................................................75
4.3.1 Data checking .............................................................................................................................................75
4.3.2 Recruitment at baseline ..........................................................................................................................79 4.3.2.1 Whitehall-II ........................................................................................................................................................... 79 4.3.2.2 Chest pain clinic.................................................................................................................................................. 79 4.3.2.3 ACRE......................................................................................................................................................................... 80 4.3.2.4 MINAP...................................................................................................................................................................... 81
4.3.3 Ethnicity ........................................................................................................................................................82 4.3.3.1 Whitehall-II ........................................................................................................................................................... 82 4.3.3.2 Chest pain clinic.................................................................................................................................................. 82 4.3.3.3 ACRE......................................................................................................................................................................... 82 4.3.3.4 MINAP...................................................................................................................................................................... 83
4.3.4 Follow-up ......................................................................................................................................................85 4.3.4.1 Whitehall-II ........................................................................................................................................................... 85 4.3.4.2 Chest pain clinic.................................................................................................................................................. 86 4.3.4.3 ACRE......................................................................................................................................................................... 86 4.3.4.4 MINAP...................................................................................................................................................................... 87
4.3.5 Cohort-specific data field checks .........................................................................................................88 4.3.5.1 Chest pain in Whitehall-II .............................................................................................................................. 88 4.3.5.2 Angina in ACRE.................................................................................................................................................... 88 4.3.5.3 Diagnosis of acute coronary syndrome type in MINAP................................................................... 90 4.3.5.4 Cardiac biomarkers in MINAP ..................................................................................................................... 92
4.4 STATISTICAL POWER...........................................................................................................................................93
4.5 CONCLUSIONS.......................................................................................................................................................94
5 INCIDENCE AND PROGNOSIS OF SUSPECTED ANGINA IN A HEALTHY POPULATION....95
5.1 SUMMARY OF CHAPTER ......................................................................................................................................95
5.2 INTRODUCTION ....................................................................................................................................................96
5.3 RESEARCH OBJECTIVE TO BE INVESTIGATED...................................................................................................96
5.4 SPECIFIC RESEARCH QUESTIONS .......................................................................................................................96
5.5 METHODS..............................................................................................................................................................97
5.5.1 Population ....................................................................................................................................................97
5.5.2 Ethnicity ........................................................................................................................................................97
5.5.3 Chest pain .....................................................................................................................................................97
5.5.4 Risk factors...................................................................................................................................................99
5.5.5 Follow-up ................................................................................................................................................... 100
5.5.6 Statistical analysis ................................................................................................................................. 100
5.6 RESULTS.............................................................................................................................................................101
5.6.1 Incidence of different forms of chest pain by ethnic group .................................................... 103
5.6.2 Prognosis of chest pain......................................................................................................................... 104 5.6.2.1 Prognosis within ethnic groups of those with pain compared to those with no chest pain
...................................................................................................................................................................................104 5.6.2.2 Prognosis within types of pain for South Asian compared to White populations............104
5.6.3 Mortality of whole cohort.................................................................................................................... 106
5.7 DISCUSSION .......................................................................................................................................................106
5.7.1 Objective addressed ............................................................................................................................... 106
5.7.2 The burden of symptoms and their prognostic validity in South Asian populations ... 107
5.7.3 The prognosis of chest pain symptoms in South Asian compared to White populations...
........................................................................................................................................................................ 107
5.7.4 Relation with clinical presentation and diagnosis and implications for clinicians...... 108

7
5.7.5 Limitations ................................................................................................................................................ 109
5.7.6 Implications .............................................................................................................................................. 110
5.8 CONCLUSIONS....................................................................................................................................................110
5.9 BUILDING TO NEXT CHAPTER .........................................................................................................................110
6 PROGNOSIS OF INCIDENT TYPICAL AND ATYPICAL CHEST PAIN...................................... 112
6.1 SUMMARY OF CHAPTER ...................................................................................................................................112
6.2 INTRODUCTION .................................................................................................................................................113
6.3 RESEARCH OBJECTIVE TO BE INVESTIGATED................................................................................................113
6.4 SPECIFIC RESEARCH QUESTIONS ....................................................................................................................113
6.5 METHODS...........................................................................................................................................................114
6.5.1 Population ................................................................................................................................................. 114
6.5.2 Ethnicity ..................................................................................................................................................... 116
6.5.3 Risk factors and treatment strategy ............................................................................................... 116
6.5.4 Descriptors of chest pain ..................................................................................................................... 116
6.5.5 Follow-up ................................................................................................................................................... 118
6.5.6 Statistical analysis ................................................................................................................................. 119
6.6 RESULTS.............................................................................................................................................................119
6.6.1 Chest pain descriptors .......................................................................................................................... 121
6.6.2 Symptoms and diagnosis ..................................................................................................................... 121
6.6.3 Symptoms and their validity in predicting prognosis .............................................................. 122
6.6.4 Symptoms and their relation to clinical management ............................................................ 124
6.6.5 The impact of diagnosis on prognosis ............................................................................................ 125 6.6.5.1 The symptom score.........................................................................................................................................125 6.6.5.2 Symptoms and risk factors in prediction of prognosis..................................................................128
6.7 DISCUSSION .......................................................................................................................................................128
6.7.1 Objective addressed ............................................................................................................................... 128
6.7.2 Symptoms in South Asian people...................................................................................................... 129
6.7.3 Typicality of symptoms and other explanations for inequalities in management........ 130
6.7.4 Clinical implications of history taking ........................................................................................... 131
6.7.5 Limitations ................................................................................................................................................ 131
6.7.6 Implications .............................................................................................................................................. 133
6.8 CONCLUSIONS....................................................................................................................................................133
6.9 BUILDING TO NEXT CHAPTER .........................................................................................................................134
7 SYMPTOMATIC OUTCOMES FOLLOWING CORONARY ANGIOGRAPHY IN PATIENTS
WITH CHRONIC STABLE ANGINA ............................................................................................................ 135
7.1 SUMMARY OF CHAPTER ...................................................................................................................................135
7.2 INTRODUCTION .................................................................................................................................................136
7.3 RESEARCH OBJECTIVE TO BE INVESTIGATED................................................................................................136
7.4 SPECIFIC RESEARCH QUESTIONS ....................................................................................................................137
7.5 METHODS...........................................................................................................................................................137
7.5.1 Population ................................................................................................................................................. 137
7.5.2 Ethnicity ..................................................................................................................................................... 137
7.5.3 Assessment of angina status at baseline and follow-up .......................................................... 137 7.5.3.1 Canadian Cardiovascular Society classification angina.................................................................137 7.5.3.2 Rose angina questionnaire ..........................................................................................................................140
7.5.4 Baseline clinical details ........................................................................................................................ 141
7.5.5 Appropriateness ratings ...................................................................................................................... 141
7.5.6 Angiographic findings .......................................................................................................................... 142
7.5.7 Follow up for mortality and hospitalisation................................................................................ 142

8
7.5.8 Statistical analysis ................................................................................................................................. 142
7.6 RESULTS.............................................................................................................................................................143
7.6.1 Baseline correlates of angina ............................................................................................................ 143
7.6.2 Mortality and relationship with angina status........................................................................... 145
7.6.3 Change in angina status between ethnic groups ....................................................................... 145
7.6.4 Angina status and relation to revascularisation........................................................................ 147
7.6.5 Angina status, appropriateness for revascularisation and relation to revascularisation.
........................................................................................................................................................................ 147
7.6.6 Risk of myocardial infarction and death....................................................................................... 148
7.7 DISCUSSION .......................................................................................................................................................148
7.7.1 Objective addressed ............................................................................................................................... 148
7.7.2 Why does angina improve less in South Asian patients after revascularisation? ......... 149
7.7.3 Limitations ................................................................................................................................................ 150
7.7.4 Implications .............................................................................................................................................. 152
7.8 CONCLUSIONS....................................................................................................................................................152
7.9 BUILDING TO NEXT CHAPTER .........................................................................................................................153
8 THE PROGNOSIS OF ACUTE CORONARY SYNDROMES ........................................................... 154
8.1 SUMMARY OF CHAPTER ...................................................................................................................................154
8.2 INTRODUCTION .................................................................................................................................................155
8.3 RESEARCH OBJECTIVE TO BE INVESTIGATED................................................................................................155
8.4 SPECIFIC RESEARCH QUESTIONS ....................................................................................................................155
8.5 METHODS...........................................................................................................................................................156
8.6 STATISTICAL ANALYSIS....................................................................................................................................157
8.7 RESULTS.............................................................................................................................................................157
8.7.1 Admission characteristics of whole cohort................................................................................... 157
8.7.2 Admission characteristics of types of acute coronary syndromes....................................... 158
8.7.3 Prognosis in whole cohort................................................................................................................... 161
8.7.4 Prognosis by acute coronary syndrome type............................................................................... 161
8.7.5 Prognosis among diabetics ................................................................................................................. 162
8.7.6 Stratifying prognosis by admission characteristics .................................................................. 163 8.7.6.1 Diabetes and other risk factors:................................................................................................................163 8.7.6.2 Disease severity ................................................................................................................................................164 8.7.6.3 Social environment .........................................................................................................................................164 8.7.6.4 Clinical management ......................................................................................................................................164
8.8 DISCUSSION .......................................................................................................................................................165
8.8.1 Admission characteristics and prognosis by acute coronary syndrome type................. 166
8.8.2 Diabetes...................................................................................................................................................... 166
8.8.3 Other risk factors .................................................................................................................................... 167
8.8.4 Disease severity ....................................................................................................................................... 168
8.8.5 Social environment ................................................................................................................................ 168
8.8.6 Clinical management ............................................................................................................................ 168
8.8.7 Limitations ................................................................................................................................................ 168
8.8.8 Implications .............................................................................................................................................. 169
8.9 CONCLUSIONS....................................................................................................................................................170
9 THE CONTRIBUTION OF INCIDENCE AND PROGNOSIS TO OVERALL CORONARY DEATH
RATES IN SOUTH ASIAN AND WHITE POPULATIONS ...................................................................... 171
9.1 SUMMARY OF CHAPTER ...................................................................................................................................171
9.2 INTRODUCTION .................................................................................................................................................172
9.3 RESEARCH OBJECTIVE TO BE INVESTIGATED................................................................................................173

9
9.4 SPECIFIC RESEARCH QUESTIONS ....................................................................................................................173
9.5 METHODS...........................................................................................................................................................173
9.6 STATISTICAL ANALYSIS....................................................................................................................................174
9.7 RESULTS.............................................................................................................................................................175
9.7.1 The studies of this thesis ...................................................................................................................... 175
9.7.2 Meta-analysis of incidence studies................................................................................................... 176 9.7.2.1 Fatal events.........................................................................................................................................................176 9.7.2.2 Fatal and non-fatal events............................................................................................................................176
9.7.3 Meta-analysis of prognostic studies ................................................................................................ 178 9.7.3.1 Previously published studies .....................................................................................................................178 9.7.3.2 Studies from this thesis.................................................................................................................................178
9.7.4 Ethnic comparisons of prognosis within strata of prognostic factors............................... 180 9.7.4.1 Diabetes ................................................................................................................................................................183 9.7.4.2 Other risk factors .............................................................................................................................................183 9.7.4.3 Disease severity ................................................................................................................................................184 9.7.4.4 Social environment .........................................................................................................................................184 9.7.4.5 Clinical management ......................................................................................................................................187
9.8 DISCUSSION .......................................................................................................................................................187
9.8.1 Objective addressed ............................................................................................................................... 187
9.8.2 Incidence .................................................................................................................................................... 188
9.8.3 Prognosis and factors affecting it .................................................................................................... 188 9.8.3.1 Risk factors..........................................................................................................................................................188 9.8.3.2 Disease severity ................................................................................................................................................188 9.8.3.3 Clinical management ......................................................................................................................................189 9.8.3.4 Social environment .........................................................................................................................................190 9.8.3.5 Symptomatic prognosis ................................................................................................................................192
9.8.4 Limitations ................................................................................................................................................ 193
9.8.5 Implications .............................................................................................................................................. 194 9.8.5.1 Public Health ......................................................................................................................................................194 9.8.5.2 Clinical ...................................................................................................................................................................194 9.8.5.3 Research ...............................................................................................................................................................195
9.9 CONCLUSION......................................................................................................................................................195
10 DISCUSSION ...................................................................................................................................... 196
10.1 OVERALL FINDINGS ..........................................................................................................................................196
10.2 IMPLICATIONS ...................................................................................................................................................198
10.2.1 Aetiology and primary prevention within primary care ................................................... 198
10.2.2 Secondary prevention within hospital care ............................................................................ 199
10.2.3 Further research................................................................................................................................ 199
10.2.4 Public health ....................................................................................................................................... 200
10.3 LIMITATIONS .....................................................................................................................................................201
10.3.1 Definition and validation of ethnicity ....................................................................................... 201
10.3.2 Heterogeneity of South Asians and whites .............................................................................. 201
10.3.3 Definition and validation of chest pain and angina ............................................................ 202
10.3.4 Data quality and validity ............................................................................................................... 204
10.4 FUTURE WORK ..................................................................................................................................................204
10.4.1 Improving the measure of angina .............................................................................................. 204
10.4.2 Improving the quality of the data and statistical methodology ..................................... 206 10.4.2.1 Propensity scores.............................................................................................................................................206 10.4.2.2 Multiple Imputation of Baseline Data ....................................................................................................206
10.4.3 Linkage of databases ....................................................................................................................... 207 10.4.3.1 Linking secondary care data with primary care data.....................................................................207

10
10.4.3.2 Linking secondary care data with other secondary care data ...................................................209
10.4.4 The influence of genetics ................................................................................................................ 209
10.4.5 South Asians in South Asia............................................................................................................. 210
10.4.6 Generational effects ......................................................................................................................... 211
10.4.7 Ethnic inequalities in other diseases ......................................................................................... 213
11 CONCLUSIONS .................................................................................................................................. 214
12 REFERENCES..................................................................................................................................... 215
13 APPENDICES ..................................................................................................................................... 226
13.1 CENSUS 2001 - ETHNICITY IN ENGLAND AND WALES..............................................................................226
13.2 INTERNATIONAL CLASSIFICATION OF DISEASES 2007 VERSION- ISCHAEMIC HEART DISEASE ...........229
13.3 ROSE ANGINA QUESTIONNAIRE ......................................................................................................................231
13.4 INCIDENCE OF CORONARY DISEASE MEDLINE LITERATURE SEARCH STRATEGY .................................232
13.5 PROGNOSIS OF CORONARY DISEASE MEDLINE LITERATURE SEARCH STRATEGY ................................233
13.6 SEARCH STRATEGIES FOR PROGNOSIS IN MEDLINE IN OVID SYNTAX AND THE PUBMED
TRANSLATION ....................................................................................................................................................................238
13.7 DEPRIVATION SCORES......................................................................................................................................240
13.7.1 Indices of Multiple Deprivation ................................................................................................... 240
13.7.2 Carstairs................................................................................................................................................ 240
13.7.3 Townsend ............................................................................................................................................. 241
13.8 TERMINOLOGY FOR DESCRIPTION OF PEOPLE..............................................................................................242
13.9 FONTS.................................................................................................................................................................242
14 ABSTRACTS....................................................................................................................................... 243
14.1 ACRE .................................................................................................................................................................243
14.2 CHEST PAIN CLINIC...........................................................................................................................................244
14.3 SYSTEMATIC REVIEW AND META-ANALYSIS.................................................................................................245
14.4 THE WHITEHALL-II STUDY ............................................................................................................................246
15 PAPERS............................................................................................................................................... 247
15.1 PROGNOSIS OF INCIDENT TYPICAL AND NON-TYPICAL ANGINA ................................................................247
15.2 SYMPTOMATIC OUTCOMES FOLLOWING CORONARY ANGIOGRAPHY IN PATIENTS WITH CHRONIC STABLE
ANGINA .............................................................................................................................................................................248
16 PRIZES ................................................................................................................................................ 249
16.1 BEST POSTER (CLINICAL SCIENCE), UCL CARDIOVASCULAR SCIENCE DAY 2006..............................249
16.2 BRITISH JUNIOR CARDIOLOGIST’S ASSOCIATION-CORDIS INTERNATIONAL RESEARCH AWARDS
FINALIST 2006.................................................................................................................................................................250
16.3 ROYAL SOCIETY OF MEDICINE CARDIOLOGY SECTION'S PRESIDENT'S MEDAL FINALIST 2008........251
17 INVITED TALKS ............................................................................................................................... 252
17.1 MINAP CONFERENCE, ROYAL COLLEGE OF PHYSICIANS 27 MARCH 2007..........................................252
17.2 SOUTH ASIAN HEALTH FOUNDATION CONFERENCE ON MANAGEMENT OF CORONARY HEART DISEASE
IN SOUTH ASIANS, ROYAL COLLEGE OF PHYSICIANS 1ST DECEMBER 2008...........................................................253

11
i. List of tables
Table 1 Prevalence of angina in UK adults from survey data ..........................................................................33
Table 2 Prevalence of angina in minority ethnic groups, Health Survey for England in 2004 .........34
Table 3 Studies examining mortality and incidence of coronary disease within South Asian
peoples compared to White majority populations ...............................................................................................54
Table 4 Literature search for the comparison of incidence of coronary disease between South
Asian and White populations .........................................................................................................................................62
Table 5 Literature search for the comparison of prognosis of coronary disease between South
Asian and White populations .........................................................................................................................................67
Table 6 The four cohorts used for the thesis – data sources and methodology ......................................78
Table 7 MINAP - Proportions of ECG abnormalities and ACS type in successive yearly datasets...81
Table 8 MINAP - Admission characteristics, comparing availability of ethnic group data, in 2004
.....................................................................................................................................................................................................84
Table 9 MINAP - Risk factor profile, comparing White and Asian patients, by sex, in 2004 .............85
Table 10 MINAP - Admission characteristics, comparing status (dead/alive) at 1 year, in South
Asian and White patients, in 2004...............................................................................................................................87
Table 11 ACRE - Comparison of baseline factors between those with data and those missing data
for angina at baseline and follow-up, in South Asian and White patients..................................................89
Table 12 MINAP - Final diagnosis against reperfusion treatment, in 2004 ..............................................92
Table 13 MINAP - Final diagnosis against troponin levels, in 2004 .............................................................92
Table 14 MINAP - Proportions of data fields for cardiac marker with missing entries in successive
yearly datasets......................................................................................................................................................................93
Table 15 MINAP - ECG findings on arrival against troponin levels, in 2004.............................................93
Table 16 Estimated risk of outcomes in South Asian participants in the studies of this thesis .......94
Table 17 Whitehall-II - Baseline characteristics in each chest pain type comparing South Asian
and White participants...................................................................................................................................................102
Table 18 Whitehall-II - Prognosis for coronary death or non-fatal myocardial infarction,
comparing types of chest pain to those with no chest pain, and comparing South Asian to White
participants by type of chest pain .............................................................................................................................105
Table 19 Whitehall-II – Incidence of whole cohort for differing outcomes, comparing South Asian
to White participants ......................................................................................................................................................106
Table 20 Chest pain clinic study - Descriptors of four components of chest pain used by
cardiologists and classification of their typicality .............................................................................................117

12
Table 21 Chest pain clinic study - Baseline data and chest pain characteristics, comparing
participants of South Asian origin with those of White origin by sex.......................................................121
Table 22 Chest pain clinic study - Typical compared to atypical chest pain as a predictor of
coronary outcome in South Asian and in White participants.......................................................................123
Table 23 Chest pain clinic study - Type of chest pain (typical and atypical) and subsequent receipt
of angiography, receipt of revascularisation and prognosis in South Asian compared to White
participants .........................................................................................................................................................................124
Table 24 Chest pain clinic study - Non-cardiac compared to typical and atypical chest pain as a
predictor of coronary outcome in South Asian and White participants by sex....................................125
Table 25 Chest pain clinic study – Individual chest pain descriptor and risk of coronary outcome
in South Asian and White participants by sex .....................................................................................................127
Table 26 Chest pain clinic study - High coronary risk compared to low coronary risk in South
Asian participants with atypical pain as a predictor of coronary outcome, adjusted for
management strategy .....................................................................................................................................................128
Table 27 ACRE - Presence of angina or not by CCS in White and South Asian patients at follow-up
cross-tabulated to data on nitrate prescription GP diagnosis of angina on general practitioner
questionnaire at follow-up...........................................................................................................................................140
Table 28 ACRE - Baseline characteristics in each angina class, in South Asian and White patients
..................................................................................................................................................................................................144
Table 29 ACRE - Numbers of outcomes (myocardial infarction and death (all cause/coronary)),
rates and hazard ratios (crude/adjusted for age) in South Asian compared with White patients
..................................................................................................................................................................................................148
Table 30 MINAP - Admission data in South Asian and White patients, in 2004 ..................................158
Table 31 MINAP - Admission characteristics in each type of acute coronary syndrome in South
Asian compared to White patients ...........................................................................................................................160
Table 32 MINAP - Risk in patients with diabetes compared to patients without diabetes of all-
cause mortality at one year, in South Asian and White patients.................................................................163
Table 33 MINAP - Risk in South Asian compared to White patients, stratified by diabetes, of all-
cause mortality at one year..........................................................................................................................................164
Table 34 MINAP - Risk in South Asian compared to White patients, stratified by risk factors,
markers of disease severity, social environment and clinical management, of age-adjusted all-
cause mortality at one year..........................................................................................................................................165
Table 35 Risk in South Asian compared to White participants, stratified by risk factors, markers
of disease severity, social environment and clinical management, of age-adjusted all-cause
mortality at one year in three prognostic cohorts.............................................................................................181
Table 36 Risk in South Asian compared to White participants, stratified by diabetes, of all-cause
mortality at one year in the three prognostic cohorts.....................................................................................183

13
Table 37 MINAP - Admission characteristics comparing those in the most deprived quintile with
the least deprived quintile, in South Asian and White participants ..........................................................186
Table 38 MINAP - Effect of deprivation on all-cause mortality at one-year comparing South Asian
and White participants...................................................................................................................................................187

14
ii. List of figures
Figure 1 Stages of atherosclerosis and correlation with clinical presentations......................................26
Figure 2 Relationship between healthy individuals and those with coronary disease, and factors
affecting incidence and prognosis................................................................................................................................47
Figure 3 Literature search flow diagram for the comparison of incidence of coronary disease
between South Asian and White populations.........................................................................................................57
Figure 4 Literature search flow diagram for the comparison of prognosis of coronary disease
between South Asian and White populations.........................................................................................................59
Figure 5 Whitehall-II – Cumulative incidence of different types of chest pain by ethnic group over
seven study phases ..........................................................................................................................................................103
Figure 6 Chest pain clinic study - Recruitment of participants....................................................................115
Figure 7 Chest pain clinic study - Likelihood that exercise ECG result, cardiologist summary or
symptom score leads to a diagnosis of angina, by sex and ethnicity.........................................................122
Figure 8 Chest pain clinic study - Typicality of chest pain according to symptom score comparing
South Asian to White participants and cumulative probability of coronary death/ACS..................123
Figure 9 ACRE - Recruitment of patients with chest pain data....................................................................139
Figure 10 ACRE - Mild compared to severe baseline angina and risk of future all-cause mortality,
in White and South Asian patients............................................................................................................................145
Figure 11 ACRE - Mean Canadian Cardiovascular Score of angina at baseline and 6-year follow-up,
in White and South Asian patients............................................................................................................................146
Figure 12 ACRE - Odds of improvement of angina in South Asians compared with White patients
within whole study patient and by management strategy post-angiography ......................................147
Figure 13 MINAP - Risk in South Asian compared to White patients within each type of acute
coronary syndrome of all-cause mortality at one year....................................................................................162
Figure 14 Meta-analysis of incidence studies of coronary disease in South Asian compared to
White populations............................................................................................................................................................177
Figure 15 Meta-analysis of prognostic studies of coronary disease in South Asian compared to
White populations............................................................................................................................................................179
Figure 16 Proportion of population classified as Indian, Pakistani or Bangladeshi at the 2001
Census and Indices of Multiple Deprivation Score 2004, by selected London boroughs.................192
Figure 17 Differing angina phenotypes: anatomy, symptoms and function domains.......................205

15
iii. Statement of contribution to the research
I formulated the research aims and objectives jointly with Professor Harry
Hemingway from 2002-2004 and co-wrote the PhD grant proposal with him.
After having completed a Masters in Epidemiology in 2005, I was responsible for
all analyses on this PhD from 2005-2008. I selected the variables used in the
analyses, performed all the statistical analyses, interpreted the results and wrote
the thesis. I produced all figures and tables and was solely responsible for the
design of posters and presentation of them, as well as for delivering talks, at
regional, national and international meetings. I led authorship of all papers
resulting from these analyses.
I was responsible for ethics approval of use of clinical data for research purposes
in part of the chest pain clinic study to the Central Office for Research Ethics
Committees, as well as site-specific approval at Newham. I was responsible for
obtaining Patient Information Advisory Group permission to link anonymised
data sets without obtaining individual patient consent. I recruited patient and
user organisations/representatives from my practice as a cardiologist at
Newham to advice on the purpose and ethics of the study.
I led on a successful grant application to further the work of this PhD thesis. With
support from the £67934 grant awarded by the Clinical Research and
Development Committee of University College London Hospitals, a statistician
will be recruited to design and conduct multi-level analyses to assess further the
impact of ethnicity and social deprivation on outcomes from acute coronary
syndromes in MINAP.

16
iv. Acknowledgements
This PhD was supported by a British Heart Foundation (BHF) Clinical PhD Studentship
(Ref FS/04/062) and would not have been possible without it, so I thank the BHF for
supporting this particular field of research and hence for facilitating my early training as
a clinician-epidemiologist.
The use of four studies entails the co-operation of many, so firstly I thank all the
participants who gave up their time to take part in the studies. I thank the Whitehall-II
group for access to and assistance with the database (especially Martin Shipley), and to
the Clinical Epidemiology group at UCL for all their individual inputs into my work over
the last three years (Natalie Fitzpatrick, Connie Junghans, Angela Crook, Ruoling Chen,
Jackie Damant, Kate McAllister, Charlotte Ashton, Gene Feder and Jessica Sheringham).
I thank the staff at Newham University Hospital’s chest pain clinic for their help in my
fieldwork there, Jo Morris and Yvonne Nicholas from Newham’s Research and
Development for assistance with the ethics approval process and Bridget Cole, Librarian
at the Norfolk & Norwich University Hospital, for invaluable assistance on the systematic
review.
To my supervisors – I cannot repay the debt I owe Professors Harry Hemingway and
Adam Timmis for not only the time they have given to me over the last three years but in
their mentorship of me and their trust in my potential as an academic. Their steering of
a young cardiologist’s course, with his burning questions on the health of populations
and of social inequalities, which itself needed a vessel that they provided, has served to
inspire that cardiologist to one day do the same for those who come to him with ideas
beyond the cardiac catheterisation laboratory.
Finally, none of this would have been possible without the relentless and untiring
support of my amazing wife, who - aside from her instant and total comprehension of
my goals in life and of my reasons for undertaking this research, and thus providing
unfaltering support - has ensured I neither went hungry nor without sleep whilst
completing this thesis. Thank you, Aisha.

17
v. Abbreviations
ACRE Appropriateness of Coronary Revascularisation
ACS acute coronary syndrome
BMI body mass index
CABG coronary artery bypass surgery
CCS Canadian Cardiovascular Society
CK/CK-MB Creatine phosphokinase/-MB isoenzyme
ECG electrocardiogram
GP general practitioner
GTN glyceryl trinitrate (nitroglycerin)
HES Hospital Episode Statistics
HDL high density lipoprotein
ICD International Classification of Diseases
IMD Indices of Multiple Deprivation
IQR inter-quartile range
LDL low density lipoprotein
MI Myocardial Infarction
MINAP Myocardial Infarction National Audit Project
NFMI Non-fatal myocardial infarction
NHS National Health Service
NSTEMI non-ST-segment elevation myocardial infarction
PCI percutaneous coronary intervention
PTCA percutaneous trans-luminal coronary angioplasty
RQ Rose angina questionnaire
STEMI ST-segment elevation myocardial infarction
18
1 Introduction
1.1 The higher coronary mortality in South Asian compared to White
populations
Of all the estimated 57 million deaths in the world in 2002, cardiovascular
disease was the largest single cause, resulting in 17 million deaths. Societies
across the world experience different rates of different cardiovascular diseases,
and within those societies, there exists differences between social class, gender
and ethnicity. In the 1950s, studies began to report differences in coronary
disease rates between ethnic groups, and in particular the South Asian group
(predominately people from India, Bangladesh, Pakistan and Sri Lanka).1-4
Shaper and Jones in 1959 stated that "in the African population of Uganda
coronary heart disease is almost non-existent. In the Asian community on the
other hand coronary heart disease is a major problem".1 Adelstein in 1963
pointed out that among the South African ethnic types, ‘Asians’ (almost entirely
of Indian descent) showed the most unfavourable mortality rates from
cardiovascular disease and that these rates were among the highest of the
national rates on record.3 Walker presented similar findings from South Africa
17 years later, having examined death certificates of members of different ethnic
populations in Johannesburg who had died of ischaemic heart disease, and used
them to calculate age-specific mortality rates. As well as an extremely high
mortality rate among White populations (especially among the Jewish sector), an
equally high or higher rate was found among Indians, in the context of a lower
rate among ‘Coloureds’ and an extremely low rate among blacks.5
Coronary heart disease remains the most common cause of premature death in
the UK, although mortality has been falling continuously since its peak in the
early 1970s.6 7 However, UK studies of mortality in the 1970s and 1980s
highlighted differences in cause of death between different immigrant groups.
Balarajan presented data based on the 1981 census showing that mortality from
ischaemic heart disease was highest in men and women born in the Indian
subcontinent with standardised mortality ratios of 136 and 146 respectively,8

19
adding value to the data he had presented seven years earlier showing higher
proportional mortality due to ischaemic heart disease in immigrants to England
and Wales from the Indian subcontinent.9
A study based on 1991 census data revealed higher standardised mortality ratios
for those born in South Asia, of 151 (141 to 162) for women and 146 (141 to
151) for men.10 This study further demonstrated that from 1971 to 1991,
standardised mortality ratios for ischaemic heart disease in the general UK
population fell by 29% for men and by 17% for women, whilst South Asian
immigrants experienced a shallower decline (20% for men and 7% for women).
Latest data from the 2001 UK census noted that though coronary mortality fell
among migrants, rate ratios for coronary mortality remained higher than for men
and women from South Asia.11-13
Similar disparities in mortality continue to be reported internationally. Sheth et
al reported on cardiovascular mortality among Canadians of European, South
Asian and Chinese origin from 1979 to 1993.14 In their analysis of 1.2 million
deaths, rates of death from ischaemic heart disease were highest among
Canadians of South Asian origin whereas those of Chinese origin had a
substantially lower rate. In Palaniappan et al’s study of coronary heart disease
mortality for six ethnic groups in California between 1990 and 2000,
proportional mortality rates were highest in Asian Indian men (161) and women
(144).15
1.2 Explaining ethnic differences in coronary mortality
This thesis seeks to explain why there is a higher coronary mortality rate in
South Asian compared to White populations. Epidemiologically, the explanation
for this may be either as a consequence of higher incidence of coronary disease
in South Asian populations or a worse prognosis of already-manifested coronary
disease – or a combination of both. Evidence for the contributions of disease
incidence and prognosis requires, respectively, incident events in ‘healthy’
cohort studies and examination of outcomes in clinical cohorts with coronary
disease.

20
1.3 Ethnicity
The Department of Health’s definition of an ethnic group is ‘a group of people
who share characteristics such as language, history, culture, upbringing, religion,
nationality, geographical and ancestral origins and place’. In contrast, the use of
‘race’ in epidemiological research is based on biological features principally
centred around physical factors, and ignores the wider societal context.16
Ethnicity depends on a wider socio-environmental and behavioural context and
thus makes its identification and hence use as a variable in research – of vital
importance in epidemiology – more difficult than race. Whereas biological
differences between ethnic groups (e.g. in cholesterol levels) can be measured by
a blood test, sociological and behavioural differences between ethnic groups (e.g.
deprivation, cultural preferences for medical treatments) are more difficult to
measure. Advantageously, by considering the influence of such components that
make up ethnicity, ethnicity allows the incorporation of socio-environmental and
behavioural factors associated with differing ethnic groups beyond just the
genetic and biological factors that race is limited to when considering the origins
of diseases.
Ultimately, such labelling is only of importance if differences between ethnic
groups exist in the population. Clearly, if there were no ethnic differences in
disease patterns, epidemiological investigation in the field would be pointless. As
long as ethnic disparities in health are suggested however, then careful and
critical analyses of them are merited. As the aetiology of disease is not just
biological but socio-environmental and behavioural, ethnicity as an exposure has
clear advantages to race as an epidemiological variable, aside from any moral
arguments for its use.
The recording of ethnicity is thus of importance. The 1991 Census of Population
was the first to collect information on the ethnic group of every individual in the
population of Great Britain. The Office for National Statistics April 2001 census
question was similar to the one asked in 1991, but with changes in some
categories - in particular, people could tick "mixed" for the first time. They were
asked “What is your ethnic group?” According to this census, South Asian people

21
made up just over 3.5% of the total UK population, about 2,084,000 out of nearly
58,800,000. Of these nearly 1,054,000 (1.8%) were Indian, 747,000 (1.25%)
were Pakistani and just under 283,000 (0.5%) were Bangladeshi. In comparison,
there were 247,403 (0.4%) Chinese people, 565,876 (1.0%) Black Caribbean
people and 485,277 (0.8%) Black African people. The average ages of minority
ethnic communities were younger than the White European population.17 The
Office for National Statistics 2001 census types were:
A. White: British; Irish or Any other White background
B. Mixed: White and Black Caribbean; White and Black African; White and
Asian or any other mixed background
C. Asian or Asian British: Indian; Pakistani; Bangladeshi; Any other Asian
background
D. Black or Black British: Caribbean; African; Any other Black background
E. Chinese or other ethnic group: Chinese; Any other
(more detailed data from The Office for National Statistics 2001 in Appendix
13.1)
1.3.1 South Asian populations
South Asian people are part of a heterogeneous group composed of different
nationalities and religions (e.g. Indians and Bangladeshis, Muslims and Hindus).
Ideally, all analyses comparing the health of this population with white majority
populations should take this into account. However, the vast majority of studies
that have presented results on ethnic differences between these two populations
have used the aggregated ‘South Asian’ category, and those that collect data on
the constituent peoples often do not have the power required for statistical
analyses between South Asian peoples.
Hence, the acceptability of the broader ‘South Asian’ group as a means of
description of this population needs to be examined. Despite its heterogeneity,
the term South Asian is growing in acceptance culturally among the people it
seeks to classify because it acknowledges common interests while it allows for

22
difference.18 This also parallels the gradual acceptance of the term "Asian
American" by peoples primarily of East and Southeast Asian ancestry, who found
reason to claim a shared identity in dealing with bureaucratic matters and
racism. Despite doubts as to the inclusiveness of such terms and their wider
applicability, especially with respect to health and disease,19 there exist
similarities in behaviour within the South Asian peoples. Poverty and smoking
are more prevalent among Pakistanis and Bangladeshis whilst obesity and a lack
of exercise are associated with all South Asian peoples, though Pakistanis and
Bangladeshis are more likely to have higher levels of inactivity.20 21
Furthermore, though differences between the differing peoples of the South
Asian category may result in different patterns of incident disease, it is unlikely
that such differences would result in differential prognoses when presenting
with coronary disease. For example, the vast majority of studies have reported
that South Asian patients of any origin (from Bangladeshis in London to Indians
in the USA) present with coronary disease at younger ages than White patients
and this younger age. Thus, age – rather than the nationality – will exert a
stronger effect on prognosis.
1.3.2 White populations
Much of the work in ethnic differences has used relatively homogenous White
populations as the comparison group. However, the heterogeneity of the ‘White’
group should be appreciated, for example the increased socioeconomic
disadvantage and mortality of Irish people living in England and Wales.22 Any
conclusions from analyses on ethnic comparisons should be applied to those
specific White populations being studied, and not extrapolated to other ‘White’
populations outside the inclusion criteria of that study. It is of further interest
that work from Scotland did not reveal worse coronary mortality in those born in
South Asia compared to those Scottish-born, but that the use of England and
Wales as a comparison group showed a substantial excess of coronary risk
among South Asians in Scotland, comparable to that reported in England and
Wales.13 Comparisons with England and Wales showed high all-cause, coronary
heart disease and stroke mortality among Scottish residents born in Scotland,

23
Northern Ireland, the Republic of Ireland. Thus, inferences from analyses
between White populations in England and South Asian populations in England
cannot then be assumed to apply to White populations in Scotland and Ireland.
The increasing migration from Southern and Eastern Europe of ‘Whites’ adds
further heterogeneity to the category.
Within England itself, evidence reporting worse coronary health within deprived
neighbourhoods can be explained away once individual measures of socio-
demographic status are adjusted for.23 Thus, conclusions applied to White
populations within smaller geographical areas such as England (or even within
cities) require consideration of such factors. However, Scotland’s relative
mortality disadvantage compared to the rest of Great Britain is not explained
away fully even after allowing for deprivation.24
1.3.3 Assessment of ethnicity
The current preference for practical reasons is for self-assessment of ethnicity25
In a USA study, there was reasonable concordance between self-assessment of
ethnicity and ethnicity recorded by an outside observer for some ethnic groups
(such as blacks, White populations and ‘Asians’a, whilst other groups were less
concordant (e.g. Hispanic and American Indian).26
1.4 The migration history of South Asian people to the United
Kingdom
1.4.1 Moving to the United Kingdom
Migration into the UK began in significant numbers after the 1962
Commonwealth Immigrants Act. The Moving Here website and partnership
(http://www.movinghere.org.uk ), led by the National Archives, reports that
before 1960 such immigration had been small and migrants generally had a
significant knowledge of the English language or Britain, or both. This group
comprised seamen, ex-Indian army personnel, university graduates, teachers,
doctors and other professionals. The entry of South Asian people to England was
controlled at source by the Indian and Pakistani governments.
a ‘Asian’ in the USA refers to East Asians e.g. Chinese, Filipinos, Japanese

24
The majority of those who entered the UK after 1960 came to fill jobs in industry,
and were unskilled in comparison. Most were literate in Urdu, Punjabi and
Gujarati but few had much in the way of formal educational qualifications. South
Asian immigrants tended to now come from a rural background and were
generally unfamiliar with the language and culture of Britain. They were more
often political or economic migrants - such as the Bangladeshis who immigrated
to the UK during the violent birth of their country in 1971 – rather than
professional or educational. Notable exceptions were in the considerable number
of Indian doctors who arrived to fill shortages in the National Health Service, and
South Asian people expelled from East Africa in the 1960s and 1970s of higher
socio-economic status, heralding from professional and mercantile backgrounds.
1.4.2 Geographical origins of migrants
The majority of South Asian migrants in the UK originate from only a few of the
many communities in the sub-continent. These communities are linked to pre-
war geographical patterns of settlement that persist today within the UK.
Demobbed soldiers came mostly from Punjab and Gujarat, and deserters from
the merchant navy from Mirpur and Sylhet. Up to 90% of Pakistanis in Bradford
and Birmingham come from the area of Mirpur. Indians who are Sikh in religion
tend to originate from mainly the Punjab region (Southall in West London is now
home to a large Punjabi Sikh community) whilst Hindus originate mostly from
the Gujarat, Punjab and West Bengal regions. British Bangladeshis largely
originate from the north-eastern Sylhet region of their country – they were often
employed as ship's cooks at the beginning of the century and many of them went
on to work in the 'Indian' restaurants, which they still dominate today. In 2001
Bangladeshis made up 33.4% of the population of Tower Hamlets in London
whilst 95% of those Bangladeshis came from the rural north-eastern district of
Sylhet. Many East African Asian people have settled in London in areas such as
Wembley and Harrow. Thus, these pockets of relative social homogeneity exist
within the heterogeneous category of the ‘South Asian’.

25
1.5 The pathology of the stages of coronary disease underlying its
differing clinical presentations
Atherosclerosis can be staged into a complex series of molecular and cellular
processes in the circulatory system leading ultimately to arterial thrombosis.
These stages correlate with differing clinical presentations relevant to this thesis.
Many presentations of coronary disease exist, but atheroma within the coronary
artery itself results in specific clinical presentations such as angina and
myocardial ischaemia.
1.5.1 Asymptomatic coronary atheroma
The first stage in atherogenesis is the formation of the fatty streak. Firstly, there
is infiltration and entrapment of low density lipoprotein (LDL) in the blood
vessel wall. Once entrapped in the vessel wall, LDL undergoes modification
which results in the secretion of a chemotactic substance that attracts
monocytes. These cells then migrate through the vessel wall, transform into
macrophages which then digest the LDL particles. The cytoplasm of the cell is
increasingly packed with lipid forming the fatty streak. Fatty streaks are smooth
raised plaques located beneath the endothelium and have been observed in the
coronary arteries of asymptomatic young adults.27 This stage of atheroma is ‘sub-
clinical’ as it is not associated with symptoms of angina, i.e., the symptom of chest
discomfort or pain associated with reduced myocardial arterial blood supply as a
result of increasing arterial luminal stenosis.
1.5.2 Exertional angina and the fibrous plaque
The fibrous plaque represents the next phase. With progression of the fatty
streak, smooth muscle cells (not normally present in the sub-endothelial space)
migrate from the media to the sub-endothelial space where they proliferate and
produce connective tissue to form a fibrous cap. Increasing diameter of the
plaque increasingly obstructs the blood flow through the lumen of the coronary
artery, progressively restricting blood supply to the myocardium, causing
clinically apparent exertional angina, or ‘chronic stable angina pectoris’, in the

26
patient.b Non-invasive tests such as exercise electrocardiography may reveal
electrical changes indicative of ischaemia.
1.5.3 The acute coronary syndrome and the ruptured plaque
The next stage is the development of a lesion which can calcify, haemorrhage,
ulcerate and thrombose. It is the progression of the stable atherosclerotic fibrous
plaque (that results in exertional angina) into this vulnerable and unstable lesion
(the rupture of which results in thrombosis) that leads to the clinical
presentation of unstable angina (recurrent episodes of angina on minimal effort
or at rest). If coronary blood supply is sufficiently reduced, infarction of the
myocardium can then result as a result of a total or a sub-total occlusion of the
coronary artery.
Figure 1 Stages of atherosclerosis and correlation with clinical presentations
(adapted from Abrams 200528)
b The term angina in this thesis will henceforth imply chronic stable angina pectoris rather than
unstable angina (described on next page)

27
1.5.4 Prediction of outcomes at differing clinical presentations of coronary
disease
To understand the relative contributions of incidence and prognosis that
underlie the epidemiology of coronary death, stages within coronary disease
need to be considered. Though incidence itself implies first event, this can be
non-fatal or fatal, correlating with different stages of coronary disease. The sub-
clinical coronary plaque can cause both the gradual encroachment of coronary
blood flow causing angina as an incident clinical event, and can also present
directly as thrombosis leading to unstable angina or myocardial infarction or
death. Incident angina can itself progress to myocardial infarction or death.
Hence, knowledge of non-fatal and fatal incidence is of importance to overall
coronary disease epidemiology. Most incident coronary disease is non-fatal
rather than fatal,29 30 and of these non-fatal presentations, the prognosis of
presentations such as angina and myocardial infarction are different. Factors
that affect prognosis will also be different in angina compared to myocardial
infarction.
1.5.5 Other presentations of ischaemic heart disease
Many presentations of ischaemic heart disease exist, and have been measured
both in epidemiological studies and by clinical means. The International
Classification of Diseases (ICD 10th Revision, Version for 2007, appendix 13.2)
lists angina pectoris (I20) and myocardial infarction (I21, I22) as three of the five
categories making up the ischaemic heart diseases category (I20-I25). Further
clinical presentations of ischaemic heart disease exist within the ICD
classification – such as coronary failure (within I24) and ischaemic
cardiomyopathy (within I25), end-results of the infarcted myocardium or
extensive atherosclerosis. Furthermore, the complications listed within I23 often
result in sudden cardiac death, another clinical presentation of ischaemic heart
disease. Other categories within I25 include those that do not present clinically
but are often found fortuitously, such as silent ischaemia and ECG changes such
as q waves (I25.2) and arrhythmic sudden cardiac death, which previous clinical
and epidemiological studies have used as measures to assess the incidence and
prevalence of ischaemic heart disease.

28
Coronary failure, cardiomyopathy and arrhythmias strictly refer to pathological
processes arising from the myocardium (as a result of coronary insufficiency)
rather than the coronary artery, whilst ECG changes may not be associated with
symptomatic disease. This thesis seeks to examine symptomatic clinical
syndromes that require the patient where possible to have presented themselves
to the healthcare service, and focuses on events within the lumen of the coronary
artery and are hence the primary clinical presentations of the pathological
process of coronary atherosclerosis. This thesis hence will focus on angina and
myocardial infarction in its study of incidence and prognosis, whilst appreciating
that coronary disease may also present as silent ischemia, coronary failure and
arrhythmias.
1.6 Angina
Angina is a common initial manifestation of coronary heart disease,29 a
significant burden in primary care31 and has considerable economic implications.
A UK study conservatively estimated that angina accounted for 1.3% of the
annual health expenditure.32
1.6.1 Definition of angina
Angina is diagnosed from a clinical constellation of symptoms from the patient
history. Descriptions of symptoms, articulated by patients to their doctors,
remain a cornerstone of diagnosis in clinical medicine. The clinical history is the
first step in assessing chest pain or discomfort in order to ascertain whether or
not it represents angina. The history also allows the doctor to identify patients in
whom additional investigation is necessary and in whom it may be spared,33 34
and whether additional therapy including coronary revascularisation through
percutaneous coronary intervention (PCI, using balloon angioplasty and
stenting) or coronary artery bypass surgery (CABG) is needed.
1.6.1.1 Diamond and Forrester definition
One of the most widely used definitions of chronic stable angina pectoris was
presented in 1979 by Diamond and Forrester who analysed 4952 patients with
chest discomfort. They showed that typicality of symptoms correlated with

29
angiographic coronary disease.34 The authors described three types of chest
pain: nonanginal, atypical, and typical.
The pain was assessed with these questions:
1) Is the pain retrosternal?
2) Is the pain precipitated by stress?
3) Is the pain relieved by rest or nitroglycerin?
Patients who answer yes to all three questions were determined to have typical
chest pain, those who answered yes to two of the questions to have atypical chest
pain and those who answered yes to only one question were deemed to have
nonanginal chest pain.
1.6.1.2 European Task Force definition
The Task Force on the Management of Stable Angina Pectoris of the European
Society of Cardiology defined angina as follows in its 2006 consensus
document:35
Stable angina is a clinical syndrome characterized by discomfort in the chest, jaw, shoulder, back, or
arms, typically elicited by exertion or emotional stress and relieved by rest or nitroglycerin.
It continued:
The characteristics of discomfort related to myocardial ischaemia (angina pectoris) have been
extensively described and may be divided into four types: location, character, duration and relation to
exertion, and other exacerbating or relieving factors. The discomfort caused by myocardial ischaemia
is usually located in the chest, near the sternum, but may be felt anywhere from the epigastrium to
the lower jaw or teeth, between the shoulder blades or in either arm to the wrist and fingers. The
discomfort is usually described as pressure, tightness, or heaviness, sometimes strangling,
constricting, or burning. The severity of the discomfort varies greatly and is not related to the severity
of the underlying coronary disease. Shortness of breath may accompany angina, and chest discomfort
may also be accompanied by less specific symptoms such as fatigue or faintness, nausea, burping,
restlessness, or a sense of impending doom.
The duration of the discomfort is brief, not more than 10 minutes in the majority of cases, and more
commonly even less. An important characteristic is the relation to exercise, specific activities, or

30
emotional stress. Symptoms classically deteriorate with increased levels of exertion, such as walking
up an incline or against a breeze, and rapidly disappear within a few minutes, when these causal
factors abate. Exacerbations of symptoms after a heavy meal or first thing in the morning are classical
features of angina. Buccal or sublingual nitrates rapidly relieve angina, and a similar rapid response
may be observed with chewing nifedipine capsules.
Finally, to classify, it presented the following classification:
Typical angina (definite) - Meets three of the following characteristics
• Substernal chest discomfort of characteristic quality and duration
• Provoked by exertion or emotional stress
• Relieved by rest and/or GTN (glyceryl trinitrate)
Atypical angina (probable) - Meets two of the above characteristics
Non-cardiac chest pain - Meets one or none of the above
This definition outlined what constitutes typical characteristics of angina
pectoris, and framed it into the categories of location, character, duration and
relation to exertion, and other exacerbating or relieving factors. What constitutes
typical characteristics of angina was not specified in the Diamond and Forrester
definition.
1.6.1.3 The Rose angina questionnaire
The Rose angina questionnaire (RQ) is a widely-used survey tool for the
measuring of angina in populations (see appendix 13.3).36 The questionnaire was
introduced in 1962 and defines angina as chest pain that limits exertion, is
situated over the sternum or in the left chest and left arm, and is relieved within
10 minutes by rest. It is highly specific when compared against a medical record
of doctor-diagnosed angina,37 and is strongly associated with subsequent risk of
coronary events in European populations.38 This definition outlines typical
characteristics of angina pectoris within the categories of location, duration and
relation to exertion.
31
1.6.2 Measuring angina
The early and appropriate identification of angina will result in early and
appropriate investigation and treatment.33 34
1.6.2.1 Typicality of angina
While laboratories standardise assays for biomarkers in the measurement of a
myocardial infarction, angina is a clinical constellation of symptom descriptors,
rendering quantitative measurement difficult. There are no large studies
comparing the diagnostic and prognostic value of chest pain descriptors between
ethnic groups, as symptoms have been predominately investigated in White male
populations. Furthermore, there is a perception that all South Asian
populations39-41 and other ethnic minorities42 43 with suspected ischaemia are
more likely to report atypical symptom descriptors of pain. This has been
attributed to cultural differences in the experience, interpretation and
understanding of pain,39 whilst biologically, there is evidence to suggest that
there are ethnic differences in the interpretation of cutaneous pain (to a series of
thermal stimuli in a study of 27 White participants and 24 African Americans
participants),44 implying that similar differences may occur in the interpretation
of visceral pain such as angina although this is far from proven.
Most studies have been performed in those presenting with the acute chest pain
of a suspected myocardial infarction.40 45 Teoh et al studied symptom
distribution between Asian and Caucasian patients at presentation with acute
coronary syndromes at a London hospital. They concluded that ‘Asian patients
were younger, more likely to be diabetic and tended to report a higher intensity
of pain and over a higher area of their body, and more frequent discomfort over
the rear of their upper thorax than Caucasian patients’. In a study examining first
myocardial infarctions in South Asian and White patients who had presented to
the coronary care unit of a district general hospital,46 chest pain was deemed
atypical in 26 (51%) of the Asian and 30 (39%) of the White patients.
Fewer studies have examined the typicality of chronic angina symptoms. The
reliability of the Rose angina questionnaire was reported in a 2001 cross-
sectional study to be inconsistent in South Asian populations when compared to

32
self-reported doctor-diagnosed angina and independently coded
electrocardiogram (ECG) abnormalities.39 The capacity of RQ ‘definite angina’ to
identify doctor-diagnosed angina was lower in South Asian populations
compared to European populations.
Beyond these cross-sectional studies, the prospective validity of angina
measures in comparing prognosis between ethnic groups is also unknown. Thus,
ethnic differences in angina prognosis may not be apparent if ethnic differences
in the description of symptoms are not taken into account.
1.6.2.2 Severity of angina
Ambulatory patients reporting a significant deterioration in their angina over the
preceding month have been found to have a higher one-year mortality rate than
those with more stable symptoms.47 Furthermore, a higher burden of symptoms
is associated with higher physical and role functioning.48 As angina has
potentially adverse prognoses both in terms of mortality and morbidity if not
adequately managed, accurate measurement of its severity is of clinical
importance.
The Canadian Cardiovascular Society (CCS) classification system has been used
as an epidemiological tool to measure the severity of angina.49 Worse severity of
angina on the CCS score is associated with a more adverse prognosis as
measured by rates of myocardial infarction and death.50 This measure is a scale
ranging from I, when angina is mild and does not limit physical activity, through
to IV, when angina severely restricts activities (box below).
Canadian Cardiovascular Society Functional Classification of Angina
Class Activity Evoking Angina Limits to Physical Activity
I Prolonged exertion None
II Walking > 2 blocks or > 1 flight of stairs Slight
III Walking < 2 blocks or < 1 flight of stairs Marked
IV Minimal or at rest Severe
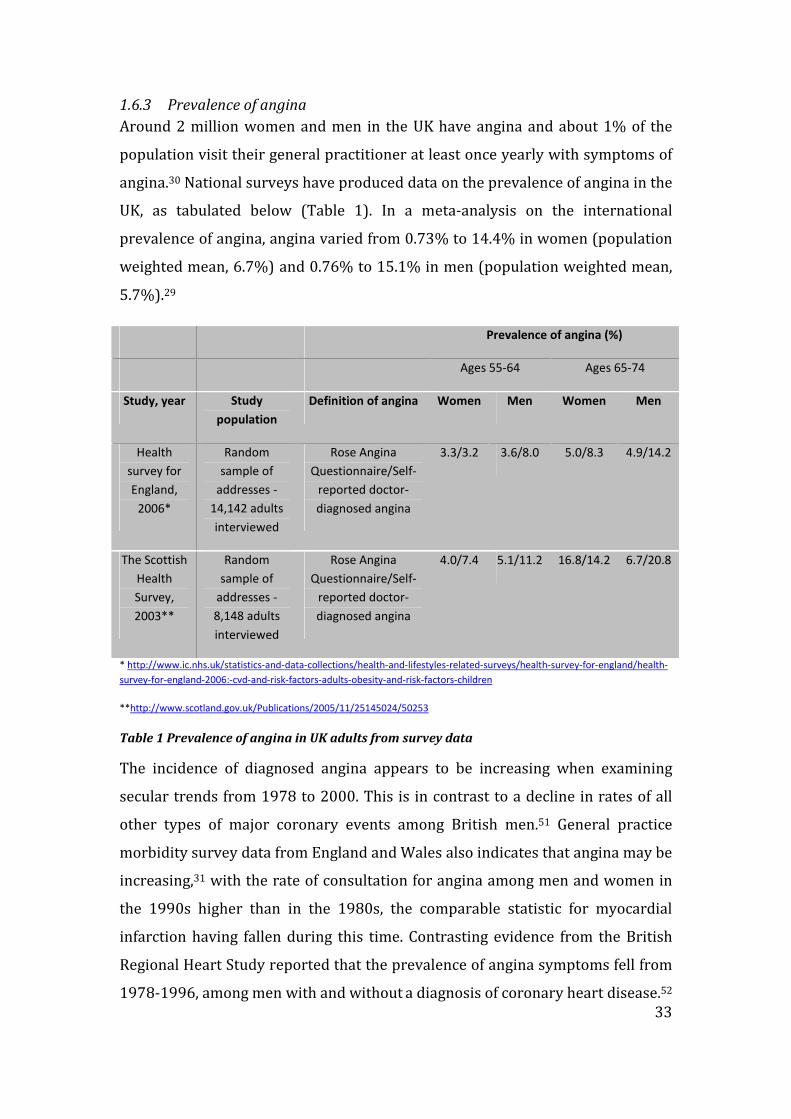
33
1.6.3 Prevalence of angina
Around 2 million women and men in the UK have angina and about 1% of the
population visit their general practitioner at least once yearly with symptoms of
angina.30 National surveys have produced data on the prevalence of angina in the
UK, as tabulated below (Table 1). In a meta-analysis on the international
prevalence of angina, angina varied from 0.73% to 14.4% in women (population
weighted mean, 6.7%) and 0.76% to 15.1% in men (population weighted mean,
5.7%).29
Prevalence of angina (%)
Ages 55-64 Ages 65-74
Study, year Study
population
Definition of angina Women Men Women Men
Health
survey for
England,
2006*
Random
sample of
addresses -
14,142 adults
interviewed
Rose Angina
Questionnaire/Self-
reported doctor-
diagnosed angina
3.3/3.2 3.6/8.0 5.0/8.3 4.9/14.2
The Scottish
Health
Survey,
2003**
Random
sample of
addresses -
8,148 adults
interviewed
Rose Angina
Questionnaire/Self-
reported doctor-
diagnosed angina
4.0/7.4 5.1/11.2 16.8/14.2 6.7/20.8
* http://www.ic.nhs.uk/statistics-and-data-collections/health-and-lifestyles-related-surveys/health-survey-for-england/health-
survey-for-england-2006:-cvd-and-risk-factors-adults-obesity-and-risk-factors-children
**http://www.scotland.gov.uk/Publications/2005/11/25145024/50253
Table 1 Prevalence of angina in UK adults from survey data
The incidence of diagnosed angina appears to be increasing when examining
secular trends from 1978 to 2000. This is in contrast to a decline in rates of all
other types of major coronary events among British men.51 General practice
morbidity survey data from England and Wales also indicates that angina may be
increasing,31 with the rate of consultation for angina among men and women in
the 1990s higher than in the 1980s, the comparable statistic for myocardial
infarction having fallen during this time. Contrasting evidence from the British
Regional Heart Study reported that the prevalence of angina symptoms fell from
1978-1996, among men with and without a diagnosis of coronary heart disease.52

34
This was a study in which angina was defined in a standardised way throughout
follow-up. However, this reported finding is limited by the authors’ technique of
determining overall population prevalence of angina through the use of a series
of cross sectional studies nested within what is a prospective cohort study.
Though analyses were age-adjusted, the presented ‘trend’ in prevalence of
angina should be interpreted cautiously. Their findings of a decline in age-
specific angina prevalence are more robust among the men aged between 55 and
64 years, who contributed to at least three of the cross sectional studies. Data
from successive Health Surveys for England can provide information on such
trends and overall show no evidence of any significant change in the prevalence
of self reported symptoms as assessed by the Rose Questionnaire between 1991
and 1994 and only a small, non-significant decline in men between 1994 and
1998.53 Thus, a valid measurement of chest pain is important for the true
assessment of prevalence.
1.6.3.1 Prevalence of angina by minority ethnic group
Clinical trials of angina have largely recruited male, White patients from
secondary and tertiary centres,54-57 rendering conclusions on the prevalence of
angina in ethnic groups difficult. Furthermore, the definitions and measures of
angina have been largely derived and validated in White male populations. The
prevalence of angina was reported to be higher in some South Asian peoples
compared to the majority White population (self-reported ‘ever diagnosed by the
participant’s doctor’) in the Health Survey for England in 2004 (Table 2).58
Caribbean Indian Pakistani Bangladeshi Chinese Irish General
population
Men
Observed % 3.4 4.9 6.9 3.1 1.6 4.0 4.8
Standardised
risk ratio
0.73 1.26 2.85 1.24 0.60 0.73 1
Women
Observed % 1.5 3.2 2.5 2.0 1.2 2.5 3.4
Standardised
risk ratio
0.61 1.79 2.19 2.22 1.00 0.87 1
Table 2 Prevalence of angina in minority ethnic groups, Health Survey for England in 2004
However, when angina was assessed in this survey by the Rose questionnaire,
the differences between minority ethnic groups and the general population were
35
smaller than those assessed by the self-reported diagnosis. Hence, the finding
that the Rose questionnaire seemed to produce different responses to the self-
reported diagnoses thus questions the validity of methods used to measure
angina in South Asian populations. If the accurate measurement of angina is of
importance in determining prevalence and prognosis, this assumes a higher
importance if ethnic differences are apparent as a result of usage of these
measures.
1.6.4 Treatment of angina
The management of angina comprises two main strategies:
• Anti-anginal medication - β-blockers, calcium-channel antagonists,
nitrates and potassium-channel activators like nicorandil
• Coronary revascularisation (following investigation by invasive coronary
angiography) – percutaneously by balloon angioplasty/stenting, or
surgically through bypass grafting.
Many patients with angina are not investigated through coronary angiography,
as symptoms may settle on medication alone. As the risk of death from coronary
angiography is around 1 in 1000,59 the purpose of coronary angiography is to
plan a management strategy beyond medication alone that will improve the
patient’s quality of life or prognosis. American College of Cardiology/American
Heart Association Guidelines for Coronary Angiography60 recommend invasive
investigation in patients with CCS class III and IV angina despite being on anti-
anginal medication.
In patients with angina, those of South Asian origin have been reported to be less
likely to undergo coronary revascularisation than those of White origin.61 This
may not be solely explained by access to specialist services, as general practices
with a higher proportion of South Asian patients have been reported as having
higher rates of coronary angiography.57 South Asian populations have also been
shown to have higher rates of angiography than White populations in studies of
healthy individuals.62 Furthermore, South Asian people were more likely to seek
immediate care for (hypothetical) anginal symptoms than White people41 in a

36
survey on attitudes to health seeking behaviour and have been reported to have
had more consultations with a general practitioner in the year before coronary
angiography than White people.61 It has been proposed that differences in the
description of symptoms might contribute to inequalities in medical care,40 63 as
the diagnostic validity of symptoms plays an important role in deciding
appropriate further clinical investigation and hence management.47 This may
explain ethnic differences in the loss of patients between getting a coronary
angiogram and ultimately receiving the treatment, coronary revascularisation,
after it.
1.6.5 Prognosis of angina
In patients with a diagnosis of angina, it has been reported that 17% will have
died from coronary heart disease or been admitted with a non-fatal myocardial
infarction or unstable angina within three years.29
Prognosis of angina can be investigated both in terms of:
• the future risk of serious manifestations of coronary disease such as
unstable angina, myocardial infarction and coronary death;
• as an outcome itself, as those who suffer angina and undergo treatment to
allay their symptoms may have their symptoms return (symptomatic
prognosis).
1.6.5.1 Risk of future myocardial infarction and coronary death
In those patients with exertional angina, prognosis for myocardial infarction and
death is not improved by coronary revascularisation:
• A meta-analysis of randomised controlled trials in 2000 comparing PTCA
(percutaneous trans-luminal coronary angioplasty, balloon angioplasty
alone without stenting) with medical treatment alone in chronic coronary
heart disease concluded that PTCA led to a reduction in angina (relative
risk (RR) 0.70 (95% confidence interval (CI) 0.50-0.98)) but conferred no
beneficial effects on risk of myocardial infarction or death.64

37
• In the Second Randomized Intervention Treatment of Angina (RITA-2),65
death or myocardial infarction occurred in 73 (14.5%) PTCA patients and
63 (12.3%) medical patients (p=0.21).
• A 1994 meta-analysis compared CABG with medical treatment and found
that surgery conferred a survival advantage only in those patients with
severe left main stem coronary disease, three-vessel disease, or two-
vessel disease with a severely stenosed proximal left anterior descending
artery.66 However, only 10% of trial patients received an internal
mammary artery graft in addition to their vein grafts, routine practice in
current surgery now. Only 25% received anti-platelet drugs whilst use of
statins was similarly low compared to current standards.
Secondary prevention medical therapy (aspirin, statins) on the other hand plays
a role in the stabilisation of the atherosclerotic process, as shown in studies such
as the REVERSAL study, where intensive lipid-lowering treatment with statins
reduced the progression of coronary atherosclerosis as measured by
intravascular ultrasound.67 The effect of cholesterol lowering with statins on
mortality and morbidity in patients with coronary heart disease is well-known,
first muted on a large scale by the 4S study,68 and subsequently shown on meta-
analysis of 4S and four subsequent trials.54
1.6.5.2 Risk of future recurrent angina
The importance of revascularisation in improving symptomatic outcomes has
been shown in both meta-analyses64 and large clinical trials.47 However, studies
have documented that many patients undergoing revascularisation still have
angina after 1 year69 70 and ethnic disparities in clinical outcomes have been
reported in African-American patients who reported higher rates of angina than
White patients at six months following coronary angiography.71 A study on
outcomes following coronary bypass surgery revealed that medical management,
length of stay and hospital morbidity in Indo-Asian patients was no different
from that of their White Caucasian counterparts, though numbers were small
(n=194 in both arms) and follow-up short, limited to in-patient stay post-
operatively.72 If South Asian patients do have higher long-term symptomatic

38
outcomes however, this would increase the size of the prevalent pool of angina in
South Asian populations. This is of importance to public health as angina places a
significant burden on both morbidity and health service usage, with angina
patients constituting up to two thirds of the patients that undergo PCI in Western
countries.64 73
1.7 Myocardial infarction
The arrival of sensitive and specific serologic biomarkers has led to a change in
the definitions of myocardial infarction. The World Health Organisation had
defined myocardial infarction as a combination of two of three characteristics:
typical symptoms (i.e., chest pain/discomfort), enzyme rise and a typical
electrocardiogram pattern involving the development of Q waves.74 The arrival
of biomarkers has led to the introduction of the term ‘acute coronary syndrome’
which now includes all those with ST-segment elevation myocardial infarction
(STEMI), non-ST-segment elevation myocardial infarction (NSTEMI) and
unstable angina.c
1.7.1 Definition of myocardial infarction
The ability to detect very small infarcts that would not previously have been
considered a myocardial infarction has resulted in many individuals, who were
formerly diagnosed as having unstable angina, being diagnosed today as having
had a myocardial infarction. This has resulted in a change of definition of
myocardial infarction as presented in the consensus document of the Joint
European Society of Cardiology/American College of Cardiology committee in
2000.75 Creatine phosphokinase-MB isoenzyme (CK-MB), a previously widely-
used biomarker for myocardial infarction, has now been shown to be unsuitable
as a diagnostic gold standard for the diagnosis of myocardial infarction76 and the
use of cardiac troponins are now widespread. Troponins are integrally involved
in the process of myofibril contraction and relaxation within the cardiac myocyte
and troponin T and troponin I are highly sensitive and specific markers of
myocardial injury.
c The term acute coronary syndrome in this thesis will henceforth imply the inclusion of
myocardial infarction within it

39
The new definition of a myocardial infarction now requires a raised troponin
level, after which electrocardiogram changes indicative of ischaemia allow
further classification into clinically-relevant types which determine appropriate
clinical management. These types include STEMI with ST segment elevation on
ECG representing total occlusion of a coronary artery and NSTEMI with ST
segment depression representing sub-total occlusion of a coronary artery. The
term ‘unstable angina’ still represents the initial presenting clinical syndrome of
recurrent episodes of angina on minimal effort or at rest, and a raised troponin
consequently redefines it as a NSTEMI.
A troponin value of 0.05 µg/l has been proposed as the most appropriate to
define an acute coronary syndrome,76 though what constitutes a myocardial
infarction remains unclear, the most recent consensus document (Joint Task
Force for the Redefinition of Myocardial Infarction) simply stating that ‘an
increased value for cardiac troponin is defined as a measurement exceeding the
99th percentile of a normal reference population’.77 Many hospitals define a
NSTEMI as a troponin above a certain level, such as 0.05 µg/l or above, and thus
use the term ‘troponin-positive acute coronary syndrome’ for those with a raised
troponin, but which is less than 0.05 µg/l. There is no consensus however for
this, and the troponin cut-point is often used simply to allocate those who would
have cardiac rehabilitation. In practice, the treatment of NSTEMI and ‘troponin-
positive acute coronary syndrome’ are broadly similar.
1.7.2 Prevalence of myocardial infarction
National surveysd report a prevalence of myocardial infarction in the UK of
around 14% in men and 3-7% in women aged 65-74. The prevalence of
myocardial infarction in men aged 55-64 is between 6-9%, whilst for women the
figures are 2-4%. However, the situation is complicated by the heterogeneous
dHealth Survey for England 2006 http://www.ic.nhs.uk/statistics-and-data-collections/health-and-lifestyles-
related-surveys/health-survey-for-england/health-survey-for-england-2006:-cvd-and-risk-factors-adults-obesity-and-
risk-factors-children
The Scottish Health Survey 2003 http://www.scotland.gov.uk/Publications/2005/11/25145024/50253

40
nature of myocardial infarction as described above. Furthermore, from a
predominance of STEMI in the past, STEMIs are declining in prevalence,78 with
the overall proportion of NSTEMI increasing.79
The multinational Global Registry of Acute Coronary Events (GRACE) project
reported data from its first 11543 patients in 2002.80 Of these patients included,
38% had a final diagnosis of unstable angina, 30% had STEMI, and 25% had
NSTEMI. The ENACT study in 1999 on patients hospitalised with acute coronary
syndromes in 390 hospitals in 29 European countries reported that unstable
angina was the most frequent cause of hospitalisation (46%), followed by acute
myocardial infarction (39%).81 In a prospective survey of the characteristics,
treatments and outcomes of patients with acute coronary syndromes in Europe,
the Euro Heart Survey of Acute Coronary Syndromes reported an initial
diagnosis of STEMI in 42.3%, NSTEMI in 51.2%, and ‘undetermined
electrocardiogram acute coronary syndrome’ in 6.5%.82
1.7.2.1 Prevalence of myocardial infarction by minority ethnic group
With regard to ethnicity, the age-standardised risk ratios of myocardial
infarction for South Asian men and women did not differ significantly from men
and women in the general population in the Health Survey for England in 2004 in
all aged above 16 years.58 There is a trend towards a younger age of presentation
in South Asian patients.8 83
1.7.3 Treatment of myocardial infarction
Treatment of patients with an acute coronary syndrome who present with ST-
segment elevation on the ECG (STEMIs) is principally aimed at restoration of
myocardial perfusion (reperfusion) using fibrinolysis (thrombolytic drugs) or
increasingly primary percutaneous coronary intervention (PCI,
angioplasty/stenting). However, NSTEMIs and unstable angina are more
heterogeneous in their presentation and are associated with a higher variation in
diagnosis and treatment.84 Variations in receipt of medical treatment such as
statins as well as access to angiography and subsequent receipt of coronary
revascularisation are widely present in such patients.85 The wide range of clinical
41
manifestations and hence treatments will result in variable prognoses. Reasons
behind these variations may include:
- the use of different definitions for ‘unstable angina’ and ‘NSTEMI’84
- differences in the characteristics of presenting patients
- geographical practice variation,81 which is influenced by the incidence of
coronary heart disease in the local population, the type of resources
available, and doctors’ perceptions of existing therapies.
It is conceivable that ethnic differences will exist in treatment and hence
prognosis and explaining reasons behind such differences will entail
consideration of not only biological differences but also socio-demographic and
clinical management variables.
1.7.4 Prognosis of acute coronary syndromes
The hospital death rate for patients with STEMI in the GRACE study was 7%,85
whilst those patients with NSTEMI and unstable angina had a rate of death at
seven days of 6% and 3% respectively. Longer-term follow-up has shown that
within five years of first admission with an acute myocardial infarction, around
40% of patients will have died, principally of a repeat myocardial infarction or
other coronary cause.86
However, it has been reported that 70% of those with ‘unstable angina’ can have
detectable elevated troponin levels.76 These patient would have had CK-MB’s
reported as within the normal range. The importance of this is more than just to
categorise. These patients with elevated troponin levels are subject to a
significant risk of adverse cardiac events. 50% of these patients will experience
recurrent ischaemia and 10% will die or re-infarct within 30 days despite
optimum medical management. This has prompted investigation into better
pharmacological therapy and the role of invasive procedures.87 Patients with the
highest risk of adverse complications are most likely to derive the greatest
benefit from invasive therapy and the release of troponin identifies high-risk
patients where early coronary intervention significantly reduces adverse
coronary outcomes, as those without a troponin release have similar outcomes

42
with either a pharmacological therapy approach or an invasive revascularisation
approach.88
Using troponin testing as a means of improved discrimination of those at risk,
inequalities in the clinical management of acute coronary syndromes may be
reduced. Prior to the widespread introduction of troponin testing, a considerable
difficulty in clinical practice was in identifying those at risk within the wide
spectrum of patients that presented with acute chest pain.
1.8 Factors determining prognosis of angina and myocardial
infarction
Aetiological factors that predict incidence, both biological and social, may also
influence prognosis. Prognosis will also be affected by strategies of clinical
management and level of disease severity at time of presentation of coronary
disease. Furthermore, prognostic outcomes should include not only the risk of
future death and other serious clinical presentations but also those that measure
morbidity, i.e., in patients with angina, the study of symptomatic outcomes
(improvement of angina).
1.8.1 Risk factors
In White populations, aetiologic risk factors for myocardial infarction such as
hypertension, diabetes and smoking are in addition prognostic factors.89 90 In
patients diagnosed with coronary heart disease who smoked, a systematic
review of cohort studies showed a 36% reduction in crude relative risk of
mortality for patients who quit compared with those who continued smoking.91
However, such patterns may not be as simple in South Asian populations. In a
prospective cohort study conducted of 828 South Asian and 27,962 non South
Asian patients in the UK with insulin-treated diabetes diagnosed at ages under
50 years, standardised mortality ratios for South Asian patients (mainly of Indian
or Pakistani descent) diagnosed with diabetes under age 30 years were 3.9 (95%
CI 2.0-6.9) in men and 10.1 (5.6-16.6) in women, and in the corresponding non
South Asian patients were 2.7 (2.6-2.9) and 4.0 (3.6-4.3), respectively.92 That
diabetes mellitus may have a worse prognosis in South Asian patients for future
adverse coronary outcomes and diabetes-related complications has been

43
proposed by others,93 and the finding that South Asian patients have poorer
knowledge and understanding of diabetes94 may play a role in this.
The prevalence of risk factors also differs by ethnic groups, and prevalence is not
necessarily higher in South Asian populations, with lower levels of total
cholesterol and smoking prevalence than the White majority population.95
Furthermore, South Asian patients, from Bangladeshis in London to Indians in
the USA, present with coronary disease at younger ages than White patients,96 97
age being the most important non-modifiable risk factor in the aetiology and
prognosis of coronary disease from large population studies such as
Framingham98 and the World Health Organisation MONICA Project
(multinational monitoring of trends and determinants in cardiovascular
disease).99
1.8.2 Disease severity
Within the coronary disease phenotypes of angina and myocardial infarction, the
severity of disease at presentation will affect prognosis. Severity of disease can
be classed as anatomical, functional and symptomatic.
1.8.2.1 Anatomical severity
The degree of coronary disease at coronary angiography predicts future risk of
adverse outcomes in those presenting with myocardial infarction.100 Previously
reported ethnic differences in degree of coronary disease between South Asian
and White populations may therefore be a factor in prognosis, as South Asian
patients have been reported to have more severe coronary disease at
angiography than White patients when presenting with coronary disease.101
The breakdown of acute coronary syndrome by degree of coronary occlusion
(e.g. STEMI/NSTEMI) and whether an effect modification of this on the
relationship between ethnicity and prognosis exists is not known. Furthermore,
it is not known whether South Asian patients present with differing severity of
myocardial infarction (levels of troponin, left ventricular function) to White
patients and whether this in turns affects prognosis.

44
1.8.2.2 Functional severity
The degree of myocardial ischaemia associated with coronary artery disease can
be measured by exercise ECG testing, which remains the most widely accessible
and relatively inexpensive method. Prediction of future coronary events and
mortality is also an important use of the exercise ECG.102
1.8.2.3 Symptomatic severity
That the South Asian population is more likely to report atypical features of pain
require prognostic analyses to take this into account. Typical pain is suggestive
of more severe coronary disease than atypical pain.103 Comparing the prognostic
validity of typical against atypical chest pain descriptors for severe adverse
outcomes such as myocardial infarction and coronary death is therefore of
importance. Furthermore, severity of angina predicts higher physical and role
functioning and hence prognosis in terms of symptomatic outcomes
(improvement in angina) needs studying.
1.8.3 Social environment
The comparative prognosis of acute coronary syndromes in South Asian and
White patients may be affected by a range of factors that are not only biological
but social. Previous research has shown the association between individual-level
socioeconomic characteristics and coronary heart disease, a higher
socioeconomic status associated with a lower coronary mortality,104 and that the
social deprivation of areas influences the aetiology and prognosis of coronary
disease.105
1.8.3.1 Deprivation
South Asian populations are more likely to live in areas with relative social and
economic deprivation.106 Studies that report that South Asian patients receive
worse clinical management suggest this may be associated with the deprived
areas they live in.29
1.8.3.2 Access to care
The relationship between social environment and minority ethnic group health
need not necessarily be a negative one. Distance from hospital is a prognostic
factor – in a study examining ambulance journeys to hospital of patient with
potentially life-threatening conditions, increased distance from hospital was
45
associated with increased risk of death (odds ratio 1.02 per kilometre; 95% CI
1.01 to 1.03; p<0.001). This association was not changed by adjustment for
confounding by age, sex, clinical category or illness severity.107 This is of
relevance to prognostic analyses in acute coronary syndromes considering
minority ethnic groups in the UK tend to live close to acute hospitals.108 It has
long been recognised that access to coronary revascularisation services may,
paradoxically, be increased in deprived areas in the UK, probably as a result of
their proximity to specialist cardiac centres such as teaching hospitals.109
1.8.4 Clinical management
1.8.4.1 Secondary prevention drugs
Cross-sectional studies have reported in ecological-type analyses that general
practitioner prescribing rates of statin prescription were lower in primary care
trusts with a higher percentage of South Asian people.110 However, more recent
studies using data from the 2001 Census and Quality and Outcomes Framework
data suggest that such medical therapy, which plays an important role in
improving prognosis,68 111 is on the contrary more highly prescribed in South
Asian and more deprived communities.112 Hence, taking into account such
differences in clinical management is of importance in prognostic analyses.
1.8.4.2 Specialist investigation and treatment
Some studies report an underuse of coronary revascularisation amongst South
Asian patients deemed appropriate to receive it.61 In acute coronary syndromes,
an elevated troponin level subjects that patient to a significant risk of adverse
cardiac events such as death, and hence access to early coronary
revascularisation that reduces the risk of premature death is of higher
importance. Thus, any underuse in a particular ethnic group will potentially
worsen their prognosis.
In those patients with exertional angina, access to clinical management strategies
which provide symptomatic relief for the patient will be of higher importance.

46
1.9 Relationship between healthy individuals and those with
coronary disease, and factors affecting incidence and prognosis
Understanding the relationship between healthy individuals and those with
coronary disease, and of how factors affecting incidence also affect prognosis
requires the disaggregation of the coronary disease entity. The figure below
(Figure 2) highlights the complexity of these relationships, and serves as a model
for the prospective analyses of my thesis. It outlines the relationships within the
umbrella of coronary disease of the primary clinical presentations of the
pathological process of coronary atherosclerosis, angina and myocardial
infarction. It demonstrates the possible pathways a healthy individual may
present themselves to healthcare services with coronary disease, and the
relationships of these coronary phenotypes with ensuing death.
This thesis seeks to compare if these relationships vary between South Asian and
White populations, to investigate ethnic differences in incidence and prognosis of
angina and myocardial infarction, and factors determining prognosis of these
differing clinical presentations of coronary disease.

47
Figure 2 Relationship between healthy individuals and those with coronary disease, and factors affecting incidence and prognosis

48
2 Aims and objectives
2.1 Aim
This thesis seeks to investigate the contribution of incidence and prognosis of
differing clinical presentations of coronary disease such as angina and
myocardial infarction to the higher coronary mortality rates observed in South
Asian compared to White populations in the UK.
2.2 Specific research objectives
1. To determine the incidence and prognosis of angina in healthy South Asian
and White populations.
2. To determine in those presenting with incident chest pain whether
differences exist in the description of symptoms between South Asian and
White populations, and the association of symptom descriptors with
prognosis and receipt of management strategies for chronic coronary
disease.
3. To determine impact on symptomatic prognostic outcomes (change in
angina severity) in South Asian and White populations from different
management strategies for chronic angina.
4. To compare fatal prognostic outcomes of acute coronary syndromes in
South Asian and White populations and assess factors underlying
prognosis.
5. To assess the contribution of incidence and prognosis to the higher
coronary death rates in South Asian compared to White populations
through meta-analysis of the four cohorts and previously reported studies.

49
3 Systematic literature review
3.1 Summary of chapter
Background The higher coronary mortality in South Asian compared to White
populations may be either due to a higher incidence of coronary disease in South
Asian populations or a worse prognosis in them. A review in 2000 reported no
evidence for a higher incidence of coronary disease in South Asian populations
and the overall prognosis of coronary disease in South Asian compared to White
populations was not known.
Methods A systematic review was conducted on MEDLINE and Embase from
January 1966 to November 2008 to identify eligible prospective studies that
compared incidence and prognosis of coronary artery disease in South Asian and
White populations. Backward citation tracking through hand-searching of
reference lists of eligible studies and forward citation tracking of subsequent
articles that cited eligible studies were conducted.
Results Of six studies on incidence, five reported that South Asian populations
have a higher incidence of coronary disease. There were few data on non-fatal
incidence. When considering the seven studies on prognosis, event numbers
were low in South Asian participants (221 recorded in total, they were
heterogeneous in their methods and adjustment for confounders was lacking.
Studies focussed more on fatal rather than non-fatal outcomes, and on
presentation with myocardial infarction rather than angina.
Conclusions The literature on incidence of coronary disease in South Asian
populations suggests a higher incidence of fatal coronary disease in them
compared to White populations, but the literature on non-fatal incidence is
sparse. When considering prognosis, the literature is unable to definitively
answer whether prognosis is worse in South Asian compared to White
populations.

50
3.2 Introduction
A higher coronary mortality in South Asian compared to White populations has
been reported from census data in the UK. Whether this is a consequence of
higher incidence of coronary disease or a worse prognosis of already-manifested
coronary disease in South Asian compared to White populations is not known.
Furthermore, incidence itself can be non-fatal or fatal and the prognoses of
differing clinical presentations such as angina and myocardial infarction are
different. Prognostic outcomes should also examine not only the risk of future
death but also non-fatal outcomes for the overall assessment of prognosis.
A systematic review published in 2000 examining the evidence of coronary
disease in South Asian compared to White populations reported that of the 19
studies retrieved, none reported incidence, and highlighted the higher number of
cross-sectional studies measuring prevalence of coronary disease phenotypes
such as self-reported angina.113 No prospective studies were reported. There was
also wide heterogeneity in case definitions of ethnic grouping, and in the
measurement of differing clinical presentations of coronary disease such as
angina and myocardial infarction. The overall picture of incidence and prognosis
of coronary disease in South Asian compared to White populations is thus not
known.
3.3 Research objective to be investigated
This chapter sought to systematically identify and critically evaluate published
literature relating to all five specific research objectives of this thesis.
3.4 Specific research questions
i. What is the current knowledge from peer-reviewed published literature
on the incidence of coronary disease (fatal and non-fatal) in healthy
South Asian and White populations?
ii. What is the current knowledge from peer-reviewed published literature
on the comparative prognosis of the coronary disease presentations of

51
angina and myocardial infarction in South Asian and White
populations?
3.5 Methods
3.5.1 Search strategy
MEDLINE 1966-2008 was searched without any language restriction and using
the following Medical Subject Heading terms:
(India or Pakistan or Bangladesh or Sri Lanka or Ethnic Groups or ethnology or
Asian Continental Ancestry Group or Asia) AND (coronary or myocardial
infarction or myocardial ischaemia or cardiovascular disease)
Studies were identified for incidence or prognosis by adding these as text word
search terms. To focus further on longitudinal studies and incidence, the search
was expanded using a combination of all the Medline Clinical Queries filters for
incidence,114 and including ‘follow-up studies’ and ‘treatment/disease-outcome’
as terms as well. The search was repeated in Embase. Hand-searching of the
reference list of eligible studies was conducted to identify further relevant work
(backward citation tracking). Science Citation Index was used to identify all the
subsequent papers that cited any of the eligible studies (forward citation
tracking) using ISI Web of Science.
This search was undertaken prior to commencement of this PhD and updated in
November 2008.
3.5.2 Inclusion criteria
The titles and abstracts and, where not clear, full manuscripts of all identified
studies were examined and eligibility for inclusion was defined if:
• The study compared South Asian and White ethnic groups.
• For incidence:
o The study was prospective in populations without clinically
manifested coronary disease, or presented data on relative risk of
coronary mortality from cross-sectional analysis.

52
o Outcomes were defined as death and incident non-fatal myocardial
infarction or angina.
• For prognosis:
o The study was prospective in a population with the coronary
disease phenotypes of angina (stable or unstable) or myocardial
infarction/acute coronary syndrome.
o Outcomes were defined as mortality from coronary disease or non-
fatal angina/myocardial infarction.
3.5.3 Data extracted
The full manuscripts of the papers remaining were obtained and the following
data extracted from each paper
• setting of study
• number of participants by ethnic group
• the terminology used for the ethnic groups (retained in describing eligible
studies in this chapter)
• age (mean or median)
• numbers of women/men and diabetics
• outcome and duration of follow-up
• risk factors that were adjusted for in prospective analyses.
3.5.4 Incidence of coronary disease
The MEDLINE search strategy for incidence is outlined in appendix 13.4. 137
relevant publications were found.
3.5.4.1 Papers excluded after reviewing titles and abstracts
Of the 137 results obtained, after scanning the titles and abstracts, 46 were
excluded on the basis that the study focussed on an ethnic group other than

53
South Asian (such as Black, Far Eastern), or used a comparison group other than
White.115 e
Four studies within these 46 presented mortality data by splitting the South
Asian population into their constituent peoples. As this thesis aims to study the
South Asian population as a whole group, these studies were not comparable to
the planned analyses for this thesis.11 13 116 12 As outlined earlier, many
similarities exist between South Asian peoples, and differences between South
Asian peoples are less likely to affect prognosis than incidence.
However, these studies are of broader relevance and are outlined in the table
below. The study by Harding et al11 examined trends for coronary heart disease
mortality among migrants in England and Wales from 1979–2003. Most South
Asian populations remained at higher risk of death in all three time periods.
Wild’s study of 2001 census data12 utilised the ability of this latest census to code
the South Asian population by their constituent peoples. Mortality rates
remained higher in all South Asian peoples. The group were unable to provide a
standardised mortality ratio for the South Asian population as a whole (personal
communication, Sarah Wild). Hippisley-Cox et al116 examined incidence of
cardiovascular disease and found a higher incidence of combined non-fatal
events in all South Asian peoples. Fischbacher et al’s13 comparisons within the
Scottish population did not report excess coronary mortality in all South Asian
peoples. However, the authors commented that when using England and Wales
as a comparison group, the excess of coronary mortality risk among the South
Asian population in Scotland was comparable to that reported in England and
Wales.
e An example of the latter showed that Asian Indian male migrants were more prone to suffer
from a myocardial infarction or coronary death than the majority populations of Chinese and
Malays in Singapore.

54
Study
(year of
publication)
Methods Outcomes Results
Harding
(2008)
From Office for
National Statistics
anonymised death
records 1979-83, 1989-
93 and 1999-2003.
Cross-sectional age-
standardised and sex-
specific death rates and
rate ratios
In all three time periods, compared with men
born in England and Wales, men born in East
Africa, India, Pakistan, Bangladesh, Scotland,
Northern Ireland, Republic of Ireland or Poland
had higher mortality.
Among women, consistently higher mortality
was seen for those born in India, Scotland,
Northern Ireland or Republic of Ireland in all
time periods compared to women born in
England and Wales. Rate ratios in Pakistan-
born women in 1999–2003 were more than
twice that of England and Wales born women.
Hippisley-
Cox
(2008)
Prospective open
cohort study with
routinely collected data
from general practice
and linked Office for
National Statistics
death certificates, 1
January 1993 to 31
March 2008
Incident diagnosis of
cardiovascular disease
(coronary heart disease,
stroke, and transient
ischaemic attack)
Adjusted risk is 45% higher (29% to 63%)
among Indian men, 67% higher (40% to 101%)
among Bangladeshi men, and 97% higher (70%
to 129%) among Pakistani men
Fischbacher
(2007)
Census data for Scottish
residents aged 25 years
and over between
January 1997 and
March 2003.
Standardised mortality
ratios by country of birth
High all-cause, coronary heart disease (CHD)
and stroke mortality among Scottish residents
born in Scotland, Northern Ireland, the
Republic of Ireland, India and Hong Kong.
Wild
(2007)
Population data from
the 2001 Census and
mortality data for 2001-
2003.
All-cause and circulatory
disease sex-specific
standardised mortality
ratios (SMRs) and 95%
confidence intervals (CI)
people aged 20 years
and over in England and
Wales by country of
birth
SMRs for circulatory disease were as follows:
people born in Bangladesh 167 (136–204);
India 149 (142–157); Pakistan 174 (159–192).
Table 3 Studies examining mortality and incidence of coronary disease within South Asian
peoples compared to White majority populations
Two studies within these 46 were North American studies which used
proportional mortality ratios and did not present direct comparisons between
South Asian and White populations and hence were not included.14 15
77 were excluded as the study was not on coronary disease and 11 on the basis
that the study examined cross-sectional associations of cardiovascular risk
factors rather than coronary disease. The systematic review on the subject by
Bhopal was in itself not an original study.113
55
Expanding the search traced a further six studies to add to the two from the
initial search leaving eight in total for which manuscripts of the papers were
obtained for full inspection.
3.5.4.2 Papers excluded after review of full text
The following were excluded:
A study which had originally recruited participants with hypertension from a
time period between 1979 to 1993 used a combined outcome that made
comparison with other studies’ outcomes impossible.117 Khattar et al published a
longitudinal comparison of morbidity and mortality among White, South Asian
and Afro-Caribbean participants with hypertension, originally recruited between
1979 to 1993 at a North-West London district general hospital, and followed-up
at five years for the risk of non-cardiovascular death, coronary events,
cerebrovascular events, and peripheral vascular death. Coronary events
consisted of a combined coronary death (myocardial infarction or ischaemia,
ventricular fibrillation, and cardiac failure), nonfatal myocardial infarction,
coronary artery bypass graft surgery, and percutaneous transluminal coronary
angioplasty. South Asian participants had the highest all-cause event rate of the
ethnic groups, the high event rate because of an excess of coronary events (2.86
in South Asian participants compared to 1.32 events/100 participant-years in
White participants, p < 0.01). Cox proportional hazards regression analysis
(adjusting for age, sex, diabetes, previous cardiovascular disease and 24 hour
systolic blood pressure) revealed that South Asian origin was an independent
predictor of time to a first event (South Asian v White participants: p = 0.008).
Patel et al’s study followed up participants with hypertension118 to compare
rates of myocardial infarction amongst South Asian participants compared to
White European Caucasian participants. On comparison of baseline risk factors,
Caucasian participants with hypertension were older, more likely to smoke, more
obese and more hyperlipidaemic than South Asian participants, who had more
diabetes. The use of antihypertensive therapies was more common amongst the
Caucasian participants compared to South Asian participants. During the 5-year
follow-up period the rate of myocardial infarction was double in South Asian

56
participants to that observed in European Caucasian participants. This increased
incidence of myocardial infarction was fully accounted for by diabetes, and the
group could not provide a multivariate-adjusted incidence rate ratio (personal
communication, Jeetesh Patel).
This left six eligible studies comparing the incidence of coronary disease in South
Asian alongside White populations, of which two were cross-sectional studies on
mortality.

57
3.5.4.3 Flow diagram of search
From titles and abstracts
From reading papers
Figure 3 Literature search flow diagram for the comparison of incidence of coronary disease
between South Asian and White populations
3.5.5 Prognosis of coronary disease
The MEDLINE search strategy is outlined in appendix 13.5. Using the clip-board
facility on Search 2.0 to collate the articles found from searches numbered 28,
29, 30, 37, 43, there were 426 relevant publications.
3.5.5.1 Papers excluded after reviewing titles and abstracts
Of the 426 results obtained, after scanning the titles and abstracts, 100 were
excluded on the basis that the study focussed on an ethnic group other than
South Asian (such as Black, Far Eastern), or used a comparison group other than
Potentially relevant publications on incidence from MEDLINE search history (n=137)
Excluded as study covers an ethnic group other than South Asian (n=46)
Studies on South Asian and White populations (n=91)
Excluded as study not on coronary disease (n=77)
Studies on coronary disease in South Asian and White populations (n=14)
Excluded as examining cross-sectional associations of risk factors or review (n=12)
Excluded (n=2)
Potentially relevant publications on incidence from Medline Clinical
Queries,‘follow-up studies’ and ‘treatment/disease-outcome’ and Embase (n=6)
6 satisfied inclusion criterion of comparison of incidence of coronary disease between
South Asian and White populations

58
White.119 f 246 were excluded as the study was not on coronary disease and 72
on the basis that the study examined cross-sectional associations of
cardiovascular risk factors rather than coronary disease or was a review
(Bhopal).113 This left eight studies.
Expanding the search traced a further study (appendix 13.6) to add to the eight
from the initial search leaving nine in total for which manuscripts of the papers
were obtained for full inspection.
3.5.5.2 Papers excluded after review of full text
The following were excluded:
Lane et al compared cardiovascular and all-cause mortality among White
European, African-Caribbean and South Asian populations through an
observational follow-up study in Birmingham. However, the dataset had serious
limitations, given that significantly fewer South Asian men could be traced by the
Office for National Statistics, and there were no data on follow-up for the South
Asian women in the study at all.120
Shaukat et al had in 1997 presented results in the BMJ that patients of Indian
subcontinent origin were at substantially higher risk of mortality and of further
coronary events than patients of European origin after first myocardial
infarction. However, this work was subsequently retracted due to research
fraud.121
This left seven eligible studies comparing the prognosis of coronary disease in
South Asian and White populations.
f An example of the latter is of Mak et al, who reported on myocardial infarction mortality event
rates and mortality among Chinese, Malay and Indian residents of Singapore. In comparison with
the Chinese population, the Malay population had the highest case-fatality.
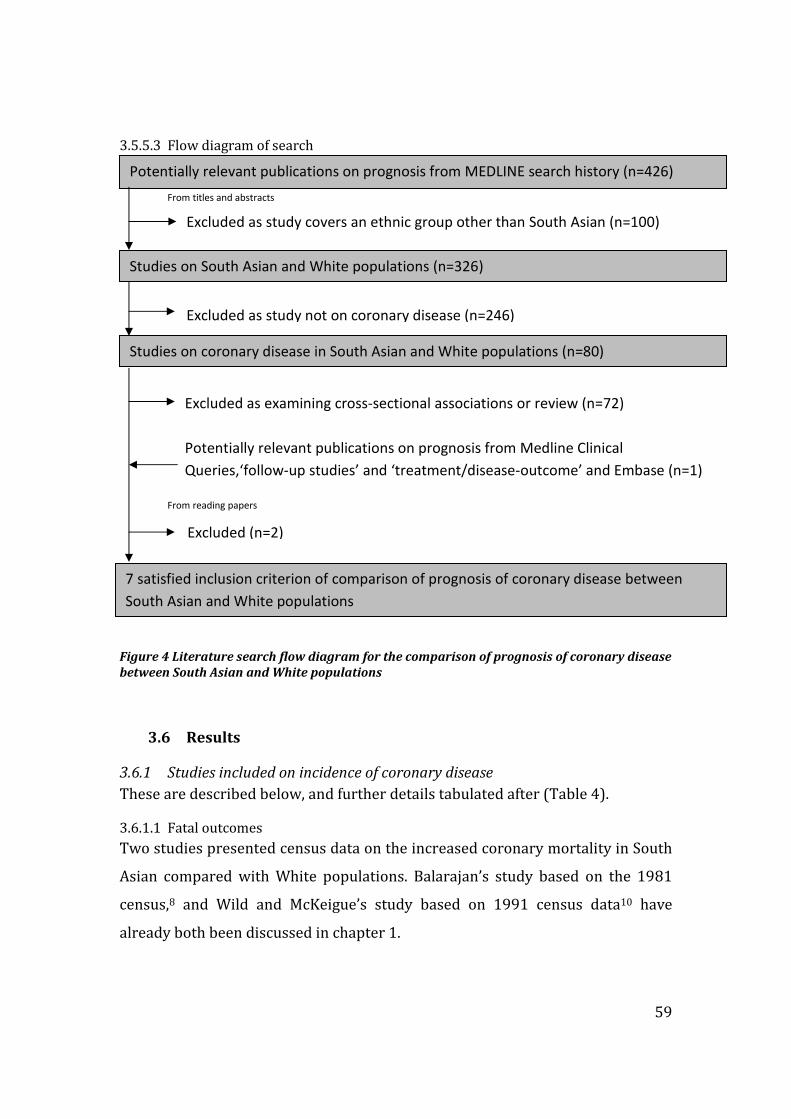
59
3.5.5.3 Flow diagram of search
From titles and abstracts
From reading papers
Figure 4 Literature search flow diagram for the comparison of prognosis of coronary disease
between South Asian and White populations
3.6 Results
3.6.1 Studies included on incidence of coronary disease
These are described below, and further details tabulated after (Table 4).
3.6.1.1 Fatal outcomes
Two studies presented census data on the increased coronary mortality in South
Asian compared with White populations. Balarajan’s study based on the 1981
census,8 and Wild and McKeigue’s study based on 1991 census data10 have
already both been discussed in chapter 1.
Potentially relevant publications on prognosis from MEDLINE search history (n=426)
Excluded as study covers an ethnic group other than South Asian (n=100)
Studies on South Asian and White populations (n=326)
Excluded as study not on coronary disease (n=246)
Studies on coronary disease in South Asian and White populations (n=80)
Excluded as examining cross-sectional associations or review (n=72)
Excluded (n=2)
7 satisfied inclusion criterion of comparison of prognosis of coronary disease between
South Asian and White populations
Potentially relevant publications on prognosis from Medline Clinical
Queries,‘follow-up studies’ and ‘treatment/disease-outcome’ and Embase (n=1)

60
One prospective cohort study that examined coronary death as a longitudinal
outcome in healthy individuals comparing South Asian and White populations
was found. Forouhi et al (2006)122 was designed to prospectively assess the
survival of 1787 European and 1420 South Asian men recruited in West London
in 1988. Ethnicity was identified on the basis of name, country of birth and
appearance, supplemented by direct enquiry in cases of doubt. Follow-up,
flagged for death notification from the Office for National Statistics, was 99.4%.
Multi-variate Cox regression models were developed, and analyses adjusted for
age and coronary risk factors. The results showed that South Asian men in this
study had higher coronary mortality than European men, and this remained
significantly higher in multi-variate models.
3.6.1.2 Non-fatal outcomes
3.6.1.2.1 Healthy individuals
Fischbacher et al’s123 2007 paper examined incidence of fatal and non-fatal
myocardial infarction. It was a record-linked retrospective cohort study of 4.6
million people. It linked information on individual ethnic group from the 2001
census to Scottish hospital discharge and mortality data. 94% of the census
records were matched to a unique national health identifier, the Community
Health Index record. Myocardial infarction was as recorded by a clinician at
hospital discharge or recorded as the underlying cause of death on a death
certificate. The South Asian population comprised people who were designated
as the head of household at the 2001 census as Pakistani, Indian, Bangladeshi
and other South Asian. The paper reported that the incidence rate ratio for acute
myocardial infarction, fatal combined with non-fatal, was 1.45 (95% CI 1.17-
1.78) for South Asian compared to non-South Asian men and 1.80 (95% CI 1.31-
2.48) for South Asian women compared to non-South Asian women. Age, sex and
previous admission for diabetes were adjusted for in the analyses. Out of the 126
incident myocardial infarctions in South Asian people, 21(17%) were fatal; in
non-South Asian people, 9672(31%) of the 30978 events were fatal.
3.6.1.2.2 Individuals with coronary disease risk factors but no coronary disease
The UK Prospective Diabetes Study 32124 sought to estimate the incidence of
myocardial infarction (fatal and non-fatal combined) by ethnicity in participants

61
with diabetes (4974 patients, aged 25-65 years, 82% White, 10% South Asian).
General practitioners referred 7,108 newly diagnosed participants with diabetes,
aged 25–65 years, to 23 clinical centres throughout the UK between 1977 and
1991. The participant defined his or her own ethnicity. The median follow-up
was 8.7 years. This study reported that the hazard ratio for the South Asian
compared to the White population of myocardial infarction was 1.2 (95% CI 0.9-
1.7), after adjusting for age, sex, year of study entry, systolic blood pressure,
smoking, social class, total cholesterol, and high density lipoprotein (HDL)
cholesterol.
The 11-year follow-up on the Southall Diabetes Survey125 was undertaken in
1984. All subjects who could be traced for follow-up were sent a questionnaire
which enquired about a history of heart attack requiring hospital admission. A
100% concordance was noted between self-reporting of morbid events and
hospital case-notes. The study used the term European for the reference
population. Completed questionnaires were obtained from 89% of the South
Asian participants and 93% of European participants still alive. The method of
ascertainment of ethnicity was not specified in the paper. A history of myocardial
infarction requiring hospital admission (hence allowing ascertainment of
incidence for solely non-fatal events) was 2.5 times more common in South Asian
participants as in European participants and adjustment for the younger age of
South Asian participants further increased the odds ratio for a history of
myocardial infarction to 3.8 (95% CI 1.8–8.0, p=0.001). The study did also
examine the coronary mortality rate ratio for the South Asian population versus
the European population, though due to the age difference between ethnic
groups, age-stratified analyses rather than an age-adjusted mortality was
presented in the paper. This made it difficult to compare incidence of fatal events
with other studies retrieved earlier with fatal outcomes. In those aged 30-64, risk
of death from circulatory disease for ischaemic heart disease was twice as high in
South Asian participants than in European participants, whereas coronary death
rates in more elderly (age above 75) South Asian participants with diabetes
appeared better than elderly European participants with diabetes.

62
Table 4 Literature search for the comparison of incidence of coronary disease between South Asian and White populations
Study (year of
publication)
Design, setting and
recruitment time
N (men/women) Percentage diabetic
(S. Asian/White)
Age
Length of follow-up in
years/outcome
Number of events
(S. Asian/White)
Results Variables adjusted for
in analyses
CROSS-SECTIONAL Wild (1997) Cross-sectional census
data, England and
Wales, 1989-92
SA: 318,805/ 315,382
W: 15,634,589/
16,070,270
- - -/coronary death 4230/177327 SMRs for those born in
South Asia of 151 for
women and 146 for
men
Age
Balarajan (1991) Cross-sectional census
data, England and
Wales, 1979-83
SA: 3410/798
W: 207,936/6248
- - -/coronary death 4208/277184 SMRs for those born in
South Asia of 146 for
women and 136 for
men
Age
COHORT Forouhi (2006) Cohort study of healthy
men aged 40-69 from
general practice lists in
West London, 1988
SA: 1420/-
W: 1787/-
35.4/ 19.6 South Asian 51.2 (7.0)
White 52.9 (7.1)
Mean (SD)
16.2/Coronary death 108/95 Adjusted coronary
mortality higher in
South Asian men
(HR 1.68 (1.21,1.94)
Age, smoking, blood
pressure, diabetes,
lipids
Fischbacher (2007) Census data, Scotland,
2001-2003
SA: 9706/9285
W: 1,464,458/
1,709,148
- - 2/fatal or first nonfatal
MI
126 (38 women)/
30978
(13276 women)
Incidence rate ratios in
South Asian compared
to non-South Asian
1.45 (1.17, 1.78) in
men, 1.80 (1.31, 2.48)
in women
Age, sex, previous
admission for diabetes
U.K. Prospective
Diabetes
Study 32 (1998)
Prospective cohort
study of patients with
new type 2 diabetes,
aged 25–65 years, from
23 UK clinics, 1977-91
SA: 336/154
W: 2367/1734
All South Asian 47.0
White 52.2
Mean
8.7/ fatal or first
nonfatal
MI
490/4101 Adjusted hazard ratio
for MI in South Asian
compared to White
participants
1.2 (0.9-1.7).
Age, sex, systolic blood
pressure, smoking
history, lipids, HbA1c
Mather (1998) Prospective cohort
study of patients with
diabetes, aged 30 years
and over, from
community survey,
1984
SA: 730 (m+w)
W: 304 (m+w)
All South Asian 55.0
White 67.0
Mean
11/nonfatal MI 82/9 myocardial infarction
requiring hospital
admission 2.5 times
more common in South
Asian as in White
participants
Age
HbA1c - haemoglobin A1C (glycosylated haemoglobin); MI – myocardial infarction

63
3.6.2 Studies included on prognosis of coronary disease
These are described below, and further details tabulated after (Table 5).
3.6.2.1 Outcomes from myocardial infarction
Six studies that compared prognosis between South Asian and White populations
following presentation with myocardial infarction were found. All of these
studies examined fatal outcomes, with none of them examining non-fatal
outcomes.
The most recent paper was Fischbacher et al’s study,123 described above within
the incidence search, which had also examined prognosis following myocardial
infarction. After adjustment for age, sex and any previous admission for diabetes,
the hazard ratio for death following myocardial infarction reflected better
survival among the South Asian population.
Liew et al126 reported on case fatality rates for acute myocardial infarction in
South Asian and White patients admitted to a single centre coronary care unit.
This study examined short-term (in-hospital) outcomes of patients over a period
of 15 years. Hence the design of the study was to examine cross-sectional
outcomes of patients with acute myocardial infarction treated in an inner city
coronary care unit over a specific time period rather than specifically the
outcomes of one cohort. Analysis of the records of all coronary care unit
admissions of patients with acute coronary syndromes during 2002 at the unit
was used to record ethnicity and this showed that 38% (196 of 521) were South
Asian, which approximated well to the proportion of South Asian people (33%)
living in the catchment area of the hospital at the time. Myocardial infarction was
defined as any two of typical chest pain, 0.1 mV ST elevation on ECG and a rise in
serum CK. The study concluded that the rate of in-hospital mortality was in
progressive decline and that these improvements were observed in both South
Asian and White patients. No difference in case fatality rates between South
Asian and White patients was observed. Analyses were not designed to adjust for
potential confounders.
Gupta et al published127 a follow-up study of Canadian South Asian patients with
myocardial infarction, albeit based on a retrospective review of charts from two

64
hospital sites, and only looking at in-hospital outcomes. Participants were
matched for age, sex, hospital and discharge date. A list of all patients with a
discharge diagnosis of myocardial infarction between January 1994 and April
1999 was obtained from the two hospitals in the study (n=4180). They identified
South Asian patients by their surnames and first names, and by using self-
reported ethnicity and country of birth when available. Of the 734 patients
identified as probably from the South Asian population, 553 were matched to
non-South Asian patients by age within five years, sex, hospital and discharge
date within six months. Most of the remaining 181 South Asian patients were
excluded because of inability to find a matched control subject or missing charts.
Anterior infarctions occurred more frequently among the South Asian patients
than among the control subjects but infarct size as measured by creatine
phosphokinase did not differ significantly between the two groups. They
reported similar in-hospital outcomes between the South Asian patients and
matched control groups (in a logistic regression model using age, smoking status
and diabetes, the risk-adjusted death rate was similar for the two ethnic groups
(9.1% and 7.7% respectively, p=0.20).
Wilkinson et al compared mortality in South Asian and White patients in the six
months after hospital admission for acute myocardial infarction in the east
London borough of Newham.96 They recorded ethnic group in all patients from
their response to a direct question. South Asian patients were younger, a higher
proportion of them did not smoke and a substantially higher proportion had
diabetes (38.3% v 10.9%). After adjustment for age, sex, previous myocardial
infarction, and treatment with thrombolysis or aspirin, or both, South Asian
patients had a poorer survival over the six months from myocardial infarction
(HR (95%CI) 2.02 (1.14-3.56)). Additional adjustments for diabetes, and also
clinical symptoms and signs of left ventricular failure were performed, and this
resulted in the excess risk disappearing (HR (95%CI) 1.44 (0.79-2.61)).
Mukhtar and Littler compared outcomes after myocardial infarction in South
Asian patients with those of White patients in a prospective case-control study
undertaken in Birmingham, UK.128 All patients of South Asian ethnic origin aged
65
69 or less who were admitted with chest pain to the coronary care units of five
hospitals in Birmingham between 1 July 1986 and 30 June 1987 were
documented. Details of ethnic origin were recorded on the original admission
and confirmed before discharge. All South Asian patients were matched for age
and sex with White patients who were admitted to the same hospital during the
same period of time and discharged alive with a confirmed diagnosis of acute
myocardial infarction. There was no significant difference between the two
groups with regard to the main risk factors for coronary artery disease. There
was also no difference in the range of cardiac medication taken by the South
Asian and White patients in the follow-up period. Information as to whether
patients were alive or dead was obtained from their general practitioners.
Patients with a confirmed myocardial infarction were invited for a follow-up
interview 18 months after the original infarct. Four South Asian patients could
not be traced. The paper reported no significant difference in survival or
complications during the four years after an acute myocardial infarction in South
Asian and White patients.
Hughes et al46 compared the natural course of first myocardial infarction in Asian
and White patients who had presented to the coronary care unit of a district
general hospital in north-west London. The primary aim of the paper was to
present data on the prevalence and characteristics of myocardial infarction
between the two ethnic groups. Over two years from June 1985 to June 1987,
128 men (77 White, 54 Asian) presenting consecutively with a first myocardial
infarction were recruited into the study. Myocardial infarction was diagnosed in
the presence of any two of a clinical history compatible with infarction, a serial
rise and fall in creatine phosphokinase activity and typical electrocardiographic
changes persisting for a minimum of 24 hours. All patients were followed up for
one year. Patients lost to follow up (seven White, eight Asian) were assumed to
have followed a similar clinical course to the remainder of their ethnic group.
Data on one-year follow-up for all-cause death showed that 14% of Asian
patients had died compared to 10% of White patients (numbers of deaths being
respectively six and seven in Asian and White groups). No account was taken for
confounders such as diabetes and age.

66
3.6.2.2 Outcomes from angina
One study compared prognosis between South Asian and White patients of any
other presentation of coronary disease bar myocardial infarction. This was an
earlier report from one of the cohorts for this thesis. It examined South Asian and
White patients with chronic angina undergoing coronary angiography and found
no differences in mortality between South Asian and White patients (age-
adjusted HR 1.05 (95% CI 0.68 to 1.63)) nor in rates of combined death and non-
fatal myocardial infarction (HR 1.07, 95% CI 0.78 to 1.47) at median follow-up
for 30 months.61 The paper’s remit was not a focus on outcomes but more on
appropriateness of care, and further adjustments for confounding variables were
not performed.
3.6.2.3 Non-fatal outcomes
There were no studies retrieved that examined non-fatal outcomes such as
angina.

67
Study (year of
publication)
Design, setting and
recruitment time
N (men/women) Percentage diabetic
(South Asian/White)
Age
Length of follow-up
/outcome
Number of events
(South Asian/White)
Results Variables adjusted for
in analyses
Fischbacher et al
(2007)
Retrospective myocardial
infarction cohort from
census data (Scotland)
2001-2003
SA: 88/38
W: 17,696/13,276
- - 2 years/all-cause death 40/17,075 Risk of death 0.59 (95%
CI 0.43-0.81), reflecting
better survival among
South Asian patients.
Age, sex and any
previous admission for
diabetes
Liew et al (2003) Myocardial infarction
cohort (London, UK)
1998–2002
SA: 303
W: 469
- - days/all-cause death 19/56 No ethnic difference in
in case fatality rates
Nil
Feder et al (2002) Coronary angiography
cohort (London, UK)
1996-1997
SA: 391/111
W: 2112/862
33/9 South Asian patients
older (presented as age
categories)
30 months/death or
non-fatal MI
50/386 No ethnic differences
in outcomes
Age
Gupta et al (2002) Matched myocardial
infarction cohort (Canada)
1994-1999
SA: 381/172
W: 381/172
43.4/28.2 South Asian 62.6
White 63.0
Mean age
6 days/Coronary death 45/39 Similar in-hospital
mortality (9.6% and
7.8%, p = 0.27)
Age, sex, smoking,
diabetes
Wilkinson et al (1996) Myocardial infarction
cohort (London, UK)
1988-1992
SA:129/20
W:259/54
38.3/10.9 South Asian 54 (49-59)
White 57 (50-60)
Median (inter-quartile
range)
0.5 years/ all-cause
death
49/78 South Asian population
had poorer survival
accounted for by
diabetes
Age, sex, previous
admission for diabetes,
impaired left ventricle
Mukhtar et al (1995) Matched myocardial
infarction cohort
(Birmingham, UK)
1986-1987
SA:102
W:102
23.5/14.7 South Asian 54.0(8.6)
White 53.9 (68.5)
Mean age (SD)
8.7 years/ fatal or first
non-fatal MI
12/10 No significant
difference in survival
Age, sex
Hughes et al (1989) Myocardial infarction
cohort (London, UK)
1985-1987
SA:23/20
W:50/20
- South Asian 50.2 (9.0)
White 55.5 (6.7)
Mean age (SD)
1 year/all-cause death
6/7
14% of South Asian
compared to 10% of
the White population
had died
Nil
Table 5 Literature search for the comparison of prognosis of coronary disease between South Asian and White populations

68
3.7 Discussion
From the systematic review of this chapter, there were some prospective studies
on incidence of coronary disease, whilst still few in numbers, whilst the
literature on prognosis in South Asian compared to White populations was
heterogeneous and focussed mostly on fatal outcomes following myocardial
infarction. The review of Bhopal in 2000 had concentrated on incidence and
prevalence. It found no evidence was available on incidence of coronary disease
in South Asian compared to White populations, and did not report any
prognostic studies.
3.7.1 Incident disease
There were few studies examining incidence of solely non-fatal events and no
studies on the incidence of angina in South Asian and White populations. There
were only two prospective studies in healthy individuals, Forouhi et al122 and
Fischbacher et al123 both showing that South Asian populations had a higher
incidence of coronary disease compared to White populations. Of the other
studies in individuals with risk factors but no manifest coronary disease, all but
one reported a higher incidence of coronary disease in South Asian compared to
White populations. Hence, though few studies exist on incidence, there are at
least some and this represents an improvement on Bhopal’s review in 2000
which retrieved none.
3.7.2 Prognosis of disease
When considering prognosis, the literature was heterogeneous in terms of length
of follow-up, with three of the studies on participants with myocardial infarction
focussing solely on short-term, in-hospital events. Participant numbers were
small, resulting in small numbers of outcomes. In total, across seven studies
spanning recruitment from 1989-2003, there were only 221 events recorded in
South Asian populations. Over half of these, 114 in total, were within one month
of the index event. Adjustment for confounders was lacking – though all studies
that recorded diabetes prevalence reported a higher prevalence in South Asian
compared to White populations, multi-variate regression analyses were not
consistently performed to account for this. None of the studies fully took into
account ethnic differences in clinical management, social environment and

69
disease severity. Studies tended to focus mostly on fatal outcomes following
presentation with myocardial infarction, and there was only one study
examining prognosis of angina, and none on non-fatal outcomes. Finally,
throughout all these studies, the method of recording of ethnic group was not
consistent.
3.7.3 Implications
3.7.3.1 Incidence of coronary disease
The lack of studies examining incidence of solely non-fatal events such as angina
between South Asian and White populations is significant. If incidence of non-
fatal events such as angina is higher among South Asian populations than White
populations, then the appropriate identification and management at this initial
presentation may prevent progression to more serious later-phase
manifestations of coronary disease such as myocardial infarction and ultimately
coronary death. Therefore, knowledge of the incidence of angina is important to
the overall picture of coronary disease epidemiology between South Asian and
White populations.
3.7.3.2 Prognosis of coronary disease
Studies retrieved were heterogeneous in their methods and thus makes it
difficult to render a conclusion on the prognosis between South Asian and White
populations. No contemporary studies have examined prognosis between South
Asian and White populations using the newer definitions of myocardial
infarction taking into account troponin level. Furthermore, few studies exist that
have compared prognosis between South Asian and White populations of any
other presentation of coronary disease bar myocardial infarction such as angina.
3.8 Conclusion
The literature on incidence of coronary disease in the South Asian population is
sparse but suggests overall a higher incidence of fatal coronary disease in South
Asian compared to White populations. There are few studies on non-fatal
incidence. When considering prognosis, the literature is heterogeneous and
focussed mostly on myocardial infarction and thus is unable to answer whether
prognosis is worse in South Asian compared to White populations.

70
4 Data in four cohorts used for this PhD
4.1 Summary of chapter
The purpose of this chapter is to present the four studies chosen to span the
natural history of coronary disease and prognostic risk. The methodology of the
datasets is compared and contrasted, and in particular the quality and validity of
the data examined for those variables essential for the analyses of this thesis
such as ethnicity and chest pain. This is of greatest importance in the acute
coronary syndrome registry (MINAP), as the other three cohort studies were
designed for research.
71
4.2 The cohorts
To answer the specific objectives of the thesis, four cohort studies were chosen
to span the natural history of coronary disease.
4.2.1 Healthy population cohort
The Whitehall-II study was set up to examine reasons behind the social gradient
in health and disease found in the original Whitehall study of the 1960s.129 The
target population for the Whitehall-II study was all civil servants aged 35–55
years working in the London offices of 20 Whitehall departments in 1985–88.
10308 people were recruited, 3413 women and 6895 men. The participants
included all grades, from clerical and office support grades through middle-
ranking executive grades up to senior administrative grades, differing widely in
salary. The whole cohort was surveyed at the research clinic at 5-year intervals,
and a postal questionnaire was sent out to them between clinic phases.130 131
Ethical approval for the study was obtained from the University College London
Medical School Committee on the ethics of human research.
4.2.2 Chest pain clinic cohort
The Chest Pain Clinic study recruited participants, all with suspected new-onset
stable angina, in six rapid access chest pain clinics in the United Kingdom from 2
January 1996 to 31 December 2002. The participating centres were:
� Newham General Hospital
� Oldchurch Hospital
� Manchester Royal Infirmary
� Blackburn Royal Infirmary
� Burnley General Hospital
� Kingston General Hospital

72
The rapid access chest pain clinic at Newham General Hospital (now University
Hospital) in east London was the first of these to be established in January 1996.
It was one of the first nationally and four years later became the service model
for the National Service Framework.132 g The National Service Framework for
coronary artery disease recommended rapid access chest pain clinics for
cardiological assessment of recent onset chest pain within two weeks of referral
from primary care. This compressed timeframe from generalist to specialist
could not be achieved in the conventional outpatient cardiology clinic with its
referrals for a wide range of other cardiac conditions. Rapid access chest pain
clinics concentrate cases of chest pain and thus can model revascularisation
requirements by measuring the population frequency of the indications for
which revascularisation confers benefit. Such an "incidence of indications"
approach has been applied in other conditions (for example, the need for total
hip replacement133).
At the time the rapid access chest pain clinic was established, an electronic
database was developed in which registry baseline data on consecutive patients
attendances were recorded. The success of the database led to its utilisation in
five other rapid access chest pain clinics around the country, all of which
recorded data in identical fields to those used at Newham.
Ethical approval for the multi-centre study was obtained from a multiregional
ethics committee (Multi-centre Research Ethics Committee /02/04/095). The
National Patient Information Advisory Group gave permission to link
anonymised data sets without obtaining individual patient consent.
4.2.3 Coronary angiography cohort
The Appropriateness of Coronary Revascularisation (ACRE) Study was a
prospective study investigating clinical outcomes in patients undergoing
coronary angiography at two hospitals within one NHS Trust – The London Chest
g Policies set by the National Health Service in the United Kingdom to define standards of care for
major medical issues and long term strategies for improving specific areas of care. They set
national standards, identify key interventions and put in place agreed time scales for
implementation

73
and St Bartholomew’s Hospitals. It was set up in 1995 to assess the appropriate
use of coronary angiography, as wide variations in practice existed. The resident
population of the combined catchment area was 2,833,000 with 89% of the
angiography procedures performed in this population being performed at this
NHS Trust. Patients were referred from five different health authorities (East
London and the City, Barking and Havering, Redbridge and Waltham Forest,
North or South Essex) and 13 hospitals as well as approximately 700 GP
practices.
Coronary angiography is defined by the American Heart Association as the
‘radiographic visualization of the coronary vessels after injection of radio-opaque
contrast media’.60 A sheath is inserted percutaneously into a peripheral artery
(most commonly the femoral artery in the groin) under local anaesthesia
through which a fine hollow coronary catheter is manipulated, under x-ray
guidance, into the origin of the coronary arteries. It is a relatively safe procedure,
the risk of major complications being ~1 in 1000.59 Complications include death,
myocardial infarction, stroke, aortic or coronary dissection, cardiac rupture, air
embolus, cardiac arrhythmia and peripheral arterial injury.
In ACRE, all consecutive patients undergoing elective (more than 90%) and
emergency coronary angiography admitted between April 15th 1996 and April
14th 1997 were recruited at the time of their coronary angiogram. 4120 patients
were identified from ward admission and catheter laboratory log books. There
were no exclusion criteria. 54% of the ACRE cohort went on to revascularisation
at 2.5 years. Ethical approval for the study came from the five local research
ethics committees.
4.2.4 Acute coronary syndrome cohort
The Myocardial Infarction National Audit Project (MINAP) is a registry which
contains data from patients with an acute coronary syndrome who have been
admitted to all 230 hospitals in England and Wales.134 The use of medical
registries to audit clinical practice has sharply increased due to progress in
information technology and increasing demands for accountability. A medical
registry has been defined as ‘a systematic collection of a clearly defined set of

74
health and demographic data for patients with specific health characteristics,
held in a central database for a predefined purpose’.135 Beyond their role as tools
to monitor and improve quality of care, registries can also be a resource for
epidemiological research. An advantage of such databases is that they include
all-comers, and therefore have no exclusion criteria as in the case of clinical
trials. Thus, conclusions from research from them are potentially applicable to all
with the condition under study. Exclusion criteria within trials often exclude for
example high-risk patients.
The degree of the population coverage within MINAP cannot be matched by the
national register in the USA (which selects 20% of hospitals)136 or elsewhere in
Europe.137 Each month, MINAP accrues over 7000 acute coronary syndrome
events. MINAP records 108 data fields, covering acute coronary syndrome type
and severity (such as ECG changes and markers of myocardial necrosis) risk
factors, drugs and invasive management. Such data are not available in routinely
collected Hospital Episode Statistics data, the national statistical data warehouse
for England of the care provided by NHS hospitals and for NHS hospital patients
treated elsewhere.h Large-scale data on admission rates with ACS with respect to
ethnicity, or by specific sub-types of ACS cannot be provided by Hospital Episode
Statistics because there is no coding of ethnicity or of STEMI, ACS (troponin
positive or negative) or NSTEMI. The database thus has the potential, through its
large numbers of participants, to examine in detail hypotheses pertaining to the
differing types of the acute coronary syndromes. Furthermore, it has the ability
to take into account the multitude of confounding factors that operate when
considering the prognosis of acute coronary syndromes. The MINAP dataset is a
collection of terms and definitions which allows national consistency when
comparing or describing any aspect of care of acute coronary syndromes. Not
every data item is relevant for every patient, as those with STEMI will for
example have a different clinical management strategy to those with NSTEMI.
However, the value of such clinical registration datasets to research depends on
h http://www.hesonline.nhs.uk

75
the quality of the data as the validity of registry data is most threatened by
incomplete and incorrect data entry.
Between 1 January 2004 to 31 December 2004, 91684 patients were entered
onto the database of which 27573 had an ST-elevation myocardial infarction
(STEMI), 42281 had a non ST-elevation myocardial infarction (NSTEMI) and
7318 had a troponin-negative acute coronary syndrome. 2003 was the first year
in which a full dataset was available using all 230 hospitals, as prior to this,
hospitals were being increasingly recruited into the registry. The patients in
MINAP have been followed up for their vital status, linked to the Office of
National Statistics. MINAP has National Patient Information Advisory Group and
Central Office for Research Ethics Committees approval for individual patient
anonymous linkage for mortality. No patient identifiers are given out to
researchers. MINAP is funded by the Healthcare Commission.
4.3 Assessment of data quality in each cohort
4.3.1 Data checking
The cohorts for study in this thesis were selected on account of the coverage they
provide across the different stages of the natural history of coronary disease. The
populations and methodology of the studies varied.
The following checks were performed on the data (definitions from Last’s
Dictionary of Epidemiology138):
• Selection bias – “Error due to systematic differences in characteristics
between those who take part in a study and those who do not.”
o At the start-point of data collection within a research study is the
recruitment process at which point such a bias can exist
• Information bias – “A flaw in measuring exposure or outcome data that
results in different quality (accuracy) of information between comparison
groups.” Within this category are:

76
� Recall bias – “Systematic error due to differences in
accuracy or completeness of recall to memory of past event
or experiences.”
� Observer bias – “Systematic difference between a true value
and that actually observed, due to observer variation.”
o Cohort studies rarely suffer from recall bias due to their
prospective nature, and observer bias was minimised in all these
studies as classification of exposure status (e.g. ethnicity) was
done prior to onset of disease.
• Measurement bias – “Systematic error arising from inaccurate
measurements of subjects on study variable(s).”
o This can result from missing data and also is the extent to which an
instrument (such as a questionnaire) actually measures the
characteristic that is of interest, its validity.
The table below outlines the data sources and methodology of the four datasets
used, and potential areas where biases and errors may result.

77
Page 1/2 Aetiologic study Prognostic studies (patients with coronary disease)
Cohort Whitehall-II Chest pain clinic ACRE MINAP
Population Healthy population, as yet
having no diagnosis of
coronary disease
People with chest pain of
recent onset referred from
primary care
Patients undergoing coronary
angiography for chronic angina
who have been reviewed by a
cardiologist
Patients presenting as
emergencies with acute,
severe chest pain at rest
Location London offices of 20 civil
service departments
Six rapid access chest pain
clinics across England
Two hospitals within one NHS
Trust, London
230 hospitals across England
and Wales
Dates of baseline data
collection
1985–8 2 January 1996 to 31
December 2002.
15 April 1996 to 14 April 1997. Full national recruitment from
2003 onwards. Continuous
registry and data accrue year
on year.
Recruitment method Epidemiological research
study, consented participants,
with clinical examinations and
questionnaires administered
at baseline by designated
research staff.
Clinical database within an
NHS clinic. Data recorded by a
cardiologist using identical
databases.
Clinical research study,
consented participants, with
baseline questionnaire
administered and review of
case notes by designated
research staff.
Clinical database, with data
recorded by coders at
individual hospitals and sent to
a collating centre.
Total numbers/response rate
at baseline
10308 recruited/73% 11185/100% consecutive
patients
4020/100% consecutive
patients
91687/100% consecutive
patients (in 2004)
Baseline data completeness 99.9% 92.5% 98.0% Variable
Collection of ethnicity
variable
Ethnicity was defined
according to the Office for
National Statistics 1991 census
types. Participants self-
reported their ethnicity at
Cardiologist ascribed ethnicity
as Asian, White, Black or other
during the consultation.
Self-assigned ethnicity was
based on the 1991 census
classification by questionnaire
The patient's ethnic group was
determined by the
clinician/health care worker.
Ethnicity was coded as Asian,
Caucasian, Black, Oriental or

78
Page 2/2 phase 5 (1997–1999),
observer-assigned ethnicity at
baseline.
other.
Completeness of data for
ethnicity
99.9% 81.2% 89.7% 80.2% (in 2004)
Number of South Asians 580 2900 502 3236
Main exposures used for
analyses of thesis
Rose questionnaire angina Chest pain descriptors
(typical/atypical)
Canadian Cardiovascular
Society classification of angina
severity
Diabetes, disease severity
(troponin) and acute coronary
syndrome type
Follow-up Seven follow-up phases over
18 years by post and by
interview/examination. Office
for National Statistics
Office for National Statistics,
Hospital Episode Statistics
Six-year follow-up by post.
Office for National Statistics,
Hospital Episode Statistics.
Case notes and Patient
Administration Systems
Office for National Statistics
Outcomes Chest pain
Non-fatal MI
Death
Angiography/Revascularisation
Non-fatal MI
Death
Change in angina
Non-fatal MI
Death
one-year all-cause mortality
Completeness of follow-up 99% of participants were
flagged for mortality. Follow-
up for the whole cohort by
questionnaire was 67%.
99.5% of participants were
flagged for mortality, hospital
admissions, coronary
angiography and
revascularisation.
99% of participants were
flagged for mortality, all-cause
hospital inpatient admissions,
and on hospital admission for
revascularisation and non-fatal
myocardial infarction
85.6% of South Asian and
91.2% of White populations
were followed up for all-cause
mortality.
Thesis objectives to be
answered (thesis chapter)
1,5
(5)
2,5
(6)
3,5
(7)
4,5
(8)
Cohort Whitehall-II Chest pain clinic ACRE MINAP
Table 6 The four cohorts used for the thesis – data sources and methodology

79
4.3.2 Recruitment at baseline
Of the four studies, MINAP differed in being a database where individual consent
is not sought at baseline admission and data entry is undertaken by the
individual different hospitals, rather than dedicated members of a research team
- hence checking the quality of baseline data variables was of particular
importance.
Selection bias within cohort studies can occur if the exposed and unexposed
groups differ in a fixed way. In an occupational cohort for example, the
unexposed control group may be healthier than an exposed group of workers
simply because they are healthy enough to stay in work. In the four studies
chosen for this thesis, the exposed (South Asian population) and the unexposed
(White population) groups were chosen from within the same study populations,
prior to the development of the outcome (e.g., myocardial infarction, death) of
interest. Thus, selection bias is reduced, and the checks undertaken for baseline
recruitment and data collection revolved predominantly around data
completeness.
4.3.2.1 Whitehall-II
This study initially recruited by inviting all non-industrial civil servants aged 35-
55 working in the London offices of 20 departments. The overall original
response rate at recruitment (Phase 1) was 73%, high for such a study,139
reducing the possibility of selection bias. A further 4% of the civil servants on the
lists provided by the civil service had moved before the study and were therefore
not eligible for inclusion.140 Completeness of data in those recruited was high at
baseline in Whitehall-II as all participants were interviewed in person by
research staff.
4.3.2.2 Chest pain clinic
As a prospectively recruited clinical cohort, all patients who consecutively
attended to the clinics over the recruitment phase were included. The nature of
the chest pain clinic is such that recent-onset chest pain is keenly sought, and
referral guidelines to the clinic were agreed following discussions between
general practitioners and the department of cardiology. The clinic is relatively
easy to access in terms of logistics (appointments given within days rather than

80
months) and there are few hurdles to assessment in clinic presented to the
general practitioner. Among patients fulfilling eligibility criteria, the cohort has
previously reported that the chest pain clinic substituted for conventional
cardiology out-patients clinic in all but 3% of cases.29 Thus, significant
differential referral by ethnicity to chest pain clinic is unlikely thus reducing the
chance of selection bias. Consent was not sought at baseline due to the nature of
the database as an on-going clinical database and completeness of baseline data
in chest pain clinic was high at 92.5%.
Though data entry for smoking status, history of hypertension and diabetes and
medication were 100% complete, history of hypercholesterolemia was unknown
in 68.49% of the cohort and 78.4% did not have a cholesterol level. Data were
available on the whole cohort for statin therapy - 1.9% of those with no data on
hypercholesterolemia were on a statin, compared to 5.9% defined as not having
hypercholesterolemia and 40.6% of those defined as having
hypercholesterolemia. Thus, it is likely that among those in whom cholesterol
was not known, a high cholesterol level was unlikely judging by their low statin
prescription rates.
A previously published sensitivity analysis showed that the rates of coronary
deaths and non-fatal events for patients with missing baseline data were not
significantly different from those complete baseline data.29
4.3.2.3 ACRE
As a prospectively recruited clinical cohort, all patients who consecutively
attended for angiography over the recruitment phase were included – this
eliminates selection bias in following up those selected for angiography, though
it can not take into account selection bias in the actual selection process for
angiography. On the day of coronary angiography, eligible patients were
identified by examination of ward admission and catheter books. Trained nurses
extracted data (e.g. on smoking, history of hypertension, diabetes, results of
exercise electrocardiography, blood pressure) from all 4020 case notes using
standardised forms. Furthermore, patients completed a questionnaire about
their general health, coronary heart disease risk factors and angina symptoms

81
(data available for 3301/4020, 82% response rate). Within those case notes
searched and questionnaires completed, completeness of data was high at 98%.
4.3.2.4 MINAP
MINAP is a continuous registry and data accrue year on year. Longitudinal
patterns were investigated in a number of important fields to test the year-on-
year consistency of data field entry and thus the quality of its measurements.
Disease patterns in one year are likely to be comparable to the next if definitions
of that disease have not changed.
Secular data entry patterns in percentages of electrocardiogram findings and
diagnosis of acute coronary syndrome type were examined. MINAP has available,
from 2003, four years of full data from all 230 hospitals in England and Wales.
These years were also compared to pre-2003 data, during which time hospitals
were being progressively recruited and hence data would be incomplete.
The results are shown in the table below.
Year Pre-03 2003 2004 2005 2006
N 2769 92,252 93,469 89,635 77,255
ECG
ST segment elevation 27.99 32.15 31.86 31.50 29.58
LBBB 7.87 4.98 5.29 5.53 4.90
ST segment depression 14.12 11.92 13.28 15.11 14.95
T wave changes 13.69 12.33 13.08 14.59 14.09
Other abnormality 24.63 13.44 14.52 14.98 14.08
Normal 6.36 8.88 8.97 9.11 8.16
Unknown 5.34 11.25 13.0 9.18 14.24
ACS type
STEMI 28.17 29.65 29.50 29.58 27.59
NSTEMI 27.01 41.85 45.24 47.48 50.29
Troponin negative 0.22 4.45 7.83 8.25 7.0
Unknown 44.60 24.04 17.44 14.69 15.12 Figures are percentages apart from N
Table 7 MINAP - Proportions of ECG abnormalities and ACS type in successive yearly datasets
The data showed a consistency from 2004-2006. STEMI’s constituted around 28-
29% of acute coronary syndromes, and percentages for the breakdown of the
other types of acute coronary syndrome and within ECG were also consistent

82
across the years. The percentage of ST segment depression remained
consistently around 13-15 across 2004-1006.
These results were suggestive that, year on year, a degree of consistency was
found, and a pattern of changing data entry over the years was not seen.
4.3.3 Ethnicity
As the main exposure of interest to this thesis was ethnicity, the validity of
measures of ethnicity within the four cohorts was checked.
4.3.3.1 Whitehall-II
Ethnicity was defined in Whitehall-II according to the Office for National
Statistics 1991 census types. Though ethnicity was observer-assigned at phase 1,
at phase 5, participants self-reported their ethnicity. This was then used to
validate the ethnicity data collected at phase 1. There was strong agreement
between data on observer-assigned ethnicity from phase 1 and self-reported
ethnicity at phase 5 - 93% of ascribed South Asian participants described
themselves South Asian, 99.3% of self-ascribed White participants described
themselves as White. Hence, Whitehall-II had a high degree of completeness of
data for ethnicity, and the data appeared valid.
4.3.3.2 Chest pain clinic
In the chest pain clinic study, the cardiologist ascribed ethnicity as “Asian”,
“White”, “black” or “other” during the consultation. In a validation study within
the Newham chest pain clinic, I found that of 34 consecutive patients (25 South
Asians), 88% self-assigned their ethnicity using the 2001 census classification in
line with the assessment of the cardiologist (kappa statistic 0.766). Those
patients who self-assigned their ethnicity as Bangladeshi, Indian, Pakistani or Sri
Lankan I refer to as ‘South Asian’. Hence, data on ethnicity in this study appeared
valid.
4.3.3.3 ACRE
Self-assigned ethnicity was based on the 1991 census classification by
questionnaire on the day of index coronary angiography and identified
424 South Asian patients. For patients with missing data, given and family names
were cross matched on a database of 15 000 names used to identify South Asian

83
patients in routine data from east London.141 This database identified a further
78 South Asian patients. This system was considered valid because the name
database is highly specific (99%); the name assigned and self assigned methods
identified similar proportions of South Asian people (15.6% and 12.8%,
respectively) and confining the analyses to those with self-assigned ethnicity did
not affect the results. Overall, 3607/4020 (89.7%) patients on the database had
data available for ethnicity, with 57 being coded black, 74 other.
Baseline ethnic profiles of this cohort have been previously reported in the
literature.61 The risk factor profile between White and South Asian patients
revealed patterns consistent with previous literature in South Asian
populations58 142 such as their younger age (6% of South Asian patients aged 70
or over compared to 20% in White patients), the high percentage of diabetics
(33% in South Asian compared to 9% in White patients) and the lower
percentage of smokers (8% in South Asian compared to 13% in White patients).
Hence, ACRE had a high degree of completeness of data for ethnicity, and the
data appeared valid.
4.3.3.4 MINAP
In MINAP, the patient's ethnic group was determined by the coder assessing the
case notes and patient computer records. Ethnicity within case notes or on the
hospital computer system can be entered in a number of ways. The patient can
themselves complete an administration form asking for personal details which
can include other items such as address and next of kin details, or can verbally
offer their ethnicity when asked. The ethnic group may also have been
determined by the healthcare professional entering administrative data on the
patient, and this information may come from self-assessed ethnicity from
another source such as letter from the general practitioner, or be assigned by the
healthcare professional. Ethnicity was coded Caucasian, Black, Asian, Oriental,
Other and Unknown in the database.
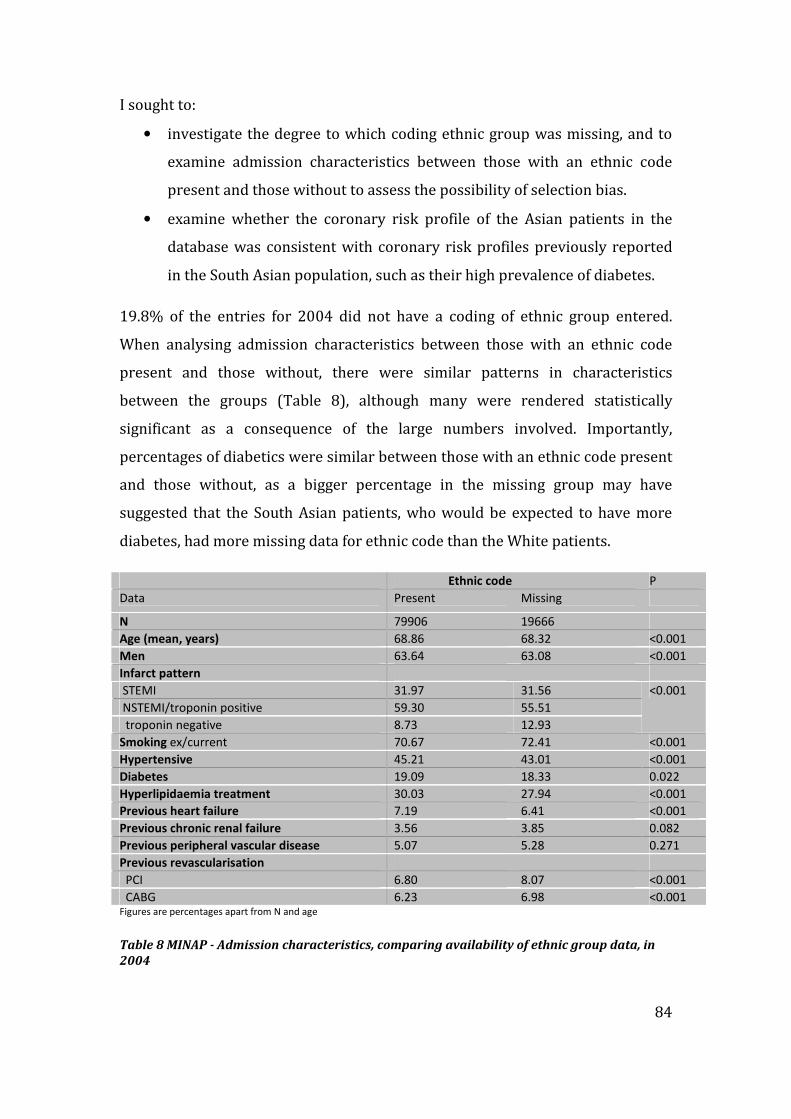
84
I sought to:
• investigate the degree to which coding ethnic group was missing, and to
examine admission characteristics between those with an ethnic code
present and those without to assess the possibility of selection bias.
• examine whether the coronary risk profile of the Asian patients in the
database was consistent with coronary risk profiles previously reported
in the South Asian population, such as their high prevalence of diabetes.
19.8% of the entries for 2004 did not have a coding of ethnic group entered.
When analysing admission characteristics between those with an ethnic code
present and those without, there were similar patterns in characteristics
between the groups (Table 8), although many were rendered statistically
significant as a consequence of the large numbers involved. Importantly,
percentages of diabetics were similar between those with an ethnic code present
and those without, as a bigger percentage in the missing group may have
suggested that the South Asian patients, who would be expected to have more
diabetes, had more missing data for ethnic code than the White patients.
Ethnic code P
Data Present Missing
N 79906 19666
Age (mean, years) 68.86 68.32 <0.001
Men 63.64 63.08 <0.001
Infarct pattern
STEMI 31.97 31.56
NSTEMI/troponin positive 59.30 55.51
troponin negative 8.73 12.93
<0.001
Smoking ex/current 70.67 72.41 <0.001
Hypertensive 45.21 43.01 <0.001
Diabetes 19.09 18.33 0.022
Hyperlipidaemia treatment 30.03 27.94 <0.001
Previous heart failure 7.19 6.41 <0.001
Previous chronic renal failure 3.56 3.85 0.082
Previous peripheral vascular disease 5.07 5.28 0.271
Previous revascularisation
PCI 6.80 8.07 <0.001
CABG 6.23 6.98 <0.001 Figures are percentages apart from N and age
Table 8 MINAP - Admission characteristics, comparing availability of ethnic group data, in
2004

85
Analyses on risk factor profile between White and Asian patients revealed
patterns consistent with previous literature in South Asian populations58 - the
high percentage of diabetics, the lower percentage of smokers (especially in
Asian women) and similar percentages of hypertensives (Table 9).143 The MINAP
study is primarily focussed on outcomes as opposed to expected patterns of
health when presenting with acute coronary syndromes. Hence, it is of
reassurance that the patterns of risk factors at baseline by ethnicity conform to
previously reported patterns.
Men Women
Asian White Asian White
N 2374 46829 849 27387
Current smokers 28.7 28.3 3.7 20.2
Hypertensive 44.3 38.1 58.8 46.9
Hyperlipidaemia treatment 35.9 26.3 35.2 25.0
Diabetes
Oral medication 19.4 6.9 22.9 7.0
Insulin 11.8 4.7 7.2 5.3 Figures are percentages apart from N
Table 9 MINAP - Risk factor profile, comparing White and Asian patients, by sex, in 2004
Hence, data on the ‘Asian’ patients in this study appeared to be valid in
measuring the true South Asian population.
4.3.4 Follow-up
The most important source of selection bias in cohort studies is when
completeness of follow-up data differs between exposure categories. This loss
can reduce the statistical power of the study (through a reduction in sample size)
and, if selective, can cause bias as the remaining sample may not represent the
population it was originally selected from.
4.3.4.1 Whitehall-II
The study maintained good follow-up through its procedures. The methodology
of interviewing participants in person at alternate stages (invited to the research
clinic at 5-year intervals, and a postal questionnaire between clinic phases)
ensured a low attrition rate. Furthermore, home visits by nurses were offered for
the first time to participants unwilling or unable to travel to the Phase 7 clinic
and a brief telephone questionnaire was administered to those who decline clinic
and full questionnaire participation at each phase.

86
Follow-up for death and myocardial infarction was 99.9% complete. In
particular, this thesis sought prospective data on chest pain as measured on the
Rose questionnaire. I found that that loss to follow-up for South Asian
participants in answering questions on chest pain was higher than in White
participants. However, there were no differences in baseline risk factor profile
(smoking, hypertension and total cholesterol) between those South Asian
participants with follow-up for chest pain and those without at phase 7. 9% of
non-response in South Asian participants and 11% in White participants were
accounted for by death. Subjects in both ethnic groups with missing follow-up
were more likely to be in a lower grade of work. Those that are more likely to
drop out completely are also more likely to have more health problems and be of
lower socio-economic status144 which may result in an underestimate of angina
in a South Asian population, as significantly more South Asian participants were
in a lower grade of work in Whitehall-II. With 18-year phase 7 follow-up for the
whole cohort being a reasonable 67%, the biggest cause of loss to follow-up for
chest pain data was loss of overall questionnaire follow-up rather than chest pain
non-response.
4.3.4.2 Chest pain clinic
The study was able to monitor mortality among patients by use of data from the
Office for National Statistics and monitor hospital admissions, coronary
angiography and revascularisation by use of the national Hospital Episode
Statistics, supplied by the National Health Service Wide Clearing System, using
unique National Health Service numbers. Successful matching was achieved for
99.5% of the cohort.
4.3.4.3 ACRE
The major variable of study within ACRE was angina, and its change from
baseline to follow-up. Analyses on whether significant differences existed
between ethnic groups in those with data on angina and those without are
presented in section 4.3.5.2. Follow-up for death and myocardial infarction was
99% complete.

87
4.3.4.4 MINAP
Follow-up in MINAP was in the form of all-cause mortality, at one year. Using
2004 data, follow-up for all-cause mortality was 85.6% complete in South Asian
patients, 91.2% in White patients. Examining admission characteristics stratified
by availability of follow-up data, both South Asian and White patients without
data for follow-up were younger and more likely to have had a troponin-negative
ACS, but there were no significant differences in the other categories (Table 10).
South Asian White Data available for one-
year follow-up Yes No Yes No
N 2769 467 p 57109 13016 p Age (mean, years) 61.87 60.32 0.027 69.66 66.02 <0.001 Men 73.37 73.45 0.904 62.99 63.68 <0.001 Infarct pattern
STEMI 32.20 40.26 0.004 31.37 36.22 <0.001 NSTEMI/trop +ve 52.11 43.64 60.78 49.30 troponin -ve 15.69 16.10 7.85 14.48 Smoking ex/current 46.33 51.30 0.072 71.72 72.19 0.449 Hypertensive 45.23 41.44 <0.001 53.64 46.32 0.005 Diabetes 42.48 37.59 0.067 29.36 30.13
0.214
Hyperlipidaemia
treatment 39.46 31.00 0.001 14.38 12.25 <0.001
Previous heart failure 6.96 4.67 0.086 7.55 5.02 <0.001 Previous chronic renal
failure 4.76 3.47 0.250 3.65 2.42
<0.001
Previous peripheral
vascular disease 3.03 2.45 0.519 5.23 4.90 0.267
Previous revascularisation
PCI 12.51 11.03 0.400 6.47 7.53 0.002 CABG 9.31 7.04 0.136 5.95 8.47 <0.001
Figures are percentages apart from N and age
Table 10 MINAP - Admission characteristics, comparing status (dead/alive) at 1 year, in
South Asian and White patients, in 2004
I performed further checks on the data. Among those lost to follow up (i.e.,
unknown vital status from the Office for National Statistics), a number were
retrieved from information on in-hospital death that was present in the database.
233 of the 5462 with missing one year follow-up had died in hospital from the
2004 cohort and hence were recorded as death. Overall figures for follow-up at
one year were now 87.7% complete in South Asian patients, 95.6% in White
patients.

88
4.3.5 Cohort-specific data field checks
4.3.5.1 Chest pain in Whitehall-II
Chest pain as recorded by the Rose questionnaire was an important variable for
planned analyses. Of the 9775, 577 (99.5%) South Asian participants and 9184
(99.9%) White participants had data available on chest pain at phase 1. By 18
year follow-up at phase 7, 41 South Asian participants and 525 White
participants had died, and data on chest pain were available on 317 South Asian
and 6268 White participants. No differences in baseline risk factor profile were
found between those South Asian participants with follow-up for chest pain at
phase 7 and those without, and the rate of chest pain non-response on those who
filled in the questionnaire was low.
4.3.5.2 Angina in ACRE
The major variable of study within ACRE was angina and its improvement from
baseline to follow-up. There were a greater proportion of South Asian patients
with missing data for angina, and I examined whether significant differences
existed in baseline characteristics in risk factors, past coronary history and
management, socio-economic characteristics, the CCS as defined by the doctor on
admission and angiographic findings within ethnic groups between those with
data on angina (at both baseline and follow-up) and those without. This analysis
revealed that no significant differences existed (Table 11).

89
Table 11 ACRE - Comparison of baseline factors between those with data and those missing data for angina at baseline and follow-up, in South Asian and
White patients
Ethnic group SOUTH ASIAN p WHITE p
Data for angina Missing Not missing Missing Not missing
N 306 (60.96) 196 1466 (49.29) 1508
Age (mean, (SD) in years) 56.33 (9.98) 54.19 (9.10) 0.016 61.38 (10.74) 60.46 (9.34) 0.013
Men 244 (79.74) 147 (75.00) 0.212 1061 (72.37) 1051 (69.69) 0.107
Ever smoked 90 (47.87) 88 (46.56) 0.799 889 (76.77) 1048 (70.86) 0.001
Hypertensive 117 (38.24) 74 (37.76) 0.914 445 (30.35) 444 (29.44) 0.587
Total cholesterol (mean, (SD,
range)) in mmol/l
5.56 (1.17) 5.61 (1.17) 0.673 5.59 (1.12) 5.61 (1.13) 0.708
Diabetes 108 (35.29) 48 (24.49) 0.011 149 (10.16) 139 (9.22) 0.383
Body Mass Index (mean (SD)) 26.01 (4.08) 25.89 (3.94) 0.767 27.24 (4.45) 27.56 (4.50) 0.077
Family history of coronary heart
disease
54 (31.03) 73 (40.11) 0.074 503 (45.48) 654 (45.54) 0.974
Lower social class 70 (32.41) 68 (35.42) 0.521 557 (39.76) 669 (45.17) 0.003
Left school < 16 yrs 75 (42.37) 74 (44.85) 0.645 1104 (85.85) 1242 (86.37) 0.694
Heart failure 40 (13.07) 18 (9.18) 0.184 237 (16.17) 157 (10.41) <0.001
Previous myocardial infarction 129 (42.16) 71 (36.22) 0.185 651 (44.41) 599 (39.72) 0.010
Doctor-defined angina status CCS
III-IV
129 (47.78) 72 (41.38) 0.186 534 (40.45) 542 (39.50) 0.615
Previous PCI 21 (6.86) 19 (9.69) 0.253 112 (7.64) 133 (8.82) 0.242
Previous CABG 22 (7.19) 15 (7.65) 0.846 151 (10.30) 146 (9.68) 0.574
>1 diseased coronary vessel 229 (75.58) 138 (70.77) 0.234 1128 (77.74) 1189 (79.27) 0.313
Impaired left ventricular function 67 (22.11) 31 (15.90) 0.089 347 (23.91) 216 (14.40) <0.001
Data are (n, (%)) unless specified

90
4.3.5.3 Diagnosis of acute coronary syndrome type in MINAP
A major variable for analysis within MINAP was the final (discharge) diagnosis.
This coded types of acute coronary syndrome, beyond the previously narrow
category of myocardial infarction, which now exist as a result of troponin
measurement. Only 3.5% of entries for 2004 had missing data. I then sought to
check the data validity within this field - the extent to which the category final
diagnosis measured the specific ACS types within it. The data collection form,
available on the website of MINAP,i stipulated that all hospitals use the following
types:
Discharge
diagnosis
1. Myocardial Infarction (ST elevation)
2. Myocardial Infarction (non ST
elevation)
3. Threatened MI
4. Acute Coronary Syndrome (troponin
positive)
5. Acute Coronary Syndrome (troponin
negative)
6. Chest pain of uncertain cause
7. Myocardial Infarction (unconfirmed)
8. Other diagnosis
10 Acute Coronary Syndrome (troponin
unspecified)
The definitions of the most relevant types of acute coronary syndrome to this
thesis were defined in MINAP thus:
• ST elevation myocardial infarction required the presence of
electrocardiographic changes of ST elevation consistent with infarction of
=>2mm in contiguous chest leads and/or ST elevation of =>1 mm ST
elevation in 2 or more standard leads.
i http://www.rcplondon.ac.uk/CLINICAL-
STANDARDS/ORGANISATION/PARTNERSHIP/Pages/MINAP-.aspx

91
• Non-ST elevation myocardial infarction required electrocardiographic
changes including new ST or T wave changes (except ST elevation)
and/or cardiac enzyme or troponin elevation (CK twice the upper limit of
the reference range; locally accepted cut off value for troponin).
• Acute coronary syndrome (troponin positive) was defined when there
were symptoms consistent with cardiac ischaemia with troponin release
with dynamic ECG changes consistent with fluctuating ischaemia.
• Acute coronary syndrome (troponin negative) was defined when there
were symptoms consistent with cardiac ischaemia without troponin
release with dynamic ECG changes consistent with fluctuating ischaemia.
I sought to check whether data in these types had been collected as stipulated
within the whole MINAP database.
I sought to do this by:
• cross-tabulation of the diagnoses with ensuing treatment strategy, which
are specific to each type of acute coronary syndrome;
• cross-tabulation with data on biochemical markers of myocardial
infarction, such as troponin, on which the definitions partly rely on.
Thus, the validity of types of acute coronary syndrome within the category of
final diagnosis could be achieved by comparison to other clinical assessments.
4.3.5.3.1 Final diagnosis and reperfusion strategy
I compared final diagnoses to final reperfusion strategy, as the vast majority of
STEMIs would have had thrombolytic treatment with a fibrinolytic drug to
reperfuse a completely occluded artery.
The table below (Table 12) shows that the majority of STEMIs received
thrombolytic therapy. Of those without a diagnosis of STEMI or NSTEMI, both
those with positive and negative troponins appropriately had very low numbers
of thrombolytics administered. An appropriately low percentage of NSTEMI had
reperfusion, though numbers were higher than in acute coronary syndrome

92
(troponin positive), probably as a result of inadvertent reperfusion, which is
more common in this group as their ECG changes may resemble STEMIs.
Final diagnosis Reperfusion
STEMI 21275 (86.4)
NSTEMI 2853 (11.6)
Acute Coronary Syndrome (trop+ve) 200 (0.81)
Acute Coronary Syndrome (trop-ve) 311 (1.3) Percentages in brackets
Table 12 MINAP - Final diagnosis against reperfusion treatment, in 2004
4.3.5.3.2 Final diagnosis and biochemical markers
I then examined troponin levels with the final diagnosis. I expected that STEMIs
would have the highest levels of troponin, followed by NSTEMIs, Troponin
positives and then troponin negative diagnoses to have a level near to zero. This
was confirmed in the following table:
Final diagnosis Mean troponin (SD) in ng/ml
STEMI 24.36 (22.8-26.0)
NSTEMI 10.50 (9.48-11.52)
Acute Coronary Syndrome (trop+ve) 2.91 (2.58-3.24)
Acute Coronary Syndrome (trop-ve) 0.11 (0.05-0.17)
Table 13 MINAP - Final diagnosis against troponin levels, in 2004
Thus, overall I found no significant measurement errors in the coding of ACS type
under the variable ‘final diagnosis’.
4.3.5.4 Cardiac biomarkers in MINAP
I sought to investigate the quality and validity of data on troponin, vital to the
types of ACS diagnosis, and which also allows quantification of severity of
disease, allowing further disaggregation of the heterogeneous entity that is ACS.
Data on biomarkers were collected as ‘elevated cardiac markers’ as well as actual
troponin level in the MINAP database.
I sought to:
• examine the degree of missingness for entry of the troponin field;
• test validity by tabulating peak troponin against the ECG findings
recorded on arrival.

93
Analyses showed that prior to 2003, there was a low rate of entry for troponin
which then improved 2004 onwards (Table 14) - this is most likely attributable
to the increasing use of troponin in hospitals. The field ‘elevated markers’ had
only 11.71% missing data, as pre-2003 entries would have included elevated CK.
The usage of CK started to diminish post-2003 to be replaced increasingly by
troponin. There was consistency observed in the levels of data entry in the fields
on troponin and also in the field elevated markers across years 2003-2006 (table
below).
Pre-03 2003 2004 2005 2006
N 2769 92,252 93,469 89,635 77,255
Troponin 39.11 18.69 18.52 19.71 16.18
Elevated markers 11.71 14.18 11.73 11.11 13.82 Figures are percentages apart from N
Table 14 MINAP - Proportions of data fields for cardiac marker with missing entries in
successive yearly datasets
I then tabulated peak troponin against the ECG findings recorded on arrival, as
higher troponin levels would be seen in those with ischaemic ECGs, and this was
confirmed in the table below:
ECG findings on arrival Peak troponin (mean, SD) in ng/ml
ST/T changes 17.8 (227)
normal/other 6.7 (229)
Table 15 MINAP - ECG findings on arrival against troponin levels, in 2004
4.4 Statistical power
The primary outcome for prognosis in this thesis was the comparative risk of
risk of death and non-fatal myocardial infarction between ethnic groups.
Examination for other outcomes (receipt of investigations, improvement in
symptoms) was exploratory and there is a lack of prior data in these outcomes
from other studies. Hence, as the magnitude and direction of difference (if any)
between the two ethnic groups were unknown for such outcomes, power
calculations using estimated relative risks were not possible.
On the combined endpoint of death and non-fatal myocardial infarction, there is
80% power at the P=0.05% level to detect a relative risk of at least 1.30 between
South Asian and White participants (chest pain clinic study), and 1.26 (ACRE

94
study) and 1.59 (Whitehall II) between South Asians and White participants,
assuming the annual event rates shown in Table 16. In MINAP, there is 90%
power at the P=0.05% level to detect a relative risk of at least 1.3 between
between South Asian and White participants for death. Statistical power is
largely determined by the number of events occurring in South Asian
participants and this exceeds 100 for each study.
Aetiologic study Prognostic studies
Whitehall I Chest pain clinic ACRE MINAP
Follow up until 2002 (14 yrs) 2004 (3 yrs) 2003 (7 yrs) 1 year
Estimated N events
in South Asians
121 174 181 300
Estimated annual
risk death / MI in
South Asians
1.5% 2% 6% 3% (risk of death
only)
Table 16 Estimated risk of outcomes in South Asian participants in the studies of this thesis
4.5 Conclusions
The four studies chosen to span the natural history of coronary disease and
prognostic risk, though different in their methodologies, stood up to scrutiny in
terms of data quality in order to examine the specific objectives of this thesis.

95
5 Incidence and prognosis of suspected angina in a healthy
population
5.1 Summary of chapter
Background The incidence of symptoms of stable angina in South Asian
populations is not known and the consistency of measurement of angina in them
has been questioned. This work sought to determine the incidence of typical
angina, exertional and non-exertional chest pain and subsequent coronary
prognosis in South Asian compared to White populations.
Methods A cohort study of 9775 (9195 White participants and 580 South Asian
participants) civil servants aged 35–55 years in 1985–8 with seven phases of
community follow-up over 18 years. Chest pain was categorised as typical
angina, exertional chest pain and non-exertional chest pain using the Rose
questionnaire. The prognostic outcome was a measure of coronary death and
non-fatal myocardial infarction at phase 7 (2003-2004).
Results The South Asian participants had higher cumulative frequencies of
typical angina by phase 7 (17.0% vs 11.3%, chi2=16.93, p<0.001) and exertional
chest pain (15.4% vs 8.5%, chi2= 31.06, p<0.001) compared to White
participants but less non-exertional chest pain (24.6% vs 31.3%, chi2=11.76,
p=0.001). In both ethnic groups, typical angina and exertional chest pain were
associated with increased rates of coronary events when compared to those with
no chest pain. Within those with any pain at baseline, South Asian participants
had a worse long-term prognosis than White participants (typical angina HR 2.56
(1.36-4.84)).
Conclusions South Asian participants had a higher incidence of typical angina
and exertional chest pain than White participants, and this was associated with
an increased subsequent rate of coronary death and myocardial infarction
compared to those with no chest pain. However, South Asian participants had a
worse long-term prognosis than White participants within all types of chest pain.

96
5.2 Introduction
Prospective studies in healthy individuals comparing South Asian to White
populations report a higher incidence of fatal outcomes122 and non-fatal
outcomes such as myocardial infarction.123 There are no studies comparing
incidence of angina among South Asian compared to White populations.145
Appropriate identification and management at early, incident symptomatic
presentations of coronary disease such as angina may prevent or at least delay
progression to more serious later-phase manifestations of coronary disease such
as myocardial infarction and ultimately coronary death.
However, South Asian people may report atypical features when presenting with
chest pain39 40 45 and angina measurement is reported to be inconsistent in South
Asian people using questionnaires.39 The comparative incidence of chest pain
symptoms in South Asian and White populations and subsequent implications on
prognosis has not been investigated in population-based studies.
5.3 Research objective to be investigated
This chapter sought to investigate specific research objective 1.
To determine the incidence and prognosis of angina in healthy South Asian and
White populations.
5.4 Specific research questions
i. What is the cumulative incidence of typical angina symptoms, exertional
chest pain, and non-exertional chest pain in South Asian compared to
White populations?
ii. What is the association with coronary risk factors with different forms of
chest pain in South Asian and White populations?
iii. What are the rates of subsequent prognostic outcomes (coronary death
and non-fatal myocardial infarction) of chest pain in South Asian and
White populations?

97
5.5 Methods
5.5.1 Population
The Whitehall-II study is a prospective cohort of non-industrial civil servants
aged 35–55 years who worked in the London offices of 20 civil service
departments at baseline (1985–1988). Clinical examinations and questionnaires
were administered at baseline, 1991–1993 (phase 3), 1997–1999 (phase 5), and
2003–2004 (phase 7), with questionnaires in 1989 (phase 2), 1995 (phase 4),
and 2001 (phase 6). By 18 years at phase 7, follow-up for the whole cohort was
67%. 10308 people were recruited, 3413 women and 6895 men. The
participants were all grades, from clerical and office support grades through
middle-ranking executive grades up to senior administrative grades, differing
widely in salary.
5.5.2 Ethnicity
Ethnicity was defined according to the Office for National Statistics 1991 census
types (appendix 13.1). Participants self-reported their ethnicity at phase 5, and
where this was missing, observer-assigned ethnicity from phase 1 was used.
There was strong agreement between data on observer-assigned ethnicity and
self-reported ethnicity - 93% of ascribed South Asian participants self-described
themselves South Asian, 99.3% of self-ascribed White participants described
themselves as White. Of the participants, 9195 were ascribed as White at phase 1
and 580 participants were grouped as South Asian.
5.5.3 Chest pain
At each of the seven phases over 18 years follow-up, symptoms of stable angina
pectoris were assessed using the Rose questionnaire (appendix 13.3). Chest pain
was defined in three mutually exclusive groups:
• “typical angina” if the pain was located over the sternum or in both the left
chest and the left arm, was precipitated by exertion, caused the person to
stop and went away in 10 minutes or less;
• ‘exertional chest pain”, based on the ‘possible’ classification as originally
proposed by Cook et al,146 being chest pain brought on by exertion but

98
not satisfying the additional criteria, such as location and relation to rest,
necessary for a diagnosis of typical angina;
• ‘non-exertional chest pain” was defined as those complaining of chest
pain that had no relation to exertion.
STATA do-file– generation of chest pain groups at phase 1
gen rosedefinite=1 if chpuph==1 & (chpact==1|chpact==2)& chpstop==1 & chptime==1 &
(chploc==1|chploc==2)
recode rosedefinite .=0
replace rosedefinite=. if chpuph==.
label variable rosedefinite "new phase 1 typical"
gen rosepossible=1 if chpuph==1 & rosedefinite==0
recode rosepossible .=0
replace rosepossible=. if chpuph==.
label variable rosepossible "new phase 1 exertional"
gen atypicalpain=1 if chpain==1 & rosepossible==0 & rosedefinite==0
recode atypicalpain .=0
replace atypicalpain=. if chpain==.
label variable atypicalpain "nonexetional phase 1"
gen chestpain=1 if atypicalpain==1
replace chestpain=2 if rosepossible==1
replace chestpain=3 if rosedefinite==1
replace chestpain=0 if chpain==2
label variable chestpain "0 none 1 non-exertional 2 exertional 3 typical"
9184 White participants and 577 South Asian participants had data on chest pain
at phase 1. By 18 year follow-up at phase 7, 41 South Asian participants and 525
White participants had died, and data on chest pain were available on 317 South
Asian participants and 6268 White participants. No differences in baseline risk
factor profile were found between those South Asian participants with follow-up
for chest pain at phase 7 and those without. The rate of chest pain non-response
on those who filled in the overall study questionnaire was low, inferring most of
loss to follow-up for chest pain response was as a result of those not filling in the
study questionnaire rather than not filling in the Rose angina section.
Baseline was defined as phases 1-3, as multiple reports of Rose angina are more
likely to indicate the presence of disease,147 and angina may come and go
depending on concomitant control of symptoms at time of assessment. Those
with typical angina at either phase 1, 2 or 3 were defined as baseline typical
angina. Baseline exertional chest pain was similarly defined using exertional

99
chest pain at either phase 1,2 or 3, having excluded those who had complained of
typical angina, and baseline non-exertional chest pain again was similarly
defined, having excluded those who had complained of typical angina or
exertional chest pain at one of the phases 1, 2 or 3.
STATA do-file– generation of baseline categories of chest pain, where z=phase 2, x=phase 3
gen earlytypical=1 if (chestpain==3|zchestpain==3|xchestpain==3)
recode earlytypical .=0
gen earlyexertional=1 if (chestpain==2|zchestpain==2|xchestpain==2)& earlytypical==0
recode earlyexertional .=0
gen earlyatypical=1 if (chestpain==1|zchestpain==1|xchestpain==1)& earlytypical==0 & earlyexertional==0
recode earlyatypical .=0
gen earlynopain=1 if (chestpain==0|zchestpain==0|xchestpain==0)& earlytypical==0 & earlyexertional==0
& earlyatypical==0
recode earlynopain .=0
5.5.4 Risk factors
At baseline, standardised assessments were made of smoking, hypertension
(blood pressure higher than or equal to 130/85 mmHg or on antihypertensive
medication), total cholesterol, body mass index (BMI), self reported diagnosis of
diabetes, and family history (in parents or siblings) of onset of coronary heart
disease before age 55 years. Metabolic syndrome was defined by the 2001
National Cholesterol Education Program Adult Treatment Panel-III criteria at
phase 3 by the presence of three or more of: central obesity, elevated fasting
blood triglycerides, reduced blood HDL cholesterol, elevated blood pressure,
elevated fasting glucose.148 This definition gave less emphasis to glucose
intolerance and acknowledged the importance of central obesity - it included the
presence of enlarged waist circumference in the set of diagnostic criteria for
metabolic syndrome. It is a widely-used definition, though may become
superseded by the more recently announced (2005) International Diabetes
Federation definition.j Validation of this measure is increasingly reported in the
literature.149
j This insists on the presence of waist circumference. This new definition also recommends using
ethnic-specific waist circumference cut-offs, and proposes a lower threshold for fasting blood
glucose.

100
Impaired glucose tolerance was defined as a fasting plasma glucose <7 mmol/l
and postloadk glucose≥ 7.8 mmol/l (140 mg/dl) and <11.1 mmol/l. Civil service
employment grade was used as a measure of socioeconomic position. On the
basis of salary and work role, the civil service defines a hierarchy of employment
grades, in three levels: unified grades 1-7 (high), executive officers (medium),
and clerical and support staff (low).
5.5.5 Follow-up
The outcome in prognostic analyses was a combined measure of coronary death
and non-fatal myocardial infarction by phase 7, the latest study phase for which
events data are available. 99% of participants were flagged for mortality at the
National Health Service Central Registry. Coronary death was defined by the
International Classification of Diseases-Ninth Revision (ICD-9) code 410–414.150
Based on all available data (from questionnaire, study ECGs, hospital acute ECGs
and cardiac enzymes), non-fatal myocardial infarction was defined following
MONICA criteria.l Classification of non-fatal myocardial infarction was carried
out blind to other study data independently by two trained coders, with
adjudication by a third in the (rare) event of disagreement.
5.5.6 Statistical analysis
Cumulative incidence was estimated with 95% confidence intervals of those who
complained of typical, exertional and non-exertional chest pain through the six
phases of the study following phase 1. Those who had complained for chest pain
at one phase were then not counted in following phases. For baseline
characteristics, continuous variables were presented as means with standard
deviation and proportions as percentages. These baseline clinical and socio-
demographic data were tabulated by ethnic group across types of chest pain, and
tested for age-adjusted linear trend across those types, in South Asian
k levels 2 hours after a 75-g oral glucose tolerance test
l The MONICA (Multinational MONItoring of trends and determinants in CArdiovascular disease)
Project was established in the early 1980s in many centres around the world to monitor trends in
cardiovascular diseases, and to relate these to risk factor changes in the population over a ten
year period.

101
participants and in White participants, using the χ2 test for linear trend for
proportions and the analysis of variance for trend for continuous variables.
The relative risk of future coronary death and non-fatal myocardial infarction
was examined among those with typical, exertional and non-exertional chest
pain on at least one of the first three phases compared to those with no chest
pain at any of these three early stages. Using the Cox’s proportional hazards
model, adjusted rates and 95% confidence intervals were calculated for
outcomes and adjusted for age, sex, hypertension, blood cholesterol, ex/current
smoker, BMI, diabetes, living alone, family history and grade at work. The
relative risk of future coronary death and non-fatal myocardial infarction of
South Asian versus White participants was calculated within each type of chest
pain.
All analyses were performed using STATA (version 10; StataCorp, College
Station, TX, USA).
5.6 Results
Irrespective of the type of chest pain, South Asian participants tended to be
older, less likely to have smoked, more likely to be hypertensive and diabetic,
more likely to live with a partner, have a higher prevalence of metabolic
syndrome and be in lower grades of work than White participants (Table 17).
Across the types of chest pain, there was an increasing prevalence of
hypertension and higher cholesterol levels and trends towards more
metabolic syndrome and higher body mass index with more typical chest
pain.

102
Ethnic group Whole cohort No chest pain Non-exertional
chest pain
Exertional chest
pain
Typical angina P for trend across
chest pain types
N South Asian
White
580
9195
312
5444
134
2619
73
587
58
534
Age in years
(mean, (SD))
South Asian
White
45.65 (5.72)
44.31 (6.08)
45.26(5.99)
44.36(6.10)
45.71(5.33)
43.77(5.94)
46.14(5.71)
44.70(6.19)
47.14(4.99)
45.90(6.11)
0.115
<0.001
Men
South Asian
White
357 (61.55)
6309 (68.61)
183 (41.35)
3591 (65.96)
100 (74.63)
2019 (77.09)
45 (61.64)
387 (65.93)
27 (46.55)
308 (57.68)
0.482
0.726
Ex/current smoker South Asian
White
190 (33.04)
4767 (52.28)
96 (31.17)
2700 (50.05)
50 (37.59)
1425 (54.77)
28 (38.36)
334 (57.29)
16 (27.59)
300 (56.93)
0.758
<0.001
Hypertensive
South Asian
White
70 (12.07)
714 (7.77)
32 (10.26)
410 (7.53)
11 (8.21)
168 (6.41)
10 (13.70)
52 (8.86)
16 (27.59)
83 (15.54)
0.002
<0.001
Cholesterol (mean (SD) in mmol/l)
South Asian
White
5.96 (1.24)
5.97 (1.16)
5.90(1.21)
5.94(1.18)
5.94(1.23)
5.94(1.12)
5.95(1.16)
6.09(1.19)
6.39(1.48)
6.19 (1.17)
0.052
<0.001
Hyperglycaemic
Diabetic
Impaired glucose tolerance
South Asian
White
South Asian
White
22 (3.84)
61 (0.67)
46 (7.93)
561 (6.10)
9(2.93)
38(0.70)
25(8.01)
327(6.01)
6(4.55)
14(0.54)
9(6.72)
157(5.99)
4(5.48)
3(0.52)
7(9.59)
37(6.30)
2(3.45)
6(1.13)
5(8.62)
40(7.49)
0.464
0.737
0.784
0.270
Metabolic syndrome
South Asian
White
66 (15.94)
754 (10.58)
34(15.89)
391(9.51)
15(14.71)
214(10.11)
6(11.76)
76(16.20)
11(23.40)
73(16.98)
0.516
<0.001
BMI
(mean (SD))
South Asian
White
24.44 (3.32)
24.55 (3.45)
24.26(3.42)
24.42(3.39)
24.64(3.14)
24.46(3.23)
24.49(2.93)
25.16(3.99)
24.84(3.71)
25.65 (4.01)
0.537
<0.001
Living with partner
South Asian
White
487 (84.26)
6766 (73.85)
256(82.58)
3995(73.61)
118 (88.06)
1987(76.22)
61(83.56)
403(69.01)
50(86.21)
375(70.36)
0.424
0.146
Family history
South Asian
White
227 (39.14)
3599 (39.14)
115(36.86)
2060(37.84)
52(38.81)
1029(39.29)
32(43.84)
247(42.08)
27(46.55)
259(48.50)
0.106
<0.001
Job grade -low South Asian
White
290 (50.00)
1733 (18.85)
158(50.64)
1095(20.11)
55(41.04)
377(14.39)
43(58.90)
124(21.12)
32(55.17)
128(23.97)
0.514
0.703
The categories of chest pain total 9184 White and 577 South Asian participants who had data on chest pain at phase 1. The whole cohort comprises the 9195 White participants at phase 1 and the 580 South Asian
participants. Data are n (%) unless otherwise specified. Test for trend is age-adjusted.
Table 17 Whitehall-II - Baseline characteristics in each chest pain type comparing South Asian and White participants

103
5.6.1 Incidence of different forms of chest pain by ethnic group
At baseline, South Asian participants had a higher prevalence of typical
angina compared to White participants (4.8% vs 2.8%, χ2= 5.50, p=0.019)
and exertional chest pain (7.8% vs 4.1%, χ2= 14.97, p<0.001) but not non-
exertional chest pain (22.2% vs 25.2%, χ2= 2.97, p=0.085), as depicted in
Figure 5. By phase 7, South Asian participants had higher cumulative
frequencies of typical angina (17.0% vs 11.3%, χ2=16.93, p<0.001) and
exertional chest pain (15.4% vs 8.5%, χ2= 31.06, p<0.001) compared to White
participants but less non-exertional chest pain (24.6% vs 31.3%, χ2=11.76,
p=0.001).
(Cumulative % with 95% CI bars)
Figure 5 Whitehall-II – Cumulative incidence of different types of chest pain by ethnic group
over seven study phases

104
5.6.2 Prognosis of chest pain
During the mean follow-up of 15.1 years, 367 incident cases of total coronary
events (49 in South Asian participants) occurred among the total cohort of
participants who had been free from any coronary event at baseline. In the
whole cohort, the South Asian participants was more likely than White
participants to sustain the endpoint of coronary death and non-fatal
myocardial infarction (HR in South Asian participants compared to White
participants 2.22 (95% CI 1.59-3.09) adjusted for age, sex, hypertension,
blood cholesterol, ex/current smoker, overweight, diabetes, living alone,
family history and grade at work).
5.6.2.1 Prognosis within ethnic groups of those with pain compared to those with no
chest pain
In both South Asian and White participants, those with baseline typical
angina and exertional chest pain had a worse prognosis for the long-term
coronary outcome compared to those with no baseline chest pain (in South
Asian participants with typical angina (adjusted HR 4.67 (95% CI 2.12-
10.30),Table 18). However, both South Asian and White participants who
complained of baseline non-exertional chest pain did not have a worse
prognosis compared to those who complained of no chest pain (in South
Asian participants adjusted HR 1.34 (95% CI 0.56-3.22), Table 18).
5.6.2.2 Prognosis within types of pain for South Asian compared to White populations
Within those with typical angina at baseline, South Asian participants had a
worse long-term prognosis than White participants (HR 2.56 (95% CI 1.36-
4.84),Table 18). The South Asian participants also had a worse long-term
prognosis than the White participants within the whole cohort (HR 2.22
(95% CI 1.59-3.09)) and in those with non-exertional chest pain, and there
was a similar suggestion in those with exertional chest pain. There were no
ethnic differences in long-term prognosis in the bigger group of participants
that had no chest pain at baseline.
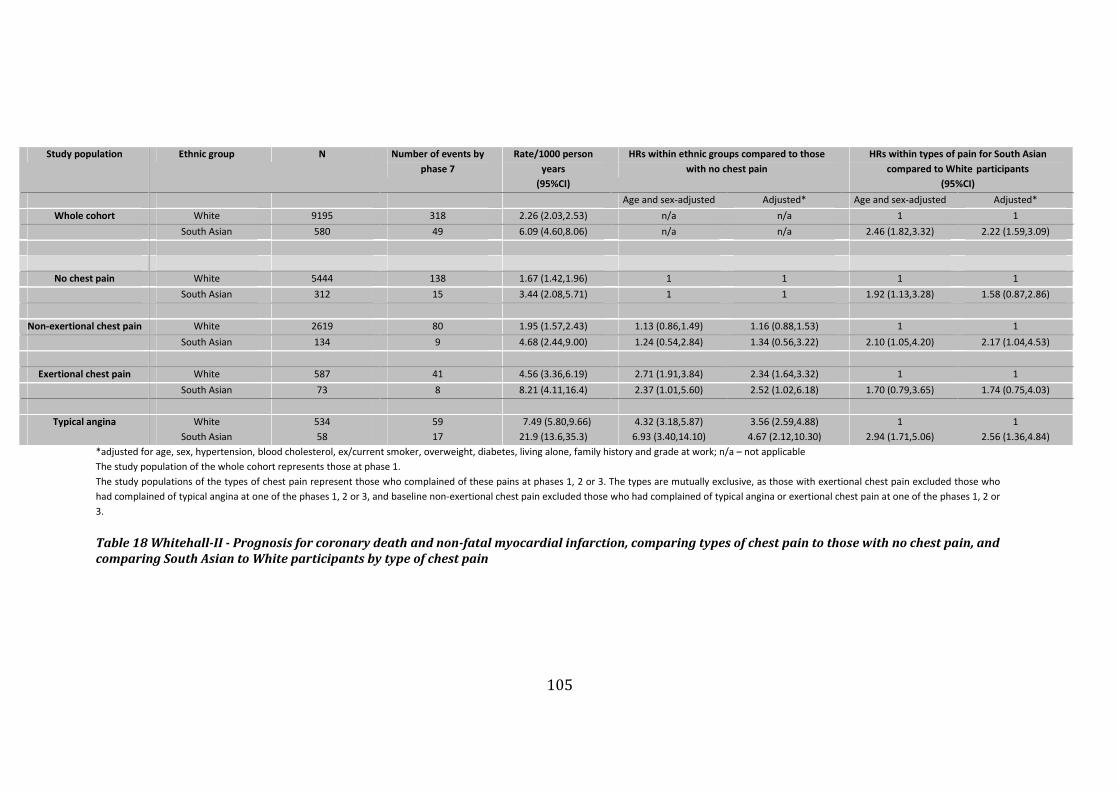
105
Study population Ethnic group N Number of events by
phase 7
Rate/1000 person
years
(95%CI)
HRs within ethnic groups compared to those
with no chest pain
HRs within types of pain for South Asian
compared to White participants
(95%CI)
Age and sex-adjusted Adjusted* Age and sex-adjusted Adjusted*
Whole cohort White 9195 318 2.26 (2.03,2.53) n/a n/a 1 1
South Asian 580 49 6.09 (4.60,8.06) n/a n/a 2.46 (1.82,3.32) 2.22 (1.59,3.09)
No chest pain White 5444 138 1.67 (1.42,1.96) 1 1 1 1
South Asian 312 15 3.44 (2.08,5.71) 1 1 1.92 (1.13,3.28) 1.58 (0.87,2.86)
Non-exertional chest pain White 2619 80 1.95 (1.57,2.43) 1.13 (0.86,1.49) 1.16 (0.88,1.53) 1 1
South Asian 134 9 4.68 (2.44,9.00) 1.24 (0.54,2.84) 1.34 (0.56,3.22) 2.10 (1.05,4.20) 2.17 (1.04,4.53)
Exertional chest pain White 587 41 4.56 (3.36,6.19) 2.71 (1.91,3.84) 2.34 (1.64,3.32) 1 1
South Asian 73 8 8.21 (4.11,16.4) 2.37 (1.01,5.60) 2.52 (1.02,6.18) 1.70 (0.79,3.65) 1.74 (0.75,4.03)
Typical angina White 534 59 7.49 (5.80,9.66) 4.32 (3.18,5.87) 3.56 (2.59,4.88) 1 1
South Asian 58 17 21.9 (13.6,35.3) 6.93 (3.40,14.10) 4.67 (2.12,10.30) 2.94 (1.71,5.06) 2.56 (1.36,4.84)
*adjusted for age, sex, hypertension, blood cholesterol, ex/current smoker, overweight, diabetes, living alone, family history and grade at work; n/a – not applicable
The study population of the whole cohort represents those at phase 1.
The study populations of the types of chest pain represent those who complained of these pains at phases 1, 2 or 3. The types are mutually exclusive, as those with exertional chest pain excluded those who
had complained of typical angina at one of the phases 1, 2 or 3, and baseline non-exertional chest pain excluded those who had complained of typical angina or exertional chest pain at one of the phases 1, 2 or
3.
Table 18 Whitehall-II - Prognosis for coronary death and non-fatal myocardial infarction, comparing types of chest pain to those with no chest pain, and
comparing South Asian to White participants by type of chest pain

106
5.6.3 Mortality of whole cohort
Overall incident coronary and cardiovascular mortality was higher in South
Asian participants than among White participants, but all-cause mortality was
not higher in South Asian participants than among White participants (Table 19).
Overall incident coronary events (coronary death and non-fatal myocardial
infarction) was higher in South Asian participants than among White
participants.
Outcome Ethnic
group
Subjects Number of
events
(To Sep 04)
Rate/1000
person
years
Age-adjusted
hazard ratio
(95%CI)
P value
White 9189 525 (5.7%) 3.33 1 All – cause
mortality South Asian 577 41 (7.1%) 4.16 1.13 (0.82-1.55)
0.456
White 9184 140 (1.5%) 0.89 1 Cardiovascular
death South Asian 577 23 (4.0%) 2.34 2.34 (1.50-3.64)
<0.001
White 9184 80 (0.9%) 0.51 1 Coronary death
South Asian 577 21 (3.6%) 2.13 3.73 (2.30-6.03)
<0.001
White 9164 318 (3.5%) 2.23 1 Coronary death
and NFMI South Asian 576 49 (8.5%) 5.86 2.62 (1.94-3.54)
<0.001
Table 19 Whitehall-II – Incidence of whole cohort for differing outcomes, comparing South
Asian to White participants
5.7 Discussion
5.7.1 Objective addressed
I found a higher cumulative incidence of typical angina and exertional chest pain
in South Asian participants compared to White participants, in a study of almost
10000 people with detailed characterisation of symptoms of stable angina using
the Rose questionnaire at seven time-points over 18 year follow-up. I found that
in both South Asian and White participants, typical angina and exertional chest
pain at baseline were strongly associated with increased rates of coronary events
when compared to those with no chest pain, but that those with non-exertional
chest pain did not have a worse prognosis compared to those with no chest pain.
Thus, the Rose questionnaire was valid in predicting prognosis in the South
Asian participants. The overall cohort revealed worse prognosis in South Asian
participants compared to White participants and that within types of pain, all
types of chest pain tended to predict a more adverse prognosis in South Asian

107
participants. South Asian participants with no chest pain at baseline were not at
higher long-term risk than the White participants with no chest pain at baseline.
5.7.2 The burden of symptoms and their prognostic validity in South Asian
populations
The diagnosis of angina is perceived to be more difficult in the South Asian
population as they are often labelled as having ‘atypical’ pain when presenting
with ischaemia.40 Though angina on Rose questionnaire predicts mortality in
European populations,151 its consistency in South Asian populations has been
questioned in a cross-sectional study39 and no studies have examined its ability
to predict long-term coronary events in patients of South Asian origin. I now
show here that cumulative incidence of typical angina as ascertained by Rose
questionnaire is higher in South Asian compared to White participants, and that
this angina has an adverse prognosis in both White and South Asian participants
compared to those with no chest pain. Non-exertional chest pain was not higher
in baseline prevalence or in cumulative incidence in South Asian compared to
White participants. It was not associated with coronary events in either ethnic
group when compared to those with no chest pain. These results suggest that the
Rose angina questionnaire can, in both South Asian and White populations,
discriminate between prognostically significant chest pain and chest pain that
does not result in adverse cardiac outcomes.
5.7.3 The prognosis of chest pain symptoms in South Asian compared to White
populations
South Asian participants had a worse long-term prognosis than White
participants within the whole cohort and within all types of chest pain, and
though there appeared to be no ethnic differences in long-term prognosis in the
bigger group of participants that had no chest pain at baseline, it is conceivable
that a lack of power may hide a worse prognosis in South Asian participants even
in this group (HR 1.58 95% CI (0.87-2.86)).
Thus, though South Asian participants with non-exertional pain are at relatively
less risk than those South Asian participants with typical angina, the finding that
South Asian participants have a worse long-term prognosis than White
participants within all types of chest pain (exertional chest pain not being

108
significant, though this may reflect lack of power) may be a reflection of their
overall higher incidence of fatal coronary disease, and of non-fatal myocardial
infarction. Thus the presence of non-exertional pain at baseline may be unrelated
to these later events, as it does not constitute an incident coronary event as such.
Using the definitions of baseline chest pain in Whitehall-II illustrates the
difficulty in defining an incident event, and hence in the calculation of prognosis.
Phase 1 represents a point in time in the life of the participants, by which time
some of the cohort may already have had chest pain prior to being included in
the study. To truly detect the prognosis of incident angina requires a cohort in
which recruitment of all participants occurs at the first time they complain of
chest pain. Whitehall-II, as a prospective cohort study of healthy individuals, was
primarily suited to the study of cumulative incidence following recruitment.
Richer data on how coronary risk factors were managed in primary care may
also explain prognostic patterns. It is conceivable that South Asian participants
with non-exertional pain were at higher risk than White populations with non-
exertional pain due to differences in risk factor profile and their management of
them in primary care. The clinical careers of people with angina evolve over
time, punctuated by changes in morbidity and in healthcare response. The
Whitehall II study, in common with other population based studies, is not able to
characterise the detailed history of appropriateness of each management step in
this career.
Finally, the use of the measures of chest pain at baseline for prognosis between
ethnic groups may be inaccurate due to small numbers. Only 58 South Asian
participants had typical chest pain at phases 1, 2 or 3 and this renders prognostic
analyses comparing them with White participants with typical chest pain less
precise.
5.7.4 Relation with clinical presentation and diagnosis and implications for
clinicians
A higher incidence of angina among South Asian participants is consistent with
their higher incidence of fatal coronary disease, and of non-fatal myocardial
infarction. These results have implications on workload for primary care doctors,

109
chest pain clinics and secondary care investigation resources in areas of high
concentrations of South Asian people. Adequate allocation of appropriate
healthcare resources on a population level in such areas will be necessary,
especially as the current rate of decline of angina prevalence is much lower
compared to the more marked decline observed for mortality from myocardial
infarction.152
The prospective validity of the Rose questionnaire in South Asian populations for
the prediction of adverse coronary events in those with typical angina compared
to those with no chest pain highlights the importance of making the correct
diagnosis from symptoms. It has been previously shown in this cohort that
people reporting angina symptoms, but without a diagnosis, were at increased
risk of death and poor subsequent physical functioning than those who did not
report symptoms.153 I was unable to extend this to my analyses due to low
numbers of South Asian participants diagnosed with angina. Conceivably, those
with typical angina who had been diagnosed with angina would do better than
those with typical angina as yet undiagnosed.
5.7.5 Limitations
A strength of this work is that no previous cohort has reported on differences
between South Asian and White populations in repeat measures of a
standardised assessment of chest pain symptoms over long-term follow up.
However, the 2003 Health Survey for England revealed that though the
prevalence of angina in Pakistani men was significantly higher than the general
population, this was not the case for Indian and Bangladeshi men.58 The
Whitehall-II study comprised mainly Indian people (74%, with 13% Sri Lankan,
10% Pakistani, and 3% Bangladeshi) and thus may underestimate the overall
future risk of coronary disease for ‘South Asians’ if baseline levels of coronary
disease are lower than a more representative South Asian population. This
heterogeneity within the South Asian group could not be accounted for in our
study. However, the Whitehall-II study, from previously published reports on
baseline characteristics comparing its South Asian and White participants is,62 in

110
its marked social and ethnic differences in coronary heart disease, broadly
comparable to other studies in the South Asian population in the UK.
5.7.6 Implications
This study reports a higher incidence of angina in South Asian participants,
though the aetiology of this is not possible to investigate with this dataset.
Diabetes is likely to contribute to the higher incidence of coronary disease in
South Asian people and cumulative prevalence of diabetes in this study was
significantly higher in South Asian than White participants (10.5% v 2.7% by
phase 7). Using such a study design, with serial measures of chest pain in a
cohort of diabetics would allow further investigation into the aetiology of angina.
Improved resolution of angina as an epidemiological variable will also allow its
increased use as a non-fatal outcome. More long term prospective studies of
chronic symptomatic conditions are needed, as increasingly these conditions
represent the bulk of where coronary disease presents, shifting away from
presenting acutely to secondary care. A better understanding of angina,
increasingly the most common initial symptomatic manifestation of coronary
disease,29 will encourage better coding of this early clinical manifestation of
coronary disease in primary care databases.
5.8 Conclusions
I have demonstrated here that South Asian people have a higher incidence of
typical angina over long-term follow-up compared to White people, but that they
did not have a higher incidence of chest pain that was non-exertional in nature.
Typical angina as measured by the Rose angina questionnaire had a worse
prognosis for coronary death and non-fatal myocardial infarction, but non-
exertional chest pain did not in both South Asian and White people, when
compared to those with no chest pain. My findings demonstrate that South Asian
people have an increased incidence of prognostically-significant angina
compared to White people.
5.9 Building to next chapter
I have shown that typical angina, as measured using the Rose questionnaire, is
common in South Asian people and that both South Asian and White populations

111
with typical angina have a higher risk of adverse coronary outcomes than in
those with no chest pain.
The Whitehall-II cohort is an observational cohort of mainly healthy participants
with no account possible for the interaction of the participants with healthcare
services. The Whitehall-II study pre-dates the widespread introduction of rapid
access chest pain clinics in the UK and was an observational study with no
intervention planned. My analyses showed that within all those with chest pain
irrespective of type, South Asian people had a worse long-term prognosis than
White people. However, whether a more equitable outcome of incident angina in
South Asian and White populations would occur if assessed in a health care
facility is not known.
For the next stage of this thesis, I planned to investigate the presentation,
management and prognosis of this early stage of coronary disease at a rapid
access chest pain clinic. These clinics are designed from the outset to assess
those with recent-onset chest pain, and hence provide a source of incident
symptoms. I wanted to continue to examine the theme of typicality of pain by
ethnic group, and examine its prognosis as it presented to the clinical
environment, and thus to examine how the typicality of pain between ethnic
groups influence clinical management. Early and appropriate identification of
angina will result in early and appropriate clinical management, and this will in
turn affect prognosis.
The Rose questionnaire is a tool used mostly in epidemiological research, and
often through self-report rather than direct interview. In the chest pain clinic, the
patient presents with symptoms to the doctor. They are directed towards
describing their chest pain using specific descriptors when questioned by the
doctor seeing them. The doctor typically asks the patient about four components
of the chest pain they are presenting with: character, site, duration and
precipitating factors. I now aimed to quantify this verbal history and assess how
such words were different between ethnic groups and whether these words,
used in diagnosis, had any prognostic significance.

112
6 Prognosis of incident typical and atypical chest pain
6.1 Summary of chapter
Background South Asian people have been reported as being more likely than
White people to report atypical angina yet less likely to undergo coronary
angiography to investigate angina. This work sought to determine whether
atypical symptoms of angina in South Asian populations predicted clinically
important outcomes and influenced receipt of appropriate clinical management.
Methods 2189 South Asian participants (980 women) and 5605 White
participants (2676 women) with new-onset chest pain of median age 54 (IQR 44-
64) were prospectively recruited from six rapid access chest pain clinics in the
UK and followed up for death due to coronary disease or admission with acute
coronary syndrome over a mean of 5.0 years. Participants were also followed up
for receipt of coronary angiography and revascularisation.
Results Atypical chest pain was reported by South Asian participants more than
White participants (59.9% vs 52.5%, p<0.001). Typical symptoms were
predictive of a diagnosis of angina across ethnicity. Typical symptoms compared
to atypical symptoms were associated with the coronary outcome in both South
Asian and White participants (HR 1.58 (1.14-2.18), South Asian). In those with
typical symptoms, South Asian participants were more likely to experience the
coronary outcome (HR 1.41, 95% CI 1.04–1.91) but were less likely to receive
angiography (HR 0.52 (95% CI 0.41-0.67; p<0.001) and revascularisation than
White participants.
Conclusions Typical chest pain compared to atypical chest pain was as likely to
be associated with a worse prognosis in South Asian as in White populations.
Systematic and potentially inequitable differences in management between
ethnic groups could not be explained by differences in presentation of
symptoms.

113
6.2 Introduction
South Asian people39-41 and other minority ethnic groups42 43 with suspected
ischaemia are more likely to report atypical features of chest pain. The
description of symptoms, articulated by patients and recorded by doctors,
remains a cornerstone of diagnosing stable angina pectoris, yet descriptions
have been largely derived and validated against White men.34
South Asian people are less likely than White people to undergo coronary
angiography to investigate angina.61 It has been proposed that differences in how
patients describe their symptoms may contribute to inequalities in medical
care,40 63 because the diagnostic validity of symptoms plays an important role in
deciding appropriate clinical management.47
The previous chapter showed both South Asian and White populations with
typical angina had a higher risk of adverse coronary outcomes than in those with
no chest pain, and that South Asian people with chest pain may have a worse
prognosis than White people. To examine the prognosis of true incident angina
between South Asian and White populations ideally requires a cohort in which
recruitment of all participants occurs at first onset of chest pain, and which takes
into account the description of symptoms articulated.
6.3 Research objective to be investigated
This chapter sought to investigate specific research objective 2.
To determine in those presenting with incident chest pain whether differences
exist in the description of symptoms between South Asian and White
populations, and the association of symptom descriptors with prognosis and
receipt of management strategies for chronic coronary disease.
6.4 Specific research questions
To:
i. Is the description of angina pain as typical or atypical associated with
coronary outcomes in White and South Asian populations?

114
ii. Are differences in how populations of White and South Asian origin
report their symptoms related to their ensuing clinical management?
6.5 Methods
6.5.1 Population
11082 consecutive participants with recent-onset chest pain recruited in six
rapid access chest pain clinics in the United Kingdom from 2 January 1996 to 31
December 2002 constituted the study population. These ambulatory care clinics
are run by cardiology teams and accept same day referrals from family doctors of
those in whom incident angina pectoris is suspected. Participants who had
previously been investigated or diagnosed with coronary disease, or in whom
acute, or unstable coronary syndromes were suspected were not eligible for
referral to these clinics. Data were electronically recorded by the cardiologist
using identical databases. Of those participants with no previous history of chest
pain (n= 9518), I excluded re-attendances during the study period (n=448),
participants without chest pain (n=291), participants diagnosed with acute
coronary syndromes on the day of visit (n=246) and participants who reported
previously diagnosed coronary heart disease or revascularisation procedure
(n=579) so as to include incident chest pain patients only. I excluded participants
with missing clinical and demographic data (n=501), participants for whom a
diagnosis was either not entered (n=132) or not identified as angina or non-
cardiac chest pain (n=83, e.g. having other diagnoses such as pericarditis) and
those who were not traced by the Office for National Statistics or the National
Health Service-wide clearing system (n=40).
Of the remaining 8762 participants with complete data and follow-up, I analysed
the 7794 participants with an ethnic code of White or Asian (excluding 968 from
other ethnic groups), which constituted the study group (Figure 6).

115
Figure 6 Chest pain clinic study - Recruitment of participants
Participants seen in rapid access chest pain clinics (n=11082)
Excluded (n = 1564)
• Previous coronary artery disease or revascularisation (n = 579)
• Diagnosed with acute coronary syndromes on the day of the visit (n = 246)
• Previous visit to a rapid-access chest pain clinic during the study period (n = 448)
• No chest pain (n = 291)
First presentation with chest pain (n = 9518)
Excluded (n = 756)
• Missing clinical or demographic data (n = 501)
• No diagnosis entered (n = 132)
• Pain not diagnosed as angina or non-cardiac chest pain (n = 83)
• Not tracked by the Office for National Statistics or the National Health Service-wide
clearing system (n = 40)
Participants with a complete dataset (n = 8762)
Excluded (n = 968)
• Ethnic background other than White or South Asian
Participants included (n = 7794; 5605 White, 2189 South Asian)

116
6.5.2 Ethnicity
The cardiologist ascribed ethnicity as “Asian”, “White”, “black” or “other” during
the consultation. In a validation study within the Newham chest pain clinic, I
found that of 34 consecutive participants (25 South Asian), 88% self-assigned
their ethnicity using the 2001 census classification in line with the assessment of
the cardiologist (kappa statistic 0.766).
6.5.3 Risk factors and treatment strategy
Data on smoking status (no, ever/current), history of hypertension, history
hypercholesterolemia/cholesterol level, history of diabetes and cardiac
medication (aspirin, β-blocker, statin, nitrate, nicorandil, calcium-channel
antagonist, ACE (angiotensin-converting enzyme) inhibitor) were recorded by
the cardiologist and exercise electrocardiogram testing was performed if deemed
appropriate by the cardiologist.
6.5.4 Descriptors of chest pain
Whilst taking the history from the participant, cardiologists recorded a
descriptor for each of the following four components of chest pain:
• character (aching, constricting, stabbing, nondescript)
• site (central, left-sided, right-sided, submammary, epigastric, other)
• duration (seconds, < 5 minutes, 5–15 minutes, 15–30 minutes, hours or
variable)
• precipitating factors (none, exercise, exercise and rest, stress, eating,
other).
Health advocates trained to support the needs of those whose first language was
not English were available if the participant did not attend with English-speaking
friends/family members. For each component, one descriptor was selected from
a drop-down menu (Table 20). Based on the Diamond-Forrester classification,34 I
considered typical pain to be that which the participant described as having a

117
constricting quality, being located centrally or on the left-side (which may have
included radiation of the pain to the left shoulder or arm, a typical characteristic
in some with angin) of the chest, lasting between a few seconds and 15 minutes,
and being provoked by exercise (table below).
Table 20 Chest pain clinic study - Descriptors of four components of chest pain used by
cardiologists and classification of their typicality
I used a “symptom score” to classify the participant’s description of pain as:
• typical (3 or more characteristics of typical pain) or
• atypical (2 or fewer characteristics).
The cardiologist also made a personal assessment of the participant’s overall
symptoms as typical or atypical (“cardiologist summary”). At the end of the
consultation, using information from other sources such as the full clinical
Typical Atypical
Central √
Left sided √
Right sided √
Sub-mammary √
Epigastric √
Site
Other √
Nothing √
Exercise √
Exercise and rest √
Stress √
Eating √
Precipitating factor
Other √
Aching √
Constricting √
Stabbing √
Character
Nondescript √
Seconds √
<5 minutes √
5-15 minutes √
15-30 minutes √
Duration of episodes
Hours/variable √

118
history, clinical examination and exercise electrocardiography, the cardiologist
diagnosed the cause of the participant’s chest pain as either angina or non-
cardiac chest pain.
STATA do-file – generation of symptom score
gen typloc=1 if cplocation==1|cplocation==2
gen typdur=1 if cpduration==3|cpduration==2
gen typprec=1 if cpprovocation==2|cpprovocation==3
gen typqual=1 if cpquality==3
recode typloc .=0
recode typdur .=0
recode typprec .=0
recode typqual .=0
gen typacc=typloc+typdur+typprec+typqual
gen typicality=1 if typacc>=3
replace typicality=0 if typacc<3
label variable typicality " 1 typical 0 atypical"
6.5.5 Follow-up
Using unique National Health Service numbers, the study was able to monitor
mortality among participants by use of data from the Office for National
Statistics. The cohort was able to monitor hospital admissions, coronary
angiography and revascularisation by use of the national Hospital Episode
Statistics, supplied by the National Health Service Wide Clearing System.
Successful matching was achieved for 99.5% of the cohort. Causes of death and
admission to hospital were coded according to the International Classification of
Diseases, 10th revision (ICD-10).
The combined primary outcome was death from coronary artery disease (ICD-10
codes I20-I25) and hospital admission due to an acute coronary syndrome (acute
myocardial infarction, ICD-10 codes I21-I23) or unstable angina (ICD-10 codes
I20.0–120.9, 124.0, I24.8, I24.9) within five years. The management outcomes
were receipt of coronary angiography as a confirmatory diagnostic test and
subsequent coronary revascularisation (either percutaneous coronary
intervention or coronary artery bypass surgery, whichever was first) within
three years of a clinic visit.

119
6.5.6 Statistical analysis
When examining baseline clinical and chest pain characteristics, age was
presented as a median with the inter-quartile range and compared between
groups using Student’s t-test, whilst proportions were compared using the χ2-
statistic. To examine the probability of receiving a diagnosis of angina according
to exercise ECG result, cardiologist summary or symptom score, likelihood ratios
were used with 95% confidence intervals by ethnicity to test the likelihood that a
positive exercise ECG or typical cardiologist summary or typical symptom score
would be expected in a participant given a diagnosis of angina by the
cardiologist. When calculating likelihood ratios for cardiologist summary and
the symptom score, those participants with a positive exercise ECG were
excluded (182 South Asian participant, 668 White participants) so as to remove
the potential influence a positive exercise ECG may have on formulating a
diagnosis of angina. To examine the prognostic validity of cardiologist summary
and symptom score on coronary outcome, adjusted Cox proportional hazards
regression were conducted by ethnicity. A hazard ratio less than 1 represents a
better prognosis. Adjusted Cox proportional receipt of coronary angiography and
revascularisation in those that had presented with typical descriptors and in
those with atypical descriptors. In these analyses, a hazard ratio less than 1
represents a lower likelihood of receiving the procedure. Adjustments were
made using age (as a continuous variable), sex, diabetes, smoking, hypertension,
anti-anginal medication (β-blocker, calcium-channel antagonist, oral nitrate,
nicorandil), secondary prevention medication (aspirin, statin, ACE inhibitor),
revascularisation (PCI or CABG) and exercise ECG result (positive or negative).
6.6 Results
In total, the cohort included 7794 participants: 2676 White women, 2929 White
men, 980 South Asian women and 1209 South Asian men. From tTable 21, South
Asian women and men were younger than their White counterparts, with lower
levels of smoking but a higher prevalence of diabetes mellitus.

120
Women Men
S Asian (n=980) White (n=2676) p South Asian (n=1209) White (n= 2929) p
Age in yrs, median(IQR) 50.6 (42-58) 57.6 (49-67) <0.001 49.8 (41-59) 54.7 (45-65) 0.001
Risk factors Smoker 35 (3.6%) 683 (25.5%) <0.001 320 (26.3%) 924 (31.6%) 0.001
Diabetes 209 (21.3%) 165 (6.1%) <0.001 219 (18.1%) 207 (7.1%) 0.001
Hypertension 367 (37.5%) 1017 (38.0%) 0.759 365 (30.2%) 875 (29.9%) 0.840
Medication Secondary prevention aspirin 232 (23.7%) 843 (31.5%) <0.001 328 (27.1%) 1028 (35.1%) <0.001
statin 61 (6.2%) 371 (13.9%) <0.001 117 (9.7%) 445 (15.2%) <0.001
ACE inhibitor 62 (6.3%) 171 (6.4%) 0.944 83 (6.9%) 213 (7.3%) 0.644
Anti-anginals β Blocker 155 (15.8%) 557 (20.8%) 0.001 214 (17.7%) 701 (23.9%) <0.001
Calcium antagonist 99 (10.1%) 474 (17.7%) <0.001 102 (8.4%) 537 (18.3%) <0.001
Oral nitrate 67 (6.8%) 229 (8.6%) 0.091 94 (7.8%) 300 (10.2%) 0.014
Nicorandil 3 (0.3%) 38 (1.4%) 0.005 9 (0.7%) 60 (2.1%) 0.003
Central 402 (41.0%) 1592 (59.5%) 450 (37.2%) 1728 (59.0%)
Left sided 404 (41.2%) 583 (21.8%) 560 (46.3%) 804 (27.5%)
Right sided 40 (4.1%) 56 (2.0%) 50 (4.2%) 86 (2.9%)
Sub-mammary 64 (6.5%) 223 (8.3%) 103 (8.5%) 149 (5.1%)
Epigastric 69 (7.0%) 218 (8.2%) 44 (3.61%) 158 (5.4%)
Site
Other 1 (0.1%) 7 (0.3%) <0.001 2 (0.2%) 4 (0.1%) <0.001
Nothing 603 (61.5%) 1399 (52.3%) 765 (63.3%) 1524 (52.0%)
Exercise 173 (17.7%) 752 (28.1%) 216 (17.9%) 958 (32.7%)
Exercise and rest 142 (14.5%) 340 (12.7%) 164 (13.6%) 288 (9.8%)
Stress 29 (3.0%) 121 (4.5%) 27 (2.2%) 94 (3.2%)
Eating 32 (3.3%) 60 (2.2%) 34 (2.8%) 60 (2.1%)
Precipitating factor
Other 1 (0.1%) 4 (0.2%) <0.001 3 (0.3%) 5 (0.2%) <0.001
Aching 325 (33.2%) 1059 (39.6%) 407 (33.7%) 1110 (37.6%)
Constricting 230 (23.5%) 762 (28.5%) 295 (24.4%) 884 (30.2%)
Stabbing 269 (27.5%) 558 (20.9%) 303 (25.1%) 623 (21.3%)
Character
Nondescript 156 (15.9%) 297 (11.1%) <0.001 204 (16.9%) 322 (11.0%) <0.001
Seconds 39 (4.0%) 147 (5.5%) 69 (5.7%) 236 (8.1%)
<5 minutes 156 (15.9%) 513 (19.2%) 230 (19.1%) 627 (21.4%)
5-15 minutes 226 (23.1%) 699 (26.0%) 269 (22.5%) 733 (25.0%)
15-30 minutes 123 (12.6%) 259 (9.7%) 129 (10.7%) 282 (9.6%)
Participant pain
descriptors
Duration of episodes
Hours/variable 436 (44.5%) 1058 (39.5%) 0.001 512 (42.0%) 1051 (35.9%) <0.001
Investigations Exercise ECG Positive 56 (12.8%) 200 (13.2%) 0.499 126 (17.3%) 468 (24.0%) 0.001
Typical 163 (16.6%) 647 (24.2%) 193 (16.0%) 834 (28.5%) Cardiologist summary
Atypical 817 (83.4%) 2044 (75.8%) <0.001 1016 (84.0%) 2095 (71.5%) <0.001
Typical 386 (39.4%) 1243 (46.5%) 492 (40.7%) 1509 (51.5%)
Symptom
assessment
Symptom score
Atypical 594 (60.6%) 1433 (53.6%) <0.001 717 (59.3%) 1420 (48.5%) <0.001

121
Table 21 Chest pain clinic study - Baseline data and chest pain characteristics, comparing
participants of South Asian origin with those of White origin by sex
(previous page)
6.6.1 Chest pain descriptors
South Asian participants of both sexes were more likely to report atypical
descriptors compared to White participants (Table 21). Their pain was less
associated with exercise, more stabbing or non-descript than constricting and
more likely to last hours or variable periods when compared to White
participants. Though left-sided pain was included as typical in the symptoms
score as it may code for the very typical sensation of chest pain radiating to the
left arm, South Asian participants had chest pain that tended to be more left-
sided than central. As left pain was not coded separately as left chest or left arm,
it is not possible to discern whether this left chest pain is mostly atypical or
mostly radiated typical pain in South Asian participants, though the pattern of
results from the other descriptors hints to the former. Overall, atypical chest pain
was reported by more South Asian participants than White participants (59.9%
v. 52.5%, p<0.001). South Asian participants of both sexes were more likely to
have their symptoms described as atypical by the cardiologist, and less likely to
be given a diagnosis of angina by the cardiologist. There was 73.3% agreement
(kappa statistic 0.43) between the cardiologist summary and symptom score.
6.6.2 Symptoms and diagnosis
Neither sex nor ethnicity modified the association between the exercise ECG
result and the diagnosis of angina, with high likelihood ratios (Figure 7) across
sex and ethnicity. Hence, typical symptoms strongly predicted a positive exercise
ECG result. After excluding patients with a positive exercise ECG which would
have strongly influenced a diagnosis of angina, both the cardiologist summary
and the symptom score of typical symptoms were still predictive of a diagnosis
of angina across sex and ethnicity. Likelihood ratios were lower for the symptom
score compared with cardiologist summary but remained well above 1.0.

122
Figure 7 Chest pain clinic study - Likelihood that exercise ECG result, cardiologist summary
or symptom score leads to a diagnosis of angina, by sex and ethnicity
6.6.3 Symptoms and their validity in predicting prognosis
The overall prognosis for the combined coronary outcome in the cohort was no
worse in South Asian compared to White participants (adjusted for age, sex,
diabetes, smoking, hypertension and hypercholesterolaemia, HR 1.04 (95% CI
0.75-1.45)).
Typical symptoms predicted coronary outcome in South Asian participants as
well as in White participants, using both the cardiologist summary and symptom
score (Table 22).

123
Chest pain assessment Chest pain description Risk of coronary
death or ACS
Typical Atypical HR* P**
Cardiologist summary South Asian 64/356 100/1833 1.97 (1.38-2.81)
White 223/1481 151/4124 2.41 (1.91-3.05)
0.353
Symptom score South Asian 97/878 67/1311 1.58 (1.14-2.18)
White 261/2663 113/2942 1.62 (1.29-2.05)
0.902
Coronary outcome - death due to coronary heart disease or acute coronary or hospital admission with unstable angina
*Hazard ratio for typical vs atypical (95%CI) adjusted for age, sex, diabetes, hypertension, smoking and revascularisation
** P for difference between two hazard ratios154
Table 22 Chest pain clinic study - Typical compared to atypical chest pain as a predictor of
coronary outcome in South Asian and in White participants
Within both those with typical symptoms and atypical symptoms, South Asian
participants were no more likely to suffer the coronary outcome than White
participants on unadjusted survival curves (Figure 8, unadjusted log rank test
p=0.53 in typical category, p=0.88 for atypical).
Figure 8 Chest pain clinic study - Typicality of chest pain according to symptom score
comparing South Asian to White participants and cumulative probability of coronary
death/ACS
Within those with typical symptoms, on examining adjusted Cox regression
hazard ratios (Table 23) to take into account differences in baseline risk profile,
South Asian participants with typical pain were as likely as White participants
with typical pain to experience a coronary outcome for cardiologist summaries

124
(HR 1.27, 95% CI 0.89–1.81) and more likely with symptom scores (HR 1.41,
95% CI 1.04–1.91). Atypical pain had a similar prognostic value for coronary
outcomes in South Asian participants compared to White participants. There was
no interaction between sex and ethnic background (likelihood ratio for
interaction: typical pain p=0.34; atypical pain p=0.76).
South Asian vs. White Hazard ratio (95% CI)*
Coronary
Angiography*
Revascularisation* Coronary death or
ACS**
Typical
Cardiologist summary 0.58 (0.45-0.75) 0.52 (0.36-0.75) 1.27 (0.89-1.81)
Symptom score 0.52 (0.41-0.67) 0.53 (0.38-0.74) 1.41 (1.04-1.91)
Atypical
Cardiologist summary 0.55 (0.38-0.78) 0.61 (0.35-1.05) 1.38 (0.94-2.02)
Symptom score 0.59 (0.39-0.88) 0.49 (0.24-1.00) 1.19 (0.73-1.92)
Coronary outcome - death due to coronary heart disease or acute coronary or hospital admission with unstable angina
* Adjusted for age, sex, diabetes, smoking, hypertension, secondary prevention/anti-anginals and exercise ECG result
** Adjusted for age, sex, diabetes, smoking, hypertension, secondary prevention medication, revascularisation and
exercise ECG result
Table 23 Chest pain clinic study - Type of chest pain (typical and atypical) and subsequent
receipt of angiography, receipt of revascularisation and prognosis in South Asian compared
to White participants
6.6.4 Symptoms and their relation to clinical management
South Asian participants with typical or atypical pain were less likely than White
participants with typical or atypical pain respectively to receive angiography and
revascularisation (Table 23-typical symptom score, adjusted HR for angiography
0.52, 95% CI 0.41–0.67; adjusted HR for revascularisation 0.53, 95% CI 0.38–
0.74). The adjustments were designed to be appropriate for the management
outcome – the use of anti-anginal medication specifically important in progress
to angiography and revascularisation. Further analyses showed that these
results were also independent of whether or not the cardiologist had made the
diagnosis of angina – by including only those in whom the diagnosis of angina
was made, South Asian participants with typical pain were still less likely than
White participants with typical pain to receive angiography and
revascularisation (typical cardiologist summary, adjusted HR for angiography

125
0.59, 95% CI 0.45–0.76; adjusted HR for revascularisation 0.49, 95% CI 0.34–
0.72).
Revascularisation rates were higher among patients who reported typical
symptoms than among those who reported atypical symptoms (women, adjusted
HR for revascularisation 3.86, 95% CI 2.35–6.35; South Asian participants,
adjusted HR 3.16, 95% CI 1.93–5.19).
6.6.5 The impact of diagnosis on prognosis
In both those diagnosed with angina and those not, the overall prognosis for
coronary death in the cohort was no worse in South Asian participants
compared to White participants (diagnosed as angina, HR 1.20 (95% CI 0.88-
1.64) adjusted for age, sex, diabetes, smoking, hypertension, secondary
prevention and exercise ECG result).
6.6.5.1 The symptom score
I defined typical pain as three or more of these characteristics and atypical pain
two or fewer (the ‘symptom score’) to make a binary descriptive variable of
chest pain. I did not analyse as per the three types initially described by Diamond
and Forrester (non-cardiac, atypical, typical) even though the data collection
form did allow the cardiologist to assess the symptoms as non-cardiac, atypical
and typical. Investigating these categories, ‘atypical’ behaved similarly to ‘non-
cardiac’, as those with atypical pain did not have higher hazard ratios for risk of
coronary outcome compared to ‘non-cardiac’ (Table 24). The Diamond and
Forrester classification is rarely used by cardiologists, most preferring to assess
typical or atypical in the real-world clinical setting. Hence, I used a binary
symptom score.
Male Female
Cardiologist
assessment
symptoms
South Asian
(n=1219)
White
(n=2959)
South Asian
(n=986)
White
(n=2704)
Non-cardiac 1 1 1 1
Typical 3.28 (1.42-7.58) 7.04 (2.81-17.67) 8.90 (0.92-86.43) 5.04 (1.76-14.41)
Atypical 1.19 (0.57-2.52) 1.57 (0.61-4.05) 4.85 (0.59-39.70) 1.11 (0.37-3.35)
Table 24 Chest pain clinic study - Non-cardiac compared to typical and atypical chest pain as
a predictor of coronary outcome in South Asian and White participants by sex

126
In the initial exploration of the database, I tried to ascertain whether individual
descriptors within the components of chest pain might be markers of prognosis
(e.g. central chest pain alone). However, numbers within each descriptor type
were too small and from a clinical point of view, most cardiologists tend to build
a picture of typicality of symptoms from a constellation of features rather than
one feature itself. My early analyses did however show me the validity of the
Diamond and Forrester classification (Table 25). When examining character,
constricting descriptors had a worse prognosis than aching, stabbing and non-
descript. Similarly, descriptors that were central in location and precipitated by
exercise had the worse prognosis within their components of chest pain.

127
Male Female
South Asian (n=1219) White (n=2959) South Asian (n=986) White (n=2704)
Aching 0.36 (0.15-0.82) 0.55 (0.33-0.91) - 0.71 (0.36-1.41)
Stabbing 0.53 (0.25-1.15) 0.32 (0.16-0.66) - 0.36 (0.13-0.95)
Constricting 1 1 1 1
Character
Nondescript 0.78 (0.36-1.69) 0.48 (0.22-1.01) - 1.02 (0.45-2.31)
Central 1 1 1 1 Site
Left sided 0.60 (0.33-1.09) 0.55 (0.32-0.95) 0.84 (0.24-2.91) 0.37 (0.16-0.88)
Nothing 1 1 1 1
Exercise 2.85 (1.41-5.75) 3.77 (2.33-6.12) 2.85 (0.48-17.11) 8.86 (3.90-20.14)
Precipitating factor
Exercise and rest 1.91 (0.89-4.09) 2.90 (1.45-5.79) 5.63 (1.34-23.76) 5.63 (2.10-15.15)
Seconds
1-5 minutes
5-15 minutes
15-30 minutes
Duration
Hours/ Variable
Numbers too small for analysis
Unadjusted hazard ratios (95%CI); HR>1 indicates poorer prognosis.
Table 25 Chest pain clinic study – Individual chest pain descriptor and risk of coronary outcome in South Asian and White participants by sex

128
6.6.5.2 Symptoms and risk factors in prediction of prognosis
I examined further the effect of high coronary risk (having two or more of the risk
factors: smoking, hypertensive, diabetic, or hypercholesterolemia) versus low
coronary risk on outcomes in the whole cohort. High coronary risk was a predictor
of outcomes in the whole cohort of coronary outcome as would be expected (age
and sex-adjusted HR 1.41 (1.08-1.85). Limiting analyses to South Asian
participants with atypical pain, high coronary risk compared to low coronary risk
remained a predictor of outcomes (age and sex-adjusted HR 3.22 (1.22-8.55)). This
was rendered non-significant on adjustment for receipt of secondary prevention
therapy but not coronary revascularisation (Table 26). Thus in South Asian people
with a profile of high coronary risk but with atypical pain, management should be
concentrated on secondary prevention not revascularisation. The symptom score
thus highlights to the general practitioner those people irrespective of ethnic
group, in whom referral to a chest pain clinic is appropriate.
Adjusted for age
and sex
Adjusted for age,
sex and
revascularisation
Adjusted for age,
sex and secondary
prevention
South Asian person
with atypical pain
3.22 (1.22-8.55) 2.82 (1.05-7.56) 2.49 (0.91-6.85)
Coronary outcome - death due to coronary heart disease or acute coronary or hospital admission with unstable angina
*Hazard ratio for typical vs atypical (95%CI) adjusted for age, sex or ethnicity, diabetes, hypertension, smoking and
revascularisation
High coronary risk = two or more of the risk factors: smoking, hypertensive, diabetic, or hypercholesterolemia
Table 26 Chest pain clinic study - High coronary risk compared to low coronary risk in South
Asian participants with atypical pain as a predictor of coronary outcome, adjusted for
management strategy
6.7 Discussion
6.7.1 Objective addressed
In a study of over 7000 consecutive participants presenting to a rapid access chest
pain clinic with detailed data on symptom characterisation, typical chest pain
compared to atypical chest pain was as likely to be associated with a worse
prognosis in South Asian as in White participants. South Asian participants with
prognostically significant angina pectoris did not present atypically. Systematic
and potentially inequitable differences in management between ethnic groups

129
could not be explained by differences in presentation of symptoms. The overall
prognosis for coronary death in the cohort was no worse in South Asian compared
to White participants.
The central diagnostic cannon of stable angina34 for the last three decades, which
has assessed pre-test probability of coronary disease using symptom typicality, age
and sex, has now had its contemporary validity in South Asian people
demonstrated by this study.
6.7.2 Symptoms in South Asian people
I found that typical symptoms were predictive of a diagnosis of angina across
ethnicity. Furthermore, typical symptoms were predictive of coronary outcomes in
South Asian participants when they were compared to atypical presentations.
Although South Asian participants attending the chest pain clinic did report a
marked excess of atypical symptoms, the rate of subsequent adverse coronary
outcomes in this group was similar in White and South Asian participants. Since
both doctors and patients may be aware that in the general population coronary
heart disease mortality is higher in South Asian people,10 155 my findings might be
explained by a lower threshold for referral of South Asian people from primary
care to a chest pain clinic with any chest pain symptoms, hence reversing the
possibility of selection bias favouring white patients. Indeed, a previous survey
found some evidence that South Asian people with chest pain may be more willing
to seek care.41
These results contrasted with the Whitehall-II findings that revealed a worse
prognosis in South Asian compared to White populations within each type of chest
pain. Whitehall-II was a healthy population rather than clinical cohort, and thus it
is conceivable that those South Asian participants with typical angina in the early
stages of Whitehall-II went undiagnosed and hence unmanaged. Furthermore, a
chest pain clinic provides a more reliable measure of incidence, as it is designed to
capture recent-onset chest pain which Whitehall-II was not. The chest pain clinic,
with its detailed coding of the description of symptoms by cardiologists in a clinic
designed for capturing incident angina, shows that incident atypical chest pain in

130
South Asian participants does not have a worse prognosis than in White
participants.
Chest pain characteristics, and their perception, have been compared in different
ethnic groups.42 43 South Asian, compared to White populations, report a higher
likelihood of seeking care.41 African-American people may be more likely to
attribute their symptoms to a non-cardiac source than White people but were not
more likely to have atypical symptoms in a prospective study based in an
emergency department.156 African-American people have also been reported to
complain more of shortness of breath than White people when presenting for
coronary angiography.157
6.7.3 Typicality of symptoms and other explanations for inequalities in
management
I found lower rates of coronary angiography and revascularisation among South
Asian participants compared with White participants. This could not be fully
explained by the presence of typical or atypical symptoms, as even South Asian
participants with typical pain were less likely to undergo diagnostic and
therapeutic invasive procedures. Studies of inequalities in invasive management of
angina among South Asian people have lacked details about pain symptoms. It is
also unlikely that differences in symptom severity explain this under-management
because functional impact and tendency to seek care are higher among South Asian
people with chest pain.41
South Asian and White people may differ in their understanding of the risks and
benefits of revascularisation. Written communication in English, waiting lists, and
repeated out-patient assessments may represent barriers for South Asian people
trying to negotiate the administrative hurdles towards revascularisation. Ethnic
groups may also differ in willingness to undergo revascularisation, with studies
from the United States reporting that Black and White people have different
preferences for treatment.158
Unmeasured factors may account for the under-management observed. The degree
of co-morbidities was not well-captured on this database and referral selection

131
may depend on interactions between co-morbidities. As an example, patients with
aortic valve stenosis causing chest pain would have been more likely to be referred
for cardiac catheterisation but less so as renal function progressively declines due
to perceived surgical operative risk. Further social factors such as employment,
language barriers, and patient preferences were not available as measures in these
data. The cohort did not have data on refusal of revascularisation, nor on the
efficacy of ensuing medical treatment with anti-anginal drugs alone. The factors
comprising angiography decision making are thus complex, prognostically
important, and often immeasurable.
6.7.4 Clinical implications of history taking
A history of typical symptoms was based solely on pre-defined response types to
four questions – character, site, duration and precipitating factors. Typical pain
was associated with a diagnosis of angina and worse prognosis for coronary
outcomes in South Asian participants compared to those with a history of atypical
symptoms. This symptom score could potentially be quickly elicited from a history
taken by the general practitioner in order to decide upon referral to a chest pain
clinic in the place of more detailed risk scores. The cardiologist summary
demonstrated stronger associations with a diagnosis of angina, or risk of coronary
outcomes on follow-up, than did the symptom score. This may reflect the
incorporation of risk factor information, and clinical experience into the estimate
of pre-test disease likelihood. Though weaker, the simpler symptom score
remained predictive of outcomes. This will encourage the general practitioner that
a simple and quick history eliciting these descriptors of chest pain is an effective
means to determining the appropriateness for referral to a cardiologist
irrespective of ethnicity. This work helps to guide the general practitioner that the
management of the patient with atypical pain but multiple coronary risk factors is
to focus on the risk factors, not the atypical pain.
6.7.5 Limitations
A major strength of this study is the detailed description of chest pain among a
large number of participants with recent onset symptoms, without previous
investigation, myocardial infarction or revascularisation, at the interface of

132
primary and secondary care. The high proportion of South Asian participants in
the study reflects the high concentration of South Asian people in the areas where
the chest pain clinics were located, and thus gives a realistic picture of likely
disease burden and potential demand on healthcare services in areas with a high
proportion of South Asian people in the local population.
Several limitations should however be considered in interpreting these findings.
First, the recorded history may have been biased by the knowledge of the exercise
ECG findings; for this reason, I excluded those with an abnormal exercise ECG
when assessing diagnosis of angina.
Second, the category of South Asian encompasses different language, religions and
cultural groups, amongst whom cardiovascular risk profile differ.20 Further
research is required to test whether symptom validity differs between
Bangladeshi, Indian, Pakistani or Sri Lankan people.
Third, data were not available on the findings of subsequent coronary angiography
if it took place. As revascularisation is largely driven by the severity of
angiographic disease, this data may have in part explained why revascularisation
was not undertaken in some.
Fourth, though data entry for smoking status, history of hypertension and diabetes
and medication were 100% complete, history of hypercholesterolemia was
unknown in 68.49% of the cohort and 78.4% did not have a cholesterol level -
hence this variable was not entered into the multi-variate analyses by symptom
category model. Adding hypercholesterolemia or statin therapy into the prognostic
multi-variate analyses symptom category did not significantly alter the direction
nor strength of the hazard ratios.
Finally, when examining prognosis for coronary death in South Asian compared to
White participants by chest pain symptoms category, increased power would have
excluded a differential outcome between ethnic groups more confidently. With all
four summary estimates for the coronary outcome to the right of 1 (Table 23), it

133
may be that lack of power hides worse outcomes for South Asian participants
irrespective of presenting symptomatology similar to that observed in Whitehall-II.
6.7.6 Implications
Better coding of the symptoms articulated by the patient with chest pain may aid
in the diagnostic process for angina. A potential limitation of this quantitative
study is that the actual words used by patients, their meaning and context were
not reported. This was addressed in an ethnographic qualitative study of 59 clinic
consultations performed alongside this study by colleagues at the Newham site to
understand how the chest pain classification and diagnosis were reached.159 They
found that symptom histories represented a complex negotiation between
cardiologist and patient, with much ambiguity and re-telling. There was little
evidence that this negotiation was patterned by sex or ethnicity. Importantly, none
of the South Asian patients in this study relied on translators; the minority who
needed help with English were accompanied by a younger family member. This
work relied on the pre-specified coding in the database; it is likely that doctors
may record in free text further relevant details of symptoms pertinent to the
diagnosis of angina. Electronic processing of this natural language might aid the
identification of patients with angina,160 though this would be dependent on
adequate documentation of the history by the doctor.
6.8 Conclusions
South Asian people with typical chest pain were found to be at increased risk of
adverse coronary outcomes compared with those who presented with atypical
pain. South Asian people with prognostically important angina pectoris did not
present atypically, and differences in symptom description did not account for
their lower rates of coronary angiography and revascularisation compared with
White people. Thus, symptoms of chest pain are valid diagnostic and potentially
important prognostic tools across ethnic backgrounds. Further study should
examine why South Asian people with the same prognosis as White people receive
poorer care.

134
6.9 Building to next chapter
I have shown that typical angina in South Asian populations, when ascertained by
the words articulated by a patient to a specialist doctor, was valid in predicting a
poorer prognosis than chest pain that is less typical of angina. By building a simple
measurement tool from the clinical history, I used facets from normal clinical
practice to show that history-taking is as valid in South Asian people as it is in
White people, and that atypical chest pain, commoner in South Asian people, has a
better prognosis than typical angina.
Overall prognosis in South Asian compared to White populations was not worse in
this cohort. This contrasts with the findings of Whitehall-II, which demonstrated a
worse prognosis in South Asian people compared to White people in all types of
chest pain. Hence, the results of analysing this cohort, at the first stage of contact
with the health services along the natural history of coronary disease, demonstrate
that early clinical assessment may be able to delay the natural course of coronary
disease. However, there are no randomised trials comparing this rapid access chest
pain clinic model for the assessment of undifferentiated chest pain to older models
of healthcare such as the out-patient cardiology service to definitively prove this.
However, under-treatment still prevailed in this cohort. The next stage of this
thesis sought to study patients with chronic chest pain in need of specialist
secondary care management. I wanted to continue to investigate prognosis, but
examine both non-fatal and fatal outcomes. Specifically, I wanted to move onto
symptomatic prognosis. If prognosis for fatal events in incident angina is relatively
equitable between ethnic groups presenting to a chest pain clinic, I sought to
investigate whether similar equity existed in how chronic angina improved with
management strategies instigated in secondary care. Such symptomatic, non-fatal
outcomes are important to the quality of life of the patient with chronic symptoms
as well as to providing an overall picture of prognosis of coronary disease in South
Asian compared to White populations. I will thus – in addition to prognosis for
serious coronary clinical events such as myocardial infarction and death, now
examine symptomatic prognosis.

135
7 Symptomatic outcomes following coronary angiography in
patients with chronic stable angina
7.1 Summary of chapter
Background In patients with angina, the overall prognosis for coronary death is
no worse in South Asian compared to White populations. However, it is not known
whether there are disparities in symptomatic outcomes between South Asian and
White populations from clinical management strategies in those with angina.
Methods Six-year prospective cohort study to determine whether improvement of
angina symptoms differs between South Asian and White patients following
revascularisation or medical management.
Results 43.9% of South Asian patients reported improvement in angina at six
years compared with 60.3% of White patients (age-adjusted odds ratio 0.56, 95%
CI 0.41-0.76, OR adjusted for diabetes, hypertension, smoking, number of diseased
vessels, left ventricular function and social class 0.59, 95% CI 0.41-0.85). Similar
proportions of White and South Asian patients underwent percutaneous coronary
intervention (PCI) (19.6% vs 19.9%) and coronary artery bypass surgery (CABG)
(32.8% vs 30.1%). South Asian patients were less likely to report improved angina
after PCI (OR 0.19, 95% CI 0.06-0.56) or CABG (OR 0.36, 95% CI 0.17-0.74). There
was less evidence of ethnic differences in angina improvement when treatment
was medical (OR 0.87, 95% CI 0.48-1.57).
Conclusions South Asian patients had poorer symptomatic prognosis following
coronary angiography, being less likely to experience long-term improvements in
angina than White patients after receipt of revascularisation. That prognosis for
fatal events is no worse in South Asian populations but that prognosis for
morbidity outcomes may be worse than in White populations adds to the overall
picture of prognosis for coronary disease between these ethnic groups.
136
7.2 Introduction
Angina is the most common initial manifestation of coronary heart disease,29 a
significant burden in primary care31 and has considerable economic implications.32
The Health Survey for England on minority health reported that the prevalence of
angina pectoris may be higher in South Asian people.161 In these patients with
exertional angina, prognosis for outcomes such as myocardial infarction and death
is not improved by coronary revascularisation.
The previous chapter showed that, in patients with incident angina, the overall
prognosis for coronary death was no worse in South Asian compared to White
populations. It also found lower rates of revascularisation among South Asian
patients compared with White patients. If revascularisation appears most suited
for rapid symptom control rather than in improving prognosis for fatal outcomes,
to fully examine prognosis of coronary disease in South Asian patients compared
with White patients requires the study of symptomatic outcomes for those with
angina.
Ethnic disparities in clinical outcomes following revascularisation have been
reported in African-Americans.71 There is little evidence on morbidity outcomes in
South Asian patients compared with White patients following presentation with
angina, such as change in symptoms following treatment, and whether differing
strategies of clinical management equally improve symptom burden by ethnic
groups.
7.3 Research objective to be investigated
This chapter sought to investigate specific research objective 3.
To determine impact on symptomatic prognostic outcomes (change in angina
severity) in South Asians and White populations from different management
strategies for chronic angina.

137
7.4 Specific research questions
i. Does the improvement of angina differ between South Asian and White
patients six years following coronary angiography?
ii. Do differing treatment modalities affect improvement of angina
differentially by ethnic group?
iii. Do South Asian and White patients appropriate for revascularisation report
improved angina at six years?
7.5 Methods
7.5.1 Population
4121 consecutive patients were eligible for inclusion in the ACRE
(Appropriateness of Coronary Revascularisation) study if they underwent
coronary angiography at the Barts and London Hospitals Trust, London between
15 April 1996 and 14 April 1997. There were no exclusion criteria and written
informed patient consent was obtained.
7.5.2 Ethnicity
Self-assigned ethnicity was based on the 1991 census classification by
questionnaire on the day of index coronary angiography and identified 424 South
Asian patients. For patients with missing data, given and family names were cross
matched on a database of 15 000 names used to identify South Asian patients in
routine data from east London.141 This database identified a further 78 South Asian
patients. This system was considered valid because the name database is highly
specific (99%); the name assigned and self-assigned methods identified similar
proportions of South Asian people (15.6% and 12.8%, respectively) and confining
the analyses to those with self assigned ethnicity did not affect the results.
7.5.3 Assessment of angina status at baseline and follow-up
7.5.3.1 Canadian Cardiovascular Society classification angina
On the day of index coronary angiography, patients completed a questionnaire
about their general health, coronary heart disease risk factors and angina

138
symptoms (data available for 3301/4020, 82% response rate) using the Canadian
Cardiovascular Society classification.
Canadian Cardiovascular Society Functional Classification of Angina
Class Activity Evoking Angina Limits to Physical Activity
I Prolonged exertion None
II Walking > 2 blocks or > 1 flight of stairs Slight
III Walking < 2 blocks or < 1 flight of stairs Marked
IV Minimal or at rest Severe
2833 of the 4020 (70%) had data on both CCS angina and ethnicity.
At follow-up, all patients who were alive and had consented to follow-up were sent
a questionnaire asking about their angina (mean date 1st October 2002, response
rate 78%). CCS for angina class was available at both baseline and follow-up in
1508 White patients and 196 South Asian patients (Figure 9). The patients’ general
practitioners were also sent a questionnaire at time of follow-up asking whether
the patient had a current diagnosis of angina in order to cross-check patient
questionnaire responses for angina.

139
Figure 9 ACRE - Recruitment of patients with chest pain data
at baseline and follow-up
Eligible patients identified
undergoing angiography
Consent obtained and
Baseline data collected
Patients with CCS and ethnic group at baseline
n = 2833/4020 (70%)
Patients with CCS at 6-year follow-up
n = 1704 /2182 (78%)
SOUTH ASIAN
n = 196
WHITE
n = 1508
Died
n = 651
(South Asian 64, White 587)

140
At follow-up (Table 27), presence of angina on CCS classification (I-IV) was
associated with general practitioner diagnosis of angina in both White (χ2=105,
p<0.001) and South Asian patients (χ2=4.0, p=0.045). CCS was also strongly
associated with nitrate prescription (χ2=114 in White patients, 15.3 in South
Asian patients, p<0.001 in both ethnic groups).
Ethnicity CCS class
(angina)
N Nitrate
prescription
P N GP diagnosis
of angina
p
White 0 (no) 592 162(27.36) <0.001 590 70(11.86) <0.001
I-IV (yes) 727 412(56.67) 720 264(36.67)
South Asian 0 (no) 44 6 (13.64) <0.001 43 9 (20.93) 0.045
I-IV (yes) 98 47 (47.96) 97 37 (38.14)
(%)
Table 27 ACRE - Presence of angina or not by CCS in White and South Asian patients at
follow-up cross-tabulated to data on nitrate prescription GP diagnosis of angina on general
practitioner questionnaire at follow-up
It has also previously been reported in this cohort that CCS class was linearly
associated with angiographic findings, revascularisation rates, mortality and
nonfatal myocardial infarction.57 In age-adjusted analyses, a higher CCS class was
associated with an increased number of diseased vessels and worse left
ventricular function. After adjusting for age, sex, smoking, history of
hypertension, diabetes, number of diseased vessels, left ventricular function, use
of aspirin, beta-blockers or statins, and revascularisation status (for death and
nonfatal myocardial infarction), a higher CCS class was linearly associated with
higher coronary angioplasty (P<0.001) and bypass graft (P=0.03) rates, and
higher all-cause mortality and nonfatal myocardial infarction (P<0.001; CCS IV
versus I: hazard ratio 2.44, 95% CI 1.46 to 4.09).
7.5.3.2 Rose angina questionnaire
Cardiac symptoms using questions derived from the Rose angina questionnaire
were also sought. However, the completion rate was significantly lower than for
CCS in both ethnic groups (60% in South Asian patients, 69.8% in White
patients).

141
7.5.4 Baseline clinical details
On the day of coronary angiography, eligible patients were identified by
examination of ward admission and catheter laboratory logbooks. Data were
extracted on clinical presentation, present medications, past history of diabetes,
smoking and hypertension, family history of coronary disease (heart attack,
angina or sudden cardiac death in parent/sibling aged under 60), occupation (to
assign social class according to the Registrar General’s classificationm) and
education from case notes by trained nurses using standardised recording forms.
The number of diseased vessels at angiography was calculated from the severity
of disease in each of 27 coronary artery segments (as defined by the Coronary
Artery Surgery Study162). Left ventricular function was assessed by
ventriculography.
7.5.5 Appropriateness ratings
A nine member expert panel (four cardiologists, three cardiothoracic surgeons, a
general doctor, and a primary care doctor) was convened to rate the
appropriateness of PCI and CABG. Using a technique developed by the RAND
corporation in the USA,59 the expert panel rated 2178 mutually exclusive
indications for coronary angiography. A specific indication was defined by logical
combinations of clinical presentation, test results, and current treatment. Median
scores ranged from 1-9, with 1-3 being inappropriate, 4-6 uncertain, and 7-9
appropriate. Angiography was "inappropriate" when risks exceeded benefits and
m An official scheme of class analysis used in British surveys and censuses, though increasingly
being supplanted by newer classifications. It grouped occupations into five socio-economic
classes with the implication that occupation was a meaningful indicator of social welfare.
I Professional occupations—e.g. doctors and lawyers.
II Managerial and lower professional occupations—e.g. managers and teachers.
IIIN Non-manual skilled occupations—e.g. office workers.
IIIM Manual skilled occupations—e.g. bricklayers, coalminers.
IV Semi-skilled occupations—e.g. postal workers.
V Unskilled occupations—e.g. porters, dustmen.

142
"uncertain" when benefits and risks approximated equality or when the expert
panel was divided in its judgement.
7.5.6 Angiographic findings
These were obtained from the free text angiogram report held in the case notes
and coded blind to the clinical details by a trained coder. The number of diseased
vessels was calculated from the severity of disease as defined by the Coronary
Artery Surgery Study.162 163
7.5.7 Follow up for mortality and hospitalisation
At baseline, 99% of patients were flagged for mortality by the Office for National
Statistics and were followed up until 14 October 2003. Patients were flagged
with the National Health Service-Wide Clearing Service for all-cause hospital
inpatient admissions since the date of their index coronary angiogram until 1st
October 2002, matched on NHS number, or date of birth, postcode and sex.
Details on hospital admission such as revascularisation procedures and non-fatal
myocardial infarction (ICD-10 code 121) were collected from case notes and
from the Patient Administration Systems from the 13 referring hospitals.
7.5.8 Statistical analysis
To measure course of angina, follow-up angina score was subtracted from
baseline angina score (both 0 to +4). Then, the change in angina was coded as
0 if angina class had not changed or worsened from baseline to follow-up
(-4 to 0), and
1 (+1 to +4) if angina had improved.
STATA do-file – generation of angina change
gen diff_angina=pccs-ccscoded
gen change_angina=diff_angina
recode change_angina -4/0=0 1/4=1
label var change_angina "change in angina status"
label define change_angina 0 "worse/none" 1 "improved"
where
pccs= CCS angina at baseline
ccscoded=CCS angina at follow-up

143
All covariates that were significantly associated with change in angina in the
univariate analysis were included in the main analysis. Logistic regression
analysis was conducted to examine the relationship between ethnicity and
change in angina class. The likelihood ratio test was used to select covariates for
the final model (at a threshold of p<0.1). Findings are presented as odds ratios
with 95% confidence intervals. Survival analysis was performed to examine the
association of change in angina class and death. Kaplan Meier curves were
plotted as a measure of absolute risk and Cox proportional hazards regression
conducted for relative risk differences. Confounders included in the Cox
regression were hypertension, smoking, number of diseased vessels, left
ventricular function and social class.
7.6 Results
7.6.1 Baseline correlates of angina
In order to validate the measure of angina across both ethnic groups, I examined
angina class versus baseline variables. South Asian patients with worse angina
(higher angina class) were more likely to smoke, have lower mean systolic blood
pressure, be in a lower social class, have a higher body mass index, have a history
of heart failure, and have a higher doctor-defined angina class (Table 28). White
patients with worse angina revealed similar trends, and were in addition more
likely to have diabetes, a history of myocardial infarction and be on calcium
antagonists, nitrates or ACE inhibitors. There was no evidence of any significant
differences between the trends in White patients and the trends in South Asian
patients (p for interaction column).

144
Table 28 ACRE - Baseline characteristics in each angina class, in South Asian and White patients
Ethnic group South Asian White
CCS class I
(N=10)
III
(N=71)
III
(N=128)
IV
(N=125)
P for trend I
(N=166)
III
(N=446)
III
(N=685)
IV
(N=905)
P for trend P for
interaction
Age (mean, years) 56.2 54.0 55.9 56.5 0.150 58.4 60.3 61.5 61.8 <0.001 0.998
Men 7 (70) 52 (73) 106 (83) 93 (74) 0.905 139 (84) 324 (73) 518 (76) 590 (65) <0.001 0.089
Ever smoked 2 (22) 29 (42) 60 (48) 65 (56) 0.014 113 (69) 306 (70) 488 (73) 674 (77) 0.001 0.217
Hypertensive 3 (30) 26 (37) 50 (39) 54 (43) 0.317 49 (30) 145 (33) 200 (29) 287 (32) 0.837 0.323
Systolic blood pressure (mmHg) 141.2 135.7 133.2 130.6 0.051 134.5 136.3 134.3 132.5 0.009 0.308
Total cholesterol (mean,mmol/l) 5.69 5.80 5.53 5.61 0.458 5.48 5.67 5.65 5.63 0.501 0.303
Diabetes 3 (30) 18 (25) 42 (33) 45 (36) 0.280 12 (7) 35 (8) 71 (10) 102 (11) 0.033 0.880
Body Mass Index (mean, kg/m2) 25.3 25.8 25.6 26.7 0.092 27.6 27.1 27.2 28.1 0.002 0.536
Family history coronary disease 3 (33) 28 (42) 38 (34) 38 (35) 0.584 82 (52) 182 (43) 285 (45) 436 (51) 0.052 0.260
Lower social class 3 (43) 42 (61) 79 (68) 87 (73) 0.047 91 (56) 235 (54) 377 (57) 519 (59) 0.089 0.121
Left school <16 3 (43) 33 (58) 61 (62) 41 (44) 0.186 28 (18) 66 (16) 91 (14) 94 (11) 0.013 0.751
Medication
Aspirin 8 (80) 53 (75) 94 (73) 95 (76) 0.898 136 (82) 334 (75) 511 (75) 691 (76) 0.726 0.784
ACE inhibitor 1 (10) 18 (25) 33 (26) 28 (22) 0.839 27 (16) 90 (20) 138 (20) 210 (23) 0.040 0.451
Statin 0 11 (15) 21 (16) 18 (14) 0.733 35 (21) 107 (24) 151 (22) 193 (21) 0.751 0.605
Beta-blocker 5 (50) 37 (52) 56 (44) 56 (45) 0.539 82 (49) 229 (51) 331 (48) 374 (41) 0.002 0.773
Calcium antagonist 5 (50) 32 (45) 60 (47) 73 (58) 0.153 76 (46) 212 (48) 316 (46) 540 (60) <0.001 0.907
Nitrate 5 (50) 34 (48) 76 (59) 70 (56) 0.505 78 (47) 282 (63) 431 (63) 657 (73) <0.001 0.221
Clinical presentation
Previous myocardial infarction 5 (50) 29 (41) 51 (40) 55 (44) 0.897 62 (37) 163 (37) 295 (43) 399 (44) 0.006 0.518
Higher doctor-defined CCS (III-IV) 2 (22) 20 (30) 56 (47) 68 (63) <0.001 23 (15) 110 (26) 245 (41) 501 (60) <0.001 0.739
Previous percutaneous coronary
intervention
1 (10) 3 (4) 9 (7) 13 (10) 0.230 15 (9) 27 (6) 45 (7) 117 (13) <0.001 0.909
Previous CABG 1 (10) 1 (1) 8 (6) 20 (16) 0.003 12 (7) 29 (7) 67 (10) 148 (16) <0.001 0.125
Angiographic findings
Zero/mild/moderate diseased vessels 3 (30) 22 (31) 35 (27) 32 (26) 35 (21) 110 (25) 144 (21) 224 (25) 0.301
1 diseased vessel 4 (40) 18 (26) 30 (23) 27 (22) 51 (31) 118 (27) 207 (30) 229 (25)
2 diseased vessels 2 (20) 19 (27) 27 (21) 18 (15) 32 (19) 87 (20) 142 (21) 181 (20)
3 diseased vessels/LMS 1 (10) 11 (16) 36 (28) 45 (37)
0.943
48 (29) 128 (29) 187 (28) 265 (29)
0.716
Impaired left ventricle 1 (13) 6 (10) 30 (28) 29 (31) 0.136 24 (19) 80 (22) 125 (22) 168 (23) 0.366
P value for trend is age-standardised. Values for categorical variables are numbers of patients with percentages of total number with data for that variable (all cells were more than 75% complete for data);
continuous variables are as stated. P value for interaction examines whether trends across CCS by ethnic group are different, a high p value implying no significant difference and thus suggesting equivalent trends in
both ethnic groups, hence taking into account smaller numbers in the South Asian group. Table does not include patients CCS=0 (n=32 for South Asian patients, 265 for White patients).

145
7.6.2 Mortality and relationship with angina status
Worse angina at baseline was associated with higher rates of all-cause mortality
in both South Asian (log-rank test p= 0.009) and White patients (log-rank test
p<0.001) on survival analysis (Figure 10).
Figure 10 ACRE - Mild compared to severe baseline angina and risk of future all-cause
mortality, in White and South Asian patients
7.6.3 Change in angina status between ethnic groups
The mean baseline CCS class was 2.83 (SD 1.18) in South Asian and 2.73 (SD
1.30) in White patients (two sample t test = -1.40, p= 0.162). At six-year follow-
up, means were 2.13 (SD 1.62) and 1.44 (SD 1.56) respectively (two sample t test
= -6.45, p<0.001,Figure 11).

146
Figure 11 ACRE - Mean Canadian Cardiovascular Score of angina at baseline and 6-year
follow-up, in White and South Asian patients
Consistent with this, South Asian patients were more likely to have a diagnosis of
angina on the six-year follow-up general practitioner questionnaire than White
patients (71/216 (32.9%) vs. 403/1691 (23.8%), age-adjusted OR 1.52, 95% CI
1.11-2.07).
Fewer South Asian patients (43.9% (86/196)) reported an improvement in
angina at six years compared to White patients (60.3% (910/1508)), age-
adjusted OR 0.56, 95% CI 0.41-0.76). Adjusting for diabetes, hypertension,
smoking, number of diseased vessels, left ventricular function and social class
did not attenuate this finding (Figure 12).

147
Figure 12 ACRE - Odds of improvement of angina in South Asians compared with White
patients within whole study patient and by management strategy post-angiography
(Medical management strategy –use of oral medication alone (such as anti-anginal medication)
7.6.4 Angina status and relation to revascularisation
Similar proportions of each ethnic group underwent percutaneous coronary
intervention (South Asian 19.9% (100/502), White 19.6% (583/2974)) and
CABG (South Asian 30.1% (151/502), White 32.8% (974/2974)) following
angiography. Stratifying on management post-angiography, South Asian patients
were less likely to report improved angina after PCI (OR 0.19, 95% CI 0.06-0.56)
and CABG (OR 0.36, 95% CI 0.17-0.7,Figure 12). However, there was less
evidence for ethnic differences in angina improvement if treated medically by
medication alone.
7.6.5 Angina status, appropriateness for revascularisation and relation to
revascularisation
Confining analyses to those patients judged appropriate for revascularisation,
South Asian patients still reported less improvement in angina at six years
compared to White patients (fully-adjusted OR 0.42, 95% CI 0.23-0.76).
The ACRE study has previously reported that the overall rate of
revascularisation is lower among South Asian than White patients.61 In this

148
paper, there was no difference between South Asian and White patients in the
proportions that were rated by the panel as appropriate for revascularisation
(72% v 68%) but among patients deemed appropriate for angioplasty, South
Asian patients were less likely to receive it than White patients.
7.6.6 Risk of myocardial infarction and death
There was no statistically significant difference in the rates of non-fatal
myocardial infarction between South Asian and White patients (Table 29). South
Asian patients had a statistically significantly lower rate of all-cause and
coronary death. However, when adjusting for age, these differences were
rendered non-significant.
Ethnic group Number of
events
Rate/1000 person
years (95%CI)
Hazard ratio
(95%CI)
P
White 275 13.90 (12.35-15.64) 1 Myocardial infarction
South Asian 41 12.25 (9.02-16.64) 0.88 (0.63-1.22)
0.447
White 1 adjusted for age
South Asian
0.87 (0.62-1.21)
0.400
White 587 31.42 (28.98-34.06) 1 All-cause mortality
South Asian 64 19.56 (15.30-24.98) 0.62 (0.48-0.81)
<0.001
White 1 adjusted for age
South Asian
0.91 (0.70-1.18)
0.460
White patients 263 17.24 (15.28-19.45) 1 Coronary mortality
South Asians 31 11.34 (7.98-16.13) 0.66 (0.46-0.96)
0.031
White 1 adjusted for age
South Asian
0.93 (0.64-1.36)
0.720
Table 29 ACRE - Numbers of outcomes (myocardial infarction and death (all
cause/coronary)), rates and hazard ratios (crude/adjusted for age) in South Asian
compared with White patients
7.7 Discussion
7.7.1 Objective addressed
This is the first study to report on long-term differences between South Asian
and White patients in symptomatic outcomes of coronary disease. My findings
reveal that South Asians patients were less likely to experience long-term
improvement in angina following coronary revascularisation when compared to
White patients, despite similar rates of infarction and death.

149
In those with angina, revascularisation appears most suited for rapid symptom
control rather than in improving prognosis for fatal outcomes. Thus this work
used a symptomatic outcome, and found relief of angina to be worse in South
Asian compared to White patients. Such symptomatic outcomes add to the
overall picture of prognosis of coronary disease in South Asian compared with
White populations, as relief of angina determines return to work and perceived
health status. 48 By ignoring ‘symptomatic prognosis’, an incomplete picture of
prognosis is painted, which appears equitable between ethnic groups when
examining case fatality alone.
7.7.2 Why does angina improve less in South Asian patients after
revascularisation?
I tested whether South Asian patients undergoing revascularisation were less
appropriate candidates for the procedure. Using pre-defined and validated
definition of appropriateness, I still found a lesser improvement in angina
amongst South Asian compared with White patients.
South Asian populations may have smaller coronary arteries compared to White
populations,164 though this may be explained by body size.72 Revascularisation of
smaller coronary arteries has been associated with less favourable clinical
outcomes165 and I found that the rate of repeat percutaneous coronary
interventions in South Asian patients was higher than among White patients (OR
1.70, 95% CI 1.01-2.86). Diabetes may also alter the perception of cardiac pain if
associated with neuropathy.166 However, after adjusting for the higher
prevalence of diabetes and lower body mass index in South Asian patients in
ACRE compared to White patients, this did not attenuate the observed
differences in angina improvement between the ethnic groups. Adjustments
were also made for other coronary risk factors, though an association between
these risk factors and symptom persistence has not found in previous studies.147
I also adjusted for the number of diseased coronary vessels, as persistence of
angina may be a marker of disease severity such as increased atherosclerotic
burden.38

150
Overall, the reasons for the lesser improvement in angina in South Asian patients
compared to White patients could not be fully elucidated by this study.
7.7.3 Limitations
I acknowledge the inherent difficulty in measuring angina in any ethnic group,
especially via a questionnaire written in English. However, several lines of
evidence suggest that the ethnic differences in symptoms I report are likely to be
robust. Firstly, South Asian patients had a higher prevalence of primary care
doctor-diagnosed angina at six years; secondly, increasing angina as measured
by CCS at baseline was associated with worsening patterns in other baseline
clinical measures and higher rates of prospective all-cause mortality; thirdly,
there were no important differences in non-response bias between ethnic groups
in those responding and not responding to the questionnaire and finally,
analyses with angina diagnosis obtained from the Rose questionnaire yielded
similar results, with South Asian patients reporting a trend towards less
improvement in angina compared with White patients (age-adjusted OR 0.68,
95% CI 0.41-1.11). The importance of symptomatic outcomes should be
underlined. Angina patients with similar functional limitation vary considerably
in tolerance of their symptoms, which in turn influences the management
instigated by their doctor.33 The presence of chest pain in primary care patients
is associated with poorer functional status, especially in role functioning.167
Patient-defined measures thus need to be developed to take into account the fact
that patients and clinicians differ in regard to the distress caused by symptoms.
168
The ACRE study could not discriminate the differing peoples within the South
Asian term and evidence exists of differences in coronary risk factors between
these peoples.20 Though ACRE did have details on individual South Asian
nationality, numbers were too small with which to carry out comparative
analyses. There is however less evidence on differences in symptoms of angina
between these peoples.
Conceivably, if one ethnic group had higher coronary mortality than the other,
then angina follow-up data may have been biased by the lack of data from those

151
who had died, who may have had lesser improvement in angina had they
survived. A greater proportion of White patients had died by six years compared
to South Asian patients. However, by excluding all those that had died, I found
that in those that survived to six years there was still a lesser improvement in
angina in South Asian patients than White patients (OR 0.49, 95% CI 0.31-0.78,
adjusting for diabetes, hypertension, smoking, number of diseased vessels, left
ventricular function and social class). The relative numbers who had died
compared to those that survived remained low in both ethnic groups and would
thus not have significantly biased the overall finding of less improvement of
angina in South Asian patients compared to White patients at follow-up.
As a prospectively recruited clinical cohort, all patients who consecutively
attended for angiography over the recruitment phase were included – this
eliminates selection bias in following up those selected for angiography, though
it cannot taken into account possible selection bias in the selection process for
angiography. South Asian people with angina pectoris had lower rates of
coronary angiography compared with White people in the Chest Pain Clinic
study, a study of incident angina. However, chronic angina is more likely to sway
the cardiologist in favour of coronary angiography. The time from initial
symptoms to ultimately receiving coronary angiography may be longer in South
Asian people, especially in light of their increased number of interactions with
healthcare professionals prior to receiving coronary angiography than White
people,61 but when faced with chronic, persistent symptoms they may not
under-investigated in the long-term. Unmeasured factors may account for the
under-management observed in the Chest Pain Clinic study, such as co-
morbidity, patient preferences and the efficacy of ensuing medical treatment
with anti-anginal drugs alone which may have rendered coronary angiography
unnecessary.

152
7.7.4 Implications
Few studies examine morbidity, symptomatic outcomes following
revascularisation and our study revealed no differences in long-term mortality
between these two ethnic groups following angiography. Coronary
revascularisation for angina, either by PCI or CABG, is performed primarily for
relief of symptoms yet in this study did not improve angina among South Asian
patients as much as it did for White patients. Hence, studying symptomatic
outcomes by ethnicity may be of more importance than case fatality alone in the
study of the prognosis of chronic stable angina.
It would have been of interest to ascertain whether in ACRE, typicality of
symptoms was prognostically related to better symptomatic outcomes, had the
data been available. However, in the Chest Pain Clinic study of the previous
chapter, South Asian participants were under-treated by revascularisation
compared to White participants irrespective of typicality of symptoms. This was
despite descriptors of chest pain being used equally across ethnic group in
making a diagnosis of angina and being equally predictive of coronary events.
Thus, atypical presentation of chest pain at initial presentation may not have
accounted for the longer-term poorer symptomatic outcomes in South Asian
patients in ACRE.
7.8 Conclusions
I found that South Asian patients were less likely to have improved angina than
White patients six years after undergoing coronary revascularisation, even after
having taken into account appropriateness for revascularisation and differences
in clinical characteristics. The use of a symptomatic outcome adds to the overall
picture of prognosis of coronary disease in South Asian compared with White
populations, as whilst prognosis for fatal events is no worse in South Asian
patients with chronic stable angina, prognosis for morbidity, symptomatic
outcomes may be.

153
7.9 Building to next chapter
I have shown that, in patients undergoing coronary angiography, South Asian
patients had no worse a prognosis for ‘hard’ outcomes such as myocardial
infarction and death compared to white patients, but that symptomatic
prognosis was worse in ACRE. This was not accounted for by under-treatment,
which still prevailed in this cohort as it did in the Chest Pain Clinic study.
The next stage of this thesis sought to study patients with acute chest pain as an
emergency presenting to secondary care. I wanted to continue to examine
prognosis at this more serious manifestation of coronary disease, and examine
whether mortality differed between ethnic groups. The heterogeneous nature of
acute coronary syndromes would be considered as prognosis will depend on the
severity of disease at presentation. There are no contemporary studies that have
examined prognosis between ethnic groups using the newer definitions of
myocardial infarction incorporating troponin level. Furthermore, prevalence of
diabetes, socio-environmental factors and management strategy, which differed
between White and South Asian participants in the previous two cohorts of this
thesis, may further influence prognosis differentially between ethnic groups.
Diabetes in South Asians may have increased potency in causing ensuing disease,
and since these acutely unwell patients are most likely to derive the greatest
benefit from intensive therapy, under-treatment here will significantly affect
future risk of death.
Thus I sought to investigate whether ethnic differences existed in prognosis of
acute chest pain, and to consider the effect of not only biological differences but
also severity of disease at presentation and socio-environmental and clinical
management measures.

154
8 The prognosis of acute coronary syndromes
8.1 Summary of chapter
Background Understanding the prognosis of acute coronary syndromes (ACS) in
South Asian compared to White populations necessitates adequate
differentiation of ACS type and assessment of degree of disease severity at
presentation, and consideration of factors such as diabetes, social environment
and clinical management that may confound prognostic analyses by ethnicity.
Methods 3037 South Asian and 68843 White patients admitted with acute
coronary syndrome in 2004 in England and Wales were followed up for all-cause
death at one year. Prognostic analyses were further stratified by risk factors,
clinical management strategies and socio-demographic characteristics.
Results South Asian patients were younger than White patients, and were more
likely to be men, less likely to smoke, but were more likely to be hypertensive or
diabetic. South Asian patients were not more likely to be under-treated. One-year
risk-factor adjusted survival in South Asian patients was marginally better than
White patients at one year (HR (95% CI) 0.83 (0.71-0.97)). Stratifying on risk
factors, clinical management strategies and socio-environmental characteristics
did not appear to confer a worse prognosis in South Asian compared to White
patients.
Conclusions Survival following acute coronary syndromes was no worse in
South Asian compared to White patients. Diabetes, was not associated with a
higher relative risk in South Asian compared to White patients, nor were any
other risk factors, clinical management strategies and socio-environmental
characteristics.

155
8.2 Introduction
Studies examining prognosis of myocardial infarction between South Asians and
White populations are conflicting. Some report a better prognosis,123 others an
equitable prognosis126 and others a worse prognosis96 in South Asian compared
to White populations. To understand the prognosis of acute coronary syndromes
in full, its different phenotypes need to be taken into account as they will differ in
degree of disease severity and will hence affect any explanation the prognosis of
acute coronary disease may have for the higher coronary mortality rate in South
Asian compared to White populations.
Prognosis of acute coronary syndromes is also affected by a range of factors that
range from biological risk factors through socio-environmental factors to
differences in clinical management. Certain risk factors such as diabetes mellitus
may be more potent in causing an adverse prognosis in South Asian compared to
in White populations.93 Furthermore, some,61 but not all57 62 169 studies, suggest
that underuse of effective medical treatments is more common among South
Asian people and that underuse may be associated with the deprived areas South
Asian people live in.29
8.3 Research objective to be investigated
This chapter sought to investigate specific research objective 4.
To compare fatal prognostic outcomes of acute coronary syndromes in South
Asian and White populations and assess factors underlying prognosis.
8.4 Specific research questions
i. Do South Asian patients suffer an increased case fatality compared to
White patients when presenting with acute coronary syndromes?
ii. Do the new definitions of myocardial infarction using troponin in
prognostic analyses affect outcomes differentially by ethnic group?
iii. What is the impact of differences of risk factors, clinical management and
socio-environmental characteristics at baseline in South Asian compared
to White patients on ensuing prognosis?

156
8.5 Methods
The Myocardial Infarction National Audit Project (MINAP) is a registry of all
patients with an acute coronary syndrome who have been admitted to all 230
hospitals in England and Wales.134 A standardised data collection form is used
by all hospitals. MINAP uses a highly secure electronic data entry transmission
and analysis system developed by the Central Cardiac Audit Database group to
collect and analyse records of patients with all types of acute coronary
syndrome.170 The study monitors mortality among patients by linkage with the
Office of National Statistics using the National Health Service number unique to
each patient.
MINAP data for all patients with first admission with ACS during the year 2004 in
England and Wales was used. Of 91684 patients, there were 68843 who were
coded White and 3037 Asian. The definitions of admission variables were as
follows:
• Smoking: ex- and current smokers
• Diabetes: known and newly-diagnosed cases
• Hyperlipidaemia: previously treated hypercholesterolaemia
• Medication: whether or not the patient was already taking an aspirin,
statin, beta-blocker or ACE inhibitor
Further data were available on
• peak troponin level
• area deprivation (Index of Multiple Deprivation (IMD) 2000 score, see
appendix 13.7.1)
• the distance the patient lived from the hospital
• whether admitting hospital had Membership of Association of UK
University Hospitals
• receipt of in-patient coronary angiography.

157
8.6 Statistical analysis
Admission characteristics were examined by ethnic groups in risk factors,
clinical management and socio-environmental characteristics. χ2 tests were
conducted to compare proportions, two-sample t tests for continuous variables.
Admission characteristics were then examined between ethnic groups using the
ACS types.
For prognostic analyses, Cox proportional hazards regression was performed to
assess risk of all-cause death at one year. Adjustments for age (as a continuous
variable), sex, hypertension, hyperlipidaemia, smoking and diabetes were made.
These analyses were repeated for each ACS type. Analyses in the whole cohort
were then stratified by admission factors (age above/below 65, sex, presence or
absence of individual coronary risk factors, disease severity, clinical
management factors and social environment) and formally examined as to
whether a statistical difference existed between hazard ratios of each strata with
the Bland-Altman two-tailed test of interaction.154
The choice of cut-off level for a significant level of troponin varies between
previously published trials, though as a cut-off level between 0.1 and 0.2 µg/L
has been proposed to identify patients at higher risk in most trials,77 171-173 0.1
was used. For deprivation, quartiles were used, and examined highest quartile
against lowest quartile. For distance from hospital, analyses were examined
around the median of 7.6km.
8.7 Results
8.7.1 Admission characteristics of whole cohort
South Asian patients were younger than White patients, and were more likely to
be men (Table 30). They were less likely to smoke, but more likely to be
hypertensive or diabetic. South Asian patients were more likely to live in more
deprived areas, but lived closer to hospitals and were more likely to use a
teaching hospital. South Asian patients did not have higher troponins than White
patients. South Asian patients were on more medications on arrival to hospital –
the proportion having only one or less of aspirin, statin, beta-blocker or ACE
inhibitor was lower than in White patients. They were also more likely to have a
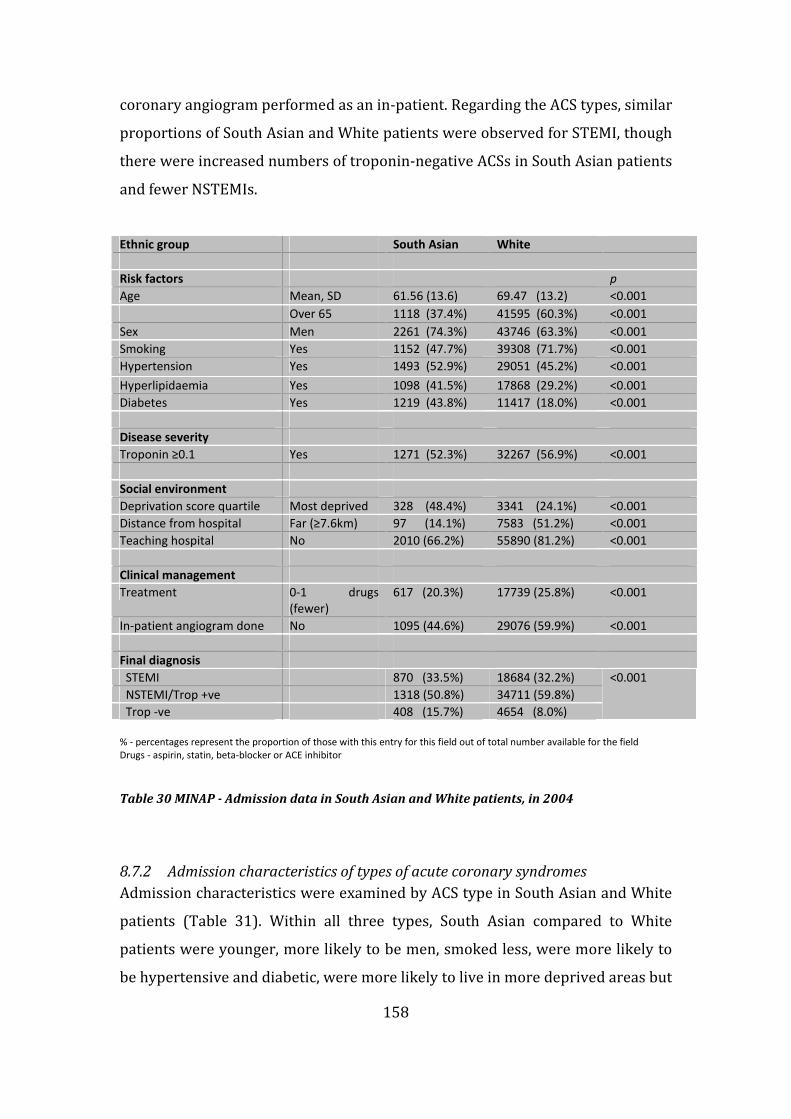
158
coronary angiogram performed as an in-patient. Regarding the ACS types, similar
proportions of South Asian and White patients were observed for STEMI, though
there were increased numbers of troponin-negative ACSs in South Asian patients
and fewer NSTEMIs.
% - percentages represent the proportion of those with this entry for this field out of total number available for the field
Drugs - aspirin, statin, beta-blocker or ACE inhibitor
Table 30 MINAP - Admission data in South Asian and White patients, in 2004
8.7.2 Admission characteristics of types of acute coronary syndromes
Admission characteristics were examined by ACS type in South Asian and White
patients (Table 31). Within all three types, South Asian compared to White
patients were younger, more likely to be men, smoked less, were more likely to
be hypertensive and diabetic, were more likely to live in more deprived areas but
Ethnic group South Asian White
Risk factors p
Age Mean, SD 61.56 (13.6) 69.47 (13.2) <0.001
Over 65 1118 (37.4%) 41595 (60.3%) <0.001
Sex Men 2261 (74.3%) 43746 (63.3%) <0.001
Smoking Yes 1152 (47.7%) 39308 (71.7%) <0.001
Hypertension Yes 1493 (52.9%) 29051 (45.2%) <0.001
Hyperlipidaemia Yes 1098 (41.5%) 17868 (29.2%) <0.001
Diabetes Yes 1219 (43.8%) 11417 (18.0%) <0.001
Disease severity
Troponin ≥0.1 Yes 1271 (52.3%) 32267 (56.9%) <0.001
Social environment
Deprivation score quartile Most deprived 328 (48.4%) 3341 (24.1%) <0.001
Distance from hospital Far (≥7.6km) 97 (14.1%) 7583 (51.2%) <0.001
Teaching hospital No 2010 (66.2%) 55890 (81.2%) <0.001
Clinical management
Treatment 0-1 drugs
(fewer)
617 (20.3%) 17739 (25.8%) <0.001
In-patient angiogram done No 1095 (44.6%) 29076 (59.9%) <0.001
Final diagnosis
STEMI 870 (33.5%) 18684 (32.2%)
NSTEMI/Trop +ve 1318 (50.8%) 34711 (59.8%)
Trop -ve 408 (15.7%) 4654 (8.0%)
<0.001

159
closer to hospitals and were not more likely to be under-treated. This was
consistent with the admission findings for the whole cohort (Table 30).
Examining across the three types, STEMIs had higher troponins than NSTEMIs, in
turn higher than troponin-negative ACSs, and there was more in-patient
coronary angiography of patients with STEMI and NSTEMI than in those with
troponin-negative ACS. STEMI and NSTEMI patients were on more medication on
arrival than troponin-negative ACS patients.

160
()-percentages representing the proportion of those with this entry for this field out of total number available for the field
-no data available Drugs - aspirin, statin, beta-blocker or ACE inhibitor
Table 31 MINAP - Admission characteristics in each type of acute coronary syndrome in South Asian compared to White patients
ACS Type STEMI NSTEMI/Troponin +ve Troponin -ve
Ethnic group South Asian White South Asian White South Asian White
N 870 18684 1318 34711 408 4654
Risk factors
Age Mean, SD 60.08 (12.7) 66.30 (13.0) 64.26 (12.7) 72.41 (12.9) 60.26 (12.1) 66.72 (12.5)
Over 65 318 (37.2) 10138 (54.8) 681 (52.3) 25178 (75.3) 163 (41.5) 2658 (57.6)
Sex Men 668 (77.2) 12983 (69.7) 979 (74.5) 21039 (60.8) 290 (71.6) 2901 (62.7)
Smoking Yes 365 (50.9) 11805 (75.9) 478 (46.1) 19099 (70.3) 148 (47.7) 2751 (71.5)
Hypertension Yes 344 (43.3) 6884 (40.0) 685 (55.9) 15581 (47.7) 257 (64.4) 2378 (53.4)
Hyperlipidaemia Yes 229 (31.0) 4175 (25.6) 460 (40.0) 8788 (28.0) 239 (64.8) 2066 (48.1)
Diabetes Yes 309 (37.7) 2320 (13.5) 575 (47.3) 6761 (20.9) 168 (48.0) 784 (17.7)
Disease severity
Troponin ≥0.1 Yes 511 (92.6) 13036 (94.1) 722 (60.4) 18091 (56.7) 1 (0.28) 30 (0.76)
Social
environment
Deprivation score
quartile
Most deprived 286 (81.3) 2925 (48.9) 42 (80.8) 416 (46.4) - -
Distance from
hospital
Far (≥7.6km) 84 (14.0) 6535 (50.9) 11 (12.9) 965 (52.2) - -
Teaching hospital No 604 (69.4) 14792 (79.2) 975 (74.0) 28868 (83.2) 211 (51.7) 3788 (81.4)
Clinical
management
Treatment 0-1 drugs (fewer) 149 (17.1) 3370 (18.0) 227 (17.2) 7848 (22.6) 371 (90.9) 3,815 (82.0)
In-patient
angiogram done
No 233 (34.5) 7179 (53.2) 395 (37.0) 13916 ( 57.0) 221 (58.6) 2031 (60.1)

161
8.7.3 Prognosis in whole cohort
Of 68843 White patients, 12823 had died at one year (rate/1000 person years
(95%CI) - 0.64 (0.63-0.65)). Of 3037 South Asian patients, 286 had died at one
year (rate/CI 0.33 (0.29-0.37)).
The hazard ratios (and 95% CIs) on cox regression analysis comparing South
Asian with White patients were:
Crude 0.53 (0.47-0.59)
Age-adjusted 0.92 (0.82-1.04)
Adjusted for sex, hypertension,
hyperlipidaemia, smoking, diabetes
0.83 (0.71-0.97)
Thus, crude survival in South Asian patients was markedly better than White
patients at one year, and only marginally better after adjustment for age and of
risk factors (HR 0.83 (95% CI 0.71-0.97)). Further adjustment for factors such as
troponin level and treatment did not alter this result (HR 0.84 (95% CI 0.71-
1.00)). Adjustment for age and deprivation score revealed that survival in South
Asian patients was similar to White patients (HR 0.97 (95% CI 0.73-1.28)).
8.7.4 Prognosis by acute coronary syndrome type
Prognosis was examined by ACS type comparing South Asian with White patients
(Figure 13). Though there was a trend towards better survival in South Asian
patients on crude analyses in all three ACS types as for the whole cohort, on
multi-variate adjustment, survival was similar in South Asian compared with
White patients for each ACS type.

162
Figure 13 MINAP - Risk in South Asian compared to White patients within each type of acute
coronary syndrome of all-cause mortality at one year
South Asian patients were noted to have more troponin-negative ACS admissions
than White patients. I thus examined prognosis for STEMI/NSTEMI combined,
excluding troponin-negative ACS admissions, and found that survival remained
no worse in South Asian patients compared with White patients (HR 0.87 (95%
CI 0.74-1.01), adjusted for age, sex, hypertension, hyperlipidaemia, smoking,
diabetes).
8.7.5 Prognosis among diabetics
The potency of diabetes for causing coronary disease was examined by
investigating the risk of one year death in patients with diabetes compared to
patients without diabetes within each ethnic group for the whole cohort.
The hazard ratios on cox regression analysis in patients with diabetes compared
to patients without diabetes, in South Asian and in White patients are depicted in
Table 32. Diabetes in South Asian patients was associated with a poorer
prognosis than in those South Asian patients who were not diabetic (adjusted HR
1.60 (95% CI 1.18-2.17)). A similarly poor prognosis was observed in White
patients with diabetes compared to White patients without diabetes (adjusted
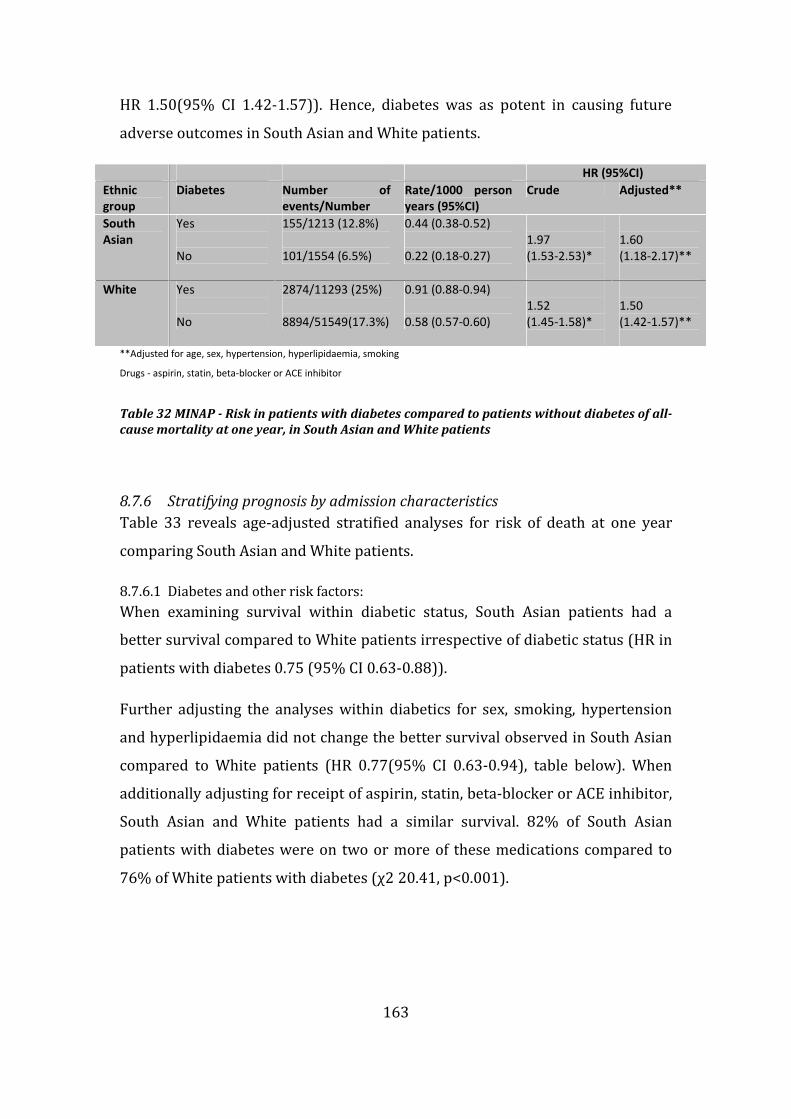
163
HR 1.50(95% CI 1.42-1.57)). Hence, diabetes was as potent in causing future
adverse outcomes in South Asian and White patients.
HR (95%CI)
Ethnic
group
Diabetes Number of
events/Number
Rate/1000 person
years (95%CI)
Crude Adjusted**
South
Asian
Yes
No
155/1213 (12.8%)
101/1554 (6.5%)
0.44 (0.38-0.52)
0.22 (0.18-0.27)
1.97
(1.53-2.53)*
1.60
(1.18-2.17)**
White Yes
No
2874/11293 (25%)
8894/51549(17.3%)
0.91 (0.88-0.94)
0.58 (0.57-0.60)
1.52
(1.45-1.58)*
1.50
(1.42-1.57)**
**Adjusted for age, sex, hypertension, hyperlipidaemia, smoking
Drugs - aspirin, statin, beta-blocker or ACE inhibitor
Table 32 MINAP - Risk in patients with diabetes compared to patients without diabetes of all-
cause mortality at one year, in South Asian and White patients
8.7.6 Stratifying prognosis by admission characteristics
Table 33 reveals age-adjusted stratified analyses for risk of death at one year
comparing South Asian and White patients.
8.7.6.1 Diabetes and other risk factors:
When examining survival within diabetic status, South Asian patients had a
better survival compared to White patients irrespective of diabetic status (HR in
patients with diabetes 0.75 (95% CI 0.63-0.88)).
Further adjusting the analyses within diabetics for sex, smoking, hypertension
and hyperlipidaemia did not change the better survival observed in South Asian
compared to White patients (HR 0.77(95% CI 0.63-0.94), table below). When
additionally adjusting for receipt of aspirin, statin, beta-blocker or ACE inhibitor,
South Asian and White patients had a similar survival. 82% of South Asian
patients with diabetes were on two or more of these medications compared to
76% of White patients with diabetes (χ2 20.41, p<0.001).

164
Age-adjusted *Model 1 **Model 2
Diabetes Yes 0.75 (0.63-0.88) 0.77(0.63-0.94) 0.81 (0.67-1.00)
No 0.78 (0.64-0.95) 0.82(0.65-1.04) 0.83 (0.65-1.05) *Model 1 - adjusted for age, sex, hypertension, hyperlipidaemia, smoking
**Model 2 - adjusted for treatment with aspirin, statin, beta-blocker or ACE inhibitor
Table 33 MINAP - Risk in South Asian compared to White patients, stratified by diabetes, of
all-cause mortality at one year
When examining survival within sex, analyses revealed similar prognoses
between ethnic groups in men and women. Prognosis was also the same in South
Asian compared to White patients with diabetes in those with and without
hypertension. South Asian patients that smoked or had high cholesterol also
appeared to have a similar prognosis to their White counterparts with these risk
factors.
8.7.6.2 Disease severity
Stratified analyses by troponin ≥0.1 suggested a better prognosis in South Asian
compared to White patients with troponin <0.1 (HR 0.75 (95% CI 0.60-0.94),
p=0.049 for two-tailed test for interaction with those with high troponin).
8.7.6.3 Social environment
Stratifying by distance from patient home to hospital and teaching status of
hospital revealed similar prognoses between ethnic groups. South Asian patients
in less deprived areas had a worse prognosis than White patients in less
deprived areas (HR 2.34 (95% CI 1.21-4.56); p=0.025 for two-tailed test for
interaction with more deprived areas).
8.7.6.4 Clinical management
Stratified analyses by coronary angiography and pharmacological treatment
revealed similar prognoses between ethnic groups. There was a worse prognosis
in South Asian patients compared to White patients amongst those selected for
in-patient angiography (HR 1.32 (95% CI 1.04-1.66)).

165
HR (95%CI) P for interaction
Risk factors
Age Over 65 0.66 (0.58-0.75) 0.132
Under 65 0.83 (0.63-1.08)
Sex Men 0.91 (0.78-1.05) 0.865
Women 0.93 (0.76-1.14)
Smoking Yes 0.78 (0.62-0.99) 0.057
No 1.04 (0.87-1.25)
Hypertension Yes 0.95 (0.81-1.11) 0.303
No 0.83 (0.68-1.02)
Hyperlipidaemia Yes 0.98 (0.79-1.20) 0.581
No 0.91 (0.77-1.06)
Diabetes Yes 0.75 (0.63-0.88) 0.766
No 0.78 (0.64-0.95)
Disease severity
Yes 0.99 (0.84,1.16) 0.049 Troponin ≥0.1
No 0.75 (0.60,0.94)
Social environment
Most deprived 0.72 (0.47,1.11) 0.025 Deprivation score
(quartiles) Least deprived 2.34 (1.21,4.56)
Far (≥7.6km) 0.61 (0.23,1.63) 0.243 Distance from hospital
Near(<7.6km) 1.12 (0.84,1.49)
Teaching hospital No 0.88 (0.76,1.01) 0.151
Yes 1.06 (0.86,1.31)
Clinical management
Treatment 0-1 drugs 1.03 (0.86,1.23)
2-4 drugs 0.93 (0.80,1.09) 0.215
No 0.85 (0.72,1.01) In-patient angiogram done
Yes 1.32 (1.04,1.66) 0.003
Table 34 MINAP - Risk in South Asian compared to White patients, stratified by risk factors,
markers of disease severity, social environment and clinical management, of age-adjusted
all-cause mortality at one year
8.8 Discussion
South Asian and White patients differed when presenting with acute coronary
syndromes. The former were younger, more likely to be men, more likely to be
diabetic and were more likely to live in more deprived areas. However, South
Asian patients did not present with higher troponin levels than White patients,
lived closer to hospitals, which themselves were more likely to be teaching
hospitals and were not more likely to be under-treated. Survival in South Asian
patients was no worse than in White patients after adjustment of confounding
factors and if anything may be marginally better. The increased coronary
mortality of the South Asian population from census data is thus not due to a

166
worse case fatality in them compared to the White population following
presentation with acute coronary syndromes.
8.8.1 Admission characteristics and prognosis by acute coronary syndrome type
Within all three ACS types (STEMI, NSTEMI, troponin-negative), South Asian
patients compared to White patients had similar baseline characteristics (such as
being younger and more likely to be diabetic), consistent with the admission
findings for the whole ACS cohort. Both South Asian and White STEMI and
NSTEMI patients were on more medication on arrival than troponin-negative
ACS, suggesting that they were already perceived to be at-risk patients. South
Asian patients with troponin-negative ACSs were on less medication on arrival
than white patients with troponin-negative ACS, and this may reflect they were
appropriately perceived to be low-risk patients (perhaps with atypical
symptoms). Survival was similar in South Asian patients compared with White
patients for each ACS type.
There were increased numbers of troponin-negative ACSs in South Asian
patients and fewer NSTEMIs. However, even when excluding those with
troponin-negative ACS admissions (who may not have genuine coronary
disease), the prognosis in South Asian patients compared to White patients was
no worse.
8.8.2 Diabetes
The prevalence of diabetes was markedly higher in South Asian compared to
White patients and diabetes in South Asian and White patients was associated
with a worse survival than those who did not have diabetes.
Though these findings are what would be expected, the findings of the
exploratory stratified analyses differ from some of the literature in South Asian
patients with diabetes. Firstly, South Asian patients with diabetes in MINAP had
a better survival than White patients with diabetes. The better survival in South
Asian patients with diabetes compared with White patients with diabetes
contrasts with the higher incidence of coronary complications of diabetes
amongst the South Asian population compared to White populations as
presented in this thesis’s systematic review of incident coronary disease (Section

167
3.6.1.2.2, the UK Prospective Diabetes Study 32124 and Southall Diabetes
Survey125 studies), Hence, diabetes in the South Asian population may indeed
lead to a higher incidence of coronary events but prognosis from those coronary
events once they have become a patient is no worse than in White patients with
diabetes presenting with coronary disease.
Secondly, MINAP did not find worse medical care in South Asian patients than in
White patients, as cross-tabulation analyses of diabetes status and medication
revealed better treatment in South Asian patients with diabetes. This better
treatment may account for the better survival observed in South Asian patients
with diabetes compared to White patients with diabetes following presentation
with an acute coronary syndrome. Adjusting for medication usage rendered
survival similar in South Asian patients compared to White patients in stratified
analyses of diabetes status. Previous studies in primary care have shown that the
proportion of South Asian patients with good diabetes control is lower than the
general population as is the proportion receiving insulin.174 This may partly
explain the higher incidence of coronary disease in South Asian patients with
diabetes, but the results in MINAP infer that if providing good care in secondary
prevention results in improved survival, the incidence of coronary complications
in South Asian patients with diabetes could in a similar way be reduced by good
quality care in primary care. A review of the literature on ethnic differences in
the prevalence of complications and mortality among patients with diabetes
suggested that any differences could be due to differences in quality of diabetes
care.175
8.8.3 Other risk factors
South Asians patients were younger than White patients, and adjusting for age
for the whole cohort rendered the markedly better crude survival in South Asian
patients closer to unity. Stratifying on age did not reveal a better prognosis in
South Asian patients compared to White patients in either age group. However, it
is likely that the younger age of presentation explains a large part of why
survival in South Asian patients compared to White patients was no worse in the
whole cohort.

168
8.8.4 Disease severity
Baseline differences in the severity of disease may also be a factor in differing
prognoses, and within those with a lower troponin, South Asian patients had a
better prognosis compared to White patients. However, as noted above, the
prognosis in South Asian compared to White patients for those with either
STEMI or NSTEMI was no worse in South Asian patients compared with White
patients. Adjustment of prognostic analyses within the whole cohort for troponin
level did not change this, and suggests that the marginal survival advantage in
South Asian patients in the whole cohort is not explained by lesser disease
severity at presentation.
8.8.5 Social environment
Analyses stratified by deprivation suggested that South Asian patients had a
worse prognosis than White patients in less deprived areas. Though survival in
South Asian patients was marginally better than White patients at one year in the
whole cohort, after adjusting for age and deprivation score, 95% confidence
intervals were equally spaced around unity (0.73-1.28). I investigate and discuss
this further in the next chapter, as much of this finding may be explained by
residual confounding.
8.8.6 Clinical management
With regard to clinical management, South Asian patients had a worse prognosis
compared to White patients with in-patient angiography (HR 1.32 (95% CI 1.04-
1.66)). This result does not however take into account factors that may have
driven clinicians to performing angiography as a result of adverse clinical
features on presentation (sicker patients needing more urgent invasive
investigation) and these data do not consider whether or not revascularisation
was undertaken after angiography. It would be the actual process of
revascularisation rather than the process of angiography itself that would have
determined prognosis.
8.8.7 Limitations
The large numbers within MINAP provided considerable statistical power but
this is potentially attenuated by the quality of those numbers. Analyses of
MINAP in chapter 4 stood up to scrutiny in terms of data quality in spite of

169
missing data. The marginally better survival in South Asian patients in the whole
cohort was a surprise, though a more conservative conclusion that the South
Asian patient certainly does not have a worse prognosis than the White patient
should be made in light of the incompleteness of data.
Some factors which are likely to play a role in determining prognosis (such as
degree of angiographic coronary disease) were unavailable in MINAP and hence
this limited the scope of the stratified prognostic analyses. Other variables not
available include readmission to hospital and also clinical management as an
out-patient following discharge. Angiography and revascularisation may have
been performed at a later date as an out-patient. Such limitations could in the
future be addressed by linkage of MINAP to NHS data sources such as Hospital
Episode Statistics. Such linkages will themselves depend on the availability and
quality of identifiers of variables such as ethnicity.
Length of follow-up was only one year within MINAP, and thus makes
conclusions on long-term prognosis impossible. However, with time, longer-term
follow-up in MINAP could be sought.
8.8.8 Implications
It may be that the younger age of South Asian patients with acute coronary
syndromes explains the similar prognosis, and certainly from adjusting for age,
the markedly better prognosis seen on crude prognostic analyses disappeared.
Though these results are encouraging and perhaps demonstrates a wide uptake
of appropriate, evidence-based treatment across demographic groups in a
disease well-serviced by evidenced-based therapy, the results should not
prevent further analyses of prognostic outcomes by ethnic groups following
presentation with acute coronary syndrome.
Firstly, prognosis for non-fatal symptomatic outcomes may not be equitable by
ethnicity - this thesis has already observed this for symptomatic outcomes from
revascularisation for chronic angina. Secondly, the younger average age of South
Asian patients, which may reflect the age distribution of the local population,
combined with equitable survival to that of older White patients, will markedly

170
increase the number of cases of coronary heart disease among the South Asian
population. Finally, the future burden of heart failure will thus increase
disproportionately in the South Asian population if survival continues to
improve. These results thus have clear implications for the allocation of
healthcare resources in this population of acute coronary syndrome patients.
8.9 Conclusions
Survival following acute coronary syndromes was no worse in South Asian
patients than White patients. Diabetes, although more common in South Asian
patients, was not associated with a higher relative risk of death in South Asian
patients compared to White patients, nor were any other risk factors, clinical
management strategies and socio-environmental characteristics.

171
9 The contribution of incidence and prognosis to overall
coronary death rates in South Asian and White populations
9.1 Summary of chapter
Background The systematic review of this thesis reported that South Asian
populations have a higher incidence of fatal coronary disease but could not
answer whether prognosis is worse in South Asian compared to White
populations. The results of this thesis thus far have shown a higher incidence of
fatal and non-fatal coronary disease in South Asian compared to White
populations but that prognosis for serious clinical events is no worse in South
Asian populations.
Methods The four new prospective studies of this thesis, one aetiologic (South
Asian N=580 initially healthy), and three prognostic (N=2189 with suspected
stable angina, N= 502 undergoing coronary angiography and N=3037 with acute
coronary syndromes) were examined for mortality outcomes. Previous studies
on incidence and prognosis included on my systematic review were meta-
analysed with these four studies using a random effects model respectively.
Results In analysing seven studies, South Asian populations showed an overall
higher risk of incident coronary events than White populations (fatal and non-
fatal HR 1.47 (1.29–1.66)). Ten prognostic studies examining risk of death from
coronary disease showed overall survival was better in South Asian than White
populations (HR 0.80 (0.71-0.88)). This effect was not explained by risk factors,
disease severity at presentation, clinical management nor social environment.
Conclusions Incidence of non-fatal and fatal coronary disease is higher in South
Asian than White populations, but prognosis for risk of death is better once
coronary disease is manifest. The dissociation between the aetiologic and
prognostic findings suggests that public health initiatives to reduce disparities in
mortality should focus on primary prevention.

172
9.2 Introduction
There is a higher cross-sectional coronary mortality in South Asian compared to
White populations in the UK. Understanding the contribution of incidence and
prognosis to this may allow interventions to prevent disease onset or its
progression to be better targeted. From the systematic literature review, most
studies reported that South Asian populations have a higher incidence of fatal
coronary disease compared to White populations, though data on non-fatal
events were few. When considering prognosis, of the studies retrieved, the
results could not answer whether prognosis was worse in South Asian compared
to White populations.
In its investigation into the higher cross-sectional coronary mortality in South
Asian compared to White populations in the UK, this thesis has so far contributed
in the following ways:
- There is a higher incidence of prognostically-significant angina in South
Asian compared to White populations. South Asian populations also have a
higher incidence of non-fatal myocardial infarction or coronary death than
White populations (Chapter 5).
- Prognosis in terms of fatal events is no higher in South Asian compared to
White populations either with angina (Chapters 6, 7) or after acute coronary
syndromes (Chapter 8).
I now sought to examine my studies in the context of these previous studies. A
higher case fatality (i.e. worse prognosis) in South Asian people might have been
expected for two main reasons. First, South Asian populations have a higher
prevalence of insulin resistance and diabetes mellitus than White European
populations,176 and the presence of diabetes among people with coronary
disease is associated with higher survival.177 Certain risk factors such as diabetes
mellitus may result in poorer outcomes in South Asians with diabetes than in
White people with diabetes.93 Second, some,61 but not all57 62 169 studies, suggest

173
that underuse of medical treatments, more common among South Asian
populations, is associated with the deprived areas they live in.29
9.3 Research objective to be investigated
This chapter sought to investigate specific research objective 5.
To assess the contribution of incidence and prognosis to the higher coronary
death rates in South Asian compared to White populations through meta-
analysis of the four cohorts and previously reported studies.
9.4 Specific research questions
i. What are the relative effects of South Asian ethnicity compared to White
ethnicity in healthy populations (aetiologic effects) and in populations
with already-manifest coronary disease (prognostic effects) from meta-
analysing the four cohort studies of this thesis with those previously
reported in the literature ?
ii. What is the influence of biological risk factors, clinical management and
socio-environmental characteristics on prognosis within the prognostic
studies of this thesis?
9.5 Methods
For the meta-analysis, studies obtained by systematic review that examined
incidence of fatal outcomes in South Asian compared to White populations were
combined with the fatal outcomes found in Whitehall-II (aetiologic, healthy
population cohort). This was repeated for studies examining non-fatal combined
with fatal outcomes. For prognosis, studies obtained by systematic review that
examined fatal outcomes in South Asian compared to White populations were
combined with the fatal outcomes found in the Chest Pain Clinic Study, ACRE
(coronary angiogram cohort) and MINAP (acute coronary syndrome cohort).
Stratified analyses on prognosis by biological risk factors, clinical management
and socio-environmental characteristics were then conducted within the studies
of this thesis. The style already utilised in the previous chapter was used, and
extended across all three prognostic cohorts. As an example, to examine whether
the severity of coronary disease at presentation influenced prognosis by ethnic

174
group, measures appropriate to the stage of disease at which the cohort
recruited were used. Exercise electrocardiography and typicality of angina were
used in the chest pain clinic cohort, severity of angina (by Canadian
Cardiovascular Society score), angiographic disease and left ventricular function
were used in the coronary angiogram cohort and troponin level was used in the
acute coronary syndrome cohort.
All three studies had data on biological risk factors and medication. The three
prognostic studies also included data on deprivation, though by different
measures. The chest pain cohort used the Townsend score, the coronary
angiogram (ACRE) cohort Carstairs, and the acute coronary syndrome (MINAP)
cohort had data on Index of Multiple Deprivation 2000 (IMD) score (appendix
13.7). The acute coronary syndrome cohort also had data on the distance the
patient lived from the hospital and receipt of in-patient coronary angiography.
9.6 Statistical analysis
In calculating incidence, a combined non-fatal outcome (non-fatal myocardial
infarction and admission with angina) in Whitehall-II was used, as well as risk of
coronary death. For prognostic analyses within Whitehall-II, risk of coronary
death in those with typical angina at baseline was assessed. Risk of coronary
death in the Chest Pain Clinic Study and ACRE were assessed and all-cause death
in MINAP was assessed as cause-specific death was unavailable. Cox
proportional hazards regression were performed, adjusted for age (as a
continuous variable), sex, hypertension, blood cholesterol, smoking and diabetes
in all cohorts. These analyses were then stratified in the prognostic studies by
baseline factors (age above/below 65, sex, presence or absence of individual
coronary risk factors, disease severity, clinical management factors and social
environment) and formally examined as to whether a statistical difference
existed between hazard ratios of each strata with the Bland-Altman two-tailed
test of interaction.
Using the systematic review, relative risks, adjusted where available, were
extracted from each study. In studies in which summary relative risk estimates
were not given, crude data in the paper were examined to estimate unadjusted

175
odds ratios and confidence intervals. The authors of studies were approached to
confirm relevant numerical data where necessary (Thanks to Sarah Wild and
Colin Fischbacher).
Results of individual studies found on systematic review were combined with the
studies of this thesis using the metan command178 in Stata10 and calculated
pooled odds ratios, weights, and 95% confidence intervals using a random
effects model. Heterogeneity was examined using the I2 statistic.154
9.7 Results
9.7.1 The studies of this thesis
All hazard ratios are adjusted for age, sex, hypertension, blood cholesterol,
ex/current smoker, diabetes.
• Whitehall-II:
o Incidence for coronary death was higher in South Asian compared
to White participants (adjusted HR 3.83 (95% CI 2.32-6.30)).
o Incidence for non-fatal events (non-fatal myocardial infarction,
angina) was higher in South Asian compared to White participants
(adjusted HR 1.64 (95% CI 1.33–2.02)).
o Prognosis for coronary death in those with typical angina at
baseline was similar in South Asian compared to White
participants (adjusted 2.07 (95% CI 0.61-6.97)).
• Chest Pain Clinic study
o Prognosis for coronary death was similar in South Asian compared
to White participants (adjusted HR 0.82 (95% CI 0.29-2.33)).
• ACRE
o Prognosis for coronary death was similar in South Asian compared
to White participants (adjusted HR 0.80 (95% CI 0.47-1.36)).
• MINAP
o Prognosis for all-cause death was marginally better in South Asian
compared to White participants (adjusted HR 0.83 (95% CI 0.71-
0.97)).

176
9.7.2 Meta-analysis of incidence studies
9.7.2.1 Fatal events
The upper panel of figure 14 below focuses on coronary death rates amongst
South Asian compared to that of White majority populations. Balarajan’s data
based on the 1981 census reveals a higher mortality in South Asian men and
women compared to the whole population of England and Wales,8 as does Wild’s
study based on 1991 census.10 Whitehall-II and Forouhi et al122 represent the
only prospective studies of healthy individuals for risk of coronary death in
healthy individuals comparing South Asian and White populations, both showing
a higher incident mortality in South Asian compared to White populations.
On meta-analysis, these studies reveal higher incident coronary mortality in
South Asian compared to White populations (HR 1.43 (95% CI 1.39–1.46)).
9.7.2.2 Fatal and non-fatal events
The lower panel of figure 14 below focuses on non-fatal incidence coronary rates
amongst South Asians compared to that of White majority populations. Both
Fischbacher et al’s123 study and the UK Prospective Diabetes Study 32124
examine incidence of non-fatal myocardial infarction combined with fatal
myocardial infarction. Whitehall-II and Mather et al125 are able to study non-fatal
events alone.
Irrespective of whether or not non-fatal events are combined with fatal ones, all
studies bar UKPDS32 reveal a higher incidence of coronary events in South Asian
compared to White populations, confirmed on meta-analysis (HR 1.47 (95% CI
1.29–1.66)).

177
The upper panel shows studies examining fatal events; the bottom panel analyses from studies examining non-fatal events
Figure 14 Meta-analysis of incidence studies of coronary disease in South Asian compared to White populations

178
9.7.3 Meta-analysis of prognostic studies
9.7.3.1 Previously published studies
The upper panel of figure 15 below focuses on the previously published studies
retrieved on systematic literature review. On observation of the confidence
intervals around the point estimates, prognosis for death seemed to not be worse
in South Asian compared with White populations.
9.7.3.2 Studies from this thesis
The point estimates from the prognostic studies of this thesis (Chest Pain Clinic,
ACRE and MINAP) suggested a trend towards a better prognosis in South Asian
compared with White populations, especially with the more recent and larger
studies. Prognosis in those with typical angina in Whitehall-II, a cohort not
presenting to healthcare services, was similar in South Asian compared to White
populations.
On meta-analysis of previously published studies with studies from this thesis, a
better prognosis for death following presentation with coronary disease was
observed for South Asian compared to White populations (HR 0.80 (0.71-0.88)).

179
The upper panel shows previously published studies; the bottom panel analyses from new studies from this thesis
Figure 15 Meta-analysis of prognostic studies of coronary disease in South Asian compared to White populations

180
9.7.4 Ethnic comparisons of prognosis within strata of prognostic factors
Whether South Asian participants of this thesis’ studies had a worse prognosis
than White participants in any of strata of prognostic factors is assessed in Table
35.

181
Table 35 Risk in South Asian compared to White participants, stratified by risk factors, markers of disease severity, social environment and clinical
management, of age-adjusted all-cause mortality at one year in three prognostic cohorts
Study Chest Pain Clinic Coronary angiogram (ACRE) Acute coronary syndrome (MINAP)
Page 1/2 South Asian White p HR (95%CI) South
Asian
White p HR (95%CI) South Asian White p HR (95%CI)
Whole study Unadjusted
Age-adjusted
*Adjusted
2189 5605 0.63 (0.39-1.02)
1.08 (0.66-1.76)
0.82 (0.29-2.33)
502 2974 0.66 (0.46-0.96)
0.93 (0.64-1.36)
0.80 (0.47-1.36)
3057 69638 0.53 (0.47-0.59)
0.92 (0.82-1.04)
0.83 (0.71-0.97)
Risk factors
Age Over 65 270(12.3) 1602 (28.6) <0.001 0.74 (0.33-1.64) 89 (17.7) 1159 (39.0) <0.001 1.22 (0.69-2.15) 1118 (37.4) 41595 (60.3) <0.001 0.66 (0.58-0.75)
Under 65 0.99 (0.53-1.84) 1.08 (0.65-1.78) 0.83 (0.63-1.08)
Sex Men 1209 (55.2) 2929 (52.3) 0.018 1.09 (0.61-1.92) 391 (77.9) 2112 (71.0) 0.002 0.78 (0.51-1.19) 2261 (74.3) 43746 (63.3) <0.001 0.91 (0.78-1.05)
Women 0.93 (0.45-1.91) 1.95 (0.80-4.74) 0.93 (0.76-1.14)
Smoking Yes 355 (16.2%) 1607 (28.7) <0.001 1.66 (0.71-3.92) 178 (47.2) 1937 (73.5%) <0.001 0.88 (0.51-1.56) 1152 (47.7) 39,308 (71.7) <0.001 0.78 (0.62-0.99)
No 1.05 (0.57-1.91) 1.37 (0.69-2.73) 1.04 (0.87-1.25)
Hypertension Yes 732 (33.4 ) 1892 (33.8) 0.791 1.16 (0.59-2.29) 191 (38.1) 889 (29.9) <0.001 1.04 (0.58-1.87) 1493 (52.9) 29051 (45.2) <0.001 0.95 (0.81-1.11)
No 0.93 (0.45-1.91) 0.85 (0.51-1.40) 0.83 (0.68-1.02)
Hyperlipidaemia Yes 366 (62.8) 1256 (64.5) 0.436 1.22 (0.39-3.79) 165 (44.4) 1012 (45.5) 0.691 0.64 (0.28-1.47) 1098 (41.5) 17868 (29.2) <0.001 0.98 (0.79-1.20)
No 0.70 (0.80-6.39) 1.69 (1.01-2.84) 0.91 (0.77-1.06)
Diabetic Yes 428 (19.5) 372 (6.6) <0.001 0.84 (0.34-2.06) 156 (31.1) 288 (9.7) <0.001 0.90 (0.51-1.58) 1219 (43.8) 11417 (18.0) <0.001 0.75 (0.63-0.88)
No 0.95 (0.52-1.75) 0.64 (0.36-1.13) 0.78 (0.64-0.95)
Disease severity
Angina symptoms ^ More 356 (16.3) 1481 (26.4) <0.001 0.96 (0.44-2.07) 201 (54.3) 1076 (50.9) 0.217 1.65 (1.00-2.74) - - - -
^^Less 1.26 (0.66-2.41) 1.07 (0.55-2.09) - - - -
Exercise ECG Positive 182 (15.6) 668 (19.3) 0.017 1.33 (0.55-3.19) - - - - - - - -
Negative 0.64 (0.18-2.31) - - - - - - - -
Coronary disease >= 2 arteries - - - - 235 (47.2) 1339 (45.4) 0.452 0.97 (0.63-1.49) - - - -
Normal-1
artery
- - - - 0.61 (0.26-1.42) - - - -
Yes - - - - 98 (23.6) 563 (23.3) 0.897 0.77 (0.43-1.38) - - - - Impaired left
ventricular function No - - - - 0.88 (0.45-1.71) - - - -
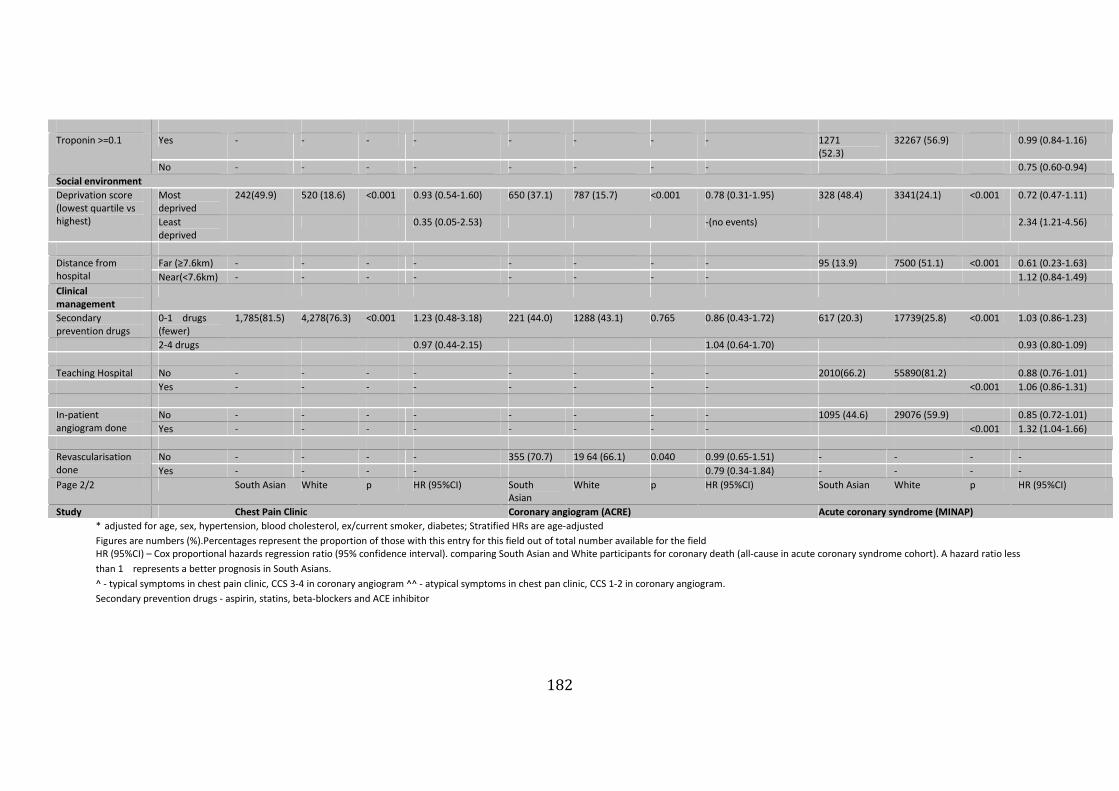
182
Yes - - - - - - - - 1271
(52.3)
32267 (56.9) 0.99 (0.84-1.16) Troponin >=0.1
No - - - - - - - - 0.75 (0.60-0.94)
Social environment
Most
deprived
242(49.9) 520 (18.6) <0.001 0.93 (0.54-1.60) 650 (37.1) 787 (15.7) <0.001 0.78 (0.31-1.95) 328 (48.4) 3341(24.1) <0.001 0.72 (0.47-1.11) Deprivation score
(lowest quartile vs
highest) Least
deprived
0.35 (0.05-2.53) -(no events) 2.34 (1.21-4.56)
Far (≥7.6km) - - - - - - - - 95 (13.9) 7500 (51.1) <0.001 0.61 (0.23-1.63) Distance from
hospital Near(<7.6km) - - - - - - - - 1.12 (0.84-1.49)
Clinical
management
Secondary
prevention drugs
0-1 drugs
(fewer)
1,785(81.5) 4,278(76.3) <0.001 1.23 (0.48-3.18) 221 (44.0) 1288 (43.1) 0.765 0.86 (0.43-1.72) 617 (20.3) 17739(25.8) <0.001 1.03 (0.86-1.23)
2-4 drugs 0.97 (0.44-2.15) 1.04 (0.64-1.70) 0.93 (0.80-1.09)
Teaching Hospital No - - - - - - - - 2010(66.2) 55890(81.2) 0.88 (0.76-1.01)
Yes - - - - - - - - <0.001 1.06 (0.86-1.31)
No - - - - - - - - 1095 (44.6) 29076 (59.9) 0.85 (0.72-1.01) In-patient
angiogram done Yes - - - - - - - - <0.001 1.32 (1.04-1.66)
No - - - - 355 (70.7) 19 64 (66.1) 0.040 0.99 (0.65-1.51) - - - - Revascularisation
done Yes - - - - 0.79 (0.34-1.84) - - - -
Page 2/2 South Asian White p HR (95%CI) South
Asian
White p HR (95%CI) South Asian White p HR (95%CI)
Study Chest Pain Clinic Coronary angiogram (ACRE) Acute coronary syndrome (MINAP)
* adjusted for age, sex, hypertension, blood cholesterol, ex/current smoker, diabetes; Stratified HRs are age-adjusted
Figures are numbers (%).Percentages represent the proportion of those with this entry for this field out of total number available for the field
HR (95%CI) – Cox proportional hazards regression ratio (95% confidence interval). comparing South Asian and White participants for coronary death (all-cause in acute coronary syndrome cohort). A hazard ratio less
than 1 represents a better prognosis in South Asians.
^ - typical symptoms in chest pain clinic, CCS 3-4 in coronary angiogram ^^ - atypical symptoms in chest pan clinic, CCS 1-2 in coronary angiogram.
Secondary prevention drugs - aspirin, statins, beta-blockers and ACE inhibitor

183
9.7.4.1 Diabetes
Diabetes was significantly more prevalent in South Asian compared to White
participants in all three of our prognostic studies. When stratifying survival by
diabetic status in each of our studies, survival was not worse in South Asian
participants with diabetes compared to White participants with diabetes, and
South Asian participants in the acute coronary syndrome cohort had a better
survival compared to White participants irrespective of diabetic status.
Further adjusting the stratified analyses in diabetics for sex, smoking,
hypertension and hyperlipidaemia, South Asian participants still demonstrated
no worse a prognosis compared to White participants in the chest pain clinic and
coronary angiogram cohorts, whilst South Asian participants with diabetes had a
better survival in the acute coronary syndrome than White participants with
diabetes (Table 36). When additionally adjusting for receipt of aspirin, statin,
beta-blocker or ACE inhibitor, South Asian and White participants still had a
similar survival in all cohorts irrespective of diabetic status.
Age-adjusted *Model 1 **Model 2
Diabetic Yes 0.84 (0.34-2.06) 0.87 (0.35-2.17) 0.88 (0.35-2.22) Chest Pain
Clinic No 0.95 (0.52-1.75) 0.88 (0.48-1.61) 0.90 (0.49-1.64)
Diabetic Yes 0.90 (0.51-1.58) 0.75 (0.34-1.68) 0.80 (0.35-1.85) ACRE
No 0.64 (0.36-1.13) 0.77 (0.37-1.59) 0.74 (0.36-1.53)
Diabetic Yes 0.75 (0.63-0.88) 0.77 (0.63-0.94) 0.81 (0.67-1.00) MINAP
No 0.78 (0.64-0.95) 0.82 (0.65-1.04) 0.83 (0.65-1.05) *Model 1 - adjusted for age, sex, hypertension, hyperlipidaemia, smoking
**Model 2 - adjusted for treatment with aspirin, statin, beta-blocker or ACE inhibitor
Table 36 Risk in South Asian compared to White participants, stratified by diabetes, of all-
cause mortality at one year in the three prognostic cohorts
9.7.4.2 Other risk factors
South Asian participants were more likely to be men, yet sex did not confer
different prognoses between the ethnic groups. South Asian participants were
more likely to have been diagnosed hypertensive in the coronary angiogram and

184
acute coronary syndrome cohorts but prognosis was the same in South Asian
compared to White participants in those with and without hypertension. South
Asian participants that smoked or had high cholesterol appeared to have a
similar prognosis to their White counterparts with these risk factors.
9.7.4.3 Disease severity
South Asian participants did not present with more severe disease than White
participants as evidenced by fewer positive exercise electrocardiograms in the
chest pain clinic cohort, an equivalent degree of coronary disease at angiography
in ACRE and a lower prevalence of a troponin above 0.1 in MINAP. Similar
analyses by severity of disease and receipt of treatment revealed similar
prognoses between ethnic groups.
9.7.4.4 Social environment
South Asian participants were more likely to live in deprived areas in all three
prospective studies, but were closer to the hospital and more likely to use a
teaching hospital in the acute coronary syndrome cohort. The previous chapter
has already shown that South Asian participants in less deprived areas had a
worse prognosis compared to White participants in those areas for the acute
coronary syndrome cohort (p=0.025 for two-tailed test for interaction with those
in the more deprived areas). This was not observed in the chest pain clinic
cohort (Bland-Altman two-tailed test of interaction154 test p=0.544). Data on
deprivation with respect to outcome in the coronary angiogram cohort were too
scarce, preventing similar prognostic analyses.
Although caution is required in interpreting such subgroup analyses, I carried
out further exploratory analyses. I compared the baseline features of those in the
most deprived quintile of MINAP with the least deprived quintile in each ethnic
group (Table 37). In more deprived areas, patients were younger, smoking and
diabetes were more prevalent and patients were closer to hospitals. These were
more likely to be teaching hospitals, and patients in more deprived areas were
more likely to get more secondary prevention drugs. There were no consistent
differences in hypertension and high cholesterol between less and more
deprived areas. These patterns were apparent in both ethnic groups, and

185
consistent with previously reported patterns in deprived areas.179 Examining the
overall mortality of the cohort, those in more deprived areas had a worse
prognosis than those in less deprived areas (age-adjusted HR 1.35, 95% CI 1.12-
1.52). Hence, the measure of deprivation appeared valid.

186
Table 37 MINAP - Admission characteristics comparing those in the most deprived quintile with the least deprived quintile, in South Asian and White
participants
Ethnic group South Asian White
Most deprived Least deprived p Most deprived Least deprived p
Risk factors
Age Over 65 133 (40.55) 195 (59.5) 0.061 1,655 (50.0) 2,043 (57.7) <0.001
Sex Men 254 (78.2) 65 (85.5) 0.151 2,222 (68.9) 2,533 (71.7) <0.001
Smoking Yes 146 (53.3) 23 (37.7) 0.028 2,374 (82.32) 2,003 (69.4) <0.001
Hypertension Yes 121 (41.6) 24 (34.3) 0.264 1,192 (38.9) 1,318 (39.9) 0.408
Hyperlipidaemia Yes 75 (27.2) 19 (29.7) 0.685 752 (25.6) 770 (75.3) 0.744
Diabetic Yes 121 (39.7) 21 (28.8) 0.084 431 (14.0) 375 (11.5) 0.002
Social environment
Distance from hospital Far (≥7.6km) 21 (6.4) 26 (34.2) <0.001 949 (28.4) 2,312 (65.3) <0.001
Clinical management
Secondary prevention
drugs
0-1 drugs
(fewer)
41 (12.5) 21 (27.6) 0.001 524 (15.7) 648 (18.3) 0.004
Teaching Hospital No 222 (67.7) 57 (75.0) 0.214 2,600 (77.8) 2,883 (81.4) <0.001
In-patient angiogram
done
No 102 (38.2) 22 (36.7) 0.825 1,370 (56.4) 1,314 (51.1) <0.001

187
Age-adjusted *Model 1 **Model 2 ***Model 3
Most deprived 0.72 (0.47-1.11) 0.85 (0.52-1.39) 0.89 (0.54-1.46) 0.96 (0.56-1.66) Deprivation
score quartile
Least deprived 2.34 (1.21-4.56) 1.72 (0.76-3.93) 1.64 (0.72-3.74) 2.18 (0.86-5.51)
HRs (95% CI) comparing South Asian vs White participants
*Model 1 - adjusted for age, smoking, diabetes, hypertension, hyperlipidaemia
**Model 2 - adjusted for age, smoking, diabetes, hypertension, hyperlipidaemia, secondary prevention medication
***Model 3 - adjusted for age, smoking, diabetes, hypertension, hyperlipidaemia, secondary prevention medication, use of
angiography, distance to hospital and type of hospital
Table 38 MINAP - Effect of deprivation on all-cause mortality at one-year comparing South
Asian and White participants
Adjustment for risk factors, secondary prevention medication, use of
angiography, distance to hospital and type of hospital did not significantly alter
the point estimates of worse prognosis seen in South Asian participants in less
deprived areas compared to White participants in those areas, though confidence
intervals were wider (Table 38).
9.7.4.5 Clinical management
South Asian participants were more likely to undergo in-patient coronary
angiography than White participants following acute coronary syndromes,
though received revascularisation less in the chest pain cohort. South Asian
participants were on fewer secondary prevention drugs at chest pain clinics,
equivalent treatment at angiography, and more treatment following acute
coronary syndromes. Stratified analyses by these clinical management types
revealed similar prognoses between ethnic groups, though in the acute coronary
syndrome cohort, South Asian participants who underwent in-patient
angiography had a worse prognosis compared to White participants who
underwent the procedure (HR 1.32 (1.04-1.66)).
9.8 Discussion
9.8.1 Objective addressed
By meta-analysing the results of the four studies of this thesis with eleven
previously published studies, I demonstrated a higher incidence of both fatal and
non-fatal coronary disease in South Asian compared to White populations but a
better prognosis for death following presentation with coronary disease in South
Asian compared to White populations. Thus, the higher cross-sectional coronary

188
mortality in South Asian compared to White populations10 is more likely to be
explained by the higher incidence of fatal and non-fatal coronary disease in
South Asian populations than a higher case fatality compared to White
populations.
9.8.2 Incidence
I have added new incidence data from Whitehall-II and shown a higher incidence
of both fatal and non-fatal coronary disease in South Asian compared to White
populations. There are few healthy population studies on the incidence of non-
fatal events in South Asian compared to White populations, and none on angina.
Whitehall-II demonstrates for the first time the higher incidence of non-fatal
events in South Asian compared to White populations.
9.8.3 Prognosis and factors affecting it
The higher incidence of coronary disease in South Asian compared to White
populations was in contrast to the lack of adverse prognostic consequences, as
prognosis for death was in fact better in South Asian populations.
9.8.3.1 Risk factors
Biologically, South Asian and White populations differ when presenting with
coronary disease. They tend to be younger, and more likely to be diabetic across
the spectrum of clinical presentations of coronary disease. Age however did not,
both on adjusted and stratified analyses, explain the better prognosis in South
Asian compared to White populations. Stratifying on diabetes revealed that
diabetes was not more likely to result in adverse outcomes in South Asian
populations, a surprise considering that glycaemic control is reportedly poorer
among South Asian people174 and that a higher risk of diabetes complications are
seen in this minority ethnic group compared to White people with diabetes.93 175
9.8.3.2 Disease severity
Differences in the severity of disease at presentation might contribute to ethnic
differences in prognosis but no evidence of this was found across a range of
markers of disease severity such as degree of angiographic coronary disease and
troponin level. A lower case fatality after hospitalisation for acute coronary
syndromes might occur if South Asian populations had a higher incidence than
189
White patients of death from myocardial infarction before reaching hospital. The
work by Fischbaker et al123 however suggests this is not the case, as 21 of the
126 first episodes of myocardial infarction recorded were sudden deaths in the
community among South Asian populations (16.7%) in comparison to 9672 out
of 30978 (31.2%) for non South Asian populations.
9.8.3.3 Clinical management
In patients with coronary disease, access to clinical management strategies will
be a factor in determining prognosis. A priori, one might have expected South
Asian patients to be under-managed for coronary disease and for this to be
associated with a worse prognosis. The lack of evidence on underuse of both
secondary prevention management and specialist investigation and treatment
among South Asian patients in the prognostic studies of this thesis contrasts with
previous literature reporting that South Asian patients are under-managed for
coronary disease29 This may reflect that care in minority ethnic groups is
improving, especially in the context of their predominantly inner-city locations
near major centres of cardiac care. South Asian patients may also have quicker
access to emergency treatment because of the proximity of their inner-city
residences to hospitals, though distance to hospital in our analyses again could
not account for the prognostic difference, nor did stratifying on use of
angiography. The TIMI phase II trial showed comparable 1-year mortality rates
in the White, Black, and Hispanic patients,180 demonstrating the efficacy of
appropriate, evidence-based treatment across demographic groups in a clinical
trial setting.
I examined further whether the relative size of the South Asian ethnic group in a
neighbourhood influenced the care hospitals provide, by excluding hospitals
which reported <5% South Asian patients in the acute coronary syndrome
cohort. I hypothesised that hospitals in areas of high South Asian populations
may be more accustomed to treating this minority ethnic group in the same way
that hospitals treating fewer cardiovascular cases are less likely to apply
evidence-based processes of appropriate care.181 However, this did not alter the
results.
190
9.8.3.4 Social environment
Analyses stratified by deprivation suggested that South Asian populations had a
worse prognosis than White populations in less deprived areas in MINAP, with a
similar suggestion from the point estimates in the chest pain clinic cohort. The
results from these exploratory analyses may be explained by unmeasured
confounders which could not be adjusted for. For instance, South Asian people in
less deprived areas may be more socially isolated from family and communities
compared to those in inner cities where the relative size of the South Asian
ethnic group within the neighbourhood is higher. The measurement of
deprivation may not take into account the increased social advantages to South
Asian people of living in tight-knit, ethnic-dense inner city areas and the impact
of local healthcare services specifically designed to serve those communities.
However, associations between social network size and cardiovascular risk
factors such as waist circumference, blood pressure and lipids have been
previously examined in White and South Asian populations and no relationship
found.182
There are however published studies that have suggested increased deprivation
is not always linked to worse ill-health. It has been previously reported that
more deprived South Asian patients with heart failure have better all-cause
mortality outcomes than less deprived White patients.183 South Asian patients
with heart failure were taking both ACE inhibitor and β blockers more commonly
at presentation in this study and the results may therefore suggest the possibility
of disease modification by pharmacological treatments known to improve
outcome in heart failure. Again, this study conducted stratified analyses similar
to those in MINAP – their findings were not biased by better survival of South
Asian patients with preserved left ventricular function, more common in South
Asian patients. Rather, survival was better for South Asian patients than White
populations with moderate left ventricular systolic dysfunction on
echocardiography. Thus, in this study as in MINAP, differing disease severity at
presentation could not explain differences in prognosis between South Asian and
White populations.

191
Whilst it is increasingly recognised that the social deprivation of areas influences
the aetiology and prognosis of coronary disease,105 large contemporary
prognostic studies with detailed and comparable data on deprivation are lacking.
For hospitals serving socially deprived communities it is important to
understand the interaction of social deprivation with ethnicity. This is crucial in
interpreting hospital league tables of outcomes (for which a dataset like MINAP
is a crucial tool) and in meeting key policy objectives to improve the health of the
worst-off in society.
Ethnic minority populations tend to be concentrated in areas of social
deprivation as I have found in my cohorts, but as Figure 16 illustrates this is not
a simple, or inevitable relationship. In London, boroughs like Camden (the 7th
most deprived borough in London with Bangladeshis constituting 61% of the
South Asian population) and Tower Hamlets (the most deprived borough in
London, with Bangladeshis constituting 91% of South Asian population), are far
more deprived than Harrow, one of the least deprived boroughs in London yet
containing a high proportion of South Asian people. Furthermore, Indians make
up 74% of the large South Asian population in Harrow. Hence, Indians appear
superficially to be more affluent than Bangladeshis. Thus, if Indians live in less
deprived areas than Bangladeshis, investigating the overall relationship between
the South Asian group and deprivation will require differences between South
Asian peoples to be taken into account. It may also be the case that if more
Indians live in rich areas than in poor areas, then the increased risk of mortality
for the South Asian group living in the least deprived areas could reflect the
increased mortality risk of the Indian population living in rich areas compared to
the (rich) White majority – in contrast, for the most deprived areas, it is plausible
that Bangladeshis have a better all cause mortality compared to poor White
people living in those deprived areas. Thus, the influence of social environment
requires appreciation of the heterogeneity of the South Asian population, and
this requires richer data.
In this thesis, the surprising data of the influence of deprivation on outcomes by
ethnic groups needs further work to fully confirm these findings, and to take into

192
account the effect of unmeasured, residual confounders within these
populations. More advanced analyses using multi-level level (hierarchical)
regression models to investigate the extent to which individual and area
deprivation and ethnicity may interact in their effects on prognosis of coronary
disease would thus be a next step.
Figure 16 Proportion of population classified as Indian, Pakistani or Bangladeshi at the
2001 Census and Indices of Multiple Deprivation Score 2004, by selected London boroughs
9.8.3.5 Symptomatic prognosis
Though prognosis for death (case fatality) appears better in South Asian
compared to White populations from this meta-analysis, symptomatic prognosis
and improvement in quality of life may differ by ethnicity. Analyses within ACRE
in chapter 7 showed that South Asian patients were less likely to have improved
angina than White patients six years after undergoing coronary
revascularisation. The use of a symptomatic outcome adds to the overall picture
of prognosis of coronary disease, as whilst prognosis for fatal events is no worse
in South Asian compared with White populations, prognosis for non-fatal

193
symptomatic may not be equitable by ethnicity. The earlier age of presentation
and the high rates of diabetes in South Asian populations will continue to cause
increased morbidity following presentation with coronary disease.
9.8.4 Limitations
Interpretation of the summary estimates requires caution. This meta-analysis
has important limitations:
• The studies were heterogeneous in their choice of populations and
methods, and access to the raw individual participant data from
previously published studies was not available to allow a more accurate
meta-analysis to be conducted. The I2 was particularly high for the
incidence studies at 47.6% (An I2 higher than 50% is deemed to be large
enough to question whether combining studies is valid), and thus this
should be considered when applying the findings in other settings.
• The studies by Wild and Balarajan included in the incidence analysis were
mortality studies and thus strictly not true incidence (first coronary
event) studies – however, death can be regarded as an incident event and
these studies were age-adjusted. The data presented by these two large
studies thus adds to the overall picture of incidence.
• The vast majority of participants studied for prognosis were those with
myocardial infarction rather than angina, of which a large proportion
were from MINAP. However, in both the chest pain clinic and coronary
angiogram cohorts, there was no indication that prognosis was any worse
in South Asian than in White participants. Combining patients with
myocardial infarction and angina arguably contributes to increased
heterogeneity – however, the focus of attention was on the examination of
case fatality following presentation with coronary disease between ethnic
groups, and hence the interest lies in comparison of longitudinal
outcomes irrespective of the actual clinical phenotype at presentation.
Thus, combining patients with differing clinical phenotypes remains of
194
value to the overall picture of prognosis of coronary disease between
ethnic groups.
• Some studies had follow-up data on all-cause death, and others data on
coronary death.
o However, a high proportion of early deaths following an ACS are
likely to be cardiac in cause - from the PRAIS UK registry
(Prospective Registry of Acute Ischaemic Syndromes in the UK),
the proportion of cardiovascular deaths was 92% in the first six
months.184
• Many of the studies on systematic review did not adjust for confounding
factors such as diabetes. Having access to individual participant data from
previously published studies could have in part reduced this limitation,
though this would have depended on whether data on factors such as
diabetes were collected.
9.8.5 Implications
9.8.5.1 Public Health
The dissociation between the aetiologic and prognostic findings suggests that
public health efforts to reduce ethnic disparities in mortality need to improve on
primary prevention, as provision of healthcare to those with manifest coronary
disease appears to be equitable between South Asian and White patients. By
providing appropriate care to all, inequity of outcomes for manifest coronary
disease may not result.
9.8.5.2 Clinical
It is conceivable however that the symptomatic prognosis and improvement in
quality of life may differ by ethnicity beyond the study of case fatality. Whilst it is
reassuring that prognosis in terms of case fatality seems no worse in South Asian
patients, continuing monitoring of prognosis is necessary in the light of the
higher incidence of coronary disease, the earlier age of presentation and
continuing high rates of diabetes in South Asian populations.

195
9.8.5.3 Research
The analyses stratified by deprivation suggesting that South Asian patients had a
worse prognosis than White patients in less deprived areas in MINAP was
counter to what would have been expected, and thus to ensure the correct
answer to this question is arrived at, richer individual and service data inputted
into such clinical registries and studies is required.
9.9 Conclusion
In contrast to the higher incidence of coronary disease in South Asian compared
to White populations, once coronary disease is manifest, their prognosis in terms
of future risk of death may be better. Public health efforts to reduce ethnic
disparities in mortality need a heightened focus on primary prevention whilst
ensuring that equitable management of manifest coronary disease continues to
result in equitable prognosis between ethnic groups.

196
10 Discussion
10.1 Overall findings
The index finding underlying this thesis is the higher coronary mortality in South
Asian compared to White populations in the UK. The aim of the thesis was to
investigate the relative contributions of incidence and prognosis of coronary
disease to these higher mortality rates observed in South Asian compared to
White populations. Overall, this thesis found that these increased coronary
mortality rates in South Asian populations are due to their higher incidence of
fatal and non-fatal coronary disease, as the prognosis in South Asian populations
of manifest coronary disease is not worse than in White populations.
As coronary disease is an aggregation of differing phenotypes such as angina and
myocardial infarction, the thesis sought to separate these phenotypes and
examine their incidence and prognosis. It then sought to further disaggregate
angina by nature of symptoms, which varies by ethnic group, and myocardial
infarction by severity, using biomarker-based diagnoses. As prognosis can be
measured by both coronary events (such as death/myocardial infarction) but
also future quality of life, the receipt and impact on improving angina symptoms
of management strategies for chronic coronary disease was examined between
South Asian and White populations. This is of importance as receipt and efficacy
of management strategies for chronic coronary disease may differ between South
Asian and White populations.
My specific objectives were as follows, and answered thus:
(i) To determine the incidence and prognosis of angina in healthy
South Asian and White populations
There was a higher cumulative incidence of typical angina and exertional chest
pain in South Asian compared to White populations using a detailed
characterisation of symptoms of stable angina using the Rose questionnaire at

197
seven time-points over 18 year follow-up. There was not a higher incidence of
non-exertional chest pain in South Asian compared to White populations. In both
South Asian and White populations, typical angina and exertional chest pain at
baseline were associated with increased rates of future coronary events when
compared to those with no chest pain, but those with non-exertional chest pain
did not have a worse prognosis compared to those with no chest pain. South
Asian populations had a worse long-term prognosis than White populations
within all types of chest pain though South Asian populations with no chest pain
at baseline were not at more long-term risk than White populations with no
chest pain at baseline.
(ii) To determine in those presenting with incident chest pain whether
differences exist in the description of symptoms between South Asian and
White populations, and the impact symptom descriptors have on
prognosis and receipt of management strategies for chronic coronary
disease
Although atypical chest pain was more common in South Asian than White
populations within a chest pain clinic, typical angina compared to atypical chest
pain was as likely to be associated with a worse prognosis in South Asian as in
White populations. Although South Asian populations attending chest pain
clinics did report a marked excess of atypical symptoms, the rate of subsequent
adverse coronary outcomes in this group was similar in White and South Asian
populations. However South Asian populations were less likely to receive
coronary angiography and revascularisation than White populations in both
those with typical angina and atypical chest pain.
(iii) To determine impact on symptomatic prognostic outcomes
(change in angina severity) in South Asian and White populations from
management strategies for chronic angina
South Asian populations were less likely to experience long-term improvement
in angina following coronary revascularisation when compared to White
populations, despite a similar prognosis for adverse clinical events such as

198
myocardial infarction and death, even after having taken into account
appropriateness for revascularisation and differences in clinical characteristics.
(iv) To compare fatal prognostic outcomes of acute coronary
syndromes in South Asian and White populations and assess factors
underlying prognosis
Survival in South Asian populations was no worse than White populations at one
year, even after adjustment of confounding factors. Factors such as diabetes,
more prevalent in South Asian populations, nor any other risk factors, clinical
management strategies and socio-economic characteristics did not appear to
confer a worse prognosis in South Asian compared to White populations.
(v) To assess the contribution of incidence and prognosis to the higher
coronary death rates in South Asian compared to White populations
through meta-analysis of new and previously reported studies
By meta-analysing the results of my own studies with eleven previously
published studies found on systematic review, the results reveal that incidence
of coronary disease was higher in South Asian compared to White populations
yet prognosis was better in South Asian populations. Thus, the higher coronary
mortality in South Asian compared to White populations is likely to be explained
by the higher incidence of coronary disease in South Asian populations rather
than worse survival from coronary disease.
10.2 Implications
10.2.1 Aetiology and primary prevention within primary care
The relatively small number of South Asian civil servants in the Whitehall-II
cohort, with their relatively low prevalence of diabetes, did not allow aetiologic
questions to be reliably addressed (why the higher incidence?). Clearly, a priority
of future research is to unravel why South Asian populations have more diabetes
than White populations.
The Whitehall-II cohort revealed a higher incidence of angina in South Asian
compared to White people. The measurement of this angina through the Rose

199
questionnaire allowed the discrimination of prognostically-important chest pain
from non-exertional chest pain that was associated with a lower rate of adverse
events. Therefore, the use of the Rose questionnaire to assess the early
presentation of chest pain was found to have prognostic validity in South Asian
as well as in White populations, and may allow its use in early detection of
angina to target clinical management to prevent progression to more adverse
outcomes.
10.2.2 Secondary prevention within hospital care
By managing true angina well (such as in a chest pain clinic), equitable outcomes
may result irrespective of the ethnic group. Whitehall-II revealed a worse
prognosis in South Asian compared to White people in those with typical angina.
This contrasted with the finding from the Chest Pain Clinic study which showed
that typical angina did not predict a worse outcome in South Asian compared to
White people. Whitehall-II was a purely observational cohort, and thus it is
conceivable that those South Asian people with typical angina went undiagnosed
and hence unmanaged (unlike in the chest pain clinic cohort, whose participants
were within a healthcare setting).
South Asian populations may continue to suffer increased morbidity following
presentation with acute coronary disease on account of their higher rates of
diabetes and this disease’s ensuing complications. The coronary angiogram
cohort showed that though the prognosis in those with angina in terms of
subsequent events such as myocardial infarction and death was not worse in
South Asian compared to White populations, South Asian patients were less
likely to experience long-term improvement in angina following coronary
revascularisation when compared to White patients. As the relief of angina
determines return to work and perceived health status,48 research on functional
outcomes is of importance. As coronary mortality rates fall, morbidity in the
form of angina becomes a more common clinical problem.
10.2.3 Further research
Few studies have collected data on chest pain symptom descriptors by ethnic
groups, and none have examined their prospective validity. The increased

200
prevalence of atypical pain in South Asian people may be a reason why the
improvement in angina in South Asian patients following revascularisation is
poorer than in White patients. If ACRE had had information on typicality of pain,
this would have aided interpretation of the analyses.
Using registry data to answer epidemiological questions has considerable cost-
saving potential. That survival in South Asian patients following presentation
with acute coronary syndromes was better than White patients at one year, even
after adjustment of confounding factors may be a vindication of care in
previously under-managed minority ethnic groups. This will encourage doctors
and public health professionals than inequalities can be successfully addressed.
However, to be able to use routinely-collected clinical data in research will
require careful data quality checking and the usage of inbuilt entry/range checks.
10.2.4 Public health
The combination of higher incidence and similar prognosis in South Asian
compared to White populations of coronary disease, coupled with the general
aging of the whole UK population, will lead to an increase in the size of the
prevalent pool of South Asian people with coronary disease. Thus, though
coronary mortality rates may continue to drop, the total burden of coronary
heart disease in South Asian populations is likely to increase. Hence,
disaggregation of cross-sectional coronary mortality rates into incidence and
prognosis, and by differing clinical presentations such as angina and myocardial
infarction, is essential for the complete understanding of the epidemiology of
coronary disease in different ethnic groups.
This thesis demonstrates that the health of South Asian populations in some
respects - such as with regard to one-year case fatality after presentation with an
acute coronary syndrome - is not worse than the majority White population.
Such results should serve to stimulate further research into discovering more
about the aspects of service provision that are responsible for these
improvements in ethnic disparities. Not collecting any ethnicity data at all (the
case in countries such as France) would mean that quantification of ethnic

201
disparities and hence instigation of measures to alleviate them and hence
measurement of their improvement would not be possible at all.
10.3 Limitations
10.3.1 Definition and validation of ethnicity
Ethnic inequalities in public health continue to be highlighted and hence
analyses of any data concerning ethnic groups remain of vital importance though
need due caution and careful validation. As the main exposure of interest to this
thesis was ethnicity, the comparability of measures of ethnicity within the four
cohorts was of importance. However, the four cohorts defined ethnicity in
differing ways. Ethnicity in Whitehall-II was defined according to the Office for
National Statistics 1991 census types. In the Chest Pain Clinic Cohort, the doctor
ascribed ethnicity as “Asian”, “White”, “Black” or “other” during the consultation.
In the coronary angiogram cohort, self-assigned ethnicity, based on the national
1991 census classification, was obtained by questionnaire on the day of index
coronary angiography. In the acute coronary syndrome cohort, the patient's
ethnic group was classified by the coder into the groups Caucasian, Asian, Black,
Oriental and other.
Though the four studies used differing methodology to define ethnicity, analyses
on the ethnicity variable of each cohort confirmed validity of the measures in
each cohort. Thus, though due care should be taken in the usage of the ethnicity
variable in epidemiology, this work shows the importance of collecting data on
ethnicity. A future gold standard for measuring ethnicity would use a self-
assessed measure and include information on country of birth, religion and
nationality of the participant and their parents to take into account the
heterogeneity within the South Asian population as well as the differences that
exist between a first-generation migrant and their progeny.
10.3.2 Heterogeneity of South Asians and whites
Cardiovascular risk within South Asian peoples is heterogeneous. For instance,
Bangladeshis are shorter, are less obese and have a lower mean blood pressure
than other South Asian peoples yet their risk of developing cardiovascular
disease and diabetes is the highest of all the South Asian ethnic groups.17 116

202
Beyond biological differences, differences in the individual reasons for migration
(e.g., economic, educational, political) and differences in baseline literacy and
skills will result in further heterogeneity. Demobbed soldiers will be different
from ship's cooks who will be different from doctors or others from professional
and mercantile backgrounds. This will also influence the future socio-economic
and educational/professional status of their children. There is increasing
evidence that those of the lowest socio-economic status, those of Pakistani and
Bangladeshi origin, have the highest rates of coronary disease.20 185
The majority of published literature in ethnicity and health has aggregated
migrants from the different geographical, religious and linguistic backgrounds
from the sub-continent as South Asian. Studies are increasingly disaggregating
this ethnic group into the different nationalities, cultures and religions
represented within it. Although in ACRE and Whitehall-II there were data on the
breakdown of the studies’ South Asian populations into Indians, Bangladeshis,
Pakistani and Sri Lankan, there were too few numbers for analysis.
Equally, as discussed in section 1.3.2, these analyses only apply to White
populations based mostly in England and Wales. The comparisons cannot be
applied to Scotland and Ireland, to migrants from those countries to England and
Wales, and to White migrants from Southern and Eastern Europe.
10.3.3 Definition and validation of chest pain and angina
Angina is a clinical constellation of symptoms rendering quantitative
measurement difficult. Acute coronary syndromes can be measured in terms of
biomarkers such as troponin - stable angina does not have a comparable blood
test to measure it. Thus, it is difficult to compare cases of angina enrolled in one
study with those in another, and indeed I have used three different measures of
angina in the three cohorts. The advantage to the use of differing definitions of
angina is in allowing differing questions to be asked. For instance, using the four-
level CCS score in ACRE allowed severity calculation of a change in angina, while
the Rose questionnaire has only two levels of severity. However, using the Chest
Pain Clinic study’s symptom score within ACRE to determine whether the pain
was typical or atypical would have aided in determining why angina was

203
improving less in some compared to others. The ACRE study assumed all CCS
angina was in fact typical angina which may not have been the case. The Chest
Pain Clinic study might have been enhanced if data were available on the
findings of subsequent coronary angiography if it took place, though from ACRE,
there was little correlation between number of diseased coronary vessels and
CCS score. This is not unreasonable, as one single severely stenosed coronary
artery is likely to be highly symptomatic.
Though different case definitions for angina were used in Whitehall-II, Chest Pain
Clinic Study and ACRE, there was some consistency in the results. For example,
typical pain had a poorer outcome than atypical, be it pain defined by the Rose
questionnaire or by the symptom score formulated from chest pain descriptors
in the Chest Pain Clinic Study. However, within the atypical type of chest pain,
they may still be patients with coronary disease who go on to develop adverse
coronary outcomes. This is applicable to both ethnic groups, though considering
those with a confirmed myocardial infarction, chest pain is still more likely to be
atypical in nature in South Asian compared to White patients.40 45 46 Typical
symptoms thus represent a filter for patients with suspected angina for further
investigation, and that which can be improved by coronary disease management
strategies.
Poor communication due to language difficulties have long been offered as an
important factor relating to the health outcomes and experiences of health care
for members of the South Asian community.186 However, throughout the
analyses of this thesis, the measures of chest pain used had equal cross-sectional
and prognostic validity in South Asian and in White populations. The
ethnographic qualitative study of 59 clinic consultations performed by
colleagues at Newham University Hospital also showed how the chest pain
classification and diagnosis were reached,159 and there was little evidence that
this negotiation was patterned by ethnicity. None of the South Asian patients in
this study relied on translators. It may be that the major differences between
South Asian patients who are not fluent in English and White will be longer

204
consultations than White patients187 and increased dissatisfaction with medical
care188 rather than an adverse prognosis.
10.3.4 Data quality and validity
The cohorts for study in this thesis, selected on account of the coverage they
provide across the different stages of the natural history of coronary disease,
used very different methodologies. I sought to examine the quality and validity of
this data throughout this thesis. In chapter 4, I assessed recruitment of baseline
data through to data on follow-up and found that data, though variable in its
completeness between the studies chosen for this thesis, was of good quality.
Validity of specific variables essential to prognostic analyses was assessed in
cross-sectional and prospective analyses within all four cohorts. When
examining angina for example, in Whitehall-II there was an increasing
prevalence of hypertension and higher cholesterol levels with more typical chest
pain and trends towards more metabolic syndrome and higher body mass index.
In the Chest Pain Clinic study, typical symptoms strongly predicted a positive
exercise ECG result, and both the cardiologist summary and the symptom score
of typical symptoms were predictive of a diagnosis of angina across sex and
ethnicity. In ACRE, the CCS variable, calculated from a patient questionnaire,
correlated with South Asian patients having a higher prevalence of primary care
doctor-diagnosed angina at follow-up. Increasing angina as measured by CCS at
baseline was associated with worsening patterns in other baseline clinical
measures and higher rates of prospective all-cause mortality.
Hence, though data across the four cohorts varied in definitions and
completeness, a range of checks on data quality and validity ensured any
conclusions made from the results of the analyses were not biased.
10.4 Future work
10.4.1 Improving the measure of angina
Until standardised case definitions for angina are agreed, prevalence and
prognostic assessments will remain variable and contradictory. Case definitions

205
of angina rely on the presence of one of more findings in three domains. These
domains are represented in the figure below.
A – Anatomy
F – Function
S – Symptoms
Figure 17 Differing angina phenotypes: anatomy, symptoms and function domains
o Anatomy of coronary arteries’ lesions may be data from coronary
angiography (both invasive and computerised tomography).
o Function in terms of ischaemia may be data from exercise ECG, stress
echocardiography, myocardial perfusion imaging and magnetic resonance
imaging.
o Symptoms may be data from the Rose angina questionnaire, symptom
descriptors, CCS classification and nitrate use.
Finding an instrument to measure angina will require the definition of the angina
phenotype in the first instance in terms of symptoms, anatomy and functional
findings. An atheromatous plaque causing coronary vessel narrowing visualised
on angiography and ischaemic changes on exercise ECG may not in itself cause
ischaemic symptoms for example and thus span the A and F cells. Syndrome X,
with its anginal symptoms and positive exercise test but normal coronary
anatomy would span the F and S cells.
Differing phenotypes of angina may be built up using a composite of measures
and the use of these will be dictated by the questions asked of the proposed

206
research. It is possible that multiple phenotypes underlying angina will result.
Different combinations here will give different syndromes, and there may ethnic
differences in any of the seven cells of the Venn diagram above.
10.4.2 Improving the quality of the data and statistical methodology
Throughout this thesis, I assessed both data quality and validity though
techniques available to me. To further improve the data, more advanced
statistical methodology could be employed.
10.4.2.1 Propensity scores
Propensity scores can be used to reduce bias in observational studies. The lack of
randomisation in such studies can complicate prognostic analyses as these
comparisons may be biased due to prognostically important baseline differences
among patients, often as a result of unobserved treatment selection biases. This
would bias for example the comparison of patients with typical and atypical pain
within the chest pain clinic. Within ACRE, an observational study of invasive
procedures, such studies are more prone to bias because patients who are
candidates for the procedure often differ in immeasurable ways from patients
who are not. Doctors may also be more risk averse in selecting those needing
further invasive investigation, performing interventions on lower-risk patients
despite greater clinical benefit to higher-risk patients (such as reduced
prescription of statins in elderly patients with a higher future probability of
death).189 190 The propensity score for an individual is defined as the probability
of being treated conditionally on (or only on the basis of) the individual’s
covariate values and was originally proposed as a method for producing a
balance of many covariates between two groups.191 192
However, propensity-based matching have the same limitations as multivariable
risk adjustment model methods if unmeasured variables that may determine
allocation to one exposed group compared to another are not measured. They
also cannot overcome initial selection bias.193
10.4.2.2 Multiple Imputation of Baseline Data
Imputation is a procedure used for entering a value for a specific data item
where the response is missing or unusable. It uses the principle that missing data

207
can range from being missing completely at random (where no other
information in the database can predict reasons for data missingness) to being
not missing at random, where a systematic pattern of missingness is found (e.g.,
one of the centres of a multi-centre study may not have a sphygmomanometer
and thus no recordings of blood pressure were taken at that centre). The
technique relies on the capacity of the database to predict associations between
exposure and missingness, and requires that every variable used in the statistical
model takes account of imputation, not just those that predict missingness.
The technique has been used and described in large observational studies in
cardiovascular disease. The success of this technique depends on the wealth of
covariate data available within the dataset. The Cardiovascular Health Study, a
population-based study designed to identify risk factors for cardiovascular
disease in individuals aged 65 or more years in the US, has reported on this
technique.194 It is a relevant example to this thesis as there existed two separate
cohorts within this study (which were enrolled in different years) with
differences in the data collected, in particular differing substantially in their
numbers of African American participants. The richness and slight redundancy of
the Cardiovascular Health Study data set allowed the researchers to impute
groups of similar and highly correlated variables together – they gave the
example of heart rate, measured at four different times. Multiple Imputation has
also been used in Whitehall-II to assess the association between persistent
economic difficulties and serious coronary events.195
10.4.3 Linkage of databases
10.4.3.1 Linking secondary care data with primary care data
The three prognostic cohorts examined within this thesis have all recruited
participants in the secondary care setting, at different points along the natural
history of coronary disease. However, no information was available in any of the
cohorts before and after (aside from outcomes) on other healthcare data.
Linkage with data from primary care sources such as the General Practice
208
Research Databasen (GPRD) may augment secondary care data sets and provide
more information on the patient journey along the natural history of coronary
disease - such as information on earlier events (e.g. onset of hypertension) - that
will provide more explanatory data for investigating the aetiology of events such
as angina and myocardial infarction. The GPRD is a computerised database of
anonymised longitudinal medical records from primary care that can be linked
with other healthcare data. Currently data are available on around 13 million
patients from around 488 primary care practices throughout the UK. By linking
MINAP data to the GPRD, such a resource would be able to identify the extent
and prognostic impact of missed opportunities for preventive care earlier in the
patient journey.
The influence of primary care on variation in prognosis is also of vital
importance. Within MINAP, no data were available on healthcare between
admission and follow-up for vital status at one year. Prognostic analyses thus
cannot take into account the care received in primary care after an admission
with an acute coronary syndrome and thus its influence on outcomes. This is
commonly the case for hospital-based follow-up studies, as secondary
prevention is deemed to be the remit of primary care.
The GPRD currently does not record ethnicity at the individual patient level, but
other primary care research databases like QRESEARCH do.o QRESEARCH is a
database derived from the anonymised health records of over 11 million patients
from 574 general practices using the EMIS clinical computer system. The
practices are spread throughout the UK and include data from patients who are
currently registered with the practices as well as historical patients who may
have died or left. Thus, multiple databases may be linked to ensure the
availability of the necessary data fields for a research hypothesis.
n http://www.gprd.com
o http://www.qresearch.org

209
10.4.3.2 Linking secondary care data with other secondary care data
Linkage of secondary care databases and studies with data sources such as
Hospital Episode Statistics (HES) will allow the addition of information such as
cause-specific future admission to databases such as MINAP. HES is the national
statistical data warehouse for England of the care provided by NHS hospitals and
for NHS hospital patients treated elsewhere. The two main clinical classifications
currently used in HES are the International Classification of Diseases, Tenth
Revision from which descriptions of the conditions treated or investigated can be
obtained and the Office of Population, Censuses and Surveys: Classification of
Interventions and Procedures, 4th Revision which records details of procedures
or interventions performed.
10.4.4 The influence of genetics
Differences in genetic susceptibility may be responsible for part of the variation
of coronary heart disease rates between ethnic groups. In twin studies, the
relative hazard of death from premature coronary heart disease (age less than
55) when one's twin died of coronary heart disease is eight times higher in men
and 15 times higher in women, even after taking into account other risk factors
for coronary heart disease.196 Similar findings of familial aggregation have been
reported in North-Eastern Indian origin South Asian people in Mauritius, where
a study has reported a 7.4-fold increased prevalence of coronary disease in
siblings of individuals with myocardial infarction.197
Detailed investigation into the causes of the increased incidence of coronary
disease observed in South Asian populations was beyond the remit of this thesis,
but the increased prevalence of the metabolic syndrome and diabetes mellitus in
this population is the most widely-held explanation.198 199 Though much of this
excess is thought to be due to environmental factors, genetic factors may play a
role in determining the level of such risk factors. An inherited susceptibility to
type 2 diabetes may derive from multiple genes of individual modest effect,200
and a component of insulin resistance, more prevalent in South Asian
populations,201 may be inherited.202 The thrifty gene hypothesis proposes that
conditions of food scarcity increased evolutionary selection pressure for efficient
metabolism, which then disadvantages those who become exposed to the
210
modern obesogenic environment, the supposed combination facing the migrant
from South Asia.203 Genes and pathways involved in the insulin resistance
metabolic syndrome may underlie this.
The recent advances in the understanding of the human genome have opened up
possibilities for new biological insights, new clinical insights, and new clinical
applications. Genome-wide association studies have for example found an
association between myocardial infarction and a common sequence variant on
chromosome 9p21.204 A genome-wide association study for insulin resistance
and related phenotypes in 2684 Indian Asian people, with further testing in
11955 individuals of Indian Asian or European ancestry, found associations of
the allele rs12970134 (near the Melanocortin 4 receptor MC4R, a human gene
near which common genetic variation is associated with risk of adiposity and
insulin resistancep) with waist circumference and independently with insulin
resistance.205
Such future work in genetics will help to unravel the interaction of genes with
the environment, and may play a role in explaining the dissociation between the
higher incidence of coronary disease in South Asian compared to White
populations and the similar prognosis between the two ethnic groups. Such
future work should also be designed to allow investigations on whether
differences exist between South Asian peoples and thus whether the
heterogeneity of this group is predominately socio-economic and behavioural or
biological.
10.4.5 South Asians in South Asia
In South Asia today, an epidemiological transition is taking place against a
background of economic globalisation that has greatly increased the size of the
urban poor and middle classes, at the same time leaving many millions to
continue living on the land at subsistence level. There is an emerging double
burden of disease in the countries of South Asia, characterised by a combination
p Homozygotes for the risk allele of rs12970134 have approximately two cm increased waist
circumference.
211
of pandemic infectious disease and high rates of coronary disease. Though
coronary risk factors tend to be concentrated in those of higher social classes,206
the poor in India are increasingly affected. Higher levels of tobacco consumption
are associated with low levels of education and income207 and both urban slums
in Delhi and rural south India have a high prevalence of diabetes and
dyslipidaemia. The high prevalence of coronary risk factors such as smoking,
high blood pressure and overweight in areas of rural India are also of concern.208
The answers to research questions surrounding ethnic differences in coronary
health may thus increasingly come from the sub-continent. Regional endeavours
such as registry data collection are already providing answers on treatment
outcomes.209 CREATE is such an endeavour which, in a study design similar to
MINAP, recruits eligible patients with suspected acute coronary syndrome in 89
centres from 10 regions and 50 cities in India. Many of the data fields are
common to MINAP and comparisons can be made to CREATE. Time from
symptom onset to presentation at hospital is typically longer in India than in the
UK for example, the delay in presentation being due to a lack of symptom
awareness, longer distances travelled to reach hospital and problems of
transportation (only 5.4% of patients are brought to hospital in an ambulance,
with the large majority using public transport (buses) and hired vehicles (taxis,
autorickshaws).210 In addition, older people and women have been observed to
present disproportionately late, irrespective of whether their symptoms were
typical or atypical. Thus, there is much potential for the reciprocal exchange of
ideas as well as collaborative work between such registries.
10.4.6 Generational effects
My data mostly concern ‘first-generation’ migrants from South Asia. It is unlikely
that a large proportion of the South Asian people in my cohorts were born in the
UK, as even the oldest second-generation South Asian people are only now in
2009 beginning to enter their 40s.
However, it is a pertinent question to ask whether the sons and daughters of
first-generation South Asian migrants will be at equal risk. Decreasing mortality
with increasing duration of residence in the new host country was observed for

212
migrants from South Asia in a study in a study in Australia,155 perhaps due to
cardio-protective behavioural practices in the Australia. However, studies in the
UK have presented opposite results to the Australian work, with increasing
cardiovascular risk with length of residence among South Asian migrants.211
The interaction of behavioural practices and socio-economic patterns awaits
further elucidation. The coronary risk of a group of educated and affluent
second-generation South Asian people may more resemble that of a similarly
educated and affluent White group, as opposed to a less educated group and less
affluent group of second-generation South Asian people. It is here that perhaps
the heterogeneity of the South Asian group may become increasingly important
in the future. It is interesting that apart from Indian people, minority ethnic
groups (including Pakistani/Bangladeshis) are found to be more likely than
White majority groups to engage in poor dietary behaviours in a study of
adolescent and parental lifestyles, with those born in the UK and girls being more
susceptible.212 Thus, some South Asian peoples may inherit (more so through
their behaviour than their genes) the diseases of their parents, whilst others –
like the offspring of some professional Indian classes – acquire the disease
profile of the majority White population.
Beyond socio-economic mechanisms, the influence of biology may continue to
adversely affect the children of South Asian migrants. South Asian populations
have a smaller superficial subcutaneous adipose tissue compartment than White
populations and a theory has been proposed that babies born to mothers of
South Asian descent are smaller and have less peripheral fat, and that during
subsequent growth and development immersed in the richer diet of the
developed world, this primary compartment reaches its capacity for fat storage
rapidly and the deep subcutaneous and visceral compartments become more
prominent, with adverse consequences for risks of diabetes and coronary
disease.213 Early evidence of ethnic differences in coronary risk has also been
presented in a cross sectional comparison of British South Asian and White
children, with ethnic differences being present even in these children aged 8 to
11 years – an increased tendency to insulin resistance was observed in South

213
Asian children, and the authors inferred an increased sensitivity to adiposity as a
result.51
The finding that second-generation minority ethnic groups in England continue
to report as poor a general health as their parents, unaffected by changes in
health behaviours,214 suggests that continuing investigation into ethnic
inequalities in health will be needed in the progeny of first-generation migrants.
10.4.7 Ethnic inequalities in other diseases
In a study in the UK of increasing cardiovascular risk with length of residence
among South Asian migrants,211 increased cancer mortality of South Asian
migrants was also shown to increase with duration of residence in England and
Wales. Increasing adoption of the detrimental aspects of the developed world
lifestyle is resulting in a shift of epidemiological patterns of cancers in South
Asian people living in the developed world towards that of the majority
population. With increased time since migration and increasing life expectancy
amongst ethnic minorities, disease patterns will start to resemble that of the
majority population. This was highlighted over ten years ago.215
The heterogeneity of South Asian people becomes particularly important when
comparing behavioural practices that may in turn determine a shift in future
epidemiological disease patterns. 43% of Bangladeshi men smoke compared to
the national average of 27%.216 Bangladeshis have also been found to tend to rely
on willpower rather than health service interventions, resulting in poor quit
rates217 whilst ethnic minority patients were significantly less likely to receive
advice on smoking cessation in one study.218 Much of the UK Bangladeshi
community are classified as having low socioeconomic status, high rates of
unemployment and low levels of formal female employment,219 and with higher
smoking rates being found in inner-city ethnic minority communities,220 the
finding that those in higher social classes have higher quit rates221 is a further
source of inequity. If lung cancer mortality reflects smoking habits of populations
20-30 years previously as has been proposed,11 the likely progression from
contemporary behavioural changes to future incidence and mortality data is all
too predictable.

214
11 Conclusions
A systematic review of the literature revealed incidence of fatal coronary disease
to be higher in South Asian compared to White populations, with few studies
available on non-fatal incidence. When considering prognosis, the literature was
unable to answer whether prognosis was worse in South Asian compared to
White populations.
South Asian populations had a higher incidence of typical angina over long-term
follow-up compared to White populations, but not a higher incidence of non-
exertional chest pain. Typical angina was predictive of coronary death and non-
fatal myocardial infarction on long-term follow-up, but non-exertional chest pain
was not, in both South Asian and White populations.
South Asian populations with typical chest pain, though at increased risk of
adverse coronary outcomes compared with those who presented with atypical
pain, had lower rates of coronary angiography and revascularisation compared
with White populations with typical chest pain.
South Asian patients were less likely to have improved angina than White
patients on long-term follow-up after undergoing coronary revascularisation,
even after having taken into account appropriateness for revascularisation and
differences in clinical characteristics. South Asian patients with chronic angina
were not at increased risk of coronary death and non-fatal myocardial infarction.
Survival following acute coronary syndromes was not worse in South Asian
compared with White patients and this was not explained by risk factors, clinical
management strategies or socio-environmental factors.
On meta-analysing the studies of this thesis with previously published literature
retrieved on systematic review, there was a higher incidence of coronary disease
in South Asian compared to White populations but once coronary disease is
manifest, their prognosis was better.

215
12 References
1. Shaper AG, Jones KW. Serum-cholesterol, diet, and coronary heart-disease in Africans and
Asians in Uganda. Lancet 1959;2:534-7.
2. Miller GJ, Beckles GL, Alexis SD, Byam NT, Price SG. Serum lipoproteins and susceptibility of
men of Indian descent to coronary heart disease. The St James Survey, Trinidad. Lancet
1982;2(8291):200-3.
3. Adelstein AM. Some aspects of cardiovascular mortality in South Africa. Br J Prev Soc Med
1963;17:29-40.
4. Pedoe HT, Clayton D, Morris JN, Brigden W, McDonald L. Coronary heart-attacks in East
London. Lancet 1975;2(7940):833-8.
5. Walker AR. The epidemiology of ischaemic heart disease in the different ethnic populations in
Johannesburg. S Afr Med J 1980;57(18):748-2.
6. Griffiths C, Brock, A. Twentieth century mortality trends in England and Wales. Health Stat Q
2003:5-17.
7. Peterson S, Peto V and Rayner M. Coronary Heart Disease Statistics. London: British Heart
Foundation, 2004.
8. Balarajan R. Ethnic differences in mortality from ischaemic heart disease and cerebrovascular
disease in England and Wales. BMJ 1991;302(6776):560-4.
9. Balarajan R, Bulusu L, Adelstein AM, Shukla V. Patterns of mortality among migrants to
England and Wales from the Indian subcontinent. Br Med J (Clin Res Ed)
1984;289(6453):1185-7.
10. Wild S, McKeigue P. Cross sectional analysis of mortality by country of birth in England and
Wales, 1970-92. BMJ 1997;314(7082):705-.
11. Harding S, Rosato M, Teyhan A. Trends for coronary heart disease and stroke mortality
among migrants in England and Wales, 1979-2003: slow declines notable for some
groups. Heart 2008;94(4):463-70.
12. Wild SH, Fischbacher C, Brock A, Griffiths C, Bhopal R. Mortality from all causes and
circulatory disease by country of birth in England and Wales 2001-2003. J Public Health
(Oxf) 2007;29(2):191-8.
13. Fischbacher CM, Steiner M, Bhopal R, Chalmers J, Jamieson J, Knowles D, et al. Variations in all
cause and cardiovascular mortality by country of birth in Scotland, 1997-2003. Scott Med
J 2007;52(4):5-10.
14. Sheth T, Nair C, Nargundkar M, Anand S, Yusuf S. Cardiovascular and cancer mortality among
Canadians of European, south Asian and Chinese origin from 1979 to 1993: an analysis
of 1.2 million deaths. CMAJ 1999;161(2):132-138.
15. Palaniappan L, Wang Y, Fortmann SP. Coronary heart disease mortality for six ethnic groups
in California, 1990-2000. Ann Epidemiol 2004;14(7):499-506.
16. Cooper R. A note on the biologic concept of race and its application in epidemiologic research.
Am Heart J 1984;108(3 Pt 2):715-22.
17. Gill P, Kai, J., Bhopal, RS., Wild, S. . Health care needs assessment: black and minority ethnic
groups. In: Stevens A, Raftery, J., Mant, JM. , editor. Health Care Needs Assessment.The
epidemiologically based needs assessment reviews. Oxford Radcliffe Medical Press, 2005.
18. Shankar L, Srikanth, R. A Part, Yet Apart:South Asians in Asian America. Philadelphia PA:
Temple University Press, 1998.
19. Bhopal RS. Heterogeneity among Indians, Pakistanis, and Bangladeshis is key to racial
inequities. BMJ 2002;325(7369):903a-.
20. Bhopal R, Unwin N, White M, Yallop J, Walker L, Alberti KGMM, et al. Heterogeneity of
coronary heart disease risk factors in Indian, Pakistani, Bangladeshi, and European
origin populations: cross sectional study. BMJ 1999;319(7204):215-220.
21. Hayes L, White M, Unwin N, Bhopal R, Fischbacher C, Harland J, et al. Patterns of physical
activity and relationship with risk markers for cardiovascular disease and diabetes in
Indian, Pakistani, Bangladeshi and European adults in a UK population. J Public Health
Med 2002;24(3):170-8.
22. Harding S, Balarajan R. Mortality of third generation Irish people living in England and Wales:
longitudinal study. BMJ 2001;322(February 24, 2001):466-467.

216
23. Morris RW, Wannamethee G, Lennon LT, Thomas MC, Whincup PH. Do socioeconomic
characteristics of neighbourhood of residence independently influence incidence of
coronary heart disease and all-cause mortality in older British men? Eur J Cardiovasc
Prev Rehabil 2008;15(1):19-25.
24. Hanlon P, Lawder RS, Buchanan D, Redpath A, Walsh D, Wood R, et al. Why is mortality higher
in Scotland than in England and Wales? Decreasing influence of socioeconomic
deprivation between 1981 and 2001 supports the existence of a 'Scottish Effect'. J Public
Health 2005;27(June 1, 2005):199-204.
25. Senior PA, Bhopal R. Ethnicity as a variable in epidemiological research. BMJ
1994;309(6950):327-30.
26. Gomez SL, Kelsey JL, Glaser SL, Lee MM, Sidney S. Inconsistencies between self-reported
ethnicity and ethnicity recorded in a health maintenance organization. Ann Epidemiol
2005;15(1):71-9.
27. Berenson GS, Srinivasan SR, Bao W, Newman WP, 3rd, Tracy RE, Wattigney WA. Association
between multiple cardiovascular risk factors and atherosclerosis in children and young
adults. The Bogalusa Heart Study. N Engl J Med 1998;338(23):1650-6.
28. Abrams J. Chronic Stable Angina. N Engl J Med 2005;352(June 16, 2005):2524-2533.
29. Sekhri N, Feder GS, Junghans C, Hemingway H, Timmis AD. Rapid-access chest pain clinics and
the traditional cardiology out-patient clinic. QJM 2006;99(March 1, 2006):135-141.
30. http://www.heartstats.org/homepage.asp: British Heart Foundation Statistics Website, 2005.
31. McCormick A, Fleming, D., Charlton, J. Morbidity statistics from general practice. Fourth
national study, 1991-1992. London: HMSO: Royal College of General Practitioners, Office
of Population Censuses and Surveys, Department of Health, 1995.
32. Stewart S, Murphy N, Walker A, McGuire A, McMurray JJV. The current cost of angina pectoris
to the National Health Service in the UK. Heart 2003;89(8):848-853.
33. Nease RF, Jr., Kneeland T, O'Connor GT, Sumner W, Lumpkins C, Shaw L, et al. Variation in
patient utilities for outcomes of the management of chronic stable angina. Implications
for clinical practice guidelines. Ischemic Heart Disease Patient Outcomes Research Team.
Jama 1995;273(15):1185-90.
34. Diamond GA. A clinically relevant classification of chest discomfort. J Am Coll Cardiol 1983;1(2
Pt 1):574-5.
35. Sutcliffe SJ, Fox KF, Wood DA, Sutcliffe A, Stock K, Wright M, et al. Incidence of coronary heart
disease in a health authority in London: review of a community register. BMJ
2003;326(7379):20-.
36. Rose G, Blackburn, H. Cardiovascular Survey Methods. Geneva: World Health Organization,
1968:527-536.
37. Lawlor DA, Adamson J, Ebrahim S. Performance of the WHO Rose angina questionnaire in
post-menopausal women: Are all of the questions necessary? J Epidemiol Community
Health 2003;57(July 1, 2003):538-541.
38. Lampe FC, Whincup PH, Shaper AG, Wannamethee SG, Walker M, Ebrahim S. Variability of
angina symptoms and the risk of major ischemic heart disease events. Am J Epidemiol
2001;153(12):1173-82.
39. Fischbacher CM, Bhopal R, Unwin N, White M, Alberti K. The performance of the Rose angina
questionnaire in South Asian and European origin populations: a comparative study in
Newcastle, UK. Int. J. Epidemiol. 2001;30(5):1009-1016.
40. Barakat K, Wells Z, Ramdhany S, Mills PG, Timmis AD. Bangladeshi patients present with non-
classic features of acute myocardial infarction and are treated less aggressively in east
London, UK. Heart 2003;89(3):276-9.
41. Chaturvedi N, Rai H, Ben-Shlomo Y. Lay diagnosis and health-care-seeking behaviour for chest
pain in south Asians and Europeans. Lancet 1997;350(9091):1578-83.
42. Raczynski JM, Taylor H, Cutter G, Hardin M, Rappaport N, Oberman A. Diagnoses, symptoms,
and attribution of symptoms among black and white inpatients admitted for coronary
heart disease. Am J Public Health 1994;84(6):951-6.
43. Meshack AF, Goff DC, Chan W, Ramsey D, Linares A, Reyna R, et al. Comparison of reported
symptoms of acute myocardial infarction in Mexican Americans versus non-Hispanic
whites (the Corpus Christi Heart Project). Am J Cardiol 1998;82(11):1329-32.
44. Sheffield D, Biles PL, Orom H, Maixner W, Sheps DS. Race and Sex Differences in Cutaneous
Pain Perception. Psychosom Med 2000;62(July 1, 2000):517-523.

217
45. Teoh M, Lalondrelle S, Roughton M, Grocott-Mason R, Dubrey S. Acute coronary syndromes
and their presentation in Asian and Caucasian patients in Britain. Heart 2007;93(2):183-
8.
46. Hughes LO, Raval U, Raftery EB. First myocardial infarctions in Asian and white men. BMJ
1989;298(6684):1345-50.
47. Boden WE, O'Rourke RA, Teo KK, Hartigan PM, Maron DJ, Kostuk WJ, et al. Optimal Medical
Therapy with or without PCI for Stable Coronary Disease. N Engl J Med 2007(March 26,
2007):NEJMoa070829.
48. Pocock SJ, Henderson RA, Seed P, Treasure T, Hampton JR. Quality of life, employment status,
and anginal symptoms after coronary angioplasty or bypass surgery. 3-year follow-up in
the Randomized Intervention Treatment of Angina (RITA) Trial. Circulation
1996;94(2):135-42.
49. Campeau L. Grading of angina pectoris [letter]. Circulation 1976;54:522-523.
50. Daly CA, De Stavola B, Sendon JL, Tavazzi L, Boersma E, Clemens F, et al. Predicting prognosis
in stable angina--results from the Euro heart survey of stable angina: prospective
observational study. Bmj 2006;332(7536):262-7.
51. Lampe FC, Morris RW, Walker M, Shaper AG, Whincup PH. Trends in rates of different forms
of diagnosed coronary heart disease, 1978 to 2000: prospective, population based study
of British men. BMJ 2005;330(7499):1046-.
52. Lampe FC, Morris RW, Whincup PH, Walker M, Ebrahim S, Shaper AG. Is the prevalence of
coronary heart disease falling in British men? Heart 2001;86(5):499-505.
53. Primatesta P. Prevalence of cardiovascular disease. London: The Stationery Office, 1999.
54. LaRosa JC, He J, Vupputuri S. Effect of Statins on Risk of Coronary Disease: A Meta-analysis of
Randomized Controlled Trials. JAMA 1999;282(December 22, 1999):2340-2346.
55. Pitt B. ACE Inhibitors for Patients with Vascular Disease without Left Ventricular Dysfunction
-- May They Rest in PEACE? N Engl J Med 2004;351(20):2115-2117.
56. Heiat A, Gross CP, Krumholz HM. Representation of the Elderly, Women, and Minorities in
Heart Failure Clinical Trials. Arch Intern Med 2002;162(15):1682-1688.
57. Jones M, Ramsay J, Feder G, Crook AM, Hemingway H. Influence of practices' ethnicity and
deprivation on access to angiography: an ecological study. Br J Gen Pract
2004;54(503):423-8.
58. Sproston K, Mindell, J. Health Survey for England 2004. The health of minority ethnic groups.
2006: NatCen, 2006.
59. Bernstein S, Laouri, M, Hilbourne, LH, Leape, LL, Kahan, JO, Park, RE, et al. Coronary
angiography: a literature review and ratings of appropriateness and necessity. Santa
Monica, CA: RAND, 1992.
60. Scanlon PJ, Faxon DP, Audet A-M, Carabello B, Dehmer GJ, Eagle KA, et al. ACC/AHA Guidelines
for Coronary Angiography: Executive Summary and Recommendations : A Report of the
American College of Cardiology/American Heart Association Task Force on Practice
Guidelines (Committee on Coronary Angiography) Developed in collaboration with the
Society for Cardiac Angiography and Interventions. Circulation 1999;99(17):2345-2357.
61. Feder G, Crook AM, Magee P, Banerjee S, Timmis AD, Hemingway H. Ethnic differences in
invasive management of coronary disease: prospective cohort study of patients
undergoing angiography. BMJ 2002;324(7336):511-516.
62. Britton A, Shipley M, Marmot M, Hemingway H. Does access to cardiac investigation and
treatment contribute to social and ethnic differences in coronary heart disease?
Whitehall II prospective cohort study. BMJ 2004;329(7461):318.
63. Chapple A, Gatrell A. Variations in use of cardiac services in England: perceptions of general
practitioners, general physicians and cardiologists. J Health Serv Res Policy
1998;3(3):153-8.
64. Bucher HC, Hengstler P, Schindler C, Guyatt GH. Percutaneous transluminal coronary
angioplasty versus medical treatment for non-acute coronary heart disease: meta-
analysis of randomised controlled trials. BMJ 2000;321(7253):73-7.
65. Henderson RA, Pocock SJ, Clayton TC, Knight R, Fox KA, Julian DG, et al. Seven-year outcome
in the RITA-2 trial: coronary angioplasty versus medical therapy. J Am Coll Cardiol
2003;42(7):1161-70.
66. Yusuf S, Zucker D, Peduzzi P, Fisher LD, Takaro T, Kennedy JW, et al. Effect of coronary artery
bypass graft surgery on survival: overview of 10-year results from randomised trials by

218
the Coronary Artery Bypass Graft Surgery Trialists Collaboration. Lancet
1994;344(8922):563-70.
67. Nissen SE, Tuzcu EM, Schoenhagen P, Crowe T, Sasiela WJ, Tsai J, et al. Statin Therapy, LDL
Cholesterol, C-Reactive Protein, and Coronary Artery Disease. N Engl J Med
2005;352(January 6, 2005):29-38.
68. Randomised trial of cholesterol lowering in 4444 patients with coronary heart disease: the
Scandinavian Simvastatin Survival Study (4S). Lancet 1994;344(8934):1383-9.
69. Serruys PW, Unger F, Sousa JE, Jatene A, Bonnier HJRM, Schonberger JPAM, et al. Comparison
of Coronary-Artery Bypass Surgery and Stenting for the Treatment of Multivessel
Disease. N Engl J Med 2001;344(15):1117-1124.
70. Poole-Wilson PA, Voko Z, Kirwan BA, de Brouwer S, Dunselman PH, Lubsen J. Clinical course
of isolated stable angina due to coronary heart disease. Eur Heart J 2007;28(16):1928-
35.
71. Kaul P, Lytle BL, Spertus JA, DeLong ER, Peterson ED. Influence of Racial Disparities in
Procedure Use on Functional Status Outcomes Among Patients With Coronary Artery
Disease. Circulation 2005;111(10):1284-1290.
72. Goldsmith I, Lip GYP, Tsang G, Patel RL. Comparison of primary coronary artery bypass
surgery in a British Indo-Asian and white Caucasian population. Eur Heart J
1999;20(15):1094-1100.
73. Vaccarino V, Rathore SS, Wenger NK, Frederick PD, Abramson JL, Barron HV, et al. Sex and
Racial Differences in the Management of Acute Myocardial Infarction, 1994 through
2002. N Engl J Med 2005;353(7):671-682.
74. Nomenclature and criteria for diagnosis of ischemic heart disease. Report of the Joint
International Society and Federation of Cardiology/World Health Organization task force
on standardization of clinical nomenclature. Circulation 1979;59(March 1, 1979):607-
609.
75. Alpert JS, Thygesen K, Antman E, Bassand JP. Myocardial infarction redefined--a consensus
document of The Joint European Society of Cardiology/American College of Cardiology
Committee for the redefinition of myocardial infarction. J Am Coll Cardiol
2000;36(3):959-69.
76. Collinson PO, Stubbs PJ, Kessler AC. Multicentre evaluation of the diagnostic value of cardiac
troponin T, CK-MB mass, and myoglobin for assessing patients with suspected acute
coronary syndromes in routine clinical practice. Heart 2003;89(3):280-6.
77. Thygesen K, Alpert JS, White HD, Jaffe AS, Apple FS, Galvani M, et al. Universal definition of
myocardial infarction. Circulation 2007;116(22):2634-53.
78. Hellermann JP, Reeder GS, Jacobsen SJ, Weston SA, Killian JM, Roger VL. Longitudinal Trends
in the Severity of Acute Myocardial Infarction: A Population Study in Olmsted County,
Minnesota. Am. J. Epidemiol. 2002;156(August 1, 2002):246-253.
79. Murphy NF, MacIntyre K, Capewell S, Stewart S, Pell J, Chalmers J, et al. Hospital discharge
rates for suspected acute coronary syndromes between 1990 and 2000: population
based analysis. BMJ 2004;328(7453):1413-1414.
80. Steg PG, Goldberg RJ, Gore JM, Fox KA, Eagle KA, Flather MD, et al. Baseline characteristics,
management practices, and in-hospital outcomes of patients hospitalized with acute
coronary syndromes in the Global Registry of Acute Coronary Events (GRACE). Am J
Cardiol 2002;90(4):358-63.
81. Fox KA, Goodman S, Bigonzi F, Le Louer V, Cohen M. Inter-regional differences and outcome
in unstable angina; analysis of the international ESSENCE trial. Efficacy and Safety of
Subcutaneous Enoxaparin in Non-Q-wave Coronary Events. Eur Heart J
2000;21(17):1433-9.
82. Hasdai D, Behar S, Wallentin L, Danchin N, Gitt AK, Boersma E, et al. A prospective survey of
the characteristics, treatments and outcomes of patients with acute coronary syndromes
in Europe and the Mediterranean basin; the Euro Heart Survey of Acute Coronary
Syndromes (Euro Heart Survey ACS). Eur Heart J 2002;23(15):1190-201.
83. Joshi P, Islam S, Pais P, Reddy S, Dorairaj P, Kazmi K, et al. Risk Factors for Early Myocardial
Infarction in South Asians Compared With Individuals in Other Countries. JAMA
2007;297(January 17, 2007):286-294.
84. Collinson J, Flather MD, Fox KA, Findlay I, Rodrigues E, Dooley P, et al. Clinical outcomes, risk
stratification and practice patterns of unstable angina and myocardial infarction without

219
ST elevation: Prospective Registry of Acute Ischaemic Syndromes in the UK (PRAIS-UK).
Eur Heart J 2000;21(17):1450-7.
85. Fox KA, Goodman SG, Klein W, Brieger D, Steg PG, Dabbous O, et al. Management of acute
coronary syndromes. Variations in practice and outcome; findings from the Global
Registry of Acute Coronary Events (GRACE). Eur Heart J 2002;23(15):1177-89.
86. Capewell S, Murphy NF, MacIntyre K, Frame S, Stewart S, Chalmers JWT, et al. Short-term and
long-term outcomes in 133 429 emergency patients admitted with angina or myocardial
infarction in Scotland, 1990-2000: population-based cohort study. Heart
2006;92(November 1, 2006):1563-1570.
87. The Global Use of Strategies to Open Occluded Coronary Arteries II. A Comparison of
Recombinant Hirudin with Heparin for the Treatment of Acute Coronary Syndromes. N
Engl J Med 1996;335(September 12, 1996):775-782.
88. Cannon CP, Weintraub WS, Demopoulos LA, Vicari R, Frey MJ, Lakkis N, et al. Comparison of
Early Invasive and Conservative Strategies in Patients with Unstable Coronary
Syndromes Treated with the Glycoprotein IIb/IIIa Inhibitor Tirofiban. N Engl J Med
2001;344(25):1879-1887.
89. Flack JM, Neaton J, Grimm R, Jr., Shih J, Cutler J, Ensrud K, et al. Blood pressure and mortality
among men with prior myocardial infarction. Multiple Risk Factor Intervention Trial
Research Group. Circulation 1995;92(9):2437-45.
90. Donahoe SM, Stewart GC, McCabe CH, Mohanavelu S, Murphy SA, Cannon CP, et al. Diabetes
and mortality following acute coronary syndromes. JAMA 2007;298(7):765-75.
91. Critchley JA, Capewell S. Mortality risk reduction associated with smoking cessation in
patients with coronary heart disease: a systematic review. JAMA 2003;290(1):86-97.
92. Swerdlow AJ, Laing SP, dos Santos Silva I, Slater SD, Burden AC, Botha JL, et al. Mortality of
South Asian patients with insulin-treated diabetes mellitus in the United Kingdom: a
cohort study. Diabetic Medicine 2004;21(8):845-851.
93. McElduff P, Edwards R, Burns JA, Young RJ, Heller R, Long B, et al. Comparison of processes
and intermediate outcomes between South Asian and European patients with diabetes in
Blackburn, north-west England. Diabet Med 2005;22(9):1226-33.
94. Rankin J, Bhopal R. Understanding of heart disease and diabetes in a South Asian community:
cross-sectional study testing the 'snowball' sample method. Public Health
2001;115(4):253-60.
95. Lyratzopoulos G, McElduff P, Heller RF, Hanily M, Lewis PS. Mid-term Body Mass Index
increase among obese and non-obese individuals in middle life and deprivation status: A
cohort Study. BMC Public Health 2005;5(125):32.
96. Wilkinson P, Sayer J, Laji K, Grundy C, Marchant B, Kopelman P, et al. Comparison of case
fatality in south Asian and white patients after acute myocardial infarction:
observational study. BMJ 1996;312(7042):1330-1333.
97. Enas EA, Garg A, Davidson MA, Nair VM, Huet BA, Yusuf S. Coronary heart disease and its risk
factors in first-generation immigrant Asian Indians to the United States of America.
Indian Heart J 1996;48(4):343-53.
98. Castelli WP. Epidemiology of coronary heart disease: the Framingham study. Am J Med
1984;76(2A):4-12.
99. Tunstall-Pedoe H, Kuulasmaa K, Amouyel P, Arveiler D, Rajakangas AM, Pajak A. Myocardial
infarction and coronary deaths in the World Health Organization MONICA Project.
Registration procedures, event rates, and case-fatality rates in 38 populations from 21
countries in four continents. Circulation 1994;90(July 1, 1994):583-612.
100. Mathew V, Farkouh M, Grill DE, Urban LH, Cusma JT, Reeder GS, et al. Clinical risk
stratification correlates with the angiographic extent of coronary artery disease in
unstable angina. J Am Coll Cardiol 2001;37(8):2053-8.
101. Gupta M, Singh, N., Warsi, M., Reiter, M., Ali, K. Canadian South Asians have more severe
angiographic coronary disease than European Canadians despite having fewer risk
factors. Can J Cardiol 2001;17(Suppl C):226C.
102. Kligfield P, Lauer MS. Exercise Electrocardiogram Testing: Beyond the ST Segment.
Circulation 2006;114(November 7, 2006):2070-2082.
103. Wu Z, Schimmele CM. Racial/Ethnic Variation in Functional and Self-Reported Health. Am J
Public Health 2005;95(4):710-716.
220
104. Banerjee S, Crook AM, Dawson JR, Timmis AD, Hemingway H. Magnitude and consequences
of error in coronary angiography interpretation (the ACRE study). Am J Cardiol
2000;85(3):309-14.
105. Roux AVD, Merkin SS, Arnett D, Chambless L, Massing M, Nieto FJ, et al. Neighborhood of
Residence and Incidence of Coronary Heart Disease. N Engl J Med 2001;345( July 12,
2001):99-106.
106. Acheson D. Independent Inquiry into Inequalities in Health. London: The Stationery Office,
1998.
107. Nicholl J, West J, Goodacre S, Turner J. The relationship between distance to hospital and
patient mortality in emergencies: an observational study. Emerg Med J
2007;24(September 1, 2007):665-668.
108. Stone M, Galbraith, J. How not to fund hospital and community health services in England.
Journal of the Royal Statistical Society 2005;169 (1):143 - 164
109. Black N, Langham S, Petticrew M. Coronary revascularisation: why do rates vary
geographically in the UK? J Epidemiol Community Health 1995;49(August 1, 1995):408-
412.
110. Ward PR, Noyce PR, St Leger AS. Are GP practice prescribing rates for coronary heart
disease drugs equitable? A cross sectional analysis in four primary care trusts in
England. J Epidemiol Community Health 2004;58(February 1, 2004):89-96.
111. Ferrieres J, Cambou JP, Gueret P, Boutalbi Y, Lablanche JM, Hanania G, et al. Effect of early
initiation of statins on survival in patients with acute myocardial infarction (the USIC
2000 Registry). Am J Cardiol 2005;95(4):486-9.
112. Ashworth M, Lloyd D, Smith RS, Wagner A, Rowlands G. Social deprivation and statin
prescribing: a cross-sectional analysis using data from the new UK general practitioner
'Quality and Outcomes Framework'. J Public Health 2007;29(March 1, 2007):40-47.
113. Bhopal R. What is the risk of coronary heart disease in South Asians? A review of UK
research. J Public Health 2000;22(3):375-385.
114. http://hiru.mcmaster.ca/hedges. Search Strategies for MEDLINE in Ovid Syntax and the
PubMed translation. . Health Information Research Unit: McMaster University.
115. Lee J, Heng D, Chia KS, Chew SK, Tan BY, Hughes K. Risk factors and incident coronary heart
disease in Chinese, Malay and Asian Indian males: the Singapore Cardiovascular Cohort
Study. Int. J. Epidemiol. 2001;30(5):983-988.
116. Hippisley-Cox J, Coupland C, Vinogradova Y, Robson J, Minhas R, Sheikh A, et al. Predicting
cardiovascular risk in England and Wales: prospective derivation and validation of
QRISK2. Bmj 2008;336(7659):1475-82.
117. Khattar RS, Swales JD, Senior R, Lahiri A. Racial variation in cardiovascular morbidity and
mortality in essential hypertension. Heart 2000;83(3):267-271.
118. Patel JV, Lim HS, Gunarathne A, Tracey I, Durrington PN, Hughes EA, et al. Ethnic differences
in myocardial infarction in patients with hypertension: effects of diabetes mellitus. QJM
2008;101(3):231-6.
119. Mak K-H, Chia K-S, Kark JD, Chua T, Tan C, Foong B-H, et al. Ethnic differences in acute
myocardial infarction in Singapore. Eur Heart J 2003;24(2):151-160.
120. Lane DA, Lip GY, Beevers DG. Ethnic differences in cardiovascular and all-cause mortality in
Birmingham, England: the Birmingham Factory Screening Project. J Hypertens
2005;23(7):1347-53.
121. Withdrawn. First myocardial infarction in patients of Indian subcontinent and European
origin: comparison of risk factors, management, and long term outcome. BMJ
2000;320(January 29):278-.
122. Forouhi NG, Sattar N, Tillin T, McKeigue PM, Chaturvedi N. Do known risk factors explain the
higher coronary heart disease mortality in South Asian compared with European men?
Prospective follow-up of the Southall and Brent studies, UK. Diabetologia
2006;V49(11):2580-2588.
123. Fischbacher CM, Bhopal R, Povey C, Steiner M, Chalmers J, Mueller G, et al. Record linked
retrospective cohort study of 4.6 million people exploring ethnic variations in disease:
myocardial infarction in South Asians. BMC Public Health 2007;7(1):142.

221
124. Ethnicity and cardiovascular disease. The incidence of myocardial infarction in white, South
Asian, and Afro-Caribbean patients with type 2 diabetes (U.K. Prospective Diabetes Study
32). Diabetes Care 1998;21(8):1271-7.
125. Mather HM, Chaturvedi N, Fuller JH. Mortality and morbidity from diabetes in South Asians
and Europeans: 11-year follow-up of the Southall Diabetes Survey, London, UK. Diabet
Med 1998;15(1):53-9.
126. Liew R, Sulfi S, Ranjadayalan K, Cooper J, Timmis AD. Declining case fatality rates for acute
myocardial infarction in South Asian and white patients in the past 15 years. Heart
2006;92(8):1030-1034.
127. Gupta M, Doobay AV, Singh N, Anand SS, Raja F, Mawji F, et al. Risk factors, hospital
management and outcomes after acute myocardial infarction in South Asian Canadians
and matched control subjects. CMAJ 2002;166(6):717-22.
128. Mukhtar HT, Littler WA. Survival after acute myocardial infarction in Asian and white
patients in Birmingham. Br Heart J 1995;73(2):122-4.
129. Reid DD, Brett GZ, Hamilton PJ, Jarrett RJ, Keen H, Rose G. Cardiorespiratory disease and
diabetes among middle-aged male Civil Servants. A study of screening and intervention.
Lancet 1974;1(7856):469-73.
130. Marmot M, Brunner E. Cohort Profile: the Whitehall II study. Int J Epidemiol 2005;34(2):251-
6.
131. Marmot MG, Smith GD, Stansfeld S, Patel C, North F, Head J, et al. Health inequalities among
British civil servants: the Whitehall II study. Lancet 1991;337(8754):1387-93.
132. National Service Framework for Coronary Heart Disease: modern standards and service
models. London: Department of Health, 2000.
133. Martin RM, Hemingway H, Gunnell D, Karsch KR, Baumbach A, Frankel S. Population need
for coronary revascularisation: are national targets for England credible? Heart
2002;88(6):627-633.
134. Birkhead JS, Weston C, Lowe D, National Audit of Myocardial Infarction Project (MINAP)
Steering Group. Impact of specialty of admitting physician and type of hospital on care
and outcome for myocardial infarction in England and Wales during 2004-5:
observational study. BMJ 2006;332(7553):1306-1311.
135. Solomon D, Henry, RC., Hogan, JG., Van Amburg, GH., Taylor, J. Evaluation and
implementation of public health registries. . J Public Health Rep 1991;106:142-150.
136. Vaccarino V, Rathore, SS., Wenger,. NK, Frederick, PD., Abramson, JL., Barron, HV., Manhapra,
A., Mallik, S., Krumholz, HM. Sex and Racial Differences in the Management of Acute
Myocardial Infarction, 1994 through 2002. NEJM 2005;353:671-682.
137. Stenestrand U, Wallentin, L. Early statin treatment following acute myocardial infarction and
1-year survival. JAMA 2001;285:430-436.
138. Last J. A Dictionary of Epidemiology. 4th ed. Oxford: Oxford University Press, 2001.
139. Baruch Y. Response Rate in Academic Studies — A Comparative Analysis Human Relations
1999;52(4):421-438.
140. Hemingway H, Stafford M, Stansfeld S, Shipley M, Marmot M. Is the SF-36 a valid measure of
change in population health? Results from the Whitehall II study. BMJ
1997;315(7118):1273-1279.
141. Naish J, Sturdy, K, Bobby, J, Pereira, F. The association between Asian ethnicity and
prescribing rates in east London general practices: a database study. Health Informatics
Journal 1997;3(3):100-105.
142. Lyratzopoulos G, McElduff P, Heller R, Hanily M, Lewis P. Comparative levels and time trends
in blood pressure, total cholesterol, Body Mass Index and smoking among Caucasian and
South-Asian participants of a UK primary-care based cardiovascular risk factor screening
programme. BMC Public Health 2005;5(125):125.
143. Bhopal RS, Agyemang C. Is the blood pressure of South Asian adults in the UK higher or
lower than that in European white adults? A review of cross-sectional data. J Hum
Hypertension 2002;16:739 - 751.
144. Chandola T, Ferrie J, Sacker A, Marmot M. Social inequalities in self reported health in early
old age: follow-up of prospective cohort study. BMJ 2007;334(May 12, 2007):990-.
145. Sekhri N, Timmis A, Chen R, Junghans C, Walsh N, Zaman J, et al. Inequity of access to
investigation and effect on clinical outcomes: prognostic study of coronary angiography
for suspected stable angina pectoris. BMJ 2008;336(10 May):1058-1061.

222
146. Cappuccio FP, Cook DG, Atkinson RW, Strazzullo P. Prevalence, detection, and management
of cardiovascular risk factors in different ethnic groups in south London. Heart
1997;78(6):555-563.
147. Roux AVD, Merkin SS, Arnett D, Chambless L, Massing M, Nieto FJ, et al. Neighborhood of
Residence and Incidence of Coronary Heart Disease. N Engl J Med 2001;345(2):99-106.
148. Third Report of the National Cholesterol Education Program (NCEP) Expert Panel on
Detection, Evaluation, and Treatment of High Blood Cholesterol in Adults (Adult
Treatment Panel III) final report. Circulation 2002;106(25):3143-421.
149. Unwin N, Bhopal R, Hayes L, White M, Patel S, Ragoobirsingh D, et al. A comparison of the
new international diabetes federation definition of metabolic syndrome to WHO and
NCEP definitions in Chinese, European and South Asian origin adults. Ethn Dis
2007;17(3):522-8.
150. World Health Organization. International Classification of Diseases. 9th revision. Geneva,
1977.
151. Graff-Iversen S, Selmer R, Lochen ML. Rose angina predicts 23-year coronary heart disease
mortality in women and men aged 40-49 years. Heart 2008;94(4):482-486.
152. Aitsi-Selmi A, Shipley, M, Hemingway, H. Stable angina pectoris: comparison of trends in
symptoms and diagnosed cases of angina from 1991 to 2003 with trends in MI mortality.
EJCPR 2008(EuroPRevent Congress abstracts):S25-26.
153. Hemingway H. MI myopia: finding the focus on angina. J Epidemiol Community Health
2003;57(1):2-.
154. Higgins JP, Thompson SG, Deeks JJ, Altman DG. Measuring inconsistency in meta-analyses.
BMJ 2003;327(7414):557-60.
155. Gray L, Harding S, Reid A. Evidence of divergence with duration of residence in circulatory
disease mortality in migrants to Australia. Eur J Public Health 2007;17(6):550-4.
156. Klingler D, Green-Weir R, Nerenz D, Havstad S, Rosman HS, Cetner L, et al. Perceptions of
chest pain differ by race. Am Heart J 2002;144(1):51-9.
157. Hravnak M, Whittle J, Kelley ME, Sereika S, Good CB, Ibrahim SA, et al. Symptom expression
in coronary heart disease and revascularization recommendations for black and white
patients. Am J Public Health 2007;97(9):1701-8.
158. Whittle J, Conigliaro J, Good CB, Joswiak M. Do patient preferences contribute to racial
differences in cardiovascular procedure use? J Gen Intern Med 1997;12(5):267-73.
159. Somerville C, Featherstone, K., Hemingway, H.,Timmis, A., Feder, G. Performing stable angina
pectoris: An ethnographic study. Soc Sci Med. 2008;66(7):1497-508.
160. Pakhomov SS, Hemingway H, Weston SA, Jacobsen SJ, Rodeheffer R, Roger VL. Epidemiology
of angina pectoris: role of natural language processing of the medical record. Am Heart J
2007;153(4):666-73.
161. Health and Social Care Information Centre. Health Survey for England: Health of ethnic
minorities. London: Health Surveys Unit of the National Centre for Social Research and
Royal Free and University College Medical School, 2004.
162. Ringqvist I, Fisher LD, Mock M, Davis KB, Wedel H, Chaitman BR, et al. Prognostic value of
angiographic indices of coronary artery disease from the Coronary Artery Surgery Study
(CASS). J Clin Invest 1983;71(6):1854-66.
163. Friesinger GC, Page EE, Ross RS. Prognostic significance of coronary arteriography. Trans
Assoc Am Physicians 1970;83:78-92.
164. Dhawan J, Bray CL. Are Asian coronary arteries smaller than Caucasian? A study on
angiographic coronary artery size estimation during life. Int J Cardiol 1995;49(3):267-9.
165. Akiyama T, Moussa I, Reimers B, Ferraro M, Kobayashi Y, Blengino S, et al. Angiographic and
clinical outcome following coronary stenting of small vessels: A comparison with
coronary stenting of large vessels. J Am Coll Cardiol 1998;32(6):1610-1618.
166. Umachandran V, Ranjadayalan K, Ambepityia G, Marchant B, Kopelman PG, Timmis AD. The
perception of angina in diabetes: relation to somatic pain threshold and autonomic
function. Am Heart J 1991;121(6 Pt 1):1649-54.
167. Birdwell BG, Herbers JE, Kroenke K. Evaluating chest pain. The patient's presentation style
alters the physician's diagnostic approach. Arch Intern Med 1993;153(17):1991-5.
168. Hlatky MA. Patient preferences and clinical guidelines. JAMA 1995;273(15):1219-20.
223
169. Gupta M, Doobay AV, Singh N, Anand SS, Raja F, Mawji F, et al. Risk factors, hospital
management and outcomes after acute myocardial infarction in South Asian Canadians
and matched control subjects. CMAJ 2002;166(6):717-722.
170. Rickards A, Cunningham D. From quantity to quality: the central cardiac audit database
project. Heart 1999;82(90002):18ii-22.
171. Ohman EM, Armstrong PW, Christenson RH, Granger CB, Katus HA, Hamm CW, et al. Cardiac
troponin T levels for risk stratification in acute myocardial ischemia. GUSTO IIA
Investigators. N Engl J Med 1996;335(18):1333-41.
172. Lindahl B, Venge P, Wallentin L. Troponin T identifies patients with unstable coronary
artery disease who benefit from long-term antithrombotic protection. Fragmin in
Unstable Coronary Artery Disease (FRISC) Study Group. J Am Coll Cardiol 1997;29(1):43-
8.
173. Hamm CW, Heeschen C, Goldmann B, Vahanian A, Adgey J, Miguel CM, et al. Benefit of
abciximab in patients with refractory unstable angina in relation to serum troponin T
levels. c7E3 Fab Antiplatelet Therapy in Unstable Refractory Angina (CAPTURE) Study
Investigators. N Engl J Med 1999;340(21):1623-9.
174. Soljak M, Majeed A, Eliahoo J, Dornhorst A. Ethnic inequalities in the treatment and outcome
of diabetes in three English Primary Care Trusts. International Journal for Equity in
Health 2007;6(1 ):8.
175. Lanting LC, Joung IMA, Mackenbach JP, Lamberts SWJ, Bootsma AH. Ethnic Differences in
Mortality, End-Stage Complications, and Quality of Care Among Diabetic Patients: A
review. Diabetes Care 2005;28(September 1, 2005):2280-2288.
176. McKeigue PM, Marmot M. Myocardial infarction in Asian men. Bmj 1989;299(6692):179-80.
177. Malmberg K, Yusuf S, Gerstein HC, Brown J, Zhao F, Hunt D, et al. Impact of Diabetes on Long-
Term Prognosis in Patients With Unstable Angina and Non-Q-Wave Myocardial
Infarction : Results of the OASIS (Organization to Assess Strategies for Ischemic
Syndromes) Registry. Circulation 2000;102(August 29):1014-1019.
178. Bradburn M, Deeks, JJ., Altman, DG. sbe24 Metan: an alternative meta-analysis command.
Stata Technical Bulletin 1998;44:4-15.
179. Lyratzopoulos G, Heller RF, McElduff P, Hanily M, Lewis P. Deprivation and trends in blood
pressure, cholesterol, body mass index and smoking among participants of a UK primary
care-based cardiovascular risk factor screening programme: both narrowing and
widening in cardiovascular risk factor inequalities. Heart 2006;92(September 1,
2006):1198-1206.
180. Taylor HA, Chaitman BR, Rogers WJ, Kern MJ, Terrin ML, Aguirre FV, et al. Race and
prognosis after myocardial infarction. Results of the thrombolysis in myocardial
infarction (TIMI) phase II trial. Circulation 1993;88(4 Pt 1):1484-94.
181. Williams SC, Koss RG, Morton DJ, Schmaltz SP, Loeb JM. Case volume and hospital
compliance with evidence-based processes of care. Int J Qual Health Care 2008;20(2):79-
87.
182. Pollard TM, Carlin LE, Bhopal R, Unwin N, White M, Fischbacher C. Social networks and
coronary heart disease risk factors in South Asians and Europeans in the UK. Ethn Health
2003;8(3):263-75.
183. Newton JD, Blackledge HM, Squire IB. Ethnicity and variation in prognosis for patients newly
hospitalised for heart failure: a matched historical cohort study. Heart
2005;91(12):1545-50.
184. Taneja AK, Collinson J, Flather MD, Bakhai A, de Arenaza DP, Wang D, et al. Mortality
following non-ST elevation acute coronary syndrome: 4 years follow-up of the PRAIS UK
Registry (Prospective Registry of Acute Ischaemic Syndromes in the UK). Eur Heart J
2004;25(22):2013-2018.
185. Bhopal R, Hayes L, White M, Unwin N, Harland J, Ayis S, et al. Ethnic and socio-economic
inequalities in coronary heart disease, diabetes and risk factors in Europeans and South
Asians. J Public Health 2002;24(2):95-105.
186. Ahmad WI, Baker MR, Kernohan EE. Race, ethnicity and general practice. Br J Gen Pract
1990;40(335):223-4.
187. Neal RD, Ali N, Atkin K, Allgar VL, Ali S, Coleman T. Communication between South Asian
patients and GPs: comparative study using the Roter Interactional Analysis System. Br J
Gen Pract 2006;56(532):869-75.

224
188. Van Wieringen JCM, Harmsen JAM, Bruijnzeels MA. Intercultural communication in general
practice. Eur J Public Health 2002;12(March 1, 2002):63-68.
189. Stukel TA, Fisher ES, Wennberg DE, Alter DA, Gottlieb DJ, Vermeulen MJ. Analysis of
Observational Studies in the Presence of Treatment Selection Bias: Effects of Invasive
Cardiac Management on AMI Survival Using Propensity Score and Instrumental Variable
Methods. JAMA 2007;297(January 17, 2007):278-285.
190. Ko DT, Mamdani M, Alter DA. Lipid-Lowering Therapy With Statins in High-Risk Elderly
Patients: The Treatment-Risk Paradox. JAMA 2004;291(April 21, 2004):1864-1870.
191. Rosenbaum P, and Rubin, DB. The Central Role of the Propensity Score in Observational
Studies for Causal Effects. Biometrika 1983;70(1):41-55.
192. Ralph BDA, Jr. Propensity score methods for bias reduction in the comparison of a treatment
to a non-randomized control group. Statistics in Medicine 1998;17(19):2265-2281.
193. Winkelmayer WC, Kurth T. Propensity scores: help or hype? Nephrol. Dial. Transplant.
2004;19(July 1, 2004):1671-1673.
194. Arnold AM, Kronmal RA. Multiple Imputation of Baseline Data in the Cardiovascular Health
Study. Am. J. Epidemiol. 2003;157(January 1, 2003):74-84.
195. Ferrie JE, Martikainen P, Shipley MJ, Marmot MG. Self-reported economic difficulties and
coronary events in men: evidence from the Whitehall II study. Int. J. Epidemiol.
2005;34(June 1, 2005):640-648.
196. Marenberg ME, Risch N, Berkman LF, Floderus B, de Faire U. Genetic Susceptibility to Death
from Coronary Heart Disease in a Study of Twins. N Engl J Med 1994;330(April 14,
1994):1041-1046.
197. Francke S, Manraj M, Lacquemant C, Lecoeur C, Lepretre F, Passa P, et al. A genome-wide
scan for coronary heart disease suggests in Indo-Mauritians a susceptibility locus on
chromosome 16p13 and replicates linkage with the metabolic syndrome on 3q27. Hum
Mol Genet 2001;10(24):2751-65.
198. Barnett AH, Dixon AN, Bellary S, Hanif MW, O'Hare J P, Raymond NT, et al. Type 2 diabetes
and cardiovascular risk in the UK south Asian community. Diabetologia
2006;49(10):2234-46.
199. Tillin T, Forouhi N, Johnston DG, McKeigue PM, Chaturvedi N, Godsland IF. Metabolic
syndrome and coronary heart disease in South Asians, African-Caribbeans and white
Europeans: a UK population-based cross-sectional study. Diabetologia 2005;48(4):649-
56.
200. McCarthy MI, Hattersley AT. Learning From Molecular Genetics: Novel Insights Arising From
the Definition of Genes for Monogenic and Type 2 Diabetes. Diabetes 2008;57(November
1, 2008):2889-2898.
201. Anand SS, Yusuf S, Vuksan V, Devanesen S, Teo KK, Montague PA, et al. Differences in risk
factors, atherosclerosis, and cardiovascular disease between ethnic groups in Canada:
the Study of Health Assessment and Risk in Ethnic groups (SHARE). Lancet %M
doi:10.1016/S0140-6736(00)02502-2 2000;356:279 - 284.
202. Kooner JS, Baliga RR, Wilding J, Crook D, Packard CJ, Banks LM, et al. Abdominal obesity,
impaired nonesterified fatty acid suppression, and insulin-mediated glucose disposal are
early metabolic abnormalities in families with premature myocardial infarction.
Arterioscler Thromb Vasc Biol 1998;18(7):1021-6.
203. Neel JV, Weder AB, Julius S. Type II diabetes, essential hypertension, and obesity as
"syndromes of impaired genetic homeostasis": the "thrifty genotype" hypothesis enters
the 21st century. Perspect Biol Med 1998;42(1):44-74.
204. Helgadottir A, Thorleifsson G, Manolescu A, Gretarsdottir S, Blondal T, Jonasdottir A, et al. A
common variant on chromosome 9p21 affects the risk of myocardial infarction. Science
2007;316(5830):1491-3.
205. Chambers JC, Elliott P, Zabaneh D, Zhang W, Li Y, Froguel P, et al. Common genetic variation
near MC4R is associated with waist circumference and insulin resistance. Nat Genet
2008;40(6):716-8.
206. Singh RB, Singh V, Kulshrestha SK, Singh S, Gupta P, Kumar R, et al. Social class and all-cause
mortality in an urban population of North India. Acta Cardiol 2005;60(6):611-7.
207. Reddy K, Gupta, PC. Tobacco Control in India. New Delhi: Ministry of Health and Family
Welfare, Government of India, 2004.

225
208. Chow C, Cardona M, Raju PK, Iyengar S, Sukumar A, Raju R, et al. Cardiovascular disease and
risk factors among 345 adults in rural India--the Andhra Pradesh Rural Health Initiative.
Int J Cardiol 2007;116(2):180-5.
209. Xavier D, Pais P, Devereaux PJ, Xie C, Prabhakaran D, Reddy KS, et al. Treatment and
outcomes of acute coronary syndromes in India (CREATE): a prospective analysis of
registry data. Lancet 2008;371(9622):1435-42.
210. Karthikeyan G, Xavier D, Prabhakaran D, Pais P. Perspectives on the management of
coronary artery disease in India. Heart 2007;93(November 1, 2007):1334-1338.
211. Harding S. Mortality of migrants from the Indian subcontinent to England and Wales: effect
of duration of residence. Epidemiology 2003;14(3):287-92.
212. Harding S, Teyhan A, Maynard MJ, Cruickshank JK. Ethnic differences in overweight and
obesity in early adolescence in the MRC DASH study: the role of adolescent and parental
lifestyle. Int. J. Epidemiol. 2008;37(February 1, 2008):162-172.
213. Sniderman AD, Bhopal R, Prabhakaran D, Sarrafzadegan N, Tchernof A. Why might South
Asians be so susceptible to central obesity and its atherogenic consequences? The
adipose tissue overflow hypothesis. Int J Epidemiol 2007;36(1):220-5.
214. Smith NR, Kelly YJ, Nazroo JY. Intergenerational continuities of ethnic inequalities in general
health in England. J Epidemiol Community Health 2009;63(March 1, 2009):253-258.
215. Bahl V. Cancer and ethnic minorities--the Department of Health's perspective. Br J Cancer
Suppl 1996;29:S2-10.
216. Smith SC, Jr, Dove JT, Jacobs AK, Kennedy JW, Kereiakes D, Kern MJ, et al. ACC/AHA
Guidelines for Percutaneous Coronary Intervention (Revision of the 1993 PTCA
Guidelines)--Executive Summary : A Report of the American College of
Cardiology/American Heart Association Task Force on Practice Guidelines (Committee
to Revise the 1993 Guidelines for Percutaneous Transluminal Coronary Angioplasty)
Endorsed by the Society for Cardiac Angiography and Interventions. Circulation
2001;103(24):3019-3041.
217. Bhopal R, Fischbacher C, Vartiainen E, Unwin N, White M, Alberti G. Predicted and observed
cardiovascular disease in South Asians: application of FINRISK, Framingham and SCORE
models to Newcastle Heart Project data. Journal of Public Health 2005;27(1):93-100.
218. Stewart A, Rao, J., Osho-Williams, G., Fairfield, M., Ahmad, R. Audit of primary care angina
management in Sandwell, England. JOURNAL OF THE ROYAL SOCIETY FOR THE
PROMOTION OF HEALTH 2002;122(2):112-117.
219. Eade J, Vamplew, T., and Peach, C. The Bangladeshis: the encapsulated community. In: Peach
C, editor. Ethnicity in the 1991 Census. London: HMSO, 1996:150-160.
220. Modhood. Ethnic Minorities in Britain: Diversity and Disadvantage. Fourth National Survey
of Ethnic Minorities. London: Policy Studies Institute, 1997.
221. Jefferis BJMH, Power C, Graham H, Manor O. Changing social gradients in cigarette smoking
and cessation over two decades of adult follow-up in a British birth cohort. J Public
Health 2004;26(1):13-18.

226
13 Appendices
13.1 Census 2001 - Ethnicity in England and Wales
In the 2001 census, ethnicity categories were coded as follows:
White
British
Irish
Any other White background
Mixed
White and Black Caribbean
White and Black African
White and Asian
Any other mixed background
Asian or Asian British
Indian
Pakistani
Bangladeshi
Any other Asian background
Black or Black British
Caribbean
African
Any other Black background
Other ethnic groups
Chinese
Any other ethnic group
Results on ethnicity and religion from the 2001 census revealed that 87.5 per
cent of the population of England and Wales (seven out of eight people) gave
their ethnic group as White British. The highest proportions describing
themselves as White British are in the North East, Wales and the South West (all
over 95 per cent).

227
Eighty-seven per cent of the population of England and 96 per cent of the
population of Wales gave their ethnic origin as White British. White Irish people
make up 1.2 per cent of the population of England and Wales as a whole, with the
highest proportion in the London borough of Brent (6.9 per cent of the
population). The largest proportions of White Other (that is, not White British or
White Irish) people are in central London, particularly the borough of
Kensington and Chelsea (25.3 per cent).
London had the highest proportion of people from minority ethnic groups apart
from more who identified themselves as of Pakistani origin, of whom there was a
higher proportion in Yorkshire and the Humber (2.9 per cent) and the West
Midlands (2.9 per cent). Two per cent of the population of England and Wales
were Indian, with Leicester having the highest proportion (25.7 per cent).
Bangladeshis formed 0.5 per cent of the population of England and Wales, with
the highest proportion in the London borough of Tower Hamlets (33.4 per cent).

228
The largest proportions of people of Mixed origin were in London, with the
exception of Nottingham, where two per cent of people were Mixed White and
Black Caribbean.
The 1991 census ethnicity categories were:
White
British
Irish
Any other White background
Asian or Asian British
Indian
Pakistani
Bangladeshi
Any other Asian background
Black or Black British
Caribbean
African
Any other Black background
Other ethnic groups
Chinese
Any other ethnic group

229
13.2 International Classification of diseases 2007 version- Ischaemic
heart disease
I20 Angina pectoris
I20.0 Unstable angina
I20.1 Angina pectoris with documented spasm
I20.8 Other forms of angina pectoris
I20.9 Angina pectoris, unspecified
I21 Acute myocardial infarction
I21.0 Acute transmural myocardial infarction of anterior wall
I21.1 Acute transmural myocardial infarction of inferior wall
I21.2 Acute transmural myocardial infarction of other sites
I21.3 Acute transmural myocardial infarction of unspecified site
I21.4 Acute subendocardial myocardial infarction
I21.9 Acute myocardial infarction, unspecified
I22 Subsequent myocardial infarction
I22.0 Subsequent myocardial infarction of anterior wall
I22.1 Subsequent myocardial infarction of inferior wall
I22.8 Subsequent myocardial infarction of other sites
I22.9 Subsequent myocardial infarction of unspecified site
I23 Certain current complications following acute myocardial infarction
I23.0 Haemopericardium as current complication following acute myocardial
infarction
I23.1 Atrial septal defect as current complication following acute myocardial
infarction
I23.2 Ventricular septal defect as current complication following acute myocardial
infarction
I23.3 Rupture of cardiac wall without haemopericardium as current complication
following acute myocardial infarction

230
I23.4 Rupture of chordae tendineae as current complication following acute
myocardial infarction
I23.5 Rupture of papillary muscle as current complication following acute myocardial
infarction
I23.6 Thrombosis of atrium, auricular appendage, and ventricle as current
complications following acute myocardial infarction
I23.8 Other current complications following acute myocardial infarction
I24 Other acute ischaemic heart diseases
I24.0 Coronary thrombosis not resulting in myocardial infarction
I24.1 Dressler's syndrome
I24.8 Other forms of acute ischaemic heart disease
I24.9 Acute ischaemic heart disease, unspecified
I25 Chronic ischaemic heart disease
I25.0 Atherosclerotic cardiovascular disease, so described
I25.1 Atherosclerotic heart disease
I25.2 Old myocardial infarction
I25.3 Aneurysm of heart
I25.4 Coronary artery aneurysm
I25.5 Ischaemic cardiomyopathy
I25.6 Silent myocardial ischaemia
I25.8 Other forms of chronic ischaemic heart disease
I25.9 Chronic ischaemic heart disease, unspecified

231
13.3 Rose angina questionnaire
1. Have you ever had any pain or discomfort in your chest? Yes No
� �
a)Do you get this pain or discomfort when you walk uphill or in a hurry? Yes No
� �
b)Do you get it when you walk at an ordinary pace on the level? Yes No
� �
c)When you get any pain or discomfort in your chest, what do you do?
Stop � Slow down � Continue at the same pace �
d)Does it go away when you stand still? Yes No
� �
e)How soon? in 10 minutes or less � More than 10 minutes �
f)Where do you get this pain or discomfort? Mark the place(s) with an X on the diagramq
q In the Rose angina questionnaire, angina is defined as being present in subjects who answer as
follows: Q1: yes; Q1a or Q1b: yes; Q1c: stop or slow down; Q1d: relieved; Q1e: 10 minutes or less;
Q1f: either (a) sternum (upper or middle or lower) or (b) left anterior chest and left arm

232
13.4 Incidence of coronary disease MEDLINE literature search strategy
1. MEDLINE; exp CORONARY DISEASE/; 148892 results.
2. MEDLINE; "coronary disease$".af; 122799 results.
3. MEDLINE; "coronary heart disease$".af; 30935 results.
4. MEDLINE; coronary$.af; 308926 results.
5. MEDLINE; exp MYOCARDIAL INFARCTION/; 119450 results.
6. MEDLINE; "myocardial infarction$".af; 149432 results.
7. MEDLINE; exp MYOCARDIAL ISCHEMIA/; 286602 results.
8. MEDLINE; exp CARDIOVASCULAR DISEASES/; 1471574 results.
9. MEDLINE; 2 OR 3 OR 4 OR 6 OR 8; 1542777 results.
10. MEDLINE; exp INCIDENCE/; 119216 results.
11. MEDLINE; Incidence.af; 422668 results.
12. MEDLINE; 9 and (10 or 11 ); 72317 results.
13. MEDLINE; exp ASIAN CONTINENTAL ANCESTRY GROUP/; 18210 results.
14. MEDLINE; exp INDIA/eh (eh=Ethnology); 2540 results.
15. MEDLINE; india$.ti,ab; 56482 results.
16. MEDLINE; exp SRI LANKA/eh (eh=Ethnology); 86 results.
17. MEDLINE; "sri lanka$".ti,ab; 2497 results.
18. MEDLINE; exp BANGLADESH/eh (eh=Ethnology); 324 results.
19. MEDLINE; "bangladesh$".ti,ab; 4610 results.
20. MEDLINE; exp PAKISTAN/eh (eh=Ethnology); 618 results.
21. MEDLINE; "pakistan$".ti,ab; 6191 results.
22. MEDLINE; exp EUROPE/eh (eh=Ethnology); 7364 results.
23. MEDLINE; exp EUROPEAN CONTINENTAL ANCESTRY GROUP/; 35109 results.
24. MEDLINE; european$.ti,ab; 73839 results.
25. MEDLINE; White$.ti,ab; 166506 results.
26. MEDLINE; 13 OR 14 OR 15 OR 16 OR 17 OR 18 OR 19 OR 20 OR 21; 86227 results.
27. MEDLINE; 22 OR 23 OR 24 OR 25; 264106 results.
28. MEDLINE; 12 and 26 and 27; 137 results.

233
13.5 Prognosis of coronary disease MEDLINE literature search strategy
1. MEDLINE; exp CORONARY DISEASE/; 148892 results.
2. MEDLINE; "coronary disease$".af; 122799 results.
3. MEDLINE; "coronary heart disease$".af; 30935 results.
4. MEDLINE; coronary$.af; 308926 results.
5. MEDLINE; exp MYOCARDIAL INFARCTION/; 119450 results.
6. MEDLINE; "myocardial infarction$".af; 149432 results.
7. MEDLINE; exp MYOCARDIAL ISCHEMIA/; 286602 results.
8. MEDLINE; exp CARDIOVASCULAR DISEASES/; 1471574 results.
9. MEDLINE; ("coronary disease$".af) OR ("coronary heart disease$".af) OR (coronary$.af) OR ("myocardial
infarction$".af) OR (exp CARDIOVASCULAR DISEASES/); 1542777 results.
10. MEDLINE; (exp CORONARY DISEASE/) OR ("coronary disease$".af) OR ("coronary heart disease$".af) OR
(coronary$.af) OR (exp MYOCARDIAL INFARCTION/) OR ("myocardial infarction$".af) OR (exp MYOCARDIAL
ISCHEMIA/) OR (exp CARDIOVASCULAR DISEASES/) OR (("coronary disease$".af) OR ("coronary heart
disease$".af) OR (coronary$.af) OR ("myocardial infarction$".af) OR (exp CARDIOVASCULAR DISEASES/));
192810 results.
11. MEDLINE; (exp CORONARY DISEASE/) OR ("coronary disease$".af) OR ("coronary heart disease$".af) OR
(coronary$.af) OR (exp MYOCARDIAL INFARCTION/) or ("myocardial infarction$".af) OR (exp MYOCARDIAL
ISCHEMIA/) or (exp CARDIOVASCULAR DISEASES/) or (("coronary disease$".af) OR ("coronary heart
disease$".af) OR (coronary$.af) OR ("myocardial infarction$".af) OR (exp CARDIOVASCULAR DISEASES/));
237093 results.
12. MEDLINE; (exp CORONARY DISEASE/) OR ("coronary disease$".af) OR ("coronary heart disease$".af) OR
(coronary$.af) OR (exp MYOCARDIAL INFARCTION/) or ("myocardial infarction$".af) OR (exp MYOCARDIAL
ISCHEMIA/) or (exp CARDIOVASCULAR DISEASES/) or (("coronary disease$".af) OR ("coronary heart
disease$".af) OR (coronary$.af) OR ("myocardial infarction$".af) OR (exp CARDIOVASCULAR DISEASES/));
63612 results.
13. MEDLINE; exp ASIAN CONTINENTAL ANCESTRY GROUP/; 18210 results.
14. MEDLINE; exp INDIA/eh; 2540 results.
15. MEDLINE; india$.ti,ab; 56482 results.
16. MEDLINE; exp SRI LANKA/eh; 86 results.

234
17. MEDLINE; "sri lanka$".ti,ab; 2497 results.
18. MEDLINE; exp BANGLADESH/eh; 324 results.
19. MEDLINE; "bangladesh$".ti,ab; 4610 results.
20. MEDLINE; exp PAKISTAN/eh; 618 results.
21. MEDLINE; "pakistan$".ti,ab; 6191 results.
22. MEDLINE; exp EUROPE/eh; 7364 results.
23. MEDLINE; exp EUROPEAN CONTINENTAL ANCESTRY GROUP/; 35109 results.
24. MEDLINE; european$.ti,ab; 73839 results.
25. MEDLINE; White$.ti,ab; 166506 results.
26. MEDLINE; (exp ASIAN CONTINENTAL ANCESTRY GROUP/) OR (exp INDIA/eh) OR (india$.ti,ab) OR (exp
SRI LANKA/eh) OR ("sri lanka$".ti,ab) OR (exp BANGLADESH/eh) OR ("bangladesh$".ti,ab) OR (exp
PAKISTAN/eh) OR ("pakistan$".ti,ab); 86227 results.
27. MEDLINE; (exp EUROPE/eh) OR (exp EUROPEAN CONTINENTAL ANCESTRY GROUP/) OR
(european$.ti,ab) OR (White$.ti,ab); 264106 results.
28. MEDLINE; ((exp CORONARY DISEASE/) OR ("coronary disease$".af) OR ("coronary heart disease$".af) OR
(coronary$.af) OR (exp MYOCARDIAL INFARCTION/) OR ("myocardial infarction$".af) OR (exp MYOCARDIAL
ISCHEMIA/) OR (exp CARDIOVASCULAR DISEASES/) OR (("coronary disease$".af) OR ("coronary heart
disease$".af) OR (coronary$.af) OR ("myocardial infarction$".af) OR (exp CARDIOVASCULAR DISEASES/))) AND
((exp ASIAN CONTINENTAL ANCESTRY GROUP/) OR (exp INDIA/eh) OR (india$.ti,ab) OR (exp SRI
LANKA/eh) OR ("sri lanka$".ti,ab) OR (exp BANGLADESH/eh) OR ("bangladesh$".ti,ab) OR (exp PAKISTAN/eh)
OR ("pakistan$".ti,ab)) AND ((exp EUROPE/eh) OR (exp EUROPEAN CONTINENTAL ANCESTRY GROUP/) OR
(european$.ti,ab) OR (White$.ti,ab)); 98 results.
29. MEDLINE; ((exp CORONARY DISEASE/) OR ("coronary disease$".af) OR ("coronary heart disease$".af) OR
(coronary$.af) OR (exp MYOCARDIAL INFARCTION/) OR ("myocardial infarction$".af) OR (exp MYOCARDIAL
ISCHEMIA/) OR (exp CARDIOVASCULAR DISEASES/) OR (("coronary disease$".af) OR ("coronary heart
disease$".af) OR (coronary$.af) OR ("myocardial infarction$".af) OR (exp CARDIOVASCULAR DISEASES/))) AND
((exp ASIAN CONTINENTAL ANCESTRY GROUP/) OR (exp INDIA/eh) OR (india$.ti,ab) OR (exp SRI
LANKA/eh) OR ("sri lanka$".ti,ab) OR (exp BANGLADESH/eh) OR ("bangladesh$".ti,ab) OR (exp PAKISTAN/eh)
OR ("pakistan$".ti,ab)) AND ((exp EUROPE/eh) OR (exp EUROPEAN CONTINENTAL ANCESTRY GROUP/) OR
(european$.ti,ab) OR (White$.ti,ab)); 253 results.
30. MEDLINE; ((exp CORONARY DISEASE/) OR ("coronary disease$".af) OR ("coronary heart disease$".af) OR
(coronary$.af) OR (exp MYOCARDIAL INFARCTION/) OR ("myocardial infarction$".af) OR (exp MYOCARDIAL

235
ISCHEMIA/) OR (exp CARDIOVASCULAR DISEASES/) OR (("coronary disease$".af) OR ("coronary heart
disease$".af) OR (coronary$.af) OR ("myocardial infarction$".af) OR (exp CARDIOVASCULAR DISEASES/))) AND
((exp ASIAN CONTINENTAL ANCESTRY GROUP/) OR (exp INDIA/eh) OR (india$.ti,ab) OR (exp SRI
LANKA/eh) OR ("sri lanka$".ti,ab) OR (exp BANGLADESH/eh) OR ("bangladesh$".ti,ab) OR (exp PAKISTAN/eh)
OR ("pakistan$".ti,ab)) AND ((exp EUROPE/eh) OR (exp EUROPEAN CONTINENTAL ANCESTRY GROUP/) OR
(european$.ti,ab) OR (White$.ti,ab)); 316 results.
31. MEDLINE; exp PROGNOSIS/; 639740 results.
32. MEDLINE; prognosis.af; 356881 results.
33. MEDLINE; (exp CORONARY DISEASE/) OR ("coronary disease$".af) OR ("coronary heart disease$".af) OR
(coronary$.af) OR (exp MYOCARDIAL INFARCTION/) or ("myocardial infarction$".af) OR ("myocardial
infarction$".af) OR (exp CARDIOVASCULAR DISEASES/) or (("coronary disease$".af) OR ("coronary heart
disease$".af) OR (coronary$.af) OR ("myocardial infarction$".af) OR (exp CARDIOVASCULAR DISEASES/));
1560108 results.
34. MEDLINE; ((exp CORONARY DISEASE/) OR ("coronary disease$".af) OR ("coronary heart disease$".af) OR
(coronary$.af) OR (exp MYOCARDIAL INFARCTION/) OR ("myocardial infarction$".af) OR ("myocardial
infarction$".af) OR (exp CARDIOVASCULAR DISEASES/) OR (("coronary disease$".af) OR ("coronary heart
disease$".af) OR (coronary$.af) OR ("myocardial infarction$".af) OR (exp CARDIOVASCULAR DISEASES/))) AND
((exp PROGNOSIS/) OR (prognosis.af)); 136554 results.
35. MEDLINE; (((exp CORONARY DISEASE/) OR ("coronary disease$".af) OR ("coronary heart disease$".af) OR
(coronary$.af) OR (exp MYOCARDIAL INFARCTION/) OR ("myocardial infarction$".af) OR ("myocardial
infarction$".af) OR (exp CARDIOVASCULAR DISEASES/) OR (("coronary disease$".af) OR ("coronary heart
disease$".af) OR (coronary$.af) OR ("myocardial infarction$".af) OR (exp CARDIOVASCULAR DISEASES/))) AND
((exp PROGNOSIS/) OR (prognosis.af))) AND ((exp ASIAN CONTINENTAL ANCESTRY GROUP/) OR (exp
INDIA/eh) OR (india$.ti,ab) OR (exp SRI LANKA/eh) OR ("sri lanka$".ti,ab) OR (exp BANGLADESH/eh) OR
("bangladesh$".ti,ab) OR (exp PAKISTAN/eh) OR ("pakistan$".ti,ab)) AND ((exp EUROPE/eh) OR (exp EUROPEAN
CONTINENTAL ANCESTRY GROUP/) OR (european$.ti,ab) OR (White$.ti,ab)); 59 results.
36. MEDLINE; ((exp CORONARY DISEASE/) OR ("coronary disease$".af) OR ("coronary heart disease$".af) OR
(coronary$.af) OR (exp MYOCARDIAL INFARCTION/) OR ("myocardial infarction$".af) OR ("myocardial
infarction$".af) OR (exp CARDIOVASCULAR DISEASES/) OR (("coronary disease$".af) OR ("coronary heart
disease$".af) OR (coronary$.af) OR ("myocardial infarction$".af) OR (exp CARDIOVASCULAR DISEASES/))) AND
((exp PROGNOSIS/) OR (prognosis.af)); 138044 results.
37. MEDLINE; (((exp CORONARY DISEASE/) OR ("coronary disease$".af) OR ("coronary heart disease$".af) OR

236
(coronary$.af) OR (exp MYOCARDIAL INFARCTION/) OR ("myocardial infarction$".af) OR ("myocardial
infarction$".af) OR (exp CARDIOVASCULAR DISEASES/) OR (("coronary disease$".af) OR ("coronary heart
disease$".af) OR (coronary$.af) OR ("myocardial infarction$".af) OR (exp CARDIOVASCULAR DISEASES/))) AND
((exp PROGNOSIS/) OR (prognosis.af))) AND ((exp ASIAN CONTINENTAL ANCESTRY GROUP/) OR (exp
INDIA/eh) OR (india$.ti,ab) OR (exp SRI LANKA/eh) OR ("sri lanka$".ti,ab) OR (exp BANGLADESH/eh) OR
("bangladesh$".ti,ab) OR (exp PAKISTAN/eh) OR ("pakistan$".ti,ab)) AND ((exp EUROPE/eh) OR (exp EUROPEAN
CONTINENTAL ANCESTRY GROUP/) OR (european$.ti,ab) OR (White$.ti,ab)); 59 results.
38. MEDLINE; exp FOLLOW-UP STUDIES/; 378507 results.
39. MEDLINE; follow-up.af; 642761 results.
40. MEDLINE; exp TREATMENT OUTCOME/; 365669 results.
41. MEDLINE; (disease AND outcome).af; 206093 results.
42. MEDLINE; ((exp CORONARY DISEASE/) OR ("coronary disease$".af) OR ("coronary heart disease$".af) OR
(coronary$.af) OR (exp MYOCARDIAL INFARCTION/) OR ("myocardial infarction$".af) OR ("myocardial
infarction$".af) OR (exp CARDIOVASCULAR DISEASES/) OR (("coronary disease$".af) OR ("coronary heart
disease$".af) OR (coronary$.af) OR ("myocardial infarction$".af) OR (exp CARDIOVASCULAR DISEASES/))) AND
((exp PROGNOSIS/) OR (prognosis.af) OR (exp FOLLOW-UP STUDIES/) OR (follow-up.af) OR (exp TREATMENT
OUTCOME/) OR ((disease AND outcome).af)); 237774 results.
43. MEDLINE; (((exp CORONARY DISEASE/) OR ("coronary disease$".af) OR ("coronary heart disease$".af) OR
(coronary$.af) OR (exp MYOCARDIAL INFARCTION/) OR ("myocardial infarction$".af) OR ("myocardial
infarction$".af) OR (exp CARDIOVASCULAR DISEASES/) OR (("coronary disease$".af) OR ("coronary heart
disease$".af) OR (coronary$.af) OR ("myocardial infarction$".af) OR (exp CARDIOVASCULAR DISEASES/))) AND
((exp PROGNOSIS/) OR (prognosis.af) OR (exp FOLLOW-UP STUDIES/) OR (follow-up.af) OR (exp TREATMENT
OUTCOME/) OR ((disease AND outcome).af))) AND ((exp ASIAN CONTINENTAL ANCESTRY GROUP/) OR (exp
INDIA/eh) OR (india$.ti,ab) OR (exp SRI LANKA/eh) OR ("sri lanka$".ti,ab) OR (exp BANGLADESH/eh) OR
("bangladesh$".ti,ab) OR (exp PAKISTAN/eh) OR ("pakistan$".ti,ab)) AND ((exp EUROPE/eh) OR (exp EUROPEAN
CONTINENTAL ANCESTRY GROUP/) OR (european$.ti,ab) OR (White$.ti,ab)); 133 results.
44. MEDLINE; ((((exp CORONARY DISEASE/) OR ("coronary disease$".af) OR ("coronary heart disease$".af) OR
(coronary$.af) OR (exp MYOCARDIAL INFARCTION/) OR ("myocardial infarction$".af) OR ("myocardial
infarction$".af) OR (exp CARDIOVASCULAR DISEASES/) OR (("coronary disease$".af) OR ("coronary heart
disease$".af) OR (coronary$.af) OR ("myocardial infarction$".af) OR (exp CARDIOVASCULAR DISEASES/))) AND
((exp PROGNOSIS/) OR (prognosis.af) OR (exp FOLLOW-UP STUDIES/) OR (follow-up.af) OR (exp TREATMENT
OUTCOME/) OR ((disease AND outcome).af))) AND ((exp ASIAN CONTINENTAL ANCESTRY GROUP/) OR (exp

237
INDIA/eh) OR (india$.ti,ab) OR (exp SRI LANKA/eh) OR ("sri lanka$".ti,ab) OR (exp BANGLADESH/eh) OR
("bangladesh$".ti,ab) OR (exp PAKISTAN/eh) OR ("pakistan$".ti,ab)) AND ((exp EUROPE/eh) OR (exp EUROPEAN
CONTINENTAL ANCESTRY GROUP/) OR (european$.ti,ab) OR (White$.ti,ab))) NOT ((((exp CORONARY
DISEASE/) OR ("coronary disease$".af) OR ("coronary heart disease$".af) OR (coronary$.af) OR (exp
MYOCARDIAL INFARCTION/) OR ("myocardial infarction$".af) OR ("myocardial infarction$".af) OR (exp
CARDIOVASCULAR DISEASES/) OR (("coronary disease$".af) OR ("coronary heart disease$".af) OR (coronary$.af)
OR ("myocardial infarction$".af) OR (exp CARDIOVASCULAR DISEASES/))) AND ((exp PROGNOSIS/) OR
(prognosis.af))) AND ((exp ASIAN CONTINENTAL ANCESTRY GROUP/) OR (exp INDIA/eh) OR (india$.ti,ab)
OR (exp SRI LANKA/eh) OR ("sri lanka$".ti,ab) OR (exp BANGLADESH/eh) OR ("bangladesh$".ti,ab) OR (exp
PAKISTAN/eh) OR ("pakistan$".ti,ab)) AND ((exp EUROPE/eh) OR (exp EUROPEAN CONTINENTAL
ANCESTRY GROUP/) OR (european$.ti,ab) OR (White$.ti,ab))); 74 results.

238
13.6 Search Strategies for prognosis in MEDLINE in Ovid Syntax and the
PubMed translation
For prognosis, the following data are shown: the single term with the highest
sensitivity while keeping specificity at 50%; the single term with the highest
specificity while keeping the sensitivity at 50%; the single term with the least
(minimal) absolute difference between sensitivity and specificity; and then the
same data for multiple terms (the single term strategy may be shown again if it
performs at least as well as multiple terms). In the second column of the table the
search strategies are shown in Ovid syntax followed by the PubMed translation.
In the third column of the table: sens = sensitivity; spec = specificity; prec =
precision; acc = accuracy.
Prognosis
Ovid Strategy Strategy type
PubMed Translation
Sens / spec / prec / acc
(%)
exp epidemiologic studies 1 term
high sensitivity epidemiologic studies(MeSH term)
65 / 79 / 1 / 79
exp epidemiologic studies 1 term
high specificity epidemiologic studies(MeSH term)
65 / 79 / 1 / 79
exp epidemiologic studies 1 term
min difference epidemiologic studies(MeSH term)
65 / 79 / 1 / 79
incidence.sh. OR exp mortality OR
follow-up studies.sh. OR
prognos:.tw. OR
predict:.tw. OR
course:.tw.
2 or more terms
high sensitivity
incidence(MeSH:noexp) OR
90 / 80 / 2 / 80

239
mortality(MeSH Terms) OR
follow up studies(MeSH:noexp) OR
prognos*(Text Word) OR
predict*(Text Word) OR
course*(Text Word)
prognos:.tw. OR
first episode.tw. OR
cohort.tw.
2 or more terms
high specificity prognos*(Title/Abstract) OR
(first(Title/Abstract) AND
episode(Title/Abstract)) OR
cohort(Title/Abstract)
52 / 94 / 3 / 94
prognosis.sh. OR
diagnosed.tw. OR
cohort:.mp. OR
predictor:.tw. OR
death.tw. OR
exp models, statistical
2 or more terms
min difference prognosis(MeSH:noexp) OR
diagnosed(Title/Abstract) OR
cohort*(Title/Abstract) OR
cohort effect(MeSH Term) OR
cohort studies(MeSH:noexp) OR
predictor*(Title/Abstract) OR
death(Title/Abstract) OR
"models, statistical"(MeSH Term)
83 / 84 / 2 / 84
With thanks to Bridget Cole, Trust Librarian, Sir Thomas Browne Library,
Norfolk & Norwich University Hospitals NHS Foundation Trust

240
13.7 Deprivation scores
13.7.1 Indices of Multiple Deprivation
The Indices of Multiple Deprivation are measures of deprivation for every area in
England. The Index consists of 33 indicators of need which have been statistically
condensed into six themes with some given more importance or weight than
others:
• Income deprivation (two and a half times the importance of the lowest).
• Employment deprivation (two and a half times the importance of the
lowest).
• Health deprivation/disability (one and a half times the importance of the
lowest).
• Education/skills and training deprivation (one and a half times the
importance of the lowest).
• Housing deprivation (joint lowest importance).
• Geographical access to services (joint lowest importance).
Indices of Multiple Deprivation are based on a range of administrative data and
have the advantage that as they are not based solely on census results they can
be updated more than once every ten years. The indices combine these
indicators into a single deprivation score for each small area in England. This
allows each area to be ranked relative to one another according to their level of
deprivation. In 2000, they were measured at a ward level which may not take
into account heterogeneity within that area. IMD 2004 and 2007 used the
smaller Lower Super Output Area level, of which there are 32,482 in the country.
13.7.2 Carstairs
Carstairs scores are an unweighted combination of four census variables:
unemployment, overcrowding, car ownership and low social class (Social Class
IV and V). The definitions used by the Office for National Statistics for the 2001
scores are shown below:

241
Each variable is standardised (z-scored) to avoid the score being unduly
influenced by a high or low value for any one variable and to put each variable on
the same scale, centred around zero. This is done for each variable by subtracting
the mean of the observations for all wards in England and Wales from the value
of that variable for each ward and dividing by the standard deviation for that
variable. The resulting values for each variable are summed to give a single score
for that ward. The scores can be either positive (more deprived) or negative (less
deprived).
13.7.3 Townsend
The Townsend Score is derived from the following census variables:
• Unemployment - the percentage of economically active residents aged 16-
59/64 who are unemployed.
• Car ownership - the percentage of private households who do not posses
a car.
• Home ownership - the percentage of private households not owner
occupied.
• Overcrowding- the percentage of private households with more than one
person per room.
The Townsend Score is a summation of the standardised scores (z scores) for
each variable (scores higher than zero indicate higher levels of material
deprivation).

242
13.8 Terminology for description of people
In the general description of persons who may be relevant to this work, I have
used the terms people and populations.
When specifically discussing those within the studies of this thesis, I used the
term participants when referring to the healthy population of Whitehall-II and to
those in Chest Pain Clinic study, who have yet to be diagnosed with disease. For
those participating in ACRE and MINAP, I have used the term patient. For general
discussion of these participants, I continue to use the terms people and
populations.
Towards the end, I discuss all people – whether describing those in general or
those in the studies of this thesis - as part of populations or as patients rather
than as participants of studies.
13.9 Fonts
The text is written in Cambria, the figures/tables in Calibri

243
14 Abstracts
14.1 ACRE
Zaman MJ, Feder G, Crook AM, Junghans C, Fitzpatrick N, Timmis A, Hemingway
H. Ethnic differences in long-term improvement of angina following
revascularization. World Congress of Cardiology 2006, Barcelona, Spain

244
14.2 Chest pain clinic
Zaman MJ, Junghans C, Sekhri N, Chen R, Feder G, Timmis A, Hemingway H.
Stable Angina Histories - Do Sex And Ethnic Differences Matter?- A Prospective
Study In 7794 Ambulatory Patients. AHA Quality of Care and Outcomes Research
in Cardiovascular Disease and Stroke 2007, Washington DC,USA

245
14.3 Systematic review and meta-analysis
Zaman MJ, Chen R, Timmis A, Marmot M, Hemingway H. Increased
cardiovascular mortality in minority ethnic groups: a result of increased
incidence or case fatality? Four new studies and a meta-analysis in South Asians.
AHA Epidemiology 2008, Colorado Springs

246
14.4 The Whitehall-II study
Zaman MJ, Shipley M, Stafford M, Brunner E, Marmot M, Timmis AD, Hemingway
H. The incidence, character and prognosis of angina in South Asian and European
populations. EuroPRevent 2008, Paris, France

247
15 Papers
15.1 Prognosis of incident typical and non-typical angina

248
15.2 Symptomatic outcomes following coronary angiography in
patients with chronic stable angina

249
16 Prizes
16.1 Best Poster (Clinical Science), UCL Cardiovascular Science Day
2006

250
16.2 British Junior Cardiologist’s Association-Cordis International
Research Awards Finalist 2006

251
16.3 Royal Society of Medicine Cardiology Section's President's Medal
finalist 2008

252
17 Invited talks
17.1 MINAP conference, Royal College of Physicians 27 March 2007

253
17.2 South Asian Health Foundation conference on management of
Coronary Heart Disease in South Asians, Royal College of
Physicians 1st December 2008
Copyright © 2022 FDOKUMEN