Professor Doug Perovic
18
Professor Doug Perovic Materials Science and Engineering
-
Upload
independent -
Category
Documents
-
view
6 -
download
0
Transcript of Professor Doug Perovic

Professor Doug Perovic Materials Science and Engineering
“The entire physical world is most properly regarded as a great energy system: an enormous marketplace in which one form of energy is forever being traded for another form according to set rules and values. That which is energetically advantageous is that which will sooner or later happen. In one sense, a structure is a device which exists in order to delay some event which is energetically favored. It is energetically advantageous, for instance, for a weight to fall to the ground, for strain energy to be released and so on. Sooner or later the weight will fall to the ground and the strain energy will be released; but it is the business of a structure to delay such events for a season, for a lifetime, or for thousands of years. All structures will be broken or destroyed in the end, just as people will die in the end. It is the purpose of medicine and engineering to postpone these occurrences for a decent interval”
[Ref: J. Gordon, Structures: Or Why Things Don’t Fall Down, (New York, Penguin Books), 1978]
Unacceptable difference between expected and observed performance
Do not achieve expected quality of performance for the expected period of time
Look beyond Catastrophic fracture problems…
Excessive deformation Serviceability problems Excessive vibrations Inadequate environmental control systems Premature deterioration Leaks
Much of knowledge used to design, construct, manufacture and operate engineered facilities and products has been obtained through learning from failures
Failure analysis improved engineering design practices
Trial-and-error Trial-and-success Development and evolution of design codes, standards
of practice, construction and manufacturing procedures Dissemination of failure analysis information to design
professionals (c.f. medical pathology medical science)
Usually refers to the determination of how a specific component or product has failed
Consideration of materials selection, design, product usage, methods of production, mechanics of failure within component
Investigations typically include: Product Failure (e.g. fracture of critical part of a product) Process Failure (e.g. a manufacturing process fails to achieve
the intended effect) Design Failure (e.g. many products fail prematurely)
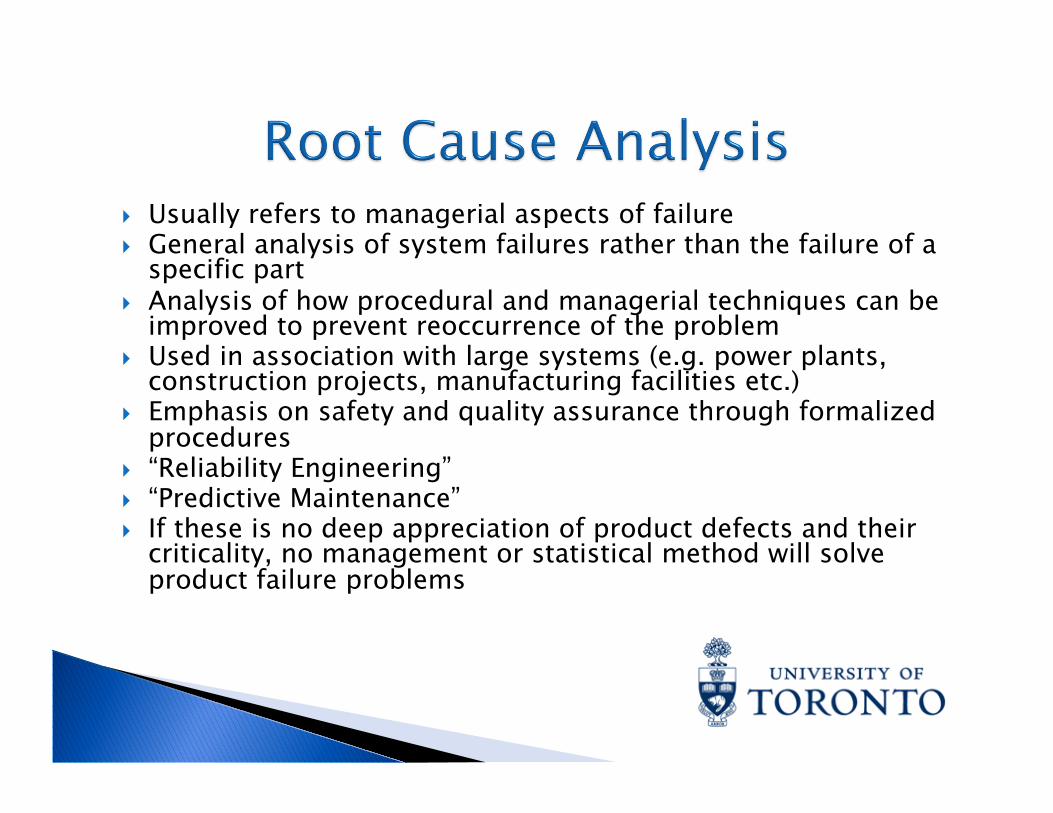
Usually refers to managerial aspects of failure General analysis of system failures rather than the failure of a
specific part Analysis of how procedural and managerial techniques can be
improved to prevent reoccurrence of the problem Used in association with large systems (e.g. power plants,
construction projects, manufacturing facilities etc.) Emphasis on safety and quality assurance through formalized
procedures “Reliability Engineering” “Predictive Maintenance” If these is no deep appreciation of product defects and their
criticality, no management or statistical method will solve product failure problems
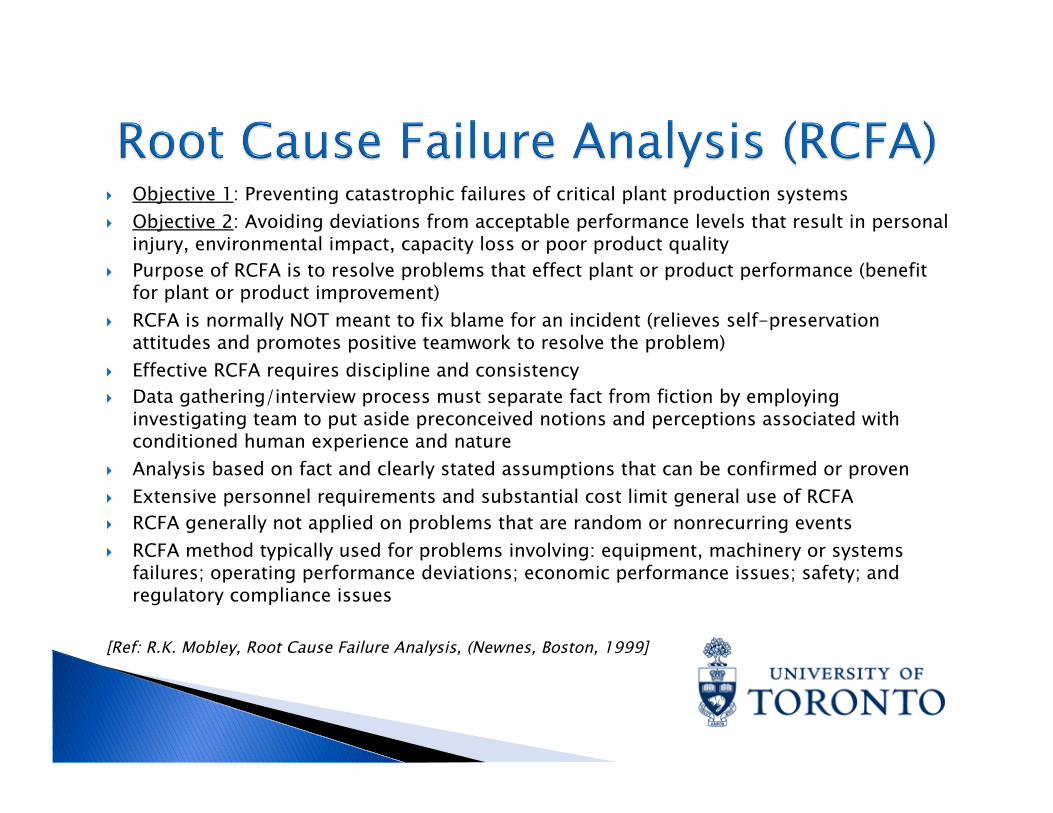
Objective 1: Preventing catastrophic failures of critical plant production systems Objective 2: Avoiding deviations from acceptable performance levels that result in personal
injury, environmental impact, capacity loss or poor product quality Purpose of RCFA is to resolve problems that effect plant or product performance (benefit
for plant or product improvement) RCFA is normally NOT meant to fix blame for an incident (relieves self-preservation
attitudes and promotes positive teamwork to resolve the problem) Effective RCFA requires discipline and consistency Data gathering/interview process must separate fact from fiction by employing
investigating team to put aside preconceived notions and perceptions associated with conditioned human experience and nature
Analysis based on fact and clearly stated assumptions that can be confirmed or proven Extensive personnel requirements and substantial cost limit general use of RCFA RCFA generally not applied on problems that are random or nonrecurring events RCFA method typically used for problems involving: equipment, machinery or systems
failures; operating performance deviations; economic performance issues; safety; and regulatory compliance issues
[Ref: R.K. Mobley, Root Cause Failure Analysis, (Newnes, Boston, 1999]
Four common techniques:
1. Failure Mode and Effects Analysis (FMEA) 2. Fault-Tree Analysis 3. Sequence of Event Analysis 4. Cause and Effect Analysis

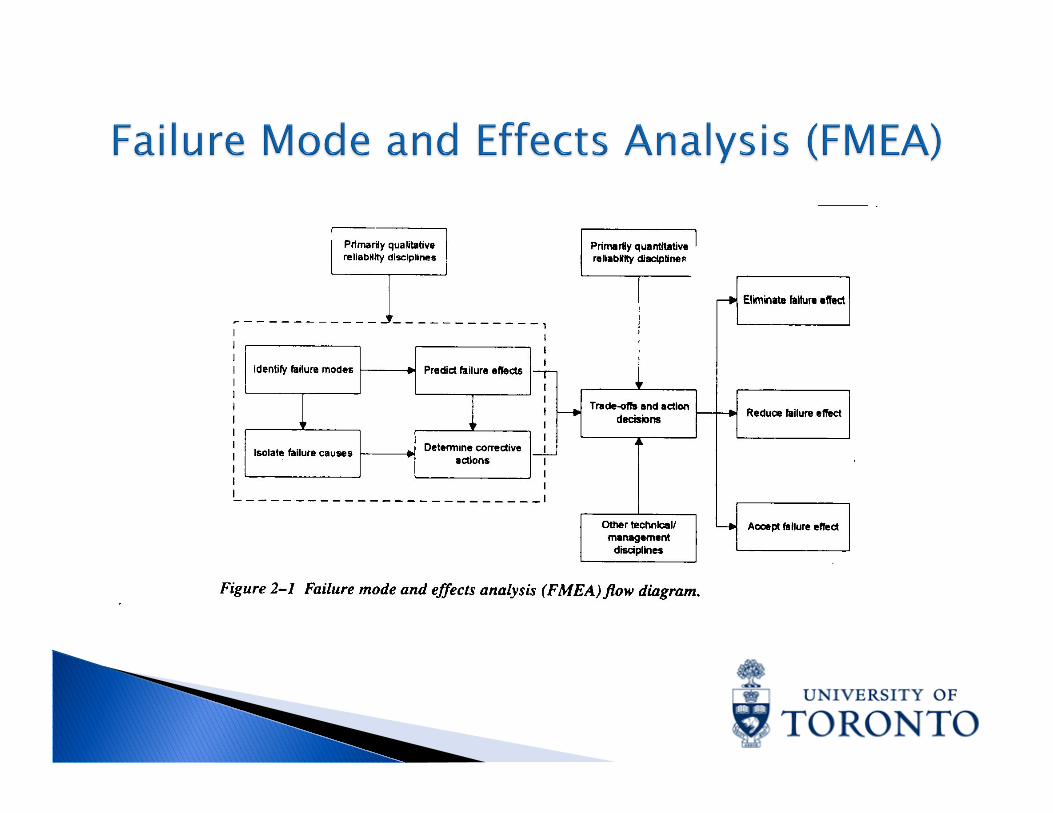
Design-evaluation procedure to identify potential failure modes and determine effect of each on system performance
Documentation of standard practice, generates historical record and serves as basis for future improvements
Logical step sequence process starting at lower-level subsystems or components
Assumes failure point of view by identifying potential modes of failure along with their failure mechanism
Each failure mode effect is traced to system level Each failure mode and resulting effect is given criticality rating based on
probability of occurrence (P), severity (S) and detectability (D) Criticality threshold represented by Risk Priority Number (RPN)= P x S x D High criticality threshold ratings lead to design changes Advantages: (i) more reliable designs, (ii) improved reliability by anticipating
problems and instituting corrections (iii) improved validity of analytical method
Disadvantages: (i) logic trees based on failure probabilities at component level for standard conditions and extrapolation techniques cannot be used to modify data for particular applications (ii) full application is very expensive
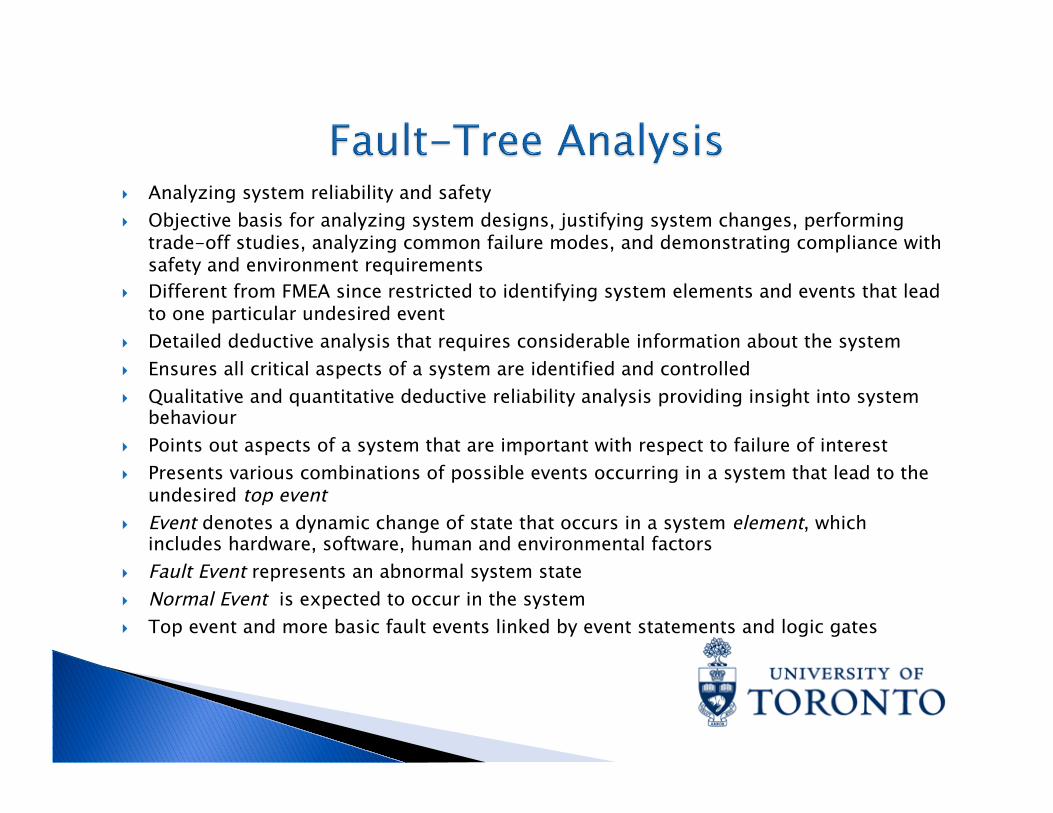
Analyzing system reliability and safety Objective basis for analyzing system designs, justifying system changes, performing
trade-off studies, analyzing common failure modes, and demonstrating compliance with safety and environment requirements
Different from FMEA since restricted to identifying system elements and events that lead to one particular undesired event
Detailed deductive analysis that requires considerable information about the system Ensures all critical aspects of a system are identified and controlled Qualitative and quantitative deductive reliability analysis providing insight into system
behaviour Points out aspects of a system that are important with respect to failure of interest Presents various combinations of possible events occurring in a system that lead to the
undesired top event Event denotes a dynamic change of state that occurs in a system element, which
includes hardware, software, human and environmental factors Fault Event represents an abnormal system state Normal Event is expected to occur in the system Top event and more basic fault events linked by event statements and logic gates

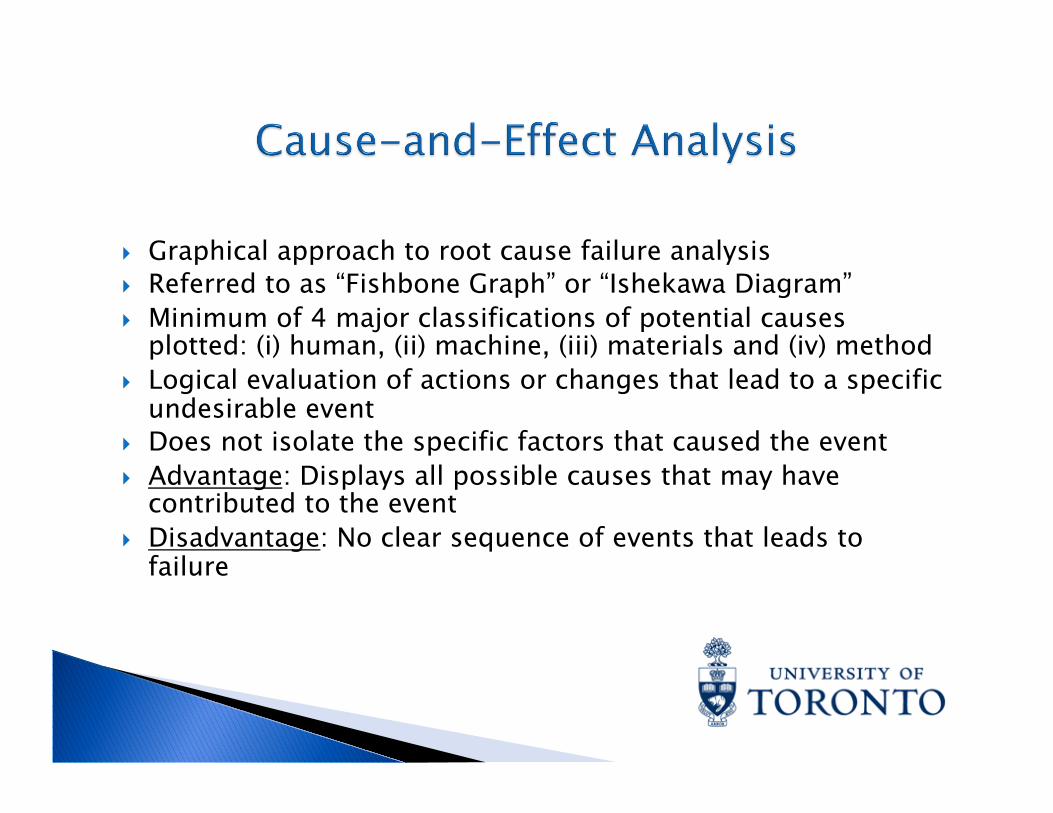
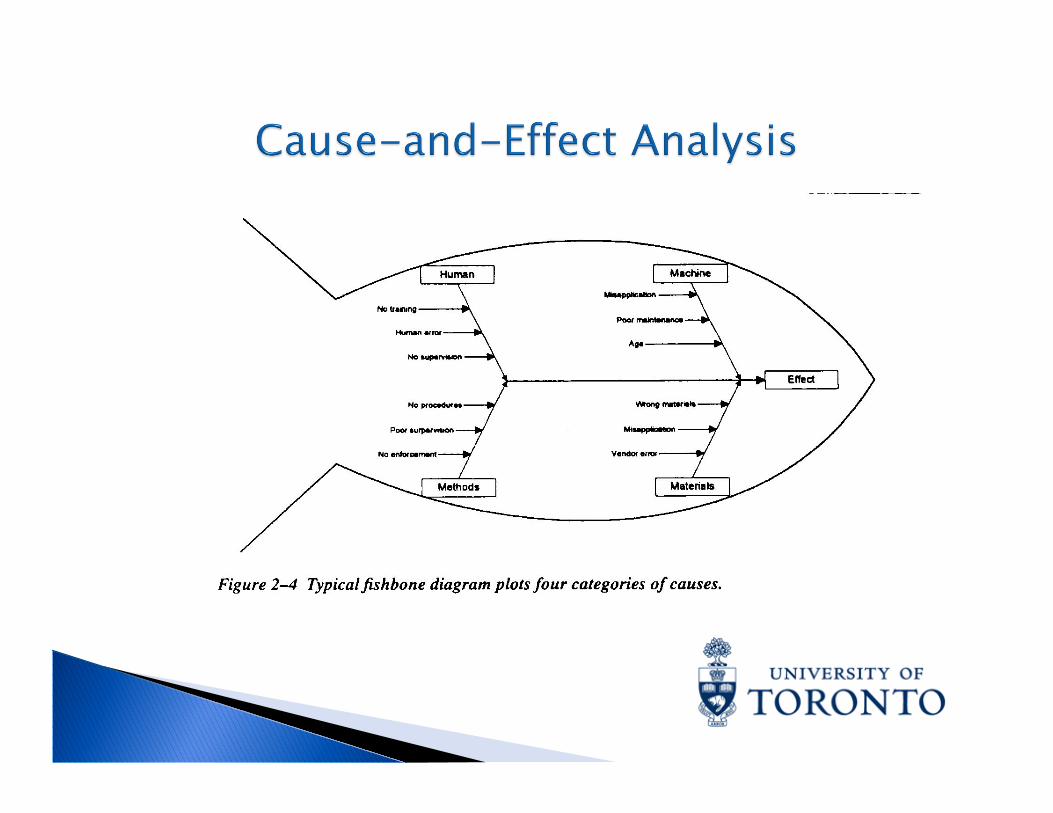
Graphical approach to root cause failure analysis Referred to as “Fishbone Graph” or “Ishekawa Diagram” Minimum of 4 major classifications of potential causes
plotted: (i) human, (ii) machine, (iii) materials and (iv) method Logical evaluation of actions or changes that lead to a specific
undesirable event Does not isolate the specific factors that caused the event Advantage: Displays all possible causes that may have
contributed to the event Disadvantage: No clear sequence of events that leads to
failure
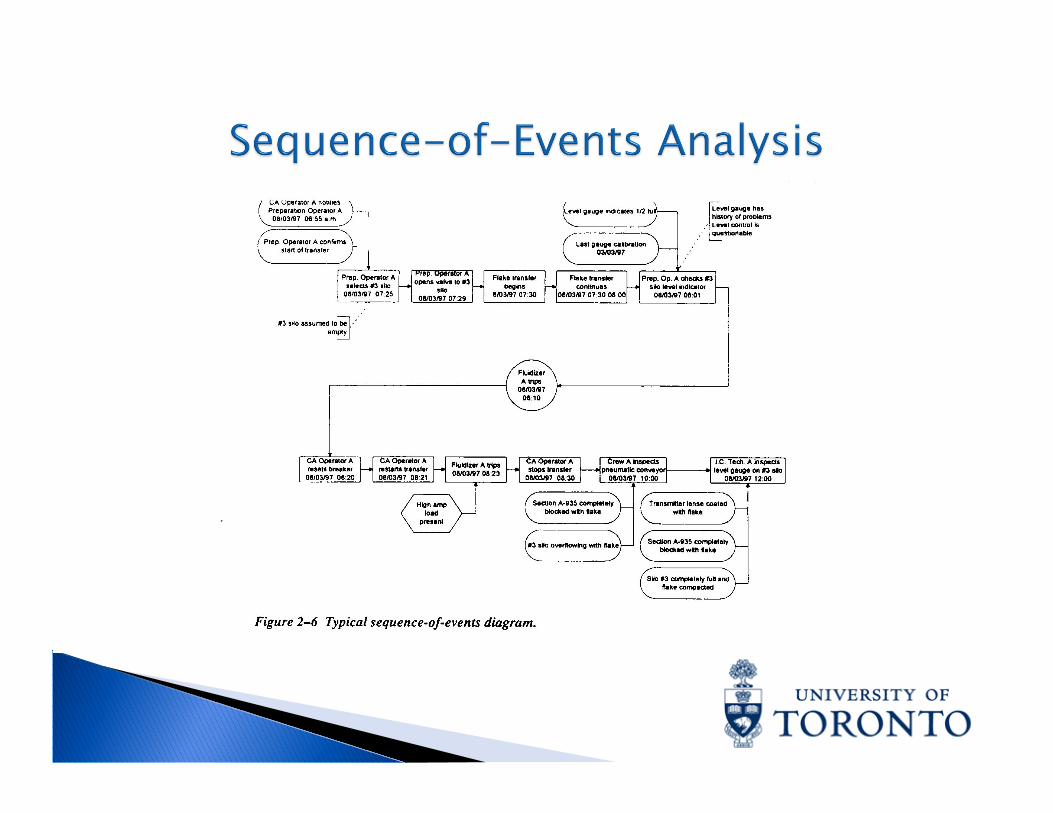
Software programs used to generate sequence-of-events diagram for all investigated events
Ideal for organization of information collected Identifies missing or conflicting information Improves understanding by showing relationship between events and the
incident Highlights potential causes of the incident Dynamic document that is continually modified until event is fully resolved Logical order used to describe confirmed events in active rather than passive
terms Each assumption and unconfirmed contributor to the event must be either
confirmed or discounted during course of investigation with sequence-of-events diagram modified accordingly
Requires precise definition and qualification of each event, forcing function and qualifier
Qualifiers should provide all confirmed background or support data needed to accurately define the event or forcing function