
Prof Salleh -Usage of the Internet and Its Effect On Youth Development
30
Usage of the Internet and Its Effect On Youth Development By Toktam Namayandeh Joorabchi, Md. Salleh Hj. Hassan and Mohd. Nizam Osman WJMCR 45 (November 2013) Introduction | Research Questions | Patterns of Internet Usage | Gratification of Internet Usage | Positive Youth Development | Research Methodology | Reach and Growth | Gratifications | Conclusion Abstract These days, more information is presented to more people from more sources than at any time in human history. This study was designed by applying the Uses and Gratification theory framework, to understand Internet usage among students. The objectives of this study are to identify the relationship between purpose of using the Internet, pattern of Internet usage and Internet skill with the gratification of Internet usage as a mediation variable and positive youth development (PYD). The objectives for this study are to determine the mediating effects of Internet gratification usage between purposes of Internet usage, Internet skill, and patterns of Internet usage and positive youth development. The present study used a survey design to achieve its objectives. This study found a significant and positive relationship between purposes of Internet usage with gratification of Internet usage. Also, the purpose of Internet usage has significant relationship with connection and confidence in PYD dimension. The relationship between gratification of Internet usage and five dimensions of positive youth development is positive and significant. The relationship between pattern of using Internet and the character dimension in positive youth development is significant. There is no relationship between Internet skill and 5 dimensions of PYD. Keywords: Media, Internet usage, Positive Youth Development, Malaysia
-
Upload
jahangirian -
Category
Documents
-
view
3 -
download
0
Transcript of Prof Salleh -Usage of the Internet and Its Effect On Youth Development
Usage of the Internet and Its Effect OnYouth Development
By Toktam Namayandeh Joorabchi, Md. Salleh Hj. Hassan andMohd. Nizam Osman
WJMCR 45 (November 2013)
Introduction | Research Questions | Patterns of Internet Usage| Gratification of Internet Usage | Positive Youth Development| Research Methodology | Reach and Growth | Gratifications |
Conclusion
AbstractThese days, more information is presented to more people from more sources than at any time in human history. This study wasdesigned by applying the Uses and Gratification theory framework, to understand Internet usage among students. The objectives of this study are to identify the relationship between purpose of using the Internet, pattern of Internet usage and Internet skill with the gratification of Internet usage as a mediation variable and positive youth development (PYD). The objectives for this study are to determine the mediating effects of Internet gratification usage between purposes of Internet usage, Internet skill, and patterns of Internet usage and positive youth development. The present study used a survey design to achieve its objectives. This study found a significant and positive relationship between purposes of Internet usage with gratification of Internet usage. Also, the purpose of Internet usage has significant relationship with connection and confidence in PYD dimension. The relationship between gratification of Internet usage and five dimensions of positive youth development is positive and significant. The relationship between pattern of using Internet and the character dimension in positive youth development is significant. There is no relationship between Internet skill and 5 dimensions of PYD.
Keywords: Media, Internet usage, Positive Youth Development, Malaysia
IntroductionLack of information creates a negative impact on our lives, particularly on the educated layer of society. The new media is one of the most important mass media in the world and it changes the world in many aspects. Students are the most important group in society because they would be building the future society. Students who use the Internet tend to be more open-minded than those who do not use the Internet. According to Trish 1, women who use the Internet tend to be more open minded than those who do not use the Internet. Malaysia has 16million Internet users 2. Even children in Malaysia spend 19 hours per week, 9 out of 10 had been to negative experience while surfing3. In 2008, 17.9% Malaysian youth, their age between 15 to 19 are the highest users of Internet compared tothe other age group4. The National Youth Development Policy of Malaysia considers youth as people aged between 15 and 40 years5. Because Malaysia was chosen as a location of this study, researchers followed the Malaysian’s youth definition. The youngest respondents are 18 years and the oldest ones are 40 years old.
Youth programmers should makes the plan for the youth and teach them to develop themselves in a positive manner. If society guides youth to the positive way, they automatically keep their distance from anti-social and abnormal behavior. Young people whose lives have higher amounts of the Five Cs (Competence, Character, Caring, Confidence and Connection) would be at lower risk for a developmental path that integrates personal, social, and behavioral problems and risks6. The research had been done by Yusof, Hashim, Vengadasamy and Sivapunniam7 shows that students that have blogs mentioned that their self-confidence increased when their friends and families visited their home pages to read their creative work. In another study Sivapunniam, Hamdan, andYusof 8 show that online discussion forums play an important role within the online learning environment. Therefore, it is of interest to find out how the use of Internet contributes towards positive youth development in term of 5Cs. Studies elsewhere have shown that with proper guidance the youth will be able to attain such development9. This study tries to find out if the Internet can increase 5Cs among students? If media
lead youth to the positive development they are automatically far away from the negative development10.
Research Questions 1. Is there a relationship between Internet usage and
gratifications of Internet usage? Is there a relationshipbetween Internet usage and positive developments?
2. What is the mediating effect of Internet gratification use between the independent variables (Internet skill, pattern of Internet usage and purpose of Internet usage) and positive youth development?
Patterns of Internet Usage Asemi 11, studied information-searching habits of Internet users in a medical science university in Isfahan. She found that 87 % of the students accessed the Internet in the facility, and that 15 % logged in four hours a day, 76 % two hours a day and 54 %an hour daily. Their purposes for using the Internet were: searching for information for research (55 %), looking up general information such as travel and tourism (37 %) and downloading music, movies, etcetera (8%). Twenty-eight percent did research work, 41 %, read e-journals and 37%checked email. Yahoo and Google are the most popular and widely used search engines with 61% and 68 %, respectively. Fifty four percent of the respondents said that they “Always find useful information,” while 51% mentioned that the “Internet has the best source of information.”
The Internet can be accessed from a variety of locations – home, office, library, school, museum, hotel, airport, etc. The most common place for users to access the Internet is fromhome (94%), followed by the office (53%), and while traveling (36%). Libraries are used as places from which to access the Internet by about one third of all Internet users. Less than one third of users (31%) access the Internet from public libraries. However, there are some who access the Internet from other types of libraries as well. Out of the variety of libraries used by those who use the library to access the Internet, public libraries are the most common type of library(93%), followed by school libraries (16%), special (medical,
law, government) libraries (10%) and college or university libraries (6%)12.
Internet Skill
The concept of Internet skills is just one of many concepts that have resulted from the rapid diffusion of digital technologies in society. Internet experience is positively related to how long an individual has used the Internet. Novak, Hoffman and Yung13 define skills as a user’s capacity for action during the online navigation process. Users who have used the Internet for longer periods are more likely to use the Internet for task-oriented activities, for instance, looking for reference material or product information, conducting research and shopping.
Gratification of Internet Usage Paul Lazarsfeld and Frank Stanton14 published a series of work during World War II that focused on how audiences use the media in their daily life15. Herzong, a student of Lazarsfeld, used the term ‘gratifications’ in 1944 in media research history and is often credited as the founder of the Uses and Gratifications theory. Herzong was interested in why women enjoyed soap operas. She conducted a research investigating the Uses and Gratifications of radio soap operas (Herzong,16 cited in Baran and Davis)17.
Rubin18 mentioned that people use communication media to fulfill their variety of needs. Windahl19 noted that the main difference between the traditional effects theory and Uses andGratifications theory in mass communication is usually examined from the point of view of communicators for the former, while the members of audience is a starting point in Uses and Gratifications study. According to Blumer and Katz 20,for both society and individuals, the media serve the functions of surveillance, correlation, entertainment and cultural transmission. Blumler, Katz and Gurevitch21 said that the Uses and Gratifications theory was an attempt to explain how individuals use the media to satisfy their needs and
achieve their goals instead of the media having ultimate powerover the viewer.
The assumptions of the U&G theory put forward22 by Denis McQuail, quoted by Stafford et al23 are:
1. Media selection and use is purposive and motivated, and people take the initiative in selecting and using communication vehicles to satisfy felt needs and desires.
2. The audience is active. 3. Based on previous experience with the media, the audience
makes motivated choices, and 4. In everyday life, the media use is only one way amongst
others to satisfy needs.
Blumler and Katz24 summarized the theory as one concerned with:(1) the social and psychological origins of (2) needs, which generates (3) expectations of (4) the mass media or other sources, which lead to (5) differential patterns of media exposure or engagement in other activities, resulting in (6) needs gratification and (7) other consequences, perhaps mostlyunintended ones. Dimmick, Sikand and Patterson25 noted that this approach views the audience member as being a user who makes conscious and motivated choices in the selection of media and content.
Katz, Gurevitch and Haas26 studied people’s use of the mass media to meet specific needs, and presented a five-fold classification of needs, which they say all media users essentially have. These are
1. Cognitive needs: Needs related to strengthening of information, knowledge and understanding of our environment.
2. Affective needs: Needs related to strengthening aesthetic, pleasurable and emotional experience.
3. Personal Integrative needs: Needs related to strengthening credibility, confidence, stability and status of the individuals.
4. Social Integrative needs: Needs related to strengthening contact with family, friends and the world.
5. Escapist needs: Needs related to escape, release tension and the desire for diversion.
Positive Youth Development The PYD approach builds upon what have become known as the “Five Cs”: Competence, Confidence, Connection, Character and Caring 27. Researchers theorized that youth whose lives incorporated this Five Cs would be on a developmental path that would result in the development of a Sixth C: Contributions to self, family and community, and to the institutions of a civil society. Such contributions are envisioned to have both a behavioral (action) constituent and an ideological component, for instance, the young person possesses a characteristic that specifies such contributions are predicated on moral and civic duty 28.
On the other hand, when youth believe that they should contribute to self and context and when they act on these beliefs, they will both reflect and promote further advances in their own positive development and, also, the health of their social world. Additionally, Lerner 29mentioned that thoseyouth whose lives contained lower amounts of the Five Cs wouldbe at higher risk for a developmental path that consists of personal, social and behavioral problems and risks.
Integrating the theoretical ideas about the plasticity of adolescent development and the practical findings about the multiple pathways children take through adolescence led to theframework now known asPYD, which views young people as resources to be developed rather than as problems to be managed 30.
This relationship between PYD and risk/problem behaviors, though, was not seen as simple or uniform. The plasticity of development meant that some children from some homes, schools and communities that lacked resources and supports demonstrated themselves to be resilient and resistant to problems. Others who came from environments filled with resources and supports were drawn nonetheless into numerous troubles. However, in general, PYD examiners hypothesized thatthe availability of activities that supported the Five Cs would help steer young people toward a life of successful contribution 31.
Research Methodology A survey was conducted at Universiti Putra Malaysia (UPM), Serdang, Malaysia. The design of the study required data to becollected from local students in three major races such as Malay, Chinese and Indian who are doing their Bachelor, Masterand PhD in this university. Respondents for this study were selected using a cluster sampling method. This technique is very useful when dealing with a very large target population when it would be impossible to generate a complete sampling frame 32. Then, the questionnaire was distributed among 16 faculties according to the population of each faculty. Sample size for this study is 400 respondents. Before the actual datacollection, a pre-test was conducted among 40 students. In addition, pilot study was conducted among 40 respondents, and the reliability was higher than 0.7. The data were analyzed byusing descriptive statistics and SEM (Structural Equation Modeling) for the relationship among variables. Analysis of Moment Structures (AMOS) was used because it implements the general approach to data analysis known as SEM, also known as analysis of covariance structures, or causal modeling 33. This approach includes, as special cases, many well-known conventional techniques, including the general linear model and common factor analysis. SEM is an extension of the GeneralLinear Model (GLM). SEM is used more as a confirmatory technique rather than exploratory technique. SEM is used to test ‘complex’ relationships between observed (measured) and unobserved (latent) variables and relationships between two ormore latent variables. In addition SEM used for the measurement the relationship between problems in using Internet and attitudes towards Internet and 5 dimensions of PYD.
Discriminant Validity
Discriminant validity can be tested by examining the AVE for each construct against squared correlations (shared variance) between the construct and all other constructs in the model. Aconstruct will have adequate discriminant validity if the AVE exceeds the squared correlation among the constructs34. Based on the Table 1, AVE for each of construct is more than each of
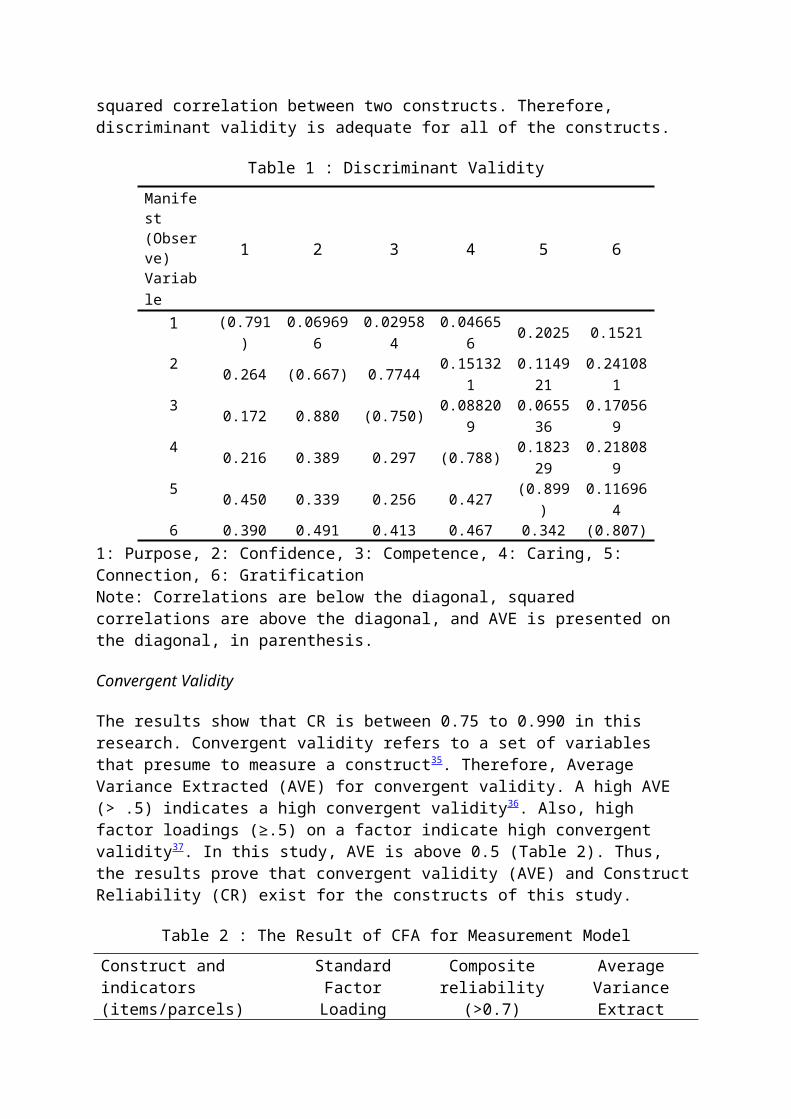
squared correlation between two constructs. Therefore, discriminant validity is adequate for all of the constructs.
Table 1 : Discriminant Validity Manifest (Observe) Variable
1 2 3 4 5 6
1 (0.791)
0.069696
0.029584
0.046656 0.2025 0.1521
2 0.264 (0.667) 0.7744 0.151321
0.114921
0.241081
3 0.172 0.880 (0.750) 0.088209
0.065536
0.170569
4 0.216 0.389 0.297 (0.788) 0.182329
0.218089
5 0.450 0.339 0.256 0.427 (0.899)
0.116964
6 0.390 0.491 0.413 0.467 0.342 (0.807) 1: Purpose, 2: Confidence, 3: Competence, 4: Caring, 5: Connection, 6: Gratification Note: Correlations are below the diagonal, squared correlations are above the diagonal, and AVE is presented on the diagonal, in parenthesis.
Convergent Validity
The results show that CR is between 0.75 to 0.990 in this research. Convergent validity refers to a set of variables that presume to measure a construct35. Therefore, Average Variance Extracted (AVE) for convergent validity. A high AVE (> .5) indicates a high convergent validity36. Also, high factor loadings (≥.5) on a factor indicate high convergent validity37. In this study, AVE is above 0.5 (Table 2). Thus, the results prove that convergent validity (AVE) and ConstructReliability (CR) exist for the constructs of this study.
Table 2 : The Result of CFA for Measurement Model Construct and indicators (items/parcels)
StandardFactorLoading
Compositereliability
(>0.7)
AverageVarianceExtract
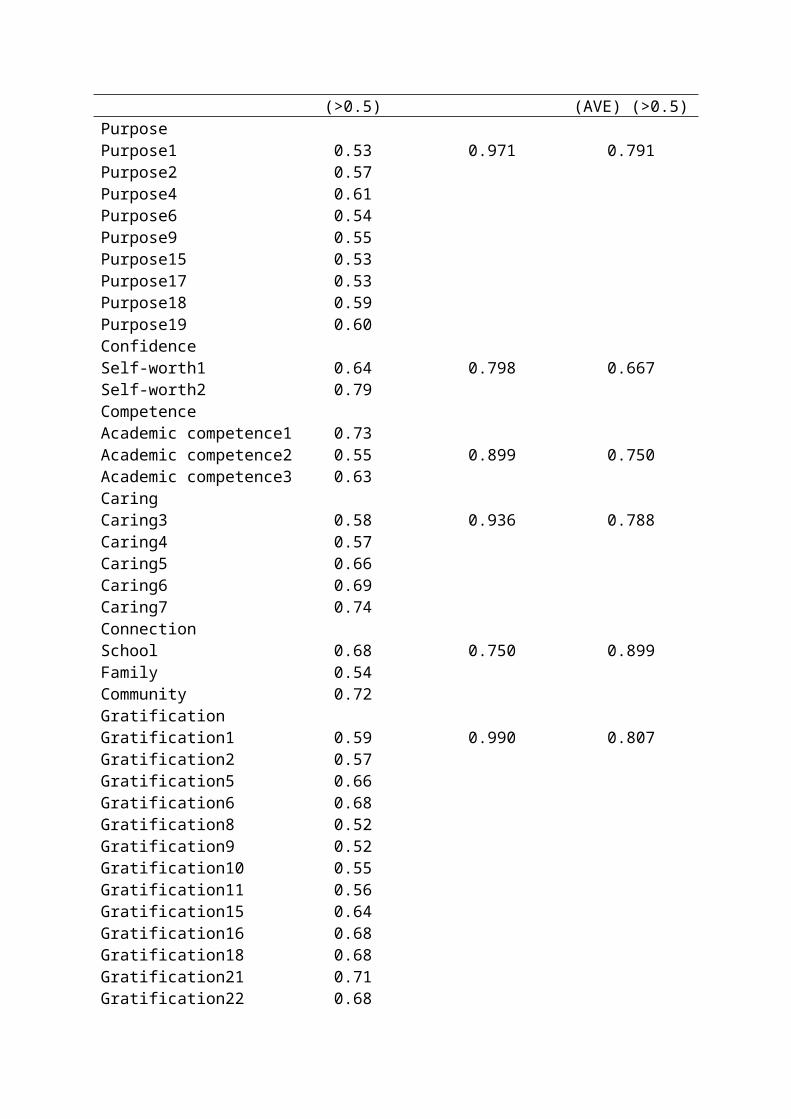
(>0.5) (AVE) (>0.5) Purpose Purpose1 0.53 0.971 0.791 Purpose2 0.57 Purpose4 0.61 Purpose6 0.54 Purpose9 0.55 Purpose15 0.53 Purpose17 0.53 Purpose18 0.59 Purpose19 0.60 Confidence Self-worth1 0.64 0.798 0.667 Self-worth2 0.79 Competence Academic competence1 0.73 Academic competence2 0.55 0.899 0.750 Academic competence3 0.63 Caring Caring3 0.58 0.936 0.788 Caring4 0.57 Caring5 0.66 Caring6 0.69 Caring7 0.74 Connection School 0.68 0.750 0.899 Family 0.54 Community 0.72 Gratification Gratification1 0.59 0.990 0.807 Gratification2 0.57 Gratification5 0.66 Gratification6 0.68 Gratification8 0.52 Gratification9 0.52 Gratification10 0.55 Gratification11 0.56 Gratification15 0.64 Gratification16 0.68 Gratification18 0.68 Gratification21 0.71 Gratification22 0.68
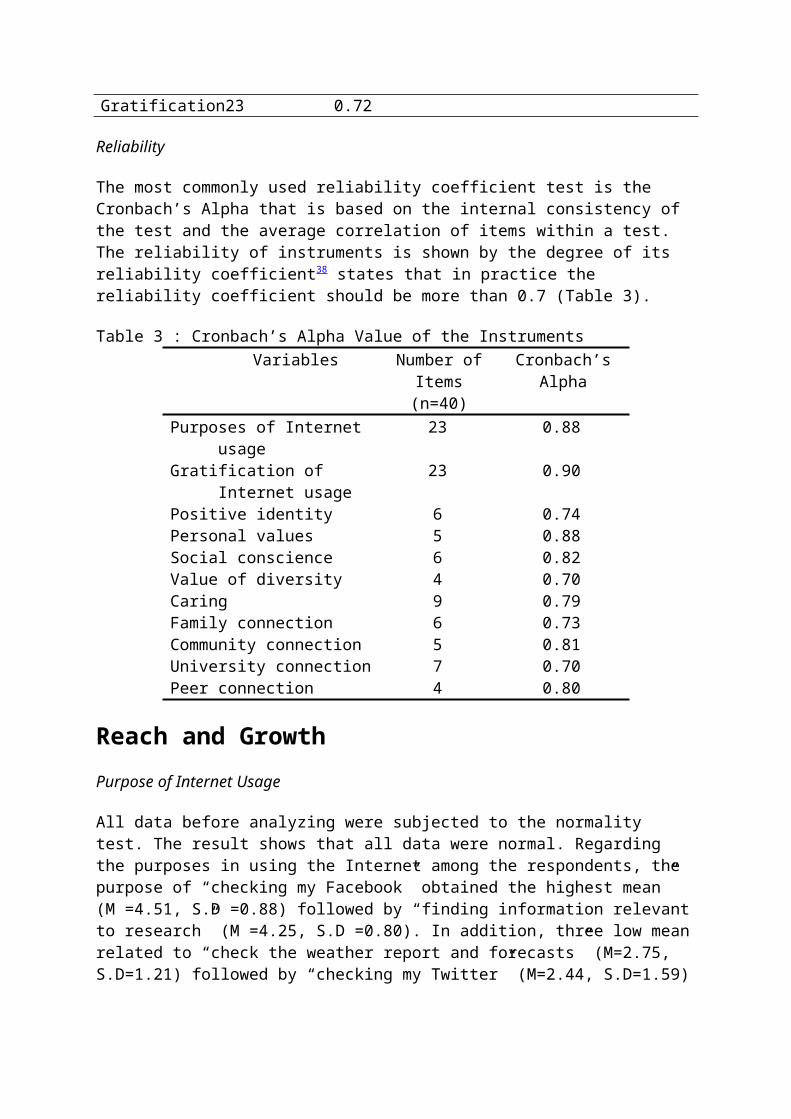
Gratification23 0.72
Reliability
The most commonly used reliability coefficient test is the Cronbach’s Alpha that is based on the internal consistency of the test and the average correlation of items within a test. The reliability of instruments is shown by the degree of its reliability coefficient38 states that in practice the reliability coefficient should be more than 0.7 (Table 3).
Table 3 : Cronbach’s Alpha Value of the Instruments Variables
Number ofItems(n=40)
Cronbach’sAlpha
Purposes of Internet usage
23 0.88
Gratification of Internet usage
23 0.90
Positive identity 6 0.74 Personal values 5 0.88 Social conscience 6 0.82 Value of diversity 4 0.70 Caring 9 0.79 Family connection 6 0.73 Community connection 5 0.81 University connection 7 0.70 Peer connection 4 0.80
Reach and Growth Purpose of Internet Usage
All data before analyzing were subjected to the normality test. The result shows that all data were normal. Regarding the purposes in using the Internet among the respondents, the purpose of “checking my Facebook” obtained the highest mean” (M =4.51, S.D =0.88) followed by “finding information relevantto research” (M =4.25, S.D =0.80). In addition, three low meanrelated to “check the weather report and forecasts” (M=2.75, S.D=1.21) followed by “checking my Twitter” (M=2.44, S.D=1.59)
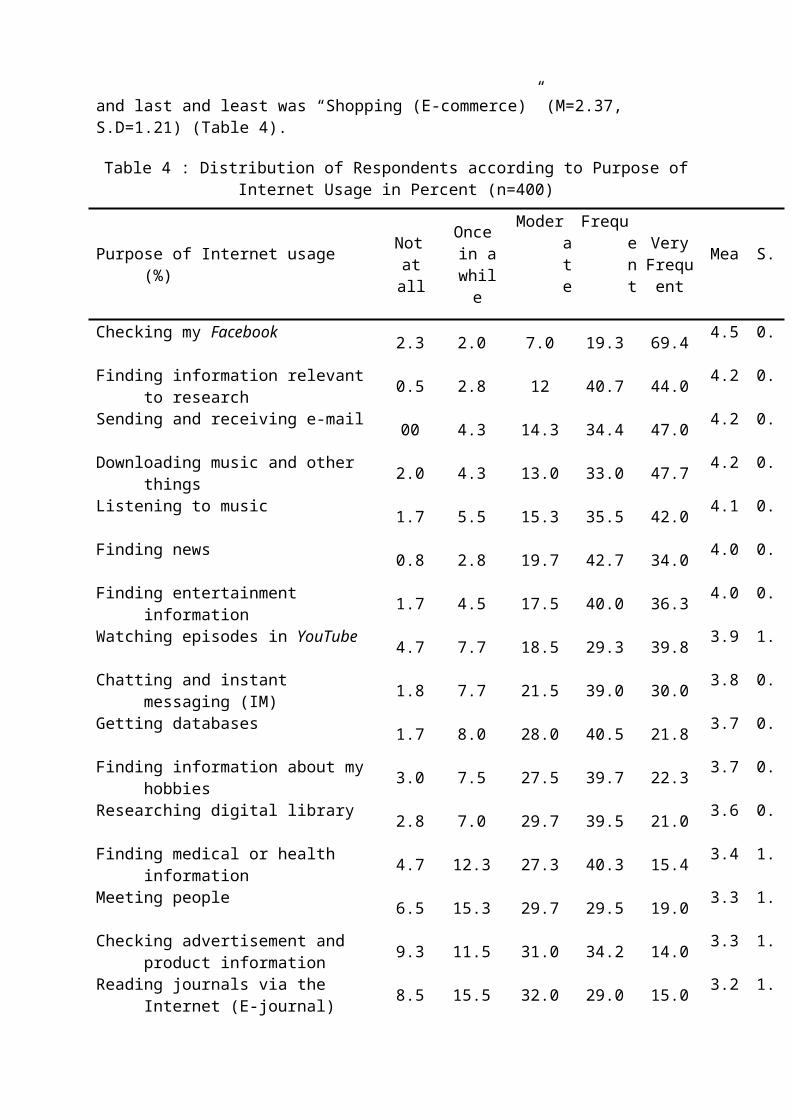
and last and least was “Shopping (E-commerce)” (M=2.37, S.D=1.21) (Table 4).
Table 4 : Distribution of Respondents according to Purpose ofInternet Usage in Percent (n=400)
Purpose of Internet usage (%)
Notatall
Oncein awhile
Moderate
Frequent
VeryFrequent
Mea S.
Checking my Facebook 2.3 2.0 7.0 19.3 69.4 4.5 0.
Finding information relevant to research 0.5 2.8 12 40.7 44.0 4.2 0.
Sending and receiving e-mail 00 4.3 14.3 34.4 47.0 4.2 0.
Downloading music and other things 2.0 4.3 13.0 33.0 47.7 4.2 0.
Listening to music 1.7 5.5 15.3 35.5 42.0 4.1 0.
Finding news 0.8 2.8 19.7 42.7 34.0 4.0 0.
Finding entertainment information 1.7 4.5 17.5 40.0 36.3 4.0 0.
Watching episodes in YouTube 4.7 7.7 18.5 29.3 39.8 3.9 1.
Chatting and instant messaging (IM) 1.8 7.7 21.5 39.0 30.0 3.8 0.
Getting databases 1.7 8.0 28.0 40.5 21.8 3.7 0.
Finding information about my hobbies 3.0 7.5 27.5 39.7 22.3 3.7 0.
Researching digital library 2.8 7.0 29.7 39.5 21.0 3.6 0.
Finding medical or health information 4.7 12.3 27.3 40.3 15.4 3.4 1.
Meeting people 6.5 15.3 29.7 29.5 19.0 3.3 1.
Checking advertisement and product information 9.3 11.5 31.0 34.2 14.0 3.3 1.
Reading journals via the Internet (E-journal) 8.5 15.5 32.0 29.0 15.0 3.2 1.
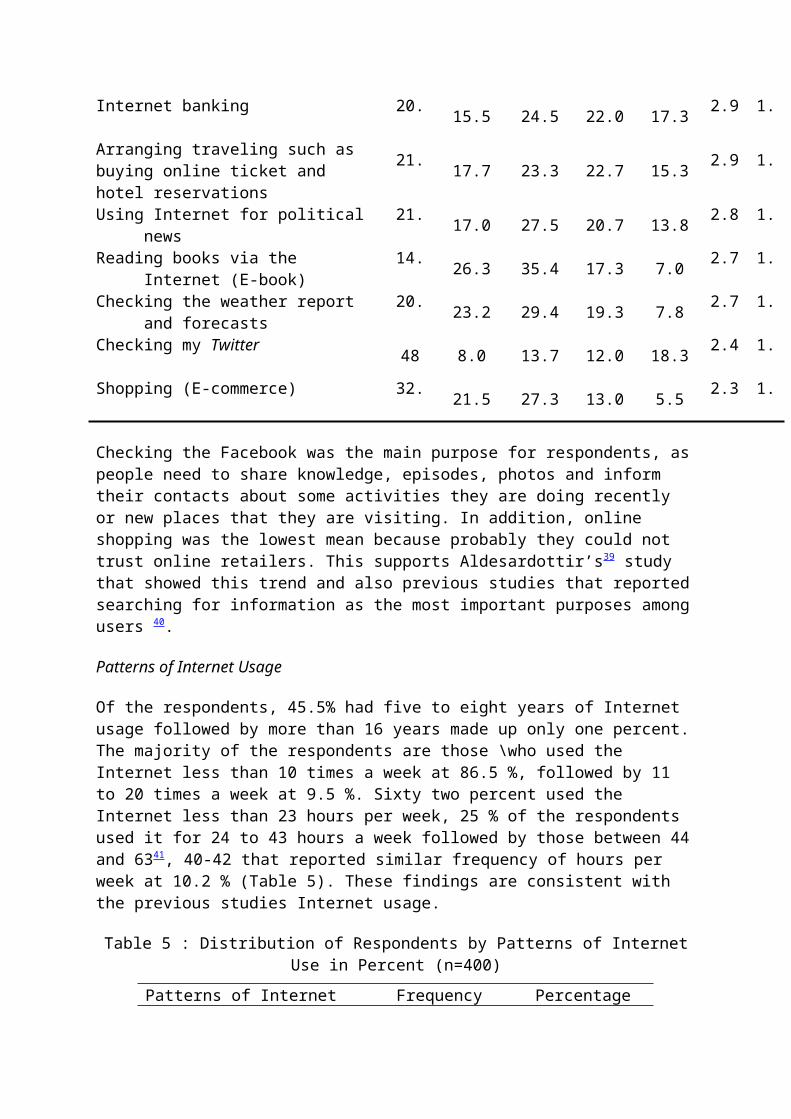
Internet banking 20. 15.5 24.5 22.0 17.3 2.9 1.
Arranging traveling such as buying online ticket and hotel reservations
21. 17.7 23.3 22.7 15.3 2.9 1.
Using Internet for political news
21. 17.0 27.5 20.7 13.8 2.8 1.
Reading books via the Internet (E-book)
14. 26.3 35.4 17.3 7.0 2.7 1.
Checking the weather report and forecasts
20. 23.2 29.4 19.3 7.8 2.7 1.
Checking my Twitter 48 8.0 13.7 12.0 18.3 2.4 1.
Shopping (E-commerce) 32. 21.5 27.3 13.0 5.5 2.3 1.
Checking the Facebook was the main purpose for respondents, aspeople need to share knowledge, episodes, photos and inform their contacts about some activities they are doing recently or new places that they are visiting. In addition, online shopping was the lowest mean because probably they could not trust online retailers. This supports Aldesardottir’s39 study that showed this trend and also previous studies that reportedsearching for information as the most important purposes amongusers 40.
Patterns of Internet Usage
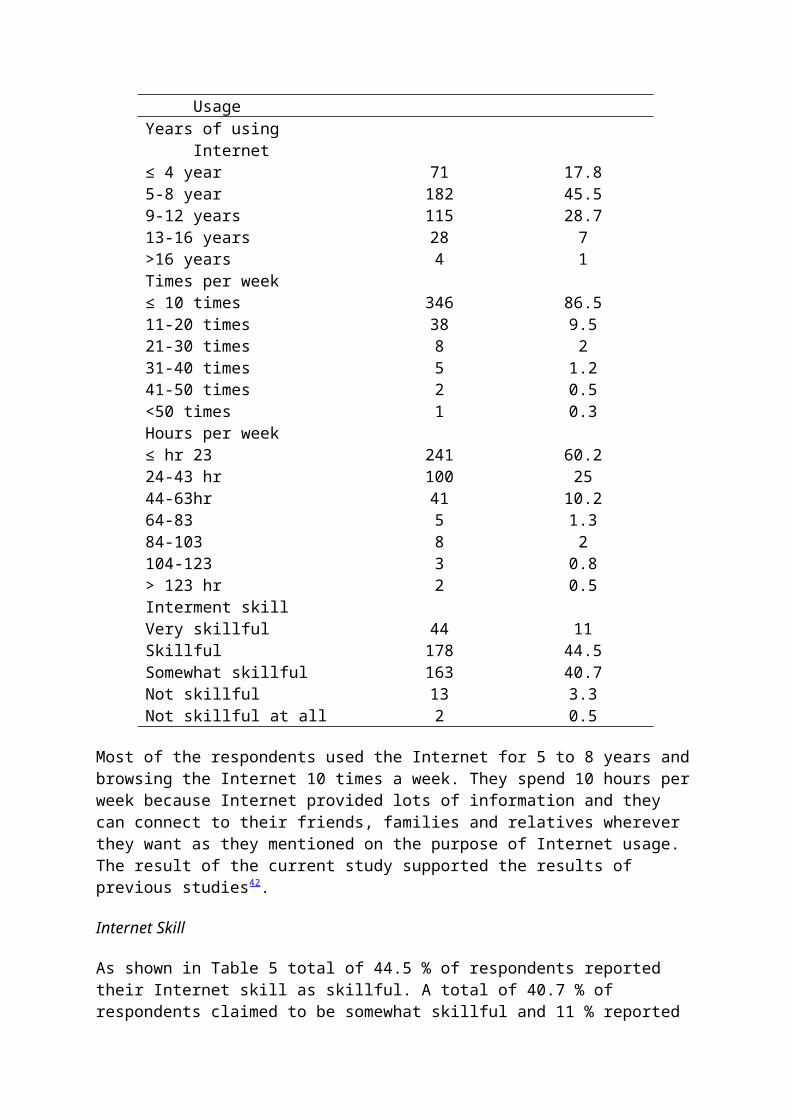
Of the respondents, 45.5% had five to eight years of Internet usage followed by more than 16 years made up only one percent.The majority of the respondents are those \who used the Internet less than 10 times a week at 86.5 %, followed by 11 to 20 times a week at 9.5 %. Sixty two percent used the Internet less than 23 hours per week, 25 % of the respondents used it for 24 to 43 hours a week followed by those between 44and 6341, 40-42 that reported similar frequency of hours per week at 10.2 % (Table 5). These findings are consistent with the previous studies Internet usage.
Table 5 : Distribution of Respondents by Patterns of InternetUse in Percent (n=400)
Patterns of Internet Frequency Percentage
Usage Years of using
Internet
≤ 4 year 71 17.8 5-8 year 182 45.5 9-12 years 115 28.7 13-16 years 28 7 >16 years 4 1 Times per week ≤ 10 times 346 86.5 11-20 times 38 9.5 21-30 times 8 2 31-40 times 5 1.2 41-50 times 2 0.5 <50 times 1 0.3 Hours per week ≤ hr 23 241 60.2 24-43 hr 100 25 44-63hr 41 10.2 64-83 5 1.3 84-103 8 2 104-123 3 0.8 > 123 hr 2 0.5 Interment skill Very skillful 44 11 Skillful 178 44.5 Somewhat skillful 163 40.7 Not skillful 13 3.3 Not skillful at all 2 0.5
Most of the respondents used the Internet for 5 to 8 years andbrowsing the Internet 10 times a week. They spend 10 hours perweek because Internet provided lots of information and they can connect to their friends, families and relatives wherever they want as they mentioned on the purpose of Internet usage. The result of the current study supported the results of previous studies42.
Internet Skill
As shown in Table 5 total of 44.5 % of respondents reported their Internet skill as skillful. A total of 40.7 % of respondents claimed to be somewhat skillful and 11 % reported
their Internet skill as very skillful. These findings are consistent with the previous studies43.
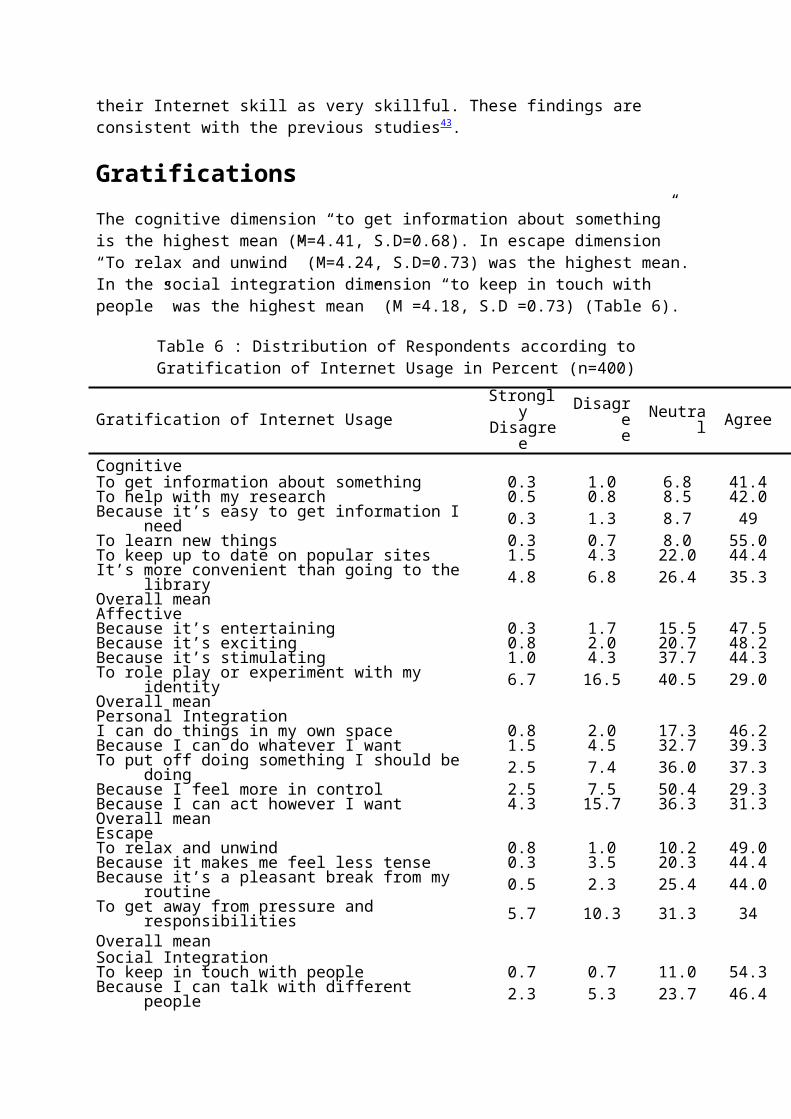
GratificationsThe cognitive dimension “to get information about something” is the highest mean (M=4.41, S.D=0.68). In escape dimension “To relax and unwind” (M=4.24, S.D=0.73) was the highest mean.In the social integration dimension “to keep in touch with people” was the highest mean” (M =4.18, S.D =0.73) (Table 6).
Table 6 : Distribution of Respondents according toGratification of Internet Usage in Percent (n=400)
Gratification of Internet Usage Strongl
yDisagre
e
Disagree
Neutral Agree Strongly
Cognitive To get information about something 0.3 1.0 6.8 41.4 To help with my research 0.5 0.8 8.5 42.0 Because it’s easy to get information I
need 0.3 1.3 8.7 49 To learn new things 0.3 0.7 8.0 55.0 To keep up to date on popular sites 1.5 4.3 22.0 44.4 It’s more convenient than going to the
library 4.8 6.8 26.4 35.3 Overall mean Affective Because it’s entertaining 0.3 1.7 15.5 47.5 Because it’s exciting 0.8 2.0 20.7 48.2 Because it’s stimulating 1.0 4.3 37.7 44.3 To role play or experiment with my
identity 6.7 16.5 40.5 29.0 Overall mean Personal Integration I can do things in my own space 0.8 2.0 17.3 46.2 Because I can do whatever I want 1.5 4.5 32.7 39.3 To put off doing something I should be
doing 2.5 7.4 36.0 37.3 Because I feel more in control 2.5 7.5 50.4 29.3 Because I can act however I want 4.3 15.7 36.3 31.3 Overall mean Escape To relax and unwind 0.8 1.0 10.2 49.0 Because it makes me feel less tense 0.3 3.5 20.3 44.4 Because it’s a pleasant break from my
routine 0.5 2.3 25.4 44.0 To get away from pressure and
responsibilities 5.7 10.3 31.3 34 Overall mean Social Integration To keep in touch with people 0.7 0.7 11.0 54.3 Because I can talk with different
people 2.3 5.3 23.7 46.4
Because it’s a distraction from loneliness 2.3 7.0 27.7 41.5
Because I need to talk to someone 3.5 9.0 37 33 Overall mean
In the affective dimension “because it’s entertaining” (M=4.15, S.D=0.75) was the highest. The item “I can do things in my own space” (M=3.24, S.D=1.23) was the highest mean. Cognitive dimension was the highest dimension among all gratification of Internet usage dimensions (M=4.15) and socialintegration was the lowest (M=3.62).
According to the uses and gratification theory, people choose media that closely match their needs and interests. This meansthat the use of Internet is operated by choice, but the selection of specific contents would also depends on user’s interests 48. People want to have information due to needs or interests; therefore it is in cognitive dimension that people want to have knowledge and information.
In the escape dimension people want to escape and relax from pressures that they are facing in society, therefore the intent to relax was the highest mean. Furthermore, in social integration dimension keeping in touch with people had the highest mean due to the fact that humans need to communicate and since they are sociable, they could not live alone withoutany communication.
In the affection dimension, entertaining was the highest mean maybe because they enjoy it. In personal integration dimension, doing my own space was the highest mean because people want privacy for their information and they want to be free in their own space. The current study supported by the findings from the previous findings44.
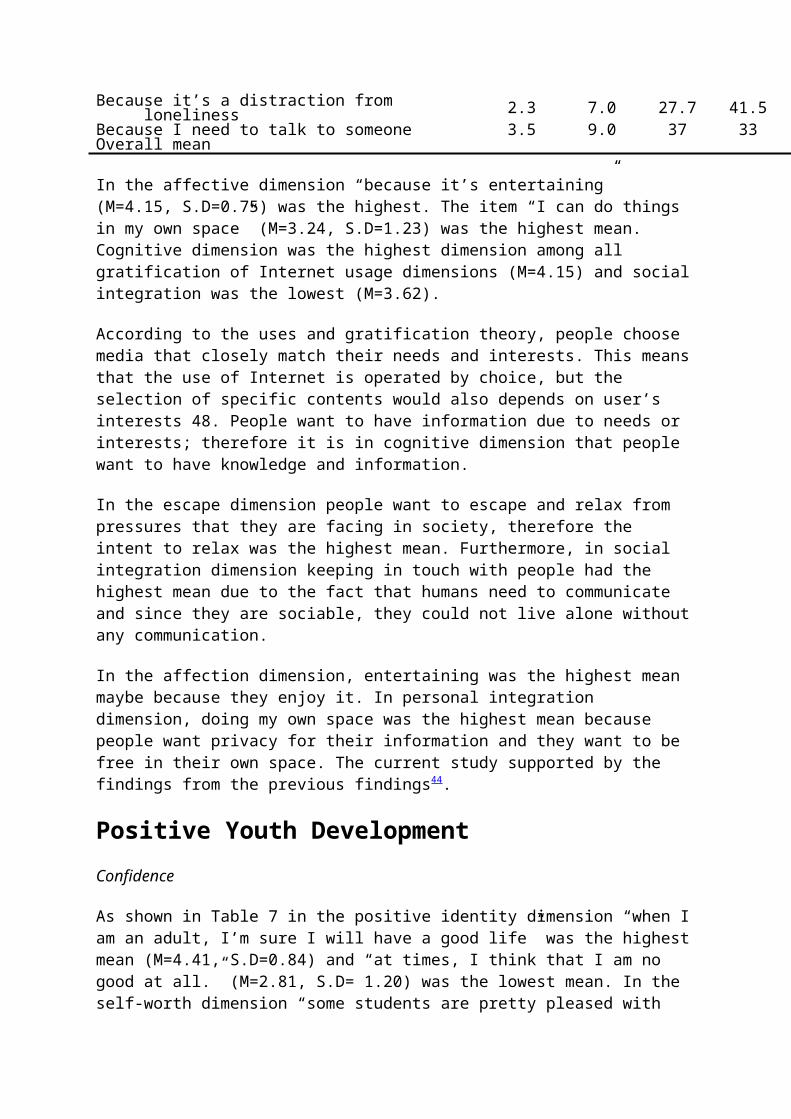
Positive Youth Development Confidence
As shown in Table 7 in the positive identity dimension “when Iam an adult, I’m sure I will have a good life” was the highestmean (M=4.41, S.D=0.84) and “at times, I think that I am no good at all.” (M=2.81, S.D= 1.20) was the lowest mean. In the self-worth dimension “some students are pretty pleased with
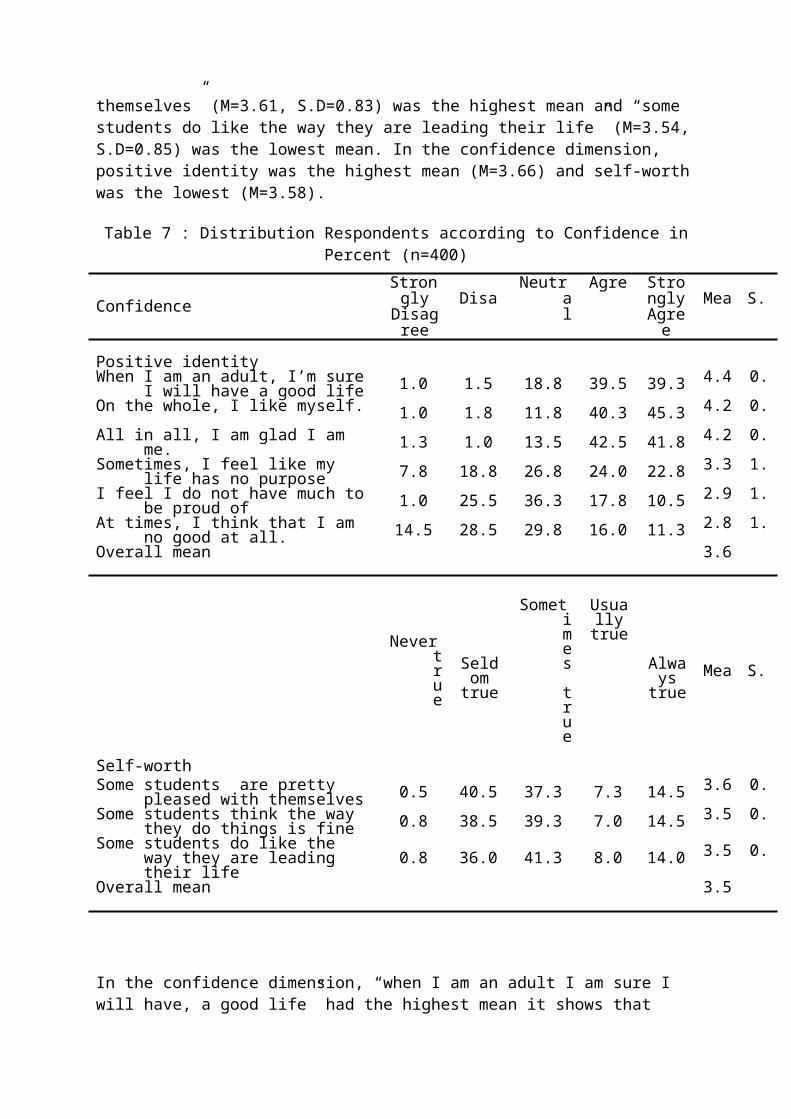
themselves” (M=3.61, S.D=0.83) was the highest mean and “some students do like the way they are leading their life” (M=3.54,S.D=0.85) was the lowest mean. In the confidence dimension, positive identity was the highest mean (M=3.66) and self-worthwas the lowest (M=3.58).
Table 7 : Distribution Respondents according to Confidence inPercent (n=400)
Confidence Strongly
Disagree
DisaNeutr
al
Agre StronglyAgree
Mea S.
Positive identity When I am an adult, I’m sure
I will have a good life 1.0 1.5 18.8 39.5 39.3 4.4 0.On the whole, I like myself. 1.0 1.8 11.8 40.3 45.3 4.2 0.All in all, I am glad I am
me. 1.3 1.0 13.5 42.5 41.8 4.2 0.Sometimes, I feel like my
life has no purpose 7.8 18.8 26.8 24.0 22.8 3.3 1.I feel I do not have much to
be proud of 1.0 25.5 36.3 17.8 10.5 2.9 1.At times, I think that I am
no good at all. 14.5 28.5 29.8 16.0 11.3 2.8 1.Overall mean 3.6
Nevertrue
Seldomtrue
Sometimes true
Usuallytrue
Always
true Mea S.
Self-worth Some students are pretty
pleased with themselves 0.5 40.5 37.3 7.3 14.5 3.6 0.Some students think the way
they do things is fine 0.8 38.5 39.3 7.0 14.5 3.5 0.Some students do like the
way they are leading their life
0.8 36.0 41.3 8.0 14.0 3.5 0.
Overall mean 3.5
In the confidence dimension, “when I am an adult I am sure I will have, a good life” had the highest mean it shows that
they are optimistic toward future. In the self-worth dimensionstudents were pretty pleased with themselves and had the highest mean because they are far away from some diseases suchas depression, anxiety, and hopelessness. In addition, they are far away from some abnormal behavior such as suicide, an inferiority complex that causes many problems in the society. This study is supported from the previous finding45.
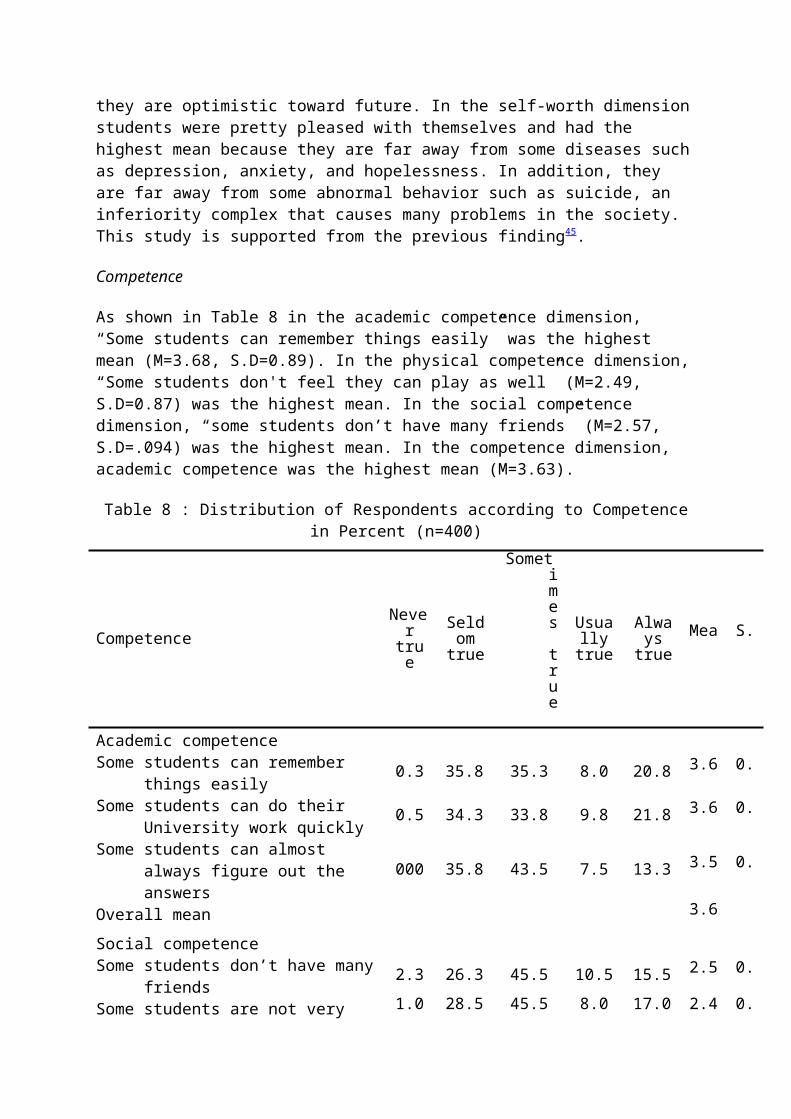
Competence
As shown in Table 8 in the academic competence dimension, “Some students can remember things easily” was the highest mean (M=3.68, S.D=0.89). In the physical competence dimension,“Some students don't feel they can play as well” (M=2.49, S.D=0.87) was the highest mean. In the social competence dimension, “some students don’t have many friends” (M=2.57, S.D=.094) was the highest mean. In the competence dimension, academic competence was the highest mean (M=3.63).
Table 8 : Distribution of Respondents according to Competencein Percent (n=400)
Competence Nevertrue
Seldomtrue
Sometimes true
Usuallytrue
Always
true Mea S.
Academic competence Some students can remember
things easily 0.3 35.8 35.3 8.0 20.8 3.6 0.
Some students can do their University work quickly 0.5 34.3 33.8 9.8 21.8 3.6 0.
Some students can almost always figure out the answers
000 35.8 43.5 7.5 13.3 3.5 0.
Overall mean 3.6 Social competence Some students don’t have many
friends 2.3 26.3 45.5 10.5 15.5 2.5 0.
Some students are not very 1.0 28.5 45.5 8.0 17.0 2.4 0.
popular 7 90 Some students usually do
things by themselves. 0.5 34.3 36.3 8.8 20.3 2.3 0.
Overall mean 2.4
Physical competence Some students don't feel they
can play as well. 2.0 35.8 42.3 7.0 13.0 2.4 0.
Some students are afraid theymight not do well at outdoor things they haven’t tried.
0.5 32.8 37.0 10.0 19.8 2.3 0.
Some students don’t feel thatthey are very good when it comes to sports
1.0 35.0 38.8 5.5 19.8 2.3 0.
Overall mean 2.4
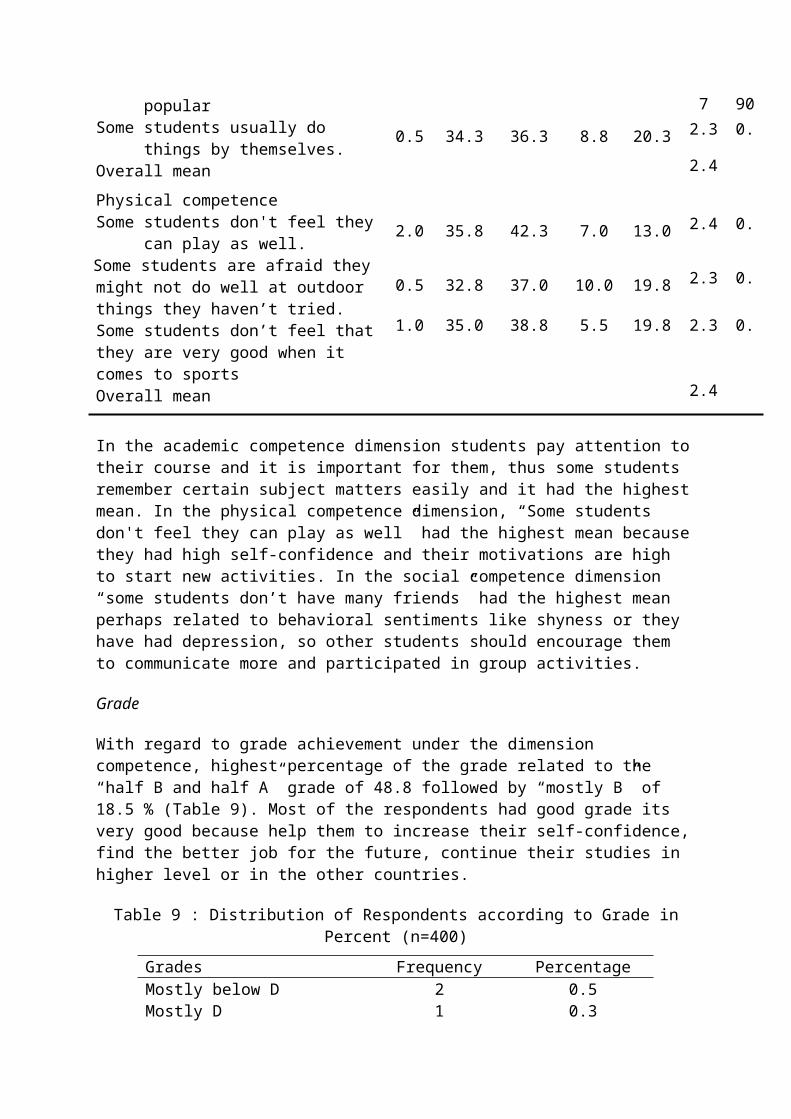
In the academic competence dimension students pay attention totheir course and it is important for them, thus some students remember certain subject matters easily and it had the highestmean. In the physical competence dimension, “Some students don't feel they can play as well” had the highest mean becausethey had high self-confidence and their motivations are high to start new activities. In the social competence dimension “some students don’t have many friends” had the highest mean perhaps related to behavioral sentiments like shyness or they have had depression, so other students should encourage them to communicate more and participated in group activities.
Grade
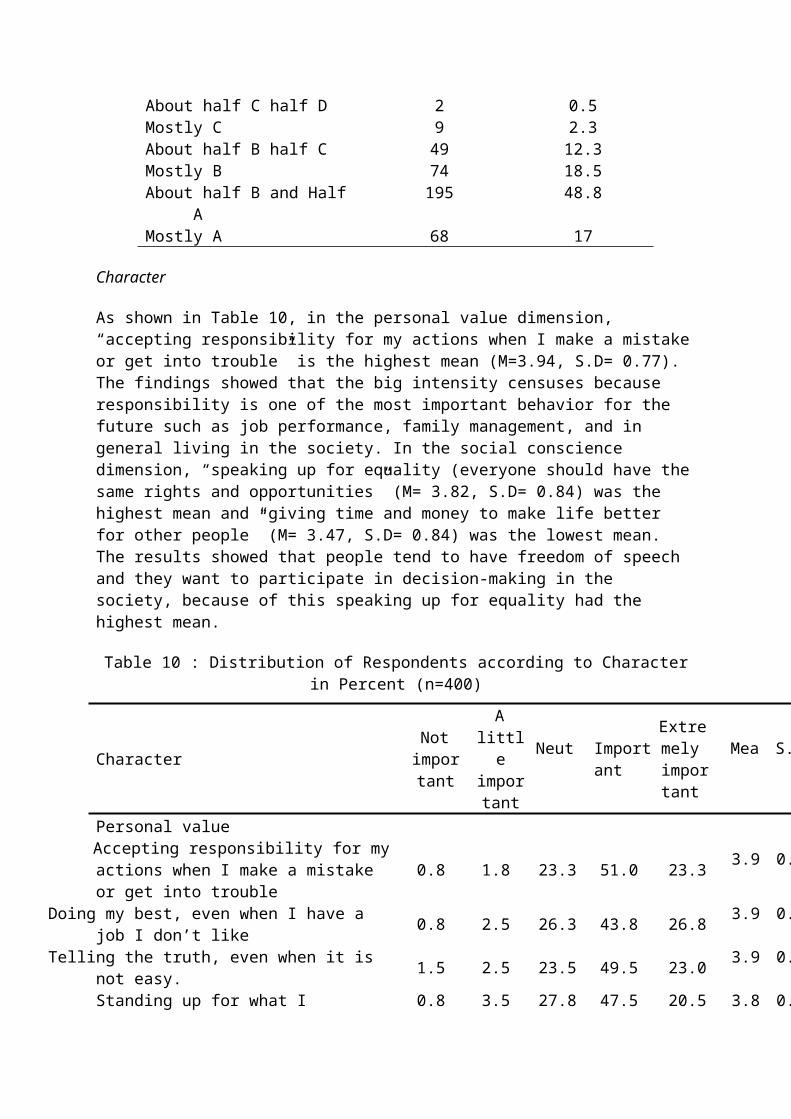
With regard to grade achievement under the dimension competence, highest percentage of the grade related to the “half B and half A” grade of 48.8 followed by “mostly B” of 18.5 % (Table 9). Most of the respondents had good grade its very good because help them to increase their self-confidence,find the better job for the future, continue their studies in higher level or in the other countries.
Table 9 : Distribution of Respondents according to Grade inPercent (n=400)
Grades Frequency Percentage Mostly below D 2 0.5 Mostly D 1 0.3
About half C half D 2 0.5 Mostly C 9 2.3 About half B half C 49 12.3 Mostly B 74 18.5 About half B and Half
A 195 48.8
Mostly A 68 17
Character
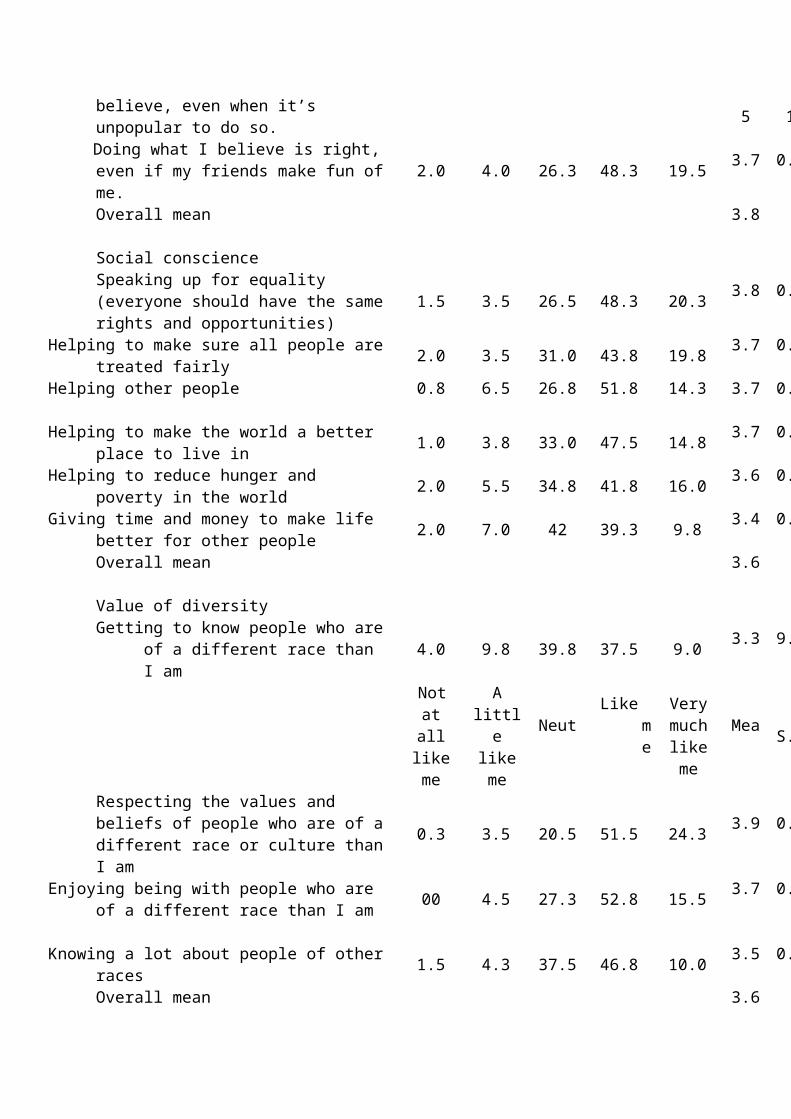
As shown in Table 10, in the personal value dimension, “accepting responsibility for my actions when I make a mistakeor get into trouble” is the highest mean (M=3.94, S.D= 0.77). The findings showed that the big intensity censuses because responsibility is one of the most important behavior for the future such as job performance, family management, and in general living in the society. In the social conscience dimension, “speaking up for equality (everyone should have thesame rights and opportunities” (M= 3.82, S.D= 0.84) was the highest mean and “giving time and money to make life better for other people” (M= 3.47, S.D= 0.84) was the lowest mean. The results showed that people tend to have freedom of speech and they want to participate in decision-making in the society, because of this speaking up for equality had the highest mean.
Table 10 : Distribution of Respondents according to Characterin Percent (n=400)
Character Notimportant
Alittle
important
Neut Important
Extremely important
Mea S.
Personal value Accepting responsibility for myactions when I make a mistake or get into trouble
0.8 1.8 23.3 51.0 23.3 3.9 0.7
Doing my best, even when I have a job I don’t like 0.8 2.5 26.3 43.8 26.8 3.9 0.8
Telling the truth, even when it is not easy. 1.5 2.5 23.5 49.5 23.0 3.9 0.8
Standing up for what I 0.8 3.5 27.8 47.5 20.5 3.8 0.8
believe, even when it’s unpopular to do so. 5 1
Doing what I believe is right, even if my friends make fun ofme.
2.0 4.0 26.3 48.3 19.5 3.7 0.8
Overall mean 3.8
Social conscience Speaking up for equality (everyone should have the samerights and opportunities)
1.5 3.5 26.5 48.3 20.3 3.8 0.8
Helping to make sure all people aretreated fairly 2.0 3.5 31.0 43.8 19.8 3.7 0.8
Helping other people 0.8 6.5 26.8 51.8 14.3 3.7 0.8
Helping to make the world a better place to live in 1.0 3.8 33.0 47.5 14.8 3.7 0.7
Helping to reduce hunger and poverty in the world 2.0 5.5 34.8 41.8 16.0 3.6 0.8
Giving time and money to make life better for other people 2.0 7.0 42 39.3 9.8 3.4 0.8
Overall mean 3.6
Value of diversity Getting to know people who are
of a different race than I am
4.0 9.8 39.8 37.5 9.0 3.3 9.2
Notatalllikeme
Alittl
elikeme
NeutLike
me
Verymuchlikeme
Mea S.D
Respecting the values and beliefs of people who are of adifferent race or culture thanI am
0.3 3.5 20.5 51.5 24.3 3.9 0.7
Enjoying being with people who are of a different race than I am 00 4.5 27.3 52.8 15.5 3.7 0.7
Knowing a lot about people of other
races 1.5 4.3 37.5 46.8 10.0 3.5 0.7
Overall mean 3.6
7 Never
true Usually
true
Sometimes
true
Seldom
true
Always
true Mea S.D
Conduct behavior Some students usually don’t do
things that get them intotrouble
0.5 8.5 36.5 34.5 20.0 3.6 0.9
Some students usually like theway they behave
0.3 8.8 32.8 42.8 15.5 3.6 0.8
Some students hardly ever do things they know they shouldn’t do
0.3 7.8 44.0 38.0 10.0 3.4 0.7
Overall mean 3.5
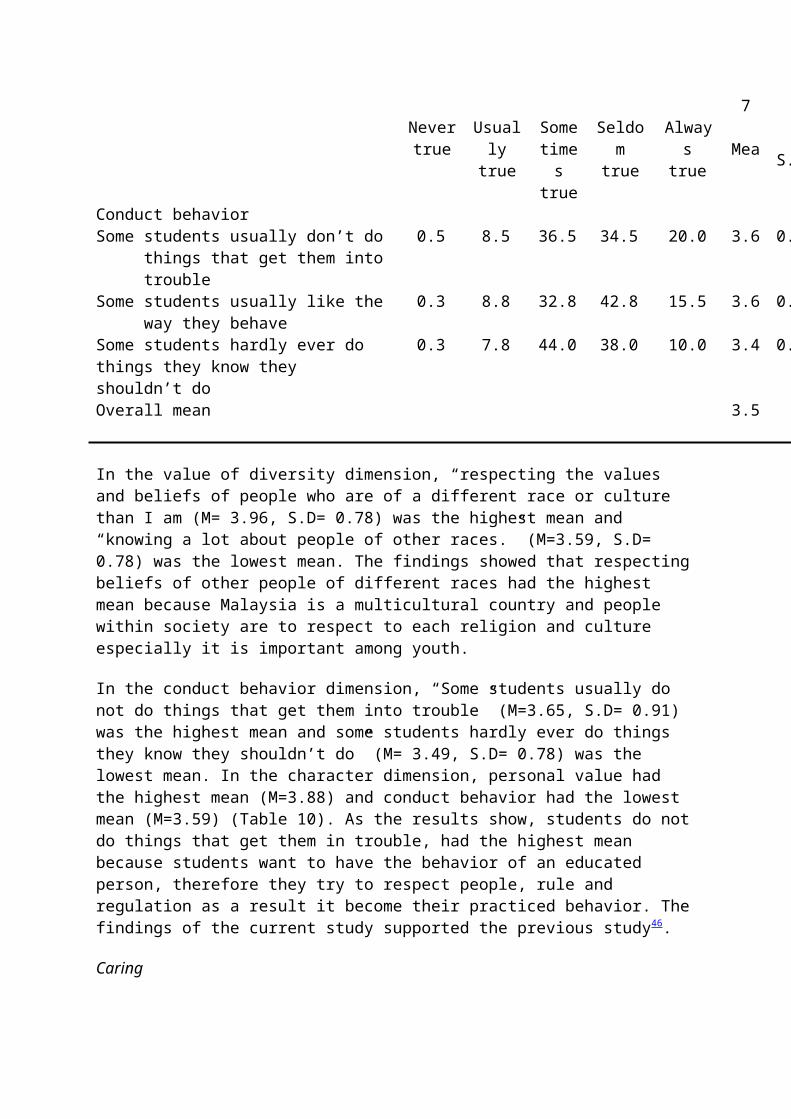
In the value of diversity dimension, “respecting the values and beliefs of people who are of a different race or culture than I am (M= 3.96, S.D= 0.78) was the highest mean and “knowing a lot about people of other races.” (M=3.59, S.D= 0.78) was the lowest mean. The findings showed that respectingbeliefs of other people of different races had the highest mean because Malaysia is a multicultural country and people within society are to respect to each religion and culture especially it is important among youth.
In the conduct behavior dimension, “Some students usually do not do things that get them into trouble” (M=3.65, S.D= 0.91) was the highest mean and some students hardly ever do things they know they shouldn’t do” (M= 3.49, S.D= 0.78) was the lowest mean. In the character dimension, personal value had the highest mean (M=3.88) and conduct behavior had the lowest mean (M=3.59) (Table 10). As the results show, students do notdo things that get them in trouble, had the highest mean because students want to have the behavior of an educated person, therefore they try to respect people, rule and regulation as a result it become their practiced behavior. Thefindings of the current study supported the previous study46.
Caring
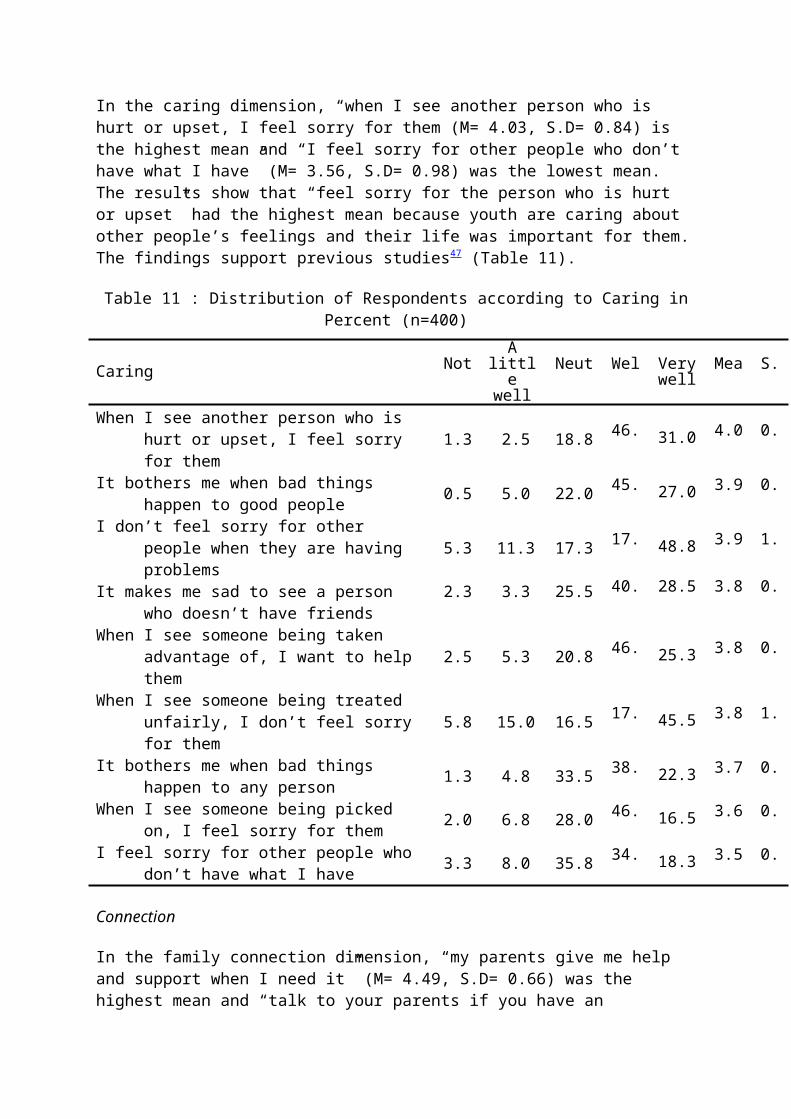
In the caring dimension, “when I see another person who is hurt or upset, I feel sorry for them (M= 4.03, S.D= 0.84) is the highest mean and “I feel sorry for other people who don’t have what I have” (M= 3.56, S.D= 0.98) was the lowest mean. The results show that “feel sorry for the person who is hurt or upset” had the highest mean because youth are caring about other people’s feelings and their life was important for them.The findings support previous studies47 (Table 11).
Table 11 : Distribution of Respondents according to Caring inPercent (n=400)
Caring NotA
little
well Neut Wel Very
well Mea S.
When I see another person who is hurt or upset, I feel sorry for them
1.3 2.5 18.8 46. 31.0 4.0 0.
It bothers me when bad things happen to good people 0.5 5.0 22.0 45. 27.0 3.9 0.
I don’t feel sorry for other people when they are having problems
5.3 11.3 17.3 17. 48.8 3.9 1.
It makes me sad to see a person who doesn’t have friends
2.3 3.3 25.5 40. 28.5 3.8 0.
When I see someone being taken advantage of, I want to helpthem
2.5 5.3 20.8 46. 25.3 3.8 0.
When I see someone being treated unfairly, I don’t feel sorryfor them
5.8 15.0 16.5 17. 45.5 3.8 1.
It bothers me when bad things happen to any person 1.3 4.8 33.5 38. 22.3 3.7 0.
When I see someone being picked on, I feel sorry for them 2.0 6.8 28.0 46. 16.5 3.6 0.
I feel sorry for other people whodon’t have what I have 3.3 8.0 35.8 34. 18.3 3.5 0.
Connection
In the family connection dimension, “my parents give me help and support when I need it” (M= 4.49, S.D= 0.66) was the highest mean and “talk to your parents if you have an
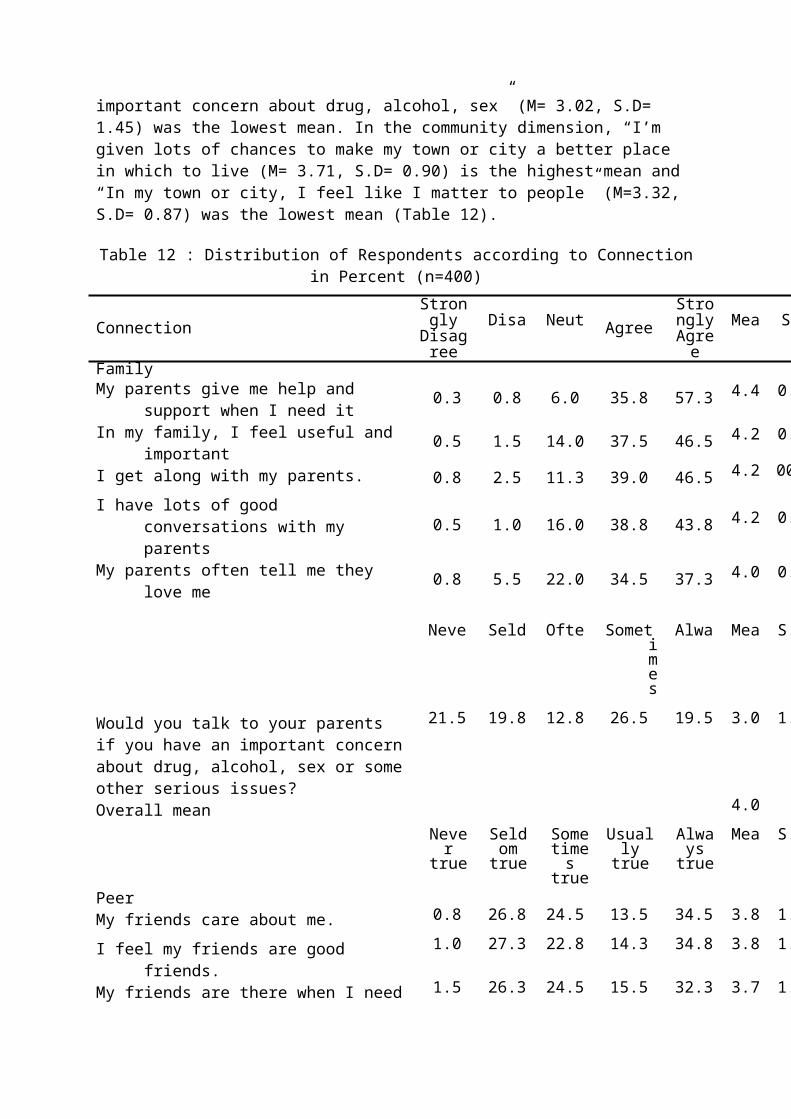
important concern about drug, alcohol, sex” (M= 3.02, S.D= 1.45) was the lowest mean. In the community dimension, “I’m given lots of chances to make my town or city a better place in which to live (M= 3.71, S.D= 0.90) is the highest mean and “In my town or city, I feel like I matter to people” (M=3.32, S.D= 0.87) was the lowest mean (Table 12).
Table 12 : Distribution of Respondents according to Connectionin Percent (n=400)
Connection Strongly
Disagree
Disa Neut Agree StronglyAgree
Mea S.
Family My parents give me help and
support when I need it 0.3 0.8 6.0 35.8 57.3 4.4 0.
In my family, I feel useful and important 0.5 1.5 14.0 37.5 46.5 4.2 0.
I get along with my parents. 0.8 2.5 11.3 39.0 46.5 4.2 00.
I have lots of good conversations with my parents
0.5 1.0 16.0 38.8 43.8 4.2 0.
My parents often tell me they love me 0.8 5.5 22.0 34.5 37.3 4.0 0.
Neve Seld Ofte Somet
imes
Alwa Mea S.
Would you talk to your parents if you have an important concernabout drug, alcohol, sex or someother serious issues?
21.5 19.8 12.8 26.5 19.5 3.0 1.
Overall mean 4.0 Neve
rtrue
Seldomtrue
Some times
true
Usually
true Always
true Mea S.
Peer My friends care about me. 0.8 26.8 24.5 13.5 34.5 3.8 1.
I feel my friends are good friends.
1.0 27.3 22.8 14.3 34.8 3.8 1.
My friends are there when I need 1.5 26.3 24.5 15.5 32.3 3.7 1.
them I trust my friends. 1.0 26.5 31.0 13.8 27.8 3.6 1.
Overall mean 3.7
StronglyDisagree
Disagree
Neut Agree StronglyAgree
Mea S.
University I care about the University that
I go to 1.5 3.5 17.8 53.5 23.8 3.9 0.
In my University, there are clear cut rules for what students can and cannot do.
0.5 1.8 26.8 50.0 21.0 3.8 0.
I get a lot of encouragement at my University. 1.0 4.5 31.8 43.3 19.5 3.7 0.
Lecturers at University push me to be the best I can be. 1.5 5.8 29.5 46.0 17.3 3.7 0.
Students in my University care about me. 1.0 4.3 34.3 47.5 13.0 3.6 0.
My lecturers really care about me. 1.8 3.5 45.3 38.0 11.5 3.4 0.
Neve Seld Ofte Somet
imes
Alwa Mea S.
How often do you feel bored at University?
4.3 20.8 19.8 49.3 6.0 3.3 1.
Overall mean 3.6
StronglyDisagree
Disagree
Neut Agree StronglyAgree
Mea S.
Community I’m given lots of chances to make my town or city a better place in which to live
1.0 6.8 32.8 39.0 20.5 3.7 0.
In my neighborhood, there are lots of people who care about me
3.0 7.8 36.8 38.0 14.5 3.5 0.
Adults in my town or city make me feel important 3.8 7.0 40.8 35.0 13.5 3.4 0.
Adults in my town or city listen 3.5 7.5 47.8 31.3 10.0 3.3 0.
to what I have to say In my town or city, I feel like
I matter to people 2.3 10.8 49.0 28.3 9.8 3.3 0.
Overall mean 3.4
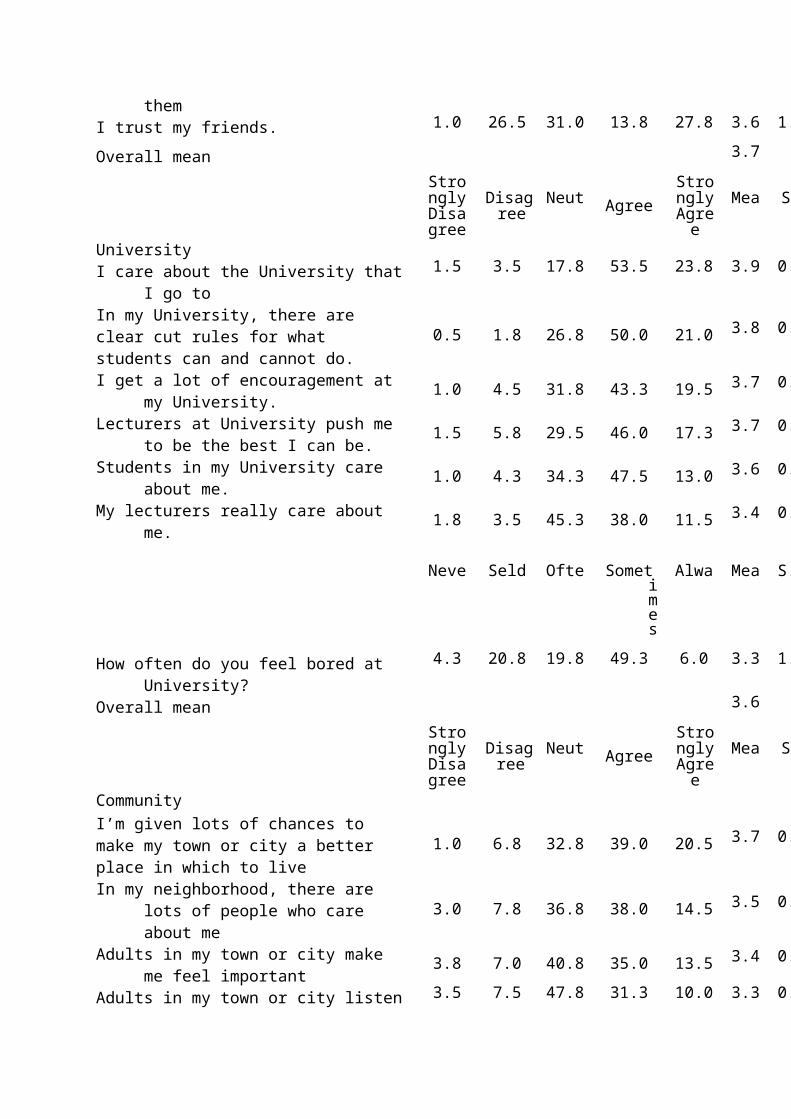
Twenty-six percent of the respondents sometimes talk about drugs, alcohol, and sex to their parents and 21.5 % of the respondents never talk about these issues to their parents. Inthe University dimension, “I care about my University that I go to” (M=3.94, S.D= 0.82) was the highest mean and “my lecturers really care about me.” (M= 3.45, S.D= 0.80) was the lowest mean. In the peer dimension, highest mean related to the statement “My friends care about me.” (M= 3.89 S.D= 1.07) and lowest mean related to the statement “I trust my friends” (M=3.66, S.D=1.05) (Table 12).
In the connection dimension, the highest mean was family (M=4.05) and community had the lowest (M=3.47). In the family dimension, “family give support to their children when they need it” had the highest mean because usually family care and supports about routine and simple matters of their children’s life such as school problem, problem in relationship with their friends. However, for serious problems such as drug usage, alcohol usage and sexual issues it is not discussed, its maybe because of culture, conservative beliefs, and parents that do not have enough knowledge or are not open minded.
In the community dimension, “giving the chance to build a better city” was the highest mean it shows higher responsibility among the youth to build the society in the future and develop their country. One quarter of the respondents talk to their parents about sex, alcohol, and drugusage but is alarming for the family and the society because if the youth has problems they may talk to their friends that maybe cause find the wrong way to solve their problems.
In the University dimension, they care about their University because they can choose their University, their field, also itshows they are satisfied about their University. In the peer dimension, “my friends care about me” had the highest mean it shows they had good relationships with their friends that
prevent some diseases such as depression, anxiety and so forth. The findings of the current study support previous findings of the investigation on positive youth development48.
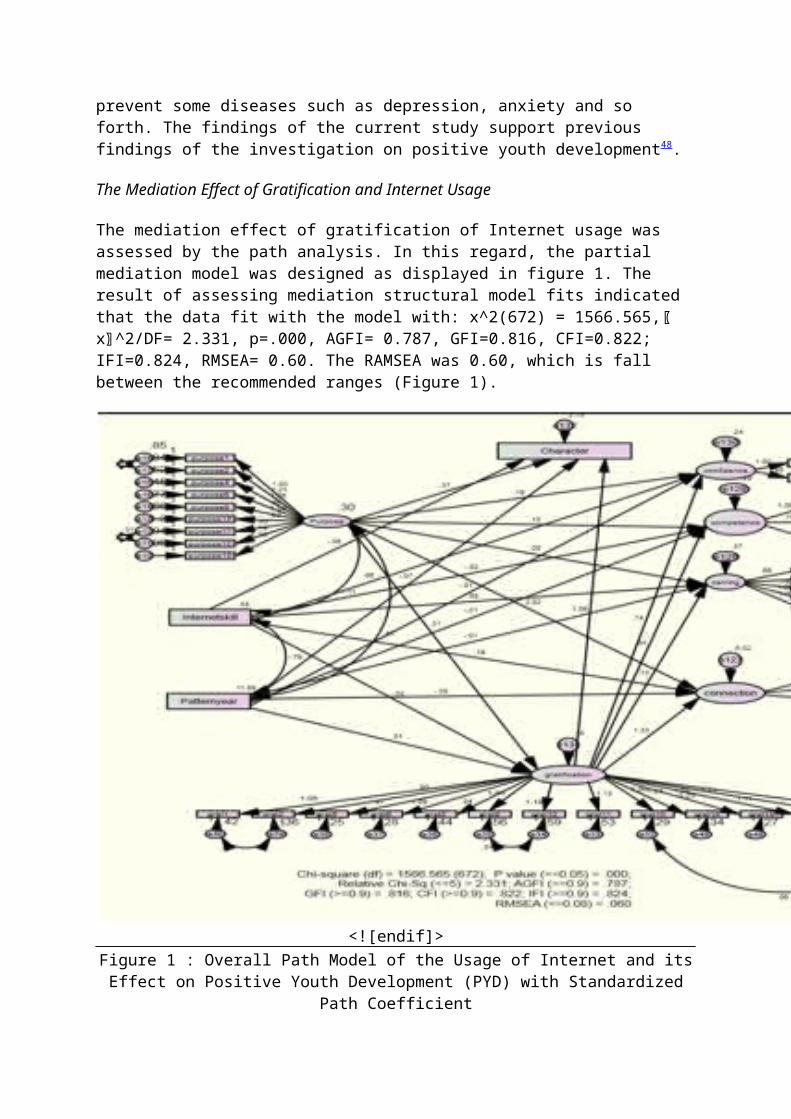
The Mediation Effect of Gratification and Internet Usage
The mediation effect of gratification of Internet usage was assessed by the path analysis. In this regard, the partial mediation model was designed as displayed in figure 1. The result of assessing mediation structural model fits indicated that the data fit with the model with: x^2(672) = 1566.565,〖x〗^2/DF= 2.331, p=.000, AGFI= 0.787, GFI=0.816, CFI=0.822; IFI=0.824, RMSEA= 0.60. The RAMSEA was 0.60, which is fall between the recommended ranges (Figure 1).
<![endif]> Figure 1 : Overall Path Model of the Usage of Internet and itsEffect on Positive Youth Development (PYD) with Standardized
Path Coefficient

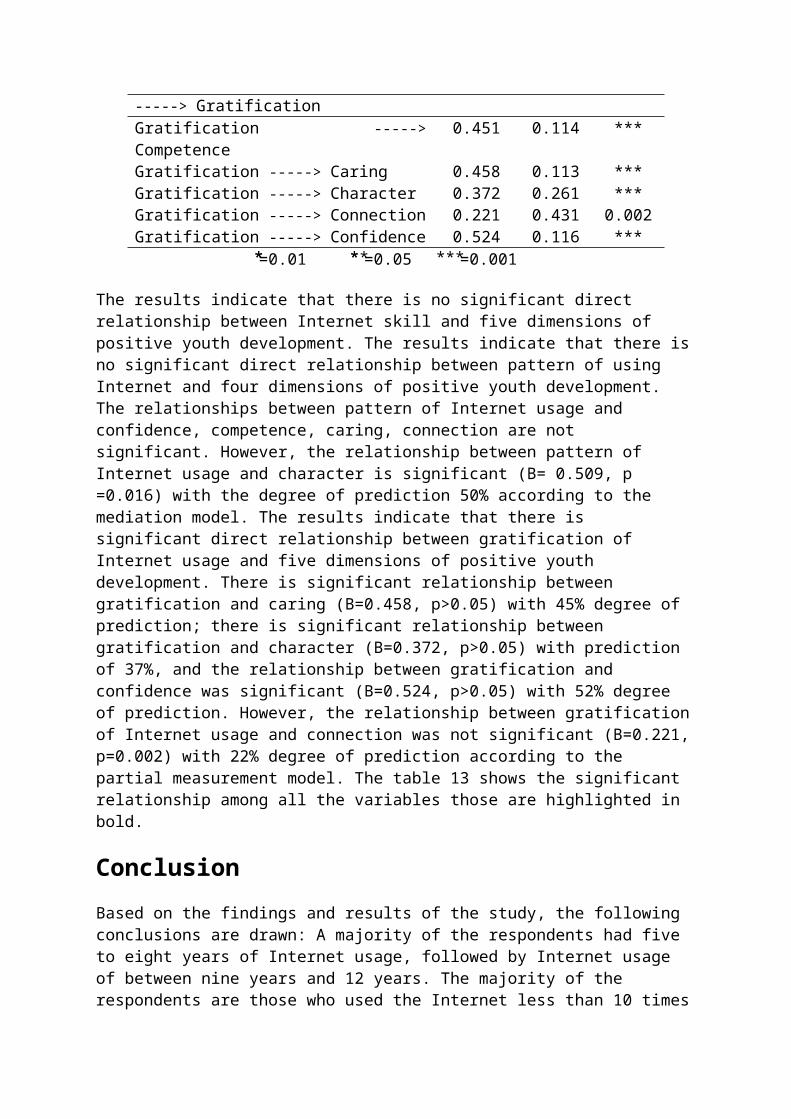
The results indicate that there is no significant direct relationship between purpose of Internet and three dimensions of positive youth development. The relationship between purpose and competence, character, caring is not significant. However, the relationship between purpose and confidence is significant (B=0.171, p =0.028) with 17% degree of prediction,the relationship between purpose and connection is significant(B= 0.420, p > 0.05) with the degree of prediction 42%, the relationship between purpose Internet usage and gratification of Internet use is significant (B=0.394, p>0.05) with ability of 39% prediction according to the mediation model (Table 13).
Table 13 : Standard Estimate for Final Model Items Estimat
e S.E P
value Purpose -----> Gratification 0.394 0.063 *** Purpose -----> Competence 0.091 0.89 0.241 Purpose -----> Caring 0.065 0.437 0.354 Purpose -----> Character 0.111 0.217 0.087 Purpose -----> Connection 0.420 0.051 *** Purpose -----> Confidence 0.171 0.88 0.028 Internet skill ----->Confidence
0.071 0.051 0.250
Internet skill ----->Competence
-0.024 0.053 0.702
Internet skill -----> Character -0.023 0.129 0.665 Internet skill ----->Connection
0.053 0.223 0.398
Internet skill -----> Caring 0.089 0.054 0.117 Internet skill ----->Gratification
0.029 0.034 0.608
Pattern of Internet usage-----> Confidence
-0.049 0.011 0.417
Pattern of Internet usage-----> Competence
-0.047 0.011 0.451
Pattern of Internet usage-----> Character
0.509 0.027 0.016
Pattern of Internet usage-----> Connection
-0.103 0.047 0.097
Pattern of Internet usage-----> Caring
-0.030 0.011 0.590
Pattern of Internet usage 0.073 0.007 0.191
-----> Gratification Gratification ----->Competence
0.451 0.114 ***
Gratification -----> Caring 0.458 0.113 *** Gratification -----> Character 0.372 0.261 *** Gratification -----> Connection 0.221 0.431 0.002 Gratification -----> Confidence 0.524 0.116 ***
=0.01 =0.05 =0.001
The results indicate that there is no significant direct relationship between Internet skill and five dimensions of positive youth development. The results indicate that there isno significant direct relationship between pattern of using Internet and four dimensions of positive youth development. The relationships between pattern of Internet usage and confidence, competence, caring, connection are not significant. However, the relationship between pattern of Internet usage and character is significant (B= 0.509, p =0.016) with the degree of prediction 50% according to the mediation model. The results indicate that there is significant direct relationship between gratification of Internet usage and five dimensions of positive youth development. There is significant relationship between gratification and caring (B=0.458, p>0.05) with 45% degree of prediction; there is significant relationship between gratification and character (B=0.372, p>0.05) with prediction of 37%, and the relationship between gratification and confidence was significant (B=0.524, p>0.05) with 52% degree of prediction. However, the relationship between gratificationof Internet usage and connection was not significant (B=0.221,p=0.002) with 22% degree of prediction according to the partial measurement model. The table 13 shows the significant relationship among all the variables those are highlighted in bold.
Conclusion Based on the findings and results of the study, the following conclusions are drawn: A majority of the respondents had five to eight years of Internet usage, followed by Internet usage of between nine years and 12 years. The majority of the respondents are those who used the Internet less than 10 times
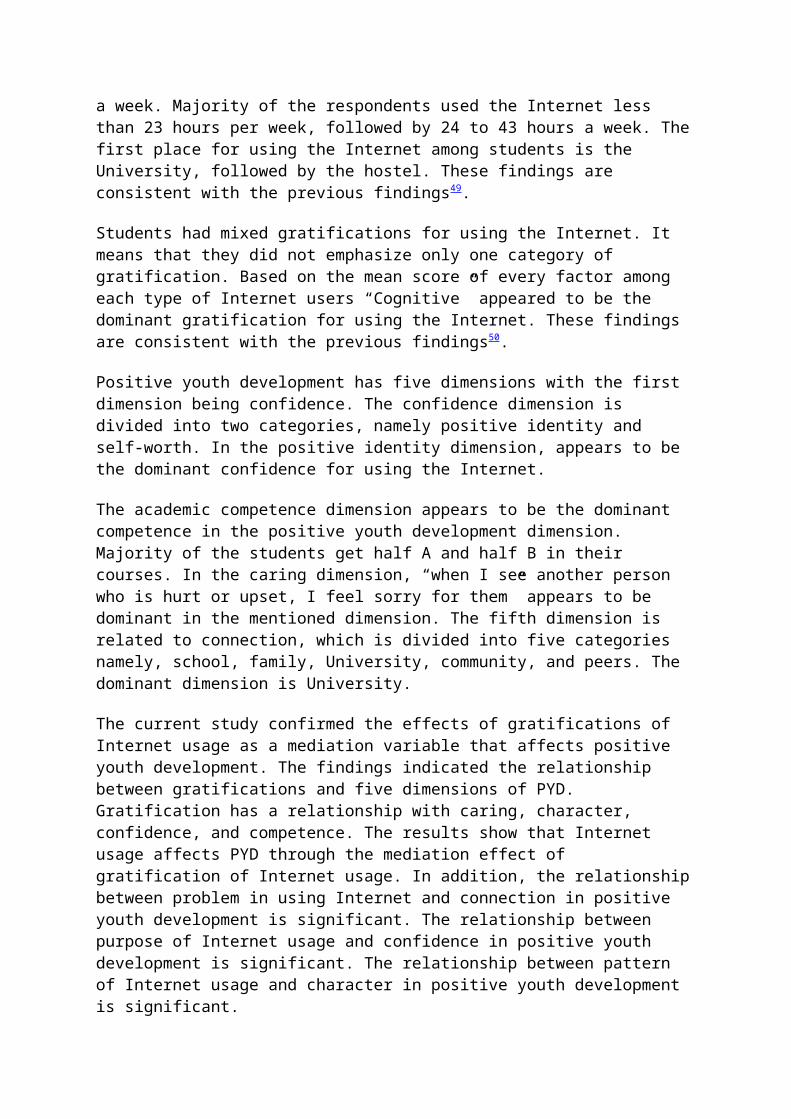
a week. Majority of the respondents used the Internet less than 23 hours per week, followed by 24 to 43 hours a week. Thefirst place for using the Internet among students is the University, followed by the hostel. These findings are consistent with the previous findings49.
Students had mixed gratifications for using the Internet. It means that they did not emphasize only one category of gratification. Based on the mean score of every factor among each type of Internet users “Cognitive” appeared to be the dominant gratification for using the Internet. These findings are consistent with the previous findings50.
Positive youth development has five dimensions with the first dimension being confidence. The confidence dimension is divided into two categories, namely positive identity and self-worth. In the positive identity dimension, appears to be the dominant confidence for using the Internet.
The academic competence dimension appears to be the dominant competence in the positive youth development dimension. Majority of the students get half A and half B in their courses. In the caring dimension, “when I see another person who is hurt or upset, I feel sorry for them” appears to be dominant in the mentioned dimension. The fifth dimension is related to connection, which is divided into five categories namely, school, family, University, community, and peers. The dominant dimension is University.
The current study confirmed the effects of gratifications of Internet usage as a mediation variable that affects positive youth development. The findings indicated the relationship between gratifications and five dimensions of PYD. Gratification has a relationship with caring, character, confidence, and competence. The results show that Internet usage affects PYD through the mediation effect of gratification of Internet usage. In addition, the relationshipbetween problem in using Internet and connection in positive youth development is significant. The relationship between purpose of Internet usage and confidence in positive youth development is significant. The relationship between pattern of Internet usage and character in positive youth development is significant.
Some of the respondents suggested that cost of Internet usage should be decreased and instead increase the speed of Internetconnection. They want the government to block some of the unethical and pornographic websites on the Internet. They desire workshops for elaborating and creating awareness about some of the negative aspects of using the Internet. They want free Internet connection for the students. They want educational workshops for professional users of the Internet. They suggested that companies provide software for detecting people who use pornographic websites. They want to be connected to the scientific sites and have easy access to scientific articles. In the purpose of Internet usage, some ofthe students mentioned that they used Internet for watching football match, dramas, cooking lessons, and blogging51. According to the results of this study, Internet has a positive effect on youth and increases their 5Cs and helps them to improve themselves via the media.
The authors are faculty members in Modern Languages and Communication, Universiti Putra Malaysia, 43400 UPM Serdang, Selangor, Malaysia