Production risk analysis of shallot farming in Adipala Sub ...
13
Production risk analysis of shallot farming in Adipala Sub-District Cilacap Regency Saefudin Ridho, Dyah Ethika Noechdijati, Irene Kartika Eka Wijayanti * , and Altri Mulyani Program of Agribusiness, Faculty of Agriculture, Jenderal Soedirman University. Jl. Dr. Soeparno 63 Purwokerto, Central Java, Indonesia. Abstract. The development of shallot farming in Adipala Sub-district starting in 2018 faced several problems, namely most farmers still had low experience of shallot farming, the type of land that was less fertile, shallot seeds from Brebes which were not specific to coastal land. This research aimed to analyze 1) revenue, cost, income, and R/C, 2) the level of production risk, 3) factors influencing production, 4) factors influencing production risk. The research object was farmers who carried out shallot farming during the growing season from November 2019 to January 2020 in Adipala Village, Bunton Village, and Karanganyar Village. The sampling method was saturated sampling. Data analysis consisted of analysis of revenue, cost, income, R/C, coefficient of variation, and Just & Pope production risk function regression. The results showed that the shallot farming in Adipala Sub-district was profitable, namely per farm it had revenue Rp10,834,600.00, cost Rp9,999,943.61, income Rp834,656.39, and R/C 1.06. The production risk level was high at 85.49%. Factors that had been shown to significantly influence production were land area, seedlings, labor, agricultural lime, petroganik, manure, TSP, ZA, KCl, NPK, herbicides, and fungicides. Meanwhile, factors that had been shown to significantly influence production risk were TSP, NPK, and fungicides. 1 Introduction Shallots are important horticultural commodity for Indonesian people because they are consumed as a spice in cooking. As the population increases, the demand for shallots also increases. Increased consumption of shallots encourages an increase in the amount of production by increasing the harvest area. * Corresponding author: [email protected] © The Authors, published by EDP Sciences. This is an open access article distributed under the terms of the Creative Commons Attribution License 4.0 (http://creativecommons.org/licenses/by/4.0/). E3S Web of Conferences 306, 02030 (2021) https://doi.org/10.1051/e3sconf/202130602030 1 st ICADAI 2021
-
Upload
khangminh22 -
Category
Documents
-
view
3 -
download
0
Transcript of Production risk analysis of shallot farming in Adipala Sub ...

1
Production risk analysis of shallot farming in Adipala Sub-District Cilacap Regency
Saefudin Ridho, Dyah Ethika Noechdijati, Irene Kartika Eka Wijayanti*, and Altri Mulyani
Program of Agribusiness, Faculty of Agriculture, Jenderal Soedirman University. Jl. Dr. Soeparno 63 Purwokerto, Central Java, Indonesia.
Abstract. The development of shallot farming in Adipala Sub-district starting in 2018 faced several problems, namely most farmers still had low experience of shallot farming, the type of land that was less fertile, shallot seeds from Brebes which were not specific to coastal land. This research aimed to analyze 1) revenue, cost, income, and R/C, 2) the level of production risk, 3) factors influencing production, 4) factors influencing production risk. The research object was farmers who carried out shallot farming during the growing season from November 2019 to January 2020 in Adipala Village, Bunton Village, and Karanganyar Village. The sampling method was saturated sampling. Data analysis consisted of analysis of revenue, cost, income, R/C, coefficient of variation, and Just & Pope production risk function regression. The results showed that the shallot farming in Adipala Sub-district was profitable, namely per farm it had revenue Rp10,834,600.00, cost Rp9,999,943.61, income Rp834,656.39, and R/C 1.06. The production risk level was high at 85.49%. Factors that had been shown to significantly influence production were land area, seedlings, labor, agricultural lime, petroganik, manure, TSP, ZA, KCl, NPK, herbicides, and fungicides. Meanwhile, factors that had been shown to significantly influence production risk were TSP, NPK, and fungicides.
1 Introduction Shallots are important horticultural commodity for Indonesian people because they are consumed as a spice in cooking. As the population increases, the demand for shallots also increases. Increased consumption of shallots encourages an increase in the amount of production by increasing the harvest area.
* Corresponding author: [email protected]
© The Authors, published by EDP Sciences. This is an open access article distributed under the terms of the Creative Commons Attribution License 4.0 (http://creativecommons.org/licenses/by/4.0/).
E3S Web of Conferences 306, 02030 (2021) https://doi.org/10.1051/e3sconf/2021306020301st ICADAI 2021

2
Table 1. Total population, consumption, production, harvested area, and productivity of shallots in Indonesia, 2014 – 2018
Year Total population (000 inhabitant)
Consumption (ton)
Production (ton)
Harvested area (ha)
Productivity (ton/ha)
2014 252,165 852,450 1,233,984 120,704 10.22 2015 255,588 917,764 1,229,184 122,126 10.06 2016 258,497 1,318,789 1,446,860 149,635 9.67 2017 261,356 1,277,182 1,470,155 158,172 9.29 2018 264,162 1,347,407 1,503,436 156,779 9.59
Source: Directorate General of Horticulture, Ministry of Agriculture [1], processed
The decrease in productivity when the harvested area increases indicates the production
risks faced by farmers. Production risk is an event of uncertainty in agricultural sector and has a potential to cause losses to farming because there are deviations in production yield from expected results [2]. Production risks have an impact on crop failure or a decrease in the number of harvests from expected yields [3]. Previous research has proven that shallot farming can not be separated from production risk, it was 60.75 percent in Batu City and 46.8 percent in Brebes Regency [4, 5].
The development of shallot farming carried out by Cilacap Regency Agriculture Department in collaboration with Bank Indonesia caused the production and harvest area of shallots in Cilacap Regency increase significantly, reaching 322 tons in 2018 with 26 hectares land area [6]. Some of problems faced by farmers in Adipala, which is one of the Sub-districts in Cilacap were the low experience of farming shallots, types of land that were less fertile, and shallot seeds from Brebes that were not specific to coastal sand land. The production factors that the farmers used consisted of land area, seedlings, labor, agricultural lime, petroganik, manure, TSP, urea, ZA, KCL, NPK, herbicides, fungicides, and insecticides.
The level of production risk and factors that influence it are things that need to be considered by farmers. In addition, production risk requires farmers to spend financing for optimum production, so this research also needs to analyze revenue, costs and income. The comparison between revenue and costs is then able to show the feasibility of farming. Thus, the objectives of this study were to 1) analyze revenue, cost, income, and R/C; 2) analyze the level of production risk; 3) analyze the factors that influence production; 4) analyze the factors that influence production risk. For this reason, the development of the hypothesis from this research is that shallot farming in Adipala District is profitable with a high risk and there is a significant influence on land area, seedlings, labor, agricultural lime, petroganik, manure, TSP, urea, ZA, KCL, NPK, herbicides, fungicides and insecticides individually, both against production and production risk.
2 Materials and methods The research was carried out in three villages in Adipala Sub-district, namely Adipala Village, Bunton Village, and Karanganyar Village. The village selection was carried out purposively with the consideration that shallot farming with the highest number of farmers was in the three villages, namely during the growing season from November 2019 to January 2020 (off season/rainy season). The preliminary survey was carried out in January 2020 and the research was carried out from June to July 2020. The research object was shallot farmers who carry out shallot farming in the growing season of that period. The number consisted of 73 people. If the population is less than 100 people, the appropriate sampling technique is saturated sampling. Saturated sample is a sampling technique that uses all members of the population as a sample [7]. However, this research limited only farmers with freehold land title as the sample. This was done with the consideration that land rental costs and land tax
2
E3S Web of Conferences 306, 02030 (2021) https://doi.org/10.1051/e3sconf/2021306020301st ICADAI 2021
2
Table 1. Total population, consumption, production, harvested area, and productivity of shallots in Indonesia, 2014 – 2018
Year Total population (000 inhabitant)
Consumption (ton)
Production (ton)
Harvested area (ha)
Productivity (ton/ha)
2014 252,165 852,450 1,233,984 120,704 10.22 2015 255,588 917,764 1,229,184 122,126 10.06 2016 258,497 1,318,789 1,446,860 149,635 9.67 2017 261,356 1,277,182 1,470,155 158,172 9.29 2018 264,162 1,347,407 1,503,436 156,779 9.59
Source: Directorate General of Horticulture, Ministry of Agriculture [1], processed
The decrease in productivity when the harvested area increases indicates the production
risks faced by farmers. Production risk is an event of uncertainty in agricultural sector and has a potential to cause losses to farming because there are deviations in production yield from expected results [2]. Production risks have an impact on crop failure or a decrease in the number of harvests from expected yields [3]. Previous research has proven that shallot farming can not be separated from production risk, it was 60.75 percent in Batu City and 46.8 percent in Brebes Regency [4, 5].
The development of shallot farming carried out by Cilacap Regency Agriculture Department in collaboration with Bank Indonesia caused the production and harvest area of shallots in Cilacap Regency increase significantly, reaching 322 tons in 2018 with 26 hectares land area [6]. Some of problems faced by farmers in Adipala, which is one of the Sub-districts in Cilacap were the low experience of farming shallots, types of land that were less fertile, and shallot seeds from Brebes that were not specific to coastal sand land. The production factors that the farmers used consisted of land area, seedlings, labor, agricultural lime, petroganik, manure, TSP, urea, ZA, KCL, NPK, herbicides, fungicides, and insecticides.
The level of production risk and factors that influence it are things that need to be considered by farmers. In addition, production risk requires farmers to spend financing for optimum production, so this research also needs to analyze revenue, costs and income. The comparison between revenue and costs is then able to show the feasibility of farming. Thus, the objectives of this study were to 1) analyze revenue, cost, income, and R/C; 2) analyze the level of production risk; 3) analyze the factors that influence production; 4) analyze the factors that influence production risk. For this reason, the development of the hypothesis from this research is that shallot farming in Adipala District is profitable with a high risk and there is a significant influence on land area, seedlings, labor, agricultural lime, petroganik, manure, TSP, urea, ZA, KCL, NPK, herbicides, fungicides and insecticides individually, both against production and production risk.
2 Materials and methods The research was carried out in three villages in Adipala Sub-district, namely Adipala Village, Bunton Village, and Karanganyar Village. The village selection was carried out purposively with the consideration that shallot farming with the highest number of farmers was in the three villages, namely during the growing season from November 2019 to January 2020 (off season/rainy season). The preliminary survey was carried out in January 2020 and the research was carried out from June to July 2020. The research object was shallot farmers who carry out shallot farming in the growing season of that period. The number consisted of 73 people. If the population is less than 100 people, the appropriate sampling technique is saturated sampling. Saturated sample is a sampling technique that uses all members of the population as a sample [7]. However, this research limited only farmers with freehold land title as the sample. This was done with the consideration that land rental costs and land tax
3
costs had a large difference so that the average cost would be more accurate with this sample limitation.
2.1 Data analysis
Analysis of revenue, cost, income, and R/C to answer the first objective used the following equations [8]:
TR = Py × Y (1)
TC = FC + VC (2)
π = TR – TC (3)
R⁄C ratio = TR/TC (4)
where: TR = total revenue (Rp) Py = product price (Rp/kg) Y = production yield (kg) TC = total cost (Rp) FC = fixed cost (Rp) VC = variable cost (Rp) π = income (Rp) R/C ratio = revenue and cost ratio Hypothesis: H0 : R/C ratio ≤ 1, unprofitable farming Ha : R/C ratio > 1, profitable farming Hypothesis testing criteria: H0 is accepted and Ha is rejected if R/C ratio is ≤ 1 H0 is rejected and Ha is accepted if R/C ratio is > 1
Analysis of the coefficient of variation is conducted to answer the second objective.
Variant is a measure of the risk unit of an investment project which describes the magnitude of the deviation that occurs, while the standard deviation is a measure of the smallest risk unit [9]. The level of production risk can be calculated by finding the percentage of production risk to the average production, using the coefficient of variation analysis, using the following equations [4]:
(5) where: σ2 = variant (kg) Yi = production yield in the i-th growing season (kg) Y = average production yield (kg) n = number of samples
3
E3S Web of Conferences 306, 02030 (2021) https://doi.org/10.1051/e3sconf/2021306020301st ICADAI 2021

4
(6) Explanation:
σ = standard deviation (kg)
(7) Explanation: CV = coefficient of variation (%)
This research only used data for one growing season of shallots so that statistical testing used a comparison with a value of 50% as follows [4]:
Hypothesis: H0 : CV ≤ 50%, low risk farming Ha : CV > 50%, high risk farming Hypothesis testing criteria: H0 is accepted and Ha is rejected if the CV value is ≤ 50% H0 is rejected and Ha is accepted if the CV value is > 50%
Just & Pope production risk function regression analysis to answer the third and
fourth objectives. Just & Pope model production risk analysis consists of the production function and the production variance function estimation. The production function used by this model is Cobb-Douglas production function in the form of a natural logarithm. Here is the equation [4]:
Production function: lnYi = β0 + β1lnX1 + β2lnX2 + β3lnX3 + β4lnX4 + β5lnX5 + β6lnX6 + β7lnX7 + β8lnX8 +
β9lnX9 + β10lnX10 + β11lnX11 + β12lnX12 + β13lnX13 + β14lnX14 + ɛ1 (8) The production risk is calculated by the residual from the estimation of the
production function. The residual is used as the dependent variable in estimating the production risk function. Here is the equation [4]:
Production risk function:
ln[ɛ12] = θ0 + θ1lnX1 + θ2lnX2 + θ3lnX3 + θ4lnX4 + θ5lnX5 + θ6lnX6 + θ7lnX7 + θ8lnX8 +
θ9lnX9 + θ10lnX10 + θ11lnX11 + θ12lnX12 + θ13lnX13 + θ14lnX14 + ɛ2 (9) where: Yi = production yield (kg) ɛ1
2 = production risk X1 = land area (ha) X2 = seedlings (kg) X3 = labor (HOK) X4 = agricultural lime (kg) X5 = petroganik (kg) X6 = manure (kg) X7 = TSP (kg)
4
E3S Web of Conferences 306, 02030 (2021) https://doi.org/10.1051/e3sconf/2021306020301st ICADAI 2021
4
(6) Explanation:
σ = standard deviation (kg)
(7) Explanation: CV = coefficient of variation (%)
This research only used data for one growing season of shallots so that statistical testing used a comparison with a value of 50% as follows [4]:
Hypothesis: H0 : CV ≤ 50%, low risk farming Ha : CV > 50%, high risk farming Hypothesis testing criteria: H0 is accepted and Ha is rejected if the CV value is ≤ 50% H0 is rejected and Ha is accepted if the CV value is > 50%
Just & Pope production risk function regression analysis to answer the third and
fourth objectives. Just & Pope model production risk analysis consists of the production function and the production variance function estimation. The production function used by this model is Cobb-Douglas production function in the form of a natural logarithm. Here is the equation [4]:
Production function: lnYi = β0 + β1lnX1 + β2lnX2 + β3lnX3 + β4lnX4 + β5lnX5 + β6lnX6 + β7lnX7 + β8lnX8 +
β9lnX9 + β10lnX10 + β11lnX11 + β12lnX12 + β13lnX13 + β14lnX14 + ɛ1 (8) The production risk is calculated by the residual from the estimation of the
production function. The residual is used as the dependent variable in estimating the production risk function. Here is the equation [4]:
Production risk function:
ln[ɛ12] = θ0 + θ1lnX1 + θ2lnX2 + θ3lnX3 + θ4lnX4 + θ5lnX5 + θ6lnX6 + θ7lnX7 + θ8lnX8 +
θ9lnX9 + θ10lnX10 + θ11lnX11 + θ12lnX12 + θ13lnX13 + θ14lnX14 + ɛ2 (9) where: Yi = production yield (kg) ɛ1
2 = production risk X1 = land area (ha) X2 = seedlings (kg) X3 = labor (HOK) X4 = agricultural lime (kg) X5 = petroganik (kg) X6 = manure (kg) X7 = TSP (kg)
5
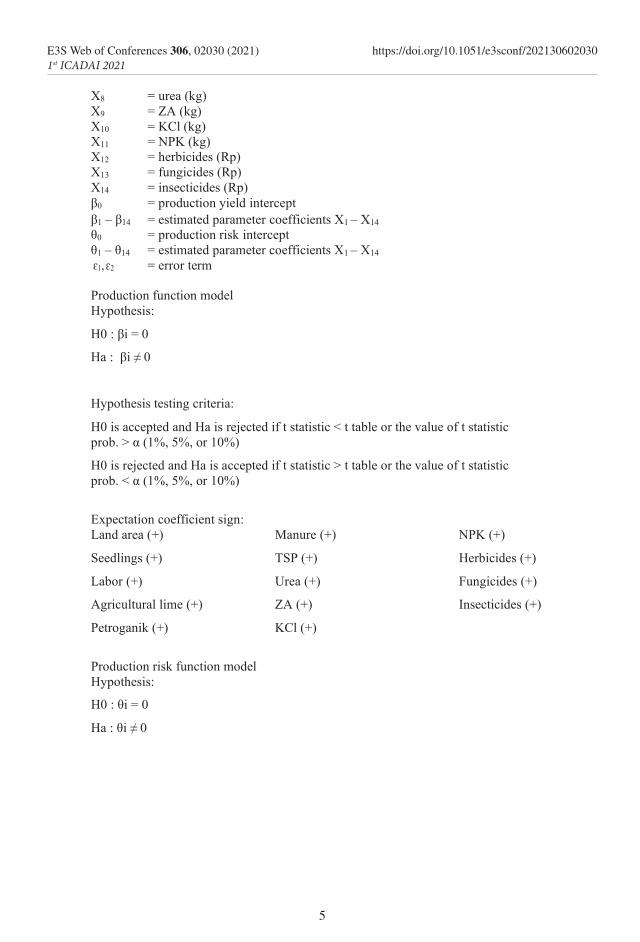
X8 = urea (kg) X9 = ZA (kg) X10 = KCl (kg) X11 = NPK (kg) X12 = herbicides (Rp) X13 = fungicides (Rp) X14 = insecticides (Rp) β0 = production yield intercept β1 – β14 = estimated parameter coefficients X1 – X14 θ0 = production risk intercept θ1 – θ14 = estimated parameter coefficients X1 – X14
ɛ1, ɛ2 = error term
Production function model Hypothesis:
H0 : βi = 0
Ha : βi ≠ 0
Hypothesis testing criteria:
H0 is accepted and Ha is rejected if t statistic < t table or the value of t statistic prob. > α (1%, 5%, or 10%)
H0 is rejected and Ha is accepted if t statistic > t table or the value of t statistic prob. < α (1%, 5%, or 10%)
Expectation coefficient sign: Land area (+)
Seedlings (+)
Labor (+)
Agricultural lime (+)
Petroganik (+)
Manure (+)
TSP (+)
Urea (+)
ZA (+)
KCl (+)
NPK (+)
Herbicides (+)
Fungicides (+)
Insecticides (+)
Production risk function model Hypothesis:
H0 : θi = 0
Ha : θi ≠ 0
5
E3S Web of Conferences 306, 02030 (2021) https://doi.org/10.1051/e3sconf/2021306020301st ICADAI 2021

6
Hypothesis testing criteria:
H0 is accepted and Ha is rejected if t statistic < t table or the value of t statistic prob. > α (1%, 5%, or 10%)
H0 is rejected and Ha is accepted if t statistic > t table or the value of t statistic prob. < α (1%, 5%, or 10%)
Expectation coefficient sign: Land area (-)
Seedlings (-)
Labor (-)
Agricultural lime (-)
Petroganik (-)
Manure (-)
TSP (-)
Urea (-)
ZA (-)
KCl (-)
NPK (-)
Herbicides (-)
Fungicides (-)
Insecticides (-)
3 Results and discussion
3.1 Revenue, cost, income, and R/C
Adipala Sub-district's revenue of shallot farming, according to Table 2, was lower than the other regions. Brebes Regency, Srigading Village Sanden Sub-district Bantul Regency, and Batu City had shallot farming revenues of Rp112,373,965.38 per hectare [5], Rp121,793,478.26 per hectare [10], and Rp130,204,610.00 per hectare [4]. This was related to the production of shallots in Adipala sub – district which was still lower, namely 3.63 times below the production of shallots in Brebes Regency which reached 1,859.52 kilograms per farm [5]. In addition, the selling price of shallots in Adipala Sub-district was still lower, namely 1.43 times below the selling price of shallots in Srigading Village Sanden Sub-district Bantul Regency, which reached Rp29,016.00 per kilogram [11].
Farmers paid a lot of money for seedlings, labor, irrigation, NPK, insecticides, and fungicides. This was in accordance with the result of research [4] which showed that the cost components mostly incurred by farmers in Batu City were for seedlings, labor, NPK, and pesticides. The type of land in the form of sand land made the need for fertilizer higher than for paddy fields. This was in accordance with the results of [11] which showed that the cost of fertilizer per 2,500 square meters per growing season in Srigading Village Sanden Sub-district Bantul Regency was Rp1,121,001.89 on sand land and Rp774,062.09 in paddy fields. The reason for the high cost of insecticides and fungicides was the increased attack by pests and diseases so that farmers tend to increase the frequency of spraying. Something similar happened in Brebes. The percentage of insecticide and fungicide costs of all shallot farming costs in Brebes Regency was 4.73% and 0.96% during the dry season, increasing to 5.61% and 1.24% during the rainy season [5].
6
E3S Web of Conferences 306, 02030 (2021) https://doi.org/10.1051/e3sconf/2021306020301st ICADAI 2021

6
Hypothesis testing criteria:
H0 is accepted and Ha is rejected if t statistic < t table or the value of t statistic prob. > α (1%, 5%, or 10%)
H0 is rejected and Ha is accepted if t statistic > t table or the value of t statistic prob. < α (1%, 5%, or 10%)
Expectation coefficient sign: Land area (-)
Seedlings (-)
Labor (-)
Agricultural lime (-)
Petroganik (-)
Manure (-)
TSP (-)
Urea (-)
ZA (-)
KCl (-)
NPK (-)
Herbicides (-)
Fungicides (-)
Insecticides (-)
3 Results and discussion
3.1 Revenue, cost, income, and R/C
Adipala Sub-district's revenue of shallot farming, according to Table 2, was lower than the other regions. Brebes Regency, Srigading Village Sanden Sub-district Bantul Regency, and Batu City had shallot farming revenues of Rp112,373,965.38 per hectare [5], Rp121,793,478.26 per hectare [10], and Rp130,204,610.00 per hectare [4]. This was related to the production of shallots in Adipala sub – district which was still lower, namely 3.63 times below the production of shallots in Brebes Regency which reached 1,859.52 kilograms per farm [5]. In addition, the selling price of shallots in Adipala Sub-district was still lower, namely 1.43 times below the selling price of shallots in Srigading Village Sanden Sub-district Bantul Regency, which reached Rp29,016.00 per kilogram [11].
Farmers paid a lot of money for seedlings, labor, irrigation, NPK, insecticides, and fungicides. This was in accordance with the result of research [4] which showed that the cost components mostly incurred by farmers in Batu City were for seedlings, labor, NPK, and pesticides. The type of land in the form of sand land made the need for fertilizer higher than for paddy fields. This was in accordance with the results of [11] which showed that the cost of fertilizer per 2,500 square meters per growing season in Srigading Village Sanden Sub-district Bantul Regency was Rp1,121,001.89 on sand land and Rp774,062.09 in paddy fields. The reason for the high cost of insecticides and fungicides was the increased attack by pests and diseases so that farmers tend to increase the frequency of spraying. Something similar happened in Brebes. The percentage of insecticide and fungicide costs of all shallot farming costs in Brebes Regency was 4.73% and 0.96% during the dry season, increasing to 5.61% and 1.24% during the rainy season [5].
7
Table 2. Revenue, cost, income, and R/C of shallot farming of respondent farmers in Adipala Sub-district, Cilacap Regency, growing season period November 2019 to January 2020
Revenue Average value Per farm Per hectare Production yield (kg) 512.70 3.336.44 Product price (Rp/kg) 20,344.16 20,344.16 Revenue (Rp) 10,834,600.00 70,507,158.35
Cost Average value Unit Price per unit
(Rp) Per farm Per hectare
Use Cost (Rp) Use Cost (Rp) Cash costs Seedlings kg 27,633.33 112.70 3,021,166.67 733.41 19,660,520.61 Agricultural lime kg 677.78 82.58 81,666.67 537.42 531,453.36 Petroganik kg 333.33 140.67 87,916.67 915.40 572,125.81 Manure kg 397.18 594.08 149,677.78 3,866.05 974,041.94 TSP kg 1,053.33 27.67 72,600.00 180.04 472,451.19 Urea kg 658.33 15.00 30,133.33 97.61 196,095.44 ZA kg 1,123.33 25.13 43,040.00 163.56 280,086.77 KCl kg 3,606.67 12.13 83,366.67 78.96 542,516.27 NPK kg 4,725.26 117.67 445,763.33 765.73 2,900,845.99 Herbicides 41,534.25 270,287.96 Fungicides 216,450.27 1,408,570.07 Insecticides 320,622.03 2,086,477.44 Other fertilizers and pesticides
94,818.33 617,039.05
Irrigation (fuel)
liter 7,600.00 1.48 501,962.27 9.63 3,266,565.73
Land tax ha 26,721.46 0.15 4,090.61 1.00 26,619.99 Equipment rental
43,166.67 280,911.06
Labor outside the family
HOK 35.87 2,546,948.98 233.45 16,574,505.30
Sum of cash cost 7,784,924.51 50,661,113.98 Non cash costs Depreciation of equipment
45,711.21 297,469.89
Labor inside the family
HOK 26.51 2,169,307.89 172.49 14,116,971.11
Sum of non cash cost
2,215,019.10 14,414,441.00
Sum of total cost 9,999,943.61 65,075,554.98 Income
Average value Per farm Per hectare Income on cash cost (Rp) 3,049,675.49 19,846,044.38 Income on total cost (Rp) 834,656.39 5,431,603.38 R/C R/C on cash cost 1.39 R/C on total cost 1.06
Source: Primary data analysis (2020)
Table 2 showed that the average income over both cash cost and total cost were positive. Then, the average R/C over both cash cost and total cost were bigger than one. This meant
7
E3S Web of Conferences 306, 02030 (2021) https://doi.org/10.1051/e3sconf/2021306020301st ICADAI 2021

8
accepting the hypothesis that shallot farming in Adipala Sub-district was profitable. However, the value of income per farm and R/C over the total cost were lower than other areas (average land area was 0.15 hectares). Srigading Village Sanden Sub-district Bantul Regency had shallot farming income over the total cost per farm Rp69,326,457.88 (average land area was 0.25 hectares). Meanwhile, the R/C value of shallot farming over the total cost in Indramayu Regency was 2.1 [12]. The low income and R/C of shallot farming were caused by the decrease in the productivity of shallots during the rainy season. This was in accordance with the result of research by [5] which explained that the income of shallot farming over the total cost per hectare in Brebes Regency in the dry season was Rp23,567,909.17, decreasing to Rp2,444,371.58 in the rainy season.
3.2 The level of production risk
Production risk is measured by dividing the standard deviation of production by the average of production yield. Table 3. shows the coefficient of variation of shallot farming of 85.49%. The coefficient of variation value is greater than 50%, meaning that it accepts the hypothesis which states that onion farming in Adipala District has a high level of production risk. The results of this study are greater than the results of research conducted by [13] in the Malang area. The high level of risk of shallot production in Adipala District is caused by onion farming which is still new to farmers so that farmers are less experienced in dealing with pests and diseases which increase in the rainy season. The production risk caused by pests and diseases can be seen from the pesticide costs incurred by farmers [4]. The low experience of farmers makes farmers only rely on chemical control with the use of which tends to be excessive. This actually causes pests to become resistant or immune so that the risk of production is getting worse.
Table 3. The level of production risk of shallot farming of respondent farmers in
Adipala Sub-district, Cilacap Regency, growing season period November 2019 to January 2020
Description The calculation result Variant 192,105.67 Standard deviation 438.30 Average production yield (kg) 512.70 Coefficient of variation (%) 85.49
Source: Primary data analysis (2020).
3.3 Production factors and production risk factors
The results of the analysis of the production function and the risk function are presented in Table 4. The results of the analysis show that the production factors that affect the production of shallots are land area, seedlings, labor, lime agricultural, petroganics, manure, TSP, Urea, ZA, KCL, NPK, herbicides, fungicides, and insecticides. The value of the coefficient of determination (Adjusted R2) of shallots is 95.10%. The value of the coefficient of determination means that 95.10% of shallot production is influenced by the variables in the model, while 4.90% is influenced by other factors that have not been included in the model. The results of the analysis show that the production input variables that have a significant effect on the production of shallots are land area, seedlings, labor, lime agricultural, petroganik, manure, TSP, ZA, KCL, NPK, herbicides, and fungicides.
The results of risk function analysis show that the factors that affect the risk of shallot production are land area, seedlings, labor, lime agricultural, petroganik, manure, TSP, Urea,
8
E3S Web of Conferences 306, 02030 (2021) https://doi.org/10.1051/e3sconf/2021306020301st ICADAI 2021
8
accepting the hypothesis that shallot farming in Adipala Sub-district was profitable. However, the value of income per farm and R/C over the total cost were lower than other areas (average land area was 0.15 hectares). Srigading Village Sanden Sub-district Bantul Regency had shallot farming income over the total cost per farm Rp69,326,457.88 (average land area was 0.25 hectares). Meanwhile, the R/C value of shallot farming over the total cost in Indramayu Regency was 2.1 [12]. The low income and R/C of shallot farming were caused by the decrease in the productivity of shallots during the rainy season. This was in accordance with the result of research by [5] which explained that the income of shallot farming over the total cost per hectare in Brebes Regency in the dry season was Rp23,567,909.17, decreasing to Rp2,444,371.58 in the rainy season.
3.2 The level of production risk
Production risk is measured by dividing the standard deviation of production by the average of production yield. Table 3. shows the coefficient of variation of shallot farming of 85.49%. The coefficient of variation value is greater than 50%, meaning that it accepts the hypothesis which states that onion farming in Adipala District has a high level of production risk. The results of this study are greater than the results of research conducted by [13] in the Malang area. The high level of risk of shallot production in Adipala District is caused by onion farming which is still new to farmers so that farmers are less experienced in dealing with pests and diseases which increase in the rainy season. The production risk caused by pests and diseases can be seen from the pesticide costs incurred by farmers [4]. The low experience of farmers makes farmers only rely on chemical control with the use of which tends to be excessive. This actually causes pests to become resistant or immune so that the risk of production is getting worse.
Table 3. The level of production risk of shallot farming of respondent farmers in
Adipala Sub-district, Cilacap Regency, growing season period November 2019 to January 2020
Description The calculation result Variant 192,105.67 Standard deviation 438.30 Average production yield (kg) 512.70 Coefficient of variation (%) 85.49
Source: Primary data analysis (2020).
3.3 Production factors and production risk factors
The results of the analysis of the production function and the risk function are presented in Table 4. The results of the analysis show that the production factors that affect the production of shallots are land area, seedlings, labor, lime agricultural, petroganics, manure, TSP, Urea, ZA, KCL, NPK, herbicides, fungicides, and insecticides. The value of the coefficient of determination (Adjusted R2) of shallots is 95.10%. The value of the coefficient of determination means that 95.10% of shallot production is influenced by the variables in the model, while 4.90% is influenced by other factors that have not been included in the model. The results of the analysis show that the production input variables that have a significant effect on the production of shallots are land area, seedlings, labor, lime agricultural, petroganik, manure, TSP, ZA, KCL, NPK, herbicides, and fungicides.
The results of risk function analysis show that the factors that affect the risk of shallot production are land area, seedlings, labor, lime agricultural, petroganik, manure, TSP, Urea,
9
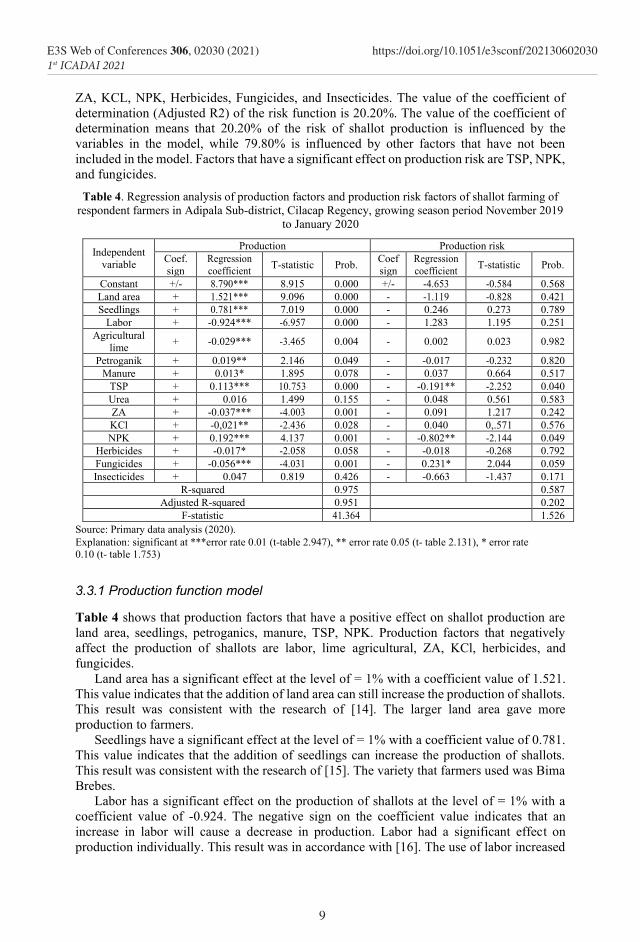
ZA, KCL, NPK, Herbicides, Fungicides, and Insecticides. The value of the coefficient of determination (Adjusted R2) of the risk function is 20.20%. The value of the coefficient of determination means that 20.20% of the risk of shallot production is influenced by the variables in the model, while 79.80% is influenced by other factors that have not been included in the model. Factors that have a significant effect on production risk are TSP, NPK, and fungicides.
Table 4. Regression analysis of production factors and production risk factors of shallot farming of respondent farmers in Adipala Sub-district, Cilacap Regency, growing season period November 2019
to January 2020
Independent variable
Production Production risk Coef. sign
Regression coefficient T-statistic Prob. Coef
sign Regression coefficient T-statistic Prob.
Constant +/- 8.790*** 8.915 0.000 +/- -4.653 -0.584 0.568 Land area + 1.521*** 9.096 0.000 - -1.119 -0.828 0.421 Seedlings + 0.781*** 7.019 0.000 - 0.246 0.273 0.789
Labor + -0.924*** -6.957 0.000 - 1.283 1.195 0.251 Agricultural
lime + -0.029*** -3.465 0.004 - 0.002 0.023 0.982
Petroganik + 0.019** 2.146 0.049 - -0.017 -0.232 0.820 Manure + 0.013* 1.895 0.078 - 0.037 0.664 0.517
TSP + 0.113*** 10.753 0.000 - -0.191** -2.252 0.040 Urea + 0.016 1.499 0.155 - 0.048 0.561 0.583 ZA + -0.037*** -4.003 0.001 - 0.091 1.217 0.242 KCl + -0,021** -2.436 0.028 - 0.040 0,.571 0.576 NPK + 0.192*** 4.137 0.001 - -0.802** -2.144 0.049
Herbicides + -0.017* -2.058 0.058 - -0.018 -0.268 0.792 Fungicides + -0.056*** -4.031 0.001 - 0.231* 2.044 0.059 Insecticides + 0.047 0.819 0.426 - -0.663 -1.437 0.171
R-squared 0.975 0.587 Adjusted R-squared 0.951 0.202
F-statistic 41.364 1.526 Source: Primary data analysis (2020). Explanation: significant at ***error rate 0.01 (t-table 2.947), ** error rate 0.05 (t- table 2.131), * error rate 0.10 (t- table 1.753)
3.3.1 Production function model
Table 4 shows that production factors that have a positive effect on shallot production are land area, seedlings, petroganics, manure, TSP, NPK. Production factors that negatively affect the production of shallots are labor, lime agricultural, ZA, KCl, herbicides, and fungicides.
Land area has a significant effect at the level of = 1% with a coefficient value of 1.521. This value indicates that the addition of land area can still increase the production of shallots. This result was consistent with the research of [14]. The larger land area gave more production to farmers.
Seedlings have a significant effect at the level of = 1% with a coefficient value of 0.781. This value indicates that the addition of seedlings can increase the production of shallots. This result was consistent with the research of [15]. The variety that farmers used was Bima Brebes.
Labor has a significant effect on the production of shallots at the level of = 1% with a coefficient value of -0.924. The negative sign on the coefficient value indicates that an increase in labor will cause a decrease in production. Labor had a significant effect on production individually. This result was in accordance with [16]. The use of labor increased
9
E3S Web of Conferences 306, 02030 (2021) https://doi.org/10.1051/e3sconf/2021306020301st ICADAI 2021

10
and became inefficient due to the increased frequency of spraying to deal with pest attacks in the rainy season.
Agricultural lime has a significant effect on the production ;of shallots at the level of =1% with a coefficient value of -0.029. The negative sign on the coefficient value of agricultural lime indicates that an increase in agricultural lime will cause a decrease in shallot production. The results of the interview showed that farmers preferred to use building lime which was not intended for farming, thereby reducing production. This result was in accordance with the research of [17] which stated that the lime treatment shows an effect on plant growth.
Petroganic has a significant effect on shallot production at the level of =5% with a coefficient value of 0.019. This value indicates that the addition of petroganics will increase the production of shallots. Petroganik had a significant effect on production individually. It was because farmers did not exceed the recommended usage limits. This result was in accordance with the research of [18] which stated that the proper application of organic fertilizers can stimulate plant growth.
Manure has a significant effect on shallot production at the level of =10% with a coefficient value of 0.013. The addition of manure in shallot cultivation can increase shallot production. The manure provided by farmers comes from goat and cow dung. Recommendations for the use of manure based on the results of the extension that farmers follow are 10,000-15,000 kilograms per hectare. The average use of manure by farmers is 3,866.05 kilograms per hectare. This shows that the use of manure by farmers is still below the recommended dose so that the use of manure can still be increased to the recommended dose limit.
TSP has a significant effect at the level of = 1% with a coefficient value of 0.113. Farmers use TSP as basic fertilizer in the fertilization process. Recommendations for the use of TSP according to the results of the extension attended by farmers are 200 kilograms per hectare, the average use of TSP by farmers is 180.04 kilograms per hectare. This shows that the use of TSP by farmers is in accordance with the recommended dose. The results of this study are different from those of [14] which stated that TSP was a factor that did not affect shallot production.
Urea had no significant effect on production individually. This result was consistent with the research of [14]. Nitrogen available in the soil is more absorbed by pathogenic fungi than plants [19]. In addition, the need of urea for shallot plants is 500 kilograms per hectare, but the average use of urea by farmers was only 104,62 kilograms per hectare [20].
ZA has a significant effect on shallot production at the level of =1% with a coefficient value of -0.037. The negative sign on the ZA coefficient value indicates that the addition of ZA will cause a decrease in shallot production. This result was consistent with the research of [15]. The results of counseling suggest the use of urea rather than ZA. Sinaga et al. [21] explained that ZA has acidic chemical properties. The land that farmers used had a pH of 6 to 7 so using ZA would only make the soil sour. ZA had a significant effect on production individually. This result was consistent with the research of [15]. The results of counseling suggest the use of urea rather than ZA. Sinaga et al. [21] explained that ZA has acidic chemical properties. The land that farmers used had a pH of 6 to 7 so using ZA would only make the soil sour.
KCL has a significant effect on shallot production at the level of =5% with a coefficient value of -0.021. The negative sign on the KCl coefficient indicates that the addition of KCl will cause a decrease in shallot production. This result was in accordance with the research of Putra et al. [22]. Farmers exceeded the recommended use limit so that KCl reduced production.
10
E3S Web of Conferences 306, 02030 (2021) https://doi.org/10.1051/e3sconf/2021306020301st ICADAI 2021
10
and became inefficient due to the increased frequency of spraying to deal with pest attacks in the rainy season.
Agricultural lime has a significant effect on the production ;of shallots at the level of =1% with a coefficient value of -0.029. The negative sign on the coefficient value of agricultural lime indicates that an increase in agricultural lime will cause a decrease in shallot production. The results of the interview showed that farmers preferred to use building lime which was not intended for farming, thereby reducing production. This result was in accordance with the research of [17] which stated that the lime treatment shows an effect on plant growth.
Petroganic has a significant effect on shallot production at the level of =5% with a coefficient value of 0.019. This value indicates that the addition of petroganics will increase the production of shallots. Petroganik had a significant effect on production individually. It was because farmers did not exceed the recommended usage limits. This result was in accordance with the research of [18] which stated that the proper application of organic fertilizers can stimulate plant growth.
Manure has a significant effect on shallot production at the level of =10% with a coefficient value of 0.013. The addition of manure in shallot cultivation can increase shallot production. The manure provided by farmers comes from goat and cow dung. Recommendations for the use of manure based on the results of the extension that farmers follow are 10,000-15,000 kilograms per hectare. The average use of manure by farmers is 3,866.05 kilograms per hectare. This shows that the use of manure by farmers is still below the recommended dose so that the use of manure can still be increased to the recommended dose limit.
TSP has a significant effect at the level of = 1% with a coefficient value of 0.113. Farmers use TSP as basic fertilizer in the fertilization process. Recommendations for the use of TSP according to the results of the extension attended by farmers are 200 kilograms per hectare, the average use of TSP by farmers is 180.04 kilograms per hectare. This shows that the use of TSP by farmers is in accordance with the recommended dose. The results of this study are different from those of [14] which stated that TSP was a factor that did not affect shallot production.
Urea had no significant effect on production individually. This result was consistent with the research of [14]. Nitrogen available in the soil is more absorbed by pathogenic fungi than plants [19]. In addition, the need of urea for shallot plants is 500 kilograms per hectare, but the average use of urea by farmers was only 104,62 kilograms per hectare [20].
ZA has a significant effect on shallot production at the level of =1% with a coefficient value of -0.037. The negative sign on the ZA coefficient value indicates that the addition of ZA will cause a decrease in shallot production. This result was consistent with the research of [15]. The results of counseling suggest the use of urea rather than ZA. Sinaga et al. [21] explained that ZA has acidic chemical properties. The land that farmers used had a pH of 6 to 7 so using ZA would only make the soil sour. ZA had a significant effect on production individually. This result was consistent with the research of [15]. The results of counseling suggest the use of urea rather than ZA. Sinaga et al. [21] explained that ZA has acidic chemical properties. The land that farmers used had a pH of 6 to 7 so using ZA would only make the soil sour.
KCL has a significant effect on shallot production at the level of =5% with a coefficient value of -0.021. The negative sign on the KCl coefficient indicates that the addition of KCl will cause a decrease in shallot production. This result was in accordance with the research of Putra et al. [22]. Farmers exceeded the recommended use limit so that KCl reduced production.
11
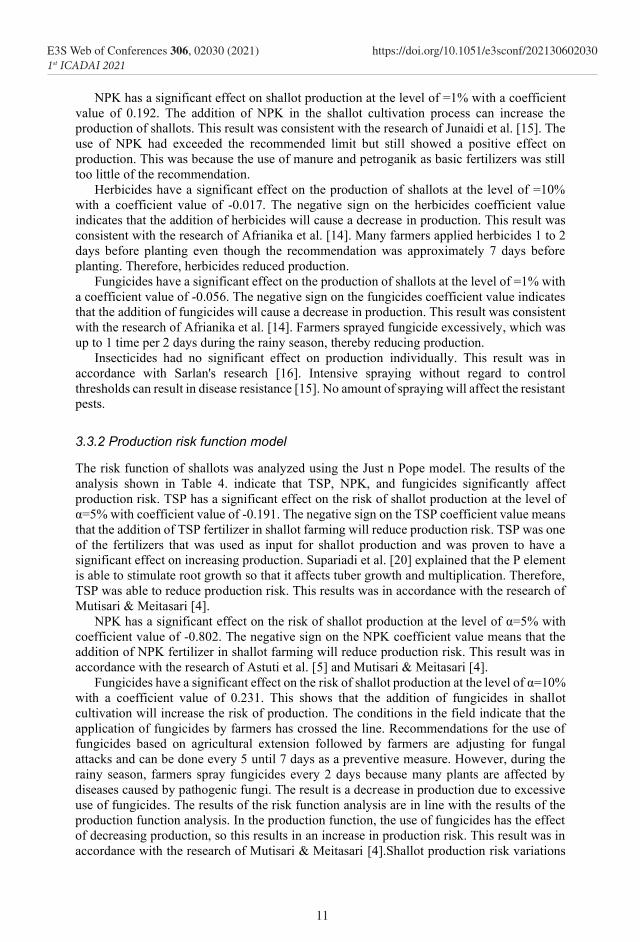
NPK has a significant effect on shallot production at the level of =1% with a coefficient value of 0.192. The addition of NPK in the shallot cultivation process can increase the production of shallots. This result was consistent with the research of Junaidi et al. [15]. The use of NPK had exceeded the recommended limit but still showed a positive effect on production. This was because the use of manure and petroganik as basic fertilizers was still too little of the recommendation.
Herbicides have a significant effect on the production of shallots at the level of =10% with a coefficient value of -0.017. The negative sign on the herbicides coefficient value indicates that the addition of herbicides will cause a decrease in production. This result was consistent with the research of Afrianika et al. [14]. Many farmers applied herbicides 1 to 2 days before planting even though the recommendation was approximately 7 days before planting. Therefore, herbicides reduced production.
Fungicides have a significant effect on the production of shallots at the level of =1% with a coefficient value of -0.056. The negative sign on the fungicides coefficient value indicates that the addition of fungicides will cause a decrease in production. This result was consistent with the research of Afrianika et al. [14]. Farmers sprayed fungicide excessively, which was up to 1 time per 2 days during the rainy season, thereby reducing production.
Insecticides had no significant effect on production individually. This result was in accordance with Sarlan's research [16]. Intensive spraying without regard to control thresholds can result in disease resistance [15]. No amount of spraying will affect the resistant pests.
3.3.2 Production risk function model
The risk function of shallots was analyzed using the Just n Pope model. The results of the analysis shown in Table 4. indicate that TSP, NPK, and fungicides significantly affect production risk. TSP has a significant effect on the risk of shallot production at the level of α=5% with coefficient value of -0.191. The negative sign on the TSP coefficient value means that the addition of TSP fertilizer in shallot farming will reduce production risk. TSP was one of the fertilizers that was used as input for shallot production and was proven to have a significant effect on increasing production. Supariadi et al. [20] explained that the P element is able to stimulate root growth so that it affects tuber growth and multiplication. Therefore, TSP was able to reduce production risk. This results was in accordance with the research of Mutisari & Meitasari [4].
NPK has a significant effect on the risk of shallot production at the level of α=5% with coefficient value of -0.802. The negative sign on the NPK coefficient value means that the addition of NPK fertilizer in shallot farming will reduce production risk. This result was in accordance with the research of Astuti et al. [5] and Mutisari & Meitasari [4].
Fungicides have a significant effect on the risk of shallot production at the level of α=10% with a coefficient value of 0.231. This shows that the addition of fungicides in shallot cultivation will increase the risk of production. The conditions in the field indicate that the application of fungicides by farmers has crossed the line. Recommendations for the use of fungicides based on agricultural extension followed by farmers are adjusting for fungal attacks and can be done every 5 until 7 days as a preventive measure. However, during the rainy season, farmers spray fungicides every 2 days because many plants are affected by diseases caused by pathogenic fungi. The result is a decrease in production due to excessive use of fungicides. The results of the risk function analysis are in line with the results of the production function analysis. In the production function, the use of fungicides has the effect of decreasing production, so this results in an increase in production risk. This result was in accordance with the research of Mutisari & Meitasari [4].Shallot production risk variations
11
E3S Web of Conferences 306, 02030 (2021) https://doi.org/10.1051/e3sconf/2021306020301st ICADAI 2021

12
58,7 percent could be explained by independent variables variations in the model. The remaining 41,3 percent was explained by other variables outside the model. Land area, seedlings, labor, agricultural lime, petroganik, manure, TSP, urea, ZA, KCL, NPK, herbicides, fungicides, and insecticides together had no significant effect on shallot production risk at the 90 percent confidence level.
4 Conclusion The conclusion of this study are: 1) Shallot farming in Adipala Sub-district was profitable, namely by Rp10,834,600.00 per farm revenue, Rp9,999,943.61 per farm cost, Rp834,656.39 per farm income, and 1.06 R/C. 2) The level of shallot farming production risk in Adipala Sub-district was high. 3) The factors that had been shown to significantly influence production were land area, seedlings, labor, agricultural lime, petroganik, manure, TSP, ZA, KCl, NPK, herbicides, and fungicides. 4) The factors that had been shown to significantly influence the production risk were TSP, NPK, and fungicides.
Thus, the following are suggestions that can be taken into consideration. Farmers should apply an integrated pest and disease control system (PHPT), especially crop rotation and planting simultaneously by planting shallots during the dry season to avoid losses due to high production risks during the rainy season. Farmers can also consider readjusting the use of factors that not only influence production but also influence production risk, namely TSP, NPK, and fungicides.
References
1. Direktorat Jenderal Hortikultura Kementerian Pertanian Data Produksi Sayuran. (On-line), http://hortikultura2.pertanian.go.id/produksi/ sayuran.php accessed 7 Februari 2020 (2018)
2. S. Rosmita, R. Darma, M. Rahmadanih, M. Salam, A. Amrullah, JSEP 16, 1 (2020) 3. Ekaria, M. Muhammad, JIAUT 11, 2 (2018) 4. R. Mutisari, D. Meitasari, JEPA 3, 3 (2019) 5. L.T.W. Astuti, A. Daryanto, Y. Syaukat, H.K. Daryanto, JEPA 3, 4 (2019) 6. Badan Pusat Statistik Provinsi Jawa Tengah, Statistik Pertanian Hortikultura Provinsi
Jawa Tengah 2016 – 2018, Badan Pusat Statistik Provinsi Jawa Tengah, Semarang (2019)
7. Sugiyono, Metode Penelitian Pendidikan: Pendekatan Kuantitatif, Kualitatif, dan R&D. Alfabeta, Bandung (2018)
8. K. Suratiyah, Ilmu Usahatani, Penebar Swadaya, Jakarta (2009) 9. Sofyan, Manajemen Risiko, Edisi Pertama, Graha Ilmu, Yogyakarta (2005) 10. Rosnia, A. Astuti, S. Sudrajat, JIA 3, 2 (2019) 11. J. Widiastuti, Studi Komparatif Usahatani Bawang Merah Lahan Sawah dan Lahan Pasir
di Desa Srigading Kecamatan Sanden Kabupaten Bantul. Skripsi. Fakultas Pertanian, Universitas Muhammadiyah Yogyakarta, Yogyakarta. (2017)
12. Y.R. Hidayat, Paradigma Agribisnis 1, 1 (2018) 13. M.Z. Mazwan, J.T. Ibrahim, W.A.M. Fadlan, ASEJ 20, 3 (2020) 14. V.I. Afrianika, S. Marwanti, I. Khomah, Agriecobis 3,2 (2020) 15. M. Junaidi, S. Hindarti, N. Khoiriyah, SEAGRI 8,2 (2020) 16. M. Sarlan, JIR 8, 2 (2020) 17. Marsary, Z.T. Mariana, A. Kurnain, AVJ 3, 1 (2020) 18. Y. Nopiandi, M.D. Anwar, JHC 2, 2 (2017)
12
E3S Web of Conferences 306, 02030 (2021) https://doi.org/10.1051/e3sconf/2021306020301st ICADAI 2021
12
58,7 percent could be explained by independent variables variations in the model. The remaining 41,3 percent was explained by other variables outside the model. Land area, seedlings, labor, agricultural lime, petroganik, manure, TSP, urea, ZA, KCL, NPK, herbicides, fungicides, and insecticides together had no significant effect on shallot production risk at the 90 percent confidence level.
4 Conclusion The conclusion of this study are: 1) Shallot farming in Adipala Sub-district was profitable, namely by Rp10,834,600.00 per farm revenue, Rp9,999,943.61 per farm cost, Rp834,656.39 per farm income, and 1.06 R/C. 2) The level of shallot farming production risk in Adipala Sub-district was high. 3) The factors that had been shown to significantly influence production were land area, seedlings, labor, agricultural lime, petroganik, manure, TSP, ZA, KCl, NPK, herbicides, and fungicides. 4) The factors that had been shown to significantly influence the production risk were TSP, NPK, and fungicides.
Thus, the following are suggestions that can be taken into consideration. Farmers should apply an integrated pest and disease control system (PHPT), especially crop rotation and planting simultaneously by planting shallots during the dry season to avoid losses due to high production risks during the rainy season. Farmers can also consider readjusting the use of factors that not only influence production but also influence production risk, namely TSP, NPK, and fungicides.
References
1. Direktorat Jenderal Hortikultura Kementerian Pertanian Data Produksi Sayuran. (On-line), http://hortikultura2.pertanian.go.id/produksi/ sayuran.php accessed 7 Februari 2020 (2018)
2. S. Rosmita, R. Darma, M. Rahmadanih, M. Salam, A. Amrullah, JSEP 16, 1 (2020) 3. Ekaria, M. Muhammad, JIAUT 11, 2 (2018) 4. R. Mutisari, D. Meitasari, JEPA 3, 3 (2019) 5. L.T.W. Astuti, A. Daryanto, Y. Syaukat, H.K. Daryanto, JEPA 3, 4 (2019) 6. Badan Pusat Statistik Provinsi Jawa Tengah, Statistik Pertanian Hortikultura Provinsi
Jawa Tengah 2016 – 2018, Badan Pusat Statistik Provinsi Jawa Tengah, Semarang (2019)
7. Sugiyono, Metode Penelitian Pendidikan: Pendekatan Kuantitatif, Kualitatif, dan R&D. Alfabeta, Bandung (2018)
8. K. Suratiyah, Ilmu Usahatani, Penebar Swadaya, Jakarta (2009) 9. Sofyan, Manajemen Risiko, Edisi Pertama, Graha Ilmu, Yogyakarta (2005) 10. Rosnia, A. Astuti, S. Sudrajat, JIA 3, 2 (2019) 11. J. Widiastuti, Studi Komparatif Usahatani Bawang Merah Lahan Sawah dan Lahan Pasir
di Desa Srigading Kecamatan Sanden Kabupaten Bantul. Skripsi. Fakultas Pertanian, Universitas Muhammadiyah Yogyakarta, Yogyakarta. (2017)
12. Y.R. Hidayat, Paradigma Agribisnis 1, 1 (2018) 13. M.Z. Mazwan, J.T. Ibrahim, W.A.M. Fadlan, ASEJ 20, 3 (2020) 14. V.I. Afrianika, S. Marwanti, I. Khomah, Agriecobis 3,2 (2020) 15. M. Junaidi, S. Hindarti, N. Khoiriyah, SEAGRI 8,2 (2020) 16. M. Sarlan, JIR 8, 2 (2020) 17. Marsary, Z.T. Mariana, A. Kurnain, AVJ 3, 1 (2020) 18. Y. Nopiandi, M.D. Anwar, JHC 2, 2 (2017)
13
19. R. Kurniasih, A. Wibowo, S.N.H. Utami, JPP 1, 1 (2017) 20. H. Supariadi, S. Yetti, Yoseva, JOM Faperta 4, 1 (2017) 21. A.M. Sinaga, P. Marbun, A. Lubis, JA 7,2 (2019) 22. Y.H. Putra, D. Susilowati, F. Syakir, SEAGRI 8, 2 (2020)
13
E3S Web of Conferences 306, 02030 (2021) https://doi.org/10.1051/e3sconf/2021306020301st ICADAI 2021


![Synthesis and Characterization of LiFePO[sub 4] and LiTi[sub 0.01]Fe[sub 0.99]PO[sub 4] Cathode Materials](https://static.fdokumen.com/doc/165x107/631dae063dc6529d5d079742/synthesis-and-characterization-of-lifeposub-4-and-litisub-001fesub-099posub.jpg)