Product Layout Improvement by integrated use of Design of Experiments and Discrete Event Simulation
11
Product Layout Improvement by integrated use of Design of Experiments and Discrete Event Simulation Manan Saraiya a , S Narayanan a , S Mukherjee b [email protected] a Department of Mechanical Engineering, VIT University, Vellore – 632014, India b Production and Quantitative Methods Department, IIMA, Ahmedabad – 380015, India Abstract This research is focused on developing and validating a novel integrated approach to solving re-layout problem in a product type layout found at a medium sized Indian submersible pumpset manufacturing company. The approach combines use of design of experiments (DoE) and discrete event simulation to arrive at an optimized facility layout. Critical factors that impact the performance metrics such as output, work in progress, capacity utilization and cost savings were identified by using DoE principles and given factor weights to arrive at a common index. Seven factors which can influence the performance metrics of the system were identified by DoE, such as grouping of sequential work activities into work stations to achieve higher utilization of labor, batch size of bottle neck operation, level of automation of internal transportation and layout alternatives and were studied in depth for suggesting optimal re-layout. Taguchi design was employed to reduce the number of experiments from 128 to 8 by using L8 design. Using Arena, a discrete event simulation software, the As-Is model was simulated in order to verify and validate the accuracy of the model, following which, the 8 models were simulated for a period of 1000 hours or 5 months, each with 25 working days. The data obtained from these simulation runs was used to generate the main effect plots using Minitab statistical software in order to study the interaction of the various factors and arrive at the optimum combination of factors. The best re-layout alternative was identified from the 128 alternatives which achieves a 129% improvement over the as-is model with minimal disturbance to heavy equipment and with bare minimum structural change. 1._Introduction Several heuristic algorithms for designing plant facilities have been topic of research in past few decades. Software packages also exist for solving layout problems, but most of these techniques try to locate the machines in the facility with the sole objective to reduce the distance travelled by components. However, the performance of a facility can also depend on factors such as grouping of sequential activities to reduce idleness and increase labor utilization, selecting appropriate batch size of bottleneck operation, level of automation of internal transportation etc. Thus, there is a need to develop an approach that can study the effect of such factors on the performance of a product/line layout. The key objective of this research work is to effectively and efficiently generate the optimum layout for the particular manufacturing facility in consideration by conducting a series of experiments between the factors that could affect its performance. Pareto analysis was carried out to identify products which contribute to 80% of the annual revenue. Furthermore, seven factors that could affect the performance metrics are chosen and the experiment is conducted with two levels for each factor using Arena simulation software (Kelton, Sadowski, and Sadowski 1998). The responses from the experiment are
-
Upload
independent -
Category
Documents
-
view
1 -
download
0
Transcript of Product Layout Improvement by integrated use of Design of Experiments and Discrete Event Simulation

Product Layout Improvement by integrated use of Design of Experiments and Discrete Event
Simulation
Manan Saraiyaa, S Narayanan
a, S Mukherjee
b
aDepartment of Mechanical Engineering, VIT University, Vellore – 632014, India
bProduction and Quantitative Methods Department, IIMA, Ahmedabad – 380015, India
Abstract
This research is focused on developing and validating a novel integrated approach to solving re-layout
problem in a product type layout found at a medium sized Indian submersible pumpset manufacturing
company. The approach combines use of design of experiments (DoE) and discrete event simulation to
arrive at an optimized facility layout. Critical factors that impact the performance metrics such as output,
work in progress, capacity utilization and cost savings were identified by using DoE principles and given
factor weights to arrive at a common index. Seven factors which can influence the performance metrics of
the system were identified by DoE, such as grouping of sequential work activities into work stations to
achieve higher utilization of labor, batch size of bottle neck operation, level of automation of internal
transportation and layout alternatives and were studied in depth for suggesting optimal re-layout. Taguchi
design was employed to reduce the number of experiments from 128 to 8 by using L8 design. Using
Arena, a discrete event simulation software, the As-Is model was simulated in order to verify
and validate the accuracy of the model, following which, the 8 models were simulated for a period of
1000 hours or 5 months, each with 25 working days. The data obtained from these simulation runs was
used to generate the main effect plots using Minitab statistical software in order to study the interaction of
the various factors and arrive at the optimum combination of factors. The best re-layout alternative was
identified from the 128 alternatives which achieves a 129% improvement over the as-is model with
minimal disturbance to heavy equipment and with bare minimum structural change.
1._Introduction
Several heuristic algorithms for designing plant facilities have been topic of research in past few decades.
Software packages also exist for solving layout problems, but most of these techniques try to locate the
machines in the facility with the sole objective to reduce the distance travelled by components. However,
the performance of a facility can also depend on factors such as grouping of sequential activities to reduce
idleness and increase labor utilization, selecting appropriate batch size of bottleneck operation, level of
automation of internal transportation etc. Thus, there is a need to develop an approach that can study the
effect of such factors on the performance of a product/line layout.
The key objective of this research work is to effectively and efficiently generate the optimum layout for
the particular manufacturing facility in consideration by conducting a series of experiments between the
factors that could affect its performance. Pareto analysis was carried out to identify products which
contribute to 80% of the annual revenue. Furthermore, seven factors that could affect the performance
metrics are chosen and the experiment is conducted with two levels for each factor using Arena
simulation software (Kelton, Sadowski, and Sadowski 1998). The responses from the experiment are
analyzed to measure the main effect and interactions between the factors. Through this analysis, the
significant factors affecting the performance metrics can be identified. On the basis of the responses from
these experiments, optimum layout design can be identified.
This research work is carried out for a submersible pumpset manufacturer. To maintain the anonymity of
the company, its products and process details and the name of the company is not mentioned. However,
the data used for conducting this research work is real and not hypothetical.
Section 2 contains a literature review of the existing techniques related to facility design and comparison
of this research work to other relevant research publications. Section 3 describes the problem statement,
data collection, analysis of data and an overview of the potential factors considered that can affect the
manufacturing system in consideration. Section 4 describes the nature of experimental design and the
methodology followed. Section 5 lists the results of the designed experiment and describes the
performance metrics of best layout out the 128 alternatives. Lastly, conclusions and the scope of
application of this research are discussed.
2. Literature Review
2.1 Facility Layout
Facility Layout design study has always been an area of active research in the industrial engineering field.
The main objective of these studies is to determine a layout which optimizes one or more parameter of
production efficiency. The layout problem is applicable to many environments such as warehouses,
banks, airports, manufacturing systems, etc (K. Balakrishnan, S. Anand and David Kelton, 2000). Each of
the above has its distinct characteristics. In any facility design problem, there are some common
objectives such as, efficient space utilization, minimize work in progress, reduce material handling cost
(S. Nahmias 2005)
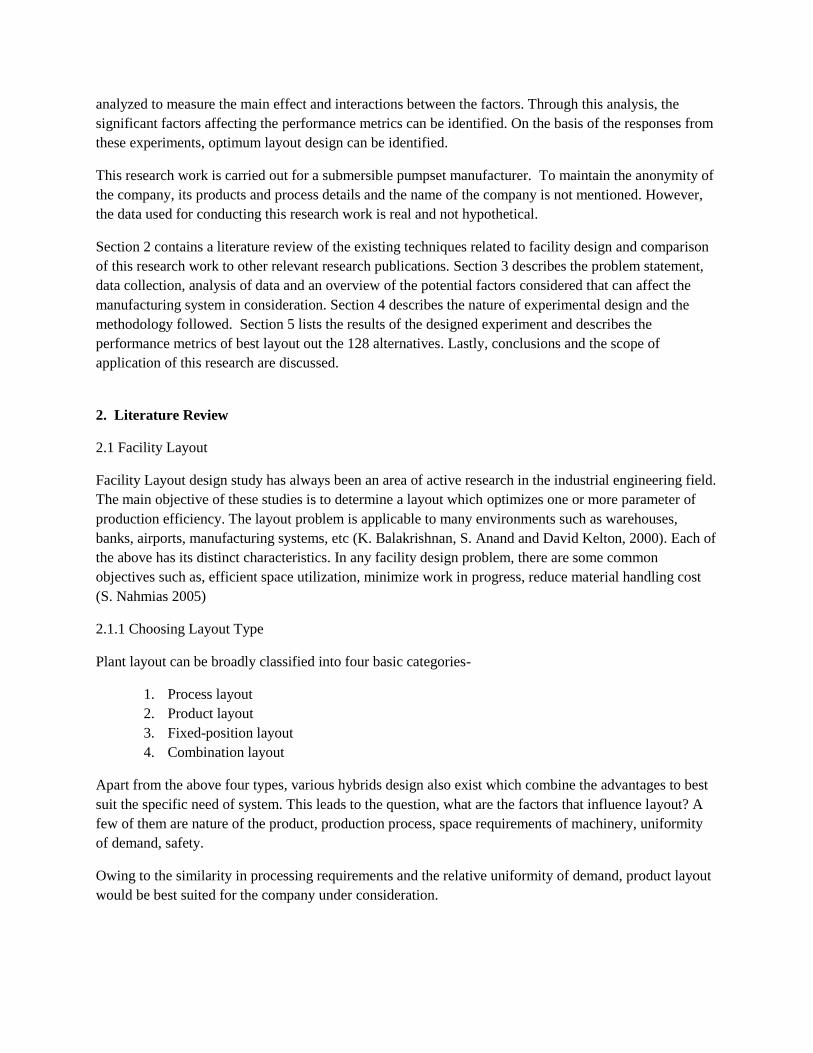
2.1.1 Choosing Layout Type
Plant layout can be broadly classified into four basic categories-
1. Process layout
2. Product layout
3. Fixed-position layout
4. Combination layout
Apart from the above four types, various hybrids design also exist which combine the advantages to best
suit the specific need of system. This leads to the question, what are the factors that influence layout? A
few of them are nature of the product, production process, space requirements of machinery, uniformity
of demand, safety.
Owing to the similarity in processing requirements and the relative uniformity of demand, product layout
would be best suited for the company under consideration.

2.1.2 Product Layout Planning
It is imperative to understand the product and its processing requirements in order to develop an effective
product layout. The following 4 step approach is generally employed to achieve an understanding of the
requirements.
1. Define Processes
2. Develop Precedence Diagram/Flow Diagram
3. Develop Assembly Chart
4. Balance the Assembly Line
2.1.3 Heuristic Algorithms for Assembly Line Balancing
There are several heuristics available for Assembly Line Balancing; the most common ones are listed
below.
1. Longest Operating Time
2. Most Following Tasks
3. Ranked Positional Weight
4. Shortest Operation Time
5. Least Number of Followers
The two major assumptions all the above heuristics make are
1. Constant Operating Time (Deterministic and not Probabilistic)
2. Multi-skilling throughout the line
2.1.4 Limitation of Heuristic Algorithms
Real time manufacturing systems rarely exhibit these two assumptions in combination. Hence, there
arrives a need for a tool that allows for probabilistic time assumptions owing to the varying nature of
product sub categories and segment wise multi-skilling. Simulation is a tool which can handle the
complexity of real time manufacturing systems.
2.2 Modeling and Simulation
2.2.1 Modeling
Modeling is the process of producing a model; a model is a representation of the construction and
working of some system of interest. A model is similar to but simpler than the system it represents. A
good model is a judicious tradeoff between realism and simplicity. An important issue in modeling is
model validity. Model validation techniques include simulating the model under known input conditions
and comparing model output with system output (Anu Maria 1997)

2.2.2 Simulation
A simulation of a system is the operation of a model of the system. The model can be reconfigured and
experimented with; usually, this is impossible, too expensive or impractical to do in the system it
represents. The operation of the model can be studied, and hence, properties concerning the behavior of
the actual system or its subsystem can be inferred. Simulation is used before an existing system is altered
or a new system built, to reduce the chances of failure to meet specifications, to eliminate unforeseen
bottlenecks, to prevent under or over-utilization of resources, and to optimize system performance. (Anu
Maria 1997. There are several Discrete Event Simulation software available, for the purpose of this
research work Rockwell Automation‟s Arena Version 14.0 was employed.
2.3 Design of Experiments (DoE)
Design of Experiments (DOE) techniques enables designers to determine simultaneously the individual
and interactive effects of many factors that could affect the output results in any design. DOE also
provides a full insight of interaction between design elements; therefore, it helps turn any standard design
into a robust one.
Some terms are commonly used in design of experiments. Factors are defined as a controllable
experimental variable, which variation influences the response variable. (Mason 2003) Each factor must
assume some values, defined as levels. The changes occurred on the mean of the values of the response
variable correspond to the effects. Besides the effects caused by the factors, the effects created by the
interaction of the factors can be determined. These interactions correspond to combined effects, where the
effect of each factor depends on the levels of the other factors.
Taguchi technique is step by step approach to identify causal relationship between design factors and
performance, which results in enhanced quality performance into processes and products at development
as well as production level. Taguchi‟s technique used by a numerous industries to optimize their process
design, through identifying independent and dependent variables with the help of identified factors and
factor levels.
2.4 Comparison of Existing Research to Current Research
There are currently three research publications which combine the use of DoE and Simulation software
for studying/improving layout. None of three has focused on Product/Line layout. Furthermore, the Multi
Criteria Decision Analysis technique has also been employed to suggest the optimum layout best on four
output parameters. Thus, this research work aims at adding to the literature of conjoint use of DoE and
Simulation software to facility design study. Table 1 shows comparison between existing research work
and the current research work.
Table 1 : Comparison of research work
Author DoE Simulation
Software
Type of Layout
studied
Multi Criteria
Decision Analysis
R Jayachitra - 2010 ✓ ✓ Process ✗
S Ramakrishnan - 2008 ✓ ✓ Process ✗
K. Balakrishnan - 2000 ✓ ✓ Process ✗
CURRENT RESEARCH ✓ ✓ PRODUCT ✓

3.1 Problem Description
Our objective is to design an efficient layout which reduces work in progress, cost of labored transport,
improves utilization and output. As the building which houses the facility is more than 30 years old, it is
undesirable to break the internal walls which would make the structure weak and lead to additional costs
for restructuring. Furthermore, it is also undesirable to move old heavy equipments such as center lathes
as it may lead to expensive breakdowns in the process. Working within these two major constraints was a
challenge.
3.2 Data Collection and Analysis
Data collection is one of the first steps involved in solving a manufacturing layout problem. The accuracy
and the extent of the data collected reflect the precision of the results. It is important that all the necessary
data required for modeling the layout be collected for the parts that will be manufactured and the
machines that will be used for production during the time horizon for which the layout is planned. So,
proper analysis of the collected data is required before modeling the layout1.
3.2.1 Data Collection
Product models contributing to more than 80% (A type) were selected. Following data was collected for
the study
1. Sales Volumes
2. Part Routing
3. Process Timings and Setup times
4. List of Equipments and respective operating costs
5. Labor requirements at each workstation and cost of labor
3.4 Performance metrics and respective factor weights
Through brainstorming activity with the various stakeholders, the following performance metrics were
selected and given factor weight relative to their criticality as shown in Table 2
Table 2 : Performance metrics and respective factor weights
Sr. No. Output Parameter Factor Weight
1. Output 21 %
2. Work in Progress 25 %
3. Cost Savings 34 %
4. Utilization 20 %
3.5 Selection of Factors
Factors which could affect the performance metrics were identified by brainstorming activity conducted
with the various stakeholders.

Table 3 one shows the factors and their corresponding levels
Table 3 : Factors and their corresponding levels
Factors 1 to 4 - Grouping of Activities signify the activities which collectively have a process time which
is lesser than the bottleneck process time and thus can be grouped together in order to increase labor
utilization and reduce idleness. Eight such activities were identified where the operators were skilled
enough to operate both processes.
Factor 5 - Batch size of Oven. Heat treatment process has a process time requirement of 8 hours.
Currently there is one oven which has a capacity of 60 pieces. It is proposed to install two ovens, each
having a capacity of 30 pieces which would reduce the waiting time.
Factor 6 - Level of Internal Transport Automation. Currently the casual labors are employed to transport
parts in the facility. It is desired to explore the effect of automation such as forklifts and gravity
conveyors can have on the output parameters.
Factor 7 – Layout. The suggested layout will relocate certain sequential operation closer together in order
to reduce wasteful moves.
Sr. No. Factor Level
1 Grouping of activities
a. Rod Cutting, and Crimping
Twisting Pressing
b. Shaft Inserting
G1 - Grouped
UG1 - Ungrouped
2 Grouping of activities
a. Circlip operation and Lapping
b. Rotor Balancing
G2 - Grouped
UG2 - Ungrouped
3 Grouping of activities
a. Stator Stack Making
b. Stator Welding
G3 - Grouped
UG3 - Ungrouped
4 Grouping of activities
a. Stator Tube Insertion and
Broaching
b. Flange Fitting and Welding
G4 - Grouped
UG4 - Ungrouped
5 Batch size of Oven (bottleneck
operation)
30
60
6 Level of Internal Transport
Automation
Manual
Semi-automatic
7 Layout Current
Suggested

4. Experimental Design and Methodology
4.1 Experimental Design
The involvement of the above mentioned factors and their respective levels makes the system to be
studied robust but complex at the same time. In order to study the effect of interactions of each of the
factors, DoE technique is employed. As each factor has 2 level s and there are 7 factors in all, this leads to
a total of 128 combinations/alternatives. Simulating 128 models is a tedious task and thus using Taguchi
design, the responses from the 128 alternatives can studied by simulating 8 models. This significantly
reduces the Simulation effort while maintaining the effectiveness of the experiment.
4.2 Methodology
The following 10 step methodology was followed.
STEP 1. Define Objectives and assigning factor weights based on AHP
STEP 2. Collection real time data
STEP 3. Identification of factors and respective levels
STEP 4. Construction of Simulation Model
STEP 5. Verification Simulation Model
STEP 6. Developing L8 design using Minitab Software
STEP 7. Modeling 8 experiments on Arena Simulation Software
STEP 8. Execution of modeled experiment and collection of output statistics
STEP 9. Statistical Analysis of output data using Minitab Software to generate main effect plots
STEP 10. Analysis and Interpretation of responses from main effect plots to arrive at optimum layout
design

4.3 Application of Taguchi design
Using L8 Taguchi design, the 128 alternatives were confounded to 8 models as listed in table 4 below
Table 4 : L8 Taguchi design
Factor 1 Factor 2 Factor 3 Factor 4 Factor 5 Factor 6 Factor 7
Model 1 G1 G2 G3 G4 30 Manual Current Layout
Model 2 G1 G2 G3 UG4 60 SemiAuto Suggested Layout
Model 3 G1 UG2 UG3 G4 30 SemiAuto Suggested Layout
Model 4 G1 UG2 UG3 UG4 60 Manual Current Layout
Model 5 UG1 G2 UG3 G4 60 Manual Suggested Layout
Model 6 UG1 G2 UG3 UG4 30 SemiAuto Current Layout
Model 7 UG1 UG2 G3 G4 60 SemiAuto Current Layout
Model 8 UG1 UG2 G3 UG4 30 Manual Suggested Layout
4.4 Conducting the Experiments
The above eight experiments along with the „As-Is‟ model were modeled on Arena Simulation Software
version 14.0. A sample model is shown in the appendix. All the process times and transportation times
were also modeled. Each model was run for duration of 1000 hours i.e. 5 months with 25 working days.
5. Analysis and Interpretation
The performance metrics received from the Simulation runs on Arena Simulation Software provided us
with data for each model. Based on the performance metrics and their factor weights as assigned in
section 3.4 the following results were obtained as show in table 5.
Table 5 : Model-wise performance metrics results
Model Output WIP
*Total
Savings
(Labor +
Transport)for
in Rs
Capacity
Utilization
Weighted
Index in
1000
points
M1 7405 683.21 165855 74 1315
M2 7368 786.01 141143 74 1187
M3 7412 721.6 105934 73 1075
M4 7361 791.66 44356 66 799
M5 7332 814.93 80688 63 918
M6 7415 701.89 53242 69 873
M7 7358 798.93 93625 72 999
M8 7404 726.44 40000 68 812

* Total Saving = Labor Cost Savings + Transport Cost Savings
Labor Cost Savings
Labor Cost is Rs 40 per hour so for 1000 hours = 1000*40=Rs 40,000
for each instance of grouping, labor cost reduces by Rs. 40,000
Using Minitab Statistical Software the following Main Effect Plots were generated as seen in figure 1.
Figure 1 : Main Effects Plot for Means
From the above Main Effects Plot for Means we observe that factors 1,2,3 and 4 are highly significant.
This signifies that grouping sequential where skill requirement is not too high will significantly improve
the system. Factors 1,2,3 and 4 have direct impact on the cost savings as the cost of 4 labors i.e. Rs.
1,60,000 will be saved during the 5 months that the simulation was run. We also observe that by reducing
the batch size of the bottleneck process (factor 5) i.e. heat treatment by oven considerably improves the
system. This is because by reducing the batch size by half, the queuing time reduces dramatically and so
does the Work in Progress. Hence, it is suggested to the company that they should use two smaller ovens,
each having half the capacity of the current single large oven. Factor 6, level of automation for internal
transport has a major impact on the system as it causes a twofold effect, firstly, due to automation using
gravity conveyors and a manual forklift the transportation time reduces, secondly, lesser casual labor is
required to carry out transportation and hence leads to cost savings. Although Factor 7, layout option
shows insignificant variation, it is because the machines are located closer together in the suggested
layout that leads to the applicability of grouping at the four stations and also leads to transportation
savings in terms distance and reduces wasteful moves. It is observed that the output for all 8 models
remains almost the same. This is level is kept keeping in mind the balance between demand and supply.
Producing beyond this level is not in the best interest of the company. If need be to increase production,
overtime can allowed or two shifts can be operated.

The responses indicate that the optimum combination is
F1=G1; F2=G2; F3=G3; F4=G4; F5=30; F6=Semi Auto; F7=Suggest
Using Taguchi Technique, the performance metrics for best alternative were calculated and are listed
below in table 6 in comparison with the existing „As-Is‟ layout
Table 6 : Comparison of As Is/existing system to optimum system
Sl.
No
Output
variable
Unit of
Measure
As-is
layout
To be
layout
% of
Improvement
Remarks
1
Weighted
Index in 1000
points
Points
score 605.5 1389 129
Highly Significant
Improvement
2 Output Numbers 7351 7412 1
Purposely kept nearly
constant as the company
faces marketing
challenges to sell beyond
current demand. Can
operate in overtime or in
two shifts if demand
increases,
3 WIP Numbers 806 699 13 Significant Reduction
4
Total Savings
in Rs Rupees -3077 184288
Yearly savings
of Rs 442291.2
per shift
operation
Significant
5
Capacity
Utilization Percentage 62 78 26
Significant
6. Implication
Data presented in table 6 implies that it is possible for the company to reduce labor staffing levels,
improve capacity utilization and reduce Work in Progress without disturbing the output level. One critical
point to be observed is that the above results have been obtained by causing minimal structural change
and without disturbing most heavy equipment like centre lathes.
7. Conclusion and Scope of application
A innovative integrated methodology to solve Product/Line layout problem where there is variability in
processing different models of the same part family leading to variation in processing time and where
multi-skilling is not available at every work station can be accommodated and be solved with high
accuracy.

The same methodology can be applied to any system where optimization is sought. Based on the
stakeholders‟ requirements, appropriate factors must be selected and a Simulation model must be
developed and responses must be analyzed.
References
a) Anu Maria, (1997), “Introduction to Modeling and Simulation”, Proceedings of the 1997 Winter
Simulation Conference
b) K. Balakrishnan, S. Anand and David Kelton, (2000), “Integrating simulation and design of
experiments to identify factors for layout design”, M.Sc. Thesis, University of Cincinnati
c) Mason, R. L., R. F. Gunst, and J. L. Hess, (2003), “Statistical Design and Analysis of Experiments.”
John Wiley & Sons Publication.
d) R. Jayachitra and P. S. S. Prasad, (2010), “Design and selection of facility layout using simulation and
design of experiments”, Indian Journal of Science and Technology, Vol. 3 No. 4
e) S. Nahmias, (2005), “Production and Operations Analysis”, 3rd
Edition, McGraw-Hill, New York. pp.
561- 573
f) S Ramakrishnan, P Tsai, K Srihari and C Foltz, (2008), “Using Design of Experiments and Simulation
Modeling to Study the Facility Layout for a Server Assembly Process”, Proceedings of the 2008
Industrial Engineering Research Conference
g) W. David Kelton, Randall P. Sadowski and Deborah A. Sadowski, (1998), “Simulation with
Arena”, McGraw- Hill
Appendix
Figure 2 depicts the Arena Simulation Model for Model Experiment 1
Figure 2 : Arena Simulation Model for Model Experiment 1