Improving Multi-Floor Facility Layout Problem Using Systematic Layout planning and Simulation
12
B. Papasratorn et al. (Eds.): IAIT 2013, CCIS 409, pp. 58–69, 2013. © Springer International Publishing Switzerland 2013 Improving Multi-Floor Facility Layout Problems Using Systematic Layout Planning and Simulation Seyedeh Sabereh Hosseini * , Seyed Ali Mirzapour, and Kuan Yew Wong Department of Manufacturing and Industrial Engineering, Universiti Teknologi Malaysia, 81310 UTM Skudai, Malaysia {sabere.hosseini,mirzapour.ie}@gmail.com, [email protected] Abstract. To find the effects of applying the systematic layout planning (SLP) method on the multi-floor facility layout (MFFL) of a card and packet production company, simulation was used as an evaluation tool. A detailed study of the facility layout such as its operational processes, flow of materials and activity relationships has been done. Long transfer distance, cross-traffic and cost have been identified as the major problems of the current MFFL. Three alternative layouts were suggested by SLP and each layout was evaluated using simulation. Comparison between the alternative layouts and current layout was also made. The simulation results illustrate that the first alternative layout is the best solution to improve the company’s layout problems. Keywords: Multi-floor facility layout problem, Cross-traffic and long distance, Systematic layout planning, Simulation. 1 Introduction Facility layout problem (FLP) is classified into single floor problem and multi-floor problem. Multi-floor facilities are constructed over a period of years to utilize the area efficiently. Due to travelling time, distance and vertical transporting of materials, multi-floor problems are more complicated than single floor ones. Vertical tranportation is applied in the area which has the limitations of available horizontal space [1]. In recent years, there has been an increasing amount of literature on multi- floor facility layout (MFFL) problems. Lee et al. [2] published a paper in which they applied an improved genetic algorithm to derive solutions for MFFLs having inner structure walls and passages. Krishnan and Jaafari [3] proposed a mimetic algorithm for unequal departmental areas to minimize material handling cost and to maximize closeness rating in MFFL problems. Khaksar-Haghani et al. [4] used an integer linear programming model for designing MFFLs of cellular manufacturing systems to minimize the total costs of intra-cell, inter-cell and inter-floor material handling. Nowadays, factories have to enhance their potential and effectiveness in production to compete against their market rivals. Thus, production processes must be equipped with the ability to decrease cost and increase effectiveness. In FLPs, minimization of * Corresponding author.
Transcript of Improving Multi-Floor Facility Layout Problem Using Systematic Layout planning and Simulation

B. Papasratorn et al. (Eds.): IAIT 2013, CCIS 409, pp. 58–69, 2013. © Springer International Publishing Switzerland 2013
Improving Multi-Floor Facility Layout Problems Using Systematic Layout Planning and Simulation
Seyedeh Sabereh Hosseini*, Seyed Ali Mirzapour, and Kuan Yew Wong
Department of Manufacturing and Industrial Engineering, Universiti Teknologi Malaysia, 81310 UTM Skudai, Malaysia
{sabere.hosseini,mirzapour.ie}@gmail.com, [email protected]
Abstract. To find the effects of applying the systematic layout planning (SLP) method on the multi-floor facility layout (MFFL) of a card and packet production company, simulation was used as an evaluation tool. A detailed study of the facility layout such as its operational processes, flow of materials and activity relationships has been done. Long transfer distance, cross-traffic and cost have been identified as the major problems of the current MFFL. Three alternative layouts were suggested by SLP and each layout was evaluated using simulation. Comparison between the alternative layouts and current layout was also made. The simulation results illustrate that the first alternative layout is the best solution to improve the company’s layout problems.
Keywords: Multi-floor facility layout problem, Cross-traffic and long distance, Systematic layout planning, Simulation.
1 Introduction
Facility layout problem (FLP) is classified into single floor problem and multi-floor problem. Multi-floor facilities are constructed over a period of years to utilize the area efficiently. Due to travelling time, distance and vertical transporting of materials, multi-floor problems are more complicated than single floor ones. Vertical tranportation is applied in the area which has the limitations of available horizontal space [1]. In recent years, there has been an increasing amount of literature on multi-floor facility layout (MFFL) problems. Lee et al. [2] published a paper in which they applied an improved genetic algorithm to derive solutions for MFFLs having inner structure walls and passages. Krishnan and Jaafari [3] proposed a mimetic algorithm for unequal departmental areas to minimize material handling cost and to maximize closeness rating in MFFL problems. Khaksar-Haghani et al. [4] used an integer linear programming model for designing MFFLs of cellular manufacturing systems to minimize the total costs of intra-cell, inter-cell and inter-floor material handling.
Nowadays, factories have to enhance their potential and effectiveness in production to compete against their market rivals. Thus, production processes must be equipped with the ability to decrease cost and increase effectiveness. In FLPs, minimization of
* Corresponding author.

Improving MFFL Problems 59
total cost or total time of material handling is generally used as the objective function, which depends on distance between facilities [5]. Layout improvement procedures can be categorized into two types: construction type and improvement type. Construction methods try to construct a layout basically “from scratch”. Improvement types, on the other hand, aim to develop a layout which would be better than its previous form. Systematic layout planning (SLP) can be used as an improvement technique to find a sensible layout based on material flow analysis and closeness rating [6]. It has been proposed by the American plant design expert, Richard Muther in 1961 [7, 8, 9]. Wiyaratn and Watanapa [7] used the SLP procedure to improve the plant layout of iron manufacturing and decreased the distance of material flow. Zhu and Wang [9] improved the overall layout of log yards using SLP, in which the best layout demonstrated a good process flow and practical significance. In this study, the SLP procedure is applied on a two-floor company to generate a number of layout alternatives. In order to evaluate certain improvement alternatives prior to actual implementation, tools such as computer simulation can be applied [10]. There are many simulation software used for modeling a given process. Adequate modeling and experimentation are important, particularly when financial investment is involved [11]. This paper tries to model and simulate the company’s layout by using the ARENA 13.9 software. After running a simulation model in ARENA, performance measures such as the average transfer time, output and completion time can be seen in the reports generated by the software [12]. Therefore, this study attempts to provide an innovative approach by combining SLP and simulation to improve a MFFL problem and assess the proposed alternatives, respectively.
2 Systematic Layout Planning
The SLP method can be used as a proven tool in providing layout design guidelines which are applied to create layout alternatives. Its procedure has 11 steps which are depicted in Fig. 1.
2.1 Original Facility Layout
The case study is a company of card and packet production which is located in Iran. This company produces three different types of cards and packets. The production processes are done on two floors, ground floor and first floor. The scope of this study is focused on the production operation of the company in which its total production is according to customer orders. This company has designed its plant based on a process layout. It has 20 departments and each has a different task. All these departments are labeled in Table 1.

60 S.S. Hosseini, S.A. Mirzapour, and K.Y. Wong
Fig. 1. SLP procedure [13]
Fig. 2 demonstrates the operation process chart showing the chronological sequence of production. From-to-chart analysis for distance and material flow was done to show the relationships between departments for each process. Particularly, the rectilinear distance between departments was computed and the amount of movements on each route was counted. These data were compiled to obtain the total travelling distances between departments, which were then converted into closeness ratings. Table 2 presents the total travelling distance and closeness rating between departments. A further analysis of the company’s layout reveals certain issues. The long distance between some departments is one of the problems that the company has. Another problem that can be seen in Fig. 3 is the cross-traffic between departments on the first floor. These problems have resulted in a higher production cost and poorer movement of materials.
Table 1. Label of departments

Improving MFFL Problems 61
Fig. 2. Process flow chart Fig. 3. Cross-traffic of the existing layout
Table 2. Total travelling distance and closeness rating

62 S.S. Hosseini, S.A. Mirzapour, and K.Y. Wong
2.2 Relationship Diagram
Graphically, the relationship between each activity is depicted in Fig. 4. The closeness values are defined as A = absolutely important, E = especially important, I = important, O = ordinary closeness, and U = unimportant. It is noted that diagrams such as the activity relationship chart and space relationship diagram are not shown in this paper due to the limited page length. A majority of departments that exist in the company are made from partitions, so the rearrangement cost is not very expensive. Except two or three, all the machines that are located in each department are portable. The location of the elevator is fixed and this is the only way for products to be transported between the two floors. Moreover, departments P and W are fixed departments which are not involved in the production process but their areas or sizes would be considered.
Fig. 4. Relationship diagram
2.3 Developing Layout Alternatives
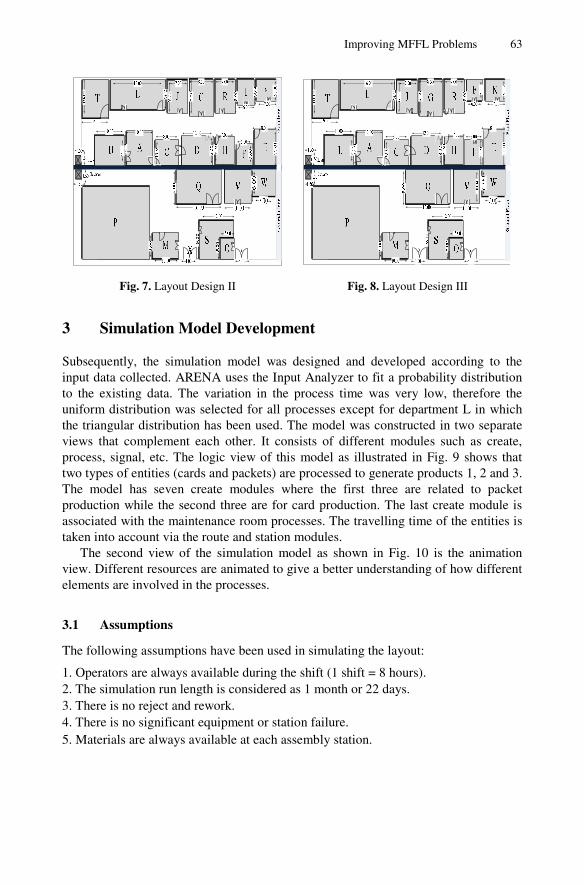
The closeness values between activities were rearranged from the most important one to the least important one. Based on this priority and the SLP method, the alternative facility layouts were developed. The current and three alternative layouts are displayed in Fig. 5, 6, 7 and 8 respectively.
Fig. 5. Current Layout Fig. 6. Layout Design I
Improving MFFL Problems 63
Fig. 7. Layout Design II Fig. 8. Layout Design III
3 Simulation Model Development
Subsequently, the simulation model was designed and developed according to the input data collected. ARENA uses the Input Analyzer to fit a probability distribution to the existing data. The variation in the process time was very low, therefore the uniform distribution was selected for all processes except for department L in which the triangular distribution has been used. The model was constructed in two separate views that complement each other. It consists of different modules such as create, process, signal, etc. The logic view of this model as illustrated in Fig. 9 shows that two types of entities (cards and packets) are processed to generate products 1, 2 and 3. The model has seven create modules where the first three are related to packet production while the second three are for card production. The last create module is associated with the maintenance room processes. The travelling time of the entities is taken into account via the route and station modules.
The second view of the simulation model as shown in Fig. 10 is the animation view. Different resources are animated to give a better understanding of how different elements are involved in the processes.
3.1 Assumptions
The following assumptions have been used in simulating the layout:
1. Operators are always available during the shift (1 shift = 8 hours). 2. The simulation run length is considered as 1 month or 22 days. 3. There is no reject and rework. 4. There is no significant equipment or station failure. 5. Materials are always available at each assembly station.

64 S.S. Hosseini, S.A. Mirzapour, and K.Y. Wong
Fig. 9. The logic view of simulation model
e n v e lo p e b o x 2 p ac k et 2 arri v al
s tore S2
As s i g n 1 4
Route 2 to s tore sSto re s s tati on2
Dec ide 30Tr ue
False
p ro c e s s O2e n v e l o p e c u tt in g Dec ide 31
Tr ue
False
Si gnal 13O2
Route 2 to s tatio ns tation O2
V2route 2 to s tation
e n v e lo p e b o x 3 pac k et 3 arriv al
s tore S3
Ass ig n 1 5
Route 3 to s tore s Store s s tati on3
Dec i de 33Tr ue
False
p ro c e s s O3e n v e l o p e c u tt in g
Dec ide 34Tr ue
False
Si gnal 14
O3Route 3 to s tati on s ta tio n O3
V3ro ute 3 to s tati on
e n v e lo pe b o x 1 pac k et 1 arriv al
s tore S1
Ass ig n 1 8
Route 1 to s tore s Store s s tati on1
Dec i de 48Tr ue
False
p ro ce s s O1e n v e l o p e c u t ti n g Dec id e 49
Tr ue
False
Sig na l 21O1
Route 1 to s tati on s tati on O1V1
route 1 to s ta ti on
Route to O1
Route to O2
Route to O3
0
0
0 0
0
0
0
0
0 0
0
0
0
0
0 0
0
0
Ro u te t o s ta tio n Jp ro c e s s 2p a c k e t m a k i n g
s ta tio n 2p a c k e t m a k i ng Dec id e 3 2
Tr ue
False
s c ra p 5 Di s p o s e 1 5G2
Ro u te t o s ta tio n
p ro c e s s 3p a c k e t m a k i n g
s ta tio n 3p a c k e t m a k i ng Dec id e 3 5
Tr ue
False
s c ra p 6 Di s p o s e 1 7
s to re T 1s ta tio n
Rou te 1 to Sto re Ts t ore T s t a t ion
flo ore le v a to r a t g ro un dpa c k et Ro ut e 1 to
St at ion 1 82at fi rs t flo or
Ro ut e t o e le v a to r
Ro u te 4 t o R
p ro c e s sp a c k e t m a k i n g
s ta tio n 1p a c k e t m a k i ng De c id e 50
Tr ue
False
s c ra p 4 Di s p o s e 2 3
B a tc h 9
s to re T2s t ati on 2
Ro ut e 2 t o Sto re Ts to re T s ta tio n2
fl oo re le v a tor a t grou ndp ac k e t Ro ute 2 to
s to re T3s t ati on 3
Ro ut e 3 t o Sto re Ts to re T s ta tio n3
fl oo re le v a tor a t grou ndp ac k e t Ro ute 3 to
B a tc h 1 1
B a tc h 1 2
Sta tio n 2 31 S e p a ra te 8 Dec id e 7 1
Els e
Ent it y. Ty pe==enve lope 1Ent it y. Ty pe==enve lope 2
0
0
0
0
0
0
0
0
0
0
0
0
0
0
0
0
en tran c e 1
en tran c e 2
en tran c e 3
W e d d in g c a rd s
Cla s s ic c a rd s
Ch r i s tm a s c a rd s
f lo ore le v ator a t g ro u ndRo ute prod u c t1 to
f lo ore le v ator a t g ro u ndRo ute prod u c t2 to
flo o rel ev a to r a t grou n dRo u te p ro du c t3 to
f lo orEle v ator a t f i rs t
f lo orEle v ator a t g ro u nd
a t fi rs t flo o rRo ute to e le va to r
Dec id e 6 9
Else
Ent it y . Type==W edding c ar dsEnt it y . Type==Classic and per s onal car ds
Dec id e 5 7Tr ue
Fals e
De c i de 6 4Tr ue
Fals e
Tr ue
False
Dec id e 6 7
As s ig n 2 4 Ro ute to s ta ti on C
Ro ute 3 to s to re A Sto re A
As s i g n 2 2
As s ig n 2 0
Ro u te to s ta ti on C
Ro u te to s tati on C
Ro ute 2 to s to re A
Ro ute 1 to s to re A
Sto re A
Store A
St o re A
Sto re A
Sto re A
Ro ute to s ta ti on C
Ro ute to s ta tio n C
Rou te to s tat io n C0
0
0
0
0
0
0
0
0
0
0
0
D c utt ing 2D cutting station 2 Decide 14True
False
imprinting stationcards and posterR oute to c lassic
NR oute 2 to scrap
D c utting 3D cutting station 3
Decide 44True
False
imprintingpersonal c ardschristmas and
R oute to
NR oute 3 to scrap
p roc es s 1C pres s in g D ecide 58
True
False
S ignal 24processing 1
pressingstation C for
cutting stationRoute 1 to D
imprintingR oute to W edding
NR oute 1 to scrap
Decide 59True
False
D c utti ng 1D c utting station 1
proc es s 2C pres s i ng
D ecide 65True
False
S ignal 26proces sing 2pressing
station C for
cutting stationR oute 2 to D
proc es s 3C pres s ing D ecide 68
Tr ue
False
S ignal 28processing 3
pressingstation C for
c utting stationR oute 3 to D
0
0
0
0
0
0
0
0
0
0
0 0
0
0
0
0
0
0
tes ti ng 1 in L
MR oute 1 to s tation
fl oorelevator at firs t
R oute 1 back to
in fi rs t floorelevatore station1
ground floorelevatore at
R oute 1 back to
floor s tation 1elevatore ground
stati onR oute 1 to s tore Q
store Q tation 1 Ex i t 1S tation m 1 Re co rd 3 6
Pro c es s te s t ing L D ec ide 62
Else
Ent it y. Type==weddingEnt it y. Type==envelope 1Ent it y. Type==classic and personalEnt it y. Type==envelope 2Ent it y. Type==chr ist m as and post er cardsEnt it y. Type==envelope 3
NR oute 1 to s tation
Ba tc h 13
Proc e ss 8 4
Ba tc h 1 4
Batc h 1 5
Se pa ra te 12
As s ign 2 5
As s i gn 2 6
As s ig n 2 7
0
0
0
0
0
0
0
Cr eat e 19S ta t i o n O
Ro u t e 3 0 4
Ro u t e 3 0 5
Ro u t e 3 0 6
S ta t i o n V
S t a t i o n C
S ta t i o n D
S ta t i o n E
S t a t i o n FRo u t e 3 0 7
S ta t i o n H
R o u te 3 0 8 S t a t i o n I
R o u te 3 0 9S ta t i o n R
Ro u t e 3 1 0 S ta t i o n J
Ro u t e 3 1 1S t a t i o n G
R o u te 3 1 2 S t a t i o n M
S t a t i o n 2 4 5 Ro u t e 3 1 3 S ta t i o n 2 4 6
Ro u t e 3 1 4
Ro u t e 3 1 5
Ro u t e 3 1 6
S t a t i o n URo u t e 3 1 7
Pr ocess UProcess 128
Pr ocess 129
Process 130
Pr ocess 131
Process 132
Pr ocess 133
Pr ocess 134
Pr ocess 135
Process 136
Process 137
Pr ocess 138
Pr ocess 139
De c i d e 7 6
Els e
88
De c i d e 7 7
Els e
9 . 5 29 . 5 29 . 5 29 . 5 29 . 5 29 . 5 29 . 5 29 . 5 29 . 5 2
Dispose 31
Dispose 32
0 0
0
0
0
0
0
0
0
0
0
0
0
0
0
0

Improving MFFL Problems 65
Fig. 10. The animation view of simulation model
3.2 Model Verification
Verification is a process in which the simulation model is ensured to work as expected without any logical error [14]. Debugging was done by running the simulation model. In this case, the model does not have any logical error, since the software did not show any error message during its execution. To check whether the model behaves as expected, the reports produced by the simulation software should be checked. This process is called “sanity check”. In this process, a factor was selected and its value reported by the simulation software was compared with that obtained by manual calculation. In order to verify the simulation model, the average transfer time for each of the products was considered.
The average transfer time of product 1 in the current situation is equal to 20.82 minutes. The result generated by simulation is 21.56 minutes (see Table 3). This indicates that the deviation between these two values is only 3.55%. The average transfer time of product 2 is 20.46 and the simulation result is 20.96, so the deviation is equal to 2.44%. For the last comparison, the average transfer time of product 3 is 19.48 whereas the simulation result is 20.24, so the deviation is 3.90%. This analysis explains that the model is acceptable.
Table 3. The simulation results for average transfer time
Transfer Time Average Half Width Minimum Maximum
Product 1 21.56 (Correlated) 10.0700 21.9000
Product 2 20.96 (Correlated) 10.0400 21.3100
Product 3 20.24 (Correlated) 10.0000 20.7200

66 S.S. Hosseini, S.A. M
3.3 Model Validation
Having verified the simulafinding whether the model rbetween the simulation mowas selected and its value ffrom the simulation modelthe total completion time. simulation results and real-wmodel is valid.
Fig. 11. Co
3.4 Model Experimenta
For this simulation, the runwhich is equal to 10560 mapproximately one day, in normal situation and avoidnumber of replications, 10formula used by Nikakhtarorder to make the experime
3.5 Evaluation
As demonstrated in Tablecompared to other alternati35184.95m to 26244.20m traffics in layout design 1 i
8000
8500
9000
9500
10000
10500
11000
1 2
Tim
e (
Min
ute )
Tim
e (
Min
ute )
Tim
e (
Min
ute )
Mirzapour, and K.Y. Wong
ation model, it is time to validate it. Validation aimsreflects the real-world system [14]. To do so, a compariodel and the real-world process should be done. A facfrom the real-world system was compared to that obtai. The factor selected in this study for model validationAs can be seen in Fig. 11, the differences between
world results are not more than 5%, and this shows that
omparison between simulated and actual values
ation
n length was 1 month with 22 days and 8 hours per minutes. Graphically, the warm-up period was shown to
order to allow the model to get into the steady state od the start-up variation of the system. To calculate 0 initial simulation runs were considered. Based on r et al. [12], the simulation was replicated for 10 timesentation more reliable.
e 4, layout design 1 gives the highest improvementives. The total travelling distance has been decreased fr
or about 25.41% improvement. The number of crois reduced to 24 which represents 36.84% improvemen
3 4 5 6 7 8 9 10
ReplicationsReplicationsReplications
s at ison ctor ined n is the the
day o be of a the the
s in
t as rom oss-
nt in

Improving MFFL Problems 67
comparison to the current layout. The estimation of cost reduction begins with the calculation of the travelling cost per one meter unit. The average payment per one worker is equal to 11 dollars per shift and the total working time per shift is 480 minutes (8 hours × 60 minutes per hour), so the cost of one worker per minute is 0.023 dollars per minute. The travelling time per distance of a worker is obtained by estimation. It is estimated that a worker will move at about 20 m/minute from one point to another. As a result, the travelling cost per meter is obtained by multiplying the cost of one worker per minute with the inverse of the worker’s moving speed. Travelling cost per meter $ 0.023 min 1 min 20 m = $0.00115 m⁄
The estimated cost for each layout alternative is obtained by multiplying the total distance travelled for each layout with the cost coefficient gained from the calculation above. As can be seen in Table 4, layout design 1 saves more money than other layouts; the cost has declined from $40.46 to $30.18. The improvement in total travelling cost is about 25.41%, which indicates that the company can save up to $10.28 per day.
Table 4. The results that have been obtained manually
Total travelling distance (m)
Number of cross-traffics
Total travelling cost ($)
Current Layout 35184.95 38 40.46
Layout Design 1 26244.20 24 30.18
Layout Design 2 29084.15 30 33.45
Layout Design 3 29978.15 27 34.47
Table 5 shows the results that have been obtained by simulation. By comparing
each performance measure of the alternative layouts with the original layout, it can be found that the improvement in average transfer time for products 1, 2 and 3 of layout design 1 is about 21.33%, 25.67% and 17.34% respectively. It is apparent from this table that there is also an improvement in terms of output and completion time of layout design 1 as compared to other alternatives.
In summary, the best alternative of the case study is layout design 1 which has the highest improvement in total travelling distance and cost, cross-traffic, transfer time, output and completion time. Hence, the benefits of implementing this layout design are cost and time savings for both finished products and in-process products.

68 S.S. Hosseini, S.A. Mirzapour, and K.Y. Wong
Table 5. The results that have been obtained by simulation
Average transfer
time (min) Average output
Average completion time (min)
Current Layout
Product 1 Product 2 Product 3
21.56 20.96 20.24
4615 10643
Layout Design 1
Product 1 Product 2 Product 3
16.96 15.58 16.73
5310 10275
Layout Design 2
Product 1 Product 2 Product 3
19.44 18.11 19.17
4950 10472
Layout Design 3
Product 1 Product 2 Product 3
19.96 18.25 19.20
4905 10561
4 Conclusions
In this paper, the SLP procedure has been applied to analyze and rearrange the production layout of a card and packet production company. High total travelling distance, cross-traffic and cost have been identified as the major layout problems of this company. SLP was used as an analysis and synthesis tool to develop different layout alternatives. Three corresponding alternatives with different characteristics and arrangements were generated. These alternatives were evaluated quantitatively to determine the best solution. For this reason, simulation was used as it is a cost-effective and efficient way to assess their effectiveness after the application of the SLP method. The simulation models of the original system and improved layouts were analyzed and compared. Finally, the layout alternative with the best results in terms of distance, time, cost, cross-traffic and output was identified.
References
1. Bozer, Y.A., Meller, R.D., Erlebacher, S.J.: An improvement-type layout algorithm for single and multi-floor facilities. Management Science 40(7), 918–932 (1994)
2. Lee, K., Roh, M., Jeong, H.: An improved genetic algorithm for multi-floor facility layout problems having inner structure walls and passages. Computers & Operations Research 32(4), 879–899 (2005)
3. Krishnan, K.K., Jaafari, A.A.: A mixed integer programming formulation for multi floor layout. African Journal of Business Management 3(10), 616–620 (2009)
4. Khaksar-Haghani, F., Kia, R., Mahdavi, I., Javadian, N., Kazemi, M.: Multi-floor layout design of cellular manufacturing systems. International Journal of Management Science and Engineering Management 6(5), 356–365 (2011)

Improving MFFL Problems 69
5. Kohara, D., Yamamoto, H.: Efficient Algorithms Based on Branch and Bound Methods for Multi Floor Facility Layout Problems. In: Proceedings of the 9th Asia Pacific Industrial Engineering & Management Systems Conference, Bali, Indonesia, pp. 387–395 (2008)
6. Ma, C.P., Yan, Z.G.: Analysis and Optimization of Assembly Workshop System Based on SLP. Logistics Engineering and Management 31, 46–49 (2009)
7. Wiyaratn, W., Watanapa, A.: Improvement Plant Layout Using Systematic Layout Planning (SLP) for Increased Productivity. World Academy of Science, Engineering and Technology 72(36), 269–273 (2010)
8. Wiyaratn, W., Watanapa, A., Kajondecha, P.: Improvement Plant Layout Based on Systematic Layout Planning. IACSIT International Journal of Engineering and Technology 5(1), 76–79 (2013)
9. Zhu, Y., Wang, F.: Study on the General Plane of Log Yards Based on Systematic Layout Planning. In: Proceedings of the International Conference on Information Management, Innovation Management and Industrial Engineering, vol. 3, pp. 92–95 (2009)
10. Sutee, U., Yarlagadda, P.K.: Simulation-Based Comparison of Pull-Push Systems in Motorcycle Assembly Line. Applied Mechanics and Materials 241, 1507–1513 (2013)
11. Mirzapourrezaei, S.A., Lalmazloumian, M., Dargi, A., Wong, K.Y.: Simulation of a Manufacturing Assembly Line Based on WITNESS. In: Proceedings of the Third International Conference on Computational Intelligence, Communication Systems and Networks (CICSyN), Bali, Indonesia, pp. 132–137 (2011)
12. Nikakhtar, A., Wong, K.Y., Zarei, M.H., Memari, A.: Comparison of two simulation software systems for modeling a construction process. In: Proceedings of the Third International Conference on Computational Intelligence, Modelling and Simulation (CIMSim), Langkawi, Malaysia, pp. 200–205 (2011)
13. Tompkins, J.A., White, J.A., Bozer, Y.A., Tanchoco, J.M.A.: Facilities Planning, 4th edn. John Wiley, Hoboken (2010)
14. Al-Sudairi, A.A.: Evaluating the effect of construction process characteristics to the applicability of lean principles. Construction Innovation: Information, Process, Management 7(1), 99–121 (2007)