Processing of fly ash and associated waste materials as ...
256
Processing of fly ash and associated waste materials as cement replacements Nicholas Tombs MEng (Hons) University of Wales, Cardiff Thesis submitted to the University of Wales in candidature for the degree of Doctor of Philosophy April 2011
-
Upload
khangminh22 -
Category
Documents
-
view
0 -
download
0
Transcript of Processing of fly ash and associated waste materials as ...
Processing of fly ash and associated waste materials as
cement replacements
Nicholas Tombs MEng (Hons)
University of Wales, Cardiff
Thesis submitted to the University of Wales in candidature for the degree of Doctor of Philosophy
April 2011
UMI Number: U567112
All rights reserved
INFORMATION TO ALL USERS The quality of this reproduction is dependent upon the quality of the copy submitted.
In the unlikely event that the author did not send a complete manuscript and there are missing pages, these will be noted. Also, if material had to be removed,
a note will indicate the deletion.
Dissertation Publishing
UMI U567112Published by ProQuest LLC 2013. Copyright in the Dissertation held by the Author.
Microform Edition © ProQuest LLC.All rights reserved. This work is protected against
unauthorized copying under Title 17, United States Code.
ProQuest LLC 789 East Eisenhower Parkway
P.O. Box 1346 Ann Arbor, Ml 48106-1346
Acknowledgements
This work is dedicated to Professor Ben Barr who passed away before the completion of this thesis. It was he who started me on this journey and who inspired my interest into the study of concrete. None of this work would have been possible without his foresight and passion for all things concrete.
The research work documented within this thesis has been made possible through the co-operation and partnership of the Knowledge Transfer Partnership (KTP), Minimix concrete, Lafarge cement, and Cardiff University. Through the close relationships formed it has been possible to understand the restrictions and requirements of the cement and concrete industries and target the benefits o f this research accordingly.
The KTP has been invaluable in maintaining the focus of this research to achieve a win - win outcome. The regular reports and presentations made to the KTP representative have proved to be invaluable for the dissemination of information to the various parties and an effective sounding board for their input into the research. For this the author would like to thank Mr Howard Nicolls for the part that he has played as representative of the KTP.
Both Minimix and Lafarge cement have invested time and effort into this research and have supplied me with commercial awareness and inside knowledge of the industries. Specialist test apparatus has been put at my disposal as has technical support when ever needed. The author would like to thank Mr Andrew Jones and Mr Michael Thomas of Minimix concrete and Mr Peter Mallory of Lafarge cement for their input and support
None of this work however, would have been possible without the foresight of Cardiff University who continue to be active in the concrete and cement replacement fields. The author is highly indebted to Professor Keith Williams for his guidance and encouragement throughout the years of this research and also for his valued friendship. Thanks also go to all the technical staff whose support and interest in this research has been inspirational for me.
A big thank you is owed to my mother who has helped in any way possible to allow me to complete this work. I know she is very proud of me.
My deepest gratitude is to my wife Michal for her unwavering understanding during all these years of this work, her selfless love and support throughout, and her encouragement and companionship during the preparation of this thesis. Her understanding of the demands required to complete this work has been inspirational. And finally to my three children Elan (8), Talia (5) and Guy (1) who have encouraged me to ‘get it done’ so as they can get their daddy back.

Declaration
This work has not previously been accepted in substance for any degree and is not concurrently submitted in candidature for any degree.
Signed:. . ........ (Candidate) Date: . . . . . hi.Atf. ,
Statement 1
This thesis is being submitted in partial fulfilment of the requirements for the degree of PhD
Signed: __ T.1- ..1.1.......... (Candidate)
Statement 2
This thesis is the result of my own independent work/investigation, except where otherwise stated. Other sources are acknowledged by explicit references.
Date:.. . ^ * 7 . . 2p.H.....Signed: .<T7T.VrS7T .......................... (Candidate)
Statement 3
I hereby give consent for my thesis, if accepted, to be available for photocopying and for inter-library loan, and for the title and summary to be made available to outside organisations.
Signed:... (Candidate) Date
Abstract
Being one of the most versatile, durable and cost-effective building materials in use today, concrete is the most widely used construction material in the world. In the production of concrete, cement manufacture accounts for the highest cost and is the most energy intensive process from all its constituents.
This research has focused on the requirement to reduce the use of cement within concrete by the use of a partial cement replacement material. An established cement replacement, Ground Granulated Blast Furnace Slag, exists but with changes in steel manufacture this material could soon be short in supply. Industry as a whole produces materials which are routinely sent to landfill as waste, through analysis of these materials, and logging of their properties, a select few may be regarded as possible cement replacement materials. Knowing the required properties of any replacement allows this analysis to be complete within hours and a decision made prior to performing the mixing and testing of concretes containing the replacement.
A fly ash has been subjected to an electrostatic precipitation process (STi) and then to an air swept classification process. The fly ash has been examined in its raw, processed and classified conditions and compared through chemical and physical analysis and through its performance when used in concrete. From this some basic requirements of a cement replacement material were documented. The ash was also inter-ground with clinker using a ball mill to produce a blended CEM II cement to test against the post blend material.
It was found that applying the STi process to the fly ash produced results comparable to those of the GGBS controls at 33% which were bettered when the fly ash was subject to a classification process. No further benefits were to be had from the inter-grinding of the fly ash when used in concrete. Further materials have been introduced to the study to test their properties against that of the fly ash and their performance as partial cement replacements.
A scoring matrix was produced which rated a materials properties by comparing them to the ideal properties of a processed fly ash. This is a novel approach which links the properties of a potential partial cement replacement and its compressive strength as concrete. A review of the physical and chemical properties of the materials used within this research is presented which provide guidelines against which future potential replacements may be compared and assessed.

Table of Contents
PageChapter 1 Introduction
1.1 Scope 1*1
1.2 Ordinary Portland cement 1-2
1.3 Concrete 1-3
1.4 Waste in concrete 1-5
1.5 Aims and objectives 1-6
Chapter 2 Literature review
2.1 Introduction 2-1
2.2 Concrete and its constituents 2-7
2.3 Aggregates 2-13
2.4 Admixtures 2-17
2.5 Cement 2-22
2.6 Chemistry of cement 2-26
2.7 Additives 2-29
2.8 Fly ash 2-39
2.9 Conclusion 2-50
Chapter 3 Experimental methods
3.1 Testing regime and mix details 3-1
3.2 Materials 3-3
3.3 Traditional strength tests 3-10
3.4 Permeability test 3-11
3.5 Physical analysis 3-17
3.6 Chemical analysis 3-22
3.7 Inter-grinding 3-33
v
Chapter 4 Results - fly ashPage
4.1 Introduction 4-1
4.2 The processing of fly ash 4-11
4.3 Results from processing fly ash 4-14
4.4 The effect of processing fly ash 4-26
4.5 Principal identifiable characteristics of a cement 4-48
replacement material
4.6 Conclusions 4-52
Chapter 5 Results - additional candidate cement
replacement materials5.1 Introduction 5-1
5.2 Compressive strength 5-2
5.3 Physical properties 5-6
5.4 Chemical analysis 5-12
5.5 Discussion 5-23
5.6 Conclusions 5-28
Chapter 6 Results - inter-grinding fly ash with clinker
6.1 Introduction 6-1
6.2 Grinding 6-4
6.3 Test results of the inter-ground material 6-5
6.4 Cost analysis 6-16
6.5 Conclusion 6-21
vi
Chapter 7 Conclusions and Recommendations
7.1 Conclusions 7-1
7.2 Recommendations for further study 7-2
Chapter 8 References
8.1 References 8-1
8.2 World wide web references 8-24
8.3 British and European standards 8-28
Chapter 9 Appendices
vii
List of Tables
Chapter 2
Table 2.1
Table 2.2
Table 2.3
Chapter 3
Table 3.1
Table 3.2.
Table 3.3
Table 3.4
Table 3.5
Table 3.6
Table 3.7
Waste management routes
Sieve sizes for the determination of aggregate grading
to BS EN 12620
Ranges of principal minerals in European clinkers
Test report results for CEM I strength class 52.5N as
recorded at the Lafarge laboratory Aberthaw cement
works
Additional Test report results for CEM I as recorded at
the Lafarge laboratory Aberthaw cement works
Compounds in the CEM I used in this research
Grinding time and required fineness of the various
Industrial Materials used
Quantities of CEM I and the four industrial materials
required to produce the required blend, for each
replacement percentage, as a percentage of the total
cementitious content by mass
Selected aggregate properties
Quantities required for the inter-grinding of the fly ash
Page
2-5
2-15
2-26
3-3
3-4
3-4
3-7
3-8
3-8
3-34
viii
Chapter 4
Table 4.1
Table 4.2
Table 4.3
Table 4.4
Table 4.5
Table 4.6
Table 4.7
Table 4.8
Table 4.9
Range of moisture contents of the aggregates as
measured during this research
Component materials required to produce lm3 concrete
as used in this research
GGBS control mix minimum strengths achieved at the
varying cement contents to be used as comparisons to
research materials.
Water / binder ratios required to achieve a 70mm
slump for the various fly ash percentages, GGBS
control and cement contents
Water / binder ratios required to achieve a 70mm
slump for the various fly ash percentages, GGBS
control and cement contents
Permeability results of blended 27% fly ash / 73%
OPCRM at various cement contents as compared to the
100% OPCRM and blended 50% GGBS / 50%OPCRM
controls
Water / binder ratios required to achieve a 70mm
slump
Results from the Leco analysis for sulphur and carbon
and the converted values to SO3 and SO4 from the
calculation in Table 4.9
Calculation of SO3 and SO4 quantity within the fly ash
samples
Page
4-3
4-4
4-9
4-18
4-22
4-24
4-28
4-33
4-34
ix

Table 4.10
Table 4.11
Table 4.12
Table 4.13
Table 4.14
Table 4.15
Chapter 5
Table 5.1
Table 5.2
Table 5.3
Table 5.4
Table 5.5
Table 5.6
Requirements of BS EN 197-1 regarding sulphate
limits
Carbon content (LOI) of the OPCRM and cement
replacement materials used
The chemical analysis results from the ICP analysis of
Aberthaw fly ash and the control materials
Fly ash analysis results and the requirements of BS EN
450
Measure of permeability at 28 days for the fly ash in its
three states of raw, processed and classified at 33%
replacement with 67% OPCRM as compared to 100%
OPCRM
Composite cement constituents
Water binder ratios of the various blended cements at
increasing replacement levels
Specific gravity of the controls and the researched
materials
Results for sulphur and carbon analysis - Leco
Carbon content (LOI) of the replacement materials
Nature of composite cement constituents (Moir 2003)
as compared to the chemical analysis of SS and MSW
Nature of composite cement constituents (Moir 2003)
as compared to the chemical analysis of FA2 and IM
Page
4-35
4-36
4-38
4-43
4-45
4-50
5-4
5-5
5-10
5-11
5-12
5-13
x
Table 5.7
Chapter 6
Table 6.1
Table 6.2
Table 6.3
Table 6.4
Table 6.5
Table 6.6
Table 6.7
Performance ratings of the candidate materials using a
scoring system as an indictor to the materials
effectiveness as a cement replacement based on results
from the analysis
Compressive strength comparison between the CEM I
control and the laboratory ground CEM I
Fineness of the cements at 33% replacement using the
Blaine test
Compressive strength comparison between CEM I at
100% and a blended GGBS 50% CEM I 50% controls
with the inter-ground fly ash at 33% fly ash 67%
CEM I
Compressive strength of mortar prisms on the CEM I
controls the post blend fly ash and the inter-ground fly
ash. Blends tested are 33% fly ash 67% CEM I
Water / binder comparison between concrete mixes
using CEM I controls and the inter-ground fly ash at
33% fly ash 67% CEM I
Water / binder ratios comparison between concrete
mixes using inter-ground and post blend fly ash
Permeability results of the inter-ground fly ash in its
three states at 33% replacement
Page
5-25
6-6
6-9
6-10
6-12
6-13
6-13
6-16
xi

Table 6.8 Results summary sheet one as output from the costanalysis showing input data and collated results
Table 6.9 Results summary sheet two as output from the costanalysis examining the cost implications of various mix designs
6-19
6-20
xii
List of Figures
Chapter 2
Figure 2.1
Figure 2.2
Figure 2.3
Figure 2.4
Figure 2.5
Figure 2.6
Chapter 3
Figure 3.1
Figure 3.2
Figure 3.3
Figure 3.4
Figure 3.5
UK waste annual arisings by sector 2004
Forms of slump as recognised by the European
standards
The cement manufacturing process
Typical pre-heater kiln processing system
Resource use within the construction industry
Fuel sources for electricity generation
Pressure cell 105mm deep x 145mm Diameter into
which a concrete sample is placed for
permeability testing
Schematic of apparatus for testing permeability of
concrete using nitrogen gas
Permeability test in progress
Typical graph showing the permeability parameters of
pressure against time showing a half time of 48
minutes and area under the pressure-time curve
Typical graph of log pressure against time, the gradient
of which is m
Page
2-3
2-8
2-24
2-25
2-30
2-40
3-12
3-13
3-14
3-15
3-16
xiii
Figure 3.6
Figure 3.7
Figure 3.8
Figure 3.9
Figure 3.10
Figure 3.11
Figure 3.12
Figure 3.13
Figure 3.14
Figure 3.15
Figure 3.16
Figure 3.17
Page
Martin’s exponential decay curves for different values 3-17
of m
Image of a) the Jeol JSM 6300 scanning electron 3-19
microscope b) the display unit as used in this research
Image of the Leco SC-144DR furnace as used in this 3-23
research
Image of the Phillips X-Ray defractometer with a 3-23
PW3830 Generator as used in this research
Image showing the effect of destructive interference as 3-24
compared to constructive interference
Image showing the diffracted rays forming a regular 3-25
array of scatters on the detector
Major components and layout of a typical ICP-OES 3-26
instrument
Image showing the concentric nebulizer used for ICP- 3-27
OES
Image showing the spray chamber which filters the 3-27
aerosol from the nebulizer
Image showing the torch assembly used for ICP-OES 3-28
Image showing the Tecnai 12 TEM as used in this 3-32
research
Image of the Ball mill used for the grinding of 3-34
materials to produce CEM I
xiv

Figure 3.18
Chapter 4
Figure 4.1
Figure 4.2
Figure 4.3
Figure 4.4
Figure 4.5
Figure 4.6
Figure 4.7
Determination of grinding time from plotting the
Blaine fineness of the cement to the time in the ball
mill
Variation in compressive strengths between three
identical concretes as a function of time curing -
cement content 300kg/m3
The 28 day compression strength results for the GGBS
control mix showing the variation in strength through
identical mix designs at different cement contents
The 28 day compression strength results for the GGBS
control mix showing the compressive strength of mix
designs using varying cement contents
Schematic of the separation process
Separator in use at the Longannet power station in
Scotland
Images taken at the STi processing plant Longannet in
Scotland a) computer controlled process showing feed
rate, weights, delivery routes and final storage location,
b) sampling of the final processed fly ash taken from
the separator for analysis
Image comparing the three products within the
separation process, the processed ash, the
raw feed ash and the waste, high carbon, ash.
Page
3-35
4-6
4-8
4-9
4-11
4-13
4-14
4-15
xv
Figure 4.8
Figure 4.9
Figure 4.10
Figure 4.11
Figure 4.12
Figure 4.13
Figure 4.14
28 day compressive strength results using STI
processed fly ash at 27% fly ash to 73%
OPCRM compared to a blended 50% GGBS 50%
OPCRM
28 day compressive strength results comparing the
processed fly ash blended with OPCRM at varying
levels to the GGBS controls
Permeability results of a blended GGBS / OPC
concrete using 250kg/m3 cement content at
various replacement levels. Measure of permeability is
taken at 5 bar pressure
Permeability results of a blended fly ash / OPC
concrete using 250kg/m3 cement content at
various replacement levels. Measure of permeability is
taken at 5 bar pressure
Permeability results of 27% fly ash at cement contents
of 200kg/m2, 250kg/m2 and 300kg/m2 as compared to
the maximum and minimum values for the CEM I and
GGBS controls.
Permeability results of 27% fly ash at cement contents
of 350kg/m2, 400kg/m2 and 450kg/m2 as compared to
the maximum and minimum values for the CEM 1 and
GGBS controls.
Fly ash samples from the separation process (left to
right) processed, raw and waste
Page
4-16
4-17
4-20
4-22
4-23
4-23
4-26
xvi
Figure 4.15
Figure 4.16
Figure 4.17
Figure 4.18
Figure 4.19
Figure 4.20
Figure 4.21
Figure 4.22
Figure 4.23
28 day compressive strength results of concrete using
various blended 67% OPCRM with
classified, processed and raw fly ash as compared to
GGBS 50% / OPCRM 50%
Particle size distribution results from the Malvern
Mastersizer X for the raw, processed and classified fly
ash with the GGBS and OPCRM as controls. The 45
micron measure is shown in red
SEM images of the control materials a) OPCRM, b)
GGBS
SEM images of the fly ash a) classified, b) processed,
c) raw, d) waste
Image showing the various size groups used in the
elemental analysis
TEM analyses of the (a) large particles and (b) medium
particles within the raw fly ash
TEM analyses of the (a) raw small spherical particles
and (b) Waste material particles
TEM analysis of (a) the irregular particles in the raw
ash and (b) an image of a non- spherical carbon particle
TEM analyses on the raw fly ash showing (a) large
spherical particle containing carbon and (b) a non-
spherical particle not containing carbon
Page
4-27
4-30
4-31
4-32
4-39
4-40
4-41
4-42
4-43
xvii
Figure 4.24
Figure 4.25
Figure 4.26
Figure 4.27
Chapter 5
Figure 5.1
Figure5.2
Figure 5.3
Figure 5.4
Figure 5.5
Figure 5.6
Results from the relative permeability test on 300kg/m
cement content concrete 33% fly ash replacement with
67% OPCRM
Results from the relative permeability test on 450kg/m
cement content concrete 33% fly ash replacement with
67% OPCRM
Target grading for a potential cement replacement
SEM images a) Idealised particle shape and b) GGBS
Compressive strength comparisons at 28 days of the
replacement materials blended with OPCRM at various
percentages and a blended mix 50% GGBS 50%
OPCRM
Particle grading results of the OPCRM, GGBS and
processed fly ash as compared the SS, MSW, FA2 and
IM cement replacement material
Material particle grading focusing on the finer
materials of OPC, processed fly ash and the IM
material
SEM images showing the particle shapes of the
replacement materials a) SS, b) MSW, c) FA2, and d)
IM
TEM particle analyses on a large SS particle
TEM particle analyses on a medium SS particle
xviii
Page
Figure 5.7 TEM particle analyses on a small SS particle 5-16
Figure 5.8 TEM particle analyses on a large MSW particle 5-17
Figure 5.9 TEM particle analyses on a medium MSW particle 5-17
Figure 5.10 TEM particle analyses on a small MSW particle 5-18
Figure 5.11 TEM particle analyses on a large FA2 particle 5-19
Figure 5.12 TEM particle analyses on a medium FA2 particle 5-19
Figure 5.13 TEM particle analyses on a small FA2 particle 5-20
Figure 5.14 TEM particle analyses on a large IM particle 5-21
Figure 5.15 TEM particle analyses on a medium IM particle 5-21
Figure 5.16 TEM particle analyses on a small IM particle 5-22
Chapter 6
Figure 6.1 Schematic diagram of a closed-circuit grinding mill 6-2
Figure 6.2 Photographs taken at Aberthaw cement works showing 6-2
(a) the ball mill grinder, (b) the inside of a replacement
ball mill
Figure 6.3 Graph plotting the estimation of grinding time required 6-4
to achieve a Blaine specific surface area as compared to
that achieved at the cement works
Figure 6.4 Grading comparison between CEM I produced at the 6-6
cement works and the CEM I ground using the ball mill
within the laboratory
Figure 6.5 Grading of inter-ground CEM II cement at 27% fly ash 6-8
replacement 73% OPCRM
xix

Figure 6.6
Figure 6.7
Figure 6.8
Figure 6.9
Page
Grading of inter-ground CEM II cement at 33% fly ash 6-8
replacement 67% OPCRM
Comparison between compression strength of inter- 6-11
ground and post blend concrete at 33% fly ash
replacement 67% CEM I
Permeability results for the CEM I as compared to the 6-14
inter-ground fly ash at 300kg/m cement content and
33% replacement 67% CEM I
Permeability results for the CEM I as compared to the 6-15
inter-ground fly ash at 450kg/m3 cement content and
33% replacement 67% CEM I
xx

Chapter 1 - Introduction
1. Introduction
1.1 Scope
1.2 Ordinary Portland cement
1.3 Concrete
1.4 Waste in concrete
1.5 Aims and objectives
1.1 Scope
With a plethora of legislation being introduced within the UK and the European
Union, restricting the disposal of industrial waste, coupled with the increased costs
associated with waste disposal, outlets are now being sought to re-use waste rather
than landfill it. With the introduction of the EC Directive on the Landfill of Waste
1999/31/EC [1999/31/EC,1999], stricter controls aimed at improving the standards of
landfilling through setting specific requirements for the design, operation and
aftercare of landfills, and for the types of waste that can be accepted in landfills have
been introduced.
The past ten years have shown an increasing emphasis on sustainable
development within industry throughout the UK. By the ratification of the Kyoto
protocol, industrialised countries have targets set to lower overall emissions of
greenhouse gases. In the UK a climate change levy has been introduced which taxes
the use of energy in industry, commerce and the public sector, with offsetting cuts in
employers National Insurance Contributions and additional support for energy
efficient schemes and renewable sources of energy. The introduction of the EC
Directive on the Landfill of Wastes 1999/31/EC requires the appropriate treatment of
waste streams prior to landfill to reduce their hazard, volume and facilitate handling
1-1

Chapter 1 - Introduction
and/or enhance recovery (Davies, 2003). Industry is being encouraged to minimise its
waste and is being penalised through landfill taxes for not doing so.
1.2 Ordinary Portland cement
In the production of concrete, cement manufacture accounts for the highest cost
and is the most energy intensive process from all its constituents. The production of
Ordinary Portland cement (OPC) is environmentally sensitive in two areas, first the
mining of the materials and second its manufacture. To make 1 tonne of cement
approximately 1.7 tonne of non-fuel raw materials are used. The bulk of this, around
85%, is limestone or similar rocks which when blended with clay or shale and other
minor constituents achieve the correct chemical balance to produce cement. The
output of an individual quarry may not be substantial, as compared to the output from
mining certain other minerals, however, the existence of thousands o f cement plants
worldwide ensures the cumulative output of material is significant. Current world
cement output requires almost 3 Gt/yr o f non-fuel raw materials; associated fuel
consumption is roughly 200 Mt/yr in straight mass terms (i.e., not on a common fuel
basis), or about 0.15 to 0.2t fuel/t clinker. The concrete and mortars (about 13 to 14
Gt/yr) incorporating this cement require a total o f about 15 Gt/yr of raw materials,
mostly aggregates (Van Oss 2002).
The production of OPC contributes significantly to CO2 emissions with a range of
figures being quoted in the literature of between 0.74 tonnes CO2 / tonne cement to as
high as 1.3 tonne (Harrison 2005). It is however, generally accepted that for every
tonne of Portland cement produced, approximately one ton of CO2 is released into the
atmosphere (Bouzoubaa et al., 1997). This equates to 5% of total global emissions
originating from cement production (Hendricks et al., 2004).
Cement manufacture creates CO2 in two ways: by the conversion of calcium
carbonate to calcium oxide inside the kilns, and by burning large quantities of fossil
fuels to heat the kilns to the 1450°C necessary. Previous estimates for CO2 emissions
from cement production have concentrated only on the former source. The UN's
Intergovernmental Panel on Climate Change puts the industry's total contribution to
1-2
Chapter 1 - Introduction
CO2 emissions at 2.4 per cent of global emissions; the Carbon Dioxide Information
Analysis Centre at the Oak Ridge National Laboratory in Tennessee quotes 2.6 per
cent (Pearce 1997).
As part o f the Kyoto agreement, European countries have agreed to an 8%
reduction in Greenhouse Gas emissions, based on 1990 levels, by the year 2012. The
cement manufacturing industry is one where quotas have been imposed by the
European Union (EU) to cap hazardous emissions. Failure to meet the obligations of
the agreement will result in heavy fines. However, improving on these limits can
provide financial benefits through carbon trading (Defra, 2007). Already the industry
has demonstrated its ability to improve its climate change performance. Between 2001
and 2004 an improvement in energy consumption of 21.2% had been achieved and is
well on its way to the 2010 target of 26.8% reduction (British Cement Association
2005).
1.3 Concrete
From material extraction, processing, component assembly, transport and
construction, to maintenance and disposal, construction products have an
environmental impact over their entire life cycle. Some of the key sustainable issues
within the industry at present are (BRE 2007):
o 10% of the UK CO2 emissions arise from the production and use of building
materials.
o Each year the UK construction industry uses 6 tonnes of building materials per
head o f population.
o Materials production and construction accounts for an estimated 122 million
tonnes o f waste, or 30% of the total arising in the UK.
The* environmental impact of buildings and infrastructures is significantly large
compared with other industries and concrete makes up a major part of this impact
(Katz, 2006).
1-3
Chapter 1 - Introduction
Being one o f the most versatile, durable and cost-effective building materials in
use today concrete is the most widely used construction material in the world, only
fresh water is consumed in larger amounts and this is generally because it is wasted
(Aitcen, 2000). Approximately 100 million tonnes of concrete is used annually in the
UK with concrete sales amounting to £5 billion. Concrete has the obvious
environmental impacts embodied in the quarrying of raw materials for aggregates; the
energy used in its production and associated carbon dioxide (CO2) emissions. As with
all products it will eventually reach the end of its useful life and require recycling too.
Many are actively involved in activities to reduce the environmental impacts of the
production o f concrete, including (Concrete centre, 2007):
o Reduction in the amount of polluting and 'greenhouse' gases emitted during
the creation o f concrete
o More efficient use of resources in concrete production, including re-used
materials and byproducts from other industrial processes
o Better re-use of waste and other secondary materials such as water, aggregate,
fuel or other cementitious material
o Lower reliance on quarrying material or sending construction and demolition
waste to landfill by maximising the use o f recycled material where practical
o Development of low-energy, long-lasting yet flexible buildings and structures;
o Exploiting the thermal mass of concrete in a structure to reduce energy
demand over the lifetime of a building
o Environmental restoration after industrial activity has ceased.
1-4
Chapter 1 - Introduction
1.4 Waste in concrete
Traditionally the UK has been heavily reliant on landfill: of a total 23.6 million
tonnes of (kerbside collected) municipal waste produced in 2009/10, 47% (about 11
million tonnes) was land filled, 41% was recycled or composted and 11% was
incinerated with energy recovery. Compared with 2008-09, where 27.3 million tonnes
of municipal waste was collected by local authorities, 50.3% was sent to landfill;
36.9% was recycled or composted and 12.2% was incinerated for energy recovery
(Deffa 2011), it can be seen that municipal waste is slowly on the decrease (wwwl .1).
For every tonne o f household waste we produce, commercial, industrial and
construction businesses produce another six tonnes. Nearly one tonne is produced by
services (shops, banks and insurance companies); a further two tonnes by the
industries which make the goods we buy; and three tonnes are produced by the
construction industry (Environment agency 2007).
Announcing the review of the Governments waste policy at the Future Source
conference, Environment Secretary Caroline Spelman said:
“There is an economic and environmental urgency to developing the right waste
strategy. We have been slowly moving in the right direction with recycling rates. The
direction of travel is right - it’s the pace that’s the problem. We need to go faster and
we need to go further.” She continued “Finding ways not just to use less energy, water
and natural resources - but by using the waste we do produce as the valuable raw
material it actually is” (wwwl .2).
It would appear that the Government have realised that waste and industrial
by-products should be regarded as potential assets and not merely discarded as a
waste material. With suitable treatment a waste product may be improved and
reclassified as a useable resource or valuable commodity. Now that businesses are
being asked to take greater responsibility for the environmental impact of their
1-5
Chapter 1 - Introduction
products and operations, industry is looking into the options available for the safe
disposal of their waste.
Concrete plays an important role in the beneficial use of these materials in
construction. Although some of these materials may be beneficially incorporated in
concrete, both as part of the cementitious binder phase or as aggregate, it is important
to realise that not all waste materials are suitable for such use (Environmental
Working Party 2003).
1.5 Aim and objectives
This thesis examines how waste material can be utilised as a cement replacement
in the making o f concrete. It looks at materials already established and accepted in
industry and what elements a new waste material would have to possess, both
physical and chemical, in order for it to be a suitable cement replacement. This study
aims to be an initial reference point in the selection of, or rejection of, a waste
material for use as a cement replacement.
This research is being run in conjunction with an industrial partner, Minimix
Concrete, with whom the Author has maintained a good relationship. The partnership
has shared results and knowledge gained from the industry and results from this
research work. The use o f waste materials within concrete was the link between both
parties the outcome being to introduce a new material (materials) as a cement
replacement into the standard concrete recipes used at the plant. Consideration for
concrete quality, strength and durability, was paramount but ultimately providing an
economic incentive to use the material was also required. The quality of the concretes
produced is discussed within this thesis whilst the financial aspect was examined
using the “Cost Analysis Model” which can be seen in Appendix 4. This model was
created by the Author to examine the effect a change of material quantity and / or cost
would have had on the sales figures at Minimix Concrete during the previous 12
months.
The inter-grinding of the fly ash with clinker and the use of admixtures within the
blended cement was carried out in collaboration with Lafarge cement works,
1-6

Chapter 1 - Introduction
Aberthaw. The Author worked within the technical department at the works carrying
out much of the analysis and reporting back with results and recommendations to the
Lafarge cement management team.
1-7

Chapter 2 - Literature review
2. Literature review
2.1 Introduction
2.2 Concrete and its constituents
2.3 Aggregates
2.4 Admixtures
2.5 Cement
2.6 Chemistry o f cement
2.7 Additives
2.8 Fly ash
2.9 Conclusion
2.1 Introduction
As presented in the introduction to this thesis, in today’s industry there is
considerable pressure to re-use and recycle materials rather than send them to landfill.
With an increased public awareness as to the environmental damage being caused by
industry, political parties both locally and worldwide now place targets for CO2
reduction and energy efficiency high on the political agenda.
The U.K. government is consulting on targets to reduce carbon emissions by 80
per cent, following reactions by campaigners who warned that the 60 per cent target
set out in the climate change bill was not ambitious enough to stem climate change
(www2.1). The fact that the government is prepared to rethink its objectives in line
with views brought about by campaigners indicates the importance of this policy. In
view of these pressures on the concrete industry a review of waste and emissions is
presented before consideration of issues related to concrete.
2-1
Chapter 2 - Literature review
Waste in the UK
Waste is an ever growing problem and has been causing increasing problems since
the industrial revolution and population explosion in the nineteenth century. This is
due to the link between waste generation and economic growth, which is further
exacerbated by population growth which further increases waste generation (Owen
2007).
Landfilling is the most common form of waste disposal across Europe. However,
differences in technical standards and operating practices between member states have
led to numerous incidents of gross land and water pollution. In response, the
European Commission has introduced a number of measures to regulate landfill
disposal and to establish a common framework that promotes waste prevention,
minimisation, re-use, recycling and recovery as alternatives to landfill disposal. The
EC Landfill Directive introduces progressive measures to further prevent or reduce as
far as possible the negative effects o f landfilling waste on the environment and on
human health (www2 .1 .1 ).
In 2004 the UK produced about 335 million tonnes of waste. Figure 2.1 below,
shows the estimated proportion produced by each sector annually. This includes
nearly 1 0 0 million tonnes of minerals waste from mining and quarrying, which is not
subject to control under the EU Waste Framework Directive, and 220 million tonnes
of controlled wastes from households, commerce and industry (including construction
and demolition wastes) (www2 .2 ).
Household waste includes household bin waste and also waste from civic amenity
sites, other household collections and recycling sites. Although the classification of
wastes contained within each sector is not specific it can be said that all wastes arising
from sources other than households should be deemed as industrial or commercial
waste as a charge is levied for their disposal. It can be seen from Figure 2.1 that
household waste represents about 9 per cent of the total waste produced and therefore
focus should be placed on industry in a bid to significantly reduce waste.
2-2

Chapter 2 - Literature review
<1%
| Agriculture (inc.Frshmgi
Mining and Quarrying
■ Sawagd sludge
■ Dredged materials
Household
| Commeroa
| Industrial
Construction and Demolition
12%
Total = 335 million tonnes
Figure 2.1 UK waste annual arisings by sector 2004
(Source DEFRA www2.2)
The Environment Agency carried out a survey of some 4,500 industrial and
commercial businesses in 2002/3. The information collected for each business
included the type of waste, quantity of waste, the waste form, waste disposal or
recovery method. Data collection was limited to controlled waste and relates to
England only. The estimate of industrial waste includes power station ash, blast
furnace and steel slag.
In 2002/3, Industrial and Commercial waste in England totalled 6 8 million tonnes.
Of this about 38 million tonnes was attributable to industry and 30 million to
commerce. The individual sector that produced the most waste was the retail sector,
which generated nearly 13 million tonnes of waste. This was followed by food, drink
and tobacco manufacturing, and the professional services and other businesses, both
producing more than 7 million tonnes, and the coke, oil, gas, electricity and water
industries at just over 6 million tonnes (www2.3).
2-3

Chapter 2 - Literature review
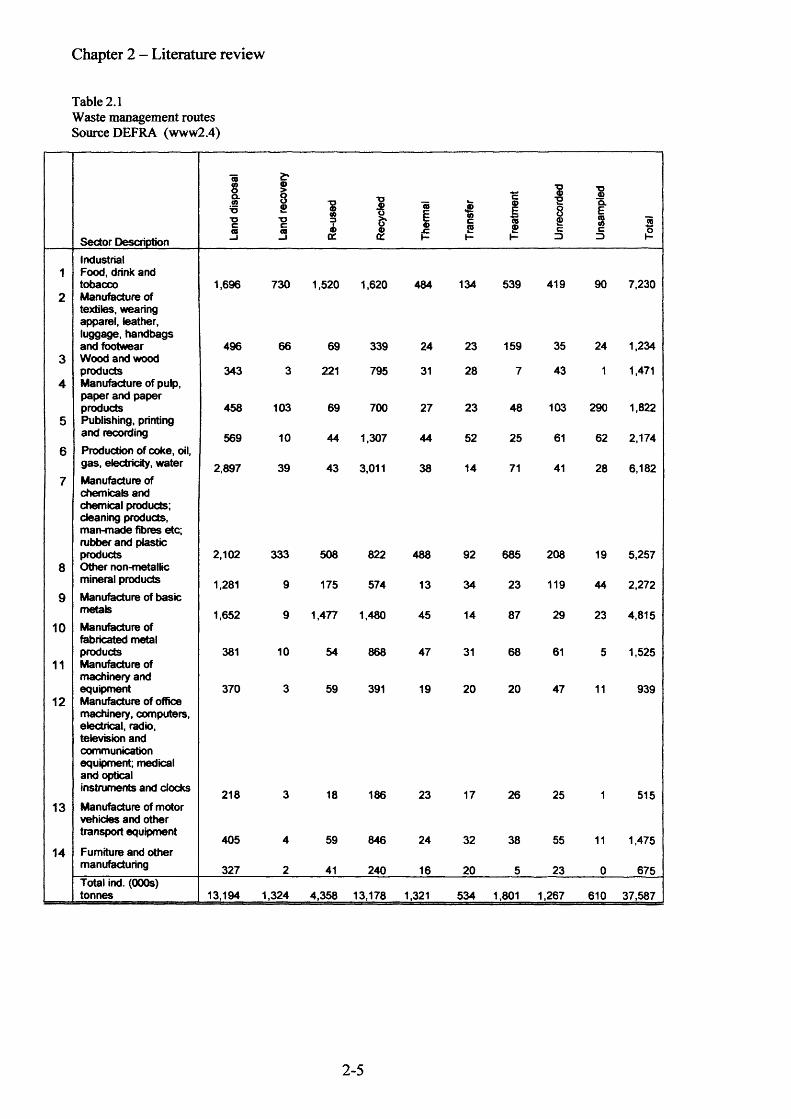
Table 2.1 shows the waste management routes employed by the various industrial
and commercial sectors. The survey was designed to exclude wastes reprocessed on
site and effluent which leaves the site via the sewer; effluent or other liquid or sludge
waste removed by tanker for subsequent treatment or disposal would be included. In
2002/3, for the first time, recycling and reuse had overtaken landfill as the most
common method of waste management. Overall 44 per cent was sent to landfill and
45 per cent recycled. Industrial companies are more inclined to recycle or re-use their
waste (around 50 per cent) than are commercial companies (around 40 per cent)
(www2.4).
It can be seen from this that whilst perhaps not so prevalent in the public
conscience, recycling and re-use o f industrial wastes is already being undertaken to a
much higher degree than that o f municipal waste. This is, in the large, forced by
government policy through the introduction o f a landfill tax which penalises
companies financially for landfilling waste materials. Landfill Tax is a tax on the
disposal o f waste. It aims to encourage waste producers to produce less waste, recover
more value from waste, for example through recycling or composting and to use more
environmentally friendly methods of waste disposal. At present landfill tax stands at
£48.00 per tonne; however, in a push to achieve future environmental targets this
figure is set to increase by £8.00 each year rising to £80 per tonne in 2014 / 15
(www2.5).
2-4
Chapter 2 - Literature review
Table 2.1Waste management routes Source DEFRA (www2.4)
a S'tooa.toS■oc<0
©>8©-oc<0
3to3I
n©oS'©
a©xz
&tocCD
c©Ere2 nr
ecor
ded
insa
mpl
ed
reo
Sector Description _l CH. OH y- h- y- 3 3 h-
Industrial1 Food, drink and
tobacco 1,696 730 1,520 1,620 484 134 539 419 90 7,2302 Manufacture of
textiles, wearing apparel, leather, luggage, handbagsand footwear 496 66 69 339 24 23 159 35 24 1,234
3 Wood and woodproducts 343 3 221 795 31 28 7 43 1 1,471
4 Manufacture of pulp, paper and paperproducts 458 103 69 700 27 23 48 103 290 1,822
5 Publishing, printingand recording 569 10 44 1,307 44 52 25 61 62 2,174
6 Production of coke, oil,gas, electricity, water 2,897 39 43 3,011 38 14 71 41 28 6,182
7 Manufacture of chemicals and chemical products; cleaning products, man-made fibres etc; rubber and plasticproducts 2,102 333 508 822 488 92 685 208 19 5,257
8 Other non-metatlicmineral products 1,281 9 175 574 13 34 23 119 44 2,272
9 Manufacture of basicmetals 1,652 9 1,477 1,480 45 14 87 29 23 4,815
10 Manufacture of fabricated metalproducts 381 10 54 868 47 31 68 61 5 1,525
11 Manufacture of machinery andequipment 370 3 59 391 19 20 20 47 11 939
12 Manufacture of office machinery, computers, electrical, radio, television and communication equipment; medical and opticalinstruments and clocks 218 18 186 23 17 26 25 5153 1
13 Manufacture of motor vehicles and othertransport equipment
405 59 846 24 32 38 55 11 1,475414 Furniture and other
manufacturing 327 2 41 240 16 20 5 23 0 675Total ind. (000s)tonnes 13,194 1,324 4,358 13,178 1,321 534 1,801 1,267 610 37,587
2-5
Chapter 2 - Literature review
Given the substantial costs involved with the transportation, and landfilling, of
waste materials it would seem to make sense that alternatives should be sought.
There are, however, a number of significant barriers to the sustained uptake o f
materials recovered for recycling (www2 .6 ):
o Market demand. A lack of demand for products with increased recycled
content means that companies have little incentive to manufacture such
products.
o Feedstock substitution. Manufacturers are often reluctant to modify their
production processes to use recovered materials in place of virgin materials, or
to move from the tried and tested to the unknown.
o Price differentials. Recovered materials are not always price competitive with
virgin raw materials, particularly when systems for collecting such materials
are sub-optimal and the costs o f collection are high.
o Standards and specifications. The use of recovered materials is often
constrained by the absence of recognised industry standards for such
materials, affecting both the adoption of recovered materials as a feedstock
and the marketing of products with recycled content.
For these reasons, efforts to develop markets are vital if recycling is to be
substantially expanded. Market development is first and foremost a regional economic
development issue, aimed at the creation o f new jobs and business opportunities at a
regional/local level, using recovered materials as a raw material in the development of
new products and processes.
The UK cement and concrete industry is continuing to contribute to UK Waste
Strategy by consuming waste produced by other industries and recycling its own
waste. Through a combination of market forces, government intervention and the
industry’s own initiatives, the cement and concrete industries have steadily improved
their environmental performance (The Concrete Centre 2007). There is considerable
potential for use of specific wastes and by-products in each concrete component,
including admixtures and mixing water. However, the major use, by volume, has been
in cementitious binders or aggregates after the ‘beneficiation’, improving properties
and reducing variability, of various inorganic waste streams (Environmental working
party 2003).
2-6
Chapter 2 - Literature review
2.2 Concrete and its constituents
What is concrete?
Concrete is a composite mixture formed from Portland cement, water and
aggregate. The aggregates form the bulk of the volume, typically 70 - 80%. Other
materials, such as admixtures and partial cement replacement materials may also be
added to the basic constituents (Illston 1994). Portland cement is a hydraulic binder
with the term ‘hydraulic’ referring to the cement’s ability to set (stiffen and hold
shape) and harden (develop full strength) in the presence of sufficient water. This
makes concrete an extremely useful material in that it can be made to form or fill any
shape that may be required. In terms of final product, concrete is arguably the most
important construction material of the past century (Hendrick 2002).
Concrete is a two state process with each state having its own properties and
requirements towards application needs and governing standards.
Fresh state
The first state is its ‘Fresh state’. Although fresh concrete is only of transient
interest, as its properties are in continuous change, it should be understood that the
strength of concrete of given mix proportions is very seriously affected by the degree
o f its compaction. It is vital therefore, that the consistence of the mix be such that the
concrete can be transported, placed, compacted and finished sufficiently easily and
without segregation (Neville 1995).
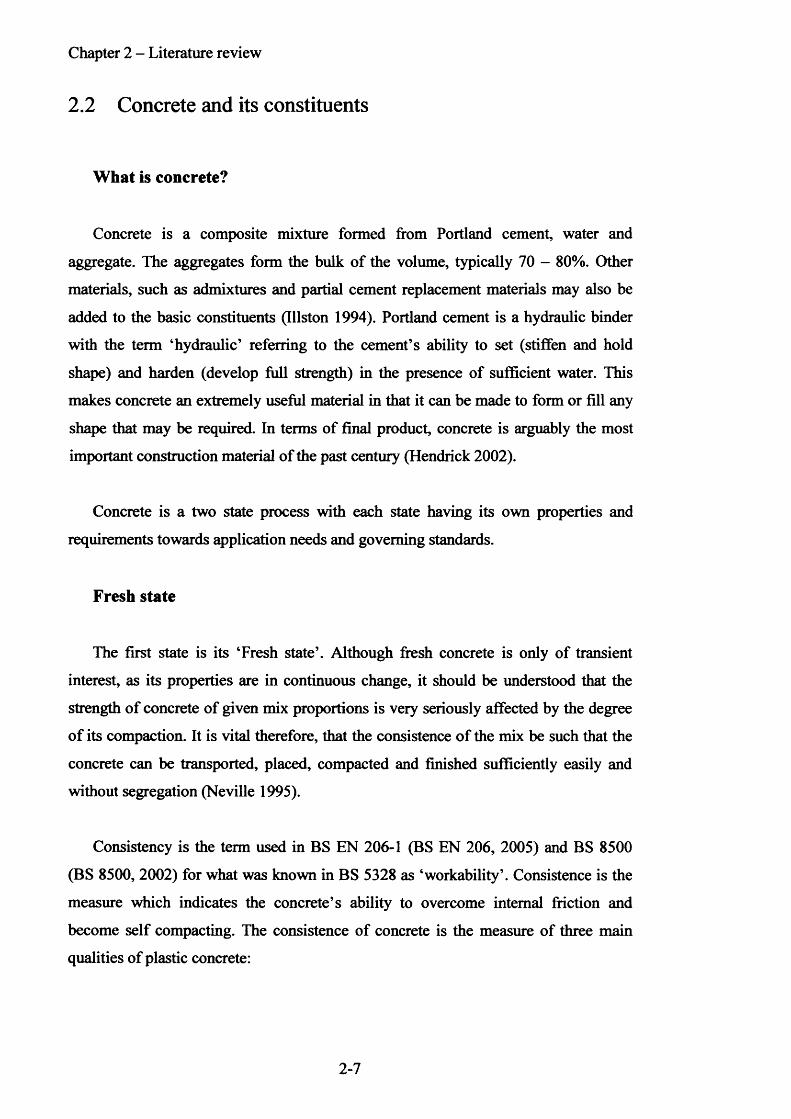
Consistency is the term used in BS EN 206-1 (BS EN 206, 2005) and BS 8500
(BS 8500, 2002) for what was known in BS 5328 as ‘workability’. Consistence is the
measure which indicates the concrete’s ability to overcome internal friction and
become self compacting. The consistence of concrete is the measure of three main
qualities of plastic concrete:
2-7
Chapter 2 - Literature review
o Compactability the ease with which the concrete can be compacted and
that air voids within the concrete are removed
o Mobility the ease with which concrete flows and can be
remoulded
o Cohesiveness the ability that the concrete has to maintain a
homogenous mass and not become segregated
While there are many ways of measuring consistence, BS EN 12350 ‘Testing
fresh concrete’ has four standardised tests in its series. The Slump test (BS EN 12350-
2), the Flow table test (BS EN 12350-5) the Vebe test (BS EN 12350-3) and the
Compactability test (BS EN 12350-4).
These tests give a single measurement and are therefore commonly known as
‘single-point’ tests. The most famous and oldest test is the Slump test. Because of its
simplicity, this method is used extensively in site work all over the world. The
apparatus was developed in the USA around 1910 and it is believed that it was first
used by Chapman although in many countries the test apparatus is associated with
Abrams (Bartos 2002).
Although work continues to find a more comprehensive measurement for the
rheology of concrete (Li 2007), the simplicity o f the measurement and low cost are
among the reasons why the slump test remains the most common method for quality
control evaluations o f fresh concrete in the field (Saak 2004).
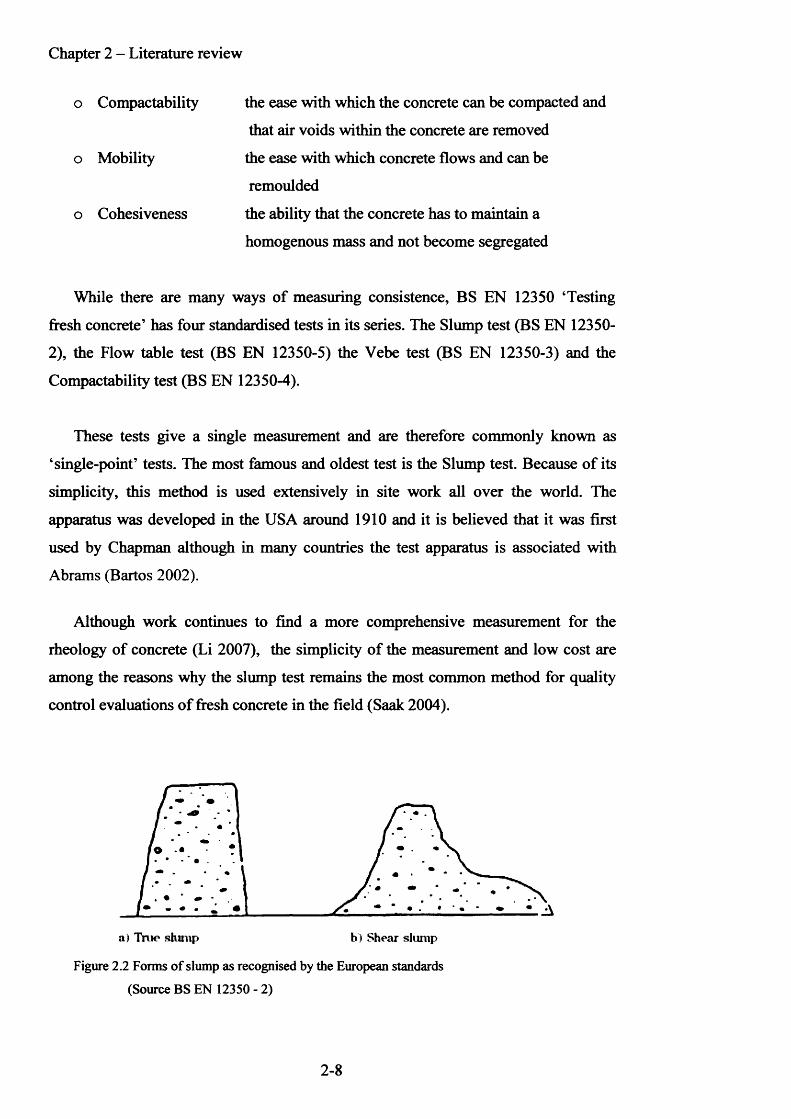
a) True slump b) Shear slump
Figure 2.2 Forms of slump as recognised by the European standards
(Source BS EN 12350 - 2)
2-8

Chapter 2 - Literature review
Despite these benefits the Slump test is not without its drawbacks. The European
standard only recognizes a true slump form as in Figure 2.2, the recording of values
from shear or collapsed slump is not allowed. Also, the standard recognises that the
test is sensitive to changes in consistency corresponding to slumps between 1 0 and
200mm, and the test is not considered suitable beyond these extremes. As well as
these drawbacks there are also differences in practice. The test is heavily operator
dependent with differing styles affecting test results. Also, the European standards
differ from the American standard as to the point from which the measurement is to
be taken (Domone 2003).
Although slump provides a qualitative measure of workability, the relationship
between slump and more quantitative Theological parameters is not fully understood.
However, despite their inherent limitations, single-point workability tests continue to
be used for the specification and quality control o f concrete (Saak 2004).
Hardened state
By far the most common test carried out on hardened concrete is the compressive
strength test. The main reason for this is the fact that this kind of test is easy and
relatively inexpensive to carry out. The European Standards covering the testing
requirements use different geometries of specimens to determine the compressive
concrete strength, fc (notation for the concrete cube strength). The geometries most
used are cylinders with a slenderness (height / diameter ratio) equal to two and cubes
(del Viso 2007).
Cylinders (0 1 50mm ><300 mm) are used in the United States, South Korea,
France, Canada, Australia, whereas 150mm and 100mm cubes are the standard
specimens used in the United Kingdom, Germany, and many other European
countries. There are several countries (e.g. Norway), where tests are made on both
cylinders and cubes (Yi 2006).
2-9
Chapter 2 - Literature review
Under favourable conditions the strength development of concrete increases for
many months. This strength development is dependent on the temperature and
humidity conditions during curing. Higher temperatures increase the rate of chemical
reaction and thus the rate of strength development, and in order to achieve higher
strengths at later ages loss of water from the concrete must be prevented. For test
purposes the concrete test specimens are stored in water at a constant temperature
until the date of testing as in BS EN 12390 - 2 (BS EN12390 2000). The compressive
strength of concrete is determined on specimens tested at 28 days (BS EN 206 2000).
During production there are inevitable variations in the characteristics of the materials
used. The overall variation in the measured strength of concrete obtained during a
project can be considered to be made up of three component sources which are (BRE
1997):
o Variation in the quality o f the material used,
o Variation in the mix proportions due to the batching process,
o Variation due to sampling and testing.
From purely a mix design perspective Lydon 1982 suggests that the compressive
strength of concrete is empirically a function of the following:
Water / cement ratio (w/c) - The influence of the water-cement ratio and cement
content on the compressive strength is well documented. The compressive strength
decreases with a higher water-cement ratio but is not influenced much by the cement
content (Schulze 1999); therefore, the w/c ratio has a greater bearing on the
compressive strength as with less water in the mix, the stronger and less porous the
concrete. However, the rheology of low W/C ratio concretes is no longer dictated by
the amount of water used to make them or by the shape of coarse aggregates, but
rather by what is now called the compatibility between the cement and the admixtures
used (Aitcin 2000). Erdogdu (2000) in his research into this compatibility concluded
that the cement content providing the highest strength gain in concrete changes with
the kind of cement used. This indicates that the effect of a superplasticising admixture
depends on the composition of cement rather than the amount used.
2-10
Chapter 2 - Literature review
Compaction - In his study to determine the effect of compaction on concrete,
Gonen (2007) found that the compaction pores seem to have a very important effect
on carbonation and sorptivity. The maximum carbonation and sorptivity coefficient
were observed on non-compacted specimens. The minimum carbonation and
sorptivity coefficient were obtained on specimens compacted by vibration.
Cement type - It has been very well established that concretes prepared from fly
ash and slag have significantly lower permeability which results in a highly durable
concrete but the compressive strength development is slower than concrete prepared
from normal Portland cement (Balendran et al. 1995). This is due to latent reaction
between the silica within the fly ash and the calcium hydroxide, or lime, a by-product
of the hydration of Portland cement, pozzolanic reaction. Little pozzolanic reaction
occurs within the first 24 hours thus for a given cementitious content, with increasing
fly ash content, lower early strengths are achieved (Lewis 2003).
Aggregate type - Concrete may be considered as a kind of three-phase composite
material with the three phases being hardened cement paste, aggregate and the
interfacial zone between the hardened cement paste and aggregate. The strength is
mainly determined by the properties o f the weakest phase o f a composite. In low- or
middle-strength concrete, normal weight aggregate is the strongest phase. Failures
always happen within the hardened cement paste and/or along the interfacial zone.
Therefore, there is no need to pay attention to aggregate's strength (or elastic
modulus) in the common mix design procedures regarding the strength of concrete
(Wu et al. 2001). Dhir et al.1999, showed that the compressive strength of a particular
concrete with 100% of the coarse aggregate and 50% fine aggregate as recycled
aggregate was between 20% and 30% lower than that of the corresponding natural
aggregate concrete.
Aggregate / cement ratio (a/c) - Lydon (1982) states that for a given w/c ratio
the higher the aggregate / cement ratio the higher the compressive strength tends to be
for mixes of the same aggregate type.
Curing - The objective o f curing is to provide an appropriate environmental
condition within a concrete structure (temperature and humidity) to ensure the
2-11
Chapter 2 - Literature review
progress of hydration reactions causing the filling and separation o f capillary voids by
hydrated compounds (Bonavetti et al. 2000). Malhotra and Ramezanianpour (1995)
stated that “ if the potential of concrete with regards to strength and durability is to be
fully realized, it is most essential that it be cured adequately. The curing becomes
even more important if the concrete contains supplementary cementing materials such
as fly ash, or ground, granulated blast-furnace slag or silica fume, and is subjected to
hot and dry environments immediately after casting” .
Durability
The new European standard EN 206 addresses the design and specification of
concrete to meet specific durability requirements. Agreement has not yet been reached
between all member countries on a single set of durability provisions that would
apply. Each country has thus decided on its own prescriptive requirements for mix
limitations (e.g. maximum water cement ratio, minimum cement content) for
concretes to satisfy each exposure condition within a common classification (Marsh
2000). Whilst considering the provision o f a durable concrete to cope with the most
aggressive environments, the most important property is permeability. Most serious
reactions, such as sulfate attack, alkali-aggregate reaction, corrosion o f reinforcement
and freeze thaw problems, initially involve the ingress or movement of water
containing aggressive solutions (Hooton 1993).
Grube and Lawrence (1984) conducted a number of studies showing that both the
change in the concrete mix and the degree o f curing affect the permeability of
concrete to both air and moisture. Research generally demonstrates that the effects of
permeability on concrete falls into two broad areas, one related to external changes
(e.g. curing and environmental conditions) and the other related to internal changes
(e.g. mix proportions and type of materials). Both affect the capillary voids in the
concrete and micro-structure (Tombs 2003). For this research the curing,
environmental conditions and the mix proportions are all constants with the main
focus being applied to the type o f materials used within the mix design.
2-12
Chapter 2 - Literature review
2.3 Aggregates
Aggregates not only make concrete economical by occupying more volume, but
also give volume stability and an increase in the durability of the concrete. Their size,
shape, grading and surface texture have a significant influence on the properties of
concrete both in the fresh and hardened states (Jamkar 2004).
The UK has large resources of material suitable for use as aggregate. Historically,
therefore, the UK has been self sufficient in the supply of primary or natural
aggregates (crushed rock, sand and gravel). However, the distribution of these
resources is uneven. In particular, there is an almost total absence of hard rock
suitable for crushed rock aggregate in southern and eastern England, where demand is
high (Highley 2005).
The usefulness o f mixing together stones, sand and some form o f binder or cement
to form ‘concrete’ has been recognised since Stone Age times. The Romans
developed a rather advanced appreciation of concrete technology; the stones and sand,
or ‘aggregates’, were only included as bulking materials, but the writings of Vitruvius
in De Architecture! demonstrate that the Romans recognised the influence of rock
types and particle size distribution on the selection of aggregates for good quality
concrete and mortars (Hewlett 2003).
The European standard EN 12620 ‘Aggregates for concrete’ (BS EN 12620 2002)
differentiate between coarse and fine aggregates dependent on whether they are
retained on a 4mm screen. Those aggregates retained are deemed ‘coarse’ whilst those
which pass through are ‘fine’. Product sizes are now based on the respective lower (d)
and upper (D) sieve sizes expressed as “d/D” Hence aggregates for concrete compared
against the replaced standard BS 882 are shown as follows:
o 2 0 mm single size becomes 1 0 / 2 0
o 10mm single size becomes 4/10
o 20 to 5mm graded becomes 4/20
o M (medium) sand becomes 0/4 or 0/2 (MP)
2-13
Chapter 2 - Literature review
In his study on pumice as a lightweight aggregate, Sari (2005) found that the
gradation of aggregate has a positive effect on the concrete strength. He reported that
the concrete strength increases with increasing fine-to coarse ratio, up to a maximum
value. When this maximum is achieved an increase in fine material begins to have an
adverse effect on the concrete strength.
Neville (1995) shows how the results of a sieve analysis can be better understood
if represented graphically. Through the use of a chart it is possible to see whether the
aggregate grading is coarse or fine. He states that the strength o f fully compacted
concrete, with a given water / cement ratio, is independent o f the aggregate grading,
with the grading being of importance in so far as it affects workability (To achieve the
maximum compressive strength for a given water / cement ratio requires full
compaction and this can only be obtained with a sufficiently workable mix). Neville
also recognises that the ideal grading curve must be a compromise between the
physical requirements and economic aspects o f the concrete mix.
However, as the concrete fluidity increases, its stability decreases. This is due to
the reduction in viscosity of the fresh concrete. To enhance its stability so that the
paste can maintain the coarse aggregates in uniform suspension, higher powder
content is required. The main target is to enhance the grain size distribution and
particle packing, thus ensuring greater cohesiveness and resistance to segregation
(Safawi, et al. 2004).
Good segregation resistance means that the distributions of aggregate particles in
the concrete are relatively equivalent at all locations and at all levels. It also means
that concrete should not segregate in vertical and horizontal directions (Buia et al..,
2002).
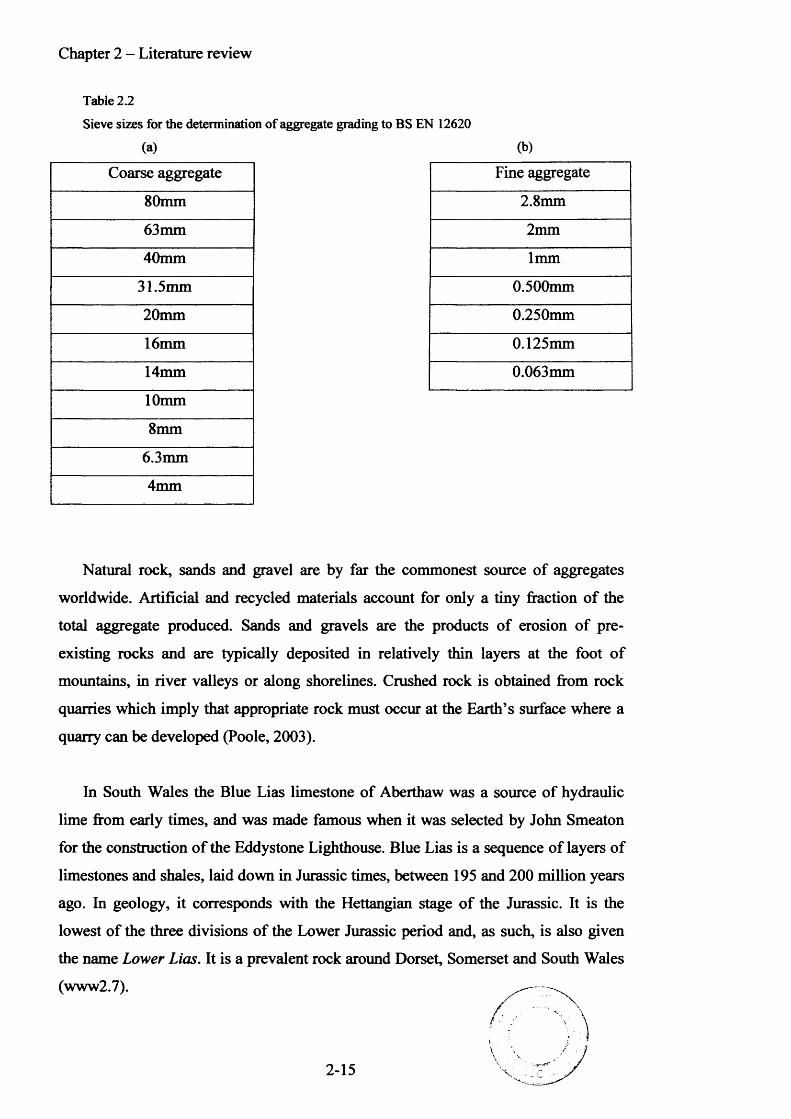
The European product standards give two options for the selection o f sieves for
grading and product description purposes. The UK has elected to use “basic set plus
set 2 ” with the recommended sequence for coarse and fine aggregates as shown in
Tables 2.2 (a) and (b).
2-14
Chapter 2 - Literature review
Table 2.2
Sieve sizes for the determination of aggregate grading to BS EN 12620
(b)
Fine aggregate
2 .8 mm
2 mm
1 mm
0.500mm
0.250mm
0.125mm
0.063mm
Natural rock, sands and gravel are by far the commonest source of aggregates
worldwide. Artificial and recycled materials account for only a tiny fraction o f the
total aggregate produced. Sands and gravels are the products of erosion of pre
existing rocks and are typically deposited in relatively thin layers at the foot of
mountains, in river valleys or along shorelines. Crushed rock is obtained from rock
quarries which imply that appropriate rock must occur at the Earth’s surface where a
quarry can be developed (Poole, 2003).
In South Wales the Blue Lias limestone of Aberthaw was a source of hydraulic
lime from early times, and was made famous when it was selected by John Smeaton
for the construction o f the Eddystone Lighthouse. Blue Lias is a sequence of layers o f
limestones and shales, laid down in Jurassic times, between 195 and 200 million years
ago. In geology, it corresponds with the Hettangian stage of the Jurassic. It is the
lowest of the three divisions of the Lower Jurassic period and, as such, is also given
the name Lower Lias. It is a prevalent rock around Dorset, Somerset and South Wales
(www2.7).//
t
\2-15
(a)Coarse aggregate
80mm
63mm
40mm
31.5mm
2 0 mm
16mm
14mm
1 0 mm
8 mm
6.3mm
4mm
Chapter 2 - Literature review
Limestones belong to the group o f sedimentary rocks known as chemical
sediments. They are formed in a marine environment from the precipitation of
calcium carbonate, the calcium having been brought into the sea via the hydrological
cycle. Fossil shells are often found in limestones, and show that biological activity is
very important too. Carboniferous Limestone is a well-cemented rock of low porosity
which occurs in thick beds. It is a very tough rock, and is commonly used as
roadstone, but can also be used for cement making because it is often quite pure, and
as a source of calcium carbonate for the chemical industry (www2 .8 ).
The aggregates employed in the UK reflect a rich geological record and cover a
vast range o f different geological types of material. Typical problems encountered
may include (Grantham 2003):
o The presence of impurities such as organic matter, sulfates, chlorides or
sodium or potassium salts,
o Some aggregates may have poor physical properties such as aggregate
crushing value or flakiness. Further more, they may be shrinkable,
expandable, porous or frost susceptible,
o The presence of constituents which are susceptible to alkali reaction,
o Poorly graded material.
The Aggregates Levy was introduced in April 2002 as a result of independent
research, which verified the environmental costs associated with quarrying that are
not already covered by regulation. These include noise, dust, visual intrusion, and loss
o f amenity and damage to biodiversity and geo-diversity.
The aggregates levy
The Aggregates Levy Sustainability Fund (ALSF) was introduced initially as a
two-year pilot scheme, to provide funds to tackle a wide range of problems in areas
affected by the extraction o f aggregates. Following a three-year second round of the
Fund, a further one year extension to the scheme was announced by the Chancellor of
the Exchequer in the pre-Budget Statement on 6 th December 2006 (www2.9).
2-16
Chapter 2 - Literature review
The Levy is set at £1.60 per tonne of aggregates extracted and sold, and is broadly
revenue neutral (the Levy rose to £1.95 per tonne from April 2008). Most o f the
revenue generated has been used to fund a cut in employers National Insurance
Contributions, but £35 million has been set aside annually to be used as a UK
Sustainability Fund. In Wales, the Aggregates Levy Sustainability Fund has been
devolved to the Welsh Assembly Government and under the Barnett Formula, has
been allocated an annual budget of £1.7 million (www2.10).
It is due to this levy that in recent years the recycling o f concrete, to produce
aggregates suitable for non-structural concrete applications, has emerged as a
commercially viable and technically feasible operation. This situation has risen over
two decades of intensive research, predominantly centred on laboratory crushed
concrete. Recent advances in aggregate - production technologies in the area of
rubble screening and aggregate washing, and tighter regulation o f the recycling
industry have contributed to significant improvements in aggregate quality (Sagoe-
Crentsil, 2001).
Concrete demolition waste has been proved to be an excellent source of
aggregates for new concrete production. There are many studies that prove that
concrete made with this type of coarse aggregates can have mechanical properties
similar to those of conventional concretes and even high-strength concrete is
nowadays a possible goal for this environmentally sound practice (Evangelista, 2007).
2.4 Admixtures
Of the many innovations in concrete technology during the last century, the use of
chemical admixtures, and in particular, that of water-reducing agents and air-
entraining agents, would probably rank as the most relevant, appropriate and critical
to the enhancement o f the quality of concrete. The combined use of chemical
admixtures and mineral admixtures, such as supplementary cementitious materials,
should then be able to bring out the unique properties of each o f these concrete
components, and show that the synergic interaction between them can produce a
2-17
Chapter 2 - Literature review
much more durable and stronger concrete than when either of these materials is used
alone with Portland cement (Swamy 1999).
The European standard controlling admixtures is BS EN 934-2 and defines
admixtures as:
‘Materials added during the mixing process of concrete in a quantity not more than 5% by mass of the cement to modify the properties of the mix in the fresh and / or hardened state ’
Additive is a term often used synonymously with admixture; however, strictly
speaking, additive refers to a substance which is added at the cement manufacturing
stage, while admixture implies addition at the mixing stage (Neville 1987)
Admixtures are now widely accepted as materials that contribute to the production
of durable and cost-effective concrete structures. The contributions include improving
the handling properties of fresh concrete, making placing and compaction easier,
reducing the permeability of hardened concrete and providing freeze/thaw resistance
(BCA, 2000a).
The need for durable concrete with low water/cement ratios has made
superplasticisers irreplaceable as it would not have been possible to achieve an
acceptable fluidity (consistence) of the concrete. Today concrete is no more a three
component system, but a multi component system with different chemical admixtures
(i.e. superplasticisers, air entraining agent) and concrete mineral additions (i.e. fly ash,
silica fume) (Griesser, 2005). High performance concrete with high strength, superior
fluidity, and self compactability can only be realised because of chemical admixtures
(Hanehara 1999).
The quantity of admixture added is usually based on the cement content and for
most admixtures is in the range 0.2 to 2.0% by weight. In terms o f active chemical
this equates to less than 0.15% on a typical concrete mix. Even at this low content
2-18
Chapter 2 - Literature review
they have a powerful effect, modifying the water requirement, setting time or other
properties. Admixture use optimises a concrete mix, improving properties including
strength and durability as well helping to reduce its environmental impact (www2 .1 1 ).
Types o f admixtures available
Almost all types of admixtures are covered by a European or National Standard
that requires them to meet basic performance requirements, provide information on
properties that can be used to check uniformity o f supply and to have a factory
production control system that gives assured quality. The two main admixture
Standards are BS EN 934 and BS 8443. Those conforming to BS EN 934 can be CE
marked (Dransfield 2006).
BS EN 934 consists o f six parts with Part 2 being the most important to concrete.
Some of the most widely used admixture types covered by EN 934 are:
o Normal plasticizing/water reducing (WRA) EN 934-2
Often Lignosulphonate based, they are used to increase workability at constant
water content and / or reduce water by up to 10%. This is used by most ready mix
companies to optimise concrete performance for normal concrete.
o Super plasticizing/high range water reducing EN 934-2
Based on Sulphonated Naphthalene or Melamine Formaldehyde Condensates,
Vinyl Polymers or Polycarboxylate Ethers. These admixtures give a much higher
performance than the normal plasticizers. They are used to give very high levels of
workability or water reductions from 12 to over 30%. They are used extensively on
larger projects where congested reinforcing steel requires high workability concrete to
penetrate between the reinforcement. They are also used in pre-cast and on site where
the large water reduction provides very high early strength and improved durability.
2-19
Chapter 2 - Literature review
o Retarding and retarding plasticizing EN 934-2
These admixtures slow the rate of cement hydration, preventing the cement from
setting before it can be placed and compacted. This type of admixture is mainly used
in hot conditions and climates or on very large pours.
o Accelerating set and hardening types EN 934-2
These are used to speed up the rate of early hydration of the cement. They can
accelerate the setting or the early strength development of concrete. These are used
mainly in cold conditions or where very early use o f a concrete pavement is required
to provide access.
o Air entraining EN 934-2
Based on special surfactants, these admixtures cause tiny air bubbles < 0.3mm in
diameter to stabilise within the cement paste. This air helps to prevent the concrete
from cracking and scaling as a result o f frost action. In low workability mixes, air
helps lubricate the aggregate aiding compaction under vibration closing voids and
reducing bleed water and segregation o f the aggregate before the concrete can set.
o Water resisting (water proofing) EN 934-2
These water repellent admixtures act on the capillary structure to block the pores
and impede the flow of water through the natural capillaries in hardened concrete.
These are generally used in structures below the water table or in water retaining
structures.
o Retarded ready-to-use mortar admixtures EN 934-3
They increase the cohesion and retard the setting of mortar for masonry, allowing
it to be delivered to a building site by ready mix in large volumes that can be used
over an extended period, usually of 1 to 2 days. Setting is initiated when
water/admixture is sucked out by the in-situ masonry unit
2-20

Chapter 2 - Literature review
o Sprayed concrete EN 934-5
These admixtures provide a very rapid set to concrete that is sprayed onto vertical
and overhead applications, preventing it from falling off before it has time to set. This
type is mainly used in tunnelling applications for early roof support. Dosage may
exceed 5% (www2.12).
This research
This study has employed the use of a number of Plasticising/water reducing
admixtures, some being designed specifically for this type o f application (i.e. with fly
ash) and some general “offthe shelf’ admixtures.
These dispersing admixtures are usually based on refined lignosulphonate, a by
product of the paper pulping industry. They are effective at dosages o f around 0.3 to
0.5% on cement weight but their water reducing effect is limited to about 12%. At
higher dosage, secondary effects such as air entrainment and retardation may limit
their use. Blending with superplasticisers may extend their dosage and performance to
give a mid-range product.
The low dose and relatively low cost make these admixtures particularly suitable
for a wide range of general applications. Used to reduce both water and cement
content, they can optimise the mix design for both cost and environmental impact.
Most will also slightly increase cohesion, reducing bleed and making placing and
finishing easier (www2.13).
2-21
Chapter 2 - Literature review
2.5 Cement
The manufacture and use of hydraulic cements is ancient and is generally
accredited to the Greeks and Romans; however, the use of lime as a binder dates back
to the 6 th millennium B.C. whereby a terrazzo floor excavated in Canjenti in Eastern
Turkey laid with a lime mortar has been dated between 12 000 and 5000 BC (Elsen J
2006).
In the mid eighteenth century whilst looking for a material with which to build the
new Eddystone Lighthouse, John Smeaton made two important discoveries. First, the
use of a new kind o f interlocking stone construction, and second, the development of
a water-resistant (hydraulic) mortar to bind the blocks together by mixing blue lime
and pozzolanic material from Civita Vecchia, near Rome. Indeed, Smeaton's seminal
observation that the best hydraulic cements were those made from limestone
containing certain proportions of clayey material is regarded as the starting point of
the modem engineering use of cement and concrete (www2.14).
The term “Portland cement” was first applied by Joseph Aspdin in his British
patent No. 5022 (1824), which describes a process for making artificial stone by
mixing lime with clay in the form of a slurry and calcining (heating to drive off
carbon dioxide and water) the dried lumps o f material in a shaft kiln. The calcined
material (clinker) was ground to produce cement. The term “Portland” was used
because of the similarity of the hardened product to that of Portland stone from Dorset
and also because this stone had an excellent reputation for performance (Moir 2003).
There are three broad categories of cement products: Portland cement, Portland
cement with the addition of pulverised fuel ash or blast furnace slag and special
cements. All but certain special cements are manufactured using substantially the
same process route. Portland cement, which is manufactured to British Standard
BS 12:1991, is defined as an active hydraulic binder based on ground clinker formed
from a predetermined homogeneous mixture of materials comprising lime (CaO),
silica (SiC>2) and a small proportion o f alumina (AI2O3) and generally iron oxide
(Fe20 3).
2-22
Chapter 2 - Literature review
The vast majority of cement used in construction work is described as being a
Portland cement and it is this general type that this research is concentrated on.
Portland cement is essentially a calcium silicate cement, which is produced by firing
to partial fusion, at a temperature o f approximately 1500°C, a well homogenised and
finely ground mixture of limestone or chalk (calcium carbonate) and an appropriate
quantity of clay or shale (Moir 2003).
Cement process overview
The second half of the twentieth century saw significant advances made in cement
manufacture, culminating in the development of the pre-calciner dry process kiln
(Moir 2003). Figure 2.3 is an illustration o f the full cement manufacture process.
The raw materials are ground to a fineness which enables a satisfactory
combination to be achieved under normal operating temperatures. The homogenised
raw meal is introduced into the top of a pre-heater tower working its way down until it
arrives at the Pre-calciner vessel. Here the meal is flash heated to approximately
900°C using the hot exhaust gases from the kiln itself and , although the material is
suspended for a few seconds only, approximately 90% of the limestone in the meal is
de-carbonated before entering the kiln. This is the point whereby cement manufacture
contributes greenhouse gases both directly through the production of carbon dioxide,
when calcium carbonate is heated, producing lime and carbon dioxide (Hewlett 1998),
and also indirectly through the use of energy, particularly if the energy is sourced
from fossil fuels. As reported in Chapter 1, the cement industry produces 5% of global
man-made CO2 emissions, o f which 50% is from the chemical process, and 40% from
burning fuel (www2.14.1) with 1 0 % from ancillary operations.
In the rotary kiln the feed is heated to approximately 1500°C and as a result o f the
tumbling action and the partial melting it is converted into the granular material
known as clinker. A rotary kiln typically comprises a long cylinder of 50 to 150
metres, inclined slightly from the horizontal (3% to 4% gradient) which is rotated at
about 1 to 4 revolutions per minute. The solid material passes down the kiln as a
2-23
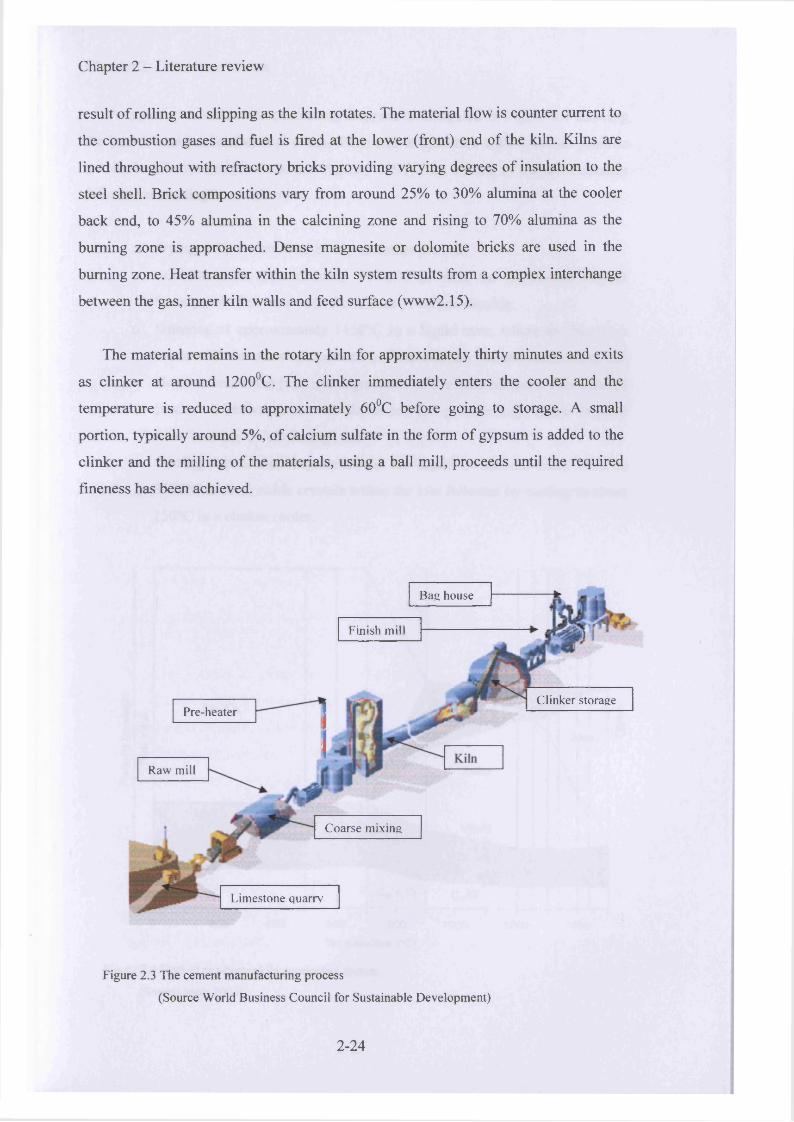
Chapter 2 - Literature review
result of rolling and slipping as the kiln rotates. The material flow is counter current to
the combustion gases and fuel is fired at the lower (front) end of the kiln. Kilns are
lined throughout with refractory bricks providing varying degrees of insulation to the
steel shell. Brick compositions vary from around 25% to 30% alumina at the cooler
back end, to 45% alumina in the calcining zone and rising to 70% alumina as the
burning zone is approached. Dense magnesite or dolomite bricks are used in the
burning zone. Heat transfer within the kiln system results from a complex interchange
between the gas, inner kiln walls and feed surface (www2.15).
The material remains in the rotary kiln for approximately thirty minutes and exits
as clinker at around 1200°C. The clinker immediately enters the cooler and the
temperature is reduced to approximately 60°C before going to storage. A small
portion, typically around 5%, of calcium sulfate in the form of gypsum is added to the
clinker and the milling of the materials, using a ball mill, proceeds until the required
fineness has been achieved.
Figure 2.3 The cement manufacturing process
(Source World Business Council for Sustainable Development)
Coarse mixing
Pre-heater
Finish mill
Bag house
Limestone quarry
Raw mill
Clinker storage
2-24
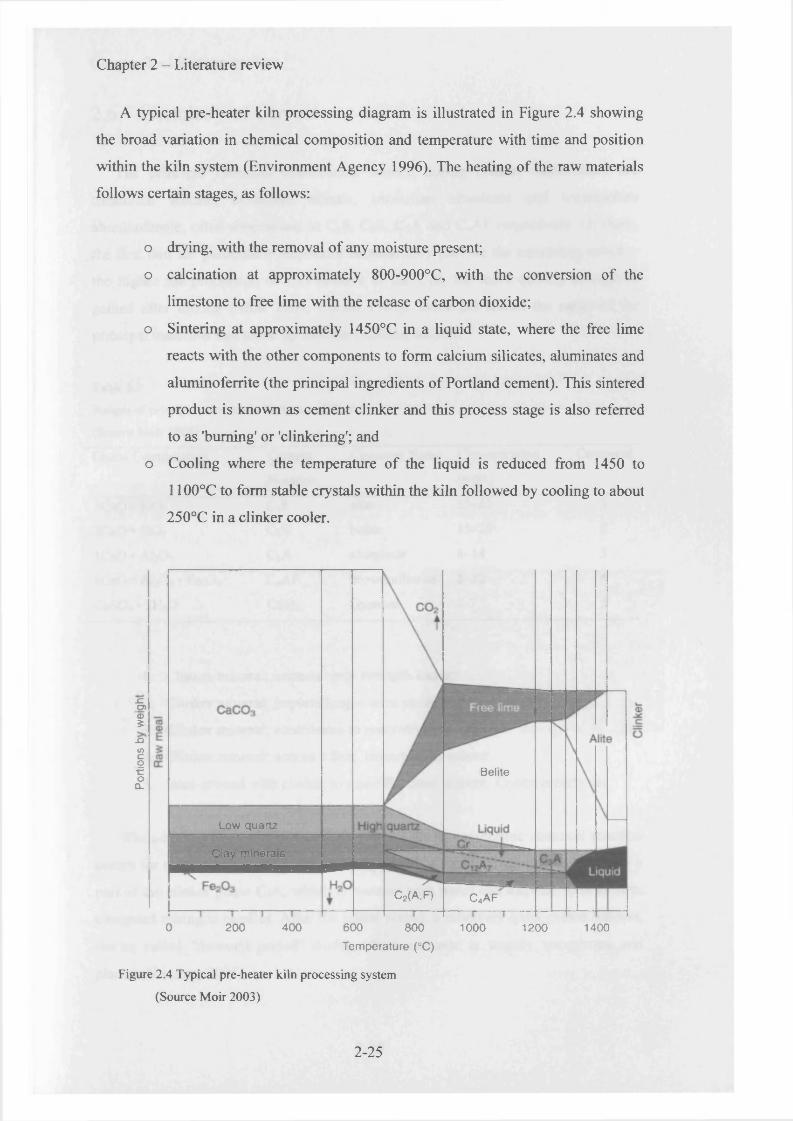
Chapter 2 - Literature review
A typical pre-heater kiln processing diagram is illustrated in Figure 2.4 showing
the broad variation in chemical composition and temperature with time and position
within the kiln system (Environment Agency 1996). The heating of the raw materials
follows certain stages, as follows:
o drying, with the removal of any moisture present;
o calcination at approximately 800-900°C, with the conversion of the
limestone to free lime with the release of carbon dioxide;
o Sintering at approximately 1450°C in a liquid state, where the free lime
reacts with the other components to form calcium silicates, aluminates and
aluminoferrite (the principal ingredients of Portland cement). This sintered
product is known as cement clinker and this process stage is also referred
to as ’burning' or 'clinkering'; and
o Cooling where the temperature of the liquid is reduced from 1450 to
1100°C to form stable crystals within the kiln followed by cooling to about
250°C in a clinker cooler.
■ CCT>a>5.oV)cofo
CLBelite
Low quartz
Clay minerals
C2(A,F) c 4a f
0 200 400 600 800Temperature (°C)
Figure 2.4 Typical pre-heater kiln processing system
(Source Moir 2003)
1000 1200 1400
2-25
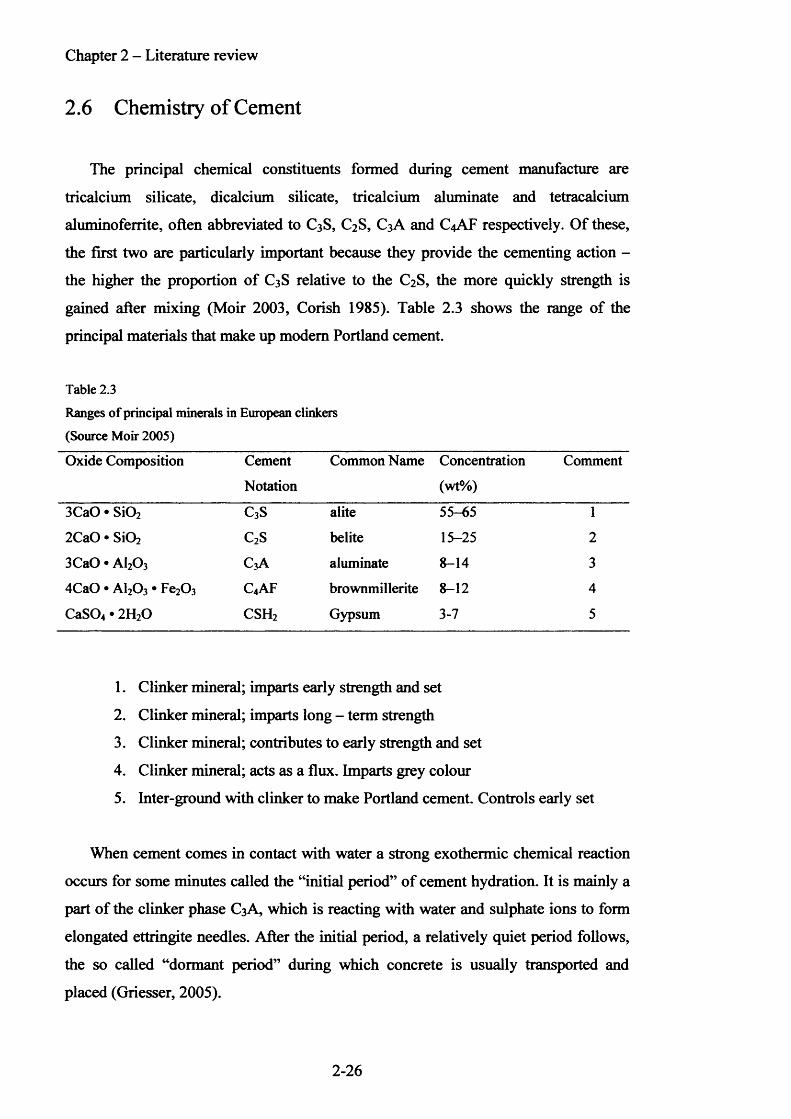
Chapter 2 - Literature review
2.6 Chemistry of Cement
The principal chemical constituents formed during cement manufacture are
tricalcium silicate, dicalcium silicate, tricalcium aluminate and tetracalcium
aluminoferrite, often abbreviated to C3S, C2S, C3A and C4AF respectively. Of these,
the first two are particularly important because they provide the cementing action -
the higher the proportion of C3S relative to the C2S, the more quickly strength is
gained after mixing (Moir 2003, Corish 1985). Table 2.3 shows the range of the
principal materials that make up modem Portland cement.
Table 2.3
Ranges of principal minerals in European clinkers
(Source Moir 2005)
Oxide Composition Cement
Notation
Common Name Concentration
(wt%)
Comment
3CaO • SiCh C3S alite 55-65 1
2CaO • Si0 2 C2S belite 15-25 2
3CaO • AI2O3 C3A aluminate 8-14 3
4CaO • AI2O3 • Fe20 3 C4AF brownmillerite 8 - 1 2 4
CaS04 • 2H20 CSH2 Gypsum 3-7 5
1. Clinker mineral; imparts early strength and set
2. Clinker mineral; imparts long - term strength
3. Clinker mineral; contributes to early strength and set
4. Clinker mineral; acts as a flux. Imparts grey colour
5. Inter-ground with clinker to make Portland cement. Controls early set
When cement comes in contact with water a strong exothermic chemical reaction
occurs for some minutes called the “initial period” of cement hydration. It is mainly a
part of the clinker phase C3A, which is reacting with water and sulphate ions to form
elongated ettringite needles. After the initial period, a relatively quiet period follows,
the so called “dormant period” during which concrete is usually transported and
placed (Griesser, 2005).
2-26
Chapter 2 - Literature review
The mineral C3 S (alite) hydrates quickly and so imparts early strength and set to
the cement, whereas C2 S (belite) hydrates slowly and is the main contributor of long
term strength. Both minerals hydrate to form tricalcium silicate hydrate gel
(sometimes called tobermorite) plus lime; the exact reaction stoichiometries vary
considerably in the number of waters of hydration incorporated, but a typical
hydration reaction, shown for C3 S, would be:
2C3S + 6 H (water)
—► C3 S2 H3 (tobermorite gel) + 3CH (lime). (1)
The tobermorite (the formula shown is only representative o f a family of similar
calcium silicate hydrates CSH) gel is the actual binder in the hydrated cement. The
lime released in the hydration reaction is in small part taken up by hydration o f C3A
and C4AF (reactions not shown), but most remain unreacted and thus available to
activate any pozzolans added in the finished cement (molecular formula of Lime
mixed with water is Ca(OH)2). Hydration of C3A is almost instantaneous and highly
exothermic. The mineral thus speeds the development of early strength and set,
sometimes to the point of causing flash set (which is undesirable); as noted earlier,
gypsum is used to control this. The main function o f the aluminoferrite mineral
(C4AF) is as a flux, that is, it acts to lower the temperature at which the clinker
minerals form (i.e., clinkering temperature). This mineral also imparts the grey colour
to Portland cement and for this reason its formation is avoided, through the use of
only iron-free raw materials and higher clinkering temperatures, in the production of
white (Portland) cement, which is a much higher priced product than grey
(“ordinary”) Portland cement (Van Oss 2002).
Pozzolans
Pozzolanic materials can be natural in origin or artificial and are available widely.
They have been used throughout the world to make good quality concrete. The natural
pozzolanic materials most commonly met with are: volcanic ash which is the original
pozzolan, pumicite, opaline shales and cherts, calcined diatomaceous earth, and burnt
2-27
Chapter 2 - Literature review
clays (Davraz et al.. 2005). Artificial pozzolanic materials are generally siliceous by
products, such as fly ashes, condensed silica fume and metallurgical slags (blast
furnace slag, steel slag and nonferrous slags) (Papadakis et al.. 2002).
According to ASTM C 595, a pozzolan is defined as:
‘ ‘a siliceous or siliceous and aluminous material, which in itself possesses little or no cementitious value but will, in finely divided form and in the presence of moisture, chemically react with calcium hydroxide to form compounds possessing cementitious properties (pozzolanic activity). ’ *
The CaO content of a pozzolanic material is generally insufficient to react with all
the pozzolanic compounds it contains; however, it exhibits some pozzolanic activity
(pozzolanic and cementitious materials). Thus, a pozzolanic material requires
Ca(OH) 2 (calcium hydroxide) in order to form strength products, whereas a
cementitious material itself contains quantities of CaO and can exhibit a self-
cementitious (hydraulic) activity. Therefore, pozzolanic materials are often used in
combination with Portland cement, which contain essential compounds for their
activation, Ca(OH) 2 from cement hydration (Papadakis et al.. 2002). Lewis enhances
this statement adding that the silica in pozzolana has to be amorphous or glassy to be
reactive and must be finely divided in order to expose a large surface area to the alkali
solutions for the reaction to proceed (Lewis et al.. 2003).
It has been shown that Portland cement is both resource and energy intensive.
Every tonne (t) of cement requires about 1.5t of raw material and about 4000 to 7500
Megajoul (MJ) of energy for production. The energy to produce a tonne of cement is
estimated to account for 40-45 percent o f the plant production cost. Much more
importantly, every tonne of cement releases 1 . 0 to 1 .2 t of CO2 into the environment
by the time the material is put in place. In the world we live in, the use of resources
and energy, and the degree of atmospheric pollution that it inflicts are most important
(Swamy 2003).
Large volumes of by-product materials generated from industrial and post
consumer sources are landfilled. The amount of waste generation is increasing, while
2-28
Chapter 2 - Literature review
landfill space is decreasing. Additionally, due to stricter environment regulations, it is
difficult to obtain approval for developing new disposal facilities. The cost of disposal
is escalating. Recycling not only saves on huge disposal costs, but also conserves
natural resources, and in some cases it provides technical and economic benefits.
Various uses o f by-products generated from industrial and post-consumer sources
exist (Naik et al.. 1999). It may be that some of this industrial waste can be used as a
pozzolanic cement replacement in concrete. Identification o f the important elements
and physical properties o f these wastes could be extremely cost effective for industry
and beneficial to the environment if their use in concrete was established.
2.7 Additives
The construction industry accounts for over 90% of mineral consumption in the
UK and, of this; one-third is used in road construction. Other uses include buildings,
railways and manufacturing of cement, lime, plaster and a variety of other products
such as glass and ceramics. (www2.16).
Quarry products including stone, crushed rock, aggregate and sand make up
between 51% and 62% of the resource flow of the construction industry, Figure 2.5.
This amounts to some 240Mt of material. According to the Quarry Products
Association, 18% of the UK’s aggregate demand is met from recycled sources. The
Minerals Planning Guidance (MPG 6 ) set a target of 55Mt for use o f recycled and
secondary material by 2006 (www2.16). This equates to ~23% or an additional 12Mt
compared with current practice. In the House Building Quick Wins guide, WRAP
estimate that an additional 20Mt of recycled and secondary material could be used in
place of virgin material if best practice is adopted (Lazarus 2005).
2-29
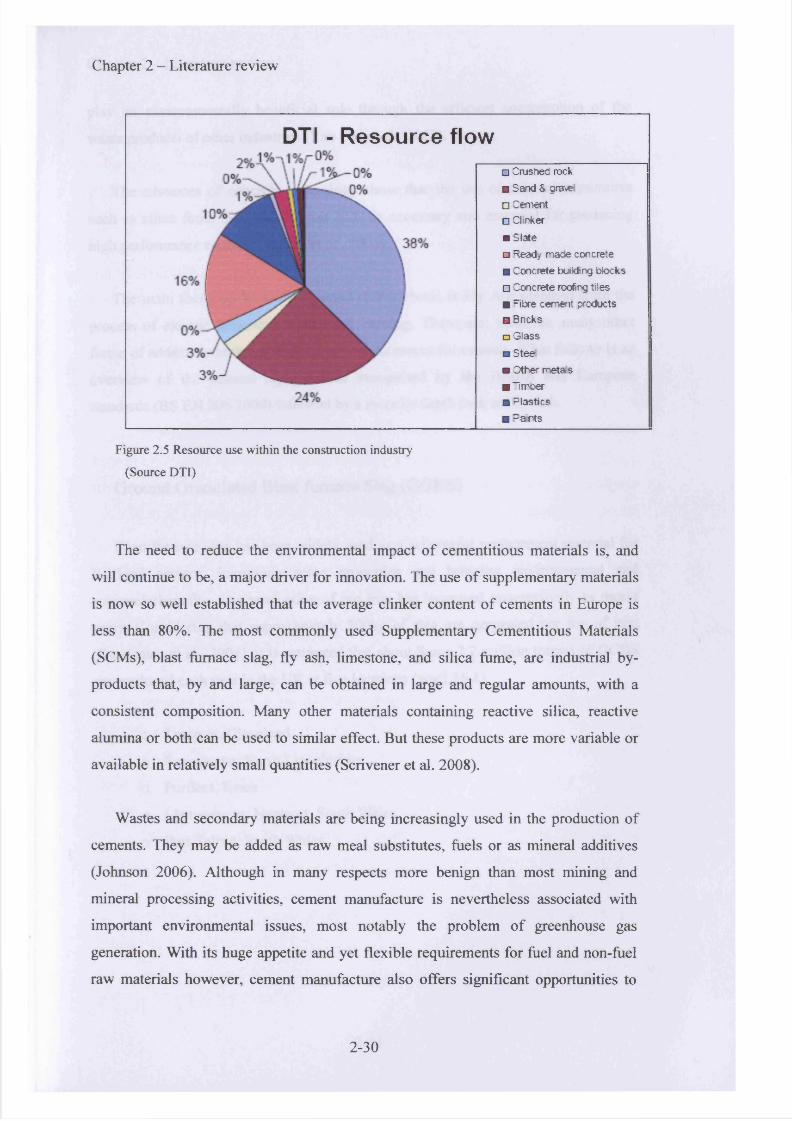
Chapter 2 - Literature review
DTI - Resource flow□ Crushed rock■ Sand & grave!□ Cement□ Chnker
■ Slate□ Ready made concrete■ Concrete building blocks□ Concrete rooting tiles■ Fibre cement products■ Bricks□ Glass■ S tee■ Other met a s■ Timber■ Plastics■ -arts
Figure 2.5 Resource use within the construction industry
(Source DTI)
The need to reduce the environmental impact of cementitious materials is, and
will continue to be, a major driver for innovation. The use of supplementary materials
is now so well established that the average clinker content of cements in Europe is
less than 80%. The most commonly used Supplementary Cementitious Materials
(SCMs), blast furnace slag, fly ash, limestone, and silica fume, are industrial by
products that, by and large, can be obtained in large and regular amounts, with a
consistent composition. Many other materials containing reactive silica, reactive
alumina or both can be used to similar effect. But these products are more variable or
available in relatively small quantities (Scrivener et al. 2008).
Wastes and secondary materials are being increasingly used in the production of
cements. They may be added as raw meal substitutes, fuels or as mineral additives
(Johnson 2006). Although in many respects more benign than most mining and
mineral processing activities, cement manufacture is nevertheless associated with
important environmental issues, most notably the problem of greenhouse gas
generation. With its huge appetite and yet flexible requirements for fuel and non-fuel
raw materials however, cement manufacture also offers significant opportunities to
2-30
Chapter 2 - Literature review
play an environmentally beneficial role through the efficient consumption of the
waste products o f other industries (Van Oss et al.. 2 0 0 2 ).
The advances of concrete technology show that the use of mineral admixtures
such as silica fume (SF) and fly ash (FA) is necessary and essential for producing
high performance concrete (Poona et al.. 2001).
The main focus of the work reported in this thesis is Fly Ash obtained from the
process of electric generation from coal burning. There are; however, many other
forms o f additive which can be used as a replacement for cement. What follows is an
overview o f the cement replacements recognised by the British and European
standards (BS EN 206 2000) followed by a more in-depth look at Fly Ash.
Ground Granulated Blast furnace Slag (GGBS)
Blast furnace slag has been widely used as a successful replacement material for
Portland cement, improving some properties and bringing environmental and
economic benefits. The production of pig iron has increased progressively in recent
years. Considering that approximately 300kg of slag are generated per ton of iron
(Escalantea et al.. 2001), it is estimated that about Some 2.2 million tonnes of GGBS
are produced each year in the UK at five locations (ww2.16.1).
o Teesport, Cleveland
o Scunthorpe, North Lincolnshire
o Purfleet, Essex
o Llanwem, nr. Newport, South Wales
o Port Talbot, South Wales
2-31
Chapter 2 - Literature review
Chemical reactions
As the chemical composition of steel slag is highly variable, the mineral
composition of steel slag also varies. Olivine, Merwinite, C3S, C2S, C4AF, C2F, RO
phase (CaOFeO-MnO- MgO solid solution) and ffee-CaO are common minerals in
steel slag. Its chemical composition consists o f CaO 45-60%, Si0 2 10-15%, AI2O3 1-
5%, Fe20 3 3-9%, FeO 7-20%, MgO 3-13%, and P2Os 1-4% (Shi et al.. 2000). The
presence of C3 S, C2 S, C4AF and C2F endorses steel slag hydraulic properties.
However, the C3 S content in steel slag is much lower than that in Portland cement.
Thus, steel slag can be regarded as a low strength hydraulic material (Kourounis et al..
2007).
In the presence of water GGBS will react very slowly, making slag on its own of
little practical use. Essentially the hydraulicity of the slag is locked within its glassy
structure (i.e. it possesses latent hydraulicity) and in order to release this reactivity
some form of ‘activation’ is required. The activators, which are commonly sulphates
and/or alkalis, react chemically with the GGBS, increasing the pH of the system. This
increase ‘disturbs’ the glassy structure resulting in activation o f the GGBS with the
water producing its own cementitious gels. In practice, activation is achieved by the
blending of GGBS with Portland cement as the latter contains both alkalis and
sulphates (Lewis et al.. 2003).
As good as GGBS has proved to be since its incorporation into the concrete
industry, environmental factors which welcome its use will also bring its demise.
Although the efficiency of blast furnaces is constantly evolving, the chemical process
inside the blast furnace remains the same. According to the American Iron and Steel
Institute; "Blast furnaces will survive into the next millennium because the larger,
efficient furnaces can produce hot metal at costs competitive with other iron making
technologies" (www2.17). However, one of the biggest drawbacks of blast furnaces is
the inevitable carbon dioxide production as iron is reduced from iron oxides by
carbon and there is no economical substitute - steelmaking is one of the unavoidable
industrial contributors of the CO2 emissions in the world (www2.18).
2-32
Chapter 2 - Literature review
The Electric Arc Furnace (EAF) is now recognised as the primary method of steel
manufacture from scrap metal materials. The environmental benefits attached to the
EAF such as the use of scrap steel as feedstock instead o f raw iron, low carbon
emissions and flexibility with production, adjusting output according to local demand,
is aiding in the reduced use of the blast furnace .The precise control of chemistry and
temperature encourage the use of electric arc furnaces producing many grades of
steel, from concrete reinforcing bars and common merchant-quality standard
channels, bars, and flats to special bar quality grades used for the automotive and oil
industry.
The main drawback with the EAF is that the process does not produce slag as a
result of steel manufacture; therefore, GGBS reserves will begin to decline as blast
furnace output reduces (Burridge 2008).
Silica Fume
Silica fume, or Micro-silica as it is also known, is a by-product o f the manufacture
of silicon and ferrosilicon alloys from high purity quartz and coal in a submerged-arc
electric furnace (Neville 1995). Its fineness and high SiC>2 content make this a very
efficient pozzolan and, like other pozzolanic materials, it is generally more efficient in
concretes having a high water-cement ratio. The expected reduction in compressive
strength associated with a high water / cement ratio can be counteracted through the
use of super plasticizers which maintain the required slump and show an increased
compressive strength at three days and after (Malhotra et al. 1982).
A number o f problems are associated with the use of silica fume. First, due to its
fineness and high silica content, fears are expressed over its use in the powdered form.
Although studies have shown there to be no risk to health, silica fume is supplied
‘pelletised’ for inter-grinding with cement or as‘slurry’ mixed with its own weight of
water and applied directly into the concrete mix (Lewis 1996). Second, silica fume is
a very expensive product (Neville 1995).
2-33
Chapter 2 - Literature review
Suppliers have recognised the value o f silica fume and consequently the price has
escalated significantly. In the early 1980’s silica fume was regarded as a waste
product but as its use has increased so has the price varying from half to twice the cost
of normal Portland cement. Further increases in the price may limit the use of fume to
specialised applications (Malhotra et al. 1982).
The addition o f silica fume to concrete is effective for increasing the compressive
strength, decreasing the drying shrinkage, increasing the abrasion resistance,
increasing the bond strength with the reinforcing steel, and decreasing the
permeability. As a result, silica fume concrete is increasingly used in civil structures
(Li et al. 1998). Future design demands with an increasing need for durability and
performance o f structures will ensure its use escalates into the future (Lewis 2000).
Limestone
The reduced cost of limestone cement is mainly due to energy saving by
substitution of a portion of the calcined clinker by a small amount of limestone. In
many cases, this has also been facilitated by the presence of limestone deposits near
cement kilns. Hence, the limestone additions do not have to be transported over long
distances to cement factories (Kenai et al. 2004).
The limestone filler was considered by many as an inert filler, but it has been
gradually accepted as contributing to the hydration process by the formation of
calcium mono-carboaluminates (C3A . CaCC>3 . 1IH 2O) (Lewis 2003).
Although most European countries produce blended cements, limestone cement is
mainly produced in France where, in 1990, out o f 69 brands of composite cements, 61
brands contained limestone filler alone or with other secondary constituents. Twenty-
nine of these had filler contents between 15% and 25% by mass of cement (Bertrandy
et al. 1999).
2-34
Chapter 2 - Literature review
Now the new European Standard BS EN 197-1 identifies two types of Portland
limestone cement containing 6-20% limestone (type II/A-L) and 21-35% limestone
(type II/B-L). The limestone is inter-ground with the Portland cement clinker which
normally produces 32.5N grade cement (Lewis 2003). This recognises that the
addition o f limestone to Ordinary Portland cement has many benefits. Livesey (1991)
reported that cement with 15% limestone gives a similar strength to OPC concrete if
the cement content is increased by 1 0 %.
Kenai et al. (2004), showed that water permeability of concrete specimens was
lower in concrete with limestone cement and that these findings were consistent with
the findings of other research that found concrete with limestone cement has a lower
oxygen permeability and higher resistance to sulfate attack than OPC concrete.
Tsivilis et al. (1999) conclude that it’s the clinker quality which significantly affects
the gas permeability and sorptivity o f the limestone cement concrete; however, the
effect of the limestone quality on the concrete permeability is not well established.
They state that limestone additions can improve the permeability properties of the
concrete, especially in cements having high C3A content.
The addition of 20% limestone filler was also found to have no detrimental
influence on the resistance to chloride penetration o f pastes and mortars (Homain et
al.. 1995). Kenai also reports that limestone cement behaviour in an outdoor, hot
climate is good, provided initial curing is sufficient (Kenai et al. 2004).
However, Bonavetti et al. (2003) saw some drawbacks to the use of limestone as a
cement replacement. They state that “For low w/c ratio concrete, a large proportion
(more than 35%) of Portland cement remains un-hydrated and acts as an expensive
and energy-consuming filler”. They also report that a reduction in compressive
strength, at 28 days, was measured; for concrete containing up to 18.1% of limestone
filler a compressive strength reduction in the range o f 8 - 1 2 % was achieved.
A further drawback is the fact that limestone is a natural resource. Although
abundant throughout Europe, preservation o f our natural resources must take
precedence and the use of this material limited. With so many other waste materials
available to replace Portland cement the use o f limestone may have a limited lifespan.
2-35
Chapter 2 - Literature review
Metakaolin
There is no national standard covering the use of metakaolin as a cementitious
addition for concrete. The product Metastar Metakaolin is covered by Agrement
Certificate Number 98/3540 which relates to a specific product used at levels up to
20% replacement o f Portland cement (Lewis 2003).
Metakaolin (MK) is a thermally activated alumino-silicate material obtained by
calcining kaolin clay within the temperature range of 700-850°C. It contains typically
50-55% SiC>2 and 40-45% AI2O3 and is highly reactive.
In Portland cement concrete, MK reacts at normal temperatures with calcium
hydroxide (lime) in the cement paste to form mainly calcium silicate hydrates (C-S-
H), C2ASH8 (gehlenite hydrate), and C4AH13 (tetracalcium aluminate hydrate) (Rojas
et al. 2 0 0 2 )
It has been reported that the replacement of cement by 5-15% MK results in
significant increases in compressive strength for high-performance concretes and
mortars at ages o f up to 28 days, particularly at early ages (Poona et al. 2001).
Replacement o f cement in concrete by mineral admixtures produces an immediate
dilution effect such that if the replacement material was totally physically and
chemically inert, concrete strength would be reduced in approximate proportion to the
degree of replacement. However, finely divided mineral admixtures, even if
chemically inert, do have a physical effect in that they behave as fillers. This is
particularly significant in the interfacial zone regions (The region of the cement paste
around the aggregate particles, which is perturbed by the presence of the aggregate.
Its origin lies in the packing o f the cement grains against the much larger aggregate,
which leads to a local increase in porosity and predominance of smaller cement
particles in this region) where they produce more efficient packing at the cement
paste-aggregate particle interface, reduce the amount o f bleeding and produce a
denser, more homogeneous, initial transition zone microstructure and also a narrower
transition zone. Thus, relative to no cement replacement, partial replacement by ultra-
2-36
Chapter 2 - Literature review
fine solids results in a reduction in the strength of pastes (due to the dilution effect)
but an increase in the strength o f concrete (due to an improved transition zone) (Wild
et al. 1996).
Wild et al.. (1996) reported that the filler effect is immediate, with OPC having a
major impact in the first 24 hours and maximum effect o f the pozzolanic reaction
occurring at between 7 and 14 days. However, Zhang et al. (1995) recognised that the
MK concrete had higher strength properties at all ages up to 180 days compared to a
control concrete and reiterated the fact that MK concrete showed a faster strength
development at early ages.
Wild et al. (1996) also suggested that an optimum replacement level of 20%
should be used to maximise the concretes’ long term strength enhancement. However,
the increased heat o f hydration from the rapid early strength development can be as
much as 15% more than that o f a 100% OPC mortar, it has been shown that this can
be controlled through the use o f a replacement level of up to 10% (Frias et al. 2000).
Lagier et al. (2007) confirmed that strong exothermic reactions occurred in all
cements blended with MK particularly in the first 24 hours. They reported that the
reaction o f metakaolin appears to be quite sensitive to variations in total alkali content
in the cement in particular when the alkali content increases. They proposed that an
increasing rate of metakaolin dissolution with increasing cement alkali content may
accelerate or intensify the reaction of the C3A phase and that the results demonstrated
that the reaction of MK during early hydration does vary with cement type.
Municipal Solid Waste Ash (MSWA)
It is difficult to get hold of reliable up to date estimates on the amount of
municipal waste landfilled annually. It could be assumed that trends established in the
early part of this decade will continue; however, with recycling schemes becoming
evermore prevalent some authorities are already reporting annual reductions in their
2004 figures over previous years (www 2.18.1).
2-37
Chapter 2 - Literature review
The UK produces 420 million tonnes of waste each year, of which 30 million
tonnes is municipal waste. In England the total amount of municipal waste has
continued to rise to an estimated 28.8 million tonnes in 2 0 0 1 / 0 2 compared to 28.1
million tonnes in 2000/01, an increase o f 2.4 per cent. The proportion of municipal
waste being recycled or composted increased from 12.3 per cent in 2000/01 to 13.5
per cent in 2001/02. The proportion of waste incinerated with energy recovery has
remained roughly constant at just under 9 per cent in 2000/01 and 2001/02. The
proportion of municipal waste being disposed in landfill has decreased from 78 per
cent in 2000/01 to 77 per cent in 2001/02. However, the actual tonnage of municipal
waste disposed of in landfill has still increased slightly from 2 2 . 1 million tonnes in
2000/01 to 22.3 million tonnes in 2001/02. Past studies showed that the average
Biodegradable Municipal Waste (BMW) content of household waste in England is
63%. In 2009/10, English local authorities sent 8.4 million tonnes of BMW to landfill.
This is 1 million tonnes less than the previous year and nearly 3 million tonnes less
than local authorities could have landfilled if all 11.2 million tonnes Landfill
Allowance Trading Scheme (LATS) allowances had been used (www2.19).
Pan et al. (2007), in their research into the use o f MSWA as a cement
replacement, recognised the fact that the ash is rich in heavy metals and salts and
without proper treatment may cause serious environmental problems.
Studies by Sakai and Hiraoka (2000) indicate that there are much more volatile
heavy metals (e.g., Hg, Pb, Cd) and toxic organic substances in fly ash than in bottom
ash. The leaching characteristic of these hazardous materials leads to secondary
pollution of groundwater after landfilling. Therefore, MSWA fly ash was classified as
hazardous waste requiring additional processing in most countries worldwide.
The results from the melting treatment of fly ash collected from MSW incinerators
are described in work carried out by Abe et al. (1996). The fly ash used had an
average particle size of 22 pm and a melting fluidity point of 1280-1330°C and was
melted using a Kubota melting furnace without any additives. They found that 8 8 % of
the fly ash was turned to slag and 1 2 % to dust, which contained a lot of heavy metals
such as Pb and Zn. The leaching levels o f heavy metals from slag was significantly
lower than those o f bottom and fly ashes from municipal solid waste incinerators;
2-38
Chapter 2 - Literature review
however, the leaching rates were dependent on pH levels such that leachate increased
at lower pH levels.
Lin et al. (2003), discuss the use of this MSW fly ash slag produced via heat
treatment. They conclude that MSWA fly ash slag is non-hazardous and can thus be
classified as general industrial waste. Thus, the recycling of MSWI fly ash slag would
not result in further environmental pollution. They observed the crystalline structure
revealing that all mortars with partial MSWI fly ash slag substitutions had a similar
crystalline composition, containing 3 CaO/SiC>2 , 2 CaO/SiC>2 , Ca(OH)2 , CSH
(Tobermolite), and C3AH6 (Calcium Aluminate Hydrate).
It has been shown that MSWA is a stable and effective cement replacement if
subjected to a process of heat treatment. This has the effect of reducing use of a
natural resource (limestone) in the making of cement, and for the disposal of a waste
material; however, much energy and natural resource will be used in providing the
temperatures needed to process the ash.
2.8 Fly Ash
The burning o f coal supplies around 40% of the UK electricity, as shown in
Figure 2.6. With the well publicised issues of security of electricity supply relating to
natural gas, the gradual decline of the existing nuclear power stations, the issues and
timescales involved with building new nuclear power stations and slow development
o f renewable forms of electricity generation and their dependence on the forces of
nature, it would appear that pulverised coal fired power generation will be necessary
for some years to come. Even in future years, the development of clean coal power
stations with carbon capture will still lead to the production of ash. As there are
estimated to be in excess of 2 0 0 years of coal in reserves around the world, such an
energy resource cannot simply be ignored (UKQAA 2007).
Mathews (2007) in his paper “Seven steps to curb global warming” states that
‘Coal will continue to be the largest source o f the world’s electricity generation, in the
2-39
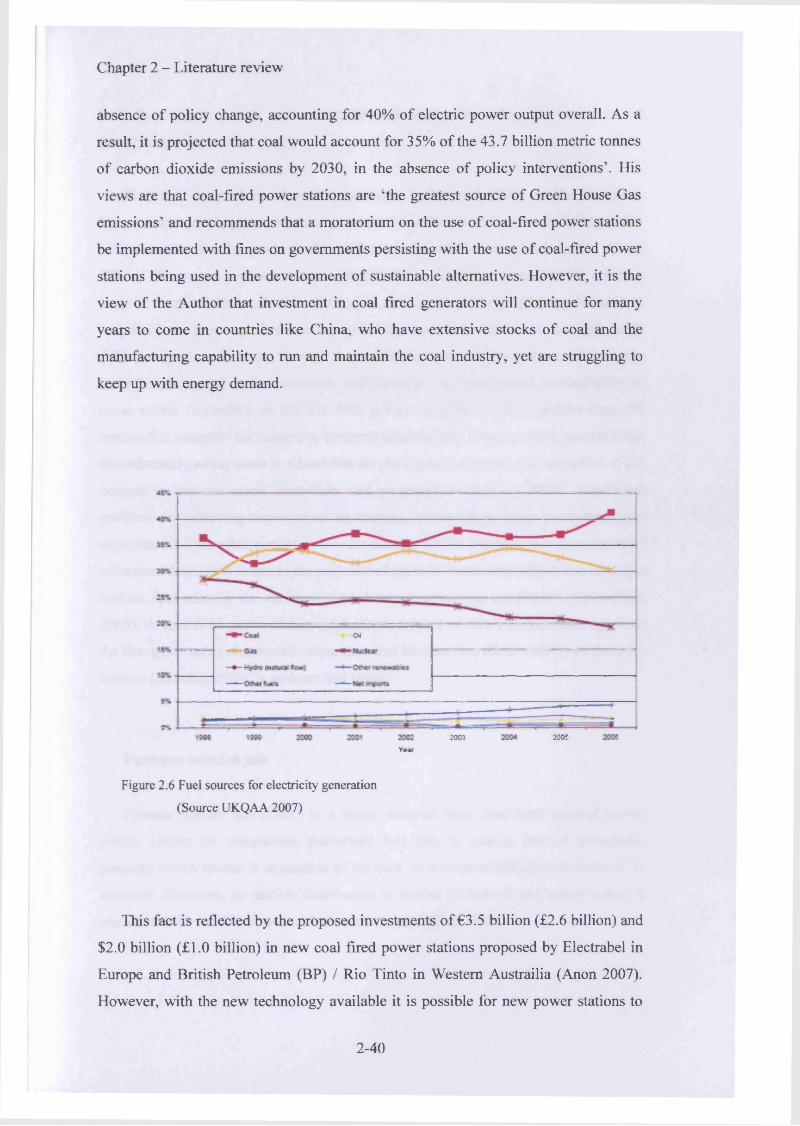
Chapter 2 - Literature review
absence of policy change, accounting for 40% of electric power output overall. As a
result, it is projected that coal would account for 35% of the 43.7 billion metric tonnes
of carbon dioxide emissions by 2030, in the absence of policy interventions’. His
views are that coal-fired power stations are ‘the greatest source of Green House Gas
emissions’ and recommends that a moratorium on the use of coal-fired power stations
be implemented with fines on governments persisting with the use of coal-fired power
stations being used in the development of sustainable alternatives. However, it is the
view of the Author that investment in coal fired generators will continue for many
years to come in countries like China, who have extensive stocks of coal and the
manufacturing capability to run and maintain the coal industry, yet are struggling to
keep up with energy demand.
04
0%200!2003
V f tM
Figure 2.6 Fuel sources for electricity generation
(Source UKQAA 2007)
This fact is reflected by the proposed investments of €3.5 billion (£2.6 billion) and
$2.0 billion (£1.0 billion) in new coal fired power stations proposed by Electrabel in
Europe and British Petroleum (BP) / Rio Tinto in Western Austrailia (Anon 2007).
However, with the new technology available it is possible for new power stations to
2-40
Chapter 2 - Literature review
be fully integrated with carbon capture and storage to reduce its emissions of
greenhouse gases.
The main by-product of coal combustion is Fly Ash (FA). In the European
Community electric power stations generate 55 million metric tons (ECOBA, 2003)
of coal combustion by-products, 44 million tons o f which corresponds to FA. About
50% of this annual production is used in the cement industry, given that FA contains
large amounts of silicon dioxide (SiC>2) and aluminium oxide (AI2O3) and because of
its pozzolanic property after reacting with lime and water. However, nitrogen oxide
(NOx) emissions reduction, through the installation of low NOx burners, often results
in higher unbumed carbon contents, and therefore in a decreased marketability of
some ashes. According to BS EN 450, a loss-on-ignition (LOI) greater than 7%
renders FA unusable for cement or concrete manufacture. It is generally accepted that
the unbumed carbon tends to adsorb the air entrainment reagents that are added to the
cement to prevent crack formation and propagation (Rubioa 2008). Significant
problems in achieving the required air content, and batch to batch consistence, are
experienced. This often results in low air content and/or much higher than expected
admixture dose. This is due to the presence of partially burnt coal, which has an active
surface that adsorbs the surfactants used as air-entraining admixtures (Dransfield.
2005). A coal fired power station produces two types o f ash, Fly Ash removed from
the flue gases using electrostatic separators and Bottom Ash (BA) withdrawn from the
furnace (Meininger 1982), as described below:
Furnace bottom ash
Furnace bottom ash (FBA) is a waste material from coal-fired thermal power
plants. Unlike its companion, pulverised fuel ash, it usually has no pozzolanic
property which makes it unsuitable to be used as a cement replacement material in
concrete. However, its particle distribution is similar to that of sand which makes it
attractive to be used as a sand replacement material (Bai, 2005).
2-41
Chapter 2 - Literature review
The coarse, fused, glassy texture of FBA would normally make an ideal substitute
for natural aggregates (Ramme et al.., 1998). An important use of bottom ash is as a
base layer material in road construction (Churcill and Amirkhanian, 1999). Also, there
has been research concerning whether FBA could partially or entirely replace natural
gravel in the production of a concrete presenting a 28-day compressive strength of 25
MPa (Pera et al. 1997).
The primary use for FBA has been for many years in block making. Many still
refer to ‘breeze blocks’, with breeze being the fore-runner to FBA. Because FBA is
flushed from the furnace by high pressure water jets, it is a far superior product to
‘breeze’, which ceased to be available anyway as the older furnaces were replaced.
Subsequently FBA became the preferred product by the block manufacturers as a
lightweight aggregate. Currently 99% of UK FBA production is used in lightweight
aggregate block manufacture (Sear, 2004).
In recent years, due to the contraction in the number o f coal burning power
stations and changes in burner technologies to reduce emissions, there is reduced
production and a shortage of FBA. Block manufacturers are having to source similar
materials, ranging from recovered bottom ash, incinerator bottom ash and pumice
from a variety of sources, including imports. Unfortunately, many o f these options
involve greater transport distances, processing or depletion o f virgin aggregates
adding to the environmental impact (Sear, 2007).
Fly ash
Pulverised Fuel Ash (PFA) has been used in concrete for over 50 years. It has
been the subject o f research for over 70 years with in excess of 10,000 papers being
published (Sear 2005). In the UK, research was carried out which led to the
construction of the Lednock, Clatworthy and Lubreoch Dams during the 1950’s with
fly ash as a partial cementitious material (Lewis et al. 2003).
During the 1970’s ready mix concrete suppliers were producing ever more
technically demanding concretes o f higher strengths and lower water cement ratios. It
2-42
Chapter 2 - Literature review
was perceived that the variability in quality and the supply problems of PFA when
taken directly from the power station were unacceptable (Sear 2001a). In line with
Europe, PFA is now referred to as Fly Ash (FA) and its requirements for use in
concrete and mortar are covered in the European Standard BS EN 450 (BS EN 450
2005).
As far as the effect of FA variability on the performance of FA concrete is
concerned, the most important aspect of physical property is the fineness of the FA,
and the most important aspect of chemical property is the carbon content (Balendran
et al. 1995).
Carbon content
Residual carbon content and the fineness of FA depend mainly on the condition of
the furnace and FA collection system. Atis (2005), whilst looking at high volume fly
ash in concrete, reported that high carbon content is believed to reduce the workability
and increase the water demand when used in concrete. Comparing two sources of fly
ash it was found that the ash with the increased loss on ignition required higher water
content and, hence, produced a lower compressive strength. Neville (1995) recognised
that carbon content was partially dependent on fineness as carbon particles tend to be
the coarser fly ash particles. Jones et al. (2006a) in their study into the effects of fly
ash fineness on mortar found that the greatest change noted in bulk chemistry was the
reduction in LOI with cycloning the material to remove the coarser fraction (34%
difference between the parent FA and the resultant finer FA).
Carbon has other detrimental effects on concrete. Ha et al. (2005) studied the
effect of carbon content on reinforcing steel (rebar) and concluded that rebar
embedded in Ordinary Portland cement suffered severe corrosion when the carbon
level in fly ash was increased, especially beyond 8 %.
Residual carbon in fly ash may also interfere with air entraining admixtures
(AEAs) added to enhance air entrainment in concrete in order to increase its
consistence and resistance toward freezing and thawing conditions. Pedersen et al.
(2008) showed that not only the amount, but also the properties of carbon, such as
particle size and surface chemistry, have an impact on the adsorption capacity of
2-43

Chapter 2 - Literature review
AEAs. Owens (1979) concluded that control of the material retained on the 45pm
sieve is the key to a less variable material. Dhir et al. (1981), however, believe this not
to be the most suitable test but that specific surface may be a somewhat better
measure of ash fineness in view of its stronger correlation with strength. However, it
would appear that they are both in agreement that fineness is an important
characteristic o f Fly Ash.
Fineness
Fly ash changes the flow behaviour o f the cement paste. With the same
consistence, concrete with fly ash is easier to compact than concrete without fly ash,
due to the lubricating effect of the spherical fly ash particles in the mix. Also due to
the improved cohesiveness of the mix, arising from the contribution of the fine fly ash
particles as aggregate supplement and in blocking the bleed water channel, there is
less bleeding and segregation (Balendran 1995). It is generally agreed that the use of
fine FA improves the properties of concrete. Dhir et al. (1985) regard fineness as the
most suitable single parameter with which to classify ashes physically, since it relates
to other important ash characteristics.
Erdogdu and Turker (1998) studied the use of various particle gradings of FA and
found that a sieved fine FA gives an improved strength relative to that of the original
coarser FA. Lee et al. (1999) obtained same source FA with three different fineness
values. They concluded that the reactive calcium hydroxide Ca(OH) 2 within the fine
FA paste was greater than that of the coarser FA cement paste. They also noted that
the finer the material the greater the density, lower the carbon content and higher
glass content; however, they concluded that it is the fineness of the material rather
than the glass content that made the material more reactive.
Chindaprasirt et al. (2004) also studied the effect of FA fineness on mortar and
concluded that the different fineness portions of FA appeared to have a slight
variation in both physical and chemical properties. Their test results showed that
fineness had a marked effect on the compressive strength as well as drying shrinkage
and sulfate resistance with the finer FA being more reactive, a better void filler and
used less water for the same consistence.
2-44

Chapter 2 - Literature review
As mentioned earlier, a pozzolanic material works when a large surface area is
exposed to the alkaline environment; therefore, fineness of the material is an
important property not only for the chemical interactions required but for the
reduction in carbon content. The second most important area must be that the fly ash
contains the correct chemistry to interact with the cement.
Chemistry
Fly ashes are complex in their range o f chemical and phase compositions. They
consist of heterogeneous combinations of glassy and crystalline phases (ACI
Committee 226 1987).
Fly ash consists principally of the oxides of silicon and iron with varying amounts
of constituents containing aluminium and some unbumed carbon. Other trace
elements such as potassium, phosphorous, cobalt, molybdenum, boron, or manganese
may be present (Lane et al. 1982).
Two general classes of fly ash can be defined: low-calcium fly ash (FL) produced
by burning anthracite or bituminous coal, and high-calcium fly ash (FH) produced by
burning lignite or sub-bituminous coal. FL is categorized as a normal pozzolan, a
material consisting of silicate glass, modified with aluminum and iron. The CaO
content is less than 10%. FL requires Ca(OH)2 to form strength-developing products
(pozzolanic activity), and, therefore, is used in combination with Portland cement,
which produces Ca(OH) 2 during its hydration (Papadakis 1999).
BS EN 450 deals with siliceous fly ash only, classified by the requirement that the
sum of the contents of silicon dioxide (Si0 2 ), aluminium oxide (AI2O3) and iron oxide
(Fe2 0 3 ) shall not be less than 70% by mass; this is a pozzolanic material. Where the
reactive calcium oxide exceeds 1 0 % by mass the classification becomes a calcareous
fly ash (BS EN 450, BS EN 197).
As was mentioned previously (Section 2.6), the setting and hardening of Portland
cement occur as a result o f the reaction between the compounds of cement and water.
2-45
Chapter 2 - Literature review
The form of the two calcium silicates are similar and differ only in the amount of
calcium hydroxide formed as shown below (Malhotra 1994):
2C3S + 6 H -> C3S2H3 + 3CH
tricalcium silicate + water —> C-S-H + calcium hydroxide (1)
2C2S + 4H -► C3S2H3 + CH
dicalcium silicate + water —► C-S-H + calcium hydroxide (2)
Pozzolanic reactions refer to chemical reactions between active silicon dioxide
(S i02) within the fly ash and the calcium hydroxide (CH) produced as a by-product
from the cement hydration. The chemical reaction is simplified as follows:
CH + S + H = C - S - H
C-S-H gels account for the main strength of concrete, with CH contributing little
to concrete build up; for pozzolanic reactions, fly ash combines and consumes CH and
forms new C-S-H gels, which contribute more to the strength build up of concrete
(Wang 2008). It is the time spent producing the calcium hydroxide that causes this
delayed secondary reaction.
Sulphite and sulphate in fly ash
Sulphur generally exists in two forms within concrete, as a sulphite (SO3) and as a
Sulphate (SO4). When calculating the compound composition of cements the normal
convention, within cement manufacture, is to assume that all the SO3 present is
combined with Calcium Oxide (CaO) and is therefore present as calcium sulphate
CaS0 4 (gypsum) (Moir 2003). Approximately 5% of the dehydrated form of gypsum
(CaS0 4 ) is added to the clinker prior to the grinding process. Dehydrated gypsum
within cement dissolves rapidly when water is added to the concrete and is beneficial
in ensuring that sufficient Ca2+ and S0 2 4 ions are available in solution to control the
initial reactivity o f the tricalcium aluminate (C3A) through the formation of a
protective layer of ettringite C3A«3 CaS0 4 .
2-46
Chapter 2 - Literature review
Ettringite is one of the most important substances in conventional portland
cement-based concrete. When water is intermixed with portland cement ettringite
quickly forms, a reaction which allows normal-setting concrete to be produced.
Without the ettringite concrete would set al.most instantaneously in a reaction known
as flash set (Hime, W. Erlin, B. 2004).The reaction can be summarised as follows:
C3A + dissolved calcium (CA2+) + dissolved sulfate (S0 2 4) + water = ettringite
If, however, the supply of dehydrated gypsum is too high, then crystals of gypsum
crystallise from solution and cause ‘false set’. As implied by its name, false set gives
the impression that the concrete has hardened but if mixing is continued, or resumed,
the initial level of workability is restored (Moir 2003).
Fly ash has SO4 present at its surface which is released into the mix, delaying the
initial setting only, further setting reactions are unaffected (Neville 1995).Typically
fresh fly ash contains between 0.35 and 2.5% sulphate as SO3 . The sulphate in fly ash
exists as gypsum, which has limited solubility in water. Therefore, when used as a fill
material it has the potential to cause sulphate attack, but in practice there is no known
case of such attack in concrete adjacent to fly ash (www2 .2 0 ).
Sulphate attack has long been recognised as responsible for concrete deterioration
in a wide variety of structures. Sulphate attack in concrete has been known to occur
when sulphate solutions, derived either from a constituent in the concrete such as
aggregate or from external sources such as groundwater, react with the calcium
aluminate hydrates present in the hardened cement to form ettringite. Formation of
ettringite has a deteriorative effect on the mortar strength and, in addition, causes
expansion which may result in micro-cracking o f the cement paste (Ghafoori, N.
Kassel, S. 1999). This expansive reaction can inflict serious damage on concrete,
leading to weakening and perhaps ultimately failure o f the affected structure.
Besides the conventional sulphate reaction in mortars and concretes involving the
formation and the expansive properties o f ettringite, another kind o f sulphate attack
attributed to the formation of thaumasite (CaSiC>3 .CaCC>3 .CaSC>4 .I 5 H2O) has been
2-47
Chapter 2 - Literature review
widely discussed during recent years (Skaropoulou, A. et al. 2009). Research has
shown that Portland limestone cement pastes are susceptible to the thaumasite
formation after only a few months exposure to sulphate solutions. This is a serious
problem as limestone has increasingly been used as a filler or as a main cement
constituent for many years (Tsivilis, S. et al. 2002). Thaumasite attacks the surfaces of
concrete which come into contact with ground containing sulphates which is usually
sea water.
Thaumasite formation requires a source of calcium silicate, sulfate and carbonate
ions, excess humidity and preferably low temperature within the hardened cement
paste to form the mineral. The structural similarity to ettringite allows thaumasite to
use this as a template for its initial nucleation. However this mineral is a more
complex salt than ettringite, forms at low temperatures (below 15°C) and is associated
with the presence of finely divided limestone sometimes used as filler, though
limestone aggregate may also promote the reaction. Thaumasite formation renders the
cement paste soft with concomitant loss of strength and disintegration of the concrete
(www2.21, Lewis et al. 2003).
Particle shape and pozzolanic activity
The shape, particle size distribution, density and composition of fly ash particles
influence the properties of freshly mixed, unhardened concrete and the strength
development of hardened concrete (ACI Committee 226 1987). Fly ash particles of
less than 50 pm are generally spherical with the larger sizes being more irregular
(Lewis 2003). It has been found that the consistence of concrete increases as the
replacement of cement with fly ash increases. Siddique (2006) concluded this and
reasoned that the “ball bearing” action of the spherical particles of fly ash were
responsible for this. However, Jones et al. (2006a) reported that whilst ultra fine fly
ash increased the flow of mortars at both 15% and 30%, its coarser parent ash had an
adverse effect on mortar consistence, as flow decreased with increasing FA contents.
The strength of fly ash concrete will, therefore, depend on whether a water reduction
is achieved, plus the pozzolanic performance of the cement/fly ash combination
(Lewis 2003).
2-48
Chapter 2 - Literature review
Therefore, it would seem that fineness affects many aspects of concrete. It affects
the particle shape, the water demand o f the concrete which in turn affects the strength
and the pozzolanic behaviour of the material.
Other requirements affected through the use of fly ash include setting time and
curing which are discussed below.
It has been reported that Fly Ash retards the initial hydration of cement and
increases the setting time of the concrete. Concrete Society Technical Report No. 40
(Concrete Society 1991), suggests that a 30 per cent FA replacement would lengthen
the setting time by up to 4 hours when the mix temperature is 5°C, but such
lengthening is reduced to one hour when the mix temperature is 25°C. However,
Balendran et al. (1995) recognised that the setting time is influenced by many other
factors, including the cementitious content, type, fineness, composition, water
content, the presence of admixture, and the adsorption of the admixture by the FA
particles. Hence, if setting time is a critical factor, trials using the materials under
consideration should be carried out. Longer setting time may increase the chances of
plastic shrinkage cracking or surface crusting under conditions o f high evaporation
rates.
Since the strength of concrete depends considerably upon the hydration of the
cement, it is essential that moisture is present to enable hydration to continue (Lydon
1982). If concrete is allowed to dry out, hydration will cease prematurely (Soroka
1998).
Escalante-Garcia et al. (2001) state that the high temperatures achieved in
concrete, from hot weather or accumulated heat of hydration, have an adverse effect
on the concrete microstructure effecting porosity and that the ultimate degree of
hydration of the anhydrous cement phases is reduced. This has a negative effect on
the concrete leading to inferior mechanical properties and a concrete prone to
chemical attack.
2-49
Chapter 2 - Literature review
Kim et al. (2002) studied the effect that curing temperature and ageing had on the
compressive strength of concrete. They concluded that compressive strength of
concrete subject to high temperature at early ages attains higher early-age
compressive and splitting tensile strengths, but lower later-age compressive and
splitting tensile strength. Elastic modulus has the same tendency; the crossover effect
of curing temperature on elastic modulus being not as obvious as the compressive
strength. Thus, early temperature rise is detrimental to OPC concrete strength but not
to fly ash concrete. A 60°C temperature rise can reduce strength in OPC concrete by
up to 30% but can boost fly ash concrete strength by over 10 % (Dhir 1986).
Thermal cracks that usually occur in mass concrete are closely related to the
thermal behavior of cement matrix, such as heat liberation, temperature rise and
thermal shrinkage. Through the addition of mineral admixtures a reduction in the total
heat liberation occurs and lowers the peak temperature of cement pastes, which is
favorable for thermal crack prevention. (Lane et al. 1982, Liwu et al. 2006).This
makes fly ash application particularly advantageous in pre-cast structural concrete
construction and mass concrete or cement-rich concrete sections.
2.9 Conclusion
The latter part of this review has identified a small section of the research that has
been, and is currently being, undertaken in an attempt to understand the fundamental
use of fly ash. The properties important to its use in concrete have been considered
here and this background has been applied to the construction o f a methodology for
the research work presented in this thesis.
Various prospective cement replacement materials have been identified, some
already incorporated within a British and European standard, whilst others are yet to
have their full potential realised. Whilst a number of cement replacement materials
have been discussed in this review much more work is being carried out on other
materials which are not directly relevant to this research.
2-50
Chapter 2 - Literature review
However, in carrying out this review, no literature was found comparing potential
cement replacement materials with materials already accepted within the industry as
being a good cement additive. This then leads to the question that if the important
elements of a cement replacement can be documented, will it then be possible to
measure the potential of a new material seeking to be a cement replacement?
The research will concentrate on the material’s physical and chemical composition
and the performance within concrete and mortar. This information will then be used to
establish what makes it a good cement replacement.
The important factors to be investigated are:
o Fineness
o Grading
o Particle shape
o Carbon content
o Elemental make up
On completion it should be possible to analyse a material from an unknown
source and within 24 hours have an answer to the question o f whether or not this
material has the potential to make a good cement replacement. On establishing this,
longer term concrete and mortar trials can then be initiated.
2-51

Chapter 3 - Experimental methods
3. Experimental methods
3.1 Testing regime and mix details
3.2 Materials
3.3 Traditional strength tests
3.4 Permeability test
3.5 Physical analysis
3.6 Chemical analysis
3.7 Inter-grinding
3.1 Testing regime and mix details
3.1.1 Mix designs
This research programme uses an Ordinary Portland Cement (referred to as
CEM I in BS EN 197-1:2000) a Ground Granulated Blast Furnace Slag (GGBS), both
conforming to BS EN 197-1:2000, and cement replacement materials obtained from
various sources. The cement is a Blue Circle 52.5 Newton CEM I supplied by Lafarge
cement at Aberthaw South Wales. The GGBS was supplied by Civil and Marine from
their depot at Llanwem, South Wales.
The measure of performance for the new replacement materials was judged
against control mixes of 100% CEM I and a blend, 50 / 50 by mass, CEM I / GGBS.
The replacement materials were blended in the ranges 20%, 25%, 27%, 30%, 33%
and 35% by mass replacement with CEM I. Concrete mix designs containing a range
of cement contents, between 140kg/m3 and 450kg/m3, were produced using each of
these replacement percentages and concrete mixed. The only variable used in the
mixing process was the water content which was adjusted to maintain consistence.
The S2 consistence class to BS EN 206:1-2000 has been used to achieve a target
3-1
Chapter 3 - Experimental methods
slump of 70mm. A Water Reducing Agent (WRA) Sika Plastiment 160 at a quantity
of 0.4% of the cement content was used within the concrete.
3.1.2 Mix designs
The mix designs used for this research are the actual recipes taken from the
batching plants of Lafarge Aggregates Ltd, South Wales, and can be seen in Appendix
1. This research has had in place a comprehensive mixing and testing regime from the
outset and mix volumes were calculated from the samples required. The initial mixes
completed the full range of tests and required that 40 litres of concrete be produced
whilst subsequent mixes required only 25 litres. A control mix was repeated at 25
litres to ensure that no differences could be attributed to the reduced batch volume.
3.1.3 Mix procedure
When producing trial mixes, the most realistic procedure is to use wet rather
than dry aggregates. In the laboratory it is usual to have air dried aggregates and these
should be batched and soaked for about thirty minutes with sufficient water to bring
them to a saturated condition (Lydon 1982). Ensuring that the aggregates were used in
their saturated condition removed the requirement of carrying out moisture content
checks before each mix as the moisture content became constant. Also, the aggregates
were collected over a period of some years and the quality and quantity o f fine
particles coating the aggregate may have changed, so this would have affected both
the amount of water added to the mix and the strength of the hardened concrete. This
issue was overcome by the soaking process removing these fine particles from the
material leaving a clean aggregate.
After soaking for thirty minutes the coarse aggregates were sieved, to drain the
excess water, and then reweighed to adjust for the increased weight due to water
absorption. Mixing of the concrete was carried out using a 160kg capacity Liner
horizontal rotary drum mixer. The coarse and fine aggregates were mixed first
followed by the CEM I and replacement material. Admixture was weighed and added
to a measuring cylinder containing 1 litre of clean water, this was poured into the mix
ensuring even distribution throughout. Further water was added until the consistence
3-2
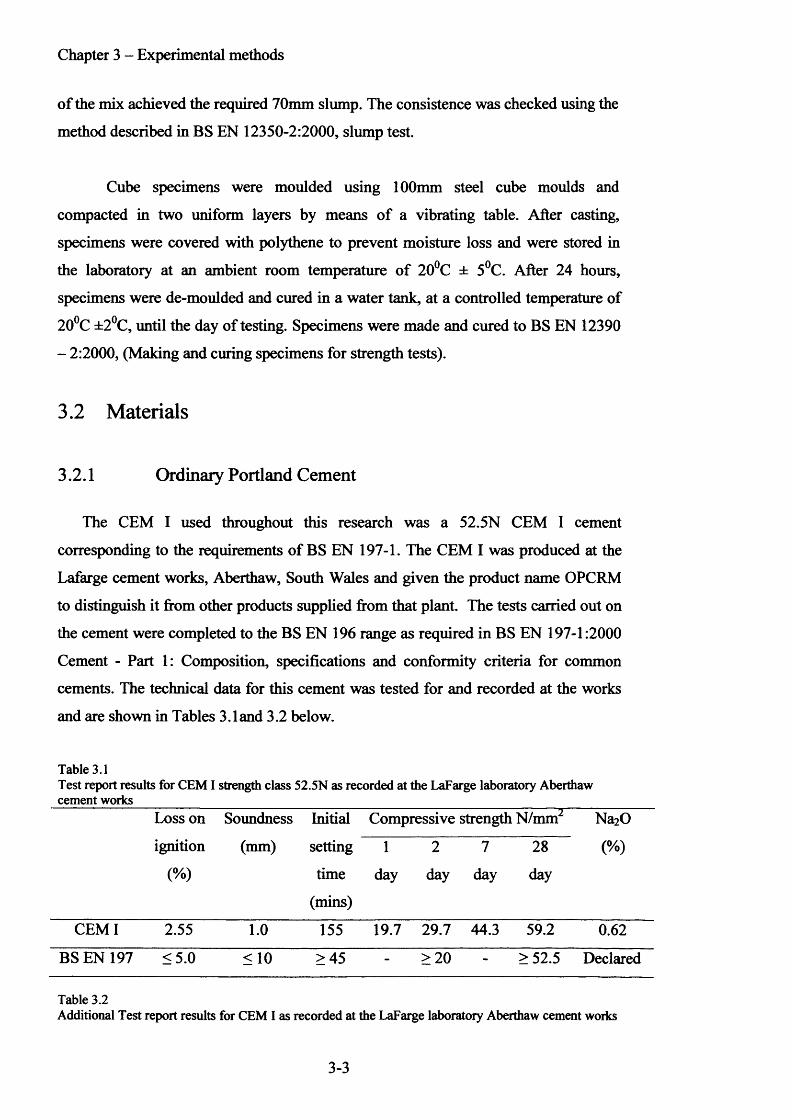
Chapter 3 - Experimental methods
of the mix achieved the required 70mm slump. The consistence was checked using the
method described in BS EN 12350-2:2000, slump test.
Cube specimens were moulded using 100mm steel cube moulds and
compacted in two uniform layers by means o f a vibrating table. After casting,
specimens were covered with polythene to prevent moisture loss and were stored in
the laboratory at an ambient room temperature of 20°C ± 5°C. After 24 hours,
specimens were de-moulded and cured in a water tank, at a controlled temperature of
20°C ±2°C, until the day of testing. Specimens were made and cured to BS EN 12390
- 2:2000, (Making and curing specimens for strength tests).
3.2 Materials
3.2.1 Ordinary Portland Cement
The CEM I used throughout this research was a 52.5N CEM I cement
corresponding to the requirements of BS EN 197-1. The CEM I was produced at the
Lafarge cement works, Aberthaw, South Wales and given the product name OPCRM
to distinguish it from other products supplied from that plant. The tests carried out on
the cement were completed to the BS EN 196 range as required in BS EN 197-1:2000
Cement - Part 1: Composition, specifications and conformity criteria for common
cements. The technical data for this cement was tested for and recorded at the works
and are shown in Tables 3.land 3.2 below.
Table 3.1Test report results for CEM I strength class 52.5N as recorded at the LaFarge laboratory Aberthaw cement works
Loss on Soundness Initial Compressive strength N/mm2 Na20
ignition (mm) setting 1 2 7 28 (%)
(%) time
(mins)
day day day day
CEM I 2.55 1 . 0 155 19.7 29.7 44.3 59.2 0.62
BS EN 197 <5.0 < 1 0 >45 - > 2 0 - >52.5 Declared
Table 3.2Additional Test report results for CEM 1 as recorded at the LaFarge laboratory Aberthaw cement works
3-3
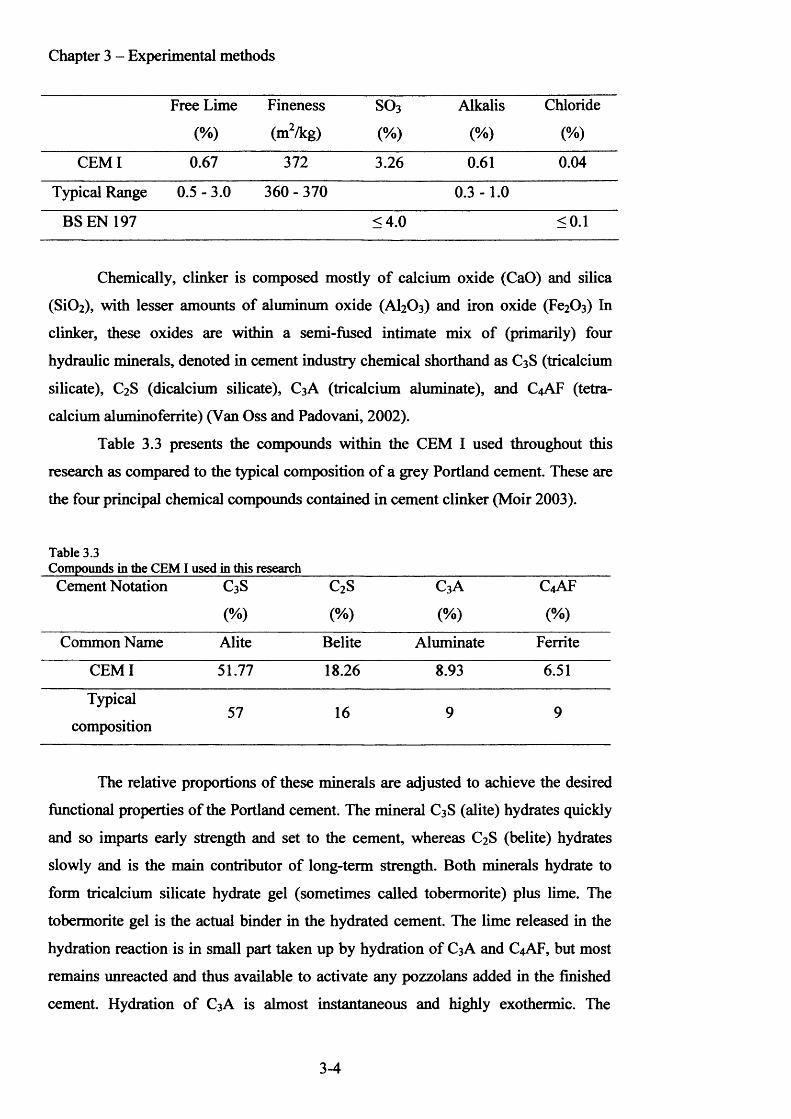
Chapter 3 - Experimental methods
Free Lime Fineness SO3 Alkalis Chloride
<%) (m2/kg) (%) (%) (%)
CEM I 0.67 372 3.26 0.61 0.04
Typical Range 0.5 - 3.0 360 - 370 0.3 -1.0
BS EN 197 <4.0 < 0 . 1
Chemically, clinker is composed mostly o f calcium oxide (CaO) and silica
(SiC>2), with lesser amounts of aluminum oxide (AI2O3) and iron oxide (Fe2C>3) In
clinker, these oxides are within a semi-fused intimate mix of (primarily) four
hydraulic minerals, denoted in cement industry chemical shorthand as C3 S (tricalcium
silicate), C2S (dicalcium silicate), C3A (tricalcium aluminate), and C4AF (tetra-
calcium aluminoferrite) (Van Oss and Padovani, 2002).
Table 3.3 presents the compounds within the CEM I used throughout this
research as compared to the typical composition o f a grey Portland cement. These are
the four principal chemical compounds contained in cement clinker (Moir 2003).
Table 3.3Compounds in the CEM I used in this research
Cement Notation C3S C2S c 3a C4AF
(%) (%) (%) (%)
Common Name Alite Belite Aluminate Ferrite
CEM I 51.77 18.26 8.93 6.51
Typical
composition57 16 9 9
The relative proportions of these minerals are adjusted to achieve the desired
functional properties of the Portland cement. The mineral C3S (alite) hydrates quickly
and so imparts early strength and set to the cement, whereas C2S (belite) hydrates
slowly and is the main contributor of long-term strength. Both minerals hydrate to
form tricalcium silicate hydrate gel (sometimes called tobermorite) plus lime. The
tobermorite gel is the actual binder in the hydrated cement. The lime released in the
hydration reaction is in small part taken up by hydration of C3A and C4AF, but most
remains unreacted and thus available to activate any pozzolans added in the finished
cement. Hydration o f C3A is almost instantaneous and highly exothermic. The
3-4
Chapter 3 - Experimental methods
mineral thus speeds the development o f early strength and set, sometimes to the point
o f causing flash set, therefore gypsum is added to control this. The main function of
the aluminoferrite mineral (C4AF) is as a flux, that is, it acts to lower the temperature
at which the clinker minerals form (i.e. clinkering temperature). This mineral also
imparts the grey colour to Portland cement and for this reason its formation avoided,
through the use of only iron-free raw materials and higher clinkering temperatures, in
the production of white Portland cement, which is a much higher priced product than
grey (“ordinary”) Portland cement (Van Oss and Padovani, 2002).
3.2.2 Replacement materials
Ground Granulated Blast furnace Slag (GGBS)
The GGBS used throughout this research was supplied by ‘Civil and Marine’
from their Llanwem works, South Wales and conformed to BS EN 197 - 1: 2000.
Fly ash
The main focus of this study is the fly ash supplied by RWE npower, operators
of the power station located at Aberthaw, South Wales. The power station is being
upgraded and a new separation process is being installed to convert fly ash collected
at the plant from a waste material to a usable one. A similar system is already in
operation at Longannet power station, Scotland. The ash produced at Aberthaw power
station was transported to Longannet in order to replicate the separation process being
installed at Aberthaw. The ash was returned from Longannet in three forms:
• Classified
• Processed
• High Carbon waste product
with the raw ash used coming directly from Aberthaw power station. By processing
the ash it is expected that both the processed and the classified ash will conform to BS
3-5
Chapter 3 - Experimental methods
EN 450 - 1: 2005, whilst the raw fly ash and High Carbon waste ash will fall outside
the limitations of this standard.
A second fly ash examined during this research was supplied from Didcot A
power station, Oxforshire; also run by RWE npower. Ash from Didcot A is used to
manufacture building blocks at a factory on the adjacent Milton Park and transported
to Thatcham (near Newbury, Berkshire) for the manufacture o f Thermalite aerated
breeze blocks using both decarbonized fly and raw ash, however; most is mixed with
water and pumped via a pipeline to former quarries in Radley (www3.1). This ash had
been subjected to a decarbonisation processing technique and conformed to BS EN
4 5 0 -1 :2 0 0 5 .
Sewage sludge ash
The Sewage sludge ash used throughout this research was supplied by
Yorkshire Water, Bradford, UK. The ash was produced through the incineration of the
sludge cake following a drying process which included the use o f centrifuges and belt
presses and sludge drying beds. The ash particles were removed from the fluidised-
bed incinerator flue gases by an electrostatic precipitator.
Municipal solid waste ash
The municipal solid waste ash used throughout this research was supplied by Veolia
from their Tyseley waste disposal unit, Birmingham. The waste is delivered to the
works directly from the collection vehicles. From there the waste is manoeuvred onto
conveyors which transport the waste to the incinerator. The particulate matter (fly
ash) is removed from the gas stream by a bag filter before the cleaned gas is released
to air. The fly ash was collected from the separator whilst any unbumable wastes and
larger ash particles fell to the bottom o f the incineration plant and were removed using
hydraulic rams.
3-6
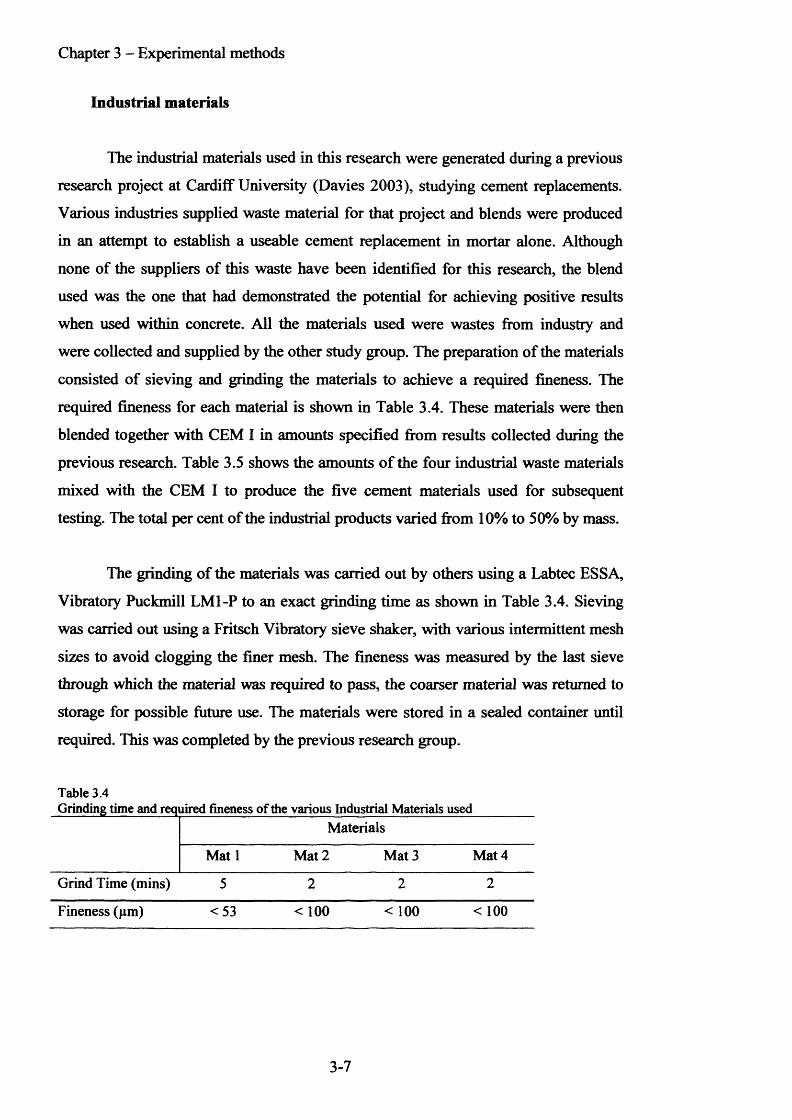
Chapter 3 - Experimental methods
Industrial materials
The industrial materials used in this research were generated during a previous
research project at Cardiff University (Davies 2003), studying cement replacements.
Various industries supplied waste material for that project and blends were produced
in an attempt to establish a useable cement replacement in mortar alone. Although
none of the suppliers of this waste have been identified for this research, the blend
used was the one that had demonstrated the potential for achieving positive results
when used within concrete. All the materials used were wastes from industry and
were collected and supplied by the other study group. The preparation o f the materials
consisted of sieving and grinding the materials to achieve a required fineness. The
required fineness for each material is shown in Table 3.4. These materials were then
blended together with CEM I in amounts specified from results collected during the
previous research. Table 3.5 shows the amounts o f the four industrial waste materials
mixed with the CEM I to produce the five cement materials used for subsequent
testing. The total per cent of the industrial products varied from 10% to 50% by mass.
The grinding of the materials was carried out by others using a Labtec ESSA,
Vibratory Puckmill LM1-P to an exact grinding time as shown in Table 3.4. Sieving
was carried out using a Fritsch Vibratory sieve shaker, with various intermittent mesh
sizes to avoid clogging the finer mesh. The fineness was measured by the last sieve
through which the material was required to pass, the coarser material was returned to
storage for possible future use. The materials were stored in a sealed container until
required. This was completed by the previous research group.
Table 3.4Grinding time and required fineness of the various Industrial Materials used
Materials
Mat 1 Mat 2 Mat 3 Mat 4
Grind Time (mins) 5 2 2 2
Fineness (pm) <53 < 100 < 100 <100
3-7
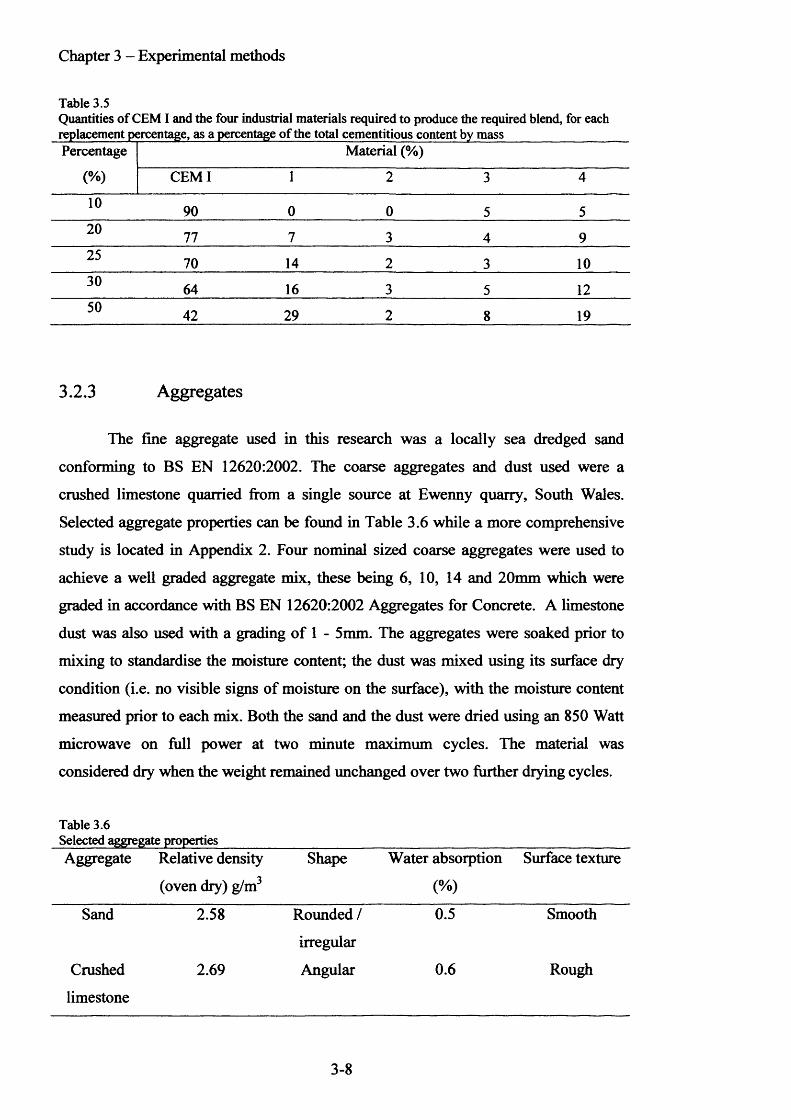
Chapter 3 - Experimental methods
Table 3.5Quantities of CEM I and the four industrial materials required to produce the required blend, for each replacement percentage, as a percentage of the total cementitious content by mass_______________Percentage Material (%)
(%) CEM I 1 2 3 4
10 90 0 0 5 520 77 7 3 4 925 70 14 2 3 1030 64 16 3 5 1250 42 29 2 8 19
3.2.3 Aggregates
The fine aggregate used in this research was a locally sea dredged sand
conforming to BS EN 12620:2002. The coarse aggregates and dust used were a
crushed limestone quarried from a single source at Ewenny quarry, South Wales.
Selected aggregate properties can be found in Table 3.6 while a more comprehensive
study is located in Appendix 2. Four nominal sized coarse aggregates were used to
achieve a well graded aggregate mix, these being 6, 10, 14 and 20mm which were
graded in accordance with BS EN 12620:2002 Aggregates for Concrete. A limestone
dust was also used with a grading of 1 - 5mm. The aggregates were soaked prior to
mixing to standardise the moisture content; the dust was mixed using its surface dry
condition (i.e. no visible signs of moisture on the surface), with the moisture content
measured prior to each mix. Both the sand and the dust were dried using an 850 Watt
microwave on full power at two minute maximum cycles. The material was
considered dry when the weight remained unchanged over two further drying cycles.
Table 3.6Selected aggregate propertiesAggregate Relative density
(oven dry) g/m
Shape Water absorption
(%)
Surface texture
Sand 2.58 Rounded /
irregular
0.5 Smooth
Crushed
limestone
2.69 Angular 0.6 Rough
3-8
Chapter 3 - Experimental methods
3.2.4 Admixtures
Organic admixtures are added to Portland cement concrete to enhance its
properties. Superplasticisers, for instance, produce concrete with high rheological
requirements, that is deformation and flow of the concrete, while maintaining a low
water/cement (w/c) ratio to guarantee excellent mechanical properties and long
durability. There is a wide variety of superplasticiser admixtures, such as
lignosulphonates, naphthalene and melamine-based, vinyl copolymers and the so-
called “latest generation” of superplasticisers, polycarboxylate derivatives. These
admixtures are adsorbed on the cement particles, causing electrostatic or steric (in the
case of polycarboxylate admixtures) repulsion that hinders coagulation (Palacios and
Puertas 2005).
Sika Plastiment 160
Plastiment 160 is a water reducing agent (WRA) designed for use in concrete.
It is a purpose designed WRA and plasticizer, made with a chemical combination of
modified lignosulphonates. This allows the manufacture o f economic high quality
concrete without undesirable side effects. It comes as a ready to use liquid for
producing a more uniformly cohesive, quality concrete. Plastiment 160 complies with
BS EN 934 - 2 Table 3.1/3.2 - High Range Water Reducing / Superplasticising
Admixtures. As the Plastiment 160 is a concrete admixture, it was added to the
concrete at the mixing stage.
3.2.5 Mix water
All water used in this research was drinking quality tap water as supplied by
Welsh Water.
3-9

Chapter 3 - Experimental methods
3.3 Traditional strength tests
3.3.1 Cubes
The cubes used in both the compressive strength tests and the permeability tests were
produced using 100mm steel cube moulds to BS EN 12390-1:2000. Compaction of
the concrete within the moulds was carried out to the method described in BS EN
12390-2:2000.
3.3.2 Curing
After twenty four hours the cubes were stripped from the moulds, and placed
fully submerged in the curing tank. The water in the tank was thermostatically
controlled heated to, and maintained at 20°C ± 2°C as specified in BS EN 12390-
2:2000. The curing period prior to testing varied based on the standard normal testing
period for concrete this being 1 day, 2 day, 7 day, 28 day and 56 day.
3.3.3 Slump test
One of the basic attributes of any cementitious material, concrete or mortar, is
its consistence or workability, defined as, the ease at which the material can be moved
around, pushed or pulled, and a smooth level surface be achieved. This property is
generally reliant on the water content of the mix with the wetter concrete being the
easier to move and hence having the higher slump value.
For this research the slump test was carried out to the procedures set out in BS
EN 12350 - 2
3-10
Chapter 3 - Experimental methods
3.3.4 Determination of compressive strength
Compressive strength of concrete is an excellent indicator of concrete quality
and it invariably forms the most important basis of specifications and quality control,
as many other properties are directly or indirectly related to it (Shibli 2007).
The compressive strength test was performed on 100mm cubes, to BS EN
12390-3:2002, using a Contest GD10A compression testing machine at a pacer rate of
180kN / minute. Although the compressive strengths o f the samples were established
at various time periods the 28 day strength is the most relevant to industry (BS EN
206-1:2000). The tests for permeability were carried out on cubes removed from the
curing tank at 28 days.
3.4 Permeability test
The testing for the relative permeability o f the concrete samples was carried
out using the method developed by Lydon (1993). This involved the casting of
1 0 0 mm concrete cubes and subjecting them to 1 0 bar nitrogen gas pressure, in pairs,
and measuring the time taken to reduce the gas pressure to 5 bar. The work was
undertaken at Cardiff University by the concrete laboratory technician Mr Andrew
Sweeney and the Author. The process used was as follows:
At 28 days the samples were removed from the curing tank and a 6 mm
diameter hole was drilled through the centre o f the cube at right angles to the direction
of casting (i.e. not through the top, exposed, face whilst in the cube mould). The
drilling process was carried out through the centre of one face to a depth of half the
cube, then from the opposite face until the holes met at the centre. This method was
employed to prevent the concrete spalling when the drill forces itself out through the
bottom of the cube. The sample cubes were then surface dried and placed in an oven
at 105°C. Continuous monitoring of the cube weight was maintained until the weight
loss was less than 1% the weight o f the cube over a 24 hour period. At this point the
cubes were removed from the oven and placed in a dessicator to cool.
3-11

Chapter 3 - Experimental methods
Aluminium tape was adhered to the bottom of the cube to cover the hole. A
thin layer of petroleum jelly was applied to the top and bottom surfaces of the sample,
the drilled faces, and to this rubberised cork pads were placed, held by suction.
Petroleum jelly was employed to create the gas tight seal required for this test as it is
easily applied and does not require any time to set. It can also be readily removed and
reapplied if a retest is required.
The top cork pad contained a hole in its centre which is designed to line up
with the hole in the sample and the hole in the lid of the pressure cell, this being the
escape route of the gas. The sample cube was placed in the pressure cell bottom face
down and centred in line with the hole in the lid. A further seal of petroleum jelly was
applied to the lid which was then bolted into place using twelve bolts, as shown in
Figure 3.1, which were systematically tightened so as not to deflect the lid or shear
any of the bolts. Bolting the lid exerts a pressure onto the cork pads and onto a rubber
sealing ring. This pressure is sufficient to stop the gas pressure causing any movement
of the pads and the sealing ring prevents gas escape from between the lid and cell
body.
Figure 3.1 Pressure cell 105mm deep x 145mm Diameter into which a concrete sample is placed for permeability testing.
3-12
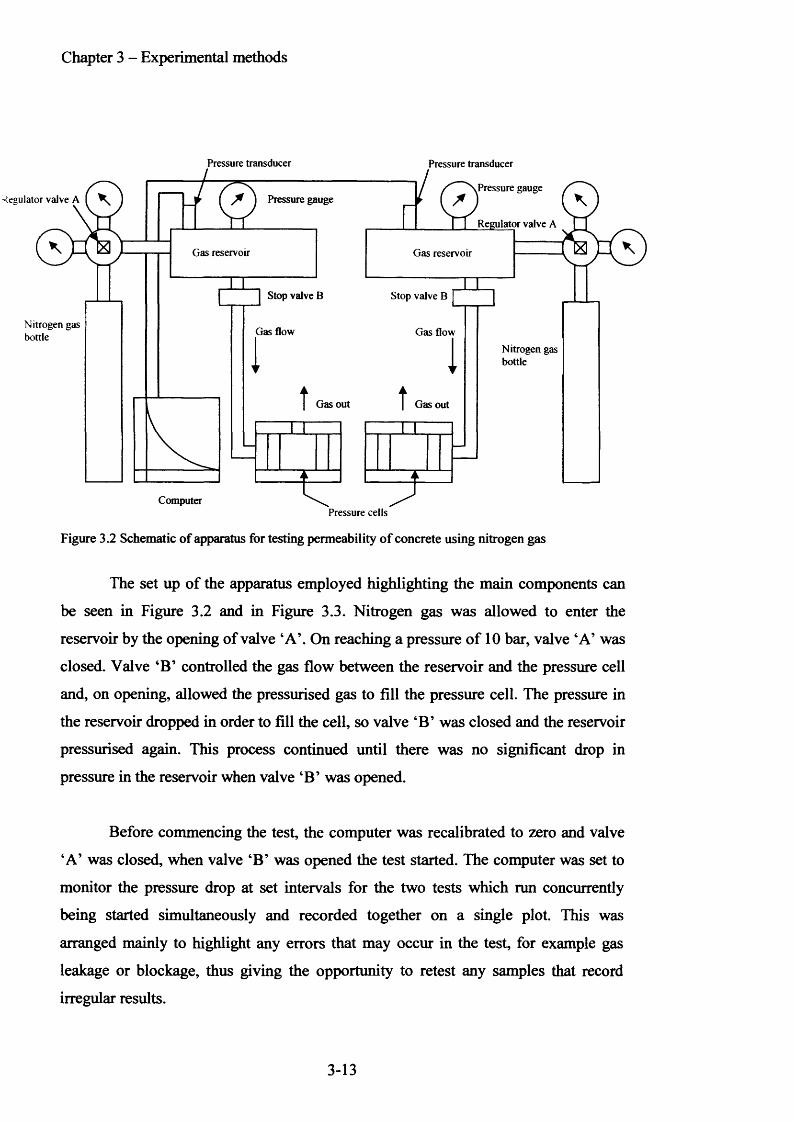
Chapter 3 - Experimental methods
Pressure transducer Pressure transducer
Pressure gaugeRegulator valve A I \ ^ ) Pressure gauge
Regulator valve A
Gas reservoir Gas reservoir
Stop valve B Stop valve B
Nitrogen gas bottle Gas flow Gas flow
Nitrogen gas bottle
Gas out Gas out
ComputerPressure cells
Figure 3.2 Schematic o f apparatus for testing permeability o f concrete using nitrogen gas
The set up of the apparatus employed highlighting the main components can
be seen in Figure 3.2 and in Figure 3.3. Nitrogen gas was allowed to enter the
reservoir by the opening of valve ‘A’. On reaching a pressure o f 10 bar, valve ‘A’ was
closed. Valve ‘B’ controlled the gas flow between the reservoir and the pressure cell
and, on opening, allowed the pressurised gas to fill the pressure cell. The pressure in
the reservoir dropped in order to fill the cell, so valve ‘B ’ was closed and the reservoir
pressurised again. This process continued until there was no significant drop in
pressure in the reservoir when valve ‘B’ was opened.
Before commencing the test, the computer was recalibrated to zero and valve
‘A’ was closed, when valve ‘B’ was opened the test started. The computer was set to
monitor the pressure drop at set intervals for the two tests which run concurrently
being started simultaneously and recorded together on a single plot. This was
arranged mainly to highlight any errors that may occur in the test, for example gas
leakage or blockage, thus giving the opportunity to retest any samples that record
irregular results.
3-13
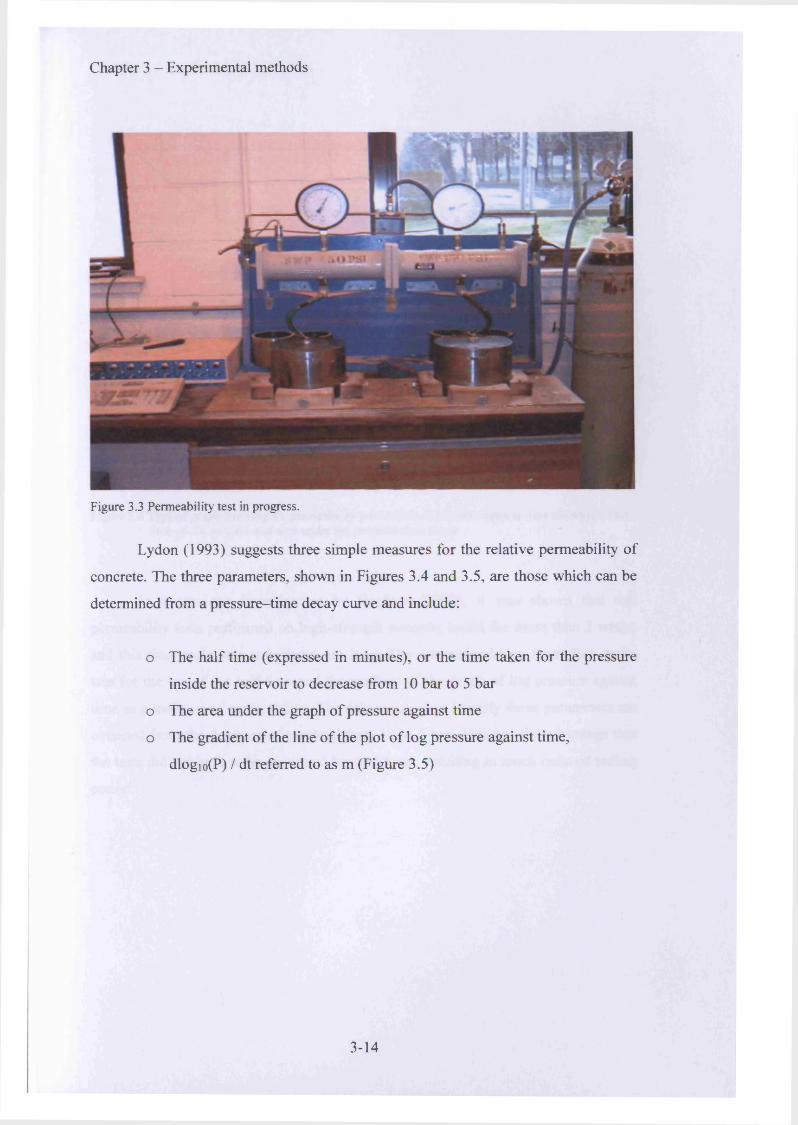
Chapter 3 - Experimental methods
Figure 3.3 Permeability test in progress.
Lydon (1993) suggests three simple measures for the relative permeability of
concrete. The three parameters, shown in Figures 3.4 and 3.5, are those which can be
determined from a pressure-time decay curve and include:
o The half time (expressed in minutes), or the time taken for the pressure
inside the reservoir to decrease from 10 bar to 5 bar
o The area under the graph of pressure against time
o The gradient of the line of the plot of log pressure against time,
dlogio(P) / dt referred to as m (Figure 3.5)
3-14

Chapter 3 - Experimental methods
10
8
6
Area
2
Half Time
o30 40 50 60 70 900 10 20 80
Time (m ins)
Figure 3.4 Typical graph showing the permeability parameters of pressure against time showing a half time of 48 minutes and area under the pressure-time curve
In a previous investigation by Gardner (2002), it was shown that full
permeability tests performed on high-strength concrete lasted for more than 2 weeks
and this time scale was considered too long. The recommendation from that study,
was for the use of the half time and the gradient of the graph of log pressure against
time as a measure of permeability. The data required to identify these parameters are
obtained from the decrease of pressure from 10 to 5 bar. This has the advantage that
the tests did not have to be continued beyond 5 bar, resulting in much reduced testing
period.
3-15
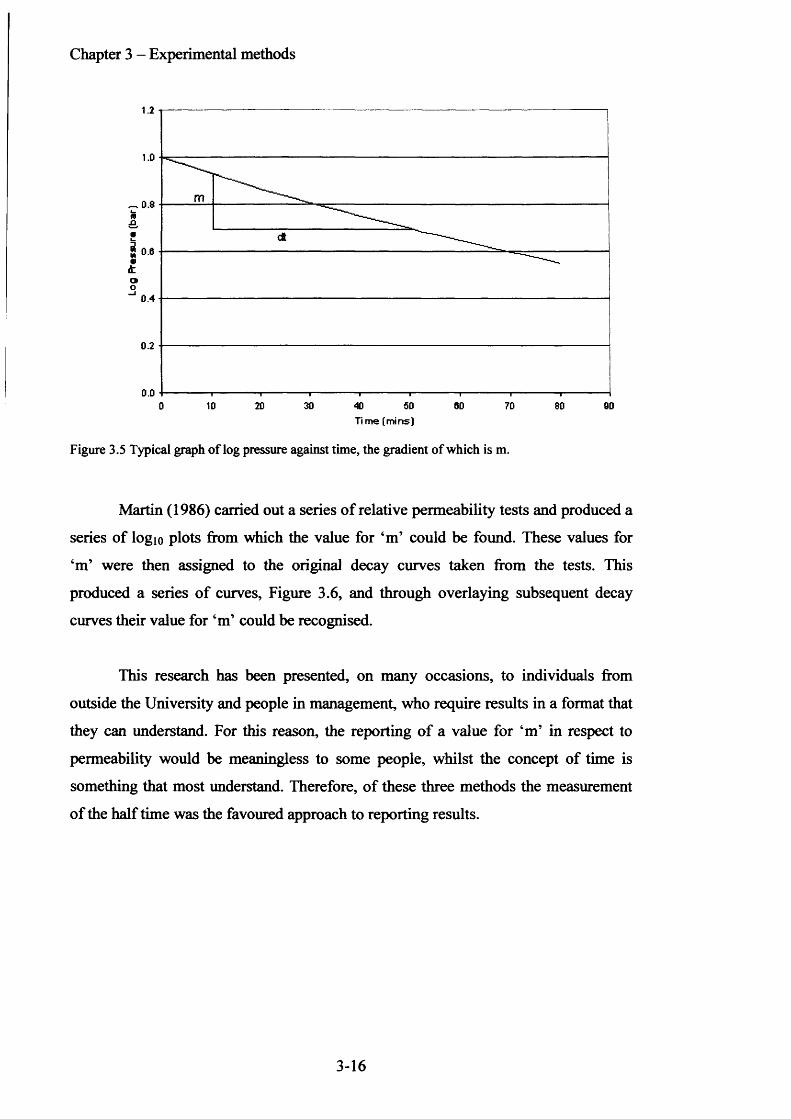
Chapter 3 - Experimental methods
0.6
0.4
0.2
0.03010 20 50 60 70 80 900
Time (mins)
Figure 3.5 Typical graph of log pressure against time, the gradient of which is m.
Martin (1986) carried out a series of relative permeability tests and produced a
series of logio plots from which the value for ‘m’ could be found. These values for
‘m’ were then assigned to the original decay curves taken from the tests. This
produced a series of curves, Figure 3.6, and through overlaying subsequent decay
curves their value for ‘m’ could be recognised.
This research has been presented, on many occasions, to individuals from
outside the University and people in management, who require results in a format that
they can understand. For this reason, the reporting of a value for ‘m ’ in respect to
permeability would be meaningless to some people, whilst the concept of time is
something that most understand. Therefore, of these three methods the measurement
of the half time was the favoured approach to reporting results.
3-16
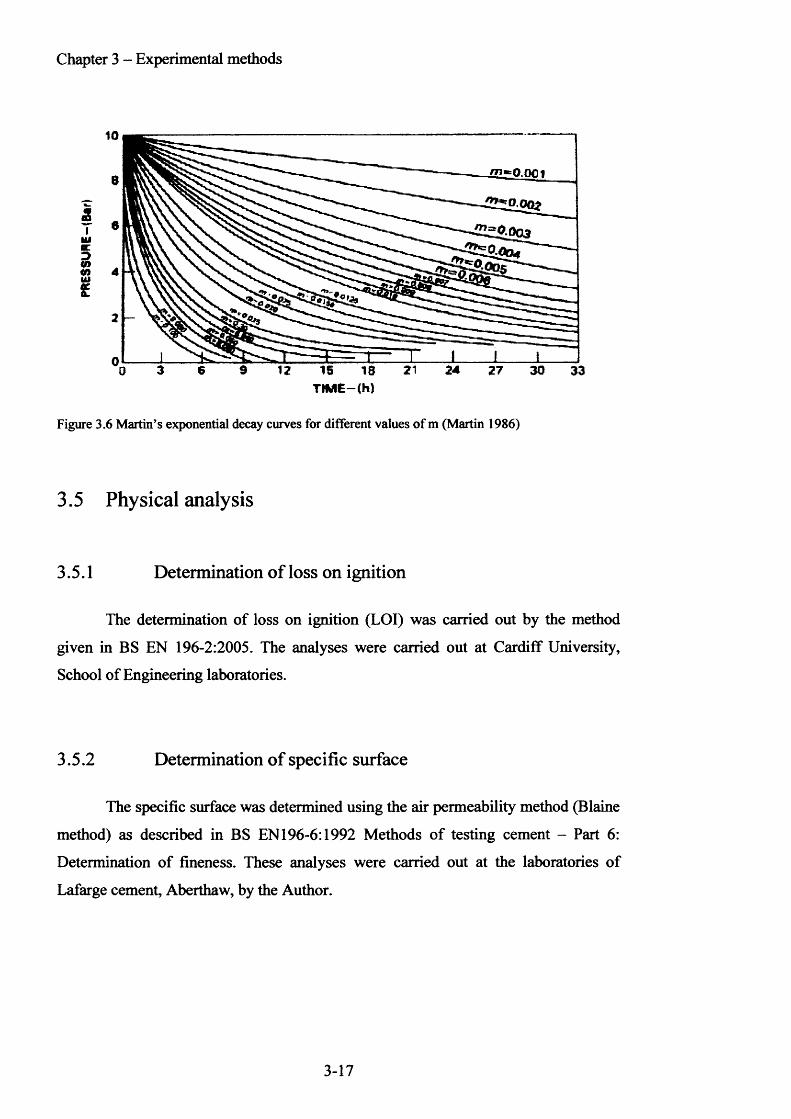
Chapter 3 - Experimental methods
IiUiKD<n<oui
24 3027TIME—(h)
Figure 3.6 Martin’s exponential decay curves for different values o f m (Martin 1986)
3.5 Physical analysis
3.5.1 Determination of loss on ignition
The determination of loss on ignition (LOI) was carried out by the method
given in BS EN 196-2:2005. The analyses were carried out at Cardiff University,
School of Engineering laboratories.
3.5.2 Determination of specific surface
The specific surface was determined using the air permeability method (Blaine
method) as described in BS EN196-6:1992 Methods of testing cement - Part 6 :
Determination of fineness. These analyses were carried out at the laboratories of
Lafarge cement, Aberthaw, by the Author.
3-17
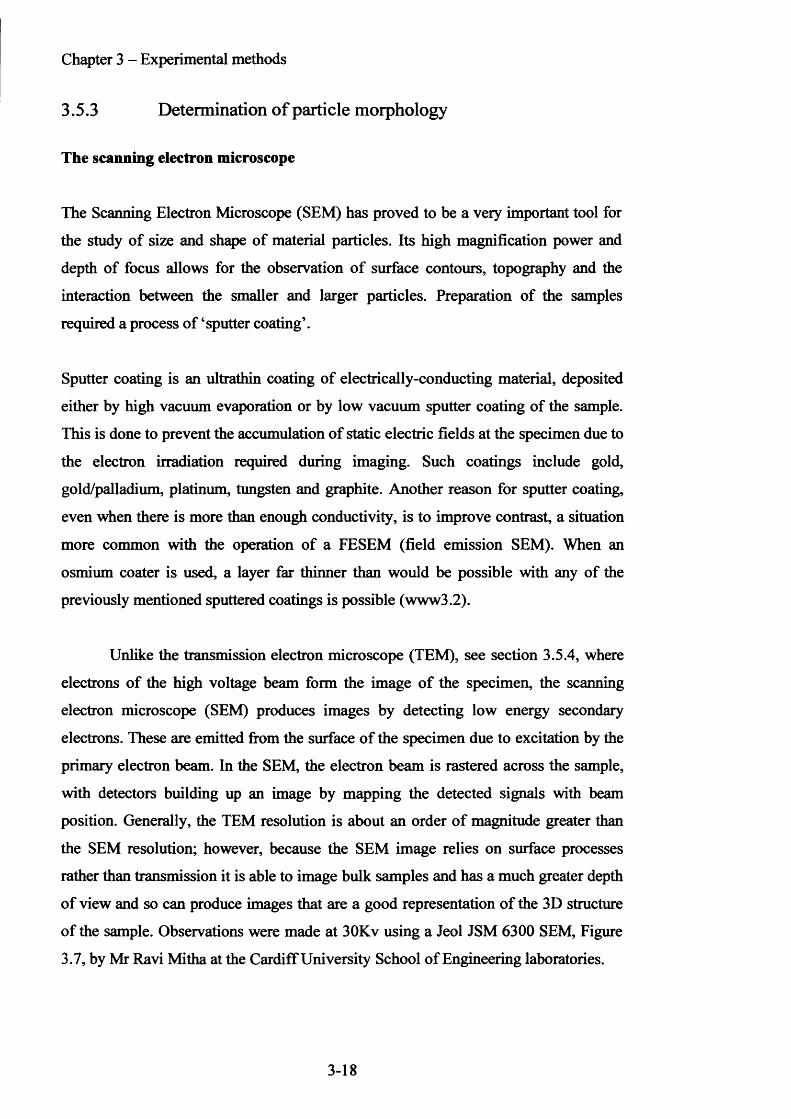
Chapter 3 - Experimental methods
3.5.3 Determination of particle morphology
The scanning electron microscope
The Scanning Electron Microscope (SEM) has proved to be a very important tool for
the study of size and shape of material particles. Its high magnification power and
depth of focus allows for the observation o f surface contours, topography and the
interaction between the smaller and larger particles. Preparation of the samples
required a process of ‘sputter coating’.
Sputter coating is an ultrathin coating of electrically-conducting material, deposited
either by high vacuum evaporation or by low vacuum sputter coating of the sample.
This is done to prevent the accumulation of static electric fields at the specimen due to
the electron irradiation required during imaging. Such coatings include gold,
gold/palladium, platinum, tungsten and graphite. Another reason for sputter coating,
even when there is more than enough conductivity, is to improve contrast, a situation
more common with the operation of a FESEM (field emission SEM). When an
osmium coater is used, a layer far thinner than would be possible with any of the
previously mentioned sputtered coatings is possible (www3.2).
Unlike the transmission electron microscope (TEM), see section 3.5.4, where
electrons of the high voltage beam form the image o f the specimen, the scanning
electron microscope (SEM) produces images by detecting low energy secondary
electrons. These are emitted from the surface of the specimen due to excitation by the
primary electron beam. In the SEM, the electron beam is rastered across the sample,
with detectors building up an image by mapping the detected signals with beam
position. Generally, the TEM resolution is about an order o f magnitude greater than
the SEM resolution; however, because the SEM image relies on surface processes
rather than transmission it is able to image bulk samples and has a much greater depth
of view and so can produce images that are a good representation of the 3D structure
of the sample. Observations were made at 30Kv using a Jeol JSM 6300 SEM, Figure
3.7, by Mr Ravi Mitha at the Cardiff University School of Engineering laboratories.
3-18
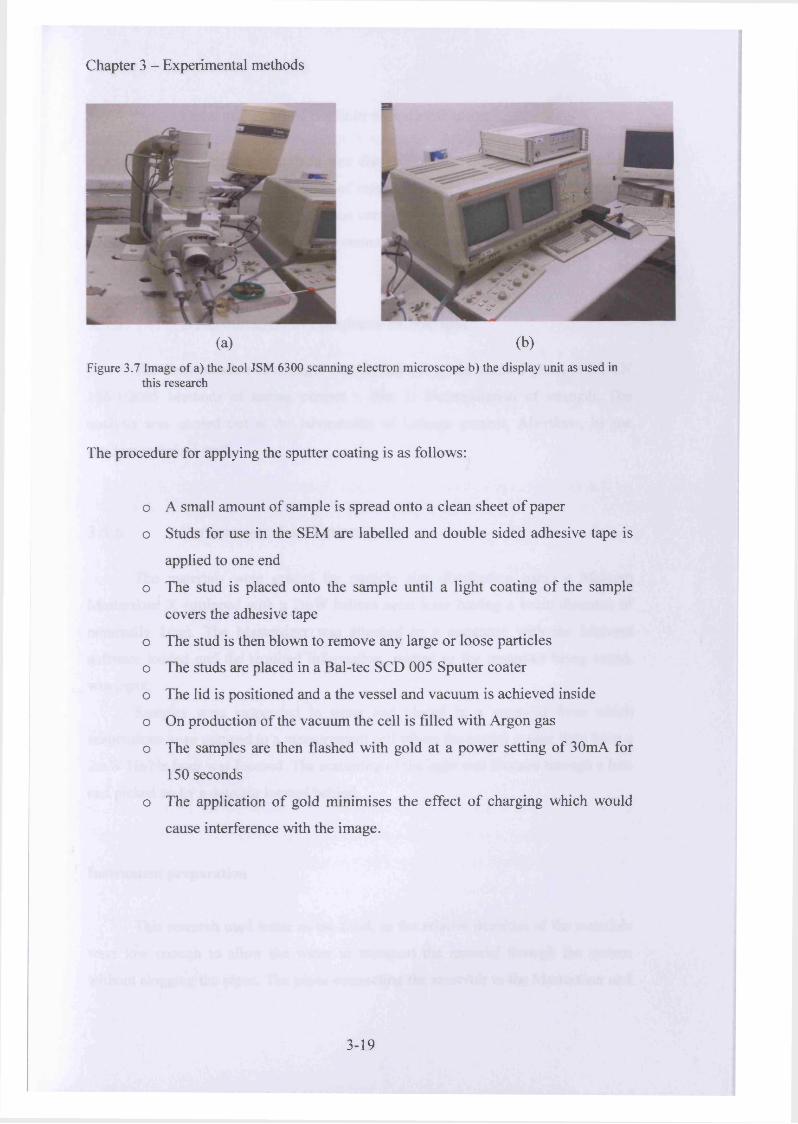
Chapter 3 - Experimental methods
(a) (b)Figure 3.7 Image of a) the Jeol JSM 6300 scanning electron microscope b) the display unit as used in
this research
The procedure for applying the sputter coating is as follows:
o A small amount of sample is spread onto a clean sheet of paper
o Studs for use in the SEM are labelled and double sided adhesive tape is
applied to one end
o The stud is placed onto the sample until a light coating of the sample
covers the adhesive tape
o The stud is then blown to remove any large or loose particles
o The studs are placed in a Bal-tec SCD 005 Sputter coater
o The lid is positioned and a the vessel and vacuum is achieved inside
o On production of the vacuum the cell is filled with Argon gas
o The samples are then flashed with gold at a power setting of 30mA for
150 seconds
o The application of gold minimises the effect of charging which would
cause interference with the image.
3-19
Chapter 3 - Experimental methods
3.5.4 Determination of particle size distribution
The determination of particle size distribution was carried out to the method
given in BS EN 196-6:1992 Methods o f testing cement - Part 6 : Determination of
fineness (sieve method). The analysis was carried out to fulfil the requirements of BS
EN 197-1, at the laboratories o f Lafarge cement, Aberthaw, by the Author.
3.5.5 Determination of compressive strength
The determination of strength was carried out to the method given in BS EN
196-1:2005 Methods o f testing cement - Part 1: Determination o f strength. The
analysis was carried out at the laboratories of Lafarge cement, Aberthaw, by the
resident technical staff.
3.5.6 Particle size distribution
The materials were graded for particle size distribution using a Malvern
Mastersizer X equipped with a 2mW helium neon laser having a beam diameter of
nominally 1mm. The Mastersizer was attached to a computer with the Malvern
software loaded and the required information, related to the materials being tested,
was input.
Samples were suspended in water and placed in a reservoir from which
suspensions were pumped to a measurement cell where the partial scatter light from a
2 m W He/Ne laser was focused. The scattering of the light was focused through a lens
and picked up by a detector located behind.
Instrument preparation
This research used water as the fluid, as the relative densities of the materials
were low enough to allow the water to transport the material through the system
without clogging the pipes. The pipes connecting the reservoir to the Mastersizer and
3-20
Chapter 3 - Experimental methods
the measurement cell were renewed and the lenses, measurement cell and presentation
tank checked for impurities and cleaned if required. The required lens was selected
and mounted together with the measurement cell in front of the detector. De-ionised
water was slowly poured into the flow cell, so as to avoid the production of bubbles,
and allowed to circulate around the system.
Computer preparation
The initial configuration of the software was set up by Mr Paul Malpas of the
School of Engineering, Cardiff University. On opening the Malvern program, an
“Easy button line” was used to progress the set up in the correct order. Each step was
progressed for every new sample. The set up consists of Setup hardware, Setup
Analysis and Presentation selection.
o Setup Hardware requires the identification of the lens being used. This
research used the 45,100 and 300mm lenses
o Setup analysis requires that the particle density be input
o Presentation selection requires that the refractive index of 1.5295 for
the fluid (used to suspend the sample distilled water in this case) be
input
o All other settings remain at default.
The system then runs its own setup program configuring the computer with the
laser apparatus. When the ‘Measure’ window appeared the sample was placed into the
flow cell using small quantities. Aids for the dispersion o f the material in the reservoir
included a cell stirrer and an ultra-sonic stirrer both set at mid power to avoid the
production of air into the water. Material was added to the flow cell and ceased when
the ‘Obscuration’ measure on the computer showed approximately 20% (with a range
of -2% and +5%). At this point the scanning was started and results collected. Eight
increments of a single sample were made by continuously cycling around the system.
The number of measurement sweeps prior to each calculation was the default setting
o f 2 0 0 0 .
3-21
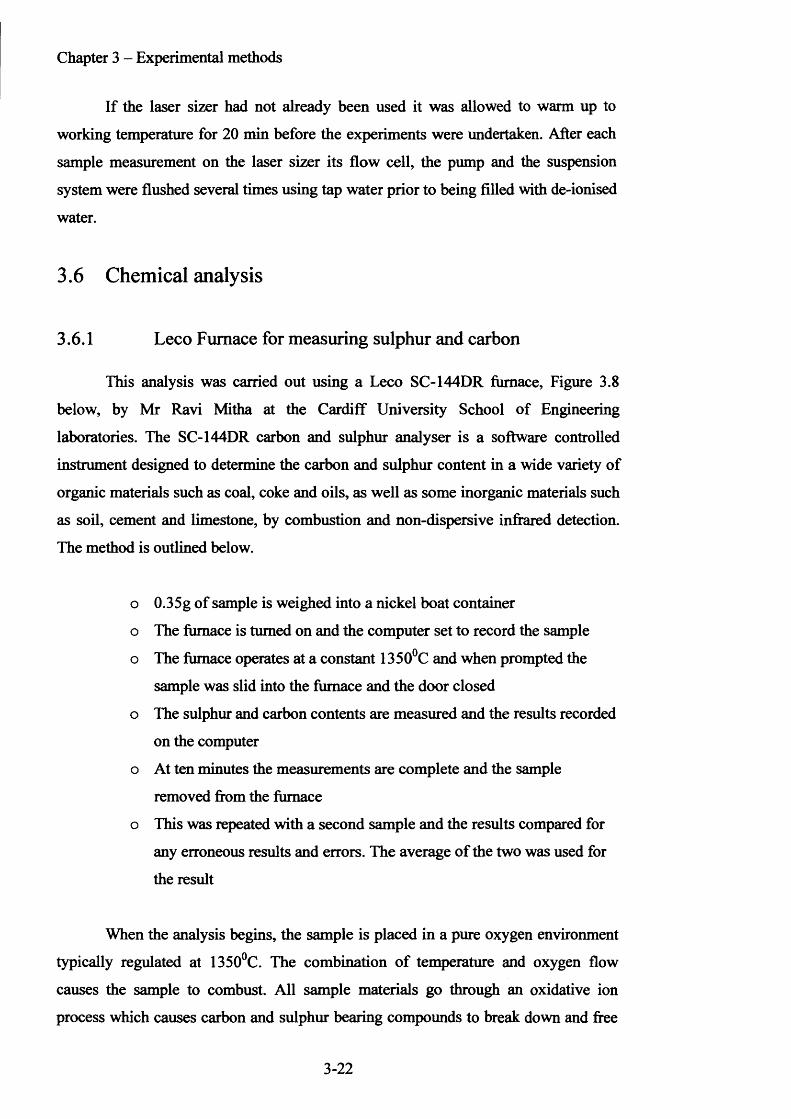
Chapter 3 - Experimental methods
If the laser sizer had not already been used it was allowed to warm up to
working temperature for 20 min before the experiments were undertaken. After each
sample measurement on the laser sizer its flow cell, the pump and the suspension
system were flushed several times using tap water prior to being filled with de-ionised
water.
3.6 Chemical analysis
3.6.1 Leco Furnace for measuring sulphur and carbon
This analysis was carried out using a Leco SC-144DR furnace, Figure 3.8
below, by Mr Ravi Mitha at the Cardiff University School of Engineering
laboratories. The SC-144DR carbon and sulphur analyser is a software controlled
instrument designed to determine the carbon and sulphur content in a wide variety of
organic materials such as coal, coke and oils, as well as some inorganic materials such
as soil, cement and limestone, by combustion and non-dispersive infrared detection.
The method is outlined below.
o 0.35g of sample is weighed into a nickel boat container
o The furnace is turned on and the computer set to record the sample
o The furnace operates at a constant 1350°C and when prompted the
sample was slid into the furnace and the door closed
o The sulphur and carbon contents are measured and the results recorded
on the computer
o At ten minutes the measurements are complete and the sample
removed from the furnace
o This was repeated with a second sample and the results compared for
any erroneous results and errors. The average of the two was used for
the result
When the analysis begins, the sample is placed in a pure oxygen environment
typically regulated at 1350°C. The combination of temperature and oxygen flow
causes the sample to combust. All sample materials go through an oxidative ion
process which causes carbon and sulphur bearing compounds to break down and free
3-22
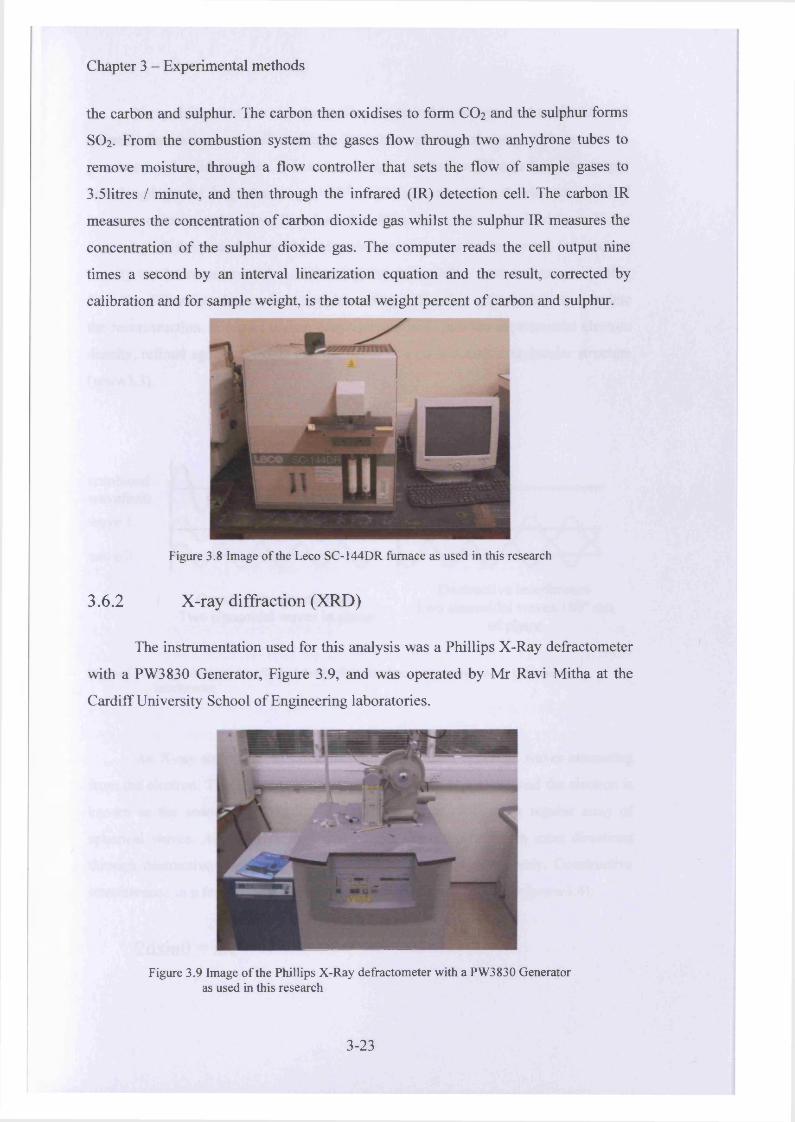
Chapter 3 - Experimental methods
the carbon and sulphur. The carbon then oxidises to form CO2 and the sulphur forms
SO2 . From the combustion system the gases flow through two anhydrone tubes to
remove moisture, through a flow controller that sets the flow of sample gases to
3.51itres / minute, and then through the infrared (IR) detection cell. The carbon IR
measures the concentration of carbon dioxide gas whilst the sulphur IR measures the
concentration of the sulphur dioxide gas. The computer reads the cell output nine
times a second by an interval linearization equation and the result, corrected by
calibration and for sample weight, is the total weight percent of carbon and sulphur.
Figure 3.8 Image of the Leco SC-144DR furnace as used in this research
3.6.2 X -ray diffraction (X RD )
The instrumentation used for this analysis was a Phillips X-Ray defractometer
with a PW3830 Generator, Figure 3.9, and was operated by Mr Ravi Mitha at the
Cardiff University School of Engineering laboratories.
Figure 3.9 Image of the Phillips X-Ray defractometer with a PW3830 Generator as used in this research
3-23
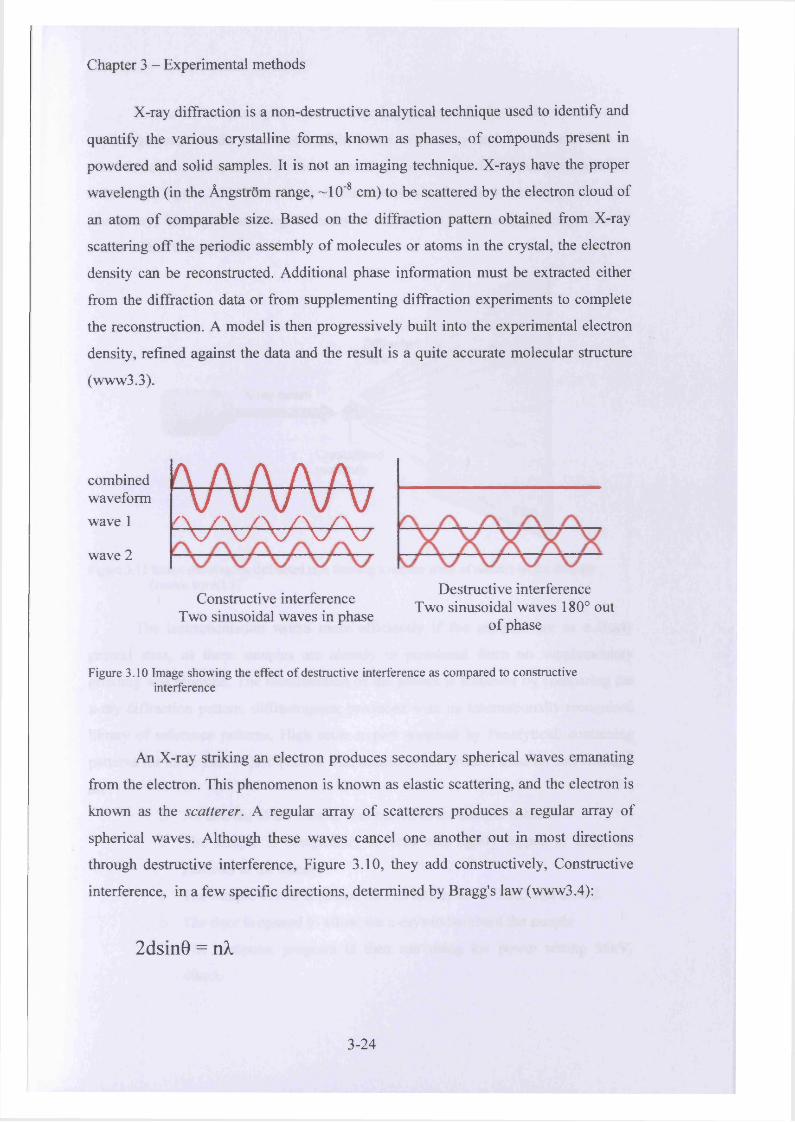
Chapter 3 - Experimental methods
X-ray diffraction is a non-destructive analytical technique used to identify and
quantify the various crystalline forms, known as phases, of compounds present in
powdered and solid samples. It is not an imaging technique. X-rays have the proper
wavelength (in the Angstrom range, ~ 1 0 ' 8 cm) to be scattered by the electron cloud of
an atom of comparable size. Based on the diffraction pattern obtained from X-ray
scattering off the periodic assembly of molecules or atoms in the crystal, the electron
density can be reconstructed. Additional phase information must be extracted either
from the diffraction data or from supplementing diffraction experiments to complete
the reconstruction. A model is then progressively built into the experimental electron
density, refined against the data and the result is a quite accurate molecular structure
(www3.3).
combinedwaveformwave 1
wave 2
Figure 3.10 Image showing the effect of destructive interference as compared to constructive interference
An X-ray striking an electron produces secondary spherical waves emanating
from the electron. This phenomenon is known as elastic scattering, and the electron is
known as the scatterer. A regular array of scatterers produces a regular array of
spherical waves. Although these waves cancel one another out in most directions
through destructive interference, Figure 3.10, they add constructively, Constructive
interference, in a few specific directions, determined by Bragg’s law (www3.4):
2dsin0 = n l
r v w w'v v v v vConstructive interference
Two sinusoidal waves in phase
Destructive interference Two sinusoidal waves 180° out
of phase
3-24
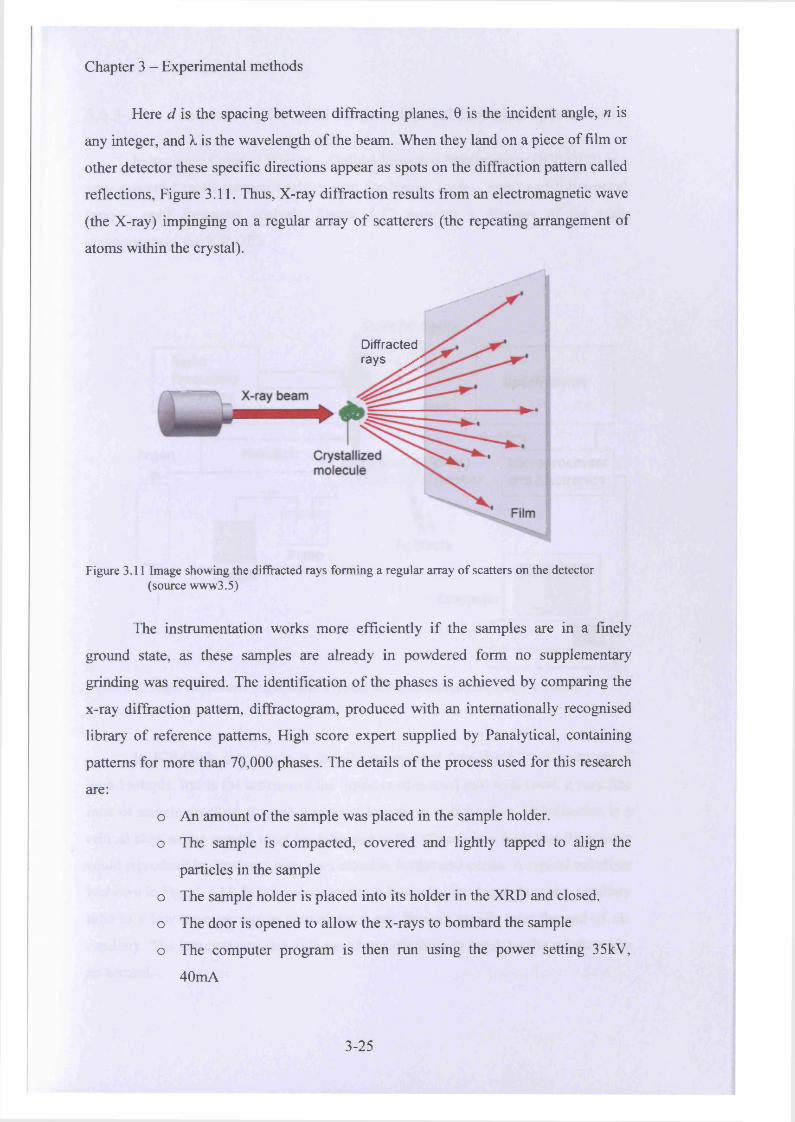
Chapter 3 - Experimental methods
Here d is the spacing between diffracting planes, 9 is the incident angle, n is
any integer, and X is the wavelength of the beam. When they land on a piece of film or
other detector these specific directions appear as spots on the diffraction pattern called
reflections, Figure 3.11. Thus, X-ray diffraction results from an electromagnetic wave
(the X-ray) impinging on a regular array of scatterers (the repeating arrangement of
atoms within the crystal).
Diffracted rays y
Figure 3.11 Image showing the diffracted rays forming a regular array of scatters on the detector (source www3.5)
The instrumentation works more efficiently if the samples are in a finely
ground state, as these samples are already in powdered form no supplementary
grinding was required. The identification of the phases is achieved by comparing the
x-ray diffraction pattern, diffractogram, produced with an internationally recognised
library of reference patterns, High score expert supplied by Panalytical, containing
patterns for more than 70,000 phases. The details of the process used for this research
are:
o An amount of the sample was placed in the sample holder,
o The sample is compacted, covered and lightly tapped to align the
particles in the sample
o The sample holder is placed into its holder in the XRD and closed,
o The door is opened to allow the x-rays to bombard the sample
o The computer program is then run using the power setting 35kV,
40mA
3-25
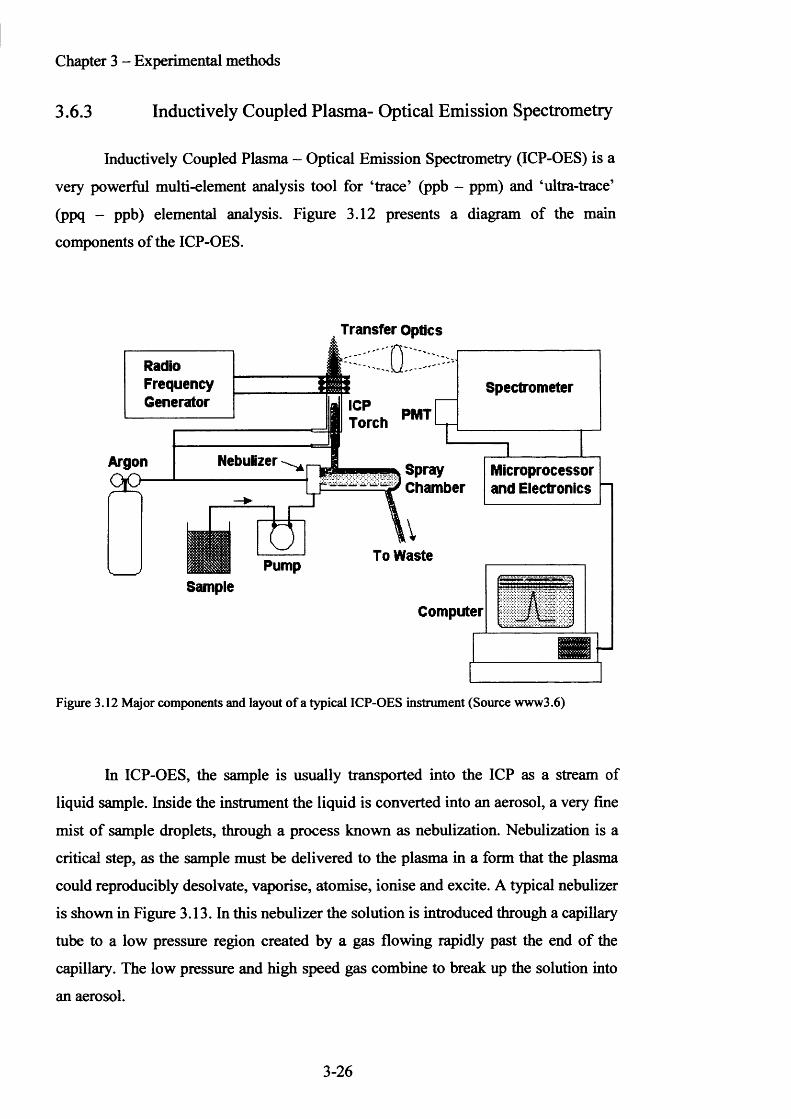
Chapter 3 - Experimental methods
3 .6 .3 Inductively Coupled Plasma- Optical Emission Spectrometry
Inductively Coupled Plasma - Optical Emission Spectrometry (ICP-OES) is a
very powerful multi-element analysis tool for ‘trace’ (ppb - ppm) and ‘ultra-trace’
(ppq - ppb) elemental analysis. Figure 3.12 presents a diagram of the main
components of the ICP-OES.
RadioFrequencyGenerator
Transfer Optics
Torch
Nebulizer
To Waste
Spectrometer
SprayChamber
Microprocessor and Electronics
V _ _ _ _ _ _ _
SampleComputer
Figure 3.12 Major components and layout of a typical ICP-OES instrument (Source www3.6)
In ICP-OES, the sample is usually transported into the ICP as a stream of
liquid sample. Inside the instrument the liquid is converted into an aerosol, a very fine
mist of sample droplets, through a process known as nebulization. Nebulization is a
critical step, as the sample must be delivered to the plasma in a form that the plasma
could reproducibly desolvate, vaporise, atomise, ionise and excite. A typical nebulizer
is shown in Figure 3.13. In this nebulizer the solution is introduced through a capillary
tube to a low pressure region created by a gas flowing rapidly past the end of the
capillary. The low pressure and high speed gas combine to break up the solution into
an aerosol.
3-26
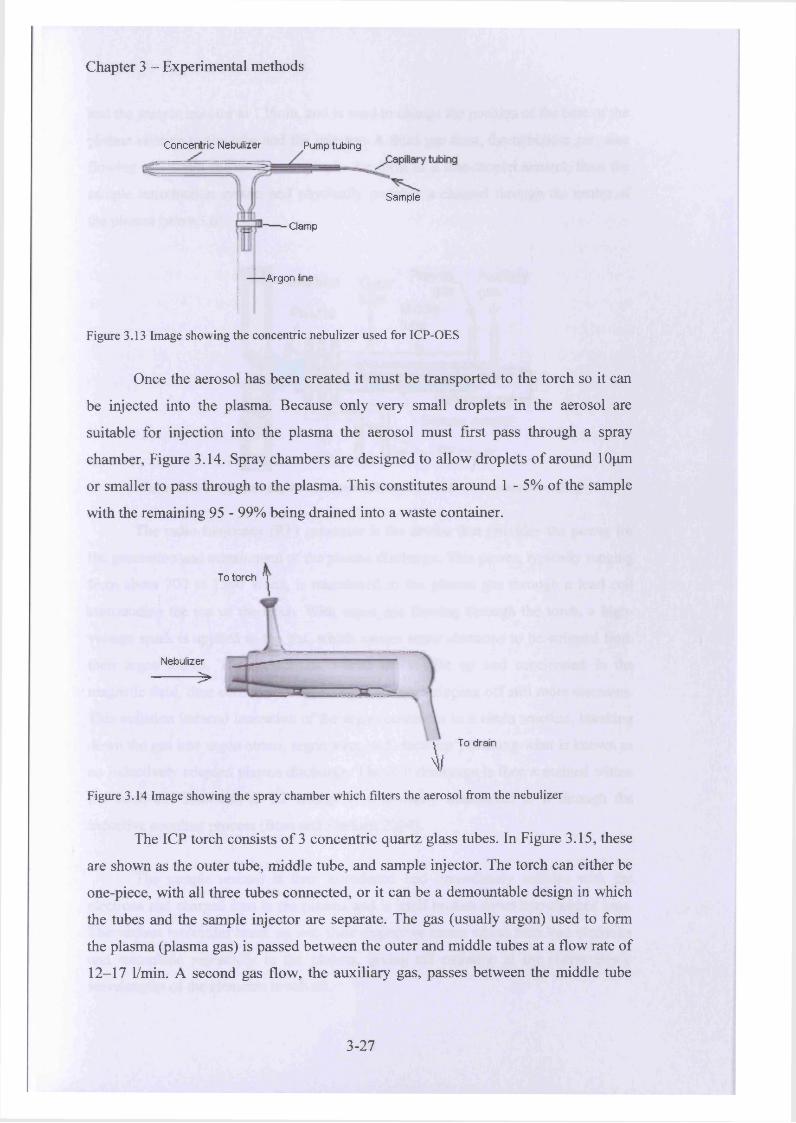
Chapter 3 - Experimental methods
Concentric Nebulizer Pump tubing
Sample
Clamp
Argon line
Figure 3.13 Image showing the concentric nebulizer used for ICP-OES
Once the aerosol has been created it must be transported to the torch so it can
be injected into the plasma. Because only very small droplets in the aerosol are
suitable for injection into the plasma the aerosol must first pass through a spray
chamber, Figure 3.14. Spray chambers are designed to allow droplets of around 10pm
or smaller to pass through to the plasma. This constitutes around 1 - 5% of the sample
with the remaining 95 - 99% being drained into a waste container.
To torch t
Nebulizer
>
\ To drain
HIFigure 3.14 Image showing the spray chamber which filters the aerosol from the nebulizer
The ICP torch consists of 3 concentric quartz glass tubes. In Figure 3.15, these
are shown as the outer tube, middle tube, and sample injector. The torch can either be
one-piece, with all three tubes connected, or it can be a demountable design in which
the tubes and the sample injector are separate. The gas (usually argon) used to form
the plasma (plasma gas) is passed between the outer and middle tubes at a flow rate of
12-17 1/min. A second gas flow, the auxiliary gas, passes between the middle tube
3-27
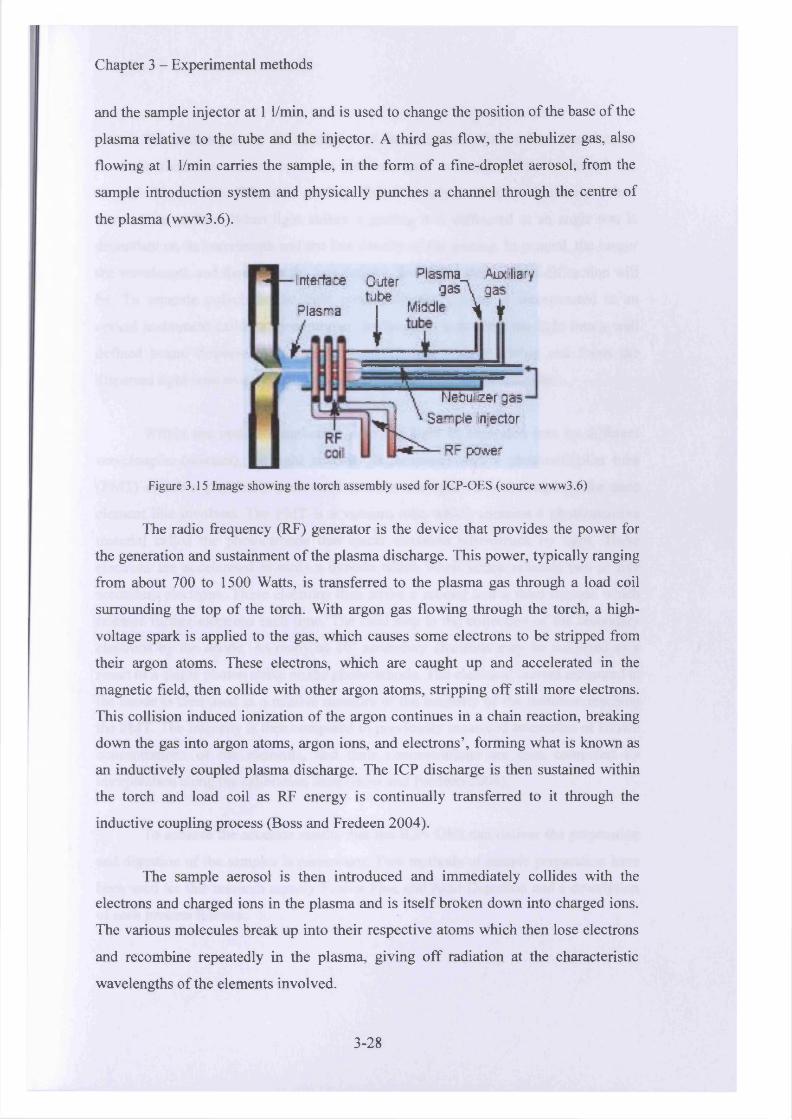
Chapter 3 - Experimental methods
and the sample injector at 1 1/min, and is used to change the position of the base of the
plasma relative to the tube and the injector. A third gas flow, the nebulizer gas, also
flowing at 1 1/min carries the sample, in the form of a fine-droplet aerosol, from the
sample introduction system and physically punches a channel through the centre of
the plasma (www3.6).
Figure 3.15 Image showing the torch assembly used for ICP-OES (source www3.6)
The radio frequency (RF) generator is the device that provides the power for
the generation and sustainment of the plasma discharge. This power, typically ranging
from about 700 to 1500 Watts, is transferred to the plasma gas through a load coil
surrounding the top of the torch. With argon gas flowing through the torch, a high-
voltage spark is applied to the gas, which causes some electrons to be stripped from
their argon atoms. These electrons, which are caught up and accelerated in the
magnetic field, then collide with other argon atoms, stripping off still more electrons.
This collision induced ionization of the argon continues in a chain reaction, breaking
down the gas into argon atoms, argon ions, and electrons’, forming what is known as
an inductively coupled plasma discharge. The ICP discharge is then sustained within
the torch and load coil as RF energy is continually transferred to it through the
inductive coupling process (Boss and Fredeen 2004).
The sample aerosol is then introduced and immediately collides with the
electrons and charged ions in the plasma and is itself broken down into charged ions.
The various molecules break up into their respective atoms which then lose electrons
and recombine repeatedly in the plasma, giving off radiation at the characteristic
wavelengths of the elements involved.
interface Outer P,ss™-v ^ ,l,ary tube 935 \ 955
Plasma | Middle \ ±
Netufzergas Sample sector
RF pjw er
3-28
Chapter 3 - Experimental methods
The next step is the differentiation o f the emission radiation from one element
from the radiation emitted by other elements and molecules. This is carried out
through the use of a diffraction grating. This is simply a mirror with closely etched
lines on its surface. When light strikes a grating it is diffracted at an angle that is
dependant on its wavelength and the line density o f the grating. In general, the longer
the wavelength and the higher the line density, the higher the angle of diffraction will
be. To separate polychromatic light predicably, the grating is incorporated in an
optical instrument called a spectrometer. Its function is to form the light into a well
defined beam, disperse it according to wavelength with a grating and focus the
dispersed light onto an exit plane or circle where the optical detector sits.
Within the optical chambers), after the light is separated into its different
wavelengths (colours), the light intensity is measured with a photomultiplier tube
(PMT) or tubes physically positioned to view the specific wavelength(s) for each
element line involved. The PMT is a vacuum tube which contains a photosensitive
material called the photocathode that ejects electrons whenstruck by light. These
electrons are accelerated towards a dynode which when struck releases two to five
secondary electrons. These electrons then strike a second and a third dynode which
releases further electrons each time. The final step is the collection of the secondary
electrons by the anode. As many as 106 secondary electrons may be collected as a
result of a single photon strike on the photocathode. The electrical current measured at
the anode is then used as a relative measure of the intensity o f the radiation reaching
the PMT. The intensity is then compared to previously measured intensities of known
concentrations of the elements, and their concentrations are then computed by
interpolation along the calibration lines (Boss and Fredeen 2004).
To achieve the accurate results that the ICP- OES can deliver the preparation
and digestion of the samples is paramount. Two methods of sample preparation have
been used for this research namely Fusion Flux and Acid Digestion and a description
of each process follows:
3-29

Chapter 3 - Experimental methods
1. Fusion Flux method: performed by Mr Ravi Mitha at the Cardiff University
School of Engineering laboratories. The main steps are:
o 0 . 1 g of the material was weighed onto a platinum crucible
o 0 .6 g of lithium metaborate was added to form a bead
o 1 0 drops of lithium iodide was added to the sample to prevent sticking
o The crucible was supported in the Claisse Fluxer (M4)
o The propane gas burner was lit beneath the crucible
o The crucible was rotated as the heat was applied achieving approximately
1050°C
o On achieving a molten state the mixture was dropped into a beaker
containing nitric acid at 2% concentration
o The solution was stirred with magnetic stirrers on a heated block for
approximately 30 minutes
o The solution was poured into conical sample jars and made up to 100ml
with de-ionised water
2. Acid Digestion using a microwave: Performed by Mr Ravi Mitha at the Cardiff
University School of Engineering laboratories. The main steps are:
o O.lg of sample was weighed into a clean dry polytetrafluoroethylene
(PTFE) microwave tube,
o 2ml of hydrofluoric acid (HF) was added to the microwave tube,
covered and allowed to stand overnight,
o 6 ml of aquaregia (a 50/50 mix o f nitric acid (HNO3) and hydrochloric
acid (HCI)) was added to the microwave tube and allowed to stand for
30 minutes
o The microwave tube was then heated in the microwave for 30 minutes
and allowed to cool for 2 0 minutes
o 6 ml of saturated boric acid (B(OH)3) was added to the tube to
neutralise the HF
o The mixture was re-heated in the microwave for a further 15 minutes
and allowed to cool for 2 0 minutes
3-30
Chapter 3 - Experimental methods
Samples for testing were made up to 50ml using de-ionised distilled
water
The maximum temperature in the microwave was set at 200°C with a
maximum pressure of 40 bar
Calibration and use of the ICP
The calibration of the Perkin Elmer Optima 2100 DV ICP was carried out by
Mr Ravi Mitha prior to running the tests. The procedure was as follows:
o A commercial spectroscopic standard was run containing each of the
required elements. Dilutions o f the standard were made using distilled
water at 0 . 1 ppm, 1 . 0 ppm, 1 0 ppm and 1 0 0 ppm
o These dilutions were run through the ICP together with a blank sample,
of de-ionised water only, to check for errors in the analysis
o A correction coefficient accuracy o f 1.0 is expected, this analysis gave
an accuracy of 0.999986
o One sample of each digestion method was analysed
o On completion of calibration the samples were analysed
Conversion of returned information to Oxides
The ICP returns a numerical amount for the element content which then
requires converting to an oxide. To get the percentage of the element in the sample the
following formula is used:
R x V / W x 10000 = P %
Where:
R = result from the analysis (mg/L)
V = liquid volume after digestion (ml)
W = weight o f the sample digested within the liquid (g)
This result is multiplied by the ratio o f its element mass to the relative oxide mass.
For example using aluminium oxide AI2O3 :
o
o
3-31
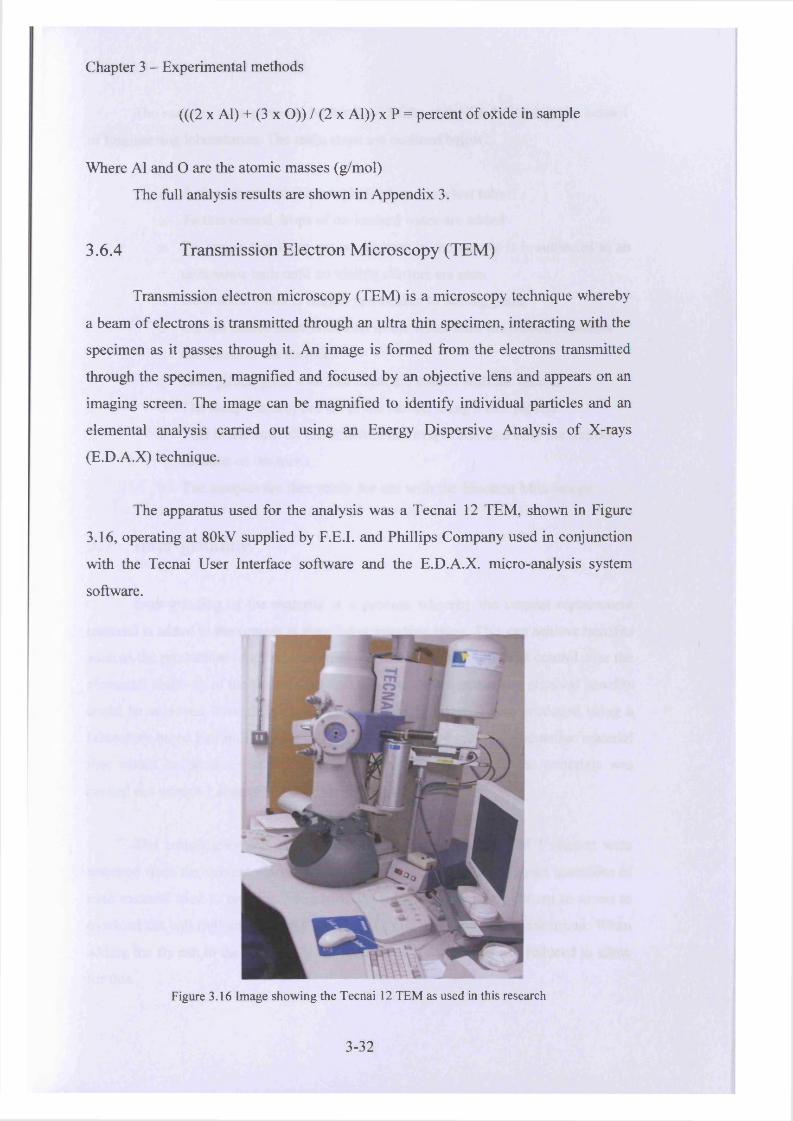
Chapter 3 - Experimental methods
(((2 x Al) + (3 x O)) / (2 x Al)) x P = percent of oxide in sample
Where Al and O are the atomic masses (g/mol)
The full analysis results are shown in Appendix 3.
3.6.4 Transm ission E lectron M icroscopy (TEM )
Transmission electron microscopy (TEM) is a microscopy technique whereby
a beam of electrons is transmitted through an ultra thin specimen, interacting with the
specimen as it passes through it. An image is formed from the electrons transmitted
through the specimen, magnified and focused by an objective lens and appears on an
imaging screen. The image can be magnified to identify individual particles and an
elemental analysis carried out using an Energy Dispersive Analysis of X-rays
(E.D.A.X) technique.
The apparatus used for the analysis was a Tecnai 12 TEM, shown in Figure
3.16, operating at 80kV supplied by F.E.I. and Phillips Company used in conjunction
with the Tecnai User Interface software and the E.D.A.X. micro-analysis system
software.
Figure 3.16 Image showing the Tecnai 12 TEM as used in this research
3-32
Chapter 3 - Experimental methods
The samples were prepared by Mr Ravi Mitha at the Cardiff University School
o f Engineering laboratories. The main steps are outlined below:
o A tiny amount of the sample is placed in a test tube
o To this several drops of de-ionised water are added
o To ensure that there are no clusters in the sample it is subjected to an
ultra-sonic bath until no visible clusters are seen
o De-ionised water is heated in a beaker to boiling point
o Carbon coated mica is floated in the water until the carbon separates
and floats to the surface
o Gold gilded grids with 150 mesh are coated with the carbon
o The sample is dropped on to the carbon using a fine pipette
o This is left until all the moisture has evaporated and only the sample
remains on the mesh
o The samples are then ready for use with the Electron Microscope
3.7 Inter-grinding
Inter-grinding of the material is a process whereby the cement replacement
material is added to the cement at the clinker grinding stage. This can achieve benefits
such as the production of a finer material, a shorter grinding time and control over the
elemental make-up of the finished product. To establish whether any physical benefits
could be achieved through inter-grinding a CEM II material was produced using a
laboratory based ball mill grinder in an attempt to reproduce a representative material
that would be produced at the cement works. The grinding of the materials was
carried out using a Labtec ESSA, Vibratory Puckmill LM1-P
The constituents and quantities required to produce a CEM I cement were
acquired from the cement works at Aberthaw. Table 3.7 gives the exact quantities of
each material used to produce 7.6kg o f CEM I, this amount being chosen so as not to
overload the ball mill and keep the amount of grinding required to a minimum. When
adding the fly ash to the blend only the total mass of the clinker was reduced to allow
for this.
3-33
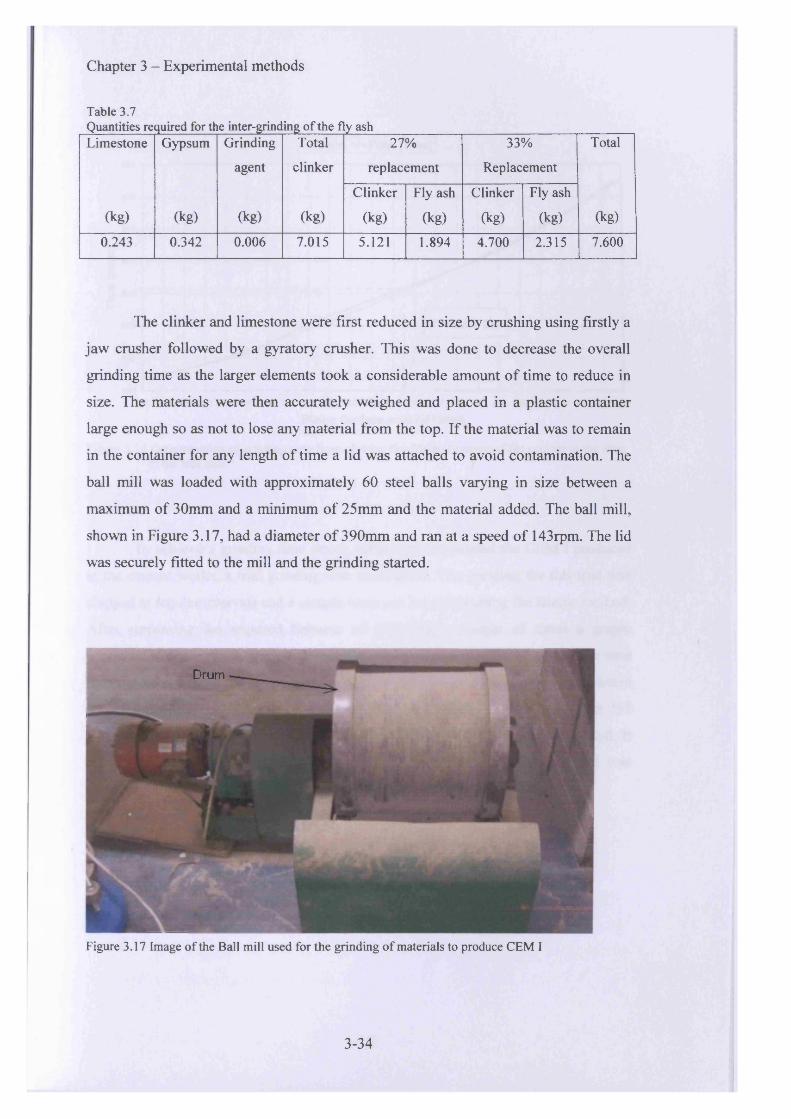
Chapter 3 - Experimental methods
Table 3.7Quantities required for the inter-grinding of the fly ashLimestone Gypsum Grinding Total 27% 33% Total
agent clinker replacement Replacement
Clinker Fly ash Clinker Fly ash
(kg) (kg) (kg) (kg) (kg) (kg) (kg) (kg) (kg)
0.243 0.342 0.006 7.015 5.121 1.894 4.700 2.315 7.600
The clinker and limestone were first reduced in size by crushing using firstly a
jaw crusher followed by a gyratory crusher. This was done to decrease the overall
grinding time as the larger elements took a considerable amount of time to reduce in
size. The materials were then accurately weighed and placed in a plastic container
large enough so as not to lose any material from the top. If the material was to remain
in the container for any length of time a lid was attached to avoid contamination. The
ball mill was loaded with approximately 60 steel balls varying in size between a
maximum of 30mm and a minimum of 25mm and the material added. The ball mill,
shown in Figure 3.17, had a diameter of 390mm and ran at a speed of 143rpm. The lid
was securely fitted to the mill and the grinding started.
Drum
Figure 3.17 Image of the Ball mill used for the grinding of materials to produce CEM I
3-34
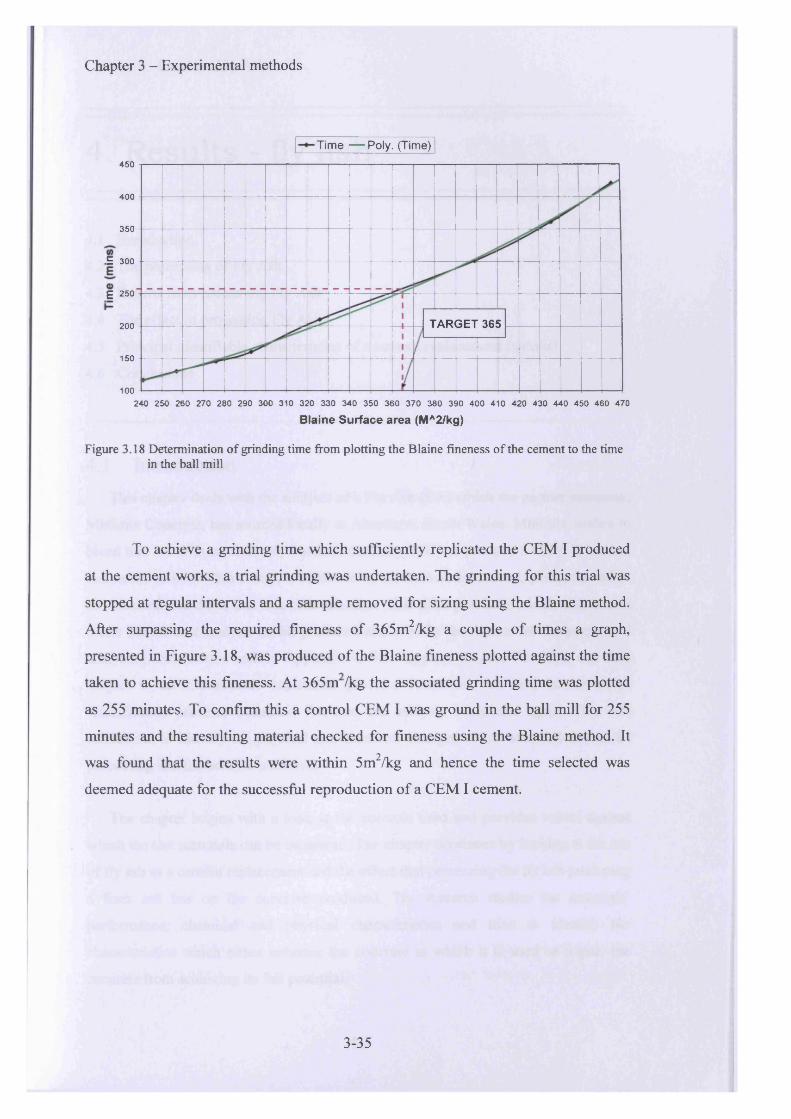
Chapter 3 - Experimental methods
Time — Poly. (Time)450
400
350
.E 300
g 250
TARGET 365200
150
100240 250 260 270 280 290 300 310 320 330 340 350 360 370 380 390 400 410 420 430 440 450 460 470
Blaine Surface area (MA2/kg)
Figure 3.18 Determination of grinding time from plotting the Blaine fineness of the cement to the time in the ball mill
To achieve a grinding time which sufficiently replicated the CEM I produced
at the cement works, a trial grinding was undertaken. The grinding for this trial was
stopped at regular intervals and a sample removed for sizing using the Blaine method.
After surpassing the required fineness of 365m2/kg a couple of times a graph,
presented in Figure 3.18, was produced of the Blaine fineness plotted against the time
taken to achieve this fineness. At 365m /kg the associated grinding time was plotted
as 255 minutes. To confirm this a control CEM I was ground in the ball mill for 255
minutes and the resulting material checked for fineness using the Blaine method. It
was found that the results were within 5m2/kg and hence the time selected was
deemed adequate for the successful reproduction of a CEM I cement.
3-35
Chapter 4. Results - Fly Ash
4. Results - fly ash
4.1 Introduction
4.2 The processing of Fly Ash
4.3 Results from processing Fly Ash
4.4 The effect of processing Fly Ash
4.5 Principal identifiable characteristics o f a cement replacement material
4.6 Conclusions
4.1 IntroductionThis chapter deals with the analysis o f a Fly Ash (FA) which the partner company,
Minimix Concrete, has sourced locally at Aberthaw, South Wales. Minimix wishes to
blend this FA with its Ordinary Portland cement (OPC) to produce a CEM II cement
and needs to know that firstly, it conforms to the standards; second, performs within
the concrete and third, that it is cost effective. This third part is not dealt with in this
thesis but the cost analysis model produced and used by the Author for the purpose of
analysing costs can be seen in Appendix 4. The supplied FA, the Raw FA, was then
subject to an Electrostatic separation process, Processed FA, and an air swept
classification process, Classified FA, and the analysis completed again. This was
carried out to identify the physical and chemical changes which occurred due to the
processing and the benefits achieved.
The chapter begins with a look at the controls used and provides values against
which the test materials can be measured. The chapter continues by looking at the use
of fly ash as a cement replacement and the effect that processing the fly ash producing
a finer ash has on the concrete produced. The research studies the materials’
performance, chemical and physical characteristics and tries to identify the
characteristics which either enhance the concrete in which it is used or impair the
concrete from achieving its full potential.
4-1
Chapter 4. Results - Fly Ash
Further materials are then introduced as possible cement replacement materials
and their physical and chemical properties scrutinised to ascertain which aspects of a
material provides the perfect condition for a cement replacement material.
4.1.1 Errors
Due to the high estimate of samples required and the number of concrete mixes
necessary to provide these samples it was decided from the outset to standardise the
mixing and testing procedure. It was hoped that maintaining a routine would reduce
errors and provide a narrow spread o f results; however, potential sources of errors
need to be identified.
The materials used were obtained and stored in a room with climate control, thus
ensuring that the cement remained useable with no change to its properties for
example moisture ingress causing the cement to harden. The cement (Ordinary
Portland Cement Ready Mix (OPCRM)) was supplied from one manufactured batch
direct from the cement works (Lafarge Aberthaw) and stored in sealed containers
within the laboratories at the University. The aggregate proved to be a problem due to
the quantities required and a number of deliveries were necessary during the period of
mixing. Although the aggregates remained within the grading as required by the
British Standards (BS EN 12620) there is room for variability within the aggregate
size having a possible effect on the aggregate grading within each mix.
Achieving the correct slump was fundamental to obtaining accurate compressive
strength results. This research relied on the fact that when the coarse aggregates were
soaked for an exact period of time the moisture content would standardise for each
mix. Periodical random moisture content checks showed little difference in the 14mm
to 2 0 mm aggregate between tests with the 6 mm to 1 0 mm being the most inconsistent.
Both the sand and dust were tested prior to each set o f tests, as these materials could
not be brought to an exact moisture content through soaking. Having been dredged
from the Severn estuary, the sand was saturated; however, being stored indoors
ultimately dried the material, whilst the dust being stored indoors at the quarry
4-2
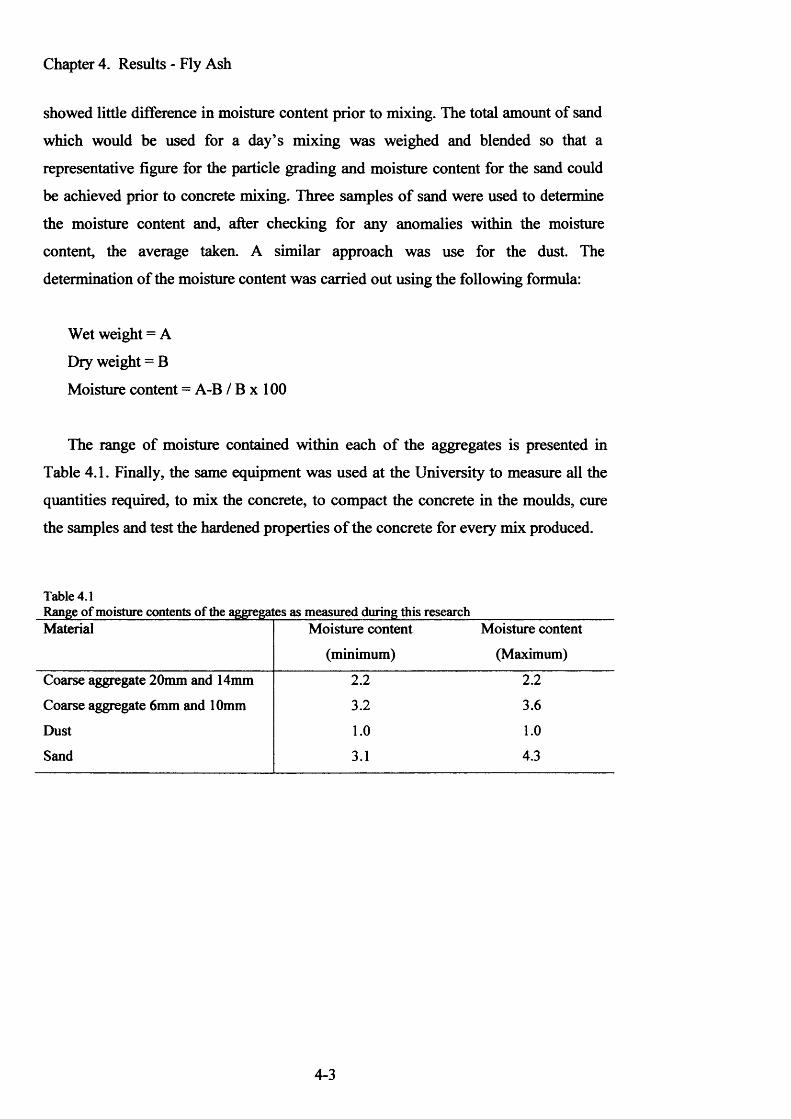
Chapter 4. Results - Fly Ash
showed little difference in moisture content prior to mixing. The total amount of sand
which would be used for a day’s mixing was weighed and blended so that a
representative figure for the particle grading and moisture content for the sand could
be achieved prior to concrete mixing. Three samples of sand were used to determine
the moisture content and, after checking for any anomalies within the moisture
content, the average taken. A similar approach was use for the dust. The
determination of the moisture content was carried out using the following formula:
Wet weight = A
Dry weight = B
Moisture content = A-B / B x 100
The range of moisture contained within each o f the aggregates is presented in
Table 4.1. Finally, the same equipment was used at the University to measure all the
quantities required, to mix the concrete, to compact the concrete in the moulds, cure
the samples and test the hardened properties o f the concrete for every mix produced.
Table 4.1Range of moisture contents of the aggregates as measured during this researchMaterial Moisture content
(minimum)
Moisture content
(Maximum)
Coarse aggregate 20mm and 14mm 2.2 2.2
Coarse aggregate 6mm and 10mm 3.2 3.6
Dust 1.0 1.0
Sand 3.1 4.3
4-3

Chapter 4. Results - Fly Ash
4.1.2 Control mixes
To establish a measure for the viability of any potential material, control mixes
were required. These control mixes were taken from the designs of the company
partner, Minimix concrete, and for ease seven designs were initially selected:
1) Low cement content 140kg/m
2) High cement content 450kg/m3
3) 5 intermediate cement contents o f 200, 250, 300, 350 and 400kg/m3
These designs are given in Table 4.2 below whilst the full compliment of mix
designs used for this research can be seen in Appendix 1.
Table 4.2Component materials required to produce lm3 concrete as used in this research
Batch weights for lm (kg)
Material Cement content (kg/m3)
140 200 250 300 350 400 450
Cementitious material 140 200 250 300 350 400 450
Coarse aggregate 20mm 407 403 400 404 393 393 397
Coarse aggregate 14mm 407 403 400 404 393 393 397
Coarse aggregate 10mm 184 182 169 185 181 164 152
Coarse aggregate 6mm 184 182 169 185 181 164 152
Dust 500 490 465 438 425 415 411
Sand 388 380 387 348 336 308 287
Different types and classes of cement are produced for various purposes. BS EN
197-1:2000 catalogues a number o f cement specifications together with any
restrictions on their use. The following cements were chosen as controls for this study
as being the most commonly supplied from the partner company:
1) CEM I (OPC)
2) CEM IH/A (Blended OPC and Ground Granulated Blast Furnace Slag (GGBS)
in the ratio 50/50)
4-4
Chapter 4. Results - Fly Ash
The mixes were produced adding enough free water to achieve a mid range slump
of typically 70mm. This falls within the S2 classification as set out in BS EN 206:1-
2000, with a range of between 50 and 90mm with a tolerance of +- 20mm. Although
some discrepancy is to be expected between each mix due to the nature of concrete
and the tester’s slumping technique, every effort was made to achieve the 70mm
slump.
Admixture to aid workability, whilst reducing the addition of free water, was
added to the mix in the quantity (as recommended by the supplier) of 0.4% by mass of
the cement content.
BS EN 206 has a requirement that the designed compressive strength of concrete
be recorded at 28 days; this has therefore been used to establish the suitability of the
material as a cement replacement within this research as within industry.
CEM I - Ordinary Portland cement control
Figure 4.1 presents the compressive strength results at 28 days for three CEM I
control mixes of identical designs. These mixes contain 100% Ordinary Portland
cement (OPCRM) at 300kg/m cement content containing no cement replacement
material. The mixes were produced to study the variability encountered between
identical mix designs repeated at varying times. This information will highlight the
range of strengths achieved within a single mix which can be allowed for in the
research samples. This means that samples recording a low result will not necessarily
be removed from the research if they fall within a range higher than the control. In
practice this variability in compressive strength is dealt with by the Quality Scheme
for Ready Mixed Concrete (QSRMC). This standard uses a statistical analysis of a
running test regime to apportion a mean strength to a selected mix design and then
reduce this strength by a margin which ensures the required strength is always
achieved. For this research the compressive strength achieved has a bearing only as a
comparison to subsequent mixes and not, at this point, as a commercial product in the
sense that QSRMC regulations are required to be followed.
4-5
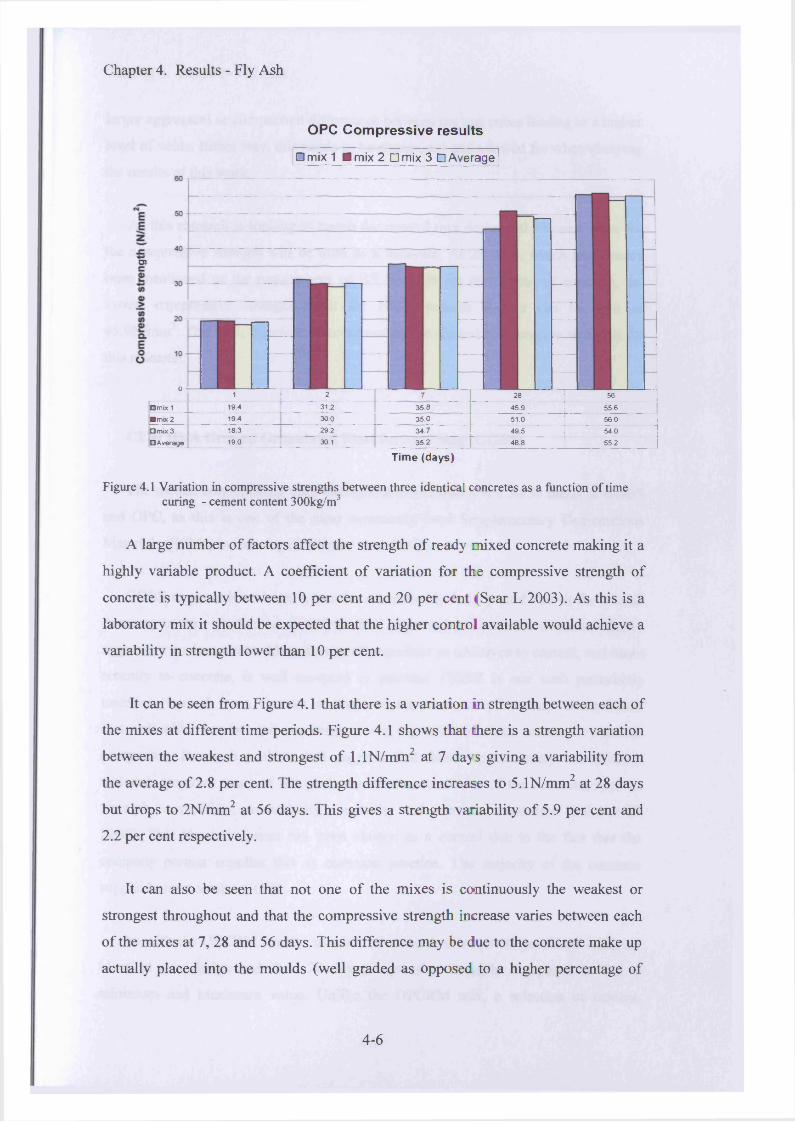
Chapter 4. Results - Fly Ash
OPC Compressive results
□ mix 1 B mix 2 Dmix 3 □ Average
05
o 11 I 2 7 28 56
Hmix 1 19.4 | 31.2 35.8 45.9 55.6■ mix 2 19.4 30.0 35.0 ' 51.0 56.0□ mix 3 18.3 29.2 34.7 49.5 54.0□ Average 19.0 | 30.1 35.2 48.8 55.2
Time (days)
Figure 4.1 Variation in compressive strengths between three identical concretes as a function of time curing - cement content 300kg/m3
A large number of factors affect the strength of ready mixed concrete making it a
highly variable product. A coefficient of variation for the compressive strength of
concrete is typically between 10 per cent and 20 per cent (Sear L 2003). As this is a
laboratory mix it should be expected that the higher control available would achieve a
variability in strength lower than 10 per cent.
It can be seen from Figure 4.1 that there is a variation in strength between each of
the mixes at different time periods. Figure 4.1 shows that there is a strength variation
between the weakest and strongest of l.IN/mm2 at 7 days giving a variability from
the average of 2.8 per cent. The strength difference increases to 5.1N/mm2 at 28 days
but drops to 2N/mm2 at 56 days. This gives a strength variability of 5.9 per cent and
2.2 per cent respectively.
It can also be seen that not one of the mixes is continuously the weakest or
strongest throughout and that the compressive strength increase varies between each
of the mixes at 7, 28 and 56 days. This difference may be due to the concrete make up
actually placed into the moulds (well graded as opposed to a higher percentage of
4-6
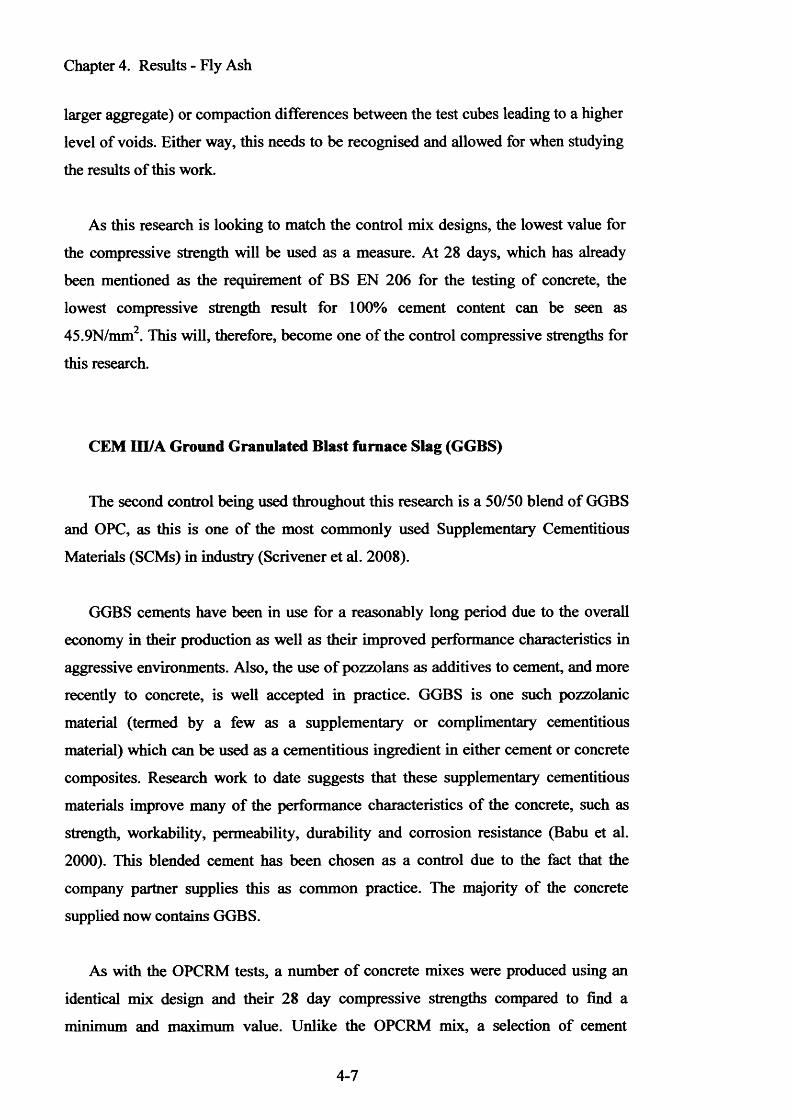
Chapter 4. Results - Fly Ash
larger aggregate) or compaction differences between the test cubes leading to a higher
level of voids. Either way, this needs to be recognised and allowed for when studying
the results of this work.
As this research is looking to match the control mix designs, the lowest value for
the compressive strength will be used as a measure. At 28 days, which has already
been mentioned as the requirement o f BS EN 206 for the testing of concrete, the
lowest compressive strength result for 100% cement content can be seen as
45.9N/mm2. This will, therefore, become one o f the control compressive strengths for
this research.
CEM III/A Ground Granulated Blast furnace Slag (GGBS)
The second control being used throughout this research is a 50/50 blend of GGBS
and OPC, as this is one of the most commonly used Supplementary Cementitious
Materials (SCMs) in industry (Scrivener et al. 2008).
GGBS cements have been in use for a reasonably long period due to the overall
economy in their production as well as their improved performance characteristics in
aggressive environments. Also, the use o f pozzolans as additives to cement, and more
recently to concrete, is well accepted in practice. GGBS is one such pozzolanic
material (termed by a few as a supplementary or complimentary cementitious
material) which can be used as a cementitious ingredient in either cement or concrete
composites. Research work to date suggests that these supplementary cementitious
materials improve many of the performance characteristics of the concrete, such as
strength, workability, permeability, durability and corrosion resistance (Babu et al.
2000). This blended cement has been chosen as a control due to the fact that the
company partner supplies this as common practice. The majority o f the concrete
supplied now contains GGBS.
As with the OPCRM tests, a number o f concrete mixes were produced using an
identical mix design and their 28 day compressive strengths compared to find a
minimum and maximum value. Unlike the OPCRM mix, a selection o f cement
4-7
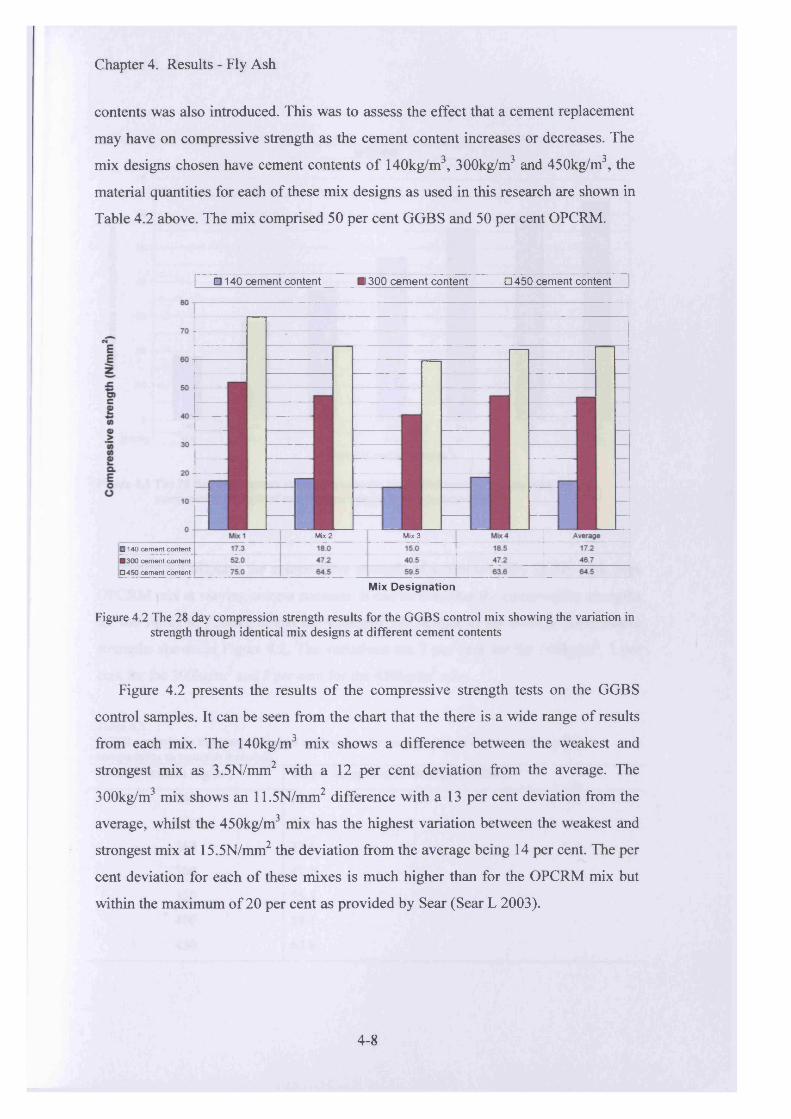
Chapter 4. Results - Fly Ash
contents was also introduced. This was to assess the effect that a cement replacement
may have on compressive strength as the cement content increases or decreases. The
mix designs chosen have cement contents of 140kg/m3, 300kg/m3 and 450kg/m3, the
material quantities for each of these mix designs as used in this research are shown in
Table 4.2 above. The mix comprised 50 per cent GGBS and 50 per cent OPCRM.
□ 140 cement content 1300 cement content □ 4 5 0 cement content
M ix 2 M ix 3
0 1 4 0 c e m e n t c o n t e n t
3 0 0 c e m e n t c o n t e n t
□ 4 5 0 c e m e n t c o n t e n t
Mix D esignation
Figure 4.2 The 28 day compression strength results for the GGBS control mix showing the variation in strength through identical mix designs at different cement contents
Figure 4.2 presents the results of the compressive strength tests on the GGBS
control samples. It can be seen from the chart that the there is a wide range of results
from each mix. The 140kg/m3 mix shows a difference between the weakest and
strongest mix as 3.5N/mm2 with a 12 per cent deviation from the average. The
300kg/m3 mix shows an 11.5N/mm2 difference with a 13 per cent deviation from the
average, whilst the 450kg/m3 mix has the highest variation between the weakest and
strongest mix at 15.5N/mm2 the deviation from the average being 14 per cent. The per
cent deviation for each of these mixes is much higher than for the OPCRM mix but
within the maximum of 20 per cent as provided by Sear (Sear L 2003).
4-8
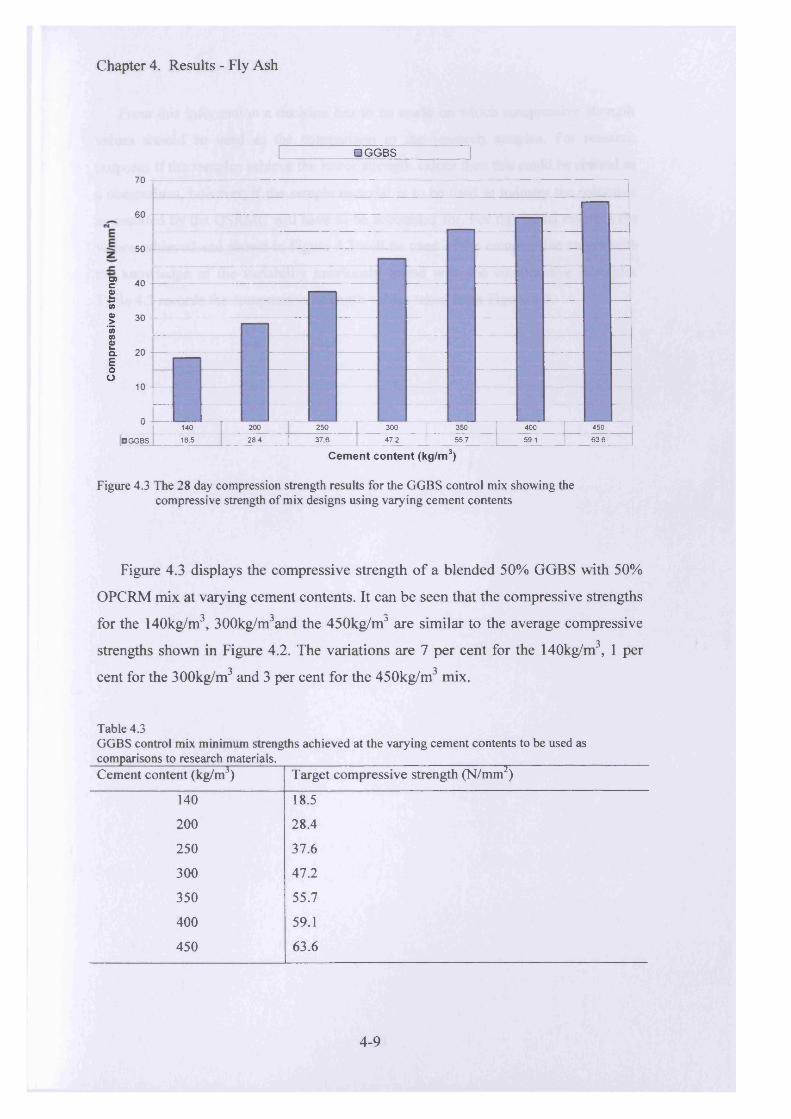
Chapter 4. Results - Fly Ash
□ GGBS
70 t
60
50
40
30
o> cf (0 0>>‘35 m£a 20Eoo
10
U i140 200 250 300 350 400 450
□ GGBS 18.5 28.4 I 376 47.2 55.7 59.1 63.6
C em en t c o n te n t (kg/m 3)
Figure 4.3 The 28 day compression strength results for the GGBS control mix showing the compressive strength of mix designs using varying cement contents
Figure 4.3 displays the compressive strength of a blended 50% GGBS with 50%
OPCRM mix at varying cement contents. It can be seen that the compressive strengths
for the 140kg/m\ 300kg/m3and the 450kg/mJ are similar to the average compressive
strengths shown in Figure 4.2. The variations are 7 per cent for the 140kg/m3, 1 per
cent for the 300kg/m3 and 3 per cent for the 450kg/m3 mix.
Table 4.3GGBS control mix minimum strengths achieved at the varying cement contents to be used as comparisons to research materials. __________________________________ _____________Cement content (kg/m3) Target compressive strength (N/mm2)
140 18.5
200 28.4
250 37.6
300 47.2
350 55.7
400 59.1
450 63.6
4-9

Chapter 4. Results - Fly Ash
From this information a decision has to be made on which compressive strength
values should be used as the comparison to the research samples. For research
purposes if the samples achieve the lower strength values then this could be classed as
a comparison, however; if the sample material is to be used in industry the reduction
as required by the QSRMC will have to be accounted for. For this initial research the
values achieved and shown in Figure 4.3 will be used as the comparative values with
the knowledge of the variability previously found with the compressive strengths.
Table 4.3 records the compressive strength values taken from Figure 4.3.
4-10
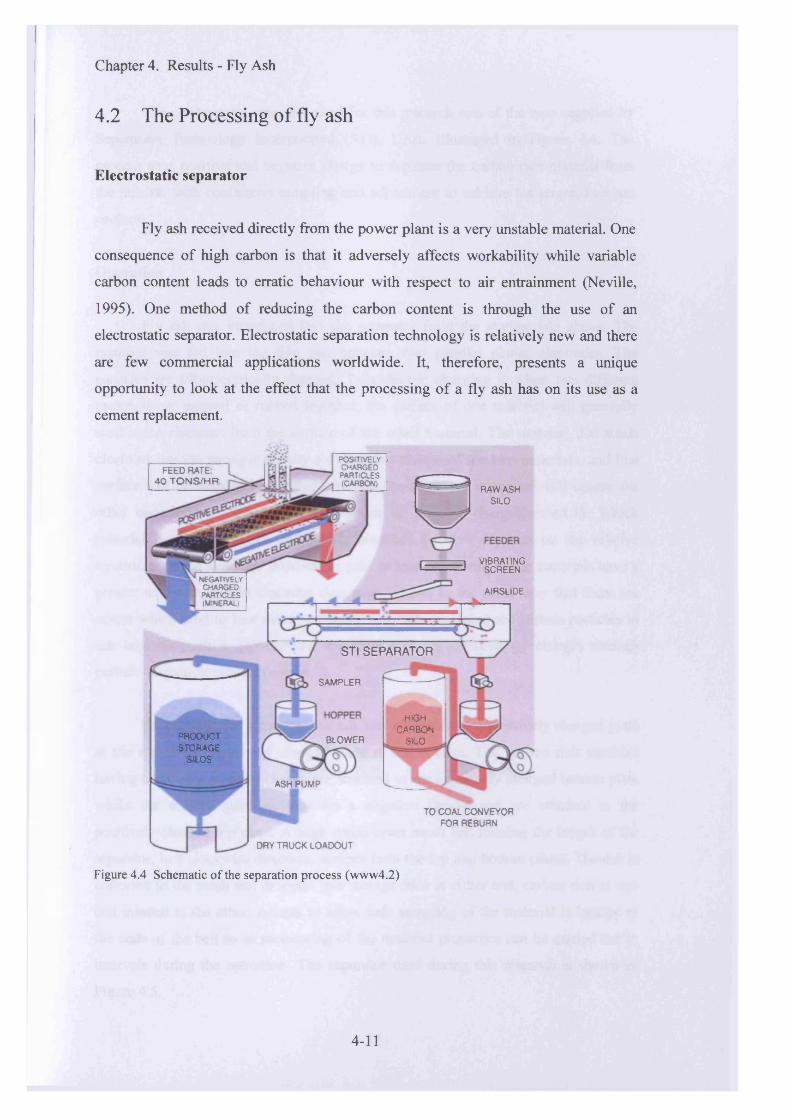
Chapter 4. Results - Fly Ash
4.2 The Processing of fly ash
Electrostatic separator
Fly ash received directly from the power plant is a very unstable material. One
consequence of high carbon is that it adversely affects workability while variable
carbon content leads to erratic behaviour with respect to air entrainment (Neville,
1995). One method of reducing the carbon content is through the use of an
electrostatic separator. Electrostatic separation technology is relatively new and there
are few commercial applications worldwide. It, therefore, presents a unique
opportunity to look at the effect that the processing of a fly ash has on its use as a
cement replacement.
POSITIVELYCHARGEDPARTICLES(CARBON)
FEED RATE 40 TONS/HR.
RAW ASH SILO
VIBRATINGSCREEN
NEGATIVELYCHARGEDPARTICLES(MINERAL)
AIRSLIDE
STI SEPARATOR
SAMPLER
HIGHCARBON
SILOPRODUCTSTORAGE
SILOS
BLOWER
ASH PUMP
TO COAL CONVEYOR FOR REBURN
DRY TRUCK L0AD0UT
Figure 4.4 Schematic of the separation process (www4.2)
4-11
Chapter 4. Results - Fly Ash
The electrostatic separator used for this research was of the type supplied by
Separation Technology Incorporated (STi), USA. illustrated in Figure 4.4. The
process uses positive and negative charge to separate the carbon rich material from
the mineral with continuous sampling and adjustment to achieve the targeted carbon
content.
Operation
Fly ash was introduced into the separator from the storage silo above. The
material was fed into the thin gap between two parallel planar electrodes. The
particles are triboelectrically charged. Triboelectric charging is when two different
materials are pressed or rubbed together, the surface o f one material will generally
steal some electrons from the surface o f the other material. The material that steals
electrons has the stronger affinity for negative charge o f the two materials, and that
surface will be negatively charged after the materials are separated. (Of course the
other material will have an equal amount o f positive charge)(www4.1). Which
material becomes negative and which becomes positive depends on the relative
tendencies of the materials involved to gain or lose electrons. Some materials have a
greater tendency to gain electrons than most others, in the same way that there are
others which tend to lose electrons easier than others. Unbumed carbon particles in
ash take on positive (+) charges; minerals take on negative (-) charges through
particle-to-particle contact (www4.2).
On entering the separator, the ash was subjected to a positively charged plate
at the top and a negatively charged plate at the bottom. The carbon rich particles
having taken on a positive charge are attached to the negatively charged bottom plate
whilst the mineral particles take on a negative charge and are attached to the
positively charged top plate. A high speed open mesh belt running the length o f the
separator, in a clockwise direction, scrapes both the top and bottom plates. The ash is
collected in the mesh and dropped into storage silos at either end, carbon rich at one
end mineral at the other. Access to allow safe sampling of the material is located at
the ends of the belt so as monitoring o f the material properties can be carried out at
intervals during the operation. The separator used during this research is shown in
Figure 4.5.
4-12
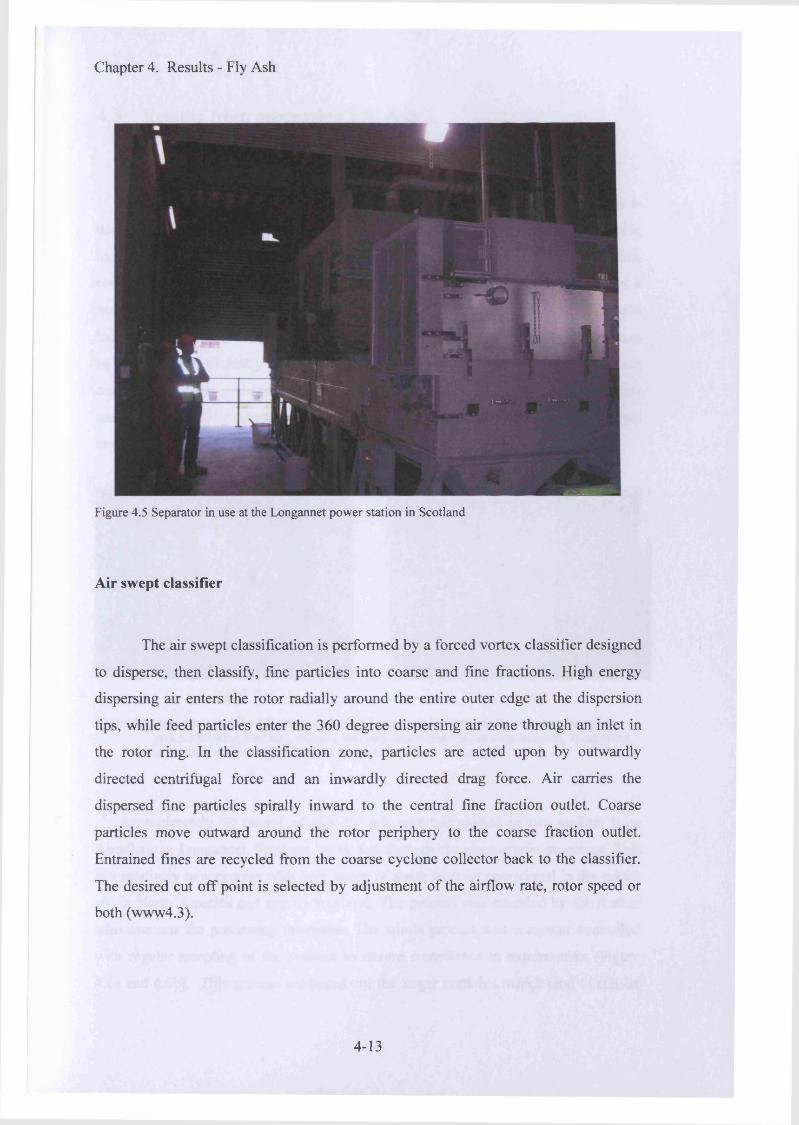
Chapter 4. Results - Fly Ash
Figure 4.5 Separator in use at the Longannet power station in Scotland
Air swept classifier
The air swept classification is performed by a forced vortex classifier designed
to disperse, then classify, fine particles into coarse and fine fractions. High energy
dispersing air enters the rotor radially around the entire outer edge at the dispersion
tips, while feed particles enter the 360 degree dispersing air zone through an inlet in
the rotor ring. In the classification zone, particles are acted upon by outwardly
directed centrifugal force and an inwardly directed drag force. Air carries the
dispersed fine particles spirally inward to the central fine fraction outlet. Coarse
particles move outward around the rotor periphery to the coarse fraction outlet.
Entrained fines are recycled from the coarse cyclone collector back to the classifier.
The desired cut off point is selected by adjustment of the airflow rate, rotor speed or
both (www4.3).
4-13
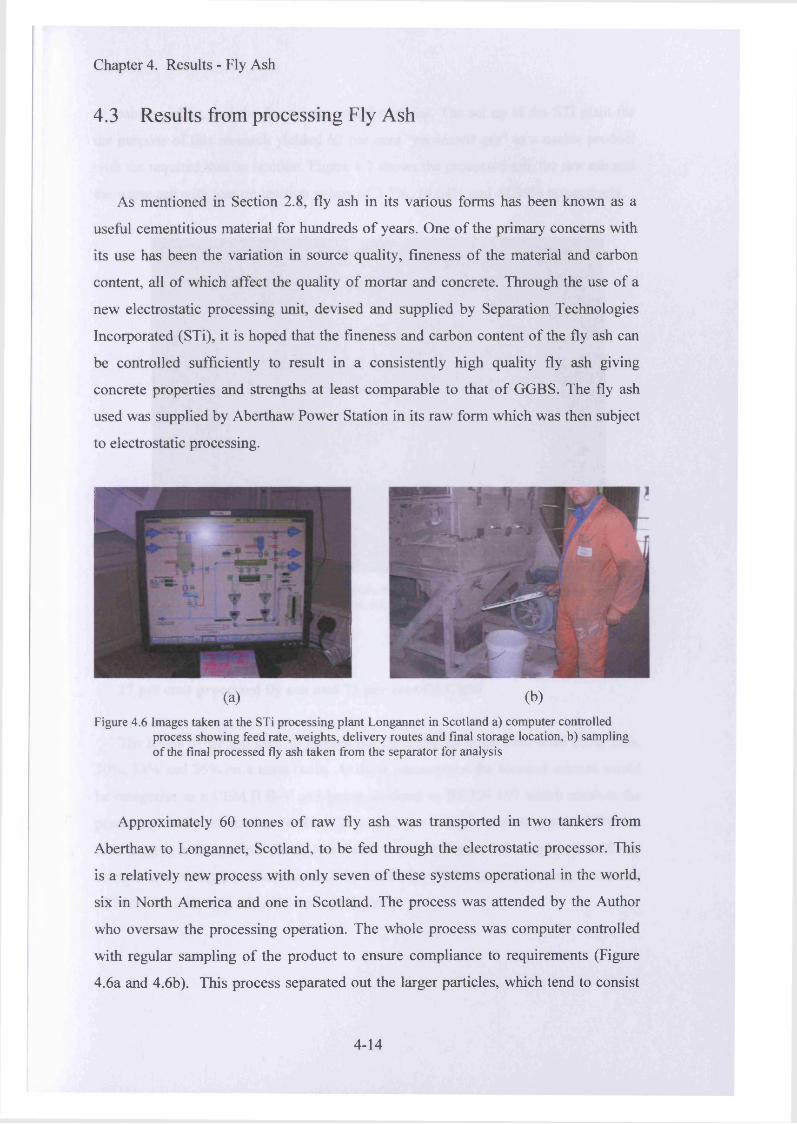
Chapter 4. Results - Fly Ash
4.3 Results from processing Fly Ash
As mentioned in Section 2.8, fly ash in its various forms has been known as a
useful cementitious material for hundreds of years. One of the primary concerns with
its use has been the variation in source quality, fineness of the material and carbon
content, all of which affect the quality of mortar and concrete. Through the use of a
new electrostatic processing unit, devised and supplied by Separation Technologies
Incorporated (STi), it is hoped that the fineness and carbon content of the fly ash can
be controlled sufficiently to result in a consistently high quality fly ash giving
concrete properties and strengths at least comparable to that of GGBS. The fly ash
used was supplied by Aberthaw Power Station in its raw form which was then subject
to electrostatic processing.
(a) (b)Figure 4.6 Images taken at the STi processing plant Longannet in Scotland a) computer controlled
process showing feed rate, weights, delivery routes and final storage location, b) sampling of the final processed fly ash taken from the separator for analysis
Approximately 60 tonnes of raw fly ash was transported in two tankers from
Aberthaw to Longannet, Scotland, to be fed through the electrostatic processor. This
is a relatively new process with only seven of these systems operational in the world,
six in North America and one in Scotland. The process was attended by the Author
who oversaw the processing operation. The whole process was computer controlled
with regular sampling of the product to ensure compliance to requirements (Figure
4.6a and 4.6b). This process separated out the larger particles, which tend to consist
4-14

Chapter 4. Results - Fly Ash
of mainly carbon, and the finer more useful material. The set up of the STi plant for
the purpose of this research yielded 62 per cent “processed ash” as a usable product
with the required loss on ignition. Figure 4.7 shows the processed ash, the raw ash and
the waste ash with loss on ignition values of 3.7%, 19.04% and 44.39% respectively.
Figure 4.7 Image comparing the three products within the separation process, the processed ash, the raw feed ash and the waste, high carbon, ash.
27 per cent processed fly ash and 73 per cent OPCRM
The levels of fly ash used to replace the OPCRM for these tests were 25%, 27%,
30%, 33% and 35% on a mass basis. At these percentages the blended cement would
be categorise as a CEM II B-V and hence conform to BS EN 197 which restricts the
percentage of fly ash used to between 21 and 35 per cent. As a starting point 27% was
used to get a feel as to how the fly ash would perform. Figure 4.8 compares the 28 day
compressive strength of the processed fly ash to the GGBS control at cement contents
of 140,200,250,300,350,400 and 450 kg/m3.
4-15
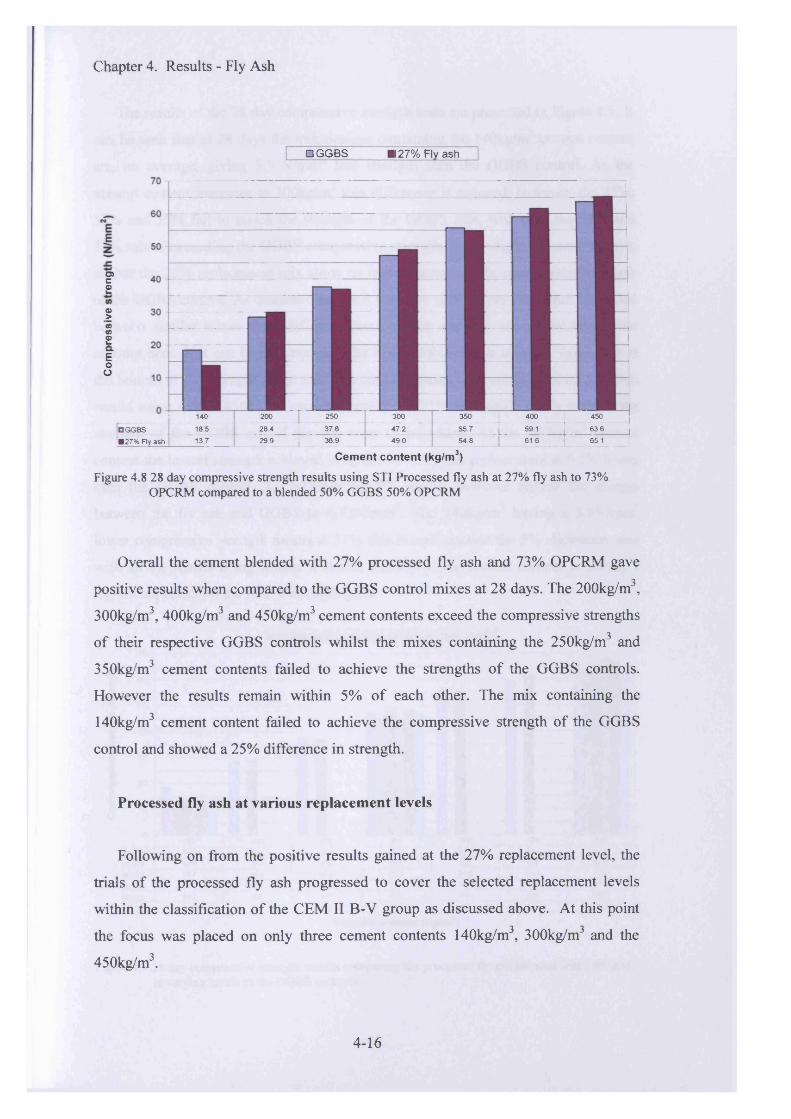
Chapter 4. Results - Fly Ash
□ GGBS 127% Fly ash
ace
ICOCO£—Eoo
I 140 200 250 300 350 400 450
□ GGBS 18.5 28.4 37.6 47.2 55.7 59.1 63.6
■ 27% Fly ash 13.7 29.9 36 9 49.0 54.8 61.6 65.1
Cem ent con ten t (kg/m3)
Figure 4.8 28 day compressive strength results using STI Processed fly ash at 27% fly ash to 73% OPCRM compared to a blended 50% GGBS 50% OPCRM
Overall the cement blended with 27% processed fly ash and 73% OPCRM gave
positive results when compared to the GGBS control mixes at 28 days. The 200kg/m3,
300kg/m3, 400kg/m3 and 450kg/m3 cement contents exceed the compressive strengths
of their respective GGBS controls whilst the mixes containing the 250kg/m3 and
350kg/m3 cement contents failed to achieve the strengths of the GGBS controls.
However the results remain within 5% of each other. The mix containing the
140kg/m3 cement content failed to achieve the compressive strength of the GGBS
control and showed a 25% difference in strength.
Processed fly ash at various replacement levels
Following on from the positive results gained at the 27% replacement level, the
trials of the processed fly ash progressed to cover the selected replacement levels
within the classification of the CEM II B-V group as discussed above. At this point
the focus was placed on only three cement contents 140kg/m3, 300kg/m3 and the
450kg/m3.
4-16
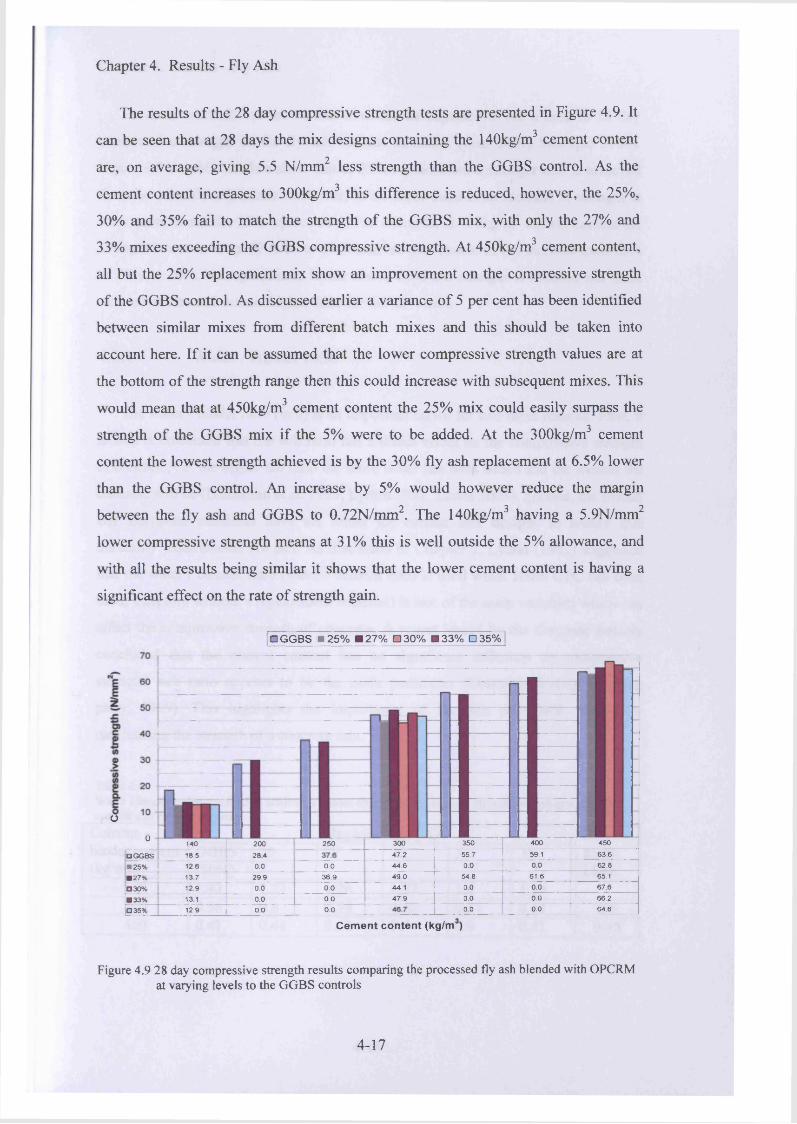
Chapter 4. Results - Fly Ash
The results of the 28 day compressive strength tests are presented in Figure 4.9. It
can be seen that at 28 days the mix designs containing the 140kg/m3 cement content
are, on average, giving 5.5 N/mm2 less strength than the GGBS control. As the
cement content increases to 300kg/m3 this difference is reduced, however, the 25%,
30% and 35% fail to match the strength of the GGBS mix, with only the 27% and
33% mixes exceeding the GGBS compressive strength. At 450kg/m3 cement content,
all but the 25% replacement mix show an improvement on the compressive strength
of the GGBS control. As discussed earlier a variance of 5 per cent has been identified
between similar mixes from different batch mixes and this should be taken into
account here. If it can be assumed that the lower compressive strength values are at
the bottom of the strength range then this could increase with subsequent mixes. This
would mean that at 450kg/m3 cement content the 25% mix could easily surpass the
strength of the GGBS mix if the 5% were to be added. At the 300kg/m3 cement
content the lowest strength achieved is by the 30% fly ash replacement at 6.5% lower
than the GGBS control. An increase by 5% would however reduce the margin
between the fly ash and GGBS to 0.72N/mm2. The 140kg/m3 having a 5.9N/mm2
lower compressive strength means at 31% this is well outside the 5% allowance, and
with all the results being similar it shows that the lower cement content is having a
significant effect on the rate of strength gain.
□ GGBS ■ 25% B27% D30% B33% D35%
O
■ ■
0140 200 250 300 350 400 450
□ GGBS 18.5 2 8 4 47.2 55.7 59.1 63.6
■ 25% 12.6 0.0 0.0 44.6 0.0 0.0 62.8
■ 27% 13.7 29.9 36.9 49.0 54.8 61.6 65.1
■ 30% 12.9 0.0 0.0 44.1 0.0 0.0 67.6
■ 33% 13.1 0.0 0.0 47.9 0.0 0.0 66.2
□ 35% 12.9 0.0 0.0 I 0.0 0.0 64.6
Cem ent conten t (kg/m )
Figure 4.9 28 day compressive strength results comparing the processed fly ash blended with OPCRM at varying levels to the GGBS controls
4-17
Chapter 4. Results - Fly Ash
Previous research has shown that it would be expected to see a drop in 28 day
compressive strength as the fly ash content increases (Sear 2007, Siddique 2004).
Figure 4.9 should therefore show that at 25% replacement a stronger mix is achieved
than the other fly ash mixes. However, in all cases there is an increase in strength at
some point above the 25% replacement. For example, at 450kg/m3 cement content the
strength increases from 62 to 65 to 67 N/mm as the amount of FA increase from 25%
to 27% to 30%. At replacement levels above 30% the strength is reduced but these
reduced values still remain higher than for the 25% mix.
4.2.1 Water / Binder ratio
The water / binder ratio (w/b) is an important factor for two main reasons. First, it
is well documented that the w/b ratio has a direct effect on the compressive strength
of concrete, i.e. the higher the ratio the more water has been added and the weaker the
concrete will be (Balendran et ai. 1995, Lydon 1982, Lewis 2003). Second, the British
and European standards have set limits for certain mix designs to ensure that
durability requirements are met. As discussed in Chapter 2, Lydon (1982) suggested
that the water / cement ratio (water / cement ratio is used when 100% OPC has been
used, therefore without a replacement material) is one o f the main variables which can
affect the compressive strength of concrete. A report issued by the Concrete Society
concluded that the cement content has no significant influence on compressive
strength; w/b ratio appears to be the main parameter (Concrete Society Working
party, 1999). This highlights the importance o f the w/b ratio with respect to
maximising the strength of a concrete mix.
Table 4.4Water / binder ratios required to achieve a 70mm slump for the various fly ash percentages, GGBS control and cement contents
Cement binder content (kg/m3)
Replacement (%) BS8500Limit
GGBS(50%)
25 27 30 33 35
140 1.43 1.22 1.26 1.27 1.3 1.19 -
300 0.56 0.6 0.59 0.62 0.57 0.53 0.6450 0.41 0.44 0.42 0.4 0.4 0.41 0.45
4-18
Chapter 4. Results - Fly Ash
Table 4.4 shows the w/b ratios for the three main cement contents used for the
processed fly ash comparison with GGBS and the associated British Standard limit. It
is well recorded (Owens, 1979) that the partial replacement of CEM I by fly ash will
result in a reduction in water demand with a consequent increase in strength. This
increase in strength partially offsets the lower early strengths associated with the
delayed reaction of the fly ash. Table 4.4 shows that the mixes containing the lower
cement content, of 140kg/m3, achieve a lower w/b ratio than the GGBS control at all
replacement levels. This, however, does not relate to the compressive strengths as
none of these mixes reach the compressive strength o f the GGBS control. At this level
of cement content there is no British Standard limit as the cement content is regarded
as too low to meet any durability requirements. At 300kg/m3 cement content the 27%
fly ash replacement achieves the highest compressive strength yet the w/b ratio
exceeds that of the GGBS control. The 30% fly ash mix is higher than the British
Standard limits at 0.62, which could explain the dip in the compressive result at this
position whilst at 450kg/m cement content the 30% fly ash mix, having the lowest
w/b ratio, out performs all the other mixes in that group. At 450kg/m cement content
the results begin to follow the expected pattern with the lower w/b ratios achieving the
greater compressive strengths and the higher w/b ratio at the 25% replacement,
achieving the lowest. The 27% replacement shows a higher w/b ratio but exceeds the
GGBS control strength.
The finer the fly ash, the greater the water reducing effect and, by increasing the
quantity of fly ash in the cement, the demand for water will further decrease (Owens,
1979). The results of the water / binder ratios do not follow this statement exactly as
it can be seen that with the 30% fly ash replacement both the 140kg/m3 and the
300kg/m3 mixes give higher w/b ratios than their preceding fly ash mixes as does the
33% fly ash replacement at 140kg/m3. Therefore, judging the compressive strength on
w/b alone seems to be inadequate, as it ignores other factors, particle shape and
grading for example (Balendran and Pang 1995), which also have a bearing on
performance.
4-19
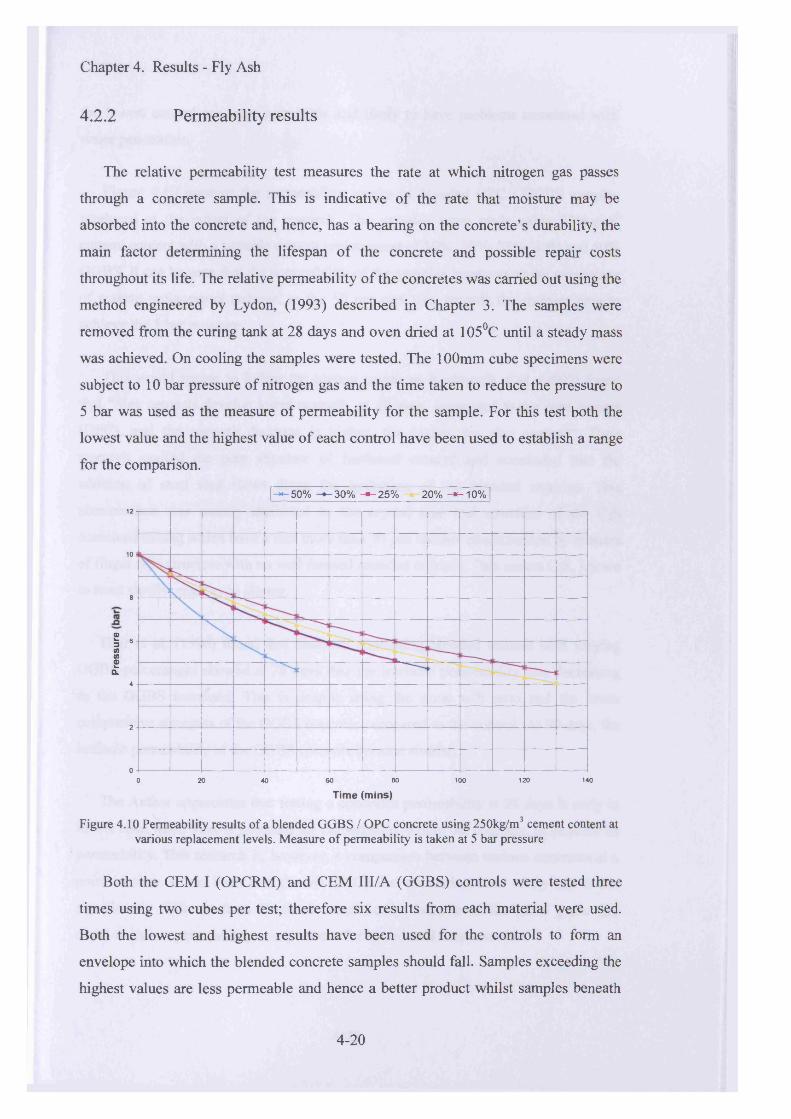
Chapter 4. Results - Fly Ash
4.2.2 Perm eability results
The relative permeability test measures the rate at which nitrogen gas passes
through a concrete sample. This is indicative of the rate that moisture may be
absorbed into the concrete and, hence, has a bearing on the concrete’s durability, the
main factor determining the lifespan of the concrete and possible repair costs
throughout its life. The relative permeability of the concretes was carried out using the
method engineered by Lydon, (1993) described in Chapter 3. The samples were
removed from the curing tank at 28 days and oven dried at 105°C until a steady mass
was achieved. On cooling the samples were tested. The 100mm cube specimens were
subject to 10 bar pressure of nitrogen gas and the time taken to reduce the pressure to
5 bar was used as the measure of permeability for the sample. For this test both the
lowest value and the highest value of each control have been used to establish a range
for the comparison.
|-*-50% -* -30% - * - 25 % 2 0 % ^ T 5 %12
10
8
1 • M 0)£
CL
4
2
080 120 1400 20 40 60 100
Time (mins)
Figure 4.10 Permeability results of a blended GGBS / OPC concrete using 250kg/m3 cement content at various replacement levels. Measure o f permeability is taken at 5 bar pressure
Both the CEM I (OPCRM) and CEM III/A (GGBS) controls were tested three
times using two cubes per test; therefore six results from each material were used.
Both the lowest and highest results have been used for the controls to form an
envelope into which the blended concrete samples should fall. Samples exceeding the
highest values are less permeable and hence a better product whilst samples beneath
4-20
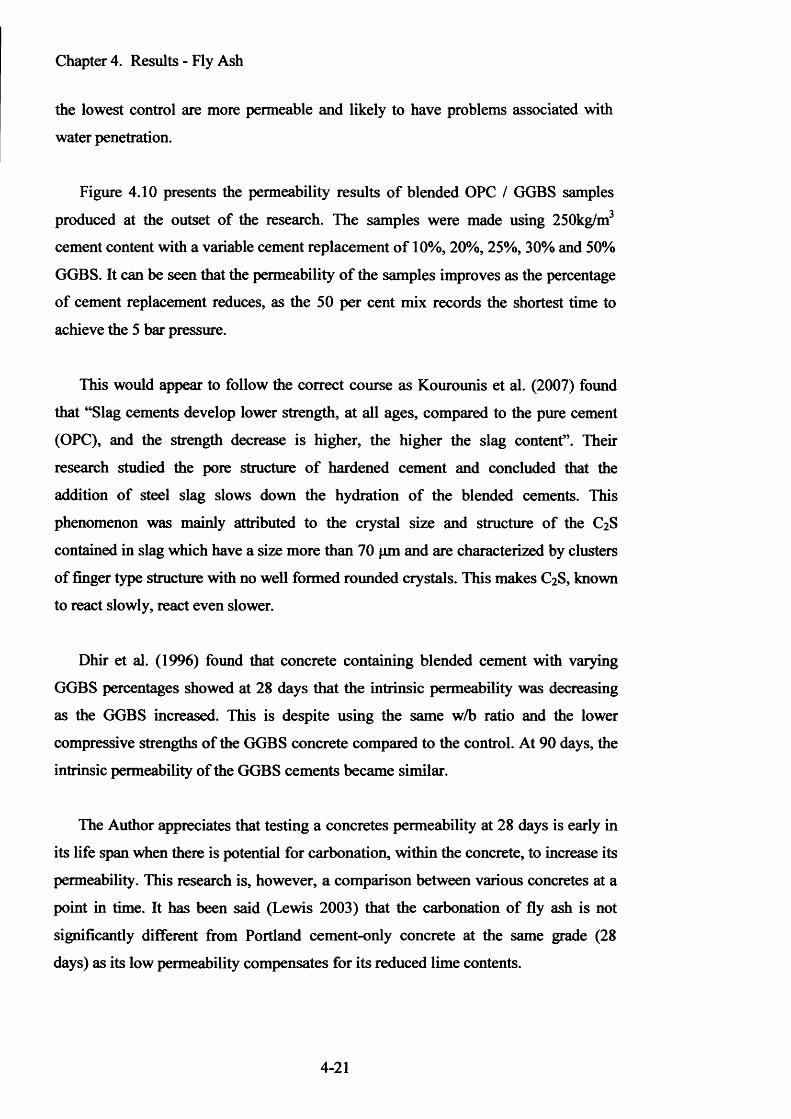
Chapter 4. Results - Fly Ash
the lowest control are more permeable and likely to have problems associated with
water penetration.
Figure 4.10 presents the permeability results of blended OPC / GGBS samples
produced at the outset of the research. The samples were made using 250kg/m
cement content with a variable cement replacement o f 10%, 20%, 25%, 30% and 50%
GGBS. It can be seen that the permeability o f the samples improves as the percentage
of cement replacement reduces, as the 50 per cent mix records the shortest time to
achieve the 5 bar pressure.
This would appear to follow the correct course as Kourounis et al. (2007) found
that “Slag cements develop lower strength, at all ages, compared to the pure cement
(OPC), and the strength decrease is higher, the higher the slag content”. Their
research studied the pore structure o f hardened cement and concluded that the
addition o f steel slag slows down the hydration o f the blended cements. This
phenomenon was mainly attributed to the crystal size and structure of the C2S
contained in slag which have a size more than 70 pm and are characterized by clusters
of finger type structure with no well formed rounded crystals. This makes C2 S, known
to react slowly, react even slower.
Dhir et al. (1996) found that concrete containing blended cement with varying
GGBS percentages showed at 28 days that the intrinsic permeability was decreasing
as the GGBS increased. This is despite using the same w/b ratio and the lower
compressive strengths of the GGBS concrete compared to the control. At 90 days, the
intrinsic permeability of the GGBS cements became similar.
The Author appreciates that testing a concretes permeability at 28 days is early in
its life span when there is potential for carbonation, within the concrete, to increase its
permeability. This research is, however, a comparison between various concretes at a
point in time. It has been said (Lewis 2003) that the carbonation of fly ash is not
significantly different from Portland cement-only concrete at the same grade (28
days) as its low permeability compensates for its reduced lime contents.
4-21
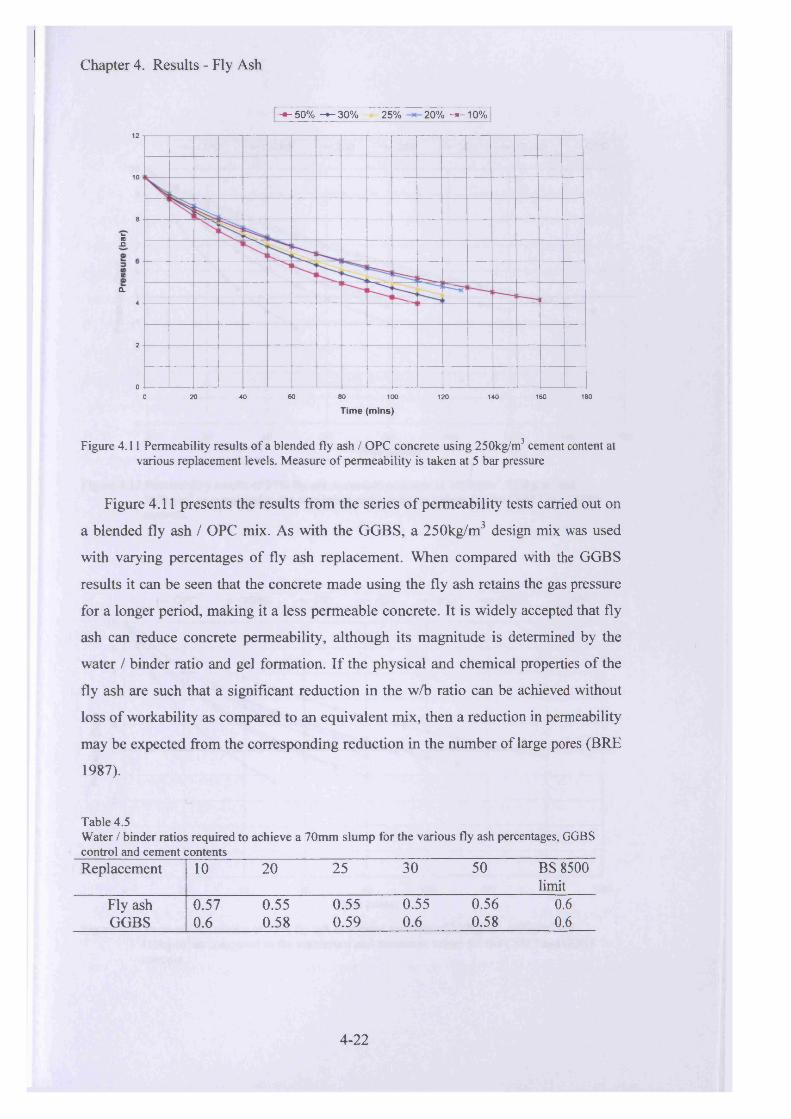
Chapter 4. Results - Fly Ash
-■-50% -* -30% 25% 20% -»-10% l
12
10
8
?5-O
tf!a
4
2
0600 20 40 80 100 120 140 160 180
Time (mins)
Figure 4.11 Permeability results of a blended fly ash / OPC concrete using 250kg/m3 cement content at various replacement levels. Measure of permeability is taken at 5 bar pressure
Figure 4.11 presents the results from the series of permeability tests carried out on
a blended fly ash / OPC mix. As with the GGBS, a 250kg/m3 design mix was used
with varying percentages of fly ash replacement. When compared with the GGBS
results it can be seen that the concrete made using the fly ash retains the gas pressure
for a longer period, making it a less permeable concrete. It is widely accepted that fly
ash can reduce concrete permeability, although its magnitude is determined by the
water / binder ratio and gel formation. If the physical and chemical properties of the
fly ash are such that a significant reduction in the w/b ratio can be achieved without
loss of workability as compared to an equivalent mix, then a reduction in permeability
may be expected from the corresponding reduction in the number of large pores (BRE
1987).
Table 4.5Water / binder ratios required to achieve a 70mm slump for the various fly ash percentages, GGBS control and cement contents ___Replacement 10 20 25 30 50 BS 8500
limitFly ash 0.57 0.55 0.55 0.55 0.56 0.6GGBS 0.6 0.58 0.59 0.6 0.58 0.6
4-22
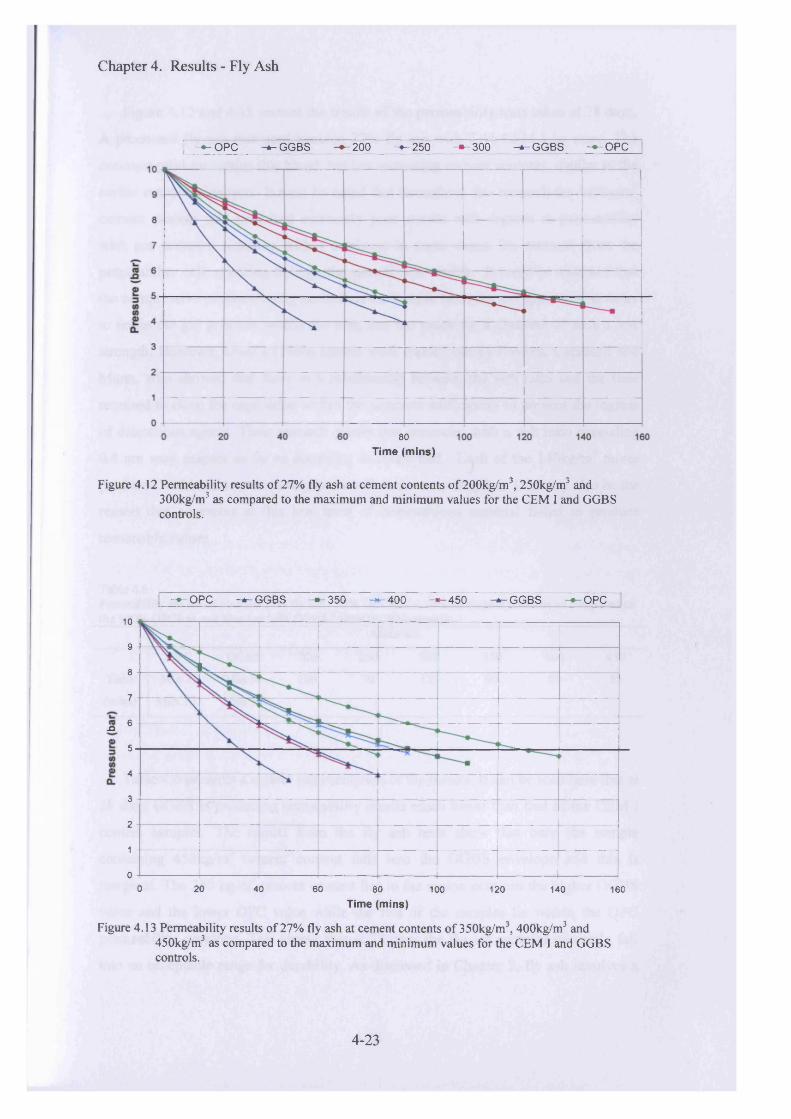
Chapter 4. Results - Fly Ash
I — OPC -+-GG BS —-2 0 0 — -250 — 300 -— GGBS — OPC
Figure 4.
80Time (mins)
12 Permeability results of 27% fly ash at cement contents of200kg/m3, 250kg/mJ and 300kg/m3 as compared to the maximum and minimum values for the CEM I and GGBS controls.
— OPC — GGBS -— 350 -* -4 0 0 — 4 50 — GGBS — OPC
10
9
8
7
6-Q5
4
3
2
1
00 20 40 60 80 100 120 140 160
Time (mins)
Figure 4.13 Permeability results of 27% fly ash at cement contents of 350kg/m3, 400kg/m3 and450kg/m3 as compared to the maximum and minimum values for the CEM I and GGBS controls.
4-23

Chapter 4. Results - Fly Ash
Figure 4.12 and 4.13 present the results of the permeability tests taken at 28 days.
A processed fly ash was used blended 27% fly ash with 73% CEM I by mass. The
concrete produce retains this blend, but has increasing cement contents, similar to the
earlier compression tests. It must be noted that throughout this research the 140kg/m3
cement content mix produced extremely poor results with regards to permeability
with gas pressure reducing within a minute in some cases. On removal from the
permeability cell, cracking through the sample was visible. It could be assumed that
the compressive pressure being exerted on the sample from the test apparatus, in order
to retain the gas pressure within the cell, was too much for a concrete of such a low
strength. However, Owens (1980) quotes work carried out by Powers, Copeland and
Mann, who showed that there is a relationship between the w/b ratio and the time
required to close the capillaries within the concrete sufficiently to prevent the ingress
of deleterious agents. Their research shows that concretes with a w/b ratio exceeding
0.6 are very suspect as far as durability is concerned. Each o f the 140kg/m3 mixes
produced within this research required a w/b ratio exceeding 0.6. This may also be the
reason that concretes at this low level of cementitious material failed to produce
reasonable values.
Table 4.6Permeability results of blended 27% fly ash / 73% OPCRM at various cement contents as compared to the 100% OPCRM and blended 50% GGBS / 50%OPCRM controls
Materials
OPC GGBS 200 250 300 350 400 450Time Min 75 Min 34 100 70 123 90 85 55
(mins) Max 127 Max 57
Table 4.6 presents a clearer representation of the results. It can be seen here that at
28 days GGBS is producing permeability results much lower than that of the CEM I
control samples. The results from the fly ash tests show that only the sample
containing 450kg/m3 cement content falls into the GGBS envelope and this is• . _ i i
marginal. The 250 kg/m cement content lies in the region between the higher GGBS
value and the lower OPC value while the rest of the samples lie within the OPC
permeability envelope. This shows that at 28 days the fly ash samples generally fall
into an acceptable range for durability. As discussed in Chapter 2, fly ash involves a
4-24

Chapter 4. Results - Fly Ash
secondary reaction between active silicon dioxide (SiC>2) within the fly ash and the
calcium hydroxide (CH) produced as a by-product from the cement hydration. This
increases the time required to reach its full potential and is probably not realised here.
However, these results show that the durability o f concrete containing fly ash is not an
issue.
4.2.3 Discussion
The processed ash has performed well at the replacement levels used. At 27% the
use of the processed fly ash has compared well with the GGBS controls except at the
lowest strength of 140N/mm where a 25% drop in strength was recorded. Concrete at
this cement content is seldom supplied anymore as it is a very low grade, weak
concrete. The low level of cement content and the high water / binder ratio may not be
providing the alkali rich environment that the fly ash requires to become a
contributing factor. Also, the lower level o f fine material makes this mix a coarse
looking mix and the particle grading may not produce the particle packing necessary
for a strong concrete. An awareness of this is required if concrete at this cement
content is to be supplied; plant trials must be produced and cement contents adjusted
accordingly. Both the 33% and 35% replacement levels give good values for
compressive strength. This is in line with a study carried out by Oner et al. (2004)
who concluded the optimum value of fly ash is about 40% beyond which compressive
strength starts to decrease.
The results of the water / binder ratios show that although in theory lower w/b
ratios will produce a higher strength concrete the inclusion o f fly ash may be having
an effect on this. Therefore, further research is required to identify other factors
involved in producing a good cement replacement.
4-25
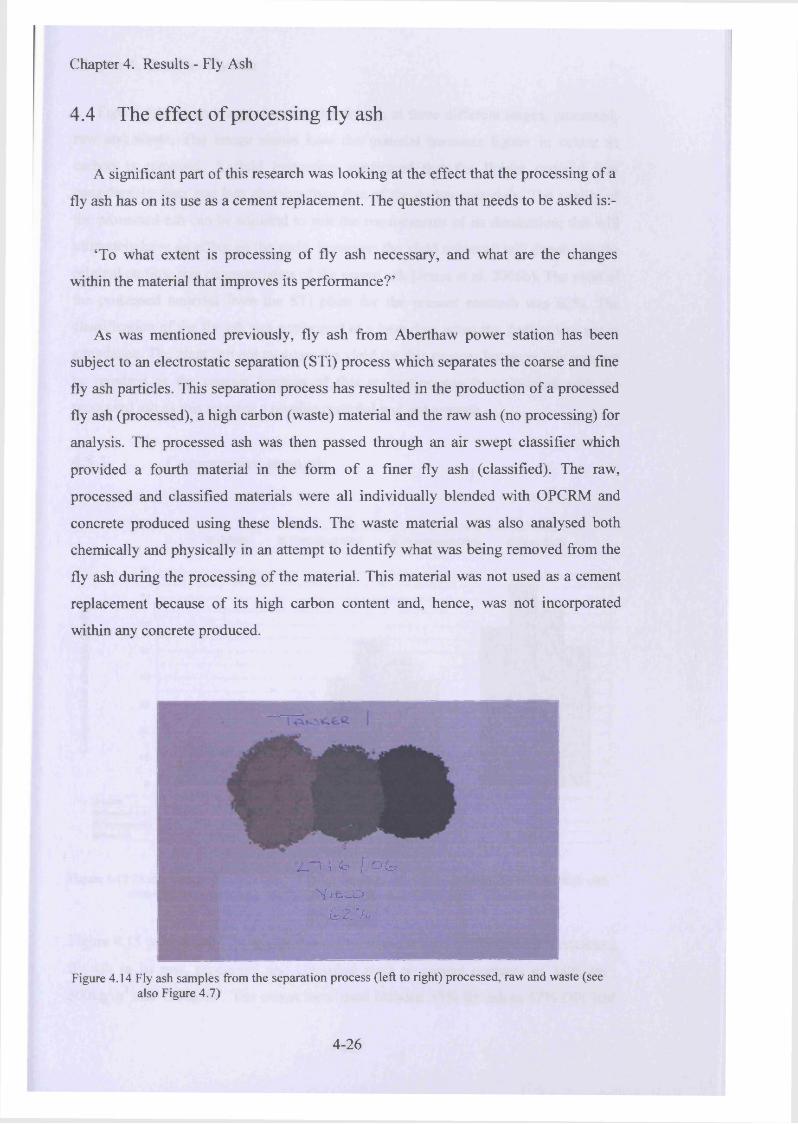
Chapter 4. Results - Fly Ash
4.4 The effect of processing fly ash
A significant part of this research was looking at the effect that the processing of a
fly ash has on its use as a cement replacement. The question that needs to be asked is:-
‘To what extent is processing of fly ash necessary, and what are the changes
within the material that improves its performance?’
As was mentioned previously, fly ash from Aberthaw power station has been
subject to an electrostatic separation (STi) process which separates the coarse and fine
fly ash particles. This separation process has resulted in the production of a processed
fly ash (processed), a high carbon (waste) material and the raw ash (no processing) for
analysis. The processed ash was then passed through an air swept classifier which
provided a fourth material in the form of a finer fly ash (classified). The raw,
processed and classified materials were all individually blended with OPCRM and
concrete produced using these blends. The waste material was also analysed both
chemically and physically in an attempt to identify what was being removed from the
fly ash during the processing of the material. This material was not used as a cement
replacement because of its high carbon content and, hence, was not incorporated
within any concrete produced.
2>1 I <o I O(o
'Viec.oG Z 7 .
Figure 4.14 Fly ash samples from the separation process (left to right) processed, raw and waste (see also Figure 4.7)
4-26

Chapter 4. Results - Fly Ash
Figure 4.14 is an image showing the fly ash at three different stages, processed,
raw and waste. The image shows how the material becomes lighter in colour as
carbon is removed. A field inspection confirmed that the lighter material was
considerably finer and less abrasive than that of the darker materials. The quality of
the processed ash can be adjusted to suit the requirements of its destination; this will
ultimately have an effect on the yield, however; the yield achieved will depend on the
original particle size characteristics of the parent ash (Jones et al. 2006b). The yield of
the processed material from the STi plant for the present research was 62%. The
classification of the fly ash was performed at a later date when the Author was not in
attendance. The plant can not measure the yield for this process however this may not
be required as the coarser fraction of this separation can be reinstated with the
processed ash as this remains a useable material and not a waste.
4.3.1 Compressive strength
■ GGBS ■ Classified 33% ■ Processed 33% ■ Raw 33%
Processed 33%
D Raw 33%
C em ent con ten t (kg/m )
Figure 4.15 28 day compressive strength results o f concrete using various blended 67% OPCRM with classified, processed and raw fly ash as compared to GGBS 50% / OPCRM 50%
Figure 4.15 presents the 28 day compressive strength results of concretes containing
fly ash in its raw, processed and classified state at cement contents of 140kg/m3,
300kg/m3 and 450kg/m3. The mixes have used blended 33% fly ash to 67% OPCRM
4-27
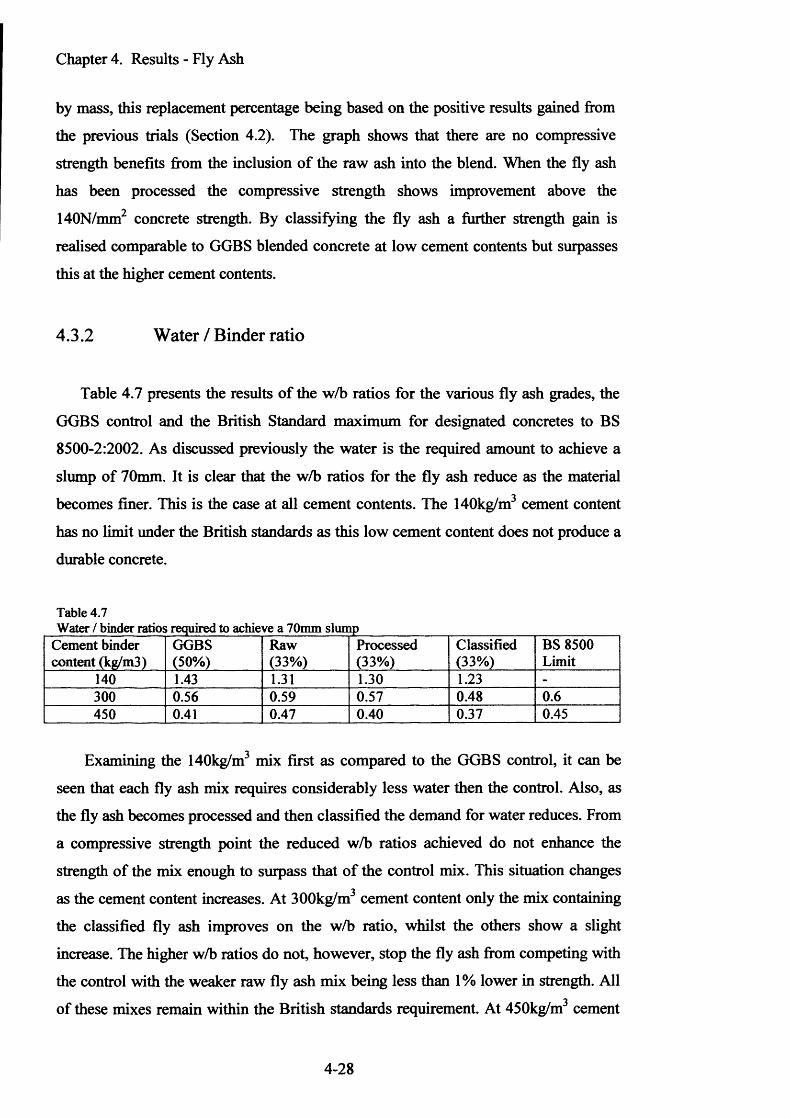
Chapter 4. Results - Fly Ash
by mass, this replacement percentage being based on the positive results gained from
the previous trials (Section 4.2). The graph shows that there are no compressive
strength benefits from the inclusion of the raw ash into the blend. When the fly ash
has been processed the compressive strength shows improvement above the
140N/mm2 concrete strength. By classifying the fly ash a further strength gain is
realised comparable to GGBS blended concrete at low cement contents but surpasses
this at the higher cement contents.
4.3.2 Water / Binder ratio
Table 4.7 presents the results of the w/b ratios for the various fly ash grades, the
GGBS control and the British Standard maximum for designated concretes to BS
8500-2:2002. As discussed previously the water is the required amount to achieve a
slump of 70mm. It is clear that the w/b ratios for the fly ash reduce as the material
becomes finer. This is the case at all cement contents. The 140kg/m cement content
has no limit under the British standards as this low cement content does not produce a
durable concrete.
Table 4.7Water / binder ratios required to achieve a 70mm slump
Cement binder content (kg/m3)
GGBS(50%)
Raw(33%)
Processed(33%)
Classified(33%)
BS 8500 Limit
140 1.43 1.31 1.30 1.23 -
300 0.56 0.59 0.57 0.48 0.6450 0.41 0.47 0.40 0.37 0.45
Examining the 140kg/m3 mix first as compared to the GGBS control, it can be
seen that each fly ash mix requires considerably less water then the control. Also, as
the fly ash becomes processed and then classified the demand for water reduces. From
a compressive strength point the reduced w/b ratios achieved do not enhance the
strength of the mix enough to surpass that o f the control mix. This situation changes
as the cement content increases. At 300kg/m3 cement content only the mix containing
the classified fly ash improves on the w/b ratio, whilst the others show a slight
increase. The higher w/b ratios do not, however, stop the fly ash from competing with
the control with the weaker raw fly ash mix being less than 1% lower in strength. All
of these mixes remain within the British standards requirement. At 450kg/m cement
4-28
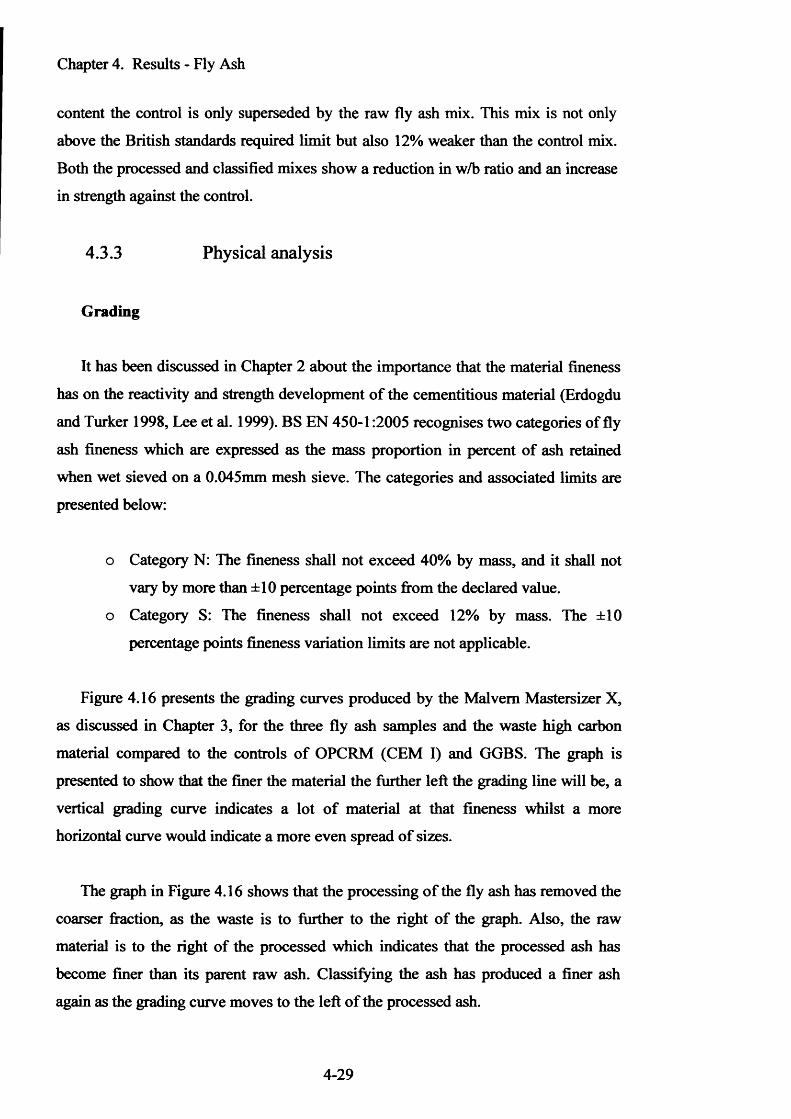
Chapter 4. Results - Fly Ash
content the control is only superseded by the raw fly ash mix. This mix is not only
above the British standards required limit but also 12% weaker than the control mix.
Both the processed and classified mixes show a reduction in w/b ratio and an increase
in strength against the control.
4.3.3 Physical analysis
Grading
It has been discussed in Chapter 2 about the importance that the material fineness
has on the reactivity and strength development o f the cementitious material (Erdogdu
and Turker 1998, Lee et al. 1999). BS EN 450-1:2005 recognises two categories of fly
ash fineness which are expressed as the mass proportion in percent of ash retained
when wet sieved on a 0.045mm mesh sieve. The categories and associated limits are
presented below:
o Category N: The fineness shall not exceed 40% by mass, and it shall not
vary by more than ±10 percentage points from the declared value,
o Category S: The fineness shall not exceed 12% by mass. The ±10
percentage points fineness variation limits are not applicable.
Figure 4.16 presents the grading curves produced by the Malvern Mastersizer X,
as discussed in Chapter 3, for the three fly ash samples and the waste high carbon
material compared to the controls o f OPCRM (CEM I) and GGBS. The graph is
presented to show that the finer the material the further left the grading line will be, a
vertical grading curve indicates a lot o f material at that fineness whilst a more
horizontal curve would indicate a more even spread o f sizes.
The graph in Figure 4.16 shows that the processing o f the fly ash has removed the
coarser fraction, as the waste is to further to the right of the graph. Also, the raw
material is to the right of the processed which indicates that the processed ash has
become finer than its parent raw ash. Classifying the ash has produced a finer ash
again as the grading curve moves to the left of the processed ash.
4-29
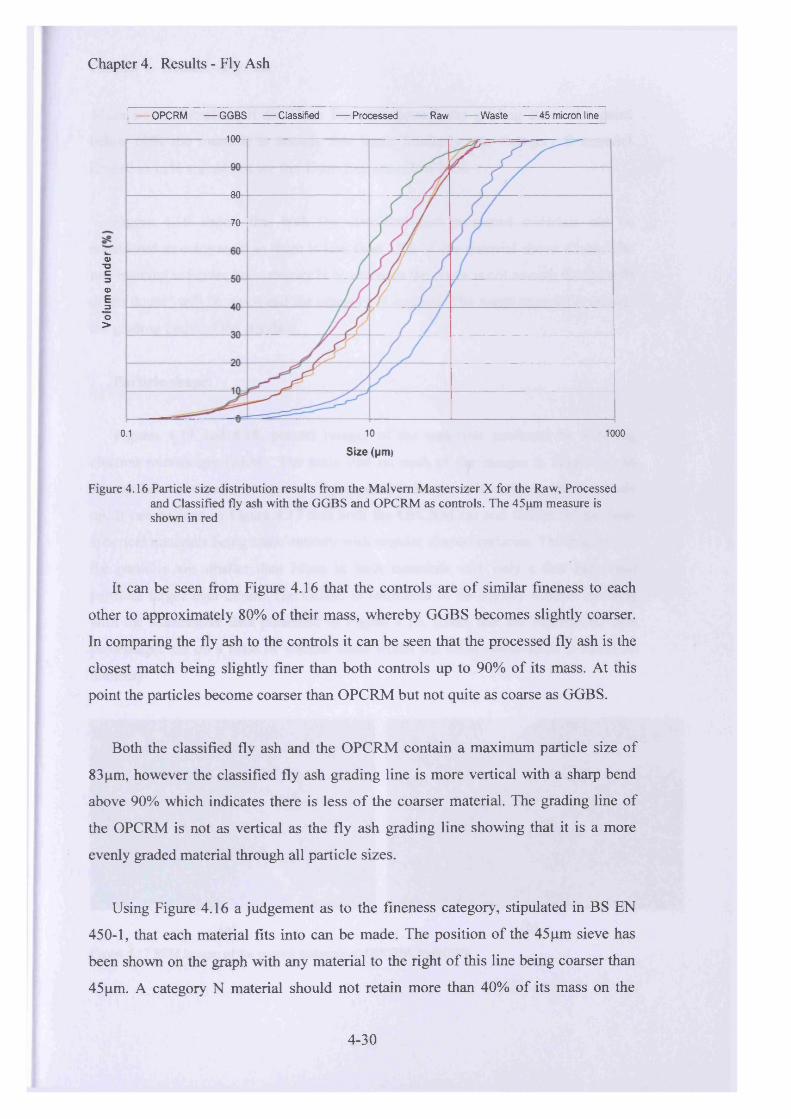
Chapter 4. Results - Fly Ash
OPCRM — GGBS — Classified — Processed — Raw — Waste — 45 micron line
408
80
—70H----
k.Q>T3c3OJE_3O>
0.1 10 1000
Size (pm)
Figure 4.16 Particle size distribution results from the Malvern Mastersizer X for the Raw, Processed and Classified fly ash with the GGBS and OPCRM as controls. The 45pm measure is shown in red
It can be seen from Figure 4.16 that the controls are of similar fineness to each
other to approximately 80% of their mass, whereby GGBS becomes slightly coarser.
In comparing the fly ash to the controls it can be seen that the processed fly ash is the
closest match being slightly finer than both controls up to 90% of its mass. At this
point the particles become coarser than OPCRM but not quite as coarse as GGBS.
Both the classified fly ash and the OPCRM contain a maximum particle size of
83 pm, however the classified fly ash grading line is more vertical with a sharp bend
above 90% which indicates there is less of the coarser material. The grading line of
the OPCRM is not as vertical as the fly ash grading line showing that it is a more
evenly graded material through all particle sizes.
Using Figure 4.16 a judgement as to the fineness category, stipulated in BS EN
450-1, that each material fits into can be made. The position of the 45 pm sieve has
been shown on the graph with any material to the right of this line being coarser than
45 pm. A category N material should not retain more than 40% of its mass on the
4-30
Chapter 4. Results - Fly Ash
45pm sieve. Therefore, if the 45pm line cuts through the grading curve at a point
below 60% the material is outside this limit. Similarly, the Category S material
limited to 12% should not see the 45 pm line cut below 88%.
Figure 4.16 shows that both the classified and processed materials can be
considered as category S as there is less than 12% of the material above 45 pm. The
raw material is border line category N however as the curve is not smooth the “benefit
of the doubt” will be given and the category N applied. The waste material is outside
the grading limits of the standard.
Particle shape:
Figures 4.17 and 4.18, present images of the materials produced by scanning
electron microscopy (SEM). The scale line on each of the images is 10pm and an
attempt has been made to capture a representative image of how the material is made
up. It can be seen in Figure 4.17 that both the OPCRM (a) and GGBS (b) are non-
spherical materials being made entirely with angular shaped particles. The majority of
the particles are smaller than 10pm in both materials with only a few individual
particles larger than 20pm. The GGBS is estimated to be slightly coarser agreeing
with the Mastersizer data presented in Figure 4.16. (Note that the Mastersizer data
percentages are on a mass or volume basis whilst the SEM observation is based on
number)
(a) (b)Figure 4.17 SEM images of the control materials a) OPCRM, b) GGBS
4-31
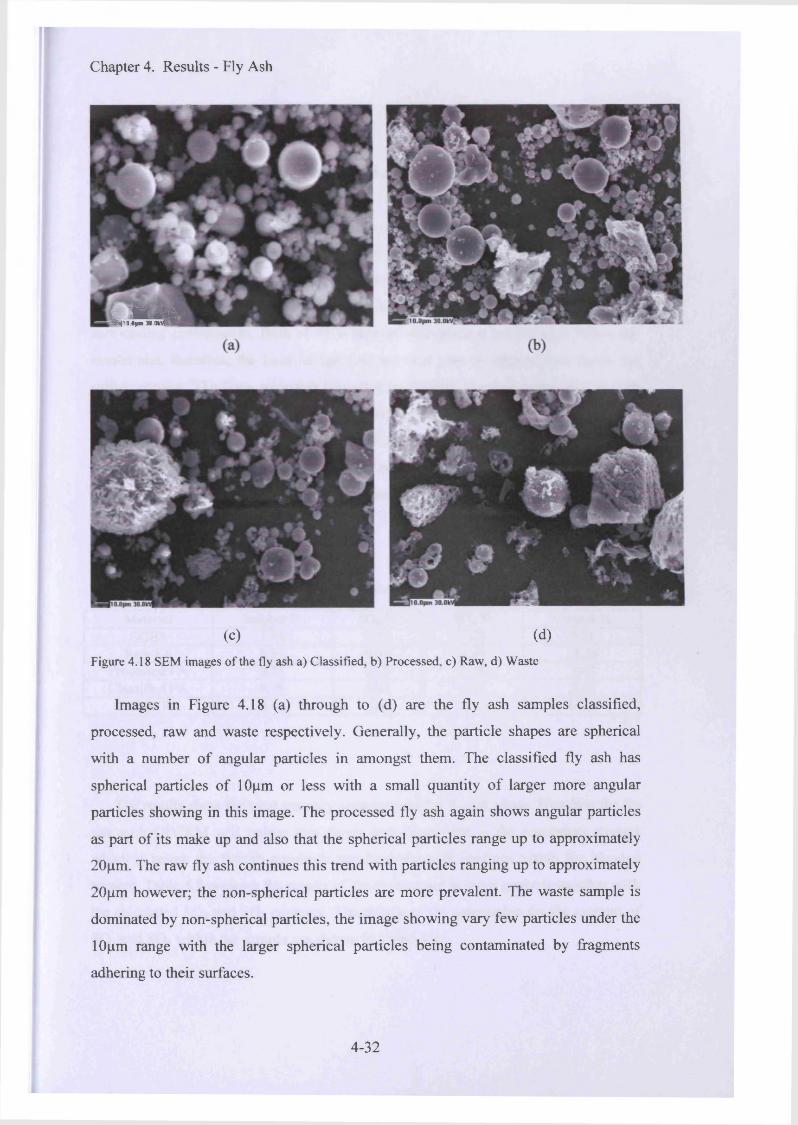
Chapter 4. Results - Fly Ash
[JHHSioj|»3a.«rta
(c) (d)Figure 4.18 SEM images of the fly ash a) Classified, b) Processed, c) Raw, d) Waste
Images in Figure 4.18 (a) through to (d) are the fly ash samples classified,
processed, raw and waste respectively. Generally, the particle shapes are spherical
with a number of angular particles in amongst them. The classified fly ash has
spherical particles of 10pm or less with a small quantity of larger more angular
particles showing in this image. The processed fly ash again shows angular particles
as part of its make up and also that the spherical particles range up to approximately
20pm. The raw fly ash continues this trend with particles ranging up to approximately
20pm however; the non-spherical particles are more prevalent. The waste sample is
dominated by non-spherical particles, the image showing vary few particles under the
10pm range with the larger spherical particles being contaminated by fragments
adhering to their surfaces.
4-32
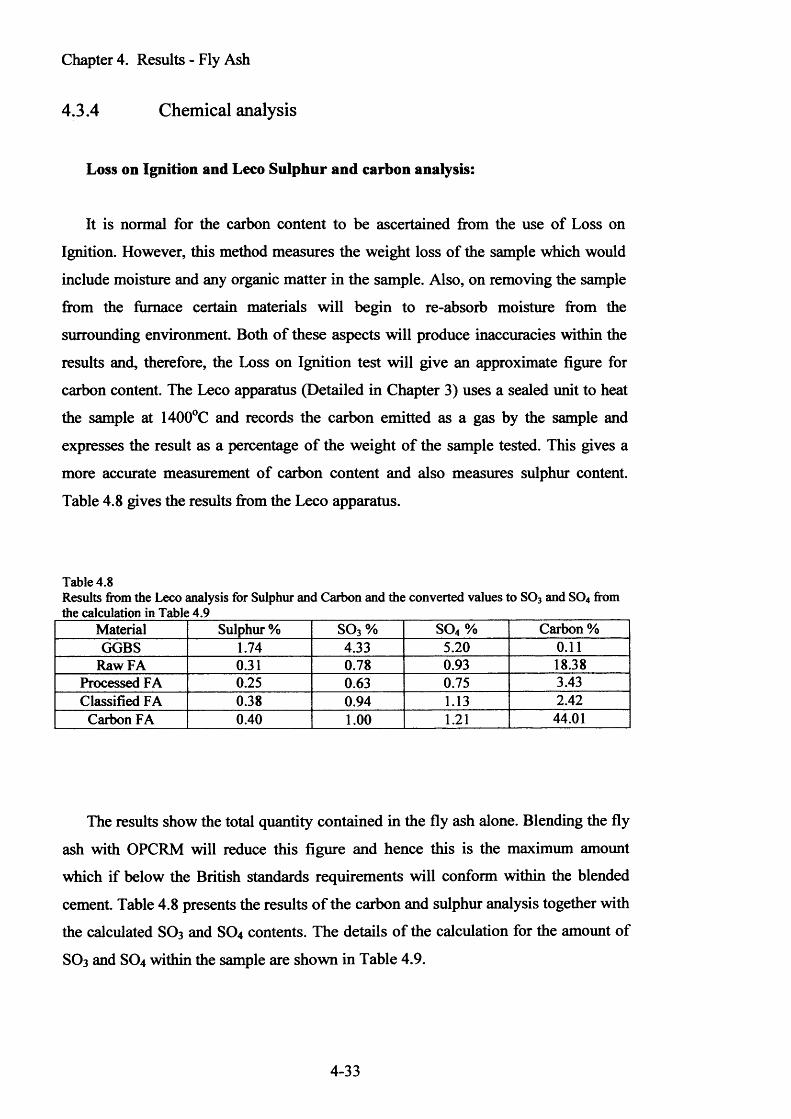
Chapter 4. Results - Fly Ash
4.3.4 Chemical analysis
Loss on Ignition and Leco Sulphur and carbon analysis:
It is normal for the carbon content to be ascertained from the use of Loss on
Ignition. However, this method measures the weight loss of the sample which would
include moisture and any organic matter in the sample. Also, on removing the sample
from the furnace certain materials will begin to re-absorb moisture from the
surrounding environment. Both o f these aspects will produce inaccuracies within the
results and, therefore, the Loss on Ignition test will give an approximate figure for
carbon content. The Leco apparatus (Detailed in Chapter 3) uses a sealed unit to heat
the sample at 1400°C and records the carbon emitted as a gas by the sample and
expresses the result as a percentage o f the weight o f the sample tested. This gives a
more accurate measurement of carbon content and also measures sulphur content.
Table 4.8 gives the results from the Leco apparatus.
Table 4.8Results from the Leco analysis for Sulphur and Carbon and the converted values to S03 and S04 from the calculation in Table 4.9 ___________
Material Sulphur % S 0 3 % SO4 % Carbon %GGBS 1.74 4.33 5.20 0 .1 1
Raw FA 0.31 0.78 0.93 18.38Processed FA 0.25 0.63 0.75 3.43Classified FA 0.38 0.94 1.13 2.42
Carbon FA 0.40 1 .0 0 1.21 44.01
The results show the total quantity contained in the fly ash alone. Blending the fly
ash with OPCRM will reduce this figure and hence this is the maximum amount
which if below the British standards requirements will conform within the blended
cement. Table 4.8 presents the results o f the carbon and sulphur analysis together with
the calculated SO3 and SO4 contents. The details of the calculation for the amount of
SO3 and SO4 within the sample are shown in Table 4.9.
4-33
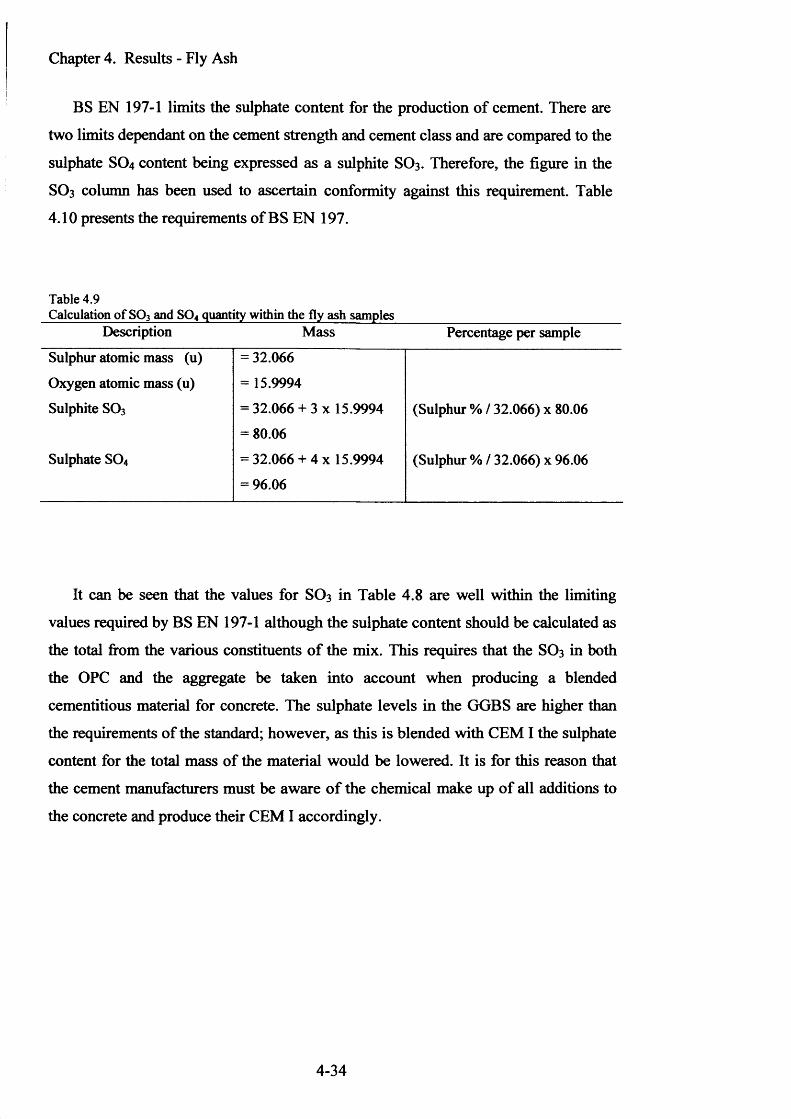
Chapter 4. Results - Fly Ash
BS EN 197-1 limits the sulphate content for the production of cement. There are
two limits dependant on the cement strength and cement class and are compared to the
sulphate SO4 content being expressed as a sulphite SO3 . Therefore, the figure in the
SO3 column has been used to ascertain conformity against this requirement. Table
4.10 presents the requirements of BS EN 197.
Table 4.9Calculation of SP3 and SQ4 quantity within the fly ash samples
Description Mass Percentage per sample
Sulphur atomic mass (u) = 32.066
Oxygen atomic mass (u) = 15.9994
Sulphite SO3 = 32.066 + 3 x 15.9994 (Sulphur % / 32.066) x 80.06
= 80.06
Sulphate SO4 = 32.066 + 4 x 15.9994 (Sulphur % / 32.066) x 96.06
= 96.06
It can be seen that the values for SO3 in Table 4.8 are well within the limiting
values required by BS EN 197-1 although the sulphate content should be calculated as
the total from the various constituents o f the mix. This requires that the SO3 in both
the OPC and the aggregate be taken into account when producing a blended
cementitious material for concrete. The sulphate levels in the GGBS are higher than
the requirements of the standard; however, as this is blended with CEM I the sulphate
content for the total mass of the material would be lowered. It is for this reason that
the cement manufacturers must be aware o f the chemical make up o f all additions to
the concrete and produce their CEM I accordingly.
4-34
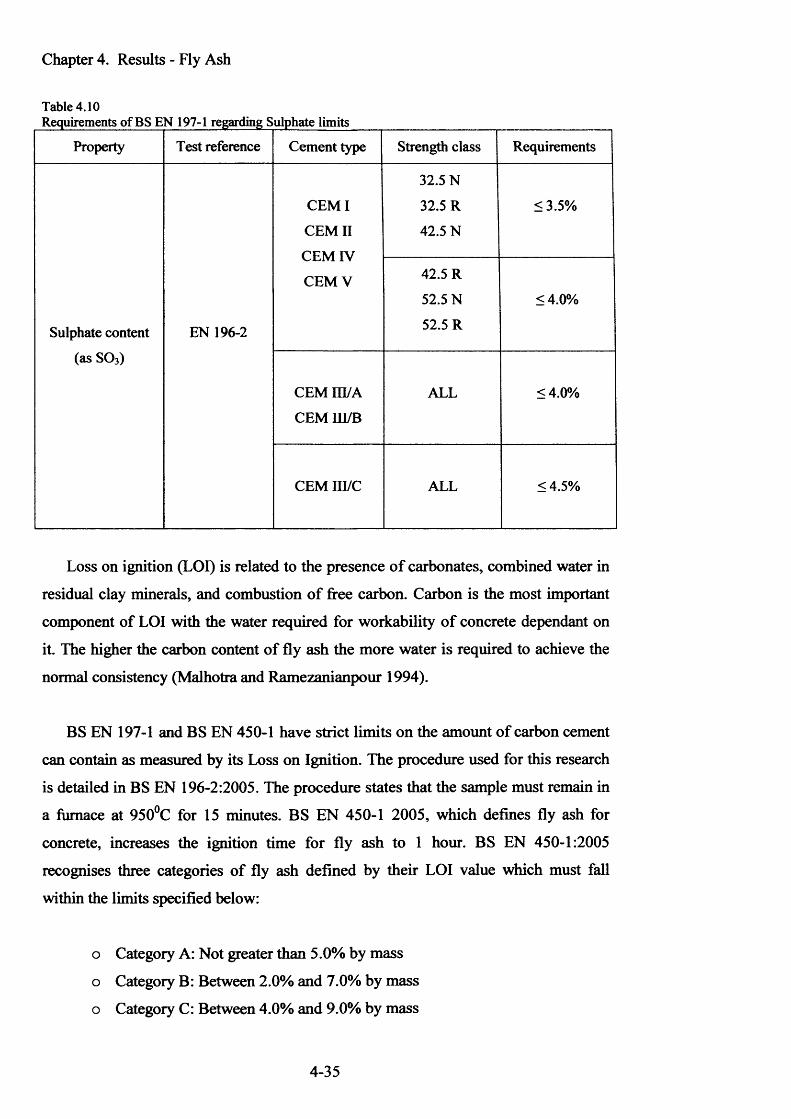
Chapter 4. Results - Fly Ash
Table 4.10Requirements of BS EN 197-1 regarding Sulphate limits
Property Test reference Cement type Strength class Requirements
32.5 N
CEM I 32.5 R <3.5%
CEM II 42.5 N
CEM IV
CEM V 42.5 R
52.5 N <4.0%
Sulphate content EN 196-2 52.5 R
(as S03)
CEMID/A ALL <4.0%
CEMIH/B
CEM m/c ALL <4.5%
Loss on ignition (LOI) is related to the presence o f carbonates, combined water in
residual clay minerals, and combustion o f free carbon. Carbon is the most important
component of LOI with the water required for workability o f concrete dependant on
it. The higher the carbon content of fly ash the more water is required to achieve the
normal consistency (Malhotra and Ramezanianpour 1994).
BS EN 197-1 and BS EN 450-1 have strict limits on the amount of carbon cement
can contain as measured by its Loss on Ignition. The procedure used for this research
is detailed in BS EN 196-2:2005. The procedure states that the sample must remain in
a furnace at 950°C for 15 minutes. BS EN 450-1 2005, which defines fly ash for
concrete, increases the ignition time for fly ash to 1 hour. BS EN 450-1:2005
recognises three categories of fly ash defined by their LOI value which must fall
within the limits specified below:
o Category A: Not greater than 5.0% by mass
o Category B: Between 2.0% and 7.0% by mass
o Category C: Between 4.0% and 9.0% by mass
4-35
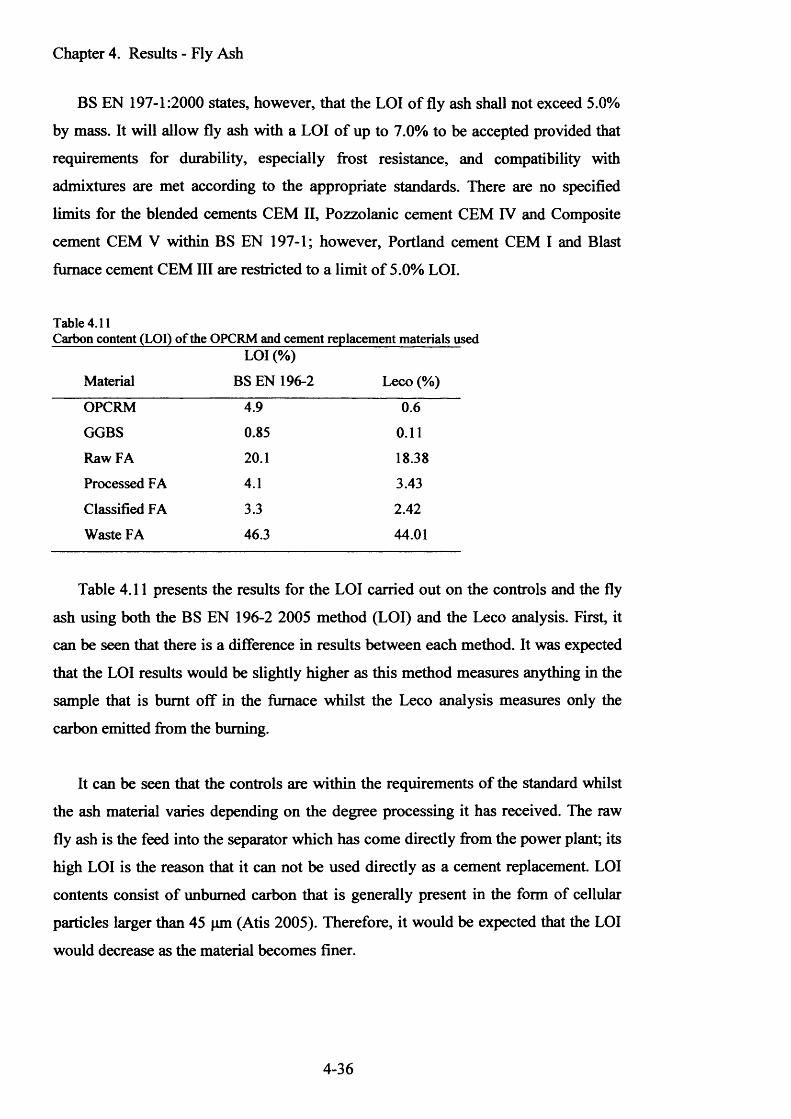
Chapter 4. Results - Fly Ash
BS EN 197-1:2000 states, however, that the LOI o f fly ash shall not exceed 5.0%
by mass. It will allow fly ash with a LOI o f up to 7.0% to be accepted provided that
requirements for durability, especially frost resistance, and compatibility with
admixtures are met according to the appropriate standards. There are no specified
limits for the blended cements CEM II, Pozzolanic cement CEM IV and Composite
cement CEM V within BS EN 197-1; however, Portland cement CEM I and Blast
furnace cement CEM III are restricted to a limit o f 5.0% LOI.
Table 4.11Carbon content (LOI) of the OPCRM and cement replacement materials used
Material
LOI (%)
BS EN 196-2 Leco (%)
OPCRM 4.9 0.6
GGBS 0.85 0.11
Raw FA 20.1 18.38
Processed FA 4.1 3.43
Classified FA 3.3 2.42
Waste FA 46.3 44.01
Table 4.11 presents the results for the LOI carried out on the controls and the fly
ash using both the BS EN 196-2 2005 method (LOI) and the Leco analysis. First, it
can be seen that there is a difference in results between each method. It was expected
that the LOI results would be slightly higher as this method measures anything in the
sample that is burnt off in the furnace whilst the Leco analysis measures only the
carbon emitted from the burning.
It can be seen that the controls are within the requirements of the standard whilst
the ash material varies depending on the degree processing it has received. The raw
fly ash is the feed into the separator which has come directly from the power plant; its
high LOI is the reason that it can not be used directly as a cement replacement. LOI
contents consist of unbumed carbon that is generally present in the form of cellular
particles larger than 45 pm (Atis 2005). Therefore, it would be expected that the LOI
would decrease as the material becomes finer.
4-36
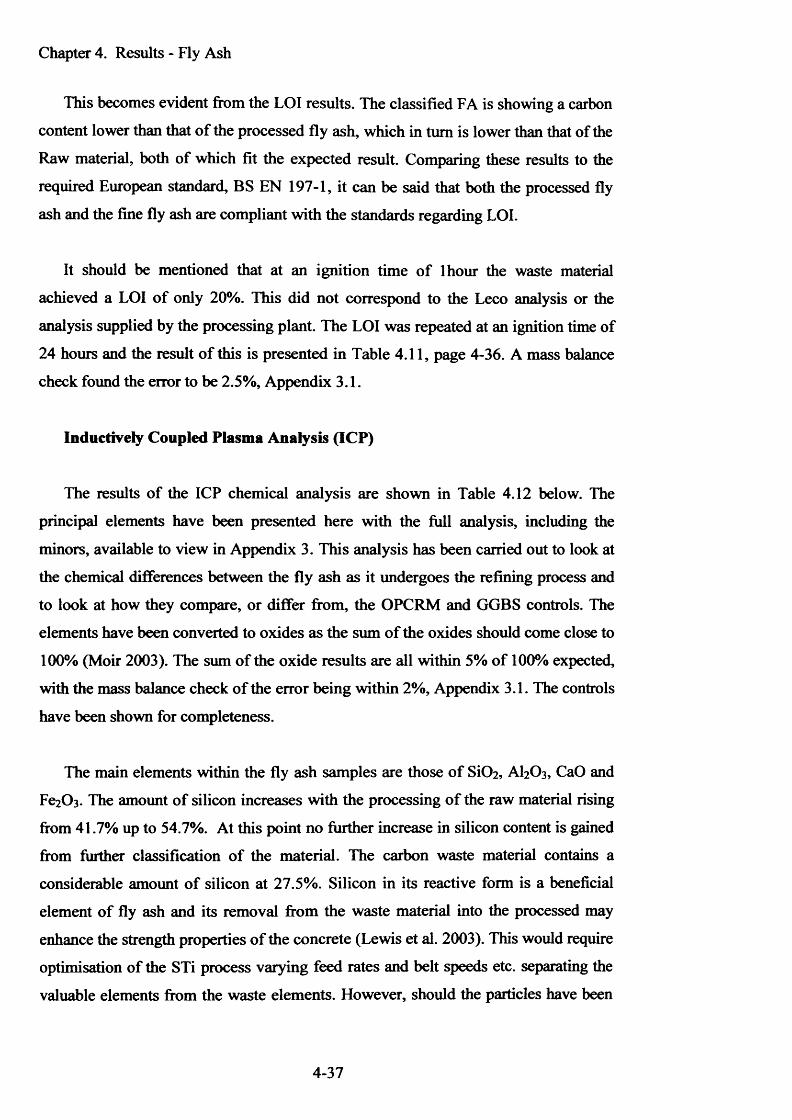
Chapter 4. Results - Fly Ash
This becomes evident from the LOI results. The classified FA is showing a carbon
content lower than that o f the processed fly ash, which in turn is lower than that of the
Raw material, both of which fit the expected result. Comparing these results to the
required European standard, BS EN 197-1, it can be said that both the processed fly
ash and the fine fly ash are compliant with the standards regarding LOI.
It should be mentioned that at an ignition time o f lhour the waste material
achieved a LOI o f only 20%. This did not correspond to the Leco analysis or the
analysis supplied by the processing plant. The LOI was repeated at an ignition time of
24 hours and the result o f this is presented in Table 4.11, page 4-36. A mass balance
check found the error to be 2.5%, Appendix 3.1.
Inductively Coupled Plasma Analysis (ICP)
The results o f the ICP chemical analysis are shown in Table 4.12 below. The
principal elements have been presented here with the full analysis, including the
minors, available to view in Appendix 3. This analysis has been carried out to look at
the chemical differences between the fly ash as it undergoes the refining process and
to look at how they compare, or differ from, the OPCRM and GGBS controls. The
elements have been converted to oxides as the sum o f the oxides should come close to
100% (Moir 2003). The sum o f the oxide results are all within 5% o f 100% expected,
with the mass balance check o f the error being within 2%, Appendix 3.1. The controls
have been shown for completeness.
The main elements within the fly ash samples are those o f SiC>2 , AI2O3, CaO and
Fe2C>3 . The amount o f silicon increases with the processing o f the raw material rising
from 41.7% up to 54.7%. At this point no further increase in silicon content is gained
from further classification o f the material. The carbon waste material contains a
considerable amount o f silicon at 27.5%. Silicon in its reactive form is a beneficial
element o f fly ash and its removal from the waste material into the processed may
enhance the strength properties o f the concrete (Lewis et al. 2003). This would require
optimisation of the STi process varying feed rates and belt speeds etc. separating the
valuable elements from the waste elements. However, should the particles have been
4-37
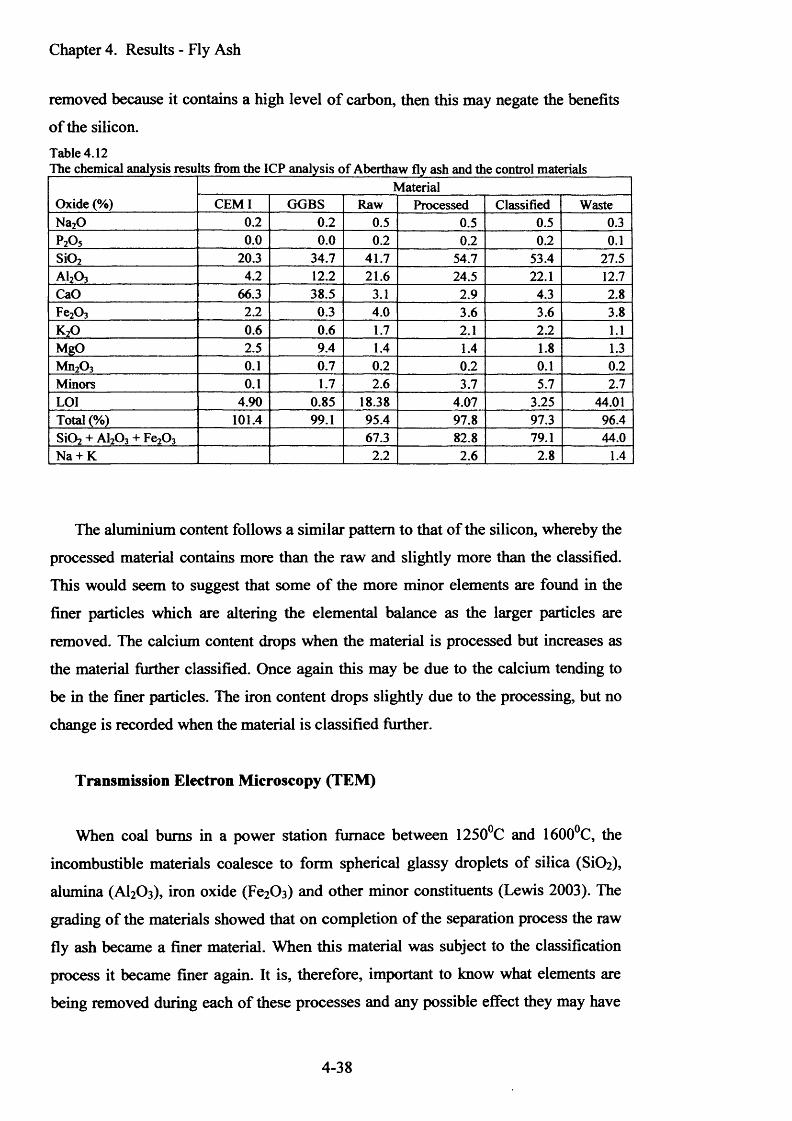
Chapter 4. Results - Fly Ash
removed because it contains a high level o f carbon, then this may negate the benefits
o f the silicon.
Table 4.12
Oxide (%)Material
CEMI GGBS Raw Processed Classified WasteNa20 0.2 0.2 0.5 0.5 0.5 0.3P2O5 0.0 0.0 0.2 0.2 0.2 0.1Si02 20.3 34.7 41.7 54.7 53.4 27.5ai2o 3 4.2 12.2 21.6 24.5 22.1 12.7CaO 66.3 38.5 3.1 2.9 4.3 2.8Fe20 3 2.2 0.3 4.0 3.6 3.6 3.8k 2o 0.6 0.6 1.7 2.1 2.2 1.1MgO 2.5 9.4 1.4 1.4 1.8 1.3Mn20 3 0.1 0.7 0.2 0.2 0.1 0.2Minors 0.1 1.7 2.6 3.7 5.7 2.7LOI 4.90 0.85 18.38 4.07 3.25 44.01Total (%) 101.4 99.1 95.4 97.8 97.3 96.4Si02 + A120 3 + Fe20 3 67.3 82.8 79.1 44.0Na + K 2.2 2.6 2.8 1.4
The aluminium content follows a similar pattern to that o f the silicon, whereby the
processed material contains more than the raw and slightly more than the classified.
This would seem to suggest that some o f the more minor elements are found in the
finer particles which are altering the elemental balance as the larger particles are
removed. The calcium content drops when the material is processed but increases as
the material further classified. Once again this may be due to the calcium tending to
be in the finer particles. The iron content drops slightly due to the processing, but no
change is recorded when the material is classified further.
Transmission Electron Microscopy (TEM)
When coal bums in a power station furnace between 1250°C and 1600°C, the
incombustible materials coalesce to form spherical glassy droplets of silica (SiCh),
alumina (AI2O3), iron oxide (Fe2 0 3 ) and other minor constituents (Lewis 2003). The
grading o f the materials showed that on completion of the separation process the raw
fly ash became a finer material. When this material was subject to the classification
process it became finer again. It is, therefore, important to know what elements are
being removed during each o f these processes and any possible effect they may have
4-38
Chapter 4. Results - Fly Ash
on the concrete mix. Through transmission electron microscopy (TEM) it is possible
to magnify the various sized particles within each material and carry out an elemental
analysis using an Energy Dispersive Analysis of X-rays (E.D.A.X) technique, details
in Chapter 3.
Small
L a rg e
Medium
Figure 4.19 Image showing the various size groups used in the elemental analysis
The viewing area of the microscope shows two concentric circles which, at a
magnification of 23,000 times, sizes them at 0.25pm and 2.0pm. The particle sizes
were judged on where they fell in relation to these circles therefore:
o Small particles <0.25pm
o Medium particles <2.0pm and >0.25 pm
o Large particles >2.0pm
An image showing the various sizes of fly ash analysed can be seen in Figure 4.19
above.
A range of analyses were carried out on the raw fly ash at each size and the
elemental results compared. Only the raw material was analysed, as it is this same
material which produces the processed and the classified with the larger element
removed. In general, the spectra were very similar for the particles in a given size
range and typical spectra are presented as Figures 4.20 (a) and (b) and Figure 4.21(a)
for the raw fly ash as large, medium and small particles.
4-39

Chapter 4. Results - Fly Ash
llli
Si
A! |
0
ft
1r 1
Ul I I I f IN i» i l l H I N 3JI < ■ i l l i J I 'M I N W
(a) (b)Figure 4.20 TEM analyses of the (a) large particles and (b) medium particles within the raw fly ash
It can be seen that the analysis of the large particle identifies the main elements of
silicon, calcium, aluminium and iron with some other minor elements as oxygen,
potassium and magnesium. The medium spherical particles, Figure 4.20b, again show
that the main elements silicon, calcium and aluminium being similar to the large
particles with iron giving a higher reading. The spectra for the minor elements are
similar to that of the large particle the change in the element labelling being due to the
software. Spectra of the small spherical particles, Figure 4.21a, show a similar pattern
to that of the medium particle with peaks for all the main elements. The analysis
shows an increase in the calcium peak and the addition of phosphorous to the spectra
of the waste particle.
It has been shown from the Loss on Ignition and the Leco analysis that there is
carbon present in the raw material, yet none has appeared on any particle analysis.
The analysis was carried out on the waste material and the resulting spectra can be
seen in Figure 4.21b. This analysis produced consistent results showing high carbon,
some phosphorous and very little of the other elements. However, the fly ash analysis
had concentrated the analysis on the spherical particles, as this is a main characteristic
4-40
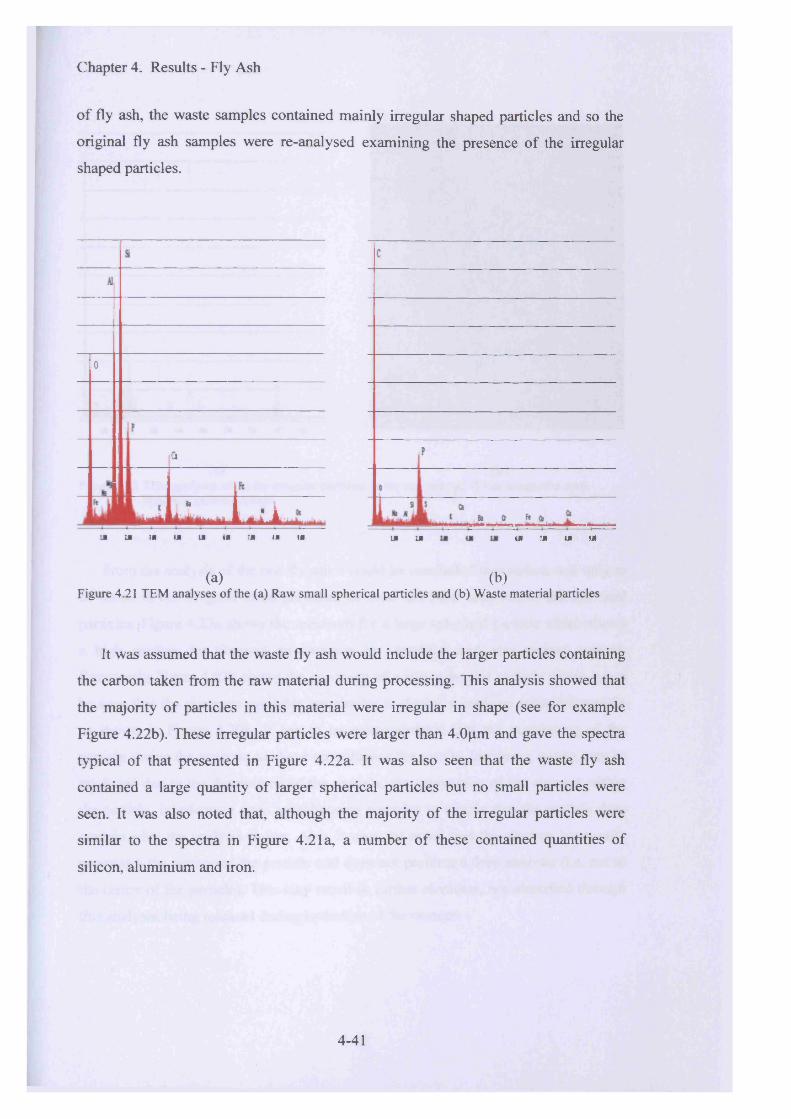
Chapter 4. Results - Fly Ash
of fly ash, the waste samples contained mainly irregular shaped particles and so the
original fly ash samples were re-analysed examining the presence of the irregular
shaped particles.
o
Hjk
. L I.; iIN IM I* IN iN IN TN IN IN I N IN I N IM IN IN
(a) (b)Figure 4.21 TEM analyses of the (a) Raw small spherical particles and (b) Waste material particles
It was assumed that the waste fly ash would include the larger particles containing
the carbon taken from the raw material during processing. This analysis showed that
the majority of particles in this material were irregular in shape (see for example
Figure 4.22b). These irregular particles were larger than 4.0pm and gave the spectra
typical of that presented in Figure 4.22a. It was also seen that the waste fly ash
contained a large quantity of larger spherical particles but no small particles were
seen. It was also noted that, although the majority of the irregular particles were
similar to the spectra in Figure 4.21a, a number of these contained quantities of
silicon, aluminium and iron.
4-41
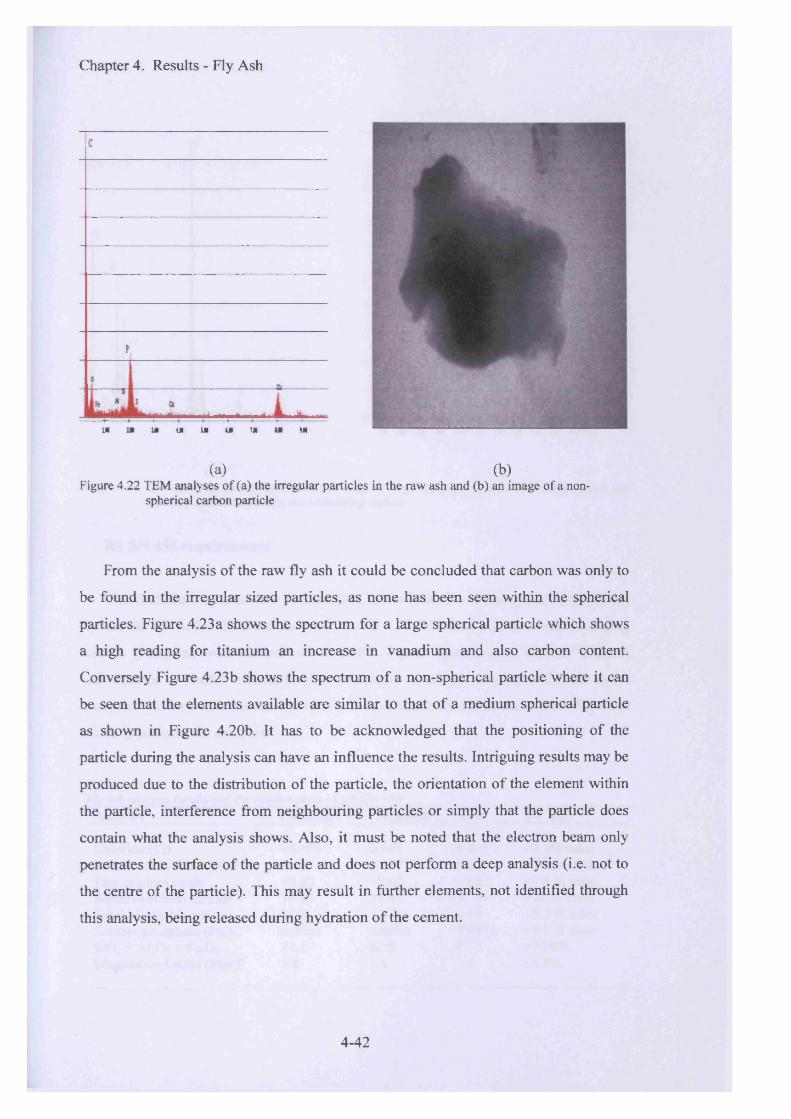
Chapter 4. Results - Fly Ash
ui ut Ul 1* Ul TJI Ml
(a) (b)Figure 4.22 TEM analyses of (a) the irregular particles in the raw ash and (b) an image of a non-
spherical carbon particle
From the analysis of the raw fly ash it could be concluded that carbon was only to
be found in the irregular sized particles, as none has been seen within the spherical
particles. Figure 4.23a shows the spectrum for a large spherical particle which shows
a high reading for titanium an increase in vanadium and also carbon content.
Conversely Figure 4.23b shows the spectrum of a non-spherical particle where it can
be seen that the elements available are similar to that of a medium spherical particle
as shown in Figure 4.20b. It has to be acknowledged that the positioning of the
particle during the analysis can have an influence the results. Intriguing results may be
produced due to the distribution of the particle, the orientation of the element within
the particle, interference from neighbouring particles or simply that the particle does
contain what the analysis shows. Also, it must be noted that the electron beam only
penetrates the surface of the particle and does not perform a deep analysis (i.e. not to
the centre of the particle). This may result in further elements, not identified through
this analysis, being released during hydration of the cement.
4-42
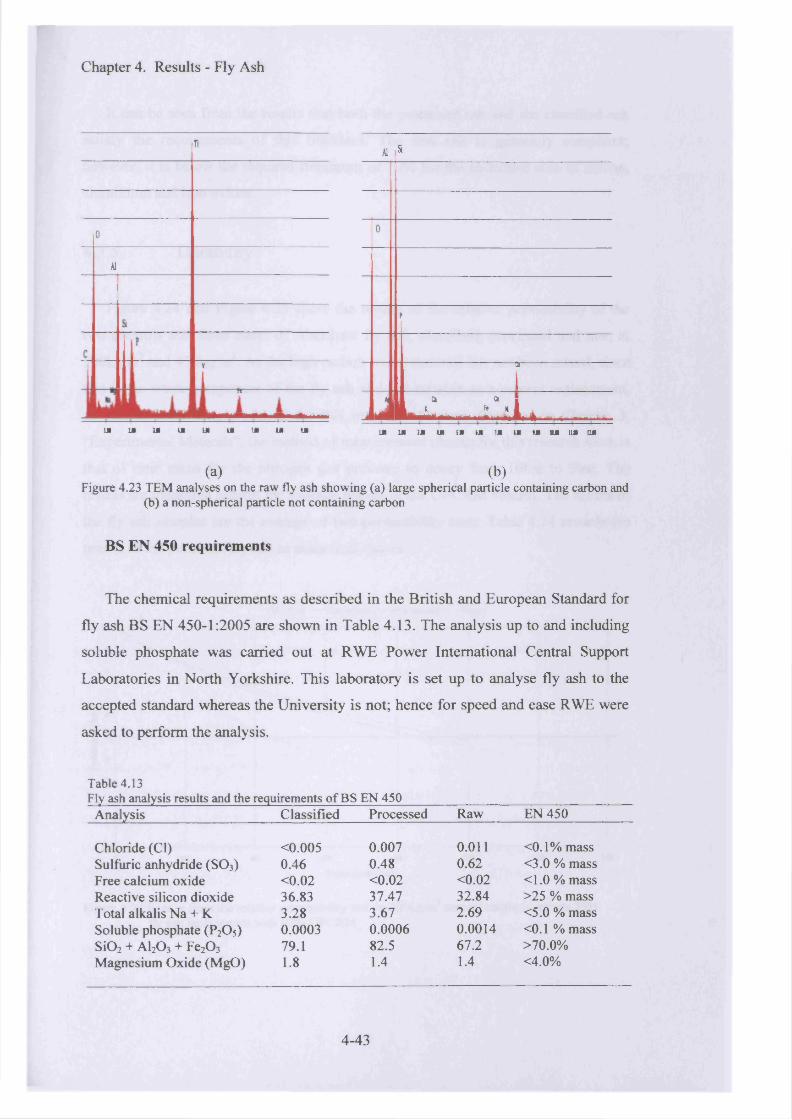
Chapter 4. Results - Fly Ash
isA1 Si
00
A1
\p
,V
1 _ ....................
--------------------------------------------- CD-----------------------------------
1
ja a
I L : . , , , ? " L , ...... ......................
U U i U i U I U I U I M U l M I f IK ]JI (J iil tH '1 II 111 HI 1LM HI
(a) (b)Figure 4.23 TEM analyses on the raw fly ash showing (a) large spherical particle containing carbon and
(b) a non-spherical particle not containing carbon
BS EN 450 requirements
The chemical requirements as described in the British and European Standard for
fly ash BS EN 450-1:2005 are shown in Table 4.13. The analysis up to and including
soluble phosphate was carried out at RWE Power International Central Support
Laboratories in North Yorkshire. This laboratory is set up to analyse fly ash to the
accepted standard whereas the University is not; hence for speed and ease RWE were
asked to perform the analysis.
Table 4.13Fly ash analysis results and the requirements of BS EN 450Analysis Classified Processed Raw EN 450
Chloride (Cl) <0.005 0.007 0 . 0 1 1 <0 .1 % massSulfuric anhydride (SO3 ) 0.46 0.48 0.62 <3.0 % massFree calcium oxide <0 . 0 2 <0 . 0 2 <0 . 0 2 <1 . 0 % massReactive silicon dioxide 36.83 37.47 32.84 >25 % massTotal alkalis Na + K 3.28 3.67 2.69 <5.0 % massSoluble phosphate (P2O5) 0.0003 0.0006 0.0014 <0 . 1 % massSiCb + AI2O3 + Fe2C>3 79.1 82.5 67.2 >70.0%Magnesium Oxide (MgO) 1 . 8 1.4 1.4 <4.0%
4-43
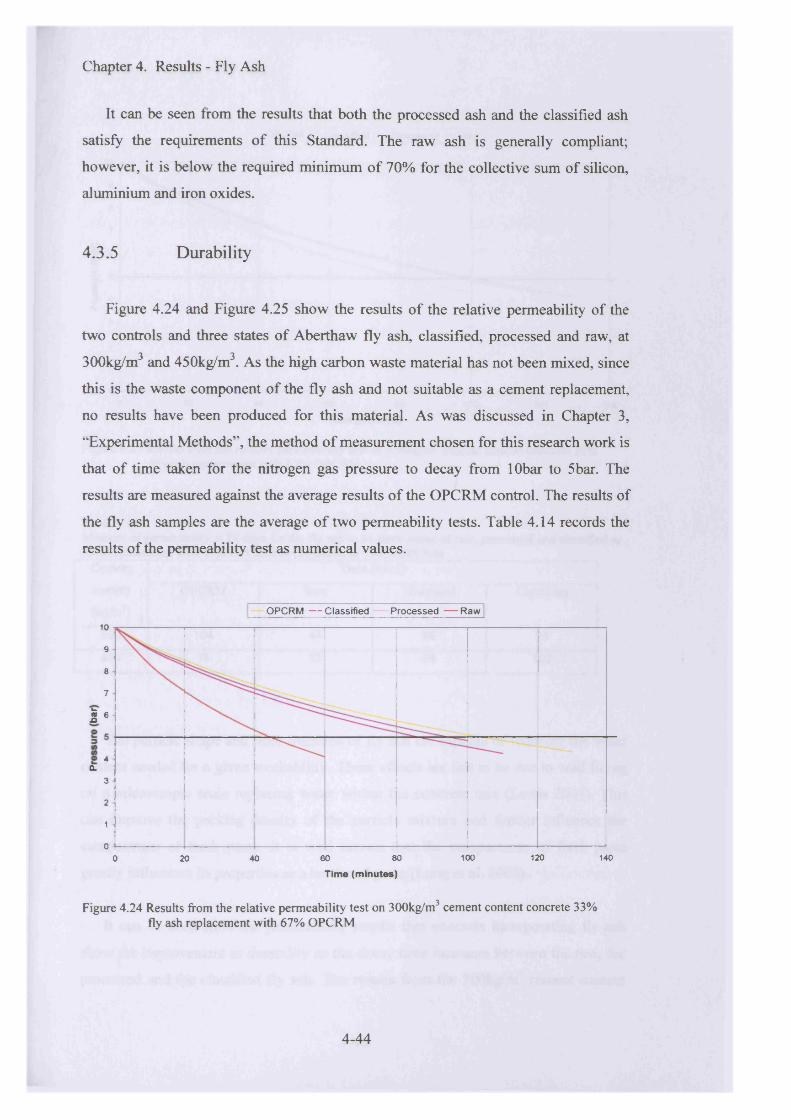
Chapter 4. Results - Fly Ash
It can be seen from the results that both the processed ash and the classified ash
satisfy the requirements of this Standard. The raw ash is generally compliant;
however, it is below the required minimum of 70% for the collective sum of silicon,
aluminium and iron oxides.
4.3.5 D urability
Figure 4.24 and Figure 4.25 show the results of the relative permeability of the
two controls and three states of Aberthaw fly ash, classified, processed and raw, at
300kg/m3 and 450kg/m3. As the high carbon waste material has not been mixed, since
this is the waste component of the fly ash and not suitable as a cement replacement,
no results have been produced for this material. As was discussed in Chapter 3,
“Experimental Methods”, the method of measurement chosen for this research work is
that of time taken for the nitrogen gas pressure to decay from lObar to 5bar. The
results are measured against the average results of the OPCRM control. The results of
the fly ash samples are the average of two permeability tests. Table 4.14 records the
results of the permeability test as numerical values.
OPCRM — Classified — Processed — Raw109
8
7
1 6
4CL
3
2
1
00 20 40 60 80 100 120 140
Time (minutes)
Figure 4.24 Results from the relative permeability test on 300kg/m3 cement content concrete 33% fly ash replacement with 67% OPCRM
4-44
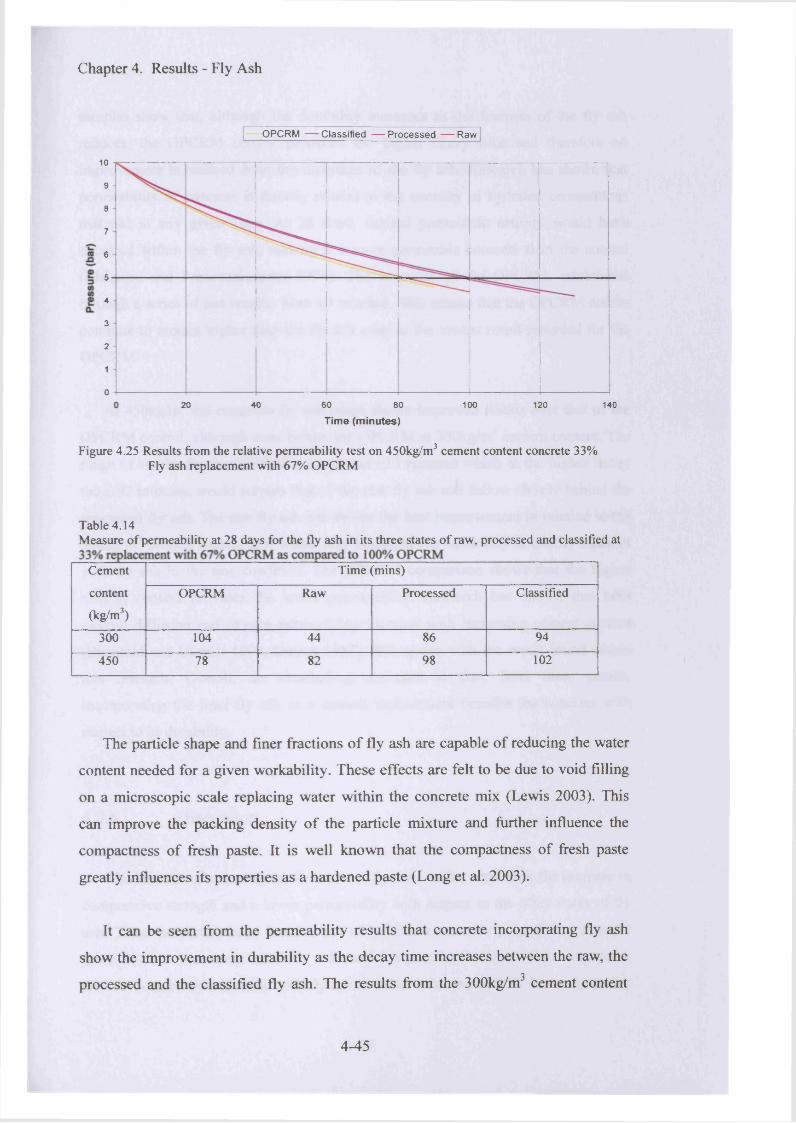
Chapter 4. Results - Fly Ash
OPCRM — Classified — Processed — Raw
10
9
8
7
6
5
4
3
2
1
020 40 60 80
Time (m inutes)100 120 140
Figure 4.25 Results from the relative permeability test on 450kg/m3 cement content concrete 33% Fly ash replacement with 67% OPCRM
Table 4.14Measure of permeability at 28 days for the fly ash in its three states of raw, processed and classified at
Cement
content
(kg/m3)
Time (mins)
OPCRM Raw Processed Classified
300 104 44 86 94
450 78 82 98 102
The particle shape and finer fractions of fly ash are capable of reducing the water
content needed for a given workability. These effects are felt to be due to void filling
on a microscopic scale replacing water within the concrete mix (Lewis 2003). This
can improve the packing density of the particle mixture and further influence the
compactness of fresh paste. It is well known that the compactness of fresh paste
greatly influences its properties as a hardened paste (Long et al. 2003).
It can be seen from the permeability results that concrete incorporating fly ash
show the improvement in durability as the decay time increases between the raw, the
processed and the classified fly ash. The results from the 300kg/m3 cement content
4-45
Chapter 4. Results - Fly Ash
samples show that, although the durability increases as the fineness o f the fly ash
reduces, the OPCRM control produces the higher decay time and therefore no
improvement is realised from the inclusion o f the fly ash. Research has shown that
permeability o f concrete is directly related to the quantity of hydrated cementitious
material at any given time. At 28 days, limited pozzolanic activity would have
occurred within the fly ash, making it a more permeable concrete than the control
(Malhotra and Ramezanianpour 1994). The extremes o f the OPCRM, established
through a series o f test results, were ±9 minutes. This means that the OPCRM results
continue to remain higher than the fly ash even at the lowest result recorded for the
OPCRM.
At 450kg/m3 the complete fly ash range shows improved results over that of the
OPCRM control, although none betters the OPCRM at 300kg/m3 cement content. The
range of results for the OPCRM control was ±13 minutes which at the higher decay
time, 92 minutes, would surpass that o f the raw fly ash and follow closely behind the
processed fly ash. The raw fly ash has shown the best improvement in relation to the
300kg/m3 cement content mix which may highlight the variability in quality inherent
with fly ash in the raw condition. The OPCRM comparison shows that the higher
cement content provides the lower permeability. Research has shown that both
oxygen diffusion and oxygen permeability increase with increasing cement content
(Buenfeld and Okundi 1998. Dutron 1987); this agrees with the result found within
this research. Overall, the concluding comment is that, from these results,
incorporating the finer fly ash as a cement replacement benefits the concrete with
respect to its durability.
4.3.6 Discussion
The benefits of reducing the fineness o f fly ash can be seen from the increase in
compressive strength and a lower permeability with respect to the other states of fly
ash. These properties have benefits not only from a concrete point (i.e. a stronger
more durable concrete), but from a financial aspect in that less of the expensive
OPCRM can be used blended with fly ash to achieve the required 28 day compressive
4-46
Chapter 4. Results - Fly Ash
strength. However, a balance has to be achieved between performance of the material
and the amount of usable fly ash which will be rejected as being too coarse for the
required material properties. For a general use concrete, the processed fly ash state
produces an enhanced concrete, in comparison to the GGBS concrete, at replacement
percentages o f up to 33%. The strength and permeability are both improved, which
leaves a margin for either the reduction in cement content within the mix or fine-
tuning the STI electrostatic precipitator to increase the yield reducing the quality
slightly but reducing wastage. The former o f these requires care as certain concretes,
Designated and Designed concrete, have a minimum cement or combination content
which must conform to BS EN 8500-2:2002.
The ICP analysis has shown that there is very little difference between the
chemical analyses o f the processed ash and the classified ash. There is, however, a
marked difference with the compressive strengths between the two. Therefore, the
increased compressive strength must have some bearing on another aspect of the
material at this level of processing. The fine-tuning o f the STi process as mentioned
earlier could also be used in an attempt to remove more o f the silicon from the waste
carbon material. It has been shown that carbon is generally localised to one type of
particle and therefore could be separated from the silicon particles. This is an area that
requires an in-depth study of the STi process and its capabilities.
An attempt at listing the main attributes o f fly ash which may potentially enhance
its use as a cement replacement material will now be made. This information will then
be used to consider any future waste materials and assess the likelihood of their
suitability as a cement replacement material. The advantage o f this is that an initial
assessment may be completed within 24 hours prior to any mixing. From this initial
assessment a judgement can be made as to whether or not trials of the mortar and
concrete should proceed to establish the compressive strength, etc., from which initial
results take days rather than hours to achieve.
4-47
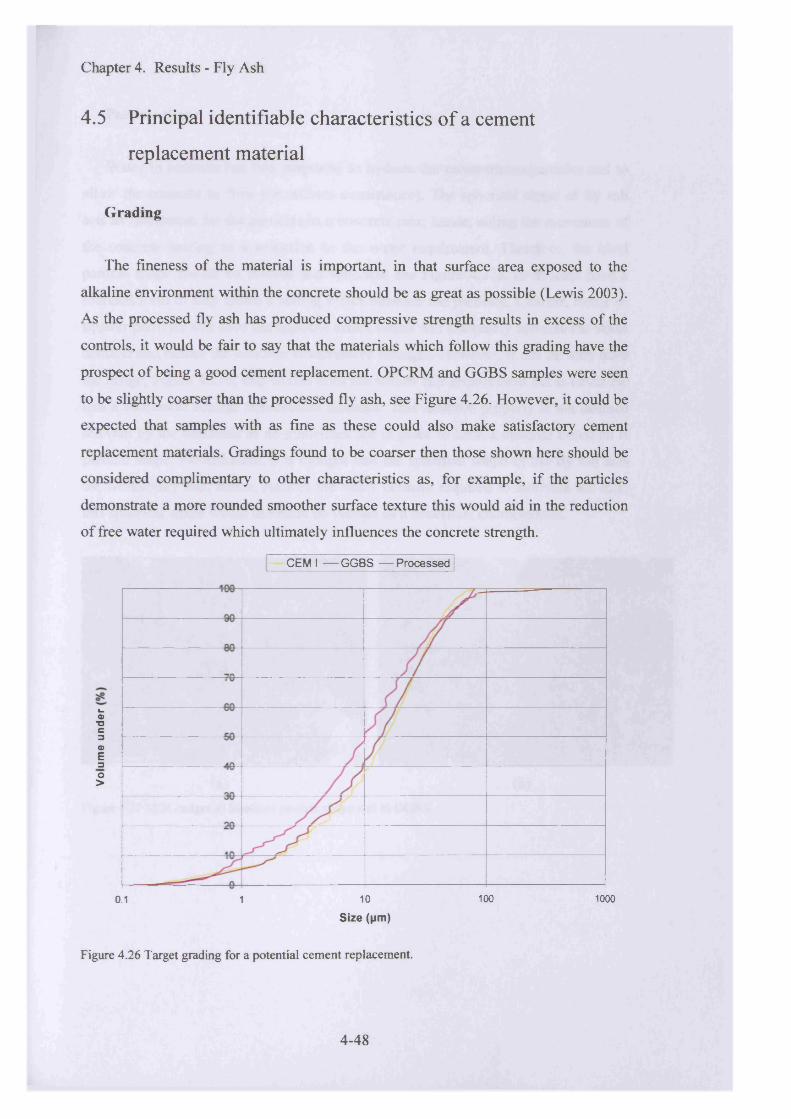
Chapter 4. Results - Fly Ash
4.5 Principal identifiable characteristics of a cement
replacement material
Grading
The fineness of the material is important, in that surface area exposed to the
alkaline environment within the concrete should be as great as possible (Lewis 2003).
As the processed fly ash has produced compressive strength results in excess of the
controls, it would be fair to say that the materials which follow this grading have the
prospect of being a good cement replacement. OPCRM and GGBS samples were seen
to be slightly coarser than the processed fly ash, see Figure 4.26. However, it could be
expected that samples with as fine as these could also make satisfactory cement
replacement materials. Gradings found to be coarser then those shown here should be
considered complimentary to other characteristics as, for example, if the particles
demonstrate a more rounded smoother surface texture this would aid in the reduction
of free water required which ultimately influences the concrete strength.
CEM I — GGBS — Processed
k_0)•ac30>E3O>
0.1 1 10 100 1000
Size (pm)
Figure 4.26 Target grading for a potential cement replacement.
4-48

Chapter 4. Results - Fly Ash
Particle shape
Water in concrete has two purposes, to hydrate the cementitious particles and to
allow the concrete to flow (i.e. affects consistence). The spherical shape of fly ash
acts as lubrication for the particles in a concrete mix; hence, aiding the movement of
the concrete leading to a reduction in the water requirement. Therefore, the ideal
particle shape should be smooth and spherical see Figure 4.27a, or at least have a
rounded form to help create a rolling effect between the particles. Coarser, flatter or
squarer particles will have the opposite effect which will ultimately increase the water
demand and reduce the concrete compressive strength. However, it can be seen from
the image, Figure 4.27b, that GGBS does not follow this requirement but is never the
less a successful cement replacement material. This material property is not deemed
relevant by the standards as no guidelines are in place to limit a material based on is
particle shape. Nevertheless, it is thought that the spherical shape of the fly ash aids
the workability and, hence, reduces the water demand required to motivate the mix;
this spherical shape would therefore be viewed as a beneficial characteristic.
(a) (b)Figure 4.27 SEM images a) Idealised particle shape and b) GGBS.
4-49
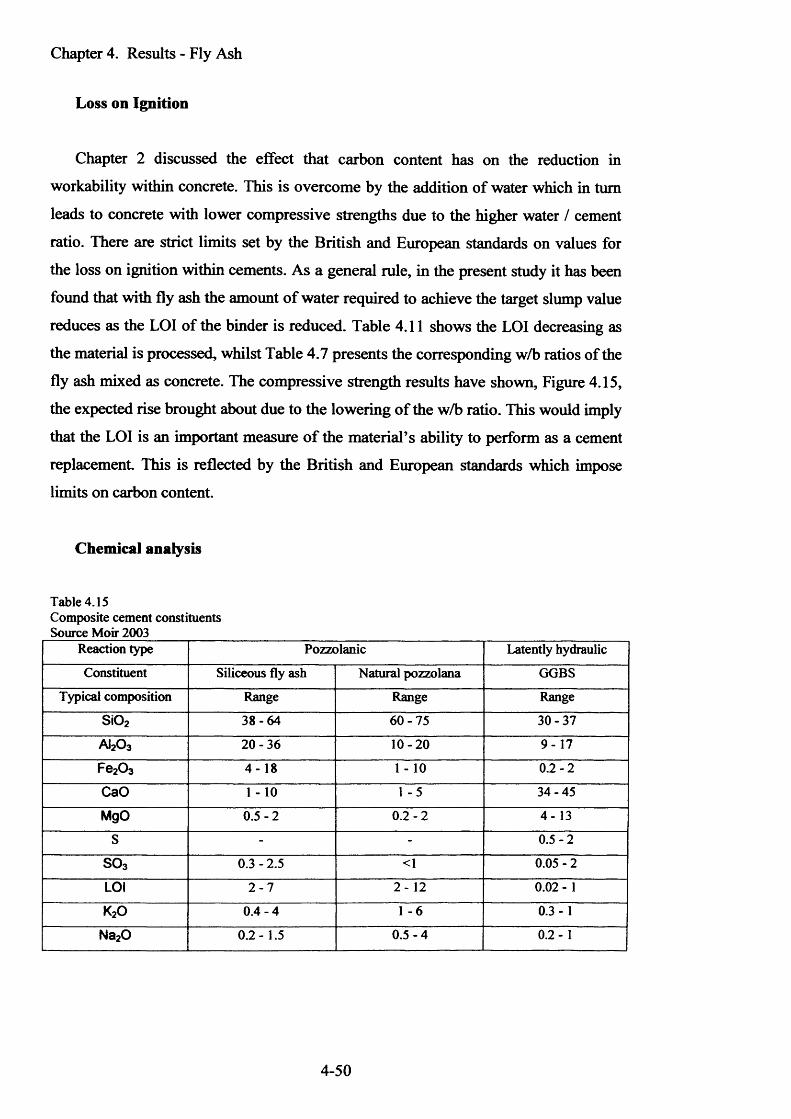
Chapter 4. Results - Fly Ash
Loss on Ignition
Chapter 2 discussed the effect that carbon content has on the reduction in
workability within concrete. This is overcome by the addition of water which in turn
leads to concrete with lower compressive strengths due to the higher water / cement
ratio. There are strict limits set by the British and European standards on values for
the loss on ignition within cements. As a general rule, in the present study it has been
found that with fly ash the amount of water required to achieve the target slump value
reduces as the LOI of the binder is reduced. Table 4.11 shows the LOI decreasing as
the material is processed, whilst Table 4.7 presents the corresponding w/b ratios of the
fly ash mixed as concrete. The compressive strength results have shown, Figure 4.15,
the expected rise brought about due to the lowering o f the w/b ratio. This would imply
that the LOI is an important measure o f the material’s ability to perform as a cement
replacement This is reflected by the British and European standards which impose
limits on carbon content.
Chemical analysis
Table 4.15Composite cement constituents Source Moir 2003
Reaction type Pozzolanic Latently hydraulic
Constituent Siliceous fly ash Natural pozzolana GGBS
Typical composition Range Range Range
Si02 38-64 60-75 30-37
AI2O3 20-36 1 0 -2 0 9-17
F62O3 4-18 1 - 10 0.2 - 2
CaO 1 - 10 1-5 34-45
MgO 0.5-2 0 .2 - 2 4-13
S - - 0.5-2
S 0 3 0.3 - 2.5 <1 0.05 - 2
LOI 2 -7 2 - 12 0.02 - 1
k2o 0.4-4 1 - 6 0.3-1
Na20 0.2- 1.5 0.5-4 0.2 - 1
4-50
Chapter 4. Results - Fly Ash
The chemical analysis carried out has produced results for the processed and fine
fly ash and the GGBS. It has been found that the processed and fine fly ash provides
comparable, if not better, results than that o f GGBS and that GGBS is an accepted
cement replacement widely used in industry today. There is, however, a vast
difference between the chemical analysis o f the fly ash and the GGBS.
The main differences are between the silicon oxide content and the calcium oxide
content. In the GGBS both silicon oxide and calcium oxide are 34% and 38%
respectively, while in the fly ash the silicon oxide content is 54% and the calcium
oxide 2.9%. Both o f these materials work, yet the chemical make up is different. This
means that waste materials looked at as part o f this research, or at some time in the
future, may not match the chemical make up o f the fly ash yet could prove to be
adequate cement replacement materials. Therefore, it is sensible to present an
acceptable range o f the cement constituents from which a judgement on the new
materials elemental analysis can be made. Table 4.15 presents ranges for both
pozzolanic and latently hydraulic materials as produced by Moir (2003) which the
Author views as an adequate aid in making an initial judgement on the suitability of a
new material as a partial cement replacement material.
Transmission Electron Microscopy (TEM)
This work has shown that individual particles vary with respect to their element
composition. Numerous analyses were undertaken on individual particles with the
establishment of an elemental composition being made on the basis of a specific
elemental pattern re-occurring on several occasions (further results from this analysis
can be viewed in Appendix 3). If a representative sample o f the material is ensured
and enough analyses are completed, then it would be expected that an accurate image
of the elemental make up can be established. Materials that show separation of
elements can be better manipulated to produce the required material, so a careful
study o f the particles at various sizes should be carried out. With respect to fly ash,
knowing which particles contain carbon will influence the method used to remove it.
4-51
Chapter 4. Results - Fly Ash
4.6 Conclusions
From the work carried out in this chapter the main conclusions are;
o Applying the STi process to the fly ash is a quick and easy method of
lowering the carbon content within the ash, producing a material which
satisfies both British and European standards.
o The compressive strength results o f the processed fly ash at 33%
replacement showed an improvement in strength over the blended GGBS.
Therefore, there remains scope for adjustment of the STi process to
increase the yield up from 62% which will provide an economic benefit
and a reduction in waste sent to landfill.
o No single property o f fly ash can readily predict its performance in the
concrete mix.
o Reducing the particle size o f the fly ash through classification provides
further benefits with regards to compressive strength of the concrete
containing the fly ash.
4-52

Chapter 5 - A study into possible cement replacement materials
5. Results - additional candidate cem ent replacem ent materials
5.1 Introduction
5.2 Compressive strength
5.3 Physical properties
5.4 Chemical analysis
5.5 Discussion
5.6 Conclusions
5.1 IntroductionChapter 4 established the main properties o f a processed fly ash that contribute to
its successful application as a cement replacement material. This chapter considers
other materials, available in a form which can successfully be added as a cement
replacement, to determine their effect on concrete strength when used as a cement
replacement material. Their physical and chemical properties will then be examined
and a comparison made to the findings in the previous chapter. The research studies
the performance o f materials’, chemical and physical characteristics and seeks to
identify the characteristics which either enhance the concrete or impair the concrete
from achieving its full potential. There are four materials being studied in this section,
their origins are described in Chapter 3, and are listed below:
o Sewage Sludge Ash (SS)
o Municipal Solid Waste Ash (MSW)
o Fly ash (FA2) supplied from Didcot A Power station
o A blended selection o f Industrial Materials (IM)
5-1

Chapter 5 - A study into possible cement replacement materials
The mix designs were produced and tested by the Author at the University using a
cement content of 270kg/m3. This amount was chosen as at that time this concrete
design was the highest selling concrete at Minimix Concrete LTD and any successful
material would be introduced into the company designs for economical benefit. The
range of cement replacement percentages used were 10%, 20%, 25%, 30% and 50%.
A target quantity of 100kg per mix was designed for, which gave more than enough
concrete for the samples required and sufficient to produce a consistent mix.
This section begins by looking at the compressive strengths of the materials and
how they compare to the control of a blended GGBS and OPCRM at similar
replacement levels to the research materials. Physical and chemical properties are then
examined and compared to the results in Chapter 4 and a discussion on the positive
and negative attributes of the materials, as compared to the Processed Fly Ash, will
then be presented. The mix procedure can be seen in Chapter 3.
5.2 Compressive strength
I GGBS B SS MSW ■ FA2 ■ IM
£ . 40 0
IaEoo
0.010% 20% 25% 30% 50%
■ GGBS 51.6 502 51.9 49.0 47.0
■ SS 41.0 35.2 38.6 31.3 19.0
MSW 32.3 26.1 23.8 23.3 16.6
■ FA2 47.7 45.9 40.7 40.3 28.3
- IM 43.6 31.2 30.4 27.7 20.0
Replacem ent (%)
Figure 5.1 Compressive strength comparisons at 28 days of the replacement materials blended with OPCRM at various percentages and a blended mix 50% GGBS 50% OPCRM
Three GGBS control mixes using identical designs were produced as a
comparison for the test samples with the average value for compressive strength used.
5-2
Chapter 5 - A study into possible cement replacement materials
The spread o f compressive strength results between each o f the repeat GGBS mixes
varied by less than lN/mm2. A single concrete mix has been produced using each
sample with the compressive strength being the average o f three cubes crushed from
this mix at 28 days. The complete set o f results can be seen in Appendix 3.
Figure 5.1 presents the results from the compressive strength tests taken at 28
days. Generally, it can be seen that, whereas the GGBS mix maintains a steady
compressive strength value over the complete range o f replacement percentages, the
other materials do not. At 10% replacement all the materials achieve their highest
compressive strength, which generally decreases as the replacement percentage
increases. The exception to this is the SS material which shows a slight improvement
in strength between the 20% and 25% replacement levels. At 10% replacement FA2 is
achieving good results which are maintained at 20% and continues to perform well up
to 30% where at only 8.7N/mm2 weaker than the GGBS is still a strong mix. At 50%
the compressive strength o f FA2 drops considerably; however, it does remain the best
o f the test samples having the highest compressive strengths at each replacement
percentage.
IM also performs well in comparison to the GGBS control mix at the 10%
replacement level. At 20% there is a rapid reduction in the compressive strength and
this material does not recover from this strength loss and proves to be a poor
comparison to GGBS at the higher replacement levels.
SS is only 10.6N/mm2 lower than the GGBS sample on compressive strength at
10% replacement and 6.7N/mm2 lower than the FA2 sample. A dip in the
compressive strength is seen at 20% replacement, but picks up slightly at 25% being
only 2.1N/mm2 lower than the FA2 material. At 30% and 50%, the reduction in
strength follows the same pattern as the FA2 material and does not compete with the
GGBS.
MSW provides the worst case at all replacement levels. The strengths achieved do
not compare favourably with the GGBS and are generally well below the other
materials being researched.
5-3
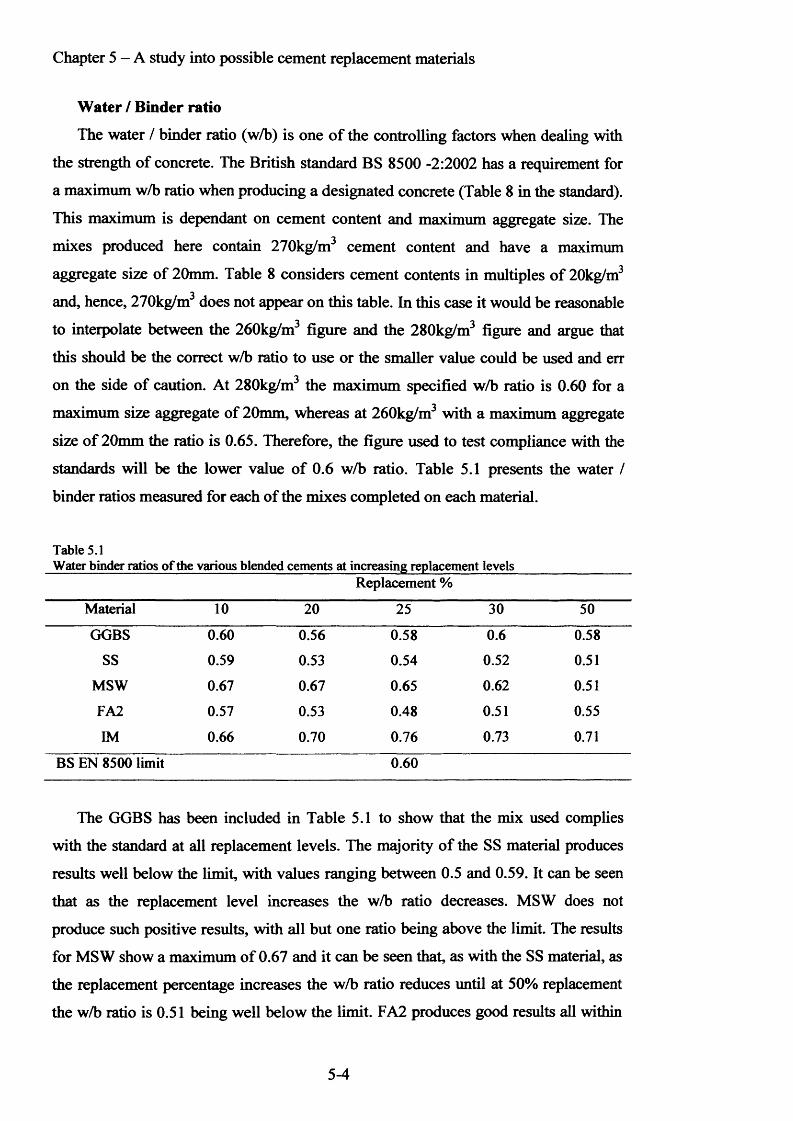
Chapter 5 — A study into possible cement replacement materials
Water / Binder ratio
The water / binder ratio (w/b) is one o f the controlling factors when dealing with
the strength of concrete. The British standard BS 8500 -2:2002 has a requirement for
a maximum w/b ratio when producing a designated concrete (Table 8 in the standard).
This maximum is dependant on cement content and m aximum aggregate size. The
mixes produced here contain 270kg/m3 cement content and have a maximum
aggregate size of 20mm. Table 8 considers cement contents in multiples o f 20kg/m3
and, hence, 270kg/m3 does not appear on this table. In this case it would be reasonable
to interpolate between the 260kg/m3 figure and the 280kg/m3 figure and argue that
this should be the correct w/b ratio to use or the smaller value could be used and err
on the side of caution. At 280kg/m3 the maximum specified w/b ratio is 0.60 for a
maximum size aggregate of 20mm, whereas at 260kg/m3 with a m axim um aggregate
size o f 20mm the ratio is 0.65. Therefore, the figure used to test compliance with the
standards will be the lower value o f 0.6 w/b ratio. Table 5.1 presents the water /
binder ratios measured for each of the mixes completed on each material.
Table 5.1Water binder ratios of the various blended cements at increasing replacement levels
Replacement %Material 10 20 25 30 50
GGBS 0.60 0.56 0.58 0.6 0.58
SS 0.59 0.53 0.54 0.52 0.51
MSW 0.67 0.67 0.65 0.62 0.51
FA2 0.57 0.53 0.48 0.51 0.55
IM 0.66 0.70 0.76 0.73 0.71
BS EN 8500 limit 0.60
The GGBS has been included in Table 5.1 to show that the mix used complies
with the standard at all replacement levels. The majority o f the SS material produces
results well below the limit, with values ranging between 0.5 and 0.59. It can be seen
that as the replacement level increases the w/b ratio decreases. MSW does not
produce such positive results, with all but one ratio being above the limit. The results
for MSW show a maximum o f 0.67 and it can be seen that, as with the SS material, as
the replacement percentage increases the w/b ratio reduces until at 50% replacement
the w/b ratio is 0.51 being well below the limit. FA2 produces good results all within
5-4

Chapter 5 — A study into possible cement replacement materials
the limit and achieving the lowest w/b ratio o f 0.48 at 25% replacement. The results
for the FA2 fall as the replacement increases until, at 30%, an increase can be seen
which continues on to the 50% replacement level. The IM material produces the
highest w/b ratios with the lowest result measuring 0.66 whilst subsequent results
exceed 0.7.
The influence o f the water-cement ratio and cement content on the compressive
strength is well documented with the compressive strength decreasing with a higher
water-cement ratio (Schulze 1999); therefore, the less water in the mix, the stronger
and less porous the concrete. When comparing the results to the compressive
strengths, it can be seen that the materials requiring the higher water demand, MSW
and IM blends, both produce low compressive strength results.
FA2 shows a decrease in water demand until the 25% replacement level. From
this point the water demand increases and it is the only material which shows this
behaviour. This may be attributed to the amount o f material being introduced into the
mix as a result o f the differences in particle densities. The particle density of fly ash is
typically 2300kg/m3, which is significantly lower than OPC at 3120kg/m3. Table 5.2
reports the specific gravities of the materials used in this research as determined using
the method laid out in BS EN 196-6:1992 Methods o f testing cement (National annex
NC - Method of testing cement for density).This method determined the density of
cement by displacement o f a non-reactive liquid (pure water) in a pyknometer. Two
separate determinations, on different portions o f the sample, using two calibrated
pyknometers achieved the average figure used in this research. Therefore, for a given
mass of OPC a direct mass substitution o f fly ash will give a greater volume of
cementitious material. Table 5.2 shows that the density o f the fly ash is lower than
that o f the OPC. However; density alone does not explain the trend for FA2, as SS has
a lower density than FA2.
Table 5.2Specific gravity of the controls and the researched materialsMaterial OPCRM GGBS SS MSW FA2 IM
Specific gravity 3268 2942 1705 2496 2207 2734
(kg/m3)
5-5
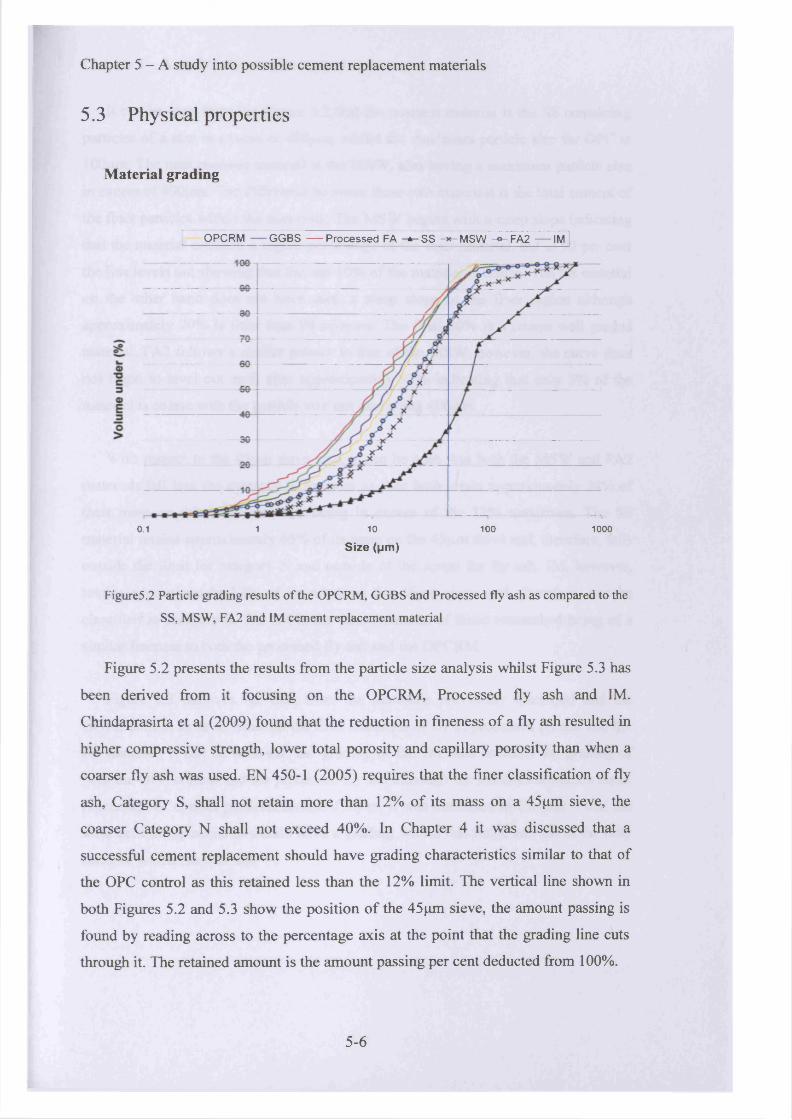
Chapter 5 - A study into possible cement replacement materials
5.3 Physical properties
Material grading
OPCRM — GGBS — Processed FA - * - S S * MSW -©-FA2 — IM
0.1 1 10 100 1000
Size (pm)
Figure5.2 Particle grading results of the OPCRM, GGBS and Processed fly ash as compared to the
SS, MSW, FA2 and IM cement replacement material
Figure 5.2 presents the results from the particle size analysis whilst Figure 5.3 has
been derived from it focusing on the OPCRM, Processed fly ash and IM.
Chindaprasirta et al (2009) found that the reduction in fineness of a fly ash resulted in
higher compressive strength, lower total porosity and capillary porosity than when a
coarser fly ash was used. EN 450-1 (2005) requires that the finer classification of fly
ash, Category S, shall not retain more than 12% of its mass on a 45pm sieve, the
coarser Category N shall not exceed 40%. In Chapter 4 it was discussed that a
successful cement replacement should have grading characteristics similar to that of
the OPC control as this retained less than the 12% limit. The vertical line shown in
both Figures 5.2 and 5.3 show the position of the 45pm sieve, the amount passing is
found by reading across to the percentage axis at the point that the grading line cuts
through it. The retained amount is the amount passing per cent deducted from 100%.
5-6
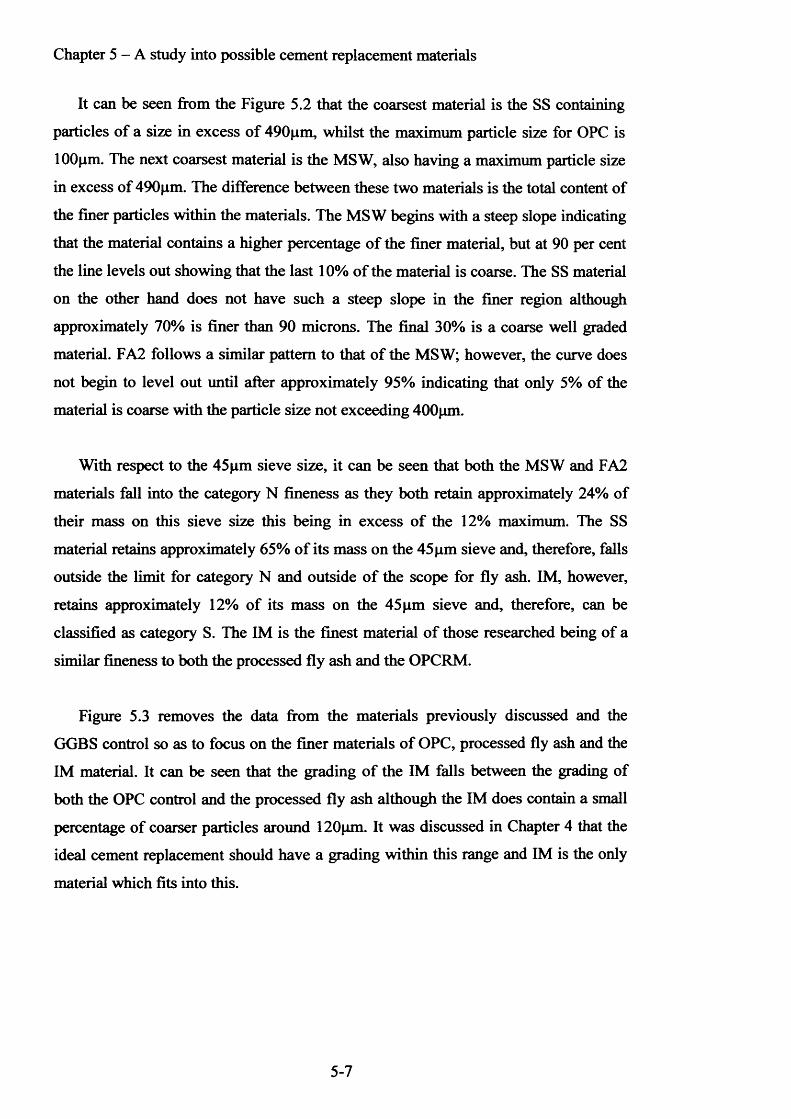
Chapter 5 - A study into possible cement replacement materials
It can be seen from the Figure 5.2 that the coarsest material is the SS containing
particles of a size in excess o f 490pm, whilst the maximum particle size for OPC is
100pm. The next coarsest material is the MSW, also having a maximum particle size
in excess of 490pm. The difference between these two materials is the total content of
the finer particles within the materials. The MSW begins with a steep slope indicating
that the material contains a higher percentage o f the finer material, but at 90 per cent
the line levels out showing that the last 10% of the material is coarse. The SS material
on the other hand does not have such a steep slope in the finer region although
approximately 70% is finer than 90 microns. The final 30% is a coarse well graded
material. FA2 follows a similar pattern to that of the MSW; however, the curve does
not begin to level out until after approximately 95% indicating that only 5% of the
material is coarse with the particle size not exceeding 400pm.
With respect to the 45pm sieve size, it can be seen that both the MSW and FA2
materials fall into the category N fineness as they both retain approximately 24% of
their mass on this sieve size this being in excess o f the 12% maximum. The SS
material retains approximately 65% o f its mass on the 45 pm sieve and, therefore, falls
outside the limit for category N and outside o f the scope for fly ash. IM, however,
retains approximately 12% of its mass on the 45 pm sieve and, therefore, can be
classified as category S. The IM is the finest material o f those researched being o f a
similar fineness to both the processed fly ash and the OPCRM.
Figure 5.3 removes the data from the materials previously discussed and the
GGBS control so as to focus on the finer materials of OPC, processed fly ash and the
IM material. It can be seen that the grading o f the IM falls between the grading of
both the OPC control and the processed fly ash although the IM does contain a small
percentage of coarser particles around 120pm. It was discussed in Chapter 4 that the
ideal cement replacement should have a grading within this range and IM is the only
material which fits into this.
5-7
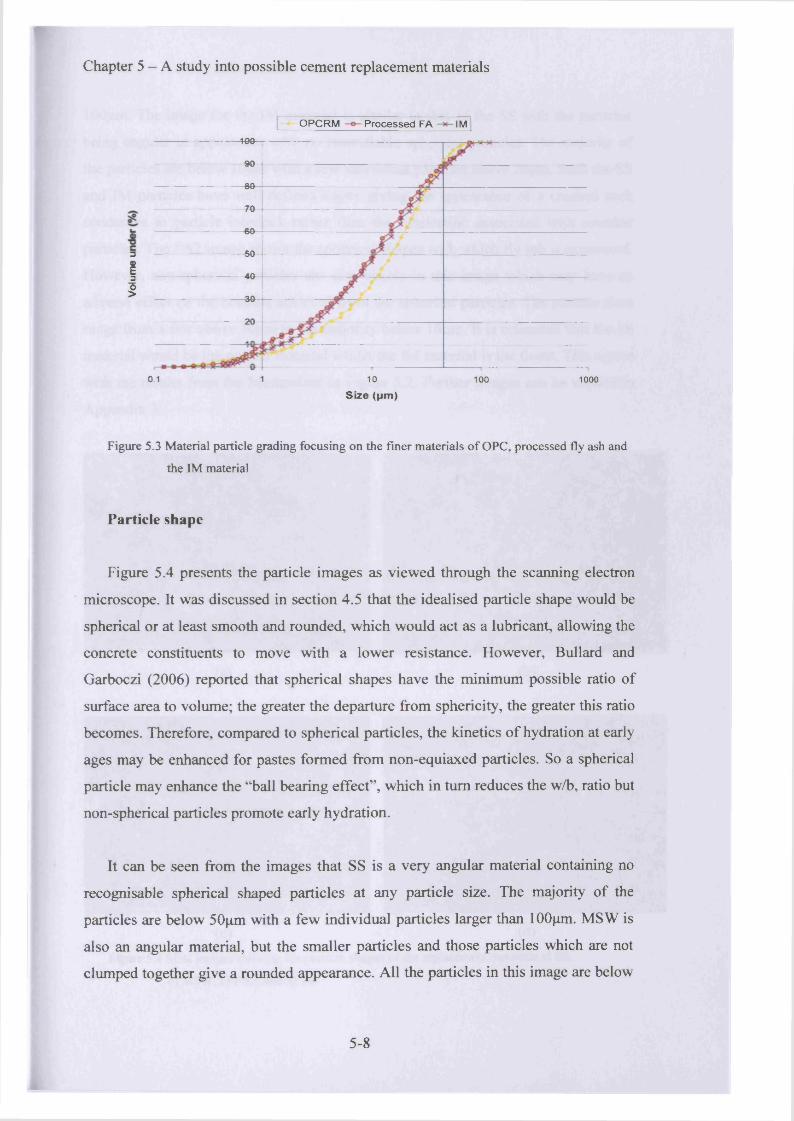
Chapter 5 - A study into possible cement replacement materials
OPCRM Processed FA IM
100
90
80
TO
TO
TO3
13
140
30
20
0.1 1 10 100 1000
Size (pm)
Figure 5.3 Material particle grading focusing on the finer materials o f OPC, processed fly ash and
the IM material
Particle shape
Figure 5.4 presents the particle images as viewed through the scanning electron
microscope. It was discussed in section 4.5 that the idealised particle shape would be
spherical or at least smooth and rounded, which would act as a lubricant, allowing the
concrete constituents to move with a lower resistance. However, Bullard and
Garboczi (2006) reported that spherical shapes have the minimum possible ratio of
surface area to volume; the greater the departure from sphericity, the greater this ratio
becomes. Therefore, compared to spherical particles, the kinetics of hydration at early
ages may be enhanced for pastes formed from non-equiaxed particles. So a spherical
particle may enhance the “ball bearing effect”, which in turn reduces the w/b, ratio but
non-spherical particles promote early hydration.
It can be seen from the images that SS is a very angular material containing no
recognisable spherical shaped particles at any particle size. The majority of the
particles are below 50pm with a few individual particles larger than 100pm. MSW is
also an angular material, but the smaller particles and those particles which are not
clumped together give a rounded appearance. All the particles in this image are below
5-8
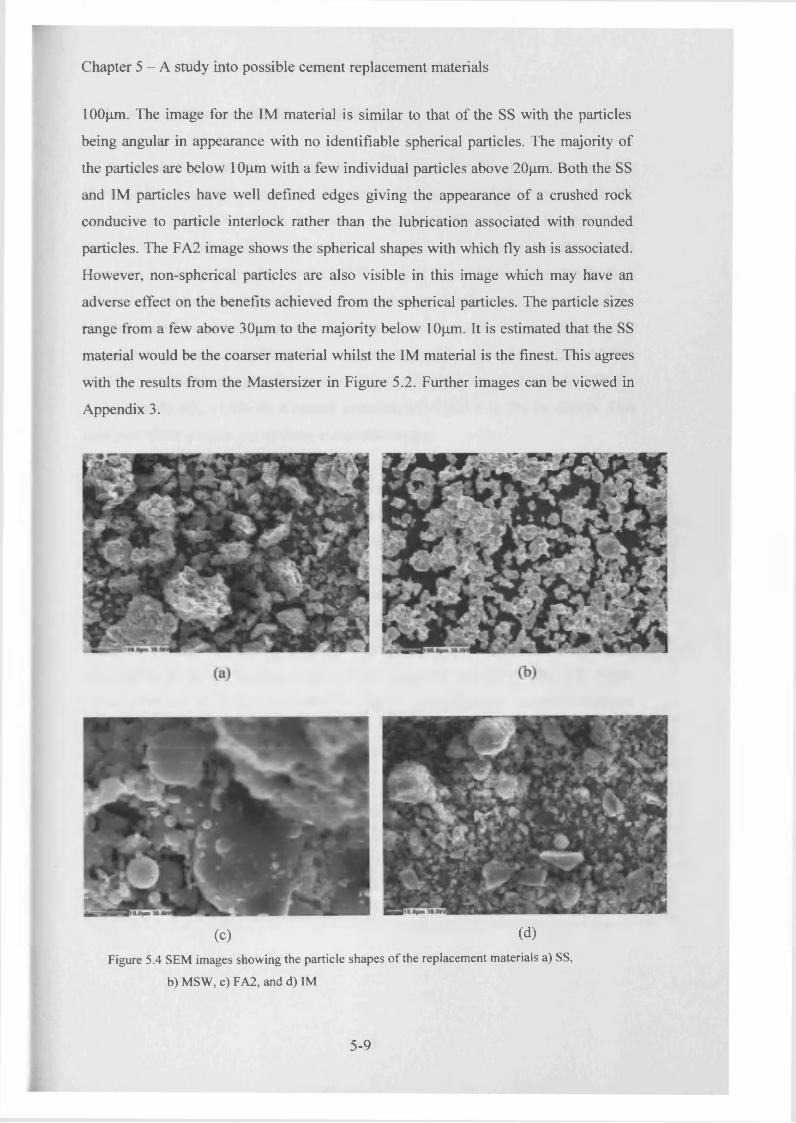
Chapter 5 - A study into possible cement replacement materials
100pm. The image for the IM material is similar to that of the SS with the particles
being angular in appearance with no identifiable spherical particles. The majority of
the particles are below 10pm with a few individual particles above 20pm. Both the SS
and IM particles have well defined edges giving the appearance of a crushed rock
conducive to particle interlock rather than the lubrication associated with rounded
particles. The FA2 image shows the spherical shapes with which fly ash is associated.
However, non-spherical particles are also visible in this image which may have an
adverse effect on the benefits achieved from the spherical particles. The particle sizes
range from a few above 30pm to the majority below 10pm. It is estimated that the SS
material would be the coarser material whilst the IM material is the finest. This agrees
with the results from the Mastersizer in Figure 5.2. Further images can be viewed in
Appendix 3.
(c) (d)Figure 5.4 SEM images showing the particle shapes of the replacement materials a) SS,
b) MSW, c) FA2, and d) IM
5-9
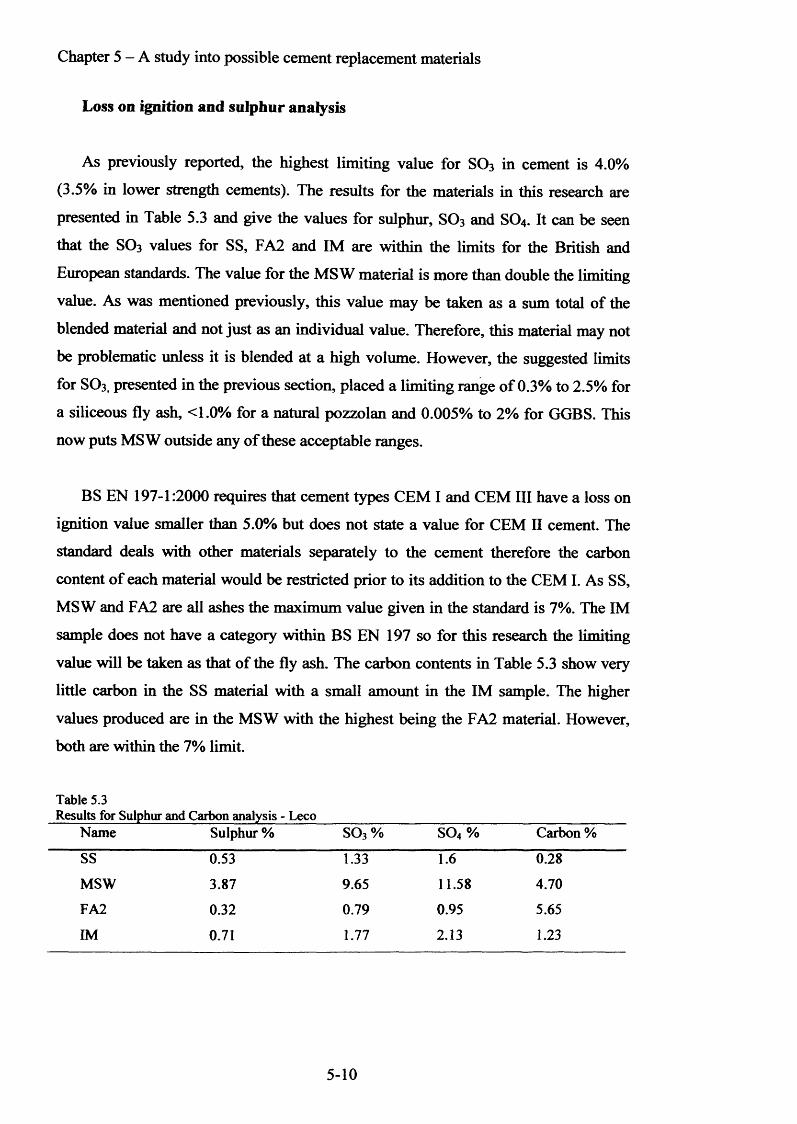
Chapter 5 — A study into possible cement replacement materials
Loss on ignition and sulphur analysis
As previously reported, the highest limiting value for S 0 3 in cement is 4.0%
(3.5% in lower strength cements). The results for the materials in this research are
presented in Table 5.3 and give the values for sulphur, SO3 and S 04. It can be seen
that the SO3 values for SS, FA2 and IM are within the limits for the British and
European standards. The value for the MS W material is more than double the limiting
value. As was mentioned previously, this value may be taken as a sum total of the
blended material and not just as an individual value. Therefore, this material may not
be problematic unless it is blended at a high volume. However, the suggested limits
for SO3 , presented in the previous section, placed a limiting range o f 0.3% to 2 .5 % for
a siliceous fly ash, <1.0% for a natural pozzolan and 0.005% to 2% for GGBS. This
now puts MSW outside any o f these acceptable ranges.
BS EN 197-1:2000 requires that cement types CEM I and CEM III have a loss on
ignition value smaller than 5.0% but does not state a value for CEM II cement. The
standard deals with other materials separately to the cement therefore the carbon
content o f each material would be restricted prior to its addition to the CEM I. As SS,
MSW and FA2 are all ashes the maximum value given in the standard is 7%. The IM
sample does not have a category within BS EN 197 so for this research the limiting
value will be taken as that of the fly ash. The carbon contents in Table 5.3 show very
little carbon in the SS material with a small amount in the IM sample. The higher
values produced are in the MSW with the highest being the FA2 material. However,
both are within the 7% limit.
Table 5.3Results for Sulphur and Carbon analysis - Leco
Name Sulphur % SO3 % S0 4 % Carbon %SS 0.53 1.33 1 .6 0.28
MSW 3.87 9.65 11.58 4.70
FA2 0.32 0.79 0.95 5.65
IM 0.71 1.77 2.13 1.23
5-10
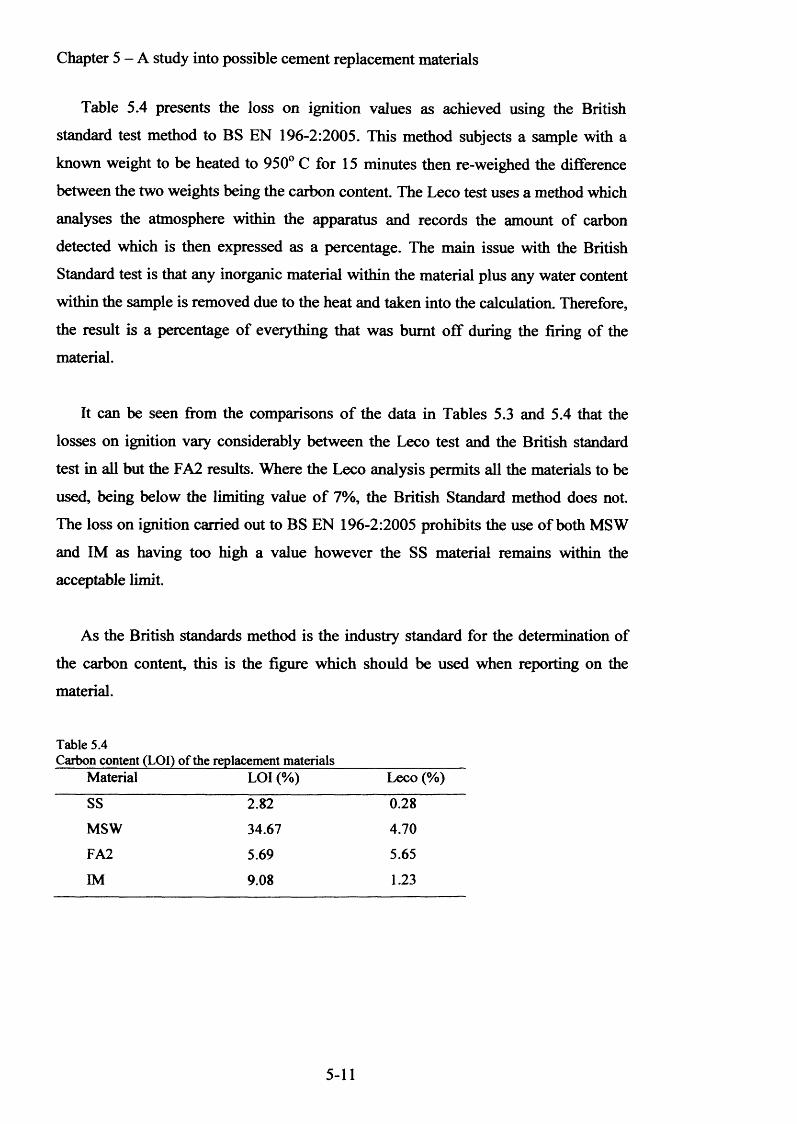
Chapter 5 - A study into possible cement replacement materials
Table 5.4 presents the loss on ignition values as achieved using the British
standard test method to BS EN 196-2:2005. This method subjects a sample with a
known weight to be heated to 950° C for 15 minutes then re-weighed the difference
between the two weights being the carbon content. The Leco test uses a method which
analyses the atmosphere within the apparatus and records the amount of carbon
detected which is then expressed as a percentage. The main issue with the British
Standard test is that any inorganic material within the material plus any water content
within the sample is removed due to the heat and taken into the calculation. Therefore,
the result is a percentage of everything that was burnt off during the firing o f the
material.
It can be seen from the comparisons o f the data in Tables 5.3 and 5.4 that the
losses on ignition vary considerably between the Leco test and the British standard
test in all but the FA2 results. Where the Leco analysis permits all the materials to be
used, being below the limiting value o f 7%, the British Standard method does not.
The loss on ignition carried out to BS EN 196-2:2005 prohibits the use of both MSW
and IM as having too high a value however the SS material remains within the
acceptable limit.
As the British standards method is the industry standard for the determination of
the carbon content, this is the figure which should be used when reporting on the
material.
Table 5.4Carbon content (LOI) of the replacement materials
Material LOI (%) Leco (%)
SS 2.82 0.28
MSW 34.67 4.70
FA2 5.69 5.65
IM 9.08 1.23
5-11
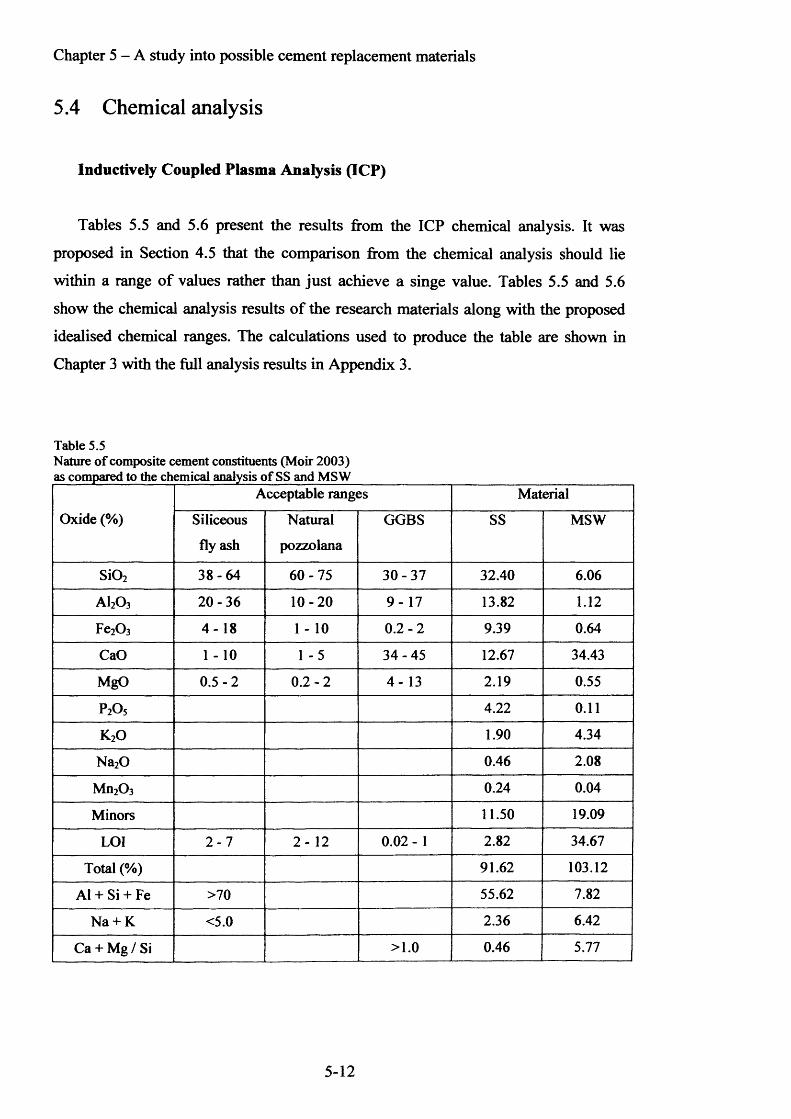
Chapter 5 - A study into possible cement replacement materials
5.4 Chemical analysis
Inductively Coupled Plasma Analysis (ICP)
Tables 5.5 and 5.6 present the results from the ICP chemical analysis. It was
proposed in Section 4.5 that the comparison from the chemical analysis should lie
within a range o f values rather than just achieve a singe value. Tables 5.5 and 5.6
show the chemical analysis results o f the research materials along with the proposed
idealised chemical ranges. The calculations used to produce the table are shown in
Chapter 3 with the full analysis results in Appendix 3.
Table 5.5Nature of composite cement constituents (Moir 2003)as compared to the chemical analysis of SS and MSW
Oxide (%)
Acceptable ranges Material
Siliceous
fly ash
Natural
pozzolana
GGBS SS MSW
Si02 38-64 60-75 30-37 32.40 6.06
A120 3 20-36 10-20 9 - 1 7 13.82 1.12
Fe2C>3 4 - 1 8 1 - 10 0. 2 - 2 9.39 0.64
CaO 1 -10 1 -5 34-45 12.67 34.43
MgO 0.5-2 0. 2 - 2 4 -1 3 2.19 0.55
P 2 O 5 4.22 0.11
k 2o 1.90 4.34
Na20 0.46 2.08
Mn20 3 0.24 0.04
Minors 11.50 19.09
LOI 2 -7 2 - 12 0.02 - 1 2.82 34.67
Total (%) 91.62 103.12
A1 + Si + Fe >70 55.62 7.82
Na + K <5.0 2.36 6.42
Ca + Mg / Si >1.0 0.46 5.77
5-12
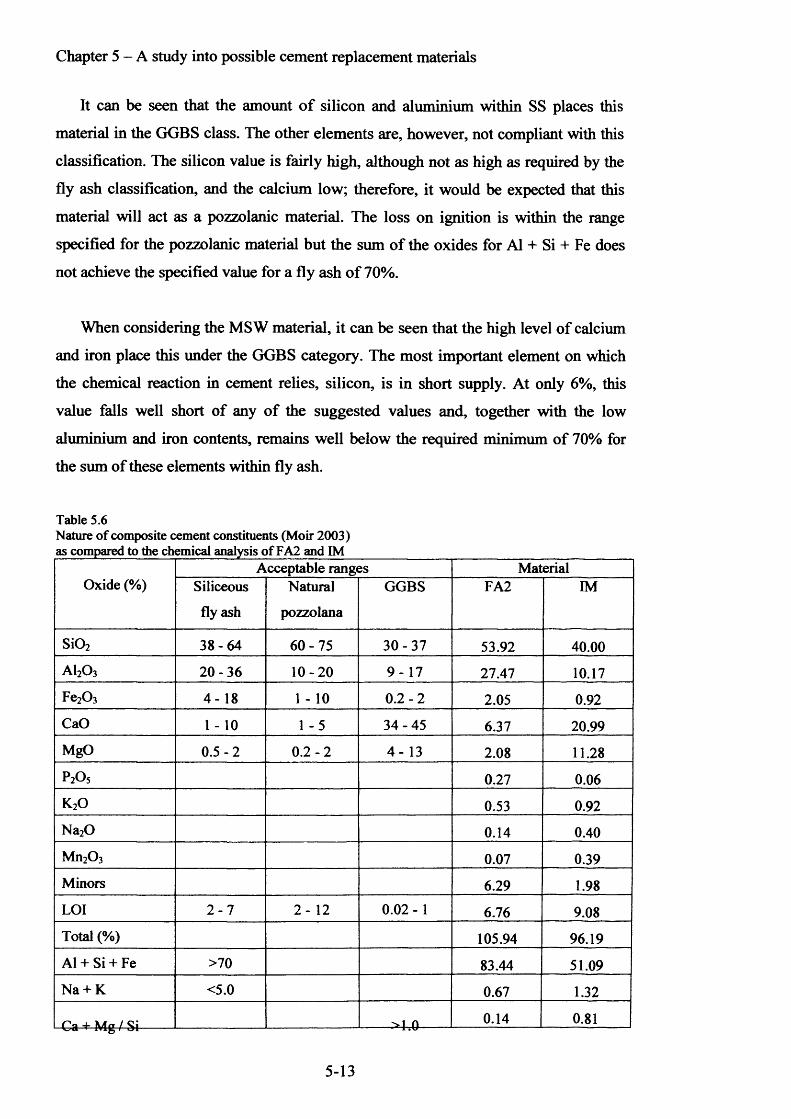
Chapter 5 - A study into possible cement replacement materials
It can be seen that the amount o f silicon and aluminium within SS places this
material in the GGBS class. The other elements are, however, not compliant with this
classification. The silicon value is fairly high, although not as high as required by the
fly ash classification, and the calcium low; therefore, it would be expected that this
material will act as a pozzolanic material. The loss on ignition is within the range
specified for the pozzolanic material but the sum o f the oxides for A1 + Si + Fe does
not achieve the specified value for a fly ash o f 70%.
When considering the MSW material, it can be seen that the high level of calcium
and iron place this under the GGBS category. The most important element on which
the chemical reaction in cement relies, silicon, is in short supply. At only 6 %, this
value falls well short of any o f the suggested values and, together with the low
aluminium and iron contents, remains well below the required minimum of 70% for
the sum of these elements within fly ash.
Table 5.6Nature of composite cement constituents (Moir 2003) as compared to the chemical analysis of FA2 and IM
Oxide (%)Acceptable ranges Material
Siliceous
fly ash
Natural
pozzolana
GGBS FA2 IM
SiQ, 38-64 60-75 30-37 53.92 40.00a i2o 3 20-36 10-20 9 - 1 7 27.47 10.17
Fe20 3 4- 18 1 - 10 0. 2 - 2 2.05 0.92CaO 1 -10 1 -5 34-45 6.37 20.99MgO 0.5-2 0. 2 - 2 4 - 1 3 2.08 11.28P 2 O 5 0.27 0.06k2o 0.53 0.92Na20 0.14 0.40Mn20 3 0.07 0.39Minors 6.29 1.98LOI 2 -7 2 - 12 0.02 - 1 6.76 9.08Total (%) 105.94 96.19A1 + Si + Fe >70 83.44 51.09Na + K <5.0 0.67 1.32
Ca +■ Mg / Si------- ------->T0------- 0.14 0.81
5-13
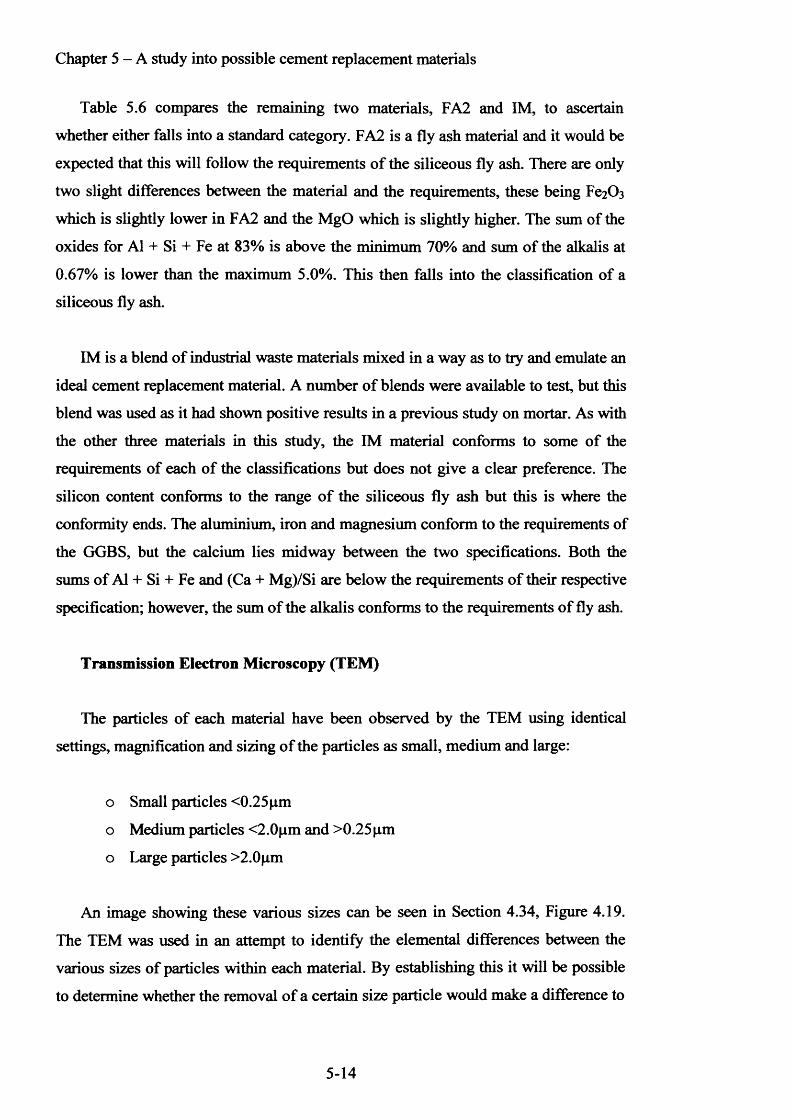
Chapter 5 - A study into possible cement replacement materials
Table 5.6 compares the remaining two materials, FA2 and IM, to ascertain
whether either falls into a standard category. FA2 is a fly ash material and it would be
expected that this will follow the requirements o f the siliceous fly ash. There are only
two slight differences between the material and the requirements, these being Fe2 0 3
which is slightly lower in FA2 and the MgO which is slightly higher. The sum of the
oxides for A1 + Si + Fe at 83% is above the minimum 70% and sum of the alkalis at
0.67% is lower than the maximum 5.0%. This then falls into the classification of a
siliceous fly ash.
IM is a blend of industrial waste materials mixed in a way as to try and emulate an
ideal cement replacement material. A number o f blends were available to test, but this
blend was used as it had shown positive results in a previous study on mortar. As with
the other three materials in this study, the IM material conforms to some o f the
requirements of each of the classifications but does not give a clear preference. The
silicon content conforms to the range o f the siliceous fly ash but this is where the
conformity ends. The aluminium, iron and magnesium conform to the requirements of
the GGBS, but the calcium lies midway between the two specifications. Both the
sums of A1 + Si + Fe and (Ca + Mg)/Si are below the requirements o f their respective
specification; however, the sum of the alkalis conforms to the requirements of fly ash.
Transmission Electron Microscopy (TEM)
The particles of each material have been observed by the TEM using identical
settings, magnification and sizing o f the particles as small, medium and large:
o Small particles <0.25pm
o Medium particles <2.0pm and >0.25pm
o Large particles >2.0pm
An image showing these various sizes can be seen in Section 4.34, Figure 4.19.
The TEM was used in an attempt to identify the elemental differences between the
various sizes of particles within each material. By establishing this it will be possible
to determine whether the removal o f a certain size particle would make a difference to
5-14
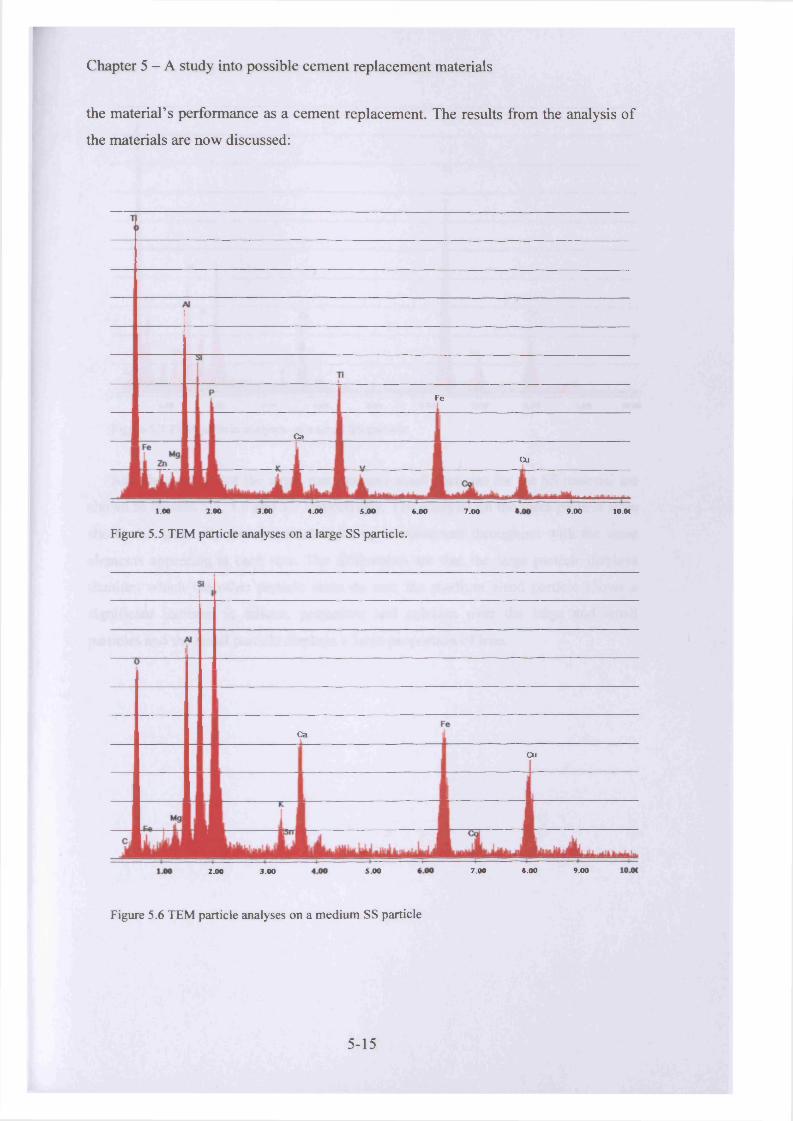
Chapter 5 - A study into possible cement replacement materials
the material’s performance as a cement replacement. The results from the analysis of
the materials are now discussed:
Fe
Ca
Cu
1.06 2.00 3.00 4.00 5 00 6 00 7.00 9.00 10 .0(
Figure 5.5 TEM particle analyses on a large SS particle.
ca
Cu
7.00 «.oo 9.005.002.00 3.00
Figure 5.6 TEM particle analyses on a medium SS particle
5-15
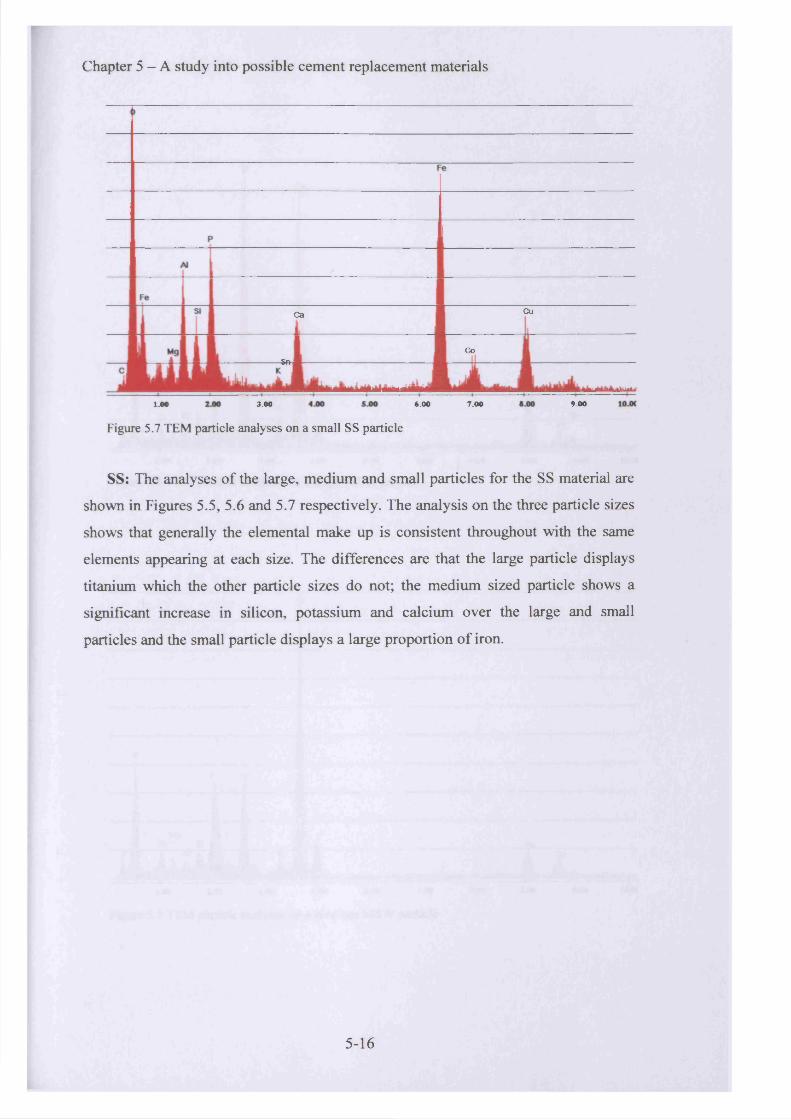
Chapter 5 - A study into possible cement replacement materials
CuCa
Co-Sr-
3.00 6.00 7.00 9.001.00
Figure 5.7 TEM particle analyses on a small SS particle
SS: The analyses of the large, medium and small particles for the SS material are
shown in Figures 5.5, 5.6 and 5.7 respectively. The analysis on the three particle sizes
shows that generally the elemental make up is consistent throughout with the same
elements appearing at each size. The differences are that the large particle displays
titanium which the other particle sizes do not; the medium sized particle shows a
significant increase in silicon, potassium and calcium over the large and small
particles and the small particle displays a large proportion of iron.
5-16

Chapter 5 - A study into possible cement replacement materials
-Ca-
Cu
OsZnFe
100 3 00 7.00 9 00 10.0C
Figure 5.8 TEM particle analyses on a large MSW particle
<a
5
p ai jTi
Mg 1 IZn Si 1 i Cujj U . i - 1 -100 2.00 3 00 4.00 5.00 6.00 7.00 6.00 9.00 10.0C
Figure 5.9 TEM particle analyses on a medium MSW particle
5-17
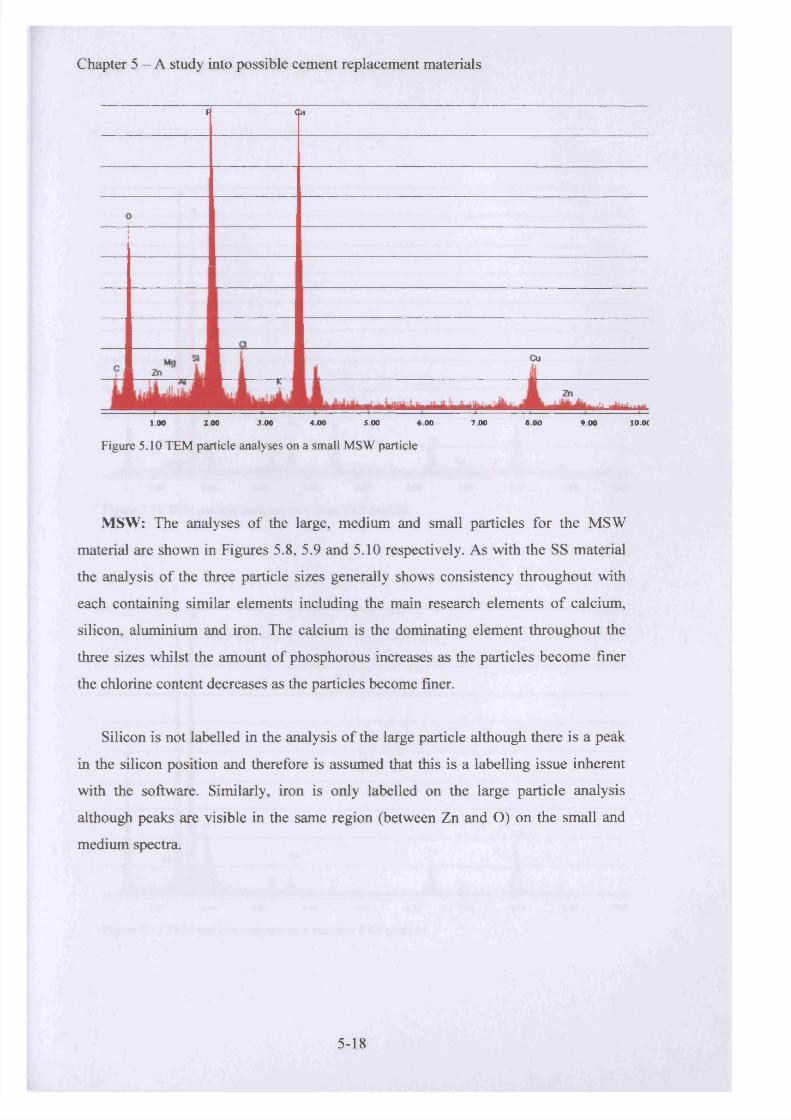
Chapter 5 - A study into possible cement replacement materials
F Ga
1.00 2.00 3.00 4.00 5.00 6.00 7.00 8.00 9.00 10. OC
Figure 5.10 TEM particle analyses on a small MSW particle
MSW: The analyses of the large, medium and small particles for the MSW
material are shown in Figures 5.8, 5.9 and 5.10 respectively. As with the SS material
the analysis of the three particle sizes generally shows consistency throughout with
each containing similar elements including the main research elements of calcium,
silicon, aluminium and iron. The calcium is the dominating element throughout the
three sizes whilst the amount of phosphorous increases as the particles become finer
the chlorine content decreases as the particles become finer.
Silicon is not labelled in the analysis of the large particle although there is a peak
in the silicon position and therefore is assumed that this is a labelling issue inherent
with the software. Similarly, iron is only labelled on the large particle analysis
although peaks are visible in the same region (between Zn and O) on the small and
medium spectra.
5-18
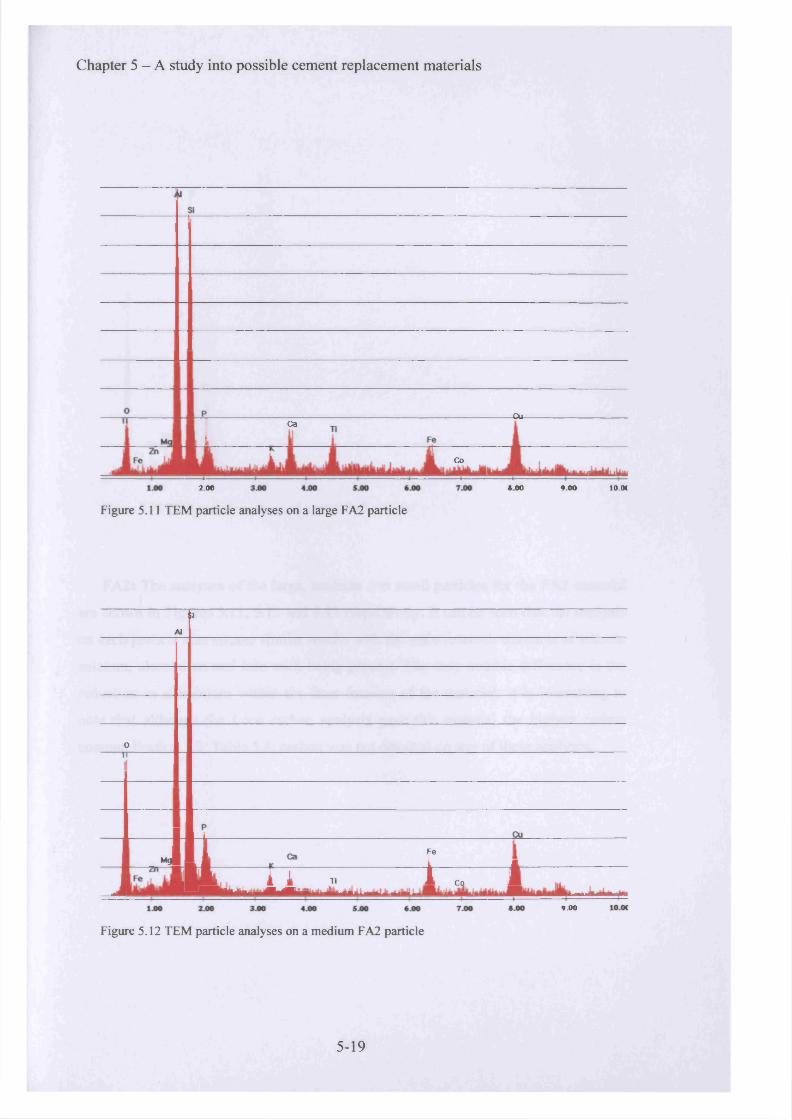
Chapter 5 - A study into possible cement replacement materials
-CaCa
Co
2.00 4 00 9.00 10.0(
Figure 5.11 TEM particle analyses on a large FA2 particle
Ai
a
O1i
J L1 rJ |l i ' l l . A c , 1
9.00
Figure 5.12 TEM particle analyses on a medium FA2 particle
5-19
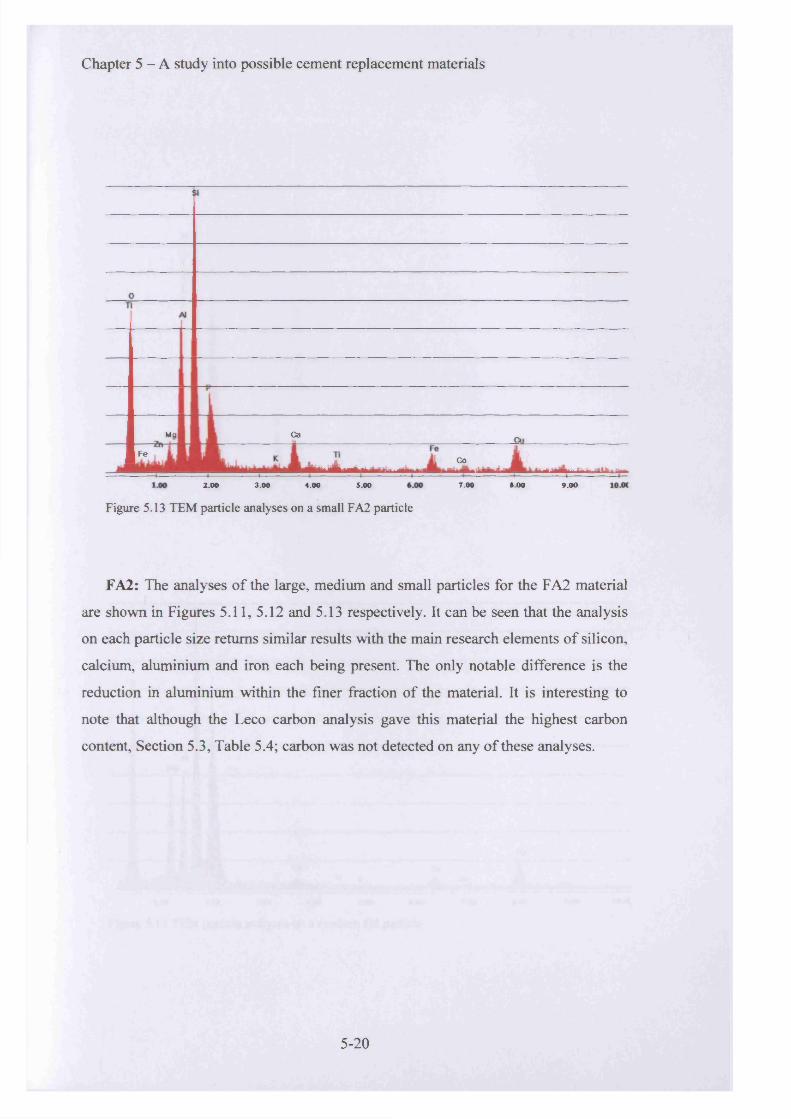
Chapter 5 - A study into possible cement replacement materials
Mq Ca
FeCo
7.002.00 3.00 4.00 5.00 5.00 9.00
Figure 5.13 TEM particle analyses on a small FA2 particle
FA2: The analyses of the large, medium and small particles for the FA2 material
are shown in Figures 5.11, 5.12 and 5.13 respectively. It can be seen that the analysis
on each particle size returns similar results with the main research elements of silicon,
calcium, aluminium and iron each being present. The only notable difference is the
reduction in aluminium within the finer fraction of the material. It is interesting to
note that although the Leco carbon analysis gave this material the highest carbon
content, Section 5.3, Table 5.4; carbon was not detected on any of these analyses.
5-20
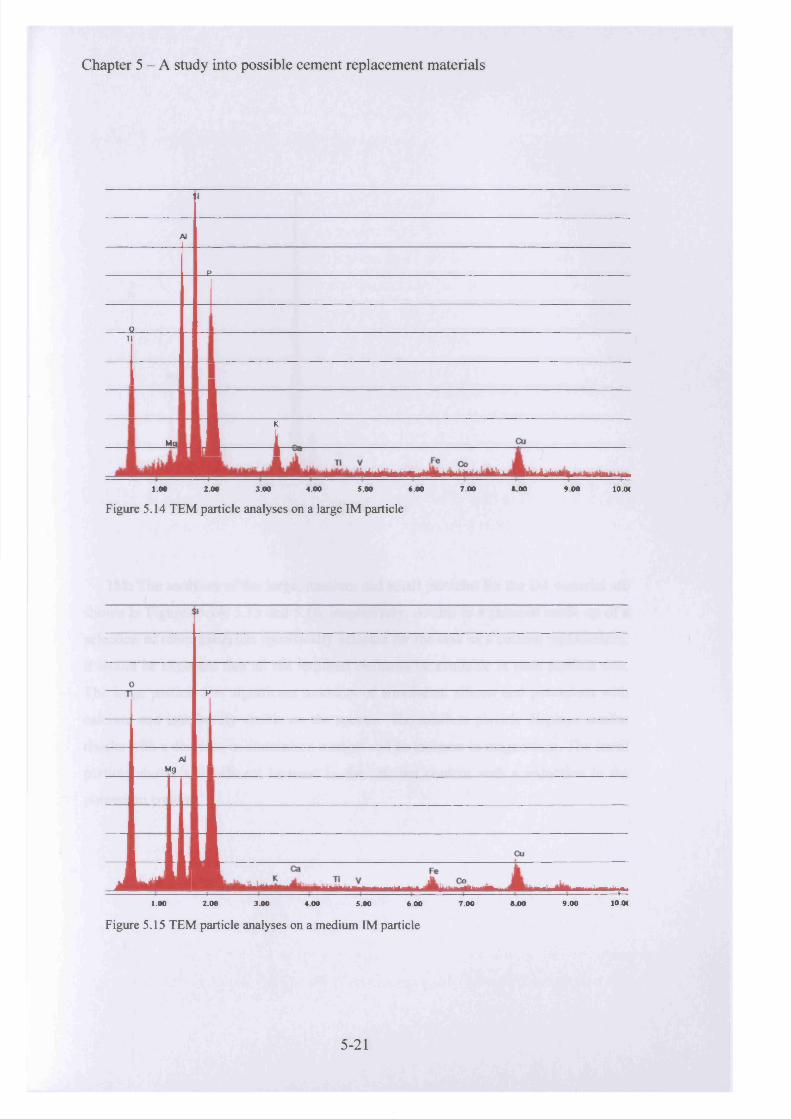
Chapter 5 - A study into possible cement replacement materials
11
Al
p
SI1
I
Mq1 i
1.00 2.00 3.00 4.00 5.00 6.00 7.00 6 00 9.00 104K
Figure 5.14 TEM particle analyses on a large IM particle
'
0T 1 p - .
AtMg
1
1 i___
1i i Q
J I M1.00 2.00 3.00 4.00 5.00 6.00 7.00 8 00 9.00 10.0C
Figure 5.15 TEM particle analyses on a medium IM particle
5-21
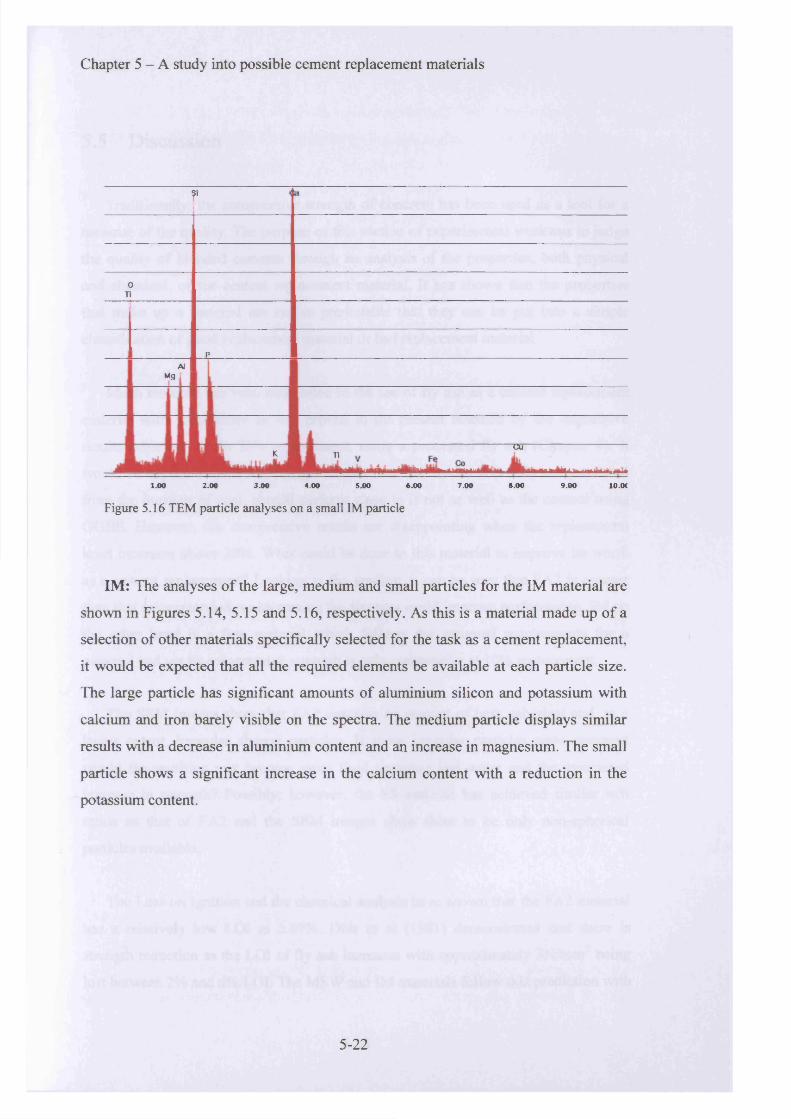
Chapter 5 - A study into possible cement replacement materials
<75-----
1
0Ti
PAl
Mg i
1.00
K 1
2.00 3.00
Ti ^
4.00 5.00 6.00 7.00 8.00 9.00 10.0C
Figure 5.16 TEM particle analyses on a small IM particle
IM: The analyses of the large, medium and small particles for the IM material are
shown in Figures 5.14, 5.15 and 5.16, respectively. As this is a material made up of a
selection of other materials specifically selected for the task as a cement replacement,
it would be expected that all the required elements be available at each particle size.
The large particle has significant amounts of aluminium silicon and potassium with
calcium and iron barely visible on the spectra. The medium particle displays similar
results with a decrease in aluminium content and an increase in magnesium. The small
particle shows a significant increase in the calcium content with a reduction in the
potassium content.
5-22

Chapter 5 - A study into possible cement replacement materials
5.5 Discussion
Traditionally, the compressive strength of concrete has been used as a tool for a
measure of the quality. The purpose of this section of experimental workwas to judge
the quality o f blended cements through an analysis of the properties, both physical
and chemical, o f the cement replacement material. It has shown that the properties
that make up a material are not so predictable that they can be put into a simple
classification o f good replacement material or bad replacement material.
Much research has been committed to the use of fly ash as a cement replacement
material with good cause as was proved in the present research by the impressive
results achieved, up to 33% replacement, using a processed fly ash (Chapter 4). It
would be expected that FA2, being a similar material, in that it is a fly ash produced
from the burning o f coal, should perform close to if not as well as the control using
GGBS. However, the compressive results are disappointing when the replacement
level increases above 20%. What could be done to this material to improve its worth
as a cement replacement? Looking at the grading, it can be seen that FA2 is coarser
than that recommended, so increasing the fineness could improve performance. IM on
the other hand is a fine material which follows the assumed requirements for a
material and yet its compressive strength is only competitive at 1 0 % replacement.
The SEM images show that FA2 contains an amount of both spherical and, to a
lesser extent, irregular shaped particles. If these irregular particles were removed
would the resulting mix become more fluid requiring less water and the associated
increase in strength? Possibly; however, the SS material has achieved similar w/b
ratios as that of FA2 and the SEM images show there to be only non-spherical
particles available.
The Loss on Ignition and the chemical analysis have shown that the FA2 material
has a relatively low LOI at 5.69%. Dhir et al (1981) demonstrated that there is
strength reduction as the LOI of fly ash increases with approximately 3N/mm being
lost between 2% and 6 % LOI. The MSW and IM materials follow this prediction with
5-23
Chapter 5 - A study into possible cement replacement materials
the MSW having the higher LOI giving the lower strength. This is not true o f the FA2
and SS materials, with the FA2 material having the higher LOI and also the higher
strength. The chemical analysis of FA2 confirms that this is a siliceous fly ash as it
conforms to the requirements of EN 450-1 2005, whilst the other materials conform
only partly to this specification. To use this information to guess the success of a
particular material as a cement replacement will require some knowledge of the
reactions within cement and its relationship to the replacement material.
This research has shown the fly ash FA2 to be the best replacement material from
the four samples tested, with SS, IM and MSW following in descending order of
quality. This material has consistently bettered the strengths o f the other samples,
although it has not improved on the strength produced by the GGBS control. As
discussed in Chapter 4, the properties of the material follow the recommended pattern
with the fineness, particle shape and elemental make up all being within the vicinity
of each of the suggested ranges. The SS material is a coarse material with 65%
retained on the 45pm sieve (procedure to BS EN 196-6 Determination o f fineness,
sieving method) and particles illustrating a rough irregular shape. The carbon content
is low and the SiC>2 content is not far short from that of siliceous fly ash. Even with
the low w/b ratio, the material does not compare to the GGBS control or the FA2
material. Kiattikomol et al (2001) showed that the fineness of the fly ash, not the
chemical composition, had a significant effect on the strength of mortar. This material
may perform better if it were processed to remove the coarser particles.
The MSW material is also a coarse material with an angular irregular particle
shape. Although the fineness improves over the SS material, the high carbon content,
high w/b ratio and low Si(> 2 content contribute to it being the worst performer out of
the four materials. None of the elemental properties of this material compare with the
idealised ranges, as shown in Table 5.6.
The IM sample has the potential to work well as a replacement material. It is a
fine material, although its particles are rough and irregular, with a high SiC>2 content.
This material showed positive results at low replacement levels however high w/b
ratios and high LOI results prove detrimental to the compressive strengths of the
concrete. The results from the analysis would have shown the potential for this
5-24

Chapter 5 - A study into possible cement replacement materials
material as a cement replacement, noting the high carbon content, with further trials
being recommended.
Table 5.7 presents a scoring system which scores the candidate replacement
material based on how it performed relative to the idealised cement replacement
through each o f the analysis. The scoring system is based upon the judgement of the
reviewer who must accurately assess the candidate material performance. The scoring
system uses a 4 point scale:
o A score of 4 indicates that the material fits the idealised requirement for a
cement replacement material. A score of 1 indicates that the material has
very little, if anything, in common with the idealised material requirement.
Scores of 2 or 3 can be used for intermediate scoring.
o A weighting is applied to the chemical analysis score as there are a number
o f comparisons to be made, which if are all matched exactly, will have a
greater benefit to the replacement material greater than, for example, the
fineness which can be manipulated through grinding.
Table 5.7Performance ratings of the candidate materials using a scoring system as an indictor to the materials effectiveness as a cement replacement based on results from the analysis_____________________
Property Weighting
factor
Material
FA2 SS IM MSW
Fineness 1 3 1 4 3
Shape 1 4 1 1 2
LOI 1 3 4 1 1
Chemical
components
2 4 3 2 1
Score 18 1 2 1 0 8
Rank 1 2 3 4
Ratings:
1 - Poor 2 - Moderate 3 - Good 4 - Excellent
5-25
Chapter 5 - A study into possible cement replacement materials
Reviewing the fineness property in Table 5.7, studying the IM and FA2 materials,
it can be seen in the material grading, Figure 5.2, that the grading curve of the IM
material follows that of the CEM I and the processed fly ash whilst the FA2 material
is coarser. Therefore, the IM material receives a score of 4, being the idealised
grading, whilst FA2 receives a score of 3 being just below the idealised grading.
With respect to shape, the SEM images show that the majority o f the particles in
the FA2 material are spherical therefore a score of 4 is awarded as this is the ideal
particle shape. The MSW achieves a score of 2 because the particles are generally
angular with a few having a spherical appearance. The SS and IM materials are both
angular with no spherical particles visible and hence receive the lowest score.
With regards to the LOI scores, a score of 4 would be awarded to a material with a
LOI o f less than 5%, a score of 3 would have a LOI of less than 7% but larger than
5%, whilst a score o f 2 would have a LOI result larger than 7% but less than 9%, with
a score o f 1 being greater than 9%.
The chemical analysis scores are based on how closely the material analysis
matches that of the idealised chemical composition as presented in Table 4.15. FA2
gets a score of 4 as this material follows the requirements o f the siliceous fly ash
fairly accurately with iron being the only anomaly. SS receives a score o f 3 as this
material is fairly close to the siliceous fly ash however the material is slightly low on
the main element o f silicon and the A1 + Si + Fe value is also lower than required. The
IM material is similar to that of the SS, however, this material gives closer
resemblance to GGBS. The results show that the calcium level is significantly lower
than required for GGBS and the value for (Ca + Mg)/Si is also too low therefore the
IM material scores a 2. MSW compares to the GGBS through its iron content and (Ca
+ Mg)/Si values being higher than required and its calcium content being the
minimum acceptable amount for GGBS. All other elements are low, with the major
element of silicon being a fifth of the content required for GGBS. These low values
necessitate the lowest score of 1 for the chemical components of MSW.
5-26
Chapter 5 - A study into possible cement replacement materials
The performance ratings have been introduced in order to rate and compare
candidate cement replacement materials and predict their suitability prior to any
further investigation. This method has the advantage that it is fairly simple to use and
researchers with some knowledge of the essential properties of a cement replacement
material can make accurate judgements for the scoring.
It can be seen from Table 5.7 that the ranking of the materials reflect those of the
majority o f the compressive strength results as presented in Figure 5.1. For this
research Table 5.7 has proved to be a suitable method for assessing the results.
However, other materials may not be so clear cut and Table 5.7 may require
reviewing to improve its accuracy.
5-27
Chapter 5 - A study into possible cement replacement materials
5.6 Conclusions
In summary the conclusions from this chapter are:
o An indication as to whether an unknown material will work as a cement
replacement can be gained from the analysis performed within this
chapter. With some knowledge of the use o f cement and cement
replacements, it is possible to compare the physical and chemical,
properties of an unknown material to those researched here and get an
indication as to the materials potential as a cement replacement prior to
mixing as a concrete.
o A performance table with a scoring system is an accurate method of
scrutinising the results from the analyses to predict the candidate materials
worth as a cement replacement.
o The ideal candidate for a quality cement replacement must possess a
chemical composition similar to one of those in the acceptable ranges and
be of a comparable fineness to OPC.
o Particle shape does not necessarily reduce the free water requirement.
5-28

Chapter 6 - Results - inter-grinding fly ash with clinker
6. Results - inter-grinding fly ash with clinker
6 .1 Introduction
6.2 Grinding
6.3 Test results o f the inter-ground material
6.4 Cost analysis
6.5 Conclusions
6.1 Introduction
The vast majority o f cement produced throughout the world is ground in ball or
rod mills. These are rotating tubes which contain steel balls or rods in a range o f sizes
through which the clinker passes (Moir 2003). The sizing action required to regulate
the performance o f ball mills is obtained by operating the mill in a closed circuit with
a classifier, (Gaudin 1939). Although vast changes have been made through natural
evolution and technology, the principle of closed circuit grinding has not changed for
many years. A closed-circuit mill, illustrated in Figure 6.1 below, contains two
separate chambers divided by a slotted diaphragm wall through which the partially
ground material is allowed to pass. Each of the chambers contain steel balls, the first
having a diameter range of generally 60-90mm and the second a diameter range of
generally 19-3 8 mm, Figure 6.2 shows the actual ball mill used at Aberthaw cement
works. The cement is discharged through a separator which divides the particles that
have been reduced to the requisite size from those that have not yet been sufficiently
reduced (i.e. oversize), the fine particles being stored whilst the coarser particles are
returned to the mill once again (Moir 2003). Closed-circuit grinding delivers tight
control of particle size whilst open-circuit mills, which do not contain the separating2 .
stage, are less efficient especially at high cement finenesses (above 350m /kg) (Moir
2003).
6-1
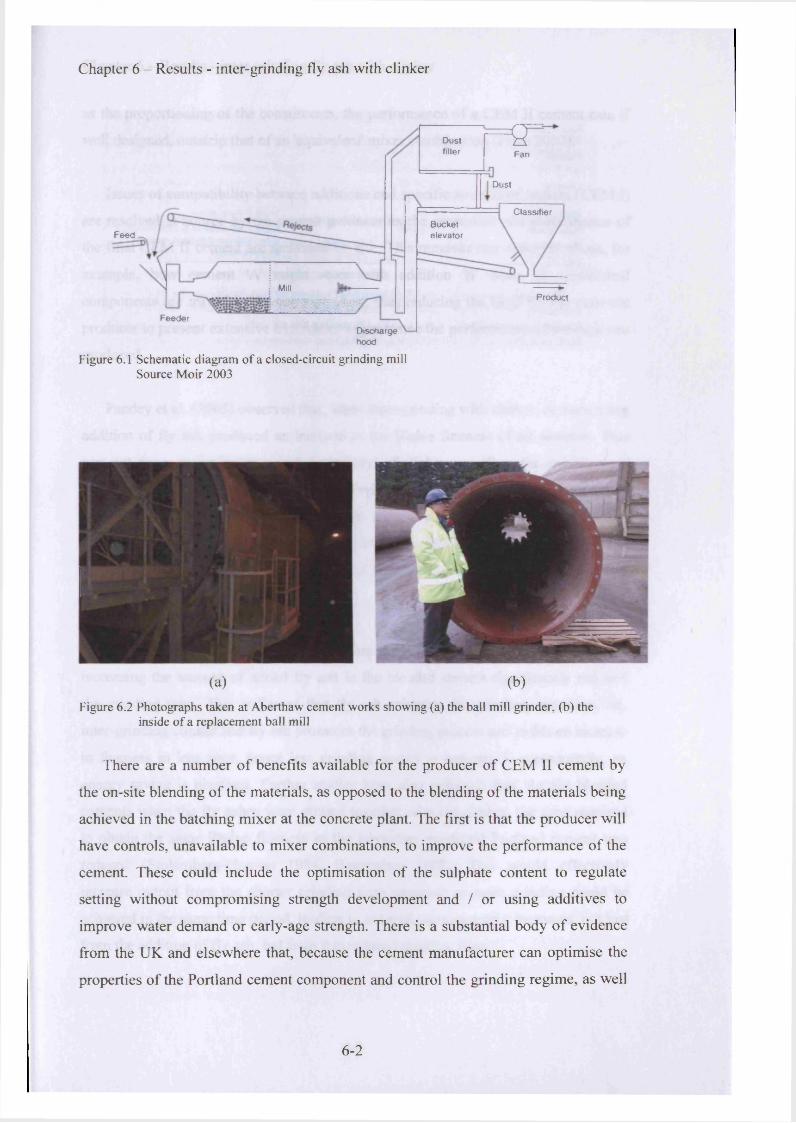
Chapter 6 - Results - inter-grinding fly ash with clinker
£ TFan
Dustfilter
Dust
ClassifierBucketelevatorFeed
MillProduct
FeederDischargehood
Figure 6.1 Schematic diagram of a closed-circuit grinding mill Source Moir 2003
(a) (b)Figure 6.2 Photographs taken at Aberthaw cement works showing (a) the ball mill grinder, (b) the
inside of a replacement ball mill
There are a number of benefits available for the producer of CEM II cement by
the on-site blending of the materials, as opposed to the blending of the materials being
achieved in the batching mixer at the concrete plant. The first is that the producer will
have controls, unavailable to mixer combinations, to improve the performance of the
cement. These could include the optimisation of the sulphate content to regulate
setting without compromising strength development and / or using additives to
improve water demand or early-age strength. There is a substantial body of evidence
from the UK and elsewhere that, because the cement manufacturer can optimise the
properties of the Portland cement component and control the grinding regime, as well
6-2

Chapter 6 - Results - inter-grinding fly ash with clinker
as the proportioning o f the constituents, the performance o f a CEM II cement can, if
well designed, outstrip that of an 'equivalent' mixer combination (Price 2007).
Issues of compatibility between additions and specific sources of cement (CEM I)
are resolved at source by the cement producer as the properties and performance of
the final CEM II cement are measured on site. This removes any concerns about, for
example, how cement 'A' might react with addition 'B' when the individual
components are mixed in the concrete plant, thus reducing the need for the concrete
producer to present extensive trial mixes to guarantee the performance of the concrete
produced.
Pandey et al. (2003) observed that, when inter-grinding with clinker, an increasing
addition of fly ash produced an increase in the Blaine fineness of all samples. This
was put down to the increase in ‘grindability’ o f clinker as well as the crushing and
disagglomeration of the fly ash particles. Tsvilis et al. (1999a) reported that materials
having different grindabilities influence the particle size distribution, which in turn
influence cement hydration and finally performance. However, an excessive amount
o f secondary material inhibits the grinding of both clinker and limestone resulting in a
coarser grading o f these materials.
Elkhadiri et al. (2002) found that, during the grinding stage, results showed that
increasing the amount of added fly ash in the blended cement significantly reduced
the grinding time. This indicated that fly ash enhances the grinding operation. So,
inter-grinding clinker and fly ash promotes the grinding process and yields an increase
in fineness in less time, hence less grinding energy is consumed, consequently, an
energy saving is obtained. Further studies have also indicated that, for the blended
cements when the fly ashes were ground together with the clinker, the time required
to obtain the same Blaine fineness as the laboratory produced Portland cement was
reduced (Stoltenberg-Hanson 1984, Bouzoubaa 1998). This would effectively
increase output from the shorter grinding time required; as more grinding could be
achieved in the same time period, leading to reduced costs as output increases, not just
from the addition o f fly ash, but from this reduced grinding time.
6-3
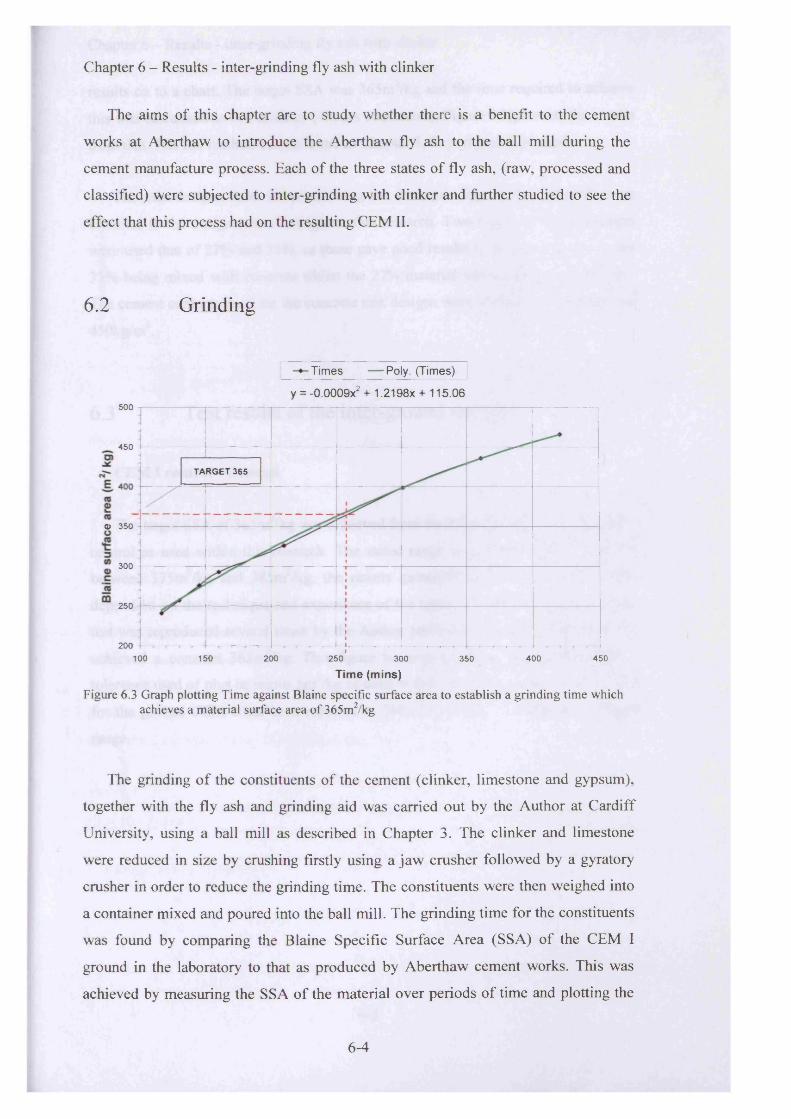
Chapter 6 - Results - inter-grinding fly ash with clinker
The aims of this chapter are to study whether there is a benefit to the cement
works at Aberthaw to introduce the Aberthaw fly ash to the ball mill during the
cement manufacture process. Each of the three states of fly ash, (raw, processed and
classified) were subjected to inter-grinding with clinker and further studied to see the
effect that this process had on the resulting CEM II.
6.2 Grinding
Times — Poly. (Times)
y = -0.0009X2 + 1,2198x + 115.06500
450
TARGET 365
O 350
300
250
200100 150 200 250 400 450300 350
Time (mins)
Figure 6.3 Graph plotting Time against Blaine specific surface area to establish a grinding time which achieves a material surface area of 365m2/kg
The grinding of the constituents of the cement (clinker, limestone and gypsum),
together with the fly ash and grinding aid was carried out by the Author at Cardiff
University, using a ball mill as described in Chapter 3. The clinker and limestone
were reduced in size by crushing firstly using a jaw crusher followed by a gyratory
crusher in order to reduce the grinding time. The constituents were then weighed into
a container mixed and poured into the ball mill. The grinding time for the constituents
was found by comparing the Blaine Specific Surface Area (SSA) of the CEM I
ground in the laboratory to that as produced by Aberthaw cement works. This was
achieved by measuring the SSA of the material over periods of time and plotting the
6-4
Chapter 6 - Results - inter-grinding fly ash with clinker
results on to a chart. The target SSA was 365m2/kg and the time required to achieve
this was calculated as 258 minutes (4hours 18minutes), Figure 6.3 presents the results
from this. The full method can be found in Chapter 3, Experimental Methods.
The mix designs used for researching the inter-grinding of the materials were
identical to the designs used throughout this research. Two replacement percentages
were used that of 27% and 33%, as these gave good results in the previous work, the
33% being mixed with concrete whilst the 27% material was tested as mortar only.3 3The cement contents used for the concrete mix designs were 140kg/m , 300kg/m and
450kg/m3.
6.3 Test results of the inter-ground material
CEM I control - Ground
•jThe target SSA of 365m /kg was achieved from the Blaine analysis on the CEM I
control as used within this research. The stated range used at the cement works is
between 375m /kg and 385m /kg, the results gained from this test are, however,
dependent on the technique and experience of the tester. For this reason, the Blaine
test was reproduced several times by the Author and it was recorded that the results■j
achieved a constant 365m /kg. This figure became the target for fineness with a
tolerance used of plus or minus 5m /kg as used within the industry. The average SSA
for the ground CEM I has been reported as 360m2/kg which is within the accepted
range.
6-5
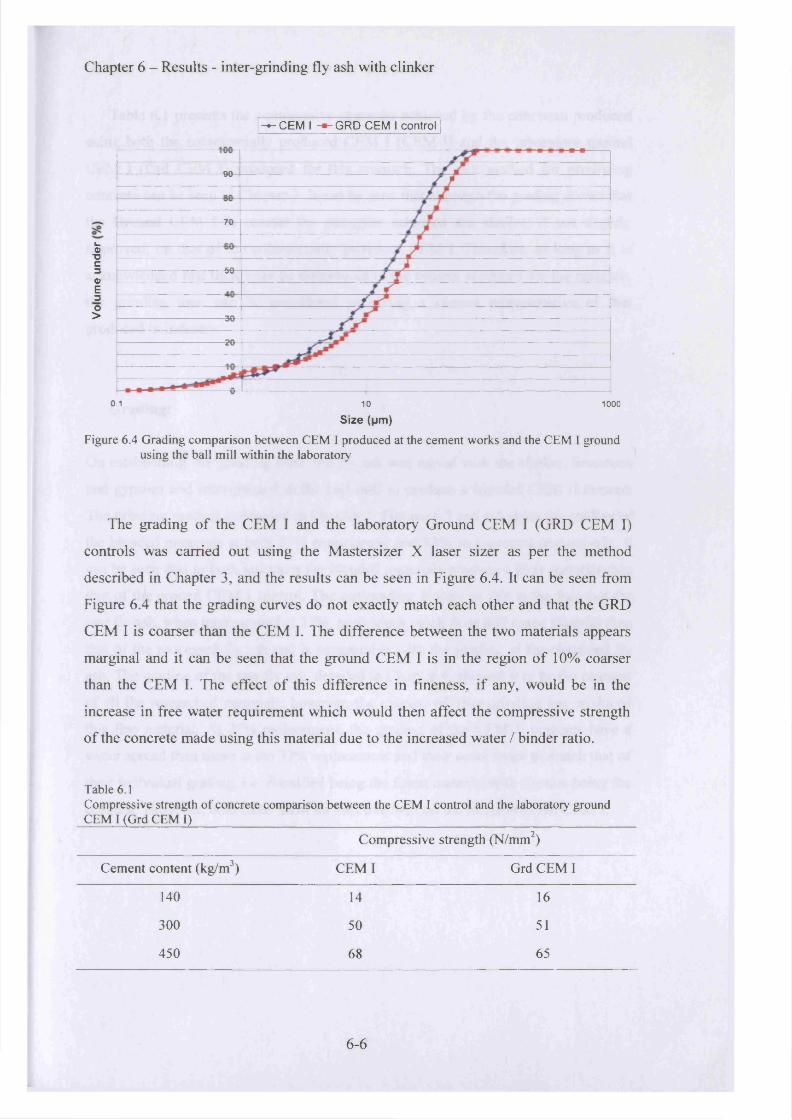
Chapter 6 - Results - inter-grinding fly ash with clinker
-•-C EM I -*-G RD CEM I control
90
70
t -o■Oc3 500)E3O> 30
20
0.1 10 1000
Size (pm)Figure 6.4 Grading comparison between CEM I produced at the cement works and the CEM I ground
using the ball mill within the laboratory
The grading of the CEM I and the laboratory Ground CEM I (GRD CEM I)
controls was carried out using the Mastersizer X laser sizer as per the method
described in Chapter 3, and the results can be seen in Figure 6.4. It can be seen from
Figure 6.4 that the grading curves do not exactly match each other and that the GRD
CEM I is coarser than the CEM I. The difference between the two materials appears
marginal and it can be seen that the ground CEM I is in the region of 10% coarser
than the CEM I. The effect of this difference in fineness, if any, would be in the
increase in ffee water requirement which would then affect the compressive strength
of the concrete made using this material due to the increased water / binder ratio.
Table 6.1Compressive strength of concrete comparison between the CEM I control and the laboratory ground CEM I (Grd CEM I)__________________________________________________________________
Compressive strength (N/mm2)
Cement content (kg/m3) CEM I Grd CEM I
140 14 16
300 50 51
450 68 65
6-6
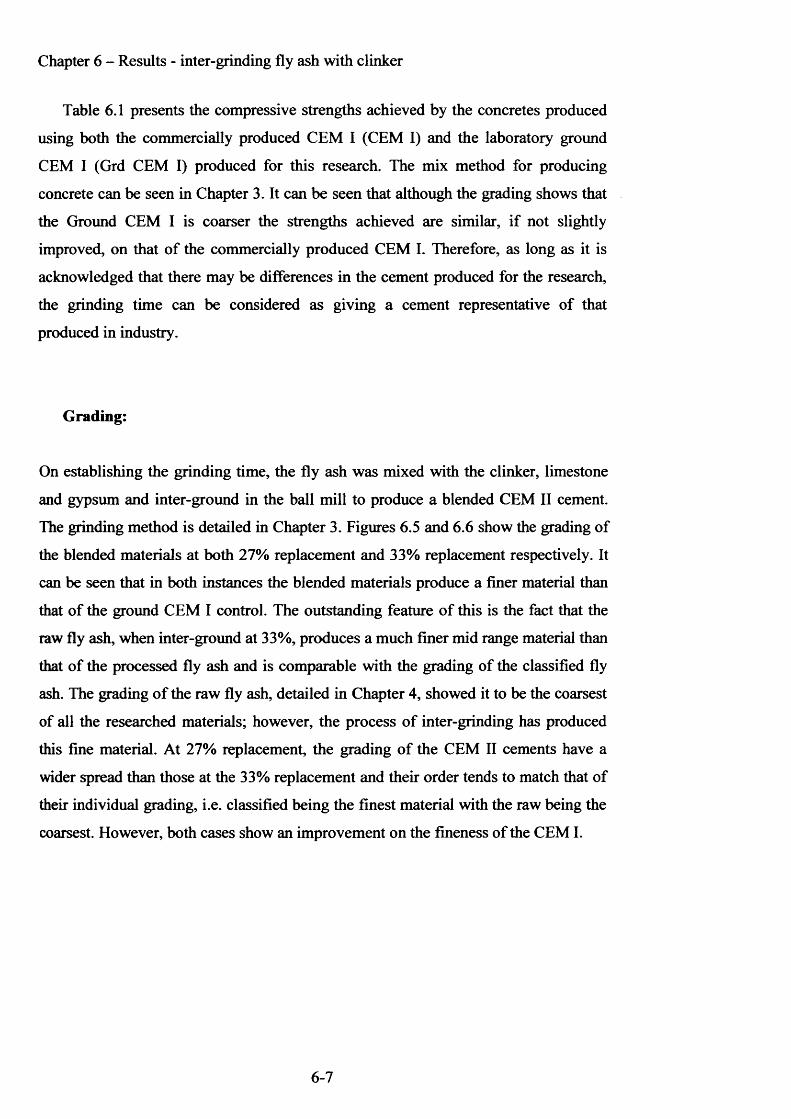
Chapter 6 - Results - inter-grinding fly ash with clinker
Table 6.1 presents the compressive strengths achieved by the concretes produced
using both the commercially produced CEM I (CEM I) and the laboratory ground
CEM I (Grd CEM I) produced for this research. The mix method for producing
concrete can be seen in Chapter 3. It can be seen that although the grading shows that
the Ground CEM I is coarser the strengths achieved are similar, if not slightly
improved, on that of the commercially produced CEM I. Therefore, as long as it is
acknowledged that there may be differences in the cement produced for the research,
the grinding time can be considered as giving a cement representative of that
produced in industry.
Grading:
On establishing the grinding time, the fly ash was mixed with the clinker, limestone
and gypsum and inter-ground in the ball mill to produce a blended CEM II cement.
The grinding method is detailed in Chapter 3. Figures 6.5 and 6 . 6 show the grading of
the blended materials at both 27% replacement and 33% replacement respectively. It
can be seen that in both instances the blended materials produce a finer material than
that of the ground CEM I control. The outstanding feature of this is the fact that the
raw fly ash, when inter-ground at 33%, produces a much finer mid range material than
that of the processed fly ash and is comparable with the grading of the classified fly
ash. The grading o f the raw fly ash, detailed in Chapter 4, showed it to be the coarsest
of all the researched materials; however, the process of inter-grinding has produced
this fine material. At 27% replacement, the grading of the CEM II cements have a
wider spread than those at the 33% replacement and their order tends to match that of
their individual grading, i.e. classified being the finest material with the raw being the
coarsest. However, both cases show an improvement on the fineness of the CEM I.
6-7
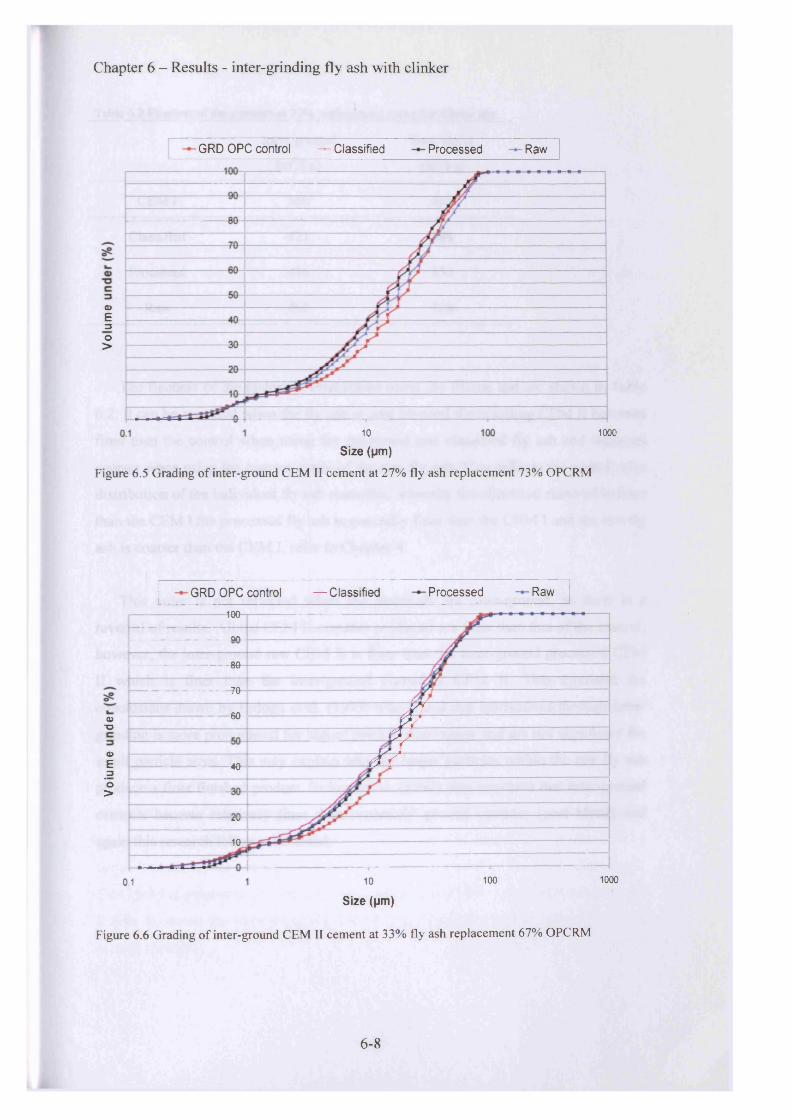
Chapter 6 - Results - inter-grinding fly ash with clinker
GRD OPC control — Classified Processed Raw
0)E3O>
10
Size (pm)
Figure 6.5 Grading of inter-ground CEM II cement at 27% fly ash replacement 73% OPCRM
GRD OPC control — Classified Processed Raw
0)-O
a>E
_ 3O>
100
_______________ Qfi—
__ anou________________________________________________________________________________
7A----------------------------------- TOH
______ fin J1 WM
£ rI______________________________ f j ________ __________________________________________________________ if l AYW 1
i
_______________________ \t £v ]_______ -----------------------------------------------------------------------------------------
1 0 ,r ___________________________ __________________________________________________
I--------------------------------------------------i--------------------------------------------------*-------------------------------------------
0.1 10
Size (pm)
100
Figure 6.6 Grading of inter-ground CEM II cement at 33% fly ash replacement 67% OPCRM
1000
1000
6-8
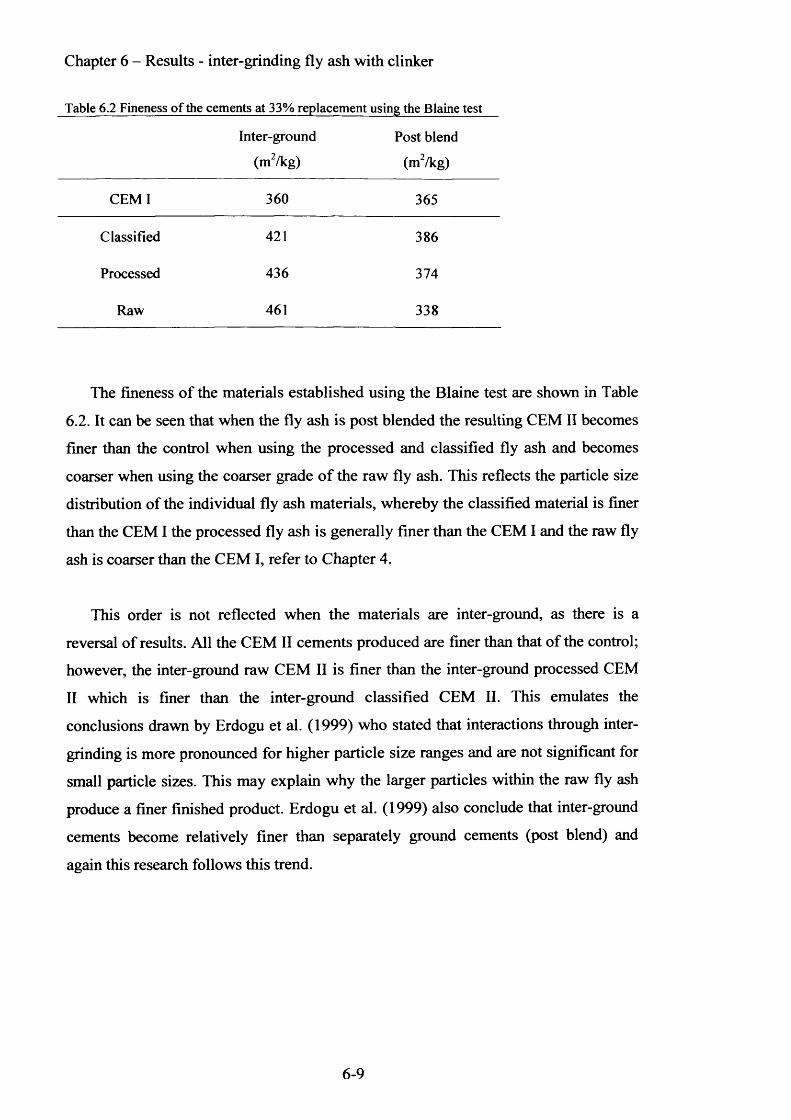
Chapter 6 - Results - inter-grinding fly ash with clinker
Table 6.2 Fineness o f the cements at 33% replacement using the Blaine test
Inter-ground
(m2/kg)Post blend
(m2/kg)
CEM I 360 365
Classified 421 386
Processed 436 374
Raw 461 338
The fineness of the materials established using the Blaine test are shown in Table
6.2. It can be seen that when the fly ash is post blended the resulting CEM II becomes
finer than the control when using the processed and classified fly ash and becomes
coarser when using the coarser grade o f the raw fly ash. This reflects the particle size
distribution of the individual fly ash materials, whereby the classified material is finer
than the CEM I the processed fly ash is generally finer than the CEM I and the raw fly
ash is coarser than the CEM I, refer to Chapter 4.
This order is not reflected when the materials are inter-ground, as there is a
reversal of results. All the CEM II cements produced are finer than that of the control;
however, the inter-ground raw CEM II is finer than the inter-ground processed CEM
II which is finer than the inter-ground classified CEM II. This emulates the
conclusions drawn by Erdogu et al. (1999) who stated that interactions through inter
grinding is more pronounced for higher particle size ranges and are not significant for
small particle sizes. This may explain why the larger particles within the raw fly ash
produce a finer finished product. Erdogu et al. (1999) also conclude that inter-ground
cements become relatively finer than separately ground cements (post blend) and
again this research follows this trend.
6-9
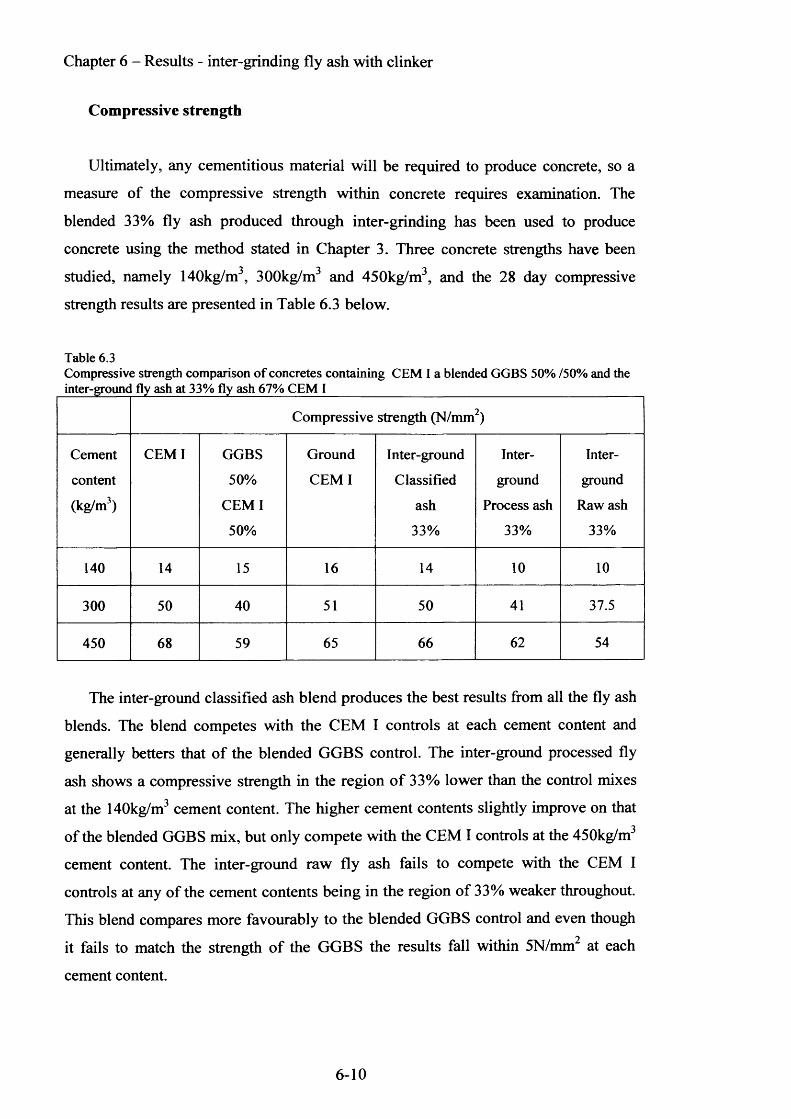
Chapter 6 - Results - inter-grinding fly ash with clinker
Compressive strength
Ultimately, any cementitious material will be required to produce concrete, so a
measure of the compressive strength within concrete requires examination. The
blended 33% fly ash produced through inter-grinding has been used to produce
concrete using the method stated in Chapter 3. Three concrete strengths have been
studied, namely 140kg/m3, 300kg/m3 and 450kg/m3, and the 28 day compressive
strength results are presented in Table 6.3 below.
Table 6.3Compressive strength comparison of concretes containing CEM I a blended GGBS 50% /50% and the inter-ground fly ash at 33% fly ash 67% CEM I______________________________________
Compressive strength (N/mm2)
Cement
content
(kg/m3)
CEM I GGBS
50%
CEM I
50%
Ground
CEM I
Inter-ground
Classified
ash
33%
Inter-
ground
Process ash
33%
Inter
ground
Raw ash
33%
140 14 15 16 14 10 10
300 50 40 51 50 41 37.5
450 68 59 65 66 62 54
The inter-ground classified ash blend produces the best results from all the fly ash
blends. The blend competes with the CEM I controls at each cement content and
generally betters that of the blended GGBS control. The inter-ground processed fly
ash shows a compressive strength in the region o f 33% lower than the control mixes
at the 140kg/m3 cement content. The higher cement contents slightly improve on that
of the blended GGBS mix, but only compete with the CEM I controls at the 450kg/m3
cement content. The inter-ground raw fly ash fails to compete with the CEM I
controls at any of the cement contents being in the region of 33% weaker throughout.
This blend compares more favourably to the blended GGBS control and even though
it fails to match the strength of the GGBS the results fall within 5N/mm2 at each
cement content.
6-10
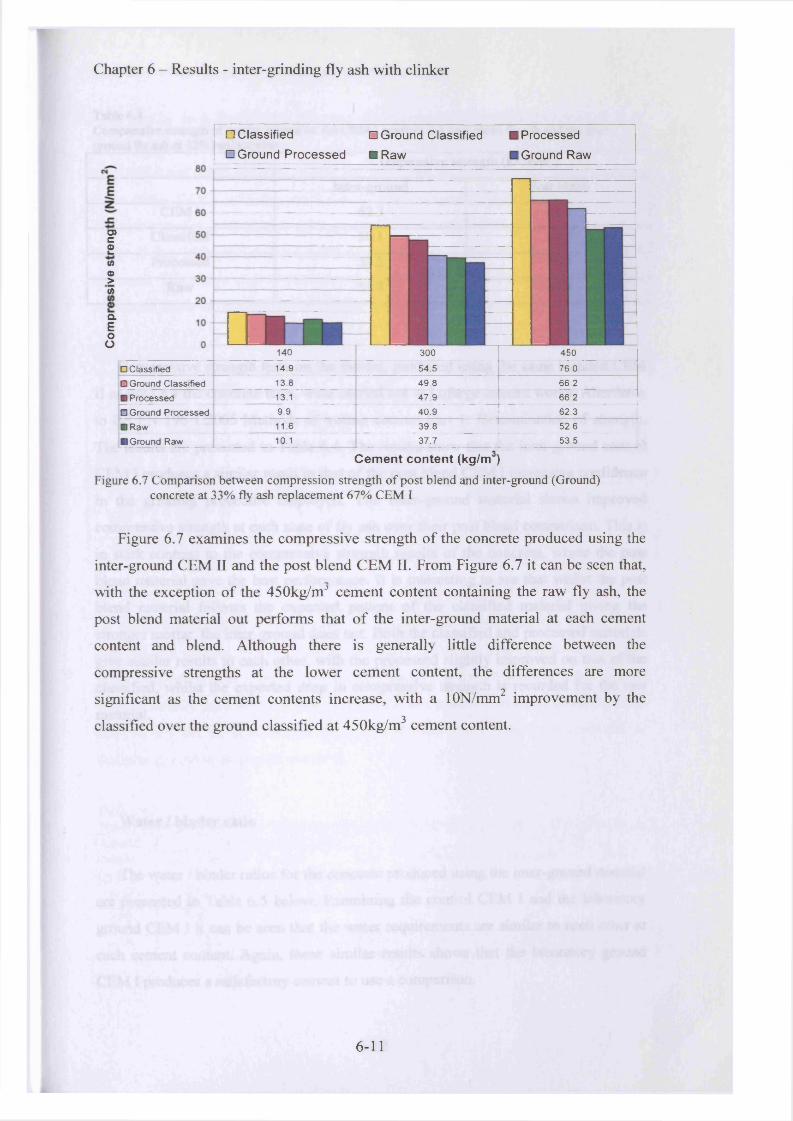
Chapter 6 - Results - inter-grinding fly ash with clinker
o>c£00©>w
a.Eoo
□ Classified
□ Ground Processed□ Ground Classified
■ Raw
I Processed
I Ground Raw
140 300
□ Classified 14.9 54.5
450
76.0□ Ground Classified 13.8 49.8
I Processed 13.1 47.9□ Ground Processed 9.9 40.9
66.266.262.3
I RawI Ground Raw
11.610.1
39.837.7
52.653.5
Cement content (kg/m )
Figure 6.7 Comparison between compression strength of post blend and inter-ground (Ground) concrete at 33% fly ash replacement 67% CEM I
Figure 6.7 examines the compressive strength of the concrete produced using the
inter-ground CEM II and the post blend CEM II. From Figure 6.7 it can be seen that,
with the exception of the 450kg/mJ cement content containing the raw fly ash, the
post blend material out performs that of the inter-ground material at each cement
content and blend. Although there is generally little difference between the
compressive strengths at the lower cement content, the differences are more
significant as the cement contents increase, with a 10N/mm2 improvement by the
classified over the ground classified at 450kg/m3 cement content.
6-11
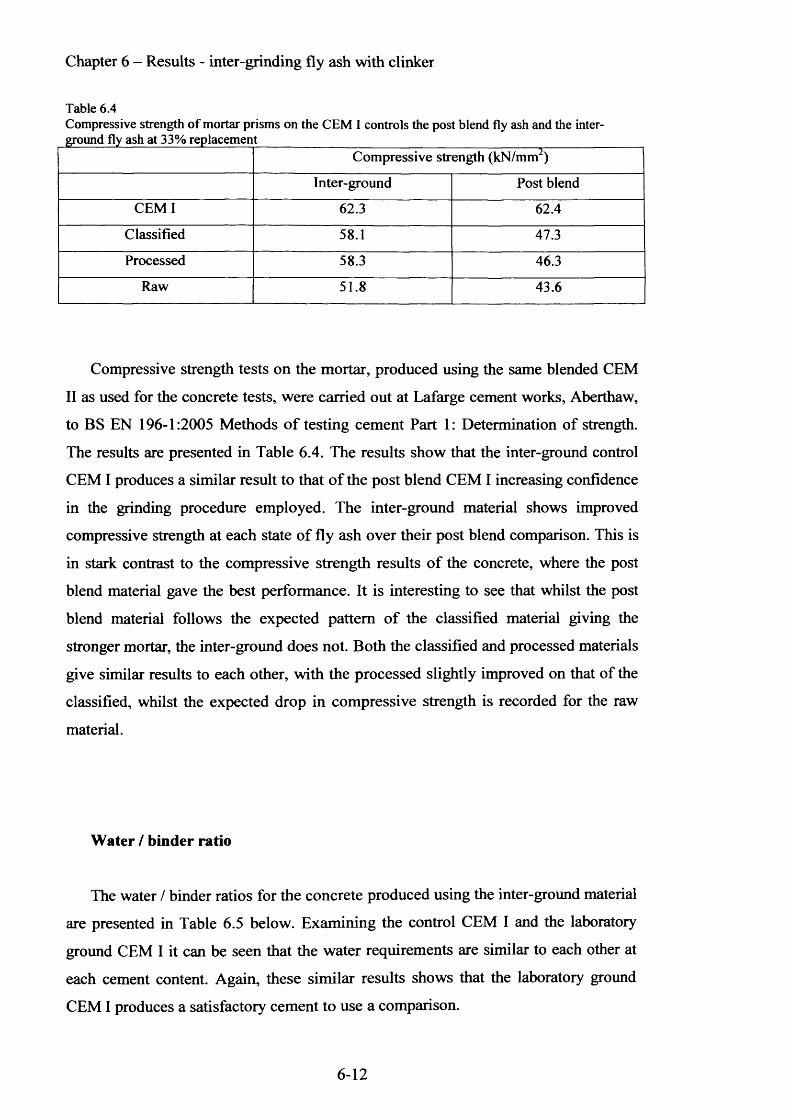
Chapter 6 - Results - inter-grinding fly ash with clinker
Table 6.4Compressive strength of mortar prisms on the CEM I controls the post blend fly ash and the inter-ground fly ash at 33% replacement
Compressive strength (kN/mm2)
Inter-ground Post blend
CEM I 62.3 62.4
Classified 58.1 47.3
Processed 58.3 46.3
Raw 51.8 43.6
Compressive strength tests on the mortar, produced using the same blended CEM
II as used for the concrete tests, were carried out at Lafarge cement works, Aberthaw,
to BS EN 196-1:2005 Methods o f testing cement Part 1: Determination of strength.
The results are presented in Table 6.4. The results show that the inter-ground control
CEM I produces a similar result to that o f the post blend CEM I increasing confidence
in the grinding procedure employed. The inter-ground material shows improved
compressive strength at each state of fly ash over their post blend comparison. This is
in stark contrast to the compressive strength results o f the concrete, where the post
blend material gave the best performance. It is interesting to see that whilst the post
blend material follows the expected pattern of the classified material giving the
stronger mortar, the inter-ground does not. Both the classified and processed materials
give similar results to each other, with the processed slightly improved on that of the
classified, whilst the expected drop in compressive strength is recorded for the raw
material.
Water / binder ratio
The water / binder ratios for the concrete produced using the inter-ground material
are presented in Table 6.5 below. Examining the control CEM I and the laboratory
ground CEM I it can be seen that the water requirements are similar to each other at
each cement content. Again, these similar results shows that the laboratory ground
CEM I produces a satisfactory cement to use a comparison.
6-12
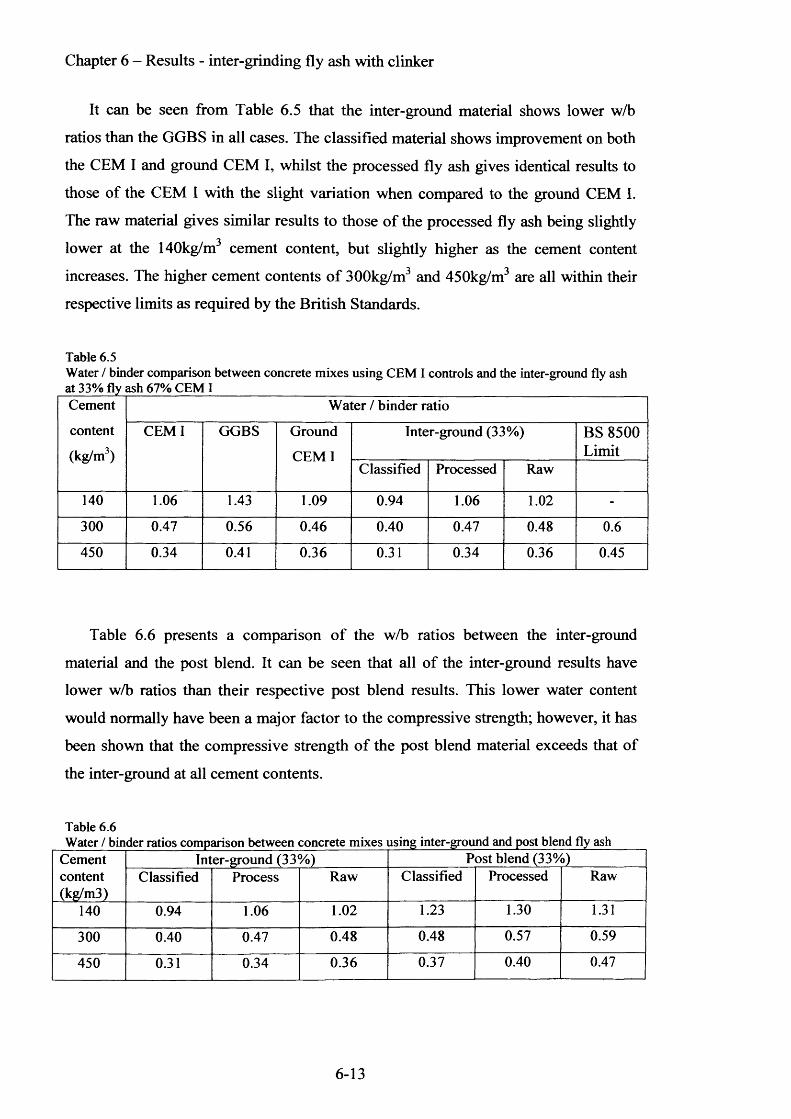
Chapter 6 - Results - inter-grinding fly ash with clinker
It can be seen from Table 6.5 that the inter-ground material shows lower w/b
ratios than the GGBS in all cases. The classified material shows improvement on both
the CEM I and ground CEM I, whilst the processed fly ash gives identical results to
those of the CEM I with the slight variation when compared to the ground CEM I.
The raw material gives similar results to those of the processed fly ash being slightly
lower at the 140kg/m3 cement content, but slightly higher as the cement content
increases. The higher cement contents o f 300kg/m3 and 450kg/m3 are all within their
respective limits as required by the British Standards.
Table 6.5Water / binder comparison between concrete mixes using CEM I controls and the inter-ground fly ash at 33% fly ash 67% CEM I____________________________________________________Cement
content
(kg/m3)
Water / binder ratio
CEM I GGBS Ground
CEM I
Inter-ground (33%) BS 8500 Limit
Classified Processed Raw
140 1.06 1.43 1.09 0.94 1.06 1.02 -
300 0.47 0.56 0.46 0.40 0.47 0.48 0.6
450 0.34 0.41 0.36 0.31 0.34 0.36 0.45
Table 6.6 presents a comparison o f the w/b ratios between the inter-ground
material and the post blend. It can be seen that all o f the inter-ground results have
lower w/b ratios than their respective post blend results. This lower water content
would normally have been a major factor to the compressive strength; however, it has
been shown that the compressive strength o f the post blend material exceeds that of
the inter-ground at all cement contents.
Table 6.6Water / binder ratios comparison between concrete mixes using inter-ground and post blend fly ash
Cementcontent(kg/m3)
Inter-ground (33%) Post blend (33%)Classified Process Raw Classified Processed Raw
140 0.94 1.06 1.02 1.23 1.30 1.31
300 0.40 0.47 0.48 0.48 0.57 0.59
450 0.31 0.34 0.36 0.37 0.40 0.47
6-13
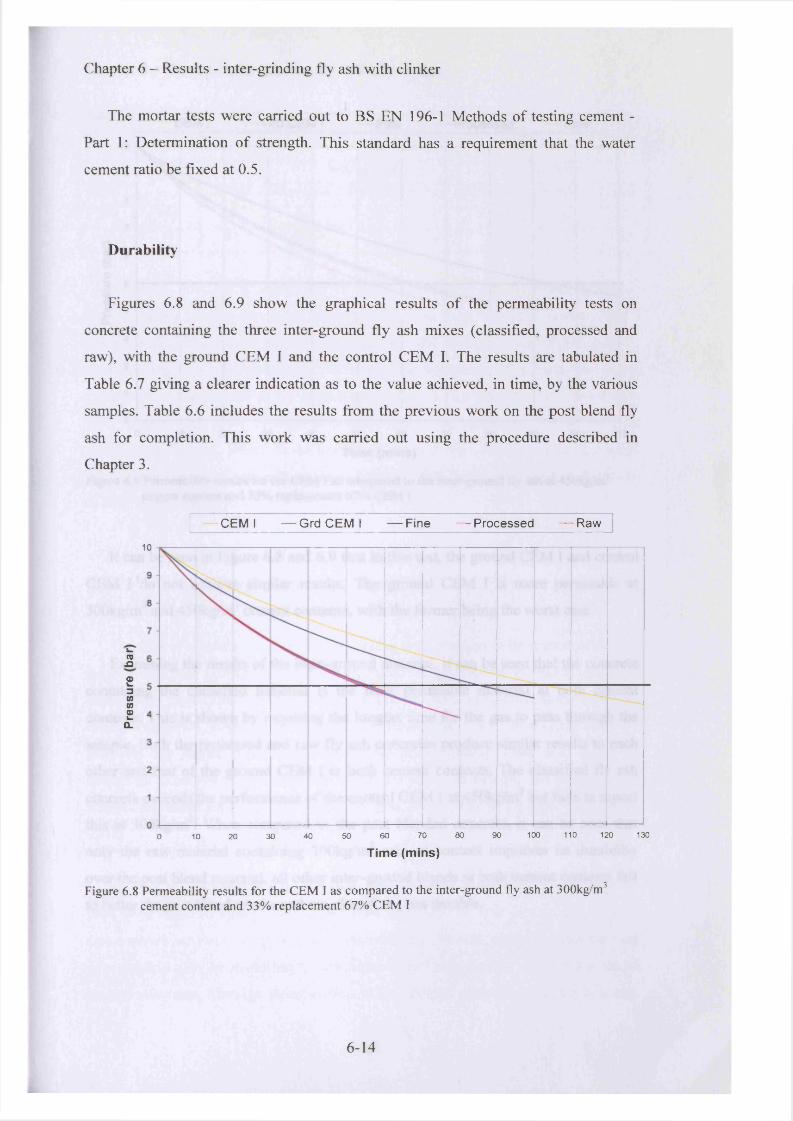
Chapter 6 - Results - inter-grinding fly ash with clinker
The mortar tests were carried out to BS EN 196-1 Methods of testing cement -
Part 1: Determination of strength. This standard has a requirement that the water
cement ratio be fixed at 0.5.
Durability
Figures 6.8 and 6.9 show the graphical results of the permeability tests on
concrete containing the three inter-ground fly ash mixes (classified, processed and
raw), with the ground CEM I and the control CEM I. The results are tabulated in
Table 6.7 giving a clearer indication as to the value achieved, in time, by the various
samples. Table 6.6 includes the results from the previous work on the post blend fly
ash for completion. This work was carried out using the procedure described in
Chapter 3.
CEM I — Grd CEM I — Fine — Processed — Raw
10
k .TO-Q
£3</}W£Q.
90 100 110 120 13060 70 80500 30 4010 20
Tim e (m ins)
Figure 6.8 Permeability results for the CEM I as compared to the inter-ground fly ash at 300kg/m3 cement content and 33% replacement 67% CEM I
6-14

Chapter 6 - Results - inter-grinding fly ash with clinker
CEM I — Grd CEM I — Fine -— Processed — Raw
10
9
8
7
6
5
4
3
2
1
00 10 20 30 40 50 60 70 90 100 11080
Time (mins)
Figure 6.9 Permeability results for the CEM I as compared to the inter-ground fly ash at 450kg/m3 cement content and 33% replacement 67% CEM I
It can be seen in Figure 6.8 and 6.9 that in this test, the ground CEM I and control
CEM I do not achieve similar results. The ground CEM I is more permeable at
300kg/nT and 450kg/m3 cement contents, with the former being the worst case.
Examining the results of the inter-ground material, it can be seen that the concrete
containing the classified material is the least permeable material at both cement
contents. This is shown by requiring the longest time for the gas to pass through the
sample. Both the processed and raw fly ash concretes produce similar results to each
other and that of the ground CEM I at both cement contents. The classified fly ash
concrete exceeds the performance of the control CEM I at 450kg/m3 but fails to repeat
this at 300kg/m3. When compared to the post blended concrete, it can be seen that
only the raw material containing 300kg/m3 cement content improves its durability
over the post blend material, all other inter-ground blends at both cement contents fail
to better the post blend results and are, therefore, less durable.
6-15
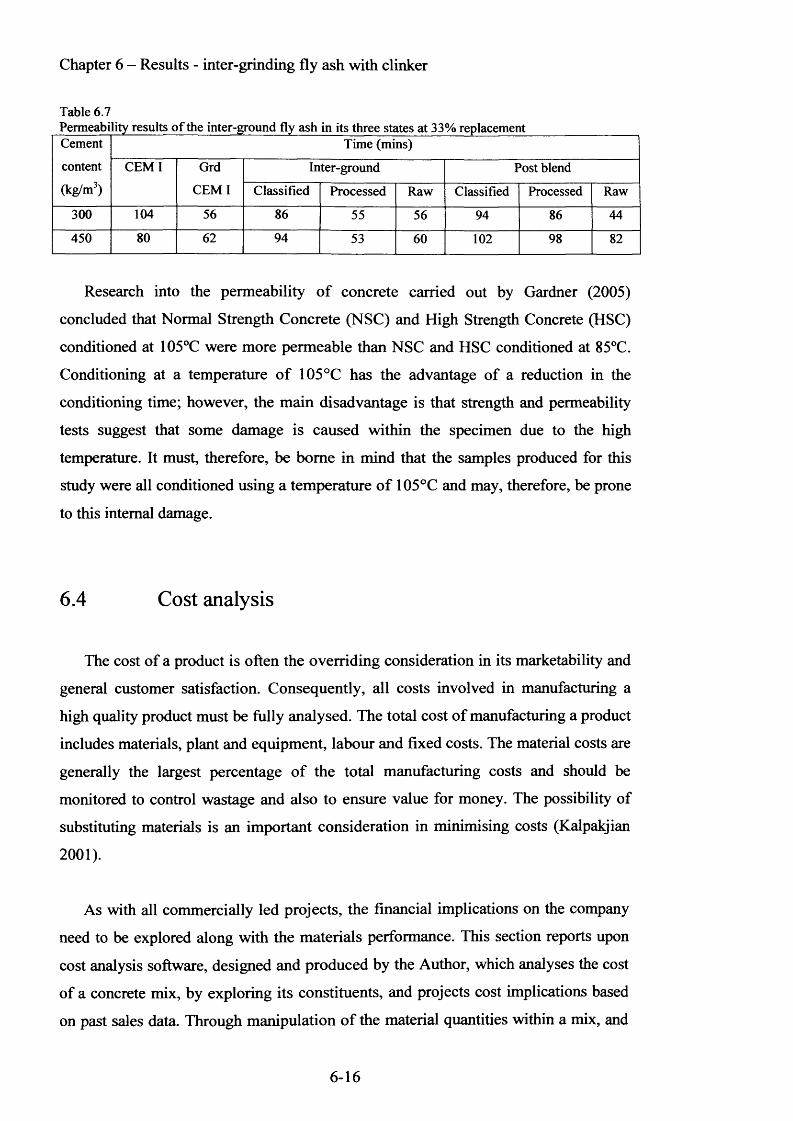
Chapter 6 - Results - inter-grinding fly ash with clinker
Table 6.7Permeability results o f the inter-ground fly ash in its three states at 33% replacementCement
content
(kg/m3)
Time (mins)
CEM I Grd
CEM I
Inter-ground Post blend
Classified Processed Raw Classified Processed Raw
300 104 56 86 55 56 94 86 44
450 80 62 94 53 60 102 98 82
Research into the permeability o f concrete carried out by Gardner (2005)
concluded that Normal Strength Concrete (NSC) and High Strength Concrete (HSC)
conditioned at 105°C were more permeable than NSC and HSC conditioned at 85°C.
Conditioning at a temperature o f 105°C has the advantage of a reduction in the
conditioning time; however, the main disadvantage is that strength and permeability
tests suggest that some damage is caused within the specimen due to the high
temperature. It must, therefore, be borne in mind that the samples produced for this
study were all conditioned using a temperature o f 105°C and may, therefore, be prone
to this internal damage.
6.4 Cost analysis
The cost of a product is often the overriding consideration in its marketability and
general customer satisfaction. Consequently, all costs involved in manufacturing a
high quality product must be fully analysed. The total cost of manufacturing a product
includes materials, plant and equipment, labour and fixed costs. The material costs are
generally the largest percentage o f the total manufacturing costs and should be
monitored to control wastage and also to ensure value for money. The possibility of
substituting materials is an important consideration in minimising costs (Kalpakjian
2001).
As with all commercially led projects, the financial implications on the company
need to be explored along with the materials performance. This section reports upon
cost analysis software, designed and produced by the Author, which analyses the cost
of a concrete mix, by exploring its constituents, and projects cost implications based
on past sales data. Through manipulation o f the material quantities within a mix, and
6-16
Chapter 6 - Results - inter-grinding fly ash with clinker
the costs associated with each material, a decision as to whether a new material
should be implemented within the mix design can be made.
The concept of the model was to allow the investigation of different cost scenarios
within the mix design, and supplier cost range, to predict financial changes associated
with each scenario. For example, if a new supplier, or new material, became available,
the new cost rate for the material can be substituted for the existing rate and the
projected potential savings in cost between the two rates analysed from the previous
twelve months sales.
The Results Summary sheet, which can be viewed in Appendix 4, on the disc and
as a hard copy at the back o f this thesis, collates all the information and presents it on
two pages as a confirmation of input and its associated output. Sheet one presents the
input displayed as input for Mix 1 at the top and Mix 2 below this. This confirms the
costs, the description and the replacement percent of the cement and the replacement
material. The average cost, per cubic metre, of each concrete designation is displayed
enabling the differences to be viewed. The total saving for each of these designations
is then presented as a breakdown o f concrete categories and total.
Sheet two breaks the results down further identifying the savings to be made from
each individual mix design. These costs are based on past sales; therefore, showing
the potential available if the material had been introduced into production twelve
months earlier. The cement addition column tells you if additional cement has been
added, possibly to make up the strengths if the performance of a particular cement
replacement is not quite good enough. The next column shows the cost difference
from the perspective of mix 2, as this would be the comparative mix. The best
combination is then shown with the material producing the more cost effective mix
identified in the last column. If the mix 1 material produces the more cost effective
mix then the best combination column becomes zero as no benefit has been gained
and the variance from mix 2 becomes a negative value as by its introduction a loss
would be made from incorporating this material into these mix designs. The material
column has been introduced so as to help recognise those mix designs into which the
company will benefit from the introduction o f the new cement replacement.
6-17

Chapter 6 - Results - inter-grinding fly ash with clinker
This model is by no means the completed article as the final user will no doubt
have thoughts on its progression and continual improvement. At this point the model
serves its purpose and achieves what is required for this research.
A copy of the model and user manual can be found in Appendices 3 on the disc
accompanying this Thesis.
6-18
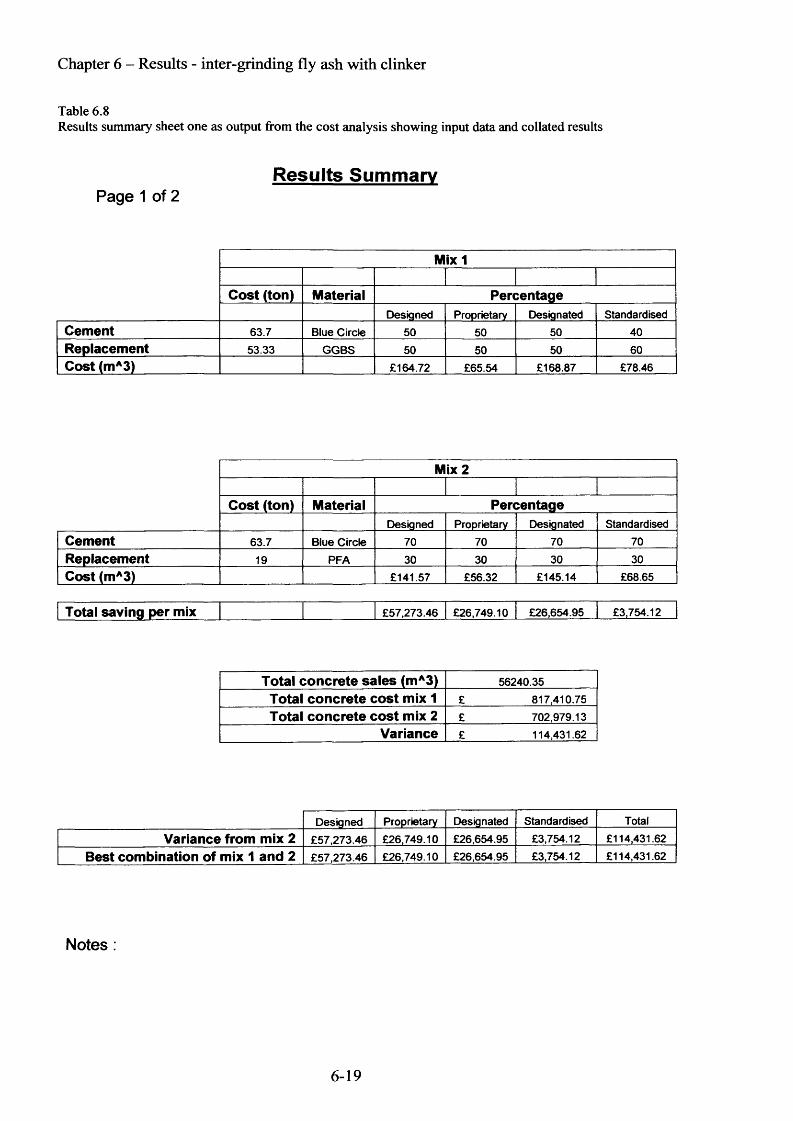
Chapter 6 - Results - inter-grinding fly ash with clinker
Table 6.8Results summary sheet one as output from the cost analysis showing input data and collated results
Results SummaryPage 1 of 2
Mix 1
Cost (ton) Material PercentageDesigned Proprietary Designated Standardised
Cement 63.7 Blue Circle 50 50 50 40Replacement 53.33 GGBS 50 50 50 60Cost (mA3) £164.72 £65.54 £168.87 £78.46
Mix 2
Cost (ton) Material PercentageDesigned Proprietary Designated Standardised
Cement 63.7 Blue Circle 70 70 70 70Replacement 19 PFA 30 30 30 30Cost (mA3) £141.57 £56.32 £145.14 £68.65
Total saving per mix £57,273.46 £26,749.10 £26,654.95 £3,754.12
Total concrete sales (mA3) 56240.35Total concrete cost mix 1 £ 817,410.75Total concrete cost mix 2 £ 702,979.13
Variance £ 114,431.62
Designed Proprietary Designated Standardised TotalVariance from mix 2 £57,273.46 £26,749.10 £26,654.95 £3,754.12 £114,431.62
Best combination of mix 1 and 2 £57,273.46 £26,749.10 £26,654.95 £3,754.12 £114,431.62
Notes :
6-19
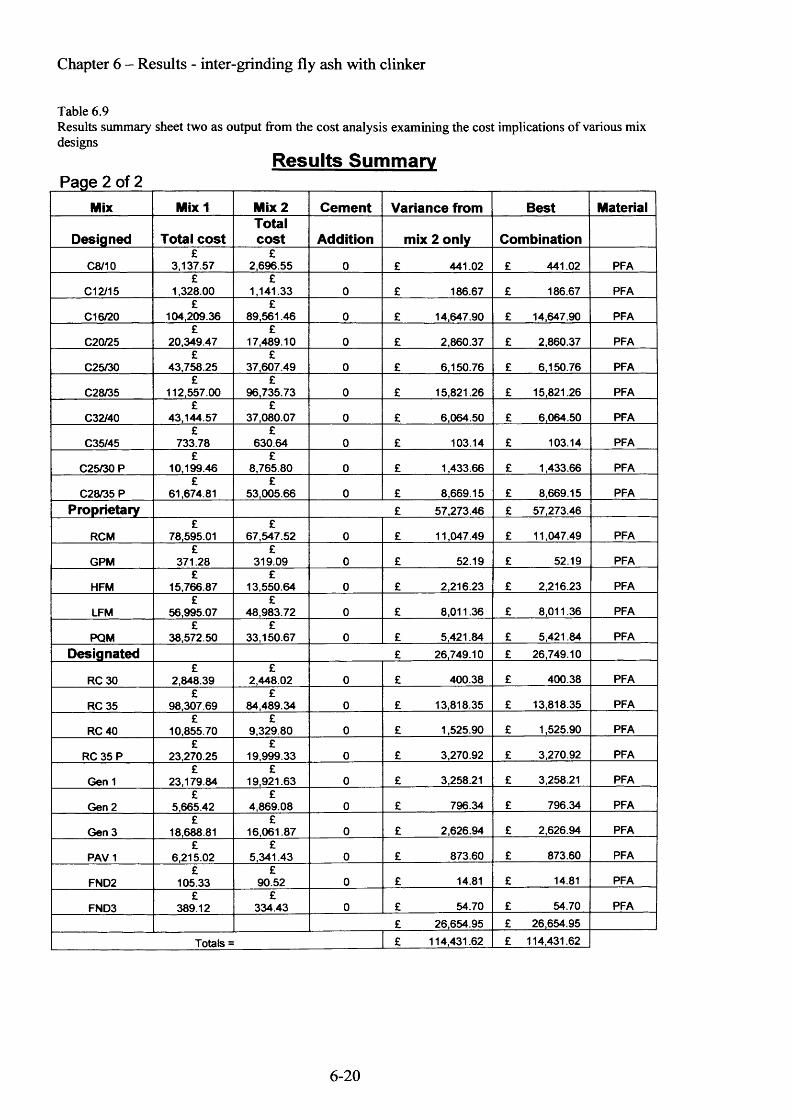
Chapter 6 - Results - inter-grinding fly ash with clinker
Table 6.9Results summary sheet two as output from the cost analysis examining the cost implications of various mix designs
Results SummaryPage 2 of 2 _________________ ______________
Mix Mix 1 Mix 2 Cement Variance from Best MaterialTotal
Designed Total cost cost Addition mix 2 only Combination£ £
C8/10 3,137.57 2,696.55 0 £ 441.02 £ 441.02 PFA£ £
C12/15 1,328.00 1,141.33 0 £ 186.67 £ 186.67 PFA£ £
C16/20 104,209.36 89,561.46 0 £ 14,647.90 £ 14,647.90 PFA£ £
C20/25 20,349.47 17,489.10 0 £ 2,860.37 £ 2,860.37 PFA£ £
C25/30 43,758.25 37,607.49 0 £ 6,150.76 £ 6,150.76 PFA£ £
C28/35 112,557.00 96,735.73 0 £ 15,821.26 £ 15,821.26 PFA£ £
C32/40 43,144.57 37,080.07 0 £ 6,064.50 £ 6,064.50 PFA£ £
C35/45 733.78 630.64 0 £ 103.14 £ 103.14 PFA£ £
C25/30 P 10,199.46 8,765.80 0 £ 1,433.66 £ 1,433.66 PFA£ £
C28/35 P 61,674.81 53,005.66 0 £ 8,669.15 £ 8,669.15 PFAProprietary £ 57,273.46 £ 57,273.46
£ £RCM 78,595.01 67,547.52 0 £ 11,047.49 £ 11,047.49 PFA
£ £GPM 371.28 319.09 0 £ 52.19 £ 52.19 PFA
£ £HFM 15,766.87 13,550.64 0 £ 2,216.23 £ 2,216.23 PFA
£ £LFM 56,995.07 48,983.72 0 £ 8,011.36 £ 8,011.36 PFA
£ £PQM 38,572.50 33,150.67 0 £ 5,421.84 £ 5,421.84 PFA
Designated £ 26,749.10 £ 26,749.10£ £
RC 30 2,848.39 2,448.02 0 £ 400.38 £ 400.38 PFA£ £
RC 35 98,307.69 84,489.34 0 £ 13,818.35 £ 13,818.35 PFA£ £
RC 40 10,855.70 9,329.80 0 £ 1,525.90 £ 1,525.90 PFA£ £
RC 35 P 23,270.25 19,999.33 0 £ 3,270.92 £ 3,270.92 PFA£ £
Gen 1 23,179.84 19,921.63 0 £ 3,258.21 £ 3,258.21 PFA£ £
Gen 2 5,665.42 4,869.08 0 £ 796.34 £ 796.34 PFA£ £
Gen 3 18,688.81 16,061.87 0 £ 2,626.94 £ 2,626.94 PFA£ £
PAV 1 6,215.02 5,341.43 0 £ 873.60 £ 873.60 PFA£ £
FND2 105.33 90.52 0 £ 14.81 £ 14.81 PFA£ £
FND3 389.12 334.43 0 £ 54.70 £ 54.70 PFA£ 26,654.95 £ 26,654.95
Totals = £ 114,431.62 £ 114,431.62
6-20
Chapter 6 - Results - inter-grinding fly ash with clinker
6.5 Conclusions
From the work carried out in this Chapter the conclusions are:
o It is possible to reproduce CEM I using a ball grinder in a laboratory which
reflects the properties and characteristics of a CEM I produced in industry
o Inter-grinding fly ash with the raw materials required to make a CEM I
material increases the fineness of the finished product when ground for the
same period o f time. To produce a similar fineness to the CEM I would
necessitate a reduction in the grinding time which would provide time and
cost benefits
o Inter-grinding fly ash with the raw materials required to make a CEM I
material has no benefit over a similar post blend fly ash mix with respect
to compressive strength.
o Mortar benefits from increased compressive strength when the fly ash is
inter-ground
6-21
Chapter 7 - Conclusions and recommendations
7. Conclusions andRecommendations
7.1 Conclusions
7.2 Recommendations for further study
7.1 Conclusions
The conclusions established from this thesis which looks to advance the
understanding and use o f waste materials as cement replacements within concrete are
summarised below:
o Applying the STi process to the fly ash is a quick and easy method of
lowering the carbon content within the ash producing a material which
satisfies both British and European standards. Utilising this process has
produced a usable fly ash which, when blended at 33% fly ash to 67%
OPC, has shown a concrete compressive strength improvement over that
of the industry standard 50% GGBS blended with 50%OPC.
o Reducing the particle size o f the fly ash further through classification
provides additional compressive strength benefits to the concrete
containing the CEM II cement.
o Some indication as to whether an unknown material will work as a cement
replacement can be gained from the analysis performed within this thesis.
Materials can be judged on their suitability to perform as cement
replacement materials through the analysis of certain material properties.
These properties have been established through the work on the processed
fly ash. The measured properties are the chemical constituents,
concentrating mainly on Si02, AEC^ CaO and Fe2 0 3 , and the acceptable
7-1
Chapter 7 - Conclusions and recommendations
ranges o f a candidate material have been presented. Loss on ignition as
required by the British and European standards is to be below 7%, whilst
the material fineness is required to match that of the OPC.
o It is possible to reproduce CEM I using a ball grinder in a laboratory which
accurately reflects the properties and characteristics o f a CEM I produced
in industry. Whilst inter-grinding fly ash with the raw materials required to
make a CEM I an increase in material fineness, of the final CEM II, was
observed this provides economic advantages to the cement manufacture
industry. However, the inter-grinding o f fly ash in this way has no benefit,
when mixed as concrete, over a similar post blend fly ash mix with respect
to compressive strength. This was found not to be the case with the
compressive strength o f mortar, however, as there is benefit from
increased compressive strength when the fly ash is inter-ground.
7.2 Recommendations for further study
This research is viewed as a first step into producing a workable specification for
the requirements of a cement replacement material. Further work required to progress
this research further is discussed below:
o It is well known in the cement and concrete industry that laboratory trials
are the results o f idealised circumstances and generally do not reflect
exactly that which happens in industry. Therefore, full scale plant trials
should be initiated using various mix designs to assess a more realistic
performance o f the materials being trialled.
o Fly ash and GGBS are just two materials that industry has accepted for use
as a cement replacement. It has been shown that the properties of these two
materials vary considerable yet both contribute to, and improve, cement
properties. Other established materials, such as metakaolin and silica fume,
7-2
Chapter 7 - Conclusions and recommendations
should be examined and their attributes documented alongside the findings
of this research. This could offer a further dimension to the properties of a
cement replacement or improve the requirements already highlighted.
Further work needs to be done to examine the variables documented and
judge them against other accepted cement replacement materials.
o The Industrial mix (IM) was included in this research as it had compared
favourably with CEM I when tested as a mortar. As a concrete, the
material failed to produce comparable compressive strength results to the
controls and, therefore, is not suitable as a cement replacement in its
present form. The analysis identified that the elemental make up of the
material did not match any o f the suggested forms. If this matter is
addressed, the resulting blended material produced may show enhanced
performance becoming a functional material.
7-3
8. References
8.1 References
8.2 World wide web references
8.3 British and European standards
8.1 References
1999/31/EC, 1999. Council directive 1999/31/EC of 26th April 1999 on the landfill of
waste. Downloaded from:
(http://eur-lex.europa.eu/RECH_menu.do) Accessed 23rd July 2006
Abe, S. Kambayashi, F. and Okada, M. 1996. “Ash melting treatment by rotating type
surface melting furnace” Waste Management, Vol. 16, Nos 5/6, pp. 431-443,
ACI committee 226, 1987. “Use of fly ash in concrete” Committee report ACI 226.3R-87
ACI Materials Journal September - October pp 381 - 409
Aitcin, P.C. 2000. “Cements of yesterday and today concrete of tomorrow” Cement and
Concrete Research Vol. 30 pp 1349-1359
Anon. 2003. “Avoidance of waste: Beneficial use of industrial by-products as
constituents of concrete”. Concrete, volume 37 Issue 5 pp 43-45
Anon 2007. “Electrabel plans 5 new euro power stations” and “BP, Rio Tinto plan clean
coal project for Australia” Pump Industry Analyst Journal May 2007.
8-1
Atis, C.D. 2005. “Strength properties of high-volume fly ash roller compacted and
workable concrete, and influence of curing condition” Cement and Concrete Research
Vol 35 pp 1112-1121
Babu, K.G. and Kumar, V.S.R 2000. “Efficiency of GGBS in concrete” Cement and
Concrete Research, volume 30 Issue 7 pp 1031-1036
Bai, Y. Darcy, F. and Basheer, P.A.M. 2005. “Strength and drying shrinkage properties
of concrete containing furnace bottom ash as fine aggregate” Construction and Building
Materials Vol 19, pp 691-697
Balendran R.V. and Pang H.W. 1995. “Strength development, deformation properties and
mix design of pulverized fuel ash concrete” Structural Survey Vol. 13 No. 1 pp. 711
Bartos, P.J.M. Sonebi, M. and Tamimi A.K. 2002. “Workability and Rheology of Fresh
Concrete: Compendium of Tests” Report of RILEM Technical Committee TC 145-
WSM, Workability of Special Concrete Mixes, RILEM Publications S.A.R.L., Cachan
Cedex, France.
BCA 1991. “Admixtures for concrete” British Cement Association publications,
Berkshire.
BCA 2000a. “Specifying constituent materials for concrete to BS EN 206-1/ BS 8500:
Admixtures” British Cement Association publications, Berkshire.
BCA. 2000b. “New Euro-cements - Information sheet number 1”. British Cement
Association publications, Berkshire.
BCA, 2005. “Working toward sustainability”, Downloaded from:
(http://www.cementindustry.co.uk) Accessed 13th May 2006.
8- 2
Bekir, I. Toprak, M. U. Bilir, T. 2007. “Determination of optimum fly ash usage amount
in concrete” Conference paper, “22nd International Conference on Solid Waste
Technology and Management”, Philadelphia, PA U.S.A., March 19-21, 2007, pp 942-
949.
Bertrandy, R.and Poitevin, P. 1999. “Limestone filler for concrete, French research and
Practice”. Proceedings o f International Conference on Blended Cements in
Construction; Swamy, R.N., Ed.; Sheffield, pp 16-31.
Bonavetti, V. Donza, H. Rahhal, V. and Irassar, E. 2000. “Influence of initial curing on
the properties of concrete containing limestone blended cement” Cement and Concrete
Research Vol.30 pp 703-708
Bonavetti, V. Donza, H. and Menendez, G. Cabrera, O. and Irassar E.F. 2003.
“Limestone filler cement in low w/c concrete: A rational use of energy” Cement and
Concrete Research Vol. 33 pp 865-871
Boss, C.B. Fredeen, K.J. 2004 “Concepts, instrumentation and techniques in inductively
coupled plasma optical emission spectrometry” PerkinElmer, USA 3rd Edition.
Bouzoubaa, M.H. 1997. “The effect of grinding on the physical properties of fly ashes
and a Portland cement clinker.” Cement and concrete research. Vol. 27, No. 12, pp 1861-
1874.
Bouzoubaa, N. Zhang, M.H. Biloudeau, A. Malhotra, V.M. 1998. “Laboratory-
Produced high volume fly ash blended cements: Physical properties and compressive
strength of mortars”. Cement and Concrete. Research. Volume 28, No.l 1, pp 1555-1569.
BRE. 1987. “Pulverised fuel ash - its use in concrete Part 2. Influences on durability”,
Information paper 12/87
8 -3
BRE. 1997. “Design of normal concrete mixes”, Construction research Communications
LTD. 2nd Edition
Bre, 2007, “Environmental impact of construction” Downloaded from:
(http://envestv2. bre. co.uk/demo/environmental.impact.html) Accessed 24/10/07
British Cement Association, 2005. “Working toward sustainability”, Downloaded from:
(http://www.cementindustry.co.uk) Accessed 13th May 2006.
Buenfeld, N.R. and Okundi, E. 1998. “Effect of cement content on transport in concrete”
Magazine of Concrete Research Vol. 50 No.4 pp 339-351
Buia, V.K. Montgomeryb, D. Hinczakc, I. and Tumerc K. 2002. “Rapid testing method
for segregation resistance of self-compacting concrete” Cement and Concrete Research
Vol. 32 pp 1489-1496
Bullard, J.W. Garboczi, E.J. 2006. “A model investigation of the influence of particle
shape on portland cement hydration” Cement and Concrete Research Vol. 36
pp 1007-1015
Burridge, J. 2008. “Concrete and sustainable construction” Presentation given at Cardiff
University by the Concrete Centre. 10th January 2008
Cembureau 1999. ’’Environmental Benefits of Using Alternative Fuels in Cement
Production - a life-cycle approach”. Downloaded from:
http://www.cembureau.be/Documents/Publications/Env_Benefits_of_using_Altemative_
Fuels_in_cement_Production_Life_Cycle_Approach_CEMBUREAU_Brochure.pdf
Accessed 15th February 2008
Chindaprasirta, P. Homwuttiwongb, S. Sirivivatnanon V. 2004. “Influence of fly ash
fineness on strength, drying shrinkage and sulfate resistance of blended cement mortar”
Cement and Concrete Research Vol.34 pp 1087-1092
8 -4
Chindaprasirta, P. Jaturapitakkul, C. Sinsiri, T. 2005 “Effect of fly ash fineness on
compressive strength and pore size of blended cement paste” Cement & Concrete
Composites 27 pp 425-428
Churcill, V.E. and Amirkhanian, S.N. 1999. “Coal ash utilization in asphalt concrete
mixtures”. Journal of Materials in Civil Engineering Vol 11 No. 4, pp 295-297.
Collins, D. 2003 “Sustainable development progress cement and concrete British Cement
Association and University of Surrey” Proceedings o f the Institution of Civil Engineers
Engineering Sustainability 156 June Issue ES2 Pages 75-77 Paper 13345
Deffa. 2006.”Emissions trading schemes”. Accessed 5th June
Concrete centre, 2007, “Sustainable concrete” Downloaded from:
(http://www. concrete centre, com/main) Accessed 25th September 2007
Concrete Society, 1991. “The Use of GGBS and PFA in Concrete”, Technical Report No.
40, Concrete Society, Slough, Cited in Balendran R.V. and Pang H.W. 1995
Concrete Society Working party, 1999. “The influence of cement content on the
performance of concrete” CS 125, U.K. Concrete Society publications.
Corish, A.T. Jackson, P.J. 1982. “Portland cement properties - past and present” Concrete
Volume 16, No.7 pp 25 - 28
Corish, A.T. 1985. “Portland cements” Concrete Society current practice sheet No. 101
Davies, L.J. 2003. “Strength and environmental considerations when using industrial by
products as partial cement replacements”. M.Phil Thesis Cardiff University.
8 -5
Davraz M. L. and Gunduz T. 2005. “Engineering properties of amorphous silica as a new
natural pozzolan for use in concrete” Cement and Concrete Research Vol. 35 pp 1251—
1261
Deffa 2007. “Emissions trading schemes” Downloaded from:
(http://www.defra.gov.uk/environment/ccl/intro.html) Accessed 5th June 2006.
del Viso, J.R Carmona, J.R. Ruiz, G. 2007. “Shape and size effects on the compressive
strength of high-strength concrete” Cement and Concrete Research, article in press.
Dhir, R.K. Munday, J.G.L. and Ong, L.T. 1981. “Strength variability of OPC/PFA
concrete” Concrete June pp 33 - 36
Dhir, R.K. Jones, M.R. Munday, J.G.L. and Hubbards, F.H. 1985. “Physical
characterisation of UK pulverised fuel ashes for use in concrete” Magazine of Concrete
Research Vol. 37 No. 131 pp 75 -87
Dhir, R.K. 1986. “Pulverised-fuel ash", in Swamy, R.N. (Eds),Concrete Technology and
Design, Cement Replacement Materials, Surrey University Press, London, Vol. 33
pp. 197-255.
Dhir, R.K. El-Mohr M.A.K. and Dyer T.D 1996. “Chloride binding in GGBS concrete”
Cement and Concrete Research, Vol. 26, No. 12, pp. 1767-1773
Dhir RK, et al 1999. “Suitability of recycled concrete aggregate for use in BS 5328
designated mixes.” Structural Building Vol 134 No.4 pp 257-74
Dix, A. et al. 2004. “Human computer interaction”. 3rd Edition, Pearson Education Ltd.
Domone, P.L. 2003. “Fresh concrete” in: Newman, J and Choo,B.S. “Advanced concrete
technology - Concrete properties” Elsevier, Oxford, U.K. 2003 pp 1/3 — 1/29
8- 6
Dransfield, J. 2005. “Admixtures for concrete, mortar and grout” in: Newman,J. and
Choo,B.S. “Advanced Concrete Technology - Constituent materials” London, Elsevier,
2005 pp 4 /3 -4 /36
Dransfield, J. 2006. “Admixture current practice-Part 2 (Back to basics)” Current practice
sheet No. 149, Concrete, November 2006 pp 57 - 59
Dutron P. 1987. “The Cembureau coOoperative programme on permeability
measurements for concrete, Pore structure and construction materials properties” RILEM
Congress, J.C. Maso (Ed), Chapman Hall Vol. 1 pp 41-48
ECOBA, 2003. “European Association for Use of the By-Products of Coal Fired
Power Stations Report 2003”, http://www.ecoba.com - Accessed 20th January 2008
Elsen, J. 2006. “Microscopy of historic mortars—a review” Cement and Concrete
Research. Vol. 36 issue 8 August pp 1416-1424
Elkhadiria, I. Diouria, A. Boukharia, A. Arideb, J. Puertas F. 2002. “Mechanical
behaviour of various mortars made by combined fly ash and limestone in Moroccan
Portland cement” Cement and Concrete Research Volume 32 pp 1597-1603
Elsen, J. 2006. “Microscopy of historic mortars - A review” Cement and concrete
research Volume 36 pp 1416 - 1424
Environment Agency 1996. “IPC Guidance Note Series 2 (S2) Mineral Industry Sector
S2 3.01 Cement Manufacture, Lime Manufacture and Associated Processes - Processes
Subject to Integrated Pollution Control; IPC Guidance Note Series 2 (S2) Mineral
Industry Sector” HMSO, UK
8 -7
Environment Agency 2007. “Environmental facts and figures” Downloaded from:
(http://www.environmentagency.gov.uk/yourenv/effrl 190084/resources_waste/213982/1
52399/?version=l&lang=_e) Accessed 1st October 2007.
Environmental working party, 2003,”Avoidance of waste: beneficial use of industrial by
products as constituents of concrete” Concrete, Volume. 37, No5, pp 43-45
Erdogdu K. and Turker P. 1998. “Effects of fly ash particle size on strength of Portland
cement fly ash mortars” Cement and Concrete Research, Volume 28, No. 9, pp. 1217—
1222
Erdogdu, K.Tokyay M. Turker P. 1999. “Comparison of intergrinding and separate
grinding for the production of natural pozzolan and GBFS-incorporated blended
cements” Cement and Concrete Research Volume 29 pp 743-746
Erdogdu, S. 2000. “Compatibility of superplasticizers with cements different in
composition” Cement and Concrete Research Volume 30 pp 767-773
Escalante-Garcia J.I. and Sharp J.H. 2001. “The microstructure and mechanical
properties of blended cements hydrated at various temperatures”. Cement and Concrete
Research Volume 31 pp 695-702
Escalante, J.I. Go'mez, L.Y. Johal, K.K. Mendoza, G. Mancha, H. and Me'ndez J. 2001.
“Reactivity of blast-furnace slag in Portland cement blends hydrated under different
conditions” Cement and Concrete Research Volume 31 No. 10, pp 1403-1409
Evangelista, L. and de Brito J. 2007. “Mechanical behaviour of concrete made with
fine recycled concrete aggregates” Cement & Concrete Composites Volume 29 pp 397-
401
8- 8
Finlay, P. 2000. “Strategic management - An introduction to business and corporate
management strategy”. Pearson Education Ltd.
Frias M. Sanchez de Rojas M.I. and Cabrera J. 2000. “The effect that the pozzolanic
reaction of metakaolin has on the heat evolution in metakaolin-cement mortars”. Cement
and Concrete Research Volume 30 pp 209-216
Gardner, D.R 2002. “The Permeability o f Varying Strengths of Concrete”
MEng Project, University o f Wales, Cardiff,
Gardner, D.R 2005. “Experimental and numerical studies of the permeability of concrete”
PhD Thesis, Cardiff University.
Gaudin, A.M. 1939. “Principles o f mineral dressing”, McGraw-Hill New York and
London 1st Edition
Ghafoori, N. Kassel, S. 1999. “Properties of Portland cement mortars containing FBC fly
ash” in: Dhir, R. K. and Jappy, T.G “Exploiting wastes in concrete” Thomas Telford,
U.K. 1999 pp 291-298
Gonen, T. and Yazicioglu, S. 2007. “The influence of compaction pores on sorptivity and
carbonation of concrete” Construction and Building Materials No.21 pp 1040-1045
Grantham, M. 2003. “Diagnosis, inspection, testing and repair of reinforced concrete
structures” in: Newman, J and Choo,B.S. “Advanced concrete technology - Testing and
quality” Elsevier, Oxford, U.K. 2003 pp 6/1 - 6/54
Griesser, A. et al 2005. “Influence o f different super-plasticisers on the Rheological
properties of mortars” in: Dhir,R.K. HewIett,P.C. and Newlands,M.D. “Admixtures-
Enhancing concrete performance” London, Thomas Telford, 2005 pp 141 - 148
8 -9
Grube, H. and Lawrence, C.D. 1984. “Permeability of concrete to oxygen” RILEM
seminar on the durability of concrete structures under normal outdoor exposure. Hanover
26-28 March. Cement and Concrete Association paper pp 68-79
Ha, T. Muralidharan, S. Bae, J. Ha, Y. Lee, H. Park, K.W. and Kim, W.D. 2005. “Effect
of unbumt carbon on the corrosion performance of fly ash cement mortar” Construction
and Building Materials Vol. 19 pp 509-515
Hanehara S. and Yamada K. 1999. “Interaction between cement and chemical admixture
from the point of cement hydration, absorption behaviour of admixture, and paste
rheology” Cement and Concrete Research 29, pp 1159-1165
Harris, D. J. 1999 “A quantitative approach to the assessment of the environmental
impact of building materials” Building and Environment Vol 34 pp 751-758
Harrison, J. 2005. “The role of concrete post Kyoto: The unrecognized sequestration
solution?” in: Dhir,R.K. Dyer,T.D. and Newlands,M.D. “Achieving sustainability in
construction” London, Thomas Telford, 2005 pp 427 - 438
Hendricks, C.A. et al. 2004. “Emission reduction of Greenhouse gases from the cement
industry”. Proceedings, conference on greenhouse gas control technologies. 23rd August.
Hewlett, P.C. Edmeades, R.W. Holdsworth,R.L. 1977. “Intedral waterproofers for concrete”
within “Concrete admixtures: Use and applications” Published by The Construction Press,
London pp 55 - 66
Hewlett, P.C. 1998 “Lea’s chemistry of cement and concrete” Elsevier Ltd 4th Edition
Highley, D.E. 2005. “The role of imports to UK aggregates supply” British geological
survey commissioned report. Crown copyright HMSO UK
8-10

Hime, W. Erlin, B. 2004 “The many faces of ettringite: an astonishing concrete
component” Concrete construction, September. Accessed on line November 23rd 2010
“http ://findarticles.com/p/articles/mi_mON SX/is_9_49/ai_n6200037/”
Hingley, W. et al. 1989. “Financial Management”. 2nd Edition, Heinemann Professional
Publishing Ltd.
Hooton. R.D. 1993. “Influence of silica fume replacement of cement on physical
properties and resistance to sulfate attack, freezing and thawing and alkali-silica
reactivity” ACI Materials Journal. Vol. 90, No 2. pp 143-151.
Homain, H. Marchand, J. Duhot, V. and Regourd, M.M. 1995 “Diffusion of chloride ions
in limestone filler blended cement pastes and mortars”. Cement and Concrete Research,
Vol. 25 No 8, pp 1667-1678.
Howlett, V. 1995. “Visual interface design for windows”. John Wiley and sons.
Illston.J.M. 1994. “Construction materials, their nature and behaviour” 2nd Edition, 1994.
Chapman and Hall, England.
Jamkar S.S. and Rao C.B.K. 2004. “Index of aggregate particle shape and texture of
coarse aggregate as a parameter for concrete mix proportioning.” Cement and Concrete
Research. Vol. 34, pp 2021-2027.
Johnson.A. 2006. “Cement/waste interactions: Assessing the role of cement in waste
management” Conference paper, “Advances in cement and concrete X - Sustainability”
Davos, Switzerland. 2nd - 7th July 2006.
Jones, M.R. McCarthy, A. and Booth, A.P.P.G. 2006a. “Characteristics of the ultra-fine
component of fly ash” Fuel Vol. 85 pp 2250-2259
8-11
Jones, R. Sear, L. McCarthy, M. Dhir, R. 2006b. “Changes in Coal Fired Power Station
Fly Ash: Recent Experiences and Use in Concrete” Down loaded from:
http ://www.ukqaa.org.uk/Papers/AshT echAO 1 ChangesInCoalF iredPowerStation JonesEt
Al.pdf Accessed 3rd March 2008
Jones, R. 2006c. “The advent of admixtures” Concrete Volume 40 Number 6 pp 26
Kalpakjian, S. 1997. “Manufacturing Engineering and Technology”. 4th Edition, Prentice
Hall, New Jersey.
Katz, A. “The impact of environmental considerations on concrete technology”
Conference paper, “Advances in cement and concrete X — Sustainability” Davos,
Switzerland. 2nd - 7th July 2006.
Kenai, S. Soboyejo W. and Soboyejo A. 2004. “Some Engineering Properties of
Limestone Concrete” Materials and Manufacturing Processes Vol. 19, No. 5, pp. 949-
961
Khatri R.P. and Sirivivatnanon V. 1995. “Effect of different supplementary cementitious
materials on mechanical properties of high performance concrete”
Cement end Concrete Research, Vol. 25, No. 1, pp. 209-220
Kiattikomol, K. Jaturapitakkul, C. Songpiriyakij, S. and Chutubtim, S. 2001. “A study of
ground coarse fly ashes with different finenesses from various sources as pozzolanic
materials” Cement and concrete composites, Vol. 23, pp 335 - 343
Kim J.K. Han S.H. and Song Y.C. 2002. “Effect of temperature and aging on the
mechanical properties of concrete Part I. Experimental results”
Cement end Concrete Research, Vol. 32, No. 7, pp. 1087-1094
Kourounis,S. Tsivilis S. and Tsakiridis P.E. 2007. “Properties and hydration of blended
cements with steelmaking slag” Cement and Concrete Research Vol. 37 pp 815-822
8-12
Lagier, F. and Kurtis,K.E. 2007 “Influence of Portland cement composition on early age
reactions with metakaolin” Cement and Concrete Research Vol. 37 pp 1411-1417
Lane, R.O. and Best, J.F. 1982. “Properties and use of fly ash in Portland cement
concrete” Concrete International Vol. 4 No. 7 pp 81-92
Lazarus, L. 2005. “Potential for Reducing the Environmental Impact of Construction
Materials” commissioned by the Bio-Regional Development Group
Lee, S.H. Sakai, E. Daimon, M. and Bang, W.K. 1999. “Characterization of fly ash
directly collected from electrostatic precipitator” Cement and Concrete Research Vol.29
pp 1791-1797
Lewis, L. Sear, L. Wainwright, P. Ryle, R. 2003. “Cementitious additions” in: Newman, J
and Choo,B.S. “Advanced concrete technology - Constituent materials” Elsevier,
Oxford, U.K. 2003 pp 3/1 - 3/66
Lewis, R. 1996 “Micro silica” Concrete Vol. 30 No.l pp 21 - 22
Lewis, R. 2000. “Micro silica concrete: the view forward” Concrete January pp 62
Li, X. and Chung D.D.L 1998 “Improving silica fume for concrete by surface treatment”
Cement and Concrete Research, Vol. 28, No. 4, pp. 493-498
Li, Z. 2007 “State of workability design technology for fresh concrete in Japan” Cement
and Concrete Research 37, pp 1308-1320
Lin, K.L. Wang K.S. Tzeng B.Y. and Lin C.Y. 2003 “The reuse of municipal solid waste
incinerator fly ash slag as a cement substitute” Resources, Conservation and Recycling
Vol. 39 pp 315-324
8-13
Livesey, P. 1991 “Strength characteristics of Portland limestone cements”. Construction
and Building Materials, Vol. 5 No.3 pp 147-150.
Liwu, M. and Min, D. 2006. “Thermal behavior of cement matrix with high-volume
mineral admixtures at early hydration age” Cement and Concrete Research Vol. 36
pp 1992-1998
Long, G. Wang, X.Y. Xiao, R. and Xie, Y. 2003. “The influences of ultra-fine powders
on the compatibility o f cement and superplasticiser with very low water / binder ratio”
Advances in Cement Research Vol. 15 No.l pp 17-21
Lydon, F.D. 1982. “Concrete mix design” Applied science publishers LTD. England. 2nd
Edition
Lydon, F.D. 1993. “The relative permeability of concrete using nitrogen gas”
Construction and Building Materials Volume 7. Number 4 pp 213-219
Malhotra V. M. and Carette, G. G. 1982 “Silica fume - A pozzolan of new interest for use
in some concretes” Concrete Construction May pp 443 - 446
Malhotra, V.M. Ramezanianpour, A.A. 1994. “Fly ash in concrete” 2nd Edition
CANMET, Canada
Malhotra V.M. Ramezanianpour A. A. 1995 “Effect of curing on the compressive
strength, resistance to chloride-ion penetration and porosity of concretes incorporating
slag, fly ash or silica fume.” Cement and Concrete Composites Volume 17 Number 2
pp125-33.
Malhotra V. M. and Carette, G. G. 1982 “Silica fume - A pozzolan of new interest for use
in some concretes” Concrete Construction May pp 443 - 446
8-14
Marsh, B. 2000. “An introduction to UK durability provisions for use with European
standard EN206” Concrete Issue 34 Number.6 pp 36 - 37
Marsh, B.K. 2003. “Standards, specifications and codes of practice”. In Advanced
concrete technology - Testing and quality. U.K. Elsevier Ltd. Section 11/3
Martin, G.R. 1986. “A method for determining the relative permeability of concrete
using gas”. Magazine of Concrete Research, Volume 38, No. 135, pp 90 - 94.
Mathews, J. 2007. “Seven steps to curb global warming” Energy Policy Volume 35 pp
4247-4259
Meininger, R.C. 1982. “Use of fly ash in cement and concrete - Report of two recent
meetings” Concrete International July
Mills, H. 1971. “Top down programming in large systems, in: Ruskin, R. Debugging
techniques in large systems”. Prentice Hall, New Jersey.
Moir, G 2003. “Cements” in: Newman, J and Choo,B.S. “Advanced concrete technology
- Constituent materials” Elsevier, Oxford, U.K. 2003 pp 1/3 - 1/45
Murdock,L.J. and Brook, K.M. 1979. “Concrete materials and practice” 5th Edition,
Edward Arnold publisher, London
Naik, T.R. and Kraus, R.N. 1999. “Use of industrial by-products in cement based
materials”. In: Exploiting wastes in concrete. Proceedings of the international seminar,
University of Dundee, Scotland September 7th 1999, pp. 23-35
NCE 2008 “What price carbon?” New Civil Engineer Magazine 28th February 2008
pp 14 -15
8-15
Neville, A.M. and Brooks,J.J. 1987. “Concrete Technology”, Longman group U.K. 1st
Edition
Neville, A.M. 1995. “Properties of concrete” Longman group, U.K. 4th Edition
Nixon, P.J 1984. “CS Working Party comments on changes in ordinary Portland Cement”
Concrete, Volume 18 No.9 pp 38 - 39
Oner, A. Akyuz, S. Yildiz, R. 2005 “An experimental study on strength development of
concrete containing fly ash and optimum usage of fly ash in concrete” Cement and Concrete
Research Volume 35 pp 1165 - 1171
Ortega, P. 2006. “The contribution o f admixtures in sustainable concrete construction”
The Institute of Concrete Technology Annual Symposium on Concrete for a Sustainable
Future, 28th March 2006
Owen, N.E. Griffiths, A.J. Williams, K.P. Woolam, T.C. 2007. “Waste composition- An
integral requirement for monitoring changes to waste management practices”
22nd International Conference on Solid Waste Technology and Management
Philadelphia, PA USA March 18-21, 2007
Owens, P.L. 1979. “Fly ash and its usage in concrete” Concrete July pp 21 - 26
Owens, P.L. 1980. “Is today’s structural concrete ready for tomorrow?” Concrete, Volume
14 No.7 pp 29 - 31
Palacios, M. Puertas, F. 2005 “Effect of superplasticiser and shrinkage-reducing
admixtures on alkali-activated slag pastes and mortars” Cement and Concrete research
Volume 35, Issue 7, pp 1358-1367
Pan, J.R. Huang, C. Kuo,J.J. and Lin, S. 2007. “Recycling MSWI bottom and fly ash as
raw materials for Portland cement” Waste Management Article in press
8-16
Pandey, S.P. Singh, A.K. Sharma, R.L. Tiwari, A.K. 2003 “Studies on high-performance
blended/multiblended cements and their durability characteristics” Cement and Concrete
Research Volume 33 pp 1433 - 1436
Papadakis, V.G. 1999 “Effect of fly ash on Portland cement systems Part I. Low-calcium
fly ash” Cement and Concrete Research Vol. 29 pp 1727-1736
Papadakis V.G and Tsimas S. 2002 “Supplementary cementing materials in concrete
Part I: efficiency and design” Cement and Concrete Research Vol. 32 pp 1525-1532
Pearce, F. 1997. “The concrete jungle overheats”. New scientist. Vol. 2097, pp 14.
Pedersen, K.H. Jensen A.D. Skjoth-Rasmussen, M.S. and Dam-Johansen K. 2008. “A
review of the interference of carbon containing fly ash with air entrainment in concrete”
Progress in Energy and Combustion Science Vol. 34 pp 135-154
Pern, J. Coutaz, L. Ambroise, J. and Chababbet, M. 1997. “Use of incinerator bottom ash
in concrete”. Cement and Concrete Research 27 (1), 1-5.
Poole, A. Sims, 1. 2003. “Geology, aggregates and classification” in: Newman, J and
Choo,B.S. “Advanced concrete technology - Constituent materials” Elsevier, Oxford,
U.K. 2003 pp 5/3 - 5/36
Poon, C.S. Lam, L. Kou, S.C. Wong, Y. and Wong, R. 2001. “Rate of pozzolanic
reaction of metakaolin in high-performance cement pastes” Cement and Concrete
Research Vol. 31 pp 1301-1306
Pressman, R. S. 2000. “Software Engineering — A Practitioners Approach”. 5th Edition,
McGraw Hill. UK
8-17

Price, B. 2007. “CEM II cements in the UK: the way forward”. Down loaded from
http://findarticles.eom/p/articles/mi_qa5379/is_200703/ai_n21284219/pg_2
Accessed 8th April 2008
Price, W. 2009. “Cementitious materials for the twenty-first century” Civil Engineering
No. 162, pp 64 - 69
Ramme, B.W. Lingle, J.W. and Naik, T.R. 1998. “Coal Combustion Products Utilization
inWiscosin - an Environmental Approach”. In: Proceedings of the Three-Day
CANMET/ACI International Symposium on Sustainable Development of the Cement and
Concrete Industry. October 21-23, Ottawa, Canada, pp. 349-383
RMC. 1991. “PFA in concrete” Readymix technical information YQ2 RMC Group pic
Rojas, M.F. and Cabrera 1, J. 2002. “The effect of temperature on the hydration rate and
stability of the hydration phases of metakaolin-lime-water systems” Cement and
Concrete Research Vol.32 pp 133-138
Rubioa, B. Izquierdo, M.T. Mayoral, M.C. Bona, M.T. and Martinez-Tarazona, R.M.
2008. “Preparation and characterization of carbon-enriched coal fly ash” Journal of
Environmental Management, Article in press.
Saak A.W. Jennings, H. M. Shah, S. P. 2004. “A generalised approach for the
determination of yield stress by slump and slump flow” Cement Mid Concrete Research
Vol. 34, No 3, pp 363-371
Safawi, M.I. Iwaki, I. and Miura, T. 2004. “The segregation tendency in the vibration of
high fluidity concrete” Cement and Concrete Research Vol 34 pp 219—226
8-18
Sagoe-Crentsil K.K. Brown, T. and Taylor, A.H. 2001. “Performance of concrete made
with commercially produced coarse recycled concrete aggregate” Cement and Concrete
Research 31, pp 707-712
Sakai,S. and Hiraoka, M. 2000. “Municipal solid waste incinerator residue recycling by
thermal processes” Waste Management Vol. 20 pp 249 - 258
Sari, D. and Pasamehmetoglu, A.G. 2005. “The effects of gradation and admixture on the
pumice lightweight aggregate concrete” Cement and Concrete Research 35
pp 936-942
Schulze, J. 1999. “Influence of water-cement ratio and cement content on the properties
of polymer-modified mortars” Cement and Concrete Research Vol. 29
Issue 6 pp 909-915
Scrivener, K.L. and Kirkpatrick, J. 2008. “Innovation in use and research on cementitious
material” Cement and Concrete Research Vol. 38 pp 128-136
Sear, L.K.A. 2001a. "Fly Ash standards, market strategy and UK Practice" The 2001
Kentucky University Fly Ash conference held in Lexington, Kentucky, USA in October.
Downloaded from:
http://www.ukqaa.org.uk/Papers/KentuckyAshSymposiumSear2001 .pdf
Accessed 4th February 2008
Sear, L.K.A, 2001b, “Pfa and fly ash as an addition in concrete - European standards”
BCA Concrete Communication conference, UMIST, Manchester, 3rd & 4th July 2001
Sear, L. 2003. “Quality control” in: Newman, J and Choo,B.S. “Advanced concrete
technology - Testing and Quality” Elsevier, Oxford, U.K. 2003 pp 9/1 - 3/24
8-19
Sear, L K.A. 2004. “Recycling power station by-products — A long history of use”
Sustainable Waste Management Conference Kingston University - 14/15 September
Sear, L.K.A. 2005. “Should you be using more PFA?” Dundee University Conference -
Global Construction - Ultimate Concrete Opportunities 5 to 7 July Downloaded from:
“http://www.ukqaa.org.uk/Papers/DundeeJuly2005ShouldYouBeUsingMorePFA.pdf’
Accessed 4th February 2008
Sear,L. and Owens, P. 2006a. Current Practice sheet No. 146, Fly Ash. Part 1: Origin and
use, combined version. The concrete society, Download from:
(www.concrete.org.uk) Accessed 15/11/06.
Sear,L. and Owens, P. 2006b. Current Practice sheet No. 146, Fly Ash. Part 2: Standards,
combined version. The concrete society, Download from - www.concrete.org.uk
Accessed 15/11/06.
Sear L.K.A. 2007. “The use of fly ash for enhancing durability and sustainability”
Sustainable Construction Materials and Technologies Conference, Coventry University,
UK, 11-13 June
Separation technologies, 2007, “ST; For Power Plants - ST technology” Downloaded
form:
(http://www.stiash.com/Ll/power-st_technology.html) Accessed 20th December 2007
Shi, C. and Qian, J. 2000. “High performance cementing materials from industrial
slags — a review” Resources Conservation and Recycling Volume. 29 No. 3
Shibli R.M. et al UPV 2007 “Method for strength detection of high performance
concrete”, Structural survey Volume 25, No. 1 pp 61 - 73).
8-20
Siddique, R. 2004. “Performance characteristics of high-volume Class F fly ash concrete”
Cement and concrete Research Volume 34 No. 3 pp 487 - 493
Siddique, R. 2006. “Properties of concrete incorporating high volumes of low-calcium fly
ash and steel fibres” The 21st International; conference on solid waste technology and
management March 18th - 21st Philadelphia, PA, USA.
Skaropoulou, A, Tsivilis, S, Kakali, G, Sharp, J and Swamy, R (2009) “Thaumasite form
of sulfate attack in limestone cement mortars: A study on long term efficiency of mineral
admixtures”. Construction and Building Materials Volume 23 Issue 6. pp 2338-2345.
Somerville, G 1996. “Cement and concrete as materials: changes in properties,
production and performance” Proceedings of the Institute of Civil Engineers Structures
and Buildings No. 116. Paper 11070 pp 335 - 343
Sommerville, S. 2004. “Software Engineering”. 7th Edition, Pearson, UK.
Soroka, I. and Ravina, D. 1998. “Hot Weather Concreting with Admixtures” Cement and
Concrete Composites Volume 20 pp 129-136
Spooner, D. Taylor, M., 1999, “Changing from British to European cement standards:
what’s new ?” Concrete Volume 33 Issue 10, pp 42 - 44
Stoltenberg-Hanson, E. 1984, “Experience with fly ash cement”. Rock Products
pp. 87- 89
Sutcliff, A.G.. 1995. “Human computer interface design”. 2nd Edition, Macmillan.
Swamy, R.N. 1999. “Editorial”. Cement and Concrete Composites Vol. 21 No.3:iii-iv.
8-21
Swamy, R.N. 2003. “Holistic design: Key to sustainability in concrete construction.” The
Indian concrete journal Vol. 27, No. 12. pp 1291-1299.
Taylor,M.G., Brookbanks,P. 2006. Fact sheet No.9. “Product certification for cements
and the CE marking”. Revision N o.l. Berkshire, BCA Publications.
Taylor, V. 2007. “Tackling the effects of climate change with concrete solutions” Concrete
Volume 41 Number 4 pp 38
Technomics, 2001. “The science o f all decision making”. Available at
http://www.technomics.net/career/car_defii.htm Accessed 9th August 2005
The Cement Sustainability Initiative: Progress report, World Business Council for
Sustainable Development, published 2002-06-01 Downloaded from:
http://www.wbcsd.org/DocRoot/1 IBetslPgkEie83rTaOJ/cement-action-plan.pdf Accessed
4th February 2008
Tombs, N. 2003 “The permeability of cover concrete - a quick test” MEng Thesis,
Cardiff University
Trammel, C.J. 1996. “The incremental development process in clean room software
engineering”. Decision Support Systems, No. 17, pp 55-71.
Tsivilis S. Chaniotakisb, E. Batis G. Meletioub, C. Kasselouria V. Kakali G. Sakellariou
A. Pavlakis G. and Psimadas C. 1999. “The effect of clinker and limestone quality on the
gas permeability, water absorption and pore structure of limestone cement concrete”
Cement and Concrete Composites Vol 21 pp 139-146
Tsivilis, S. Voglis, N. Photou J. 1999a “Technical note - A study on the intergrinding of
clinker and limestone” Minerals Engineering, Volume. 12, No. 7, pp. 837-840
8-22

Tsivilis, S. Chaniotakis, E. Kakali, G Batis, G 2002 “An analysis of the properties of
Portland limestone cements and concrete”, Cement and Concrete Composites 24,
pp. 371-378.
UKQAA 2006 “Technical Data Sheet 1.1 — Fly ash to BS EN 450:2005 as an addition in
concrete specified to BS EN206 - Part 1” Down loaded from:
(http://www.ukqaa.org.uk/Datasheets_PDF/Datasheet_ 1-1 _Jan_2006.pdf)
Accessed 3rd March 2008
UKQAA, 2007 “Technical data sheet 8.1 — Environment and sustainability” Downloaded
from:
(http://www.ukqaa.org.uk/EnvirAndSustain.html) Accessed 20th January 2008
Van Oss, H.G. and Padovani, A.C. 2002. “Cement Manufacture and the Environment
Part I: Chemistry and Technology” Journal of Industrial Ecology Vol 6, Number 1 pp 89
-105
Wang, S. Baxter, L. and Fonseca, F. 2008. “Biomass fly ash in concrete: SEM, EDX and
ESEM analysis” Fuel Vol. 87 pp 372-379
Wild, S. Khatib J.M. and Jones A. 1996. “Relative strength, pozzolanic activity and
cement hydration in superplasticised metakaolin concrete” Cement and Concrete
Research, Vol. 26, No. 10, pp. 1537-1544,
Wu, K. Yan, A. Yao, W. and Zhang, D. 2001. “Effect of metallic aggregate on strength
and fracture properties of HPC” Cement and Concrete Research Vol. 31 pp 113-118
Yi, S. Yang, E. and Choi, J. 2006. “Effect of specimen sizes, specimen shapes, and
placement directions on compressive strength of concrete” Nuclear Engineering and
Design, 236, pp 115-127.
8-23
Zhang, H. Malhotra, V.M. 1995. “Characteristics of a thermally activated alumino-
silicate pozzolanic material and its use in concrete” Cement and Concrete Research, Vol.
25. No. 8. pp. 1713-1725.
8.2 World wide web references
wwwl.l
(http ://ww2 .defra.gov.ulc/news/2010/06/15/waste-policy-review/)
Accessed 10th February 2011
wwwl.2
(http://ww2.defra.gov.uk/news/2010/06/15/caroline-spelman-waste/)
Accessed 10th February 2011
www2.1
(http://www.politics.co.uk/news/opinion-former-index/environment-and-rural-
affairs/brown-calls-world-leading-green-agenda-$481753.htm) Accessed 24th February
2008
www2.1.1
(http://www.opsi.gov.uk/si/em2004/uksiem_20043212_en.pdf)
Accessed 12th November 2007
www2.2
(http://www.defra.gov.uk/environment/statistics/waste/kfrwrkf02.htm)
Accessed 8th January 2008
www2.3
(http://www.defra.gov.uk/environment/statistics/waste/wrindustry.htm)
Accessed 8th January 2008
8-24

www2.4
(http://www.defra.gov.uk/environment/statistics/waste/download/xls/wrtb06.xls)
Accessed 8th Jan 2008
www2.5
(http://www.therecycler.com/news/13822/Landfill-tax-to-rise-to-%C2%A380-a-tonne-
says-British-Chancellor.aspx) Accessed 10th February 2010
www2.6
(http://www.hm-treasury.gov.Uk/media/8/7/LFT_recycling_320.pdf)
Accessed 8th January 2008
www2.7
(http://en.wikipedia.org/wiki/Aberthaw_Cement_Works)
Accessed 21st January 2008
www2.8
(http://www.es.ucl.ac.uk/schools/UCL/limestone.htm) Accessed 21st January 2008
www2.9
(http://www.english-heritage.org.uk/server/show/nav.1315) Accessed 17th January 2008
www2.10
(http://wales.gov.uk/publications/accessinfo/decisionreport/DReconomics/1901781/?lang
=cy) Accessed 17th January 2008
www2.11
(http://www.efca.info) Accessed 14th January 2008
www2.12
(http://www.admixtures.org.uk/en934.asp) Accessed 14th Jan 2008
8-25
www2.13
(http ://www.sustainableconcrete.org.uk/main.asp?page= 176) Accessed 14th January 2008
www 2.14
(http://www.bbc.co.uk/dna/h2g2/A918371) Accessed 9th January 2008
www2.14.1
(http://www.wbcsd.org/DocRoot/lIBetslPgkEie83rTaOJ/cement-action-plan.pdf)
Accessed 9th January 2008
www2.15
(http://www.environment.gov.au/settlements/publications/chemicals/scheduled-
waste/swtt/cement.html#figure71) Accessed 22nd January 2008
www2.16
(http://www.4sight.org.uk/) Accessed 21st January 2008
www2.16.1
(http://www.mineralproducts.org/prod_slag04.htm) Accessed 10th February 2011
www2.17
(http://www.steel.org/AM/Template.cfm?Section=Home&template=/CM/HTMLDisplay.
cfm&ContentID=54331) - Accessed 23rd Jan 2008
www2.18
(http://en.wikipedia.org/wiki/Blast_fumace) - Accessed 23rd Jan 2008
www2.18.1(http://www.sepa.org.uk/nws/ ) - Accessed 27th February 2008
8-26
www2.19
(http://www.environment-agency.gov.uk/static/documents/Business/LATS_report_2009-
10.pdf)
Accessed 10th February 2011
www2.20
(http://www.sandberg.co.uk/labs/cm_sulphate.php) Accessed 26th February 2008
www2.21
(http://www.ukqaa.org.Uk/Questions.html#FAQ12) Accessed 26th February 2008
www3.1
(http://en.wikipedia.org/wiki/Didcot_Power_Station) Accessed 29th March 2011
www3.2
(http://en.wikipedia.org/wiki/Scanning_Electron_Microscope)
Accessed 29th Jan 2008
www3.3
(http://www.ruppweb.org/Xray/101index.html) Accessed 1st February
www3.4
(http://en.wikipedia.org/wiki/X-ray_crystallography#Overview_of_single-crystal_X-
raydiffraction) Accessed 1st February 2011
www3.5(http://www.biochem.arizona.edu/classes/bioc462/462bh2008/462bhonorsprojects/462bh
onors2006/cooperj/protein%20structure%20analysis.htm) Accessed 1st February 2011
8-27
www3.6
(http://www.atoomspectrometrie.nl/Icpconceptsbook.pdf) Accessed 21st May 2011
www4.1
(http://www.trifield.com/content/tribo-electric-series/) Accessed 2nd February 2011
www4.2
(http://www.stiash.com/Ll/power-sti_technology.html) Accessed 27th June 2007
www4.3
(http://www.hmicronpowder.com/literature/ACCUCUT.PDF) Accessed 2nd February
2011
8.3 British and European standards
The major British and European standards relevant to this research are presented below.
BS EN 206-1:2000 “Concrete - Part 1: Specification, performance, production and
conformity”
BS EN 8500-1:2002 “Concrete - Complimentary British Standard to BS EN 206-1 - Part
1: Method of specifying and guidance for the specifier”
BS EN 8500-2:2002 “Concrete - Complimentary British Standard to BS EN 206-1 - Part
2: Specification for constituent materials and concrete”
BS EN 197-1:2000 “Cement - Part 1: Composition, specifications and conformity for
common cements”
8-28
BS EN 450-1:2005 “Fly ash for concrete - Part 1: Definition, specifications and
conformity criteria”
BS EN 450-2:2005 “Fly ash for concrete - Part 2: Conformity evaluation”
BS EN 196- Methods of testing cement - Parts 1 -3 and 5 - 9
BS EN 12620: 2002 “Aggregates for concrete”
BS EN 12390 - “Testing hardened concrete” Parts 1 -8
BS EN 12350 - “Testing fresh concrete” Parts 1 -7
8-29
9. Appendices
These Appendices can be viewed on the CD-ROM accompanying this thesis. The
research paper can be seen as a hard copy at the rear o f this thesis as can the cost analysis
results sheets.
1 - Mix designs
1.1 - Design sheets
2 - Aggregate
2.1 - Aggregate properties
2.2 - Aggregate properties
3 - Results from analysis
3.1 - Chemical analysis
3.2 - Compressive strength
3.3 - Permeability
3.4 - Particle grading
3.5 - SEM
3.6-TE M
3.7-X R D
3.8 - Collated materials
3.9 - Tensile strength
3 .10- Mortar results
3.11 - Specific gravity
3.12-Grinding
9-1
4 - Cost analysis
4.1 - Cost analysis model
4.2 - User guide and output
4.3 - A study into modelling
5 - Industry benefits
5.1 - Calculations
5.2 - Environmental benefits
6 - Correspondence
6.1-B s i
7 - British standards
7.1 - British and European standards
8 - Research paper
8.1 - Influence of cement replacement materials on properties of concrete
products - strength, durability and environmental stability.
9 -2
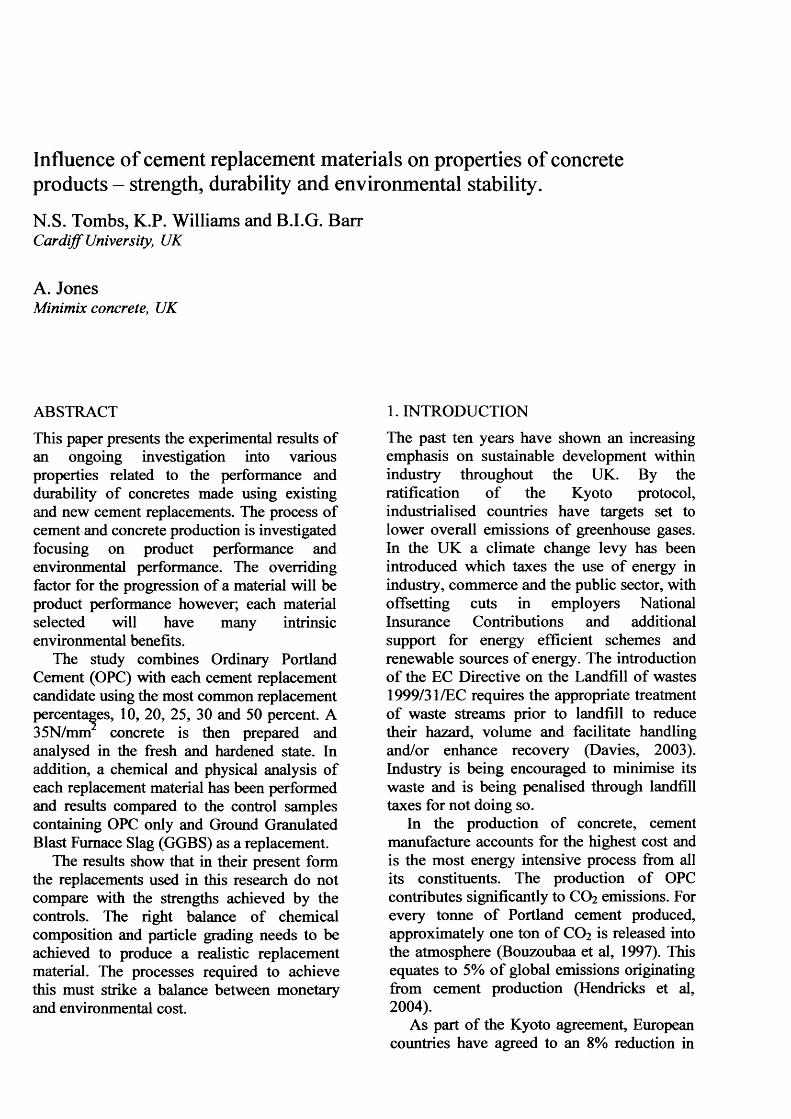
Influence of cement replacement materials on properties of concrete products - strength, durability and environmental stability.
N.S. Tombs, K.P. Williams and B.I.G. BarrCardiff University, UK
A. JonesMinimix concrete, UK
ABSTRACT
This paper presents the experimental results of an ongoing investigation into various properties related to the performance and durability of concretes made using existing and new cement replacements. The process of cement and concrete production is investigated focusing on product performance and environmental performance. The overriding factor for the progression of a material will be product performance however; each material selected will have many intrinsic environmental benefits.
The study combines Ordinary Portland Cement (OPC) with each cement replacement candidate using the most common replacement percentages, 10, 20, 25, 30 and 50 percent. A 35N/mm concrete is then prepared and analysed in the fresh and hardened state. In addition, a chemical and physical analysis of each replacement material has been performed and results compared to the control samples containing OPC only and Ground Granulated Blast Furnace Slag (GGBS) as a replacement.
The results show that in their present form the replacements used in this research do not compare with the strengths achieved by the controls. The right balance o f chemical composition and particle grading needs to be achieved to produce a realistic replacement material. The processes required to achieve this must strike a balance between monetary and environmental cost.
1. INTRODUCTION
The past ten years have shown an increasing emphasis on sustainable development within industry throughout the UK. By the ratification o f the Kyoto protocol, industrialised countries have targets set to lower overall emissions o f greenhouse gases. In the UK a climate change levy has been introduced which taxes the use of energy in industry, commerce and the public sector, with offsetting cuts in employers National Insurance Contributions and additional support for energy efficient schemes and renewable sources of energy. The introduction o f the EC Directive on the Landfill o f wastes 1999/31/EC requires the appropriate treatment of waste streams prior to landfill to reduce their hazard, volume and facilitate handling and/or enhance recovery (Davies, 2003). Industry is being encouraged to minimise its waste and is being penalised through landfill taxes for not doing so.
In the production of concrete, cement manufacture accounts for the highest cost and is the most energy intensive process from all its constituents. The production of OPC contributes significantly to CO2 emissions. For every tonne o f Portland cement produced, approximately one ton of CO2 is released into the atmosphere (Bouzoubaa et al, 1997). This equates to 5% of global emissions originating from cement production (Hendricks et al, 2004).
As part of the Kyoto agreement, European countries have agreed to an 8% reduction in

Greenhouse Gas emissions, based on 1990 levels, by the year 2012. The cement manufacturing industry is one where quotas have been imposed by the European Union (EU) to cap hazardous emissions. Failure to meet the obligations of the agreement will result in heavy fines however; improving on these limits can provide financial benefits (Defra, 2006). Already the industry has demonstrated its ability to improve its climate change performance. Between 2001 and 2004 an improvement in energy consumption of 21.2% had been achieved and is well on its way to the 2010 target of 26.8% reduction (BCA). Short term actions are to include maximising the use of waste as fuels and replacement materials for the principal cement raw material, limestone.
The European standard BS EN 450-1 covers a range of fly ash produced by the combustion o f hard coal. Co-combustion with certain materials is allowed within this standard, however fly ash produced from the burning o f other materials alone is not. It has been reported that the use of hard coal produced fly ash has turned out to be beneficial with regards to the properties of the concrete, especially in relation to its resistance to aggressive species (Bertolini, 2004). This being the case, could other ashes, at present being condemned to landfill sites, also be of benefit to the properties of concrete.
On completing this initial study it will be possible to identify if a particular ash is acceptable as a safe replacement material for cement and if so the environmental benefits gained from its use.
2. MATERIALS
Three types of ash, a blend of industrial wastes and a GGBS have been selected for this study and compared with a control mix of neat OPC. The OPC has been produced to meet the specification as required by BS EN 197 while the GGBS, also used as a control due to its already proven benefits within concrete, complies with the requirements of BS 6699.
The three ashes used in the study are from a coal fired power plant (FA), a municipal solid waste incineration plant (MSW), and a sewage sludge incineration plant (SS). Only FA has been processed and prepared for supply back into industry, the remaining two are raw materials direct from the incinerator.
IM combines several industrial wastes each chosen for their chemical compositions. Each o f these waste materials contain elements similar to those found in OPC and hence could be viewed as being a substitute rather than a replacement.
Coarse aggregates used are crushed lime stone quarried locally with marine sand used as fine aggregate both conforming to BS EN 12620:2002.
A Portland cement (CEM I) 52.5N was used conforming to BS EN 197.
A water reducing and plasticizing agent (Sika Plastiment 160) was mixed with potable water (Cardiff city supply) quantified at 0.4% o f the cement content. The use o f additives within concrete is an accepted norm within the industry and any detrimental effects from their use need to be identified.
3. EXPERIMENTAL PROGRAM
3.1 Mix designs
The object o f mix design is to determine the most appropriate proportions in which to use the constituent materials to meet the needs of the work. This research has based itself around a single design for a standard concrete with a cement content of 275kg/m3. This design is used within industry and has been fashioned through the production of trial mixes. Its selection was based on its popularity through sales and having a cement quantity large enough to highlight the differences between materials and mix proportions.
3.2 Experimental procedure
There are two main variables within this study. Firstly, the amount of replacement material blended with the cement. BS 8500-2 gives an allowable range of 6 - 55%
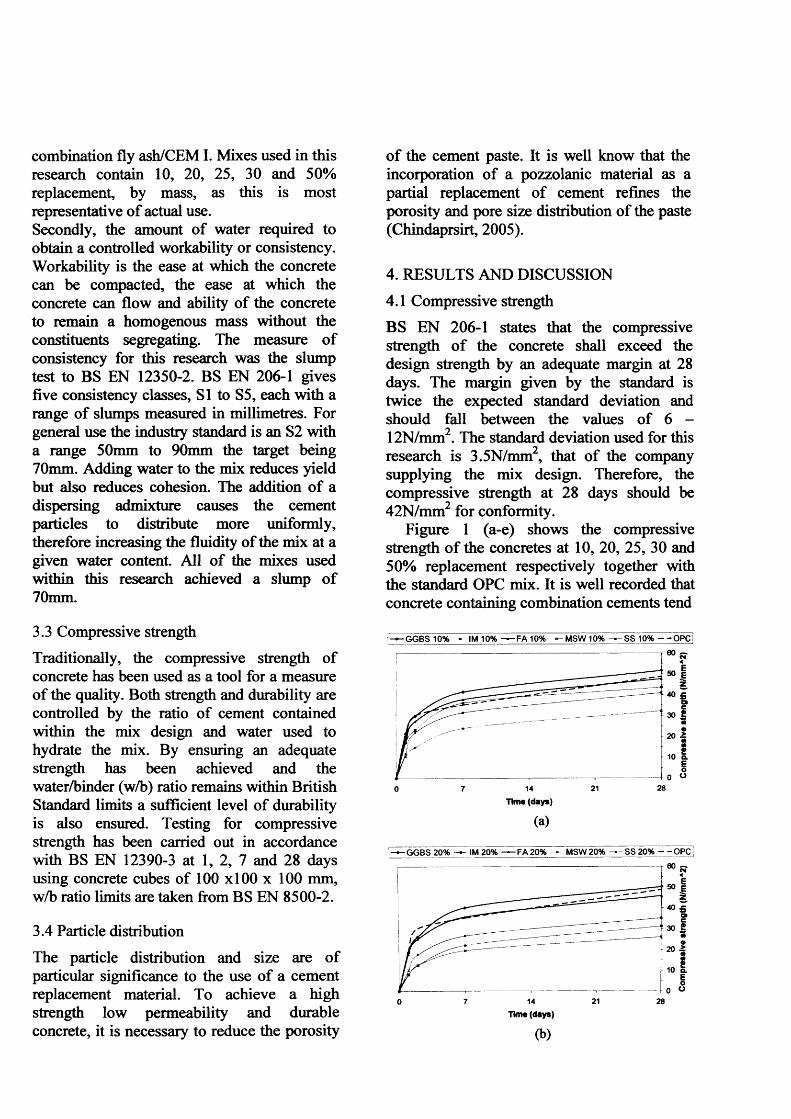
combination fly ash/CEM I. Mixes used in this research contain 10, 20, 25, 30 and 50% replacement, by mass, as this is most representative o f actual use.Secondly, the amount of water required to obtain a controlled workability or consistency. Workability is the ease at which the concrete can be compacted, the ease at which the concrete can flow and ability of the concrete to remain a homogenous mass without the constituents segregating. The measure of consistency for this research was the slump test to BS EN 12350-2. BS EN 206-1 gives five consistency classes, SI to S5, each with a range of slumps measured in millimetres. For general use the industry standard is an S2 with a range 50mm to 90mm the target being 70mm. Adding water to the mix reduces yield but also reduces cohesion. The addition of a dispersing admixture causes the cement particles to distribute more uniformly, therefore increasing the fluidity of the mix at a given water content. All of the mixes used within this research achieved a slump of 70mm.
3.3 Compressive strength
Traditionally, the compressive strength of concrete has been used as a tool for a measure of the quality. Both strength and durability are controlled by the ratio of cement contained within the mix design and water used to hydrate the mix. By ensuring an adequate strength has been achieved and the water/binder (w/b) ratio remains within British Standard limits a sufficient level of durability is also ensured. Testing for compressive strength has been carried out in accordance with BS EN 12390-3 at 1, 2, 7 and 28 days using concrete cubes of 100 x 100 x 100 mm, w/b ratio limits are taken from BS EN 8500-2.
3.4 Particle distribution
The particle distribution and size are of particular significance to the use of a cement replacement material. To achieve a high strength low permeability and durable concrete, it is necessary to reduce the porosity
of the cement paste. It is well know that the incorporation of a pozzolanic material as a partial replacement of cement refines the porosity and pore size distribution of the paste (Chindaprsirt, 2005).
4. RESULTS AND DISCUSSION
4.1 Compressive strength
BS EN 206-1 states that the compressive strength o f the concrete shall exceed the design strength by an adequate margin at 28 days. The margin given by the standard is twice the expected standard deviation and should fall between the values of 6 - 12N/mm . The standard deviation used for this research is 3.5N/mm2, that of the company supplying the mix design. Therefore, the compressive strength at 28 days should be 42N/mm2 for conformity.
Figure 1 (a-e) shows the compressive strength o f the concretes at 10, 20, 25, 30 and 50% replacement respectively together with the standard OPC mix. It is well recorded that concrete containing combination cements tend
GGBS 10% — IM 10% FA 10% -^MSW10% ^ S S 10% --O P C
40
10 a.
0 7 14 21 28
Tim* (days)
(a)
GGBS 20% —- IM 20% — FA 20% - - - MSW 20% SS 20% - - OPC
40 £wc
L 30 £
10 a.
0 7 14 21 28
Time (days)
(b)
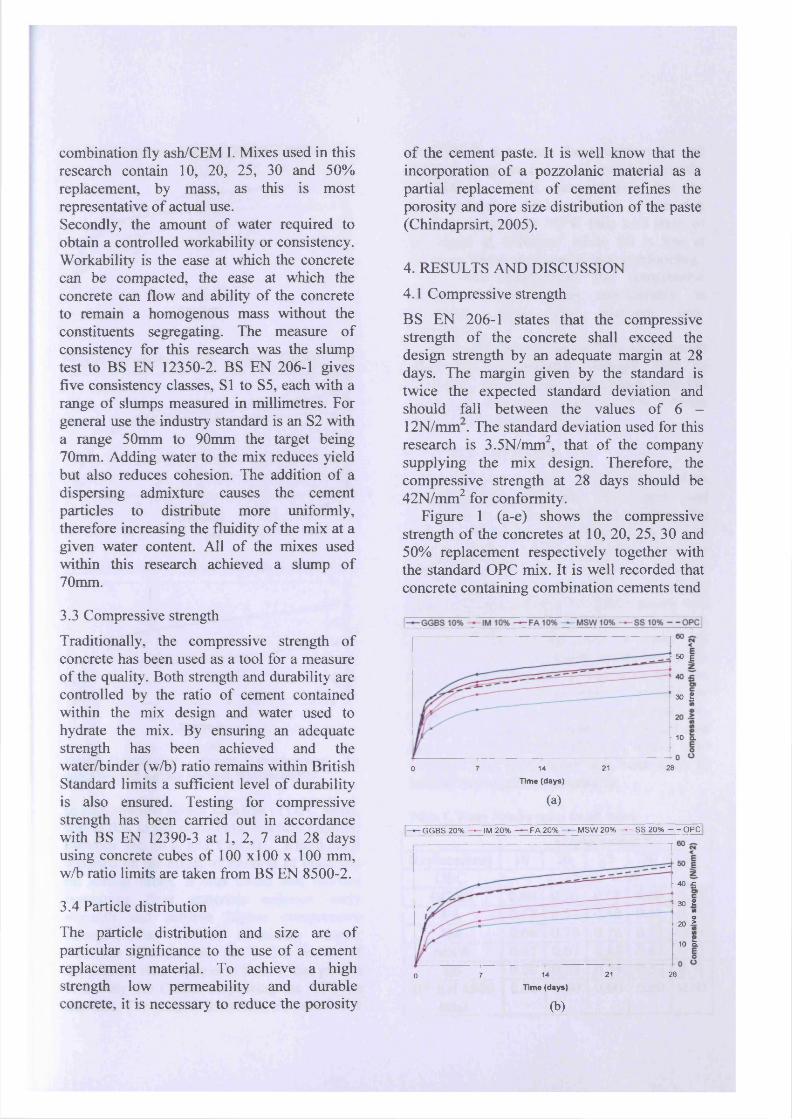
combination fly ash/CEM I. Mixes used in this research contain 10, 20, 25, 30 and 50% replacement, by mass, as this is most representative of actual use.Secondly, the amount of water required to obtain a controlled workability or consistency. Workability is the ease at which the concrete can be compacted, the ease at which the concrete can flow and ability of the concrete to remain a homogenous mass without the constituents segregating. The measure of consistency for this research was the slump test to BS EN 12350-2. BS EN 206-1 gives five consistency classes, SI to S5, each with a range of slumps measured in millimetres. For general use the industry standard is an S2 with a range 50mm to 90mm the target being 70mm. Adding water to the mix reduces yield but also reduces cohesion. The addition of a dispersing admixture causes the cement particles to distribute more uniformly, therefore increasing the fluidity of the mix at a given water content. All of the mixes used within this research achieved a slump of 70mm.
3.3 Compressive strength
Traditionally, the compressive strength of concrete has been used as a tool for a measure of the quality. Both strength and durability are controlled by the ratio of cement contained within the mix design and water used to hydrate the mix. By ensuring an adequate strength has been achieved and the water/binder (w/b) ratio remains within British Standard limits a sufficient level of durability is also ensured. Testing for compressive strength has been carried out in accordance with BS EN 12390-3 at 1, 2, 7 and 28 days using concrete cubes of 1 0 0 x 1 0 0 x 1 0 0 mm, w/b ratio limits are taken from BS EN 8500-2.
3.4 Particle distribution
The particle distribution and size are of particular significance to the use of a cement replacement material. To achieve a high strength low permeability and durable concrete, it is necessary to reduce the porosity
of the cement paste. It is well know that the incorporation of a pozzolanic material as a partial replacement of cement refines the porosity and pore size distribution of the paste (Chindaprsirt, 2005).
4. RESULTS AND DISCUSSION
4.1 Compressive strength
BS EN 206-1 states that the compressive strength of the concrete shall exceed the design strength by an adequate margin at 28 days. The margin given by the standard is twice the expected standard deviation and should fall between the values of 6 - 12N/mm . The standard deviation used for this research is 3.5N/mm2, that of the company supplying the mix design. Therefore, the compressive strength at 28 days should be 42N/mm2 for conformity.
Figure 1 (a-e) shows the compressive strength of the concretes at 10, 20, 25, 30 and 50% replacement respectively together with the standard OPC mix. It is well recorded that concrete containing combination cements tend
50 E
30 I
10 Q.
0 7 14 21 28
Time (days)
(a)
—•—G G BS 20% - IM 20% — FA 20% > M SW 20% - " - S S 2 0 % OPC
40 5
30 £ HI •
20 i
10 a.
o 7 14 21 28
Time (days)
(b)
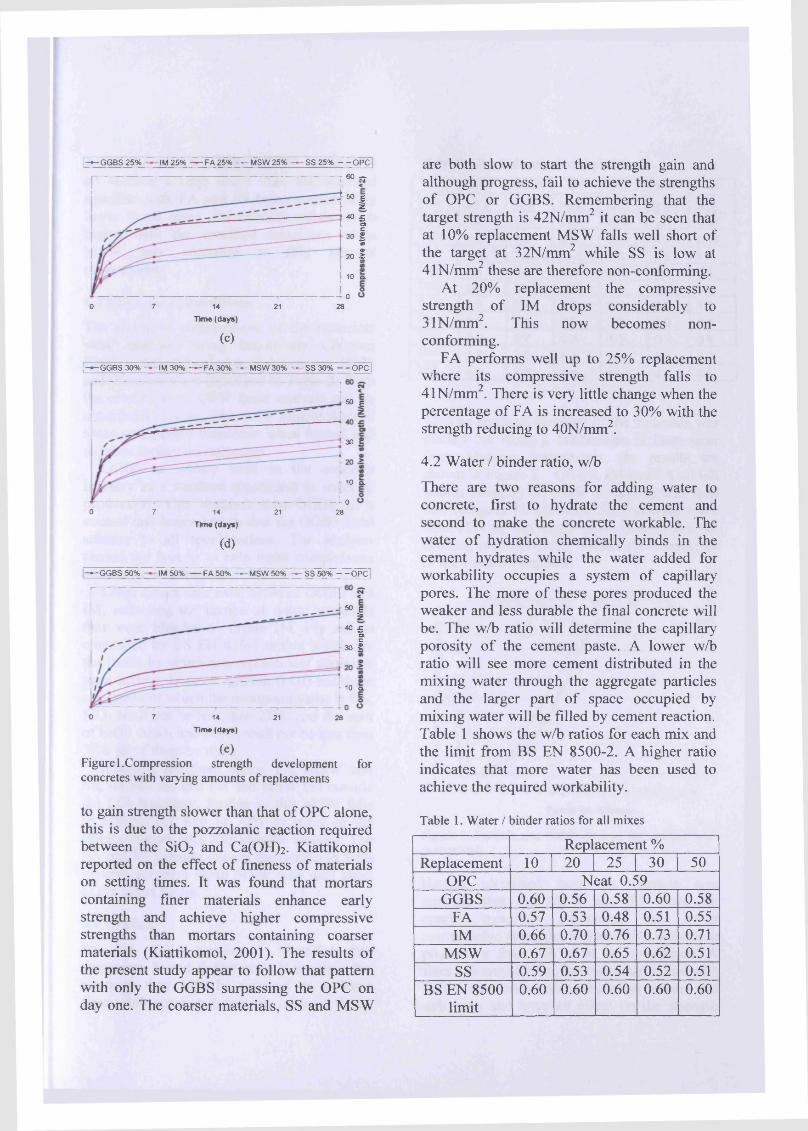
j—*—GGBS 25% » IM 25% —— F A 25% - MS W 25% ^ SS 25% - - OPC
60 c r
50 Iz40 £
O)
30! 20 |10 Q.
070 14 21 28
Time (days)
(c)
I-— GGBS 30% — IM30% — FA 30% —-MSW30% — SS30% -~O PC |
50 E
30
10 o.
00 7 14 21 28
Ttm« (days)
(d)
— GGBS 50% IM 5 0% FA 50% - MSW50% — SS 50% - - O P C
50 £40 £
a tc30 |
10 Q.
0 7 14 21 28
Time (days)
(e)Figure 1.Compression strength development for concretes with varying amounts of replacements
to gain strength slower than that of OPC alone, this is due to the pozzolanic reaction required between the Si02 and Ca(OH)2. Kiattikomol reported on the effect of fineness of materials on setting times. It was found that mortars containing finer materials enhance early strength and achieve higher compressive strengths than mortars containing coarser materials (Kiattikomol, 2001). The results of the present study appear to follow that pattern with only the GGBS surpassing the OPC on day one. The coarser materials, SS and MSW
are both slow to start the strength gain and although progress, fail to achieve the strengths of OPC or GGBS. Remembering that the target strength is 42N/mm2 it can be seen that at 10% replacement MSW falls well short of the target at 32N/mm2 while SS is low at 41N/mm2 these are therefore non-conforming.
At 20% replacement the compressive strength of IM drops considerably to 31N/mm2. This now becomes non- conforming.
FA performs well up to 25% replacement where its compressive strength falls to 41N/mm2. There is very little change when the percentage of FA is increased to 30% with the strength reducing to 40N/mm2.
4.2 Water / binder ratio, w/b
There are two reasons for adding water to concrete, first to hydrate the cement and second to make the concrete workable. The water of hydration chemically binds in the cement hydrates while the water added for workability occupies a system of capillary pores. The more of these pores produced the weaker and less durable the final concrete will be. The w/b ratio will determine the capillary porosity of the cement paste. A lower w/b ratio will see more cement distributed in the mixing water through the aggregate particles and the larger part of space occupied by mixing water will be filled by cement reaction. Table 1 shows the w/b ratios for each mix and the limit from BS EN 8500-2. A higher ratio indicates that more water has been used to achieve the required workability.
Table 1. Water / binder ratios for all mixes
Replacement %Replacement 1 0 2 0 25 30 50
OPC Neat 0.59GGBS 0.60 0.56 0.58 0.60 0.58
FA 0.57 0.53 0.48 0.51 0.55IM 0 . 6 6 0.70 0.76 0.73 0.71
MSW 0.67 0.67 0.65 0.62 0.51SS 0.59 0.53 0.54 0.52 0.51
BS EN 8500 limit
0.60 0.60 0.60 0.60 0.60
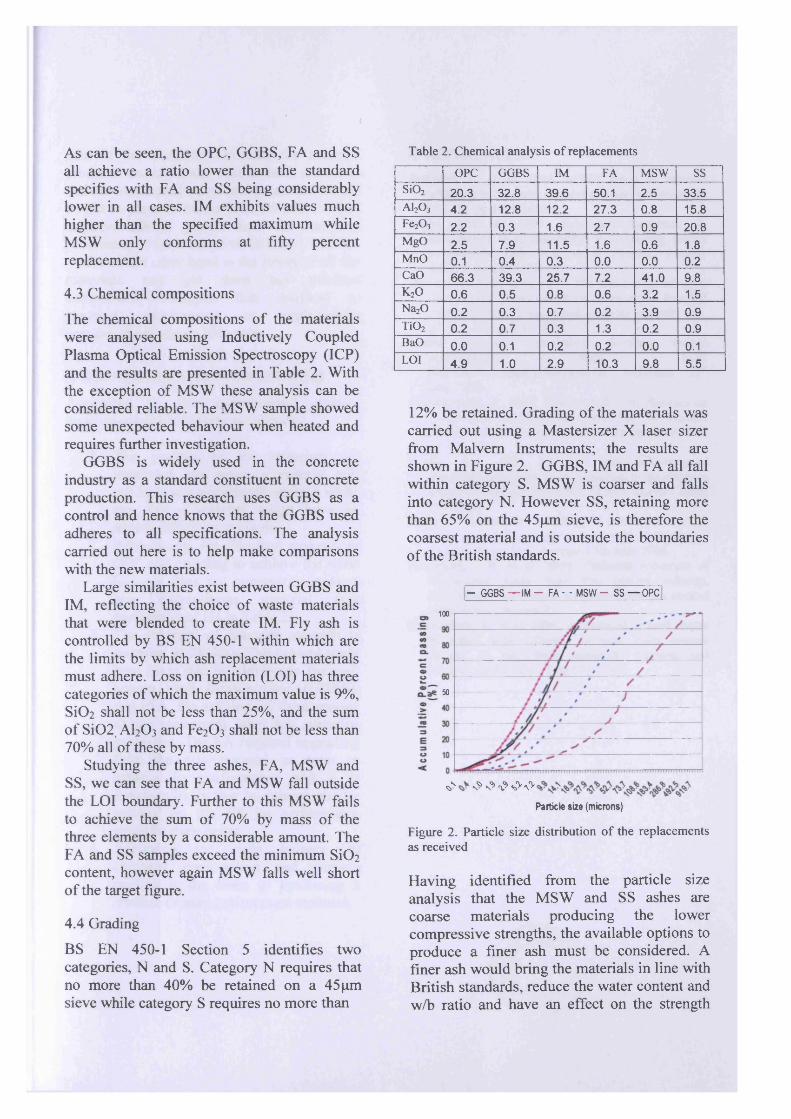
As can be seen, the OPC, GGBS, FA and SS all achieve a ratio lower than the standard specifies with FA and SS being considerably lower in all cases. IM exhibits values much higher than the specified maximum while MSW only conforms at fifty percent replacement.
4.3 Chemical compositions
The chemical compositions of the materials were analysed using Inductively Coupled Plasma Optical Emission Spectroscopy (ICP) and the results are presented in Table 2. 'With the exception of MSW these analysis can be considered reliable. The MSW sample showed some unexpected behaviour when heated and requires further investigation.
GGBS is widely used in the concrete industry as a standard constituent in concrete production. This research uses GGBS as a control and hence knows that the GGBS used adheres to all specifications. The analysis carried out here is to help make comparisons with the new materials.
Large similarities exist between GGBS and IM, reflecting the choice of waste materials that were blended to create IM. Fly ash is controlled by BS EN 450-1 within which are the limits by which ash replacement materials must adhere. Loss on ignition (LOI) has three categories of which the maximum value is 9%, SiC>2 shall not be less than 25%, and the sum of Si02? AI2O3 and Fe2C>3 shall not be less than 70% all of these by mass.
Studying the three ashes, FA, MSW and SS, we can see that FA and MSW fall outside the LOI boundary. Further to this MSW fails to achieve the sum of 70% by mass of the three elements by a considerable amount. The FA and SS samples exceed the minimum Si0 2
content, however again MSW falls well short of the target figure.
4.4 Grading
BS EN 450-1 Section 5 identifies two categories, N and S. Category N requires that no more than 40% be retained on a 45 pm sieve while category S requires no more than
Table 2. Chemical analysis of replacements
12% be retained. Grading of the materials was carried out using a Mastersizer X laser sizer from Malvern Instruments; the results are shown in Figure 2. GGBS, IM and FA all fall within category S. MSW is coarser and falls into category N. However SS, retaining more than 65% on the 45pm sieve, is therefore the coarsest material and is outside the boundaries of the British standards.
- GGBS — IM - FA ■ - MSW - SS — OPC
100
50
* s* v? * # +Particle size (microns)
Figure 2. Particle size distribution of the replacements as received
Having identified from the particle size analysis that the MSW and SS ashes are coarse materials producing the lower compressive strengths, the available options to produce a finer ash must be considered. A finer ash would bring the materials in line with British standards, reduce the water content and w/b ratio and have an effect on the strength
OPC GGBS IM FA MSW SSSi02 20.3 32.8 39.6 50.1 2.5 33.5AI2O3 4.2 12.8 12.2 27.3 0.8 15.8FeaOj 2.2 0.3 1.6 2.7 0.9 20.8MgO 2.5 7.9 11.5 1.6 0.6 1.8MnO 0.1 0.4 0.3 0.0 0.0 0.2CaO 66.3 39.3 25.7 7.2 41.0 9.8K20 0.6 0.5 0.8 0.6 3.2 1.5Na20 0.2 0.3 0.7 0.2 3.9 0.9Ti02 0.2 0.7 0.3 1.3 0.2 0.9BaO 0.0 0.1 0.2 0.2 0.0 0.1LOI 4.9 1.0 2.9 10.3 9.8 5.5
gain of the concrete. Grinding the material produces an additional cost in both monetary and environmental terms and measures should be put in place to assess both the positive and negative effects gained from the use and processing of these materials (Bijen, J, 1999).
IM on the other hand is the finest of all the materials and yet does not produce compressive strengths that conform to standard requirement at replacement concentrations above 10% m/m.
5. DISCUSSION AND CONCLUSIONS
According to the experimental results, conclusions can be drawn as follows:
1. The grading of the materials are important, too coarse a material will not have any pozzolanic reaction while too fine a material might have an adverse effect on strength.
2. Reproducing the chemical makeup o f OPC and grinding to achieve the same fineness does not necessarily make a new cementitious material (see conformity of IM in Table 2).
3. The measure of concrete strength is recorded at 28 days. The present study here finds that in addition to the well known blast furnace slags (GGBS), and PFA, the ash derived from sewage sludge incinerator ashes has attractive properties. The FA required upgrading from the raw material in order to achieve its performance and it is therefore likely that by using a similar process on the SS its performance might be even better.
4. Achieving the right balance of chemical composition and particle grading is the basis to producing a credible cement replacement material.
6. REFERENCESBertolini, L. et al. 2004. MSWI ashes as mineral
additions in concrete. Cement and concrete research. Vol. 34, pp 1899-1906.
Bijen, J.M.J.M. 1999. Secondary materials: Acontribution to sustainability? In Exploiting wastes in concrete, Dhir, R.K. et al. London, Thomas Telford, pp 209 - 216.
Bouzoubaa, M.H. et al, 1997. The effect of grinding on the physical properties of fly ashes and a Portland cement clinker. Cement and concrete research. Vol. 27, No. 12, pp 1861-1874.
British Cement Association, Working toward sustainability, 2005. PDF.http://www.cementindustry.co.uk Accessed 13th May 2006.
Chindaprasirt, P. 2005. Effect of fly ash fineness on compressive strength and pore size of blended cement paste. Cement and concrete composites 27 pp 425-428
Davies, L.J. 2003. Strength and environmental considerations when using industrial by-products as partial cement replacements. M.Phil Thesis Cardiff University.
Defra. Emissions trading schemes, PDF, http://www.defra.gov.uk/environment/climatechang e/trading/index.htm. Accessed 5th June 2006.
Hendricks, C.A. et al. 2004. Emission reduction of Greenhouse gases from the cement industry. Proceedings, conference on greenhouse gas control technologies. August 23.
Kiattikomol, K, et al. 2001. A study of ground coarse fly ashes with different fineness from various sources as pozzolanic materials. Cement and concrete composites 23 pp 335 - 343