
Process Evaluation Report Quality Initiatives in CEmONC (L3 ...
130
Process Evaluation Report Quality Initiatives in CEmONC (L3), BEmONC (L2), and Delivery Points (L1) in Madhya Pradesh Madhya Pradesh Technical Assistance and Support Team (MPTAST) under the Madhya Pradesh Health Sector Reforms Programme (MPHSRP) August 2015 Submitted to: Department for International Development, UK Submitted by: Madhya Pradesh Technical Assistance and Support Team (MPTAST) FHI 360 H-5, GROUNDFLOOR, GREENPARK EXTENSION NEW DELHI 110016 TEL: 91-11-4048-7777 www.fhi360.org
-
Upload
khangminh22 -
Category
Documents
-
view
0 -
download
0
Transcript of Process Evaluation Report Quality Initiatives in CEmONC (L3 ...

Process Evaluation Report Quality Initiatives in CEmONC (L3), BEmONC (L2), and Delivery Points (L1) in Madhya Pradesh
Madhya Pradesh Technical Assistance and Support Team (MPTAST)
under the Madhya Pradesh Health Sector Reforms Programme
(MPHSRP)
August 2015
Submitted to:
Department for International Development, UK
Submitted by:
Madhya Pradesh Technical Assistance and Support Team (MPTAST)
FHI 360 H-5, GROUNDFLOOR, GREENPARK EXTENSION NEW DELHI 110016 TEL: 91-11-4048-7777 www.fhi360.org

Contributors
CORT Study Team
Dr Sandhya Barge
Dr Mital Petiwale
Ms. Seema Narvekar
Ms. Premlata Kshatriya
Technical Monitor
Mr. Nilesh Pandey, Senior Research Specialist, MPTAST, FHI360, Bhopal, India
Government of Madhya Pradesh
Mr. Faiz Ahmed Kidwai (IAS), Mission Director, NHM, Madhya, Pradesh
Dr. Pankaj Shukla, Dy. Director Urban Health, NHM, Madhya, Pradesh
Dr. D. K. Gaur, Dy. Director, NHM, Madhya, Pradesh
DFID India
Dr. Rashmi Kukreja, Health Advisor DFID India
Mr. Sanjay Sharma, State Representative, Madhya Pradesh
FHI 360/India Team
Dr. Bitra George, Country Director
Ms. Sumita Taneja, Director - Programs
MPTAST/ Bhopal Team
Dr. S. Krishnaswamy, Team Leader
Dr. Aboli Gore, Deputy Team Leader Health,
Mr. S. Fareed Uddin, Expert Quality Assurance

Preface
In addressing MDG goals, maternal and neonatal mortality continues to remain a high priority in
health sector and a challenge to program managers. Ensuring maternal health guarantees wellbeing
for the family, community and nation as it has profound effect on health of women and survival of
newborn. Indicators for maternal mortality and morbidity also reflect on functioning of health
system. Under National Health Mission, health facilities have been identified to provide Basic and
Comprehensive Emergency Obstetric and Newborn Care. Despite increase in institutional delivery
(76 percent) in the state of Madhya Pradesh, issues related to quality of care in public health
institutions including availability, utilization, affordability, accessibility and adequate coverage of
services prevails. There is also recognition that public health facilities face a number of challenges
including lack of human resource, skills, infrastructure, equipment and supplies.
Working with Madhya Pradesh Department of Public Health and Family Welfare (DoPH&FW),
the Madhya Pradesh Technical Assistance and Support Team (MPTAST) is providing technical
assistance in strengthening public health facilities with a focus on quality improvement for
maternal, neonatal and child health services within the state. It initiated quality assurance and
improvement at state, district and block levels under its quality initiatives by forming and
strengthening Quality Assurance Committees (QACs) at various levels in 16 high priority districts
of Madhya Pradesh. Assisting them, Centre for Operations Research and Training (CORT) a
multidisciplinary social science research organization undertook a study to assess the quality of
services related to obstetric and newborn care in public health facilities namely CEmONC (L3
level), BEmONC (L2 level) and Delivery Point (L1 level) on account of Quality Assurance
Initiative.
We take this opportunity to thank MPTAST core team members particularly Dr. Krishnaswamy,
Dr. Nilesh Pandey, Dr. Aboli Gore, and Dr. S Fareed Uddin for providing valuable inputs at various
stages of project implementation. We are grateful for their support. We also thank Mr. Umashankar
and Ms. Rajita Agarwal from MPTAST for their timely support. It would have been impossible to
implement the study without the cooperation and assistance of officials at various levels of health
system. We humbly thank the district and block level officials for facilitating and taking an active
part in the study. Our sincere gratitude to all Medical officers, Nurses, Lab technicians and other
staff members of sampled health facilities for giving us the requisite time. Last but not the least the
beneficiaries who responded in this study. Contribution of each member has facilitated in making
this report a valuable document of present strengths and needs of the system.
We wish to put on record the sincere efforts made by all the team members of CORT. Dr. Mital
Petiwale, Ms. Seema Narvekar, Ms. Premlata Kshatriya who worked relentlessly. We also
appreciate the services rendered by our field team members namely Dr. Mukesh Gadhvi, Dr.
Vaibhav Gupta, Mr. Balaji Chakravar and the entire field team members for helping in the
completion of study.
Dr. Sandhya Barge August 2015
Executive Director, CORT

Table of Contents
Executive Summary ............................................................................................................................... i Chapter 1 Introduction ........................................................................................................... 1 Background ............................................................................................................................................. 1 Madhya Pradesh Health Sector Reform Programme (MPHSRP) ............................................................ 1 Mechanism of MPTAST ........................................................................................................................... 2 Study Objective ....................................................................................................................................... 2 Study Area ............................................................................................................................................... 3 Methodology ........................................................................................................................................... 3 Training and field work ........................................................................................................................... 4 Data Collection ........................................................................................................................................ 4 Quality Assurance ................................................................................................................................... 5 Challenges ............................................................................................................................................... 5 Chapter 2 Infrastructure ..................................................................................................... 7 Premises .................................................................................................................................................. 7 Waiting Area ........................................................................................................................................... 8 Outdoor Patient Department (OPD) ....................................................................................................... 9 Ambulance .............................................................................................................................................. 9 Electrical Supply ...................................................................................................................................... 9 Fire Extinguisher ................................................................................................................................... 10 Water Supply......................................................................................................................................... 10 Composite Index for Infrastructure ...................................................................................................... 10 Emergency Room .................................................................................................................................. 12 Human Resources (HR) ......................................................................................................................... 13 Characteristics of Medical Officer ......................................................................................................... 15 Characteristics of Nurses ...................................................................................................................... 16 Place of Nurse Posting in Facility .......................................................................................................... 17 Nurses Working in Shift Duties ............................................................................................................. 17 Technical Capacity of Medical Officer ................................................................................................... 18 Technical Capacity of Nurses ................................................................................................................ 20 Chapter 3 Obstetric Care .................................................................................................. 24 Antenatal and Prenatal Wards .............................................................................................................. 24 Labor Room ........................................................................................................................................... 25 Minor Operation Theatre (OT) .............................................................................................................. 28 OT Surgical Instruments for CEmONC Services ..................................................................................... 29 Emergency Drugs (including Neonates) for OT ..................................................................................... 31 Functionality of CEmONC ...................................................................................................................... 32 Services Provided .................................................................................................................................. 32 Nature of Services Provided by Health Personnel ................................................................................ 34 Type of Services provided by Nurses .................................................................................................... 35 Type of Services provided during ANC .................................................................................................. 37 Type of Services provided by Medical Officers ..................................................................................... 38 Cliental Services .................................................................................................................................... 47 Core Competencies of Skilled Birth Attendants .................................................................................... 50 Core Competencies of SBA providing Care at CEmONC ....................................................................... 51

Chapter 4 New Born Care .................................................................................................. 53 New Born Corner .................................................................................................................................. 53 Neonatal Stabilization Unit (NSU) ......................................................................................................... 54 Chapter 5 Clinical Laboratory ............................................................................................ 59 Logistics at Laboratory .......................................................................................................................... 59 Type of Tests Conducted ....................................................................................................................... 59 Characteristics of Laboratory Technician .............................................................................................. 60 Services provided by Laboratory Technician ........................................................................................ 62 Chapter 6 Drugs ................................................................................................................... 65 Essential Drug List (EDL) ........................................................................................................................ 66 Observations for the Drugs being dispensed from Pharmacy .............................................................. 66 Chapter 7 Infection Prevention and Bio-Medical Waste Management ................................... 67 Infection Prevention ............................................................................................................................. 67 Infection Control ................................................................................................................................... 68 Fumigation ............................................................................................................................................ 69 Hygiene and Sanitation Observation .................................................................................................... 69 Bio-medical Waste Management ........................................................................................................ 69 Chapter 8 Utilization of Services and Level of Satisfaction among Beneficiaries ................... 73 Profile of Beneficiaries ........................................................................................................................ 73 Mode of transportation used by beneficiaries to reach facility ....................................................... 74 Person accompanying beneficiary to facility .................................................................................... 75 Services availed in Facility .................................................................................................................. 75 Chapter 9 Quality Assurance Process, Support, Sustainability ............................................... 84 District Quality Assurance Cell (DQAC) ............................................................................................. 84 Block Qualitative Team (BQT) ............................................................................................................ 86 Medical Officers, Nurses and Lab Technicians .................................................................................. 88 Mentoring /supportive supervision for Nurses ................................................................................ 91 Quality Assurance Discussion ............................................................................................................ 92 District Quality Team Visit .................................................................................................................. 93 Constrains faced by Nurse .................................................................................................................. 93 Facilities at a Glance ............................................................................................................................. 96 Glimpses from field ........................................................................................................................... 101 Annexure 1: Components considered for Calculating Composite Index ..................................... 102 Annexure – 2: Definition .................................................................................................................. 115 Annexure – 3: List of Labour Room Trays .................................................................................... 116 References .......................................................................................................................................... 117

Executive Summary
Background
Tackling maternal and neonatal mortality continues to remain a high priority in the health
sector. Ensuring maternal health guarantees wellbeing of the family, community and nation as
it has profound effect on health of women and survival of newborn. Care for mother and
newborn has to be provided from conception till the first 42 days after delivery at home/
community levels, institutions where delivery takes place and again at home following
discharge from facility. Indicators for maternal mortality and morbidity also reflect on the
health system and its functioning. Under NHM health facilities has been identified to provide
Basic and Comprehensive Emergency Obstetric and Newborn Care. Considering the health
delivery system, depending on type of facility L1 level facilities are usually the Sub Health
Centers (SHC) and Primary Health Centres (PHC) that provides delivery services. BEmONC
facility are L2 level facilities which is provided through PHC and Community Health Centers
(CHC), and CEmONC are L3 level facility which are usually the CHC and District Hospital
(DH)/ civil hospital.
Joining hands with Madhya Pradesh Department of Public Health and Family Welfare
(DoPH&FW), the Madhya Pradesh Technical Assistance and Support Team (MPTAST) is
providing technical assistance in strengthening of public health facilities with a focus on quality
improvement for maternal, neonatal and child health services within the state. It initiated
quality assurance and improvement at state, district and block levels under its quality initiatives
by forming and strengthening Quality Assurance Committees (QACs) at various levels in 16
high priority districts of Madhya Pradesh.
Objective of Study Present study was undertaken by Centre for Operations Research and Training a
multidisciplinary social science research organization to assess the quality of services related
to obstetric and newborn care in public health facilities namely CEmONC (L3 level),
BEmONC (L2 level) and Delivery Point (L1 level) on account of Quality Assurance Initiative.
Study Design Using delivery case load at the facility, study facilities were selected in each district for each
level of facility using Probability Proportion to Size (PPS). The study covered 70 public health
facilities that included 18 CEmONC (L3), 32 BEmONC (L2) and 20 Delivery Points (L1)
facilities.
A combination of both quantitative and qualitative approaches was used to elicit the required
information. Data was gathered using a structured checklist for each type of facility across the
levels. In addition service providers (medical officers (105), nurse /ANM (155) and laboratory
technician (54)) and beneficiaries (IPD (483) and OPD (485)) were also interviewed.
Analysis of the findings have been presented in terms of percentages and composite index that
have been prepared for various study components. Percentages needs to be interpreted
cautiously especially for level wise facility data on account of small ‘N’. Further scoring of
sub- components was done to arrive at Composite Index (CI) that have been categorized as

Executive Summary
ii
very good (>75 percent), good (50.1-75 percent), poor (25.1-50 percent) and very poor (<25
percent).
Key findings
Infrastructure: Facilities were assessed for their
by looking into the premises (sign board, boundary
wall, control entry and exit approach road etc.),
waiting area (seating arrangement, drinking water
facility, display of doctor name, display of timings
etc), OPD facility (privacy, examination table with
footstep, hand washing facility etc.), ambulance
services, fire extinguisher and electrical supply
were available and functional, water supply
(source and safe drinking water), staff quarters and
toilets in a given facility. Inadequacy in these
amenities was observed largely at the lower level
facilities. The composite index revealed that
baring a few facilities at L2 and L1 levels,
largely L3 facilities were falling in ‘very good’
category.
Human Resource: All facilities did
not have the required human
resources as per their level or
nature of facility. In some L3
facilities specialist doctors were
available on call basis. Considering
that the facility had to serve as 24/7,
medical officers especially in L1 and
L2 level were doing their duty hours
as well as available for emergency call
24/7.
Considering the nature of services
provided by providers and essential manpower (based on level and type of facility) data
revealed that 80 percent facilities at L1 followed by 72 percent at L2 had the essential human
resources, while at L3, this was found to be 61 percent only, mainly on account of lack of
specialist doctors as per norm.
Study gathered information on various on the job training received by Medical officers and
Nurses. Data indicates that the extent of trainings received by providers largely came in ‘very
poor’ to ‘poor’ category across the three levels of facilities.
Obstetric care: Status of ANC/PNC wards at L2 and L3 levels relatively were found to be
‘good’ to ‘very good’ in case of 94-97 percent of facilities. At L1, this was 50 percent, with 35
percent facilities falling in the category of poor. Over all, three facilities from L1 and one from
L2 level were found to be very poor in terms of ANC/PNC wards in term of bed capacity,
cleanliness of wards, privacy, security and availability of basic equipment like BP apparatus,
puncture proof boxes, etc.
5
20
9
60
50
11
15
41
89
0
20
40
60
80
100
L1 L2 L3
Composite Index Infrastructure
very good good poor very poor
Position of Human Resource
Only one ANM in position in 25 % L1 facility No medical officer in 29 percent of PHC at L1
and 18 percent of PHC at L2 level Specialist doctors not available in all L3 facility
No Gynecologists in 11 percent facility, in 44 percent facility one available
No Pediatrician in 6 percent facility, in 39 percent facility one available
No Anesthetists in 17 percent facility, in 66 percent facility one available
Executive Summary
iii
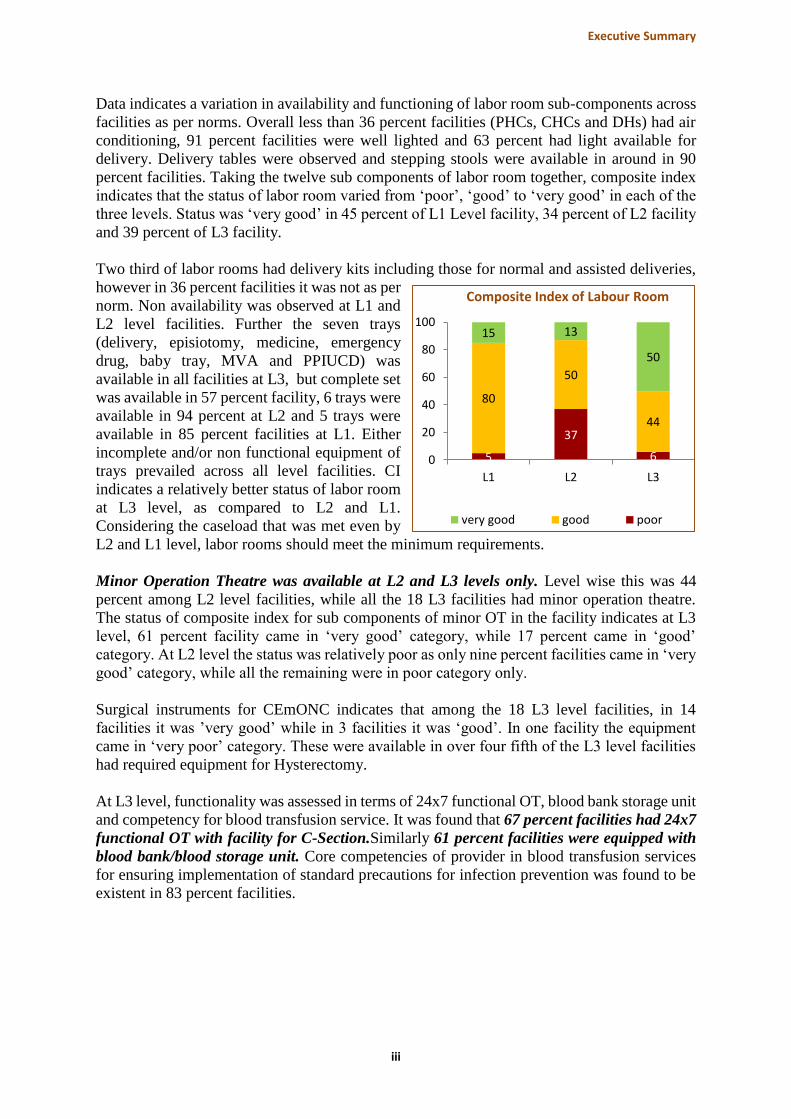
Data indicates a variation in availability and functioning of labor room sub-components across
facilities as per norms. Overall less than 36 percent facilities (PHCs, CHCs and DHs) had air
conditioning, 91 percent facilities were well lighted and 63 percent had light available for
delivery. Delivery tables were observed and stepping stools were available in around in 90
percent facilities. Taking the twelve sub components of labor room together, composite index
indicates that the status of labor room varied from ‘poor’, ‘good’ to ‘very good’ in each of the
three levels. Status was ‘very good’ in 45 percent of L1 Level facility, 34 percent of L2 facility
and 39 percent of L3 facility.
Two third of labor rooms had delivery kits including those for normal and assisted deliveries,
however in 36 percent facilities it was not as per
norm. Non availability was observed at L1 and
L2 level facilities. Further the seven trays
(delivery, episiotomy, medicine, emergency
drug, baby tray, MVA and PPIUCD) was
available in all facilities at L3, but complete set
was available in 57 percent facility, 6 trays were
available in 94 percent at L2 and 5 trays were
available in 85 percent facilities at L1. Either
incomplete and/or non functional equipment of
trays prevailed across all level facilities. CI
indicates a relatively better status of labor room
at L3 level, as compared to L2 and L1.
Considering the caseload that was met even by
L2 and L1 level, labor rooms should meet the minimum requirements.
Minor Operation Theatre was available at L2 and L3 levels only. Level wise this was 44
percent among L2 level facilities, while all the 18 L3 facilities had minor operation theatre.
The status of composite index for sub components of minor OT in the facility indicates at L3
level, 61 percent facility came in ‘very good’ category, while 17 percent came in ‘good’
category. At L2 level the status was relatively poor as only nine percent facilities came in ‘very
good’ category, while all the remaining were in poor category only.
Surgical instruments for CEmONC indicates that among the 18 L3 level facilities, in 14
facilities it was ’very good’ while in 3 facilities it was ‘good’. In one facility the equipment
came in ‘very poor’ category. These were available in over four fifth of the L3 level facilities
had required equipment for Hysterectomy.
At L3 level, functionality was assessed in terms of 24x7 functional OT, blood bank storage unit
and competency for blood transfusion service. It was found that 67 percent facilities had 24x7
functional OT with facility for C-Section.Similarly 61 percent facilities were equipped with
blood bank/blood storage unit. Core competencies of provider in blood transfusion services
for ensuring implementation of standard precautions for infection prevention was found to be
existent in 83 percent facilities.
5
37
6
80
50
44
15 13
50
0
20
40
60
80
100
L1 L2 L3
Composite Index of Labour Room
very good good poor

Executive Summary
iv
Delivery case load: Variation regarding average number
of deliveries conducted per month was observed across the
levels and type of facilities. Average deliveries conducted
per month was much more than what the level was expected
to provide in some facilities. Assessing the deliveries
conducted in the facility as compared to expected (5 at L1,
10 at L2 and 270 at L3 : Maternal and Newborn Health
Toolkit, MoPH&FW, 2013) data indicates that 80 percent facilities at L1 and 66 percent at
L2 level were conducting more than the required expected number of deliveries each month.
At L3 level, half the facilities were conducting less than expected. Findings suggest that
demand for services exist at all levels which also indicates use of institutional service in rural
areas, however the caseload presently met by certain facilities could have adverse implication
on quality of service they provide.
Regarding the maternal care services provided, the data
indicates that 80-86 percent of doctors mentioned that they
provided services like Antenatal Care, Intra-natal Care,
New Born Care and Postnatal Care. However, abortion
services were provided only by little over half of the doctors. Providers should be equipped
with necessary skills to provide counseling and facilitation for safe abortion service. While in
case of nurses, 79-86 percent of nurses provided services in terms of Antenatal Care, Intra-
natal Care and Postnatal Care while only 40 percent nurses were involved in providing/assisting
in abortion services.
New Born Care: New born corner in health
facilities conducting deliveries need to
ensure certain amenities. Resuscitation
facility was available in 79 percent facilities
except for certain facilities at L1 and L2. .
Zero dose immunization according to GOI
schedule and Inj. Vitamin K was reported
from 71 percent facilities. Composite index
for new born care corner indicates all
facilities at L3 level had the required sub
components for addressing new born care.
Facilities at L1 and L2 level need to be
further strengthened on these aspects as it has the potentiality to influence the reduction of
infant mortality.
Neonatal Stabilization Unit were observed at PHC, CHC and DH levels. To ensure baby
maintains body temperature presences of radiant warmer is essential. Sixty eight percent
facilities had open care system having radiant warmer with trolley, drawers and oxygen bottles
and 72 percent facilities had hand operated neonate resuscitator. Status of CI for NSU across
the levels varied from ‘very poor’ to ‘very good’.
At CEmONC level, CI of Sick Newborn Care Unit in terms of required equipments, supplies
drugs etc indicates that in 89 percent facilities the status was ‘very good’/ ‘good’.
Clinical laboratory: Composite index indicates that all laboratory facilities at L3 and 50
percent facilities at L2 were found to be ‘very good’ in terms of logistics for the laboratory
54 percent medical officers
provided abortion services
Average number of deliveries
conducted per month level wise
L1 – 12 L2 – 75 L3 – 350
20 25
15 3
15 28
50 44
100
0
20
40
60
80
100
L1 L2 L3
Composite Index of New Born Corner
very good good poor very poor

Executive Summary
v
and test conducted. Status of CI in PHCs of L1 category scored ‘very poor’. Laboratory
technician was not posted in half the PHC of L2 category. Lack of these human resources would
have an implication on service provided.
Pharmacy and Stock: Depending on type of health facility, drugs under Essential Drug List
(EDL) have to be available. At L1 level, 30 percent facilities had this, while at L2 and L3 level
this was 41 percent and 39 percent respectively. Observation revealed that in 27 percent
facilities, at least one of the drugs observed being dispensed over the counter had actually
crossed the expiry date.
Infection control and bio waste management: In 68 percent facilities, guidelines for infection
control were available. OT was fumigated in 94 percent DH facilities and swab testing was
done in 72 percent.
All the facilities at L3 had an authorization with MPPCB. While at lower levels especially the
rural areas like SHC and PHC, this was found to be very low. It was observed that 41 percent
of the facilities had Common Bio Medical Waste Treatment Facility (CBWTF) agreement.
While among the remaining 59 percent facilities deep burial pits and sharp pits were available
in 61 percent of facilities.
Clients satisfaction with services: Maternal health services were sought by beneficiaries (IPD
- 73 percent, OPD – 53 percent) although residing in another villages /towns than where the
heatlh facility was located. More than half (52 percent) of the IPD beneficiaries had used the
services of Janani express/108 ambulance to reach the facility. Over half (59 percent) of IPDs
beneficiaries were accompanied by ASHA this was 91 percent at L1 level, while at L2 and L3
level it was 52 and 58 percent respectively. IPD beneficiaries had come mainly (88 percent)
for their delivery. Around three fourth of the beneficiaries acknowledged that the newborns
had received BCG and Polio drops as part of immunization in the facility.
Ninety three percent of the beneficiaries had initiated breastfeeding to the new born. Seventy
six percent beneficiaries reiterated that behavior of the nurse/ doctor towards them was very
polite. Beneficiaries mentioned that they had received morning tea (87 percent), breakfast (85
percent), lunch (71 percent), afternoon tea/milk (68 percent) and dinner (67 percent) from the
facility. Almost all (97 percent) beneficiaries were satisfied with the quantity and quality of
food received.
Both IPD (22 percent) and OPD (34 percent) beneficiaries had incurred expenses across the
levels of facility. High level of satisfaction regarding
services received by beneficiaries prevailed. Almost all
IPD and OPD beneficiaries did perceive that they were
safe and did not perceive any threat from anyone in the
facility.
IEC material: Array of IEC material like infection prevention and control, ANC, during labor,
PNC, New Born Care etc. were available and displayed in facility. Pattern of availability of
IEC materials was more or less similar across the level of facilities with almost 72-78 percent
facilities could be categorized as ‘good’ to ‘very good’ in CI. Three out of five (60 percent)
IPD beneficiaries had seen the IEC materials displayed in the facilities, out of which 31 percent
mentioned that IEC material was explained to them largely by nurses.
97 percent of IPD and OPD
beneficiaries were satisfied with
services received in ward / facility

Executive Summary
vi
Quality Assurance: DQAC were formed since 2010 under the chairmanship of the District
Collector and the CHMO was the convener and in absence of the collector, the CMHO can
chair the meeting. At District Hospital level, District Quality Team (DQT) was formed and was
chaired by the Civil Surgeon. With respect to functionality, it was found that for dissemination
of QA Policy and guidelines, on receipt of guidelines from state, on CHMOs orders, guidelines
were circulated to district and block members. Meetings were conducted with district level and
block level officials for the same and if required, training were conducted. Ensuring standards
of Quality of Care in the district, visits were undertaken by MPTAST members and DHOs to
the facilities in some places. Team members from Doctor Express which consisted of three to
four experts from the district did visit the delivery point facilities once in a month for support,
supervision and monitoring. Apart from this, from time to time, coordinators from MPTAST
had also undertaken field visits at some places. PHN also goes for visits. Generally supportive
supervision checklist was used and followed for the review. For ensuring sustainability of the
initiatives, capacity building of QA teams at various levels had been carried out -at central level
at Indore/Bhopal for the district officials including the DPM, MPTAST had conducted one day
trainings of other district officials and QA was also discussed in DHS meetings. Capacity
building was done in form of circulating the guidelines. Officials were also trained at Bhopal
for Bio Medical Waste Management.
Trainings for SBA, LSAS, EmONC, BEmONC, BMW etc were undertaken at the district level.
Meeting and trainings were used to provide inputs on QA. Inputs were also provided on spot
to the trained staff. Also, it was reported that training of internal assessors was recently carried
out. For ensuring Monitoring, various methods were used by the districts-delivery points were
visited by DQT and BQT teams, Doctors express and sector MOs.VHSND was also visited
every month to observe and monitor. Thus once a month visits were marked to ensure that work
was done as per quality standards. For Coordination with State for dissemination and
implementation of guidelines, initially at some places, discussions were undertaken by
MPTAST members and district officials and reported by MPTAST to SQAC who provided
feedback regarding the gaps and shortages for appropriate measures by the districts. Reporting
to SAQC was done on programmatic performance basis, financial achievement, quality issues
etc. which were discussed in the DHS meetings in which the collector was present and
MPTAST was also involved.
BQT is for the block level and the Block Medical Officer (BMO) chairs it. At the block level,
BQT teams were yet to be crystallized but presently in most of the districts, it was through the
BPMU formed under NRHM that supportive supervision was being carried out. Guidelines
were photocopied and sent to all centers for implementation while in some, weekly visits were
made to the facilities. For supportive supervision, visits were made twice in a week, at facility
level by the block teams and issues were also discussed in the meetings. During the visits,
labour room, records, drugs, cleanliness etc were observed and reviewed at the facility level.
Inputs on quality initiatives were regularly provided in meetings. Sometimes the issues were
covered in other training and in some the BMO oriented the staff at CHC, PHC and SC on
various aspects like quality, labor room, drugs and emergency medicines, how to behave with
patients, how to maintain records, etc. Instances of training of MOs for CEmONC, BEmONC
and BMW, were also observed. Feedback to facilities in block was generally given orally at
the facility level regarding the minor shortfalls while for major problems, it was given in
writing. The quality initiatives were found to be effective as people reported improvement in
terms of infrastructure, in terms of MCDS workplan, HH tracking, parental feedback, post
delivery stay at CHC as well as improvement in terms of privacy, equipment, waste disposal,

Executive Summary
vii
labour room, infection control etc. At some places it was observed that work on QA had become
stagnated as MPTAST members had left and were no more available for support.
Seventy three percent of the MOs mentioned that they had received orientation on QA. It was
found that MPTAST played a major role in
orientation across facilities. Most of the MOs
reported that their respective facilities had been
visited by DQT/BQT. Most of the MOs reported
that QA issues were implemented in their
facilities. Two third of the doctors mentioned that
they had discussion related to quality of services
during mentoring/supportive visits. Seventy two
percent MOs mentioned that they conducted self
appraisal of facility and had discussion with their
staff on weekly/monthly basis. Among all the
medical officers interviewed, only half (50
percent) of them mentioned that they do have a
mechanism for taking client feedback. This varied across the level of facilities as three out of
five at L1, 32 percent at L2 and 60 percent at L3 took cliental feedback. This feedback was
shared with the staff or was reported to higher authorities. Medical officers do face constrains
in providing service which impacts them also in providing 24x7 quality service.
At the nurse’s level, 79 percent mentioned that they had discussions regarding quality
assurance with district officials, block level officials, MPTAST members or their Medical
Officers. Issues pertaining to delivery room, instruments/equipment, Bio Medical Waste
Management, ANC Services and normal delivery,
Immunization, work management, record and
registers etc. were discussed during these
discussions. They also suggested the need to have
more staff (74 percent) training of staff (48 percent)
and to have more doctors (12 percent). Two fifth
(40 percent) of nurses also mentioned that all the
instruments were not available while 26 percent mentioned that they were non-functional. Sixty
two percent nurses mentioned non availability of drugs which needs to be taken care of for
strengthening the services.
Findings suggests that quality initiatives had been undertaken at various levels with
improvement, however further scope of improvement are there if issues of HR, training,
equipment etc. are taken care of.
Considering all study indicators, Composite Index for facility was measured. As indicated in
map schematically, the status of L3 level facility was falling in ‘very good’ category in all 16
districts. Status of L1 and L2 were largely in ‘good’ category. But there were exceptions like
Sidhi, Dindori and Damoh district that had even L1 facility falling in ‘very good’ category. In
contrast Sagar had both L1 and L2 level facility falling in ‘poor’ category, while Dhar and
Damoh district had L2 in ‘poor’ category.
Orientation on quality issues
facilitated nurses
Helped 68 % to take better care
of clients
26 % learned new things
Constraints faced by Medical
Officers in providing quality service
Shortage of staff – 65 %
Doctors not available – 30 %
Shortage of support staff - 20 %
Lack of equipment - 59 %
Nonfunctional equipment -26 %
Weak drug supply -18%
Drugs out of stock -11%
Poor quality of drugs -8%

Executive Summary
viii
CI of Districts
Category L1 L2 L3
Poor (<50%)
Good (51-75%)
Very Good (76% and above)
Recommendations There is demand for services from the health facility in district even from rural community.
Presently this is met by facilities which to some extent have the readiness in terms of its
infrastructure and logistics. However, there were shortcomings. Facility wise issues needs to
understood and addressed. These facilities needs to be supported and strengthened further by
ensuring
availability of human resource
competent human resource
supply chain management of EDL drugs
adherence to protocol regarding infection control and bio waste management practices.
All of the above will lead to better quality assurance. Some facilities have the capacity, others
need to be stirred on this pathway.
.

Chapter 1 Introduction
Background
Reproductive health is fundamental to social and economic development of community and is
core of human development. Globally goals set for Millennium Development Goals (MDGs)
by 2015 include improving maternal health and reducing child mortality. Striving towards
these, there has been some decline but varies across the states. For India, the Maternal Mortality
Ratio (MMR) has come down to178 (2010-2012) from 212 (2007-09). The MDG target for
India is to bring down maternal deaths to 109 by 2015. The 17 per cent decline in the MMR
has been most significant in Empowered Action Group (EAG) of States (which includes
Madhya Pradesh) (257). In Madhya Pradesh and Chhattisgarh the decline has been to 230
(2010-2012). Similarly, the infant mortality rate (IMR) for India has improved to 47 (SRS
2010) from 50 (SRS 2009), but the maximum infant mortality rate has been reported from
Madhya Pradesh (67) against the national average of 50, while the MDG target is of 42 by
2015.
With launching of National Rural Health Mission (NRHM) further efforts are made to improve
the health system and health status of people, especially for those who live in the rural areas,
and provide universal access to equitable, affordable, and quality healthcare. Addressing the
component of Emergency Obstetric and Newborn Care (EmONC) the seven and nine signal
functions identified for basic and comprehensive emergency obstetric and newborn care had
been defined for health facilities. As these are the key interventions for treating the vast
majority of maternal complications and for resuscitation of the newborn after birth. It is well
recognized that all this has to take place within the ambit of Quality of Care. Quality of care
as applied to a public health system is defined as “attributes of a service program that reflect
adherence to professional standards, in a congenial service environment and satisfaction on the
part of the user” (UNFPA Technical Report 1999)
Madhya Pradesh Health Sector Reform Programme (MPHSRP)
Government of Madhya Pradesh (GoMP) is committed to improve access to quality health,
nutrition and water-sanitation related services especially to the poorest, vulnerable and those
in underserved areas. In order to strengthen the capacity of GoMP namely the Department of
Public Health and Family Welfare (DoPH&FW), Department of Women and Child
Development (DWCD) and Public Health Engineering Department (PHED), the Family Health
International (FHI 360) led consortium including Water-Aid, is providing long term Technical
Assistance to MPHSRP through MP Technical Assistance and Support Team (MPTAST).
Despite high rates of institutional delivery (76 percent) in MP, there are still issues with quality
of care in public health institutions including availability, utilization, affordability, accessibility
and adequate coverage of services. There is also recognition that public health facilities face a
number of challenges including lack of human resource, skills, infrastructure, equipment and
supplies.
Through the Madhya Pradesh Health Sector Reform Project (MPHSRP), the Madhya Pradesh
Technical Assistance and Support Team (MPTAST) is providing technical assistance to the
Department of Public Health and Family Welfare (DoPH&FW) in strengthening of public
Quality Initiatives in health facilities in Madhya Pradesh 2
health facilities with a focus on quality improvement for maternal, neonatal and child health
services at the state and district level.
Mechanism of MPTAST
State Level: At the state level, MPTAST has facilitated the formation of a Quality Assurance
(QA) cell which oversees the QA initiatives envisaged by National Rural Health Mission
(NRHM). The QA cell has worked towards strengthening Quality Assurance Committees
(QACs) at the state, division and district level. Further Quality Management teams have been
constituted to support and regularize the QA activities at all levels under the supervision of
QACs. QA cell oversees rating of public health facilities including District Hospitals (DH) and
Civil Hospital (CH) in the state. Further in close coordination with the Maternal Health (MH)
section, development of Model Maternity Wing across all 51 districts is also being anchored
through the QA cell. The Standard Operating Procedures (SOPs) have been developed in
consultation with the National level experts from National Health Systems Resource Centre
(NHSRC).
District Level: At the district level, MPTAST initiated a quality improvement process in one
Comprehensive Emergency Obstetric and Newborn Care (CEmONC) and one Basic
Emergency Obstetric and Newborn Care (BEmONC) facility in Madhya Pradesh in 2012. A
supportive supervision checklist was developed in consultation with the NRHM program
officials. These checklists were administered on a bi-monthly basis where the gaps were
identified and actions to be taken discussed with the relevant authorities at the facility, block
and district level. An Action Taken Report was developed during a follow up visit which
reflected the steps initiated by the various public health facilities to address the gaps identified
earlier.
Based on the learning and success of the QA initiative in one district, MPTAST expanded the
QA activities across 16 priority districts in Madhya Pradesh. Following discussion with
government officials, it was decided to hire an expert agency to strengthen quality of care in
CEmONC facilities in the remaining 15 districts. Around 49 CEmONC facilities were covered
by the agency. MPTAST facilitated incorporation of QI plans for 49 CEmONC facilities in the
NRHM PIP for 2014-15. In the 16 District Hospitals, implementation of quality standards was
undertaken as per GoI’s QA assessors’ guidebook. Technical Officer (TO) – Health from
MPTAST was providing implementation support in BEmONC facilities (L2 level) and
Delivery Point SHC/PHC (L1 Level) while in CEmONC facilities (L3 Level) the
implementation support was provided by a partner agency hired by MPTAST.
Study Objective
The main objective of the study was to assess the quality of services especially related to
obstetric care in public health facilities namely CEmONC (L3 level), BEmONC (L2 level) and
Delivery Point (L1 level) on account of Quality Assurance Initiative.

Quality Initiatives in health facilities in Madhya Pradesh 3
More specifically the study attempted to:
1. Understand the type and extent of QA support provided in CEmONC, BEmONC and
Delivery Point health facilities
2. Assess the effectiveness of QA processes in improving service delivery quality in
CEmONC, BEmONC and Delivery Points facilities
3. Document barriers and facilitators in quality service provision within select public
health facilities
4. Seek perception of beneficiaries on availability, accessibility, range and quality of
services received in the public health facilities
5. Understand mechanism established for adoption of QA support provided into the public
health facility systems and process for sustainability
6. Provide recommendations to strengthen strategies of QA support based on learnings for
scale-up at the state level.
Overall, the study documents what has worked well and what did not work well, the extent of
participation and role played by state and district QACs, as well as perceptions of beneficiaries
and service providers about QA Initiative.
Study Area
MPTAST had initiated the activities across the
public health facilities distributed in 16 priority
districts (Figure 1). Data was collected from
these districts as per samples.
Methodology
A combination of both quantitative and
qualitative approaches was used to elicit the
required information. Thus, the methodology
included a quantitative facility survey along
with qualitative approach including exit
interviews, observations, informal discussions
with key informants, and documentation and reporting reviews to collect the relevant
information.
Sample Size
In 16 high priority districts of Madhya Pradesh where QA interventions were implemented by
MPTAST, the study covered 70 public health facilities that included 18 CEmONC (L3), 32
BEmONC (L2) and 20 Delivery Points (L1) facilities. Using delivery case load at the facility,
study facilities were selected in each district for each level of facility using Probability
Proportion to Size (PPS). For L3 level, it was decided to include the district level hospital in
each district.
Data was gathered using a structured checklist for each type of facility across the levels. In
addition service providers (medical officers (105), nurse/ANM (155) and laboratory technician
(54)) and beneficiaries (IPD (483) and OPD (485)) were also interviewed (table 1.1) using
separate questionnaires that were initially pretested and translated to local language.

Quality Initiatives in health facilities in Madhya Pradesh 4
Beneficiaries who had sought services either for obstetric or new born care were only included
in the survey. It may be mentioned that on account of absences of eligible respondents
especially in case of IPD /OPD beneficiary in lower level of facilities attempt was made to
cover them in the higher level of facilities where they were available. This was also true for
some of the service providers. Informal discussions were held with block and district level
officials as and when they were available in the study area.
Table 1.1: Distribution of respondents across level of facility
Level of
facilities
Type of providers All providers Beneficiaries
MOs Nurses/
ANMs
Lab
Technici
an
IPDs OPDs Total
Total 105 155 54 314 483 485 968
L1 6 24 1 31 24 6 30
L2 36 49 18 103 79 118 197
L3 63 82 35 180 380 361 741
Training and field work
Field team members which included field
supervisor, two para-medics and six field
investigators from social science discipline were
recruited for the study. Most of the team
members had masters in social work
qualification or were graduates with experience
in social science data collection. Investigators
with para medic background were responsible
for collecting data related to equipment,
laboratory, drugs etc. All team members
underwent one week training which included
both class room training, field visit to different
level of facilities for an exposure to health facility set up and its logistics. Training was jointly
given by MPTAST and CORTs team members.
Three such teams were formed. Each team planned out their team movement plans and visited
the study districts separately. Initially they contacted the district officials and chief medical
superintendent. Usually in the district hospitals all the team members would split and carry out
the data collection in two to three days. For the lower level facilities in the district the teams
divided and carried out the data collection. Several contacts were done for contacting the
district and block level stakeholders.
Data Collection
Following the training, actual data collection was initiated and conducted from 23rd March
2015 to 1st May 2015. In each study district the sample facility was visited for data collection.
However in two facilities this had to be replaced. As it was learnt that the selected facility was

Quality Initiatives in health facilities in Madhya Pradesh 5
no longer working as a delivery center or it had
shut down/closed. Replacement was done by
selecting a same level facility in the same district.
The discrepancy were communicated to
MPTAST and permission for change was sought
prior to making changes.
Project updates were provided to MPTAST
through weekly progress report which contained
the facility and sample coverage, observations
and planning for the next week. These reports
were sent on every Monday of the week.
Quality Assurance
The teams were supported in field by field coordinators which included doctors and researchers
from CORTs core team members. They moved along with the team to the facilities. Every day
reporting of facilities covered, problems faced and requirement of field teams were
communicated to and fro between the field supervisors/ coordinators and head office. Data
collected on field was first scrutinized by the field supervisors and coordinators. Corrections
were made at the field level. Field visits were also made by MPTAST team members who
supported and guided the field team members.
At regular interval, filled in questionnaire were sent to CORTs computer center. The data was
immediately scrutinized and accordingly both oral as well as written feedback was provided to
the respective team members.
Challenges
During the survey field team members encountered many field challenges, some of them are
briefly given here.
Some facilities were found to be closed at the time of visit. Concerned service providers
had to be called. Providers were sometimes not available or on leave, and therefore
could not be interviewed as per the study design.
At level 1 and level 2 facilities most of the time it was difficult to get required number
of IPD and OPD beneficiaries as per study design. To cover the short fall the same were
covered from district hospitals. Sometimes multiple visits were made to the facilities
for beneficiary interviews. Absences of doctor in the facility also had its impact on the
presences of beneficiaries.
In case of CMHO and BMOs, due to their busy schedules, they were not always
available and hence in many districts they could not be contacted in spite of taking
appointments with them.
Analysis has been presented in percentages as it is comprehensive, however in certain variables
it should be read cautiously as ‘N’ denominator is less than 30. Further, considering the wide
spectrum of study components, to have an overall status composite index was computed by
pooling together sub-components, scoring them and then converting them to percentages.

Quality Initiatives in health facilities in Madhya Pradesh 6
These percentages have been graded in four categories of ‘very poor’, ‘poor’, ‘good’ and ‘very
good’.
Findings from the study have been presented in subsequent nine chapters. This includes second
chapter on infrastructure followed by obstetric care (chapter 3), New Born Care (Chapter 4),
Clinical Laboratory (Chapter 5), Pharmacy and Stock of Drugs has been discussed in Chapter
6. Chapter 7 presents the findings from the Infection Prevention and Bio Medical Waste
Management. Services utilized by the beneficiaries and their satisfaction is discussed in eight
chapter. Chapter 9 discusses the quality assurance components.

Quality Initiatives in health facilities in Madhya Pradesh 7
Chapter 2 Infrastructure
This chapter attempts to understand the status of infrastructure available, human resource,
characteristic and skill of medical officers and staff nurse and IEC materials available in the
study facilities. Infrastructure norms are essential in facility depending upon its nature and type
of government hospitals. Broadly it should meet the patient requirements and have friendly
environment.
It is essential to make the existing facility as mother- and baby-friendly as far as possible. As
per the local situation it might differ from facility to facility. But it should facilitate optimal
utilization, client safety and comfort ensuring privacy. Meeting services for obstetric and new
born care facility needs to ensure presences of anterooms before aseptic zones such as Labor
Room (LR), Operation Theatre (OT), Sick Newborn Care Unit (SNCU), etc. Basic amenities
also needs to be ensured like availability of 24x7 running water supply, uninterrupted power
supply (along with power back-up), and clean toilets (separate for male and female). Moreover,
it also calls for standardized ambience of the premises, waiting area and other facilities for the
clients.
Premises
Starting from the lowest level of facility, i.e. L1, according to the norms of MCH services, the
premises should be easy to locate and hence should have sign board visible from a distance, it
should provide safety from outsiders and stray animals and hence should have boundary wall
with a gate. The surrounding should be neat and clean for the ambience and a board indicating
routine functioning hours and emergency phone numbers of vehicle drivers/call center for
transport should be displayed.
At higher facility like L2, apart from the above mentioned facilities, the premises should also
include controlled entry and exit, approach road within the facility paved with interlocking
blocks, garden, covered drainage, leveled ground without water logging, parking space for
vehicles of staff and clients, exclusive slots for parking of ambulances/referral transport and
driver's room. There should be a covered porch where the ambulance can de-board the patient,
wheel-chair and patient stretcher are available at the entrance of the facility and the entrance
has a ramp for easy movement of wheel-chair/stretcher.
At L3 level in addition to above issues, the premises should have garden and green plantation,
clients have easy access to emergency, the signage in vernacular language is displayed to guide
client to various departments in the facility, and space for parking etc. should be there.
As observed from study findings almost all (94 percent) facilities had sign board with facility
name. Nearly 71 percent had board indicating routine functional hours. Direction boards
leading to the facility were found in 36 percent facilities baring PHC and SHC. While 5/16
CHC and 3/17 DH did not have this. Boundary wall with a gate for protection was found in 56
percent facilities. This too varied across the type of facility as 8/13 SHC, 15/24 PHC, 6/16 CHC
and 2/17 DH did not have boundary wall with a gate. Further, neat and clean outer surrounding
were marked in 70 percent facilities and emergency phone no. of vehicle drives/call center for
transport were available in 77 percent facilities. Adequate lighting was observed in all the
facilities.

Quality Initiatives in health facilities in Madhya Pradesh 8
Controlled entry and exit was found in 53 percent facilities with exception of 15/24 PHC and
5/16 CHCs. Forty four percent of the facilities had approach road which was paved with
interlocking blocks with exception of one DH, 16/24 PHC and 9/16 CHC. Garden was observed
in 31 percent of the facilities while 16/24 PHC, 9/17 DH and 10/17 CHC did not have this
amenity. Only 41 percent facilities had closed drainage and the problem persists across
facilities. Leveled ground without water logging was observed in 63 percent facilities with
exception of 5/16 CHC, 7/24 PHC and 1/17 DH.
Parking space for vehicles of staff and clients was observed in 49 percent facilities. Fifty three
percent of CHC and DH had exclusive slots for parking of ambulances/referral transport.
Parking space for ambulance may not be available at PHC as there is no provision of an
ambulance at PHC level. However, 17 percent of PHC had this. Driver’s room was not
available in 50 percent of facilities (CHC and DH).
Covered porch where the ambulance can de-board the patient was observed in 43 percent of
facilities. Facility wise 15/24 PHC, 9/16 CHC and 2/17 DH did not have this provision.
Wheelchair and patient stretcher at the entrance were available in 63 percent of facilities and
non-availability was observed more at PHC and CHC level. Ramp for easy movement of wheel
chair/stretcher at the entrance was observed in 56 percent facilities. The problem of non-
conformity to this norm was observed more at PHC and CHC level. Complaint box/suggestion
box was observed only in 39 percent facilities. The problem of non- availability was observed
more at DH followed by CHC and PHC.
Waiting Area
Waiting area in the facility should have seating arrangement for clients and attendants in
proportion to client load with display of doctors' names with days and duty rosters. As we go
higher up in the level of facility, the waiting area should be covered, with water cooler and/or
drinking water facility, display of citizen’s charter, EDL and IEC along with directions to
various departments and clear display of room numbers.
Data indicates that waiting area was available in all the facilities except 3/13 SHCs. It was
marked with seating arrangement for clients and attendants as per norm in 93 percent facilities
and lack of it was observed more at lower facility levels. This area was covered as per norm in
73 percent facilities with 3/24 PHC and 3/17 CHC not adhering to this norm. The waiting area
was marked with display of doctor’s names with days and duty rosters in 66 percent facilities
(3/16 CHC and 8/24 PHC did not adhere to this norm). For the patients, water cooler and
drinking water facilities were available in 66 percent facilities with exception of 8/24 PHC,
2/16 CHC and 1/17 DH. Citizen’s charter was displayed as per norm in 61 percent of facilities
while 6/24 PHC, 6/16 CHC and 2/17 DH failed to adhere to this norm. Display of IEC and
EDL was observed in 71 percent facilities with exception of 2/24 PHC, 1/16 CHC and 4/17
DH. Display of staff on duty with timing as per norm was observed in 54 percent facilities with
13/24 PHC, 4/16 CHC and 2/17 DH failing to adhere to the norm. Signage to various
departments was adhered to in 54 percent facilities while 12/24 PHC and 9/16 CHC had no
such signage. Similarly room numbers were displayed correctly in 51 percent of facilities with
exception of 14/24 PHC and 7/16 CHCs. Separate functional toilets for male and female clients
were observed in case of 46 percent facilities.

Quality Initiatives in health facilities in Madhya Pradesh 9
Outdoor Patient Department (OPD)
At the lower level of facility, there is no OPD per se, but as we move in higher cadre of facility,
the OPD area is demarcated with seating arrangement for staff and patient, examining facility–
examination table with foam mattress, sheet and pillow, screen/curtains for privacy, display of
working hours and duty roster of staff, display of technical protocols, privacy for clients etc.
Study findings reveal that separate OPD was available at PHC, CHC and DH level. As implied
by data, all facilities except one PHC and CHC had seating arrangement for staff and patient.
Examination facility ensuring privacy as per norm was observed in 91 percent facilities;
however problem was more persistent at PHC level. Display of technical protocol was observed
in all except one DH, four PHCs and three CHCs. Privacy of clients was ensured in 75 percent
of facilities except in case of 10/24 PHCs 3/16 CHCs and 1/17 DH. Similarly privacy in
antenatal/postnatal clinic was ensured in 53 percent of the facilities except 3/16 CHCs and all
PHCs. For client comfort, examination table with foot step was observed in 79 percent of
facilities except for 10/24 PHCs, one CHC and one DH. Hand washing facility for infection
prevention was observed in 72 percent facilities while 9/24 PHCs, 5/16 CHCs and 2/17 DH did
not follow this norm. Display of resuscitation and protocols was observed in 47 percent of
facilities while it was absent in all PHCs, 5/16 CHCs and 1/17 DH. Duty roster of staff with
timings was available in 51 percent facilities exception being 2/16 CHC and 2/17 DH.
Ambulance
There is no provision to have dedicated ambulance at PHC level and in times of need, 102 or
108 may be called. Ambulance services should be available at L3 facility. It should be fully
equipped to handle emergency cases. This can be in form of hospital ambulance belonging to
the facility or it can be one that is available on request as seen in case of Janani Express or 102
services.
Study findings indicate that 94 percent of facilities (CHC and DH) had availability of
ambulance services. But only 64 percent of facilities had was ambulance that was fully
functional. In 15 percent it was available on request like Janani Express. It was noted that only
48 percent facilities had fully equipped ambulances at their service. Functional ambulance at
CHC were not necessarily fully equipped.
Electrical Supply
Electrical supply should be available 24x7 at the respective facilities and back up for
emergency situations should be there in term of inverters and generators in case of failure of
power supply. Power supply is a must in facility as it ensures enough light and air, functioning
of air condition, use of water pumps/electric motors for water supply, used for maintaining
temperature in supply chain etc.
The data indicates that 89 percent of facilities had power lines as source of electricity and in
73 percent it was fully functional. The problem of non-functional power lines was observed at
SHC level. As a backup, inverter/generator was available in 84 percent facilities. Non
functionality of such backup was observed in lower level facilities. Though at SHC level a
backup was not available in form of inverter/generator, in 46 percent facilities, an emergency
lamp was available which was found to be functional in 31 percent SHCs.

Quality Initiatives in health facilities in Madhya Pradesh 10
Fire Extinguisher
Functional Fire Extinguisher was available in 72 percent facilities and was found to be
functional in 65 percent facilities.
Water Supply
Water supply should be ensured 24x7 at facilities. This is essential for various purposes like
drinking, washing hands, cleaning, laundry, kitchen, toilets etc. The source of water supply can
be varied (municipal, village water supply, bore well, tube well, hand pump etc.).Further,
facility should have water storage facility in form of tanks etc. Available drinking water should
be clean and safe for drinking.
As data indicates hand pump/tube well/bore well was source of water supply in 73 percent
facilities followed by 14 percent who were depended on village water tank. The rest 13 percent
facilities had either the municipal corporation supply or multiple sources of water supply.
Water storage tanks were available in 83 percent facilities while 8/13 SHCs and 4/24 PHCs did
not have any facility for storing water. Moreover, water storage tank was observed to be
completely covered in 77 percent facilities. Source of water supply used for drinking water was
made safe in 76 percent of facilities. The problem of impure water was observed more at lower
level facilities like SHC and PHC. Laundry services were available in 53 percent facilities
except in 17/24 PHCs, 8/16 CHCs and 2/17 DHs.
Composite Index for Infrastructure
Assessing the position of infrastructure across the levels as seen from table 2.1, at L3 level 89
percent facilities had ‘very good’ premises. At L2 level, 41 percent facilities were found to
rank ‘very good’ while half of them ‘poor’. Similarly at L1, fifteen percent facilities were found
to be ‘very good’ while 60 percent were found to be ‘good’ in terms of premises.
With respect to waiting area, overall, all the facilities came in either ‘good’ to ‘very good’
category, except at L1 level where 20 percent facilities were found to be ‘poor’ or ‘very poor’.
In case of OPD facilities, 94 percent facilities at L3, 50 percent at L2 and 43 percent at L1 were
found to be very good. Poor OPD facilities were observed in case of PHC especially in case of
L1 (43 percent)

Quality Initiatives in health facilities in Madhya Pradesh 11
Table 2.1: Composite index of infrastructure by level of facility Particulars Level 1 Level 2 Level 3
Total number of facilities 20 32 18
N % N % N %
Premises Very poor (<=25 %) 4 20.0 1 3.1 0 0.0 Poor (25.1-50 %) 3 15.0 15 46.9 1 5.6 Good (50.1-75 %) 6 30.0 13 40.6 2 11.1 Very good (>75 %) 7 35.0 3 9.4 15 83.3
Waiting area Very poor (<=25 %) 2 10.0 0 0.0 0 0.0 Poor (25.1-50 %) 2 10.0 3 9.4 0 0.0 Good (50.1-75 %) 3 15.0 15 46.9 2 11.1 Very good (>75 %) 13 65.0 14 43.8 16 88.9
Total number of facilities 7 32 18 OPD*
Very poor (<=25 %) 0 0.0 1 3.1 0 0.0 Poor (25.1-50 %) 3 42.9 5 15.6 0 0.0 Good (50.1-75 %) 1 14.3 10 31.3 1 5.6 Very good (>75 %) 3 42.9 16 50.0 17 94.4
Ambulance* Very poor (<=25 %) 0 0.0 18 56.3 0 0.0 Poor (25.1-50 %) 0 0.0 5 15.6 2 11.1 Good (50.1-75 %) 0 0.0 1 3.1 1 5.6 Very good (>75 %) 0 0.0 8 25.0 15 83.3
Total number of facilities 20 32 18
Fire extinguisher Very poor (<=25 %) 12 60.0 13 40.6 1 5.6 Poor (25.1-50 %) 0 0.0 4 12.5 0 0.0 Good (50.1-75 %) 0 0.0 0 0.0 0 0.0 Very good (>75 %) 8 40.0 15 46.9 17 94.4
Electricity supply Very poor (<=25 %) 10 50.0 0 0.0 0 0.0 Poor (25.1-50 %) 4 20.0 4 12.5 1 5.6 Good (50.1-75 %) 1 5.0 4 12.5 0 0.0 Very good (>75 %) 5 25.0 24 75.0 17 94.4
Water supply Very poor (<=25 %) 2 10.0 1 3.1 0 0.0 Poor (25.1-50 %) 5 25.0 2 6.3 6 33.3 Good (50.1-75 %) 8 40.0 23 71.9 12 66.7 Very good (>75 %) 5 25.0 6 18.8 0 0.0
Staff quarter Very poor (<=25 %) 3 15.0 3 9.4 3 16.7 Poor (25.1-50 %) 0 0.0 0 0.0 0 0.0 Good (50.1-75 %) 0 0.0 0 0.0 0 0.0 Very good (>75 %) 17 85.0 29 90.6 15 83.3
Toilet Very poor (<=25 %) 3 15.0 15 46.9 18 100.0 Poor (25.1-50 %) 3 15.0 1 3.1 0 0.0 Good (50.1-75 %) 2 10.0 7 21.9 0 0.0 Very good (>75 %) 12 60.0 9 28.1 0 0.0
Infrastructure Very poor (<=25 %) 1 5.0 0 0.0 0 0.0 Poor (25.1-50 %) 4 20.0 3 9.4 0 0.0 Good (50.1-75 %) 12 60.0 16 50.0 2 11.1 Very good (>75 %) 3 15.0 13 40.6 16 88.9

Quality Initiatives in health facilities in Madhya Pradesh 12
Ambulance services were found to be ‘very good’ in case of 83 percent facilities at DH
followed by 28 percent facilities at L2 being ‘good’ to ‘very good’.
Fire extinguishers were found to be very good in 94 percent of facilities at L3, 47 percent at L2
and 40 percent at L1.
Electricity supply was found to be ‘very good’ in all except one facility at L3 level. In case of
L2, except for four facilities, all rest were found to be ‘good’ to ‘very good’ while at L1 this
was found to be ‘poor’ to ‘very poor’ in case of 70 percent facilities.
In case of water supply, except for 35 percent facilities at L1 level, 9 percent at L2 and one
third of facilities at L3 which were found to be ‘poor’ to ‘very poor’ most of the other facilities
across all the levels were ‘good’ to ‘very good’.
Staff quarters were found to be very good in case of 83 percent facilities at L3, 91 percent
facilities at L2 and 85 percent facilities at L1.
Toilet facilities were found to be very poor in case of all the facilities at L3 followed by 47
percent at L2 and 15 percent at L1. It is to be noted that these were found to be very good in
case of 60 percent facilities at L1 and 28 percent facilities at L2.
Taking all the above infrastructure indicators together, it may be mentioned that baring a few
facilities at L2 and L1 levels, it was observed that largelyL3 facilities were falling in ‘very
good’ category followed by L2 level facilities.
Emergency Room
Separate emergency rooms are generally available at higher facility levels like CHC, DH and
Civil Hospitals. The emergency room was assessed on certain criteria like whether it was
equipped to handle referral after basic management, had emergency drug tray, oxygen, suction
facility, adult and neonatal resuscitation equipment, consumable and disposables and had
display of resuscitation protocols and display of duty staff with timings.
The data indicates that 56 percent CHCs and all DHs had an emergency room. This was, 60
percent at L2 and 94 percent at L3 facilities amounting to total of 79 percent facilities. Further,
data indicates that 73 percent facilities each were equipped and had assured referral after basic
management, had designated room with emergency drug tray and oxygen. Equipment’s for
adult and neonatal resuscitation and display of duty staff with timings existed in 70 percent
facilities. Sixty seven percent had suction facilities, while 64percent each had consumable/
disposables and display of resuscitation protocols.

Quality Initiatives in health facilities in Madhya Pradesh 13
Table 2.2: Composite index of emergency room by level of facility
Particulars Level 2 Level 3
Total number of facilities 15 18
N % N %
Emergency room
Very poor (<=25 %) 6 40.0 3 16.7
Good (50.1-75 %) 1 6.7 0 0.0
Very good (>75 %) 8 53.3 15 83.3
Thus overall, based on the above table, it can be said that 83 percent facilities at L3 and 53
percent facilities at L2 were found to be very good in terms of emergency room i.e. were well
equipped to manage emergency.
Human Resources (HR)
For quality service delivery with dignity and privacy to clients, an adequate number of
competent Human resource (HR) is required for providing best possible care during pregnancy,
delivery and postpartum period. HR requirement is generally seen on patient load, type of
services provided and the level of facility.
Table 2.3: Availability of selected human resource across the level and type of facility Level-1 Level-2 Level-3
Particulars SC PHC Total PHC CHC Total CHC DH Total
N % N % N % N % N % N % N % N % N %
Total 13 7 20 17 15 32 1 17 18
Staff Nurse
One 4 30.8 1 14.3 5 25.0 4 23.5 0 0.0 4 12.5 0 0.0 0 0.0 0 0.0
More than one 9 69.2 6 85.7 15 75.0 13 76.5 15 100.0 28 87.5 1 100.0 17 100.0 18 100.0
Medical Officer
None 2 28.6 2 28.6 3 17.6 0 0.0 3 9.4 0 0.0 0 0.0 0 0.0
One 5 71.4 5 71.4 10 58.8 4 26.7 14 43.8 0 0.0 1 5.9 1 5.6
More than one 0 0.0 0 0.0 4 23.5 11 73.3 15 46.9 1 100.0 16 94.1 17 94.4
Total 15 15 1 17 18
Obstetrician/
Gynecologist
None 14 93.3 14 93.3 0 0.0 2 11.8 2 11.1
One 0 0.0 0 0.0 1 100.0 7 41.2 8 44.4
More than one 1 6.7 1 6.7 0 0.0 8 47.1 8 44.4
Pediatrician
None 13 86.7 13 86.7 1 100.0 0 0.0 1 5.6
One 2 13.3 2 13.3 0 0.0 7 41.2 7 38.9
More than one 0 0.0 0 0.0 0 0.0 10 58.8 10 55.6
Anesthetist
None 14 93.3 14 93.3 0 0.0 3 17.6 3 16.7
One 1 6.7 1 6.7 1 100.0 9 52.9 10 55.6
More than one 0 0.0 0 0.0 0 0.0 5.0 29.4 5.0 27.8
Lab. Technician
None 9 52.9 0 0.0 9 28.1 0 0.0 1 5.9 1 5.6
One 7 41.2 6 40.0 13 40.6 0 0.0 0 0.0 0 0.0
More than one 1 5.9 9 60.0 10 31.3 1 100.0 16 94.1 17 94.4

Quality Initiatives in health facilities in Madhya Pradesh 14
As per the expected norm it was observed that at the sub centre level except for ANM, no other
medical or paramedical staff were to be available, whereas at the DH level more specialized
staff were available due to nature of services it provides. Adequate number of qualified and
trained manpower for 24x7 is a must for any facility to be designated as 24x7 facility.
Table 2.3 presents the current scenario of selected human resource who were mainly involved
in delivering obstetric care. Therefore the status of staff nurse, medical officer, obstetrician,
pediatrician, anesthetist and laboratory technician across the type and level of facility have
been looked into. Data does indicate that there were five L1 facilities that had only one staff
nurse in position. Further in five PHCs there was not a single medical officer. At least one
specialized doctor in terms of Gynecologist, pediatrician and anesthetist were present in L3
level. In certain L3 level facility, hospitals had accessibility to these doctors on call basis.
Further an attempt was made to understand the status of HR in the facility for it to function as
delivery point, BEmONC and CEmONC facilities. Considering that facility needs to have
certain essential manpower in the facility to function, following norms were considered:
At L1 level SHC should have two ANMs. At L1 PHC, which caters to larger population
and oversees the functioning of SHCs, ideally should have one MO and one ANM.
However as it is L1 level, in case MO is absent, there should be at least two ANMs to carry
out the functioning of the facility smoothly.
At L2 level, in either case of PHC and CHC, facility should have at least one MO and three
staff nurses/ANM/Female Health Worker for carrying out the essential functions of
BEmONC facilities.
At the L3 level which provides CEmONC services, the CHC, Civil Hospital and DH should
have at least four MOs, 9 staff nurse/ANM, one OBGyn, one Pediatrician, one anesthetist
and one lab technician.
Taking the above criteria, as seen in figure 2.1,
overall only 71 percent of facilities met the
essential HR requirement depending on its level
and type. At L1 level, 80 percent facility had the
HR, while at L2 and L3 level it was 72 and 61
percent respectively. Lack of essential HR
prevailed across the type of facilities.
Training status of human resource: Data was
gathered from the facility regarding on the job
training status of medical officers and nurses
/ANM. A list of thirteen (e.g. contraceptive
update, IMNCI, SBA, LSAS etc.) different trainings were asked. Overall analysis of the same
for both medical officers and nurses /ANM separately (table 2.4) indicates that to some extent
the medical officers of L3 level have received the training followed by those working at L2
level. Training received by medical officers of L1 level was very poor. As regards to the
training received by nurses /ANM, the pattern was largely similar across the levels that is it
mainly came in the very poor and poor category, with only some facilities falling in the good
category. So there were few facilities where the nurses/ANMs had received training on many
components. Overall only two facilities from L3, one from L2 and three facilities from L1 level
8072
6169 71
81
6571
0
20
40
60
80
100
Level1
Level2
Level3
SC PHC CHC DH Total
Fig 2.1: Facility and level wise essential manpower

Quality Initiatives in health facilities in Madhya Pradesh 15
had service providers undertaking training on almost 50 to 75 percent of the training
components.
Table 2.4: Composite index of training status of human resource by level of facility
Particulars Level 1 Level 2 Level 3
Total number of
facilities
7 32 18
N % N % N %
Trained MO
Very poor (<=25 %) 7 100.0 24 75.0 8 44.4
Poor (25.1-50 %) 0 0.0 7 21.9 6 33.3
Good (50.1-75 %) 0 0.0 1 3.1 3 16.7
Very good (>75 %) 0 0.0 0 0.0 1 5.6
Total number of
facilities 20 32 18
Trained ANM
Very poor (<=25 %) 13 65.0 15 46.9 3 16.7
Poor (25.1-50 %) 4 20.0 14 43.8 13 72.2
Good (50.1-75 %) 2 10.0 3 9.4 1 5.6
Very good (>75 %) 1 5.0 0 0.0 1 5.6
Training total
Very poor (<=25 %) 16 80.0 24 75.0 8 44.4
Poor (25.1-50 %) 1 5.0 7 21.9 8 44.4
Good (50.1-75 %) 3 15.0 1 3.1 2 11.1
Overall 40 percent of facilities among all (barring SHCs) the facilities mentioned that they do
arrange emergency staff training if required. The pattern was similar across the levels.
Depending on the nature of topics, level of staff were involved. Training were conducted on
the issue of pulse polio, Mission Indradhanush, Matrutva swasthya samasya samadhan, bio
medical waste etc.
Among the various service providers, as discussed in chapter one essential providers namely
medical officers and nurse at the facility were contacted on sample basis and interviewed. Their
characteristics and capacity have been discussed in following paragraphs.
Characteristics of Medical Officer A total of 106 medical officers were interviewed in the study of which 56 percent were females.
By qualifications, three fourth (76 percent) of respondents were MBBS, 13 percent were
MD/MS while rest included diplomas and BAMS/BHMS. Most of the medical officers had
worked for an average of 12 years as medical officers and had been posted in the present facility
for an average of 6 years, with facility wise average for L1 being 8 years, L2 being 5 years
and L3 being 6 years respectively. Two fifth (40 percent) of Medical Officers resided in staff
quarters of the facility especially in case of L1 and L2 facilities while another 45 percent resided
in the same village/town in which they were posted with an exception of 65 percent in case of
L3 level facility. Almost four out of five (81 percent) medical officers interviewed mentioned
that they were available on call duty 24 hours. This percentage was higher in case of L2 level
where it was 92 percent.

Quality Initiatives in health facilities in Madhya Pradesh 16
Table 2.5: Background characteristics of the Medical Officer
Background characteristics Percentage
No. of medical officers 106
Gender
Male 44.3
Female 55.7
Qualification
MBBS 75.5
MD/MS 13.2
Diploma 8.5
BAMS/BHMS 1.9
Others 0.9
Mean years of working as medical officer 12.1
Mean years of working in this facility 5.9
Place of Residence
Staff quarters of the facility 39.6
In same village/town where facility is located 45.3
In village/town other than where facility is located 13.2
No response 1.9
Available on call duty for 24 hours 81.1
Characteristics of Nurses
A total of 156 nurses were interviewed, all of whom were females. Qualification wise, 74
percent had done their diploma in nursing followed by 17 percent who had done their B.Sc. in
Nursing. This was followed by less than one percent doing M.Sc. Nursing. Sixty four percent
of respondents were designated as Nurse and 36 percent were designated as ANM. A little over
one fourth (26 percent) of the nurses mentioned place of their residence as staff quarters
followed by 64 percent who mentioned the same town/village in which facility was located.
Two percent shared facility quarters. Rest of the nurses resided in town/village other than in
which the facility was located.
Table 2.6: Background characteristics of the nurses
Profile of Nurses Percentage
No. of nurses 156
Gender Female 100
Educational Qualifications B.Sc. nursing 17.3 M.Sc. nursing 0.6 Diploma in nursing 74.4 Others 7.1 No response 0.6
Designation ANM 35.9 Nurse 64.1
Place of Residence Same village/town where facility is located 63.5 Facility staff quarters 26.3 Village/town other than where facility is located 8.3 Sharing staff quarters in facility 1.9
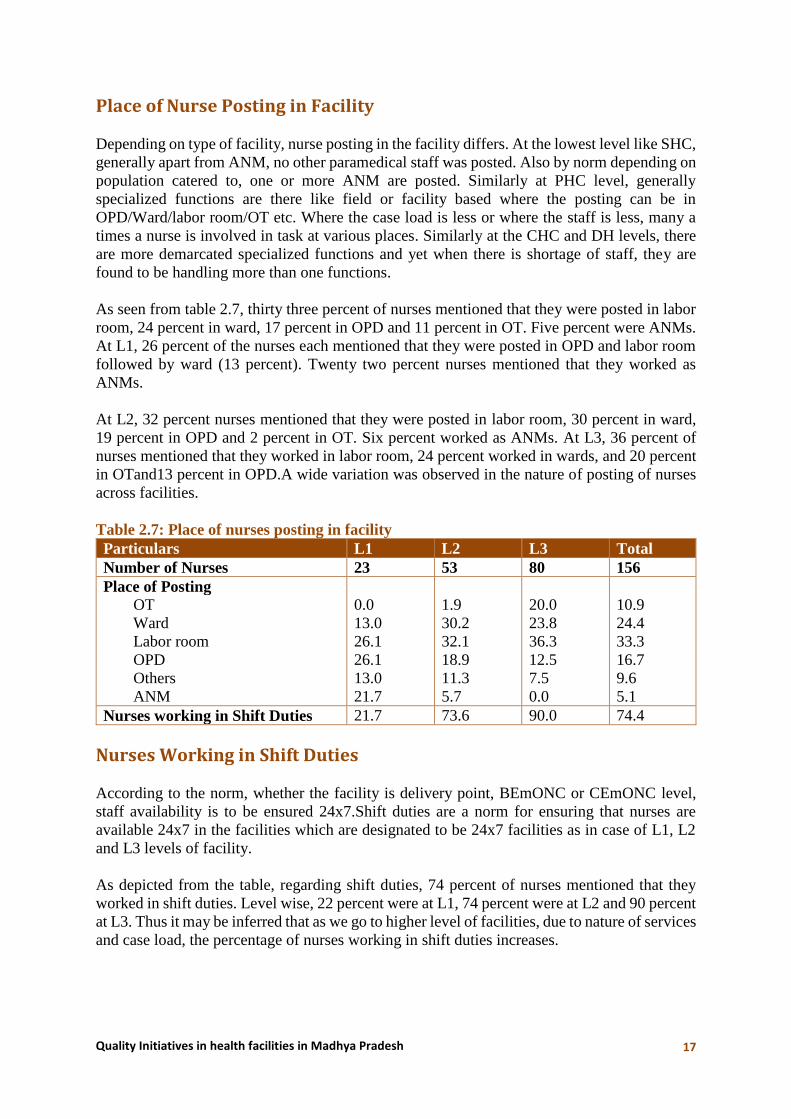
Quality Initiatives in health facilities in Madhya Pradesh 17
Place of Nurse Posting in Facility
Depending on type of facility, nurse posting in the facility differs. At the lowest level like SHC,
generally apart from ANM, no other paramedical staff was posted. Also by norm depending on
population catered to, one or more ANM are posted. Similarly at PHC level, generally
specialized functions are there like field or facility based where the posting can be in
OPD/Ward/labor room/OT etc. Where the case load is less or where the staff is less, many a
times a nurse is involved in task at various places. Similarly at the CHC and DH levels, there
are more demarcated specialized functions and yet when there is shortage of staff, they are
found to be handling more than one functions.
As seen from table 2.7, thirty three percent of nurses mentioned that they were posted in labor
room, 24 percent in ward, 17 percent in OPD and 11 percent in OT. Five percent were ANMs.
At L1, 26 percent of the nurses each mentioned that they were posted in OPD and labor room
followed by ward (13 percent). Twenty two percent nurses mentioned that they worked as
ANMs.
At L2, 32 percent nurses mentioned that they were posted in labor room, 30 percent in ward,
19 percent in OPD and 2 percent in OT. Six percent worked as ANMs. At L3, 36 percent of
nurses mentioned that they worked in labor room, 24 percent worked in wards, and 20 percent
in OTand13 percent in OPD.A wide variation was observed in the nature of posting of nurses
across facilities.
Table 2.7: Place of nurses posting in facility
Particulars L1 L2 L3 Total
Number of Nurses 23 53 80 156
Place of Posting
OT 0.0 1.9 20.0 10.9
Ward 13.0 30.2 23.8 24.4
Labor room 26.1 32.1 36.3 33.3
OPD 26.1 18.9 12.5 16.7
Others 13.0 11.3 7.5 9.6
ANM 21.7 5.7 0.0 5.1
Nurses working in Shift Duties 21.7 73.6 90.0 74.4
Nurses Working in Shift Duties
According to the norm, whether the facility is delivery point, BEmONC or CEmONC level,
staff availability is to be ensured 24x7.Shift duties are a norm for ensuring that nurses are
available 24x7 in the facilities which are designated to be 24x7 facilities as in case of L1, L2
and L3 levels of facility.
As depicted from the table, regarding shift duties, 74 percent of nurses mentioned that they
worked in shift duties. Level wise, 22 percent were at L1, 74 percent were at L2 and 90 percent
at L3. Thus it may be inferred that as we go to higher level of facilities, due to nature of services
and case load, the percentage of nurses working in shift duties increases.

Quality Initiatives in health facilities in Madhya Pradesh 18
Technical Capacity of Medical Officer The focus of the Government of India started moving towards task shifting and multiskilling
as the realization came that we do not have enough qualified personnel to man the health
facilities as specialists. Further with the limited opportunities for post-graduation and a
lucrative and expanding private sector, the chances of getting the required numbers of
specialists were very low in rural areas. For effective functioning of a facility, apart from full
employment of staff, capacity building of the employed staff is also very important. With
advent of technological advancement capacity building of medical officers has been undertaken
in form of trainings. Under NHM, following trainings for Medical Officers has been mentioned
by directorate of family welfare. Trainings are conducted on all the five components under the
Reproductive and Child Health Program, i.e. Maternal Health, Child Health, Population
Stabilization, Adolescent Health and RTI/STI’s
1. Maternal Health: Basic Emergency Obstetric Care (BEmOC) for Medical Officers,
Medical Termination of Pregnancy (MTP) for Medical Officer.
2. Child Health: Safe Immunization Program (SIP) for Medical Officers, Infant and Young
Child Feeding Practice (IYCF) for Medical Officers, Integrated Management of
Neonatal and Childhood Illnesses (IMNCI) for Medical Officers, Facility Based IMNCI
for Medical Officers, Navjaat Shishu Suraksha Karyakram (NSSK) for Medical Officers
and Severe Acute Malnutrition (SAM) for Medical Officers.
3. Population Stabilization: No-Scalpel Vasectomy (NSV) for Medical Officers, alternate
Methodology in IUCD insertion (Interval and Post-Partum) for Medical Officers and
Paramedical workers, IUCD 375 for Medical Officer
4. Adolescent Health: Adolescent Reproductive and Sexual Health Training Program for
Medical Officers
5. RTI/STI: Training on RTI’s/STI’s for Medical Officers
Study findings indicate that variation does exist in the percentage of doctors who had received
the training across the issues.
Short term Training of MO on EmOC: To tackle with the MMR and IMR at the national level,
it is important that the medical doctors have the necessary skills. This is more so in rural areas
where at the tertiary level, most of the doctors are MBBS and so it is important to train them
in necessary skills for providing EmOC.
As the data indicates (table 2.8), variation was observed as regards the training received by
medical officers. Eighteen percent of the doctors mentioned that they had received short term
training on EmOC which was for around 24 days.
Pediatric Skills for managing essential/immediate newborn care: Due to various reasons,
IMR is found to be high. Immediate newborn care and care till 42 days after birth of the child
is very important. Thus, empowering MOs with pediatric skills is very important.
As shown in the table, 26 percent medical officers mentioned they had received Pediatric Skills
for managing essential/immediate newborn care. This training was for around 5 days.
Safe Abortion/MTP/MVA: Medical Termination of Pregnancy, Manual Vacuum Aspiration
and safe abortions are on felt needs of unwanted pregnancies (including medical problems). In
absence of these, many women die. Thus doctors need to be trained in this. As seen from the

Quality Initiatives in health facilities in Madhya Pradesh 19
table, 40 percent doctors mentioned that they had received 12 days training on safe
abortion/MTP/MVA.
Minilap/PPS: Only three percent doctors of the total 106 had received Minilap/PPS training.
NSV: The data interprets that 6 percent doctors had received NSV training of 4-5 days duration.
IUCD insertion: A little over one fourth (26 percent) of medical officers had received IUCD
insertion training of around 5-6 days.
RTI/STI/HIV: A little above one fourth (26 percent) of MOs mentioned that they had received
training on RTI/STI/HIV with mean duration of four days.
FIMNCI: The data indicates that FIMNCI of 5-6 days training had been received by 18 percent
of the doctors.
NSSK: This training was received by 27 percent medical officers for around 3-4 days.
PPTCT: HIV/AIDS has remarkable prevalence in India and hence one of the way to reduce
this is to prevent parent to child transmission. Thus ICTCs and PPTCTs centers must be
equipped with adequately trained manpower including Medical officers. As seen from the
table, PPTCT training of 6 days duration had been received by 11 percent of the doctors.
Table 2.8: Type of training received by Medical Officer
Particulars Percentage Mean duration of
training (in days)
No. of medical officers 106
Short term Training of MO on EmOC 17.9 24.2
Pediatric Skills for managing essential/immediate
newborn care
25.5 5.3
Safe Abortion/MTP/MVA 39.6 12.5
Minilap/PPS 2.8 9.7
NSV 7.5 4.8
IUCD insertion 26.4 5.4
RTI/STI/HIV 25.5 3.7
FIMNCI 17.9 5.8
NSSK 27.4 3.8
PPTCT 11.3 6.2
Home Based New Born Care 9.4 4.8
Life Saving Anesthesia Skills 6.6 6.8
Others* 62.3 9.6
* bio medical waste, immunization, PPIUCD, AIDs, FBNC , malaria, KMC, Leprosy, SBA,
management, etc.
Home Based New Born Care: The data indicates that less than 10 percent of doctors had
received 5 days training on Home Based New Born Care.
Life Saving Anesthesia Skills (LSAS): The data indicates that only 7 percent of the doctors
had reported having received training on LASA of 6-7 days duration.

Quality Initiatives in health facilities in Madhya Pradesh 20
Technical Capacity of Nurses Capacity building is an important intervention for successful implementation of any health
program. It enhances knowledge and skills by imparting trainings to various categories of
health functionaries. As per norms, trainings are conducted on all the five components under
the NHM- Reproductive and Child Health Program, i.e. Maternal Health- (BEmONC, SBA,
and MTP etc.), Child Health- (FIMNCI, IMNCI, NSSK, and IYCF etc.), Population
Stabilization (NSV, IUCD etc.), Adolescent Health and RTI/STI’s. Moreover, with the health
system becoming more organized and with weightage on quality assurance, refresher trainings
and skill labs are also used for updating knowledge and skills. Apart from the trainings under
NHM, trainings are also being presently being conducted under quality assurance for infection
control etc. Due to variation in nurses posting, skills gained through training would vary.
Broadly training falls in the following categories:
Contraceptive update
One of the targets under NHM is family planning, addressing the objective of National
Population Policy to address the unmet need of contraception. Medical and paramedical staff
is trained for contraceptive updates which include new types of contraceptive, new skills etc.
At SHC and PHC level, it is generally ANMS and nurses who are involved in counseling for
family planning.
Overall, 21 percent nurses had been trained in this with mean days of training being three. At
L1, only 13 percent nurses mentioned that they had received this training. These nurses were
the nurses who were working at the Sub Health Centers while none of the nurses from PHC at
this level had received training on this issue. Moreover, across the facilities, at SHCs 21 percent
of the nurses were trained, at PHCs 12 percent, at CHCs 29 percent while at DH, 33 percent
had been trained.
Home Based Newborn Care (HBNC)
A comprehensive “Home Based Newborn Care Operational Guideline- 2011” has been
developed, published and disseminated in 2011 by Child Health Division, MoPH&FW, GOI
to provide framework and guidance to enable a coherent home based new born care strategy
and act a reference tool to plan necessary interventions. It includes weighing of baby, ensuring
immunization, registration of birth and safety of mother and child for 42 days. Home-based
newborn care could be explicated as a family as well as community oriented services that
involve community mobilization and the empowerment of care givers to demand quality
services for their sick newborns. HBNC mainly aims at reducing the neonatal deaths by
preventing or treating morbidities such as infections, asphyxia or hypothermia which largely
form the preventable causes of mortality.
It is depicted from the data that 13 percent of nurses mentioned that they had received this
training, with an average of three days training. The exception being at L1 where 26 percent of
nurses mentioned that they had received this training with mean duration of 4 days. Within L1,
it was basically nurses at SHCs who had received this training.
Infection Management and Environment Plan (IMEP)
Bio-medical waste refers to all wastes generated from healthcare and health research facilities
and associated laboratories. While most of this is communal waste, a small percentage can be
deemed infectious and/or hazardous. These include infected sharps and wastes with infectious,
hazardous, radioactive, or genotoxic characteristics, which if inadequately treated and managed

Quality Initiatives in health facilities in Madhya Pradesh 21
can have adverse impact on the environment and on public health through air, land and water
pollution. Therefore institutionalizing effective waste management systems in all healthcare
facilities is a key prerequisite to improving efficiency and effectiveness of healthcare. Thus
Infection Management and Environment Plan is an important area of training.
As depicted from the table, mere five percent of the nurses mentioned that they had received
training on IMEP with average mean duration of training being two days.
Immunization
Overall, 47 percent nurses mentioned that they had availed training of around three days on
immunization. Level wise this was 70 percent at L1, 60 percent at L2 and 31 percent at
L3.Variation was observed across the facility levels. By type of facility this was 71 percent at
SHC, 73 percent at PHC, 40 percent at CHC and 34 percent at DH mentioned that they had
received this training.
IMNCI
The IMNCI strategy encompasses a range of interventions to prevent and manage the
commonest major childhood and neonatal illnesses that cause death, that is, acute respiratory
infections, diarrhea, measles, malaria, and malnutrition.
Eight percent nurses mentioned that they had availed training on IMNCI which was for a mean
duration of six days.
Facility-based care of neonates (FIMNCI)
This is aimed at strengthening of infrastructure, provision of extra nurses, and up gradation of
skills of physicians and nurses. Five percent nurses mentioned that they had received training
on FIMNCI with mean duration of seven days. Not much variation was observed across
different levels of facilities.
IUCD insertion
To reduce the maternal mortality rate and infant mortality rate and at the same time pave way
for family planning, IUCD insertion as a spacing method is encouraged. The study data
indicated that 38 percent nurses had received training on IUCD insertion in a training of mean
four days duration. At L1, this training had been availed by 22 percent of nurses with mean
duration of training being three days. These were basically nurses from SHCs level. At PHC
level, 27 percent nurses had received this training, at CHC it was 31 percent and at DH it was
46 percent.
Navjaat Shishu Suraksha Karyakram (NSSK) A program on basic newborn care and resuscitation, named Navjaat Shishu Suraksha
Karyakram (NSSK), is about key interventions at the time of birth, which includes prevention
of hypothermia and infections, early initiation of breastfeeding and basic newborn
resuscitation.
As seen in table 2.9, 35 percent nurses mentioned that they had received training on NSSK
whose mean duration was of four days. Level wise this was 48 percentage L1, 38 percent at L2
and 35 percent at L3. Across type of facilities the distribution was 71 percent at SHCs, 27
percent at PHCs, 31 percent at CHCs and 31 percent at DHs mention that they had received
this training.

Quality Initiatives in health facilities in Madhya Pradesh 22
Reproductive Tract Infection and Sexually Transmitted Infections (RTI/STI)
Prevention and treatment of Reproductive Tract Infection and Sexually Transmitted Infections
has received a boost under the RMNCH+A program, a major focus of NHM.
As seen from table 2.9, 15 percent of nurses mentioned they had received training on RTI/STI
whose mean duration of training was of five days. Level wise variation existed in the
percentage of nurses who were trained varying from 11 percent at L2 to 17 percent at L1.
Moreover, across the various kinds of facilities, 29 percent nurses at SHCs, six percent at PHCs,
17 percent at CHCs and 15 percent at DHs had received this training.
Skilled Birth Attendant (SBA)
Training aims at educating and training doctors, mid wives and nurses to achieve proficiency
in skills needed to manage normal (uncomplicated) pregnancies, childbirth and immediate
postnatal period as well as identification, management and referral of complications in women
and newborns.
The data indicates that 69 percent nurses had undertaken this training in a 20 days (mean)
duration. Level wise it was highest at L1 level and least at L3 level (74 percent at L1, 70 percent
at L2 and 66 percent at L3). Extent of training varied across the facilities by its type too (79
percent at SHCs, 70 percent at PHCs, 69 percent at CHCs and 66 percent at DHs).
Antenatal Care (ANC) refresher
Refresher trainings should be provided to update competencies. Since Antenatal Care Services
are the basic services which are provided by ANM/Nurses, it forms the platform to check IMR
and MMR, this training and refresher training play an important role.
Table 2.9: Training received by nurses by level of facility
L1 L2 L3 Total
Number of
Nurses
23 53 80 156
% trained Mean
duration
of training
(in days)
% trained Mean
duration
of
training
(in days)
% trained Mean
duration
of
training
(in days)
% trained Mean
duration
of
training
(in days)
Contraceptive
Update
13.0 3.0 22.6 3.8 22.5 2.4 21.2 3.0
HBNC 26.1 4.2 11.3 2.7 10.0 2.3 12.8 3.0
IMEP 8.7 1.0 1.9 3.0 5.0 2.0 4.5 1.9
Immunization 69.6 2.3 60.4 2.9 31.3 2.2 46.8 2.5
IMNCI 8.7 4.0 11.3 5.5 5.0 6.5 7.7 5.6
FIMNCI 4.3 1.0 7.5 9.8 3.8 5.7 5.1 7.1
IUCD
insertion
21.7 2.6 32.1 4.1 46.3 3.6 37.8 3.6
NSSK 47.8 4.2 37.7 5.3 30.0 2.8 35.3 4.0
RTI/STI 17.4 3.5 11.3 7.0 16.3 4.4 14.7 4.9
SBA 73.9 19.9 69.8 19.6 66.3 19.7 68.6 19.7
ANC
Refresher
13.0 8.0 13.2 4.0 5.0 5.5 9.0 5.3

Quality Initiatives in health facilities in Madhya Pradesh 23
As seen from table 2.9, overall only nine percent nurses mentioned that they had received ANC
refresher training whose mean duration was five days. Level wise it was 13 percent each at L1
and L2, and five percent at L3.By type of facilities it ranged from 21 percent at SHCs, Nine
percent at PHCs, 11 percent at CHCs and five percent at DHs.
IEC Material
The IEC material protocol is laid down at large for a government hospital, which will facilitate
the staff as well as the client /community. Broad range of IEC material includes infection
prevention and control, ANC, during labor, PNC, New Born Care etc.
Eighty to eighty six percent facilities had IEC
displayed for kangaroo care, breast feeding,
ANC checkup and PNC checkup. This was
followed by 75-79 percent facilities which had
displayed IEC on hand washing, infection
control, abdominal examination and labor
room sterilization. Around 70-74 percent
facilities had displayed IEC in form of bleach
preparation, instrument glove cleaning, and
simplified partograph, PPH Management,
Active Management of Third Stage Labor
(AMTSL) and Neonatal Resuscitation.
Facilities (60-69 percent) had IEC on
Eclampsia, Management of Anemia during
labor, postpartum Hemorrhage, Puerperial
Sepsis, Anemia in pregnancy and APH management. A little more than half (54 to 56 percent)
of facilities had IEC in form of APH less than 20 weeks and APH more than 20 weeks. IEC for
prolonged labor was displayed in 41 percent facilities. Non availability of IEC material
prevailed across all the facilities irrespective of its type and level.
Considering the availability of all IEC material together, the composite index for the facility
have been analyzed. As may be inferred from table 2.10, almost in 72-78 percent facilities the
availability of IEC material could be categorized as ‘good’ to ‘very good’. ‘Poor’ to ‘very poor’
IEC material were found in 18/70 facilities which cut across the levels. Pattern of availability
of IEC materials was more or less similar across the level of facilities.
Overall, the findings indicate that largely facilities across the levels were having infrastructure
falling in good and very good category. However, there was a lack of essential human resource
across the levels for it to function appropriately. Status of training on varying components was
not received by all medical officers and nurse /ANM. This also emerges from the providers
individual survey findings. IEC materials to a great extent were prevailing across the level of
facilities.
5 6 6
20 22 17
3031
17
45 41
60
0
20
40
60
80
100
L1 L2 L3
Fig. 2.2: CI of IEC
very good good poor very poor

Quality Initiatives in health facilities in Madhya Pradesh 24
Chapter 3 Obstetric Care
Obstetric care necessitates that the required amenities should be available. Presences of this
ensure that all the required equipment and in turn services are in place. Addressing this, the
present chapter discusses the status of ANC/PNC wards, situation of labor room, minor
operation theatre and its equipment, status of drugs and nature of services provided by service
providers for obstetric care.
Antenatal and Prenatal Wards
Number of beds available in the ANC/PNC wards varied by the nature of health facility.
Average number of beds at sub-center were ranging from one to two per facility, while at PHC
it was five to six, CHC had around 15 and at district hospital it was round 59. Wide variation
did exist between the minimum and maximum number of beds available even within the same
category of health facility.
Assessing some of the basic equipment that should be available within the ward (in PHC, CHC
and DH), data indicates that overall the most commonly found items in 73-76 percent facilities
were in form of BP apparatus, disposable sterile syringe and needles and consumables in form
of cotton and gloves. Sixty six to 70 percent facilities were such where privacy was ensured, a
fetoscope, weighing scale for adult, hub cutter, wall clock and service of hot cooked diet being
provided to all admitted clients was available at the ward level. Newborn thermometer was
available in 64 percent facilities with more of DH, CHC and PHC having it as compared to
lower level facilities like SHC. Availability of puncture proof boxes and Fetal Doptone were
available in 31 and 23 percent facilities respectively. It is to be noted that at L1 in place of
foetal Doppler, fetoscopes may be available which are equally effective.
Observations at maternity ward revealed that 76-89 percent facilities had floors that were
cleaned with disinfectants, all areas of ward were well lit with intact doors and windows.
Another 70-79 percent facilities had functional bathroom for clients use and drinking water
facility. Toilets available for use of client had running water in 64 percent facilities, waste
basket in 67 percent and fitted with railing in less than half (40 percent) of the facilities. Level
wise, 25 percent facilities at L1, 84 percent at L2 and 83 percent at L3 had a waste basket in
the toilet. Around 70 percent of windows in the ward had curtains and 57 percent of facilities
had a hand washing area. Level wise, 54 percent facilities at L1, 63 percent at L2 and 89 percent
at L3 had all windows with curtains while 20 percent facilities at L1, 66 percent at L2 and 83
percent at L3 had hand washing area. Less than one third facilities had door either with curtain
or an automatic door closure for the ward. This raises issues regarding privacy and security of
the clients. Sign for restricted entry was available in nearly half of facilities.
Table 3.1: Categorization of level of facility for status of ANC/PNC ward
Level 1 Level 2 Level 3
Total number of
facilities
20 32 18
N % N % N %
ANC/PNC Wards
Very poor (<=25 %) 3 15.0 1 3.1 0 0.0
Poor (25.1-50 %) 7 35.0 0 0.0 1 5.6
Good (50.1-75 %) 6 30.0 15 46.9 4 22.2
Very good (>75 %) 4 20.0 16 50.0 13 72.2
Quality Initiatives in health facilities in Madhya Pradesh 25
Assessing the overall status of ANC/PNC wards across the level of facilities, data
indicates(table 3.1) that at L2 and L3 levels relatively status of ANC/PNC wards were found
to be ‘good’ to ‘very good’ in case of 94-97 percent of facilities. At L1, this was 50 percent
with 35 percent facilities falling in the category of poor. Over all, three facilities from L1 and
one from L2 level were found to be very poor in terms of ANC/PNC wards.
Labor Room
Considering the nature of service, labor room constitutes an essential component of the
hospital, wherein it has to be functional as per norm. This includes having an ambience, a
draught free environment, air conditioned in higher facilities, having changing area and buffer
zones etc. It should also take care of infection prevention by provision of utility area with hand
washing, the walls and floor should be tiled for easy cleaning, should have adequate light for
conducting delivery etc. For patients, there should be adequate number of delivery tables with
a stepping stool as per case load. There should be attached toilet facility for patient. Windows
should be with smoked glass.
Data indicates a variation in availability and functioning of labor room sub-components across
facilities as per norms. At L2, 31 percent facilities and at L3, 94 percent facilities had air
conditioning. It is to be noted that there is no provision of AC at L1 level. Ninety one percent
facilities were well lighted for delivery. Again, lighting should be adequate (there is no
requirement of focus lamp for delivery at any level). Draught free environment was available
in more than 79 percent facilities. Around 84 percent facilities had interior tilling of walls and
floor. Functional toilet facilities were there in 89 percent facilities, around 74 percent had utility
room attached with hand washing area and 30 percent had changing area and buffer zone.
Delivery tables as per caseloads were observed in 90 percent and stepping stools were available
in around 91 percent facilities.
Taking the twelve sub components of labor room together, composite index indicates that the
status of labor room varied from ‘poor’, ‘good’ to ‘very good’ in each of the three levels. There
were 40 percent of L1 Level facility, 34 percent of L2 facility and 39 percent of L3 facility
wherein the status of labor room was ‘very good’. In each category all the facilities should
actually fall in this category.
Equipment for Labor Room
The equipment for labor room have been assessed from three angles. Either the facility has the
equipment or it does not have them. Secondly, in case it has the equipment, it is as per norm
on the day of visit and thirdly, the facility has the equipment but it is not as per norm.
Overall, 66 percent of labor rooms had delivery kits including those for normal and assisted
deliveries, however in 36 percent facilities it was not as per norm. Non availability was
observed at L1 and L2 level facilities. Further according to the norm, seven trays (delivery,
episiotomy, medicine, emergency drug, baby tray, MVA and PPIUCD) at L3, 6 trays at L2 and
5 trays at L1 should be available. At L3, this was available in all facilities, but as per norm set
was available in 57 percent facility. Similarly at L2, 94 percent facilities had this but was found
to be as per norm in 44 percent facilities. At L1, 85 percent facilities had the 5 trays but were
found to be as per norm in 15 percent facilities only.
Status of availability of other supportive equipment in labor room varied like Intravenous sets
(79 percent) BP apparatus and stethoscope (94 percent) weighing machine for baby (in all

Quality Initiatives in health facilities in Madhya Pradesh 26
facilities), weighing machine for adults (90 percent), Inch tape (76 percent), parthograph charts
(89 percent), instrument tray with cover (97 percent), Intravenous stand (93 percent),
disposable syringes and needles of various sizes (97 percent), Foley urethral catheter (91
percent), kidney trays small and big (91 percent),cheatle forceps (84 percent) fetoscope (90
percent), sponge holding forceps (79 percent), surgical and cord cutting scissors (87 percent)
and cord cutting scissor (Umbilicus- blunt) (47 percent). As in the earlier situation, in these
equipment too non availability of equipment were more so at L1 and L2 level with some of
them though available but not as per norm which actually prevailed across the level of facilities.
Over 90 percent facilities had functional dressing drums, artery forceps and sponge holders,
but 77 facilities had wheel chair / patient’s trolley and mosquito repellent was available in nine
percent facilities.
Composite index for all the above equipment in labor room taken together indicates that
relatively more facilities of L2 (44 percent) and L3 (57 percent) level as compared to L1 (15
percent) had over 75 percent (very good) of the required equipment in labor room. In each level
there were few facilities wherein the equipment came in ‘poor’ category.
Pelvic Examination
For pelvic examination Sim’s /Cusco’s vaginal speculum and Anterior vaginal wall retractor
was available in 87 and 77 percent facilities. Along with these the sterile equipment available
in facilities included sterile gloves (77 percent), sterilized cotton swab and swab sticks in a jar
with lid (69 percent), antiseptic solution (90 percent) and kidney tray for keeping used
instruments (67 percent).
Taking all the equipment together for pelvic examination, composite index indicates that 60
percent of L1, 50 percent of L3 and 34 percent of L2 facility were falling in ‘very good’
category. However, some of them also came in the ‘very poor’ /’poor’ category. It indicates
that although the facilities were involved in conducting deliveries, normally required
equipment were not available fully.
MVA Supplies
MVA is mostly carried out in CEmONC and BEmONC facilities. i.e. L3 and L2 levels only
and hence the data represents those from L2 and L3 only. Data reveals that 53 percent of L2
level facility and all facilities at L3 levels i.e. overall 70 percent facilities provided MVA
technique for abortion. At the PHC level only 47 percent were providing this service (figure…).
Further as data indicates, MVA syringe and cannulae of sizes 4-8 was although available in
these facilities, in about half of them it was not as per the norm.
Other supplies required for MVA that were available in facilities included speculum (62
percent), anterior vaginal wall retractor (62 percent), sponge holding forceps (66 percent) and
small toothed Volsellum/Allis long forceps (60 percent). In other words the remaining facilities
did not have these equipment. Other essential equipment included steel tray with lid to keep
sterile instrument for use (64 percent), sterile kidney tray (62 percent), kidney tray for emptying
contents of syringe (62 percent) and tray containing chlorine solution for keeping soiled
instruments (66 percent). Availability of proper light source/functional torch for conducting
the procedure was reported by 62 percent facilities. Presences of syringe for local anesthesia
/sterile needle and local anesthetic agent were reported by 64 percent facilities each. Overall
the data indicates that though the facilities were providing MVA services they need not
necessarily had all the requisite equipment at the facility.

Quality Initiatives in health facilities in Madhya Pradesh 27
Composite index regarding MVA supplies indicates that 16 and 44 percent of L2 and L3 level
facilities respectively had supplies falling in ‘very good’ category.
Considering the fact that a labor room to function adequately as per the requirement and level
need to ensure the ambience in the room and the related equipment in place, all the above sub-
component have been analyzed together to develop the composite index for labor room. As
seen from table 3.2, at L3 level, 50 percent of facilities were falling in ‘very good’ category,
and 44 percent were falling in ‘good’ category. In L2 level, the status was 13 and 44 percent
for ‘very good’ and ‘good’ category respectively, while in L1 only 15 percent came in ‘very
good’ category.
Table 3.2: Status of Labor Room by level of facility
Level 1 Level 2 Level 3
Total number of
facilities
20 32 18
N % N % N %
Labour room
Very poor (<=25 %) 0 0.0 0 0.0 0 0.0
Poor (25.1-50 %) 5 25.0 4 12.5 2 11.1
Good (50.1-75 %) 6 30.0 17 53.1 9 50.0
Very good (>75 %) 9 45.0 11 34.4 7 38.9
Equipment for labour
room
Very poor (<=25 %) 0 0.0 0 0.0 0 0.0
Poor (25.1-50 %) 1 5.0 9 28.1 3 16.7
Good (50.1-75 %) 16 80.0 9 28.1 5 27.8
Very good (>75 %) 3 15.0 14 43.8 10 55.6
Pelvic examination
Very poor (<=25 %) 1 5.0 2 6.3 0 0.0
Poor (25.1-50 %) 6 30.0 15 46.9 6 33.3
Good (50.1-75 %) 4 20.0 1 3.1 3 16.7
Very good (>75 %) 9 45.0 14 43.8 9 50.0
Total number of facilities 7 32 18
Supplies required for
MVA
Very poor (<=25 %) 15 46.9 0 0.0
Poor (25.1-50 %) 9 28.1 2 11.1
Good (50.1-75 %) 3 9.4 8 44.4
Very good (>75 %) 5 15.6 8 44.4
Total number of
facilities 20* 32 18
Total for labour room
Very poor (<=25 %) 0 0.0 1 3.1 0 0.0
Poor (25.1-50 %) 1 5.0 11 34.4 1 5.6
Good (50.1-75 %) 16 80.0 16 50.0 8 44.4
Very good (>75 %) 3 15.0 4 12.5 9 50.0
*Supplies for MVA has not been considered in this calculation

Quality Initiatives in health facilities in Madhya Pradesh 28
Minor Operation Theatre (OT)
As per norm, there is no provision for Minor Operation Theatre at L1 level and hence it was
available at L2 and L3 levels only. Sixty four percent facilities had this facility. Level wise this
was 44 percent among L2 level facilities, while all the 18 L3 facilities had minor operation
theatre. Analyzing the data by type of facility, all 17 district hospitals, 12 CHC among the total
16 CHC and 3 PHC among the total 17 PHC had minor OT.
The data indicates that although overall 64 percent of facilities reported presences of minor OT
in their facilities, all these did not necessarily have the logistics within the OT. For instance
adequate wide table with stainless steel top and foot rest was observed in only 54 percent and
50 percent facilities respectively. To conduct the procedure with the support of shadow less
lamp (42 percent) with air condition in the room (34 percent)and platform having slab with
granite top (46 percent) was not available in all OTs. Further the OT room having tiles on floor
and wall was in 44 percent facilities and 42 percent had cupboard to keep the required supplies
handy. Ensuring basic hygienic practices, 50 percent facilities had hand washing area with
elbow operated handle and 54 percent had color coded bins for appropriate disposal of waste.
A little over half of the facility (56 percent) had the drug and dressing tray in the OT. It may
be pointed out that although these were available in the OT, it was not necessarily meeting the
required norm.
The status of composite index for sub components of minor OT in the facility indicates (table
3.3) at L3 level, 61 percent facility came in ‘very good’ category, while 17 percent came in
‘good’ category. At L2 level the status was relatively poor as only nine percent facilities came
in ‘very good’ category, while all the remaining were in poor category only.
Equipment for OT
Information on the equipment available in Minor OT was collected from CHC and DH level
facilities at L3. Among these, all had hydraulic table for operation and trolleys for patients
and trolley for instruments. All facilities had dressing drums of all sizes and suction apparatus
in the OT. Shadow less lamps were available in 94percent facilities. Presences of diathermy
machine (67 percent) and x-ray view box (57 percent) was found.
Anesthesia Equipment for OT
Anesthesia equipment for OT is available only in CHC and DH level facilities at L3 level. Thus
the data represent findings from these facilities only. A list of 25 sub components were assessed
in this. Findings do suggest variation in the status of availability of each. The data indicates
that 89 percent facilities each had I/V set plain and blood transfusion set (1 each/day) and 94
percent had Urinary Catheter (1/day). Ambubag with ruben valve, face mask and oxygen
reservoir bag for adult was available in 94 percent facilities. Electrical operated suction
machine and needle, spinal in various sizes were available, I/V cannulae for neonates in various
capacity was available in 78 percent facilities. Laryngoscopes Macintosh curved blade for
adult, medium, extra-large and straight blade for neonates with spare bulbs and batteries were
available in 89 percent facilities.
Anatomical Face Mask of various sizes was available in 78 percent facilities only. Similarly
two A type cylinders for oxygen and nitrous oxide with pressure reducing valve was available
in 83 percent facilities. , Pressure gauge to monitor the pressure of gases in cylinders and Rota
meter with bob in for accurately calculating the flow of gases was available in 89 percent

Quality Initiatives in health facilities in Madhya Pradesh 29
facilities., Pulse oximeter was available in 78 percent facilities and suction catheter of various
dimensions were available in 72 percent facilities.
Boyle’s type Anaesthesia Machine made of stainless steel body with antistatic wheel and
facility to lock, foot operated suction machine and Endotracheal tubes of various internal
diameters were available in 89 percent facilities. Magill and Bains Breathing circuit was
available in 78 percent facilities and Guedal’s airway of various sizes was available in 67
percent facilities. Laryngeal Mask Airways of multiple usage and disposable was available in
72 percent facilities and Magill forceps for adult and pediatric were available in 57 percent
facilities. Pro- seal Laryngeal Mask airway (autoclavable) was available in 61percent facilities.
Proper guarantee with spare part coverage was available in 57 percent facilities. Two vaporizers
one for isoflurane and one fluotech mark 4 for halothane were available 57 percent of facilities.
Soda lime canister with circle absorber with closed circuit tunings was available in 50 percent
facilities only.
Analysis of composite index (table 3.3) for the sub components of anesthesia equipment for
OT indicates that the status of L3 level facilities was largely ‘very good’ or ‘good’,
OT Surgical Instruments for CEmONC Services
CEmONC services are available at DH, Civil Hospitals and selected CHC which are designated
as CEmONC services facilities. It was observed that in some CHC, though they were not
designated as CEmONC centers, they had many of the surgical instruments for CEmONC
services. For the sake of interpretation, data for L3 level facility which includes 16 DH, one
civil hospital and one CHC is taken into consideration. Also in one CHC under CEmONC, it
was observed that 21/28 surgical instruments were available.
The data indicates that in 94 percent facilities, surgical instruments in form of Instrument tray
with stainless steel cover, sponge holding forceps, artery forceps straight, Mayo- Hegar needle
holder, Surgical Knife Handle with different blade sizes, Yankauer suction tube, curved and
dry intestinal clamps, toothed and non-toothed tissue dressing forceps, of 18 and 25cm and
ALLIS forceps with multiple ratchets used to grip arteries and digestive tissues were available.
Only one DH did not have these instruments.
Eighty nine percent facilities had instruments in form of two cesarean sets, back haus towel
clips, packet round bodied needles, catgut No. 1-0 , retractors- doyens (big and small), small,
medium and large suction nozzle, straight intestinal clamps, tissue forceps 21cm non toothed
and BABCOCK forceps with multiple ratchets for digestive tissues were available in 89 percent
facilities.
Eighty three percent facilities had halstead mosquito forceps, operating scissors- curved, blunt
pointed, mayo; operating scissors- straight, blunt pointed and mayo and scissors straight mayo
blunt/blunt pointed. Two packet triangular point suture needles were available with 79 percent
facilities. Polyglycolic suture and Nylone 1-01 were available in 72 percent facilities.
Polydiozone 1-01 foil was available with 67 percent facilities.
It is to be noted that Uterine Hemostatic Forceps (Green Armitage) was available in 61 percent
facilities while it was not available in the CHC and 6/ 17 DH. Overall, the composite index for
the surgical instruments indicates that among the 18 L3 level facilities, in 14 facilities it was
’very good’ while in 3 facilities it was ‘good’. In one facility the equipment came in ‘very poor’
category.
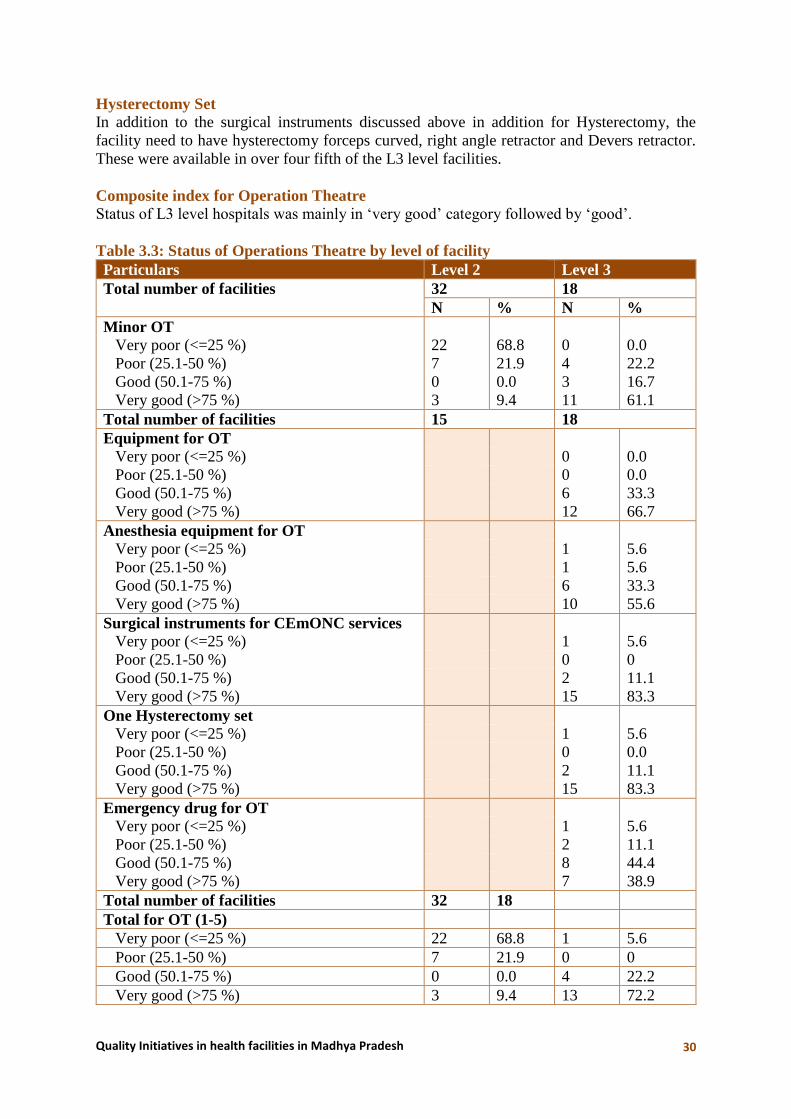
Quality Initiatives in health facilities in Madhya Pradesh 30
Hysterectomy Set In addition to the surgical instruments discussed above in addition for Hysterectomy, the
facility need to have hysterectomy forceps curved, right angle retractor and Devers retractor.
These were available in over four fifth of the L3 level facilities.
Composite index for Operation Theatre
Status of L3 level hospitals was mainly in ‘very good’ category followed by ‘good’.
Table 3.3: Status of Operations Theatre by level of facility
Particulars Level 2 Level 3
Total number of facilities 32 18
N % N %
Minor OT
Very poor (<=25 %) 22 68.8 0 0.0
Poor (25.1-50 %) 7 21.9 4 22.2
Good (50.1-75 %) 0 0.0 3 16.7
Very good (>75 %) 3 9.4 11 61.1
Total number of facilities 15 18
Equipment for OT
Very poor (<=25 %) 0 0.0
Poor (25.1-50 %) 0 0.0
Good (50.1-75 %) 6 33.3
Very good (>75 %) 12 66.7
Anesthesia equipment for OT
Very poor (<=25 %) 1 5.6
Poor (25.1-50 %) 1 5.6
Good (50.1-75 %) 6 33.3
Very good (>75 %) 10 55.6
Surgical instruments for CEmONC services
Very poor (<=25 %) 1 5.6
Poor (25.1-50 %) 0 0
Good (50.1-75 %) 2 11.1
Very good (>75 %) 15 83.3
One Hysterectomy set
Very poor (<=25 %) 1 5.6
Poor (25.1-50 %) 0 0.0
Good (50.1-75 %) 2 11.1
Very good (>75 %) 15 83.3
Emergency drug for OT
Very poor (<=25 %) 1 5.6
Poor (25.1-50 %) 2 11.1
Good (50.1-75 %) 8 44.4
Very good (>75 %) 7 38.9
Total number of facilities 32 18
Total for OT (1-5)
Very poor (<=25 %) 22 68.8 1 5.6
Poor (25.1-50 %) 7 21.9 0 0
Good (50.1-75 %) 0 0.0 4 22.2
Very good (>75 %) 3 9.4 13 72.2

Quality Initiatives in health facilities in Madhya Pradesh 31
Particulars Level 2 Level 3
Infection prevention equipment and supplies
for OT
Very poor (<=25 %) 0 0.0
Poor (25.1-50 %) 0 0.0
Good (50.1-75 %) 10 55.6
Very good (>75 %) 8 44.4
24x7 functional OT, blood bank storage unit &
competency for blood transfusion service
Very poor (<=25 %) 3 16.7
Poor (25.1-50 %) 2 11.1
Good (50.1-75 %) 4 22.2
Very good (>75 %) 9 50.0
Emergency Drugs (including Neonates) for OT
Checklist having a list of around 40 emergency drugs required for women and neonate were
looked into. Most of OT at CHCs are non functional due to non availability of Anesthetist and
mostly family planning operations are being done in camps and hence the availability of
medicines may vary. Individual analysis of these drugs at L3 level indicates a variation in their
availability across the facilities. For instance overall the data indicates that injection Diazepan
5 mg/ml 2 ampoules was the most commonly available emergency drug and was available in
all facilities. Injection Adrenaline as per specification, was available in 89 percent facilities,
Injection Atropin Sulphate 4 ampoules in 94 percent and Injection Chloropheniramine 2
ampoules were available in 89 percent facilities. Injection Calcium Gluconate 10 ml X 2
ampoules was available in 83 percent facility exception being one CHC and two DHs. Injection
Dextrose for neonates was available in 79 percent facilities and Injection Adrenaline for
neonates 2 ampoules were available in 94 percent facilities. Injection Oxytocin 10 ampoules
was available in 83 percent facilities exception being in 1 CHCs and 2 DHs.
Sixty one percent facilities had Nefidipine in form of tablet and capsules both (not available in
1 CHC and 6 DHs), 72 percent had Injection Dextrose 25% (not available in 1CHC and 4DHs)
and 78 percent had Injection Aminophyline 2 ampoules which were not available in 1 CHC
and 3 DHs.
Sixty Seven percent facilities had emergency drugs in form of injection Magnesium Sulphate
0.5 gm X 10 ampoules which were not available in 6 DHs. Injection Nalozone was not available
in the CHC and 8/17 DH. Similarly injection labetalol 5 ampoules was not available in the
CHC and 9/17 DH.
Eighty nine percent facilities respectively had injection Diclofenac and Injection
Dexamethasone, while 83 percent had injection normal saline and Injection Lignocaine
hydrochloride. Similarly 89 percent facilities had Injection Oxytocin as per specification, 78
percent had Misoprostol 3 tablet, 83 percent had Injection Furosemide, and Injection
Hydrocortisone, 94 percent had Injection Pentazocine, 83 percent had Injection lignocaine
hydrochloride, 89 percent had Injection dopamine and61 percent had inj ampicillin sodium.
Fifty seven percent facilities had Injection ergometrine maleate, 61 percent had injection
ketamine, 50 percent had inject gentamycine sulphate, 61 percent had inj metronidazole and
salbutomol inhaler as part of emergency drugs. Sixty one percent had drugs like injection
Bupivacaine hydrochloride, 67 percent had Injection Bupivacaine hydrochloride for spinal, 61

Quality Initiatives in health facilities in Madhya Pradesh 32
percent had Injection Neostigmine Methyl sulphate, and Injection Propofol. Fifty six percent
had Injection Promethazine hydrochloride, 39 percent had Injection cloxacillinsodium and 50
percent had Injection insulin. Thirty nine facilities had emergency drugs in form of Injection
Ephedrine, 57 percent had Halothane, 33 percent had Isoflurane, 44 percent had Injection
Suxamethonium hydrochloride, 39 percent had Injection Atracurium and Injection
Vecuronium bromide and 44 percent had Injection Thiopentone sodium.
Analysis of overall drugs available through composite index indicates the status of availability
of these emergency drugs to be varying from ‘good category to ‘very good’ category (table
3.3). This prevailed for L3 level facilities. All the facilities fall under the category of good to
very good at L3.
Functionality of CEmONC
This was assessed at L3 level facilities mainly in terms of 24x7 functional OT, blood bank
storage unit and competency for blood transfusion service. The data indicates that 67 percent
facilities except 6/17 DH at L3 had 24x7 functional OT with facility for C-Section. Similarly
61 percent facilities were equipped with blood bank/blood storage unit with exception of the
CHC and 6/17 DH. Core competencies of provider in blood transfusion services for ensuring
implementation of standard precautions for infection prevention was found to be existent in 83
percent facilities with exception of three DH. Similarly competencies for ensuring proper waste
disposal systems as per IMEP guidelines were found in 79 percent facilities except in four DH.
Services Provided
The data indicates that except for one PHC at L1 level, all other facilities at L1, L2 and L3
levels provided basic services in form of conducting normal deliveries. Similarly baring 1/15
CHC and 3/17 PHC at L2 levels, rest all facilities from L1 and L2 provided referral in case of
complicated delivery requiring CEmONC. Management of referral of HIV positive mother and
new born as a service was provided by 79 percent facilities except all SHC and 1/7 PHC at L1,
9/17 PHC and 1/15 CHC at L2 and 1/17 DH at L3.
Variation regarding average number of deliveries conducted per month was observed across
the levels and type of facilities. At L1 level on an average 12 deliveries were conducted per
facility (table 3.4). These averages did not differ much between the SHC (11) and PHC (13) of
L1 level. At L2 level on an average 75 deliveries were conducted. Variation in the number of
deliveries conducted by PHC and CHC was significant. At L3 level, 389 deliveries were
conducted each month. It may be mentioned that a wide variation in the number of deliveries
conducted existed within most of categories of facilities. Expected number of deliveries
conducted at L1 were 5, 10 at L2 and 270 at L3 (Maternal and Newborn Health Toolkit,
MoHFW, 2013). Assessing the deliveries conducted in the facility as compared to this, data
indicates that at L1 and L2 level, largely the facilities are conducting the required expected
number of deliveries or more than that. At L3 level, half the facilities were conducting less than
expected, while the remaining half were conducting more than expected. In both situations
there would be an implication on the quality of service.

Quality Initiatives in health facilities in Madhya Pradesh 33
Table 3.4: Distribution of facilities by deliveries conducted per month (in percentages)
Particulars Level-1 Level-2 Level-3
SC PHC Total PHC CHC Total CHC DH Total
Number of facilities 13 7 20 17 15 32 1 17 18
Avg. number of deliveries
conducted per month
11 13 12 35 120 75 350 391 389
Standard Deviation 7 9 8 21 139 104 NA 222 216
Minimum 1 3 1 5 25 5 350 80 80
Maximum 20 30 30 75 601 601 350 732 732
% of facilities conducting
deliveries
Less than expected of deliveries 23.1 14.3 20.0 35.3 6.7 21.9 0.0 52.9 50.0
As per expected 0.0 0.0 0.0 23.5 0.0 12.5 0.0 0.0 0.0
More than expected 76.9 85.7 80.0 41.2 93.3 65.6 100.0 47.1 50.0
Services in form of identification of referral for danger signs, pregnancy testing, antenatal care,
intra-natal care, postnatal care and postpartum contraceptive counseling was found to be
undertaken by all the facilities at L1, L2 and L3 levels.
However, variation was observed for some of the maternal services provided by facilities. Forty
eight hours stay post-delivery was not reported by any of the sub-centers of L1 level. Among
PHCs, 20/24 PHC and 15/16 CHC were found to be providing this. Level wise this was adhered
to by all facilities of L3 and except for two facilities in L2 level others reported keeping women
after delivery for 48 hours. At L1, this was adhered by only four PHCs.
All facilities, except all 13 sub-centers, 16/24 PHC and one CHC were involved in
management of complications. Similarly 50-52 percent facilities provided services in form of
episiotomy and suturing (not in case of 18/24 PHC and 4/16 CHC), stabilization of obstetric
emergencies (except 13 SHC, 18/24 PHC and 2/16 CHC) and HIV screening (except 13 SHC,
14/24 PHC and 7/16 CHC). Forty one to 58 percent facilities were found to have provided
services in form of assisted vaginal delivery (except 17/24 PHC, half of CHC and 3/17 DH),
antenatal steroids for preterm labor (except 19/24 PHC and 5/11 CHC and one DH),
comprehensive abortion care (except 21/24 PHC, 6/16 CHC and one DH) and case
management of RTI/STI (except 19/24 PHC and 5/16 CHC).
Table 3.5: Basic and maternal and health services provided by level of facility
Particulars Level 1 Level 2 Level 3
Total number of
facilities
20 32 18
N % N % N %
Services
Very poor (<=25 %) 6 30.0 14 43.8 0 0.0
Poor (25.1-50 %) 1 5.0 7 21.9 0 0.0
Good (50.1-75 %) 0 0.0 7 21.9 0 0.0
Very good (>75 %) 13 65.0 4 12.5 18 100.0
Level wise composite index was assessed taking all the maternal services together in table 3.5.
All the services were being provided at L3 level.

Quality Initiatives in health facilities in Madhya Pradesh 34
As observed from the above table, compared to L2 facilities, the status of L1 facilities was very
good with regards to basic and maternal health services provided which was cent percent at L3
level. While 35 percent facilities were found to range from poor to very poor at L1 level, this
was found to be 65 percent at L2.
Nature of Services Provided by Health Personnel
As mentioned in the earlier section, health personnel namely the medical officers and nurse
were interviewed from the study facilities. Details were gathered from them regarding the
nature of services they provided mainly in the area of obstetric care. Findings from the same
are discussed in the following sections.
Medical officers: Nature of services provided by Medical officers varies with respect to type
of facility. Higher the facility level, specialized is the function or service provided by medical
officers. Duties most commonly reported include providing services for OPD, IPD, conducting
deliveries, manage emergency, refer cases etc. On an average in ward a medical officer in L1
facility sees two patients per day (table 3.6). This is 13 in case of L2 and 41 in case of L3. This
variation is because of difference in caseloads at various facilities which increases with the
level of facility. Moreover, it is to be noted that at L1 at SHC level, no doctors are posted.
Table 3.6: Extent of services provided by Medical officers
Particulars Level 1 Level 2 Level 3 Total
No. of medical officers 5* 38 63 106
Average No. of patients seen each day
in OPD 60.9
in ward daily 2.0 13.3 41.1 29.6
Extent of doctor involvement in conducting
delivery
Always 40.0 (2) 21.1 31.7 28.3
Sometimes 40.0 (2) 76.3 49.2 58.5
Never 20.0 (1) 2.6 19.0 13.2
Average number of cases referred in month 6.3 11.4 10.2 10.5
Visit by additional doctor to the facility regularly
on fixed day to provide services 60.0 (3) 10.5 19.0
17.9
Type of cases addressed by doctor during
emergency
All type of cases 60.0 (3) 78.9 90.5 84.9
Pregnancy complication 40.0 (2) 71.1 52.4 58.5
Delivery case 60.0 (3) 50.0 65.1 59.4
Injuries & accident 60.0 (3) 50.0 61.9 57.5
Medico legal cases 60.0 (3) 57.9 20.6 35.8
Others 40.0 (2) 42.1 47.6 45.3
No response 20.0 (1) 7.9 20.6 16.0
Another important service a medical officer provides is conducting deliveries. At SHC level,
since no medical doctors were posted, it is the ANM who conducts deliveries. Also for
providing BEmNOC and CEmONC, it is the doctors who were equipped to provide these kind
of services.

Quality Initiatives in health facilities in Madhya Pradesh 35
All medical officers were asked about their involvement in conducting delivery, 31 percent
doctors of L3 and 21 percent of doctors of L2 mentioned that they were always involved in
conducting deliveries, while out of the total 5 doctors interviewed at L1, two were involved in
conducting deliveries. It may be noted that 19 percent of doctors at L3 and 2 percent at L2 were
never involved in conducting deliveries. Remaining doctors were sometimes involved in
conducting deliveries.
Referring cases especially complicated cases is yet another important decision that a doctor
needs to undertake, in case they cannot manage the case. Doctors from all levels refer cases.
Average number of cases referred in a month was almost similar in L2 and L3 levels (11 in
case of L2 and 10 in case of L3), while it was 6 in case of L1 (PHC).
To fill in the skill gaps and gaps in HR, services of additional doctors were sought by facilities.
Regular visits by additional doctors for providing services was mentioned by 19 percent
respondents in L3 and 11 percent in L2 facilities. While three out of five doctors at L1
mentioned that additional doctors do come regularly to their facility and provide services.
Doctors have to be ready for addressing emergency cases. Data indicates variation in type of
emergency cases that the doctors addressed across the level of facilities. During emergency at
L1, three out of five mentioned that they handled delivery cases, injury accident cases, medico
legal cases and all types of cases while two doctors mentioned that they handled pregnancy
complication and other cases. At L2 level,79 percent mentioned they handled all kinds of cases,
71 percent of the doctors mentioned that they handled pregnancy complication cases, 58
percent handled medico legal cases while 50 percent mentioned that they handled delivery
cases as well as cases of injury and accident. At L3, 91 percent mentioned that they handled all
kinds of cases, 65 percent handled delivery cases and 62 handled injury and accidental cases.
Type of Services provided by Nurses At lower level of facilities like SHC, ANMs handled all cases like conducting ANC checkups,
conducting deliveries; provide IV drugs, injections, provide medicine, involved in follow up
of indoor patients, etc. As we move towards higher facilities there were more
departmentalization and specialized functions like in case of CHC and DH which required
nurses to conduct specialized functions.
Data indicates that overall 80 percent of the nurses conduct ANC checkups, 73 percent
conducted deliveries and 26 percent mentioned that they did general things like providing IV
Drug, injection, medicine, oxygen etc. 16 percent were involved in follow up of indoor patients,
11 percent each mentioned that they helped doctors in caesarian case and assisted doctor while
6 percent mentioned they were involved in other things too.
At L1, all the nurses were involved in ANC checkup and 91 percent mentioned that they
conducted deliveries. Thirty percent of nurses were also involved in providing IV Drug,
injection, medicine, oxygen etc. Follow up of indoor patients and assistance to doctors were
mentioned by 13 and 4 percent doctors respectively.
At L2, 98 percent mention that they were involved in ANC checkup and 89 were involved in
conducting deliveries. Other activities were mentioned by lesser percentage of nurses as 19
percent were involved in providing IV Drug, injection, medicine, oxygen etc. and 17 percent
were involved in follow up of indoor patients.

Quality Initiatives in health facilities in Madhya Pradesh 36
At L3 level due to specialized functions and varying type of services offered and case load, 63
percent nurses mentioned that they were involved in ANC checkup, 58 percent conducted
deliveries, 21 percent assisted doctors in caesarian cases, 16 percent each assisted doctors and
were also involved in making follow up of indoor patients and 30 percent were involved in
providing IV drugs, injections etc.
ANC Checkup Conducted
On an average as inferred from the table 3.7, a nurse conducts 56 ANCs per week. Variation
exists in the case load at different levels of facilities. Informal discussions also revealed that on
account of migration and seasonal variation caseloads do vary in particular seasons. The data
indicates that at L1 level, average number of ANC conducted in a week was 12. Caseload varies
by type of facility as at SHC level it was 13 with minimum being 2 in a week and maximum
being 70 in a week, while at the PHC level, this was found to be 11 per week with maximum
being 40. Similarly at L2 level, it was on an average 22 per week. In this case too, it varied by
type of facility (at PHC, it was 14 with maximum in a week being 51 and at CHC level it was
29 with maximum 80in a week).
Table 3.7: Type and extent of services rendered by nurses (b)
Particulars L1 L2 L3 Total
Number of Nurses 23 53 80 156
Cases catered to by Nurses
ANC check-up 100.0 98.1 62.5 80.1
Conduct deliveries 91.3 88.7 57.5 73.1
Help doctor in caesarian case - - 21.3 10.9
Assist doctor 4.3 1.9 16.3 9.6
Follow up of the indoor patient 13.0 17.0 16.3 16.0
General: IV Drug, injection,
medicine, oxygen etc. 30.4 18.9 30.0 26.3
Others - 1.9 10.0 5.8
Average number of ANC
Checkup conducted in a week 12 22 111 56
Type of ANC provided
Measure blood pressure 100.0 96.2 70.0 83.3
Check Hb level 95.7 94.3 61.3 77.6
Measure weight 100.0 98.1 68.8 83.3
Check urine 91.3 92.5 63.8 77.6
Give TT injection 95.7 94.3 60.0 76.9
Others 21.7 43.4 27.5 32.1
No ANC services 0.0 0.0 27.5 14.1
Monthly Cases Referred 5.2 8.5 13.8 10.4
Monthly Deliveries Conducted 15.2 58.7 299.0 158.9
Monthly Delivery Cases referred 4.1 7.8 12.8 9.4
At L3, the average number of ANC conducted by a nurse was 111 per week. At CHC level this
was mentioned to be 36 with maximum of 60 per week. While at DH, the average in a week
was 121 and maximum was found to be 500 in a week.

Quality Initiatives in health facilities in Madhya Pradesh 37
Type of Services provided during ANC
According to norm, four ANC checkups are a must as part of services to be provided under
MCH. The ANC card provided to women has a record of this apart from HMIS. Periodic checks
during the antenatal period along with blood and urine tests, help in monitoring the pregnancy
and ensure safety of the mother and the baby. Majority of women gain about 8-12 kgs during
their pregnancy. Also, the average blood pressure during this time should be 120 over 70. Urine
test helps to confirm pregnancy, tract sugar and protein levels and detect pus cells if any. Hb
test is done to ensure that the mother has enough iron for self and the baby. Thus during the
periodic ANC checkup, all these things are monitored.
As part of their ANC services, the nurses do undertake the above services like measuring blood
pressure, measure weight, getting Hb level and urine checked, give TT injections and other
services like making ANC card, provide medicines etc. During the survey it was found that 28
percent of nurses at L3 were not involved in providing ANC services.
From the table, it can be inferred that overall, 83 percent of nurses mentioned that they
measured blood pressure. At L1, this was 100 percent while at L2, it was 96 percent at PHC
level and 97 at CHC level. Thus there was no variation here. At L3, 70 percent of nurses
mentioned that they measured blood pressure. This was found to be 100 percent at CHC level
while at DH, 68 percent mentioned that they measured blood pressure. This was probably
because in DH the nurses had more specialized functions due to their place of posting in
departments like OT/Labor room/Wards etc.
Over three fourth (78 percent) of nurses in general mentioned that they did ensured that Hb
was checked as part of their ANC service. At L1, this was reported by 96 percent nurses posted
at SHC as against 89 percent at PHC level. Similarly at L2, 94 percent nurses in general
provided this service, with all nurses at PHC level acknowledging this service against 90
percent at CHC level. At L3, 61 percent in general provided this service. Within this, all nurse
at CHC mentioned that they ensured Hb was checked, against 58 percent at DH level.
Weight measurement in general was reported by over four fifth (83 percent) of nurses. At L1,
all the nurses were doing this. At L2, 98 percent of the nurses mentioned that they were
involved in measuring weight, with all nurses in PHC reported doing this as against 97 percent
nurses from CHC. At L3, all nurses at CHC level mentioned that they measured weight as part
of ANC checkups, against 69 percent at DH.
Three fourth (78 percent) of the nurses mentioned that they ensured urine was checked as part
of ANC checkup. At L1, 91 percent of nurses mentioned this, with 93 percent at SHC and 90
percent at PHC. At L2, 93 percent of nurses mentioned that they ensured urine test was done
as part of ANC checkup with all nurses at PHC mentioning this against 86 percent at CHC
level. At L3, 64 percent of nurses were involved, with all nurses at CHC mentioning this and
61 percent at DH.
Over three fourth (77 percent) of nurses provided TT injections during their ANC services. At
L1, this was found to be 96 percent with 100 percent coverage at SHC level and 90 percent at
PHC levels. At L2, 94 percent of nurses mentioned that they provide TT injections which was
found to be 96 percent at PHC level and 93 percent at CHC level. At L3, this was 60 percent
with all nurses at CHC involved and 57 percent of nurses at DH mentioning this.

Quality Initiatives in health facilities in Madhya Pradesh 38
A little around one third (32 percent) nurses also mentioned that they provide other services.
Monthly Cases Referred: The table shows that on an average, 10 cases were referred by
nurses on a monthly basis. At L1, the average was five, at L2 it was nine while at L3, it was
14. More cases were found to be referred from CHC.
Monthly deliveries conducted: The average number of monthly deliveries conducted was
overall 159 in facilities. However, it did vary across the levels and type of facility. At L1 it was
15 with maximum number being 30 at SHC and PHC levels. At L2, this was 59 with 41 average
deliveries at PHC level with maximum being 100 and 74 at CHC level with maximum being
200. At L3, the average number of monthly deliveries conducted was 299, at CHC level it was
found to be 300 with maximum being 400 and at DH the average was 299 with maximum being
700 in a month.
Monthly delivery cases referred: All cases received at the facility did not necessarily receive
the required services. Some of them had to be referred to higher facility level. The average
number of delivery cases referred by the facility was nine. At L1, this was 4, at L2 this was 8
while at L3 this was 13.
Largely the cases referred were delivery cases. The proportion of cases referred was highest in
case of L1 followed by L2 and least at L3.
Type of Services provided by Medical Officers
Medical officers were asked whether they provided different services under obstetric care. As
inferred from the data, 80-86 percent of the doctors mentioned that they provided services like
Antenatal Care, Intra-natal Care, New Born Care and Postnatal Care. Analysis of the same
across the level of facility and type of facility suggests that these were largely provided by the
medical officer in type L1 and L2 facilities and PHC and CHC. Whereas, in L3 and district
hospital around seven out of ten medical officers were involved in providing services. Abortion
services were provided only by 54 percent of the doctors of the total 106 doctors interviewed.
These services were provided by around two third of the medical officers in L3 facility and
district hospital. In L2 a little over one third (37 percent) of the officers were providing abortion
services.
Table 3.8: Type of Services provided by Medical Officers (in percentages)
Particulars Level of facility Type of facility Total
L1 L2 L3 PHC CHC DH
No. of medical officers 5 38 63 19 26 61 106
Antenatal care services 100 (5) 100.0 71.4 100 (19) 100(26) 70.5 83.0
Intranatal care services 80.0 (4) 97.4 73.0 94.7 (18) 96.2(25) 72.1 82.1
Postnatal care services 100 (5) 97.4 73.0 100 (19) 96.2(25) 72.1 83.0
Abortion services 0 36.8 68.3 21.1 (4) 46.2(12) 67.2 53.8
Data in table 3.9 indicates that 40 percent nurses interviewed mentioned that they provide
abortion related services. Twenty three percent nurses at L2 and 64 percent nurses at L3
mentioned this. It may be noted that no abortion related services were provided at L1 level by
any ANMs which is as per norm.
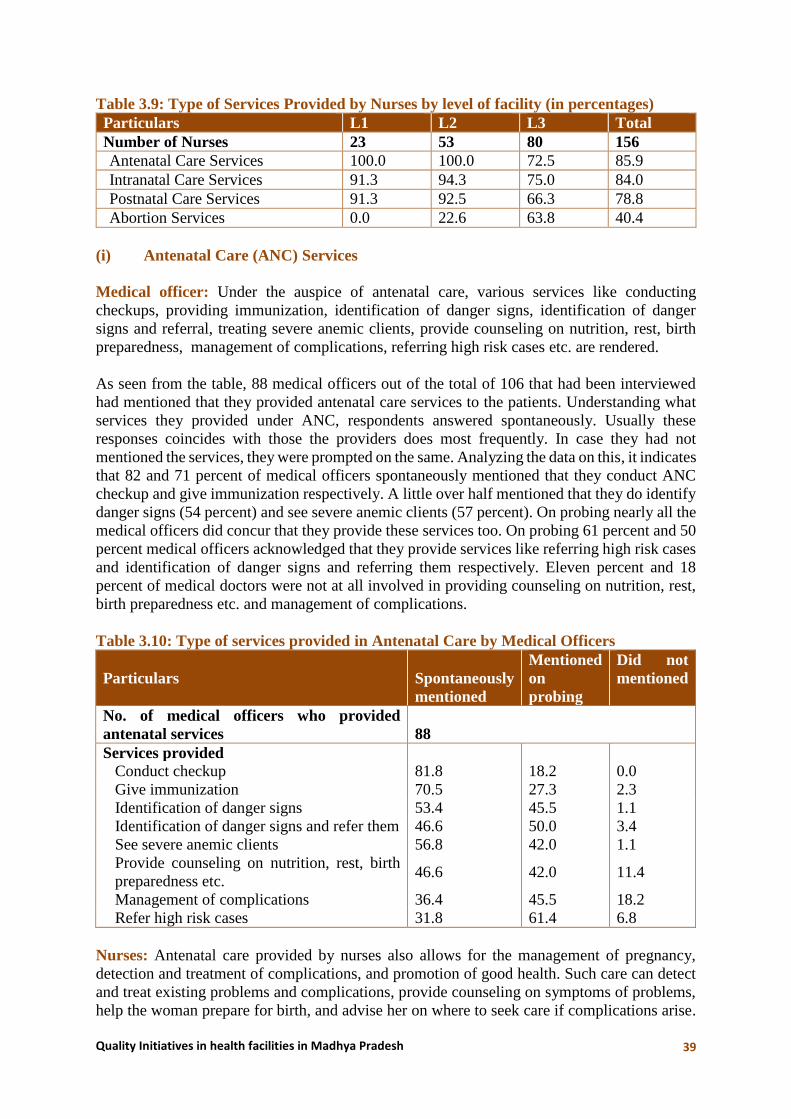
Quality Initiatives in health facilities in Madhya Pradesh 39
Table 3.9: Type of Services Provided by Nurses by level of facility (in percentages)
Particulars L1 L2 L3 Total
Number of Nurses 23 53 80 156
Antenatal Care Services 100.0 100.0 72.5 85.9
Intranatal Care Services 91.3 94.3 75.0 84.0
Postnatal Care Services 91.3 92.5 66.3 78.8
Abortion Services 0.0 22.6 63.8 40.4
(i) Antenatal Care (ANC) Services
Medical officer: Under the auspice of antenatal care, various services like conducting
checkups, providing immunization, identification of danger signs, identification of danger
signs and referral, treating severe anemic clients, provide counseling on nutrition, rest, birth
preparedness, management of complications, referring high risk cases etc. are rendered.
As seen from the table, 88 medical officers out of the total of 106 that had been interviewed
had mentioned that they provided antenatal care services to the patients. Understanding what
services they provided under ANC, respondents answered spontaneously. Usually these
responses coincides with those the providers does most frequently. In case they had not
mentioned the services, they were prompted on the same. Analyzing the data on this, it indicates
that 82 and 71 percent of medical officers spontaneously mentioned that they conduct ANC
checkup and give immunization respectively. A little over half mentioned that they do identify
danger signs (54 percent) and see severe anemic clients (57 percent). On probing nearly all the
medical officers did concur that they provide these services too. On probing 61 percent and 50
percent medical officers acknowledged that they provide services like referring high risk cases
and identification of danger signs and referring them respectively. Eleven percent and 18
percent of medical doctors were not at all involved in providing counseling on nutrition, rest,
birth preparedness etc. and management of complications.
Table 3.10: Type of services provided in Antenatal Care by Medical Officers
Particulars Spontaneously
mentioned
Mentioned
on
probing
Did not
mentioned
No. of medical officers who provided
antenatal services 88
Services provided
Conduct checkup 81.8 18.2 0.0
Give immunization 70.5 27.3 2.3
Identification of danger signs 53.4 45.5 1.1
Identification of danger signs and refer them 46.6 50.0 3.4
See severe anemic clients 56.8 42.0 1.1
Provide counseling on nutrition, rest, birth
preparedness etc. 46.6 42.0 11.4
Management of complications 36.4 45.5 18.2
Refer high risk cases 31.8 61.4 6.8
Nurses: Antenatal care provided by nurses also allows for the management of pregnancy,
detection and treatment of complications, and promotion of good health. Such care can detect
and treat existing problems and complications, provide counseling on symptoms of problems,
help the woman prepare for birth, and advise her on where to seek care if complications arise.

Quality Initiatives in health facilities in Madhya Pradesh 40
This care includes conducting checkup, providing immunization, identification of danger signs,
identification of danger signs and referral, detect severe anemic clients, and provide counseling
on nutrition, rest, birth preparedness, management of complications and referring high risk
cases.
As the data reveals, 86 percent nurses out of 156 interviewed, all 23 nurses at L1 and all 53
nurses at L2 were involved in providing antenatal care services. At L3, 73 percent of nurses
provided antenatal care services within which all nurses at CHC level L3 provided this services
as compared to 70 percent at DH.
As seen from the table 3.11, 134 nurses had mentioned that they provided antenatal services,
however, variation was observed regarding kind of services provided. Around four fifth (79
percent) nurses mentioned that they conducted checkups and 70 percent mentioned that they
provide immunization. However, only 48 percent mentioned they were involved in
identification of danger signs, 34 percent stated that they identify danger signs and refer
patients, 47 percent stated that they see severe anemic clients and 40 percent mentioned that
they provide counselling on nutrition, rest, birth preparedness etc. A little over one fourth of
the nurses stated that they were involved in management of complications (28 percent) and
they refer high risk cases (26 percent). On probing, most of them answered in affirmative.
However, 11 percent nurses did not mentioned that they provided counseling on nutrition, rest,
birth preparedness etc. Also 22 percent nurses did not mention that they were involved in
management of complications while 13 percent did not mentioned that they refer high risk
cases in spite of probing.
Table 3.11: Antenatal Care Services provided by Nurses
Particulars Spontaneously
mentioned
Mentioned
on probing
Did not
mentioned
No. of Nurses provided antenatal services 134
Services provided
Conduct checkup 79.1 15.7 5.2
Give immunization 70.1 26.1 3.7
Identification of danger signs 47.8 48.5 3.7
Identification of danger signs and refer
them 34.3 60.4 5.2
See severe anemic clients 47.0 48.5 4.5
Provide counseling on nutrition, rest, birth
preparedness etc. 40.3 48.5 11.2
Management of complications 27.6 50.0 22.4
Refer high risk cases 26.1 60.4 13.4
(ii) Intranatal Care Services
Services provided in Intranatal Care by Medical Officers
The array of various services provided as part of Intranatal care services include conducting
normal delivery, active management of third stage labor, identification of danger signs and
refer, referral management for obstetric, emergency, eclampsia, PPH and shock, episiotomy
and suturing of cervical tear, conducting assisted vaginal delivery by forceps or vacuum,
stabilization of patients with obstetric emergencies, e.g. eclampsia, PPH, sepsis, shock, referral
linkages with higher facilities, management of obstructed labor, surgical interventions like

Quality Initiatives in health facilities in Madhya Pradesh 41
caesarean section, comprehensive management of all obstetric emergencies (e.g.
PIH/Eclampsia, Sepsis, PPH retained placenta, shock etc.) and referral linkages with higher
facilities including medical colleges.
Medical Officer: It can be inferred from the table 3.12, out of the total 106 medical officers
who were interviewed, 87 mentioned that they were involved in providing intra-natal care
services. Around three out of five (62 percent) doctors mentioned spontaneously that they were
involved in conducting normal deliveries in the facility. Forty one percent mentioned
spontaneously that they were involved in active management of third stage labor while 38
percent were involved in identification of danger signs and referral. On probing, most of the
doctors mentioned that they did provide these services.
Referral management for obstetric, emergency, eclampsia, PPH and shock as a service was
mentioned spontaneously by a little over one fourth (28 percent) and on probing by 60 percent
of the medical doctors against 13 percent who did not acknowledge this at all. Only twenty five
percent doctors mentioned spontaneously that they undertake episiotomy and suturing of
cervical tear as a service while Over half (59 percent) of the doctors mentioned on probing that
they undertake Episiotomy and suturing of cervical tear as a service.
Less than 25 percent of the doctors mentioned spontaneously that they provide services in form
of stabilization of patients with obstetric emergencies(not mentioned by 18 percent), referral
linkages with higher facilities(not mentioned by 21 percent) and management of obstructed
labor(not mentioned by 35 percent). On probing rest of them mentioned to have provided these
services.
Sixty seven percent doctors mentioned that they do not provided services in form of assisted
vaginal deliveries, 29 percent are not involved in comprehensive management of all obstetric
emergencies and 37 percent are not involved in referral linkages with higher facilities like
medical college.
Facility wise the data revels that, at L1, only 25 percent doctors mentioned spontaneously that
they are involved in normal delivery while 75 percent mentioned only on probing they are
involved in active management of third stage labor. Fifty percent mentioned only on probing
that they provided services like referral management for obstetric emergency, episiotomy and
suturing of cervical tear, stabilization of patients with obstetric emergencies, referral linkages
with higher facilities, management of obstruct labor, comprehensive management of all
obstetric emergencies and referral linkages with higher facilities. None of the doctors
conducted assisted vaginal delivery or surgical interventions like caesarean section.
At L2, majorly doctors were not involved in surgical interventions like caesarean section (89
percent), assisted vaginal delivery (87 percent) and management of obstruct labor (68 percent).
Majority of doctors on probing mentioned that they were involved in referral management of
obstetric emergency (76 percent), identification of danger signs and refer (73 percent),
episiotomy and suturing of cervical tear (70 percent) and active management of third stage
labor (67 percent). Most of the services were mentioned on probing at L2 except for normal
delivery followed by active management of third stage labor and identification of danger signs
and referral.
At L3, except for 48 percent doctors who did were not involved in assisted vaginal delivery
and 20 percent who were not involved in referral linkages with higher facilities, some doctors

Quality Initiatives in health facilities in Madhya Pradesh 42
spontaneously mentioned that they are involved in providing other services like normal
delivery (70 percent), active management of third stage labor and identification of danger signs
and refer 52 percent each. Majority of doctors on probing mentioned that they were involved
in stabilization of patents with obstetric emergencies and comprehensive management of all
obstetric emergencies (59 percent), 54 percent in case of referral linkages with higher facilities
followed by 52 percent each in case of referral linkages with higher facilities and management
of obstructed labor. Forty eight to fifty percent mentioned on probing that they were involved
in referral management for obstetric emergency, episiotomy and suturing of cervical tear and
surgical interventions like caesarean section.
Table 3.12: Type of services provided in Intra-natal care by Medical Officers (in
percentages)
Particulars Spontaneously
mentioned
Mentioned
on
probing
Did not
mentioned
No. of medical officers provided intranatal
services 87
Services provided
Normal delivery 62.1 34.5 3.4
Active management of third stage labor 40.2 55.2 4.6
Identification of danger signs and refer 37.9 58.6 3.4
Referral management for obstetric,
emergency, eclampsia, PPH and shock 27.6 59.8 12.6
Episiotomy and suturing of cervical tear 25.3 58.6 16.1
Assist vaginal delivery by forceps, vacuum 16.1 17.2 66.7
Stabilization of patients with obstetric
emergencies, e.g. eclampsia, PPH, sepsis,
shock
24.1 57.5 18.4
Referral linkages with higher facilities 23.0 56.3 20.7
Management of obstructed labor 23.0 42.5 34.5
Surgical interventions like caesarean
section 23.0 29.9 47.1
Comprehensive management of all obstetric
emergencies e.g. PIH/Eclampsia, Sepsis,
PPH
retained placenta, shock etc.
18.4 52.9 28.7
Referral linkages with higher facilities
including medical colleges 16.1 47.1 36.8
Nurses: As seen from the data, 84 percent nurses mentioned that they provide intra-natal care
services. At L1, 91 percent nurses, at L2, 94 percent nurses and 75 percent nurses at L3
mentioned that they provide intra-natal care services. Across facilities, 93 percent nurses at
SHC, 97 percent at PHC, 91 percent at CHC and 73 percent at DH mention that they provide
intra-natal care services.
Services provided in Intra-natal Care by Nurses
As inferred from the table no 3.13, 131 nurses mentioned that they provide intra-natal care
services. Sixty percent of the nurses mentioned spontaneously that they conducted normal
delivery and on probing, most of them had agreed to this, 39 percent were involved in active

Quality Initiatives in health facilities in Madhya Pradesh 43
management of third stage labor (50 percent mentioned this on probing) followed by 29 percent
who were involved in identification of danger signs and referral (60 percent mentioned on
probing).
Twenty one percent were involved in referral management of obstetric emergency (56 percent
mentioned this on probing). Less than 20 percent spontaneously mentioned that they were
involved in episiotomy and suturing of cervical tear (35 percent did not mentioned this on
probing) and referral linkages with higher facilities (33 percent did not mentioned this on
probing).
Similarly less than 15 percent mentioned spontaneously that they were involved in stabilization
of patients with obstetric emergencies (43 percent did not mentioned this on probing) and
referral linkages with higher facilities (48 percent did not mentioned this in spite of probing).
Sixty six percent were not involved in assisted vaginal delivery (21 percent had mentioned on
probing), 53 percent were not involved in surgical interventions like caesarean (34 percent had
mentioned this on probing) and 47 percent were not involved in comprehensive management
of all obstetric emergencies (41 percent had mentioned this on probing).
As indicated by data, at L1, 53 percent of nurses mentioned spontaneously that were involved
in normal delivery while on probing, all them had mentioned this. Services like active
management of third stage labor (71 percent), identification of danger signs and refer (86
percent) and referral management of obstetric emergency (62 percent) were mentioned on
probing while the majority of rest had mentioned this spontaneously. Majority of the services
which were not mentioned on probing were surgical interventions like caesarean section (91
percent), comprehensive management of all obstetric emergencies (86 percent), referral
linkages with higher facilities (81 percent), assisted vaginal delivery (76 percent), management
of obstruct labor (71 percent), episiotomy and suturing of cervical tear and stabilization of
patients with obstetric emergencies (57 percent each) and referral linkages with higher facilities
(48 percent). Most of these services in the remaining cases were mentioned on probing.
At L2, 70 percent nurses mentioned spontaneously that they had been involved in conducting
normal delivery and majority agreed on probing. On probing, 74 percent mentioned they were
involved in identification of danger signs and refer, 50 percent in active management of third
stage labor and 58 in referral management for obstetric emergency. Of the remaining nurses,
majority of them had mentioned this spontaneously. In spite of probing, services which were
not mentioned by the nurses included surgical interventions like caesarean section (84 percent),
assisted vaginal delivery (78 percent), comprehensive management of all obstetric
emergencies (66 percent), management of obstruct labor (60 percent), stabilization of patients
with obstetric emergencies and referral linkages with higher facilities including medical
colleges (56 percent each), episiotomy and suturing of cervical tear (46 percent) and referral
linkages with higher facilities (40 percent). Majority of remaining rest of the nurses had
mentioned these services on probing.
At L3, 55 percent nurses spontaneously mentioned that they conducted normal delivery (not
mentioned by 17 percent), 40 percent were involved in active management of third stage labor
(not mentioned by 18 percent), 42 percent were involved in identification of danger signs and
refer (not mentioned by 18 percent), 32 percent were involved in episiotomy and suturing of
cervical tear (not mentioned by 18 percent) and 30 percent were involved in referral
management of obstetric emergencies (not mentioned by 18 percent). Majority of the service

Quality Initiatives in health facilities in Madhya Pradesh 44
which were not mentioned on probing were assisted vaginal delivery (51 percent), stabilization
of patients with obstetric emergencies (27 percent), referral linkages with higher facilities (22
percent) and management of obstructed labor (20 percent). These services were mentioned
spontaneously by less than 24 percent nurses. It was on probing 61 percent nurses mentioned
that they were involved in surgical interventions like caesarean section (not mentioned by 15
percent), 63 percent in comprehensive management of all obstetric emergencies (not mentioned
by 17 percent) and 52 in referral linkages with higher facilities including medical college (not
mentioned by 30 percent).
Table 3.13: Intra-natal care Services provided by Nurses
Particulars Spontaneously
mentioned
Mentioned
on probing
Did not
mentioned
No. of Nurses providing intra-natal services 131
Services provided
Normal delivery 60.3 30.5 9.2
Active management of third stage labor 38.9 49.6 11.5
Identification of danger signs and refer 29.0 60.3 10.7
Referral management for obstetric,
emergency, eclampsia, PPH and shock 21.4 55.7 22.9
Episiotomy and suturing of cervical tear 19.1 45.8 35.1
Assist vaginal delivery by forceps, vacuum 13.0 21.4 65.6
Stabilization of patients with obstetric
emergencies, e.g. eclampsia, PPH, sepsis,
shock
14.5 42.7 42.7
Referral linkages with higher facilities 16.8 50.4 32.8
Management of obstructed labor 14.5 42.0 43.5
Surgical interventions like caesarean section 13.0 33.6 53.4
Comprehensive management of all obstetric
emergencies e.g. PIH/Eclampsia, Sepsis, PPH
retained placenta, shock etc.
13.0 40.5 46.6
Referral linkages with higher facilities
including medical colleges 13.7 38.2 48.1
Others 0.0 0.8 99.2
(iii) Postnatal Care Services
The postnatal period is a critical phase in the lives of mothers and newborn babies. Most
maternal and infant deaths occur during this time. A postpartum period (or postnatal period) is
the period beginning immediately after the birth of a child and extending for about six weeks.
These includes regular checkup, timely identification of danger signs and complications, and
referral of mother and baby, motivating for family planning, stabilization of mother with
postnatal emergencies, e.g. PPH, sepsis, shock, retained placenta etc. and referral linkages with
higher facilities.
Services provided for Postnatal Care by Medical Officers
Postnatal care is equally an important component of obstetric care, it mainly should include
rendering services like regular checkup, timely identification of danger signs and
complications, referral of mother and baby, motivating patients for family planning,
stabilization of mother with postnatal emergencies and referral linkages with higher facilities.

Quality Initiatives in health facilities in Madhya Pradesh 45
As inferred from the table 3.14, postnatal care was provided by 88 medical officers out of the
106 who were interviewed. The various services provided by them as part of postnatal care
were regular checkup (74 percent), stabilization of mother with postnatal emergencies (30
percent) and motivate for family planning (52 percent). However, in the subsequent two cases,
around half of them mentioned this on probing. Regarding referrals, the doctors were also
involved in timely identification of danger signs and complications and referral of mother and
baby (46 percent) and referral linkages with higher facilities (22 percent). However remaining
more than half of them mentioned this on probing.
Facility wise, at L1 a total of 5 doctors were interviewed. Of these, two each were involved in
regular checkups (one was not involved) and timely identification of danger signs and
complications and referral of mother and baby. Rest of them mentioned this on probing. One
each was involved in motivate for family planning, stabilization of mother with postnatal
emergencies (three not involved) and referral linkages with higher facilities (three not
involved). Rest of them mentioned to have provided these services on probing.
At L2, doctors were involved in regular checkup (65 percent), timely identification of danger
signs and complications and referral of mother and baby (22 percent) and motivate for family
planning (43 percent) while majorly rest all mentioned these services on probing. A very less
percentage of doctors mentioned spontaneously but on probing mentioned 62 percent
mentioned that they are involved in stabilization of mother with postnatal emergencies (32 did
not mentioned on probing) followed by 65 percent who were involved in referral linkages with
higher facilities (27 percent did not mentioned).
At L3, the doctors mentioned spontaneously that they undertook regular checkup (85 percent),
timely identification of danger signs and complications and referral of mother and baby (65
percent), motivate for family planning (63 percent), stabilization of mother with postnatal
emergencies (50 percent) and referral linkages with higher facilities (33 percent). Majority of
them mentioned to have provided all these on probing in the remaining cases.
Table 3.14: Type of services provided for postnatal care by Medical Officers (in
percentage)
Particulars Spontaneously
mentioned
Mentioned
on probing
Did not
mentioned
No. of medical officers who provided services for
postnatal care 88
Services provided
Regular checkup 73.9 19.3 6.8
Timely identification of danger signs and
complications, and referral of mother and baby 45.5 53.4 1.1
Motivate for family planning 52.3 47.7 0.0
Stabilization of mother with postnatal emergencies,
e.g. PPH, sepsis, shock, retained placenta 29.5 53.4 17.0
Referral linkages with higher facilities 21.6 54.5 23.9
Services for Postnatal Care provided by Nurses
As depicted from the table, nurses mentioned to have provided regular checkup (68 percent),
timely identification of danger signs and complications and referral of mother and baby (41
percent), motivate for family planning (46 percent), stabilization of mother with postnatal

Quality Initiatives in health facilities in Madhya Pradesh 46
emergencies (20 percent) and referral linkages with higher facilities (19 percent). Thought on
probing, remaining nurses mentioned to have provided these services, 31 percent each did not
provide services in form of stabilization of mother with postnatal emergencies and referral
linkages with higher facilities.
Facility wise, at L1, nurses mentioned that they provided services like regular checkup (71
percent), timely identification of danger signs and complications and referral of mother and
baby (24 percent) and motivate for family planning (29 percent). However on probing, largely
all the remaining nurses mentioned that they provided these services. Lesser number of nurses
mentioned provided services but on probing, 38 percent said they provided services in form of
stabilization of mother with postnatal emergencies (not provided by 57 percent) and 48 percent
mentioned that they provided referral linkages with higher facilities (not provided by 38
percent).
At L2 level, nurses mentioned that they provided services in form of regular checkup (69
percent), timely identification of danger sign and complications and referral of mother and baby
(43 percent), motivate for family planning (51 percent), stabilization of mother with postnatal
emergencies (25 percent) and referral linkages with higher facilities (20 percent). While most
of the remaining nurses mentioned this on probing, 41 percent each did not provided services
like stabilization of mother with postnatal emergencies and referral linkages with higher
facilities.
At L3, the nurses mentioned that they provided regular checkup (66 percent), timely
identification of danger signs and complications and referral of mother and baby (45 percent),
motivate for family planning (49 percent), stabilization of mother with postnatal emergencies
(21 percent) and referral linkages with higher facilities (19 percent). While most of the
remaining nurses on probing mentioned to have provided these services, 11 percent did not
provided service of stabilization of mother with postnatal emergencies and 19 percent did not
provided referral linkages with higher facilities.
Table 3.15: Services for postnatal care provided by Nurses
Particulars Spontaneously
mentioned
Mentioned
on probing
Did not
mentioned
No. of Nurses providing services for postnatal
care
Services provided
Regular checkup 68.3 26.0 5.7
Timely identification of danger signs and
complications, and referral of mother and baby 40.7 52.8 6.5
Motivate for family planning 46.3 52.0 1.6
Stabilization of mother with postnatal
emergencies, e.g. PPH, sepsis, shock, retained
placenta
19.5 49.6 30.9
Referral linkages with higher facilities 18.7 50.4 30.9
Others 0.0 0.0 100.0

Quality Initiatives in health facilities in Madhya Pradesh 47
Cliental Services
Post-delivery stay in facility by woman ensures monitoring health of mother and newborn,
nutritional diet for the mother, administration of medicines to mother, immunization to new
born, tracking of any complications post-delivery etc. It also provides an opportunity to ensure
counseling on breast feeding, kangaroo care, post-partum contraceptives etc. Data was gathered
on these issues from the nurses. As observed from table 3.16, average number of post-delivery
stay of women in the facility was mentioned as 2.5 days across the facilities. This average was
2.1 at L1 and 2.6 days each at L2 and L3 levels respectively.
Overall, 86 percent nurses acknowledged that following delivery women do stay for stipulated
period as per norm. At L1, this was 74 percent, L2 it was 76 percent while at L3 it was 96
percent. Asking for reasons why women do stay in the facility as per norm, various reasons
were mentioned including women had work to do at home and children to look after, they stay
close by and therefore return home on their own, if they deliver in morning half they return by
evening, personal problem etc. Few reasons related to facility that were mentioned included
shortage of manpower and lack of beds.
Zero day immunization of new born: Under the immunization program new born child
should receive polio and hepatitis vaccination as part of zero day immunization. Data indicates
that overall 94 percent nurses across facilities, mentioned that they provide zero day
immunization to new born. At L2 and L3 levels it was 96 and 98 percent respectively. While
at L1, this was less at 78 percent. During the informal discussions with the ANM/ nurses it was
learnt that in many places, people still have taboo regarding immunization due to social beliefs.
Also since women do not stay for stipulated time period, it was difficult to ensure this.
Sometimes they cannot carry out the immunization as vaccines were not available in the
facility.
Table 3.16: Ensuring Cliental Services
L1 L2 L3 Total
Number of Nurses 23 53 80 156
No. of days women stay in facility post
delivery 2.1 2.6 2.6 2.5
Post-delivery stay by women as per norm 73.9 75.5 96.3 85.9
Zero day immunization of new born 78.3 96.2 97.5 94.2
(iv) Abortion Services
Medical Officers: Abortion services broadly includes counseling and facilitation for safe
abortion services, conducting MVA up to 12 weeks, medical methods of abortion (up to 7
weeks of pregnancy), post abortion contraceptive counselling, referral linkages with higher
center for cases beyond 8 weeks of pregnancy up to 20 weeks, treatment of
incomplete/inevitable/ spontaneous abortions, conducting second trimester MTP, management
of all post abortion complications and providing IUD/oral pills.
As depicted from the above table, the doctors mentioned that they provided services like MVA
up to 12 weeks (46 percent), Second Trimester MTP (35 percent), Medical methods of abortion
(up to 7 weeks of pregnancy) (28 percent), treatment of incomplete/inevitable/ spontaneous
abortions (28 percent) and management of all post abortion complications (28 percent). On
probing though most of the remaining doctor mentioned this, around 12- 21 percent were not

Quality Initiatives in health facilities in Madhya Pradesh 48
providing these services except in case of second trimester MTP where it was 28 percent. They
also mentioned services like post abortion contraceptive (35 percent), counseling and
facilitation for safe abortion services (41 percent) and providing IUD/Oral pills (32 percent).
Facility wise, abortion facilities are available only at L2 and L3 facilities. At L2, 7 percent
doctors mentioned that they provide counseling and facilitation for safe abortion services and
on probing, most of them mentioned this. Less than 15 percent doctors mentioned that they
provided abortion services in form of medical abortion up to 7 weeks (43 percent do not provide
this), MVA up to 12 weeks (36 percent do not provide this) management of all post abortion
complications (36 percent do not provide this) and post abortion contraceptive counseling (not
provided by 36 percent). Largely the remaining of them mentioned this when probed. Second
trimester MTP (not mentioned by 50 percent) and treatment of incomplete/inevitable/
spontaneous abortions (not mentioned by 29 percent) were mentioned as services provided only
on probing. Provision of IUD/Oral Pills was mentioned only on probing (21 percent did not
provide this). Referral linkages with higher center for cases beyond 8 weeks of pregnancy up
to 20 weeks was mentioned only by 7 percent doctors while 50 percent did not mentioned this
in spite of probing.
At L3, the doctors mentioned that they provided abortion services in form of medical abortion
up to 7 weeks of pregnancy (33 percent), MVA up to 12 weeks (56 percent), second trimester
MTP (42 percent) and treatment of incomplete/inevitable/spontaneous abortions (37 percent).
Though majority of remaining doctors mentioned this on probing, medical abortion up to 7
weeks of pregnancy was not done by 14 percent and second trimester MTP was not done by
21 percent doctors. Management of all post abortion complications was mentioned by 37
percent and on probing, majority of them mentioned this. Similarly, counseling and facilitation
for safe abortion was mentioned by 51 percent, post abortion contraceptive counseling by 44
percent and provision of IUD/Oral pill by 42 percent. Referral linkages with higher centers for
cases beyond 8 weeks of pregnancy up to 20 weeks was mentioned by 35 percent while 21
percent did not mentioned it.
Table 3.17: Abortion services provided by Medical Officers (in percentages)
Particulars Spontaneously
mentioned
Mentioned
on probing
Did not
mentioned
No. of medical officers who provided
abortion services
57
Services provided
MVA up to 12 weeks 45.6 38.6 15.8
Medical methods of abortion (up to 7 weeks
of pregnancy)
28.1 50.9 21.1
Post abortion contraceptive counselling 35.1 47.4 17.5
Referral linkages with higher center for cases
beyond 8 weeks of pregnancy up to 20 weeks
26.3 45.6 28.1
Treatment of incomplete/inevitable/
spontaneous abortions
28.1 59.6 12.3
Second trimester MTP 35.1 36.8 28.1
Management of all post abortion
complications
28.1 57.9 14.0
Counseling and facilitation for safe abortion
services
40.4 56.1 3.5
Provide IUD/oral pills 31.6 61.4 7.0

Quality Initiatives in health facilities in Madhya Pradesh 49
Nurses: As depicted from the table, nurses mentioned that they provided services like
counseling and facilitation for safe abortion services (48 percent), post abortion contraceptive
counseling (44 percent), provide IUD/Oral Pills (35 percent) and referral linkages with higher
center for cases beyond 8 weeks of pregnancy up to 20 weeks (29 percent). Around 11 to 25
percent nurses were not involved in providing these services. Apart from this, the nurses also
assisted the doctors for performing MVA up to 12 weeks (46 percent), medial method of
abortion (up to 7 weeks of pregnancy) (40 percent), treatment of incomplete/inevitable/
spontaneous abortions (32 percent), second trimester MTP (38 percent) and management of all
post abortion complications (25 percent). In this case also around 12-29 percent of nurses did
not provide this kind of assistance to doctors.
Facility wise, abortion services are available only at L2 and L3 facilities and hence the data
represents from these facilities only.
At L2, 41 percent nurses mentioned providing services like counseling and facilitation for safe
abortion (17 percent not provided), 25 percent provide post abortion contraceptive counseling
(58 percent did not provided), 33 percent provide IUD/oral pills (25 percent did not provide
this) and 25 percent provided referral linkages with higher centres for cases beyond 8 weeks of
pregnancy up to 20 weeks (one third did not provide this). Moreover, 25 percent nurses assisted
doctors in MVA up to 12 weeks (42 percent did not assisted), 25 percent assisted in medical
methods of abortion (25 percent did not assisted), 25 percent assisted in treatment of
incomplete/inevitable/spontaneous abortions (50 percent did not assisted), 25 percent assisted
in second trimester MTP (58 percent did not assisted) and 33 percent assisted in management
of all post abortion complications (50 percent did not assisted). It is to be noted that very few
nurses were involved in providing the services or assisted in providing the services at L2 level.
Table 3.18: Abortion services provided by Nurses
Particulars Spontaneously
mentioned
Mentioned
on probing
Did not
mention
No. of Nurses providing abortion services
Services provided
Counseling and facilitation for safe abortion
services 49.2 39.7 11.1
MVA up to 12 weeks 46.0 33.3 20.6
Medical methods of abortion (up to 7 weeks
of pregnancy) 39.7 47.6 12.7
Post abortion contraceptive counselling 44.4 34.9 20.6
Referral linkages with higher centre for cases
beyond 8 weeks of pregnancy up to 20 weeks 28.6 46.0 25.4
Treatment of incomplete/inevitable/
spontaneous abortions 31.7 46.0 22.2
Second trimester MTP 38.1 33.3 28.6
Management of all post abortion
complications 25.4 50.8 23.8
Provide IUD/oral pills 34.9 47.6 17.5
At L3, 51 percent nurses mentioned that they provided counseling and facilitation for safe
abortion, 49 percent mentioned post abortion contraceptive counseling, 35 percent provided
IUD/Oral Pills and 29 percent mentioned referral linkages with higher centers for cases beyond
8 weeks of pregnancy up to 20 weeks (24 percent did not mentioned this). However, on
probing, most of them mentioned providing these services. The nurses also mentioned that they

Quality Initiatives in health facilities in Madhya Pradesh 50
assist the doctors in other services. Fifty one percent mentioned assisting in MVA up to 12
weeks (16 percent did not assisted), 43 percent assisted in medical method of abortion, 33
percent in treatment of incomplete/inevitable/spontaneous abortions (16 percent did not
assisted), 41 percent in second trimester MTP (22 percent did not assisted) and 24 percent in
management of all post abortion complications (18 percent did not assisted).
Core Competencies of Skilled Birth Attendants
The largest threat of maternal mortality occurs during labor, birth and the 24 hours following
birth. Many of the interventions known to save the lives of women and their newborns depend
upon the presence of a Skilled Birth Attendant (SBA). This health professional must be
accredited—such as a midwife, doctor or nurse—and have been educated and trained to
proficiency in the skills needed to manage normal (uncomplicated) pregnancies, childbirth, and
the immediate postnatal period, as well as the identification, management and referral of
complications in women and newborns.
Findings suggest variation across the type of facility as well as competencies. It is to be noted
that the data represents findings from PHC, CHC and DH levels largely. Around 70-73 percent
facilities had capacity to provide treatment of moderate and severe anemia in pregnancy (12/24
PHC and 3/16 CHC did not have this), manage vaginal tears (except for 11/24 PHC and 5/16
CHC) and removal of retained placenta associated with bleeding (excluding 9/16 CHC).
Similarly 60 percent facilities were equipped to provide treatment of bleeding in the antenatal
period and postpartum (except half of PHCs and CHCs) as well as treatment of hypertensive
disorders in pregnancy which was lacking in 16/24 PHC and 6/16 CHC.
Fifty one to 54 percent facilities had core competencies to provide treatment of sepsis (absent
in 18/24 PHC and 9/16 CHC), management of sick and low birth weight newborn-including
management of birth asphyxia, sepsis and low birth weight (absent in 16/24 PHC, 8/16 CHC
and 3/17 DH) and management of neonatal sepsis including with Injectable antibiotics which
was found to be absent in case of 16/24 PHC, 8/16 CHC and 1/17 DH.
Treatment of abortion was carried out by 42 percent facilities baring 21/24 PHC, 10/16 CHC
and 1/17 DH. Performing manual vacuum aspiration for the management of incomplete
abortion as a core competency of SBA was noted in case of 37 percent facilities with exception
of 22/24 PHC, 11/16 CHC and 2/17 DH. Only 16 percent facilities had the required
competencies to use vacuum extraction in vaginal deliveries while 23/24 PHC, 16/16 CHC and
8/17 DH did not have the required competencies.
Taking all the eleven (i.e. treatment of moderate/severe anemia in pregnancy, bleeding in
antenatal/postpartum, hypertensive disorders in pregnancy, sepsis and abortions, use of vacuum
extraction in vaginal deliveries, managing vaginal tears, incomplete abortions, removal of
retained placenta, management of sick low birth weight new born and neonate sepsis) core
competency which is assessed for understanding core competencies of SBA, composite index
was calculated. As table 3.19 indicates over three fourth facilities at L3 level had scored ‘very
good’ in SBA competencies, baring four facilities which came in ‘good category’. Status of
SBA competency at L1 and L2 facilities largely befell in ‘poor’ to ‘very poor’ category.
Thereby, indicating that only selected type of services were available for obstetric and new
born at L1 and L2 level. However, there were one and two facilities at L1 and L2 levels
respectively that came in ‘very good’ category.

Quality Initiatives in health facilities in Madhya Pradesh 51
Core Competencies of SBA providing Care at CEmONC
At the CEmONC level, 68 percent facilities had competencies for providing skilled attendance
by specialist as well as manage and provide 24 hour comprehensive care for major pregnancy
related complications in mother and new born. Both these components were not available in
6/17 DH. Competencies for providing safe surgery and blood transfusion and presences of an
obstetrician/or a non-specialist MBBS doctor who had received Emergency Obstetric Care
(EmOC) training were found in 61 percent facilities except for 7/17 DH. A Pediatrician or an
MO trained in new born care for the Stabilization Unit to provide higher level of newborn care
skills were existent in 61 percent facilities except 6/17 DH and one CHC. It is to be noted that
an anesthetist or an MBBS doctor who had received training in life saving anesthesia skills was
present in 56 percent facilities with the exception of one CHC and 7/17 DH.
Similarly 67 percent facilities at CEmONC level were equipped to diagnose maternal
emergencies, provide appropriate medical and surgical treatment to maternal emergencies,
undertake manual removal of placenta, conduct caesarean section and provide initial care and
stabilization of sick newborns not requiring intensive care, support mothers to breastfeed and
provide breastfeeding support and referral services. These competencies were lacking in 6/17
DH. Also, 61 percent facilities had the competencies to perform assisted vaginal delivery with
exception of CHC and 6/17 DH and cross match blood and provide blood transfusion was not
found in 7/17 DH.
Taking all the above competency together for core composite index of skill in CEmONC level,
data indicates that around two third of facilities were meeting the competency in ‘very good’
category, while the remaining were falling in ‘very poor’ category.
Table 3.19: Core competencies of skilled birth attendants
Level 1 Level 2 Level 3
Total number of
facilities
7 32 18
N % N % N %
Skilled Birth Attendant
Very poor (<=25 %) 3 42.9 15 46.9 0 0.0
Poor (25.1-50 %) 2 28.6 7 21.9 0 0.0
Good (50.1-75 %) 1 14.3 8 25.0 4 22.2
Very good (>75 %) 1 14.3 2 6.3 14 77.8
Total number of
facilities 18
SBA care at CEmONC
Very poor (<=25 %) 6 33.3
Poor (25.1-50 %) 0 0.0
Good (50.1-75 %) 0 0.0
Very good (>75 %) 12 66.7
Total number of
facilities 7 32 18
Competencies Total
Very poor (<=25 %) 3 42.9 15 46.9 0 0.0
Poor (25.1-50 %) 2 28.6 7 21.9 6 33.3
Good (50.1-75 %) 1 14.3 8 25.0 0 0.0
Very good (>75 %) 1 14.3 2 6.3 12 66.7

Quality Initiatives in health facilities in Madhya Pradesh 52
Overall, the index indicates that the status of facilities in each level varies from ‘very poor’ to
‘very good’ categories.
To sum up, findings suggest that ANC/PNC ward and logistics for labor room were relatively
better in L3 level facilities followed by L2 and L1. Situation for minor OT needs to be enhanced
at both levels more so at L2. Facilities for CEmONC services needs to be ensured in all
facilities. Despite these shortcomings, L1 and L2 level facilities were conducting deliveries
more than expected of them. But, half of L3 facilities were conducting deliveries less than
average.

Quality Initiatives in health facilities in Madhya Pradesh 53
Chapter 4 New Born Care Neonatal mortality is one of the major contributors (2/3) to the Infant Mortality. To address the
issues of higher neonatal and early neonatal mortality, facility based newborn care services at
health facilities have been emphasized. Setting up of facilities for care of Sick Newborn such
as Special New Born Care Units (SNCUs), New Born Stabilization Units (NBSUs) and New
Born Baby Corners (NBCCs) at different levels is a thrust area under NHM.
Facility-based newborn care has a significant potential for improving the survival of newborns
in India. Three levels of neonatal care are envisaged. Newborn-care corners are established at
every level to provide essential care at birth, including resuscitation. Level I care includes
referral of sick newborns from Primary Health Centers (PHCs) to higher centers and care at
Neonatal Stabilization Units (NSUs) in the first referral units. Care in the NSUs includes
stabilization of sick newborns and care of low-birth weight (LBW) babies not requiring
intensive care. Level II care includes functioning of Special Care Newborn Units (SCNUs) at
the district hospital level. These units are equipped to handle sick newborns other than those
who need ventilator support and surgical care. The level III units are the neonatal intensive care
units. In covering the study health facilities, data was gathered from new born corner, NSU and
SCNUs. Findings from the same have been discussed in following paragraph.
New Born Corner
New born corner in a health facility needs to ensure presences of certain facilities that takes
care of newborn. Analyzing these, data indicates that resuscitation facility was overall available
in 79 percent facilities except for 1/13 SHCs, 11/24 PHCs and 3/16CHCs which was observed
more at the levels of L1 and L2. All L3 facilities were equipped with resuscitation facility.
Ideally these should be present in all health facilities wherein deliveries were taking place.
Further, stabilization and referral of sick newborns and very low birth weight babies was
reported by 75 percent facilities. This was deficient across some PHCs and CHCs (11/24 PHCs
and 3/16 CHCs).
Yet another component that needs to be managed includes identification and management of
LBW infants (</=1800 g). This was reported by only two third (67 percent) of total facilities.
Imbalance was observed across all levels of facilities, but more so at L1 (71 percent) and L2
(41 percent) as compared to L3 (one DH) i.e. in case of 14/24 PHCs, 4/16 CHCs and one DH.
Further care of newborn in management of newborn sepsis was reported by 61 percent facilities
but was wanting in 16/24 PHCs and 6/16 CHCs. Similarly service in form of phototherapy for
newborns with hyper bilirubinemia was available in only a little over half (53 percent) of
facilities, but was deficient at PHCs (21/24) and CHCs (6/16).
Some of the minimum care that also needs to be accorded to newborn includes immunization
and support for breast feeding. Findings indicate that zero dose immunization according to GOI
schedule and Inj. Vitamin K was overall reported from 71 percent facilities. However, absences
of this was more observed in case of L1 (45 percent- 5/7 PHCs, 4/13 SHCs) and L2 (35 percent-
6/17 PHCs, 4/15 CHCs) level facilities as compared to L3 (One DH).
Aspects related to advise on breast feeding/feeding support was observed in case of 80 percent
facilities and was found to be missing in case of 10/24 PHC and 4/16 CHC which were largely

Quality Initiatives in health facilities in Madhya Pradesh 54
falling in L1 and L2 levels. System needs to ensure that the available support staff provides the
required support on regular basis.
Table 4.1: Composite index of newborn corner by level of facility
Level 1 Level 2 Level 3
Total number of
facilities
20 32 18
N % N % N %
Facility in newborn
corner
Very poor (<=25 %) 4 20.0 8 25.0 0 0.0
Poor (25.1-50 %) 3 15.0 1 3.1 0 0.0
Good (50.1-75 %) 3 15.0 9 28.1 0 0.0
Very good (>75 %) 10 50.0 14 43.8 18 100.0
Considering the status of all the above seven components, composite index was calculated. As
table 4.1 indicates all facilities at L3 level had the required sub components for addressing new
born care. While at L1 and L2, only 50 and 44 percent facilities respectively came in the range
of ‘very good’ category. Facilities at L1 and L2 level need to be further strengthened on these
aspects as it has the potentiality to influence the reduction of infant mortality.
Neonatal Stabilization Unit (NSU)
As mentioned earlier NSU are observed at PHC, CHC and DH levels. To ensure baby maintains
body temperature presences of radiant warmer is essential. A little over two third (68 percent)
facilities had the open care system having radiant warmer with trolley, drawers and oxygen
bottles. However, these were not available in 6 /24 PHCs, 10/16 CHCs and 2/17 DHs. Yet
another important component is the resuscitator which ensures that the baby starts breathing
normally. Seventy two percent facilities had hand operated neonate resuscitator which was
found to be absent in 5/24 PHC, 10/16 CHC and one DH.
Some of the other essential
equipment available in the facility
were mucus extractor, 20 ml, sterile,
disposable, Dee Lee in 64 percent
facilities but was not available in
9/24 PHC, 10/16 CHC and 2/17 DH
and foot operated pump suction was
in 61 percent facilities. Yet other
necessities which existed included
weighing scale (84 percent), sterile
hand gloves (83 percent) and
oxygen cylinder (81 percent). To a
lesser extent existed towels for
drying wrapping baby (79 percent),
feeding tube (67 percent) and IV
cannula (68 percent)
54
2511
50
46 9
16
89
0
20
40
60
80
100
L1 L2 L3
Fig. 4.1: CI of Neomatal Stabilixation Unit
very good good poor very poor

Quality Initiatives in health facilities in Madhya Pradesh 55
Sick Newborn Care Unit
It may be mentioned that Sick Newborn Care Unit are to be found at CEmONC level only that
is at CHC and DHs level. Findings from the same are discussed in following paragraph.
Furniture and General Equipment: As indicated by data, Electronic weighing scale for
weighing the infants, emergency drug trolley, refrigerator, nebulizer, room thermometer and
generator of 15 KVA was available in 90 percent facilities with exception of one CHC and one
DH.
Infantometer was available in 83 percent facilities except one CHC and 2/17 DH. Procedure
trolley was available in 67 percent facilities with exception of one CHC and 5/17 DH. Portable
X-Ray machine was available in 78 percent facilities excluding one CHC and 3/17 DH. Basic
surgical instruments were found to be there in 61 percent facilities except one CHC and 6/17
DH. BP monitors for the unit was available in 56 percent facilities and was not found in one
CHC and 7/17 DH.
Spot lamp was noted in 61 percent facilities barring one CHC and 6/17 DH. Multichannel
monitor with noninvasive was there in 72 percent facilities except one CHC and 4/17 DH.
Equipment: As indicated by data, servo-controlled radiant warmer, Neonatal stethoscope,
Neonatal Resuscitation Kit (Oxygen reservoir, masks, Neonatal laryngoscope), suction
machine, non-stretchable measuring tape, infusion pump or syringe pump, pulse oxymeter,
double sided blue light, phototherapy and window AC/Slit ac was available in 90 percent
facilities with its non-availability in one CHC and one DH.
Low reading digital thermometer (Centigrade scale) was available in 83 percent facilities with
exception of one CHC and 2/17 DH. Double outlet oxygen concentrator was marked in 83
percent facilities with exception of one CHC and two DH.
Flux meter was available only in half facilities and CHC and 8/17 DH did not had this. CFL
phototherapy was available in 61 percent facilities with CHC and 6/17 DH not having this.
Horizontal laminar flow and central AC was observed to be there in only 22 percent facilities
while in CHC and 13/17 DH did not have this.
Supplies: Supplies in form of Cord Clamp, Micro drip set with or without burette, suction
catheters, endotracheal tubes, feeding tubes and chemical disinfectants were available in 90
percent facilities except the CHC and one DH.
Normal saline, 10% Dextrose infusion bottle for individual care were available in case of 83
percent facilities except one CHC and two DH.
Supplies like Dee Lee’s Mucus Trap, Glucostix and multi stix strips in container and Neoflon
(Intravenous catheter) were available in 83 percent facilities except the CHC and two DH.
Blood transfusion set was available in 72 percent facilities and the CHC and 4/17 DH did not
had this. Capillary tubes for microhaematocrit in containers were observed in 44 percent of
facilities while CHC and 9/17 DH did not had this.
Emergency Drugs: As inferred from data, out of the 12 emergency drugs observed in SNCU
at CHC and DH, three drugs – 5%, 10% and 25% Dextrose, Normal Saline and

Quality Initiatives in health facilities in Madhya Pradesh 56
Ampicillineinjection were found in 90 percent facilities. The problem of non-availability was
faced at CHC and one DH.
Similarly emergency drugs like Aminophylline, Hydrocortisone and Cefotaxime injection were
available in 83 percent facilities and the shortage was noticed more at CHC and two DH.
Gentamycin injection was available in 77 percent facilities with exception of CHC and 3 DH.
Ampicillin with Cloxacillin injection and Sodium Bicarbonate injection was available in case
of 78 percent facilities with exception of CHC and 3/17 DH.
Phenobarbitone injection were available in 72 percent facilities as compared to CHC and 4/17
DH were it was not available. Sixty seven percent facilities had adrenaline (1:10000) injections
and were not available in CHC and 5/17 DH. Nalaxone injections were available only in 44
percent facilities and were not available in CHC and 9/17 DH.
Equipment for Disinfection of Sick Newborn Care Unit: Majority of the facilities had
Autoclave drums of small, medium and large sizes (90 percent) followed by electric heater(79
percent), vertical autoclave (79 percent) and Formalin Vaporizer (79 percent) as equipment
for disinfection of sick newborn care unit. The gaps were observed at CHC and DH (1-3). Sixty
seven percent facilities had container for liquid disinfectants, electronic fumigators and
disinfectant sprayer while 72 percent had washing machine with separate dryer. Vacuum
cleaner was available in 61 percent facilities. Also Ethylene Oxide (ETO) sterilizer was
available in 39 percent facilities while it was not available in CHC and 10/17 DHs. Facility for
hot air oven was least available (22 percent facilities).
Type of services provided by facilities for New Born Care
The data indicates that all the facilities across L1, L2 and L3 levels except one PHC at L2
provided services in form of new born care and care of the sick newborn referral after
stabilization as part of basic functions of facility related to new born care. The type of new born
care in form of immediate care like drying, warming, skin to skin contact and initiation of
breast feeding was done by all the facilities across all the levels. Antibiotics for preterm or
PROM for prevention of sepsis of newborns was undertaken by 51 percent facilities except at
a SHC, 20/24 PHC and 8/16 CHC.
11 11 11 11 11611 17
6 11
56
78 7283 78
28
0
20
40
60
80
100
Furniture and
general equipment
Equipment and
supplies for
individual patient
care
Supplies Emergency drugs Equipment for
disinfection of
SNCU
Fig. 4.2: CI of Sick Newborn Care Unit (in %)
very good good poor very poor

Quality Initiatives in health facilities in Madhya Pradesh 57
The various services included in new born care were neonatal resuscitation, providing warmth,
initiation of breastfeeding within an hour of birth and exclusive breastfeeding, screening for
congenital anomalies, weighing of newborns, administering antenatal corticosteroids to the
mother in case of pre-term babies, Respiratory Distress Syndrome (RDS), immediate care of
LBW newborns and Sick Newborn Care Unit (SNCU).
Medical officer
As observed from the table 4.2, 91 doctors out of 106 interviewed had mentioned that they
provided new born care services.
Neonatal resuscitation and warmth as a service provided was each mentioned by 56 percent of
doctors while 43 percent mentioned this on probing. Only one doctor at L2 level did not
mention this to be a service provided.
Advice on/Counseling on initiation of breastfeeding within an hour of birth and exclusive
breastfeeding was not mentioned as a service provided by two doctors at L2 and one doctor at
L3, while 52 percent doctors mentioned this on probing as a service provided, 58 percent were
from L2 and 45 percent were from L3.
Screening for congenital anomalies was not mentioned as a service provided by 28 percent of
doctors. Level wise this was 32 percent from L2 and 22 percent of doctors were from L3. On
probing, 45 percent of doctors mentioned this as a service provided them.
Weighing of newborns was not mentioned as a service provided by 8 percent of doctors (one
doctor was from L1, three were from L2 and four were from L3 levels). Overall, 47 percent
doctors mentioned on probing that they do provide this service to new born.
Antenatal Corticosteroids to the mother in case of pre-term babies as a service was mentioned
on probing by 51 percent of doctors, while 31 percent of doctors did not acknowledge this.
Respiratory Distress Syndrome (RDS) was not acknowledged as a service provided on probing
by 40 percent of doctors. On probing, 43 percent of doctors had mentioned that they provide
this service. By type of facility, it may be mentioned that 7 doctors out of 18 at PHC, 13 doctors
out of 26 at CHC and 35 doctors out of 47 at DH provided this service, indicating that the
service was spread across the facilities.
Immediate care of LBW newborns was not stated by 31 percent of doctors as a service that
they provided. Whereas, 47 percent doctors accepted this as a service they provided on probing.
Facility wise, 9 doctors out of 18 at PHC, 17 doctors out of 26 at CHC and 37 doctors out of
47 were involved in providing this service.
Sick Newborn Care Unit (SNCU) is generally found to be at L3 levels. A little less than half
(48 percent) of the doctors reported that they were not involved in providing this service.

Quality Initiatives in health facilities in Madhya Pradesh 58
Table 4.2: Type of services provided for new born care by Medical Officers (in
percentages)
Particulars Spontaneously
mentioned
Mentioned
on
probing
Did not
mentioned
No. of medical officers who provided new
born care services
91
Services provided
Neonatal resuscitation 56.0 42.9 1.1
Warmth 56.0 42.9 1.1
Initiation of breastfeeding within an hour of
birth and exclusive breastfeeding
45.1 51.6 3.3
Screening for congenital anomalies 27.5 45.1 27.5
Weighing of newborns 44.0 47.3 8.8
Antenatal Corticosteroids to the mother in
case of pre-term babies
18.7 50.5 30.8
Respiratory Distress Syndrome (RDS) 17.6 42.9 39.6
Immediate care of LBW newborns 22.0 47.3 30.8
Sick Newborn Care Unit (SNCU) 17.6 34.1 48.4
Nurses
Among the total 156 nurses interviewed, data indicates that 85 percent nurses mentioned that
they provide new born care services. Level wise this was, 96 percent nurses at L1, 93 percent
at L2 and 76 percent at L3 mentioned that they provide services for new born care. Facility
wise, 100 percent at SHC, 94 percent at PHC, 91 percent at CHC and 74 percent nurses at DH
mention that they provide new born care.
Thus the findings suggest that services under newborn corner that needs to be ensured at all
levels were still lacking in some of the L1 and L2 level facilities. Radiant warmer and
resuscitator in NSU need to be ensured in all. At L3 level the status of SNCU was largely in
position.

Quality Initiatives in health facilities in Madhya Pradesh 59
Chapter 5 Clinical Laboratory
This chapter attempts to understand the status of the laboratory available in health facility in
terms of logistics and type of tests conducted. Further it also presents the findings obtained
from the laboratory technicians in terms of their background characteristic and their capacity.
It may be mentioned that data regarding the logistics and test conducted are available from all
the three levels of facility, however information from the laboratory technician emerges from
L2 and L3 level facilities only.
Logistics at Laboratory
Haemoglobinometer (Sahilis Kits) with reagents
and lancet were available in 72 percent at L2
level. Similarly, strips for testing urine albumin
and sugar were available in 84 percent at L2 and
were not available in PHC at L1 level. In case
testing strips were not available, specimen
collection bottle and RDK for malaria testing
were available in 72 percent facilities at L2 and
14 percent at L1. All the facilities at L3 level had
all the three specified things.
Logistics in form of test tubes, holders, test tube
stand, match box, spirit, lamp, lab register and a
lab having marble/stone top platform and wash basin with running were available in all the
facilities at L3 level. Semi auto analyzer was available in 83 percent facilities at L3. L2 had
test tubes and match box (84percent), holders (69 percent), test tube stand (78 percent), spirit
(91 percent), lamp (78 percent), lab register (72 percent), lab having marble/stone top platform
and wash basin with running water (63 percent) and Semi auto analyzer (47 percent). At L1
level, one PHC had spirit and lamp in terms of logistics.
Lab was found to be operational during OPD hours in 72 percent facilities at L2 and all the
facilities at L3 while emergency lab facility available after routine working hours was found to
be there in case of 53 percent at L2 and all at L3.
Type of Tests Conducted
At L1 level, hemoglobin and urine test for
pregnancy were conducted by all the SHC
facilities while urine test for albumin and sugar
and RDK for malaria test was found to be
conducted by 92 percent SHCs. At PHC level,
only 29 percent facilities (2/7) were found to be
conducting these tests.
At L2, 90-94 percent facilities were found to
have conducted tests like HB, Urine for albumin
and sugar and Urine for pregnancy test. RDK for
malaria was conducted by 88 percent, 72 percent
conducted bleeding time clotting time and P/S
71
9
29
19
25
47
100
0
20
40
60
80
100
L1 L2 L3
Fig. 5.2: CI of Test Conducted at
Laboratory
very good good poor very poor
100
13
13
28
47
100
0
20
40
60
80
100
L1 L2 L3
Fig. 5.1: CI of Logistics at
Laboratory
very good good poor very poor

Quality Initiatives in health facilities in Madhya Pradesh 60
for MP. 63-66 percent facilities conducted blood grouping, sputum for TB, HIV screening and
blood grouping and RH typing, wet mount, RPR/VDRL, serum bilirubin for sick newborns.
44-47 percent facilities had conducted CBC, Semen Analysis, Routine and microscopic
examination of stool and Hepatitis B/ Australian Antigen tests.
At l3 level, Hb, tests such as Urine test for pregnancy test, blood grouping, bleeding time,
clotting time, sputum for TB, P/S for MP, HIV screening and blood grouping and RH typing,
wet mount, RPR/VDRL, Serum bilirubin for sick newborns were conducted by all the facilities.
Around 89-94 percent facilities had conducted tests like Urine for albumin and sugar, RDK for
malaria, CBC, Semen analysis, routine and microscopic examination of stool and hepatitis
B/Australian Antigen.
Characteristics of Laboratory Technician
Among total 54 laboratory technicians interviewed, 20 were from L2 level while 34 were from
L3 level. It was observed that at some facilities LTs were roped in from nearby facility on two
to three days per week to cope up with the requirement.
Table 5.1: Background characteristics of Lab Technician
Particulars Level 2 Level 3 Total
No. of Lab Technician 20* 34 54
Gender
Male 95.0 (19) 91.2 92.6
Female 5.0 (1) 8.8 7.4
Qualification
11-12 35.0 (7) 35.3 35.2
B.Sc. 55.0 (11) 38.2 44.4
B.A. 0.0 5.9 3.7
B.Com. 5.0 (1) 0.0 1.9
Others 5.0 (1) 20.6 14.8
Received training for laboratory technician
Certificate course in laboratory 25.0 (5) 29.4 27.8
DMLT 40.0 (8) 41.2 40.7
Others 30.0 (6) 23.5 25.9
No training 5.0 (1) 5.9 5.6
Average no. of years working as laboratory technician 12.3 (12)* 17.7 (11)* 15.7 (12)*
Average no. of years posted in this facility 10.2 (11)* 13.9 (10)* 12.5 (10)*
Average working time (in hours) (0.6)* (2.7)* (2.3)*
Job responsibilities
Manage cleanliness and safety 95.0 (19) 97.1 96.3
Handle properly and ensure maintenance of microscope 95.0 (19) 94.1 94.4
Sterilize equipment as required 95.0 (19) 91.2 92.6
Dispose of specimens and infected material in a safe
manner 95.0 (19) 88.2 90.7
Maintain necessary records and submit it 95.0 (19) 88.2 90.7
Prepare monthly reports regarding work 95.0 (19) 91.2 92.6
Indent for supplies for the lab and ensure safety storage
of material received 85.0 (17) 82.4 83.3
Others 0.0 (0) 5.9 3.7
Lab not fully functional 5.0 (1) 0.0 1.9
Figures in () parenthesis are Figures in ()* parenthesis are SD

Quality Initiatives in health facilities in Madhya Pradesh 61
The data indicates that 93 percent of LTs were male. Qualification wise most of them were
graduates though coming from different discipline. A little over two-fifth were from science
stream, arts and commerce constituted four and two percent respectively. A little over one –
third (35 percent) of the lab technician had passed only 11-12th class. However, to carry out
their functions effectively, basic training for a laboratory technician which is a prerequisite was
taken by over two-third of them. This included DMLT (41 percent), certificate course in
laboratory (28 percent) and other pathological training, BMLT, CMLT, etc. (26 percent).
The average number of years laboratory technician were working was 16 years. Those working
in L3 level were working for more years (18 years) as compared to L2 level (12 years). They
have been posted in the present facility for around 13 years.
Though the job responsibilities are more or less same across facilities, due to the nature of
services provided and case load it could vary across facilities. As seen from table over nine out
of ten LTs did acknowledge that they were involved in managing cleanliness and safety,
handling the microscope properly and ensuring its maintenance, sterilize equipment as
required, dispose of specimen and infected material as well as prepare monthly reports,
maintain necessary records and submit them. While 83 percent mentioned that they make
indents for supplies for the lab and ensure safe storage of material that is received. In other
words almost all the laboratory technicians were involved in doing the regular laboratory work
at both L2 and L3 levels.
Table 5.2: Training status of Lab Technician
Background characteristics Level 2 Level 3 Total
No. of Lab Technician 20 34 54
% received on the job training 85.0 76.5 79.6
No. received on the job training 17 26 43
Issues on which receive the training Malaria 23.5 (4) 46.2 37.2 TB 17.6 (3) 15.4 16.3 HIV 35.3 (6) 11.5 20.9 Filarial 11.8 (2) - 4.7 Culture - 3.8 2.3 Leprosy - 11.5 7.0 Dealing with patients - 3.8 2.3 Laboratory management - 15.4 9.3 Other 35.4 (4) 76.8 60.6
Laboratory technicians need to have an update on their knowledge with information as and
when required. Findings indicate that 80 percent of LTs had received on the job training. At
L2, this was 85 percent as compared to 77 percent at L3. Variation was observed in the nature
of training received by LT at L2 and L3. Training on issues like malaria, TB and HIV was
received by LTs at both levels by around 37 percent, 16 percent and 21 percent respectively.
Training on filarial was received at only L2 (12 percent) level, whereas training on culture (4
percent), leprosy (12 percent) and soft information on how to deal with patients and laboratory
management was received by 4 and 15 percent LTs at L3 level.

Quality Initiatives in health facilities in Madhya Pradesh 62
Services provided by Laboratory Technician
Laboratory technician do concede that adequate
equipment and chemicals were available in the facility.
This was 95 percent at L2 level and 88 percent at L3
level. However, variation existed in the type of tests
that were reported by LTs of L2 and L3 level. Overall
the extent of tests conducted at L3 level was more than
those reported by L2 level LTs. All the routine
examination that were usually conducted for urine,
stool, blood, sputum and semen were conducted by 79
to 94 percent of LTs of L3 level. At L2 level, lesser
percentage of LTs were involved in conducting the test except for urine –glucose and blood
hemoglobin which was mentioned by 90 percent LTs.
Other examination conducted at L2 level ranged widely. For instance 60 percent LTs conducted
ketone bodies examination in urine, while 80 percent did conduct urine microscopic
examination. Stool examination was done to a lesser degree in L2 level (gross examination 30
percent and microscopic examination 50 percent). Sputum and semen examination was done
to lesser extent at L2 level as compared to L3 level. A little over half of the LTs at L3 level
were done throat swap test.
Table 5.3: Type of pathological tests conducted
Background characteristics Level 2 Level 3 Total
No. of Lab Technician 20 34 54
Examination of Urine Urine - Specific gravity and PH 65.0 (13) 91.2 81.5 Urine – Glucose 90.0 (18) 94.1 92.6 Urine - Protein (albumin) 75.0 (15) 91.2 85.2 Urine - Bile pigments and bile salts 70.0 (14) 88.2 81.5 Urine - Ketone bodies 60.0 (12) 91.2 79.6 Urine - Microscopic examinations 80.0 (16) 91.2 87.0
Examination of Stools Stools - Gross examinations 30.0 (6) 79.4 61.1 Stools - Microscopic examinations 50.0 (10) 88.2 74.1
Examination of Blood Blood - Collection of blood specimen by finger prick technique
70.0 (14) 88.2 81.5
Blood - Hemoglobin estimation 90.0 (18) 94.1 92.6 Blood - RBC count 70.0 (14) 88.2 81.5 Blood - WBC count 70.0 (14) 88.2 81.5 Blood - Preparation, staining and examination of thick and thin blood smears for parasites/microfilaria
70.0 (14) 85.3 79.6
Blood - Erythrocyte Sedimentation Rate 60.0 (12) 85.3 75.9 Blood – VDRL 80.0 (16) 94.1 88.9 Blood - Blood grouping and RH typing 75.0 (15) 91.2 85.2 Blood - Rapid HIV and STI Screening test 85.0 (17) 91.2 88.9
Other examination Examination of sputum 70.0 (14) 82.4 77.8 Examination of semen 60.0 (12) 88.2 77.8 Prepare throat swabs 0.0 (0) 58.8 37.0 Others 10.0 (2) 11.8 11.1
9588
0
20
40
60
80
100
Level 2 Level 3
Fig 5.3: Adequate equipment and chemical available

Quality Initiatives in health facilities in Madhya Pradesh 63
Depending on the level of facility, different types of services are provided to the clients. For
providing these services, the lab had to be equipped with the necessary instruments and
chemicals necessary to conduct the tests. It is essential to provide the laboratories in
government hospitals with the equipment and chemicals necessary to conduct medical
investigations to ensure early diagnosis.
As the data indicates, most of the tests are conducted at both the levels except the throat swabs
being prepared at only L3 level. 93 percent of LTs mentioned that they conduct Urine Glucose
and Blood Hemoglobin estimations.
Out of the six types of urine test conducted, most of the test are performed by all as indicated
by the data. The average being mentioned by at least 88 to 94 percent of the respondents at L3
and 60 to 90 percent at L2. Urine Ketone Bodies test is conducted by 12 out of 19 LTs at L2
while Urine Bile pigments test and bile salts is conducted by 88 percent of respondents at L3
level.
Stools gross examination test is conducted by 79 percent LTs at L3 while at L1, six out of 20
LTs conduct this test. Stools microscopic examination test is conducted by 88 percent LTs at
L3 while at L2, it is conducted by 10 out of 20 LTs.
The nine blood test specified and indicated by data are conducted mostly by all with overall all
total responses ranging from 75 to 93 percent. At L3, more than 85 percent LTs report
conducting all the test while at L2, Blood ESR which is reported to be conducted by 12 out of
20 respondents, rest all averages to be conducted by 70-75 percent of LTs.
Examination of sputum is reported to be conducted by 82 percent of LTs at L3 whereas at L2,
14 out of 20 LTs conduct this test. Similarly, Examination of semen is conducted by 88 percent
LTs at L3 while 12 out of 20 conduct this test at L2.
Preparation of throat swab is performed at L3 level only and 59 percent of LTs conduct this
test as indicated by data.
Table 5.4: Observations
Background characteristics Level 2 Level 3 Total
No. of Lab Technician 20 34 54
Laboratory is neat and clean Good 80.0 (16) 76.5 77.8 Average 15.0 (3) 20.6 18.5 Poor 5.0 (1) 2.9 3.7
% Lab technician has personal protective equipment (apron, gloves, mask)
90.0 (18) 82.4 85.2
% appropriate disposal of waste materials (in colored bags)
80.0 (16) 88.2 85.2
Interaction with client Good 85.0 (17) 82.4 83.3 Average 10.0 (2) 17.6 14.8 Poor 5.0 (1) 0.0 1.9
% washed hands with soap 90.0 (18) 94.1 92.6
% wear disposable gloves while handling blood and body fluids
85.0 (17) 79.4 81.5
Wear gowns and eyewear in chance of splashing of fluid
75.0 (15) 76.5 75.9

Quality Initiatives in health facilities in Madhya Pradesh 64
On the day of interview with lab technicians, observations were noted by interviewers during
the interview. These were regarding cleanliness of laboratory, PPE used by lab technicians,
appropriate disposal of waste management, hand washing practices and their interaction with
clients.
Regarding cleanliness of lab, it was observed in 79 percent cases that it was good while in 19
percent of cases, it was observed to be average.
Personal Protection Equipment protects the service providers from infections and injuries.
During the visits, it was observed that 85 percent Lab technicians had personal protective
equipment like apron, gloves and masks. The variation being at L2 where this was observed in
18/20 cases.
For infection control, disposal of waste at the point of origin plays an important part. Especially
in places like laboratory, where there are specimens of blood, urine and stools. Appropriate
disposal of waste material in colored bags was observed in 85 percent of lab technicians with
variation being at L2 where it was observed in 16/20 cases.
Cliental satisfaction is the crux of health services. On the day of the visit to the laboratory, in
83 percent of the cases, the interaction of the lab technician with the client was found to be
good while it was found to be poor in case of one LT at L2 level. Rest all were average.
Hand washing practice is a protocol to be followed by every health care provider for infection
prevention. It was observed that in 93 percent of Lab technicians followed this protocol while
rendering the services.
Similarly it was observed that 82 percent LTs wore disposable gloves while handling blood
and body fluids as infection prevention measure while disposing liquid waste, it was observed
that 76 percent of Lab technicians wear gowns and eyewear in chance of splashing of fluid.
Table 5.5: Status of Clinical Laboratory by level of facility
Level 1 Level 2 Level 3
Total number of facilities 7 32 18
N % N % N %
Laboratory total
Very poor (<=25 %) 7 100.0 5 15.6 0 0.0
Poor (25.1-50 %) 0 0.0 3 9.4 0 0.0
Good (50.1-75 %) 0 0.0 8 25.0 0 0.0
Very good (>75 %) 0 0.0 16 50.0 18 100.0
As indicated by table 5.5, composite index for status of laboratory based on the logistics and
test conducted, it was found that all the facilities at L3, followed by 50 percent facilities at
L2 were found to be very good. While all the PHCs at L1 came in ‘very poor’ category.
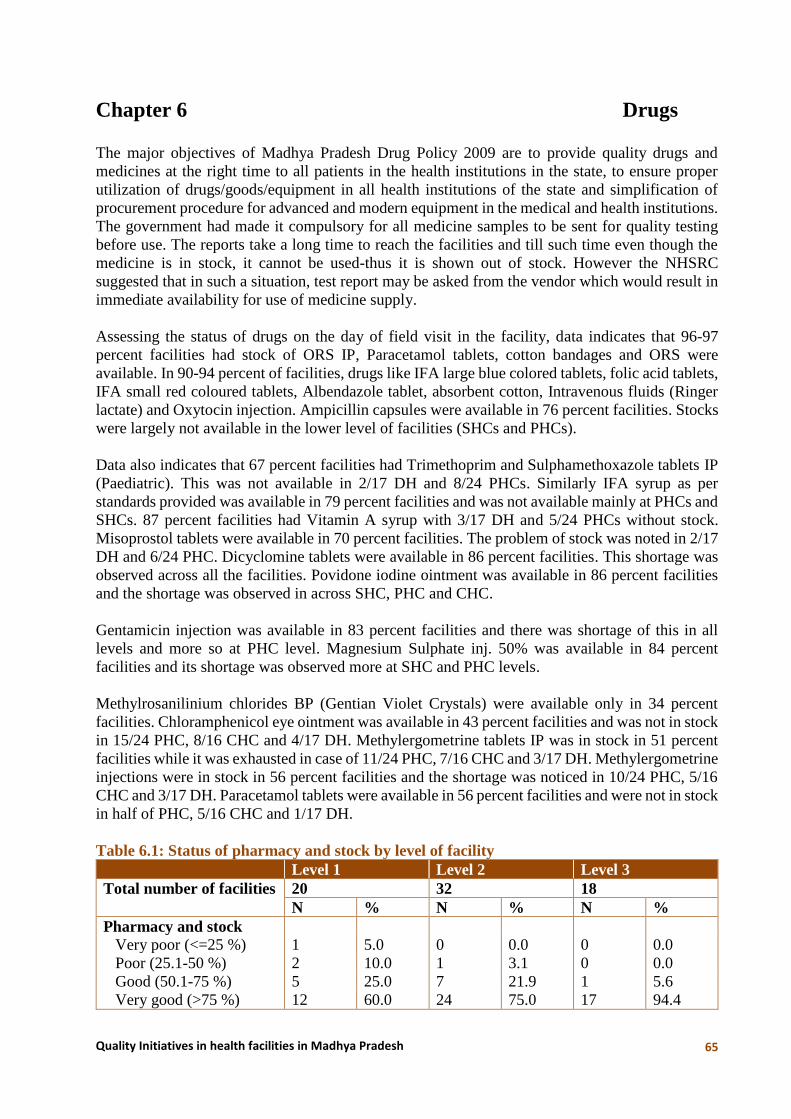
Quality Initiatives in health facilities in Madhya Pradesh 65
Chapter 6 Drugs
The major objectives of Madhya Pradesh Drug Policy 2009 are to provide quality drugs and
medicines at the right time to all patients in the health institutions in the state, to ensure proper
utilization of drugs/goods/equipment in all health institutions of the state and simplification of
procurement procedure for advanced and modern equipment in the medical and health institutions.
The government had made it compulsory for all medicine samples to be sent for quality testing
before use. The reports take a long time to reach the facilities and till such time even though the
medicine is in stock, it cannot be used-thus it is shown out of stock. However the NHSRC
suggested that in such a situation, test report may be asked from the vendor which would result in
immediate availability for use of medicine supply.
Assessing the status of drugs on the day of field visit in the facility, data indicates that 96-97
percent facilities had stock of ORS IP, Paracetamol tablets, cotton bandages and ORS were
available. In 90-94 percent of facilities, drugs like IFA large blue colored tablets, folic acid tablets,
IFA small red coloured tablets, Albendazole tablet, absorbent cotton, Intravenous fluids (Ringer
lactate) and Oxytocin injection. Ampicillin capsules were available in 76 percent facilities. Stocks
were largely not available in the lower level of facilities (SHCs and PHCs).
Data also indicates that 67 percent facilities had Trimethoprim and Sulphamethoxazole tablets IP
(Paediatric). This was not available in 2/17 DH and 8/24 PHCs. Similarly IFA syrup as per
standards provided was available in 79 percent facilities and was not available mainly at PHCs and
SHCs. 87 percent facilities had Vitamin A syrup with 3/17 DH and 5/24 PHCs without stock.
Misoprostol tablets were available in 70 percent facilities. The problem of stock was noted in 2/17
DH and 6/24 PHC. Dicyclomine tablets were available in 86 percent facilities. This shortage was
observed across all the facilities. Povidone iodine ointment was available in 86 percent facilities
and the shortage was observed in across SHC, PHC and CHC.
Gentamicin injection was available in 83 percent facilities and there was shortage of this in all
levels and more so at PHC level. Magnesium Sulphate inj. 50% was available in 84 percent
facilities and its shortage was observed more at SHC and PHC levels.
Methylrosanilinium chlorides BP (Gentian Violet Crystals) were available only in 34 percent
facilities. Chloramphenicol eye ointment was available in 43 percent facilities and was not in stock
in 15/24 PHC, 8/16 CHC and 4/17 DH. Methylergometrine tablets IP was in stock in 51 percent
facilities while it was exhausted in case of 11/24 PHC, 7/16 CHC and 3/17 DH. Methylergometrine
injections were in stock in 56 percent facilities and the shortage was noticed in 10/24 PHC, 5/16
CHC and 3/17 DH. Paracetamol tablets were available in 56 percent facilities and were not in stock
in half of PHC, 5/16 CHC and 1/17 DH.
Table 6.1: Status of pharmacy and stock by level of facility
Level 1 Level 2 Level 3
Total number of facilities 20 32 18
N % N % N %
Pharmacy and stock
Very poor (<=25 %) 1 5.0 0 0.0 0 0.0
Poor (25.1-50 %) 2 10.0 1 3.1 0 0.0
Good (50.1-75 %) 5 25.0 7 21.9 1 5.6
Very good (>75 %) 12 60.0 24 75.0 17 94.4

Quality Initiatives in health facilities in Madhya Pradesh 66
Analyzing the drugs available in facility through the composite index (table 6.1) indicates that
largely they were available at L3 level followed by L2 and L1.
Essential Drug List (EDL)
Essential medicines, as defined by the World Health Organization (WHO) are "those drugs that
satisfy the health care needs of the majority of the population; they should therefore be available
at all times in adequate amounts and in appropriate dosage forms, at a price the community can
afford."
Among the total EDL drugs that the facility should have, it was observed that at L1 level, 30
percent facilities had this while none of the PHCs in L1 had the total EDL. At L2, 41 percent
facilities had the specified EDL while it was not available in 8/17 PHC and 11/15 CHC. At L3, 39
percent facilities had the EDL drugs and it was observed that the CHC and 11/17 DH did not had
the drugs as per EDL. At L1, the average number of drugs not available ranged from one to 27 at
SHC and 2-6 at PHC level. At L2, this was observed to be 4-13 at PHC except one PHC where 60
drugs were not available while at CHC, this was 1-22 except one CHC where 62 drugs were not
available. At SHC, PHC , CHC and DH level the shortage was noted for an average of one to 15
days with exception of two PHC and one DH were specified drugs was not available for past one
year. For the drugs that were not in stock, it was observed that the requisition for the same was
made in 57 percent facilities and the date of requisition ranged from one month back to one year
back. As specified earlier, in some facilities it was observed that the requisition was made one year
back. Generally, when there is no stock, most of the facilities handle the situation by either
prescribing the drug (13 percent), giving alternative medicine (14 percent), asking for the same
from the CMHO office (9 percent), get it from district (6 percent) etc. This type of variation is
observed across all levels of facilities.
When drugs expire, more than 1/3rd (33 percent) manage this by sending it back to higher facilities.
Some dissolve it in water and dispose it (14 percent), use it up before expiry (16 percent) while
some burn it, burry them in pits or dispose it off in the BMW van.
Observations for the Drugs being dispensed from Pharmacy
In all the 70 facilities covered under the study, random samples of drugs were taken and their
expiry dates were observed. The drugs so observed were at two points i.e. when they were being
dispensed over the counter and also randomly from shelf. Drugs were observed for their expiry
dates when being dispensed over the counter. A total of five drugs were observed in each facility.
It was observed that in case of 27 percent facilities, at least one of the drugs observed was expired.
This included 7/13 SHC, 7/24 PHC, 1/16 SHC and 4/13 DH. Also in case of one DH, it was
observed that three out of five drugs were expired. In 2/13 SHC, 1/24 PHC, 1/16 CHC and 1/17
DH, two out of five drugs were found to be expired. Similarly in case of 5/13 SHC, 6/24 PHC and
2/17 DH, one out of five drugs were expired.
Thus the findings indicates that availability of stock in the pharmacy was in place at higher level
facilities. Drugs according to EDL needs to be ensured across all level of facilities. Facilities
needs to safeguard that the drugs are dispensed within the expiry date.

Quality Initiatives in health facilities in Madhya Pradesh 67
Chapter 7 Infection Prevention and Bio-Medical
Waste Management
Bio Medical Waste Management is a Quality parameter and is mandatory. There are government
rules specifically for its management and non-adherence to which is a punishable act. Its improper
management can cause infections to the patients, attendants, hospital staff and visitors. The
hospital waste like body parts, organs, tissues, blood and body fluids along with soiled linen,
cotton, bandage and plaster casts from infected and contaminated areas are very essential to be
properly collected, segregated, stored, transported, treated and disposed of in safe manner to
prevent nosocomial or hospital acquired infection.
On 20th July 1998 Ministry of Environment and Forests (MoEF), Govt. of India, Framed a rule
known as ‘Bio- medical Waste (Management and Handling) Rules, now known as “Bio-Medical
Waste (Management & Handling) Rules 2011” under the Environment Protection Act, 1986. The
act provides uniform guidelines and code of practice for management and handling of biomedical
wastes generated from Hospitals, clinics and other institutions generating Biomedical Waste. It
categories the waste into eight categories and specifies how it is to be segregated into different
colour coded bags/bins, treatment and disposal. It incorporates the storage and disposal of
municipal solid waste (MSW) generated from the hospitals. The act specifies rules, roles and
responsibility of the authority, occupier, operator etc. It also has rules to be followed by the
CBWTF – Common Bio Waste Treatment Facility.
Infection control addresses factors related to the spread of infections within the healthcare setting
(whether patient-to-patient, from patients to staff and from staff to patients, or among-staff),
including prevention (via hand hygiene/hand washing, cleaning/disinfection/ sterilization,
vaccination, surveillance), monitoring/investigation of demonstrated or suspected spread of
infection within a particular health-care setting (surveillance and outbreak investigation), and
management (interruption of outbreaks).
Guidelines for infection control in hospitals under Health Services have been framed as part of a
quality assurance program being implemented by the Health Department in its hospitals. It has
instructed all hospitals to recognize nosocomial infections (infections acquired from hospitals) as
an important issue affecting patient safety and to put in place proper safeguards to prevent them.
Infection control within hospitals is the responsibility of all health care professionals, including
doctors, nurses, laboratory technicians, paramedical staff, engineers and other hospital employees.
Staff involved in providing services too need to protect themselves from infections and injuries.
Needle prick injury is very common in hospitals.
Infection Prevention
As seen from table 7.1, 97 percent of nurses mentioned that they wash hands as a measure of
infection prevention. This was mentioned by all nurses at L1 level. At L2, 96 percent of nurses
mentioned this, with all nurses at PHCs mentioning this and 93 percent at CHCs. At L3, this was
done by 98 percent covering all nurses at CHC and 97 percent at DH.
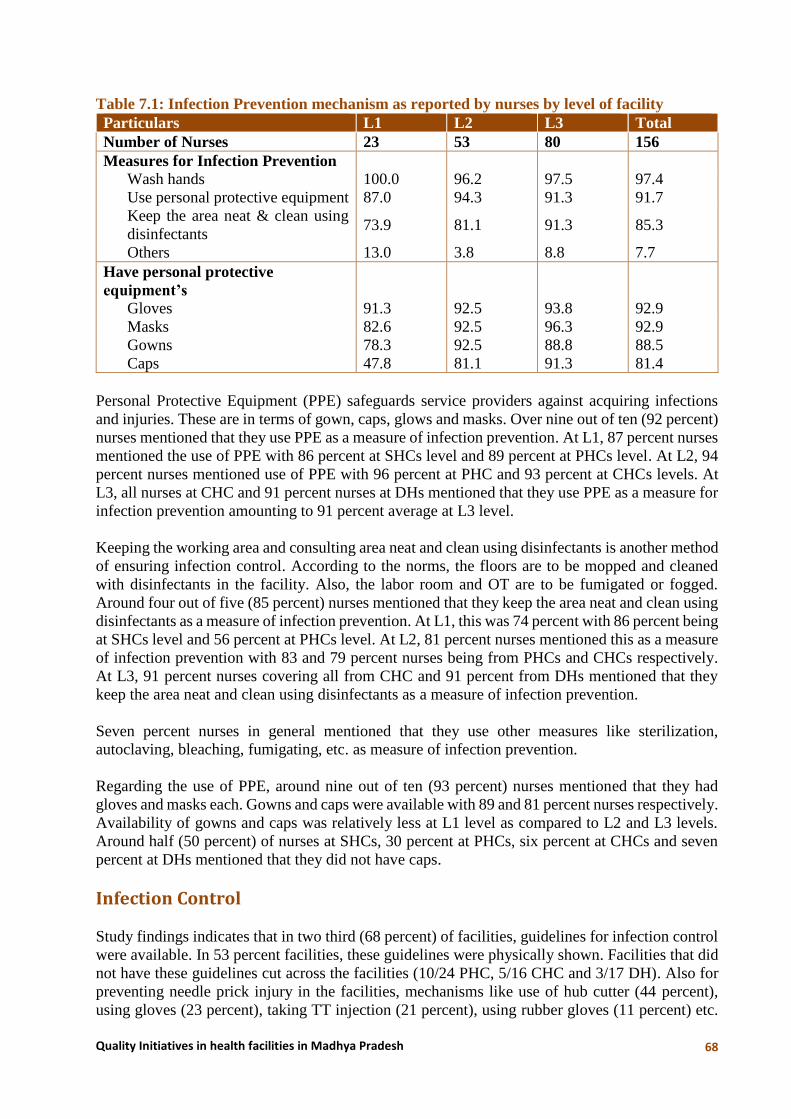
Quality Initiatives in health facilities in Madhya Pradesh 68
Table 7.1: Infection Prevention mechanism as reported by nurses by level of facility
Particulars L1 L2 L3 Total
Number of Nurses 23 53 80 156
Measures for Infection Prevention
Wash hands 100.0 96.2 97.5 97.4
Use personal protective equipment 87.0 94.3 91.3 91.7
Keep the area neat & clean using
disinfectants 73.9 81.1 91.3 85.3
Others 13.0 3.8 8.8 7.7
Have personal protective
equipment’s
Gloves 91.3 92.5 93.8 92.9
Masks 82.6 92.5 96.3 92.9
Gowns 78.3 92.5 88.8 88.5
Caps 47.8 81.1 91.3 81.4
Personal Protective Equipment (PPE) safeguards service providers against acquiring infections
and injuries. These are in terms of gown, caps, glows and masks. Over nine out of ten (92 percent)
nurses mentioned that they use PPE as a measure of infection prevention. At L1, 87 percent nurses
mentioned the use of PPE with 86 percent at SHCs level and 89 percent at PHCs level. At L2, 94
percent nurses mentioned use of PPE with 96 percent at PHC and 93 percent at CHCs levels. At
L3, all nurses at CHC and 91 percent nurses at DHs mentioned that they use PPE as a measure for
infection prevention amounting to 91 percent average at L3 level.
Keeping the working area and consulting area neat and clean using disinfectants is another method
of ensuring infection control. According to the norms, the floors are to be mopped and cleaned
with disinfectants in the facility. Also, the labor room and OT are to be fumigated or fogged.
Around four out of five (85 percent) nurses mentioned that they keep the area neat and clean using
disinfectants as a measure of infection prevention. At L1, this was 74 percent with 86 percent being
at SHCs level and 56 percent at PHCs level. At L2, 81 percent nurses mentioned this as a measure
of infection prevention with 83 and 79 percent nurses being from PHCs and CHCs respectively.
At L3, 91 percent nurses covering all from CHC and 91 percent from DHs mentioned that they
keep the area neat and clean using disinfectants as a measure of infection prevention.
Seven percent nurses in general mentioned that they use other measures like sterilization,
autoclaving, bleaching, fumigating, etc. as measure of infection prevention.
Regarding the use of PPE, around nine out of ten (93 percent) nurses mentioned that they had
gloves and masks each. Gowns and caps were available with 89 and 81 percent nurses respectively.
Availability of gowns and caps was relatively less at L1 level as compared to L2 and L3 levels.
Around half (50 percent) of nurses at SHCs, 30 percent at PHCs, six percent at CHCs and seven
percent at DHs mentioned that they did not have caps.
Infection Control
Study findings indicates that in two third (68 percent) of facilities, guidelines for infection control
were available. In 53 percent facilities, these guidelines were physically shown. Facilities that did
not have these guidelines cut across the facilities (10/24 PHC, 5/16 CHC and 3/17 DH). Also for
preventing needle prick injury in the facilities, mechanisms like use of hub cutter (44 percent),
using gloves (23 percent), taking TT injection (21 percent), using rubber gloves (11 percent) etc.

Quality Initiatives in health facilities in Madhya Pradesh 69
were reported. Apart from this, some facilities used the mechanisms of cutting and putting in sharp
pits, use of puncture proof boxes, burning and discarding, using PPE etc. Separate sleepers were
available for labor room /OT in case of 79 percent facilities. The problem of non-availability was
observed more at PHC (9/24) and CHC (2/16) levels. However, only 26 percent of facilities had
changing room for patients.
Fumigation
As per the new guidelines, fumigation in the labour room is prohibited and only carbonization is
acceptable for disinfectant purpose. Thus only the OTs are fumigated. For infection prevention
and control, from time to time, swab testing is done in concerned area of the facility and places
like OT/ are to be fumigated or fogged. Records of the same are kept by the concerned persons in
the facility.
Findings suggest OT / was fumigated in 94 percent facilities of L3 level. It was done in case of all
but one facility. This was mostly carried out with help of Formaldehyde mixed in water. Sparingly,
spray or chlorine was used. A variation was observed regarding frequency of this process being
carried out. Largely it was done on weekly basis (57 percent), 2-3 times in a week (17 percent),
Monthly/after delivery or operation/before delivery or operation (6 percent) etc. Generally class
IV employees were responsible for this. In addition staff nurse, OT nurse, sisters were also
responsible. In 28 percent facilities, no record of fumigation was maintained. It was maintained
and seen in 50 percent facilities, Swab testing was done 72 percent of DH facilities. A huge
variation was observed as regards to frequency of swab testing ranging from weekly-fortnightly-
monthly-quarterly-half yearly. In facilities where this was done in past, in 81 percent cases it was
found negative except for two DH...
Hygiene and Sanitation Observation
Hygiene and sanitation was observed in the facility especially in places like premises, general
building, waiting area, OPD, emergency room, general ward, ANC/PNC ward, labor room,
laboratory, pharmacy and toilets. Observations revealed that apart from the waiting area and toilets
which were found to be poor in around 11-19 percent of facilities, rest of the areas were largely
fair and a small percentage was good in terms of hygiene and sanitation. In 81-86 percent facilities,
Labour room and OPD were swapped with disinfectants while other nine percent were only
swapped. Similarly in 75-79 percent facilities, the waiting area and ANC/PNC wards were
swapped with disinfectants while other 7-16 percent was just swapped. In 68 percent facilities, the
general ward was found to be swapped with disinfectants while another 14 percent were just
swapped. In case of 60-65 percent facilities, it was observed that the premises, general building of
the facility, laboratory and pharmacy were swapped with disinfectants while in case of other 11-
18 percent these areas were swapped without disinfectants. In case of Emergency room in 51-56
percent facilities, these were swapped with disinfectants. In case of toilets in 23 percent facilities,
it was cleaned without disinfectants.
Bio-medical Waste Management
Medical Officer
Discussing on the issue of bio waste management with medical officers, 58 percent medical
officers mentioned that there were burial pits available in the facility. However, 18 percent doctors
at DH did not mention anything.

Quality Initiatives in health facilities in Madhya Pradesh 70
The general waste was disposed of with the municipal waste as mentioned by 31 percent doctors.
This was 34 percent at DH and 35 percent at CHC. The waste was disposed of in burial pits as
mentioned by 27 percent doctors. This was 53 percent in case of PHCs and 31 percent in CHCs
and 18 percent at DH. Other mechanism like disposing the waste outside hospital was also
observed.
Sharps were mostly disposed of with municipal waste as mentioned by 27 percent of doctors. This
was 34 percent doctors in case of DH. According to 24 percent doctors it was disposed of in burial
pits. Other mechanisms include disposing it off in van which comes for collection, in sharp pits
etc.
Bio waste was generally disposed of with municipal waste as mentioned by 39 percent at DH, 31
percent at CHCs and 16 percent doctors at PHC. Forty seven percent at PHCs and 50 percent at
CHCs mentioned that it was disposed of in burial pits. Other mechanisms observed were disposing
it off in collection van, burning, disposing it off in sharp pits etc. Over one fourth (26 percent) of
doctors at DH did not mention any mechanism for disposal of bio waste. Regarding separate burial
pits for sharps and bio medical waste, half of the doctors mentioned that they do not have this.
Only 58 percent doctors at PHC, 38 percent at CHC and 94 percent doctors at DH did acknowledge
the availability of separate burial pits for sharps and bio medical waste.
Nurse
A wide variation was observed in the practices followed for waste disposal across facilities as
mentioned by nurses. Used syringe were discarded in red/blue/yellow colored bins and bags as
mentioned by 63 percent nurses. Sixteen percent also mentioned use of hub cutter for disposal of
use syringes. Other disposal mechanisms included bleaching, using boxes for disposal, burying,
sending it to higher facilities etc.
Table 7.2: Bio Medical Waste Management
Background characteristics Level 2 Level 3 Total
No. of Lab Technician 20 34 54
Cleaning of the test tubes/ culture plates
Daily 25.0 (5) 35.3 31.5
When used 5.0 (1) 8.8 7.4
Lab not functioning 0.0 2.9 1.9
After disinfecting 5.0 (1) 2.9 3.7
Discharged then cleaned by attendant 5.0 (1) 0.0 1.9
Others 60.0 (12) 44.0 50.1
No response 0.0 5.9 3.7
% handled laboratory specimen as if they
are infectious 90.0 (18) 94.1 92.6
Process of blood/Urine and feces disposed of after testing
Van comes for disposal 35.0 (7) 23.5 27.8
No BMW management 0.0 5.9 3.7
Discharged in separate canals made specially for this 15.0 (3) 2.9 7.4
Others 40.0 (8) 52.8 48.4
Irrelevant/testing process 5.0 (1) 2.9 3.7
No response 5.0 11.8 9.3

Quality Initiatives in health facilities in Madhya Pradesh 71
The nurses mentioned that used needles were generally discarded in blue bag or bin (30 percent),
hub cutter (17 percent), buried (14 percent) and using other plastic bags (10 percent). This also
included mechanisms like burning, throwing in sharp pits, bleaching etc.
Placenta was largely discarded in yellow bag/bin as mentioned by 42 percent nurses, followed by
burial (10 percent), bleaching (9 percent) and other colored bags/bins (14 percent). Other
mechanism observed also included cutting and throwing it in sharp pits, giving it to relatives,
sending it back to higher level facility etc.
Bio medical waste management in places like laboratory is very crucial as its source of origin of
solid and liquid waste in form especially blood, urine and stools. Laboratory equipment also need
to be cleaned and sterilized for reuse. This includes instruments like test tubes, urine and stool
sample collection containers, culture plates etc.
As observed from the data, three percent LTs mentioned that lab was not functional on the day of
visit. Ninety three percent of Lab Technicians reported that they handled laboratory specimen as
if they were infectious indicating that they were aware of the possibility of infections taking place.
Less than one third (32 percent) of LTs cleaned the test tubes/culture plates daily. There was not
much variation observed regarding this across facilities. Other responses included cleaning when
used (seven percent), after disinfecting (four percent), disposed of and cleaned by attendant (two
percent) and others (fifty percent).
Disposal of waste is to be carried out in appropriate way following process as per protocol. With
respect to process of disposing off blood/urine and feces samples after testing, six percent LTs at
L3 mentioned that there was no BMW management, less than one third (28 percent) lab technicians
mentioned that a van comes for collection, seven percent mentioned that it was drained off in
separate canals made specially for this while four percent mentioned that it’s an irrelevant/testing
process.
Facility
During the various informal interactions held with health professionals during the course of study,
it was observed that there were different types of BMW practices across the districts and facilities.
In some facilities, they had authorization with Madhya Pradesh Pollution Control Board (MPPCB),
some had Common Bio Medical Waste Treatment Facility agreement and some had local level
solutions like use of sharp pits and deep burial pits for Bio Medical Waste Management. Apart
from this, the facilities also had practice of using hub cutter or puncture proof boxes for needle
disposal and used color coded bags and bins for disposal of medical waste. Practices like
disinfecting things before disposal, use of personal protective equipment and immunization of staff
for infections was also observed.
As inferred from the data half of the facilities had authorization with MPPCB. All the facilities at
L3 had an authorization with MPPCB. While at lower levels especially the rural areas like SHCs
and PHCs, this was found to be very low. It is observed that 41 percent of the facilities had
Common Bio Medical Waste Treatment Facility (CBWTF) agreement. This was again observed
more at DH (14/17) and CHC (8/8) while out of the remaining 59 percent of facilities, deep burial
pits and sharp pits were overall available only in case of 61 percent of facilities. Facility wise this
was available in 3/3 DH, 6/8CHC, 6/12 SHC and 10/18 PHCs. Hub cutter was available at
available at all the facilities with exception of two each of PHCs and SHCs. Puncture proof boxes
for needle disposal was not available at 64 percent of facilities. Mostly it was available at DH
(10/17) and CHC (8/8) while very few facilities at the lower level had it. Colored waste bins were

Quality Initiatives in health facilities in Madhya Pradesh 72
available in 84 percent of facilities. The problem of non-availability was more observed at the
SHCs level (6/13) and PHCs (3/24). Similarly color coded plastic bags were available and
functional in 51 percent of the facilities while in another 17 percent they were available but not
functional. The problem of non-availability persisted across the facilities (1/16 DH, 5/16 CHCs,
9/24 PHCs and 7/13 SHCs).
The practice of disinfecting plastic/sharp waste before disposal was overall followed by 77 percent
of the facilities and was not practiced at 5/13 SHCs, 7/24 PHCs and 3/16 DHs. PPE were available
in 77 percent facilities. This problem was more reflected at DH 3/14, 9/24 PHCs and 3/13 SHCs.
Regarding staff immunization as prevention of
infections, in 73 percent of facilities, it was not done.
This persisted across all levels of facilities.
Analyzing the above data through composite index
(Fig 7.1), data indicates that the status of facilities
varied from ‘very poor’ to ‘very good’ across the
levels. To some extent the status was relatively better
among the L3 level facilities followed by L2 and L1.
Findings thus suggest that process of BMW
management followed by lab technician, nurses and medical officers needs to be in concurrence
with the norms laid down for the facilities.
256 6
30
25
35
41
55
1028
39
0
20
40
60
80
100
L1 L2 L3
Fig. 7.1: CI of Bio-medical Waste
very good good poor very poor

Quality Initiatives in health facilities in Madhya Pradesh 73
Chapter 8 Utilization of Services and Level of
Satisfaction among Beneficiaries
Functionality of health facilities can be also assessed from beneficiaries who have availed the
services from these facilities. Exploring into the same, data was gathered from 496 indoor and 481
outdoor patients who sought services either for pregnancy, delivery and/or post-delivery. It may
be mentioned that the distribution of beneficiaries across the level of facilities has varied as it has
depended on their availability. Beneficiaries covered for the study were mainly from the L3 facility
as 375 IPD beneficiaries and 357 OPD beneficiaries had been interviewed. Lesser number of
beneficiaries are covered from L1 (22 IPD and 7 OPD) and L2 (99 IPD and 117 OPD) facilities.
Profile of Beneficiaries
The average age of beneficiaries was around 23-24 years suggesting that most of them were young
adults who were mostly married (table 8.1). Small number (5) of unmarried women was found in
L2 and L3 facilities. Most beneficiaries (78 percent OPD and 73 percent IPD) were literate, with
half of them studying upto class 10th. On an average they had studied upto class 6-7, with 7-8
percent beneficiaries studying over college. Work wise, 35 percent of IPD as compared to 29
percent of OPD beneficiaries were engaged in mostly agriculture and labor related work. Being
young beneficiaries, mean number of children IPD beneficiaries had was around two, while OPD
beneficiary had one child.
Table 8.1: Background characteristics of the beneficiaries (in percentages)
Particulars IPD OPD
No. of patient interviewed 496 481
Mean age (in years) 23.5 23.8
Marital status
Unmarried 0.4 1.0
Married 99.6 98.8
Widowed 0.0 0.2
Educational level
Illiterate 27.6 22.5
Literate 72.4 77.5
Upto 10 class 52.4 56.8
11-12 class 12.5 13.1
College and above 7.3 7.6
Mean class studied 6.7 7.3
% working 34.9 28.5
Type of work done 173 137
Agriculture 11.0 5.1
Agriculture Labor 52.0 51.1
Labor work 27.2 27.0
Other 9.8 16.8
Mean no. of children
Total 1.6 1.0
Sons 0.7 0.4
Daughters 0.9 0.6
% who belong to same town /village where the facility is located 27.0 47.4

Quality Initiatives in health facilities in Madhya Pradesh 74
To understand the distance travelled by beneficiaries to seek services from the facility, question
was asked regarding the place of residence. Data indicates that overall, 47 percent of the OPD
beneficiaries resided in the same village/town where the facility is located, while this is 27 percent
in case of IPD indicating that generally for indoor services beneficiaries do avail the services
although residing in another village /town. Both in L2 and L3, 77 and 74 percent beneficiaries
belonged to other villages /towns. In L1 facility this is 36 percent. In case of OPD beneficiaries,
percentage belonging to another village /town is 43 percent in L1, 66 percent in L2 and 49 percent
in L3 facility. Irrespective of the level of facility, both indoor and outdoor services of the facility
were used by beneficiaries who were residing in other villages /town too.
Mode of transportation used by beneficiaries to reach facility
Quick and rapid mode of travel is an important factor related to quality of services especially for
beneficiaries of indoor services. More than half (52 percent) of the beneficiaries had used the
services of Janani express / 108 ambulance to reach the facility. This phenomenon was more so in
L2 and L3 level of facility. On the other hand in L1 facility, 32 percent of IPD beneficiaries had
indicated that they came walking to the facility, against 19 percent who did use Janani Express/108
Ambulance services. Overall, other mode of travel used to reach the facility includes public
jeep/tempo (19 percent) and personal motor vehicle (14 percent). Janani express/ambulance which
were called to shift the beneficiary to the facility on an average took around half an hour to reach.
Average time taken to reach the facility varied depending on the level of facility, it took around 13
minutes to reach L1 facility, 27 minutes to reach L2 facility and 34 minutes to reach L3 level
facility.
Table 8.2: Mode of travel used by beneficiaries to reach facility (in percentages)
Particulars IPD OPD
Level 1 Level 2 Level 3 Total Level 1 Level 2 Level 3 Total
No. of patient
interviewed
22* 99 375 496 7* 117 357 481
Mode of travel
Janani Express/108
Ambulance 19.0 53.0 53.9 52.2 0.0 2.6 4.2 3.7
Public jeep/Tempo 14.3 17.0 19.2 18.5 0.0 19.7 33.1 29.3
Personal Motor vehicle 28.6 14.0 13.6 14.3 14.3 23.9 26.9 26.0
Walking 31.8 7.1 0.8 3.4 71.4 27.4 10.1 15.2
Bus 0.0 2.0 5.9 4.8 14.3 25.6 23.5 23.9
Ambulance from health
facility 0.0 3.0 5.3 4.6
Others (Animal cart,
Cycle etc.) 4.5 4.0 1.4 2.0
0.0 0.9 2.2 1.8
Average time taken by
vehicle to arrive after the
call was made (in minutes)
27.5 29.7 25.2 26.1
Average time taken to
reach the facility from
home (in minutes)
12.7 26.8 34.0 31.6
In case of OPD beneficiaries, overall 29 and 26 percent beneficiaries had used public jeep/ tempo
and personal motor vehicle respectively to reach the facility. Use of these modes of transportation

Quality Initiatives in health facilities in Madhya Pradesh 75
was 60 percent for L3 facility OPD beneficiaries and 44 percent in case of L2 facility beneficiaries.
Further, 24 percent had overall used bus facility to reach the facility, while 15 percent had walked
to the facility for the services.
Person accompanying beneficiary to facility
System has provided the provision that a woman availing delivery services from the facility should
have minimum problems in the facility. For this it encourages ASHA to accompany the woman to
the facility. Data indicates that 59 percent of IPDs beneficiaries were accompanied by ASHA. This
was 52 percent at L2 and 58 percent at L3 level (Figure 3.1).From the family, it was generally the
mother-in-law/mother (83 percent) who accompanies the IPD beneficiary in the facility followed
by husbands (65 percent) (table 8.3). Across the level of facilities, it was observed that as we go
from lower facility to the higher facility, this combination reverses with more of husbands
accompanying than the mother-in-law/mothers. The involvement of male member increases as the
facility level increases, which could be as they travel from another village to the facility.
In case of OPD beneficiaries 14 percent had come alone to the facility, especially 28 percent in L1
facility. However in this case too, 39 percent of OPD beneficiaries were accompanied by their
husbands to the facility followed by mother–in-law/mother (34 percent).
Table 8.3: Person who accompanies the beneficiary to the facility (in percentages)
Particulars IPD OPD
No. of patient interviewed 496 481
Person accompanied
Mother-in law/Mother 82.5 33.9
Husband 64.5 39.3
Sister-in law/Sister 29.4 14.8
Father-in law/Father 16.5 3.3
Brother 8.5 3.3
Others 6.5 4.8
No one accompanied - 14.1
% of patients accompanied by ASHA to facility
(GRAPH) 58.5 4.0
Services availed in Facility
The nature of services availed by the beneficiaries do differ for indoor and outdoor beneficiaries.
Services received by IPD beneficiaries
IPD beneficiaries had largely (88 percent) come for their delivery. The other beneficiaries included
pregnancy complications (5 percent), low birth weight of new born (2 percent), one percent each
of complication of newborn and post abortion complications. Three beneficiaries were admitted
on account of postpartum complications. IPD beneficiaries who experienced delivery had
experienced normal delivery in L2 and L1 facility (Figure 8.2). At L3 level 28 percent of
beneficiaries have had caesarian delivery.

Quality Initiatives in health facilities in Madhya Pradesh 76
Under the National Health Mission, Mamta kit consisting of essentials for the new born child is
given. As seen from table 8.4, variation exists among the beneficiaries in the number of items that
they had received. Over half of the beneficiaries had received baby clothes (57 percent) and baby
nappies (52 percent). Around 48 percent and 41 percent of the beneficiaries had been provided
with baby caps and towels respectively. Level wise, in L1 level the percentage is relatively higher
as compared to L2 and L3, however this must be read cautiously as the ‘N’ is less than 30 in this
case. At L2 level, 43 percent of beneficiaries had received all components of Mamata kit. At L3,
60 percent had received baby clothes, 53 percent had received baby nappies followed by 48 percent
who had received baby caps as components of Mamta kits.
Table 8.4: Percent of IPD beneficiary who received Mamta kit following delivery by level of
facility
Particulars Level 1 Level 2 Level 3 Total
No. of IPD beneficiary who
delivered
21* 91 346 458
Beneficiary received
Baby towel 61.9 42.9 38.7 40.6
Baby clothes 71.4 42.9 60.1 57.2
Baby nappies 71.4 42.9 52.6 51.5
Baby caps 71.4 42.9 48.0 48.0
Other 0.0 1.1 4.3 3.5
Exploring further regarding the immunization that the newborn child received in the facility,
around three fourth of the beneficiaries did acknowledge that the newborns had received BCG and
Polio drops as part of immunization in the facility. This varied across the level of facilities, as it
was found to be lower in case of L2 and L1 facility and was around two thirds.
Table 8.5: Percent of newborn baby in IPD who received immunization by level of facility
Particulars Level 1 Level 2 Level 3 Total
No. of patient delivered 21 91 346 458
Immunization received by new born
BCG 66.7 64.8 78.3 75.1
Polio drops 66.7 64.8 77.2 74.2
Mothers should initiate breastfeeding to the newborn preferably within an hour of delivery.
Understanding from the beneficiaries, whether nurse /ANM had informed them about the same,
over nine out of ten beneficiaries (92 percent) did acknowledge that they were told about the same.
These percentages were higher at 95 percent in L1 and L2 level facility as compared to L3 (91
percent) level facility. Ninety three percent of the beneficiaries had initiated breastfeeding to the
91
5258
0
20
40
60
80
100
Level 1 Level 2 Level 3
Fig 8.1: Percent IPD benefficiaries accompanied by ASHA to facility by level
of facility
100 10071
28
0
20
40
60
80
100
Level 1 Level 2 Level 3
Fig 8.2: Type of delivery experienced by IPD beneficiary
Normal Ceasarian

Quality Initiatives in health facilities in Madhya Pradesh 77
new born. Almost all (99 percent) beneficiaries of L2 level facility had initiated breastfeeding, in
L3 this was 91 percent.
Beneficiary responses regarding service providers’ availability and nature of services
received: Over nine out of ten beneficiary did mentioned that the doctor comes on round regularly
in their ward. However, percentage varied across the level of facilities with 96 percent in L3
facility, 81 and 73 percent each in L2 and L1 facility. On the day of the survey, only 74 percent of
the beneficiary mentioned that the doctor had come on visit. Around two third (67 percent) of the
beneficiaries said that the doctor did routine check-up during their visit, this was 59 percent at L2
level. Twenty nine percent beneficiaries reported that the doctor prescribed medicines, with
exception being 9 percent at L1 level. Advice given to them was mentioned by 30 percent (27, 36
and 28 percent in L1, L2 and L3 level facilities respectively). Only 10 percent of beneficiaries
reported that the doctor saw reports during the visit.
Eighty five percent of beneficiaries did mentioned that the nurse was always available in the ward.
In this case too, the responses varied across the level of facility (96, 79 and 86 percent in L1, L2
and L3 respectively). Services received from them mainly included ‘giving medicine’ (70 percent),
‘injection’ (71 percent), ‘measuring blood pressure’ (66 percent) etc.
Table 8.6: Service provider’s availability and nature of services received by IPD beneficiaries
by level of facility
Particulars Level 1 Level 2 Level 3 Total
No. of patient interviewed 22 99 375 496
% mentioned doctor came on round regularly to the
indoor ward 72.7 80.8 95.5 91.5
% mentioned doctor had come on round on the day
of survey 68.2 62.6 77.6 74.2
Type of services provided by doctor on the day of
survey
Did routine check-up 68.2 58.6 69.6 67.3
Gave advice 27.3 36.4 28.0 29.6
Prescribe medicine 9.1 28.3 30.4 29.0
Saw reports 13.6 9.1 9.6 9.7
Others 0.0 0.0 0.8 0.6
Nothing 0.0 0.0 0.3 0.2
% mentioned nurse available in the ward always 95.5 78.8 86.4 85.3
Type of services provided by nurse
Measure blood pressure 81.8 75.8 62.4 65.9
Measured temperature 68.2 62.2 41.6 47.0
Gave medicine 68.2 73.7 69.3 70.2
Injection 68.2 67.7 71.7 70.8
IV fluid 13.6 20.2 29.9 27.2
Nothing 0.0 1.0 2.1 1.8
Others 0.0 0.0 2.4 1.8
Services received by OPD beneficiaries
Majority (91 percent) of the OPD beneficiaries covered had availed ANC service from the facility
(table 8.7). Other services like post-natal care, family planning, abortion etc. ranged from one to
two percent only. A very small percentage (three) of beneficiaries happened to be those who had
availed treatment for general illness.

Quality Initiatives in health facilities in Madhya Pradesh 78
Table 8.7: Type of services received in facility by OPD beneficiaries by level of facility Particulars Level 1 Level 2 Level 3 Total Total no. of OPD beneficiary 7* 117 357 481
Antenatal care 71.4 88.9 92.4 91.3 General illness 28.6 6.0 1.1 2.7 Post-natal care 0.0 0.9 2.5 2.1 Family planning 0.0 2.6 0.8 1.2 Abortion 0.0 0.0 1.4 1.0 Others 0.0 1.7 1.7 1.7
Perception of IPD beneficiary on their interaction with service provider
Interaction between the service provider and beneficiary constitutes an essential component of
quality of service. Data indicates (table 8.8) that all the beneficiaries understood the information
provided by nurse/doctor across the level of facilities. However, understanding whether the
provider listened to their complaints/ concerns, 88 percent of the beneficiary acknowledged it.
Overall, 76 percent of the beneficiaries also reiterated that the behavior of the nurse/ doctor towards
them was very polite, 21 percent reported it to be polite and three percent mentioned it was rude.
In L3 level, the percentage of reported ‘rude’ was 4 percent.
Table 8.8: Perception of IPD beneficiary on their interaction with service provider Particulars Level 1 Level 2 Level 3 Total No. of patient interviewed 22 99 375 496 % understood clearly the information provided by nurse /doctor
100.0 99.0 98.7 98.8
% feel that provider did listen to their complain/concerns
100.0 83.8 87.7 87.5
Perceived behaviour of nurse/doctor towards patient was
Very polite 100.0 76.8 74.7 76.2 Polite 0.0 22.2 21.3 20.6 Rude/ Very rude 0.0 1.0 4.0 3.2
Meals received by IPD beneficiary
Dietary facilities are made by institutions for indoor patients. Adhering to this, data indicates (table
8.9) that beneficiaries had mentioned that they had received morning tea (87 percent), breakfast
(85 percent), lunch (71 percent), afternoon tea/milk (68 percent) and dinner (67 percent). In other
words, some beneficiaries either did not get any meals at all or some of the meals. Provision of
meals was relatively better in L3 level of facility, as compared to L2 and L1. Pattern of receiving
the meals by beneficiaries was more or less uniform across the level of facilities.
Table 8.9: Food received by IPD beneficiary by level of facility (in percentages) Particulars Level 1 Level 2 Level 3 Total No. of patient interviewed 22 99 375 496 Morning tea/milk 63.6 75.8 91.2 86.9 Breakfast 50.0 75.8 89.6 85.1 Lunch 45.5 58.6 76.3 71.4 Afternoon tea/milk 40.9 56.6 72.8 68.1 Dinner 36.4 54.5 72.3 67.1 Total number of IPD beneficiary who received any food
14 75 343 432
% Satisfied with quantity of food received 100.0 100.0 95.6 96.5 % Satisfied with quality of food 92.9 96.0 96.2 96.1

Quality Initiatives in health facilities in Madhya Pradesh 79
Further, 97 percent of beneficiaries were satisfied with the quantity of food received. Regarding
quality of food received, beneficiaries were largely (96 percent) satisfied.
IEC Material
Information, Education and Communication material plays a vital role for beneficiaries availing
the services from the facility as it facilitates in creating awareness and sensitization. Under MCH
program there is protocol for display of IEC material at specified locations in a facility.
IPD beneficiaries: All the IPD beneficiaries were asked whether they had any opportunity to see
IEC material displayed in the ward. Overall, three out of five (60 percent) beneficiaries had seen
the IEC materials displayed. This varies by level and type of health facility. At L1 level, 71 percent
of the beneficiaries had an opportunity to see the IEC displayed in the ward, followed by 61 percent
in L3 and 51 percent in L2. However, only 31 percent of beneficiary mentioned that IEC material
was explained to them.
Table 8.10: IEC Material – IPD
Particulars % who had opportunity
to see IEC material
displayed in ward
IEC explained No. of patients
Level 1 71.4 57.1 21
Level 2 51.0 28.0 100
Level 3 61.3 30.1 375
SC 75.0 60.0 20
PHC 67.6 43.2 37
CHC 36.1 16.7 72
DH 62.7 30.8 367
Total 59.7 30.8 496
Beneficiaries if literate can understand the IEC material but since some of them are illiterate, an
explanation from the various medical, paramedical and/or other staff of the facilities regarding the
IEC would facilitate in enhancing beneficiaries awareness and sensitization towards the issue. In
over four out of five (84 percent) beneficiaries, nurse had explained about the IEC material.
Doctors constituted only five percent and four percent were hospital staff members. At L3 level,
involvement of nurses was 87 percent while for doctors it was four percent followed by five percent
other hospital staff. At L2 level, in 75 percent cases, it was the nurse while in another 10 percent
it was doctors who explain IEC to the patients.
Table 8.11: Person who explained about IEC material to IPD ward/facility
Particulars Level 1 Level 2 Level 3 Total
Total 12 28 113 153
Nurse 75.0 75.0 86.7 83.7
Doctor - 10.7 4.4 5.2
Other hospital staff - - 5.3 3.9
Family members - 3.6 0.9 1.3
Others 25.0 10.7 2.7 5.9
Cleanliness in facility
Cleanliness is an important component of service delivery in government facilities as it’s the first
point of infection control at the facility level. Although the issue is subjective and could be

Quality Initiatives in health facilities in Madhya Pradesh 80
influenced by their background characteristic, an attempt was made to understand regarding the
same from both indoor and outdoor beneficiaries.
Perception of IPD beneficiary Data does indicate a relatively higher level of perception regarding cleanliness of wards (table
8.12). As 68 percent of beneficiary reported it to be ‘somewhat clean’, and 31 percent mentioned
it to be ‘very clean’. At L2 and L3 level, 38 and 28 percent respectively found the ward to be very
clean.
Regarding cleanliness of toilets, 19 percent of beneficiaries mentioned it was not clean. This was
21 percent in L3 and 12 percent in L2. Only 12 percent of beneficiary found the toilet to be ‘very
clean’. This was 9 percent in L3 and 17 percent in L2 level.
With respect to cleanliness of bathrooms, 32 percent beneficiaries at L1, 12 percent at L2 and 19
percent at L3 level do not find bathrooms to be clean suggesting low levels of satisfaction amongst
them. Against this, 32 percent beneficiaries at L1, 16 percent at L2 and 9 percent at L3 find it very
clean indicative of higher levels of satisfaction. Majority (71 percent) of the beneficiaries have
moderate level of satisfaction regarding cleanliness of bathrooms.
Table 8.12: Perception of IPD beneficiary regarding cleanliness (in percentages)
Particulars Level 1 Level 2 Level 3 Total
No. of patient interviewed 22 99 375 496
Cleanliness of Ward
Somewhat clean 50.0 59.6 71.5 68.1
Very clean 50.0 38.4 28.3 31.3
Not clean 0.0 2.0 0.3 0.6
Cleanliness of Toilet
Somewhat clean 40.9 70.7 70.4 69.2
Very clean 31.8 17.2 9.1 11.7
Not clean 27.3 12.1 20.5 19.2
Cleanliness of Bathroom
Somewhat clean 36.4 71.7 72.5 70.8
Not clean 31.8 12.1 18.7 17.9
Very clean 31.8 16.2 8.8 11.3
Perception of OPD beneficiary
Perception of the OPD beneficiaries with respect to cleanliness in general in the facility was
broadly divided into two, with 54 percent mentioning it to be somewhat clean, while the remaining
46 percent categorizing it as ‘very clean’. Fifty one percent of L3 level beneficiaries found the
facility to be very clean as against 31 percent of L2 level.
Almost similar were the findings as regard to cleanliness of the waiting area, with 47 percent of
beneficiaries perceive it to be ‘very clean’. Level wise this was 57 percent among beneficiaries at
L1 level, 32 percent among L2 level and 52 percent at L3 level. Remaining beneficiaries found the
waiting area to be ‘somewhat clean’.
Compared to general area in the facility and the waiting area, the consultation/doctors room was
found to be ‘very clean’ by 60 percent of beneficiaries. Level wise this was 86 percent at L1 level,
48 percent at L2 level and 64 percent at L3 level. The remaining found it to be ‘somewhat clean’.

Quality Initiatives in health facilities in Madhya Pradesh 81
Fourteen percent of L1 facilities had no drinking water facilities, while 43 percent of the
beneficiaries mentioned that the available drinking water was not clean at L1 level. 43 percent at
L1, 72 percent at L2 and 68 percent of beneficiaries at L3 perceived that the drinking water in
these facilities was somewhat clean suggesting moderate level of satisfaction.
As regards to toilet facility, three fourth (75 percent) of the beneficiary reported it to be ‘somewhat
clean’. Around one fifth (21 percent), did perceive it to be ‘very clean’, while five percent did not
find it clean. Cleanliness was relatively poorer in L1 level facility.
Table 8.13: Perception of OPD beneficiary regarding cleanliness in facility
Particulars Level 1 Level 2 Level 3 Total
No. of patient interviewed 7* 117 357 481
Cleanliness
In facility
Somewhat clean 57.1 69.2 49.3 54.3
Very clean 42.9 30.8 50.7 45.7
Waiting area
Not clean 0.0 0.0 0.3 0.2
Somewhat clean 42.9 68.4 47.9 52.8
Very clean 57.1 31.6 51.8 47.0
Consultation/doctor room
Not clean 0.0 0.0 0.8 0.6
Somewhat clean 14.3 52.1 35.6 39.3
Very clean 85.7 47.9 63.6 60.1
Drinking water facility
Not clean 42.9 1.7 3.9 4.0
Somewhat clean 42.9 71.8 67.8 68.4
Very clean 0.0 26.5 28.3 27.4
No facility available 14.3 0.0 0.0 0.2
Toilet facility
Not clean 14.3 3.4 4.8 4.6
Somewhat clean 71.4 81.2 72.5 74.6
Very clean 14.3 15.4 22.7 20.8
Perception of beneficiary toward support staff Observations of beneficiaries regarding the behavior of support staff towards them could have a
bearing on their seeking services from the facility. As seen from table 8.14, overall beneficiaries
of both IPD (92 percent) and OPD (97 percent) seem to consider that the support staff was polite
towards them. However, IPD beneficiaries did seem to be experiencing some level of rudeness
from them. Variation does exist across the level of facilities. Majority of the IPD beneficiaries i.e.
82 percent, 59 percent and 67 percent of L1, L2 and L3 facilities respectively found the behavior
of the staff to be ‘very polite’, with exception of 14 percent at L1, 5 percent at L2 and four percent
at L3 who found it to be ‘very rude’. Similarly in case of OPD, 86 percent, 71 percent and 76
percent of the beneficiaries at L1, L3 and L3 respectively found the behavior of the staff to be very
polite.

Quality Initiatives in health facilities in Madhya Pradesh 82
Table 8.14: Perception of beneficiary on behavior of support staff by level of facility (in
percentages) Particulars IPD OPD
Level 1 Level 2 Level 3 Total Level 1 Level 2 Level 3 Total
Total no. of beneficiary 22 99 375 496 7 117 357 481 Level of behaviour
Very polite 81.8 58.6 66.9 65.9 85.7 70.9 77.0 75.7 Polite/somewhat polite 4.5 34.3 24.8 25.8 0.0 26.5 19.9 21.2 Very rude 13.6 5.1 4.3 4.8 14.3 0.9 0.6 0.8 Rude 0.0 2.0 4.0 3.4 0.0 1.7 2.5 2.3
Expenses incurred for services
As per the guidelines, MCH services for the patients are to be free of any charges, irrespective of
the type of health facility. Findings suggest that both IPD (22 percent) and OPD (34 percent)
beneficiaries had incurred expenses across the levels of facility. However, the amount spent by
IPD beneficiaries was much more than the OPD beneficiaries.
With regards to IPD beneficiaries, it was found that 18 percent of beneficiaries had to pay an
average of Rs.438 for availing services at L1 level. The amount was generally paid on birth of the
baby, towards cleaning and/ or to class IV employees. At L2, 20 percent beneficiaries mentioned
that they had to pay an average of INR 258 for availing services which was generally found to be
paid for case paper, birth of the baby, conveyance, eatables, gloves, baby bath, cleaning charges
or class IV employees, while at L3, 23 percent beneficiaries mentioned that they had to pay an
average of INR 493 to avail services at the facility for conveyance, birth of the baby, injections,
operation, cleaning charges, class IV employees, etc.
Table 8.15: Percentage of IPD beneficiary who incurred expenses for services Particulars IPD
Level 1 Level 2 Level 3 Total No. of patient interviewed 22 99 375 496 Percent of beneficiaries who paid money to avail services
18.2 20.2 22.7 22.0
Average money paid (in INR) 437.5 257.5 493.3 447.5
In case of OPD beneficiaries (table 8.16) overall one third of them who incurred expenses, the
amount was on an average INR 31. Marginal variation existed across the level of facility. Fourteen
percent OPD beneficiaries at L1 mentioned that they had to spend an average of INR 30 for
conveyance. A little over one third (38 percent) of beneficiaries at L2 spend an average of INR 25
mostly for conveyance and case papers and sometimes for ambulance services. Similar were the
expense pattern of another one third (33 percent) of OPD beneficiaries at L3 level who paid on an
average of INR 31.
Table 8.16: Percentage of OPD beneficiaries and expenses incurred by them Particulars Level 1 Level 2 Level 3 Total No. of patient interviewed 7 117 357 481 Percent of beneficiaries who paid money to avail services
14.3 37.6 33.1 33.9
Average money paid (in INR) 30.0 24.9 33.2 30.9 Services for which money was paid
Case paper 0.0 40.9 33.9 35.6 108 Ambulance 0.0 0.0 0.8 0.6 Conveyance 100.0 59.1 64.4 63.2 Operation 0.0 0.0 0.8 0.6

Quality Initiatives in health facilities in Madhya Pradesh 83
Beneficiary perception on security in facility and satisfaction of services
Likelihood of beneficiaries to use services from the health facility would continue only if they
were satisfied with the services as well as perceived that they were safe and secure. As seen from
table 8.17, overall 97 percent of both IPD and OPD beneficiaries were satisfied with the services
that they had received in the ward/ facility, there by reflecting high level of satisfaction regarding
services received by them. Probing further on the reasons for their satisfaction, almost similar were
the responses from IPD and OPD beneficiaries. It mainly included, good information/ services/
treatment / facilities available (76 percent OPD and 78 percent IPD beneficiaries); get all facilities
(26 percent OPD and 18 percent IPD beneficiaries); good behavior of doctors/ nurse/ support staff
(16 percent OPD and 13 percent IPD beneficiaries) and free of cost (19 percent OPD and 23
percent IPD beneficiaries). Reasons mentioned by OPD beneficiaries who were not satisfied
though very small percentage included: referred to higher facility, did not get all
information/facility, staff behavior was not good, sonography facility not available everyday etc.
Whereas the responses of IPD beneficiary included: not getting good treatment, lack of staff, do
not get all facilities, locker is not clean/functional, insects/bugs are there, food facility not available
etc.
Finding regarding safety and security in the health facility was almost similar, as almost all (99
percent) beneficiaries did perceive that they were safe and did not perceive of any threat from any
one.
Table 8.17: Satisfaction of services and security in facility as perceived by beneficiaries by
level of facility
Particulars IPD OPD
Level 1 Level 2 Level 3 Total Level 1 Level 2 Level 3 Total
No. of patient interviewed 22 99 375 496 7 117 357 481
Percent satisfied with services
received in ward/facility 100.0 93.9 97.3 96.8 100.0 97.4 97.2 97.3
Percent feel safe and secure in
facility 100.0 98.0 98.7 98.6 85.7 100.0 98.9 99.0
To sum up the data indicates that largely both IPD and OPD beneficiaries were satisfied with the
services provided by providers. IPD beneficiaries largely received the benefits from the facility.
However, beneficiaries did incur out of pocket expenses which varied widely.

Quality Initiatives in health facilities in Madhya Pradesh 84
Chapter 9 Quality Assurance Process, Support, Sustainability
District Quality Assurance Cell (DQAC)
Data for DQAC was available through 11 interviews conducted in 11 districts and hence represents
the scenario of Quality Assurance Process, Support and Sustainability in these districts. Wide
variation was observed across the districts. It may also be mentioned that in many cases, quality
assurance was reported as part of NHM supportive supervision initiative and not as a separate
initiative of DQAC. Thus there was no clear clarity on part of respondents regarding DQAC but
they have responded as to what is quality assurance mechanism in their district.
It was found that in all the districts a 10 member DQAT had been formed since 2010 onwards.
These teams basically support the quality improvement process in the district.
Variation was observed in the formation of the 10 member committee/team in various districts and
generally included Collector, CMHO, Civil Surgeon, Gynecologist and any of the members in
form of DPMO, DPFO, DIO, DHOs, BPM, Pharmacist, DLO, nodal officers, members of FOGSI,
representative of nursing division, doctors from private hospitals, women and child development
officer, education officer, MPTAST representative, BMOs etc. DQAC is formed under the
chairmanship of the District Collector and the CHMO is the convener and in absence of the
collector, the CMHO can chair the meeting. Moreover, at the District Hospital level, District
Quality Team (DQT) is formed and is chaired by the Civil Surgeon.
With respect to functionality, it was found that for dissemination of QA Policy and guidelines, on
receipt of guidelines from the state, on CHMOs orders, guidelines were circulated to district and
block members. Meetings were conducted with district level and block level officials for the same
and if required, training were conducted.
In district like Panna, this work was done through DHS. In Dindori, MPTAST members facilitated
training of BMOs and MOs for dissemination of QA Policy and guidelines.
As part of quality assurance process, to ensuring standards of Quality of Care in the district,
visits were undertaken by MPTAST members and DHOs to the facilities in places like Dindori.
Team members from Doctor Express which consisted of three to four experts from the district did
visit the delivery point facilities once in a month for support, supervision and monitoring. In other
districts, with the help of a checklist, work was supervised by the experts e.g. check if 6 trays are
available at the delivery point or not, training of staff, quality services provided etc.
In Jabalpur, in two CEmONC, the DQT monitors the work/services and the report is reviewed in
DHS meeting while for BEmONC, the BQT is responsible. Apart from this, from time to time,
coordinators from MPTAST and UNICEF also undertake field visits
Similarly in Panna it was found that PHN goes and provides training along with other experts.
Once in a month they go and keep track of things
QA process was also supported in form of Review and Reporting in the district. Generally
supportive supervision checklist was used and followed for the review. The checklist was
administered at the facility level by the DQAC and BQAC members. Based on this, instructions

Quality Initiatives in health facilities in Madhya Pradesh 85
were given to the duty staff, facility in charge and the district authority either orally or in writing.
Gap analysis was also done with the help of format provided by MPTAST members. The findings
were shared and discussed in the DHS meetings and other meetings on a monthly basis. In Dhar
district, the DPM informed that they do not conduct meetings any more. The two MPTAST
members had left and now follow up was not being done properly as they were busy with other
programmes. The reporting was done as and when the state demands. Around 60 percent of the
activities were implemented in the district. The DQC was formed on 26.11.2010 and in all, eight
meetings were conducted till 31.10.2014
For ensuring sustainability of the initiatives, Capacity Building of QA teams at various levels had
been carried out. In some districts it was reported that induction/ orientation on QA was done at
central level at Indore/Bhopal for the district officials including the DPM. In places like Dindori,
MPTAST had conducted one day trainings of other district officials and QA was also discussed in
DHS meetings. In yet another district, capacity building was done in form of circulating the
guidelines.
Officials were also trained at Bhopal for Bio Medical Waste Management. Trainings for SBA,
LSAS, EmONC, BEmONC, BMW etc were undertaken at the district level. Meeting and trainings
were used to provide inputs on QA. Inputs were also provided on spot to the trained staff. Also, it
was reported that training of internal assessors was recently carried out.
For ensuring Monitoring, various methods were used by the districts. In some, visits were made
to the delivery points by the experts in teams of members of DQT and BQTs or the doctor express.
There was a doctor express in the district and sector MOs also visited VHSND every month and
observe and monitor. Review of reports of DQT and BQT was undertaken in the DHS meeting.
During the next visit, the officials made sure that the amendments had been carried out. People
were trained on need base. In Panna, the DPM and CMHO mentioned that they visited field once
a month and ensured that the work was done as per quality standards
As part of quality assurance process, Coordination with State for dissemination and
implementation of guidelines was also undertaken by the districts. Once the guidelines were
received from the state, the same were circulated to team members who undertook the work. This
was reviewed in DHS and a copy of the report was sent to the state. In some districts, it was found
that initially, discussions were undertaken with MPTAST and district officials and MPTAST
reports to SQAC. SQAC in turn gave feedback regarding the gaps and shortages and based on this
feedback, appropriate measures were taken by the district
A format from the state was also there for delivery point which is discussed in the DHS meeting
every month and the minutes are noted.
In Jabalpur, a special team had been constituted to look into the failure cases of family planning.
This report was reviewed in DHS and then sent to state.
In Panna, everything is being done by Zilla Swasthya Samiti including the DHS meeting. Nothing
separate is constituted under DQAC
As part of Reporting to SAQC, Programmatic performance basis, financial achievement, quality
issues etc. were discussed in the DHS meetings in which the collector was present. This DHS
report was sent to the state every month. Minutes of DHS were also sent to state. Also in some
districts, MPTAST members also fill in the checklist and send which contains delivery point

Quality Initiatives in health facilities in Madhya Pradesh 86
related matters. Reporting was also done through emails. In Panna, a meeting with collector takes
place every month and reporting to SAQC was done by them
Block Qualitative Team (BQT)
The BQT is for the block level and the Block Medical Officer (BMO) chairs it. In all, 14 interviews
were conducted for BQT across 11 districts. At the block level, the BQT teams were yet to be
crystallized but presently in most of the districts, it was through the BPMU formed under NRHM
that supportive supervision was being carried out. There seems to be confusion at the block level
regarding BQT and BPMU. What the officials have reported as being quality initiative in their
blocks has been represented here.
Support: Generally the BPMU team constituted works as the block level team consisting of 5 to
10 members. These included CBMO/BMO, staff nurse, BCM, data operator, BPM, BAM,
Pharmacist, LT, dentist, clerk, sector supervisor, ASHA etc. In some cases, it consisted of CBMO,
MOs and BPM.
Implementation of QA Policy, guidelines and procedures at block and facility level: In some
districts, the guidelines were photocopied and sent to all the centers for implementation while in
some, Weekly visits were made to the facilities. For supportive supervision, visits were made twice
in a week, at facility level by the block teams. Different patterns were observed across districts.
E.g. In Sehore, the issues were discussed in meetings, in another block , it was informed that they
do not know about guidelines but work was properly done as routine visits were undertaken by
team (Not BQT team) in which labor room, records, drugs, cleanliness etc. was reviewed in yet
another block use of 57 Point checklist was reported.
Training on Quality Initiatives: The officials indicated that no special training had been carried
out for quality initiatives as such but regular meetings were used to provide inputs. Sometimes the
issues were covered in other training, MCH, Immunization and Family Planning etc. For instance
in a block of Dindori district, the BMO had oriented the staff of CHC, PHC and SC during the
monthly meetings that were conducted. The topics covered included quality, labor room, drugs
and emergency medicines, how to behave with patients, how to maintain records, etc. Similarly in
Uchera Satna, capacity building of PHC MO, ANMs, ASHA, MPW, LHV, Supervisors, pear
educator and VHNC members has been undertaken for quality initiatives. Training of facility staff
was undertaken on protocols, infection control, etc.
Feedback to facilities in block: Generally oral feedback was given at the facility level regarding
the minor shortfalls while for major problems, it was given in writing. Many a times, supportive
supervision played are role in this. In a block of Barwani, it was reported that one MO had been
Suggestions for improvement
There is problem of HR and hence 100% work is not being done as there is too much of
workload
If HR issues are handled, quality will automatically improve
Staff should be oriented
Separate staff should be recruited

Quality Initiatives in health facilities in Madhya Pradesh 87
trained for CEmONC, 4 MOs have been trained for BEmONC, while BMW training had been
imparted to MOs, ANM, Block and district level officials.
Effectiveness of Quality Initiatives in the block: It was reported over all that these initiatives
were found to be effective in various ways. In Panna, it was reported that there was 80-90 percent
improvement but the 20% short fall was due to HR issues. In some places, infrastructure was under
construction. In a block of Barwani, it was reported that there had been improvement in terms of
MCDS work plan, HH tracking, parental feedback, post-delivery stay had improved at the CHC
level while in a block of Jhabua district it was reported that due to the initiatives of MPTAST,
there had been improvement in terms of privacy, equipment, waste disposal, labor room, infection
control etc.
Further strengthening required: Various suggestions have been reported from the blocks. HR
had to be strengthened as work load was high, Knowledge needs to be upgraded timely etc. In
Dindori, requirement is in form of HR at all levels- Doctors, ANM, Ward boy, Peon etc. Also diet
was not as per protocol as it was too less for a mother per day. Staff training should be undertaken
whenever new equipment come as they are not used to handling them, required infrastructure at
CHC, PHC and SC should be there. At many places all the required equipment were not there like
warmers. BMW management was not proper and things are dumped. Many a times drug supply
was not regular. Similarly in Ghugri Mandla, it was requirement in term of communication facility,
upgrading villager’s education, etc. HR at delivery point should be as per case load. Staff should
be trained. Pawai Panna reported that population coverage of SHC area was around 7000-8000
which should be less. HR is less and it should be full time. Training especially of field staff should
be with 4th class employees need training on BMW as they throw waste everywhere. Referral is
done to Panna and Damoh, Amonganj or Katna as the distance of CHC and PHC is too far away
from SHC. There is no lady MO due to which referral is not that good. In Raipur Kaschuliya block
of Rewa district, also, HR problem is reported. In Uchera Satna, the requirements are in terms of
HR, Staff nurse, supportive staff, and repeated trainings, upgradation of infrastructure, service
delivery, record maintenance and equipments. In some places, radiant warmers are required.
Refresher training should be conducted for BMW. In Rama, Jhabua it was reported that there is
requirement of HR especially in terms of Data entry operator, Pharmacist, Staff Nurse and Lab
tech at the PHC level. At the CHC, there was requirement of residence, pharmacist, data entry
operator, staff nurse and Ob/gyn and Pediatrician. For strengthening, they also require digital X-
ray and semi analyzer
Reporting on Quality Initiative: Oral reporting was done based on observations and supervision
at the facility level. Solutions if possible were provided there and if not, are reported to the BMO
orally. In case the problem was beyond the BMOs capacity, it was reported by him at the district
level in writing in the monthly meeting. Many a times, the reporting is in form of checklist
provided by MPTAST representative. The teams report to BMO and he tries to solve the problem.
If not, he reports to CHMO. The facility level reports to the CBMO and the MPTAST checklist is
sent to CHMO. Reporting to district level officials was done once in a month.
Suggestions for improvement: There should be recruitment of staff as per requirement
Exceptions: In Sardarpur block, the CBMO and BPM informed that since February 2015, no
meeting has been conducted as they were busy with other programs and hospital work and
MPTAST members had left. They also said that for quality improvement, there should be required
HR. They informed that the quality of drugs was not good, there were problems in labor room,

Quality Initiatives in health facilities in Madhya Pradesh 88
MTP room was not there and for OT had to go out, laundry man is not there etc. In yet another
block of Sagar, the CBMO was found to be unaware about BQT
Medical Officers, Nurses and Lab Technicians
Medical Officers mechanism to take clients feedback
Patient satisfaction is one of the important goals of any health system, but it is difficult to measure
the satisfaction and gauze responsiveness of health systems as not only the clinical but also the
non-clinical outcomes of care do influence the customer satisfaction. It provides the chance to
health care providers and managers to improve their services in the public health facilities. Patients'
feedback is necessary to identify problems that need to be resolved in improving the health
services. Even if they still do not use this information systematically to improve care delivery and
services, this type of feedback triggers a real interest that can lead to a change in their culture and
in their perception of patient. Cliental feedback plays an important role in quality assurance process
as it helps to identify the gaps in client’s satisfaction level and it also paves way for improvement.
Among all the medical officers interviewed, only half (50 percent) of them mentioned that they do
have a mechanism for taking client feedback. This varied across the level of facilities as three out
of five at L1, 32 percent at L2 and 60 percent at L3 took cliental feedback.
Understanding further from these doctors as to what is exactly done with the feedback received.
Responses varied as 57 percent of the doctors mentioned that they share the feedback with the
staff, and 11 percent mentioned they reported it to the higher authorities.
Table 9.1: Medical Officers mechanism to take clients feedback (in percentages)
Particulars Level 1 Level 2 Level 3 Total
No. of Medical Officers 5* 38 63 106
% MO have mechanism for taking
clients feedback 60.0 (3) 31.6 60.3 50.0
No. of MO who take clients
feedback 3* 12* 38 53
Process of handling feedback
Is shared with staff 66.7 (2) 66.7 52.6 56.6
Identify areas of improvement 0.0 8.3 5.3 5.7
Reported to higher authorities 0.0 16.7 10.5 11.3
Others 33.3 (1) 8.3 31.6 26.4
Joint commission on Accreditation of Health care organizations (JCAHO) had described the
following criteria as quality dimensions (safety, effectiveness, efficiency, timeliness, efficacy and
equity, respect and caring, availability, appropriateness)
Forty six percent of medical officers mentioned that they had received an orientation on quality
assurance. On probing another 27 percent did acknowledge this. This had taken place across the
level of facilities (5 out of 5 medical officers at L1, 31 out of 38 at L2 and 42 out of 63 at L3). At
L1, these issues were discussed by MPTAST team members, team from state or others. Similarly
at L2, 29 percent of doctors were oriented by MPTAST team members, 13 percent by district level
officials, 10 percent by state level team and 48 percent by others. At L3 level too almost similar
was the pattern, (MPTAST members 31 percent, district level officials 21 percent, state level teams
2 percent and others 43 percent).

Quality Initiatives in health facilities in Madhya Pradesh 89
Table 9.2: Orientation of Medical Officers on Quality Assurance (in percentages)
Particulars Level 1 Level 2 Level 3 Total
No. of Medical Officers 5* 38 63 106
% who received any orientation on QA issues from anyone
Mentioned yes
On probing mentioned yes
80.0 (4)
20.0 (1)
39.5
42.1
47.6
19.0
46.2
27.4
No. of MO have received any orientation on QA issues 5* 31 42 78
Person who has discussed with MO on QA
MPTAST team members 20.0 (1) 29.0 33.3 30.8
Officials from district level 0.0 12.9 21.4 16.7
Team from state 20.0 (1) 9.7 2.4 6.4
Others 60.0 (3) 48.4 42.9 46.2
The data indicates that 4 out of 5 MOs at L1, 97 percent MO at L2 and 78 percent of MO at L3
reported that their respective facilities had been visited by DQT teams having 3-4 members. The
average number of time these teams had visited was 4 and average amount of time spent in the
facility was around two hours. Regarding extent of QA issues being implemented in the facility,
49 percent of MOs in L3 reported it was fully implemented while 43 percent said it was partially
implemented. Similarly, at L2 level, 73 percent said it was partially implemented while 24 percent
reported it to be fully implemented. At L1, two doctors mentioned it was somewhat implemented
while one said that it was fully implemented.
Table 9.3: Mentoring /supportive supervision for Quality
Particulars Level 1 Level 2 Level 3 Total
No. of Medical Officers 5* 38 63 106
% of facilities that have been visited by DQT team 80.0(4) 97.4 77.8 84.9
Average number of times DQT teams visited the facility 3.5 3.8 3.7 3.7
Average number of members in DQT team 3.3 4.0 4.2 4.1
Average time spend by DQT team 120.0 120.1 116.7 118.3
No. of Medical Officers reported DQT team visited 4* 37 49 90
Extent of QA issues been implemented in the facility
Fully implemented 25.0 (1) 24.3 49.0 37.8
Some implemented 50.0 (2) 73.0 42.9 55.6
Not implemented 0.0 (0) 2.7 4.1 3.3
No response 25.0 (1) 0.0 4.1 3.3
As seen from the table, around two third of Medical Officers mentioned that they had discussion
related to quality of services. However the frequency for these meetings varied widely from
weekly, fortnightly, monthly etc.

Quality Initiatives in health facilities in Madhya Pradesh 90
Table 9.4: Mentoring /support for Quality of service
Particulars Level 1 Level 2 Level 3 Total
No. of Medical Officers 5* 38 63 106
Any discussions related to quality of
services 100.0 (5) 70.3 60.3 65.7
Frequency of meetings/discussions with
staff team members/ANM/nurses
Weekly 40.0 (2) 44.7 19.0 29.2
Fortnightly 0.0 0.0 6.3 3.8
Monthly 0.0 2.6 7.9 5.7
Quarterly 20.0 (1) 5.3 7.9 7.5
Half yearly 0.0 10.5 3.2 5.7
Others 40.0 (2) 23.7 23.8 24.5
Do not know 0.0 2.6 4.8 3.8
Not fixed 0.0 2.6 9.5 6.6
Do not have any meeting 0.0 7.9 17.5 13.2
Regarding self-appraisal for facility, 4 out of 5 medical officers at L1, 27 out of 38 medical officers
at L2 and 45 out of 63 medical officers at L3 mention that they conduct self-appraisal for the
facility.
Table 9.5: Self-appraisal for facility
Particulars Level 1 Level 2 Level 3 Total
No. of Medical Officers 5* 38 63 106
% MO mentioned they conduct
self-appraisal for the facility 80.0 (4) 71.1 71.4 71.7
No. conducted self-appraisal 4* 27* 45 76
Frequency of
meetings/discussions with staff
team members/ANM/ Nurses
Weekly 25.0 (1) 0.0 2.2 2.6
Fortnightly 0.0 14.8 6.7 9.2
Monthly 50.0 (2) 48.1 28.9 36.8
Quarterly 0.0 0.0 2.2 1.3
Yearly 0.0 0.0 4.4 2.6
Others 25.0 (1) 14.8 33.3 26.3
At a time of discharge 0.0 0.0 8.9 5.3
Not fixed 0.0 7.4 8.9 7.9
No response 0.0 14.8 4.4 7.9
Frequency of meetings/discussion with staff/ANM/Nurses was mostly weekly or monthly at L1
level. AT L2, it was monthly/fortnightly while at L3, it was monthly or others. A wide variation
was observed at L2 and L3 levels.
Perception of Medical Officer regarding the priority needs in the facility by level of facility
As seen from the table, at L1, out of five Medical officers, 4 mentioned the priority being the issue
of filling in the vacant post of staff, three said it was others, two said it was shortage of drugs while
one each mentioned non-working of equipment and security of staff as priority issue for the
facility.

Quality Initiatives in health facilities in Madhya Pradesh 91
Similarly at L2 level, 76 percent mentioned filling in the vacant post of staff as a priority issue. 30
percent mentioned non-working of equipment, 16 percent said it was shortage of drugs, 32 percent
said it was security of staff while 34 percent said it was others.
At L3, filling up of vacant post of staff toped the priority list with 78 percent medical officers
stating it to be a priority issue. 40 percent MOs, mentioned that priority was non-working of
equipment, 30 percent said it was security of staff while 29 percent said it was shortage of drugs.
Table 9.6: Perception of Medical Officer regarding the priority needs in the facility by level
of facility
Particulars Level 1 Level 2 Level 3 Total
No. of Medical Officers 5* 38 63 106
Nature of issues
Fill up the vacant post of staff 80.0 (4) 76.3 77.8 77.4
Equipment not working 20.0 (1) 28.9 39.7 34.9
Shortage of drugs 40.0 (2) 15.8 28.6 24.5
Security for staff 20.0 (1) 31.6 30.2 30.2
Others 60.0 (3) 34.2 19.0 26.4
None 0.0 2.6 3.2 2.8
Further, the MOs explained in details the challenges/constraints they had faced in providing the
various kinds of services in terms of community, staff, equipment and drugs (for details see box
below).
Mentoring /supportive supervision for Nurses
Under NRHM, project management units were set up at the district (DPMU) and block levels
(BPMU) for monitoring various components. Representatives of these units made field visits to
various facilities in the district and provided inputs to the facility. This was done with help of a
checklist which was administered to each facility and gap analysis was done. Supportive
supervision was also carried out by teams consisting of sectoral representatives along with BMO.
At the local level generally the MO was involved in providing inputs to the facilities. Also, in MP,
Community
Problem of convincing (33 percent), Illiteracy (20 percent), Do not come for ANC (21
percent), fail to understand limitations of the system (18 percent), lack of awareness (19
percent) etc.
Staff
Shortage of staff (65 percent), doctors not available (30 percent), shortage of support
staff (20 percent), overload of work, non-availability of staff 24x7 etc.
Equipment
Lack of equipment (59 percent), non-functional equipment (26 percent), bad quality, old
equipment etc.
Drugs
Weak drug supply(18 percent), out of stock (11 percent), bad quality (8 percent)

Quality Initiatives in health facilities in Madhya Pradesh 92
it was observed that representatives of MPTAST were also involved in providing inputs in matters
related to quality assurance. Thus various officials from state, district, and block and facility level
were involved in providing inputs.
Quality Assurance Discussion
As depicted from the table, 26 percent nurses mentioned that they had discussions with district
officials. This was more apparent in case of District Hospital at L3. 15 percent nurses mentioned
that they had discussions with block level officials which was more at the L1 and L2 levels. The
role of block level officials was negligible at L3 level as in DH, they had their own team which
usually was involved in providing inputs. Moreover it was observed that MPTAST representatives
were also involved regularly at DH level.
The data also depicts that 21 percent nurses mentioned that they did not had any discussions
pertaining to quality assurance with anyone. This may be because the Quality Processes might
have been told but the word Quality Assurance may not have been used.
Visits/ Meetings conducted: Data indicates that 58 percent of nurses mention that visits/ meetings
are conducted by district level officials which is found to be more at L3 level. 51 percent nurses
mentioned that such visits/meetings are conducted by block level officials more so at L1 and L2
levels than L3 levels. 74 percent nurses mention that MOs visit/conduct meetings and this is more
or less same across all facilities except at L1 where variation is there.
Orientation Issues Covered: A variation was observed regarding the orientation issues covered
in the meetings. This ranged from issues pertaining to delivery room, instruments/ equipment, Bio
Medical Waste Management, ANC Services and normal delivery, Immunization, work
management, record and registers etc.
Usefulness of orientation: As depicted from the data, 68 percent nurses mentioned that it had
helped them to take better care of the clients. It resulted in the staff coming to know about newer
things was mentioned by 26 percent nurses. Other usefulness mentioned were in term of being able
to offer better quality of services, fulfilled demands, awareness of patients, improvement in
hospital functioning and so on.
Table 9.7: Mentoring /supportive supervision for Nurses
Particulars Level 1 Level 2 Level 3 Total
Number of Nurses 23 53 80 156
Quality Assurance Discussion with
District officials 13.0 13.2 38.8 26.3
Block officials 21.7 32.1 2.5 15.4
MPTAST team members 8.7 18.9 22.5 19.2
Others 30.4 18.9 12.5 17.3
Do not know the designation/level of the person
discussed
4.3 0.0 0.0 0.6
Nobody 21.7 17.0 23.8 21.2
Visits/ Meetings conducted by
a) District level officials 47.8 45.3 68.8 57.7
b) Block level officials 73.9 81.1 25.0 51.3
c) Medical officers 60.9 77.4 76.3 74.4

Quality Initiatives in health facilities in Madhya Pradesh 93
District Quality Team Visit
The data implies that a DQT team consisting of around five members have visited the facilities for
about three times and spent on an average half an hour to one hour in the facility. At L1 level, 91
percent of the nurses mentioned that they were involved in QA process during the visit. A variation
is observed at L2 and L3 levels where around 42 to 44 percent of nurses mentioned that they were
involved. This variation may be because at L1 levels, ANMs are posted.
Table 9.8: District Quality Team Visit as mentioned by nurses by level of facility
Particulars Level 1 Level 2 Level 3 Total
Number of Nurses 23 53 80 156
No of times DQT visited facility 2.8 3.3 3.3 3.0
Number of DQT team members 4.7 4.0 8.0 5.1
Avg. time spent by DQT team (in minutes) 70.8 81.3 24.3 65.2
Nurse’s involvement in QA process during the visit 91.3 41.5 43.8 50.0
Constrains faced by Nurse
As indicated by data, regarding strengthening of staff, more weightage was given to have more
staff (74 percent) followed by training of staff (48 percent) and need to have more doctors (12
percent). The nurses also suggested that the class IV employee should be recruited, staff quarters
should be made available, appointment of Lab Technician, need for change room, adhering to
punctuality etc. for staff improvement.
Regarding instruments, 40 percent nurses mentioned that all the instruments were not available
while 26 percent mentioned that they were non-functional. Other things mentioned regarding this
were old instruments, problem of quality of instruments, requirement, and lack of regular supply
and so on.
Sixty two percent nurses mentioned non availability of drugs which needs to be taken care of for
strengthening this aspect.
Other things to be strengthened as suggested by nurses were in term of bathroom/room for the
staff, electricity and water availability, good toilets etc.
Table 9.9: Orientation
Background characteristics Level 2 Level 3 Total
No. of Lab Technician 20 34 54
% received any orientation on QA issues from anyone 75.0 (15) 79.4 77.8
No. of Lab Technician received training 15 27 42
Person who discussed
MPTAST team members 33.3 (5) 55.6 47.6
Officials from district level 73.3 (11) 63.0 66.7
Officials from block level 33.3 (5) 3.7 14.3
Team from state 6.7 (1) 18.5 14.3
Others 6.7 (1) 11.1 9.5
Usefulness of the orientation
Good care of patients 13.3 (2) 3.7 7.1
Very useful 73.3 (11) 77.8 76.2

Quality Initiatives in health facilities in Madhya Pradesh 94
As depicted from the table, 78 percent LTs have received orientation on QA issues. 15/20 and
27/34 LTs at L2 and L3 have received these orientation respectively.
A variation is observed regarding with whom these discussions have taken place. This rages from
discussions with state to block level officials. 48 percent LTs mentioned that they discuss this with
MPTAST team members. At L2, five out of 20 report this while at L3, 27/34 report doing this. 11
out of 20 LTs at L2 mentioned that they discuss this with officials from district level while 63
percent LTs at L3 mentioned this to be the case. Five out of 20 LTs discuss this with block level
officials at L2 level while only four percent of LTs mentioned that they discuss the orientation
issues with block level officials. Discussions with state level officials are held by 19 percent of
LTs at L3 while only one LT report this to be the case at L2 level.
These orientations have proved to be very useful for the LTs. This is reported by 79 percent LTs
at L3 and by 11/20 LTs at L2.
Table 9.10: Meetings/discussions with medical officer/staff members/ANM/ nurses
Background characteristics Level 2 Level 3 Total
No. of Lab Technician 20 34 54
Meetings/discussions with medical officer/staff members/
ANM/nurses
Weekly 30.0 (6) 20.6 24.1
Fortnightly 10.0 (2) 2.9 5.6
Monthly 25.0 (5) 14.7 18.5
Quarterly 5.0 (1) 0.0 1.9
Half yearly 0.0 5.9 3.7
Other 5.0 (1) 11.7 9.3
Not fixed 5.0 (1) 14.7 11.1
No response 20.0 (4) 29.4 25.9
As depicted in the table, it is to be noted that 26 percent of LTs have not responded to this question.
Apart from this variation is observed in the data regarding frequency of meetings taking place with
either medical officers, staff members, ANM or nurses. In general these meetings take place
weekly, monthly fortnightly etc. as reported by LTs. 24 percent of LTs mentioned that these
meetings take place weekly. At L2, 3/20 LTs mentioned this while 21 percent (34) at L3 said that
the meetings are conducted weekly. The meeting is conducted monthly as citied by 19 percent of
LTs. At L2, this is reported by 5/20 and while at L3, this is reported by 15 percent LTs.
Table 9.11: Constraints faced in providing services
Background characteristics Level 2 Level 3 Total
No. of Lab Technician 20 34 54
More work load 0.0 5.9 3.7
Have to spend more time 0.0 5.9 3.7
Lack of staff 10.0 (2) 44.1 31.5
Vindoul shortage 10.0 (2) 2.9 5.6
Other 55.0 (11) 67.4 63.4
No constrains/No response 40.0 (8) 14.7 24.1

Quality Initiatives in health facilities in Madhya Pradesh 95
As inferred from the data, 24 percent LTs mentioned that they do not face any constrains in
providing services. This is reported by 8/20 LTs at L2 and 15 percent LTs at L3. Shortage of staff
as constrain was reported by 32 percent of LTs. This is observed more at L3 with 44 percent LTs
mentioning this to be a constraint while 2/20 mentioned this at L2. 64 percent of LTs mention that
others reasons as constrains faced in providing services.
Table 9.12: One most important priority issue that needs to be addressed in the facility
Background characteristics Level 2 Level 3 Total
No. of Lab Technician 20 34 54
Fill up the vacant post of staff 40.0 (8) 41.2 40.7
Equipment not working 10.0 (2) 2.9 5.6
Shortage of drugs 5.0 (1) 2.9 3.7
Security for staff 5.0 (1) 0.0 1.9
Others 30.0 (6) 52.9 44.4
None 10.0 (2) 0.0 3.7
As seen from the above table, discussing the most important priority issue that needs to be
addressed in the facility, 41 percent LTs mentioned the priority to be filling up of vacant posts of
staff. Others in form of self-care, security guard, completing work on time etc. was mentioned by
44 percent LTs. These kind of problems are faced more at L3 as observed from data. Other issues
which are listed as priority are nonfunctional equipment, shortage of drugs and security of staff.
The data suggests that quality initiatives have been undertaken at various levels and improvement
is noted in many areas and yet there is scope for improvement as suggested by the service
providers in terms of HR, training, equipment and so on. Thus the discussions pay way for further
strengthening of the QA initiatives at various levels

Quality Initiatives in health facilities in Madhya Pradesh 96
Facilities at a Glance
Level 1
Sub Health
Centre
(SHC, N=13)
Primary
Health Centre
(PHC, N=7)
All
(N=20)
N N N %
Human Resource
Essential Manpower 9 7 16 80
Obstetric Care
Normal Delivery
Below expected 3 1 4 20
Above expected 10 6 16 80
Labour Room
Fully Equipped 2 1 3 15
Partially Equipped 11 6 17 85
Initial management & referral of
complications
13 7 20 100
Identification and referral for danger signs 13 7 20 100
Pregnancy testing/ Antenatal care/ Intranasal
care/ Normal deliveries by SBA
13 7 20 100
Pre-referral management of obstetric
emergencies
- 1 1 5
Postnatal care–24–48 hours stay post–delivery 13 5 18 90
Post-partum contraceptive counseling 13 7 20 100
New Born Care Corner
Immediate newborn care – drying, warming,
skin to skin contact
13 7 20 100
Initiation of Breastfeeding 13 7 20 100
Breastfeeding/feeding support 13 3 16 80
Essential newborn care including resuscitation 12 3 15 75
Zero day immunization (OPV, BCG, Hep B;
as per GoI schedule), Inj. Vit. K
9 2 11 55
Referral services - 1 1 5

Quality Initiatives in health facilities in Madhya Pradesh 97
Level 2 BEmONC
Primary
Health
Centre
(PHC N=17)
Community
Health
Centre
(CHC N=15)
All
(N=32)
N N N %
Human Resource
Essential Manpower 10 13 23 71.9
Obstetric Care
Normal Delivery
Below expected 6 1 7 21.9
Expected 4 0 4 12.5
Above expected 7 14 21 65.6
Labour Room
Fully Equipped 2 2 4 12.5
Partially Equipped 15 13 28 87.5
Identification and referral for danger signs 17 15 32 100
Pregnancy testing/Antenatal care/Intranasal
care/ Normal deliveries by SBA 17 15 32 100
Postnatal care–24–48 hours stay post–
delivery 16 15 31 96.9
Post-partum contraceptive counseling 17 15 32 100
Assisted vaginal deliveries 7 14 21 65.6
Management of complications 7 8 15 46.9
Episiotomy and suturing 5 10 15 46.9
Stabilization of obstetric emergencies 5 13 18 56.3
Antenatal steroids for preterm labour 4 10 14 43.8
HIV screening 9 8 17 53.1
Comprehensive abortion care 3 9 12 37.5
Case management of RTI/STI 5 10 15 46.9
Management and Referral of HIV positive
mother and newborn 8 14 22 68.8
Antibiotics for preterm/PROM for prevention
of sepsis of newborns 3 7 10 31.3
BEmONC Services
Treatment of moderate and severe anemia in
pregnancy 11 12 23 71.9
Treatment of bleeding in antenatal period and
post-partum 9 7 16 50
Treatment of hypertensive disorders in
pregnancy 7 9 16 50
Treatment of sepsis 4 6 10 31.3
Treatment of abortions 2 5 7 21.9

Quality Initiatives in health facilities in Madhya Pradesh 98
Use vacuum extraction of vaginal deliveries 0 0 0 0
Managing vaginal tears 10 10 20 62.5
Perform manual vacuum aspiration for the
management of incomplete abortion 1 4 5 15.6
Removal of retained placenta 0 6 6 18.8
Management of neonatal sepsis including
Injectable antibiotic 6 7 13 40.6
New Born Corner
Essential newborn care including
resuscitation 10 12 22 68.8
Zero day immunization (OPV, BCG, Hep B;
as per GoI schedule), Inj. Vit. K 11 11 22 68.8
Breastfeeding/feeding support 11 11 22 68.8
Immediate newborn care–drying, warming,
skin to skin contact 17 15 32 100
Initiation of Breastfeeding 17 15 32 100
Identification and Management of LBW
infants >/=1800 g with no other complications 8 11 19 59.4
Phototherapy for newborns with
hyperbilirubinemia 3 9 12 37.5
Management of newborn sepsis 7 9 16 50
Stabilization and referral of sick newborns
and those with very low birth weight 11 12 23 71.9
Neonatal Stabilization Unit
Radiant warmer with trolley/drawers 14 6 20 62.5

Quality Initiatives in health facilities in Madhya Pradesh 99
Level 3 CEmONC
Community
Health Centre
(CHC N=1)
District
Hospital
(DH N=17)
All
(N=18)
N N N %
Human Resource
Essential Manpower 0 11 11 61.1
Obstetric Care
Normal Delivery
Below expected 0 9 9 50
Expected 0 0 0 0
Above expected 1 8 9 50
Labor Room
Fully Equipped 0 9 9 50
Partially Equipped 1 8 9 50
Operation Theater
Fully Equipped 0 13 13 72.2
Partially Equipped 1 4 5 27.8
Identification and referral for danger signs 1 17 18 100
Pregnancy testing/ Antenatal care/ Intranasal
care 1 17 18 100
Postnatal care–24–48 hours stay post–delivery 1 17 18 100
Post-partum contraceptive counseling 1 17 18 100
Assisted vaginal deliveries 0 14 14 77.8
Management of complications 1 17 18 100
Episiotomy and suturing 1 17 18 100
Stabilization of obstetric emergencies 1 17 18 100
Antenatal steroids for preterm labor 1 16 17 94.4
HIV screening 1 17 18 100
Comprehensive abortion care 1 16 17 94.4
Case management of RTI/STI 1 17 18 100
Antibiotics for preterm or PROM for
prevention of sepsis of newborns 1 17 18 100
Comprehensive management of all obstetric
emergencies, eg, PIH/eclampsia, sepsis, PPH,
retained placenta, shock, obstructed labor,
severe anemia
1 17 18 100
CEmONC Services
Treatment of moderate and severe anemia in
pregnancy 1 17 18 100
Treatment of bleeding in antenatal period and
postpartum 1 17 18 100

100 | P a g e
Community
Health Centre
(CHC N=1)
District
Hospital
(DH N=17)
All
(N=18)
N N N %
Treatment of hypertensive disorders in
pregnancy 1 17 18 100
Treatment of sepsis 1 17 18 100
Treatment of abortions 1 16 17 94.4
Use vacuum extraction of vaginal deliveries 0 9 9 50
Managing vaginal tears 1 17 18 100
Perform manual vacuum aspiration for the
management of incomplete abortion 1 15 16 88.9
Removal of retained placenta ( associated with
bleeding) 1 17 18 100
Management of neonatal sepsis including with
Injectable antibiotic 1 16 17 94.4
Management of sick and low birth weight
newborn- including management of
birth asphyxia, sepsis and low birth weight
1 14 15 83.3
Caesarean Section Skills
24x7 functional OT with facility for C Section 1 11 12 66.7
Blood bank/ blood storage unit 0 11 11 61.1
New Born Care Corner
Essential newborn care including resuscitation 1 17 18 100
Zero day immunization (OPV, BCG, Hep B; as
per GoI schedule), Inj. Vit. K 1 16 17 94.4
Breastfeeding/feeding support 1 17 18 100
Immediate newborn care – drying, warming,
skin to skin contact 1 17 18 100
Initiation of Breastfeeding 1 17 18 100
Identification and Management of LBW infants
>/=1800 g with no other complications 1 16 17 94.4
Phototherapy for newborns with
hyperbilirubinemia 1 17 18 100
Management of newborn sepsis 1 17 18 100
Stabilization and referral of sick newborns and
those with very low birth weight 1 17 18 100
Sick New Born Care Unit
Functional 1 17 18 100
Fully Equipped 0 15 15 83.3
Partially Equipped 1 2 3 16.7
Neonatal Stabilization Unit
Radiant warmer with trolley/drawers 0 15 15 83.3

101 | P a g e
Glimpses from field

102 | P a g e
Annexure 1: Components considered for Calculating Composite
Index
Infrastructure
Premises with
1. Sign board with facility name (visible from a distance)
2. Board (indicating routine functioning hours)
3. Direction boards leading to the facility
4. Boundary wall with a gate
5. Neat and clean outer surroundings
6. Emergency phone no. of vehicle drivers/call centre for transport
7. Adequate lighting
8. Controlled entry and exit
9. Approach road within facility is paved with interlocking blocks
10. Garden
11. Covered drainage
12. Leveled ground without water logging
13. Parking space for vehicles of staff and clients
14. Exclusive slots for parking of ambulances/referral transport
15. Driver's room
16. Covered porch where the ambulance can deboard the patient
17. Wheel-chair and patient stretcher are available at the entrance of the facility
18. Entrance has a ramp for easy movement of wheel-chair/ stretcher
19. Complaint box /suggestion box kept
Waiting area
1. Available
2. With seating arrangement for clients and attendants (as per client load)
3. Display of doctors' names with days and duty rosters
4. Covered space
5. Water cooler and drinking water
6. Display of Citizen Charter
7. Display of IEC and EDL
8. Display of staff on duty with timing
9. Signage to various departments
10. Room numbers displayed clearly
11. Separate Functional toilets for male and female clients
Outdoor Patient Department
1. Seating arrangement for staff and patient
2. Examining facility (examination table with foam mattress, Sheet and pillow, screen/curtains for
privacy)
3. Display of technical protocols
4. Privacy for clients
5. Antenatal/postnatal clinic having privacy
6. Examination table with foot step
7. Hand washing facility
8. Display of resuscitation and protocols
9. Duty roster of staff with timings

103 | P a g e
Ambulance
1. Availability of ambulance
2. If available is the ambulance equipped?
Functional fire extinguisher
1. Functional fire extinguisher
Electric supply
1. Does this facility have electricity from the grid/ power lines?
2. Does this facility have an inverter/ generator?
Water supply
1. What is the source of water supply?
2. Does this facility have water storage tanks?
3. Is the water storage tank covered completely with cover (tank completely closed)?
4. Is the source of water supply used for drinking made safe?
5. Laundry service available in facility.
Staff Quarters
1. Staff quarters available in the facility?
2. Number of staff quarters available
Toilet facility
Emergency Room 1. Assured referral after basic management
2. Designated room with emergency drug tray
3. Oxygen
4. Suction facility
5. Adult and neonatal resuscitation equipment
6. Consumables and disposables
7. Display of resuscitation protocols
8. Display of duty staff with timings
Training Status of Human Resources Trained MO
1. Contraceptive update
2. HBNC
3. IMEP
4. Immunization
5. IMNCI
6. FIMNCI
7. IUCD insertion
8. NSSK
9. RTI/STI
10. SBA
11. ANC refresher
12. LSAS (Life Saving Anaesthesia Skills)
13. Bio medical waste management
Trained ANM
1. Contraceptive update
2. HBNC
104 | P a g e
3. IMEP
4. Immunization
5. IMNCI
6. FIMNCI
7. IUCD insertion
8. NSSK
9. RTI/STI
10. SBA
11. ANC refresher
12. LSAS(Life Saving Anaesthesia Skills)
13. Bio medical waste management
IEC material 1. Hand Washing
2. Infection Control
3. Bleach Preparation
4. Instrument Gloves Cleaning
5. Abdominal Examination
6. Simplified Partograph
7. Kangaroo Care
8. APH Less than 20 week
9. APH More than 20 week
10. Eclampsia
11. PPH Management
12. Active Management of Third Stage Labour (AMTSL)
13. Neonatal Resuscitation
14. Breast Feeding
15. ANC Checkup
16. PNC Check up
17. Labor Room Sterilization
18. Management of Anemia DuringLabour
19. Post Partum Hemorrhage
20. Prolonged Labour
21. Puerperial Sepsis
22. Anemia in Pregnancy
23. APH Management
Obstetric Care
ANC/PNC Ward
1. No. of beds
2. Privacy
3. Foetoscope
4. Foetal Doptone
5. Newborn thermometer
6. Weighing scale (adult)
7. BP apparatus
8. Disposable sterile syringe and needles
9. Hub cutter
10. Puncture proof box
11. Consumables (cotton, gloves)
12. Wall clock
13. Hot cooked diet is provided to all admitted clients

105 | P a g e
Labour Room
Labour Room
1. As per the number of delivery tables envisaged (required atleast 10 X 10 ft space)
2. Windows with smoked glass
3. Well lighted
4. Draught free environment
5. Interior tiling of walls and floor
6. Stepping stool for every labor table
7. Light for conducting deliveries
8. Changing area and buffer zone
9. Utility room attached hand washing area
10. Toilet (running water and functional)
11. Air conditioning
Equipment for labour room
1. BP apparatus and stethoscope in working order
2. Weighing machine (adult)
3. Weighing machine (baby)
4. Inch tape
5. Thermometer (oral and rectal)
6. Partograph Charts
7. Instrument tray with cover (310 x 195 x 63 mm)
8. Kidney trays (1 big and 1 small)
9. Dressing drum
10. Cheatle forceps
11. Cord cutting scissor (Umbilicus – Blunt)
12. Artery forceps
13. Surgical scissors, cord-cutting scissors
14. Sponge holder
15. Foetoscope
16. Intravenous stand
17. Hypochlorite solution
18. Disposable syringes and needles (10 cc, 5 cc and 2 cc)
19. Foley urethral catheter
20. Intravenous set
21. Sponge holding forceps
22. Delivery kits, including those for normal delivery and assisted deliveries (forceps delivery/vacuum
delivery, surgical kit)
23. Delivery kit for HIV positive women
24. Plastic tubs for 0.5% Chlorine solution%
25. Wheel chair/patient's trolley
26. 7 Trays: (Delivery tray, Episiotomy tray, Medicine tray, Emergency drug tray, Baby tray, MVA tray,
PPIUCD tray)
27. Shadow less lamp
28. Mosquito Repellent
Pelvic Examination
1. Sim's/Cusco's vaginal speculum
2. Anterior vaginal wall retractor
3. Sterile gloves
4. Sterilised cotton swabs and swab sticks in a jar with lid
5. Kidney tray for keeping used instruments
6. Bowl for antiseptic solution

106 | P a g e
7. Steel tray with lid to keep sterile/HLD instruments for use
8. Antiseptic solution: Chlorhexidine 1% or Cetrimide 2% (if povidone iodine solution is available, it is
preferable to use that)
9. Cheatle forceps with a dry bottle to hold it
10. Inj. Vitamin K. K
Supplies required for MVA
1. Speculum (small, medium, large)
2. Anterior vaginal wall retractor
3. Sponge holding forceps
4. Volsellum (small toothed)/Allis long forceps
5. MVA syringe and cannulae of sizes 4-8 (two sets; one for back up in case of technical problems)
6. Sterile gloves
7. Steel tray with lid to keep sterile instruments for use
8. Strainer for tissues
9. Sterilised cotton swab
10. Sterile kidney trays (for keeping instruments in case of re-use and for sterile saline or sterile water for
flushing in case of blocked cannula)
11. Kidney tray for emptying contents of syringe
12. Bowl for antiseptic solution for soaking cotton swabs
13. Basin with antiseptic solution for washing gloved hand
14. Tray containing chlorine solution for keeping soiled instruments
15. Cheatle forceps with a dry bottle to hold it
16. Proper light source/functional torch
17. Syringe for local anaesthesia (10 ml) and Sterile Needle (22-24 gauge) mlgauge
18. Local anaesthetic agent (Inj. 1% Lignocaine, for giving para cervical block)
19. Sterile saline/sterile water for flushing cannula in case of blockage
Operation Theater
Minor OT
1. Stainless steel top adequately wide table
2. Foot rest
3. Shadow less lamp
4. Air conditioning
5. Floor and wall tiling
6. Slab with granite top
7. Hand washing area with elbow operated handle
8. Cupboard
9. Colour coded bins
10. Tub for 0.5% chlorine solution
11. Drug and dressing tray
Equipment FOR OT
1. Diathermy machine
2. Dressing drum all sizes
3. Lamps shadowless: Ceiling lamp, Portable type Steriliser
4. Suction Apparatus
5. Stand with wheel for single basin
6. Table operation, hydraulic: Major, Minor
7. Trolley for patients
8. Trolley for instruments
9. X-ray view box
10. Wheel chairs

107 | P a g e
Anesthesia Equipment for OT
1. Boyle’s type Anaesthesia Machine made of stainless steel body with antistatic wheel and facility to
lock
2. Two A type cylinders for oxygen and nitrous oxide with pressure reducing valve
3. Pressure gauge to monitor the pressure of gases in cylinders
4. Rota meter with bob in for accurately calculating the flow of gases.
5. Two vaporizers One for Isoflurane and one Fluotech Mark 4 for Halothane
6. Soda-lime canister with circle absorber with closed circuit tubings
7. Breathing circuit: Magill and Bains two sets of each
8. Proper guarantee with spare part coverage
9. Pulse Oximeter
10. Laryngeal Mask Airway -Size 3.0 & 4.0: multiple usage (autoclavable) and 4 and 2 disposable for
doing infective cases (2 of each size)
11. Pro-seal Laryngeal Mask Airway (autoclavable) (Size 3 & 4 2 each)
12. Ambu Bag (Self-inflating bellows-silicon) with Ruben valve, Face mask (anatomical) & oxygen
reservoir bag Adult (2)
13. Suction Machine: Electrical operated, heavy duty with 2 bottles of 5 liters capacity (each 1)
14. Suction Machine: Foot operated (1)
15. Needle, Spinal, (disposable), Size 22G, 24G and 25G. (Pencil tipped with introducer) (1 each/day)
16. I/V Cannulae –16G, 18G, 20G, 22G & 24 for neonates (1 each/day)
17. I/V Set plain and blood transfusion set (1 each/day)
18. Anatomical Face Mask (Sizes: 2, 3, 4 1 each)
19. Guedal’s Airway (Sizes: 2, 3, 4 1 each)
20. Suction Catheter (Sizes FG. 6,8,10,12,14,16,18 1 each/day)
21. Urinary Catheter (1/day)
22. Stylet for Endotracheal Intubation (1)
23. Laryngoscopes Macintosh curved blade for Adult, Medium, extra-large & straight blade for neonates
with spare bulbs and batteries (2)
24. Endotracheal Tubes, internal diameter of (2.5, 3.0, 6.0, 6.5, 7.0, 7.5, 8.0, 8.5 mm)
25. Magill Forceps Adult and pediatric
OT Surgical Instruments for CEmONC Services Standard quantity for one patient
1. A. Cesarean Set (a minimum of at least 2 sets would be needed) 2 Sets
2. Instrument Tray with cover – Stainless Steel 31 x 19.5 x 6.5cm 1
3. Towel Clips (Backhaus) 13cm 6 13cm 6
4. Sponge Holding Forceps (Forester; Straight; serrated) 25cm 4
5. Artery Forceps Straight – CRILE (Small) 14cm 6
6. Halstead Mosquito Forceps 12.5cms (3 straight, 3 curved) 6
7. Tissue Forceps 21cm non-toothed 4 21cm
8. Needle Holder (Mayo – Hegar) Straight 2
9. Surgical Knife Handle (One each of no. 3 and No. 4. No. 3 for blade sizes 10,11,12& 15 and No. 4
for blade sizes 20, 21, 22, 23
10. 2 Packet Triangular Point Suture Needles 7.3 cms; size 6 1
11. Packet Round Bodied Needles No. 12; size 6 1
12. Catgut No. 1-0 (plain) 1 foil No. 1-0 1 foil
13. Polyglycolic suture (egVicryl) 1-0 2 foils
14. Polydioxone (PDS) 1-0 1 foil (PDS) 1-0 1 foil
15. Nylon 1-0 1 1-0 1
16. Retractors- Doyens (big and small) 1 each
17. Operating Scissors, Curved, blunt Pointed, Mayo, 17cm 1
18. Operating Scissors, Straight, Blunt Pointed, Mayo, 17cm 1
19. Scissors Straight MAYO Blunt/blunt pointed 23cm 1
20. Suction Nozzle (small, medium, long) 3 (small, medium, long) 3
21. Suction Tube (Yankauer) 23cm long, 23 French Gauze (8mm dia) removable tip and tubing connector
(small, medium, long) 3

108 | P a g e
22. Intestinal Clamps, Curved, Dry Pattern 23cm 1
23. Intestinal Clamps, Straight, Dry Pattern 23cm 1
24. Dressing forceps (Tissue) 18cm – one each of toothed (1x2 teeth) and non - toothed 2 sets
25. Dressing forceps (Tissue) 25cm – one each of toothed (1x2 teeth) 1 set
26. ALLIS forceps 20cm, 4x5 teeth, multiple ratchets used to grip arteries and digestive tissues 4
27. BABCOCK forceps 20cm, multiple ratchets used to grip arteries and digestive tissues 2
28. Uterine Haemostatic forceps (Green Armitage) 21cm 4
Hysterectomy Set - 1 set
1. A. Cesarean Set (a minimum of at least 2 sets would be needed) 2 Sets
2. Instrument Tray with cover – Stainless Steel 31 x 19.5 x 6.5cm 1
3. Towel Clips (Backhaus) 13cm 6
4. Sponge Holding Forceps (Forester; Straight; serrated) 25cm 4
5. Artery Forceps Straight – CRILE (Small) 14cm 6
6. Halstead Mosquito Forceps 12.5cms (3 straight, 3 curved) 6
7. Tissue Forceps 21cm non-toothed 4
8. Needle Holder (Mayo – Hegar) Straight 2
9. Surgical Knife Handle (One each of no. 3 and No. 4. No. 3 for blade sizes 10,11,12& 15 and No. 4 for
blade sizes 20, 21, 22, 23
10. 2 Packet Triangular Point Suture Needles 7.3 cms; size 6 1
11. Packet Round Bodied Needles No. 12; size 6 1
12. Catgut No. 1-0 (plain) 1 foil
13. Polyglycolic suture (egVicryl) 1-0 2 foils
14. Polydioxone (PDS) 1-0 1 foil
15. Nylon 1-0 1
16. Retractors- Doyens (big and small) 1 each
17. Operating Scissors, Curved, blunt Pointed, Mayo, 17cm 1
18. Operating Scissors, Straight, Blunt Pointed, Mayo, 17cm 1
19. Scissors Straight MAYO Blunt/blunt pointed 23cm 1
20. Suction Nozzle (small, medium, long) 3
21. Suction Tube (Yankauer) 23cm long, French Gauze (8mm dia) removable tip and tubing connector-1
22. Intestinal Clamps, Curved, Dry Pattern 23cm 1
23. Intestinal Clamps, Straight, Dry Pattern 23cm 1
24. Dressing forceps (Tissue) 18cm – one each of toothed (1x2 teeth) and non - toothed 2 sets
25. Dressing forceps (Tissue) 25cm – one each of toothed (1x2 teeth) 1 set
26. ALLIS forceps 20cm, 4x5 teeth, multiple ratchets used to grip arteries and digestive tissues 4
27. BABCOCK forceps 20cm, multiple ratchets used to grip arteries and digestive tissues 2
28. Uterine Haemostatic forceps (Green Armitage) 21cm 4
29. Hysterectomy Forceps curved
30. Right angle retractor – 1
31. Devers retractor -2
Emergency Drugs (including neonates) for OT Standard quantity for one patient
1. Nefidipine (tablet and capsules both) (5, 10mg) 5 tabs and capsules each
2. Inj Labetalol 5 ampoules
3. Inj Calcium Gluconate 10ml X 2 ampoules
4. Inj Magnesium sulphate 0.5 gm X 10 ampoules
5. Inj Oxytocin 10 Ampoules
6. Inj Dextrose (25%) 2 ampoules
7. Inj Dextrose (10%) (2ml/kg)-neonates 2 ampoules
8. Inj Adrenaline 1:10,000 sol (for neonates (0.01-0.03mg/kg) 2 ampoules
9. Inj Naloxone 0.4mg/ml ( for neonates (0.1-0.2 mg/kg) 1 ampoule
10. Inj Adrenaline 2 ampoules
11. InjAminophyline 2 ampoules
12. Inj Atropine sulphate 4 ampoules

109 | P a g e
13. InjChloropheniramine 2 ampoules
14. Inj Diazepam 5mg/ml 2 ampoules
15. InjMephentermine (inj) 1 vial
Emergency Drugs (including neonates) for OT Standard quantity for one patient
1. Inj Ephedrine 2 ampoules
2. Inj Oxytocin 10 units/ml 1ml/ampo 2 ampoules
3. InjErgometrine maleate 2 ampoules
4. Misoprostol 3 tablets
5. Inj Furosemide 1 ampoules
6. Inj Hydrocortisone 100mg/ml 100ml 2 vial
7. Inj Dexamethasone 2 ampoules
8. InjPentazocine 2 ampoule
9. Inj Diclofenac 4 ampoule
10. Halothane 20-50ml
11. Isoflurane 20-50ml
12. Inj Lignocaine hydrochloride, 2ml ampoule, 5% heavy 1 ampoule
13. Inj Lignocaine hydrochloride, 2ml ampoule, 2% 30ml vial 1
14. Inj Bupivacaine hydrochloride 0.5% 20ml vial 1 vial
15. Inj Bupivacaine hydrochloride 0.5% heavy for spinal 4ml ampoule 1 ampoules
16. InjSuxamethonium hydrochloride 1 vial for 5 patients
17. InjAtracurium 2 ampoules
18. InjVecuronium bromide 4mg/amp 2 ampoules
19. Inj Neostigmine Methyl sulphate 0.5mg/ml 1ml/amp 5 ampoules
20. InjThiopentone sodium 1 vial for 3 patients
21. InjPropofol 2 ampoules
22. Inj Ketamine 50mg/ml 1 vial
23. Inj Dopamine 2 ampoules
24. Inj Normal saline 10 ml x 2 ampoules
25. Inj Promethazine hydrochloride 25mg/ml, 2ml/ampoule 1 ampoule
26. Inj Ampicillin sodium 250mg/ml 5ml/vial 2 vials
27. Inj Gentamycin sulphate 40mg/ml, 2ml/vial/amp 2 ampoules
28. InjCloxacillin sodium 250mg/vial 8 vials
29. Inj Metronidazole 5mg/ml 100ml/bottle 4 bottles
30. Salbutamol Inhaler 1
31. Inj Insulin 40 units/ml, 10ml vial 1 vial
Infection Prevention Equipment & Supplies for OT
1. Autoclave (horizontal) with electricity or heat source
2. Autoclave drum
3. Autoclave tape
4. Boiler with heat source or electricity
24x7 functional OT with facility for C-section
Blood Bank/Blood Storage Unit
Basic Maternal and Health Care provided Basic Functions
1. Normal delivery
2. Referral in case of complicating delivery requiring CEmOC
3. New born care
4. Care of the sick newborn referral after stabilization
5. Management or referral of HIV positive mother and newborn

110 | P a g e
Type of maternal and health services provided at facility
1. Identification and referral for danger signs
2. Pregnancy testing
3. Antenatal care
4. Intra natal care
5. Postnatal care (24–48 hours stay post–delivery)
6. Immediate newborn care (drying, warming, skin to skin contact)
7. Initiation of Breastfeeding
8. Post-partum contraceptive counseling
9. Assisted vaginal deliveries
10. Management of complications
11. Episiotomy and suturing
12. Stabilization of obstetric emergencies
13. Antenatal steroids for preterm labour
14. HIV screening
15. 48 hours stay post delivery
16. Comprehensive abortion care
17. Case management of RTI/STI
18. Antibiotics for preterm or PROM for prevention of sepsis of newborns
Core Competencies
Core Competencies of Skilled Birth Attendants
1. Treatment of moderate and severe anaemia in pregnancy
2. Treatment of bleeding in the antenatal period and post-partum
3. Treatment of hypertensive disorders in pregnancy
4. Treatment of sepsis
5. Treatment of abortions
6. Use vacuum extraction in vaginal deliveries
7. Managing vaginal tears
8. Perform manual vacuum aspiration for the management of incomplete abortion
9. Removal of retained placenta (associated with bleeding)
10. Management of the sick and low birth weight newborn – including management of birth asphyxia,
sepsis and low birth weight
11. Management of neonatal sepsis including with injectable antibiotics
Core Competencies of Skilled Birth Attendants Providing Care at CEmONC
1. Facility provides skilled attendance by specialists
2. Managing and providing 24 hour comprehensive care for major pregnancy related complications in
mother and newborn
3. Provide safe surgery and blood transfusion
4. Facility has an obstetrician/or a non-specialist MBBS doctor who has received Emergency Obstetric
Care (EmOC) training
5. An anaesthetist or an MBBS doctor who has received training in Life Saving Anaesthesia (LSAS)
skills
6. A paediatrician or an MO trained in newborn care for the “Stabilisation Unit” to provide higher level
of newborn care skills
Skilled birth attendants would have the following additional skills to manage and provide comprehensive
care for all major life threatening complications in the mother and the newborn
1. Diagnose maternal emergencies
2. Provide appropriate medical and surgical treatment to maternal emergencies
3. Perform assisted vaginal delivery
4. Manual removal of retained placenta

111 | P a g e
5. Caesarean Section
Provide initial care and stabilisation of sick newborns not requiring intensive care, support mothers to
breastfeed and provide breastfeeding support, referral services.
Cross match blood and provide
New Born Care
New born corner
1. Resuscitation
2. Zero day immunization (as per GoI schedule), Inj.Vit. K
3. Breastfeeding/feeding support, advice
4. Identification and management of LBW infants (>/=1800 g)
5. Phototherapy for newborns with hyperbilirubinemia
6. Management of newborn sepsis
7. Stabilization and referral of sick newborns and those with very low birth weight
Neonatal Stabilization Unit
1. Open care system: radiant warmer with trolley, drawers, oxygen bottles
2. Resuscitator, hand operated, neonate
3. Weighing scale
4. Pump suction, foot operated
5. IV cannula 24,26G
6. Light examination, mobile 220-12V
7. Extractor mucus, 20ml, sterile, disposable, Dee Lee
8. Towels for drying wrapping baby
9. Tube, feeding
10. Oxygen cylinder
11. Sterile gloves
12. Open care system: radiant warmer with trolley, drawers, oxygen bottles
13. Resuscitator, hand operated, neonate
14. Weighing scale
15. Pump suction, foot operated
Sick Newborn Care Unit
Furniture and General Equipment
1. Electronic weighing scale
2. Infantometer
3. Emergency drugs trolley
4. Procedure trolley
5. Refrigerator
6. Spot lamp
7. Portable x-ray machine x-ray
8. Basic surgical instruments
9. Nebulizer
10. Multi-channel monitor with noninvasive
11. BP monitor
12. Room Thermometer
13. Generator (15 KVA) (15 KVA)
Equipment and Supplies for Individual Patient Care Equipment
1. Servo-controlled Radiant Warmer
2. Low-Reading Digital Thermometer (centigrade scale)
3. Neonatal Stethoscope
4. Neonatal Resuscitation Kit (oxygen reservoir, masks, Neonatal laryngoscope)

112 | P a g e
5. Suction Machine
6. Non stretchable measuring tape
7. Infusion pump or syringe pump
8. Pulse Oxymeter
9. Double Outlet Oxygen Concentrator
10. Double Sided Blue Light
11. Phototherapy
12. Flux meter
13. CFL Phototherapy
14. Horizontal Laminar Flow
15. Window AC (1.5)/Split AC (1.5)
16. Central AC
Supplies
1. Cord clamp
2. Dee Lee’s Mucus Trap
3. Neofl on (intravenous catheter)
4. Micro drip set with & without burette
5. Blood Transfusion Set
6. 3 way stop cock
7. Suction Catheters
8. Endotracheal Tubes
9. Feeding Tubes
10. Chemical disinfectants
11. Glucostix and multistix strips (in container)
12. Capillary Tubes for microhaematocrit (in containers)
13. Normal saline, 10% Dextrose infusion bottle
Emergency Drugs
1. Adrenaline (1:10000) (inj)
2. Naloxone (inj)
3. Sodium Bicarbonate (inj)
4. Aminophylline (inj)
5. Phenobarbitone (inj)
6. Hydrocortisone (inj)
7. 5%,10%, 25% Dextrose
8. Normal saline
9. Ampicillin with Cloxacillin (inj)
10. Ampicillin (inj)
11. Cefotaxime (inj)
12. Gentamycin (inj)
Equipment for Disinfection of Sick Newborn Care Unit
1. Electric heater/boiler
2. Washing machine with dryer (separate)
3. Electronic fumigator
4. Vacuum Cleaner
5. Vertical Autoclave
6. Autoclave drums (large, medium & small sizes)
7. Disinfectant Sprayer
8. Container for liquid disinfectant
9. Formalin Vaporizer
10. Hot Air Oven
11. Ethylene oxide (ETO) Sterilizer

113 | P a g e
Clinical Laboratory
Logistics at Laboratory
1. Haemoglobinometer (Sahilis kit) with reagents and lancet
2. Strips for testing urine albumin and sugar
3. Reagents such as sulphuric acid, acetic acid, Benedict solution.
4. Specimen collection bottle (in case testing strips are not available)
5. Test-tubes
6. Holder
7. Test-tube stand
8. Match box
9. Spirit
10. Lamp
11. RDK for malaria testing
12. Trained laboratory technicians
13. Lab operational during OPD hours
14. Emergency lab facility available after routine working hours
15. Lab should have marble/stone top platform and wash basin with running water supply
16. Semi Auto analyzer
17. Lab Register
Laboratory test conduct
1. Hb
2. Urine for albumin & sugar
3. RDK for malaria
4. Urine for pregnancy test
5. CBC
6. Semen analysis
7. Blood grouping
8. Bleeding time, clotting time
9. Routine and microscopic examination of stool
10. Sputum for TB
11. P/S for MP
12. HIV screening
13. Hepatitis B/Australian Antigen
14. Blood grouping and RH typing, wet mount, RPR/VDRL, serum bilirubin for sick newborns
Drugs
Pharmacy and Stock
1. ORS IP
2. IFA tablets-large (blue color)
3. Folic acid tablets IP
4. IFA tablets-small (red color)
5. Trimethoprim and sulphamethoxazole tablets IP (paediatric)
6. Methylrosanilinium chloride BP (gentian violet crystals)
7. Zinc sulphate dispersible tablets USP
8. IFA syrup (as per standards provided)
9. Water-miscible vitamin concentrate IP (Vitamin A syrup)
10. Methylergometrine tablets IP
11. Misoprostol tablets
12. Oxytocin injection
13. Paracetamol tablets
14. Methylergometrine injection
15. Albendazole tablets
16. Dicyclomine tablets

114 | P a g e
17. Chloramphenicol eye ointment
18. Povidone iodine ointment
19. Cotton bandage
20. Absorbent cotton
21. Intravenous fluids (Ringer lactate)
22. Gentamicin injection
23. Magnesium sulphate inj.50% %
24. Oxytocin injection
25. Paracetamol tablets
26. Ampicillin capsules
27. Metronidazole tablet
28. ORS
Bio Medical Waste Management 1. Does the facility have authorization with Madhya Pradesh Pollution Control Board (MPPCB)?
2. Does the facility have Common Bio Medical Waste Treatment facility (CBWTF) agreement?
3. Deep burials
4. Sharp pits
5. Hub-cutter
6. Puncture proof boxes for needle disposal
7. Bio-medical waste pits are constructed (away from the water source)
8. Colored waste bins
9. Coloured waste bags
10. Plastic/sharp waste is disinfected before disposal
11. Personal protective equipment(PPE) (mask, gloves, caps, aprons)
12. Has the staff been immunized for infections?

115 | P a g e
Annexure – 2: Definition
Definition:
1. BEmOC Services
1. Administer parental antibiotics
2. Administer uterotonic drugs (i.e. parental oxytocin)
3. Administer parental anticonvulsants for pre-eclampsia and eclampsia (i.e. Magnesium sulphate)
4. Manual Removal of placenta
5. Remove retained products (eg. Manual vacuum extraction, dilatation and curettage)
6. Perform assisted vaginal delivery (eg. vacuum extraction, forceps delivery)
7. Performs basic neonatal resuscitation (e.g. with bag and mask)
Perform signal functions 1-7 (BEmOC Services), plus:
8. Perform surgery (e.g, Caesarean section)
9. Perform blood transfusion
A BEmOC facility is the one in which all functions 1-7 are performed.
A CEmOC facility is one in which all functions 1-9 are performed.
(Maternal and New Born Health Toolkit)
2. L1, L2 and L3 facilities
Level 3 – (Comprehensive Level-FRU): All FRU-CHC/SDH/DH/area hospitals/referral hospitals/tertiary
hospitals where complications are managed including C-section and blood transfusion. Such an FRU would
be equipped also with a Newborn Stabilization Unit (NBSU) at CHC/SDH/others or Special Newborn Care
Unit (SNCU) at DH and above. A District Hospital irrespective of caseload has to be a Level 3 institution.
Level 2 – (Basic Level): All 24 x 7 facilities (PHC/Non-FRU CHC/others)providing BEmOC services;
conducting deliveries and management of medical complications not requiring surgery or blood transfusion
and have either a NBCC or NBSU.
Level 1 – All sub-centres and some PHCs which have not yet reached the next level of 24 x 7 PHC,
deliveries are conducted by a skilled-birth attendant (SBA). An NBCC must be established in all such
facilities.
(Maternal and New Born Health Toolkit)
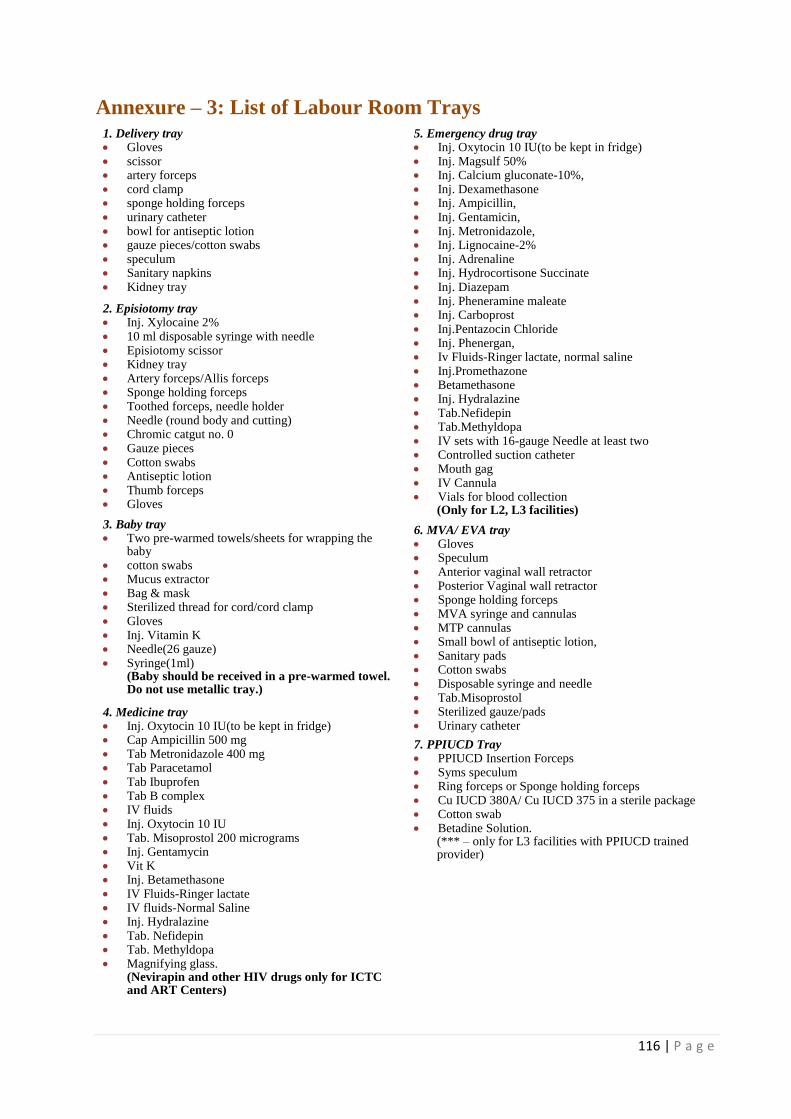
116 | P a g e
Annexure – 3: List of Labour Room Trays
1. Delivery tray Gloves scissor artery forceps cord clamp sponge holding forceps urinary catheter bowl for antiseptic lotion gauze pieces/cotton swabs speculum Sanitary napkins Kidney tray
2. Episiotomy tray Inj. Xylocaine 2% 10 ml disposable syringe with needle Episiotomy scissor Kidney tray Artery forceps/Allis forceps Sponge holding forceps Toothed forceps, needle holder Needle (round body and cutting) Chromic catgut no. 0 Gauze pieces Cotton swabs Antiseptic lotion Thumb forceps Gloves
3. Baby tray Two pre-warmed towels/sheets for wrapping the
baby cotton swabs Mucus extractor Bag & mask Sterilized thread for cord/cord clamp Gloves Inj. Vitamin K Needle(26 gauze) Syringe(1ml)
(Baby should be received in a pre-warmed towel. Do not use metallic tray.)
4. Medicine tray Inj. Oxytocin 10 IU(to be kept in fridge) Cap Ampicillin 500 mg Tab Metronidazole 400 mg Tab Paracetamol Tab Ibuprofen Tab B complex IV fluids Inj. Oxytocin 10 IU Tab. Misoprostol 200 micrograms Inj. Gentamycin Vit K Inj. Betamethasone IV Fluids-Ringer lactate IV fluids-Normal Saline Inj. Hydralazine Tab. Nefidepin Tab. Methyldopa Magnifying glass.
(Nevirapin and other HIV drugs only for ICTC and ART Centers)
5. Emergency drug tray Inj. Oxytocin 10 IU(to be kept in fridge) Inj. Magsulf 50% Inj. Calcium gluconate-10%, Inj. Dexamethasone Inj. Ampicillin, Inj. Gentamicin, Inj. Metronidazole, Inj. Lignocaine-2% Inj. Adrenaline Inj. Hydrocortisone Succinate Inj. Diazepam Inj. Pheneramine maleate Inj. Carboprost Inj.Pentazocin Chloride Inj. Phenergan, Iv Fluids-Ringer lactate, normal saline Inj.Promethazone Betamethasone Inj. Hydralazine Tab.Nefidepin Tab.Methyldopa IV sets with 16-gauge Needle at least two Controlled suction catheter Mouth gag IV Cannula Vials for blood collection
(Only for L2, L3 facilities)
6. MVA/ EVA tray Gloves Speculum Anterior vaginal wall retractor Posterior Vaginal wall retractor Sponge holding forceps MVA syringe and cannulas MTP cannulas Small bowl of antiseptic lotion, Sanitary pads Cotton swabs Disposable syringe and needle Tab.Misoprostol Sterilized gauze/pads Urinary catheter
7. PPIUCD Tray PPIUCD Insertion Forceps Syms speculum Ring forceps or Sponge holding forceps Cu IUCD 380A/ Cu IUCD 375 in a sterile package Cotton swab Betadine Solution.
(*** – only for L3 facilities with PPIUCD trained provider)

117 | P a g e
References
A framework for evaluation of Quality of Care in maternity services, University of Southampton, 2000
Assessors Guidebook for Quality Assurance in District Hospitals 2013, Ministry of Health and Family
Welfare, Government of India.
Fundamental Elements of Quality of Care, A Simple Framework: Judith Bruce Studies in Family
Planning, Vol 21, No.2 ( March –April 1990) pp 61-91, Population Council.
Guidelines for in service training in Basic and Comprehensive Emergency Obstetric and Newborn
Care, Jhpiego, USA, 2012
Maternal and Newborn Health Toolkit, To provide quality maternal and new born health services at
health care facilities in India, Maternal Health Division, Ministry of Health and Family Welfare,
Government of India, January 2013.
NATIONAL RURAL HEALTH MISSION, Meeting people’s health needs in rural areas, Programme
Implementation Plan 2006-2012, State Health Mission, Department of Health & Family Welfare,
Government of Madhya Pradesh. Bhopal
National Rural Health Mission, Reproductive and Child Health Programme Phase II, 8th Joint Review
Mission, July- September, 2011, Ministry of Health and Family Welfare, Government of India
Operational guidelines for Maternal and Newborn Health Care
Operational guidelines for quality assurance in public health facilities, Ministry of Health and Family
Welfare, GoI- 2013
Special bulletin on maternal mortality in India 2010-12, Sample registration system, Office of registrar
general, India, 2013
Taking emergency Obstetrics and New Born Care to Rural India, A Programme of Obstetrics and
Gynecological Society of India and Government of India, Jhpiego , MacArthur