sadc sub regional transport & trade - African Development Bank
Upload
khangminh22Category
view
2download
0
ISSN No.: 2664-5556

SPONSORS

SADC ICPRSD 2018 i
Edited By:
Prof George O Anderson
Dr Ditiro B. Moalafhi
Dr Sajid M. Sheikh
Dr Ibo M. Ngebani
Prof Jerekias Gandure
Prof Joyce T. Mathangwane
First Published in Gaborone, Botswana by the University of Botswana
All rights reserved. No part of this publication may be reproduced, stored, retrieved system, or transmitted, in any
form or by any means, without the written permission of the publisher, nor be otherwise circulated in any form of
binding or cover.
© Copyright 2018, University of Botswana. The individual papers remain the intellectual properties of the authors.
School of Graduate StudiesUniversity of BotswanaE-mail: [email protected]: (267) 355 2391/2839
ISSN No.: 2664-5556
Publisher:
School of Graduate Studies
University of Botswana
Postal Address: Private Bag UB 00706, Gaborone. Botswana
Physical Address: University of Botswana, Corner of Notwane and
Mobutu Rd, Gaborone. Botswana
Block 247, Graduate Studies, Room 109

HOST ORGANISATION
LOCAL ORGANISING COMMITTEE CHAIR
ORGANISING COMMITTEE
Prof.GeorgeO.Anderson,SchoolofGraduateStudies (SGS),UniversityofBotswana (UB)
–Member
�
�
�
�
�
�
�
�
�
�
�
�
�
�
�
�
�
�
EnvironmentalScienceDepartment,UB–Secretary
PublicAffairs,UB–Member
,MechanicalEngineeringDepartment,UB–Member
Electrical EngineeringDepartment,UB-Member
ElectricalEngineeringDepartmentUB -Member
AdultEducationDepartment,UB–Member
EnglishDepartment,UB–Member
PAS,UB–Member
SchoolofNursing,UB–Member
GraduateSchoolofBusiness,UB–Member
SGS,UB–Member
SGS,UB–Member
FacultyofMedicine,UB
SADC–Member
SADC–Member
RepublicofSouthAfrica–Member
NorthWestUniversity,RepublicofSouthAfrica–Member
PublicAffairs,UB-Member
Dr.D.B.Moalafhi,
Mrs.M.Reetsang,
Prof. J.Gandure
Dr. I.Ngebani,
Dr. S.M.Sheikh,
Prof.O.M.Modise,
Prof. J.Mathangwane,
Dr.D.Mandiyanike,
Dr.G.Sinombe,
Mr.A.T.Yalala,
Ms.K.Matlhoame,
Mrs.M.Baitseng,
Dr.D. Joel,
Ms.L.Mavimbela,
Ms.A.Morgan,
Prof.U.Useh,NorthWestUniversity,
Ms. M.Sichembe,
Ms.T.Muswere,
------------------------------------------------------------------------------------------------------------------------------------------------------------------------------------------------Contacts:Professor George O. AndersonProfessor of Electric Power EngineeringDean, School of Graduate Studies and Chair SADC ICPRSD LOCUniversity of BotswanaE-mail: [email protected]: (267) 355 2391/2839Mobile: (267) 71674591------------------------------------------------------------------------------------------------------------------------------------------------------------------------------------------------

Achieving sustainable development requires the human resource with the right sustainabilityknowledge and skills to respond to the challenges facing our world today. Governments, communitiesand businesses are tackling the practical challenges that come with creating a sustainable future.Innovation is a big part of overcoming these challenges, thinking differently and finding new ways toreconcile the needs of people and businesses with those of our environment. Sustainable development isnow a mainstream agenda, with implications for every area of society. These areas include industry thatensures that sustainability informs every aspect of its operations, from the environmental and socialimpacts of product design, manufacturing, logistics, and waste management, to communicating withshareholders, the workforce and consumers; governments and policy makers who create theframeworks of innovation that ensures pro-sustainability changes; and Individuals who make betterchoices about things like food sourcing and waste, energy use, transport and buying goods and services.
Academic institutions are argued to play a key role in educating future generations with the rightsustainability knowledge and skills. The SADC International Conference on Postgraduate Research forSustainable Development has been organized to provide a platform for academics, industry experts,policy makers and all other stakeholders to share and debate on issues that relate to enhancingpostgraduate research for sustainable development.
WELCOME
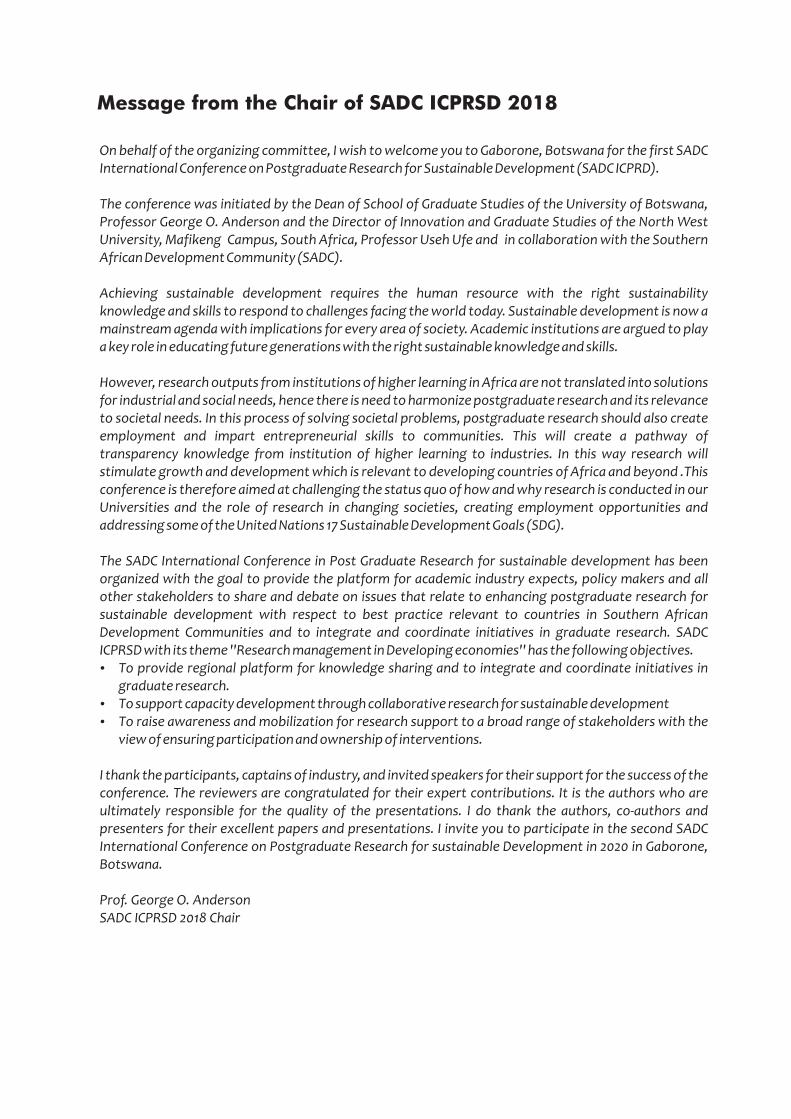
On behalf of the organizing committee, I wish to welcome you to Gaborone, Botswana for the first SADCInternational Conference on Postgraduate Research for Sustainable Development (SADC ICPRD).
The conference was initiated by the Dean of School of Graduate Studies of the University of Botswana,Professor George O. Anderson and the Director of Innovation and Graduate Studies of the North WestUniversity, Mafikeng Campus, South Africa, Professor Useh Ufe and in collaboration with the SouthernAfrican Development Community (SADC).
Achieving sustainable development requires the human resource with the right sustainabilityknowledge and skills to respond to challenges facing the world today. Sustainable development is now amainstream agenda with implications for every area of society. Academic institutions are argued to playa key role in educating future generations with the right sustainable knowledge and skills.
However, research outputs from institutions of higher learning in Africa are not translated into solutionsfor industrial and social needs, hence there is need to harmonize postgraduate research and its relevanceto societal needs. In this process of solving societal problems, postgraduate research should also createemployment and impart entrepreneurial skills to communities. This will create a pathway oftransparency knowledge from institution of higher learning to industries. In this way research willstimulate growth and development which is relevant to developing countries of Africa and beyond .Thisconference is therefore aimed at challenging the status quo of how and why research is conducted in ourUniversities and the role of research in changing societies, creating employment opportunities andaddressing some of the United Nations 17 Sustainable Development Goals (SDG).
The SADC International Conference in Post Graduate Research for sustainable development has beenorganized with the goal to provide the platform for academic industry expects, policy makers and allother stakeholders to share and debate on issues that relate to enhancing postgraduate research forsustainable development with respect to best practice relevant to countries in Southern AfricanDevelopment Communities and to integrate and coordinate initiatives in graduate research. SADCICPRSD with its theme ''Research management in Developing economies'' has the following objectives.
To provide regional platform for knowledge sharing and to integrate and coordinate initiatives ingraduate research.To support capacity development through collaborative research for sustainable developmentTo raise awareness and mobilization for research support to a broad range of stakeholders with theview of ensuring participation and ownership of interventions.
I thank the participants, captains of industry, and invited speakers for their support for the success of theconference. The reviewers are congratulated for their expert contributions. It is the authors who areultimately responsible for the quality of the presentations. I do thank the authors, co-authors andpresenters for their excellent papers and presentations. I invite you to participate in the second SADCInternational Conference on Postgraduate Research for sustainable Development in 2020 in Gaborone,Botswana.
Prof. George O. AndersonSADC ICPRSD 2018 Chair
�
�
�
Message from the Chair of SADC ICPRSD 2018
WELCOME ADDRESS
ADRESS
GUEST SPEAKER
KEYNOTE SPEAKERS
INVITED SPEAKERS
ViceChancellorof theUniversityofBotswana,
SADCExecutiveSecretary,
MinisterofTertiaryEducation,ResearchScienceandTechnology,Botswana
,BaylorCollegeofMedicine&TexasChildren'sHospital
,GeneralManager–TransmissionandDistribution
,CEOWaterUtilitiesCorporation
,
Prof. David Norris
Dr Sterbomena Tax
Hon. Ngaka Ngaka
Dr. Jeremy Slone
Mr Edward Rugoyi
Mr. Mmetla Masire
Mr. Noble Thapeli Katse, Director,
Dr. Corrado Cancedda
Business Development, Botswana Communications
Regulatory Authority
Director of the Botswana University of Pennsylvania Partnership and Strategic Advisor for
AcademicPartnershipsat theCenter forGlobalHealthof thePerelmanSchoolofMedicine, at theUniversityofPennsylvania.
Preamble
Sub-Themes of the Conference
Goal of the conference
Research is conducted to generate knowledge and this knowledge should be relevant to the needs of localcommunities and impact lives. In Southern Africa most of the research output from institutions of higherlearning such as universities is not translated into solutions for industrial and social needs. Hence there is needto harmonise postgraduate research and its relevance to societal needs. In the process of solving societalproblems, postgraduate research should also create employment and impart entrepreneurial skills tocommunities. This will create a pathway of transferring knowledge from institutions of higher learning toindustries. In this way, research will stimulate growth and development which is relevant to developingcountries of Southern Africa and beyond. This conference therefore is aimed at challenging the status quo ofhow and why research is conducted in our universities and the role of research in changing societies andcreatingemploymentandopportunities.
The goal of the conference is to provide a platform for sharing information on Post Graduate Research withregards to best practices relevant to countries in the Southern African Development Community (SADC). Thespecificobjectivesof theconferenceare:
To provide a regional platform for knowledge sharing and to integrate and co-ordinate initiatives ingraduate researchTosupportcapacitydevelopment throughcollaborative research for sustainabledevelopmentTo raise awareness andmobilisation for research support to a broad rangeof stakeholderswith the viewofensuringparticipationandownershipof interventions.
�
�
�
Health and EnvironmentScience, Engineering and Technology/ EntrepreneurshipResearch in Developing Economies
�
�
�
CONTENTS
HEALTH AND ENVIRONMENT
Integrating Geophysical Methods to Decipher hydrogeological characteristics of a Groundwaterborehole site in the University of Botswana Gaborone Campus: Critical Lessons Learnt 2Medicinal Value of Hapargohython Procumbens in Structural Remodeling of the Myocardium 19The Role of Moodle Based Surgical Skills Illustrations Using 3d Animations in UndergraduateTraining 22Weed species composition and diversity in flood recession farming in the Okavango Delta,Botswana 27A Feasibility Study on the Use of Drones for Healthcare Service Delivery in Botswana 37Soil Macrofauna Dynamics Following Repeated Soil Application of Different Quality OrganicResources Under Maize Monocropping in Zimbabwe 41Entrepreneurial Education and Entrepreneurial Intention: Does Age Matter? 56Evaluation of Antiretroviral Therapy Programme in Primary Health Care Settings in Lesotho 64Adolescents’ eating habits and anthropometric measurements: Gaborone Botswana 72An Assessment of Household Willingness to Pay for Improved Solid Waste Management Servicesin Lobatse, Botswana 79Photosynthesis Responses of Field Grown Jatropha Curas Accessions to aWide Range of SummerLeaf Temperatures 88Responses of different accessions of Jatropha curcas plants to water stress in Botswana 93Morphological Responses of Jatropha Curcas Species to Intra Season (Within the Season)Fluctuating Temperatures 103
SCIENCE, ENGINEERING AND TECHNOLOGY / ENTREPRENEURSHIP
Sustainability of Energy Access:The Case of the 20kWpMmokolodi Solar PV Plant 110Study of Damage Evolution in Compressor Turbine (CT) Blades of Short Haul Aircraft Fleet underThermo Mechanical Stresses 117Modeling Property Values Using Multiple Regression Analysis 127The Potential of Internet of Things (IoT) Implementations for Sustainable Development inDeveloping Countries 140Strategic Leadership in Zimbabwean Small and Medium Enterprises 146Cognitive Impacts Of Programme Revision In Teaching Design Sketching As A Modelling Tool ForIndustrial Design Courses At The University Of Botswana 160
Job creation through Research: A perspective of the Tourism sector in Tanzania 166
RESEARCH IN DEVELOPING COUNTRIES
Graduate Studies Supervisor – Supervisee Relationship 173Research and Innovation for Development, An Experience for Botswana – A Developing Countryin Southern Africa 179Research for Sustainable Development in Sub Saharan Africa in the 21st Century 187The Politics of Water Crises in the City of Bulawayo 196Postgraduate Candidates’ Attrition and Completion Periods in the Master of ProjectManagement Programme, University of Botswana 202Model for University Industry Partnership based on System Dynamics of University Performanceand Industry Needs: A Case Study at the University of Botswana 214Towards a Conceptual Framework for “Universities Industries Government Others”Collaboration for Sustainable Development in Industry 4.0 Revolution 223Research Implications of Sustainable Energy Development 234Employment Creation, a Spillover Effect of doing Research: An Autoethnographic Perspective 244Are the Environment Problems or Just Social Problems: Experiences of Botswana HorticulturalFarmers with Climate Change, Environment Education and Transformative Learning 250Facilitating Research through REDCap® at the University of Botswana 257Graduate Research for Sustainable Development 261

2018
Health andEnvironmentHealth and
Environment
Health andEnvironmentHealth and
Environment
1

List of Abbreviations AMT - Audio Magnetotelluric
BGI - Botswana Geoscience Institute DWA – Department of Water Affairs GPS - Global positioning system HLEM – Horizontal Loop Electromagnetic
IGRF – International Geomagnetic Reference Field
TMI - Total Magnetic intensity
UB – University of Botswana
UTM - Universal Traverse Mercator
VES – Vertical Electrical Sounding
Integrating Geophysical Methods to Decipher hydrogeological characteristics of a
Groundwater borehole site in the University of Botswana Gaborone Campus: Critical
Lessons Learnt
R. T. Ranganaia, O. Tafilaa, G. Balesengb, B. Montshiwac aDepartment of Physics, cDepartment of Geology, University of Botswana, Private Bag
UB0704, Gaborone, Botswana. bPoseidon Geophysics, P Bag X018, The Village, Gaborone, Botswana
Email: [email protected]
Abstract
The University of Botswana (UB) recently drilled three groundwater boreholes on its main campus in Gaborone as a way of increasing its supply of water following the recent drought period affecting the southern parts of the country. Of the three boreholes, only one located towards the university teaching hospital was equipped while the other two yielded below average to none, equating to a low 33% success rate. The low yield borehole was chosen as a geophysics test-site for groundwater exploration to hydrogeology and environmental geophysics students and was investigated to determine its hydrogeological conditions. The main campus is located on the Gaborone granite complex which is generally considered to have poor groundwater potential due to lack of primary porosity. Several geophysical methods targeting potential fractures and the weathered zone were employed and jointly interpreted with the results indicating that the current site was indeed a poor location. Due to restricted space for running extended geophysical surveys in the built up area, a 115m audiomagnetotellurics (AMT) line for groundwater investigation up to depths of 300m was conducted and a ground magnetic profile of about the same length was conducted to determine the best location of the borehole point which was determined to be at 35J 392751 7272304 UTM coordinates, about 15 m from its current location. The electromagnetic profiling technique proved unreliable due to several cultural noise sources. A Vertical Electrical Sounding (VES) centred near the borehole and employing the Schlumberger array was conducted based on the fact that water bearing zones exhibit low resistivities compared to the surrounding ground. The results confirm the importance of a systematic geoscience approach to locate the best drilling site/location for a successful borehole. Keywords Audiomagnetotellurics (AMT), Dowsing, Gaborone granite, geophysics test-site, groundwater borehole, magnetic profiling, porosity, Vertical Electrical Sounding (VES)
2
1. Introduction
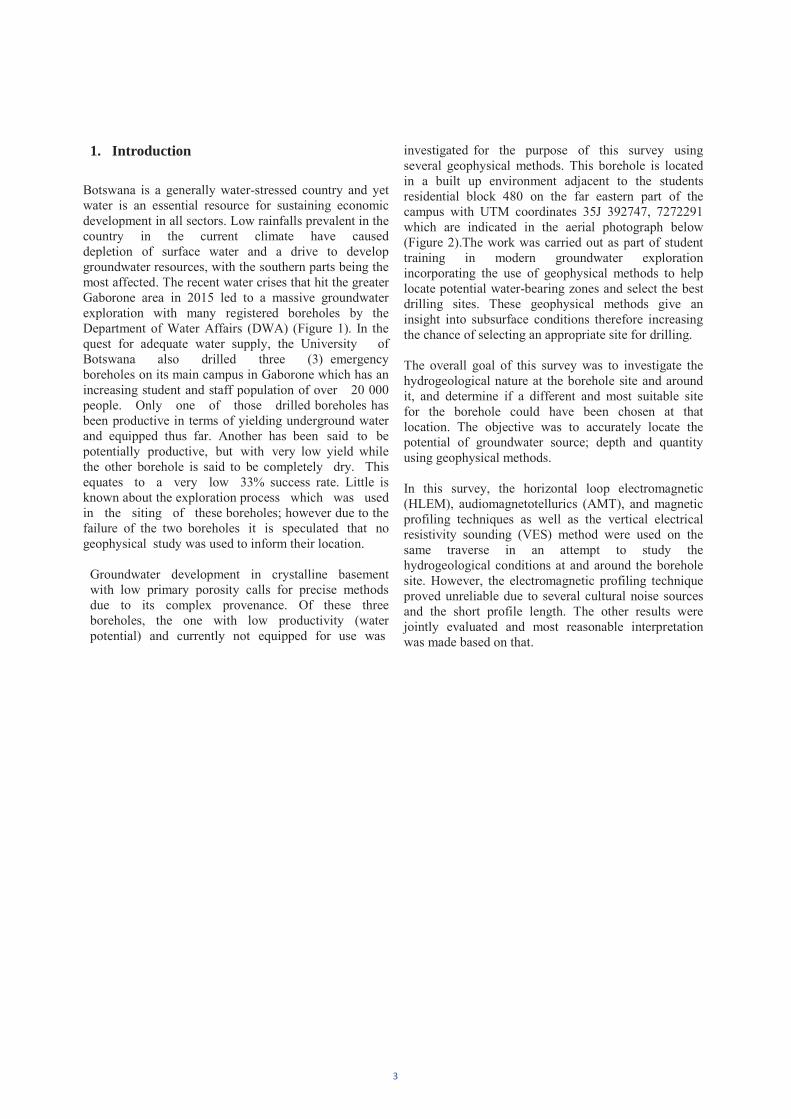
Botswana is a generally water-stressed country and yet water is an essential resource for sustaining economic development in all sectors. Low rainfalls prevalent in the country in the current climate have caused depletion of surface water and a drive to develop groundwater resources, with the southern parts being the most affected. The recent water crises that hit the greater Gaborone area in 2015 led to a massive groundwater exploration with many registered boreholes by the Department of Water Affairs (DWA) (Figure 1). In the quest for adequate water supply, the University of Botswana also drilled three (3) emergency boreholes on its main campus in Gaborone which has an increasing student and staff population of over 20 000 people. Only one of those drilled boreholes has been productive in terms of yielding underground water and equipped thus far. Another has been said to be potentially productive, but with very low yield while the other borehole is said to be completely dry. This equates to a very low 33% success rate. Little is known about the exploration process which was used in the siting of these boreholes; however due to the failure of the two boreholes it is speculated that no geophysical study was used to inform their location.
Groundwater development in crystalline basement with low primary porosity calls for precise methods due to its complex provenance. Of these three boreholes, the one with low productivity (water potential) and currently not equipped for use was
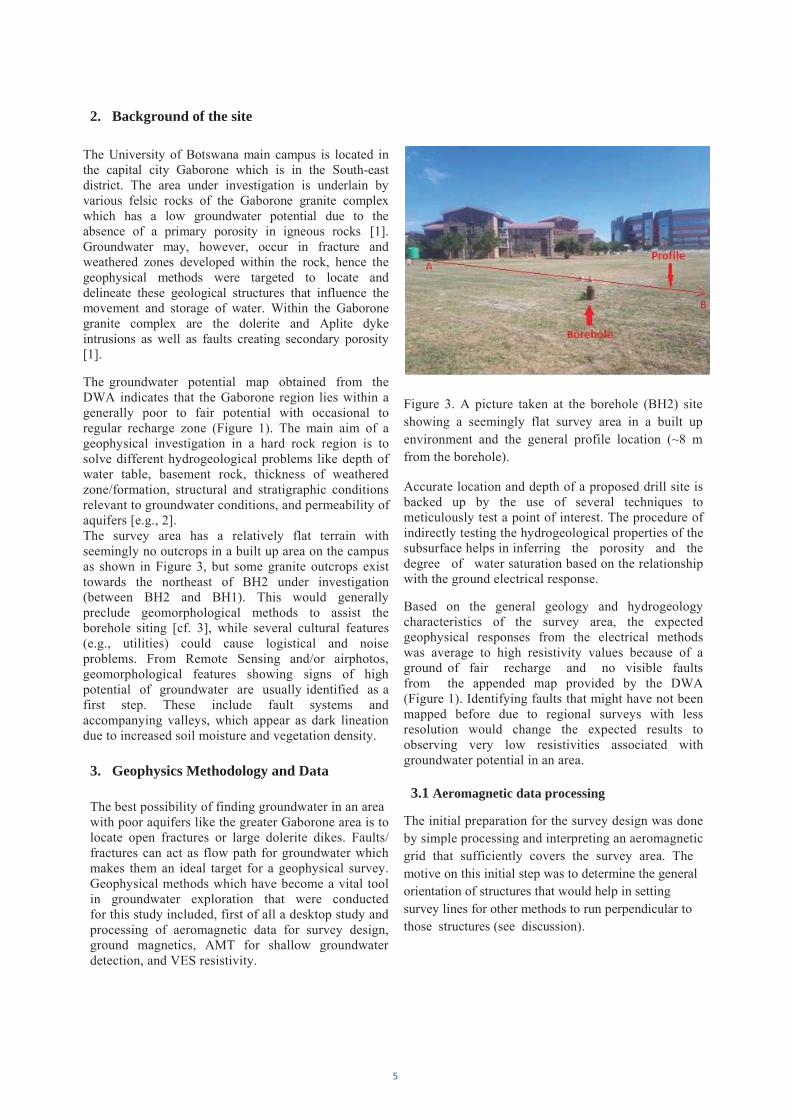
investigated for the purpose of this survey using several geophysical methods. This borehole is located in a built up environment adjacent to the students residential block 480 on the far eastern part of the campus with UTM coordinates 35J 392747, 7272291 which are indicated in the aerial photograph below (Figure 2).The work was carried out as part of student training in modern groundwater exploration incorporating the use of geophysical methods to help locate potential water-bearing zones and select the best drilling sites. These geophysical methods give an insight into subsurface conditions therefore increasing the chance of selecting an appropriate site for drilling. The overall goal of this survey was to investigate the hydrogeological nature at the borehole site and around it, and determine if a different and most suitable site for the borehole could have been chosen at that location. The objective was to accurately locate the potential of groundwater source; depth and quantity using geophysical methods. In this survey, the horizontal loop electromagnetic (HLEM), audiomagnetotellurics (AMT), and magnetic profiling techniques as well as the vertical electrical resistivity sounding (VES) method were used on the same traverse in an attempt to study the hydrogeological conditions at and around the borehole site. However, the electromagnetic profiling technique proved unreliable due to several cultural noise sources and the short profile length. The other results were jointly evaluated and most reasonable interpretation was made based on that.
3
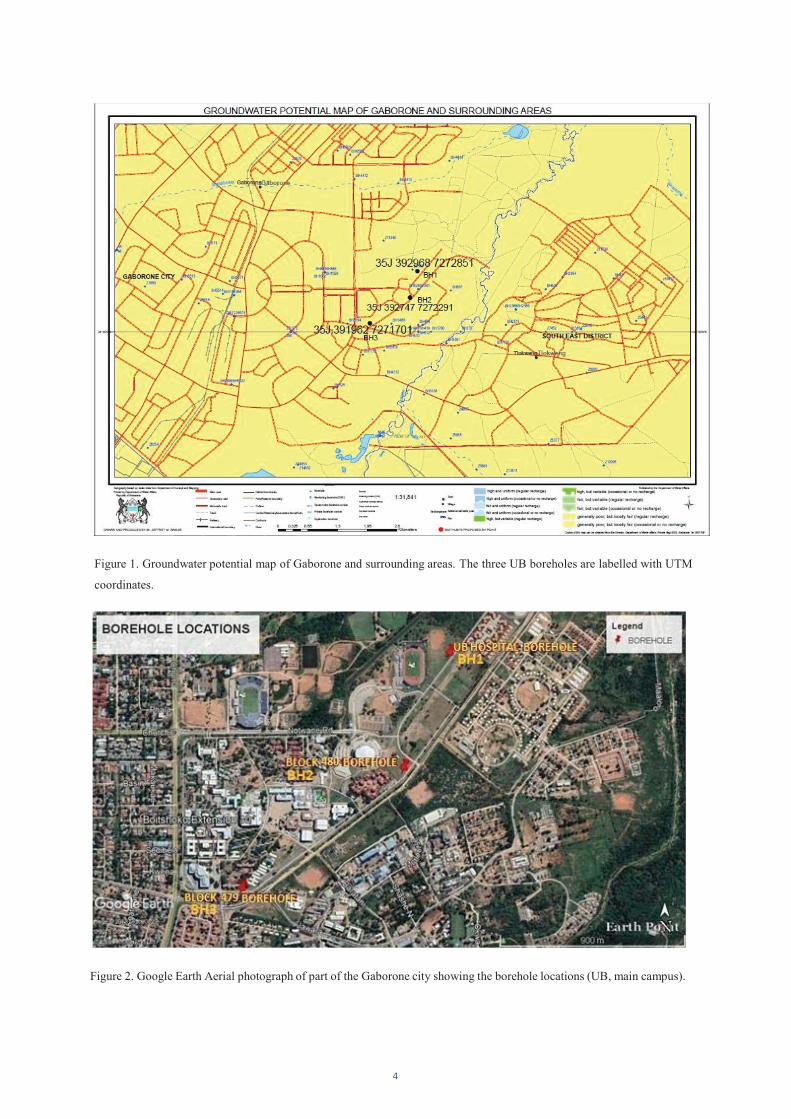
Figure 1. Groundwater potential map of Gaborone and surrounding areas. The three UB boreholes are labelled with UTM
coordinates.
Figure 2. Google Earth Aerial photograph of part of the Gaborone city showing the borehole locations (UB, main campus).
4
2. Background of the site
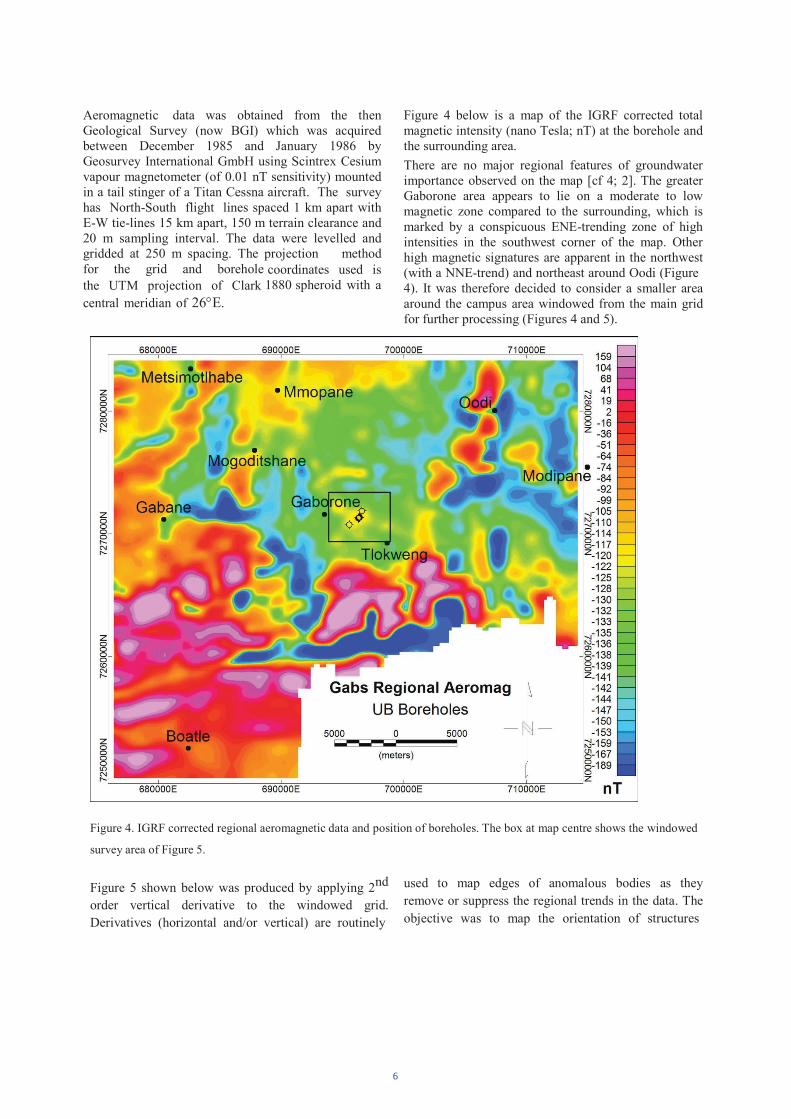
The University of Botswana main campus is located in the capital city Gaborone which is in the South-east district. The area under investigation is underlain by various felsic rocks of the Gaborone granite complex which has a low groundwater potential due to the absence of a primary porosity in igneous rocks [1]. Groundwater may, however, occur in fracture and weathered zones developed within the rock, hence the geophysical methods were targeted to locate and delineate these geological structures that influence the movement and storage of water. Within the Gaborone granite complex are the dolerite and Aplite dyke intrusions as well as faults creating secondary porosity [1]. The groundwater potential map obtained from the DWA indicates that the Gaborone region lies within a generally poor to fair potential with occasional to regular recharge zone (Figure 1). The main aim of a geophysical investigation in a hard rock region is to solve different hydrogeological problems like depth of water table, basement rock, thickness of weathered zone/formation, structural and stratigraphic conditions relevant to groundwater conditions, and permeability of aquifers [e.g., 2]. The survey area has a relatively flat terrain with seemingly no outcrops in a built up area on the campus as shown in Figure 3, but some granite outcrops exist towards the northeast of BH2 under investigation (between BH2 and BH1). This would generally preclude geomorphological methods to assist the borehole siting [cf. 3], while several cultural features (e.g., utilities) could cause logistical and noise problems. From Remote Sensing and/or airphotos, geomorphological features showing signs of high potential of groundwater are usually identified as a first step. These include fault systems and accompanying valleys, which appear as dark lineation due to increased soil moisture and vegetation density. 3. Geophysics Methodology and Data
The best possibility of finding groundwater in an area with poor aquifers like the greater Gaborone area is to locate open fractures or large dolerite dikes. Faults/ fractures can act as flow path for groundwater which makes them an ideal target for a geophysical survey. Geophysical methods which have become a vital tool in groundwater exploration that were conducted for this study included, first of all a desktop study and processing of aeromagnetic data for survey design, ground magnetics, AMT for shallow groundwater detection, and VES resistivity.
Figure 3. A picture taken at the borehole (BH2) site showing a seemingly flat survey area in a built up environment and the general profile location (~8 m from the borehole). Accurate location and depth of a proposed drill site is backed up by the use of several techniques to meticulously test a point of interest. The procedure of indirectly testing the hydrogeological properties of the subsurface helps in inferring the porosity and the degree of water saturation based on the relationship with the ground electrical response. Based on the general geology and hydrogeology characteristics of the survey area, the expected geophysical responses from the electrical methods was average to high resistivity values because of a ground of fair recharge and no visible faults from the appended map provided by the DWA (Figure 1). Identifying faults that might have not been mapped before due to regional surveys with less resolution would change the expected results to observing very low resistivities associated with groundwater potential in an area. 3.1 Aeromagnetic data processing
The initial preparation for the survey design was done by simple processing and interpreting an aeromagnetic grid that sufficiently covers the survey area. The motive on this initial step was to determine the general orientation of structures that would help in setting survey lines for other methods to run perpendicular to those structures (see discussion).
5
Aeromagnetic data was obtained from the then Geological Survey (now BGI) which was acquired between December 1985 and January 1986 by Geosurvey International GmbH using Scintrex Cesium vapour magnetometer (of 0.01 nT sensitivity) mounted in a tail stinger of a Titan Cessna aircraft. The survey has North-South flight lines spaced 1 km apart with E-W tie-lines 15 km apart, 150 m terrain clearance and 20 m sampling interval. The data were levelled and gridded at 250 m spacing. The projection method for the grid and borehole coordinates used is the UTM projection of Clark 1880 spheroid with a central meridian of 26 E.
Figure 4 below is a map of the IGRF corrected total magnetic intensity (nano Tesla; nT) at the borehole and the surrounding area. There are no major regional features of groundwater importance observed on the map [cf 4; 2]. The greater Gaborone area appears to lie on a moderate to low magnetic zone compared to the surrounding, which is marked by a conspicuous ENE-trending zone of high intensities in the southwest corner of the map. Other high magnetic signatures are apparent in the northwest (with a NNE-trend) and northeast around Oodi (Figure 4). It was therefore decided to consider a smaller area around the campus area windowed from the main grid for further processing (Figures 4 and 5).
Figure 4. IGRF corrected regional aeromagnetic data and position of boreholes. The box at map centre shows the windowed
survey area of Figure 5.
Figure 5 shown below was produced by applying 2nd
order vertical derivative to the windowed grid. Derivatives (horizontal and/or vertical) are routinely
used to map edges of anomalous bodies as they remove or suppress the regional trends in the data. The objective was to map the orientation of structures
6
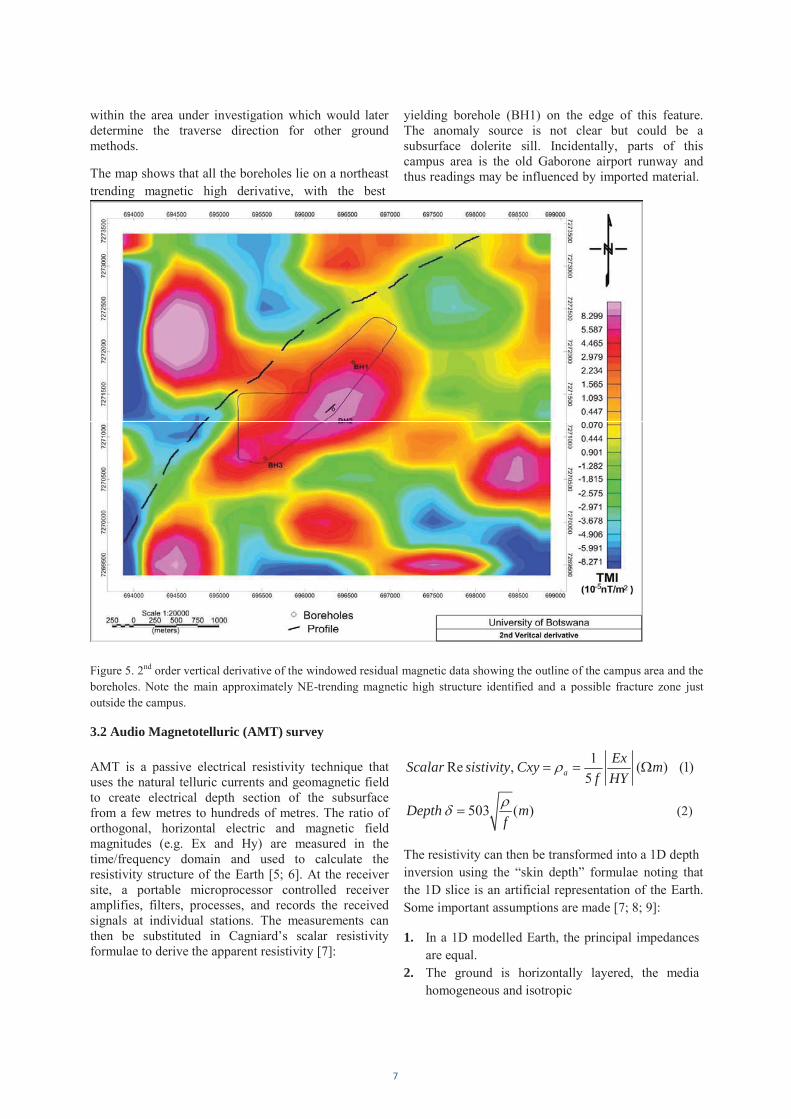
within the area under investigation which would later determine the traverse direction for other ground methods.
The map shows that all the boreholes lie on a northeast trending magnetic high derivative, with the best
yielding borehole (BH1) on the edge of this feature. The anomaly source is not clear but could be a subsurface dolerite sill. Incidentally, parts of this campus area is the old Gaborone airport runway and thus readings may be influenced by imported material.
Figure 5. 2nd order vertical derivative of the windowed residual magnetic data showing the outline of the campus area and the boreholes. Note the main approximately NE-trending magnetic high structure identified and a possible fracture zone just outside the campus.
3.2 Audio Magnetotelluric (AMT) survey
AMT is a passive electrical resistivity technique that uses the natural telluric currents and geomagnetic field to create electrical depth section of the subsurface from a few metres to hundreds of metres. The ratio of orthogonal, horizontal electric and magnetic field magnitudes (e.g. Ex and Hy) are measured in the time/frequency domain and used to calculate the resistivity structure of the Earth [5; 6]. At the receiver site, a portable microprocessor controlled receiver amplifies, filters, processes, and records the received signals at individual stations. The measurements can then be substituted in Cagniard’s scalar resistivity formulae to derive the apparent resistivity [7]:
(2)
The resistivity can then be transformed into a 1D depth inversion using the “skin depth” formulae noting that the 1D slice is an artificial representation of the Earth. Some important assumptions are made [7; 8; 9]: 1. In a 1D modelled Earth, the principal impedances
are equal. 2. The ground is horizontally layered, the media
homogeneous and isotropic
1Re , ( ) (1)5a
ExScalar sistivity Cxy mf HY
503 ( )Depth mf
7

3 . Ignore displacement current effect and do not consider Ex and Hy between the /4 phase angle.
Non-uniqueness in the inversion of electromagnetic data is overcome by requiring that the model (a) fits the data and (b) is as spatially smooth as possible. This represents a statistical trade-off between fitting the data and being spatially smooth.
The MT method is well suited for studying complicated geological environments because the electric and magnetic field transfer functions are sensitive to vertical and horizontal variations in resistivity [8]. [10] further point out that the depth of investigation is dependent on the frequency used, with low frequencies penetrating greater depths than high
frequencies. For hydrological investigations, AMT data may provide critical information about geologic structure, lithology, water table trends, and trends in pore fluid salinity or contaminant [6; 11; 8]. This method was conducted alongside the borehole with a total line of 120m trending NE – SW using PQWT TC300 AMT Receiver. In a hard rock environment such as present, dykes, fractures and faults can be precisely located [12]. The receiver uses 40 frequencies to image depths to range of 300m at 5m intervals which are central points of a 10m electrode cable. The results of the survey are a profile plot of potential difference for 24 stations as shown in Figure 6a. Station 12 from this survey corresponds with borehole point which makes a perpendicular line of 8m from survey line.
Figure 6a. AMT resistivity profiles showing frequency response plot of the 115m NE-SW line which was 8 m away from the borehole. Note an error spike at station 22where the electrode was removed from the ground before the AMT receiver completed taking the readings.
From Figure 6a, one can see data recorded by the instrument at different frequencies. Areas of different resistivity contrasts are clearly visible, with the first 50 meters of the profile at traverse stations 1 to 12 showing a zone of high resistivity values. The nature of the anomaly indicates what might be a dolerite dyke or sill. From the 13th profile stations it’s a zone of low resistivity which continues as low resistivity up to the 17th and shows slow, steady increase thereafter till the end of the survey line. The water potential point is in
between where there is a contact of the hard rock with the other rock unit and the zone of low resistivity (stations 13 and 14). Ideally, the borehole is at ‘V’ point of the frequency plot [12], either at station 13 or 15.The survey was done at many frequencies and it shows that relatively high frequencies have more definition and pick the shallow anomalies better than relatively lower anomalies but are more susceptible to noise than the lower frequency wave. The receiver created a 2D section of the Earth apparent resistivity down to a depth of 300 m (Figure 6b).
8
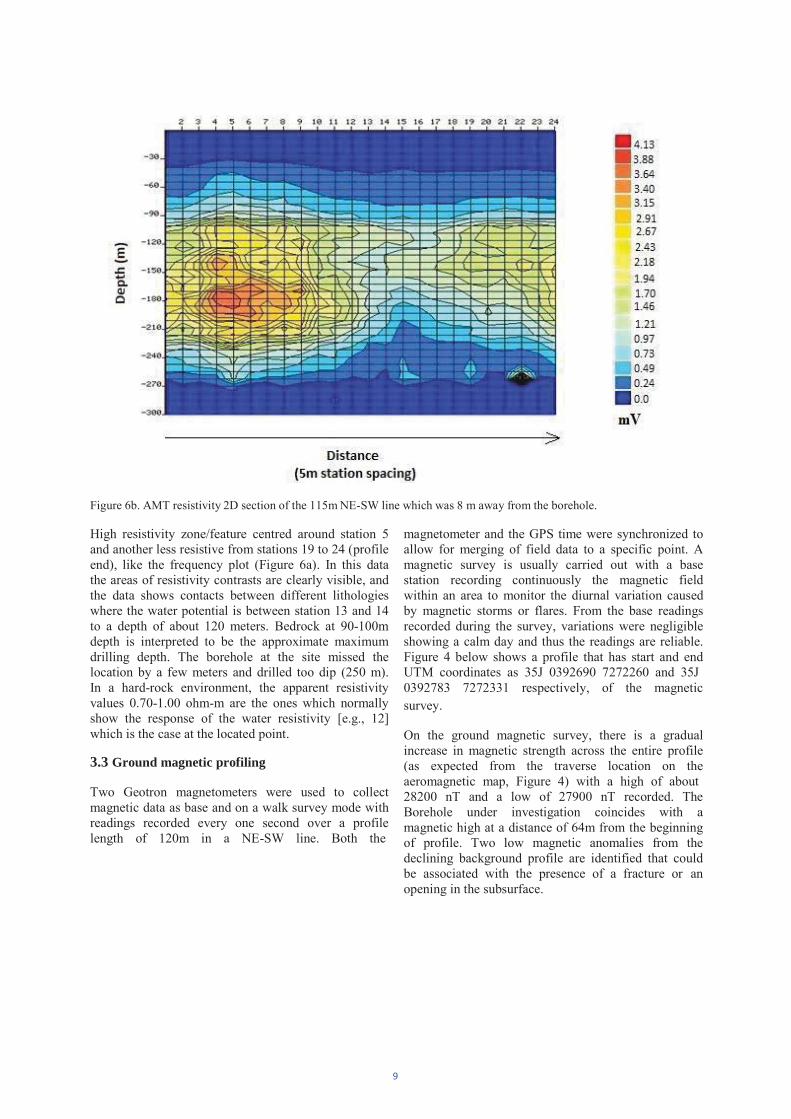
Figure 6b. AMT resistivity 2D section of the 115m NE-SW line which was 8 m away from the borehole.
High resistivity zone/feature centred around station 5 and another less resistive from stations 19 to 24 (profile end), like the frequency plot (Figure 6a). In this data the areas of resistivity contrasts are clearly visible, and the data shows contacts between different lithologies where the water potential is between station 13 and 14 to a depth of about 120 meters. Bedrock at 90-100m depth is interpreted to be the approximate maximum drilling depth. The borehole at the site missed the location by a few meters and drilled too dip (250 m). In a hard-rock environment, the apparent resistivity values 0.70-1.00 ohm-m are the ones which normally show the response of the water resistivity [e.g., 12] which is the case at the located point.
3.3 Ground magnetic profiling
Two Geotron magnetometers were used to collect magnetic data as base and on a walk survey mode with readings recorded every one second over a profile length of 120m in a NE-SW line. Both the
magnetometer and the GPS time were synchronized to allow for merging of field data to a specific point. A magnetic survey is usually carried out with a base station recording continuously the magnetic field within an area to monitor the diurnal variation caused by magnetic storms or flares. From the base readings recorded during the survey, variations were negligible showing a calm day and thus the readings are reliable. Figure 4 below shows a profile that has start and end UTM coordinates as 35J 0392690 7272260 and 35J 0392783 7272331 respectively, of the magnetic survey. On the ground magnetic survey, there is a gradual increase in magnetic strength across the entire profile (as expected from the traverse location on the aeromagnetic map, Figure 4) with a high of about 28200 nT and a low of 27900 nT recorded. The Borehole under investigation coincides with a magnetic high at a distance of 64m from the beginning of profile. Two low magnetic anomalies from the declining background profile are identified that could be associated with the presence of a fracture or an opening in the subsurface.
9
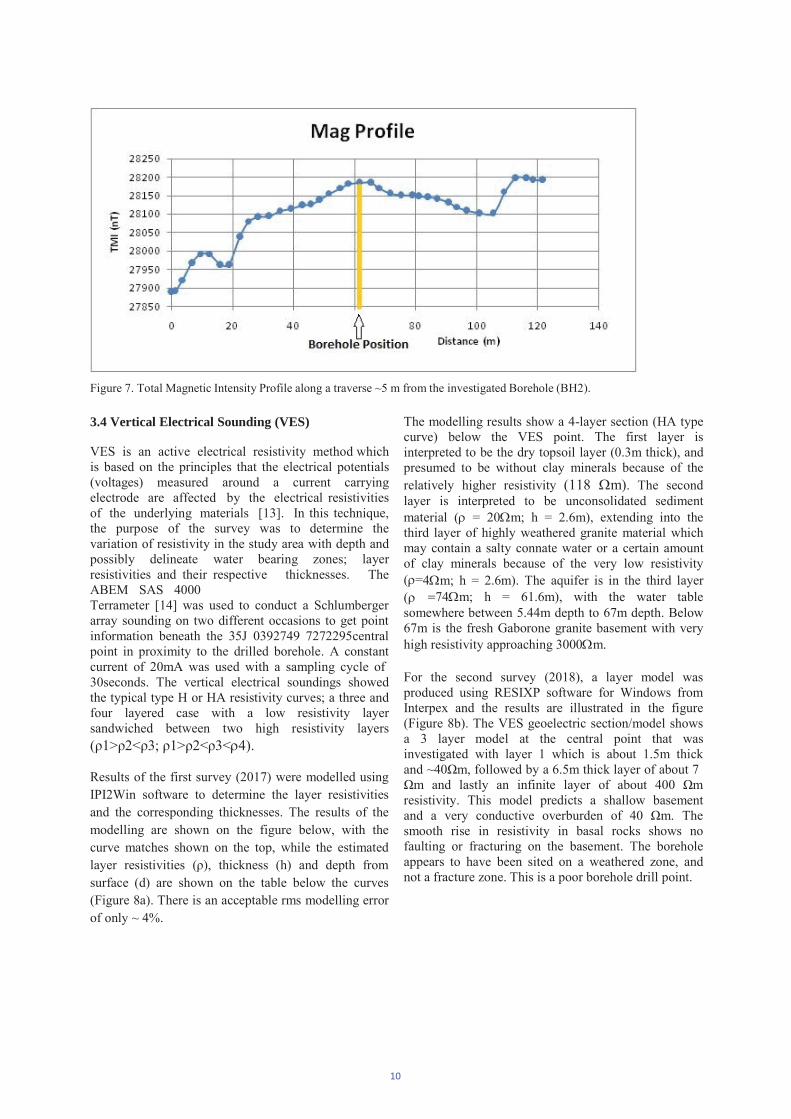
Figure 7. Total Magnetic Intensity Profile along a traverse ~5 m from the investigated Borehole (BH2).
3.4 Vertical Electrical Sounding (VES)
VES is an active electrical resistivity method which is based on the principles that the electrical potentials (voltages) measured around a current carrying electrode are affected by the electrical resistivities of the underlying materials [13]. In this technique, the purpose of the survey was to determine the variation of resistivity in the study area with depth and possibly delineate water bearing zones; layer resistivities and their respective thicknesses. The ABEM SAS 4000 Terrameter [14] was used to conduct a Schlumberger array sounding on two different occasions to get point information beneath the 35J 0392749 7272295central point in proximity to the drilled borehole. A constant current of 20mA was used with a sampling cycle of 30seconds. The vertical electrical soundings showed the typical type H or HA resistivity curves; a three and four layered case with a low resistivity layer sandwiched between two high resistivity layers ( 1> 2< 3; 1> 2< 3< 4). Results of the first survey (2017) were modelled using IPI2Win software to determine the layer resistivities and the corresponding thicknesses. The results of the modelling are shown on the figure below, with the curve matches shown on the top, while the estimated layer resistivities ( ), thickness (h) and depth from surface (d) are shown on the table below the curves (Figure 8a). There is an acceptable rms modelling error of only ~ 4%.
The modelling results show a 4-layer section (HA type curve) below the VES point. The first layer is interpreted to be the dry topsoil layer (0.3m thick), and presumed to be without clay minerals because of the relatively higher resistivity (118 m). The second layer is interpreted to be unconsolidated sediment material ( = 20 m; h = 2.6m), extending into the third layer of highly weathered granite material which may contain a salty connate water or a certain amount of clay minerals because of the very low resistivity ( =4 m; h = 2.6m). The aquifer is in the third layer ( =74 m; h = 61.6m), with the water table somewhere between 5.44m depth to 67m depth. Below 67m is the fresh Gaborone granite basement with very high resistivity approaching 3000 m. For the second survey (2018), a layer model was produced using RESIXP software for Windows from Interpex and the results are illustrated in the figure (Figure 8b). The VES geoelectric section/model shows a 3 layer model at the central point that was investigated with layer 1 which is about 1.5m thick and ~40 m, followed by a 6.5m thick layer of about 7
m and lastly an infinite layer of about 400 m resistivity. This model predicts a shallow basement and a very conductive overburden of 40 m. The smooth rise in resistivity in basal rocks shows no faulting or fracturing on the basement. The borehole appears to have been sited on a weathered zone, and not a fracture zone. This is a poor borehole drill point.
10
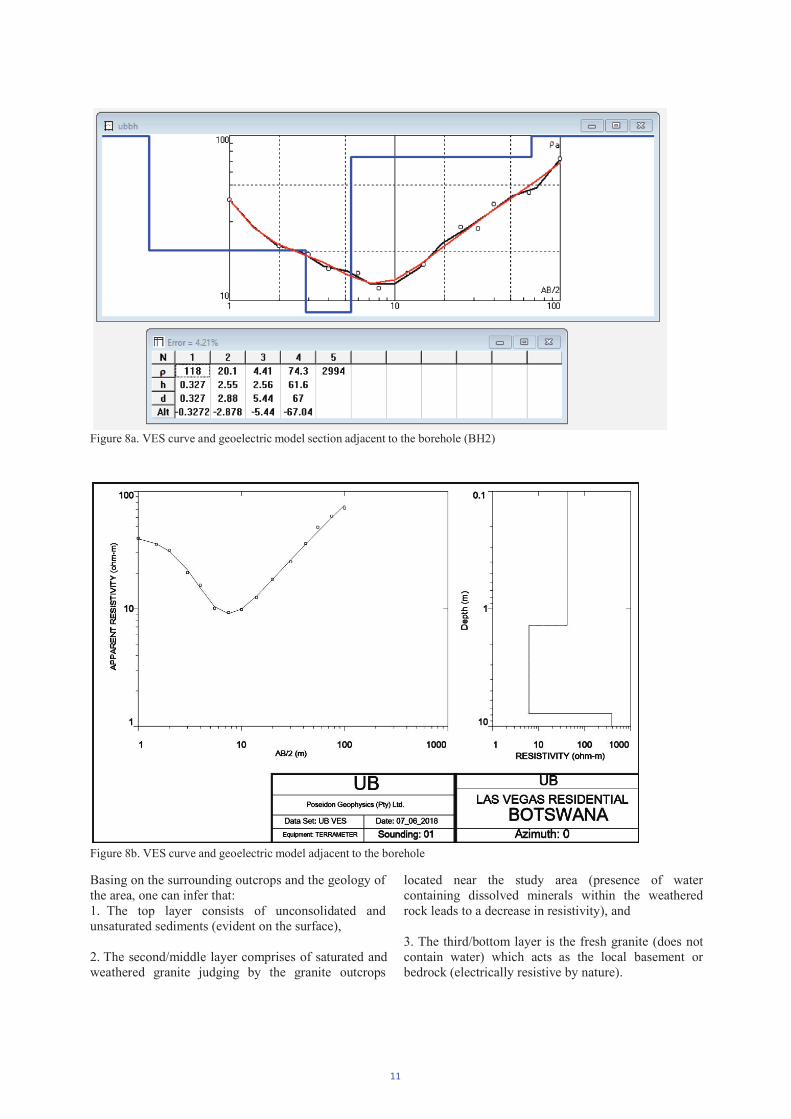
Figure 8a. VES curve and geoelectric model section adjacent to the borehole (BH2)
Figure 8b. VES curve and geoelectric model adjacent to the borehole
Basing on the surrounding outcrops and the geology of the area, one can infer that: 1. The top layer consists of unconsolidated and unsaturated sediments (evident on the surface),
2. The second/middle layer comprises of saturated and weathered granite judging by the granite outcrops
located near the study area (presence of water containing dissolved minerals within the weathered rock leads to a decrease in resistivity), and 3. The third/bottom layer is the fresh granite (does not contain water) which acts as the local basement or bedrock (electrically resistive by nature).
11
4. Discussion
This study aims to understand the subsurface conditions of the area, determine the water potential and understand why the borehole site was chosen. Groundwater was expected to be found in the weathered zone or the fractured bedrock in this area of study. Thus, traversing allowed us to locate zones of fracturing or contact zones, which are potential areas for the storage of large quantities of groundwater.
4.1 Results Discussion
The borehole location plots on a highly magnetic bull’s eye point. Within the same location, there is a NE-SW trending lineament which could have determined a NW-SE survey in order to traverse across this structure but there were restrictions on surveying in this direction. A discontinuous structure trending
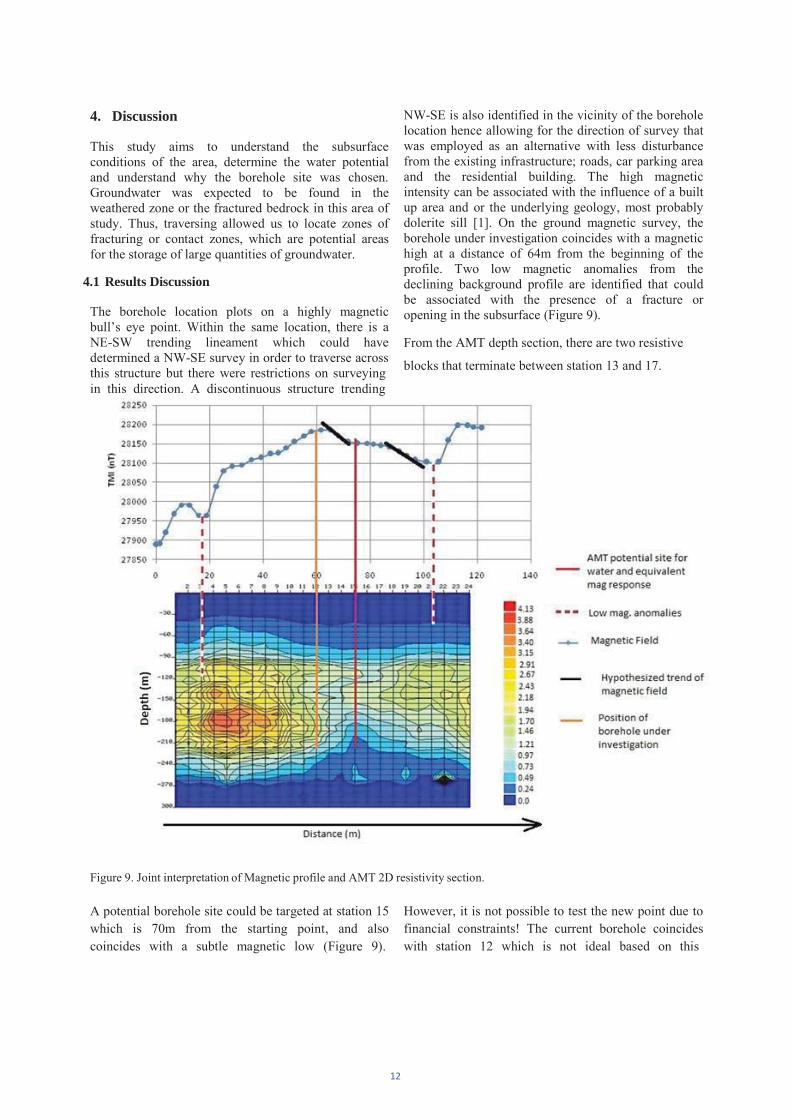
NW-SE is also identified in the vicinity of the borehole location hence allowing for the direction of survey that was employed as an alternative with less disturbance from the existing infrastructure; roads, car parking area and the residential building. The high magnetic intensity can be associated with the influence of a built up area and or the underlying geology, most probably dolerite sill [1]. On the ground magnetic survey, the borehole under investigation coincides with a magnetic high at a distance of 64m from the beginning of the profile. Two low magnetic anomalies from the declining background profile are identified that could be associated with the presence of a fracture or opening in the subsurface (Figure 9). From the AMT depth section, there are two resistive
blocks that terminate between station 13 and 17.
Figure 9. Joint interpretation of Magnetic profile and AMT 2D resistivity section.
A potential borehole site could be targeted at station 15 which is 70m from the starting point, and also coincides with a subtle magnetic low (Figure 9).
However, it is not possible to test the new point due to financial constraints! The current borehole coincides with station 12 which is not ideal based on this
12

method, and the magnetics. Based on the VES, the borehole appears to have been sited on a weathered zone only, and not a fracture zone. This is a poor borehole drill point. Contrary to this, an ideal borehole point in crystalline terrain should have resistivities in the range of 50 – 150 m [15], and have associated fractures.
The two vertical electrical soundings showed the typical type H (3 layer) and HA (4 layer) resistivity curves with the important weathered zone between 50
and 70 m deep. The AMT section suggests a depth of 90-100m, but this is considered an overestimate in equation 1 where 503 is used as opposed to the value of 356 used by other manufacturers like Zonge and Phoenix (far field calculation in CSAMT) [9]. The reported drilled depth of 250 m for all the boreholes thus appears excessive and unnecessarily costly. A reasonable maximum depth in this case would have been around 120 m, allowing good penetration of the (fractured?) basement.
Figure 10. A schematic Map of the survey area (re-projected to UTM zone 35S). Note the position of the determined best
borehole location relative to current position (~15m apart). It is also important to note that the longitudinal conductance (S) or the aquifer protective capacity (APC) of the overburden (APC = S= h/ = h.
= 0.003 to 0.580 mho; Table 1) at the site is very low ( is the layer conductivity) to moderate. APC is the ability of the overburden unit to impede and filter percolating ground surface leaching fluid (pollutants) from entering into the aquiferous unit. Clayey overburden,which is depicted by relatively high longitudinal conductance, gives protection to the underlying
aquifer. During the resistivity VES survey, there was need to increase the current injected into the ground at larger current electrode separations. Because of the spatial constraints presented by the nearby car park and residence block, the sounding could not be extended further enough. This may have led to insufficient m a p p i n g o f t h e s u b s u r f a c e v a r i a t i o n o f resistivity with depth, with the possibility of not mapping the bedrock components sufficiently.
13

Table 1. Determined layer resistivity, thickness and aquifer protective capacity
Subsurface Layer Resistivity ( m) Thickness (m) Longitudinal Conductance (mho)
Surface soil/Overburden 40 – 118 0.33 – 1.50 0.003 – 0.038 Weathered rock 7 – 40 1.5 – 6.50 0.038 – 0.128 Fractured rock 5 –74 6.5 – 70 0.580 – 0.929 Bedrock 3000 – ----- -----
Figure 11. EMAC36 results and VES geological section, Modipane (see Figure 4) https://www.kau.edu.sa/Files/0003035/Subjects/EM(1).pdf (retrieved 9 July 2018)
14

The importance of using several methods for groundwater exploration, particularly in complex crystalline basement, is also corroborated by results from Modipane (Figure 11) and Mogoditshane, areas east and west of the study area, respectively (Figure 4), within the same Gaborone granite complex. In Figure 11, VES managed to outline the weathered zone with the HLEM identifying the important fractures.
4.2 Critical Lessons Learnt
Several important lessons can be derived from the whole exercise and we summarise four that we consider critical ones below.
(i) Dowsing/Divining versus Geoscience
Despite the many merits of geophysics in groundwater exploration not all groundwater investigations utilise these tools, with varying methods being used to site boreholes. Many still resort to the traditional methods of water dowsing, geomorphological methods or even random drilling. The traditional water dowsing technique is particularly popular with individuals mainly because of the cost factor. The theory governing the technique is poorly understood and many dry holes have been drilled after using this type of survey. Commonly, the dowsing exploration technique typically uses a “Y”-shaped forked stick or wire, a bottle of water, pendulums, or wire rods. Scientifically, there are suggestions that dowsing ability is related to changes in the Earth’s geomagnetic field, similar to the principles of navigation applied by whales and homing pigeons [16]. On the other hand, geophysical techniques which depend on physical contrast of rocks can be relied on as the theory and interpretation techniques are readily available. The other advantage of geophysical techniques is that they can be compared in order to show if the anomalous structure revealed by one method can be picked using other methods to confirm its physical presence. The results of this paper bear testimony to the effectiveness of these methods. Further, the use of multiple methods to explore for groundwater triangulates data and overcomes the vulnerability to errors linked to a single method.
(ii) Integrated Downscaling/Focussing Approach One of the objectives of this programme was introducing an improved geophysical approach to water exploration to hydrogeology students, and adding to the knowledge of the hydrogeology of the area. The methodological framework used and recommended assumes a ‘top down’ (downscaling) approach using airborne methods to identify the large scale, dominant architecture of the subsurface for selecting the most viable areas for more detailed ground geophysics. Spatially exhaustive airborne data, collected over large areas, can be used to identify geological architecture and act as a guide to further, more expensive, ground based studies [4; 2]. Research in the last two decades has shown that the synergetic use of AM/AEM and RS data within geographic information systems (GIS) for regional structural mapping before ground (geophysical) surveys are undertaken results in significant borehole success rates and increased yields. Further, at an initial ground stage, this special approach involves the use of cost- efficient geophysical techniques, such as the very low frequency (VLF), electromagnetic and magnetic profiling which can offer a relatively rapid coverage of a wider area and locate potential targets [17; 2]. At a second stage higher resolution but more costly two dimensional (2-D) or three dimensional (3-D) geophysical techniques, such as the VES/ERT (electrical resistivity tomography) or seismic refraction, can be applied only in specific locations helping the interpreter to pinpoint more accurately the most suitable locations for positioning the hydro-wells [17]. The complex internal structure of fractured linear aquifers particularly calls for a detailed investigation on the ground. This ‘top down’ (focussing) approach offers an efficient way of characterizing the subsurface over large spatial scales. By combining the geophysical results with available hydrogeological and geomorphological data, an optimal drilling site can be established. For more accurate results, the various methods must be analysed jointly whenever possible. (iii) “Black-box” Geophysical Instrumentation Geophysics involves theoretical session, field data acquisition, data processing and interpretation. The overriding goal of geophysics is to properly apply the theory to the real (geological) world. In electrical resistivity and electromagnetic methods, as in most
15

other geophysical methods, there is a gap between the theory and the field data acquisition occasioned by the sophisticated data collecting equipment whose software are shrouded in secrecy. The modern instruments are becoming less and less transparent hence approaching a “black box”. The software is hidden and cannot be altered. There is a tendency to diminish understanding of the system. The users of these modern commercial equipments feel disconnected because experiments in the laboratory are not adequately designed to expose them for what they would encounter in the field and their professional lives. This creates a gap between theories learnt in the classroom and field measurements, as is the case with the present largely automatic receivers (ABEM SAS4000 and the PQWT TC300). The ABEM SAS4000 (four channel) resistivity and IP instrument, with integrated computer for control of data acquisition process and storage of data offers cost-effectiveness but the calculations are hidden. SAS stands for Signal Averaging System – a method whereby consecutive readings are taken automatically and the results are averaged continuously (ABEM, 2010), making results more reliable than those obtained using single-shot systems. Equally, the Audio Magnetotelluric Receivers from PQWT automatically creates 2D sections of the Earth's apparent resistivity down to 150/300/500 meters depending on the model. As a groundwater exploration aid, this meter is excellent due to the fact that the inversion of the data is done automatically in the field and areas of resistivity contrasts are clearly visible. In a hard rock environment such as present, dykes, fractures and faults can be precisely located and in paleochannels (e.g. NW Botswana) their extent can be determined. However, for teaching purposes students require the possibility to experiment with it and to understand clearly the principles involved, unlike the present “black box” set-up [e.g., 18; 19; 20]. According to [9], for example, the academics are therefore quite rightly wary as PQWT hide behind patents in the method they are measuring Hy, which is assumed to be a response determined constant.
The secrecy in the software of these patent measuring equipments is a hindrance to understanding their working principle in relation to the subsurface of the Earth. It has become difficult, if not impossible, to connect the physics principles with the computer processed data. There is the need, therefore, to develop
software and/or hardware versions of demonstrating equipment for students’ use both in laboratory and the field [e.g., 20]. We are currently addressing these shortcomings [e.g., 21]. (iv) University-Government/Industry Collaboration The survey is also an excellent example of training of students in collaboration with relevant government departments and industry (BGI, DWA, Poseidon Geophysics), a true tripartite alliance. It is envisaged that this will in future include geophysical borehole logging and the drill logs, to confirm the geoelectric layers, again in collaboration with industry as the University does not have this equipment. Another important point to note in this regard is the consideration of the use of in-house expertise versus out-sourcing of services, though this is presently beyond the scope of this paper. 5. Conclusions The low yield borehole investigated in this research attracted a geophysical approach because there is no scientific documentation and findings, with a reported traditional water dowsing technique having been employed. The overall goals of this programme included training of students, introducing an improved geophysical approach to water exploration, and adding to the knowledge of the hydrogeology of the area. A hierarchical, focussing approach to subsurface measurement has been developed that begins with the identification of dominant geological structure and flow path identification and reduces in scale to focus on areas of interest. Groundwater was expected to be found in the weathered zone or the fractured bedrock in this area of study. The aeromagnetic interpretation shows that the dominant structural trend is northeast, with the most promising fault structure just outside the campus area. The buildings and infrastructure unfortunately allowed the profile direction to be non- perpendicular to the geological trend. However, the traversing allowed us to locate zones of fracturing or contact zones, while the VES determined the thickness of weathered zone. From the results, it can be concluded that the borehole was located at a poor groundwater bearing source. This is evident from the superimposed AMT and ground magnetic profile at point 35J 392751 7272304 where there exists a low resistivity or discontinuity at a point that coincides with a subtle low magnetic anomaly (Figure 9). Thus from all the methods conducted it can be concluded that the best position for drilling
16
a borehole along the investigated profile is at station 15. This site is about 15m from the current location (Figure 10) and has the lowest apparent resistivity and shows high water bearing potential. The existing borehole was found to have been located in a highly resistive location, of which explains why the borehole was a failure. This study emphasises the need for incorporating geophysical methods in groundwater exploration as it is easy to miss high potential target without in-depth insight into subsurface conditions. Unfortunately, the new preferred point could not be tested due to financial constraints.
The results confirm the importance of a systematic geoscience approach to locate the best drilling site/location for a successful borehole and reducing costs. The incorporation of geophysics in groundwater exploration also reduces costs and time spent as it reduces if not eliminates the need for exploration boreholes, with sound geophysical data drilling can commence directly with the final production boreholes. Geophysical equipment for teaching purposes need to be ‘tuned’ to the applications as much as possible rather than the automated commercial “black boxes”.
This programme demonstrates that modern approaches can result in significantly improved overall understanding of the geology and hydrogeology of a given area that underpins water well drilling success rates. It should also be noted that geophysical techniques do not dispense with drilling, but rather reduce its requirement to the best locations, and hence lowering the overall cost of the groundwater exploration project.
6. Acknowledgements
The authors are highly indebted to the University of Botswana for use of the borehole as a geophysics test site for the MSc Hydrogeology and BSc Environmental Geophysics students. The students’ enthusiasm and hard work in data collection for this study is worth a mention towards achieving the desired goal. The BGI provided the aeromagnetic data and allowed the publication thereof while Poseidon Geophysics kindly made the AMT receiver available and the Department of Water Affairs provided the groundwater potential map covering the campus area. Finally, we would like to thank the reviewers for their valuable suggestions.
7. References
[1] Key R. M. The Geology of the area around Gaborone and Lobatse, Kweneng, Kgatleng, Southern and South East districts. Gaborone: Geological Survey Department, Ministry of Mineral Resources & Water Affairs, 1983.
[2] Ranganai R.T, Moidaki M.D., King J.G. and Bagai Z.B. Geophysical and Hydrogeological Groundwater Prospectivity Mapping in the Kraaipan Granite-Greenstone Terrain, Southeast Botswana. Journal of Water Resource and Protection, 9, 1270-1298, 2017. (https://doi.org/10.4236/jwarp.2017.911082)
[3] Teixeira , J., Chaminé , H.I., Carvalho, J.M., Alberti, A.P. & Rocha, F. Hydrogeomorphological mapping as a tool in groundwater exploration, Journal of Maps, 9(2), 263-273, 2013. DOI: 10.1080/17445647.2013.776506
[4] Ranganai R.T. and Ebinger C.E. Aeromagnetic and LANDSAT TM Structural Interpretation for Identifying Groundwater Exploration Targets, South-Central Zimbabwe Craton. Journal of Applied Geophysics, Vol. 65(2), 73- 83, 2008.
[5] Cagniard L. Basic Theory of the magnetotelluric method of geophysical prospecting, Geophysics, 18(3), pp. 605-635, 1953.
[6] Vozoff K. The magnetotelluric method, in Electromagnetic Methods in Applied Geophysics,Volume 2, Application, Part B, Ed. Nabighian, M.N.: Society of Exploration Geophysicists, Investigation in Geophysics 03, 641-712,1991.
[7] Waff H. Electrical Resistivity Imaging of Groundwater Systems using Natural and Controlled Source Magnetotellurics. University of Oregon, Oregon, pp20, 2000. ftp://geom.geometrics.com/pub/GeoElectric/Literature/Electrical%20Resistivity%20Imaging%20of%20Groundwater%20Systems.. (retrieved 17/06/2018)
[8]Aboud E., Saud R., Asch T., & Aldamegh K.. Water exploration using Magnetotelluric and gravity data analysis; Wadi Nisah, Riyadh, Saudi Arabia. NRIAG Journal of Astronomy and Geophysics, 184-191, 2014.
17
[9] Geotron. PQWT Range of AMT Receivers for Telluric Exploration. Geotron Systems (Pty) Ltd., Potchefstroom, South Africa, 2017. www.geotron.co.za
[10] Hersir G. P.& Arnason K.. Resistivity Methods- MT.Presented at Short Course VIII on Exploration for Geothermal Resources, UNU- GTP, GDC and KenGen, Lake Bogoria and Lake Naivasha, Kenya, Oct. 31 – Nov. 22,2013.
[11] Zonge K.L. and Hughes L.J. “Controlled source audio-frequencymagnetotellurics”, in Electromagnetic Methods in Applied Geophysics, ed. Nabighian, M.N., Vol. 2, Society of Exploration Geophysicists, p 713-809, 1991.
[12] PQWT. PQWT-TC300·300 Meters Automatic Mapping Underground Water Detector, Hunan Puqi Geological Exploration Equipment Research Institute, Changsha, Hunan Province, China, 2016. www.pqwtcs.com
[13] Milsom J., and Eriksen A. Field Geophysics. Chichester: Wiley-Blackwell, 2011.
[14] ABEM, ABEM Terrameter SAS400/SAS1000 Instruction Manual. ABEM Instrument AB, Sundbyberg, Sweden, 2010. http://www.abem.se/
[15] Louis I.F., Louis F.I. and Grambas . Exploring for Favorable Groundwater Conditions in Hardrock Environments by Resistivity Imaging Methods: Synthetic Simulation Approach and Case Study Example. International Conference on Earth Sciences and Electronics (ICESE), Journal of Electrical & Electronics Engineering, Special Issue October 2002, 1-14.
[16] Ndlovu S., Mpofu V., Manatsa D. and Muchuweni E. Mapping groundwater aquifers using dowsing, slingram electromagnetic survey method and vertical electrical sounding jointly in the granite rock formation: a case of Matshetshe rural area in Zimbabwe. Journal of Sustainable Development in Africa, Volume 12, No.5, 199-208, 2010.
[17] Vargemezis G., Tsourlos P., Stampolidis A., Fikos I, Ballas D, and Papadopoulos N. A focusing approach to ground water detection by means of electrical and EM methods: the case of Paliouri, Northern Greece. Stud. Geophys. Geod. 56, 1063�1078, 2012. DOI:10.1007/s11200-
011-0444-0 [18] Fairhead J.D., Bennett K.J., Gordon D.R.H
and Huang D.: Euler: beyond the “Black Box”. Extended Abstract, SEG Annual Meeting, Los Angeles, 422-424, 1994.
[19] Ogubazghi G., Ranganai R.T., Simon R.E., King J.G. and Ugwu U.N. Development of a Laboratory Demonstrator Applicable to Resistivity and Induced Polarisation (IP) Methods. Unpub. Report, Department of Physics, University of Botswana, 14pp, 2012.
[20] Ugwu U.N. A Laboratory Demonstrator System for Geoeletrical Resistivity and Impact Survey on Groundwater Pollution: A Case Study of Two Open Dumpsites in Osogbo Metropolis, Southwestern Nigeria, Unpub. PhD Thesis, Department of Physics, University of Botswana, 179pp, 2016.
[21] Ogubazghi G., Ugwu N.U., Yemane T., Ranganai R. T. and Simon R.E. A New Laboratory Demonstrator System Applicable for the Electrical Resistivity Method: System Description and Preliminary Results. ESARSWGRegional Conference, Dar es
18
Medicinal value of Hapargohytum procum bens in structural remodeling of the myocardium
Mary Pipedi-Tshekiso*, Leon Hay** *Faculty of Science, University of Botswana
**Basic Medical Sciences, Sefako Makgato Health Sciences University, South Africa
ABSTRACTPrevention of myocardial remodeling is a therapeutic measure during hypertension. This study focuses on the use of Hapargophytum procumbens crude extract alongside captopril on myocardial hypertrophy during experimental hypertension. The results of the study indicate that H. Procumbens has some antifibrosistic effects to prevent myocardial hypertrophy during hypertension. Keywords - Hapargohytum Procumbens, Myocardial, Hypertrophy, Captopril
I. INTRODUCTION Hypertension has been found to be the
most valuable predictor of cardiovascular diseases. Main characteristic feature of hypertension is elevated vascular resistance caused by dynamic changes and alterations of the vascular geometry of arterioles and arteries. Due to pressure overload, prolonged hypertension is the common cause of myocardial hypertrophy, ventricular dilation and heart failure.
The relationship between hypertension and ventricular hypertrophy leads to complications which pose a challenge to re-evaluate the existing antihypertensive therapy. A longside their efficacy and safety, accompanying side effects and cost effectiveness are major considerations in selecting antihypertensive drugs. An appropriate antihypertensive drug should lower blood pressure as well as prevent myocardial hypertrophy at minimal costs and side effects.
In recent years, scientists have focused their attention on the use and promotion of indigenous knowledge in medical settings.2
Amongst the traditional remedies known to relieve symptoms of hypertension is Harpagophytum procumbens (H. procumbens)3. This study looks into the role ofHarpagophytum procumbens and its role in the development of myocardial hypertrophy.
H. procumbens is a weedy perennial shrub of the family Pedaleaceae, found in the sandy soils of the western parts of South Africa,
Kalahari Desert in Botswana, Namibia and some parts of Madagascar. It is known to contain iridoid glycosides, harpagoside, harpagide, procumbine, kaemferol, luteolin and some acetylated phenolic glycosides. Its crude extract is commonly used for its anti-inflammatory and analgesic properties.4
II. OBJECTIVESPrepare an aqueous extract of H. procumbens secondary roots tubersDetermine the effect of H. procumbens crude extract on the left ventricular blood pressure parametersCompare the effect of H. procumbens to that of captopril on the plasma levels of angiotensin.Determine collagen concentration on the left ventricleDetermine the heart to body weight ratios
III. MATERIALS AND METHOD
A crude extract of the secondary root tubers was prepared in 100g batches of coarsely ground tubers. The crude extract was air-dried at room temperature and stored in a cool dry place before dissolving in gelatin and warm water.
Drug Treatment was carried out for a period of 24 weeks.
At the end of the experiment, animals were anaethetised with a mixture of ketamine and xylazine (1:3) at a 2ml/kg of the stock solution.
19
Captopril was prepared in a similar manner at a daily dosage of 15mg/kg/day.
A Spontaneously hypertensive Rat (SHR) model was used along side its normotensive counterpart Wistar Kyoto Rats (WKY) model. Each of the two models was further divided into 3 groups; Devil’s claw, captopril and placebo.
Daily dosages of 100mg/kg/day for Devil’s claw were given each animal in the treatment group ad libitum.15mg/kg/day of captopril
Placebo group was treated in a similar manner excluding the drugs.Placebo group was treated in a similar manner excluding the drugs.
At the end of the experiment, animals were anaesthetised with a mixture of ketamine and xylazine (1:3) at 2ml/kg of the stock solution.
At the end of the experiment, animals
were anaesthetised with a mixture of ketamine and xylazine (1:3) at 2ml/kg of the stock solution.
Each animal was catheterised for direct left ventricular systolic and left ventricular end-diastolic pressure.
Radioimmunoassay was employed using a commercial RIA kit to determine plasma levels of Angiotensin II in all the groups.
Heart weight and body were recorded. Total collagen was determined by measurement of hydroxyproline levels through spectrophotometry of left ventricular homogenate.
Statistical data were analysed using Student T-test and presented as mean ±SEM, taking p 0.05 as significant.
IV. RESULTS
20
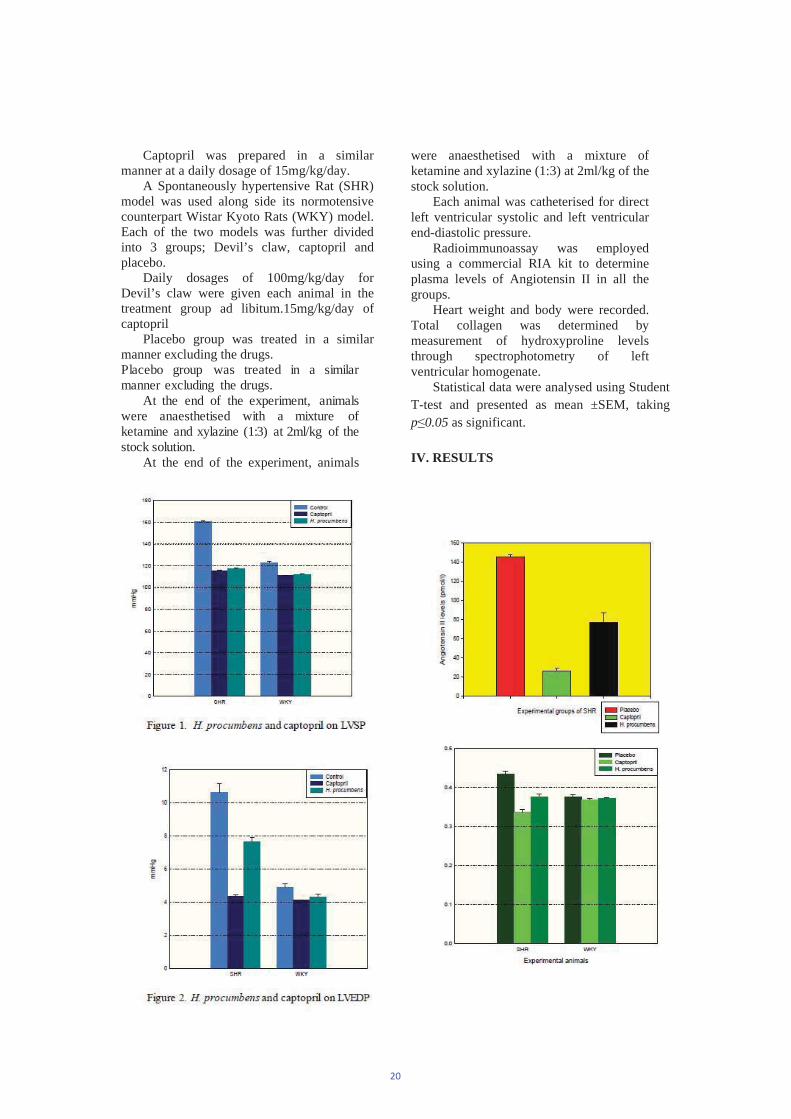
V. DISCUSSION The average left ventricular systolic and the
left ventricular end-diastolic pressure values were significantly lowered in the treated groups as compared to the control Figs 1 and 2.
However, the two treatments were not significantly different from each other. The high ventricular pressures are evidence of the high filling pressures as vascular resistance increases. The levels of the captopril treatment were lower than those of the control. Given the mode of action of the drug, this result is expected
Although the AngII levels of H. procumbens were significantly higher than those of the captopril group, they were significantly lower than those of the control. This could suggest that part of the mechanism of H. procumbens extract in counteracting myocardial fibrosis may directly or indirectly involve Angiotensin II.
Although the effects of captopril in reducing the heart to body weight ratios show a tendency of being slightly higher than those of H. procumbens, these differences were not statistically significant.
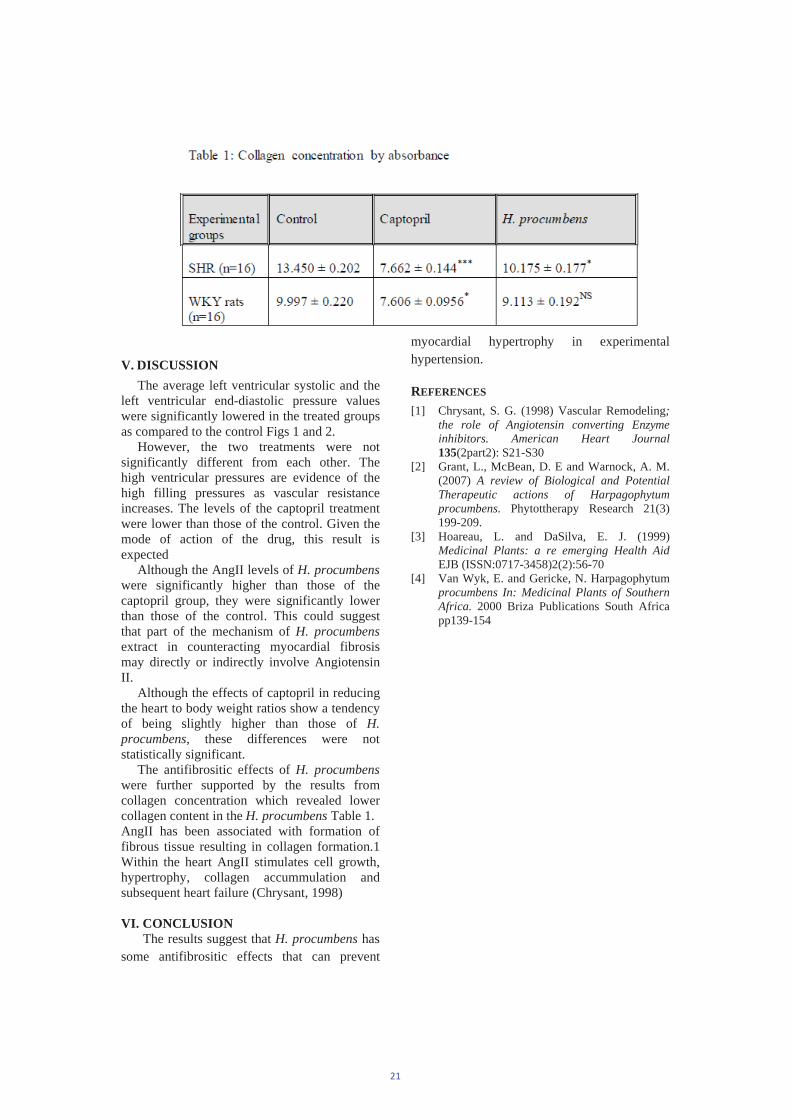
The antifibrositic effects of H. procumbens were further supported by the results from collagen concentration which revealed lower collagen content in the H. procumbens Table 1.AngII has been associated with formation of fibrous tissue resulting in collagen formation.1 Within the heart AngII stimulates cell growth, hypertrophy, collagen accummulation and subsequent heart failure (Chrysant, 1998)
VI. CONCLUSION The results suggest that H. procumbens has
some antifibrositic effects that can prevent
myocardial hypertrophy in experimental hypertension.
REFERENCES
[1] Chrysant, S. G. (1998) Vascular Remodeling;the role of Angiotensin converting Enzyme inhibitors. American Heart Journal 135(2part2): S21-S30
[2] Grant, L., McBean, D. E and Warnock, A. M. (2007) A review of Biological and Potential Therapeutic actions of Harpagophytum procumbens. Phytottherapy Research 21(3) 199-209.
[3] Hoareau, L. and DaSilva, E. J. (1999) Medicinal Plants: a re emerging Health Aid EJB (ISSN:0717-3458)2(2):56-70
[4] Van Wyk, E. and Gericke, N. Harpagophytum procumbens In: Medicinal Plants of Southern Africa. 2000 Briza Publications South Africa pp139-154
21
The Role of Moodle-Based Surgical Skills Illustrations Using 3d Animations in Undergraduate Training
Motsumi Mpapho Joseph*, Alemayehu Ginbo Bedada**, Ayane Gezahen** *Department of Surgery, Faculty of Medicine University of Botswana.
Email: [email protected]**Department of Surgery, Faculty of Medicine University of Botswana.
ABSTRACTLearning surgical skills is intensive and demanding and there is a need to invest in the utility of methods that simplify or make it easier. The objective of this study is to find out whether there is a difference in the satisfaction level and understanding between students taught using 3D-animations vs traditional teaching. This is a randomised comparative study conducted at the university of Botswana over one-year period. Participants were undergraduate medical students. They were randomly assigned to the 3D-animations group and traditional teaching group. The animated procedures, pre- and post-tests and the survey were hosted on Moodle. Independent-samples T-test was used to determine the significance of the difference in the understand levels of the two groups. There were 45 fifth-year students who participated in 3 skills-illustrations and 45 third year students who participated in 2 skills-illustrations, giving a total of 225 data points. 3D animations teaching was associated with better understanding than traditional teaching (P< 0.001). Traditional teaching was given a median rating of 5(Good) and mode of 4(Average) vs mode and median rating of 8(Excellent) for 3D animations teaching on a scale of 1-10(worst – superb). However, the combination of the two teaching methods was given a mode and median rating of 10(superb). All students recommended the adoption of the 3D animations.Students have a better understanding and a higher satisfaction level when taught using 3D animations. However, students considered using the two modalities in combination to be the best.Keywords - 3D surgical skills animations, Computer simulated surgical illustrations, Multimedia surgical skills illustrations, Three Dimensional surgical animations.
I. INTRODUCTION Training of surgical procedures require teaching
modalities which are elaborate and easy to understand. The teaching modality should relay the details of the procedure in a way that closely resembles real life scenarios anatomically. Motion graphics in the form of 3D animations is potentially such a modality. Such animations of surgical procedures can be availed to students through Learning management systems (LMS) such as Moodle, to create a learner driven teaching platform. Moodle with its resources and activities (e.g. quizzes, survey, assignments, chats, gradebooks and back-end database) would make surgical training, continuous assessment and student feedback more effective. The end-product of such a design is an audio-visual virtual classroom of surgical procedure illustrations delivered to the student via Moodle. Once such a resource is developed and produced it can be used over years without wear and tear problems. It is the researcher’s opinion that low and middle income countries need to harness the power of organized Audio-visual virtual classrooms in
medical training and that this may appeal to the current generation of medical students.
This research proposes that surgical skills illustrations using 3D animations availed on Moodle platform would improve students’ understanding and satisfaction levels.
A. Background of Undergraduate Surgical Rotations at Faculty of Medicine, University of Botswana
The faculty of medicine is a newly established faculty which graduated its first cohort of undergraduate medical students in 2014. The medical undergraduate program (MBBS) consists of five years of training which are divided into two phases. Phase I curriculum is for covering premedical sciences, followed by phase II curriculum which is the clinical phase of undergraduate medical training. Phase I is covered during the first two years of training while phase II is covered during the latter 3 years. Surgical specialty rotations occur during the phase II curriculum. General surgery rotations occur in the
22
third year (Surgery I) and the fifth year of training (Surgery III). Teaching of surgical practical skills is part of the curriculum and it is where the challenges lie. We use plain models and text presentations as our teaching aids for surgical skills teaching. We currently do not have procedure-customised models to illustrate principles and the details of each procedure. Such models are expensive to acquire and maintain. If acquired they ultimately need to be replaced due to wear and tear during demonstrations. The use of lectures and plain models devoid of anatomical details to teach practical surgical skills is referred to as traditional teaching methods in this research. These challenges prompted the researchers to propose 3D animation illustrations as an option worth exploring. None of the departments in the faculty of medicine use 3D animations as a teaching method.
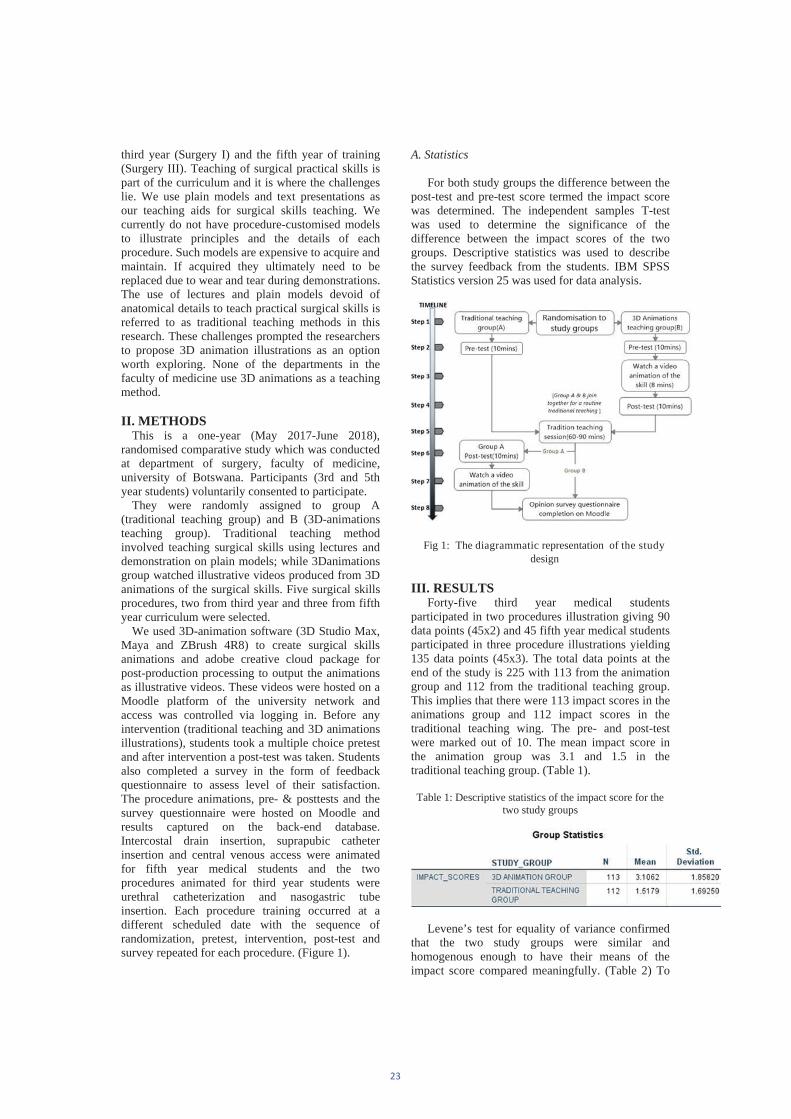
II. METHODS This is a one-year (May 2017-June 2018),
randomised comparative study which was conducted at department of surgery, faculty of medicine, university of Botswana. Participants (3rd and 5th year students) voluntarily consented to participate.
They were randomly assigned to group A (traditional teaching group) and B (3D-animations teaching group). Traditional teaching method involved teaching surgical skills using lectures and demonstration on plain models; while 3Danimations group watched illustrative videos produced from 3D animations of the surgical skills. Five surgical skills procedures, two from third year and three from fifth year curriculum were selected.
We used 3D-animation software (3D Studio Max, Maya and ZBrush 4R8) to create surgical skills animations and adobe creative cloud package for post-production processing to output the animations as illustrative videos. These videos were hosted on a Moodle platform of the university network and access was controlled via logging in. Before any intervention (traditional teaching and 3D animations illustrations), students took a multiple choice pretest and after intervention a post-test was taken. Students also completed a survey in the form of feedback questionnaire to assess level of their satisfaction. The procedure animations, pre- & posttests and the survey questionnaire were hosted on Moodle and results captured on the back-end database. Intercostal drain insertion, suprapubic catheter insertion and central venous access were animated for fifth year medical students and the two procedures animated for third year students were urethral catheterization and nasogastric tube insertion. Each procedure training occurred at a different scheduled date with the sequence of randomization, pretest, intervention, post-test and survey repeated for each procedure. (Figure 1).
A. Statistics
For both study groups the difference between the post-test and pre-test score termed the impact score was determined. The independent samples T-test was used to determine the significance of the difference between the impact scores of the two groups. Descriptive statistics was used to describe the survey feedback from the students. IBM SPSS Statistics version 25 was used for data analysis.
Fig 1: The diagrammatic representation of the study design
III. RESULTS Forty-five third year medical students
participated in two procedures illustration giving 90 data points (45x2) and 45 fifth year medical students participated in three procedure illustrations yielding 135 data points (45x3). The total data points at the end of the study is 225 with 113 from the animation group and 112 from the traditional teaching group. This implies that there were 113 impact scores in the animations group and 112 impact scores in the traditional teaching wing. The pre- and post-test were marked out of 10. The mean impact score in the animation group was 3.1 and 1.5 in the traditional teaching group. (Table 1).
Table 1: Descriptive statistics of the impact score for the two study groups
Levene’s test for equality of variance confirmed that the two study groups were similar and homogenous enough to have their means of the impact score compared meaningfully. (Table 2) To
23
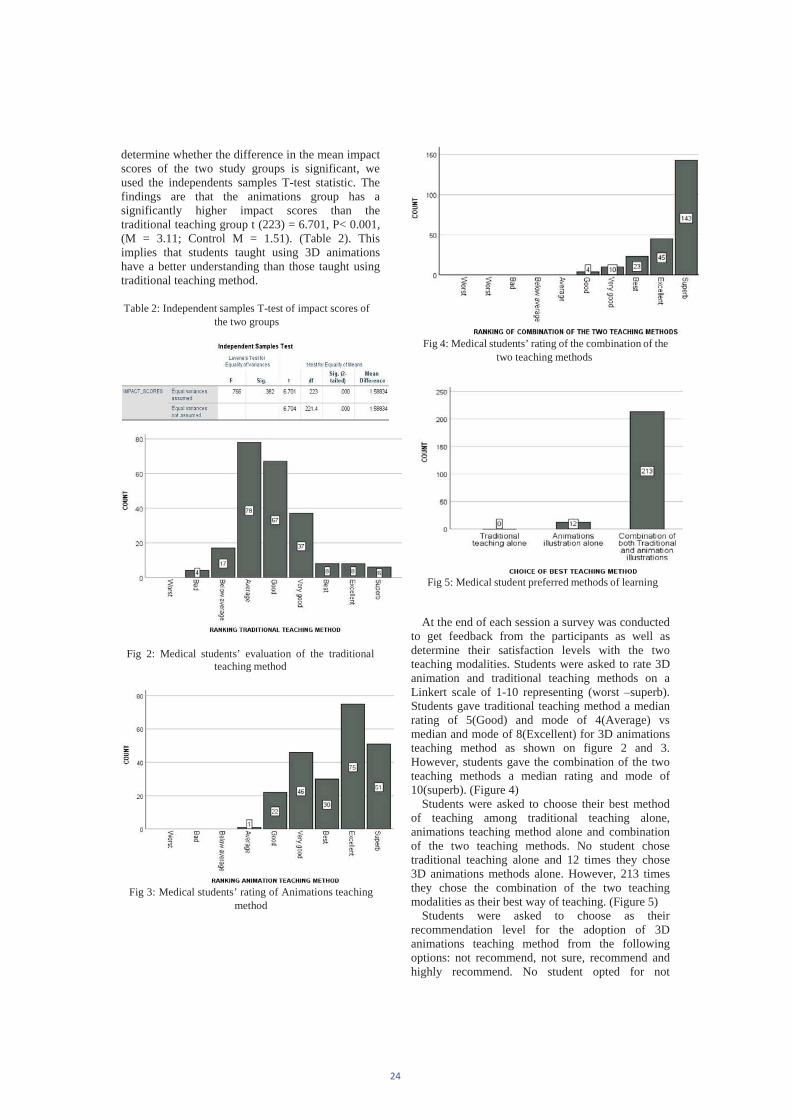
determine whether the difference in the mean impact scores of the two study groups is significant, we used the independents samples T-test statistic. The findings are that the animations group has a significantly higher impact scores than the traditional teaching group t (223) = 6.701, P< 0.001, (M = 3.11; Control M = 1.51). (Table 2). This implies that students taught using 3D animations have a better understanding than those taught using traditional teaching method.
Table 2: Independent samples T-test of impact scores of the two groups
Fig 2: Medical students’ evaluation of the traditional teaching method
Fig 3: Medical students’ rating of Animations teaching method
Fig 4: Medical students’ rating of the combination of the two teaching methods
Fig 5: Medical student preferred methods of learning
At the end of each session a survey was conducted to get feedback from the participants as well as determine their satisfaction levels with the two teaching modalities. Students were asked to rate 3D animation and traditional teaching methods on a Linkert scale of 1-10 representing (worst –superb). Students gave traditional teaching method a median rating of 5(Good) and mode of 4(Average) vs median and mode of 8(Excellent) for 3D animations teaching method as shown on figure 2 and 3. However, students gave the combination of the two teaching methods a median rating and mode of 10(superb). (Figure 4)
Students were asked to choose their best method of teaching among traditional teaching alone, animations teaching method alone and combination of the two teaching methods. No student chose traditional teaching alone and 12 times they chose 3D animations methods alone. However, 213 times they chose the combination of the two teaching modalities as their best way of teaching. (Figure 5)
Students were asked to choose as their recommendation level for the adoption of 3D animations teaching method from the following options: not recommend, not sure, recommend and highly recommend. No student opted for not
24
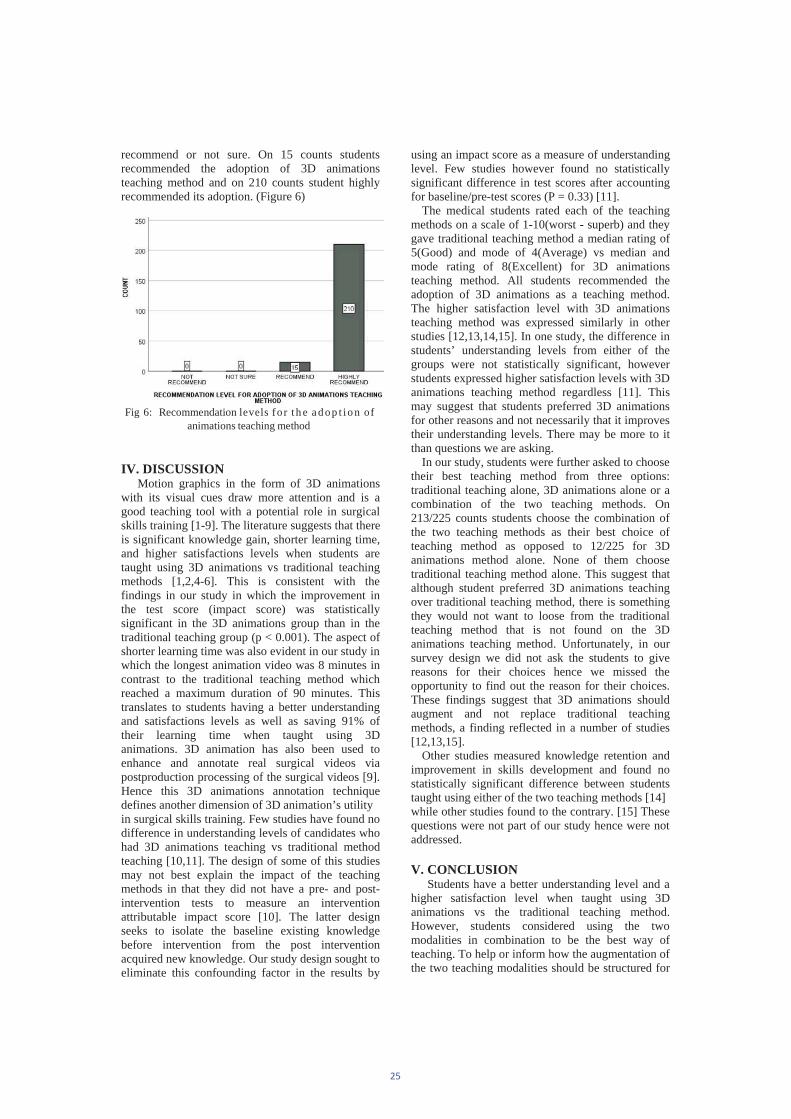
recommend or not sure. On 15 counts students recommended the adoption of 3D animations teaching method and on 210 counts student highly recommended its adoption. (Figure 6)
Fig 6: Recommendation levels fo r t h e a d op t io n of animations teaching method
IV. DISCUSSION Motion graphics in the form of 3D animations
with its visual cues draw more attention and is a good teaching tool with a potential role in surgical skills training [1-9]. The literature suggests that there is significant knowledge gain, shorter learning time, and higher satisfactions levels when students are taught using 3D animations vs traditional teaching methods [1,2,4-6]. This is consistent with the findings in our study in which the improvement in the test score (impact score) was statistically significant in the 3D animations group than in the traditional teaching group (p < 0.001). The aspect of shorter learning time was also evident in our study in which the longest animation video was 8 minutes in contrast to the traditional teaching method which reached a maximum duration of 90 minutes. This translates to students having a better understanding and satisfactions levels as well as saving 91% of their learning time when taught using 3D animations. 3D animation has also been used to enhance and annotate real surgical videos via postproduction processing of the surgical videos [9]. Hence this 3D animations annotation technique defines another dimension of 3D animation’s utility in surgical skills training. Few studies have found no difference in understanding levels of candidates who had 3D animations teaching vs traditional method teaching [10,11]. The design of some of this studies may not best explain the impact of the teaching methods in that they did not have a pre- and post-intervention tests to measure an intervention attributable impact score [10]. The latter design seeks to isolate the baseline existing knowledge before intervention from the post intervention acquired new knowledge. Our study design sought to eliminate this confounding factor in the results by
using an impact score as a measure of understanding level. Few studies however found no statistically significant difference in test scores after accounting for baseline/pre-test scores (P = 0.33) [11].
The medical students rated each of the teaching methods on a scale of 1-10(worst - superb) and they gave traditional teaching method a median rating of 5(Good) and mode of 4(Average) vs median and mode rating of 8(Excellent) for 3D animations teaching method. All students recommended the adoption of 3D animations as a teaching method. The higher satisfaction level with 3D animations teaching method was expressed similarly in other studies [12,13,14,15]. In one study, the difference in students’ understanding levels from either of the groups were not statistically significant, however students expressed higher satisfaction levels with 3D animations teaching method regardless [11]. This may suggest that students preferred 3D animations for other reasons and not necessarily that it improves their understanding levels. There may be more to it than questions we are asking.
In our study, students were further asked to choose their best teaching method from three options: traditional teaching alone, 3D animations alone or a combination of the two teaching methods. On 213/225 counts students choose the combination of the two teaching methods as their best choice of teaching method as opposed to 12/225 for 3D animations method alone. None of them choose traditional teaching method alone. This suggest that although student preferred 3D animations teaching over traditional teaching method, there is something they would not want to loose from the traditional teaching method that is not found on the 3D animations teaching method. Unfortunately, in our survey design we did not ask the students to give reasons for their choices hence we missed the opportunity to find out the reason for their choices. These findings suggest that 3D animations should augment and not replace traditional teaching methods, a finding reflected in a number of studies [12,13,15].
Other studies measured knowledge retention and improvement in skills development and found no statistically significant difference between students taught using either of the two teaching methods [14] while other studies found to the contrary. [15] These questions were not part of our study hence were not addressed.
V. CONCLUSIONStudents have a better understanding level and a
higher satisfaction level when taught using 3D animations vs the traditional teaching method. However, students considered using the two modalities in combination to be the best way of teaching. To help or inform how the augmentation of the two teaching modalities should be structured for
25
a higher efficacy, a further study would be required to find out why students unanimously preferred teaching using a combination of the two teaching methods. The cost effectiveness assessment and ultimately validation of this teaching tool are milestones to be achieved.
VI. DECLARATIONS The authors declare no conflict of interest.
Ethical approval for this study was granted by the University of Botswana office of research and development (ORD). Participants freely and voluntarily consented to take part in the study.
REFERENCES
[1] Ahmet A, Gamze K, Rustem M, Sezen KA. Is Video-Based Education an Effective Method in Surgical Education? A Systematic Review. J Surg Educ. 2018.
[2] Clements DN, Broadhurst H, Clarke SP, Farrell M, Bennett D, Mosley JR, et al. Theeffectiveness of 3D animations to enhance understanding of cranial cruciate ligament rupture. J Vet Med Educ. 2013;40(1):29-34.
[3] Qualter J, Fana M, Deluccia N, Colen K, Scharf C, Hazen A. Visualizing treatment options for breast reconstructive surgery. Stud Health Technol Inform. 2009;142:262-4.
[4] Marsh KR, Giffin BF, Lowrie DJ, Jr. Medicalstudent retention of embryonic development: impact of the dimensions added by multimedia tutorials. Anat Sci Educ. 2008;1(6):252-7.
[5] Lim MW, Burt G, Rutter SV. Use of three-dimensional animation for regional anaesthesia teaching: application to interscalene brachial plexus blockade. Br J Anaesth. 2005;94(3): 372-7.
[6] Mehrabi A, Glückstein C, Benner A, Hashemi B, Herfarth C, Kallinowski F. A new way for surgical education-development and evaluation of a computer-based training module. Comput Biol Med. 2000;30(2):97-109.
[7] Guttmann GD. Animating functional anatomy for the web. Anat Rec. 2000;261(2):57-63.
[8] Fung A, Kelly P, Tait G, Greig PD, McGilvray ID. Creating an animation-enhanced video library of hepato-pancreatobiliary and transplantation surgical procedures. J Vis Commun Med. 2016;39(1-2):27-32.
[9] Sundsten JW, Kastella KG, Conley DM. Videodisc animation of 3D computer reconstructions of the human brain. J Biocommun. 1991;18(2):45-9.
[10]Mata CA, Ota LH, Suzuki I, Telles A, Miotto A, Leão LE. Web-based versus traditional lecture: are they equally effective as a flexible bronchoscopy teaching method? Interact Cardiovasc Thorac Surg. 2012;14(1):38-40.
[11] Keedy AW, Durack JC, Sandhu P, Chen EM, O'Sullivan PS, Breiman RS. Comparison of traditional methods with 3D computer models in the instruction of hepatobiliary anatomy. Anat Sci Educ. 2011;4(2):84-91.
[12]Prinz A, Bolz M, Findl O. Advantage of three dimensional animated teaching over traditional surgical videos for teaching ophthalmic surgery: a randomised study. Br J Ophthalmol. 2005;89(11):1495-9.
[13] Kobayashi M, Nakajima T, Mori A, Tanaka D, Fujino T, Chiyokura H. Three-dimensionalcomputer graphics for surgical procedure learning: Web three-dimensional application for cleft lip repair. Cleft Palate Craniofac J. 2006;43(3):266-71.
[14]Nousiainen M, Brydges R, Backstein D, Dubrowski A. Comparison of expert instruction and computer-based video training in teaching fundamental surgical skills to medical students.Surgery. 2008;143(4):539-44.
[15] Glittenberg C, Binder S. Using 3D computer simulations to enhance ophthalmic training.Ophthalmic Physiol Opt. 2006;26(1):40-9.
26
Weed species composition and diversity in flood recession farming in the Okavango Delta, Botswana
Modise Nthabaa, Keotshepile Kashea
aOkavango Research Institute
Corresponding Email: [email protected]
Abstract Flood recession farming locally known as molapo farming is an important livelihood activity for resource poor and vulnerable riparian farming communities around the Okavango Delta. A good understanding of the weed species composition and diversity in molapo farming is a pre-requisite for development of effective weed management strategies. Furthermore, it could help us understand the ecology and potential threats of status of weeds in seasonal floodplains used as molapo farming areas. The study was conducted in molapo farming areas in the villages of Shorobe, Makalamabedi and around Lake Ngami to determine the weed species composition and diversity in molapo farming. A total of 36 fields were randomly selected by Microsoft excel random number generator.Vegetation sampling was done using gradient oriented transects laid parallel to each other and spaced 20 m apart from the lower to upper gradient in each molapo field. Weed species composition and diversity were then recorded in 1m2 quadrats placed along each transect at 10 m interval. The number of quadrats placed depended on the area of the fields. To determine weedsspecies community composition, hierarchical cluster analysis was performed using Sorensen distance measure with flexible beta linkage ( = -0.25). Indicator values for the weeds species were derived from indicator species analysis. Multi response permutation procedure was used to test for the hypothesis of no significant difference between the groups of species communities. These procedures were carried out in PC-ORD. Kruskal-Wallis test was used to test for statistically significant difference in speciesdiversity and evenness between the weed species communities. A total of 101 weeds species were enumerated and belonged to 24 different families. Weeds species communities determined were Cynodon dactylon-Bulbostylis hispidula, Sida cordifolia-Corchorus tridens, Glinus oppositifolius-Heliotropium ovalifolium and Sida alba-abutilon angulatum. Pairwise comparison suggested that there was a statistically significant difference between the species communities (p 0.001) with a stronger separation between Cynodon dactylon-Bulbostylis hispidula and Sida cordifolia-Corchorus tridens communities. There was no significant difference in Shannon’s diversity index (p 0.05) between the weed species communities. The distribution of species (species evenness) across the communities was statistically significant (p 0.05). Sida alba-abutilon angulatum community recorded the highest median value (Md = 0.767) while Cynodon dactylon-Bulbostylis hispidula community recorded the lowest median value (Md= 0.507) in comparison to other weed species communities. Flood recession farming fields were dominated by common weed species which are also troublesome in dryland arable farming. Therefore weed control methods that are not detrimental to the delta ecosystem through practices like conservation agriculture should be encouraged among the famers of this smallholder subsistencefarming practice.
KeywordsCommunity Composition, Diversity, Molapo farming, Weed species.
1. Introduction
Flood recession farming is practiced around the world where there are lakes, flood plains or wetlands. In this farming system, crops are planted in seasonally flooded floodplains or river banks following receding water. Flood recession farming is practiced in countries such as China and Malaysia (Juraimi 2011), the Philippines (De Datta 1979), Cambodia (Fox 1999) and Brazil (Shorr, 2000). In Africa it is an old practice that dates back to at least 5000 years in the case of Egypt’s Nile valley (Scudder 1991; Richter et al. 2010). Because of this historical tradition, there is rich knowledge of floodplain farming in West Africa especially along the Niger, Sokoto, Rima, Senegal Rivers, the Sudd Swamps of the Sudan, the Omo Valley in Ethiopia, Tana River in Kenya, Rufiji River in Tanzania, the Zambezi and Lufira rivers in Zaire (Barrow, 1999). Furthermore, the presence of early-maturing and drought-resistant varieties of millet and sorghum suggests that flood-recession cultivation was historically widespread on the continent (Scudder
1991; Richter et al 2010). In Botswana, flood recession farming, locally
called molapo farming is mostly practiced along the fringes of the Okavango Delta (Figure 1). It is an important land use and livelihood activity for the rural poor and vulnerable riparian communities that reside around the Okavango Delta (Motsumi et al 2012). Flooding in the Delta enhances ecosystem services by supplying water and nutrients to support the rich biodiversity (Ellery et al. 2003) and household livelihoods in the Delta (Motsholapheko et al. 2011). More importantly, annual flooding naturally provides moisture and fertilise molapo farms and as water starts to retreat in October farmers start to plough and plant crops (Oosterbaan et al. 1987). Due to these favourable environments, crops tend to produce better yields compared with dryland farming. For instance, sorghum grain yield ranges from 1,800 to 2,900 kg ha-1 in molapo farming, whereas; under dry-land it could be as low as 121 kg ha-1 (Bendsen 2002; Arntzen 2005).
Despite its potential to increase crop productivity, molapo farming has some challenges. The challenges mainly associated with molapo
27
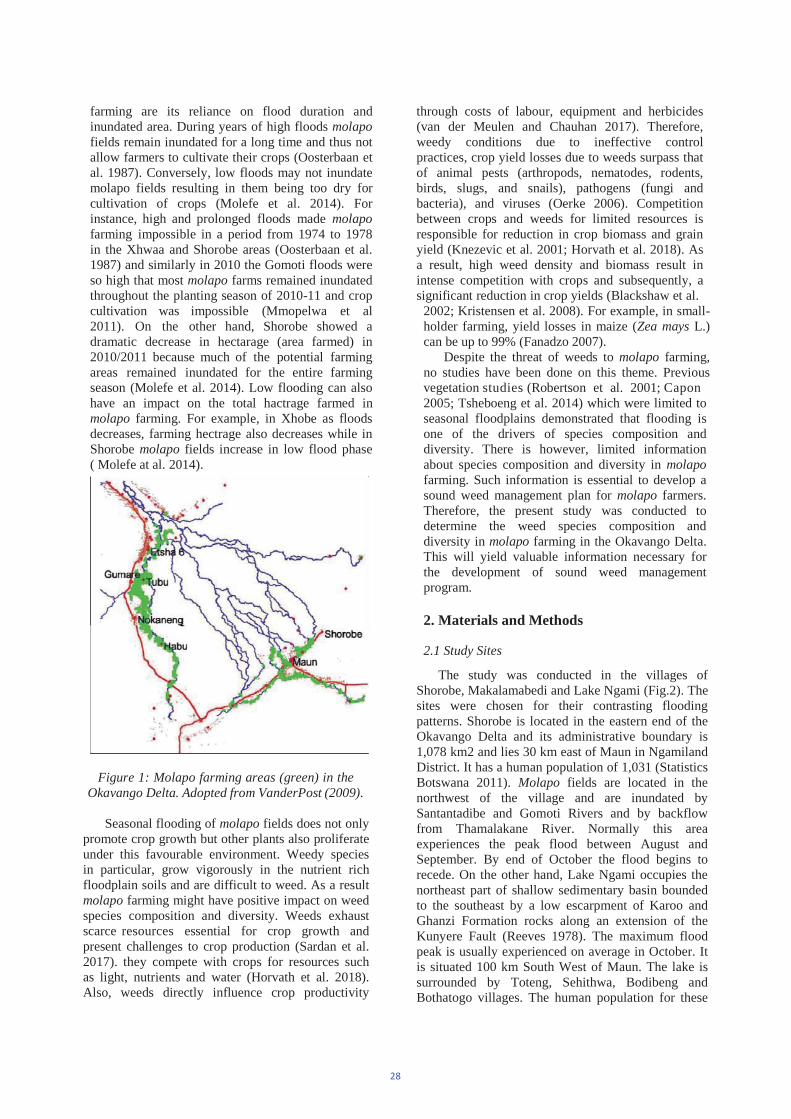
farming are its reliance on flood duration and inundated area. During years of high floods molapo fields remain inundated for a long time and thus not allow farmers to cultivate their crops (Oosterbaan et al. 1987). Conversely, low floods may not inundate molapo fields resulting in them being too dry for cultivation of crops (Molefe et al. 2014). For instance, high and prolonged floods made molapo farming impossible in a period from 1974 to 1978 in the Xhwaa and Shorobe areas (Oosterbaan et al. 1987) and similarly in 2010 the Gomoti floods were so high that most molapo farms remained inundated throughout the planting season of 2010-11 and crop cultivation was impossible (Mmopelwa et al 2011). On the other hand, Shorobe showed a dramatic decrease in hectarage (area farmed) in 2010/2011 because much of the potential farming areas remained inundated for the entire farming season (Molefe et al. 2014). Low flooding can also have an impact on the total hactrage farmed in molapo farming. For example, in Xhobe as floods decreases, farming hectrage also decreases while in Shorobe molapo fields increase in low flood phase ( Molefe at al. 2014).
Figure 1: Molapo farming areas (green) in the Okavango Delta. Adopted from VanderPost (2009).
Seasonal flooding of molapo fields does not only promote crop growth but other plants also proliferate under this favourable environment. Weedy species in particular, grow vigorously in the nutrient rich floodplain soils and are difficult to weed. As a result molapo farming might have positive impact on weed species composition and diversity. Weeds exhaust scarce resources essential for crop growth and present challenges to crop production (Sardan et al. 2017). they compete with crops for resources such as light, nutrients and water (Horvath et al. 2018). Also, weeds directly influence crop productivity
through costs of labour, equipment and herbicides (van der Meulen and Chauhan 2017). Therefore, weedy conditions due to ineffective control practices, crop yield losses due to weeds surpass that of animal pests (arthropods, nematodes, rodents, birds, slugs, and snails), pathogens (fungi and bacteria), and viruses (Oerke 2006). Competition between crops and weeds for limited resources is responsible for reduction in crop biomass and grain yield (Knezevic et al. 2001; Horvath et al. 2018). As a result, high weed density and biomass result in intense competition with crops and subsequently, a significant reduction in crop yields (Blackshaw et al.
2002; Kristensen et al. 2008). For example, in small- holder farming, yield losses in maize (Zea mays L.) can be up to 99% (Fanadzo 2007).
Despite the threat of weeds to molapo farming, no studies have been done on this theme. Previous vegetation studies (Robertson et al. 2001; Capon 2005; Tsheboeng et al. 2014) which were limited to seasonal floodplains demonstrated that flooding is one of the drivers of species composition and diversity. There is however, limited information about species composition and diversity in molapo farming. Such information is essential to develop a sound weed management plan for molapo farmers. Therefore, the present study was conducted to determine the weed species composition and diversity in molapo farming in the Okavango Delta. This will yield valuable information necessary for the development of sound weed management program.
2. Materials and Methods
2.1 Study Sites
The study was conducted in the villages of Shorobe, Makalamabedi and Lake Ngami (Fig.2). The sites were chosen for their contrasting flooding patterns. Shorobe is located in the eastern end of the Okavango Delta and its administrative boundary is 1,078 km2 and lies 30 km east of Maun in Ngamiland District. It has a human population of 1,031 (Statistics Botswana 2011). Molapo fields are located in the northwest of the village and are inundated by Santantadibe and Gomoti Rivers and by backflow from Thamalakane River. Normally this area experiences the peak flood between August and September. By end of October the flood begins to recede. On the other hand, Lake Ngami occupies the northeast part of shallow sedimentary basin bounded to the southeast by a low escarpment of Karoo and Ghanzi Formation rocks along an extension of the Kunyere Fault (Reeves 1978). The maximum flood peak is usually experienced on average in October. It is situated 100 km South West of Maun. The lake is surrounded by Toteng, Sehithwa, Bodibeng and Bothatogo villages. The human population for these
28
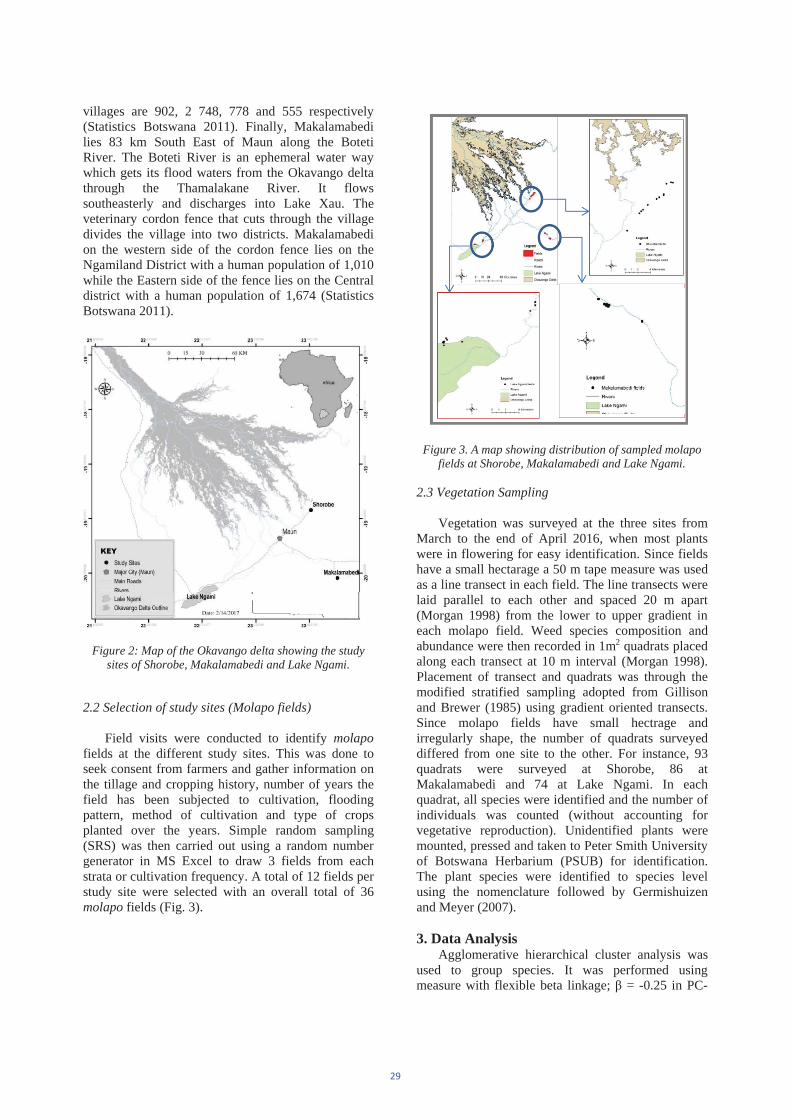
villages are 902, 2 748, 778 and 555 respectively (Statistics Botswana 2011). Finally, Makalamabedi lies 83 km South East of Maun along the Boteti River. The Boteti River is an ephemeral water way which gets its flood waters from the Okavango delta through the Thamalakane River. It flows southeasterly and discharges into Lake Xau. The veterinary cordon fence that cuts through the village divides the village into two districts. Makalamabedi on the western side of the cordon fence lies on the Ngamiland District with a human population of 1,010 while the Eastern side of the fence lies on the Central district with a human population of 1,674 (Statistics Botswana 2011).
Figure 2: Map of the Okavango delta showing the study sites of Shorobe, Makalamabedi and Lake Ngami.
2.2 Selection of study sites (Molapo fields)
Field visits were conducted to identify molapo fields at the different study sites. This was done to seek consent from farmers and gather information on the tillage and cropping history, number of years the field has been subjected to cultivation, flooding pattern, method of cultivation and type of crops planted over the years. Simple random sampling (SRS) was then carried out using a random number generator in MS Excel to draw 3 fields from each strata or cultivation frequency. A total of 12 fields per study site were selected with an overall total of 36 molapo fields (Fig. 3).
Figure 3. A map showing distribution of sampled molapo fields at Shorobe, Makalamabedi and Lake Ngami.
2.3 Vegetation Sampling
Vegetation was surveyed at the three sites from March to the end of April 2016, when most plants were in flowering for easy identification. Since fields have a small hectarage a 50 m tape measure was used as a line transect in each field. The line transects were laid parallel to each other and spaced 20 m apart (Morgan 1998) from the lower to upper gradient in each molapo field. Weed species composition and abundance were then recorded in 1m2 quadrats placed along each transect at 10 m interval (Morgan 1998). Placement of transect and quadrats was through the modified stratified sampling adopted from Gillison and Brewer (1985) using gradient oriented transects. Since molapo fields have small hectrage and irregularly shape, the number of quadrats surveyed differed from one site to the other. For instance, 93 quadrats were surveyed at Shorobe, 86 at Makalamabedi and 74 at Lake Ngami. In each quadrat, all species were identified and the number of individuals was counted (without accounting for vegetative reproduction). Unidentified plants were mounted, pressed and taken to Peter Smith University of Botswana Herbarium (PSUB) for identification. The plant species were identified to species level using the nomenclature followed by Germishuizen and Meyer (2007).
3. Data Analysis Agglomerative hierarchical cluster analysis was
used to group species. It was performed using measure with flexible beta linkage; = -0.25 in PC-
29

ORD 6 software (McCune and Mefford, 2011). This was done by Clustering groups of species based on the number of times they occur with each other in the field quadrat data. Indicator Species Analysis (Dufrene & Legendre, 1997) was used to calculate indicator values for species in groups determined from cluster analysis. Each group was named using the weed species with the highest indicator value and a significant p-value (p 0.05). Multi response permutation procedure (MRPP) was used in testing the hypothesis of no difference between the groups of species communities in molapo farming using the Sorensen distance measure. The test statistic T was calculated as: T= ( observed - expected) / s.dev expected). This determines the separation between weed species communities, with more negative values indicating stronger separation. Within group homogeneity is determined by the effect size or chance-corrected within group agreement A=1- ( observed/ expected). A =1 when all items are identical within groups ( =0), A=0 when heterogeneity within groups equals expectation by chance, A<0 with more heterogeneity within groups than expected by chance. Kruskal-Wallis test was then used to test for statistically significant differences in species diversity between the species communities and test the hypothesis that the distribution of species evenness is the same across the species communities.
4. Results
4.1 Number of weed species
A total of 101 weeds species were enumerated in the entire flood recession area (Table 1). These species belonged to 24 different families. The family with the most species was Poaceae (Table 1). It constituted 25 different species with density of 8064.82 individuals per hectare. This was followed by the family Fabaceae comprising of 17 species with species density of 1576.38 species per hectare. Malvaceae had 9 species, while Cyperaceae had 8 species. Convolvulaceae and Amaranthaceae families had 6 species in each. Majority of the families enumerated had less than five species. Five (5) species belonged to Asteraceae family. Tiliaceae and Rubiaceae families had 3 species each. Only 2 species were recorded in the Sterculiaceae, Solanaceae, Polygonaceae and Molluginaceae families. Eleven (11) families recorded 1 species in each.
4.2 Indicator Species Analysis
The number of weed species communities was determined at 4 divisions where the p-value (p .05) was minimised (Fig. 4). The main weed species communities identified were Cynodon dactylon-
Bulbostylis hispidula Sida cordifolia-Corchorus tridens, Glinus oppositifolius-Heliotropium ovalifolium and Sida alba-Abitulon angulatum (Fig.5).
Table 1: Families of species showing the number of species in each family and density of individual species.
Figure 4. Determination of number of ecologically meaningful clusters for weedy species classification.
30
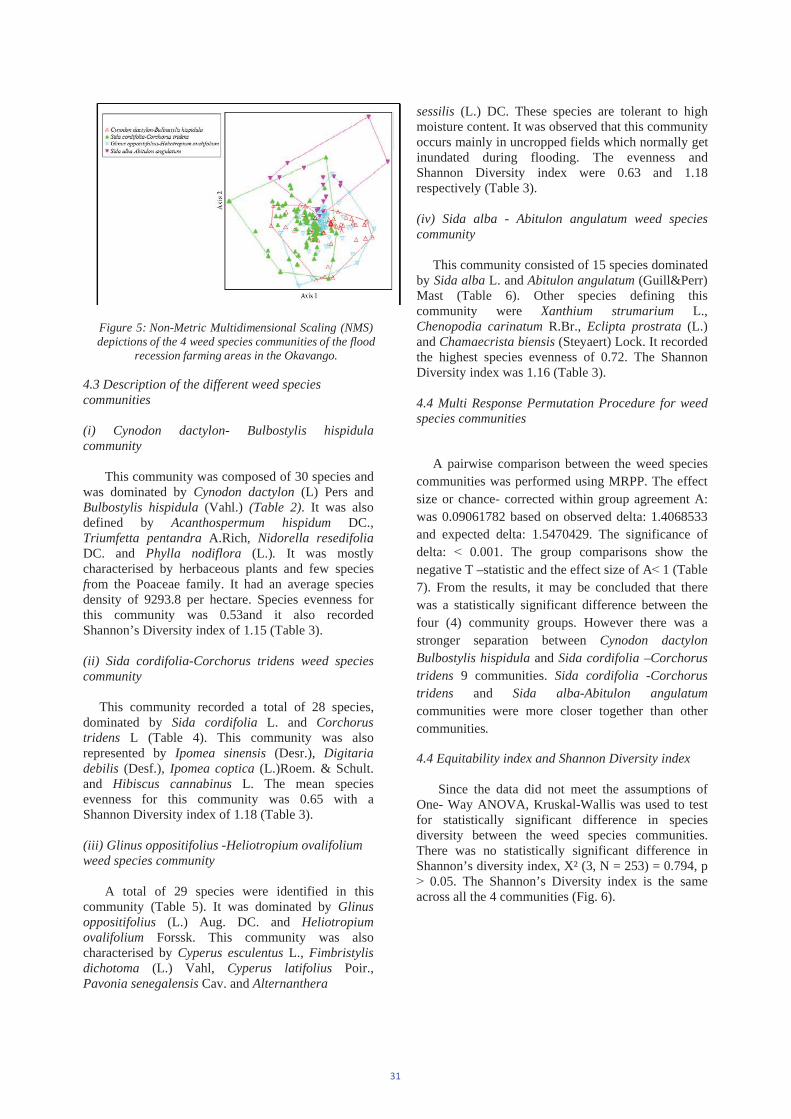
Figure 5: Non-Metric Multidimensional Scaling (NMS) depictions of the 4 weed species communities of the flood
recession farming areas in the Okavango.
4.3 Description of the different weed species communities
(i) Cynodon dactylon- Bulbostylis hispidula community
This community was composed of 30 species andwas dominated by Cynodon dactylon (L) Pers andBulbostylis hispidula (Vahl.) (Table 2). It was alsodefined by Acanthospermum hispidum DC.,Triumfetta pentandra A.Rich, Nidorella resedifolia DC. and Phylla nodiflora (L.). It was mostlycharacterised by herbaceous plants and few speciesfrom the Poaceae family. It had an average speciesdensity of 9293.8 per hectare. Species evenness forthis community was 0.53and it also recordedShannon’s Diversity index of 1.15 (Table 3).
(ii) Sida cordifolia-Corchorus tridens weed species community
This community recorded a total of 28 species, dominated by Sida cordifolia L. and Corchorustridens L (Table 4). This community was also represented by Ipomea sinensis (Desr.), Digitariadebilis (Desf.), Ipomea coptica (L.)Roem. & Schult. and Hibiscus cannabinus L. The mean species evenness for this community was 0.65 with a Shannon Diversity index of 1.18 (Table 3).
(iii) Glinus oppositifolius -Heliotropium ovalifolium weed species community
A total of 29 species were identified in this community (Table 5). It was dominated by Glinusoppositifolius (L.) Aug. DC. and Heliotropiumovalifolium Forssk. This community was also characterised by Cyperus esculentus L., Fimbristylisdichotoma (L.) Vahl, Cyperus latifolius Poir.,Pavonia senegalensis Cav. and Alternanthera
sessilis (L.) DC. These species are tolerant to high moisture content. It was observed that this community occurs mainly in uncropped fields which normally get inundated during flooding. The evenness and Shannon Diversity index were 0.63 and 1.18 respectively (Table 3).
(iv) Sida alba - Abitulon angulatum weed species community
This community consisted of 15 species dominated by Sida alba L. and Abitulon angulatum (Guill&Perr) Mast (Table 6). Other species defining this community were Xanthium strumarium L., Chenopodia carinatum R.Br., Eclipta prostrata (L.)and Chamaecrista biensis (Steyaert) Lock. It recorded the highest species evenness of 0.72. The Shannon Diversity index was 1.16 (Table 3).
4.4 Multi Response Permutation Procedure for weed species communities
A pairwise comparison between the weed species communities was performed using MRPP. The effect size or chance- corrected within group agreement A: was 0.09061782 based on observed delta: 1.4068533 and expected delta: 1.5470429. The significance of delta: 0.001. The group comparisons show the negative T –statistic and the effect size of A 1 (Table 7). From the results, it may be concluded that there was a statistically significant difference between the four (4) community groups. However there was a stronger separation between Cynodon dactylon Bulbostylis hispidula and Sida cordifolia –Corchorus tridens 9 communities. Sida cordifolia -Corchorus tridens and Sida alba-Abitulon angulatum communities were more closer together than other communities.
4.4 Equitability index and Shannon Diversity index
Since the data did not meet the assumptions of One- Way ANOVA, Kruskal-Wallis was used to test for statistically significant difference in species diversity between the weed species communities. There was no statistically significant difference in Shannon’s diversity index, X² (3, N = 253) = 0.794, p
0.05. The Shannon’s Diversity index is the same across all the 4 communities (Fig. 6).
31
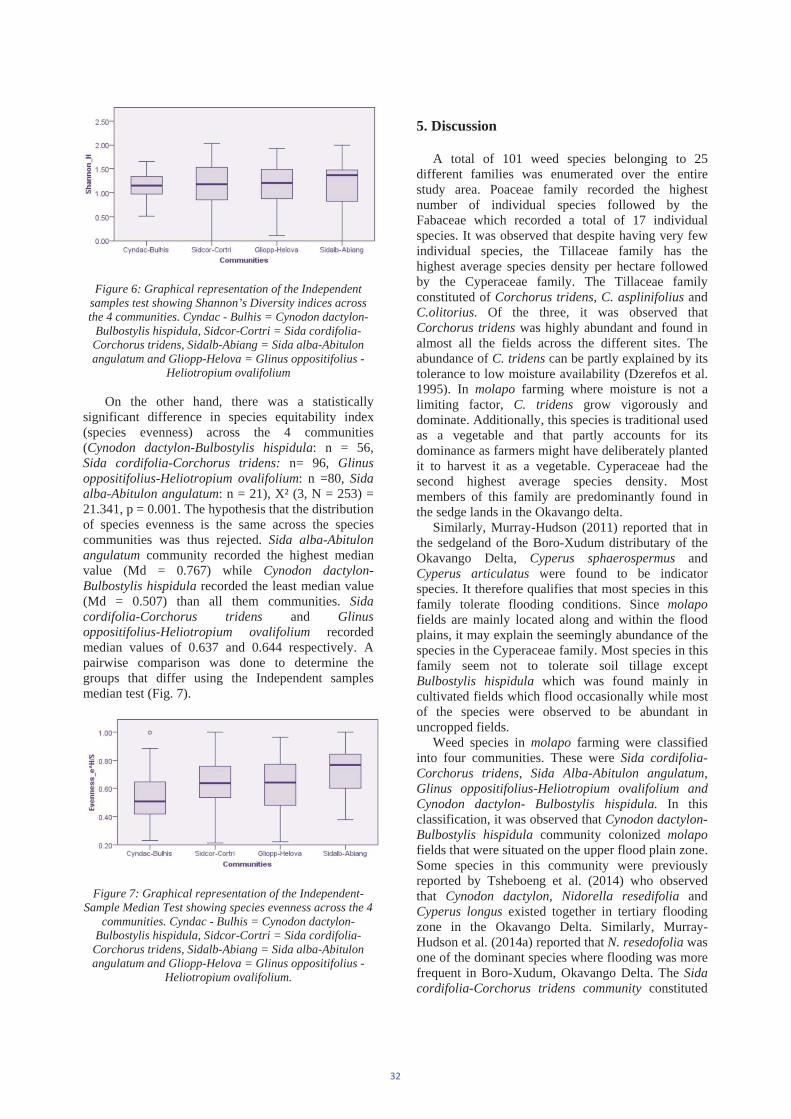
Figure 6: Graphical representation of the Independent samples test showing Shannon’s Diversity indices across the 4 communities. Cyndac - Bulhis = Cynodon dactylon-
Bulbostylis hispidula, Sidcor-Cortri = Sida cordifolia- Corchorus tridens, Sidalb-Abiang = Sida alba-Abitulon angulatum and Gliopp-Helova = Glinus oppositifolius -
Heliotropium ovalifolium
On the other hand, there was a statistically significant difference in species equitability index (species evenness) across the 4 communities (Cynodon dactylon-Bulbostylis hispidula: n = 56, Sida cordifolia-Corchorus tridens: n= 96, Glinusoppositifolius-Heliotropium ovalifolium: n =80, Sidaalba-Abitulon angulatum: n = 21), X² (3, N = 253) = 21.341, p = 0.001. The hypothesis that the distribution of species evenness is the same across the species communities was thus rejected. Sida alba-Abitulon angulatum community recorded the highest median value (Md = 0.767) while Cynodon dactylon-Bulbostylis hispidula recorded the least median value (Md = 0.507) than all them communities. Sida cordifolia-Corchorus tridens and Glinusoppositifolius-Heliotropium ovalifolium recorded median values of 0.637 and 0.644 respectively. A pairwise comparison was done to determine the groups that differ using the Independent samples median test (Fig. 7).
Figure 7: Graphical representation of the Independent- Sample Median Test showing species evenness across the 4
communities. Cyndac - Bulhis = Cynodon dactylon- Bulbostylis hispidula, Sidcor-Cortri = Sida cordifolia- Corchorus tridens, Sidalb-Abiang = Sida alba-Abitulon angulatum and Gliopp-Helova = Glinus oppositifolius -
Heliotropium ovalifolium.
5. Discussion
A total of 101 weed species belonging to 25 different families was enumerated over the entire study area. Poaceae family recorded the highest number of individual species followed by the Fabaceae which recorded a total of 17 individual species. It was observed that despite having very few individual species, the Tillaceae family has the highest average species density per hectare followed by the Cyperaceae family. The Tillaceae family constituted of Corchorus tridens, C. asplinifolius and C.olitorius. Of the three, it was observed that Corchorus tridens was highly abundant and found in almost all the fields across the different sites. The abundance of C. tridens can be partly explained by its tolerance to low moisture availability (Dzerefos et al. 1995). In molapo farming where moisture is not a limiting factor, C. tridens grow vigorously and dominate. Additionally, this species is traditional used as a vegetable and that partly accounts for its dominance as farmers might have deliberately planted it to harvest it as a vegetable. Cyperaceae had the second highest average species density. Most members of this family are predominantly found in the sedge lands in the Okavango delta.
Similarly, Murray-Hudson (2011) reported that in the sedgeland of the Boro-Xudum distributary of the Okavango Delta, Cyperus sphaerospermus andCyperus articulatus were found to be indicator species. It therefore qualifies that most species in this family tolerate flooding conditions. Since molapofields are mainly located along and within the flood plains, it may explain the seemingly abundance of the species in the Cyperaceae family. Most species in this family seem not to tolerate soil tillage except Bulbostylis hispidula which was found mainly in cultivated fields which flood occasionally while most of the species were observed to be abundant in uncropped fields.
Weed species in molapo farming were classified into four communities. These were Sida cordifolia-Corchorus tridens, Sida Alba-Abitulon angulatum,Glinus oppositifolius-Heliotropium ovalifolium andCynodon dactylon- Bulbostylis hispidula. In this classification, it was observed that Cynodon dactylon-Bulbostylis hispidula community colonized molapofields that were situated on the upper flood plain zone. Some species in this community were previously reported by Tsheboeng et al. (2014) who observed that Cynodon dactylon, Nidorella resedifolia andCyperus longus existed together in tertiary flooding zone in the Okavango Delta. Similarly, Murray-Hudson et al. (2014a) reported that N. resedofolia was one of the dominant species where flooding was more frequent in Boro-Xudum, Okavango Delta. The Sidacordifolia-Corchorus tridens community constituted
32
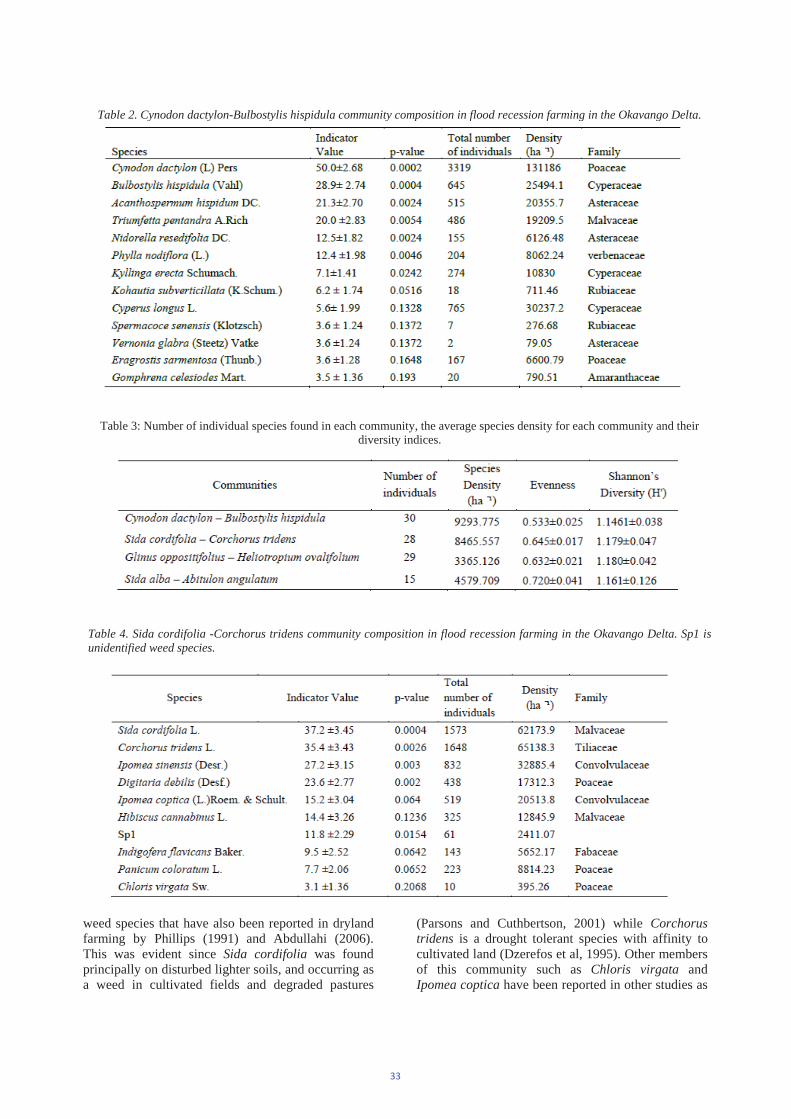
Table 2. Cynodon dactylon-Bulbostylis hispidula community composition in flood recession farming in the Okavango Delta.
Table 3: Number of individual species found in each community, the average species density for each community and their diversity indices.
Table 4. Sida cordifolia -Corchorus tridens community composition in flood recession farming in the Okavango Delta. Sp1 is unidentified weed species.
weed species that have also been reported in dryland farming by Phillips (1991) and Abdullahi (2006). This was evident since Sida cordifolia was found principally on disturbed lighter soils, and occurring as a weed in cultivated fields and degraded pastures
(Parsons and Cuthbertson, 2001) while Corchorus tridens is a drought tolerant species with affinity to cultivated land (Dzerefos et al, 1995). Other members of this community such as Chloris virgata andIpomea coptica have been reported in other studies as
33
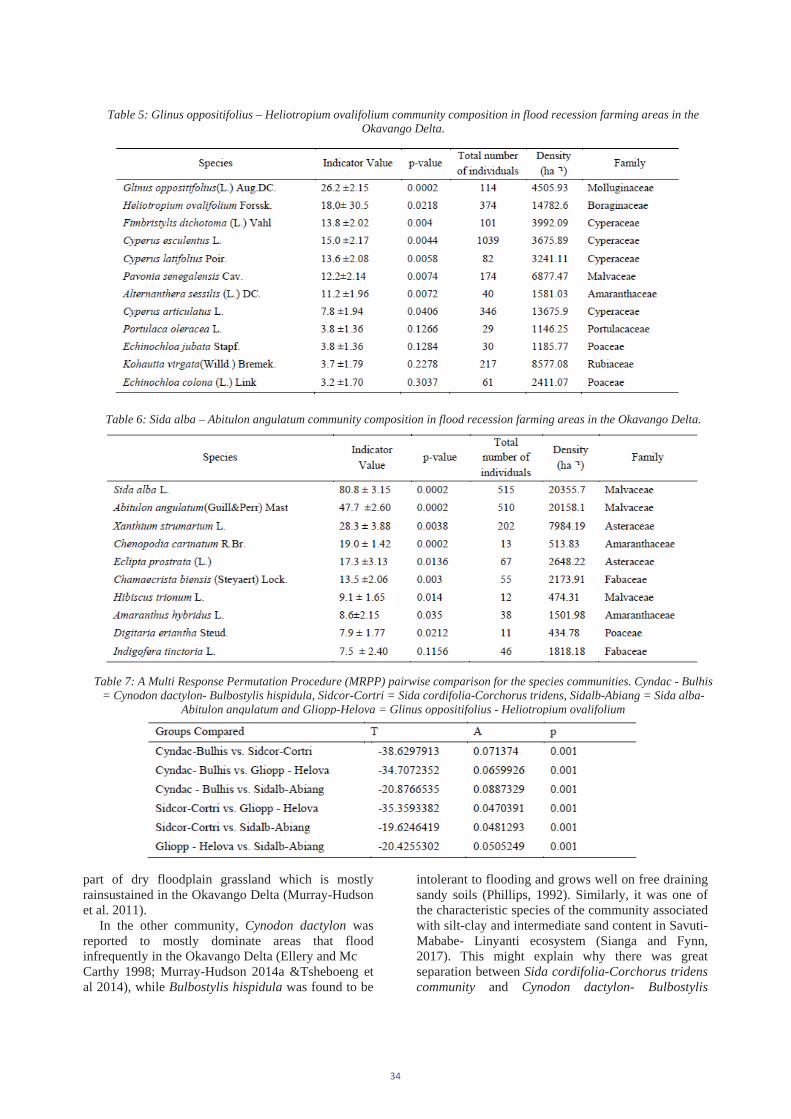
part of dry floodplain grassland which is mostly rainsustained in the Okavango Delta (Murray-Hudson et al. 2011).
In the other community, Cynodon dactylon was reported to mostly dominate areas that flood infrequently in the Okavango Delta (Ellery and Mc Carthy 1998; Murray-Hudson 2014a &Tsheboeng et al 2014), while Bulbostylis hispidula was found to be
intolerant to flooding and grows well on free draining sandy soils (Phillips, 1992). Similarly, it was one of the characteristic species of the community associated with silt-clay and intermediate sand content in Savuti-Mababe- Linyanti ecosystem (Sianga and Fynn, 2017). This might explain why there was great separation between Sida cordifolia-Corchorus tridenscommunity and Cynodon dactylon- Bulbostylis
Table 5: Glinus oppositifolius – Heliotropium ovalifolium community composition in flood recession farming areas in the Okavango Delta.
Table 6: Sida alba – Abitulon angulatum community composition in flood recession farming areas in the Okavango Delta.
Table 7: A Multi Response Permutation Procedure (MRPP) pairwise comparison for the species communities. Cyndac - Bulhis = Cynodon dactylon- Bulbostylis hispidula, Sidcor-Cortri = Sida cordifolia-Corchorus tridens, Sidalb-Abiang = Sida alba-
Abitulon angulatum and Gliopp-Helova = Glinus oppositifolius - Heliotropium ovalifolium
34
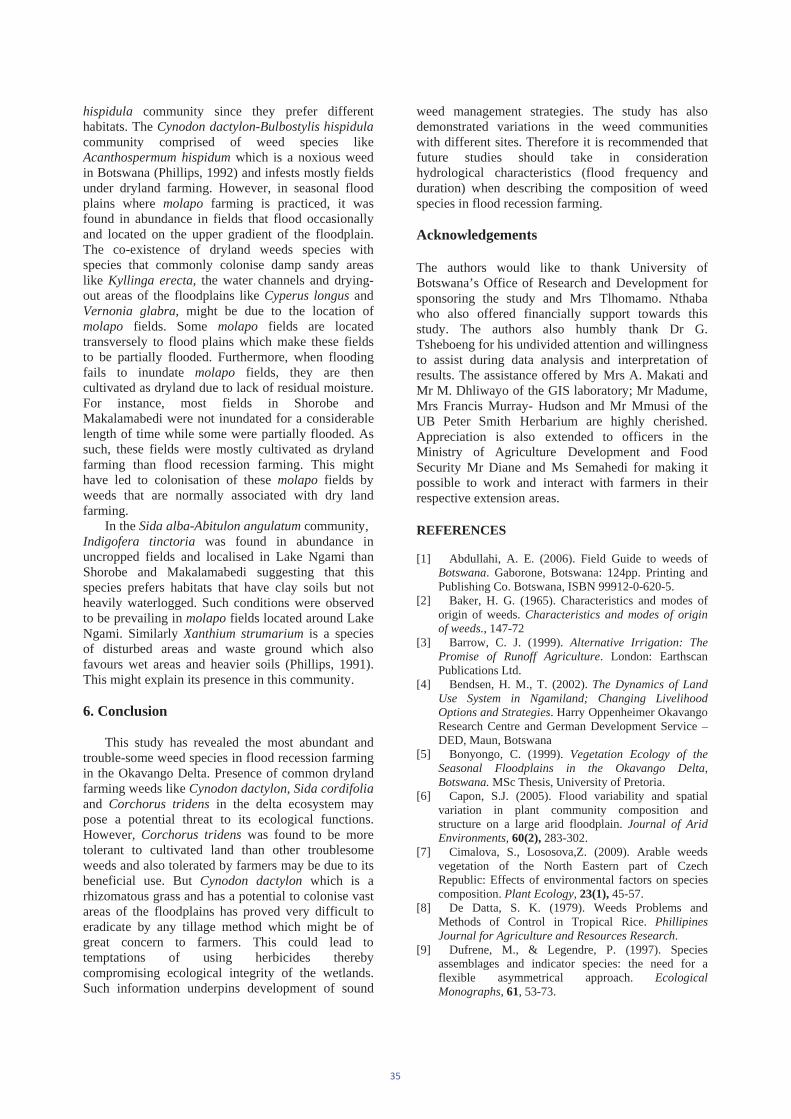
hispidula community since they prefer different habitats. The Cynodon dactylon-Bulbostylis hispidula community comprised of weed species like Acanthospermum hispidum which is a noxious weed in Botswana (Phillips, 1992) and infests mostly fields under dryland farming. However, in seasonal flood plains where molapo farming is practiced, it was found in abundance in fields that flood occasionally and located on the upper gradient of the floodplain. The co-existence of dryland weeds species with species that commonly colonise damp sandy areas like Kyllinga erecta, the water channels and drying-out areas of the floodplains like Cyperus longus and Vernonia glabra, might be due to the location of molapo fields. Some molapo fields are located transversely to flood plains which make these fields to be partially flooded. Furthermore, when flooding fails to inundate molapo fields, they are then cultivated as dryland due to lack of residual moisture. For instance, most fields in Shorobe and Makalamabedi were not inundated for a considerable length of time while some were partially flooded. As such, these fields were mostly cultivated as dryland farming than flood recession farming. This might have led to colonisation of these molapo fields by weeds that are normally associated with dry land farming.
In the Sida alba-Abitulon angulatum community, Indigofera tinctoria was found in abundance in uncropped fields and localised in Lake Ngami than Shorobe and Makalamabedi suggesting that this species prefers habitats that have clay soils but not heavily waterlogged. Such conditions were observed to be prevailing in molapo fields located around Lake Ngami. Similarly Xanthium strumarium is a species of disturbed areas and waste ground which also favours wet areas and heavier soils (Phillips, 1991). This might explain its presence in this community.
6. Conclusion
This study has revealed the most abundant and trouble-some weed species in flood recession farming in the Okavango Delta. Presence of common dryland farming weeds like Cynodon dactylon, Sida cordifolia and Corchorus tridens in the delta ecosystem may pose a potential threat to its ecological functions. However, Corchorus tridens was found to be more tolerant to cultivated land than other troublesome weeds and also tolerated by farmers may be due to its beneficial use. But Cynodon dactylon which is a rhizomatous grass and has a potential to colonise vast areas of the floodplains has proved very difficult to eradicate by any tillage method which might be of great concern to farmers. This could lead to temptations of using herbicides thereby compromising ecological integrity of the wetlands. Such information underpins development of sound
weed management strategies. The study has also demonstrated variations in the weed communities with different sites. Therefore it is recommended that future studies should take in consideration hydrological characteristics (flood frequency and duration) when describing the composition of weed species in flood recession farming.
Acknowledgements
The authors would like to thank University ofBotswana’s Office of Research and Development for sponsoring the study and Mrs Tlhomamo. Nthaba who also offered financially support towards this study. The authors also humbly thank Dr G. Tsheboeng for his undivided attention and willingness to assist during data analysis and interpretation of results. The assistance offered by Mrs A. Makati and Mr M. Dhliwayo of the GIS laboratory; Mr Madume, Mrs Francis Murray- Hudson and Mr Mmusi of the UB Peter Smith Herbarium are highly cherished. Appreciation is also extended to officers in the Ministry of Agriculture Development and Food Security Mr Diane and Ms Semahedi for making it possible to work and interact with farmers in their respective extension areas.
REFERENCES
[1] Abdullahi, A. E. (2006). Field Guide to weeds of Botswana. Gaborone, Botswana: 124pp. Printing and Publishing Co. Botswana, ISBN 99912-0-620-5.
[2] Baker, H. G. (1965). Characteristics and modes of origin of weeds. Characteristics and modes of origin of weeds., 147-72
[3] Barrow, C. J. (1999). Alternative Irrigation: ThePromise of Runoff Agriculture. London: Earthscan Publications Ltd.
[4] Bendsen, H. M., T. (2002). The Dynamics of LandUse System in Ngamiland; Changing LivelihoodOptions and Strategies. Harry Oppenheimer Okavango Research Centre and German Development Service – DED, Maun, Botswana
[5] Bonyongo, C. (1999). Vegetation Ecology of theSeasonal Floodplains in the Okavango Delta,Botswana. MSc Thesis, University of Pretoria.
[6] Capon, S.J. (2005). Flood variability and spatial variation in plant community composition and structure on a large arid floodplain. Journal of AridEnvironments, 60(2), 283-302.
[7] Cimalova, S., Lososova,Z. (2009). Arable weeds vegetation of the North Eastern part of Czech Republic: Effects of environmental factors on species composition. Plant Ecology, 23(1), 45-57.
[8] De Datta, S. K. (1979). Weeds Problems and Methods of Control in Tropical Rice. PhillipinesJournal for Agriculture and Resources Research.
[9] Dufrene, M., & Legendre, P. (1997). Species assemblages and indicator species: the need for a flexible asymmetrical approach. EcologicalMonographs, 61, 53-73.
35
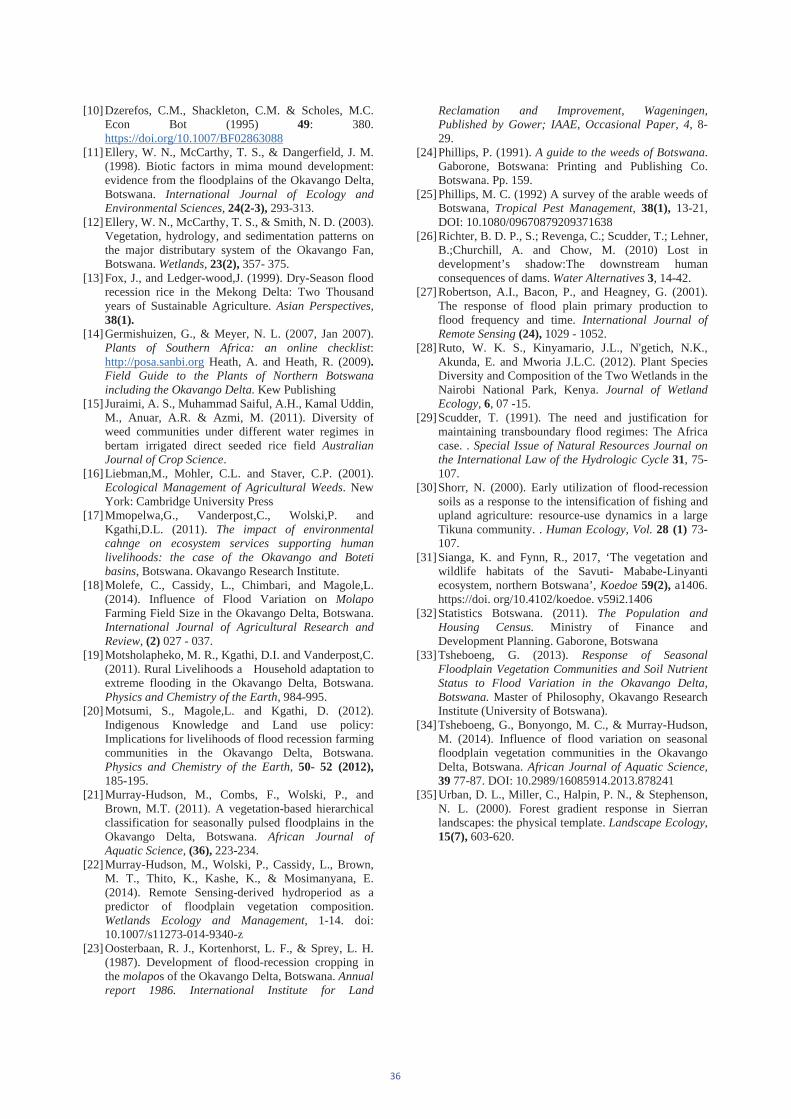
[10] Dzerefos, C.M., Shackleton, C.M. & Scholes, M.C. Econ Bot (1995) 49: 380. https://doi.org/10.1007/BF02863088
[11] Ellery, W. N., McCarthy, T. S., & Dangerfield, J. M. (1998). Biotic factors in mima mound development: evidence from the floodplains of the Okavango Delta, Botswana. International Journal of Ecology and Environmental Sciences, 24(2-3), 293-313.
[12] Ellery, W. N., McCarthy, T. S., & Smith, N. D. (2003). Vegetation, hydrology, and sedimentation patterns on the major distributary system of the Okavango Fan, Botswana. Wetlands, 23(2), 357- 375.
[13] Fox, J., and Ledger-wood,J. (1999). Dry-Season flood recession rice in the Mekong Delta: Two Thousand years of Sustainable Agriculture. Asian Perspectives, 38(1).
[14] Germishuizen, G., & Meyer, N. L. (2007, Jan 2007). Plants of Southern Africa: an online checklist:http://posa.sanbi.org Heath, A. and Heath, R. (2009).Field Guide to the Plants of Northern Botswana including the Okavango Delta. Kew Publishing
[15] Juraimi, A. S., Muhammad Saiful, A.H., Kamal Uddin, M., Anuar, A.R. & Azmi, M. (2011). Diversity of weed communities under different water regimes in bertam irrigated direct seeded rice field Australian Journal of Crop Science.
[16] Liebman,M., Mohler, C.L. and Staver, C.P. (2001). Ecological Management of Agricultural Weeds. New York: Cambridge University Press
[17] Mmopelwa,G., Vanderpost,C., Wolski,P. and Kgathi,D.L. (2011). The impact of environmentalcahnge on ecosystem services supporting humanlivelihoods: the case of the Okavango and Botetibasins, Botswana. Okavango Research Institute.
[18] Molefe, C., Cassidy, L., Chimbari, and Magole,L. (2014). Influence of Flood Variation on MolapoFarming Field Size in the Okavango Delta, Botswana. International Journal of Agricultural Research and Review, (2) 027 - 037.
[19] Motsholapheko, M. R., Kgathi, D.I. and Vanderpost,C. (2011). Rural Livelihoods a Household adaptation to extreme flooding in the Okavango Delta, Botswana. Physics and Chemistry of the Earth, 984-995.
[20] Motsumi, S., Magole,L. and Kgathi, D. (2012). Indigenous Knowledge and Land use policy: Implications for livelihoods of flood recession farming communities in the Okavango Delta, Botswana. Physics and Chemistry of the Earth, 50- 52 (2012), 185-195.
[21] Murray-Hudson, M., Combs, F., Wolski, P., and Brown, M.T. (2011). A vegetation-based hierarchical classification for seasonally pulsed floodplains in the Okavango Delta, Botswana. African Journal of Aquatic Science, (36), 223-234.
[22] Murray-Hudson, M., Wolski, P., Cassidy, L., Brown, M. T., Thito, K., Kashe, K., & Mosimanyana, E. (2014). Remote Sensing-derived hydroperiod as a predictor of floodplain vegetation composition. Wetlands Ecology and Management, 1-14. doi: 10.1007/s11273-014-9340-z
[23] Oosterbaan, R. J., Kortenhorst, L. F., & Sprey, L. H. (1987). Development of flood-recession cropping in the molapos of the Okavango Delta, Botswana. Annual report 1986. International Institute for Land
Reclamation and Improvement, Wageningen,Published by Gower; IAAE, Occasional Paper, 4, 8-29.
[24]Phillips, P. (1991). A guide to the weeds of Botswana.Gaborone, Botswana: Printing and Publishing Co. Botswana. Pp. 159.
[25]Phillips, M. C. (1992) A survey of the arable weeds of Botswana, Tropical Pest Management, 38(1), 13-21, DOI: 10.1080/09670879209371638
[26]Richter, B. D. P., S.; Revenga, C.; Scudder, T.; Lehner, B.;Churchill, A. and Chow, M. (2010) Lost in development’s shadow:The downstream human consequences of dams. Water Alternatives 3, 14-42.
[27]Robertson, A.I., Bacon, P., and Heagney, G. (2001). The response of flood plain primary production to flood frequency and time. International Journal ofRemote Sensing (24), 1029 - 1052.
[28]Ruto, W. K. S., Kinyamario, J.L., N'getich, N.K., Akunda, E. and Mworia J.L.C. (2012). Plant Species Diversity and Composition of the Two Wetlands in the Nairobi National Park, Kenya. Journal of Wetland Ecology, 6, 07 -15.
[29]Scudder, T. (1991). The need and justification for maintaining transboundary flood regimes: The Africa case. . Special Issue of Natural Resources Journal on the International Law of the Hydrologic Cycle 31, 75-107.
[30]Shorr, N. (2000). Early utilization of flood-recession soils as a response to the intensification of fishing and upland agriculture: resource-use dynamics in a large Tikuna community. . Human Ecology, Vol. 28 (1) 73-107.
[31]Sianga, K. and Fynn, R., 2017, ‘The vegetation and wildlife habitats of the Savuti- Mababe-Linyanti ecosystem, northern Botswana’, Koedoe 59(2), a1406. https://doi. org/10.4102/koedoe. v59i2.1406
[32]Statistics Botswana. (2011). The Population andHousing Census. Ministry of Finance and Development Planning. Gaborone, Botswana
[33]Tsheboeng, G. (2013). Response of SeasonalFloodplain Vegetation Communities and Soil Nutrient Status to Flood Variation in the Okavango Delta, Botswana. Master of Philosophy, Okavango Research Institute (University of Botswana).
[34]Tsheboeng, G., Bonyongo, M. C., & Murray-Hudson, M. (2014). Influence of flood variation on seasonal floodplain vegetation communities in the Okavango Delta, Botswana. African Journal of Aquatic Science, 39 77-87. DOI: 10.2989/16085914.2013.878241
[35]Urban, D. L., Miller, C., Halpin, P. N., & Stephenson, N. L. (2000). Forest gradient response in Sierran landscapes: the physical template. Landscape Ecology,15(7), 603-620.
36
A Feasibility Study on the Use of Drones for Healthcare Service Delivery in Botswana
Kagiso Ndlovu1,, Kabelo L. Mauco2, , Tomas Andersen4, Nkwebi Motlogelwa1, Mpapho Motsumi3, Roseyln Matlou4
1Department of Computer Science, University of Botswana, Gaborone, Botswana
2Department of Health Information Management Botho University, Gaborone, Botswana
3Department of Surgery, Faculty of Medicine, University of Botswana, Gaborone, Botswana
4Perelman School of Medicine, University of Pennsylvania, USA
Corresponding Author. Email: [email protected]
AbstractHealthcare service delivery in developing countries faces a number of barriers such as shortage of healthcare workers, shortage of ambulances as well as inaccessible terrains due to poor road infrastructure. These situations often results in unnecessary deaths, for example as a result of ambulances taking a prolonged time to arrive at a scene requiring emergency medical intervention. Recent literature has documented the use of drones in addressing some of the challenges associated with the delivery of healthcare services. Drones are commonly known as unmanned aerial vehicles (UAVs). Alternative terms include Unmanned Aircraft (UA), Remotely Operated Aircraft (ROA), Remotely Piloted Vehicle (RPV) and Remotely Piloted Aircraft (RPA). Published literature on drone-aided healthcare services, has mostly been on the use of drones in the delivery as well as pick up of medication or medical equipment. There is lack of adequate literature on the feasibility of implementing drone-aided healthcare service delivery in developing countries, as most of the published work is from developed countries. The overall objective of this study is therefore to evaluate the feasibility of using drones for healthcare service delivery in Botswana. Face-to-face structured interviews were conducted with purposively selected stakeholders in Botswana. The interview guide used had open ended questions and was developed with the overall objective of the study in mind. Thematic analysis of the interview transcripts involved the use of an iterative approach as well as NVivo 11 software. Participants identified opportunities in Botswana for drone-aided healthcare service delivery in areas such as emergency medical services and general medical services. Limited legislation on the use of drones in Botswana as well lack of an organized physical address system, are some of the barriers identified by participants on the use of drones for healthcare service delivery in Botswana. This study illustrates only preliminary results as not all of the participants indicated in the methods section had been contacted prior to conclusion of this article.
Keywords Drones, Healthcare Services, Emergency Response, Telemedicine, Developing Economies, Botswana
I. IntroductionHealthcare service delivery in developing countries faces a number of challenges, such as shortage of healthcare workers, as well as inaccessible terrains due to poor road infrastructure. In Uganda not only was shortage of healthcare workers documented, but also inequity of their distribution [1]. Documented poor access to treatment in developing countries has in some cases, resulted in people dying from infections for which treatments or prophylaxis should be available readily [2]. Botswana’s healthcare sector, like in many other developing countries also faces similar challenges. A study by Seitio-Kgokgwe et al [3], noted that some of the challenges faced by healthcare service delivery in Botswana include; disparities in the distribution of healthcare facilities creating inequities in access, poor supply of medicines as well as general shortage of staff. Botswana is also currently facing a burden of increase in the rates non-communicable diseases [4]. The affected chronically ill patients mostly in rural Botswana hence face a challenge of having to frequently visit medical institutions for routine check-ups or medicine refills. Those who cannot afford the associated cost, usually end up defaulting
and in most cases resulting in severe complications and increased costs to the healthcare sector in attending to such complications. Nevertheless, the advent of innovative technology tools, present opportunities to augment the current challenges.
An example innovative technology tool is a drone. The use of drones has become widespread, offering an alternative way of gathering and sharing information as well as delivery of products and various services [5]. Drones are commonly known as unmanned aerial vehicles (UAVs). Alternative terms include Unmanned Aircraft (UA), Remotely Operated Aircraft (ROA), Remotely Piloted Vehicle (RPV) and Remotely Piloted Aircraft (RPA) [6]. Recent literature has documented the use of drones in addressing some of the challenges associated with the delivery of healthcare products and services. Drones applications in healthcare has been reported in delivery of; medicine, defibrillators, blood samples and vaccine medications [7].
In the Netherlands, prototype ambulance drones have demonstrated delivery of defibrillators. In this instance, a paramedic in the control room was able to instruct a lay person assisting the patient via a livestream webcam on the drone [8]. Another milestone was achieved in Malawi when a custom made drone called EcoSoar was designed at the Unmanned Systems Lab to be fabricated and operated locally for remote medicine delivery and remote sensing purposes [9]. The Low-cost drone built by University students and delivers medicine over 19 km radius [9]. In Rwanda, small packages attached to parachutes consisting of blood, plasma, and coagulants were delivered by drones to hospitals across rural western Rwanda, helping to cut waiting times from hours to 37
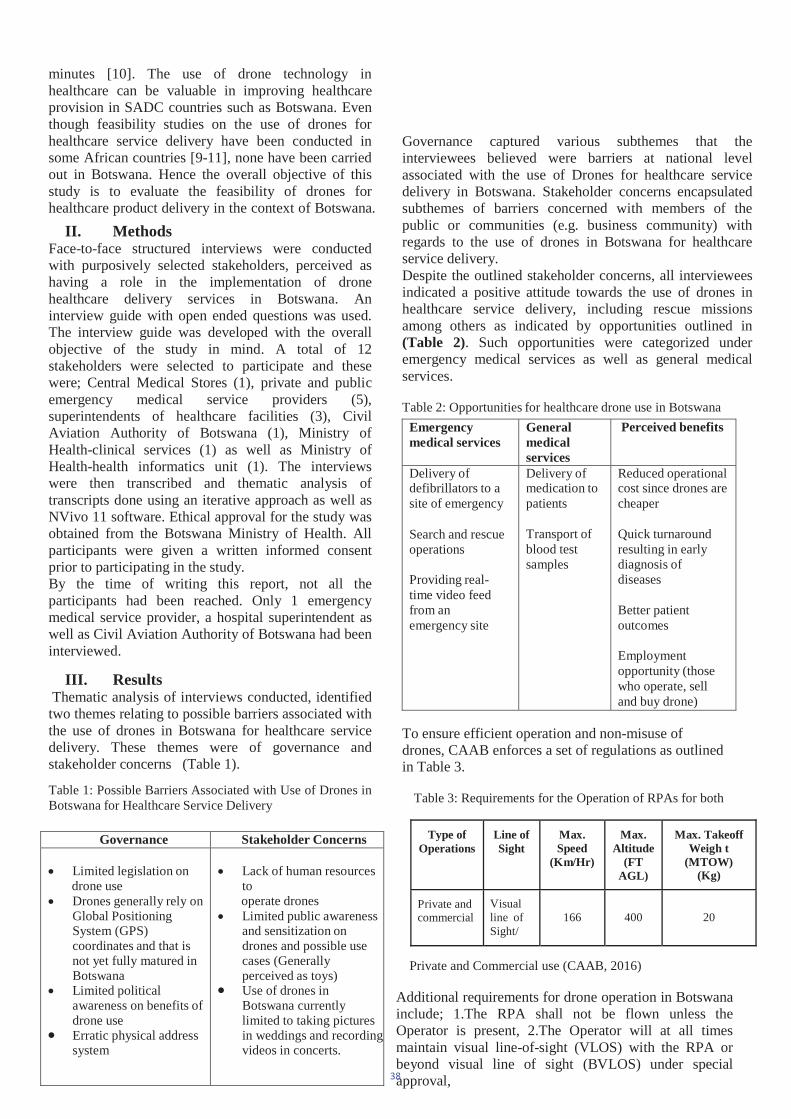
Type ofOperations
Line ofSight
Max. Speed
(Km/Hr)
Max. Altitude
(FTAGL)
Max. TakeoffWeigh t
(MTOW)(Kg)
Private and commercial
Visual line of Sight/
166 400 20
minutes [10]. The use of drone technology in healthcare can be valuable in improving healthcare provision in SADC countries such as Botswana. Even though feasibility studies on the use of drones for healthcare service delivery have been conducted in some African countries [9-11], none have been carried out in Botswana. Hence the overall objective of this study is to evaluate the feasibility of drones for healthcare product delivery in the context of Botswana.
II. MethodsFace-to-face structured interviews were conducted with purposively selected stakeholders, perceived as having a role in the implementation of drone healthcare delivery services in Botswana. An interview guide with open ended questions was used. The interview guide was developed with the overall objective of the study in mind. A total of 12 stakeholders were selected to participate and these were; Central Medical Stores (1), private and public emergency medical service providers (5), superintendents of healthcare facilities (3), Civil Aviation Authority of Botswana (1), Ministry of Health-clinical services (1) as well as Ministry of Health-health informatics unit (1). The interviews were then transcribed and thematic analysis of transcripts done using an iterative approach as well as NVivo 11 software. Ethical approval for the study was obtained from the Botswana Ministry of Health. All participants were given a written informed consent prior to participating in the study. By the time of writing this report, not all the participants had been reached. Only 1 emergency medical service provider, a hospital superintendent as well as Civil Aviation Authority of Botswana had been interviewed.
III. Results Thematic analysis of interviews conducted, identified two themes relating to possible barriers associated with the use of drones in Botswana for healthcare service delivery. These themes were of governance and stakeholder concerns (Table 1).
Table 1: Possible Barriers Associated with Use of Drones in Botswana for Healthcare Service Delivery
Governance captured various subthemes that the interviewees believed were barriers at national level associated with the use of Drones for healthcare service delivery in Botswana. Stakeholder concerns encapsulated subthemes of barriers concerned with members of the public or communities (e.g. business community) with regards to the use of drones in Botswana for healthcare service delivery. Despite the outlined stakeholder concerns, all interviewees indicated a positive attitude towards the use of drones in healthcare service delivery, including rescue missions among others as indicated by opportunities outlined in (Table 2). Such opportunities were categorized under emergency medical services as well as general medical services.
Table 2: Opportunities for healthcare drone use in Botswana Emergency medical services
General medicalservices
Perceived benefits
Delivery of defibrillators to a site of emergency
Search and rescue operations
Providing real-time video feedfrom an emergency site
Delivery of medication to patients
Transport of blood test samples
Reduced operational cost since drones are cheaper
Quick turnaroundresulting in earlydiagnosis of diseases
Better patient outcomes
Employment opportunity (thosewho operate, selland buy drone)
To ensure efficient operation and non-misuse of drones, CAAB enforces a set of regulations as outlined in Table 3.
Table 3: Requirements for the Operation of RPAs for both
Private and Commercial use (CAAB, 2016)
Additional requirements for drone operation in Botswana include; 1.The RPA shall not be flown unless the Operator is present, 2.The Operator will at all times maintain visual line-of-sight (VLOS) with the RPA or beyond visual line of sight (BVLOS) under special approval,
Governance Stakeholder Concerns
Limited legislation ondrone use Drones generally rely on Global Positioning System (GPS) coordinates and that is not yet fully matured in Botswana Limited political awareness on benefits of drone use Erratic physical address system
Lack of human resources to operate drones Limited public awareness and sensitization on drones and possible use cases (Generally perceived as toys) Use of drones in Botswana currently limited to taking pictures in weddings and recording videos in concerts.
38
3. RPA will be flown below 400 ft AGL at all times and no further than 500m from the Operator at the controls of the RPA or beyond visual line of sight under special approval, Additional requirements for drone operation in Botswana include; 1.The RPA shall not be flown unless the Operator is present, 2.The Operator will at all times maintain visual line-of-sight (VLOS) with the RPA or beyond visual line of sight (BVLOS) under special approval, 3. RPA will be flown below 400 ft AGL at all times and no further than 500m from the Operator at the controls of the RPA or beyond visual line of sight under special approval, 4. The Operator may make use of a Visual Observer (VO), 5. The Operator or the VO may not fly more than one RPA at any one time, 6. The RPA registered in Botswana is not permitted to cross International Boundaries and 7. No person shall operate an RPA unless they have in their possession the certificate issued by the Authority for each RPA in operation and the user manual for the RPA [12].
IV. Discussion
Incidences on abuse of drone use have been documented in literature [13]. The civil aviation authority of Botswana has also noted safety, security and privacy concerns for both government and public interests, relating to the use of remotely piloted aircraft (RPA) [12]. As such, there is need for legislation in Botswana that governs drone use. The document outlining requirements for operation and certification of drones for both Private and Commercial use [12], is a step in the right direction for the country but needs to be completed by a more rigorous piece of legislation so as to promote feasibility of drone use in Botswana. Indeed, one respondent noted that the “legislation needs to be there to prevent instances involving misuse of drones or calling them for emergency medical intervention as a prank”. On the other hand, Some of the requirements outlined in the requirements for operation and certification of drones for both Private and Commercial use [12], could potentially enforce further constraints especially in healthcare applications where response time is crucial, that is, speeds faster than the 166Km/hour could be preferable. Other restrictions such as where the drone can land and flying route could also bring additional response challenges to healthcare emergencies and rescue missions. Some of the interviewees also noted limited political awareness on benefits of drone use as a concern. Such limited political awareness on drone use, can be a possible contributing factor to inadequate legislation in Botswana concerning drone use. Wackwitz and Boedecker, highlighted collision with manned or unmanned aircrafts, buildings and power lines as some safety hazards associated with the use of drones [14]. In Botswana where power lines and telecommunication lines are overhead as opposed to being underground, collision of drones
with such is an impending challenge. Presence of an organized physical address system as well as an environment with a mature use of the Global Positioning System (GPS) can positively promote the use of drone delivery services, unfortunately such as environment is non-existent in the context of Botswana as highlighted by the interviewees (Table
1). Botswana Post in its newsletter, has previously confirmed presence of a deficient national address system [15].With regards to stakeholder concerns, Table 1 illustrates that barriers to drone use may be as a result of limited awareness of drones and their use as well as lack of trained human resources with the capacity to operate drones.
V. Conclusion
This study illustrates only preliminary results as not all of the participants indicated in the methods section had been contacted prior to conclusion of this article. Only some of the relevant stakeholders present in Gaborone had been interviewed. Further consultation and insight from all the relevant stakeholders will provide a more comprehensive assessment on the feasibility of drone use for healthcare service delivery in Botswana.
References
[1] Madinah N. (2016). Challenges to the health service delivery system in Uganda. IOSR Journal of Nursing and Health Science (IOSR-JNHS).e- ISSN: 2320–1959.p- ISSN: 2320–1940 Volume 5, Issue 2 Ver. V (Mar. - Apr. 2016), PP 30-38
[2] ShabbarJaffar, Alison Grant, Jimmy Whitworth, Peter Smith and Hilton Whittle (2004); The Natural History of HIV-1 and HIV-2 infections in Adults in Africa: a Literature review: Bulletin of the WHO; June 2004 Vol. 82 (6).
[3] Onalenna Seitio-Kgokgwe, Robin DC Gauld, Philip C Hill, Pauline Barnett (2014). Assessing performance of Botswana’s public hospital system: the use of the World Health Organization Health System Performance Assessment Framework. Int J Health Policy Manag 2014, 3(4), 179–189
[4] Health Policy Project (2015). Noncommunicable Diseases: The Payoffs of Investing Early in Prevention Efforts. https://www.healthpolicyproject.com/pubs/.
[5] Rocci Luppicini Arthur So. Technoethical review of commercial drone use in the context of governance, ethics, and privacy. Technology in Society 46 (2016) 109e119.
[6] R. Clarke, "Understanding the drone epidemic”, Computer Law & Security Review, 30 (2014), pp. 230-246.
[7] Judy E. Scott and Carlton H. Scott. Drone 39
Delivery Models for Healthcare. Proceedings of the 50th Hawaii International Conference on System Sciences | 2017
[8] M. Prigg, The ambulance drone that could save your life, Daily Mail, 2014. https://www.youtube.com/watch?v=y-rEI4bezWc
[9] BBC News, Malawi and Unicef launch drone air corridor. https://www.bbc.com/news/world-africa-40441790
[10] Simmons D (2016). Rwanda begins Zipline commercial drone deliveries. https://www.bbc.com/news/technology-37646474
[11] Landhuis E. (2018). Medical cargo could be the gateway for routine drone delivery. https://www.npr.org/sections/health- shots/2018/03/10/592059175/medical-cargo-could-be-the-gateway-for- routine-drone-deliveries
[12] Civil Aviation Authority of Botswana (2016). Operation of remotely operated aircraft. Gaborone, Botswana.
[13] Sandbrook, C., 2015. The social implications of using drones for biodiversity conservation. Ambio, 44(4), pp.636-647.
[14] Wackwitz, K. and Boedecker, H., 2015. Safety Risk Assessment for UAV Operation. Drone Industry Insights, Safe Airspace Integration Project, Part One, Hamburg, Germany.
[15] Mogorosi; Official newsletter of Botswana Post. Third Quarter. 2009-10
40
Soil macrofauna dynamics following repeated soil application of different quality organic resources under maize monocropping in Zimbabwe
1,2Tauro T.P., 1Mtambanengwe F., 1Mpepereki S., and 1Mapfumo P1Department of Soil Science & Agricultural Engineering, University of Zimbabwe, P.O. Box MP 167,
Mount Pleasant, Harare, Zimbabwe; 2Marondera University of Agricultural Sciences & Technology, P.O Box 35 Marondera, Zimbabwe;
Email: [email protected] There is limited understanding on macrofauna food preference for survival in most cropping systems where both organic and inorganic resources are utilised. A study was conducted during the 2015/16 season to determine the influence of different quality organic and inorganic nutrient resources on macrofaunal abundance and diversity under high rainfall (> 800 mm yr-1) at Domboshawa Training Centre in Zimbabwe. Calliandra calothyrsus, Crotalaria juncea, cattle manure, maize stover and Pinus patula sawdust were applied to a maize crop at low (1.2 t C ha-1) and high 4.0 (t C ha-1) rates, and a control with no addition of organic input was included. Treatments received basal phosphorus, potassium and sulphur fertilizer at 16.0, 14.7 and 4.6 kg ha-1, respectively at planting, plus or minus mineral nitrogen at 120 kg N ha-1 under a split plot design. Macrofauna were sampled using monoliths to 0.30 m depth fortnightly from early February to mid-May. Fauna richness was quantified using
indices. Redundancy analysis and Monte Carlo permutation test were used to determine the relationship between macrofauna abundance and environmental variables. Application of organic resources at low rate increased community diversity by selectively stimulating macrofauna appearance and persistence. Earthworm, wireworm and termite abundance were significantly affected by both treatment and time. Millipede, white grub, spider, locust and medium black ant abundances were significantly affected by time. Selectively, macrofauna increased or decreased in abundance or appeared earlier or appeared later in the season or were totally suppressed under high rate or following application of mineral nitrogen fertilizer. Diversity increase following nitrogen application was related to quantity and quality of the resource. Mineral nitrogen was identified as the most influential variable affecting macrofauna abundance. Application of medium to high quality organic resources stimulated macrofaunal activity to improve community diversity.
Keywords: Abundance, diversity, macrofauna, monocropping, maize, N responses, organic resources
Introduction Natural systems with diverse tree cover have high diversity of soil macrofauna that promote a sustainable soil ecosystem [1]. Maintenance of habitant within an undisturbed environment and supply of required resources are key factors ensuring macrofauna community diversity. However, the need for food, feed and fibre has forced humans to open up woodlands and forests in order to meet their demands. The resultant transformation of landscapes due to deforestation often affects soil macrofaunal community structures through destruction of nests, modification of microclimate and removal of food substrates from the mixed tree species [2, 3]. Macrofauna will be deprived of shading effect, moisture and nutrients from root and leaf decomposition beneath the canopy [4]. Moreover, use of fire
during forest clearing and field preparation has also been linked to reduction of species richness in Eastern Amazonia and parts of Sub-Saharan Africa (SSA) [5, 6]. In addition, most agricultural farming systems are driven by the need to meet human, livestock and industry requirements thus intensifying at the expense of macrofauna needs [7, 8]. Lack of knowledge coupled with application of high inorganic fertilizers rates, use of herbicides plus clean weeding are some of the promoted intensification strategies leading to soil degradation. Over time such degraded fields are abandoned due to low yields emanating from nutrient mining, organic matter depletion and reduced macrofauna diversity [9, 10, 11]. Given the pivotal role played by soil macrofauna in decomposition, soil structure improvement and nutrient cycling [12] there is need to find farming innovations which build
41
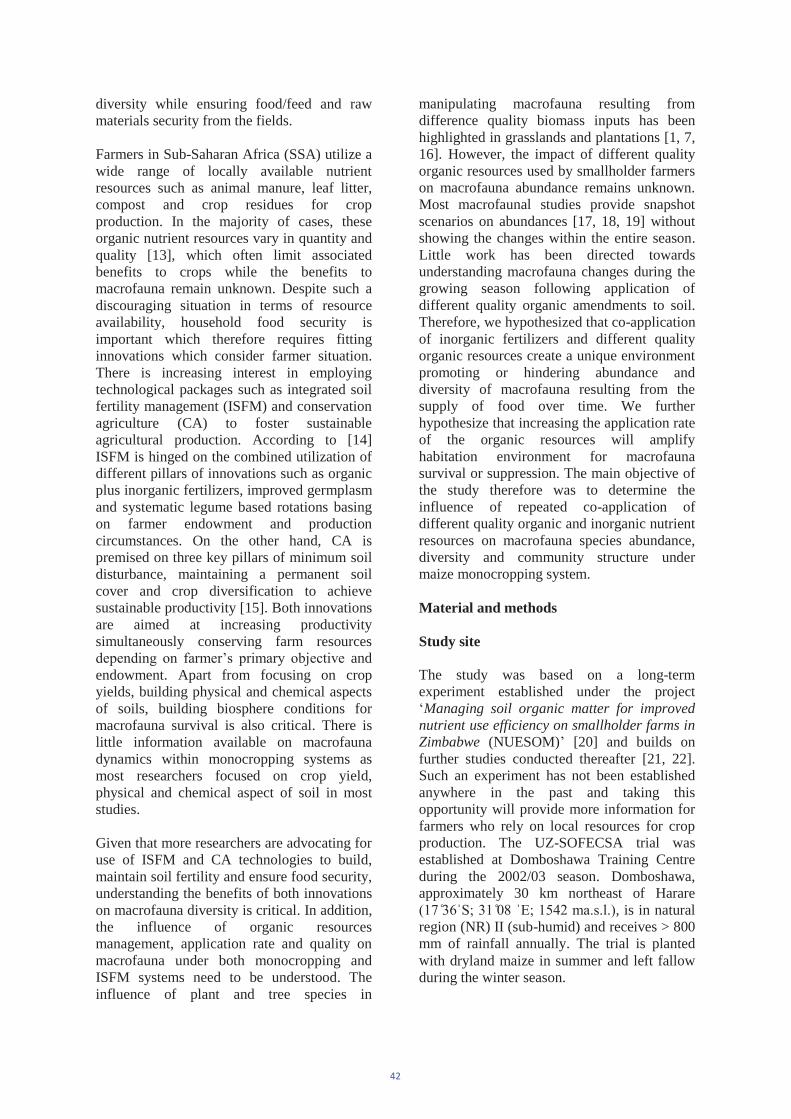
diversity while ensuring food/feed and raw materials security from the fields.
Farmers in Sub-Saharan Africa (SSA) utilize a wide range of locally available nutrient resources such as animal manure, leaf litter, compost and crop residues for crop production. In the majority of cases, these organic nutrient resources vary in quantity and quality [13], which often limit associated benefits to crops while the benefits to macrofauna remain unknown. Despite such a discouraging situation in terms of resource availability, household food security is important which therefore requires fitting innovations which consider farmer situation. There is increasing interest in employing technological packages such as integrated soil fertility management (ISFM) and conservation agriculture (CA) to foster sustainable agricultural production. According to [14] ISFM is hinged on the combined utilization of different pillars of innovations such as organic plus inorganic fertilizers, improved germplasm and systematic legume based rotations basing on farmer endowment and production circumstances. On the other hand, CA is premised on three key pillars of minimum soil disturbance, maintaining a permanent soil cover and crop diversification to achieve sustainable productivity [15]. Both innovations are aimed at increasing productivity simultaneously conserving farm resources
and endowment. Apart from focusing on crop yields, building physical and chemical aspects of soils, building biosphere conditions for macrofauna survival is also critical. There is little information available on macrofauna dynamics within monocropping systems as most researchers focused on crop yield, physical and chemical aspect of soil in most studies.
Given that more researchers are advocating for use of ISFM and CA technologies to build, maintain soil fertility and ensure food security, understanding the benefits of both innovations on macrofauna diversity is critical. In addition, the influence of organic resources management, application rate and quality on macrofauna under both monocropping and ISFM systems need to be understood. The influence of plant and tree species in
manipulating macrofauna resulting from difference quality biomass inputs has been highlighted in grasslands and plantations [1, 7, 16]. However, the impact of different quality organic resources used by smallholder farmers on macrofauna abundance remains unknown. Most macrofaunal studies provide snapshot scenarios on abundances [17, 18, 19] without showing the changes within the entire season. Little work has been directed towards understanding macrofauna changes during the growing season following application of different quality organic amendments to soil. Therefore, we hypothesized that co-application of inorganic fertilizers and different quality organic resources create a unique environment promoting or hindering abundance and diversity of macrofauna resulting from the supply of food over time. We further hypothesize that increasing the application rate of the organic resources will amplify habitation environment for macrofauna survival or suppression. The main objective of the study therefore was to determine the influence of repeated co-application of different quality organic and inorganic nutrient resources on macrofauna species abundance, diversity and community structure under maize monocropping system.
Material and methods
Study site
The study was based on a long-term experiment established under the project Managing soil organic matter for improved
nutrient use efficiency on smallholder farms in Zimbabwe (NUESOM) [20] and builds on further studies conducted thereafter [21, 22]. Such an experiment has not been established anywhere in the past and taking this opportunity will provide more information for farmers who rely on local resources for crop production. The UZ-SOFECSA trial was established at Domboshawa Training Centre during the 2002/03 season. Domboshawa, approximately 30 km northeast of Harare
, is in natural region (NR) II (sub-humid) and receives > 800 mm of rainfall annually. The trial is planted with dryland maize in summer and left fallow during the winter season.
42
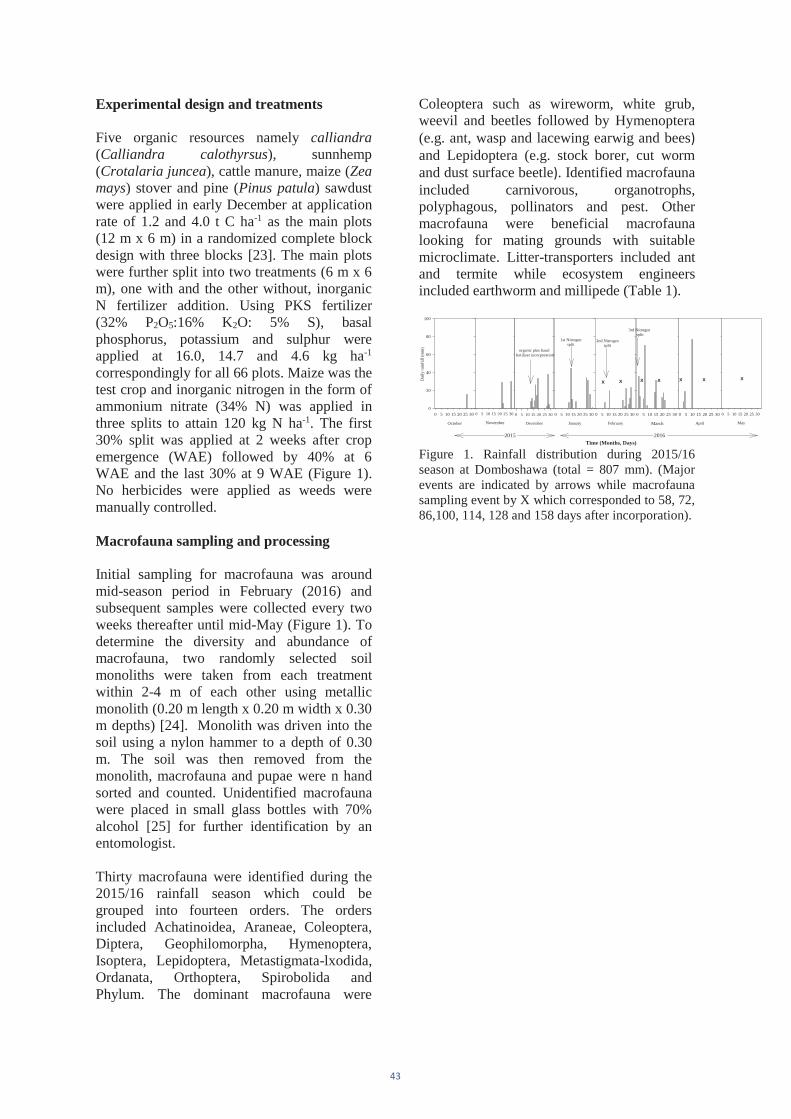
Experimental design and treatments
Five organic resources namely calliandra(Calliandra calothyrsus), sunnhemp (Crotalaria juncea), cattle manure, maize (Zea mays) stover and pine (Pinus patula) sawdust were applied in early December at application rate of 1.2 and 4.0 t C ha-1 as the main plots (12 m x 6 m) in a randomized complete block design with three blocks [23]. The main plots were further split into two treatments (6 m x 6 m), one with and the other without, inorganic N fertilizer addition. Using PKS fertilizer (32% P2O5:16% K2O: 5% S), basal phosphorus, potassium and sulphur were applied at 16.0, 14.7 and 4.6 kg ha-1
correspondingly for all 66 plots. Maize was the test crop and inorganic nitrogen in the form of ammonium nitrate (34% N) was applied in three splits to attain 120 kg N ha-1. The first 30% split was applied at 2 weeks after crop emergence (WAE) followed by 40% at 6 WAE and the last 30% at 9 WAE (Figure 1). No herbicides were applied as weeds were manually controlled.
Macrofauna sampling and processing
Initial sampling for macrofauna was around mid-season period in February (2016) and subsequent samples were collected every two weeks thereafter until mid-May (Figure 1). To determine the diversity and abundance of macrofauna, two randomly selected soil monoliths were taken from each treatment within 2-4 m of each other using metallic monolith (0.20 m length x 0.20 m width x 0.30 m depths) [24]. Monolith was driven into the soil using a nylon hammer to a depth of 0.30 m. The soil was then removed from the monolith, macrofauna and pupae were n hand sorted and counted. Unidentified macrofauna were placed in small glass bottles with 70% alcohol [25] for further identification by an entomologist.
Thirty macrofauna were identified during the 2015/16 rainfall season which could be grouped into fourteen orders. The orders included Achatinoidea, Araneae, Coleoptera, Diptera, Geophilomorpha, Hymenoptera, Isoptera, Lepidoptera, Metastigmata-lxodida, Ordanata, Orthoptera, Spirobolida and Phylum. The dominant macrofauna were
Coleoptera such as wireworm, white grub, weevil and beetles followed by Hymenoptera (e.g. ant, wasp and lacewing earwig and beesand Lepidoptera (e.g. stock borer, cut worm and dust surface beetle . Identified macrofauna included carnivorous, organotrophs, polyphagous, pollinators and pest. Other macrofauna were beneficial macrofauna looking for mating grounds with suitable microclimate. Litter-transporters included ant and termite while ecosystem engineers included earthworm and millipede (Table 1).
October
0 5 10 15 20 25 30D
aily
rain
fall
(mm
)
0
20
40
60
80
100
November
0 5 10 15 20 25 30
December
0 5 10 15 20 25 30
January
0 5 10 15 20 25 30
February
0 5 10 15 20 25 30
March
0 5 10 15 20 25 30
April
0 5 10 15 20 25 30
May
0 5 10 15 20 25 30
1st Nitrogensplit
2nd Nitrogensplit
3rd Nitrogen split
organic plus basal fertiliser incorporation
X X X X X X X
2015 2016Time (Months, Days)
Figure 1. Rainfall distribution during 2015/16 season at Domboshawa (total = 807 mm). (Major events are indicated by arrows while macrofauna sampling event by X which corresponded to 58, 72, 86,100, 114, 128 and 158 days after incorporation).
43

Table 1. Macrofauna identified at the UZ-SOFECSA long-term experiment during 2015/16 season at Domboshawa in Zimbabwe.
Data analyses
Data was analysed by using PAST and GENSTAT statistical package (GENSTAT, 2005). Analysis of variance was used to separate treatment and time effects on species population, taxa and diversity index. Species population data was transformed first before species evenness and richness was calculated to determine species diversity. Species diversity was calculated using a number of indices including Shannon Wienner index (Schloss et al., 2009). The following Shannon index formula was used:
Where H’ is Shannon Wienner diversity index, S is the number of individual species in the community (richness), pi is be the proportion of S made up of the ith species that is pi = Ni
/Ntotal, where Ni is the individuals of species i(macrofauna per m2) and Ntotal is the total number of individuals (macrofauna per m2).All mean comparisons were considered at P <0.05 significance. Canoco 4.5 was used for multivariate analysis to establish the relationships among macrofauna, many environment factors and management inputs [28]. The data was subjected to gradient analysis which then identified Redundancy analysis (RDA) as the appropriate technique to use. Then Monte Carlo permutation test was used to identify the variables explaining the result from the RDA analysis.
Results
3.1 The effects of organic resource type and quantity on macrofauna abundance
Organic resource types and time significantly influenced abundance of earthworm, wireworm and termite. Millipede, white grub, spider, locust and medium black ant abundance was significantly (P<0.001) affected by time. All macrofauna abundance fluctuated within season. Two general peaks was observed for earthworm abundance under both low and high rate treatments (Figure 2a & 2c). At 86 DAI, low rate manure had the highest earthworm abundance (33/ m2)followed by sawdust which had 20 earthworm /m2. At 128 DAI low rate sawdust had the highest earthworm abundance (50/ m2). At 86 DAI plots receiving high rate of maize stover, sawdust, Crotalaria and manure had higher earthworm abundance (20-33 /m2) than Calliandra (12/ m2) and control (4/ m2). At 128 DAI high rate Calliandra and maize stover had the highest earthworm >70 /m2
(Figure 2c). Increasing the application rate of maize stover ensured higher earthworm abundance at 72 DAI while increasing sawdust quantity significantly reduced earthworm abundance from 50 earthworm /m2 to 8 earthworm /m2 at 128 DAI.
Order Common name Survival strategy
Achatinoidea Snail Herbivorous Araneae Spider Carnivorous Coleoptera Fuller rose
weevil Herbivorous
Coleoptera White grub Organotrophs or polyphagous
Coleoptera Lady bird Carnivorous Coleoptera White fringed
beetle larvae Feeds on root system
Coleoptera Ground beetle, Shinning fungus beetle, Rove beetle and Wireworm
Pest
Diptera Housefly Carnivorous Geophilomorpha Centipede Organotrophs or
carnivorous Hymenoptera Bee Pollinator Hymenoptera Ant, Wasp and
Lacewing earwig
Carnivorous
Isoptera Termite Pest or Organotrophs
Lepidoptera Moth pupa N/ALepidoptera Stock borer, Cut
worm and Dust surface beetle
Pest
Metastigmata=Ixodida
Tick Parasite
Neuroptera Lacewing earwig and Ant lion
Carnivorous
Odanata Praying mantis Carnivorous Orthoptera Locust and
Cricket Pest
Phyllum Earthworm Organotrophs Spirobolida or Julida
Millipede Organotrophs
44
A maximum of 12 wireworm/ m2 was observed under low rate Crotalaria at 86 DAI. Increasing the application rate of manure led to an early wireworm peak (16 / m2) 72 DAI which was significantly higher than under low rate manure. Increasing the application rate of maize stover stimulated wireworm at 86 DAI. However, increasing the rate of Calliandracaused total wireworm disappearance. Furthermore, increasing the rate of Crotalariacaused partial suppression of wireworm until 128 DAI. No wireworm was observed in the control throughout the growing season (Figure 3a & c). Low rate maize stover attained two peaks at 86 DAI with 1325 termite /m2 and at 114 DAI with 6250 termite /m2. Termite persisted under low rate Calliandra attaining seasonal peak of 1279 termite /m2 at 100 DAI. Increasing the application rate of organics produced two peaks at 72 and 100 DAI. Increasing the application rate of Calliandra,Crotalaria and maize stover suppressed termite abundance at most sampling point during the season. Apart from the control, high rate maize stover attained the higher termite abundance (5417 termite /m2) than Calliandra(1325 termite /m2) and other treatments (Figure 4a & c) at 72 DAI.
Millipede abundance under both low and high rate treatments was < 10 millipede /m2 except under high rate Calliandra at 58 DAI. Low rate maize stover attained highest millipede abundance (8 millipede /m2) 72 DAI while only 4 millipede /m2 were noted in the control. Low rate of Crotalaria and manure had no millipede throughout the growing season, while Calliandra and sawdust only supported 4 millipede /m2 at 86 DAI with rest of the season having none. Increasing the application rate of Crotalaria totally suppressed millipede while increasing manure rate stimulated millipede appearance at 72 DAI only. Furthermore, increasing the rate of Calliandrastimulated the appearance of 13 millipede /m2
at 58 DAI followed by total suppression until the end of the season (Figure 5a & c).White grub abundance was >5 white grub /m2 across all low rate treatments at 86 DAI the peak point except for Crotalaria. Low rate Crotalaria had the highest white grub (20 white grub /m2) abundance 58 DAI which gradually decreased to nil at 86 DAI and
resurging between 100-114 DAI with 4 white grub /m2. Thereafter white grub was total suppressed onward under the same treatment. From 86 to 100 DAI Calliandra had highest white grub abundance (20 white grub /m2) than other treatments. The control was only able to sustain a maximum of 8 white grub/ m2 at 86 and 128 DAI. Increasing the rate of Calliandrareduced the abundance and caused the partial disappearance of white grub from 72 DAI onwards. However, increasing the application rate of maize stover, manure and sawdust stimulated persistence of white grub (Figure 6a & c).Across all low rate treatments spider was absent at 58 and 128 DAI. Spider was most prevalent under low rate maize stover where two peaks was observed at 72 and 86 DAI both having 4 spider /m2. Low rate Crotalariaattained peak spider abundance 58 DAI while
at 114 DAI both having 4 spider /m2. Peak spider abundance under the control was observed 72 DAI with 4 spider /m2 and 128 DAI with 8 spider /m2.Increasing the application rate of Calliandraimproved spider persistence while spider become prominent at the end of the growing season under Crotalaria and maize stover. However, increasing the application rate of manure caused the total spider disappearance. High rate maize stover supported 20 spider /m2
followed by Crotalaria with 8 spider /m2 and lastly Calliandra with 4 spider /m2 at 128 DAI (not shown).
3.2 The effects of nitrogen application on macrofauna abundance
Application of mineral nitrogen (N) to low rate treatments except for Crotalaria reduced abundance of earthworm to be < 10 /m2
throughout the season. Application of N significantly reduced earthworm population from 20-33 to 4 /m2 under low rate manure and sawdust 86 DAI. Similarly, earthworm vanished completely from 50 /m2 under low rate sawdust 128 DAI following N addition (Figure 2b). Application of N led to partial suppression of earthworm under low rate Crotalaria, high rate Crotalaria, high rate maize stover and control. Under low rate Crotalaria earthworm resurged 128 DAI to attain a peak of 16 earthworm / m2 and under high rate maize stover they resurged 100 DAI
45
to attain a peak of 37 earthworm/ m2 following application of N. Application of N significantly reduced earthworm abundance from >75 /m2 to < 5 /m2 128 DAI under high rate treatment of Crotalaria and maize stover. Addition of N to high rate Calliandra led to total earthworm disappearance (Figure 2d).Mineral N prompted the disappearance of wireworm under low rate treatments of Calliandra, maize stover, sawdust and under high rate Calliandra and sawdust. There was partial wireworm suppression under both low and high rate manure following N addition. However, N addition stimulated wireworm appearance under high rate Crotalaria 58 DAI and under high rate maize stover 158 DAI. Addition of N to low rate manure increased wireworm persistence. Application of N under the control stimulated 4 wireworm /m2 to be observed at 86 and 128 DAI (Figure 3b & d) while termite population was reduced (Figure4e). In addition, N application to all low rate treatments reduced termite abundance to below 712 /m2. Addition of nitrogen to high rate maize stover significantly reduced termite abundance from 5500 to 0 /m2 at 72 DAI. However, N application to high rate sawdust increased termite abundance from 58 to 688 /m2 at 114 DAI (Figure 4b & d).
Application of N led to disappearance of millipede under the control, low rate maize stover, low rate sawdust and high rate sawdust. Nitrogen application to low rate Calliandrapartially suppressed millipede until 100 DAI when 4 millipede /m2 were observed. Following application of N, millipede only appeared 114 DAI under high rate Crotalariaattaining 4 millipede /m2 (Figure 5b & d). Nitrogen addition to low rate Calliandra led to disappearance of white grub. Application of N prompted partial suppression under low rate maize stover as white grub only appeared earlier between 72-86 DAI and later at 128 DAI. Under high rate treatments of Crotalaria,maize stover and manure white grub suppression was from 114 DAI onwards. On the other hand application of N to low rate Crotalaria, low rate manure, high rate Crotalaria and high rate Calliandra increased white grub persistence (Figure 6b & d). Nitrogen application to low rate treatments of Calliandra, Crotalaria and sawdust increased spider abundance to 8, 4 and 4 spider /m2
correspondingly at 128 DAI. Adding N to control led to total disappearance of spider while under low rate maize stover spider only appeared at 58 DAI (not shown).
Using Redundancy analysis (RDA) biplot, application of mineral nitrogen was the most influential variable affecting macrofauna abundance followed by resource total N > application rate of the organics > polyphenols and the least factor being lignin content of the organic resource. A total of twenty clusters were produced on the RDA biplot. Earthworm, termite, wireworm and centipede were similar and were all negatively correlated to total nitrogen in organic resources. Termite was negatively correlated to applied mineral nitrogen. However, spider abundance was positively correlated to organic resources total nitrogen. White grub and medium black ant were similar in behaviour (in same cluster) and were negatively correlated to resources application rate, polyphenols and lignin content. On the other hand, millipede and locust were in the same cluster and were positively correlated application rate, polyphenols and lignin content. Amongst the five environmental variables the Monte Carlo permutation test indicated that N topdressing had significant (P < 0.05) influence on macrofauna abundance (Figure 7).
Figure 2. Changes in abundance of earthworm at Domboshawa during 2015/16 rainfall season.
46
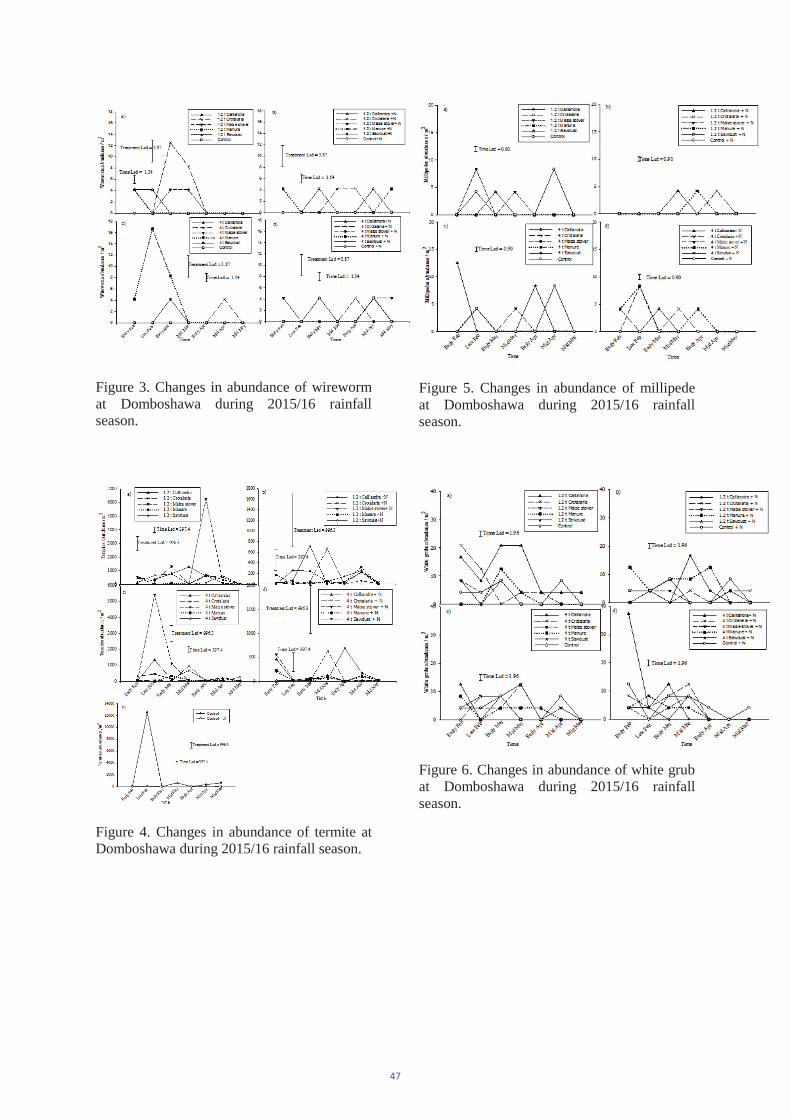
Figure 3. Changes in abundance of wireworm at Domboshawa during 2015/16 rainfall season.
Figure 4. Changes in abundance of termite at Domboshawa during 2015/16 rainfall season.
Figure 5. Changes in abundance of millipede at Domboshawa during 2015/16 rainfall season.
Figure 6. Changes in abundance of white grub at Domboshawa during 2015/16 rainfall season.
47
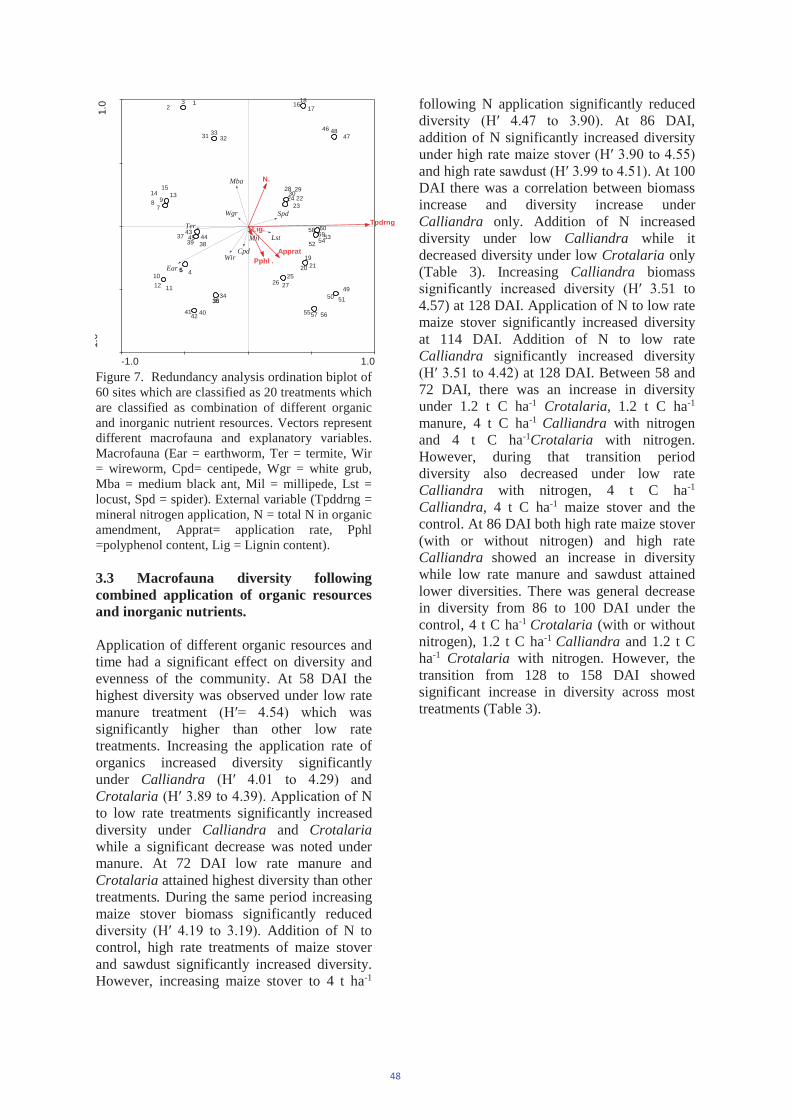
-1.0 1.0
1.0
1.0
Ter
Ear
Mil
Wir
Wgr
Cpd
Spd
Lst
Mba
Apprat
N.
Lig.
Pphl .
Tpdrng
12
3
456
78 9
10
1112
131415
1617
18
1920 21
2223
24
2526 27
28 2930
31 3233
343536
373839
404142
434445
4647
48
4950 51
525354
55 5657
585960
Figure 7. Redundancy analysis ordination biplot of 60 sites which are classified as 20 treatments which are classified as combination of different organic and inorganic nutrient resources. Vectors represent different macrofauna and explanatory variables. Macrofauna (Ear = earthworm, Ter = termite, Wir = wireworm, Cpd= centipede, Wgr = white grub, Mba = medium black ant, Mil = millipede, Lst = locust, Spd = spider). External variable (Tpddrng = mineral nitrogen application, N = total N in organic amendment, Apprat= application rate, Pphl =polyphenol content, Lig = Lignin content).
3.3 Macrofauna diversity following combined application of organic resources and inorganic nutrients.
Application of different organic resources and time had a significant effect on diversity and evenness of the community. At 58 DAI the highest diversity was observed under low rate
significantly higher than other low rate treatments. Increasing the application rate of organics increased diversity significantly under CalliandraCrotalaria Nto low rate treatments significantly increased diversity under Calliandra and Crotalariawhile a significant decrease was noted under manure. At 72 DAI low rate manure and Crotalaria attained highest diversity than other treatments. During the same period increasing maize stover biomass significantly reduced
Addition of N to control, high rate treatments of maize stover and sawdust significantly increased diversity. However, increasing maize stover to 4 t ha-1
following N application significantly reduced div At 86 DAI, addition of N significantly increased diversity
and high rate . At 100 DAI there was a correlation between biomass increase and diversity increase under Calliandra only. Addition of N increased diversity under low Calliandra while it decreased diversity under low Crotalaria only (Table 3). Increasing Calliandra biomass
51 to 4.57) at 128 DAI. Application of N to low rate maize stover significantly increased diversity at 114 DAI. Addition of N to low rate Calliandra significantly increased diversity
at 128 DAI. Between 58 and 72 DAI, there was an increase in diversity under 1.2 t C ha-1 Crotalaria, 1.2 t C ha-1
manure, 4 t C ha-1 Calliandra with nitrogen and 4 t C ha-1Crotalaria with nitrogen. However, during that transition period diversity also decreased under low rateCalliandra with nitrogen, 4 t C ha-1
Calliandra, 4 t C ha-1 maize stover and the control. At 86 DAI both high rate maize stover (with or without nitrogen) and high rate Calliandra showed an increase in diversity while low rate manure and sawdust attained lower diversities. There was general decrease in diversity from 86 to 100 DAI under the control, 4 t C ha-1 Crotalaria (with or without nitrogen), 1.2 t C ha-1 Calliandra and 1.2 t C ha-1 Crotalaria with nitrogen. However, the transition from 128 to 158 DAI showed significant increase in diversity across most treatments (Table 3).
48
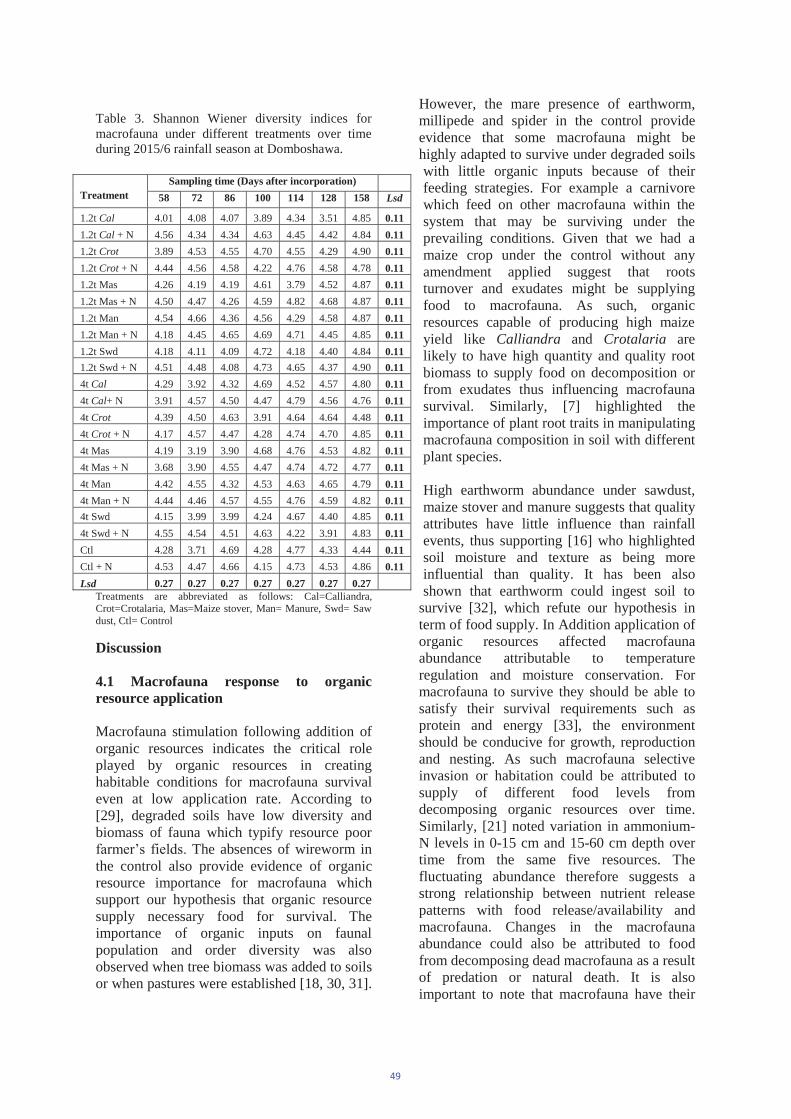
Table 3. Shannon Wiener diversity indices for macrofauna under different treatments over time during 2015/6 rainfall season at Domboshawa.
Treatments are abbreviated as follows: Cal=Calliandra, Crot=Crotalaria, Mas=Maize stover, Man= Manure, Swd= Saw dust, Ctl= Control
Discussion
4.1 Macrofauna response to organic resource application
Macrofauna stimulation following addition of organic resources indicates the critical role played by organic resources in creating habitable conditions for macrofauna survival even at low application rate. According to [29], degraded soils have low diversity and biomass of fauna which typify resource poor
The absences of wireworm in the control also provide evidence of organic resource importance for macrofauna which support our hypothesis that organic resource supply necessary food for survival. The importance of organic inputs on faunal population and order diversity was also observed when tree biomass was added to soils or when pastures were established [18, 30, 31].
However, the mare presence of earthworm, millipede and spider in the control provide evidence that some macrofauna might be highly adapted to survive under degraded soils with little organic inputs because of their feeding strategies. For example a carnivore which feed on other macrofauna within the system that may be surviving under the prevailing conditions. Given that we had a maize crop under the control without any amendment applied suggest that roots turnover and exudates might be supplying food to macrofauna. As such, organic resources capable of producing high maize yield like Calliandra and Crotalaria are likely to have high quantity and quality root biomass to supply food on decomposition or from exudates thus influencing macrofauna survival. Similarly, [7] highlighted the importance of plant root traits in manipulating macrofauna composition in soil with different plant species.
High earthworm abundance under sawdust, maize stover and manure suggests that quality attributes have little influence than rainfall events, thus supporting [16] who highlighted soil moisture and texture as being more influential than quality. It has been also shown that earthworm could ingest soil to
survive [32], which refute our hypothesis in term of food supply. In Addition application of organic resources affected macrofauna abundance attributable to temperature regulation and moisture conservation. For macrofauna to survive they should be able to satisfy their survival requirements such as protein and energy [33], the environment should be conducive for growth, reproduction and nesting. As such macrofauna selective invasion or habitation could be attributed to supply of different food levels from decomposing organic resources over time. Similarly, [21] noted variation in ammonium-N levels in 0-15 cm and 15-60 cm depth over time from the same five resources. The fluctuating abundance therefore suggests a strong relationship between nutrient release patterns with food release/availability and macrofauna. Changes in the macrofauna abundance could also be attributed to food from decomposing dead macrofauna as a result of predation or natural death. It is also important to note that macrofauna have their
Treatment Sampling time (Days after incorporation)
58 72 86 100 114 128 158 Lsd
1.2t Cal 4.01 4.08 4.07 3.89 4.34 3.51 4.85 0.11 1.2t Cal + N 4.56 4.34 4.34 4.63 4.45 4.42 4.84 0.11 1.2t Crot 3.89 4.53 4.55 4.70 4.55 4.29 4.90 0.11 1.2t Crot + N 4.44 4.56 4.58 4.22 4.76 4.58 4.78 0.11 1.2t Mas 4.26 4.19 4.19 4.61 3.79 4.52 4.87 0.11 1.2t Mas + N 4.50 4.47 4.26 4.59 4.82 4.68 4.87 0.11 1.2t Man 4.54 4.66 4.36 4.56 4.29 4.58 4.87 0.11 1.2t Man + N 4.18 4.45 4.65 4.69 4.71 4.45 4.85 0.11 1.2t Swd 4.18 4.11 4.09 4.72 4.18 4.40 4.84 0.11 1.2t Swd + N 4.51 4.48 4.08 4.73 4.65 4.37 4.90 0.11 4t Cal 4.29 3.92 4.32 4.69 4.52 4.57 4.80 0.11 4t Cal+ N 3.91 4.57 4.50 4.47 4.79 4.56 4.76 0.11 4t Crot 4.39 4.50 4.63 3.91 4.64 4.64 4.48 0.11 4t Crot + N 4.17 4.57 4.47 4.28 4.74 4.70 4.85 0.11 4t Mas 4.19 3.19 3.90 4.68 4.76 4.53 4.82 0.11 4t Mas + N 3.68 3.90 4.55 4.47 4.74 4.72 4.77 0.11 4t Man 4.42 4.55 4.32 4.53 4.63 4.65 4.79 0.11 4t Man + N 4.44 4.46 4.57 4.55 4.76 4.59 4.82 0.11 4t Swd 4.15 3.99 3.99 4.24 4.67 4.40 4.85 0.11 4t Swd + N 4.55 4.54 4.51 4.63 4.22 3.91 4.83 0.11 Ctl 4.28 3.71 4.69 4.28 4.77 4.33 4.44 0.11 Ctl + N 4.53 4.47 4.66 4.15 4.73 4.53 4.86 0.11 Lsd 0.27 0.27 0.27 0.27 0.27 0.27 0.27
49
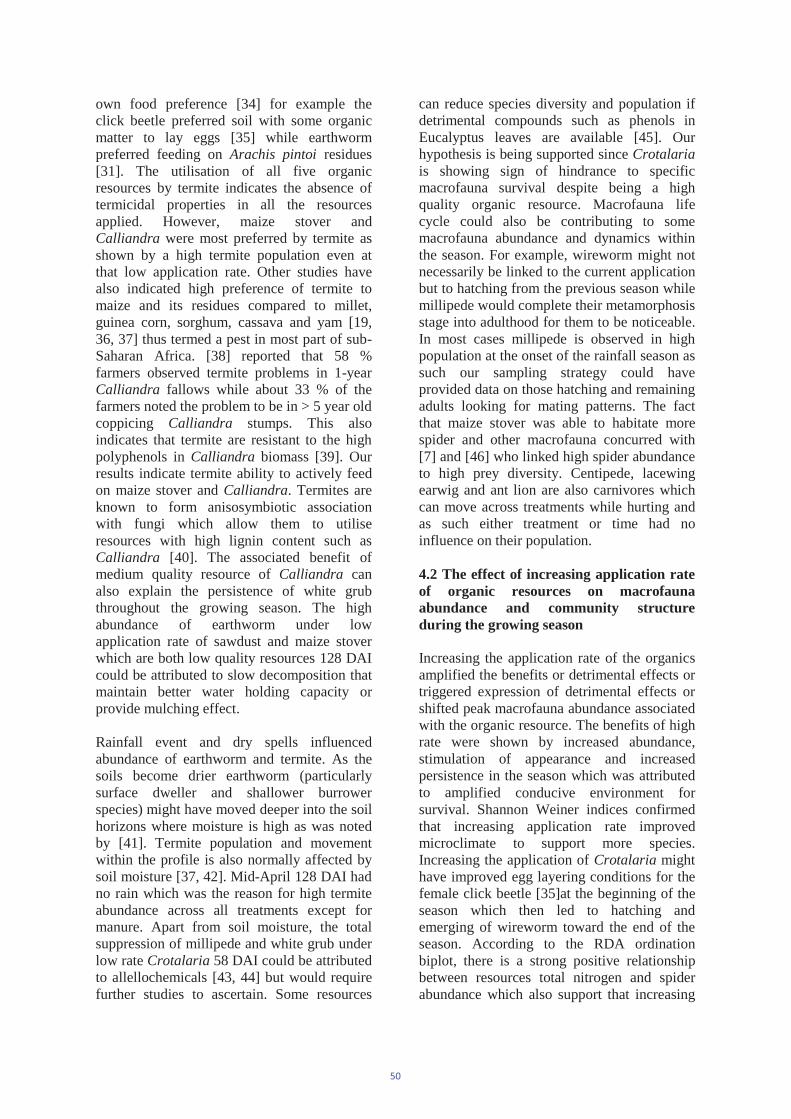
own food preference [34] for example the click beetle preferred soil with some organic matter to lay eggs [35] while earthworm preferred feeding on Arachis pintoi residues [31]. The utilisation of all five organic resources by termite indicates the absence of termicidal properties in all the resources applied. However, maize stover and Calliandra were most preferred by termite as shown by a high termite population even at that low application rate. Other studies have also indicated high preference of termite to maize and its residues compared to millet, guinea corn, sorghum, cassava and yam [19, 36, 37] thus termed a pest in most part of sub-Saharan Africa. [38] reported that 58 % farmers observed termite problems in 1-year Calliandra fallows while about 33 % of the farmers noted the problem to be in > 5 year old coppicing Calliandra stumps. This also indicates that termite are resistant to the high polyphenols in Calliandra biomass [39]. Our results indicate termite ability to actively feed on maize stover and Calliandra. Termites are known to form anisosymbiotic association with fungi which allow them to utilise resources with high lignin content such as Calliandra [40]. The associated benefit of medium quality resource of Calliandra can also explain the persistence of white grub throughout the growing season. The high abundance of earthworm under low application rate of sawdust and maize stover which are both low quality resources 128 DAI could be attributed to slow decomposition that maintain better water holding capacity or provide mulching effect.
Rainfall event and dry spells influenced abundance of earthworm and termite. As the soils become drier earthworm (particularly surface dweller and shallower burrower species) might have moved deeper into the soil horizons where moisture is high as was noted by [41]. Termite population and movement within the profile is also normally affected by soil moisture [37, 42]. Mid-April 128 DAI had no rain which was the reason for high termite abundance across all treatments except for manure. Apart from soil moisture, the total suppression of millipede and white grub under low rate Crotalaria 58 DAI could be attributed to allellochemicals [43, 44] but would require further studies to ascertain. Some resources
can reduce species diversity and population if detrimental compounds such as phenols in Eucalyptus leaves are available [45]. Our hypothesis is being supported since Crotalariais showing sign of hindrance to specific macrofauna survival despite being a high quality organic resource. Macrofauna life cycle could also be contributing to some macrofauna abundance and dynamics within the season. For example, wireworm might not necessarily be linked to the current application but to hatching from the previous season while millipede would complete their metamorphosis stage into adulthood for them to be noticeable. In most cases millipede is observed in high population at the onset of the rainfall season as such our sampling strategy could have provided data on those hatching and remaining adults looking for mating patterns. The fact that maize stover was able to habitate more spider and other macrofauna concurred with [7] and [46] who linked high spider abundance to high prey diversity. Centipede, lacewing earwig and ant lion are also carnivores which can move across treatments while hurting and as such either treatment or time had no influence on their population.
4.2 The effect of increasing application rate of organic resources on macrofauna abundance and community structure during the growing season
Increasing the application rate of the organics amplified the benefits or detrimental effects or triggered expression of detrimental effects or shifted peak macrofauna abundance associated with the organic resource. The benefits of high rate were shown by increased abundance, stimulation of appearance and increased persistence in the season which was attributed to amplified conducive environment for survival. Shannon Weiner indices confirmed that increasing application rate improved microclimate to support more species. Increasing the application of Crotalaria might have improved egg layering conditions for the female click beetle [35]at the beginning of the season which then led to hatching and emerging of wireworm toward the end of the season. According to the RDA ordination biplot, there is a strong positive relationship between resources total nitrogen and spider abundance which also support that increasing
50
the application rate of Calliandra stimulated appearance and persistence of spider. Increasing the application rate created the mulching effect on the soil subsequently regulating soil moisture which benefited or affected macrofauna. Increasing application rate of high quality resources increased diversity as more macrofauna were stimulated from high food supplied apart from the few which were selectively suppressed. The benefits of high food and water conservation for wireworm from high rate Crotalaria and Calliandra might be suppressed by increased repellents levels. For low quality resources diversity was reduced following increase in application rate which could be attributed to immobilisation. Furthermore, increased soil moisture retention reduced the appearance of termite which dislikes wet conditions as highlighted by other researchers [37, 42]. However, the mulching effect might be short lived for rapidly decomposing organics like Crotalaria and Calliandra or those actively consumed by macrofauna (e.g. maize stover and Calliandra). Furthermore, as the season progressed the rainfall amount decreased which caused termite to emerge toward end of the season.
Crotalaria juncea has been known to suppress nematodes by repelling effect [47] or even cause mortality of Elasmopalpus lignosellus(Lepidoptera Pyralidae) due to allelochemical substance released from its biomass [44]. [14] also noted lower order diversity following Crotalaria application. Despite the dry spell noted 158 DAI, the high diversity indicates that macrofauna have adapted to both dry and wet condition which is ecological plasticity. Despite the fact that most of the nutrients would have been leached or mined by mid-May [13, 22] these organic resources still have enough food to support macrofauna survival but limited by moisture. High diversity at 158 DAI is evident that the nutrient requirement for macrofauna is lower than that required by crops for growth. It is important to note there is always competition for food/nutrient/energy within the soil biosphere amongst macrofauna, microbes and the standing crop. Depending on the quality and soil conditions, decomposition will release the different food substrates and difference in macrofauna consumption efficiency will determine abundance and
diversity.
4.3 The effect of mineral nitrogen to macrofauna abundance and community structure
Application of mineral N was detrimental to some macrofauna as shown by decrease in abundance, partial suppression and/or total suppression. The applied nitrogen could be affecting macrofauna directly or indirectly by acidifying the microclimate subsequently affecting macrofauna survival. Similarly, [48] noted that urea was toxic to earthworm while [49] noted that high rate of ammonium nitrate (AN) killed termite. Applied nitrogen could also indirectly promote acidification by promoting maize growth thereby increasing mining of bases from soil [22]. As such farmers who apply little organic amendments and yet apply high rate of mineral nitrogen might be affecting soil macrofauna. It is also important to note that nitrogen from the organic resources also affected abundance of termite, earthworm, wireworm and centipede as shown by negative correlation to resource total nitrogen. Therefore, application of mineral nitrogen could further stimulate mineralisation which would amplify the effect of nitrogen on macrofauna abundance particular to high quality resources such as Crotalaria. [39] also noted that nitrogen availability was highest (25 mg N kg-1 soil) in root zone under high rate Crotalaria treatment. Spiders depend on other species for survival, so any manipulation of would subsequently regulate their abundance [50]. According to [39] and [51] Crotalaria junceacan supply nitrogen easily while Calliandra calothyrsus might need priming with external nitrogen to sustain crop production. However, for macrofauna abundance mineral nitrogen addition to low, medium and high quality organic resources seemed to be detrimental to selective macrofauna survival. [52] also noted lower number of soil fauna individuals under fully fertilized treatments and higher individuals when organic resources were added. Diversity changes following nitrogen application was related to quantity and quality of the resource. Application of nitrogen to low rate Calliandra promotes decomposition thereby allowing other macrofauna to survive thus having higher diversity. Our results thus
51
support our hypothesis that combined application of organic and inorganic resources improves diversity. At the same time the significant increase in diversity following nitrogen application under high rate treatments of maize stover and sawdust could be attributed to improved decomposition.
4.4 Conclusions
We identified that application of organic resource under maize mono-cropping can curb the decline in macrofauna abundance and diversity. The study showed that macrofauna responded differently to organic resources depending on their food requirements, preference related to palatability, feeding strategies, their life cycle, rainfall events and modification of habitats. This study also indicated the importance of root biomass on macrofauna abundance and diversity. Application of organic resources at 1.2 t C ha-1
stimulated macrofauna appearance (e.g. wireworm), promoted persistence of other macrofauna (e.g. white grub under Calliandra)while millipede was total suppressed under low rate Crotalaria. Increasing the application rate to 4.0 t C ha-1 amplified the benefits or detrimental effects or triggered expression of detrimental effects or shifted peak macrofauna abundance associated with the organic resource. Calliandra suppression effect on white grub and wireworm was only triggered at high application rate. Application of ammonium nitrate was the most influential variable affecting macrofauna abundance. Mineral nitrogen caused decrease in abundance, partial suppression and/or total suppression of macrofauna particularly earthworm, wireworm, termite and centipede. Diversity changes following nitrogen application was related to quantity and quality of the resource. However, further research is needed to understand the influence of co-application of organic and inorganic resource on microbial abundance and diversity in maize rhizosphere and bulky soil.
Acknowledgements
Financial support from UZ Research Grant 91069 is greatly appreciated. We are also grateful for the support from Nutrient Use Efficiency and Soil Organic Matter
(NUESOM) and Entomologist within Department of Crop Science for species identification.
References
[1] Kamau S., Barrios, E., karanja N.K., Ayuke F.O and Lehmann J. Soil macrofauna abundance under dominant tree species increases along a soil degradation gradient. Soil Biology & Biochemistry. 112, 35-46, 2017.
[2] Karanja N.K., Ayuke F.O., Muya E.M., Musombi B.K., and Nyamasyo G.H.N. Soil macrofauna community structure across land use systems of Taita, Kenya. Tropical and Subtropical Agroecosystems, 11 (2009): 385-396, 2009.
[3] Steinwandter M., Schlick-Steiner B.C., Seeber G.U.H., Steiner F.M. and Seeber J. Effects of Alpine land-use changes: Soil macrofauna community revisited. Ecology and Evolution, 7,5389-5399, 2017.
[4] Barrios E, Sileshi G.W., Shepherd K.D. and Sinclair F. Agroforestry and soil health: linking trees, soil biota and ecosystem services. In: Wall, D.H., Bardgett, R.D., Behan-Pelletier, V., Herrick, J.E., Jones, T.H., Ritz, K., Six, J., Strong, D.R. and van der Putten, W.H. (editors). Soil ecology and ecosystem services. Oxford (UK): Oxford University Press; p. 315 330, 2012.
[5] Mathieu J., Rossi J., Grimaldi M., Mora P.H., Lavelle P., Rouland C., and Rouland A. Multi-scale study of soil macrofauna biodiversity in Amazonian pastures. Biology and Fertility of Soils, 40: 300-305, 2004.
[6] Sileshi G. and Mafongoya P.L. The short-term impact of forest fire on soil invertebrates in the miombo. Biodiversity and Conservation, 15(10), 3153-3160, 2006.
[7] Salamon J., Wissuwa J., Jagos S., Koblmuller M., Ozinger O., Winkler C. and Frank T. Plant species effects on soil macrofauna density in grassy arable fallows of different age.
52
European Journal of Soil Biology, 47, 129-137, 2011.
[8] Muchane M.N., Karanja D., Wambugu M.G., Matahi J.M., Masiga C.W., Mugoya C. and Muchai M. Land use practices and their implications on soil macro-fauna in Maasai Mara ecosystem. International Journal of Biodiversity and Conservation, vol 4(13), 500-514, 2012.
[9] Manzungu E. and Mtali L. 2012. Spatial and temporal distribution of fallow land and its utilisation in south east Zimbabwe. Journal of Geography and Geology. Vol. 4, No. 4; 62-75.
[10] Nezomba H., Mtambanengwe F., Tittonell P. and Mapfumo P. Point of no return? Rehabilitating degraded soils for increased crop productivity on smallholder farms in eastern Zimbabwe. Geoderma, 239 240: 143-155, 2015.
[11] Tully T., Sullivan C., Weil R. and Sanchez P. The state of soil degradation in Sub-Saharan Africa; Baselines, Trajectories and solutions. Sustainability, 7, 6523-6552, 2015.
[12] Ayuke F.O., Karanja N.K., Muyu E.M., Musombi B.K., Mungatu J. and Nyamasyo G.H.N. Macro fauna diversity and abundance across different land use systems in Embu, Kenya. Trop Sub trop. Agroecosyst,11, 371-384, 2009.
[13] Mapfumo P. and Giller K.E. Soil Fertility Management Strategies and Practices by Smallholder Farmers in Semi-Arid Areas of Zimbabwe. International Crops Research Institute for the Semi-Arid Tropics (ICRISAT), pp 1-43, 2001.
[14] Mapfumo P. Integrating Sustainable Soil Fertility Management Innovations in Staple Cereal Systems and Other Value Chains to Enhance Livelihoods and Environmental Systems in Southern Africa. SOFECSA Annual Report for SSA-CP FARA. SOFECSA, CIMMYT, Harare, Zimbabwe, 2009.
[15] PFA. 2007. "Conservation Agriculture." People and Food Agriculture. http.www.peopleandplanet.net
[16] Warren M.W. and Zou X. Soil Macrofauna and litter nutrients in
three tropical tree plantations on disturbed site in Puerto Rico. Forestry Ecology and Management, 170, 161-171, 2002.
[17] Nhamo N. The Contribution of Different Fauna Communities to Improved Soil Health, A Case of Zimbabwean Soils under Conservation Agriculture. University of Bonn Ecology and Development Series.56, pp 141, 2007.
[18] Manyanga M.A., Mafongoya P.L. and Tauro T.P. Soil macrofauna order diversity and abundance under improved fallows and organic matter transfer system in Zimbabwe. African Journal of Ecology, 52 (4): 506 513, 2014.
[19] Mutsamba E.F., Nyagumbo I. and Mafongoya P. Termite prevalence and crop lodging under conservation agriculture in sub-humid Zimbabwe. Crop Protection, 82:60-64, 2016.
[20] Mapfumo P., Mtambanengwe F., Nandwa S., Yeboah E. and Vanlauwe B. Soil organic matter dynamics for sustainable cropping and environmental management in Tropical systems: Effect of organic resource quality and diversity. TSBF-AFNet SOM Network proposal. TSBF-CIAT, Nairobi, Kenya, 2001.
[21] Mtambanengwe F. and Mapfumo P. Effects of organic resource quality on soil profile N dynamics and maize yields on sandy soil in Zimbabwe. Plant Soil, 281: 173-191, 2006.
[22] Mtangadura T.J., Mtambanengwe F., Nezomba H., Rurinda J. and Mapfumo P. Why organic resources and current fertilizer formulation in Southern Africa cannot sustain maize productivity: evidence form a long-term experiment in Zimbabwe. PLos One, 12(8):e0182840. 2017.
[23] Mtambanengwe F. Soil Organic Matter Dynamics as Affected by Organic Resource Quality and Management Practices on Smallholder Farms. DPhil Thesis, Department of Soil Science and Agricultural Engineering, University of Zimbabwe, 2006.
[24] Brown G.B., Pasin I.A., Benito P.N., Aquino, A.M. and Correira M.E.C. Diversity and functional role of soil
53
macrofauna communities in Brazil no-tillage agroecosystems: A preliminary analysis Universidale Estadual de Londrina. International Symposium on Managing Biodiversity in Agricultural Ecosystems Montreal, Canada, 8-10 November 2001.
[25] Dangerfield J.M. Characterization of soil fauna communities. In: Rao, M.R. and Scholes, R.J. (Eds), Report on Characterization of an Experimental Field in KARI farm, Muguga, Kenya, pp. 51-67. ICRAF, Nairobi, Kenya, 1993.
[26] ENSTAT, GENSTAT Edition 2 Reference Manual. Laws Agricultural Trust (Rothamsted Experimental Station). Clarendon Press, Oxford Science Publications, UK, 2005.
[27] Schloss P.D., Westcott S.L., Ryabin T., Hall J.R., Hartmann M., Hollister E.B., Lesniewski R.A., Oakley B.B., Parks D.H., Robinson C.J., Sahl J.W., Stres B., Thallinger G.G., Van Hom D.J. and Weber C.F. Introducing Mothur: open-source, platform-independent, community-supported software for describing and comparing microbial communities. Applied and Environmental Microbiology, 75, 7537-7541, 2009.
[28] Ter Braak C.J.F. and Smilauer P. CANOCO Reference manual and User Guide: Software for Ordination (Version 5). Biometric, Wageningen and Ceske Budejovie. 2012.
[29] Ayuke F.O., Rao M.R., Swift M.J. and Opondo-Mbai M.L. Impact of soil fertility management strategies on diversity and populations soil macrofauna in an agroecosystem. East African Agricultural and Forestry Journal, 69:2, 131-137, 2003.
[30] Ayuke O.F. Diversity, abundance and function of soil invertebrate fauna in relation to quality of organic residues. M.Phil. Thesis, Moi University, Kenya. 2000.
[31] Velasquez E., Fonte S.J., Barot S., Grimaldi M., Desjardins T. and Lavelle P. Soil macrofauna-mediated impacts of plant species composition on soil functioning in Amazonian
pastures. Applied Soil Ecology 56, 43-50, 2012.
[32] Lavelle P., Senapati B. and Barros E. Soil macrofauna. In: Trees, Crops and Soil Fertility: Concepts and Research Methods (Eds G. SCROTH and F. L. SINCLAIR). CAB International, Wallingford, UK, 2003.
[33] Coleman D.C., Hendrix P.F., Beare H.H., Cheng W.X and Crossley D.A. Microbial and faunal interaction as they affect soil organic matter dynamics in subtropical agroecosystem. In: paoletti, M.G., Foissner, W., Coleman, D. (Eds). Soil Biota, Nutrient Cycling and Farming Systems. CRC press, Boca Raton, FL, pp 1-14, 2000.
[34] Sayad E., Hosseini S.M., Hosseini V. and Salehe-Shooshtari H. Soil macrofauna in relation to soil and leaf litter properties in tree plantations. Journal of Forest Science, 58(3), 170-180, 2012.
[35] Andrews N., Ambrosino, M., Fisher, G. and Rondon, S.I. Wireworm Biology and Nonchemical Management in Potatoes in the Pacific Northwest. PNW 607. pp1-19. 2008.
[36] Obi J.C., Ogunkunle A.O. and Meludu N.T. Effect of Termite Infestation on the Farming System Characteristics of an Endemic Area in the Guinea Savanna Region of Nigeria. American-Eurasian Journal of Scientific Research, 3(1), 1-6, 2008.
[37] Yêyinou Loko L., Orobiyi A., Dansi A.,
perception of termites in agriculture production and their indigenous utilization in Northwest Benin. Journal of Ethnobiology and Ethnomedicine, 13, 64.1-12, 2017.
[38] Nyeko P., Stewart J., Franzel S. and
the management and utilisation of Calliandra calathyrsus, a fodder shrub, in Uganda. Agricultural Research and Extension Network. Network paper number, 140, 1-20, 2004.
[39] Mtambanengwe F., Mapfumo P. and Vanlauwe B. Comparative short-term effects of different quality organic
54
resources on maize productivity under two different environments in Zimbabwe. Nutrient Cycling in Agroecosystems, 76 (2-3): 271-284, 2006.
[40] Wardle D.A. and Lavelle P. Linkages between soil biota, plant litter quality and decomposition. In: Cadisch, G. and Giller, K. E. (Eds). Driven by nature: Plant litter quality and decomposition, CAB International, Wallingford, U. K. 107-124, 1997.
[41] McDaniel J.P, Barbarick K.A, Stromberger M.E. and Cranshaw W. Survivability of Aporrectodea caliginosa in response to drought stress in a Colorado soil. Soil Sci Soc Am J, 77, 1667 1672, 2013.
[42] Dibog L., Eggleton P. and Francis F. Seasonality of soil termites in a Humid Tropical Forest, Mbalmayo, Southern Cameroon. Journal of Tropical Ecology, vol 14(6), pp.841-850, 1998.
[43] Wang K. H., Sipes, B. S. And Schmitt D.P. Crotalaria as a cover crop for nematode management: A review. Nematropica, vol. 32(1), pp. 35-57. 2002.
[44] Gill H.K., McSorley R., Goyal G. and Webb S.E. Mulch as a potential management strategy for lesser cornstalk borer, Elasmopalpus lignosellus (Insecta: Lepidoptera: Pyralidae), in bush bean (Phaseolus vulgaris). Florida Entomol, vol 93(2),pp. 183-190, 2010.
[45] Reich P.B., Oleksyn J., Modrzynski J., Mrozinski P., Hobbie S.E., Eissenstat D.M., Chorover J., Chadwick O.A., Hale C.M., and Tjoelker M.G. Linking litter calcium, earthworms and soil properties: a common garden test with 14 tree species. Ecology Letters, 8, 811-818, 2005.
[46] Pommeresche R., Bakken A.K. and Korsaeth A. Abundance and diversity of spiders (Araneae) in barley and young leys. The Journal of Arachnology, Vol. 41, No. 2, 168-175, 2013.
[47] Wang K.N., Zasada I.A., Sipes B.S. The secret of the allelopathic effect of Sunn Hemp for suppressing plant-
parasitic nematodes. The food provider, 1-5, 2012.
[48] Rai N., Ashiya P and Rathore D.S. Comparative study of the effect of chemical fertilizers and organic fertilizers on Eisenia foetida.International Journal of Innovative Research in Science, Engineering and Technology, vol. 3(5), 12991-12998, 2014.
[49] Meuti M.E. The effects of dietary nitrogen on symbiotic nitrogen fixation in the eastern subterranean termite, Reticulitermes flavipes (Isoptera: Rhinotermitidae). Senior Honours Thesis, The Ohio State University.pp1-57, 2008.
[50] Toft S. 1999. Prey Choice and spider fitness. The Journal of Arachnology,27, 301-307.
[51] Palm C.A., Gachengo C.N., Delve R.J., Cadisch G. and Giller K.E. Organic inputs for soil fertility management in tropical agroecosystems: application of an organic resource database. Agric. Ecosys. Environ. 83, 27-42, 2001.
[52] Zhu X. and Zhu B. Diversity and abundance of soil fauna as influenced by long term fertilization in cropland of purple soil, China. Soil and Tillage Research, 146, 39-46, 2015.
55
Entrepreneurial education and entrepreneurial intention: does age matter?
Gladness L. Monametsia , Petty Pherab , and Joseph EvanAgollac
School of Business and Management Studies Botswana Open University
Email: [email protected]
Abstract
Within the context of a higher education institution this paper investigates the link between entrepreneurial education and entrepreneurial intention. Further, the moderating effects of age are analysed. The study sample consists of 245 students pursuing a business qualification at undergraduate and graduate levels in a tertiary institution in Botswana.Cross sectional design using inferential statistics was used in order to understand the relationships between the variables. The results indicate that there is a positive and significant correlation between perceived behaviouralcontrol and entrepreneurial intention but that age is insignificant as a moderator. The insignificance of age suggests that a lifetime development approach to entrepreneurship research could potentially be effective for entrepreneurial development. The implications of these finding are relevant for policy makers, universities and others involved in entrepreneurial development. This is because entrepreneurial education is thought to be paramount in the development of entrepreneurship. It is therefore, anticipated that findings of this study will help develop more effective policy mechanisms for entrepreneurial development.
KeywordsAge, Botswana, entrepreneurial Intentions, entrepreneurship education, perceived behavioural control.
1. Introduction
General consensus amongst most governments is that entrepreneurship is the panacea for developing countries. Entrepreneurship brings about many benefits to an economy. Such benefits include the provision of new products and services, employment opportunities that all ultimately reduces the burden on government in providing for its citizens. It is in this vein that many countries, developed and developing have turned their attention to entrepreneurial training and education. It is now a consensus amongst scholars and practitioners that entrepreneurial intention should be revivified through education and training. Education helps to direct desirable behaviour within societal and economic frameworks hence the efforts of governments to promote entrepreneurial education.
A study by [42] found that entrepreneurial intention increased after students took an entrepreneurship course. Furthermore, their study found that the increase in entrepreneurial pursuits was higher for business students than for non-business students. Similarly, results of [47] revealed that exposure to entrepreneurial activities positively impacted determinants of entrepreneurial intentions.
Today, there are many business students and graduates and yet developing nations still struggle with successful private enterprises from its youth [8]. Litanies of studies have focused on entrepreneurship in adults, however very little is known about YE. This has resulted in a lack of literature in the field. Therefore, the present study proposes to fill this void by adding to the dearth of literature on the subject and especially the literature from a non-western country.
Institutional framing can have an impact on the behaviours of entrepreneurs [41] and so it is important to study the behaviours of entrepreneurs within a certain context. An example is, [20] study that analysed the behaviour of entrepreneurs among Catholic Christians. [36] Explored this within a large traditional corporation. These studies sought to examine the variables from the institutional lens of a higher education provider. The following research questions will thus be explored:
1. What is the impact of entrepreneurial education on entrepreneurial intention?2. To what extent does age moderate the
56
relationship between entrepreneurial education and entrepreneurial intention?
2. Youth Entrepreneurship in Botswana
In the past few years, Botswana has suffered low job- creation where youth were the hardest groups affected. Botswana youth unemployment rate was recorded at 35.67% in2017, a global ranking of 22 out of 181 countries [12]. This poses a major challenge for the government as the median population age is 24.5 years. Youth as defined by the African Union [1] as those aged 15-35 years make up a total proportion 18.91% of the population in Botswana [13]. Botswana forms part of the Sub-Saharan countries with largest proportion of youth relative to its population.
In order to address the high youth unemployment the Botswana government has set up Youth Development Fund (YDF) for the express purpose of funding youth entrepreneurs’ projects. This is an attempt to buttress against the systematic bias inherent in formal financial institutions’ against youth enterprises. In addition to the Youth Development Fund, other institutions were set up, the aim of which was to broadly encourage entrepreneurship in the country; the Local Enterprise Authority (LEA) and the Citizen Entrepreneurial Development Agency (CEDA). LEA was set up to provide development and support services whereas CEDA was set up to provide finance for entrepreneurs. The Youth Farmers Fund (YFF) is another funding agency administered by CEDA, targeted specifically for youth agricultural enterprises. Despite the government support mechanisms structure in place, youth unemployment still remains high.
In answering the question “To what extent have women and youth entrepreneurs utilized the government institutional support (credit and capacity building) to enhance the growth of their microenterprises?” OKurut and Ama’s study [46] found that the youth micro-entrepreneurs only seven percent had applied for a loan from the various credit institutions. Does this indicate a lack of interest in entrepreneurship by youth? It is common narrative that the youth in Africa have a
negative attitude towards self- employment, especially self-employment in the informal sector [10]. In South Africa for example, entrepreneurship is seen as a temporary means for survival while in search for formal employment as opposed to a consciously permanent career option [40].
3. Literature Review
3.1 Youth Entrepreneurship
Youth entrepreneurship (YE) offer many economic benefits, the most obvious being employment creation and revenue generation to the national exchequer. It is a widely held view by scholars that youth entrepreneurship is and can be a means to incorporate a disaffected and relegated youth into the mainstream economy [8]. Furthermore, greater benefits include an industrious youth free from the socio-psychological problems that come with idleness’ [19];[18]. The character of youth epitomizes the very spirit of entrepreneurship. This makes youth more apt to running successful enterprises by their ambition, drive, imagination, enthusiasm, energy and audacity [11]. It is thus that the OECD [45] notes that these natural dispositions for youth should be honed through appropriate support structures and policy development in recognition that thriving of the new economy hinges on a an entrepreneurial culture, a culture which youth are best aligned to pioneer. In lieu of the budding significance of entrepreneurship and self-employment as a source of new jobs and economic vitality in developed countries, and employments in developing countries, it is essential to stimulate youth entrepreneurship as a source of enhanced youth livelihoods and economic liberation [17];[24]. Entrepreneurial intentions are the basis for the entrepreneurial process. These intentions are indicators of entrepreneurial behaviour [49]. Although a lot of youth dream of starting their own business only a minority ever do. In the USA, only 10% of adult population is engaged in entrepreneurship. This discrepancy between aspirations and what transpires later in life necessitates a study on the EI of youths.
3.2 Entrepreneurship Education
57
The effects of education on entrepreneurship has been an on-going debate in recent years [30];[6].Entrepreneurship education is defined as ‘ a holistic approach to empowering and developing entrepreneurs’[37]. A number of studies have looked at the entrepreneurial intentions of students as it offers a unique perspective on how their training influences them [6]; [59]; [22]. Entrepreneurship education programs have been found to have strong influence on entrepreneurship intentions [23]; [51]. Entrepreneurship education does not only impact skills on starting a business, but also how to establish networks necessary to identify business opportunities [48]. From the literature it is noted that there is a dichotomy of empirical results with regard to how entrepreneurial education affects entrepreneurship. As earlier highlighted there are those that found a positive impact of entrepreneurial education on entrepreneurship. However there are those that found that entrepreneurial education does not affect determinants of entrepreneurship intentions [52]; [3]; [23]. Despite this debate about the effect of entrepreneurship education on entrepreneurship intention, business education is touted by many as a tool to help university students to start their own businesses.
3.3 Perceived Behavioural Control
Perceived Behavioural Control (PBC) draws from the Theory of Planned Behaviour (TPB) [4]. PBC attempts to explain behaviours, which individuals can control. It explains the relationship between behavioural intentions and actions. More succinctly, it attempts to explain the perceptions of an individual of performing a task, for example, starting and running a business. The main hypothesis of the TPB theory [4] was that even though an individual may be aware of the potential benefits of certain behaviours they would only perform that action in relation to their perceived ability to accomplish the particular task in question. This perceived ability is related to one’s skill, competence, time, and money amongst others. One of the criticisms of the PBC is its
similarity with the concept of self-efficacy drawn from the Theory of Reasoned Action (TRA), [9]. In response to this Ajzen explained that essentially PBC and self- efficacy are similar when the subjective probability of success and the degree of control for both internal and external factors reach a maximum. However, the difference arises when the subjective probability of success and degree of control of factors is not maximal, then it encroaches on the realm of PBC. Despite the wide and successful application of PBC in various areas of studies there are differing opinions on the relevance of the use of the single construct of ‘control’ [57]. Multi-dimensional constructs of PBC have emerged to address the shortcoming. [58] suggested an addition of self-efficacy in order to accommodate internal control factors that were overlooked in favour of external control factors. In addition, studies [16]; [56] highlighted the conceptualisation of the terms as the main issue in the two theories. The definition of PBC according to Ajzen and Madden is “the person’s belief as to how easy or difficult performance of the behaviour is likely to be” [5:457]. The response of the single construct then prompted an easy-difficult scale. Sparks [56] argued that this may not be effective due to non-divergence of difficulty and control, for instance, some actions are within ones control but difficult to perform. Regardless, PBC has continued to be used to predict behavioural intentions in various contexts. It is worth noting, however, that PBC only contributes to the understanding of intentions but does not actually predict behaviour [26]. This study utilises the PBC theory in order to ascertain the entrepreneurial intentions of the study population.
3.4 Hypothesis Development
3.4.1 Youth and Entrepreneurial Intention
Various studies have showed the positive correlation between age and entrepreneurial intention [27]; [38]. It was found that EI peaks at age forty and then seems to level off after. [39] found a correlation between age and IE in youth Corp members in Nigeria. This holds true for many African countries, where entrepreneurial participation is dominant amongst middle aged individuals [10]. [21] found entrepreneurial capacity in
58
youth as young as eleven. Notwithstanding the limitation of the small sample size these capacities such as resourcefulness and persistence were found to have been fostered by among other things positive modelling by entrepreneurs. This rebuts the idea of youth as a homogenous group regarding entrepreneurship. Though there are no studies that have shown a link between early EI and the pursuit of a successful entrepreneurial career, many have shown that youths’ attitudes and interests help shape their entrepreneurial endeavours [25]. Given these findings we posit that:
H1: Age and Entrepreneurial Intention are significantly correlated.
3.4.2 Perceived Behavioural Control and Entrepreneurial Intentions
Empirical studies suggest a strong relationship between PBC and EI [2]. In addition, a study [32] found that PBC was the strongest predictor of entrepreneurial intent amongst students enrolled in business courses in Lesotho. These findings were similar to other studies [31]; [34]; [43]; [47]. Where dissent existed it was due to personal variables [7]; [31]. A subdividing approach when analysing factors that influence EI are therefore suggested [29]. Thus the following hypotheses are put forth.
H2: Perceived Behavioural Control is significantly and positively linked to Entrepreneurial Intentions
H3: Age significantly moderates the relationship between Perceived Behavioural Control and Entrepreneurial Intention.
4. Research Methodology
The sample participants consisted of students selected at the Botswana Open University pursuing a business qualification at undergraduate and graduate levels. The number of students was 245 indicating a 49 percent response rate out of the 500 issued questionnaires. The sample size was informed by Krejice and Morgan [33] and hence sufficiently representative of the population.
The study adopted Buli and Yesuf [15] research instrument with some items
incorporated from Ajzen’s theory of planned behaviour. It consisted of questions relating to demography, EI and PBC. The measurement scale was a 5-point likert scale ranging from 1 (strongly disagree) to 5 (strongly agree). There were 6 questions each relating to each of the constructs of EI and PBC and demographic information was about age and gender. The instrument was piloted on 25 students to ensure face and construct validity.
5. Results
Inferential statistics were used to analyse data on IBM SPSS version 20. The hypotheses were tested using regression analysis and One way ANOVA. Firstly we sought to ascertain the relationship between PBC and EI, and between Age and EI. Secondly, we sought to find the moderating relationship of age between PBC and EI.
We found that there is a positive and significant relationship between PBC and EI according to Pearson’s correlation coefficient (R= .567). We also found that our independent variable accounts for about 33% of the variation in the dependent variable (R2= 0.33).This result is consistent with studies (Agolla et al., 2018), which found significant relationships between PBC and EI. In order to test for autocorrelation we calculated the Durban Watson value which was almost 2 (df =1.978) indicating no autocorrelation between the data. Assumptions of homogeneity of equal variances was met as the F value of ANOVA was high, F= (118.797) and p = 000 being lower than the alpha level of .05. This non significance of results indicated that there were equal variances between the groups.
In order to test the moderating effect of age with PBC and EI a one way ANOVA was conducted. We found the moderating effect of age between the other two variables to be statistically insignificant. The combined independent variables of age and PBC did not affect the R2 value or the adjusted R2 shifting only slightly, the one way ANOVA revealed R2=. 572 and adjusted R2=.321. This shows that age had a miniscule impact between PBC and EI. There was no autocorrelation as verified by Durban Watson close to 2 (df=2.120). The assumption of equal variances
59
between the groups was once again met, p=.000 being lower than the alpha level of .05. Based on these results H1: Rejected, H2: Accepted, H3: Rejected
6. Conclusion
This study focused on entrepreneurial intention amongst university students and it revealed that students pursuing a businessqualification were influenced to start abusiness. This echoes findings [23]; [35]; [51]; [55]. However, unlike [ 2 8 ] t h i s study found that age does not influence entrepreneurial intentions, relationshipbetween students’ perceptions and their intent to start a business. This implies that students of all ages are likely to benefit from business training and hence more effort should be directed towards making entrepreneurial training more effective and more available to people of all ages. Tangential to these findings a study suggested a lifetime developmental approach in entrepreneurship research and education [44]. This should not just belimited to a certain time period of one’s life, but rather continuous. The findings also suggest that in addition to entrepreneurial education, other tools should be used to encourage youth entrepreneurship. It should be stressed that the findings of this study are limited to intentions to start a business and does not make any inferences towards the successfuloperations of business by said students. This may be an area for subsequent research, where students having completed their training do actually start a business and ifso, how successful it is relative toentrepreneurs having never received any formal training. We suggest a longitudinal study that would follow participants after receiving their training as opposed to the cross sectional design that this paper adopted.
7.0 References
[1] African youth charter, African Union 2006, accessed, 15 August 2018 at https://au.int/en/treaties/african-youth-charter
[2] Agolla, J.E., Monametsi, G. and Phera, P.Antecedents of entrepreneurial intentions amongst tertiary students: the
case of Botswana. Asia Pacific Journal of Innovation and Entrepreneurship (inpress), 2018.
[3] Ahmed, T., Chandran V. G. R. and Klobas J.Specialized entrepreneurship education: Does it really matter? Fresh evidence from Pakistan. International Journal of Entrepreneurial Behaviour and Research, vol 23(1), pp 4-19, 2017.
[4] Ajzen, I. The theory of planned behaviour. Organisational Behaviour and Human Decision Processes, vol 50, pp. 179–211, 1991.
[5] Ajzen, I. and Madden, T. J.Prediction of goal directed behaviour: Attitudes, intentions and perceived behavioural control. Journal of Experimental Social Psychology, 22, 453–474, 1986.
[6] Anne Støren, L. Entrepreneurship in higher education: Impacts on graduates' entrepreneurial intentions, activity and learning outcome. Education and Training,vol 56(8), pp. 795-813, 2014.
[7] Aragon-Sanchez, A., Baixauli-Soler, S., & Carrasco-Hernandez, A. J. (2017). A missing link: the behavioral mediators between resources and entrepreneurial intentions. International Journal of Entrepreneurial Behavior & Research, vol23(5), pp. 752-768, 2017.
[8] Awogbenle, A. C. and Iwuamadi, K. C. Youth unemployment: Entrepreneurship development programme as an intervention mechanism. African Journal of Business Management, vol 4(6), pp. 831-835, 2010.
[9] Bandura, A. Self efficacy: Toward a unifying theory of behavioural change. Psychological Review, vol 84, pp. 191–215, 1977.
[10] Beeka, B. H. and Rimmington, M. Entrepreneurship as a career option for African youth. Journal of Developmental Entrepreneurship, vol 16, pp. 145-164, 2011.
[11] Bennell, P. Improving Youth Livelihoods In Sub-Saharan Africa: A Review Of Policies And Programmes With Particular Emphasis on the Link Between Sexual Behaviour And Economic Well Being. Draft report, USAID, 2000.
[12] Botswana Youth Unemployement 2017, World Bank, accessed 25 September 2018 at https://www.theglobaleconomy.com/Botswana/Youth_unemployment/
[13] Botswana age structure, 2018, Index-Mundi 2018, accessed 20 September 2018
60

athttps://www.indexmundi.com/botswana/age_structure.html
[14] Brixiova, Z., Ncube, M., and Bicaba, Z. Skills and youth entrepreneurship in Africa: Analysis with evidence from Swaziland. World Development, vol 67, pp.11-26, 2015.
[15] Buli, B. M., & Yesuf, W. M. (2015). Determinants of entrepreneurial intentions: Technical-vocational education and training students in Ethiopia. Education+Training, vol 57(8/9), pp. 891-907, 2015.
[16] Chan, D. K. S. and Fishbein, M. Determinants of college women's intentions to tell their partners to use condoms. Journal of Applied Social Psychology, vol 23, pp. 1455–1470, 1993.
[17] Chigunta FJ. Youth entrepreneurship: Meeting the key policy challenges. Education Development Center; 2002 Jul.
[18] Corps, M. Youth entrepreneurship in Kashmir: challenges and opportunities. Mercy Corp, 2011
[19] Curtain, R. Youth and employment: A public policy perspective. Development Bulletin, vol 55(1), pp. 7-11. 2001.
[20] Dakung, R. J. and Soemunti, T. W. Entrepreneurial behaviour among catholic christians in plateau state-nigeria. World Journal of Entrepreneurship, Management and Sustainable Development,vol 12(2),pp. 176-192, 2016.
[21] Damon, W. Moral child: Nurturing children's natural moral growth. Simon and Schuster, 2008.
[22] Deepak, P., Joshi, M. P. and Tiwari, S. R. (2018). Examining entrepreneurial intention in higher education: An exploratory study of college students in india. The Journal of Entrepreneurship,vol27(1), 25-46, 2018.
[23] Fayolle, A., Lassas-Clerc, N. and Tounés, A. “The effects of real vs. virtual business planning as learning process (summary)”, Frontiers of Entrepreneurship Research,vol 29 (4), pp. 3, 2009.
[24] Geldhof, G. J., Malin, H., Johnson, S. K., Porter,T., Bronk, K. C., Weiner, M. B., Agans, J. P., Mueller, M. K., Hunt, D., Colby, A., Lerner, R. M. and Damon, W. Entrepreneurship in young adults: Initial findings from the young entrepreneurs study. Journal of Applied Developmental Psychology, vol 35(5), pp. 410-421, 2014.
[25] Geldhof, G. J., Porter, T., Weiner, M. B., Malin, H., Bronk, K. C., Agans, J. P., and Lerner, R. M. Fostering youth entrepreneurship: Preliminary findings
from the young entrepreneurs study. Journal of Research on Adolescence, vol 24(3), pp. 431-446, 2014.
[26] Godin, G., Valois, P. and Lepage, L. The pattern of influence of perceived behavioural control upon exercising behaviour: An application of Ajzen's theory of planned behaviour. Journal of behavioral medicine, vol 16(1), pp. 81-102, 1993.
[27] Gulruh, M. J. Perspectives from the field: Will recent public policies reduce entrepreneurship in the healthcare industry. International Journal of Public Administration, vol 29, pp. 479-488, 2010.
[28] Hatak, I., Harms, R., & Fink, M. Age, job identification, and entrepreneurial intention. Journal of Managerial Psychology, vol 30(1), pp. 38-53, 2015
[29] Ibrahim, N., & Mas’ud, A. Moderating role of entrepreneurial orientation on the relationship between entrepreneurial skills, environmental factors and entrepreneurial intention: A PLS approach. Management Science Letters, vol 6(3), pp. 225-236, 2016.
[30] Kakouris, A. Exploring entrepreneurial conceptions, beliefs and intentions of Greek graduates. International Journal of Entrepreneurial Behavior & Research, vol22(1), pp. 109-132, 2016.
[31] Karimi, S., Biemans, H., Naderi Mahdei, K., Lans, T., Chizari, M. and Mulder, M. Testing the relationship between personality characteristics, contextual factors and entrepreneurial intentions in a developing country. International Journal of Psychology, vol 52(3), pp. 227-240, 2017.
[32] Khaola, P. and Ndovorwi, T.Beyond the Theory of Planned Behaviour -- Viewing Entrepreneurial Intent Through the Lens of Economic Powerlessness. Journal of Enterprising Culture, vol 23(4), pp. 501-518, 2015.
[33] Krejcie, R. V. and Morgan, D. W. Determining sample size for research activities. Educational and psychological measurement, vol 30(3), pp. 607-610, 1970.
[34] Krzysztof, W. and Liwiusz W. Entrepreneurial Intentions of Students in Poland in the View of Ajzen’s Theory of Planned Behaviour. Entrepreneurial Business and Economics Review, vol 4(1),pp. 83-94, 2016.
[35] Liñán, F., Rodríguez-Cohard, J. C., & Rueda-Cantuche, J. M. Factors affecting entrepreneurial intention levels: a role for
61

education. International entrepreneurship and management Journal, vol 7(2), pp. 195-218, 2011
[36] Mair, J. (2001). Entrepreneurial behaviour in a large traditional organisation: Exploring nature, drivers, and performance implications (Order No. 3012849). Available from ABI/INFORM Global; ProQuest Central.
[37] Mehtap, S., Pellegrini, M. M., Caputo, A., and Welsh, D. H. B. Entrepreneurial intentions of young women in the Arab world: Socio-cultural and educational barriers, International Journal of Entrepreneurial Behavior & Research, vol23 (6), pp. 880-902, 2017.
[38] Minniti, M.Female entrepreneurship and economic activity. The European Journal of Development Research, vol 22(3), pp. 294-312, 2010
[39] Moa-Liberty A. W., Tunde A. O. and Tinuola O. L. The influence of self-efficacy and socio-demographic factors on the entrepreneurial intentions of selected Youth Corp members in Lagos, Nigeria. Bulletin of Geography: Socio-Economic Series, vol 34(34), pp. 63-71, 2016.
[40] Motts, N. (2000). Current Youth Entrepreneurship Practice in Africa: Does it Work?. Accessed 25 September 2018 at https://idl-bncidrc.dspacedirect.org/bitstream/handle/10625/32150/118503.pdf?sequence=1
[41] Mpeera Ntayi, J., Mutebi, H., Kamanyi, S., & Byangwa, K. Institutional framing for entrepreneurship in sub-Saharan Africa: a case of Uganda. World Journal of Entrepreneurship, Management and Sustainable Development, vol 9(2/3), pp. 133-154, 2013.
[42] Murugesan, R., and Jayavelu, R. Testing the impact of entrepreneurship education on business, engineering and arts and science students using the theory of planned behaviour. Journal of Entrepreneurship in Emerging Economies,vol 7(3), pp. 256-275, 2015.
[43] Ni u–Antonie, R. and Feder, E. Youths’ Entrepreneurial Behaviour and Intentions. Empirical Study on Students with Entrepreneurship Education. Romanian Economic Journal, vol (50), pp. 65-87, 2013.
[44] Obschonka, M., Silbereisen, R. K., & Schmitt-Rodermund, E. Entrepreneurial intention as developmental outcome. Journal of Vocational Behavior, vol 77(1),pp. 63-72, 2010.
[45] OECD and European Commission. Career guidance: A handbook for policy makers, (OECD/European Commission, Paris), 2004.
[46] Okurut, F. N. and Ama. N. O. Assessing factors that affect women and youth micr0-entrepreneurs in Botswana.
International Journal of Academic Research in Economics and Management Sciences, vol 2 (1), pp. 2226-3624, 2013.
[47] Osorio, F., and Juan, C. L. Entrepreneurial intention in students of secondary education: Using the exposure effect to extend the theory of planned behaviour. Cuadernos De Administración, vol 28(51),2015.
[48] Pedrini, M., Langella, V., and Molteni, M. Do entrepreneurial education programs impact the antecedents of entrepreneurial intention?: An analysis of an entrepreneurship MBA in Ghana", Journal of Enterprising Communities: People and Places in the Global Economy, vol 11 (3),pp.373-392, 2017.
[49] Pilková, A., Holienka, M., and Jan ovi ová, Z. Investigating Youth Entrepreneurial intentions’ Drivers in Visegrad Countries. Acta Universitatis Agriculturae Et Silviculturae Mendelianae Brunensis, vol 65(6), pp. 2055-2065, 2017.
[50] Rashid, I. Push and pull factors in entrepreneurial intentions among youth in a small imperial state. Indian Journal of Industrial Relations, vol 53(1), pp. 167, 2017.
[51] Sánchez, J. C. The impact of an entrepreneurship education program on entrepreneurial competencies and intention. Journal of Small Business Management,vol 51(3), pp. 447-465, 2013.
[52] Shamsudin, S. F. F. B., Al Mamun, A., Nawi, N. B. C., Nasir, N. A. B. M. and Zakaria, M. N. B. Factors affecting entrepreneurial intention among the Malaysian university students. The Journal of Developing Areas, vol 51 (4),pp. 423-431, 2017.
[53] Singh, B., Verma, P. and Rao, M. K. Influence of individual and socio-cultural factors on entrepreneurial intention dagger. South Asian Journal of Management, vol 23(1), pp. 33-55, 2016.
[54] Solesvik, M. Z. Entrepreneurial motivations and intentions: investigating the role of education major. Education+ Training, vol 55(3), pp. 253-271, 2013.
[55] Souitaris, V., Zerbinati, S., & Al-Laham, A. Do entrepreneurship programmes raise entrepreneurial intention of science and
62

engineering students? The effect of learning, inspiration and resources. Journal of Business venturing, vol 22(4),pp. 566-591, 2007.
[56] Sparks, P. Attitudes towards food: Applying, assessing and extending the theory of planned behaviour. In: Thesocial psychology of health and safety: European perspectives. Editors: D. R. Rutter and L. Quine (Eds.). Aldershot , England : Avebury, pp. 25–46, 1994.
[57] Sparks, P., Guthrie, C. A. and Shepherd, R. The dimensional structure of the perceived behavioral control construct 1. Journal of
applied social psychology, vol 27(5), pp. 418-438, 1997.
[58] Terry, D. J. Self efficacy expectancies and the theory of reasoned action. In D. J. Terry, C. Gallois, and M. McCamish (Eds.), The theory of reasoned action: Its application to AIDS preventative behaviour pp. 135–151, 1993. Oxford , England : Pergamon.
[59] Turker, D. and Senem, S. S. Which factors affect entrepreneurial intention of university students? Journal of European Industrial Training, vol 33(2), pp. 142-159, 2009.
63
Evaluation Of Antiretroviral Therapy Programme In Primary Health Care Settings In Lesotho
Abstract
Nyangua and ZZ. NkosiaNational University of Lesotho bUniversity of South Africa
Email: [email protected]
The purpose of this study was to evaluate the antiretroviral therapy programme in primary health care setting in Lesotho. Mixedmethods research using a convergent parallel design was used to collect data. Registered nurses, midwives, nurse clinicians andadults aged 18 years and older who were HIV/AIDS positive were included in the study. SPSS (23) and constant comparison analysis were used to analyse data. Majority of PHC facilities were staffed by registered nurse midwives and nurse clinicians who were qualified and competent in the execution of duties. A large number of patients sought ART services which were offered on aweekly basis although there was variation in the actual number of days the services were provided. Time patients spent seeking ART services varied across districts whilst ARVs and other drugs were usually available. Challenges in ART services delivery included unsatisfactory staffing resulting in the provision of inadequate services and work overload, lack of knowledge of somepatients on ART, too many partners involved in the programme, inadequate documentary evidence and stigma pertaining to the HIV status of individuals. Dissatisfaction in the programme was alluded to poor staffing patterns, lack of continued, consistent in-service training and support, poor salaries, and that ARVs purported hunger. Partners assisting the government must be monitored to avoid duplication of efforts and more education be instigated to prevent individuals infected testing more than once. Regular monitoring and evaluation of ART programme to enable timely reviews and improve service delivery is vital.
Keywords
Antiretroviral therapy, Evaluation of HIV/AIDS programme, Lesotho primary health care, Registered nurses.
1. Introduction
HIV/AIDS remains a major public health concern especially in sub-Saharan Africa where its prevalence is highest with over 19 million people living with the disease out of the 36.7 million people infected world-wide [1]. Globally the pandemic has resulted in social and economic consequences including reduced life expectancy,
10 September 2018. This work was supported by the University of South Africa (UNISA).
Dr I Nyangu Lecturer, Department of Nursing, Faculty of Health Sciences, National University of Lesotho, P.O.Roma 180, Lesotho (e-mail: [email protected])
Professor ZZ Nkosi Professor, College of Human Sciences, University of South Africa, Muckleuneck Ridge, Pretoria, South Africa. (e-mail: [email protected])
reduced household income, increased orphans, increased health care demands and reduced labour availability. Of note is that Southern Africa remains the area most affected by the HIV epidemic and it is host to nine countries with the highest prevalence in the world, including Swaziland (25.9%), Botswana (25%), Lesotho (23.4%), Zimbabwe (18.1%), South Africa (16.9%), Zambia (14.3%) and Malawi (12.7%) [2]. Currently Lesotho has a prevalence of 25% amongst adults aged 15-49 years [3]. Lesotho is a lower middle income country with per capita Gross Domestic Product of US$2.448 billion in 2012 [4]. The country has an estimated population of 2.1 million people and according to last United Nations (UN)
64
estimates, the life expectancy at birth for both sexes was estimated to be 50.38 [5]. Not only has the pandemic crippled government resources but has brought great challenges in the achievement of other development goals especially improving maternal mortally, reducing child mortality and combating other diseases such as Tuberculosis. The government of Lesotho implemented antiretroviral therapy in 2001 and the free antiretroviral therapy program only started in November 2004 [6]. Notable successes in antiretroviral treatment is that Lesotho is one of the few countries that permitted initiation of ART by registered nurses owing to the scarcity of Medical Doctors, a move that has seen a great increase of the coverage of ART. However, literature on the evaluation of the ART program remains limited in Lesotho. Anecdotal evidence suggests that patients have also been found to change the packaging of their ARVs and each time on subsequent visits most patients present their ARVs in plastic packets and not plastic bottles initially dispensed in. Furthermore subjective evidence suggests that emigration has also resulted in most patients` refills being taken by an immediate or close relative or care supporter and the daunting question in the researcher`s mind was whether the medicines eventually got to the patients most of whom work in neighbouring South Africa and only come back home over the long Christmas break. It is in light of the above that this study evaluated the antiretroviral program in the primary health care setting.
2. Research Problem
Many programs and processes targeted towards the reduction of HIV/AIDS in Lesotho have been implemented in the past decade including the antiretroviral program. It is true that the antiretroviral program has seen a great improvement in the lives of many people who are both infected and affected by HIV/AIDS including a reduction in mortality due to the condition. Anecdotal evidence suggests various challenges in the implementation of the program with patients unable to go through complete blood testing when collecting their drug supplies, long queues whilst waiting for services,
failure for individual patients to collect their medications due to employment commitments, tedious paper work during the provision of services and staff overload due to inadequate human resource allocations. Furthermore since implementation of ART in 2004, literature and evidence on the successes, challenges and/or improvement plans in the implementation processes of antiretroviral program in PHC settings of Lesotho remains limited. This study therefore sought to evaluate the antiretroviral program in the primary health care setting of Lesotho with emphasis on implementation processes employed to propagate the program.
3. Research Purpose
The purpose of this study was to evaluate the antiretroviral therapy program in the Primary Health Care setting in Lesotho and develop an evaluation tool that can be used to evaluate the ART program.
4. Research Objectives
A. Describe ART services offered in PHC settings
B. Determine if staffing patterns had an association with number of days ART services were offered, number of days PMTCT services were offered, number of patients seen, time spent by patients seeking ART services at the facility, time taken by a patient to consult a registered nurse midwife/clinician
C. Explore and describe experiences and views of registered nurse midwives/clinicians on the ART program in the PHC settings
D. Explore and describe experiences and views of patients on the ART program in the PHC settings
E. Develop an evaluation tool that can be used to assess the ART program.
5. Research Methods
The Intervention wheel framework [7] and
65
Conceptual Model of Social Programs [8] were used as theoretical underpinnings for this study. Mixed methods convergent parallel research design [9] was used to conduct a process evaluation of the ART program in PHC settings of Lesotho. The study was conducted in 6 districts. The accessible population included registered nurses/midwives/clinicians providing ART services in PHC settings of Lesotho and all individuals who were HIV/AIDS positive and sought ART services in PHC settings of Lesotho and were available at the time of the study. Quota - convenience sampling was used to select registered nurses/midwives/clinicians working in PHC settings for quantitative data whilst purposive sampling was used to recruit registered nurses and HIV/AIDS positive individuals who could participate in focus group discussions. A sample size of 214 was found appropriate to adequately represent the population under study [10].
The Instrument Development Construct Validation framework [11] was used as a guide in the development of the initial questionnaire. Pre-tests of the data collection tools was done on eight registered nurses/midwives/clinicians for quantitative data and a focus group discussion with registered nurses/midwives/clinicians not included in the quantitative strand was conducted and the same concepts elicited quantitatively were asked qualitatively . Quantitative data was collected on 197 participants whilst a total of four focus group discussions were conducted.
Validity: A pre-test was conducted to ascertain relevance of items on the questionnaire and an analysis was conducted using SPSS.
Reliability: Cronbach`s Alpha coefficient was used to establish internal consistency in the quantitative data collection instrument and it was found to be 0.785. Trustworthiness: Sufficient time to ensure an in-depth understanding of experiences and perceptions, recording participants’ demeanor and behaviors during discussions, probing to allow the researcher to record correct information and returning to the groups to verify their responses were used to ensure trustworthiness.
6. Ethical Considerations
The researcher obtained ethical clearance from the Ethics and Higher Degrees Committee in the College of Human Sciences. The researcher then sought permission to conduct the study from the Ministry of Health in Lesotho and its partners and permission was granted. Emanuel [12] provided benchmarks for ethical research that were used to guide the ethical principles in this study and include collaborative partnership, social value, scientific validity, fair selection of study population, favourable risk-benefit ratio, independent review, informed consent and respect for recruited participants and study communities.
7. Results
A. Quantitative data was collected from 40% (n = 64) of the health centre facilities which were mostly church owned. Seven percent (n =14) of participants were males and 92% (n = 181) were females. The age range was 39 with a minimum of 23 and a maximum of 62 years. Mean ( ) = 36 (CI = 34.8 - 38.3); SD = 9.8 Nine percent (n = 17) of the participants were registered nurses, 72% (n = 142) were registered nurses midwives and 19% (n = 37) were nurse clinicians. Spearman rho correlation coefficient at the 0.05 significance level showed no association between occupation title and perceptions on the number of ART (including PMTCT) patients seen at the facilities (rs[197]= -0.055; p = 0.453), time spent seeking ART services (rs[197]= 0.047; p= 0.508), time spent providing ART services (rs[197]= 0.078; p = 0.274), number of days ART services were offered at facilities (rs[197]= 0.025; p = 0.072)and number of days PMTCT services were offered at facilities (rs[197]= -0.063; p = 0.377).
Number of years at facility: The range was 29 with a minimum of zero years and the maximum 29 years. Mean ( ) = 4.6 (CI = 3.5- 4.9); SD = 4.7. KWA test showed significant differences on the number of years spent at facilities by the participants across the districts (p = 0.01; = 0.05). Mann-Whitney-U-test (MWU) showed statistically significant higher numbers of years at facilities in Maseru than Mafeteng (U = 163; p = 0.012), Maseru than
66
Qacha`s Nek (U = 83; p = 0.04), Qacha`s Nek than Thaba Tseka (U = 15.5; p = 0.022), Maseru than Berea (U = 236; p = 236), Berea than Butha Buthe (U = 67; p = 0.04), Berea than Thaba Tseka (U = 27; p < 0.001).
Number of years in clinical practice: Therange was 34 years with a minimum of 1 year and a maximum of 35 years. Mean ( ) = 9.7 (CI = 8.5 -11.4); SD = 8. KWA test was did not show significant differences in the number of years spent in clinical practice across the districts (p = 0.73; = 0.05). MWU showed years spent in clinical practice were higher in Maseru than Mafeteng (U = 163; p = 0.012), Mafeteng than Qacha`s nek (U = 22.5; p = 0.046), Mafeteng than Berea (U = 59; p = 0.046), Maseru than Thaba Tseka (U = 153.5; p = 0.039).
Services offered at facilities: The services that were offered at the facilities included screening, contact tracing, referral & follow- up, family planning, creatinine clearance, village teaching, prevention of mother to child transmission, full blood count, electrolyte count, TB screening & continuation, ART initiation & continuation, Blood urea count, haemoglobin count, liver function tests, secondary school teaching, outreach, immunisations, health facility & village & traditional healer teaching, antenatal care, postnatal care, general out patients care, voluntary male medical circumcision, cervical cancer screening and counselling.
B. Qualitative sample had four samples. Sample one had five nurses who a mean age of 39 and had spent on average of six years at their facilities. Sample two had three nurses who had a mean age of 37 and had spent on average four years at their facilities. Sample three had seven patients whose mean age was 47 and had started taking ARVs from as early as 2005. Sample four had four patients whose mean age was 37 and had stated taking ARVs from 2006.
C. Data Integration
Number of patients seen per week: Quantitative showed an average number of 173 patients seen at facilities every week whilst qualitative results revealed a theme of staffing adequacy
which had one category of inadequate human resource and sub-categories of large population being served.
Number of days ART and PMTCT services wereoffered: Quantitative results showed more than 50% of the participants reported that services were offered for at least five (5) days and when necessary. Qualitative results showed in the theme of ART service delivery a category of weekly services meaning they were offered on a weekly basis.
Average time spent seeking ART and consulting a nurse: Quantitative results showed that majority of the participants reported that it takes 30 minutes to an hour to provide ART
services. Participants did, however, allude to shortage of staff as a challenge that affected time spent by patients at facilities. Qualitative results in the theme of ART service delivery emerged a category of duration of ART services which had sub-categories of; depends on conditions of service provider, depends on availability of basic utilities and depends on the number of patients.
Availability of ARVs and other drugs: Quantitative results showed that majority of the participants strongly agreed (66%) or agreed (27%) that ARVs and other drugs were available at their facilities. participants did, however, cite the stock outs of drugs as a challenge that they experienced sometimes. Qualitative results yielded a theme of medication availability with a category of sometimes unavailable and sub-categories of low stock and replacement of unavailable drugs emerged from data analysis.
Staff adequacy: Quantitative results showed that majority of the participants disagreed (19%) or strongly disagreed (28%) that they were adequately staffed. Participants further stated the challenge that they were not adequately staffed at their facilities as they served too many patients. Qualitative results yielded a theme of staffing adequacy with a category of inadequate human resource and sub-categories of inadequate services, large population being served and work overload.
Staff qualified and competent: Quantitative results showed that majority of participants strongly agreed (58%) and agreed (31%) that staff was
67
qualified and competent to provide ART services. participants did, however, they needed more training on the provision of ART services and supportive supervision was minimal. Qualitative results show that a theme of confidence and competence of ART service providers with categories of confident, knowledgeable, competent and refresher courses necessary emerging from data analysis.
Adequacy of resources and equipment to provide ART services: Quantitative results showed that majority of the participants strongly agreed (28%) and agreed (42%) that resources and equipment were adequate to allow for the provision of efficient ART services. Participants did, however, state lack of equipment as one of the challenges in theprovision of ART services. Qualitative result show a theme of ART service delivery with a category of inadequate services which had sub-categories of dysfunctional equipment, lack of ART registers, wrong clinical monitoring of patients and use of other service providers. Adequate and efficient ART services: Quantitative results showed that majority of the participants strongly agreed (35%) and agreed (30%) that the ART services they offer were adequate and efficient. Qualitative results yielded a theme of ART services delivery with a category of inefficient ART services which had sub-categories of lack of knowledge, untoward effects of incentives, too many partners and poor remuneration.
Services routine, accurate and efficient to allow accessibility: Quantitative results showed that majority of the participants strongly agreed (48%) and agreed (42%) that the ART services were offered routinely allowing patients to access them. Participants did, however, state a challenge that the ART services were not adequate and more could be done to improve the service. Qualitative results yielded a theme of ART service delivery with a category of variety of services which subcategories of accessible and another which specified the different services that were being offered.
Time allows patients to receive all ART services: Quantitative results showed that majority of the participants strongly agreed (57%) and agreed (34%) that time spent at the facilities allowed patients to receive all ART services. Participants
did state shortage of staff and too many patients as challenges that also affected the time that ART patients spent at the facilities. Qualitative results yielded a theme of ART service delivery and a category of duration of ART service delivery with sub- categories of depends on conditions of service provider, depends on availability of basic utilities and depends on the number of patients.
Documentary evidence is adequate and accurate: Quantitative results showed that majority of the participants strongly agreed (31%) and agreed (45%) that documentary evidence was adequate and accurate at their facilities. Participants did, however, cite the lack of equipment as a challenge. Qualitative results show a theme of ART service delivery with a category of inadequate services which has a sub-category of lack of ART registers.
Patients satisfied with ART services:Quantitative results showed that majority of the participants strongly agreed (32%) and agreed (46%) that patients were satisfied with ART services even though it could not be ascertained whether they actually did ask the patients. Qualitative results yielded a theme of satisfaction with ART services with a category of partially satisfied which had sub-categories of drugs evoke hunger and stigmatisation.
Job satisfaction: Quantitative results showed that majority of the participants strongly agreed (34%) and agreed (44%) that they were satisfied with their jobs. Participants, however, stated challenges of providing inadequate ART services. Qualitative results show a theme of satisfaction with ART services with a category of partially satisfied and sub-categories of dysfunctional equipment and deaths due to cervical cancer.
Monitoring and evaluation system available: Quantitative results showed that majority of the participants strongly agreed (25%) and agreed (36%) that monitoring and evaluating system was available at their facilities. Participants did, however, state lack of supportive supervision as a challenge. Qualitative results yielded a theme of monitoring and evaluation with a category of incomplete.
68

8. Conceptual Framework Integration
The ART program is the central core of the framework and it is offered with either an individual, community or population focus and is also system based. Directly linked to the ART program are activities that can be done during its propagation including surveillance, screening, case finding, case management, consultation, referral and follow-up, health teaching, counselling, outreach, collaboration, coalition, community organising and disease and health investigations. However, the implementation of these activities is seen to be affected by other factors from the health system as a whole. As shown in figure 4.28 the propagation of the ART program is influenced by several factors identified by this study including staff adequacy, qualification, competency, knowledge of staff, job satisfaction, adequacy of resources and equipment, routine, accurate and efficient ART services, patient satisfaction, time taken in the provision of services, documentation of activities, availability of ARVs and other medications, number of ART and PMTCT patients, monitoring and evaluation. The factors themselves are seen to be interrelatedand failure at one can result in poor propagation of the ART program. The conceptual framework by Babbie and
Mouton [8] shows that there is a relationship between the program goals and the target group as a program is designed to address the needs of the target group. The goals of the program must be operationalised into measurable outcomes. Goals of the ART programme include improving lifestyles of HIV positive individuals and reducing the burden of the disease locally, regionally and internationally. Measurable outcomes include increased life expectancy of HIV positive individuals and reduced disease mortality and morbidity. Program components are the actual mechanisms and means the implementation leads to the attainment of the stated objectives. Programme components include processes involved in the implementation of the ART programme that are individual focused, community focused or population focused. Such processes involve availability of resources and equipment and availability of ARVS and other drugs, surveillance, disease investigations, screening, referral and follow
up, case management, health teaching, counselling, consultation, collaboration, coalition building, community organizing, advocacy and policy development and enforcement. The program management system comprises all the systems required to implement and manage a program including administrative (records and filing), monitoring (keeping track of program participants) and information (financial). Programme management systems involve monitoring and evaluation processes of the ART programme and adequacy of documentation in the programme. The human resource base (VI) refers to individuals managing the program in light of their competencies in effective and efficient program management, organisational structures in large scale programs and personality styles suited to program management. The human resource base for the ART programme includes adequate staff who are satisfied with their jobs and qualified, competent and knowledgeable in the provision of ART services which are routine, accurate and efficient to ensure patient satisfaction. Stakeholders include founders or sponsors of a program, the general public and other competing service providers such as non- governmental organisations. Stakeholders of the ART programme include HIV positive individuals, communities and the population at large that are also affected by the disease. The context includes the broader socio-political context, specific geographical location or setting and the time frame which determines the success of an intervention. The context refers to settings in which ART services are offered and they are the PHC facilities located at various sites within the country.
9. Outcome Of The Study
Design and validation of the tool: IDCV [10] Literature review on the ART programme was conducted and the intervention wheel framework was used as a guide in the development of the tool and 14 interventions were incorporated. Open coding and axial coding during constant comparison analysis in which both qualitative and quantitative data was analysed was done to allow the instrument developer to identify behaviours affecting the ART programme and they included: staffing patterns; types of ART services offered; number of ART and PMTCT patients seen; number of days ART and PMTCT services are offered; time spent seeking
69
ART services; time spent consulting a nurse; availability of ARVs and other medications; staff adequacy; staff qualified and competent; adequacy of resources and equipment; routine, accurate and efficient ART services; time allows patients to receive all services; documentation of activities; patient satisfaction; job satisfaction; monitoring and evaluation. Experts including a statistician were included to review the tool for item analysis, relevance and time analysis. The instrument was initially given to 8 respondents who took part in the pre-test. The data was analysed using SPSS (23) and Cronbach`s Alpha coefficient was determined to be 0.785. Data integration process was used to revise the tool which was the pre-tested again on respondents, and Cronbach`s Alpha coefficient was 0.768.
10. Discussion
PHC facilities are mostly run by nurses who were found to be competent in the provision of ART services. However they need support for their efforts to be translated to improved health status for the whole nation through supportive supervision and in-service training. General staffing patterns were not uniform across the facilities and generally inadequate to allow the provision of services especially considering that other health care services besides ART were also being provided. Besides the training of many nurses in country, Lesotho like many other sub-Saharan countries also faces challenges of health care provider exportation to other countries that provide better salaries and working conditions.
Even though similar services were available at facilities, they were not offered on exactly the same days and in the exact same manner owing to differences in staffing patterns and health care provider preferences. Through the use of the supermarket approach, services were understood to be comprehensive and efficient enough allowing accessibility. However respondents raised challenges of inadequate resources and dysfunctional equipment especially for the continued monitoring of patients and this was found to be a major set-back in the ART programme. This has resulted patients having to move from one facility to another seeking services that could assist in monitoring their health progress. ARVs themselves were also reported to purport hunger, an allegation that
certainly needs further investigation and understanding for it to be addressed.
Although ARVs and other drugs were generally available, some interruptions in drug supplies were reported, however efforts were made to provide supplies to all patients to ensure that there no interruptions in their treatment. Work commitments were also found to be a major factor affecting continued monitoring of patients especially those working in neighbouring South Africa and of note is that patients were reluctant to be enrolled in ART under the South African health care system where they spent most of their time. Instead patients preferred sending a relative or any other treatment supporter to collect their medication and the health providers ensured that they did give supplies for as long as 3 months. However the dilemma that ensued was on the lack of monitoring of the patients whether to continue providing the medication or to stop.
Respondents in this study generally showed their acknowledgement of the services being provided as they felt it was better than nothing at all despite the many challenges being faced. However it was noted that partners assisting the government must be monitored to avoid duplication of efforts and more education be instigated to prevent individuals infected testing more than once. Increased monitoring and evaluation activities need to be done to ensure that the ART programme is propagated as envisaged.
11. Recommendations
On site supervision of the ART programme by trained mentors must be instigated quarterly and feedback given to health facilities. Lesotho Ministry of Health needs to work together with the Ministry of Health in South Africa in the provision of ART services to Basotho who work in South Africa the programme needs to move from being paper based system to a more electronic system in which tracking of patients is done even if they are not in the facility or country from which they initiated their ART. Maintenance of equipment from budgetary lines, back up equipment especially in light of laboratory machines to avoid patients being denied access to laboratory testing and
70
review of staffing patterns at PHC facilities. Exit level training of final year nursing students to update them on current practices and continued in-service training of nurses. Research on the use of electronic patient record to improve accessibility of services to result in a more effective and efficient programme not only in Lesotho but in Southern Africa. Research focusing on knowledge, attitudes and practices of both nurses and HIV positive patients regarding the ART programme especially with regards to initial and follow up screening tests.
12. Limitations
This study was limited to evaluation of the ART programme alone and did not seek to ascertain outcome impacts of the ART programme. Furthermore the study did not consider implementation of other programs that were being provided in PHC facilities. The topography of Lesotho did not allow the researcher to reach some of the primary health care facilities in the mountainous areas.
13. References
[1] Joint United Nations Programme on HIV/AIDS. Global AIDS update. From: https://www.unaids.org/ 2015. (accessed 7 October 2016). [2] Van Dyk, A. HIV/AIDS care and counselling: A multidisciplinary approach. 4th edition. Pearson Education South Africa. CapeTown, 2010.
[3] Ministry of Health, Lesotho & ICF International. Lesotho Demographic and Health Survey (LDHS). MoH & ICF International. Maseru, 2014.
[4] World Bank. Lesotho overview. From: http://www.worldbank.org/en/country/lesotho/ overview. 2013. (accessed 9 October 2014).
[6] World Health Organization, Joint United Nations Programme on HIV/AIDS, United Nations Children’s Fund. Towards universal access: Scaling up priority HIV interventions in the health sector. Progress report. WHO, 2011.
[7] Stanhope, M & Lancaster, J. Public health
nursing: Population centred health-care in the community. Mosby. Missouri. 2012.
[8] Babbie E.R. & Mouton, J. The practice of social research. Oxford University Press. Cape Town, 2002.
[9] Creswell, JW & Plano Clark, VL. Designing and conducting mixed methods research. 2nd edition. Sage. California, 2011.
[10]http://www.raosoft.com/samplesizecalculator (Accessed 7 May 2015).
71
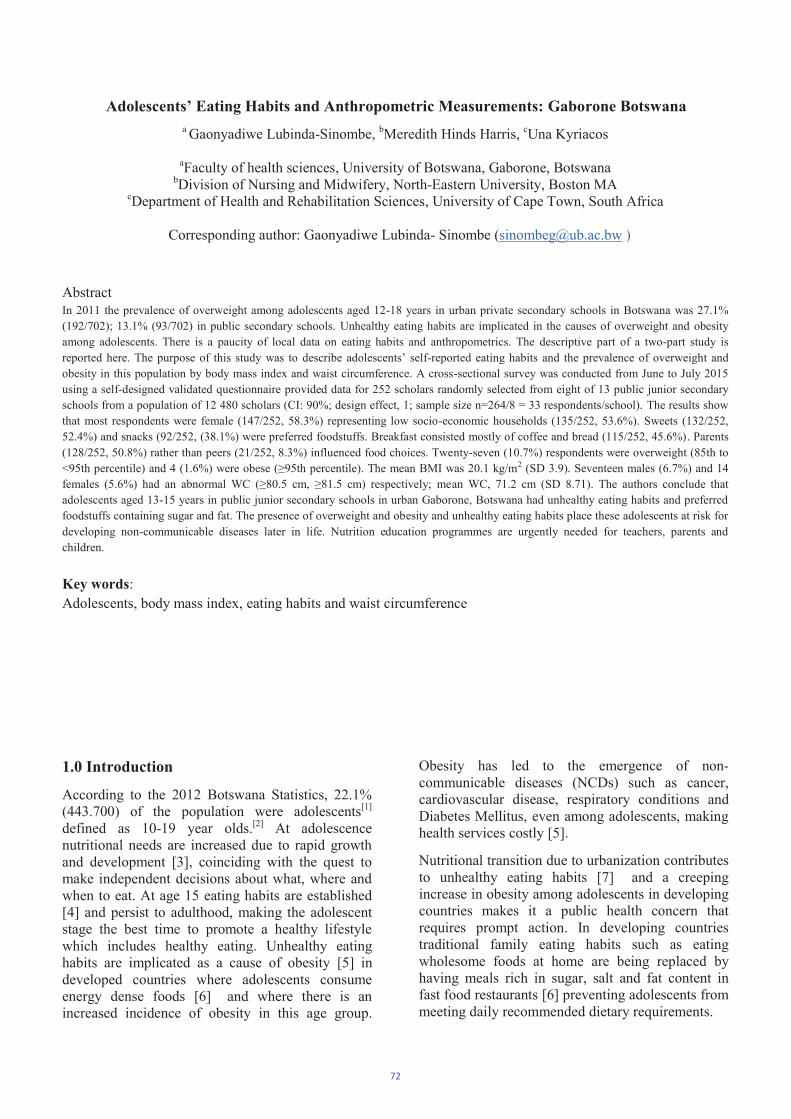
72
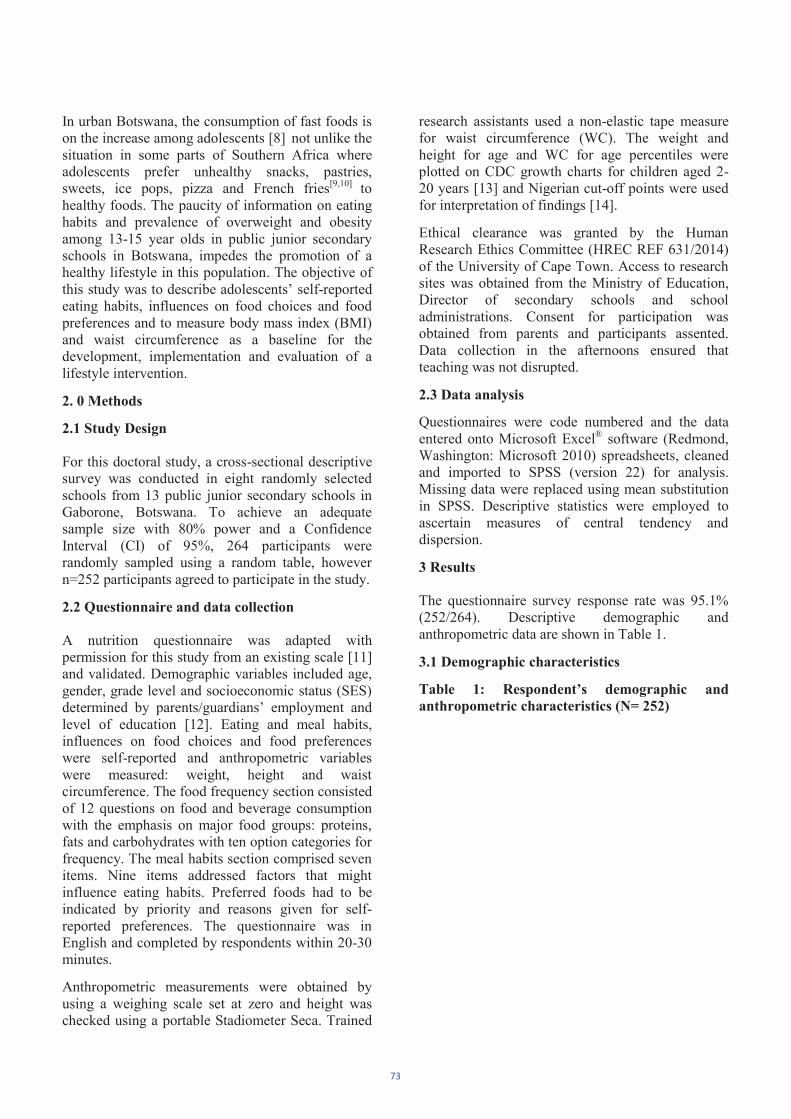
73
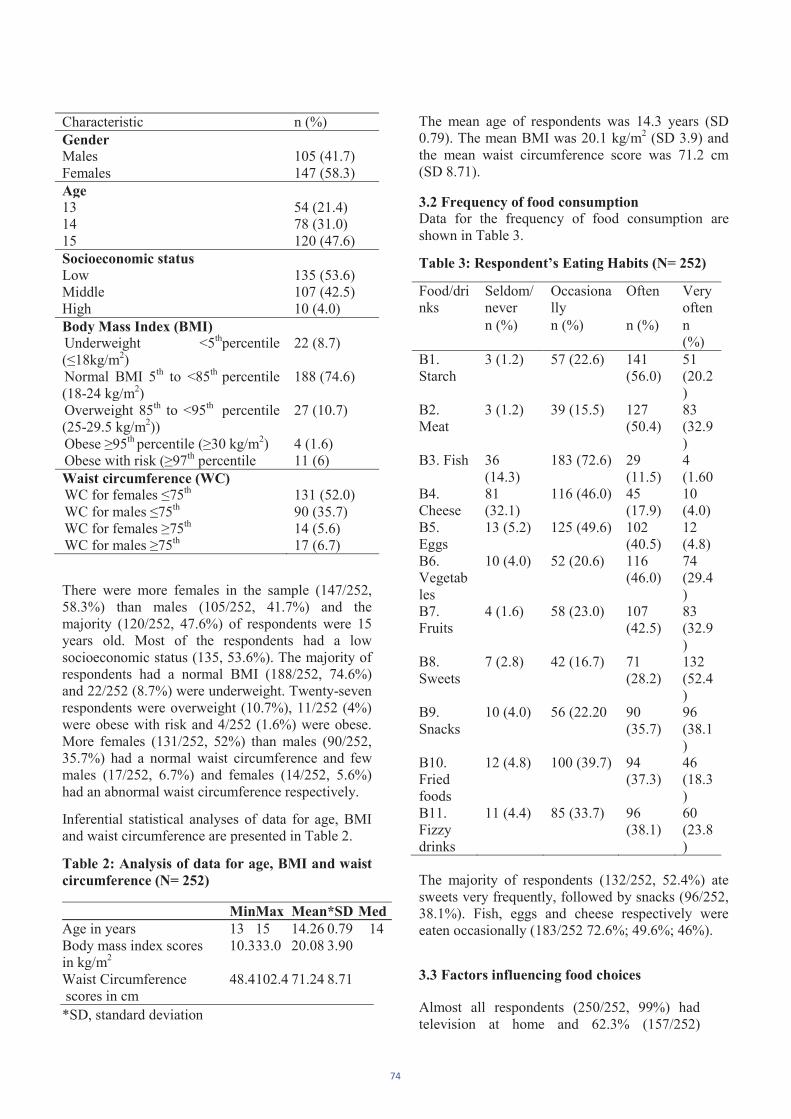
74

75

76
77
78
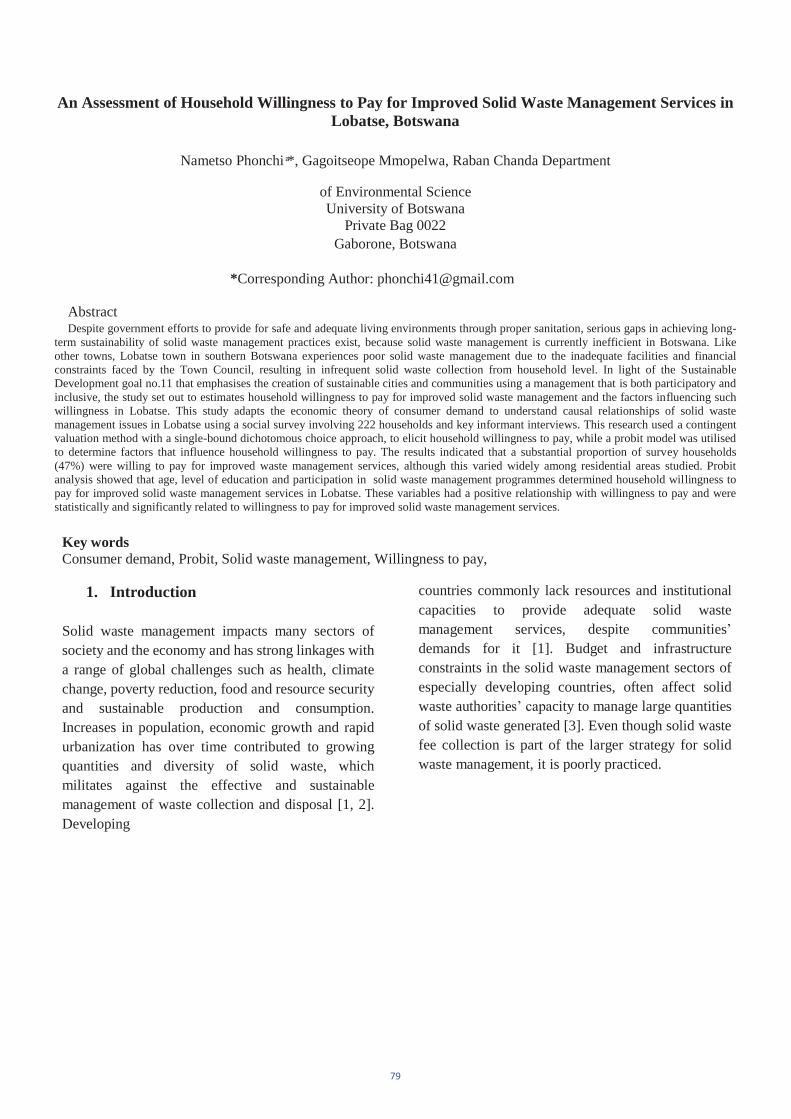
An Assessment of Household Willingness to Pay for Improved Solid Waste Management Services in Lobatse, Botswana
Nametso Phonchi *, Gagoitseope Mmopelwa, Raban Chanda Department
of Environmental Science University of Botswana
Private Bag 0022 Gaborone, Botswana
Abstract
*Corresponding Author: [email protected]
Despite government efforts to provide for safe and adequate living environments through proper sanitation, serious gaps in achieving long- term sustainability of solid waste management practices exist, because solid waste management is currently inefficient in Botswana. Like other towns, Lobatse town in southern Botswana experiences poor solid waste management due to the inadequate facilities and financial constraints faced by the Town Council, resulting in infrequent solid waste collection from household level. In light of the Sustainable Development goal no.11 that emphasises the creation of sustainable cities and communities using a management that is both participatory and inclusive, the study set out to estimates household willingness to pay for improved solid waste management and the factors influencing such willingness in Lobatse. This study adapts the economic theory of consumer demand to understand causal relationships of solid wastemanagement issues in Lobatse using a social survey involving 222 households and key informant interviews. This research used a contingent valuation method with a single-bound dichotomous choice approach, to elicit household willingness to pay, while a probit model was utilised to determine factors that influence household willingness to pay. The results indicated that a substantial proportion of survey households (47%) were willing to pay for improved waste management services, although this varied widely among residential areas studied. Probit analysis showed that age, level of education and participation in solid waste management programmes determined household willingness to pay for improved solid waste management services in Lobatse. These variables had a positive relationship with willingness to pay and were statistically and significantly related to willingness to pay for improved solid waste management services.
Key wordsConsumer demand, Probit, Solid waste management, Willingness to pay,
1. Introduction
Solid waste management impacts many sectors of society and the economy and has strong linkages with a range of global challenges such as health, climate change, poverty reduction, food and resource security and sustainable production and consumption. Increases in population, economic growth and rapid urbanization has over time contributed to growing quantities and diversity of solid waste, which militates against the effective and sustainable management of waste collection and disposal [1, 2]. Developing
countries commonly lack resources and institutional capacities to provide adequate solid waste management services, despite communities’ demands for it [1]. Budget and infrastructure constraints in the solid waste management sectors of especially developing countries, often affect solid waste authorities’ capacity to manage large quantities of solid waste generated [3]. Even though solid waste fee collection is part of the larger strategy for solid waste management, it is poorly practiced.
79
A pre- study discussion with Lobatse Town Council’sWaste Management and Sanitation Department authorities revealed that, in 2011 the Town Council established a solid waste collection fee for households at P10 per month, which has not been implemented to date, due to a failure to enforce it by the Council. However, payment for solid waste management services by the community is essential for long-term sustainability of solid waste management systems [4, 2]. There is little or no documentation on approaches or methods to solicit information on people’s propensity to pay for solid waste management services in Botswana in general, and Lobatse in particular. One such approach which this study adopts, is determining the household willingness to pay (WTP) for improved solid waste management which Lobatse Town Council and other urban Councils can implement. Infact there are very few studies in Botswana that have used economic models to apply household willingness to pay for services in Botswana. These include Mmopelwa et al. [5] and Mbata [6] on supply of quality and reliable water in Kanye and Maun, respectively.
A study by Kwailane [7] on the challenges of domestic solid waste management in Lobatse, provided only a descriptive analysis of willingness to pay and concluded that Lobatse residents were non- commital to pay for solid waste management services. The study neither determined willingness to pay for solid waste management services by willing households, nor investigated factors that determined household WTP and reasons for those not willing to pay. Furthermore, the study was carried out prior to 2014, where Small Men were not engaged to provide solid waste collection services. This study seeks to establish whether residents of Lobatse were willing to pay for improved solid waste management services under current solid waste management strategies and set up in Botswana. It also determines the factors influencing willingness to pay for solid waste collection services.
Through the principle of ‘act locally, think globally’,this study contributes information towards the attainment of global targets for waste management in the recently adopted Sustainable Development Goals. The paper is organised as follows. This introduction is followed, respectively, by literature highlights, methods (including study area description),
discussion of findings, policy implications and concluding remarks.
1. Literature Highlights
Economic instruments are increasingly advocated as best practice in solid waste management world-wide because of their relative effectiveness in achieving environmental objectives such as reducing generated solid waste and switching solid waste disposal to waste recycling [8]. The current economic instruments used in Botswana are property rates, service levy, regulatory measures and environmental education, and these have proven to be inadequate in enhancing environmental protection [9]. Environmental education in Botswana is still at an early stage of development as the envisaged programmes are still being developed [9]. This paper advocates for a strong position on strengthening the existing environmental education and regulatory measures, and developing new ones that could go a long way in improving public knowledge and participation in waste management [9].
There is extensive literature on valuation of environmental services [10, 3]. People’s valuation of environmental goods and services can be derived by constructing hypothetical markets where they are asked to state their actual preferences using the contingent valuation method [10]. Studies on household willingness to pay for solid waste management issues have been conducted in many different countries (e.g Nigeria, Ethiopia, Ghana, Malaysia,) faced with diverse environmental challenges and socio-economic conditions [11, 1]. The literature indicates that the common factors that determine household willingness to pay (WTP) for solid waste services include household income, education and gender [11, 12, 1, 2].
Hagos, et al [1] revealed that solid waste management is significantly related to income and awareness of environmental quality.
Similarly, Animasaun [12] argued that household WTP was influenced by income, education, activities of sanitary inspectors, house type and occupation. In Enugu State, Nigeria, Fonta et al [11] revealed that willingness to pay is significantly and positively related to household wealth index proxy for income, dwelling composition and respondents’ perceptions of environmental quality. Kwetey et al [2] in Northern Ghana found that respondent’s level of education, income, age and occupation had insignificant influence on the respondents WTP for improved solid waste management.
While people may be willing to pay for environmental services, factors like illicit burning, lack of solid waste collection containers, open dumping of solid waste were
80
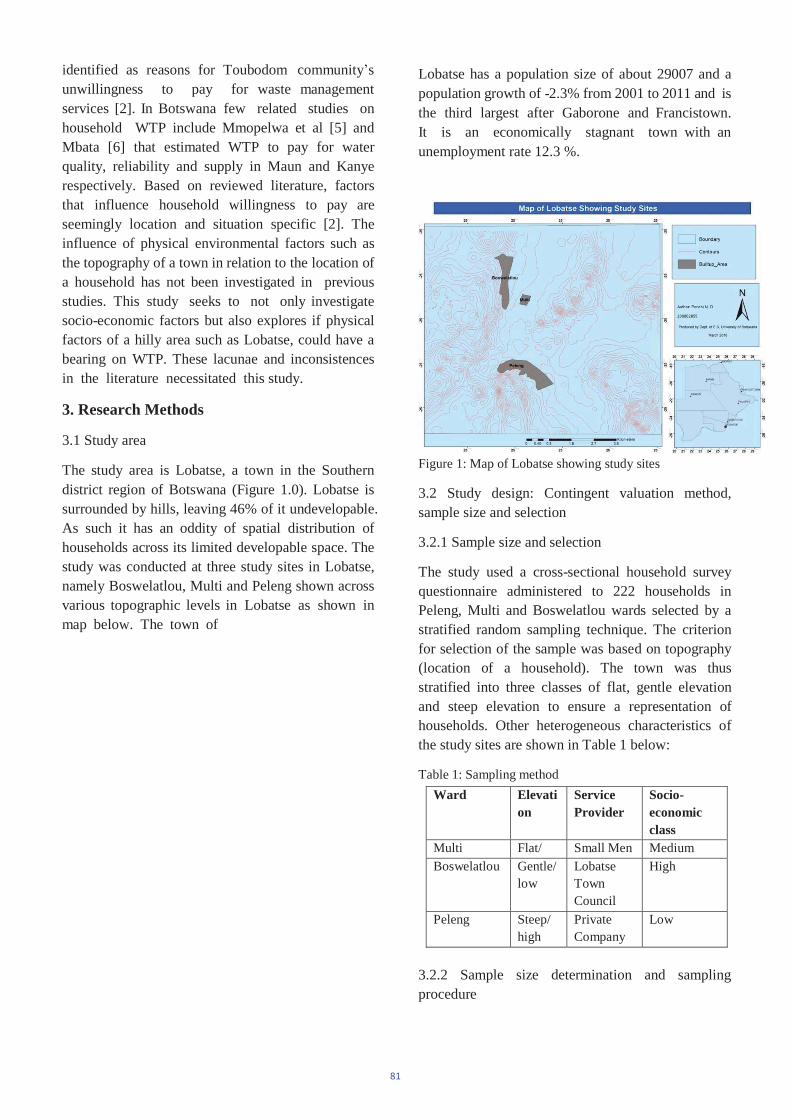
identified as reasons for Toubodom community’sunwillingness to pay for waste management services [2]. In Botswana few related studies on household WTP include Mmopelwa et al [5] and Mbata [6] that estimated WTP to pay for water quality, reliability and supply in Maun and Kanye respectively. Based on reviewed literature, factors that influence household willingness to pay are seemingly location and situation specific [2]. The influence of physical environmental factors such as the topography of a town in relation to the location of a household has not been investigated in previous studies. This study seeks to not only investigate socio-economic factors but also explores if physical factors of a hilly area such as Lobatse, could have a bearing on WTP. These lacunae and inconsistences in the literature necessitated this study.
3. Research Methods
3.1 Study area
The study area is Lobatse, a town in the Southern district region of Botswana (Figure 1.0). Lobatse is surrounded by hills, leaving 46% of it undevelopable. As such it has an oddity of spatial distribution of households across its limited developable space. The study was conducted at three study sites in Lobatse, namely Boswelatlou, Multi and Peleng shown across various topographic levels in Lobatse as shown in map below. The town of
Lobatse has a population size of about 29007 and a population growth of -2.3% from 2001 to 2011 and is the third largest after Gaborone and Francistown. It is an economically stagnant town with an unemployment rate 12.3 %.
Figure 1: Map of Lobatse showing study sites
3.2 Study design: Contingent valuation method, sample size and selection
3.2.1 Sample size and selection
The study used a cross-sectional household survey questionnaire administered to 222 households in Peleng, Multi and Boswelatlou wards selected by a stratified random sampling technique. The criterion for selection of the sample was based on topography (location of a household). The town was thus stratified into three classes of flat, gentle elevation and steep elevation to ensure a representation of households. Other heterogeneous characteristics of the study sites are shown in Table 1 below:
Table 1: Sampling method Ward Elevati
onServiceProvider
Socio-economicclass
Multi Flat/ Small Men MediumBoswelatlou Gentle/
lowLobatse Town Council
High
Peleng Steep/ high
Private Company
Low
3.2.2 Sample size determination and sampling procedure
81
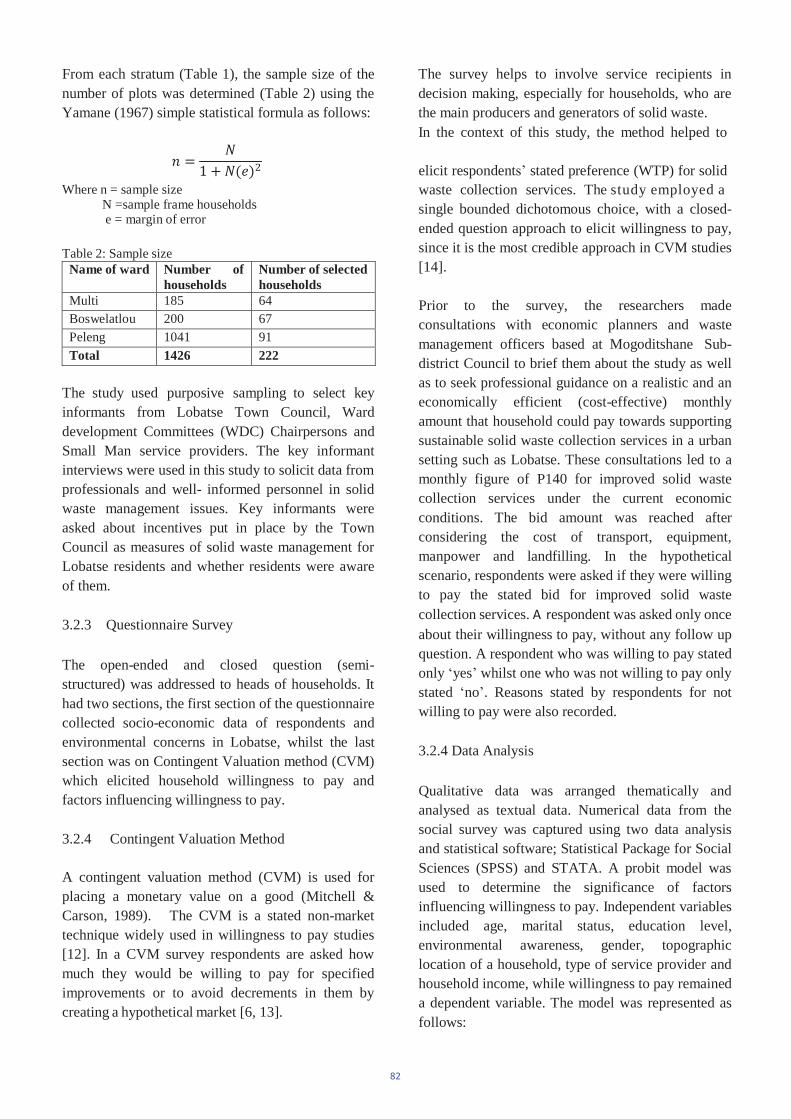
From each stratum (Table 1), the sample size of the number of plots was determined (Table 2) using the Yamane (1967) simple statistical formula as follows:
The survey helps to involve service recipients in decision making, especially for households, who are the main producers and generators of solid waste. In the context of this study, the method helped to
Where n = sample sizeelicit respondents’ stated preference (WTP) for solid waste collection services. The study employed a
N =sample frame households e = margin of error
Table 2: Sample size Name of ward Number of
householdsNumber of selectedhouseholds
Multi 185 64Boswelatlou 200 67Peleng 1041 91Total 1426 222
The study used purposive sampling to select key informants from Lobatse Town Council, Ward development Committees (WDC) Chairpersons and Small Man service providers. The key informant interviews were used in this study to solicit data from professionals and well- informed personnel in solid waste management issues. Key informants were asked about incentives put in place by the Town Council as measures of solid waste management for Lobatse residents and whether residents were aware of them.
3.2.3 Questionnaire Survey
The open-ended and closed question (semi- structured) was addressed to heads of households. It had two sections, the first section of the questionnaire collected socio-economic data of respondents and environmental concerns in Lobatse, whilst the last section was on Contingent Valuation method (CVM) which elicited household willingness to pay and factors influencing willingness to pay.
3.2.4 Contingent Valuation Method
A contingent valuation method (CVM) is used for placing a monetary value on a good (Mitchell & Carson, 1989). The CVM is a stated non-market technique widely used in willingness to pay studies [12]. In a CVM survey respondents are asked how much they would be willing to pay for specified improvements or to avoid decrements in them by creating a hypothetical market [6, 13].
single bounded dichotomous choice, with a closed- ended question approach to elicit willingness to pay, since it is the most credible approach in CVM studies [14].
Prior to the survey, the researchers made consultations with economic planners and waste management officers based at Mogoditshane Sub- district Council to brief them about the study as well as to seek professional guidance on a realistic and an economically efficient (cost-effective) monthly amount that household could pay towards supporting sustainable solid waste collection services in a urban setting such as Lobatse. These consultations led to a monthly figure of P140 for improved solid waste collection services under the current economic conditions. The bid amount was reached after considering the cost of transport, equipment, manpower and landfilling. In the hypothetical scenario, respondents were asked if they were willing to pay the stated bid for improved solid waste collection services. A respondent was asked only once about their willingness to pay, without any follow up question. A respondent who was willing to pay stated only ‘yes’ whilst one who was not willing to pay only stated ‘no’. Reasons stated by respondents for not willing to pay were also recorded.
3.2.4 Data Analysis
Qualitative data was arranged thematically and analysed as textual data. Numerical data from the social survey was captured using two data analysis and statistical software; Statistical Package for Social Sciences (SPSS) and STATA. A probit model was used to determine the significance of factors influencing willingness to pay. Independent variables included age, marital status, education level, environmental awareness, gender, topographic location of a household, type of service provider and household income, while willingness to pay remained a dependent variable. The model was represented as follows:
82
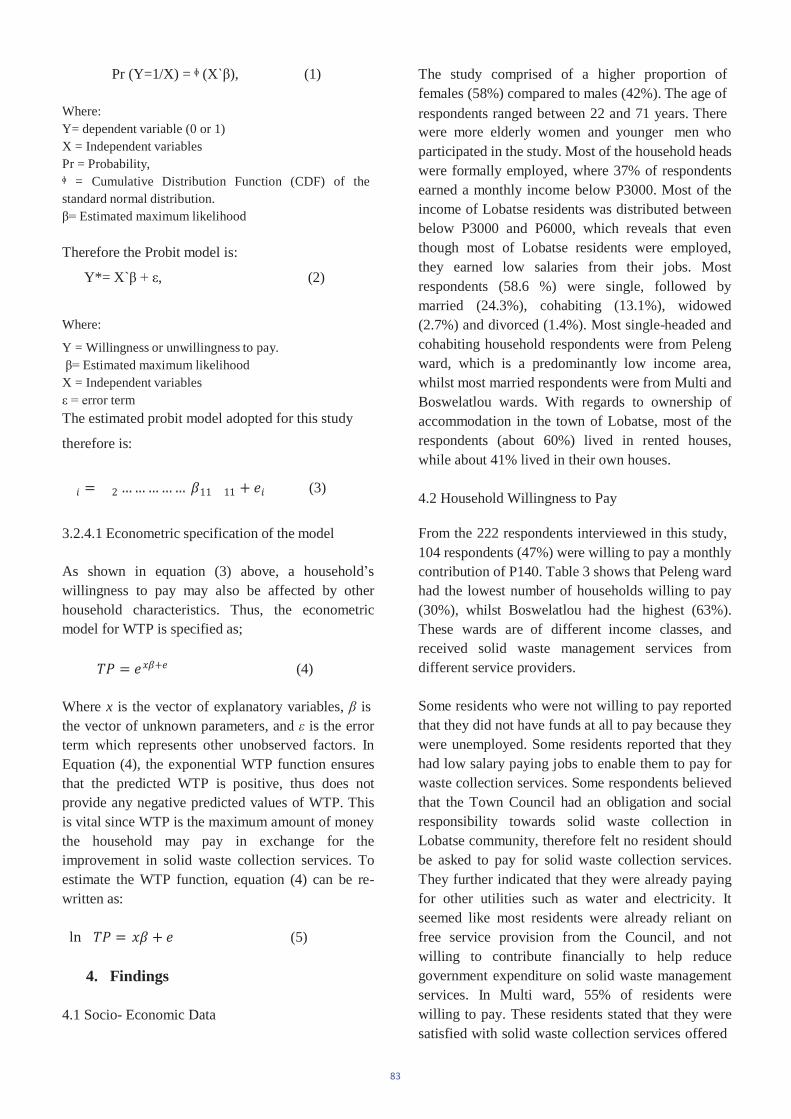
Where:
Pr (Y=1/X) = (X` ), (1) The study comprised of a higher proportion of females (58%) compared to males (42%). The age of respondents ranged between 22 and 71 years. There
Y= dependent variable (0 or 1) X = Independent variables Pr = Probability, = Cumulative Distribution Function (CDF) of the
standard normal distribution. = Estimated maximum likelihood
Therefore the Probit model is:
Y*= X` + , (2)
Where:
Y = Willingness or unwillingness to pay. = Estimated maximum likelihood
X = Independent variables = error term
The estimated probit model adopted for this study
therefore is:
(3)
3.2.4.1 Econometric specification of the model
As shown in equation (3) above, a household’swillingness to pay may also be affected by other household characteristics. Thus, the econometric model for WTP is specified as;
(4)
Where x is the vector of explanatory variables, isthe vector of unknown parameters, and is the error term which represents other unobserved factors. In Equation (4), the exponential WTP function ensures that the predicted WTP is positive, thus does not provide any negative predicted values of WTP. This is vital since WTP is the maximum amount of money the household may pay in exchange for the improvement in solid waste collection services. To estimate the WTP function, equation (4) can be re- written as:
(5)
4. Findings
4.1 Socio- Economic Data
were more elderly women and younger men who participated in the study. Most of the household heads were formally employed, where 37% of respondents earned a monthly income below P3000. Most of the income of Lobatse residents was distributed between below P3000 and P6000, which reveals that even though most of Lobatse residents were employed, they earned low salaries from their jobs. Most respondents (58.6 %) were single, followed by married (24.3%), cohabiting (13.1%), widowed (2.7%) and divorced (1.4%). Most single-headed and cohabiting household respondents were from Peleng ward, which is a predominantly low income area, whilst most married respondents were from Multi and Boswelatlou wards. With regards to ownership of accommodation in the town of Lobatse, most of the respondents (about 60%) lived in rented houses, while about 41% lived in their own houses.
4.2 Household Willingness to Pay
From the 222 respondents interviewed in this study, 104 respondents (47%) were willing to pay a monthly contribution of P140. Table 3 shows that Peleng ward had the lowest number of households willing to pay (30%), whilst Boswelatlou had the highest (63%). These wards are of different income classes, and received solid waste management services from different service providers.
Some residents who were not willing to pay reported that they did not have funds at all to pay because they were unemployed. Some residents reported that they had low salary paying jobs to enable them to pay for waste collection services. Some respondents believed that the Town Council had an obligation and social responsibility towards solid waste collection in Lobatse community, therefore felt no resident should be asked to pay for solid waste collection services. They further indicated that they were already paying for other utilities such as water and electricity. It seemed like most residents were already reliant on free service provision from the Council, and not willing to contribute financially to help reduce government expenditure on solid waste management services. In Multi ward, 55% of residents were willing to pay. These residents stated that they were satisfied with solid waste collection services offered
83

by Small Men, who collected waste three times a week, without fail. The consumer demand theory, which informs this study, suggests that an improvement in the solid waste collection services may increase residents’ utility or satisfaction, and therefore may be willing to pay for specific improvements in the current services.
Table 3: Household Location and WTP
WardWTP
TotalYes % No %Peleng 27 29.6 64 70.3 91Multi 35 55 29 45.3 64Boswelatlou 42 63 25 37 67Total 104 100 118 100 222
Residents of Bowelatlou and Peleng wards receive solid waste collection service from the Lobatse Town Council, which they were mostly dissatisfied about. It is very likely that the inconsistencies and delays of the solid waste collection service by the Town Council influenced the higher number of respondents to be willing to pay with the hope that there would be an improvement in the service delivery in the future. On the other hand, most of the residents in Peleng ward were either totally unemployed or informally employed under Ipelegeng; a drought relief programme (introduced by the Government to assist in poverty alleviation) which pays them P500 per month. These respondents stated that they were not willing to pay because they could not afford P140 per month. A Chi-square test revealed a strong association ( 2 = 19.113, df =2; p< .001.) between household location and willingness to pay.
4.3 Factors Influencing Household Willingness to Pay
As indicated previously, the explanatory variables were regressed with willingness to pay in a probit model as Table 5 shows below;
Table 5: Probit regression of results
Age: The age of respondents was a statistically significant predictor (p<0.1) and had a positive influence on willingness to pay. This implies that older people are more likely to care for their environment than younger people, and are thus willing to experience an improvement in the quality of environment. These findings are consistent with Addai & Danso- Abbeam [3].
Level of Education: Results show that as the level of education increased, willingness to pay also increased. Thus a consumer with high level education is willing to pay for improvements in solid waste collection services. This made intuitive sense that as respondents’ educational level increased, their environmental awareness increases leading to a demand for improved environmental quality.
Participation in solid waste management programmes: Participation in activities such as litter picking campaigns, fair competitions and volunteering with NGO’s has a positive influence on willingness to pay. Participation in waste management programmes increases awareness of environmental issues, as households partake in litter picking programmes, cleaning campaigns which helps them recognise the benefits of contributing to environmental services.
Other factors such as respondents’ household location, gender, household size, household income, marital status, and the awareness of solid waste as a
84
problem had no significant influence on household willingness to pay. These are comparable to findings of Niringiye & Omortor [15]. Although not significant and statistically related to WTP, Topography (location HH) has a negative relationship with willingness to pay. Households located in flat or low lying areas were more likely to be willing to pay than those in high/ steep locations. Similarly, the negative coefficient for household size indicates that holding all other factors constant, the willingness to pay for improved solid waste services decreases with increasing household size. This finding is similar to that of Addai & Danso- Abbeam [3] in Ghana.
5. Discussions and Policy Implications
With the increasing amount of solid waste generated and governments’ financial constraints, public payment for solid waste improvement services, especially collection seems vital for Lobatse town and Botswana in general.
The study revealed that households have certain socio-economic characteristics that influence their willingness-to-pay for solid waste disposal. Education of a respondent was found to be a significant factor on WTP. In order for communities to appreciate the benefit of solid waste collection services, a strategic environmental education must be developed. Currently the Lobatse Town Council conducts environmental education through Kgotla meetings, however, the timing for conducting these meetings does not favour formally employed residents. Government should perhaps explore new environmental education mediums such as aggressive environmental clean–up campaigns, school outreach trips, community environmental groups, workshops, print media (pamphlets), social media, television and radio media.
Government intervention through encouraging public- private participation in solid waste disposal in Lobatse is vital. At present, public-private partnerships is only through Small Men, who have short contracts (10-12 months) to provide solid collection services in small pockets of the town. Government should therefore consider formalised long-term contracts (3-5 years) for Small Men to strengthen privatised business ethics and motivate their effectiveness in solid waste collection. This
study also recommends an increase in the current number of Small Men. Solid waste collection services by Small Men should also be extended to other wards in the town, where they are currently not servicing, because they are more effective in solid waste collection than public service sector.
At the global level, in 1992, the Rio Declaration endorsed economic instruments as a means for obtaining sustainable environmental improvement for because they encourage solid waste minimization and reuse at household level. The current economic instruments used in Botswana are not efficient [9] therefore the study suggests that Government of Botswana introduces alternative instruments such as solid waste collection and solid waste disposal fee. A monthly household waste collection charge of P140 should be introduced to ensure that each solid waste generator contributes to solid waste management, as well as to recover part of the government financial costs incurred in many activities of solid waste management. Community consultations must first be done before implementing this charge to ensure that households understand its benefit.
Under the P140 waste collection monthly charges, the Council should ensure provision of solid waste bins and improve weekly collection frequencies at households to encourage safe handling of waste at source and minimize indiscriminate waste disposal. This will encourage an improved solid management system, and communities may recognise the economic value of environmental amenities by having a WTP for improved solid waste management services. Since some households already resisted willingness to pay for improved solid waste collection, collection charges may be infused into basic household bills such as water bills to ensure compliance of all households.
Additionally, product levies and deposit refund schemes to help improve the solid waste management sector. Eco-taxes must be introduced in Botswana to encourage recycling of solid waste material at households. Waste collection funds from households must be channelled directly to the waste management sector instead of the general Government revenue, to ensure an improvement of waste collection equipment, such as repair of fleet, improved skilled labour and equipment. Based on the findings that older people were willing to pay compared to youth,
85
the latter must be introduced to environmental education at a young age to ensure an understanding of waste management issues. Primary school education curriculum must be revised to include waste management aspects. Communities and individuals must be encouraged to partake in the solid waste management sector such as active litter picking campaigns to ensure involvement in waste minimization.
6. Conclusion
In increasingly growing urban towns in developing countries like Lobatse, Botswana, solid waste is a major source of concern due to inappropriate planning, inadequate financial and labour resources, and ineffective solid waste management. The aim of this paper was to assess the current solid waste management strategies in Lobatse and determine WTP of residents for improved urban solid management, and suggest mechanisms and alternatives for cost recovery for government.
Therefore, for the purpose of government’sdevelopment of new policies for solid waste management, the results of this study can be useful for understanding the status of the solid waste issues, residents’ practices and attitudes towards solid waste collection fees, their WTP for solid waste disposal, and reasons for unwilingness to pay. For policy makers and waste managers, this study can be used to promote the contribution of households, and other stakeholders such as the private sector in solid waste management as indicated in section 5.
7. Acknowledgements
I am greatly indebted to my research supervisors Professors Goitseope Mmopelwa and Raban Chanda, together with the Barclays-Festus G. Mogae foundation, for funding my Masters of Science Degree study programme. I also thank my research assistants Tebogo Mokomane and Emmanuel Motsemme.
8. References
[1] Hagos D. Mekonneni A. and Gebreegziabher Z. Households’ Willingness to pay for Improved Urban Waste Management in Mekelle City,Ethiopia. Environment for Development, pp 1-29, 2012.
[2] Kwetey S. Samuel J.C. and Wilhemina A. Household Demand and Willingness to Pay for Solid Waste Management Service in Tuobodom in the Techiman- North District, Ghana. American Journal
of Environmental Protection, pp 74-78, 2014.
[3] Addai K N. and Danso- Abbeam G.Determinants of Willingness to Pay for Improved Solid Waste Management in Dunkwa-on-Offin, Ghana. Journal of Agriculture and Environmental Sciences, pp 1-9, 2014.
[4] McDougall F.R, White P.R, Franke M. and Hindle P. Integrated Solid Waste Management: A life cycle Inventory. John Wiley & Sons, 2008.
[5] Mmopelwa G , K g a t h i D . L , M a s a m b a W.R and Thukuza A. Household W i l l i n g n e s s t o Pay for Reliability of Water Supply and Quality in Chobe Surbub of Maun; an Application of the Contingent Valuation Methods.Botswana Notes and Records, pp 97-107, 2005.
[6] Mbata J.N. Estimating Households Willingness to pay for water services in a rural economy: The case study of Kanye in Southern Botswana. Development Southern Africa, pp 29-43, 2006.
[7] Kwailane T.T. Challenges of Domestic Solid Waste Management in an Emerging African Urban Environment: An Analysis of Stakeholder Perspective from Lobatse, Botswana. Masters of Science Degree in Environmental science. University of Botswana, 2012.
[8] Nahman A and Godfrey L. Economic Instruments for Solid W a s t e M a n a g e m e n t i n A f r i c a .Resources, Conservation and Recycling, pp 521-531, 2010.
[9] Kgathi D. L. a n d B o l a a n e B . Instruments for Sustainable Solid Waste Management in Botswana. Waste Management & Research, pp 342-353, 2001.
[10] Aklilu A. Households’willingness to pay for improved solid waste management: the case of AddisAbaba. Dissertation, aau, 2002.
[11] Fonta W M. Emeichokua H.I. Ogujiubac K.K. and Chukwu J.O. Using a Contingent Valuation Approach for Improved Solid Waste Management Facility: Evidence from Enugu State, Nigeria. Journal of African Economies, pp 277-304, 2007.
[12] Animasaun E D. Economic Valuation of Private Sector Waste Management Services. Journal of Sustainable Development, pp 38-47, 2011.
[13] Lee C and Mjelde J.W. Valuation of Ecotourism Resources Using a Contingent Valuation Method; Case of the Korean DMZ. Ecological Economics, pp 511-520, 2007. 86

[14] Haab T.C. and McConnell K.E. Valuing Environmental and Natural Resources; The Econometrics of Non- Market Valuation. Cheltenham: Edward Elgar Publishing Limited, 2002.
[15] Niringiye A and Omortor D. Determinants of Willingness to Pay for Solid Waste Management in Kampala City. Current Research Journal of Economic Theory Vol 2(3), pp 119-122, 2010.
87
Photosynthetic responses of field grown Jatropha curcas accessions to a wide range of summer leaf temperatures
Hilary Shoniwaa,* and Baleseng Mosekia
aUniversity of Botswana Department of Biological Sciences P.O Box 00704 Gaborone
Email: [email protected]
Abstract
This study compared photosynthetic responses of four field grown Jatropha curcas accessions over two summers having a wide range of temperatures. Three accessions were collected from different ecological regions of Botswana. These wereTsamaya (north east), Tabala (central) and Tlokweng (south east). The fourth accession was from Ghana. The Ghana accession was chosen to see how it would fare in Botswana. The study was conducted in the month of January, the hottest month of 2017 and of 2018. The mean leaf temperatures for January 2017 were 21°C and 47°C for January 2018. Measurements of photosynthetic rate (A) stomatal conductance (gs) and transpiration (E) were performed in the two seasons. Of all the accessions in the study Ghana had the highest A (16.7 mol m-2 s -1 ), gs (2.4 molm-2 s -1 ) and E(4.8 mmolm-2 s -1)in 2017. In 2018 the readings for all these parameters were zero for all the accessions; the high leaf temperatures (45°C-49°C)had severely impaired the A, gs and E for all the accessions in January 2018. In conclusion J. curcas, though semi-arid, its photosynthetic machinery appears to be affected by the high temperatures.
Keywords accessions, Jatropha curcas, Leaf temperatures, Photosynthetic rate
1. Introduction
J.curcas is a shrub belonging to the Family Euphorbiaceae. It has been growing in popularity because its seeds produce a high quality oil that has great potential as a biodiesel oil. The quality and quantity of its oil combined by the ability to grow in semi-arid marginal and unproductive regions with low nutrient requirements and little care has caused great interest in this plant [1].
Temperature is one of the abiotic factors that greatly impacts plant growth and productivity. It has an impact across a whole spectrum of plant production processes. Temperature effects are
increased both by water excesses and deficiencies [2]. Above all temperature effects impact the photosynthetic process.
Photosynthesis is a major process on which plants depend for their existence. It approximately doubles for every 10 °C increase in temperature. Above the optimum temperature the rate begins to decrease, as enzymes are denatured, until it stops. The winter temperatures (0-12°C) that are well below plant optimum can disrupt membrane functioning of Calvin cycle enzymes and suppress the synthesis of protein de novo required for the repair of PSII [3].
The summer high temperatures (above 30°C) have a major effect on enzymatically catalyzed reactions and membrane processes such as the thylakoid membrane, electron transport, Calvin enzymes, dark
88
respiration and control of stomatal conductance. At high temperature Rubisco the enzyme responsible for incorporating CO2 into the photosynthetic machinery becomes more sensitive to O2 than CO2 creating 2- phosphoglycolate as its product [4]. This product is toxic and energy must be expanded to eliminate it. This is a disadvantage in that it reduces the net photosynthetic rate. On the other hand it is advantageous in reducing excess energy. The effects of high temperature vary among species. A temperature range of 35-40°C for most tropical C3 crops is said to be under high heat stress. J. curcas is a C3 plant. Temperatures above 40°C cause severe heat stress [5]. On the other hand Williams and Boote [6] show that peanut a semi-arid warmer climate crop having an optimum temperature of 25-35°C can tolerate temperature levels as high as 40°C. Larkindale [5] state that PSII is sensitive to high temperature which results in decline of photosynthetic rates. Cui [7] report that high temperature reduced net photosynthetic rate due to stomatal and non-stomatal limitations. PSII mechanisms were affected as evidenced by the reduction of the maximum photochemical efficiency (Fv/Fm) in dark adapted leaves. J. curcas is a semi- arid plant found growing in Botswana a semi-arid country.
Summer in Botswana begins in November and continues through to March. It is marked by high temperatures where shade temperatures can reach up to 38°C. Humidity in the morning can range from 60- 80% and drop to 30-40% in the afternoons. January is the hottest month of the season. Rainfall occurs in summer and tends to be erratic and generally unpredictable.
The objective of the study was to compare photosynthetic responses of field grown J. curcas accessions (Ghana, Tabala, Tlokweng and Tsamaya) over two summers that had a wide range of temperatures. It was conducted in the month of January in 2017 and 2018. The mean leaf temperatures for January 2017 were 21°C and 47°C for January 2018.
2. Materials and methods
2.1 Experimental site The study was conducted in an agricultural field at Sebele in the Department of Agricultural Research of the Ministry of Agriculture of the Government of Botswana (25°56´37´´E, 24°33´40´´S, 992m a.s.l.). This is a semi-arid area [8]. The mean annual rainfall in this area is 490mm [9] far below the optimum range of 1000-1500mm [1]). Precipitation occurring from October to March accounts for almost 100% of the annual rainfall [9]. Winter temperatures range from 6 °C-25 °C and summer temperatures range from 32 °C -35 °C.
J. curcas seedlings from accessions from different regions of Botswana were transferred into the 0.5ha field with a spacing of 2mx2m in December 2011. Manual irrigation was initially done up to 2012. From July 2012 drip irrigation was installed providing 5 l of water per week per plant. The irrigation was stopped in October 2012 and from November the plants were rain fed only. In May 2012 the shrubs were pruned to safeguard them over the cold in the winter [9].The irrigation and pruning continued up to April 2017.
2.2 Gas exchange measurements
Photosynthetic rate ( mol CO2m ²s¯¹),stomatal conductance (mmol H2Om¯²s¯¹) and transpiration rate (mmol H2Om¯²s¯¹) were measured simultaneously using a portable infrared CO2 analyzer equipped with a 6400XT 3x2 leaf chamber on 3 selected Botswana accessions and one Ghana. The Botswana accessions selected were from different ecological regions, Tsamaya from northern Botswana, Tabala from the central region and Tlokweng from the south eastern region. The measurements were taken in January of both 2017 and 2018. There were five replicates for each accession. A fully expanded leaf of the sixth pair from the apex was tagged on each replicate so that measurements taken would be from the same leaf. Measurements were taken
89
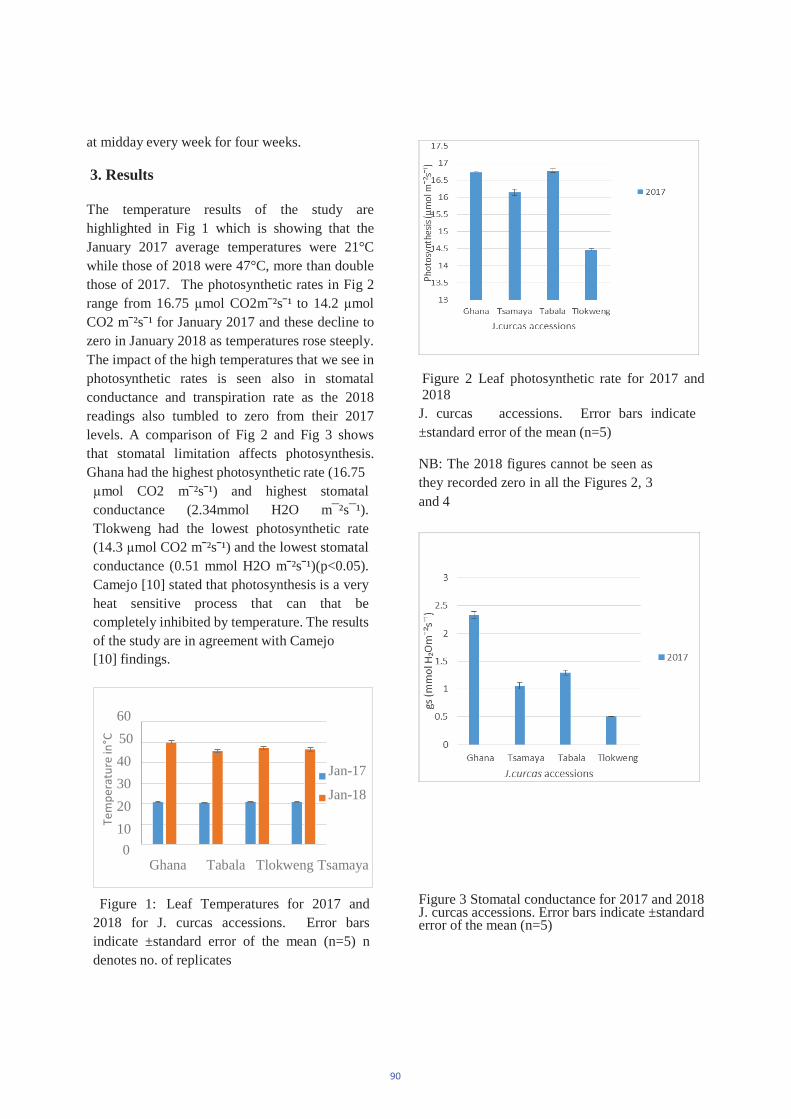
at midday every week for four weeks.
3. Results
The temperature results of the study are highlighted in Fig 1 which is showing that the January 2017 average temperatures were 21°C while those of 2018 were 47°C, more than double those of 2017. The photosynthetic rates in Fig 2 range from 16.75 mol CO2m ²s ¹ to 14.2 mol CO2 m ²s ¹ for January 2017 and these decline to zero in January 2018 as temperatures rose steeply. The impact of the high temperatures that we see in photosynthetic rates is seen also in stomatal conductance and transpiration rate as the 2018 readings also tumbled to zero from their 2017 levels. A comparison of Fig 2 and Fig 3 shows that stomatal limitation affects photosynthesis. Ghana had the highest photosynthetic rate (16.75
mol CO2 m ²s ¹) and highest stomatal conductance (2.34mmol H2O m¯²s¯¹). Tlokweng had the lowest photosynthetic rate (14.3 mol CO2 m ²s ¹) and the lowest stomatal conductance (0.51 mmol H2O m ²s ¹)(p<0.05). Camejo [10] stated that photosynthesis is a very heat sensitive process that can that be completely inhibited by temperature. The results of the study are in agreement with Camejo [10] findings.
Figure 2 Leaf photosynthetic rate for 2017 and 2018J. curcas accessions. Error bars indicate ±standard error of the mean (n=5)
NB: The 2018 figures cannot be seen as they recorded zero in all the Figures 2, 3 and 4
6050 403020100
Jan-17
Jan-18
Ghana Tabala Tlokweng Tsamaya
Figure 1: Leaf Temperatures for 2017 and 2018 for J. curcas accessions. Error bars indicate ±standard error of the mean (n=5) n denotes no. of replicates
Figure 3 Stomatal conductance for 2017 and 2018 J. curcas accessions. Error bars indicate ±standard error of the mean (n=5)
90
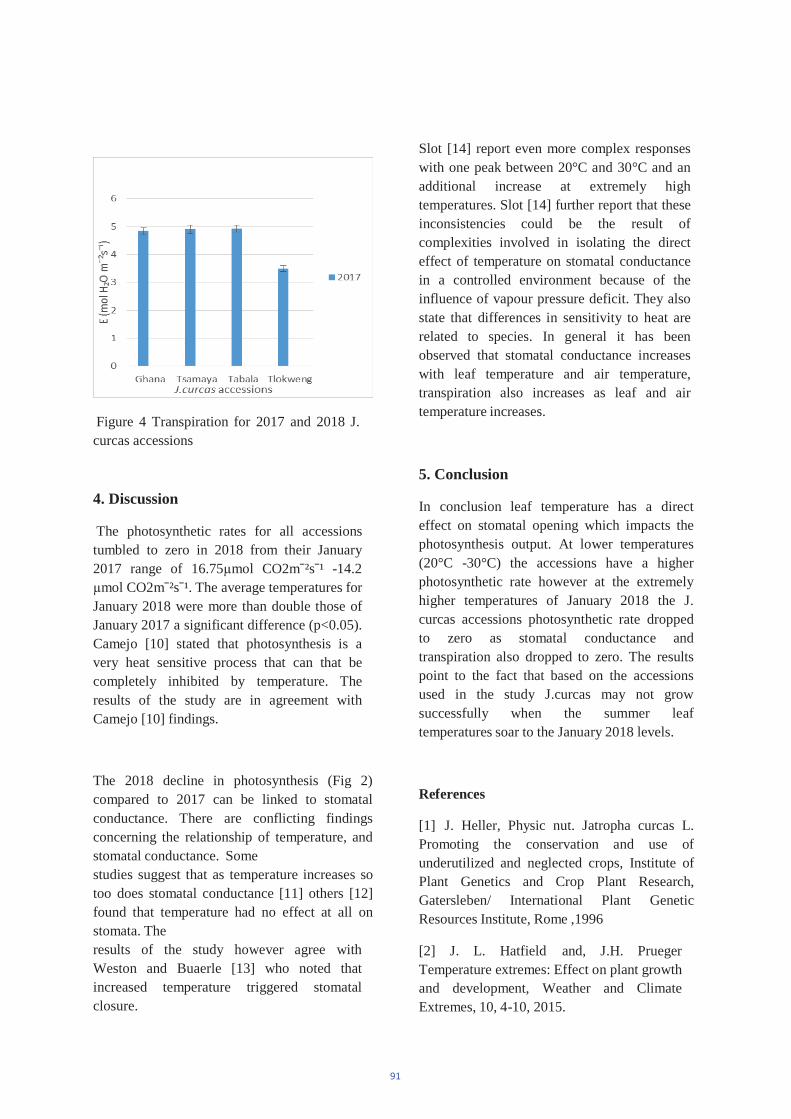
Figure 4 Transpiration for 2017 and 2018 J. curcas accessions
4. Discussion
The photosynthetic rates for all accessions tumbled to zero in 2018 from their January 2017 range of 16.75 mol CO2m ²s ¹ -14.2
mol CO2m ²s ¹. The average temperatures for January 2018 were more than double those of January 2017 a significant difference (p<0.05). Camejo [10] stated that photosynthesis is a very heat sensitive process that can that be completely inhibited by temperature. The results of the study are in agreement with Camejo [10] findings.
The 2018 decline in photosynthesis (Fig 2) compared to 2017 can be linked to stomatal conductance. There are conflicting findings concerning the relationship of temperature, and stomatal conductance. Some studies suggest that as temperature increases so too does stomatal conductance [11] others [12] found that temperature had no effect at all on stomata. The results of the study however agree with Weston and Buaerle [13] who noted that increased temperature triggered stomatal closure.
Slot [14] report even more complex responses with one peak between 20°C and 30°C and an additional increase at extremely high temperatures. Slot [14] further report that these inconsistencies could be the result of complexities involved in isolating the direct effect of temperature on stomatal conductance in a controlled environment because of the influence of vapour pressure deficit. They also state that differences in sensitivity to heat are related to species. In general it has been observed that stomatal conductance increases with leaf temperature and air temperature, transpiration also increases as leaf and air temperature increases.
5. Conclusion
In conclusion leaf temperature has a direct effect on stomatal opening which impacts the photosynthesis output. At lower temperatures (20°C -30°C) the accessions have a higher photosynthetic rate however at the extremely higher temperatures of January 2018 the J. curcas accessions photosynthetic rate dropped to zero as stomatal conductance and transpiration also dropped to zero. The results point to the fact that based on the accessions used in the study J.curcas may not grow successfully when the summer leaf temperatures soar to the January 2018 levels.
References
[1] J. Heller, Physic nut. Jatropha curcas L. Promoting the conservation and use of underutilized and neglected crops, Institute of Plant Genetics and Crop Plant Research, Gatersleben/ International Plant Genetic Resources Institute, Rome ,1996
[2] J. L. Hatfield and, J.H. Prueger Temperature extremes: Effect on plant growth and development, Weather and Climate Extremes, 10, 4-10, 2015.
91
[3] N. Murata, S.Takahashi, Y. Nishiyama, S.I. Allakhverdiev Photoinhibition of photosystem II under environmental stress, Biochim Biophys Acta 1767,2007, 414 42
[4] H. Lambers, F. Stuart Chapin III and T.J. Pons Plant Physiological Ecology (Spring Street NY: Springer,2008)
[5] Larkindale Jane, Hall Jennifer D., Knight Marc R., and Vierling Elizabeth) Heat Stress Phenotypes of Arabidopsis Mutants Implicate Multiple Signaling Pathways in the Acquisition of Thermotolerance1[w], Plant Physiology, 138, 882 897, 2005.
[6] Williams, J.H., Boote, K.J., Physiology and modelling. In: Pattee, H.E., Stalker, H.S. (Eds.), Advances in Peanut Science. American Peanut Research and Education Society, Stillwater, OK, USA, 301 353, 1995.
[7] L. Cui, J. Li, Y. Fan, S. Xu and Z. Zhang, High temperature effects on photosynthesis, PSII functionality and antioxidant activity of two Festuca arundinacea cultivars with different heat susceptibility, Botanical Studies 47, 61-69, 2006.
[8] Peel M. C., Finlayson B. L. and Mcmahon T. A. Updated world map of the Köppen-Geiger climate classification. Hydrology and Earth System Sciences Discussions, European Geosciences Union, 11 ( 5), 1633-1644, 2007.
[9] Tominaga J., Inafuku S, Coetzee T. and Kawamitsu Y. Diurnal Regulation of Photosynthesis in Jatropha curcas under drought during summer in a semiarid region. Biomass and Energy 67, 279-287, 2014.
[10] D. Camejo, P. Rodriguez, M. Angeles Morales, J.M. Amico, A. Torrecillas, and J.J. Alarcón. High temperature effects on photosynthetic activity of two tomato cultivars with different heat susceptibility, J. Plant Physiol. 162, 281-289, 2005.
[11] E.Schulze, O.L.Lange, M.Evenari L.
Kappen L, U.Buschbom. The role of air humidity and leaf temperature in controlling stomatal resistance of Prunus armeniaca L.under desert conditions. I. A simulation of the daily course of stomatal resistance, Oecologia 17, 159 170, 1974.
[12] T. Cerasoli, M.A Wertin, A. McGuire, D.P. Rodrigues, J.S.Aubrey, R.O. Pereira, R. Teskey, Poplar saplings exposed to recurring temperature shifts of different amplitude exhibit differences in leaf gas exchange and growth despite equal mean temperature, AoB Plants 6, 1 9, 2014.
[13] Weston DJ, Bauerle WL. Inhibition and acclimation of C3 photosynthesis to moderate heat: a perspective from thermally contrasting genotypes of Acer rubrum (red maple). Tree Physiology 27, 1083 1092, 2007.
[14] Slot M, Garcia MN, Winter K. Temperature response of CO2 exchange in three tropical tree species, Functional Plant Biology, 43, 468 478, 2016.
92
Responses of different accessions of Jatropha curcas plants to water stress in Botswana
Kesego Makholwaa and Baleseng Mosekib
aUniversity of Botswana, Department of Biological sciences, P/Bag 00704, Botswana bUniversity of Botswana, Department of Biological sciences, P/Bag 00704, Botswana
Email: [email protected]
Abstract The ability of Jatropha curcas to grow in marginal and dry soils has not been extensively explored. Given the current world energy problems of high fossil fuel consumption which plays a great role in the greenhouse effect, J.curcas biodiesel have been considered a potential alternative source of clean energy. Although it best grows under precipitation amounts of 250-1200mm annually, this plant has been reported to be drought tolerant, but no study has been done to ascertain this in Botswana. In thisstudy, potted plant (35 days old) from three J.curcas accessions namely Mmadinare (Central region), Thamaga (Southern region) and Maun (Northern region) in Botswana, selected to represent the different the climatic zones with respect to rainfall per annum, were assessed for water stress tolerance. These were subjected to continuous well-watered conditions (control) and to water stress (with-holding water) until they reached wilting point (140 days), followed by a 28-day re-watering period. Leaf morphology, leafgas exchange and chlorophyll fluorescence were measured at weekly intervals. Results showed that with the decline of soil wateravailability, net photosynthetic rate (A) and transpiration rate (E) were affected as they displayed a gradual decrease after 49 days of exposure to water stress, which ultimately resulted in lower dry weight compared to that of the control, with Mmadinare accession showing the least decrease in these parameters. This could be ascribed in part to reduction in stomatal conductance (gs)in which Mmadinare accession had least reduction, resulting in the highest total dry weight accumulated. All the accessions exhibited recovery of both physiological and morphological parameters after the 28-day re-watering period, with Mmadinare accession displaying a higher recovery rate. This indicates that Mmadinare accession appeared to be more tolerant to water stressthan Thamaga and Maun accessions.
Keywords Jatropha curcas, leaf gas exchange, re-watering, water-stress
1. Introduction
Over the past years there has been an increase in fossil fuel consumption as a result of increased use of transportation and industrialization [1]. This increase is in proportion to the rise in atmospheric carbon dioxide. As a country we have experienced fluctuations as well as hikes in fuel prices and even shortage of fuel at times. This is due to the fact that Botswana mostly depends on the importation of fossil fuels as there is no production locally. According to the [2], the use of conventional fuels has frequently resulted in a drastic rise in emissions from greenhouse gases such as carbon dioxide as well as disastrous environmental impacts both of which have profound impacts on the respective ecosystems.
Due to these aforementioned challenges, reducing consumption of fossil fuels in order to diminish carbon dioxide emissions has become a crucial countermeasure for global warming or the greenhouse effect.
Thus far, the most promising route has been biofuel production [2].
The demand for plant oils as sources of raw material for biodiesel production has increased recently due to several factors, including increased petroleum price, which aims at reducing CO2 emissions and fuel security. Consequently, the demands on other resources such as land and water have also increased [3]. It is important therefore to identify other sources of oils from species that are non-edible and adapted to semi-arid regions like Botswana which will in turn, allow the sustainable biofuel production using local raw materials at competitive prices possible [4].
Biofuel production led to the discovery of the Jatropha curcas plant. J.curcas is the mostpromising source of oil that can be used in biofuel production. It is a perennial plant belonging to the family Euphorbiaceae.
93
J. curcas is thought to originate from Mexico orCentral America and was introduced to Africa and Asia in the 16th century [5]. J.curcas seeds produce 35% oil which can be easily converted to biodiesel. The low sulphur content indicates less harmful sulphur dioxide (S02) exhaust emissions when the oil is used as a fuel [5].
J.curcas has been reported to survive in a range of rainfall conditions of 200mm to 1200mm. Study carried out by [6] revealed that J.curcasplants have the ability to withstand drought stress as shown by their growth (stem elongation and leaf development) which proved drought tolerance.
Water stress is an abiotic type of plant stress. It is one of the major uncontrollable environmental variables limiting growth and development and subsequently seed yield of plants. Photosynthesis is one of the processes that is most affected by abiotic stress due to reduction in stomatal conductance which is one of the first plant response to water deficit. Therefore, studying the morphological, physiological as well as the biochemical responses of J.curcas to semi-arid conditions of Botswana can assist in determining if the plant is indeed drought tolerant and hence be given a chance to be commercially grown locally at large scale production. The objective of the present study was to evaluate the physiological and morphological responses of J. curcas grown in water stress or drought conditions.
2. Materials and methods
2.1 Experimental setup
Three J.curcas accession seeds from the North, South and Central regions of Botswana (Maun [19o58’S, 23o25’E]; Thamaga [24o40’S, 25o32’E] and Mmadinare [21o56’S, 27o37’E] respectively) were germinated in Petri dishes at 25°C. After emergence the seedlings were transferred to pots filled with potting soil.
Each pot contained one plant. The plants were raised in a greenhouse at 35°C and relative humidity of 65-70% (representing semi-arid conditions). When the plants were one month old, they were separated into two groups. One
group was irrigated with half strength Hoagland culture solution every other day, whilst the other group was water stressed by withholding water. All measurements were carried out on the third fully expanded leaf [7].
Table 1. Annual rainfall and temperatures of selectedorigin of accessions.
Accession Origin Annual Annual temp rainfall
(oC) (mm)
MAD Mmadinare 35 379
TH Thamaga 33 457
MAU Maun 27 471
Source: climatemps.com
2.2 Treatments
Potted plants of the three Jatropha accessions (35 days old) were subjected to water stress by withholding water while for the control, plants were given 250ml of half strength Hoagland’ssolution twice a week. From the two experiments run, in the other set of plants, water stressed plants were then re-watered at permanent wilting point while the other set was terminated to calculate fresh and dry weight.
2.3 Growth and morphology
Stem growth characteristics were monitored weekly by measuring length (from substrate surface to the apical meristem) and diameter (at the base). Dry weight (g) was determined after drying plant material at 70 C (until a constant weight was achieved).
2.4 Leaf gas exchange
Leaf gas exchange was measured with a portable infrared gas analyzer (LI-6400; LI-COR Inc., Lincoln, USA). Net photosynthesis (An,
mol CO2 m 2 s 1), transpiration (E, mol H2O m 2 s 1) and stomatal conductance to water vapor (gs, mol H2O m 2 s 1) were monitored along the experiments. Data was collected weekly from the youngest fully expanded leaf [7].
94

2.5 Experimental design and statistical analysis
The experiment was completely randomized designed with five replications. One-way ANOVA was used to determine the effects of drought treatments. All statistical analyses were performed using Sigma plot 11.
3. Results
3.1 Growth and morphology
Generally, in all the three J.curcas accessions (Mmadinare, Thamaga and Maun) well-watered plants exhibited an increase for all the morphological parameters as compared to water stressed plants (Table 2). Mmadinare accession had higher values for the stem length, stem diameter and leaf number (17.7cm, 1.55cm and 20 leaves respectively), followed by Thamaga and Maun. Thamaga accession displayed readings of 15.8cm, 0.75cm and 18 leaves for the same parameters respectively while Maun exhibited readings of 15.5cm, 1.59 cm and 17 leaves, respectively. However, Mmadinare accession displayed the lowest leaf area at the end of stress exposure (57±0.3 cm2) while Thamaga and Maun accessions had leaf surface area 62±0.7 cm2 and 69.3±0.3 cm2, respectively. Similarly, Mmadinare accession had the highest percentage increase morphological parameters (Table 2). Percentage increases (from end of stress to after recovery) in the stem length were 10.2%, 7.1% and 5.7% for Mmadinare, Thamaga and Maun accessions respectively. Percentage increases for the stem diameter were 24.5%, 20% and 22% for Mmadinare, Thamaga and Maun accessions respectively while the percentage increases for leaf number were 25%, 17.7% and 16.7% for Mmadinare, Thamaga and Maun accessions respectively. Leaf area percentage changes were 8.7%, 6.8% and 7.2% for Mmadinare, Thamaga and Maun accessions respectively. Over-all, the three accessions showed a recovery after rehydration because none of them exhibited a percentage decrease.
3.2 Leaf gas exchange
Stomatal conductance (Fig. 2), transpiration rate (Fig. 1) and CO2 uptake (Fig. 1) of the three
J.curcas accessions; Mmadinare, Thamaga and Maun after being exposed to water stress were markedly reduced after 49 days. All the accessions exhibited a recovery after re-watering. However, Mmadinare accession displayed the highest recovery rate because it exhibited highest slopes (Table 3) for all the parameters from day 1 of rehydration to day 7. Maun accession followed Mmadinare accession, while Thamaga had the least recovery within the week of rehydration that followed.
CO2 assimilation showed a positive correlation in all the accessions with Thamaga accession showing the most correlation as shown by the values in table 3. As for total dry weight, Mmadinare accession had the highest mass of 3g followed by Maun accession (2.8g) and lastly Thamaga accession (2.74g) as illustrated in Fig. 3.
4. Discussion
4.1 Morpho-physiological responses to drought
In the present study, with regard to leaf gas exchange (AN, gs, and E), significant differences (p<0.05) between the well-watered and the water stressed plants were detected. Similar results were found out by [8]. The stomatal conductance of all the three accessions (Mmadinare, Thamaga and Maun) appeared to be sensitive to water stress as shown in fig. 2. From the results, it was evident that exposure to water deficit resulted in a gradual stomatal regulation in J.curcas as proven by the reduced gs values from day 35 (for Thamaga and Maun accessions) and day 49 (for Mmadinare accession). Although it is evident from the results that net photosynthesis was mostly influenced by stomatal activity/reduction (Fig. 3), it could also have been affected by several other non-stomatal factors such the reduced activity of photosynthetic enzymes (for example,
95
ribulose bisphosphate carboxylase/oxygenase [RUBISCO]) and even the decrease in the reaction centres of photosystem II [9]. Transpiration rate displayed a significant drop in all the accessions (Fig. 1), which corresponded to the reduction of stomatal conductance. Under drought conditions water supplies are limited, the plant’s priority changes from maximizing assimilation to restricting transpiration while maintaining as much assimilation as possible [9].
Furthermore, Stomatal conductance showed a positive correlation to carbon dioxide uptake (Fig. 3) suggesting that even though transpiration was restricted, there was still some carbon dioxide uptake activity.
Stomatal response to Carbon dioxide and the way this response affects photosynthesis and transpiration has effects on plant water regulation and growth, since virtually all of the CO2 used by the plant passes through stomata. These responses might have influences on climate change through changes in the hydrological and carbon cycles [10].
As a result of the mentioned responses, there was probably increase in the Water Use Efficiency of the accessions which enabled a water conservation strategy for the plants to survive until soil moisture depleted. Stomatal conductance has a greater influence on transpiration than on photosynthesis, therefore, transpiration decreases more rapidly than photosynthesis so WUE then increases [11].
Significant effects of water deficit on plant growth parameters (stem length, stem diameter and leaf number) were also detected suggesting growth reduction under water stress. This was similar to the results found out by [12]. The stem height, stem diameter and leaf number for water
stressed plants (table 2) were generally lower than that of normal irrigated plants. The leaf number was lower probably because of senescence of old leaves. Senescence leads to reduction of water loss by leaf transpiration [13].Furthermore, in a similar study, [11] concluded that water stress in linked to decrease in stem length in plants such as Eucalyptus with up to 25% decrease in the plant height. Also reduced leaf growth, stem length and stem diameter have been observed in several other plant species such as Oryza sativa [11]. Also, from the results in the present study, leaf area in water stressed plants was much lower than the control plants, probably to reduce surface area for transpiration. As mentioned before, a decrease in transpiration will then lead to reduced net photosynthesis hence enabling an increase in the Water use efficiency of the plant [9]. This was mainly because of the reduced net photosynthesis (AN) values [13].
4.2 Recovery to re-watering
Though not at the same rate, after 112 days of exposure, all the accessions were able to increase in readings of the photosynthesis parameters. Since Mmadinare had the highest recovery slopes for all the parameters in the first week (table 3), it could be suggested that Mmadinare accession recovered at a higher rate. Full recovery was observed at week 4 of rehydration. This indicated that J. curcas can recover even after severe drought. [8] had similar results in a similar study and suggested that such recovery efficiency insinuate that the imposed water stress caused no permanent damage to the leaf photochemical system. It also shows the high resilience of J. curcas accessions to drought stress.
96
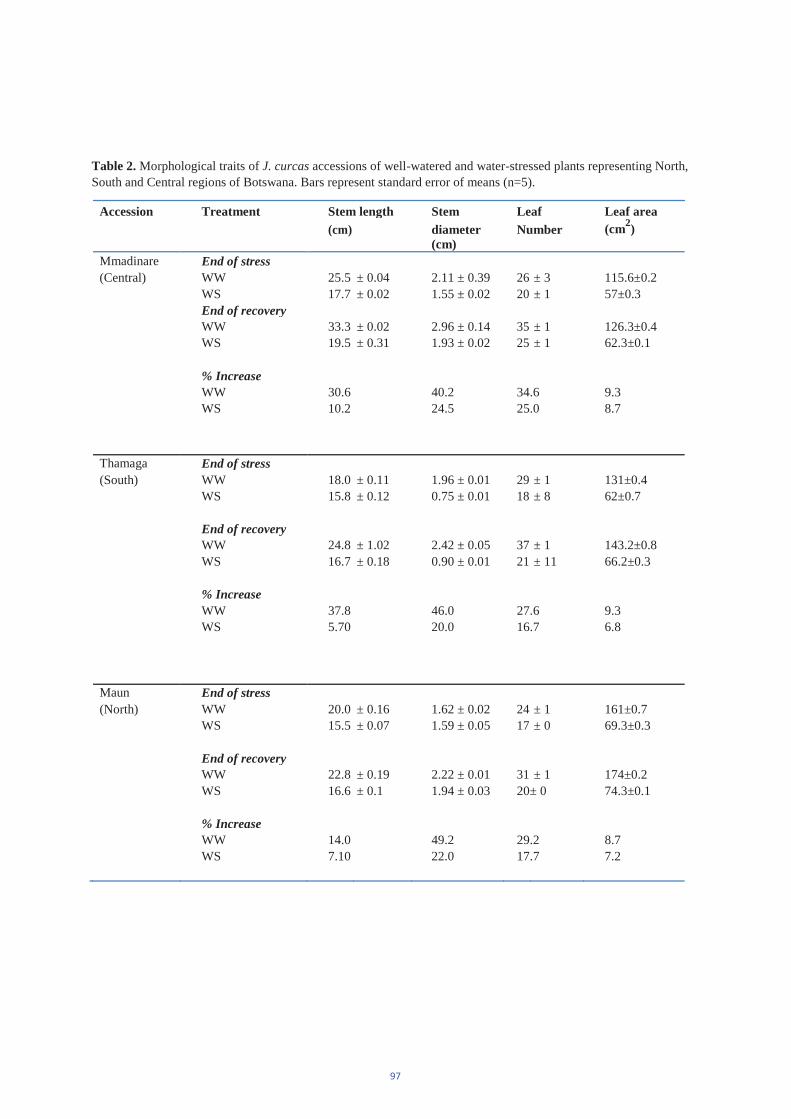
Table 2. Morphological traits of J. curcas accessions of well-watered and water-stressed plants representing North,South and Central regions of Botswana. Bars represent standard error of means (n=5).
Accession Treatment Stem length Stem Leaf Leaf area (cm) diameter Number (cm2)
(cm) Mmadinare End of stress (Central) WW 25.5 ± 0.04 2.11 ± 0.39 26 ± 3 115.6±0.2
WS 17.7 ± 0.02 1.55 ± 0.02 20 ± 1 57±0.3 End of recovery WW 33.3 ± 0.02 2.96 ± 0.14 35 ± 1 126.3±0.4 WS 19.5 ± 0.31 1.93 ± 0.02 25 ± 1 62.3±0.1
% Increase WW 30.6 40.2 34.6 9.3 WS 10.2 24.5 25.0 8.7
Thamaga End of stress (South) WW 18.0 ± 0.11 1.96 ± 0.01 29 ± 1 131±0.4
WS 15.8 ± 0.12 0.75 ± 0.01 18 ± 8 62±0.7
End of recovery WW 24.8 ± 1.02 2.42 ± 0.05 37 ± 1 143.2±0.8 WS 16.7 ± 0.18 0.90 ± 0.01 21 ± 11 66.2±0.3
% Increase WW 37.8 46.0 27.6 9.3 WS 5.70 20.0 16.7 6.8
Maun End of stress (North) WW 20.0 ± 0.16 1.62 ± 0.02 24 ± 1 161±0.7
WS 15.5 ± 0.07 1.59 ± 0.05 17 ± 0 69.3±0.3
End of recovery WW 22.8 ± 0.19 2.22 ± 0.01 31 ± 1 174±0.2 WS 16.6 ± 0.1 1.94 ± 0.03 20± 0 74.3±0.1
% Increase WW 14.0 49.2 29.2 8.7 WS 7.10 22.0 17.7 7.2
97
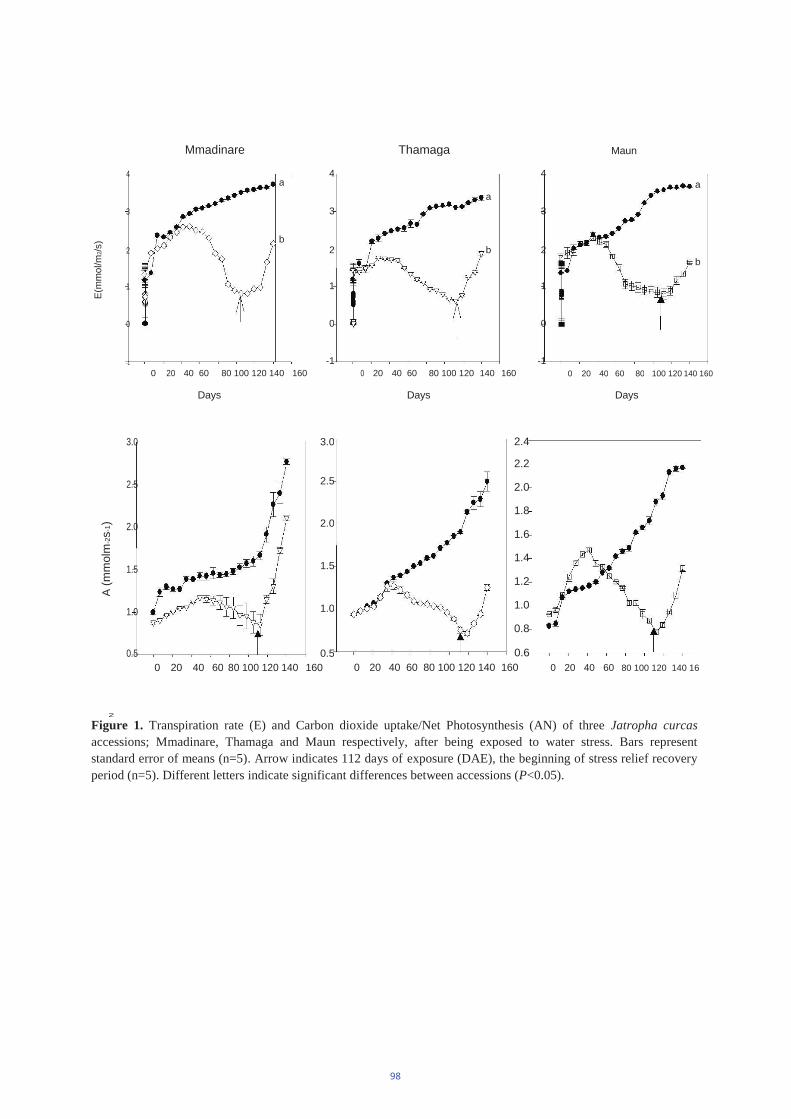
E(m
mol
/m2/s
) A
(mm
olm
-2s-
1)N
Mmadinare
4a
4
3 3
b22
1 1
0 0
-1 -10 20 40 60 80 100 120 140 160
Days
3.0 3.0
2.5 2.5
2.0 2.0
1.5 1.5
1.0 1.0
0.5 0.5 0 20 40 60 80 100 120 140 160
Thamaga Maun
4a
a3
b 2b
1
0
-10 20 40 60 80 100 120 140 160 0 20 40 60 80 100 120 140 160
Days Days
2.4
2.2
2.0
1.8
1.6
1.4
1.2
1.0
0.8
0.6 0 20 40 60 80 100 120 140 160 0 20 40 60 80 100 120 140 16
Figure 1. Transpiration rate (E) and Carbon dioxide uptake/Net Photosynthesis (AN) of three Jatropha curcasaccessions; Mmadinare, Thamaga and Maun respectively, after being exposed to water stress. Bars represent standard error of means (n=5). Arrow indicates 112 days of exposure (DAE), the beginning of stress relief recovery period (n=5). Different letters indicate significant differences between accessions (P<0.05).
98

Table 3. Recovery slopes of water stressed Mmadinare, Thamaga and Maun accession plants from day 1 of recoveryto day 7 for photosynthetic measurements.
Accession Transpiration Net Stomatal rate ( E) Photosynthesis conductance
(AN) (gs)
Mmadinare 0.0186* 0.0429 0.01
Thamaga 0.0014* 0.0043 0.0029*
Maun 0.0043* 0.0086* 0.0014
* indicate significant differences between accessions (P<0.05).
0.25
0.20
0.15
0.10
* 0.05 *
0.00 0 20 40 60 80 100 120 140 160
Days of exposure
MAD Well=watered MAD Water-stressed TH Well-watered
TH Water-stressed MAU Well-watered MAU Water-stressed
Figure 2. Stomatal conductance (gs) observed for both well-watered and water-stressed plants in three Jatrophacurcas accessions. Bars represent standard error of means (n=5). Arrow indicates 112 days of exposure (DAE),the beginning of stress relief. * indicate significant differences between accessions (P<0.05).
99
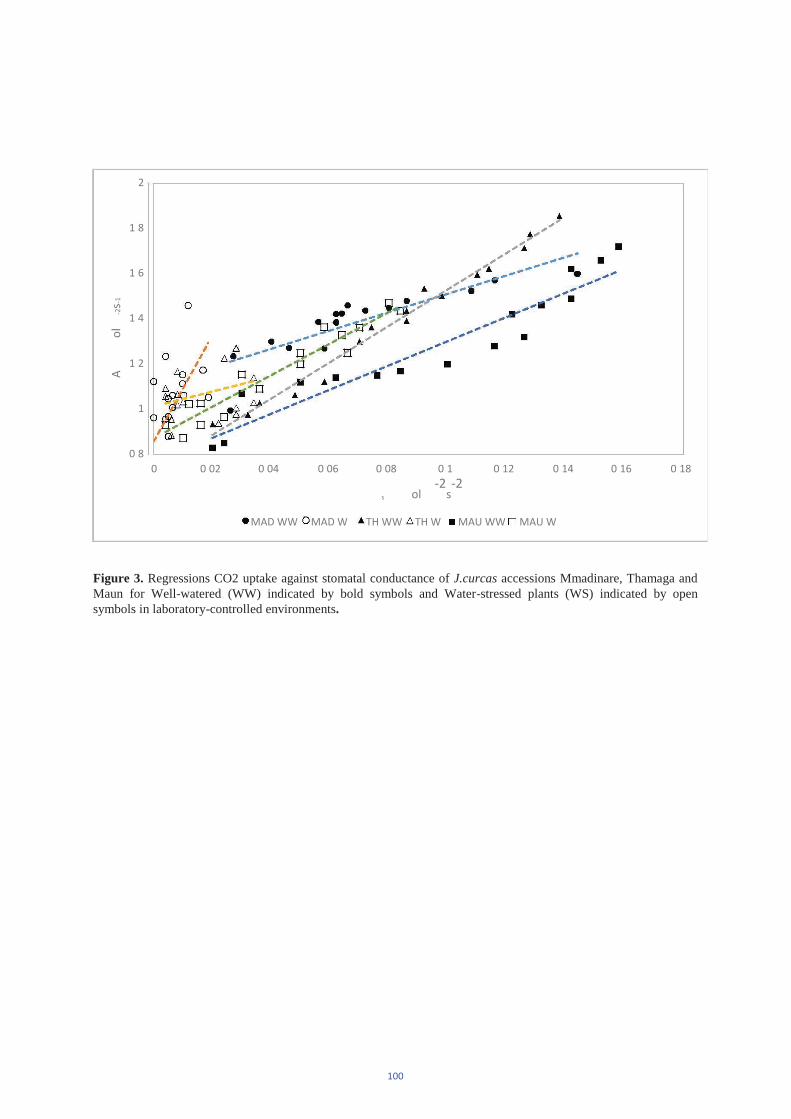
A� ��
�ol
�-2
s-1�
2
1�8
1�6
1�4
1�2
1
0�8 0 0�02 0�04 0�06 0�08 0�1 0�12 0�14 0�16 0�18
�s �� � ol �-2
s-2
�
MAD WW MAD W� TH WW TH W� MAU WW MAU W�
Figure 3. Regressions CO2 uptake against stomatal conductance of J.curcas accessions Mmadinare, Thamaga andMaun for Well-watered (WW) indicated by bold symbols and Water-stressed plants (WS) indicated by open symbols in laboratory-controlled environments.
100
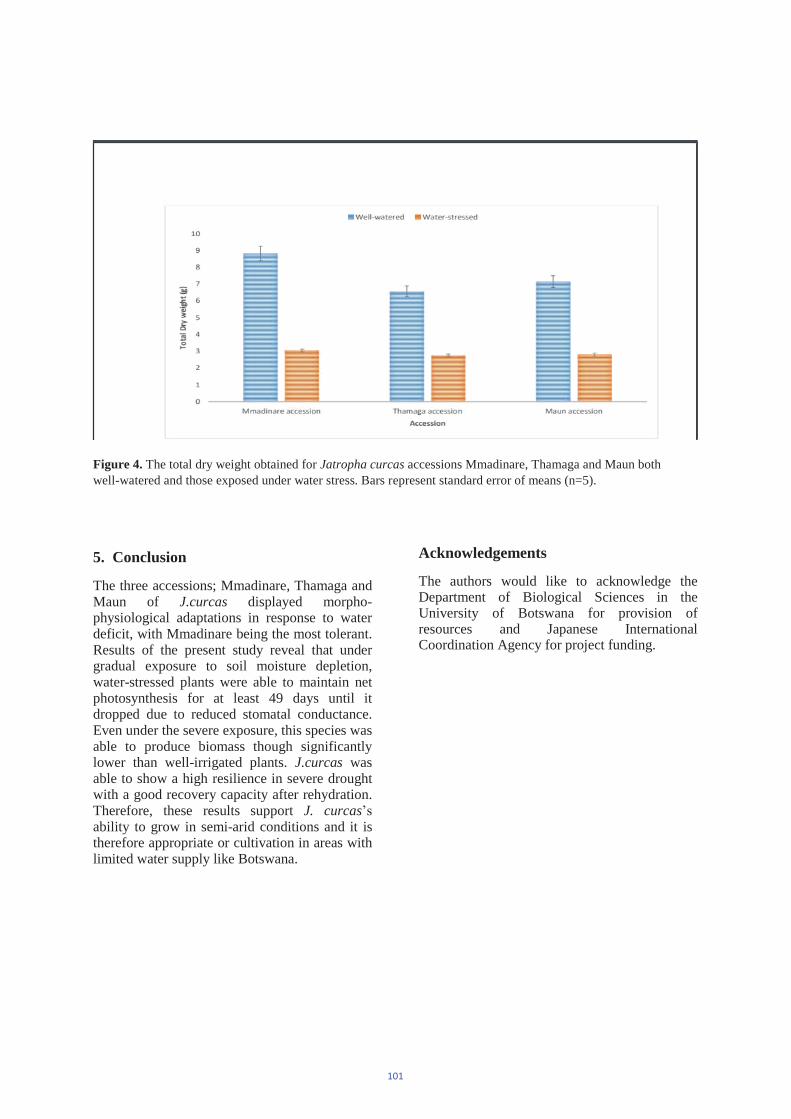
Figure 4. The total dry weight obtained for Jatropha curcas accessions Mmadinare, Thamaga and Maun bothwell-watered and those exposed under water stress. Bars represent standard error of means (n=5).
5. Conclusion
The three accessions; Mmadinare, Thamaga and Maun of J.curcas displayed morpho-physiological adaptations in response to water deficit, with Mmadinare being the most tolerant. Results of the present study reveal that under gradual exposure to soil moisture depletion, water-stressed plants were able to maintain net photosynthesis for at least 49 days until it dropped due to reduced stomatal conductance. Even under the severe exposure, this species was able to produce biomass though significantly lower than well-irrigated plants. J.curcas was able to show a high resilience in severe drought with a good recovery capacity after rehydration. Therefore, these results support J. curcas’s ability to grow in semi-arid conditions and it is therefore appropriate or cultivation in areas with limited water supply like Botswana.
Acknowledgements
The authors would like to acknowledge the Department of Biological Sciences in the University of Botswana for provision of resources and Japanese International Coordination Agency for project funding.
101
References
[1] Naresh, B., Reddy S., Vijiyalakshmi P., Reddy V. and Devi P. Physio-chemical screening of accessions of Jatropha curcas for biodiesel production. Plant tissue culture and Biotechnology,
pp 155-161, 2012.
[2] Global Energy Architecture Performance Index Report. Switzerland: World Economic Forum, 2011.
[3] Hidayati S.N., Baskin C.C and Baskin M. Dormancy-breaking and germination requirements for seeds of Symphoricarposorbiculatus (Caprifoliaceae). American Journal of Botany, vol 88 (8), pp 1444-1451 2001.
[4] Oliveira F. R. A., Oliveira F. A., Guimaraes I. P., Medeiros M. K., Oliveira T., Freitas A. V. L. and Medeiros M. A. Emergency of seedlings of Moringa oleifera Lam irrigated with water of different levels of salinity. Bio scientific Journal, vol 25 (5), pp 66-74,2009.
[5] Heller, J. Physic nut: Jatropha curcas L. Germany: International Plant Genetic Resources Institute, 1996.
[6] Niu G., Rodriguez D., Mendoza M., Jifon J and Ganjegunte G. Responses of Jatropha curcas to Salt and Drought Stresses, International Journal of Agronomy, 2012.
[7] Moseki B and Dintwe K. Effect of Water Stress on Photosynthetic Characteristics of Two Sorghum Cultivars. The African Journal of Plant Science and Biotechnology,2011.
[8] Sapeta H, Costa J., Lourenco T., Maroco J., Van der Linde, P and Oliveira M. Drought stress response in Jatropha curcas: growth and physiology. Environmental and Experimental Botany, vol 85, pp 76-84, 2013.
[9] Yuping L., Hongbin L., Yuanyuan L and Suiqi Z. Improving water-use efficiency by decreasing stomatal conductance and
transpiration rate maintain higher ear photosynthetic rate in drought resistant.The Crop Journal, vol 5, pp231-239,2017.
[10] Urban J., Ingwers M., McGuire M and Teskey R. Increase in leaf temperature opens stomata and decouples net photosynthesis from stomatal conductance in Pinus taeda and Populus deltoides x nigra. Journal of experimental Botany, vol 68 (7), pp 1757-1767, 2017.
[11] Seyed Y., Rouhollah M and Rahman M. M. I. Water-Stress in Plants: Causes, Effects and Responses, 1-14, 2012.
[12] Yin C.Y., Pang X. Y., Way X, Chen K and Gong R.G. Growth and photosynthetic responses in Jatropha curcas L. seedlings of different provenances to watering regimes. Photosynthetica. vol 54(3), pp 367-373, 2016.
[13] Carneiro I. C. S., Pereira E.G AND Souza P. G. Combined effects of low light and water stress on Jatropha curcas L. Promotes shoot growth and morphological adjustment. ActaBotanica Brasilica, vol 29 (4),pp467-472,2015.
102
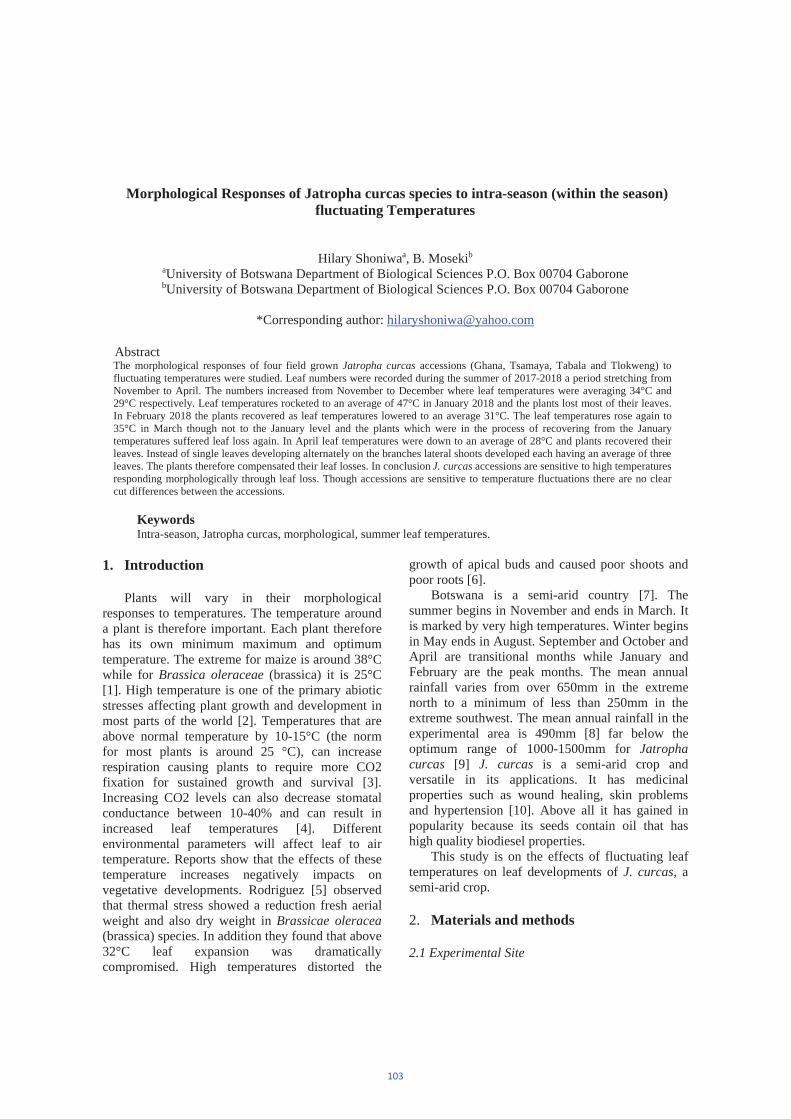
Morphological Responses of Jatropha curcas species to intra-season (within the season) fluctuating Temperatures
Hilary Shoniwaa, B. Mosekib
aUniversity of Botswana Department of Biological Sciences P.O. Box 00704 Gaborone bUniversity of Botswana Department of Biological Sciences P.O. Box 00704 Gaborone
*Corresponding author: [email protected]
Abstract The morphological responses of four field grown Jatropha curcas accessions (Ghana, Tsamaya, Tabala and Tlokweng) to fluctuating temperatures were studied. Leaf numbers were recorded during the summer of 2017-2018 a period stretching from November to April. The numbers increased from November to December where leaf temperatures were averaging 34°C and 29°C respectively. Leaf temperatures rocketed to an average of 47°C in January 2018 and the plants lost most of their leaves. In February 2018 the plants recovered as leaf temperatures lowered to an average 31°C. The leaf temperatures rose again to 35°C in March though not to the January level and the plants which were in the process of recovering from the January temperatures suffered leaf loss again. In April leaf temperatures were down to an average of 28°C and plants recovered their leaves. Instead of single leaves developing alternately on the branches lateral shoots developed each having an average of threeleaves. The plants therefore compensated their leaf losses. In conclusion J. curcas accessions are sensitive to high temperatures responding morphologically through leaf loss. Though accessions are sensitive to temperature fluctuations there are no clear cut differences between the accessions.
Keywords Intra-season, Jatropha curcas, morphological, summer leaf temperatures.
1. Introduction
Plants will vary in their morphological responses to temperatures. The temperature around a plant is therefore important. Each plant therefore has its own minimum maximum and optimum temperature. The extreme for maize is around 38°C while for Brassica oleraceae (brassica) it is 25°C [1]. High temperature is one of the primary abiotic stresses affecting plant growth and development in most parts of the world [2]. Temperatures that are above normal temperature by 10-15°C (the norm for most plants is around 25 °C), can increase respiration causing plants to require more CO2 fixation for sustained growth and survival [3]. Increasing CO2 levels can also decrease stomatal conductance between 10-40% and can result in increased leaf temperatures [4]. Different environmental parameters will affect leaf to air temperature. Reports show that the effects of these temperature increases negatively impacts on vegetative developments. Rodriguez [5] observed that thermal stress showed a reduction fresh aerial weight and also dry weight in Brassicae oleracea (brassica) species. In addition they found that above 32°C leaf expansion was dramatically compromised. High temperatures distorted the
growth of apical buds and caused poor shoots and poor roots [6].
Botswana is a semi-arid country [7]. The summer begins in November and ends in March. It is marked by very high temperatures. Winter begins in May ends in August. September and October and April are transitional months while January and February are the peak months. The mean annual rainfall varies from over 650mm in the extreme north to a minimum of less than 250mm in the extreme southwest. The mean annual rainfall in the experimental area is 490mm [8] far below the optimum range of 1000-1500mm for Jatropha curcas [9] J. curcas is a semi-arid crop and versatile in its applications. It has medicinal properties such as wound healing, skin problems and hypertension [10]. Above all it has gained in popularity because its seeds contain oil that has high quality biodiesel properties.
This study is on the effects of fluctuating leaf temperatures on leaf developments of J. curcas, asemi-arid crop.
2. Materials and methods
2.1 Experimental Site
103

The study was conducted in an agricultural field at Sebele in the Department of Agricultural Research of the Ministry of Agriculture of the Government of Botswana (25°56´37´´E, 24°33´40´´S, 992m a.s.l.) [8]. At the time of this study, the summer of 2017-18, J. curcas plants of different accessions were six years old. They had been grown from seedlings transferred in that 0,5ha field with a spacing of 2mx2m. They were watered by drip irrigation at a rate of 5l/week. The J.curcas accessions were selected from regions of Botswana with different rainfall and temperature ranges. These were Tsamaya from the north east, Tabala from the central region, Tlokweng from the south east and Ghana from Ghana. Ghana was selected to see how it would fare in Botswana.
2.2 Leaf number counts
Average leaf numbers wer e recorded monthly per each accessions and percentage changes were recorded for each month and for each accession. Average monthly leaf temperatures were recorded for each accession and percentage changes calculated for each accession.
3. Results
3.1 Figures of average leaf monthly temperatures, % changes in leaf temperatures, average leaf numbers and % changes in leaf numbers
Fig 1 shows the average temperatures for each month for the J. curcas accessions. There were significant differences between each accession. Though Tlokweng from the south east appeared to be significantly different (p<0.05) in November 2017 and December 2017 this was not so after the January 2018 high temperatures. All accessions differed significantly in their January leaf temperatures. In April the leaf temperatures for the accessions declined to their lowest monthly average (28.6°C) for that season and there were significant differences among all accessions.
Fig 2 shows the % changes of the average leaf temperatures for each month for each accession. The temperatures fluctuated peaking in January 2018 with average temperatures close to 50°C and the lowest in April 28.6°C. In December 2017 and January 2018 Tabala and Tlokweng show the similar percentage changes with no significant changes but thereafter from January through to March there are significant differences.
3.2 Relationship between leaf numbers and temperature
The fluctuations in temperatures seen above were accompanied by fluctuations in leaf numbers (Fig 3). Tlokweng, in the south east, had the highest average leaf numbers and Tsamaya, from the north, had the lowest average leaf numbers in November 2017. The highest leaf numbers were in December 2017 when the leaf temperatures were close to the plant optimum temperatures. The lowest leaf numbers were in January 2018 when the leaf temperatures were at their peak. In February leaf numbers increased as temperatures declined. These fluctuations are best reflected as percentage changes (see Fig 4).
Fig 4 shows that the December 2017 percentage changes for all accessions were significant compared to November 2017. In January 2018 though the percentage differences were significant for all accessions Ghana is outstanding at 26% followed by Tlokweng at18% the Tabala at 15% and lastly Tsamaya at 10%. In February 2018 the decline in temperatures reflects Tabala as outstanding in its change in percentage leaf numbers and is significantly different from the other accessions. In March 2018 the percentages changes decline but there were no significant differences among accessions. In April 2018 though temperatures were near plant optimum percentage changes in leaf numbers far below December levels when temperatures were comparable.
A negative correlation was observed for all J.curcas accessions used in this study. The relationship was strongest for the J.curcas Tabala accession from the central region and weakest for the J.curcas Ghana accession.
Figures 5a-d show a negative correlation between temperatures and leaf numbers for each accession. The strongest negative correlation is seen in the J.curcas Tabala accession from the central regions and weakest negative correlation is seen in the J.curcas Ghana accession.
4. Discussion
4.1 Effects of fluctuating leaf temperatures on leaf numbers
In January 2018 the leaf temperatures rocketed (Fig 1) and leaf numbers tumbled (Fig 3) compared to the November 2017 leaf temperatures and numbers. The January 2018 leaf temperatures were not only far above the plant optimum of 25°C reported by Thebud and Santarius [3] but also above the maximum of 38°C for Zea mais (maize) stated by Hatfield and Prueger [1]. The high leaf temperatures followed by a reduction in leaf numbers confirm that high temperatures stress plants and affect growth and development [2].
104
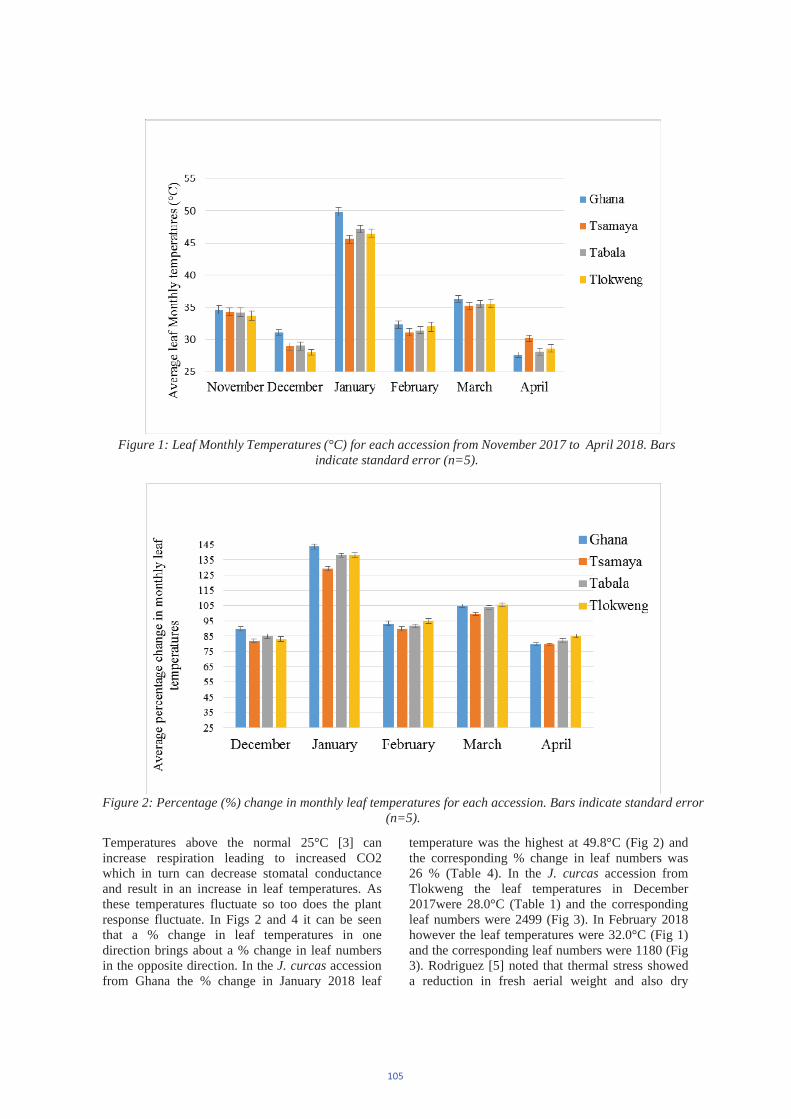
Temperatures above the normal 25°C [3] can increase respiration leading to increased CO2 which in turn can decrease stomatal conductance and result in an increase in leaf temperatures. As these temperatures fluctuate so too does the plant response fluctuate. In Figs 2 and 4 it can be seen that a % change in leaf temperatures in one direction brings about a % change in leaf numbers in the opposite direction. In the J. curcas accessionfrom Ghana the % change in January 2018 leaf
temperature was the highest at 49.8°C (Fig 2) and the corresponding % change in leaf numbers was 26 % (Table 4). In the J. curcas accession from Tlokweng the leaf temperatures in December 2017were 28.0°C (Table 1) and the corresponding leaf numbers were 2499 (Fig 3). In February 2018 however the leaf temperatures were 32.0°C (Fig 1) and the corresponding leaf numbers were 1180 (Fig 3). Rodriguez [5] noted that thermal stress showed a reduction in fresh aerial weight and also dry
Figure 1: Leaf Monthly Temperatures (°C) for each accession from November 2017 to April 2018. Bars indicate standard error (n=5).
Figure 2: Percentage (%) change in monthly leaf temperatures for each accession. Bars indicate standard error (n=5).
105
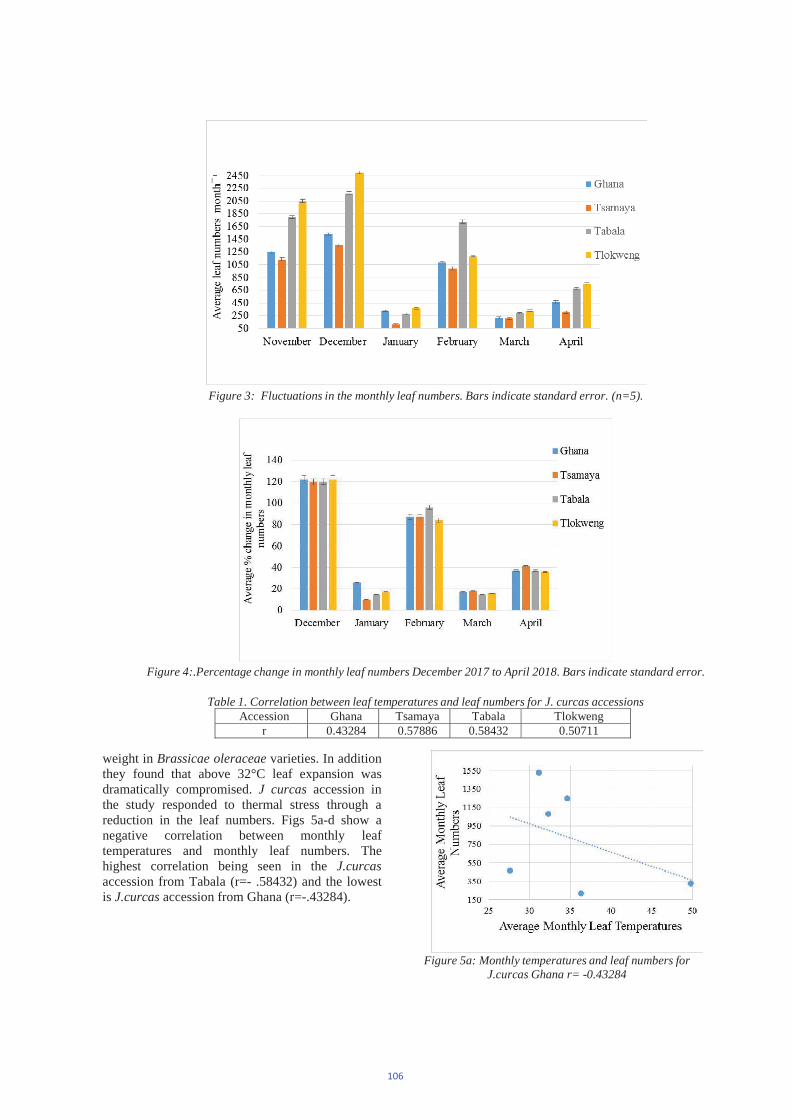
weight in Brassicae oleraceae varieties. In addition they found that above 32°C leaf expansion was dramatically compromised. J curcas accession in the study responded to thermal stress through a reduction in the leaf numbers. Figs 5a-d show a negative correlation between monthly leaf temperatures and monthly leaf numbers. The highest correlation being seen in the J.curcas accession from Tabala (r=- .58432) and the lowest is J.curcas accession from Ghana (r=-.43284).
Figure 5a: Monthly temperatures and leaf numbers for J.curcas Ghana r= -0.43284
Figure 3: Fluctuations in the monthly leaf numbers. Bars indicate standard error. (n=5).
Figure 4:.Percentage change in monthly leaf numbers December 2017 to April 2018. Bars indicate standard error.
Table 1. Correlation between leaf temperatures and leaf numbers for J. curcas accessions Accession Ghana Tsamaya Tabala Tlokweng
r 0.43284 0.57886 0.58432 0.50711
106

Figure 5b Monthly temperatures and leaf numbers for J.curcas Tsamaya r= -0.57886
Figure 5c Monthly temperatures and leaf numbers for J.curcas from Tabala r= -0.58432
Figure 5d Monthly temperatures and leaf numbers for J.curcas from Tlokweng r= -0.50711
4.2 Change in plant architecture
In April the plant architecture was altered as the plant responded by having several lateral shoots each with a maximum of three leaves (Fig 6). This had not been observed in the other months of the season. This observation is in agreement with Bita and Gerats [12] who reported that plant architecture changes and hypocotyls and petioles elongate resembling morphological responses of shade avoidance. In 2014 Mike Corcoran the owner of
Edentrees in the USA told his clients that the premature leaf fall their trees were experiencing was the result of the extreme high temperatures they had been experiencing that season. He explained that leaf loss was a defense mechanism to reduce water loss through transpiration which takes place via the stomata in the leaves. This explains the losses in the J. curcas accession in the summer of 2017-18(Table 4). The plants shed their leaves to avoid further loss of water but were quick to develop new leaves when temperatures were more favorable. They were able to do this over several months but by April their defense was weaker and consequently their recovery too was slower. They developed fewer leaves in April compared to March despite April temperatures being more favorable. The April average leaf temperature lower and more favorable at 28.6°C as well as being significantly different (p<0.05) from December ones at 29.3°C the J.curcas accessions were unable to recover and exceed the December leaf numbers
5. Conclusion
J.curcas being a semi- arid crop its accessions were able to tolerate temperatures above the normal (25°C). Up to leaf temperatures of around 34°C leaf numbers were increasing but when the temperatures exceeded 35°C the accessions began to lose leaves. The plants shed their leaves to avoid further loss of water but were quick to develop new leaves when temperatures were more favorable. More work needs to be done on breeding accessions of J.curcas. The recovery from the stress of high temperatures shows that there is much potential in J. curcas enabling them to tolerate high temperatures that can be unlocked through continued research.
References
[1] J.L. Hatfield and J.H. Prueger Temperature extremes: effect on plant growth and development, Weather and Climate Extremes, 10,2015, 4-10,
[2] Leong, S.K., and C.K. Ong. The influence of temperature and soil water deficit on the development and morphology of groundnut (Arachis hypogaea L.), J. Exp. Bot, 34, 1983, 1551-1561.
[3] Thebud, R., Santarius,K., Effect of high temperature stress of various biomembranes of leaf cells in situ and in vitro, Plant Physiology ,70 ,1982, 200-205.
[4] Nelson J.A., Bugbee B (2015) Analysis of Environmental Effects on Leaf Temperature under Sunlight, High Pressure Sodium and
107

Light Emitting Diodes, PLoS One. 10(10),2015, e0138930
[5] V.M. Rodríguez, P. Soengas, V. Alonso-Villaverde,T. Sotelo, M. E. Cartea and P. Velasco, Effect of temperature stress on the early vegetative development of Brassica oleraceaL, BMC Plant Biology, 15, 2015, 145
[6] Natarajan S. and Kuehny Morphological, Physioloical and Anatomical Characteristics Associated with heat preconditioning and heat tolerance in Salvia splendens, Journal of American Society of Horticultural Science, 133(4), 2008, 527-534
[7] Peel M. C., Finlayson B. L. and Mcmahon T. A. Updated world map of the Köppen-Geiger climate classification, Hydrology and Earth System Sciences Discussions, European Geosciences Union, 11(5), 2007, 1633-1644.
[8] J.Tominaga, S.Inafuku, T.Coetzee and Y. Kawamitsu Diurnal Regulation of Photosynthesisin Jatropha curcas under drought during summer in a semiarid region, Biomass and Energy, 67,2014, 279-287
[9] R. Brittaine, N. Lutaladio, Jatropha: A smallholder bioenergy crop—The potential for
pro-poor development. In Integrated Crop Management,8, FAO Rome, 2010.
[10] J. Heller, Physic nut. Jatropha curcas L. Promoting the conservation and use of underutilized and neglected crops, 1. Institute of Plant Genetics and Crop Plant Research, Gatersleben/ International Plant Genetic Resources Institute, Rome, 1996
[11] C.E. Bita and T. Gerats, Plant tolerance to high temperature in a changing environment: scientific fundamentals and production of heat stress-tolerant crops, Front Plant, Sci 4 ,2013,273
[12] Corcoran M accessed 26th July 2018 http://edentreeservicekc.com/extreme-heat-causing-tree-issues-midwest/ 2014
108

109
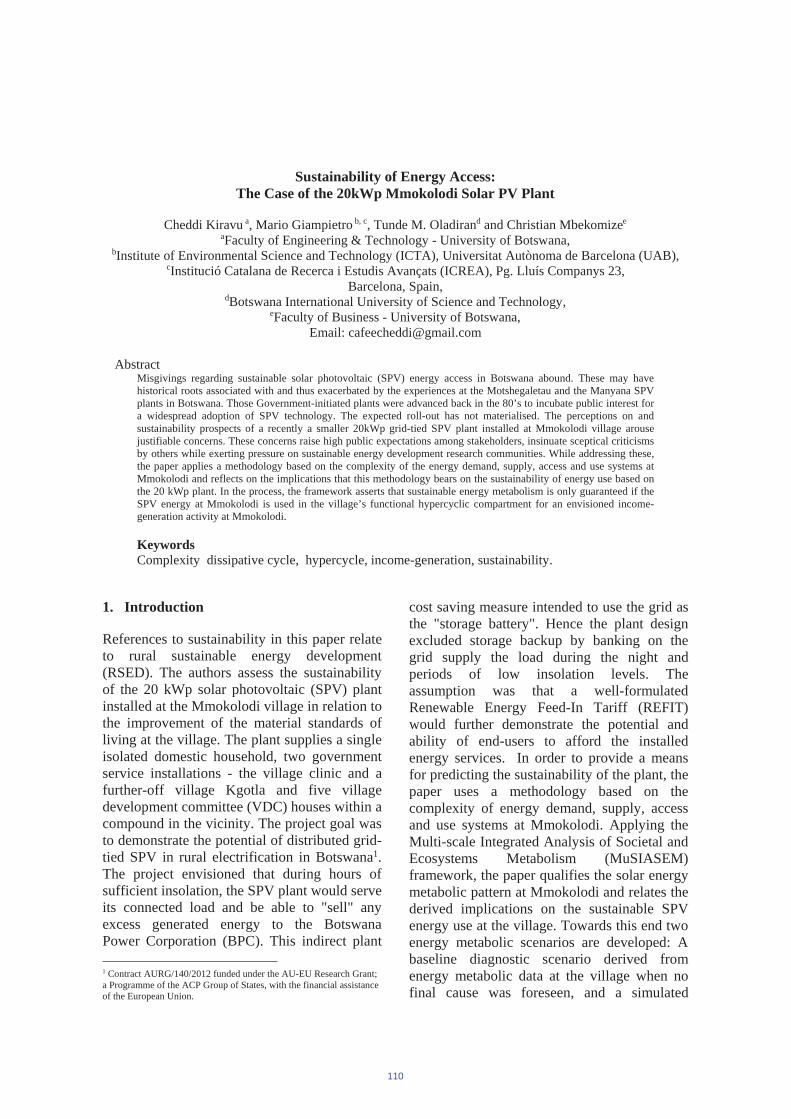
Sustainability of Energy Access: The Case of the 20kWp Mmokolodi Solar PV Plant
Cheddi Kiravu a, Mario Giampietro b, c, Tunde M. Oladirand and Christian Mbekomizee
aFaculty of Engineering & Technology - University of Botswana, bInstitute of Environmental Science and Technology (ICTA), Universitat Autònoma de Barcelona (UAB),
cInstitució Catalana de Recerca i Estudis Avançats (ICREA), Pg. Lluís Companys 23, Barcelona, Spain,
dBotswana International University of Science and Technology, eFaculty of Business - University of Botswana,
Email: [email protected]
Abstract Misgivings regarding sustainable solar photovoltaic (SPV) energy access in Botswana abound. These may have historical roots associated with and thus exacerbated by the experiences at the Motshegaletau and the Manyana SPV plants in Botswana. Those Government-initiated plants were advanced back in the 80’s to incubate public interest for a widespread adoption of SPV technology. The expected roll-out has not materialised. The perceptions on and sustainability prospects of a recently a smaller 20kWp grid-tied SPV plant installed at Mmokolodi village arouse justifiable concerns. These concerns raise high public expectations among stakeholders, insinuate sceptical criticisms by others while exerting pressure on sustainable energy development research communities. While addressing these, the paper applies a methodology based on the complexity of the energy demand, supply, access and use systems at Mmokolodi and reflects on the implications that this methodology bears on the sustainability of energy use based on the 20 kWp plant. In the process, the framework asserts that sustainable energy metabolism is only guaranteed if the SPV energy at Mmokolodi is used in the village’s functional hypercyclic compartment for an envisioned income-generation activity at Mmokolodi.
Keywords Complexity dissipative cycle, hypercycle, income-generation, sustainability.
1. Introduction
References to sustainability in this paper relate to rural sustainable energy development (RSED). The authors assess the sustainability of the 20 kWp solar photovoltaic (SPV) plant installed at the Mmokolodi village in relation to the improvement of the material standards of living at the village. The plant supplies a single isolated domestic household, two government service installations - the village clinic and a further-off village Kgotla and five village development committee (VDC) houses within a compound in the vicinity. The project goal was to demonstrate the potential of distributed grid-tied SPV in rural electrification in Botswana1.The project envisioned that during hours of sufficient insolation, the SPV plant would serve its connected load and be able to "sell" any excess generated energy to the Botswana Power Corporation (BPC). This indirect plant
1 Contract AURG/140/2012 funded under the AU-EU Research Grant; a Programme of the ACP Group of States, with the financial assistance of the European Union.
cost saving measure intended to use the grid as the "storage battery". Hence the plant design excluded storage backup by banking on the grid supply the load during the night and periods of low insolation levels. The assumption was that a well-formulated Renewable Energy Feed-In Tariff (REFIT) would further demonstrate the potential and ability of end-users to afford the installed energy services. In order to provide a means for predicting the sustainability of the plant, the paper uses a methodology based on the complexity of energy demand, supply, access and use systems at Mmokolodi. Applying the Multi-scale Integrated Analysis of Societal and Ecosystems Metabolism (MuSIASEM) framework, the paper qualifies the solar energy metabolic pattern at Mmokolodi and relates the derived implications on the sustainable SPV energy use at the village. Towards this end two energy metabolic scenarios are developed: A baseline diagnostic scenario derived from energy metabolic data at the village when no final cause was foreseen, and a simulated
110
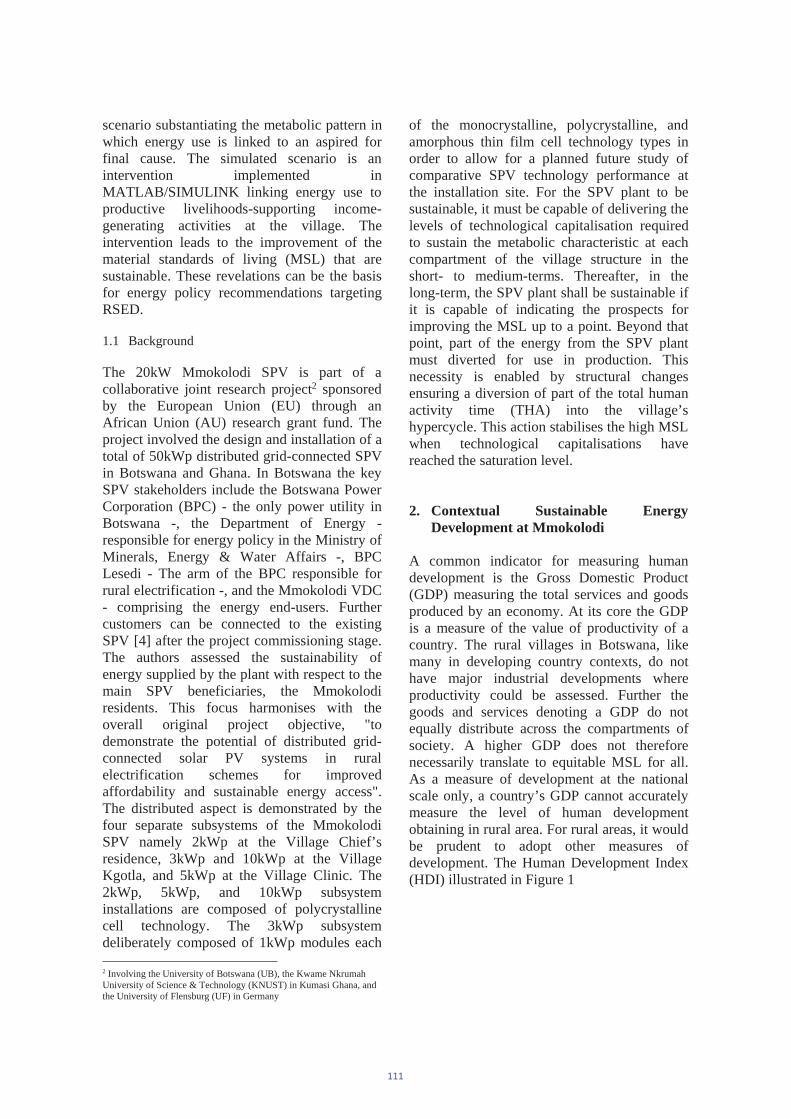
scenario substantiating the metabolic pattern in which energy use is linked to an aspired for final cause. The simulated scenario is an intervention implemented in MATLAB/SIMULINK linking energy use to productive livelihoods-supporting income-generating activities at the village. The intervention leads to the improvement of the material standards of living (MSL) that are sustainable. These revelations can be the basis for energy policy recommendations targeting RSED.
1.1 Background
The 20kW Mmokolodi SPV is part of a collaborative joint research project2 sponsored by the European Union (EU) through an African Union (AU) research grant fund. The project involved the design and installation of a total of 50kWp distributed grid-connected SPV in Botswana and Ghana. In Botswana the key SPV stakeholders include the Botswana Power Corporation (BPC) - the only power utility in Botswana -, the Department of Energy - responsible for energy policy in the Ministry of Minerals, Energy & Water Affairs -, BPC Lesedi - The arm of the BPC responsible for rural electrification -, and the Mmokolodi VDC - comprising the energy end-users. Further customers can be connected to the existing SPV [4] after the project commissioning stage. The authors assessed the sustainability of energy supplied by the plant with respect to the main SPV beneficiaries, the Mmokolodi residents. This focus harmonises with the overall original project objective, "to demonstrate the potential of distributed grid-connected solar PV systems in rural electrification schemes for improved affordability and sustainable energy access". The distributed aspect is demonstrated by the four separate subsystems of the Mmokolodi SPV namely 2kWp at the Village Chief’s residence, 3kWp and 10kWp at the Village Kgotla, and 5kWp at the Village Clinic. The 2kWp, 5kWp, and 10kWp subsystem installations are composed of polycrystalline cell technology. The 3kWp subsystem deliberately composed of 1kWp modules each
2 Involving the University of Botswana (UB), the Kwame Nkrumah University of Science & Technology (KNUST) in Kumasi Ghana, and the University of Flensburg (UF) in Germany
of the monocrystalline, polycrystalline, and amorphous thin film cell technology types in order to allow for a planned future study of comparative SPV technology performance at the installation site. For the SPV plant to be sustainable, it must be capable of delivering the levels of technological capitalisation required to sustain the metabolic characteristic at each compartment of the village structure in the short- to medium-terms. Thereafter, in the long-term, the SPV plant shall be sustainable if it is capable of indicating the prospects for improving the MSL up to a point. Beyond that point, part of the energy from the SPV plant must diverted for use in production. This necessity is enabled by structural changes ensuring a diversion of part of the total human activity time (THA) into the village’s hypercycle. This action stabilises the high MSL when technological capitalisations have reached the saturation level.
2. Contextual Sustainable Energy Development at Mmokolodi
A common indicator for measuring human development is the Gross Domestic Product (GDP) measuring the total services and goods produced by an economy. At its core the GDP is a measure of the value of productivity of a country. The rural villages in Botswana, like many in developing country contexts, do not have major industrial developments where productivity could be assessed. Further the goods and services denoting a GDP do not equally distribute across the compartments of society. A higher GDP does not therefore necessarily translate to equitable MSL for all. As a measure of development at the national scale only, a country’s GDP cannot accurately measure the level of human development obtaining in rural area. For rural areas, it would be prudent to adopt other measures of development. The Human Development Index (HDI) illustrated in Figure 1
111
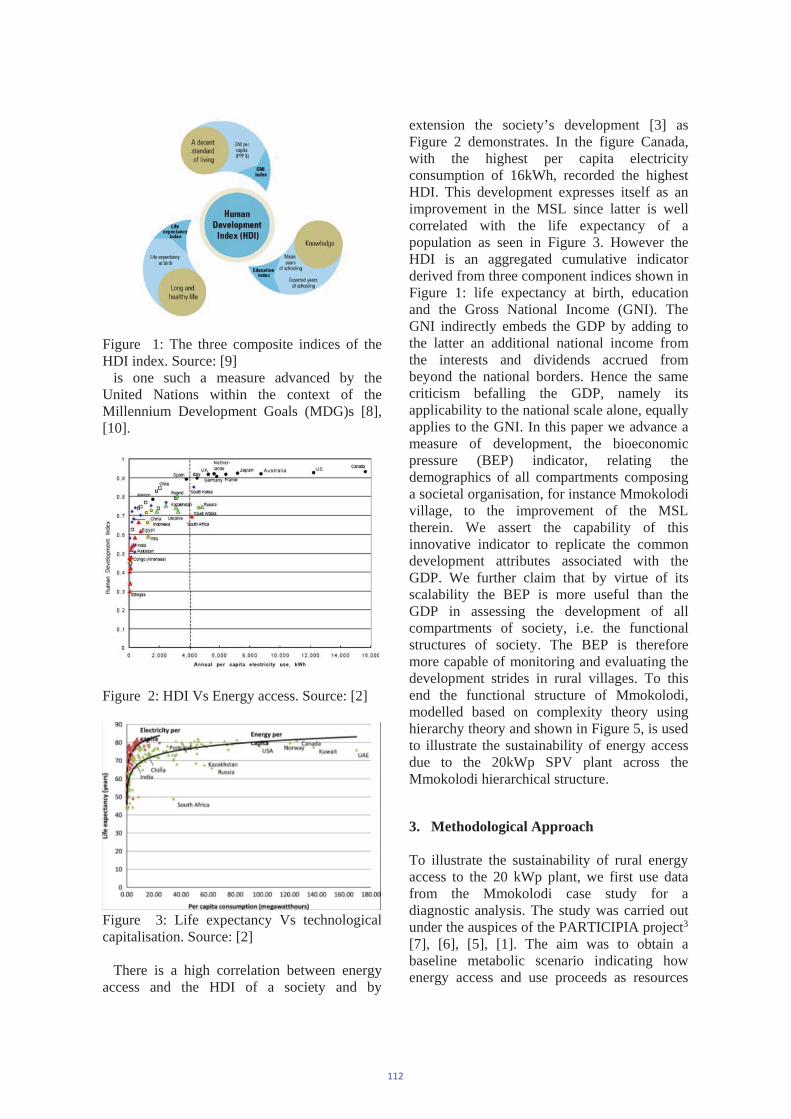
Figure 1: The three composite indices of the HDI index. Source: [9] is one such a measure advanced by the United Nations within the context of the Millennium Development Goals (MDG)s [8], [10].
Figure 2: HDI Vs Energy access. Source: [2]
Figure 3: Life expectancy Vs technological capitalisation. Source: [2]
There is a high correlation between energy access and the HDI of a society and by
extension the society’s development [3] as Figure 2 demonstrates. In the figure Canada, with the highest per capita electricity consumption of 16kWh, recorded the highest HDI. This development expresses itself as an improvement in the MSL since latter is well correlated with the life expectancy of a population as seen in Figure 3. However the HDI is an aggregated cumulative indicator derived from three component indices shown in Figure 1: life expectancy at birth, education and the Gross National Income (GNI). The GNI indirectly embeds the GDP by adding to the latter an additional national income from the interests and dividends accrued from beyond the national borders. Hence the same criticism befalling the GDP, namely its applicability to the national scale alone, equally applies to the GNI. In this paper we advance a measure of development, the bioeconomic pressure (BEP) indicator, relating the demographics of all compartments composing a societal organisation, for instance Mmokolodi village, to the improvement of the MSL therein. We assert the capability of this innovative indicator to replicate the common development attributes associated with the GDP. We further claim that by virtue of its scalability the BEP is more useful than the GDP in assessing the development of all compartments of society, i.e. the functional structures of society. The BEP is therefore more capable of monitoring and evaluating the development strides in rural villages. To this end the functional structure of Mmokolodi, modelled based on complexity theory using hierarchy theory and shown in Figure 5, is used to illustrate the sustainability of energy access due to the 20kWp SPV plant across the Mmokolodi hierarchical structure.
3. Methodological Approach
To illustrate the sustainability of rural energy access to the 20 kWp plant, we first use data from the Mmokolodi case study for a diagnostic analysis. The study was carried out under the auspices of the PARTICIPIA project3
[7], [6], [5], [1]. The aim was to obtain a baseline metabolic scenario indicating how energy access and use proceeds as resources
112
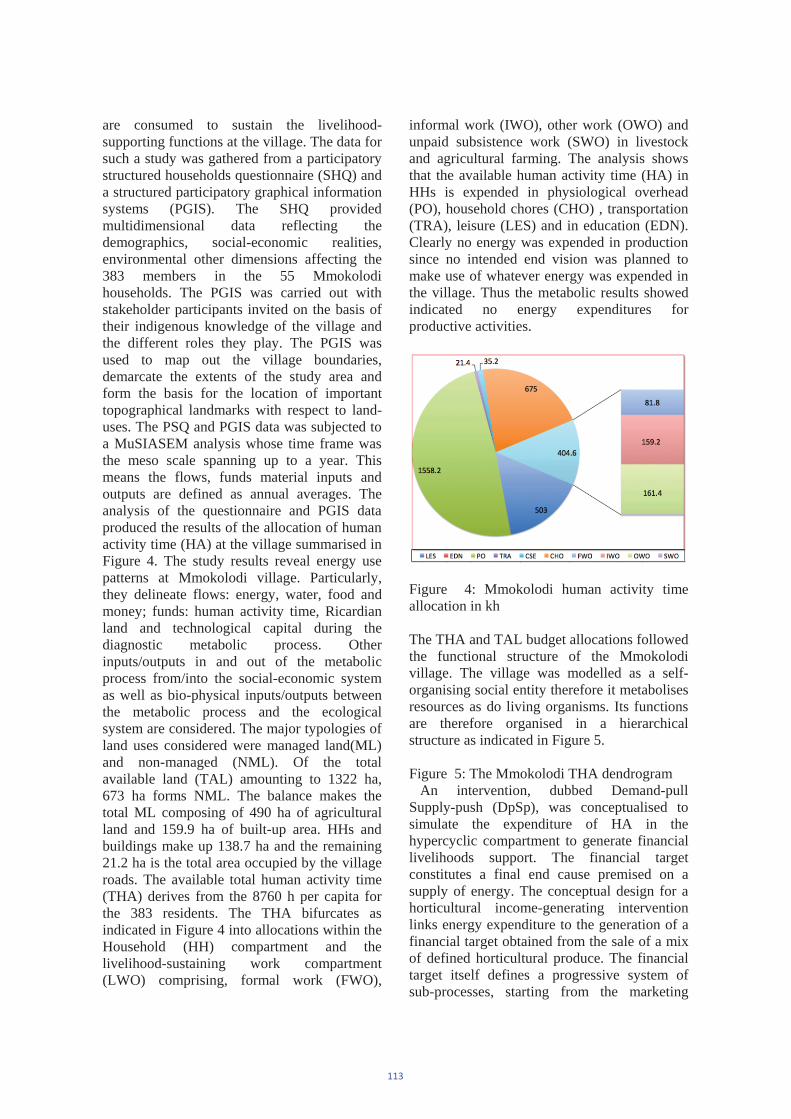
are consumed to sustain the livelihood-supporting functions at the village. The data for such a study was gathered from a participatory structured households questionnaire (SHQ) and a structured participatory graphical information systems (PGIS). The SHQ provided multidimensional data reflecting the demographics, social-economic realities, environmental other dimensions affecting the 383 members in the 55 Mmokolodi households. The PGIS was carried out with stakeholder participants invited on the basis of their indigenous knowledge of the village and the different roles they play. The PGIS was used to map out the village boundaries, demarcate the extents of the study area and form the basis for the location of important topographical landmarks with respect to land-uses. The PSQ and PGIS data was subjected to a MuSIASEM analysis whose time frame was the meso scale spanning up to a year. This means the flows, funds material inputs and outputs are defined as annual averages. The analysis of the questionnaire and PGIS data produced the results of the allocation of human activity time (HA) at the village summarised in Figure 4. The study results reveal energy use patterns at Mmokolodi village. Particularly, they delineate flows: energy, water, food and money; funds: human activity time, Ricardian land and technological capital during the diagnostic metabolic process. Other inputs/outputs in and out of the metabolic process from/into the social-economic system as well as bio-physical inputs/outputs between the metabolic process and the ecological system are considered. The major typologies of land uses considered were managed land(ML) and non-managed (NML). Of the total available land (TAL) amounting to 1322 ha, 673 ha forms NML. The balance makes the total ML composing of 490 ha of agricultural land and 159.9 ha of built-up area. HHs and buildings make up 138.7 ha and the remaining 21.2 ha is the total area occupied by the village roads. The available total human activity time (THA) derives from the 8760 h per capita for the 383 residents. The THA bifurcates as indicated in Figure 4 into allocations within the Household (HH) compartment and the livelihood-sustaining work compartment (LWO) comprising, formal work (FWO),
informal work (IWO), other work (OWO) and unpaid subsistence work (SWO) in livestock and agricultural farming. The analysis shows that the available human activity time (HA) in HHs is expended in physiological overhead (PO), household chores (CHO) , transportation (TRA), leisure (LES) and in education (EDN). Clearly no energy was expended in production since no intended end vision was planned to make use of whatever energy was expended in the village. Thus the metabolic results showed indicated no energy expenditures for productive activities.
Figure 4: Mmokolodi human activity time allocation in kh
The THA and TAL budget allocations followed the functional structure of the Mmokolodi village. The village was modelled as a self-organising social entity therefore it metabolises resources as do living organisms. Its functions are therefore organised in a hierarchical structure as indicated in Figure 5.
Figure 5: The Mmokolodi THA dendrogram An intervention, dubbed Demand-pull Supply-push (DpSp), was conceptualised to simulate the expenditure of HA in the hypercyclic compartment to generate financial livelihoods support. The financial target constitutes a final end cause premised on a supply of energy. The conceptual design for a horticultural income-generating intervention links energy expenditure to the generation of a financial target obtained from the sale of a mix of defined horticultural produce. The financial target itself defines a progressive system of sub-processes, starting from the marketing
113
processor of the horticultural produce, through a number of intermediary processors leading back the penultimate water pumping processor before the last processor in the chain, the energy processor. The energy processor itself composes of a mix of three energy sub-processors namely SPV, wind or diesel. Any combination of a mix of these could be simulated for a given financial target. Each of the processor is characterised by a set of inputs, outputs, funds and flows that must be quantified. In alignment with MuSIASEM’s view of the complexity of the livelihoods-generating functional processes at Mmokolodi, the simulated hierarchical metabolic process at the village required a set of resource inputs from the ecological environment, the catalytic mediation of a set of committed funds and a concomitant sinking of a set of environmental outputs at each scale of the Mmokolodi hierarchical functional structure. The simulated intervention was designed in MATLAB-SIMULINK thus allowing the simultaneous integration of multi-dimensional variable results at multiples scales of the Mmokolodi hierarchy.
4. Results, Analysis and Discussion
The structure indicates the dissipative (HH and FWO) compartment, and the hypercyclic compartment (DPSP intervention) compartment at Mmokolodi. The diagnostic metabolic data indicates that energy uses occur predominantly in the dissipative compartment of the Mmokolodi hierarchical structure. No energy is invested in generating money to support village livelihoods. The results indicate that the total annual earnings from FWO, IWO, OWO and SWO amounted to P443, 520 whereas the total expenditure during the analysis period was P768,780 creating a net annual deficit of P325, 260. Mmokolodi expends more than it generates! The livelihood supporting financial flows are a measure of Mmokolodi’s development. Since no energy expenditures occur in Mmokolodi’s hypercyclic compartment, the diagnostic metabolic pattern cannot be sustainable according to Odum’s maximum power principle. On this basis the diagnostic
metabolic pattern at Mmokolodi is not sustainable. In the short-term it fails to substantiate increased technological capitalisation required by the hypercyclic activities necessary to stabilise productivity for improved MSL in the village. In the long-term, it fails to demonstrate a progressive shift away from livelihoods-sustaining activities towards the consumptive and service activities as the MSL improves as the case is in more developed countries. These results provoked the DpSp intervention. Part of the simulated DpSp data results is indicated in Figure 5. The figure is organised to reflect the hierarchical functional structure of Mmokolodi. Assuming constant energetic metabolic throughputs demanded of of the survivability of self-organising societal entities in accord with Odum’s maximum power principle, the metabolic rate EMRi at any scale i is inversely proportional to the hours of HAi invested at the scale level i, so that Equation 1 is valid.
(1) where EMRDPSP represents the metabolic rate at the hypercyclic compartment, DpSp. For one scenario of the DpSp simulation where the financial target was P72000 per annum, the total energy throughput was 336kWh and the total human activity time was 52.6kh with the resultant energy metabolic rate EMR at the DpSp level being 6.4W. Tracking the metabolic rates and the energy throughputs across the Mmokolodi functional structure produced a scalable energy metabolic pattern At the LWO compartment and village level the energetic metabolic rates were 0.4W and 0.1W respectively. At the selected scales below the DpSp level, for instance the solar PV, the tomato drip-fertigation and the tomato pulp sub processors, the corresponding values were respectively 152.7W, 29.2W and 10.4 W. These values are consistent with the expected metabolic relationships in living organisms: Larger compartments, denoted by their relative allocations of higher HA demonstrating characteristically lower metabolic rates than their counterparts of reduced sizes. The observation is compatible with the Basal Metabolic Rate (BMR) values of living organisms. For instance, a rodent has a much
114
higher BMR than an elephant! Therefore the simulated Mmokolodi metabolic pattern is correctly scalable, at least with respect to the energetic metabolic rates. Similar scaling can be verified for the metabolic densities or intensities. The next characterisation of the metabolic pattern is afforded by the energy throughputs. Taking the analogy of the rodent and an elephant, it is predictable that the elephant with a lower BMR consumes more food than a rodent with a high BMR. These magnitudes of the energy throughput flows at the DpSp intervention level was TET = 336 kWh. At the LWO compartment, the HH compartment and the village level, the values are respectively 5188 kWh, 16409 kWh and 21597 kWh. For the solar PV, the tomato drip-fertigation and the tomato pulp processors the corresponding values are 14 kWh, 73 kWh and 207 kWh. Again these values, consistent with the corresponding sizes of the compartments, are directly related to the expenditures of HA at the respective scale. Having presented the preceding arguments, a critique of the sustainability of the 20kWp SPVP can now be appreciated. Even if the energy derived from the Mmokolodi 20kWp SPVP were to be included in the flows of energy for the diagnostic metabolic case, the conclusions regarding the sustainability of the latter case would still not change. The plant would be supplying the HH (the chief’s residence) and FWO dissipative namely the S&G (the village clinic, the Kgotla) compartments within the Mmokolodi functional structure. Consequently the sustainability of the energy access resulting from the SPV could not be established notwithstanding the addition of an extra 20kWp. Thus the 20kWp SPV cannot be sustainable in its current state of functional use. To be sustainable, energy from the 20kWp SPVP would need to be diverted to some activity, for instance, the afore-mentioned income-generating activity within the Mmokolodi’s hypercyclic compartment (DpSp). That activity must be geared towards the sustenance of a defined identity for the village. The definition of the income-generating activity could be achieved within the VDC. Latter would be part of the hypercyclic compartment of the Mmokolodi
hierarchical structure. This would amount to diverting part of the energy from the 20kWp plant away from pure consumptive activities in the dissipative HH and the S&G compartment to the FWO compartment for use in the productivity within the hypercyclic compartment. Only then could the energy use from the SPV be scalable as was demonstrated by the DpSp.
5. Conclusions
This paper provided background notes for the evaluation of the sustainability of the Mmokolodi 20 kWp SPVP. The sustainability considered Mmokolodi’s short-term ability to deploy increasing levels of technological capitalisation as required by the village’s BEP and Mmokolodi’s long-term ability to a progressively embrace the consumption of goods and services as expressions of sustainable development. The articulation of sustainability was based on the results of a baseline metabolic and a simulated metabolic scenario. The former scenario indicated no sustainability on account of a violation of Odum’s maximum power principle. The latter metabolic scenario was demonstrably sustainable in that it indicated scaled energy throughputs and metabolic rates expected of a self-organising Mmokolodi. The 20 kWp SPVP was arguably not sustainable in its current state until and unless its energy use were directed towards an income-generating activity within Mmokolodi’s hypercyclic compartment. However the paper noted that the sustainability aspired for does not emerge spontaneously of its own accord. The Mmokolodi 20kWp SPVP, like the DpSp intervention, must be catalysed. The initial financial outlay must be present. This could be affirmed by direct Government support. Indeed the intervention could be the basis for supportive energy policy to catalyse the promotion of increased SPV adoption by linking energy use to an identified income-generating activity at a rural village.
References
[1] Kiravu et al. Participatory integrated assessment of energy systems to promote energy access and energy efficiency. 2nd
115
SASEI International Renewable Energy Conference (IREC), Gaborone, Botswana, October 2016.
[2] Adam Wierman. The value of energy consumption. https://rigorandrelevance.wordpress.com/2014/03/27/the-value-of-energy-consumption/, September 2012. Rigorous Systems Research Group (RSRG) blog. Accessed August 2018
[3] Corina Pirlogia. The human development relies on energy. Procedia Economics and Finance, Vol 3, pp. 495-501, 2012.
[4] Kiravu C., S. Emil, L. Magole, A. Jeffrey, C. Mbekomize, E. Matlotse, E. Rakgati, T. Oladiran, T. Tsamaase and F. Ceshin. Mmokolodi solar PV project – demonstrating sustainable renewable energy system design and potential for rural electrification in Botswana. International Conference on Clean Energy for Sustainable Growth in Developing Countries, Palapye, Botswana, October 2015.
[5] Kiravu Cheddi, Lapolagang Magole, Sandra Bukkens, Annah Mandu Jeffrey, François Diaz Maurin and Mario Giampietro. Presentation of the University of Botswana’s New Masters Participatory Integrated Analysis of Energy Systems (MPIES). International Association for Technology and Energy for Sustainable Development (IASTED), Gaborone, October 2016.
[6] Kiravu Cheddi, Lapologang Magole, Sandra Bukkens, Anna Mandu Jeffrey, François Diaz Maurin, and Mario Giampietro. The Metabolic Patterns of Rural Villages: Botswana’s Mmokolodi Case Study. In International Renewable Energy (IREC) Conference. Gaborone, Botswana, 2016.
[7] Kiravu Cheddi, François Diaz Maurin, Mario Giampietro, Alan C. Brent, G.F. Bukkens, Zvayi Chiguvare, Annah Mandu Gasennelwe-Jeffrey, Gideon Gope, Zora
Kovacic, Lapologang Magole, Josephine Kaviti Musango, Ulpiano Ruiz-Rivas Hernando, Suzanne Smit, Antonio Vázquez Barquero and Felipe Yunta Mezquita. Proposing a master’s programme on participatory integrated assessment of energy systems to promote energy access and energy efficiency in Southern Africa. International Journal of Sustainability in Higher Education,,Gaborone, Vol 19(3): 622-641, October 2018.
[8] Modi V., S. MacDade, J. Saghir and D. Lallement. Energy and the Millennium Development Goals: Energy Sector Management Assistance Programme, United Nations Development Programme, UN Millennium Project and World Bank. http://www.unmillenniumproject.org/documents/MP_Low_Res.pdf, 2006. Accessed August 2016
[9] UNDP HDI Infographics. http://www.hdr.undp.org/en/content/hdi-infographic, October 2016. Accessed August 2018
[9] United Nations. Sustainable Development http://www.un.org/sustainabledevelopment/, Accessed August 2016
116
Study of Damage Evolution in Compressor Turbine (CT) Blades of Short- Haul Aircraft Fleet under Thermo-Mechanical StressesJoshua K. Ngoreta,b and Venkata P. Kommulaa
aDepartment of Mechanical Engineering, University of Botswana, Private Bag 0061, Gaborone.
bDepartment of Mechanical Engineering, Jomo Kenyatta University of Agriculture and Technology, 62000-00200, Nairobi, Kenya.
Email:[email protected]
Abstract
The role played by short-haul aircrafts is critical in air transport network. With service missions of approximately 3 hours ordistances not exceeding 2000 km, the compressor turbine (CT) blades of their engines experience intense cyclic thermo- mechanicalstresses from short but high flight turnovers, changes in power settings, starts and stops, in adherence to the engine’s preset operation limits, overexploitation and not sticking to preset flight environments.Thermo-mechanical stresses implacably account for the greatest degradation of CT blades. From continual exposure to this severe operational environment, the CT blades often catastrophically fail without warning. This study, therefore, investigates thermo-mechanical damage evolution a typical high pressure (HP), PT6A-114Aengine CT blade. An assimilative investigating approach was adopted. The CT blade was modeled for the evolution of thermo-mechanical stresses in an environment that mimics the operational conditions using commercial ANSYS tools in the transient regime. A detailedmicrostructural and metallographic characterization was then performed using energy dispersive spectroscopy-scanning electron microscopy (EDS-SEM) on the substrate material. Finally, mechanical testing for residual micro hardness and equivalent yield strength executed. The modeling results revealed that the CT blade experienced greater deterioration at the tip and lesser on the airfoil and least on the base. In agreement with the modeling results, the EDS-SEM results established that the substrate material had degraded from the effect of creep and fatigue with greatest damage on the tips, lesser on the airfoils and least at the bases. The experimental microhardness values for the transverse sections had fallen by 28.5%, 23% and 20.5% at the tips, airfoil, and base respectively and 25.1%, 22.6% and 20% for longitudinal section relative to the typical hardness values of HV 440 for Ni-base superalloy CT blades before exposure to service.
Keywords: Compressor Turbine, equivalent yield strength, microstructure, modeling.
1. IntroductionThe CT assembly appearing in Fig. 1.1 [1] is a turbo- machine that revolves a rotor carrying with it a compressoron the same shaft. It constitutes of CT blades that rotate along with the shaft and vanes which are stationery in alternating rows [2]. A CT blade in Fig. 1.2 [3] is specially profiled aerodynamic turbine component capable of reactively or impulsively extracting energy from high-temperature, high- pressure gases leaving the combustors as they impinge and rotate it. The number of CT blades on an assembly vary from engine to another, with a typical PT6A-114A engine having 58 HP ones.
Figure 1.1: CT assembly
Polycrystalline Inconel 713LC, Ni-base super alloy, whose composition is captured in Table 1.1
was used for manufacture of CT blades in this study. The turbine is the power harness of an engine and its failure could spell unwarned engine outage. Unfortunately, failure of CT blades account for 42% of all gas turbine outages [5, 6]. Therefore, understanding evolution of damage as a result of thermo-mechanical stresses is vital in order to uphold their health status in operation.
117
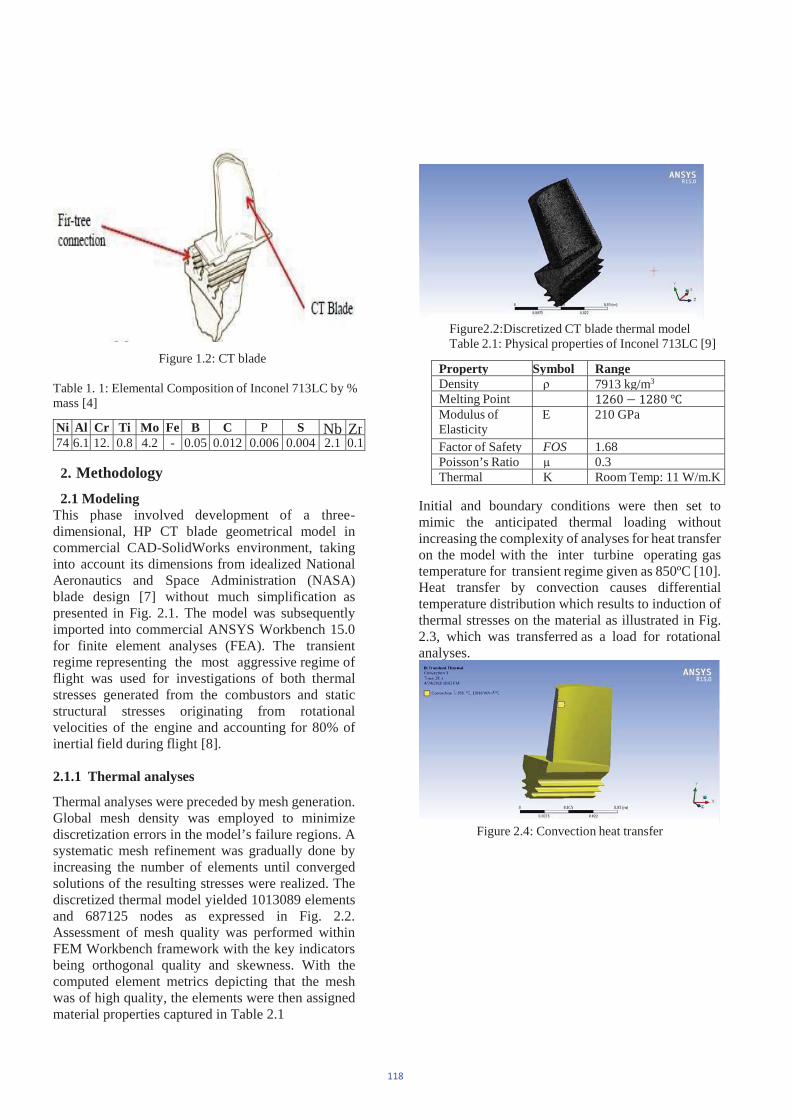
Figure 1.2: CT blade
Table 1. 1: Elemental Composition of Inconel 713LC by % mass [4]
Ni Al Cr Ti Mo Fe B C P S Nb Zr74 6.1 12. 0.8 4.2 - 0.05 0.012 0.006 0.004 2.1 0.1
2. Methodology2.1 Modeling
This phase involved development of a three- dimensional, HP CT blade geometrical model in commercial CAD-SolidWorks environment, taking into account its dimensions from idealized National Aeronautics and Space Administration (NASA) blade design [7] without much simplification as presented in Fig. 2.1. The model was subsequently imported into commercial ANSYS Workbench 15.0 for finite element analyses (FEA). The transient regime representing the most aggressive regime of flight was used for investigations of both thermal stresses generated from the combustors and static structural stresses originating from rotational velocities of the engine and accounting for 80% of inertial field during flight [8].
2.1.1 Thermal analyses
Thermal analyses were preceded by mesh generation. Global mesh density was employed to minimize discretization errors in the model’s failure regions. A systematic mesh refinement was gradually done by increasing the number of elements until converged solutions of the resulting stresses were realized. The discretized thermal model yielded 1013089 elements and 687125 nodes as expressed in Fig. 2.2. Assessment of mesh quality was performed within FEM Workbench framework with the key indicators being orthogonal quality and skewness. With the computed element metrics depicting that the mesh was of high quality, the elements were then assigned material properties captured in Table 2.1
Figure2.2:Discretized CT blade thermal model Table 2.1: Physical properties of Inconel 713LC [9]
Property Symbol RangeDensity 7913 kg/m3
Melting PointModulus of Elasticity
E 210 GPa
Factor of Safety FOS 1.68Poisson’s Ratio 0.3Thermal K Room Temp: 11 W/m.K
Initial and boundary conditions were then set to mimic the anticipated thermal loading without increasing the complexity of analyses for heat transfer on the model with the inter turbine operating gas temperature for transient regime given as 850ºC [10]. Heat transfer by convection causes differential temperature distribution which results to induction of thermal stresses on the material as illustrated in Fig. 2.3, which was transferred as a load for rotational analyses.
Figure 2.4: Convection heat transfer
118

2.1.2 Rotational Analyses
Similar to the thermal analyses, meshing was redone for rotational analyses, yielding 952942 elements and 1407817 nodes. The parametric mesh quality was assessed with the computed element metrics depicted that the mesh was of high quality. The root of the blade was constrained in the axial direction with a fixed support to keep it in direction of rotation as depicted in Fig. 2.4.
Figure 2.4: Fixed support prior to application of rotational load
The magnitude of rotational velocity given for transient regime is 1047.2 rads/sec [10] which was applied in the axial (x-direction) and acting parallel to the rotation of the shaft as indicated in Fig. 2.5. prior to damage initialization.
Figure 2.5: Application of rotational velocity
2.2 Microstructure and Metallurgical Characterization
The PT6A-114A engine, HP, CT blades in this study, and as presented in Fig. 2.6 were collected from Vector Aerospace Kenya Limited after premature retire from service at 6378 creep-fatigue hours
contrary to a preset 10000 creep-fatigue hours.
Figure 2.6: Sample Specimen
The specimens were cleaned and marked both transversely and longitudinally as depicted in Fig. 2.7 (a) and (b) respectively.
Figure 2.7: Marked samples for sectioning (a) Transverse (b) Longitudinal
In conformity to ASTM E3-11; sectioning, mounting, grinding, polishing and carbon coating were carried out. The sectioning’s were carried out at intervals of 33.3%, 66.7% n 83.3% from the root of the CT blades whose lengths are 36 mm go give a fair representation of the base airfoil and tip sections. Figs. 2.8 and 2.9 illustrate the final prepared samples ready for micrography.
119
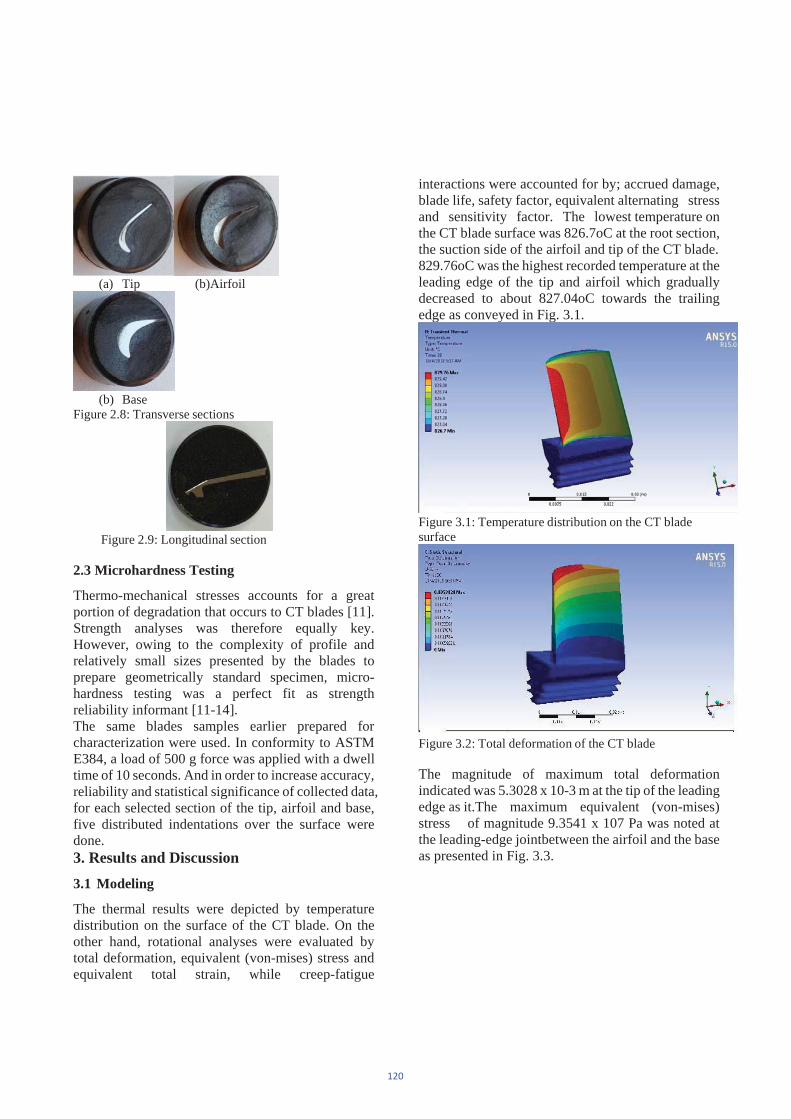
(a) Tip (b)Airfoil
(b) Base Figure 2.8: Transverse sections
Figure 2.9: Longitudinal section
2.3 Microhardness Testing
Thermo-mechanical stresses accounts for a great portion of degradation that occurs to CT blades [11]. Strength analyses was therefore equally key. However, owing to the complexity of profile and relatively small sizes presented by the blades to prepare geometrically standard specimen, micro-hardness testing was a perfect fit as strength reliability informant [11-14]. The same blades samples earlier prepared for characterization were used. In conformity to ASTM E384, a load of 500 g force was applied with a dwell time of 10 seconds. And in order to increase accuracy, reliability and statistical significance of collected data, for each selected section of the tip, airfoil and base, five distributed indentations over the surface were done. 3. Results and Discussion3.1 Modeling
The thermal results were depicted by temperature distribution on the surface of the CT blade. On the other hand, rotational analyses were evaluated by total deformation, equivalent (von-mises) stress and equivalent total strain, while creep-fatigue
interactions were accounted for by; accrued damage, blade life, safety factor, equivalent alternating stress and sensitivity factor. The lowest temperature on the CT blade surface was 826.7oC at the root section, the suction side of the airfoil and tip of the CT blade. 829.76oC was the highest recorded temperature at the leading edge of the tip and airfoil which gradually decreased to about 827.04oC towards the trailing edge as conveyed in Fig. 3.1.
Figure 3.1: Temperature distribution on the CT blade surface
Figure 3.2: Total deformation of the CT blade
The magnitude of maximum total deformation indicated was 5.3028 x 10⁻³ m at the tip of the leading edge as it.The maximum equivalent (von-mises) stress of magnitude 9.3541 x 10⁷ Pa was noted at the leading-edge jointbetween the airfoil and the base as presented in Fig. 3.3.
120

Figure 3.3: Equivalent (von-mises) stress on CT blade
The entire root and the rest of the blade were relatively unaffected by these stresses.
Figure 3.4: Equivalent elastic strain on the CT blade
Equivalent elastic strain changed in similar fashion to match the von-misses stress with a maximum of 0.50453 m/m recorded at the leading-edge joint of the airfoil and the base denoted in Fig. 3.4
Figure 3.5:Accrued damage on the CT blade
Maximum damage of magnitude 1.5456 x 10⁵ was observed at the leading-edge joint between the airfoil and the base as indicated in Fig. 3.5, with the rest of the blade unaffected. Creep-fatigue life depicted in
Fig. 3.6 indicated that the CT blade could have served for a minimum of 6470.1 creep- fatigue hours at most life threatened region; the leading-edge joint between the airfoil and the base, while the entire blade could serve much a longer period.
Figure 3.6. CT blade life
3.2 Microstructure and Metallurgical Characterization
3.2.1 The TipThe tip section had cracks originating from the protective coating and finding their way to the substrate material. Pores were evident and needles had developed as they appear in Fig. 3.7.
Fig 3.7: Sectioned tip Selected areas 4, 5 and 6 as shown in Fig. 3.8 were chosen for EDS analyses.
121
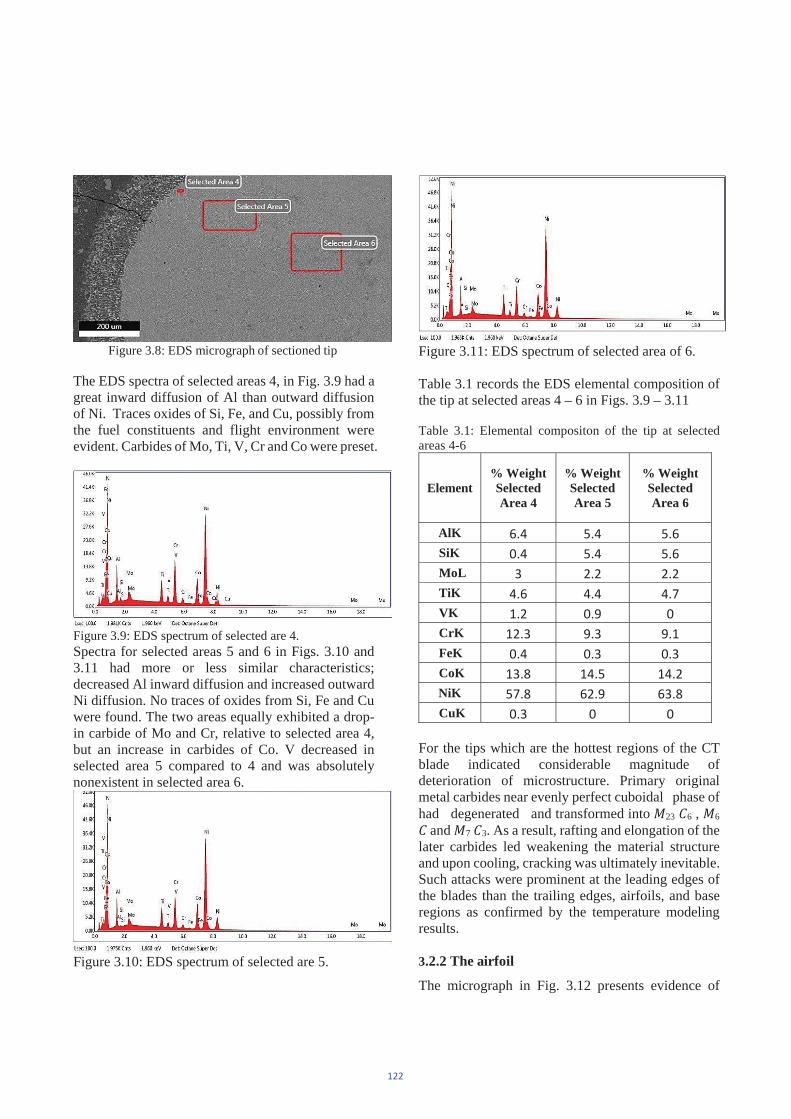
Figure 3.8: EDS micrograph of sectioned tip
The EDS spectra of selected areas 4, in Fig. 3.9 had a great inward diffusion of Al than outward diffusion of Ni. Traces oxides of Si, Fe, and Cu, possibly from the fuel constituents and flight environment were evident. Carbides of Mo, Ti, V, Cr and Co were preset.
Figure 3.9: EDS spectrum of selected are 4. Spectra for selected areas 5 and 6 in Figs. 3.10 and 3.11 had more or less similar characteristics; decreased Al inward diffusion and increased outward Ni diffusion. No traces of oxides from Si, Fe and Cu were found. The two areas equally exhibited a drop-in carbide of Mo and Cr, relative to selected area 4, but an increase in carbides of Co. V decreased in selected area 5 compared to 4 and was absolutely nonexistent in selected area 6.
Figure 3.10: EDS spectrum of selected are 5.
Figure 3.11: EDS spectrum of selected area of 6.
Table 3.1 records the EDS elemental composition of the tip at selected areas 4 – 6 in Figs. 3.9 – 3.11
Table 3.1: Elemental compositon of the tip at selected areas 4-6
Element % Weight SelectedArea 4
% Weight SelectedArea 5
% Weight SelectedArea 6
AlK 6.4 5.4 5.6SiK 0.4 5.4 5.6MoL 3 2.2 2.2TiK 4.6 4.4 4.7VK 1.2 0.9 0CrK 12.3 9.3 9.1FeK 0.4 0.3 0.3CoK 13.8 14.5 14.2NiK 57.8 62.9 63.8CuK 0.3 0 0
For the tips which are the hottest regions of the CT blade indicated considerable magnitude of deterioration of microstructure. Primary original metal carbides near evenly perfect cuboidal phase of had degenerated and transformed into 23 6 , 6
and 7 3. As a result, rafting and elongation of the later carbides led weakening the material structure and upon cooling, cracking was ultimately inevitable. Such attacks were prominent at the leading edges of the blades than the trailing edges, airfoils, and base regions as confirmed by the temperature modeling results.
3.2.2 The airfoil
The micrograph in Fig. 3.12 presents evidence of
122
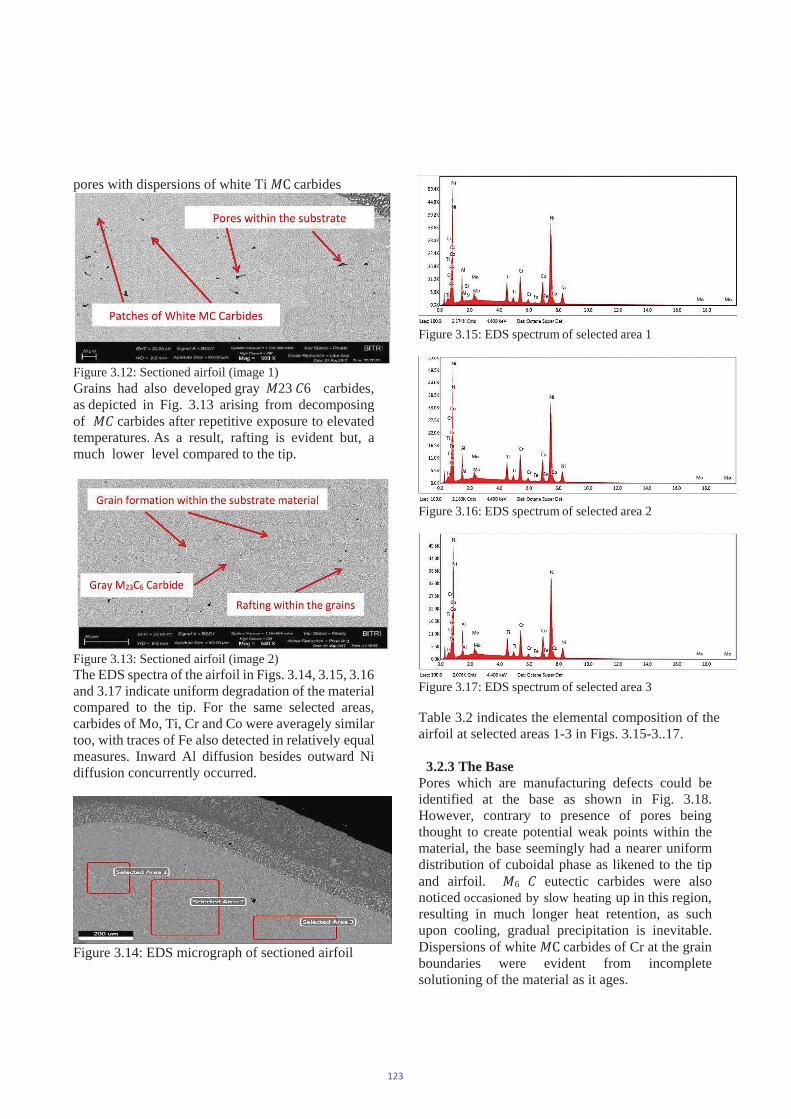
pores with dispersions of white Ti carbides
Figure 3.12: Sectioned airfoil (image 1) Grains had also developed gray 23 6 carbides, as depicted in Fig. 3.13 arising from decomposing of carbides after repetitive exposure to elevated temperatures. As a result, rafting is evident but, a much lower level compared to the tip.
Figure 3.13: Sectioned airfoil (image 2) The EDS spectra of the airfoil in Figs. 3.14, 3.15, 3.16 and 3.17 indicate uniform degradation of the material compared to the tip. For the same selected areas, carbides of Mo, Ti, Cr and Co were averagely similar too, with traces of Fe also detected in relatively equal measures. Inward Al diffusion besides outward Ni diffusion concurrently occurred.
Figure 3.14: EDS micrograph of sectioned airfoil
Figure 3.15: EDS spectrum of selected area 1
Figure 3.16: EDS spectrum of selected area 2
Figure 3.17: EDS spectrum of selected area 3
Table 3.2 indicates the elemental composition of the airfoil at selected areas 1-3 in Figs. 3.15-3..17.
3.2.3 The BasePores which are manufacturing defects could be identified at the base as shown in Fig. 3.18. However, contrary to presence of pores being thought to create potential weak points within the material, the base seemingly had a nearer uniform distribution of cuboidal phase as likened to the tip and airfoil. 6 eutectic carbides were also noticed occasioned by slow heating up in this region, resulting in much longer heat retention, as such upon cooling, gradual precipitation is inevitable. Dispersions of white carbides of Cr at the grain boundaries were evident from incomplete solutioning of the material as it ages.
123
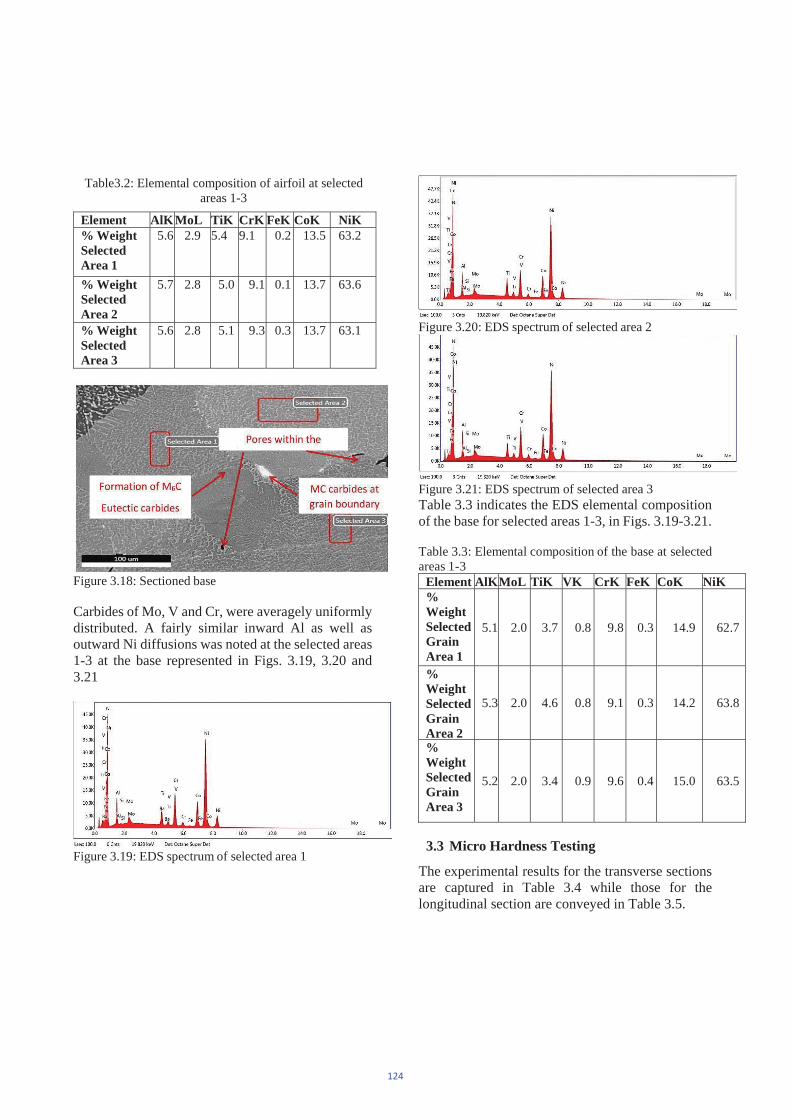
Table3.2: Elemental composition of airfoil at selected areas 1-3
Figure 3.18: Sectioned base
Carbides of Mo, V and Cr, were averagely uniformly distributed. A fairly similar inward Al as well as outward Ni diffusions was noted at the selected areas 1-3 at the base represented in Figs. 3.19, 3.20 and 3.21
Figure 3.19: EDS spectrum of selected area 1
Figure 3.20: EDS spectrum of selected area 2
Figure 3.21: EDS spectrum of selected area 3 Table 3.3 indicates the EDS elemental composition of the base for selected areas 1-3, in Figs. 3.19-3.21.
Table 3.3: Elemental composition of the base at selected areas 1-3
Element AlKMoL TiK VK CrK FeK CoK NiK%Weight Selected Grain Area 1
5.1 2.0 3.7 0.8 9.8 0.3 14.9 62.7
%Weight Selected Grain Area 2
5.3 2.0 4.6 0.8 9.1 0.3 14.2 63.8
%Weight Selected Grain Area 3
5.2 2.0 3.4 0.9 9.6 0.4 15.0 63.5
3.3 Micro Hardness Testing
The experimental results for the transverse sections are captured in Table 3.4 while those for the longitudinal section are conveyed in Table 3.5.
Element AlK MoL TiK CrK FeK CoK NiK% Weight Selected Area 1
5.6 2.9 5.4 9.1 0.2 13.5 63.2
% Weight Selected Area 2
5.7 2.8 5.0 9.1 0.1 13.7 63.6
% Weight Selected Area 3
5.6 2.8 5.1 9.3 0.3 13.7 63.1
124
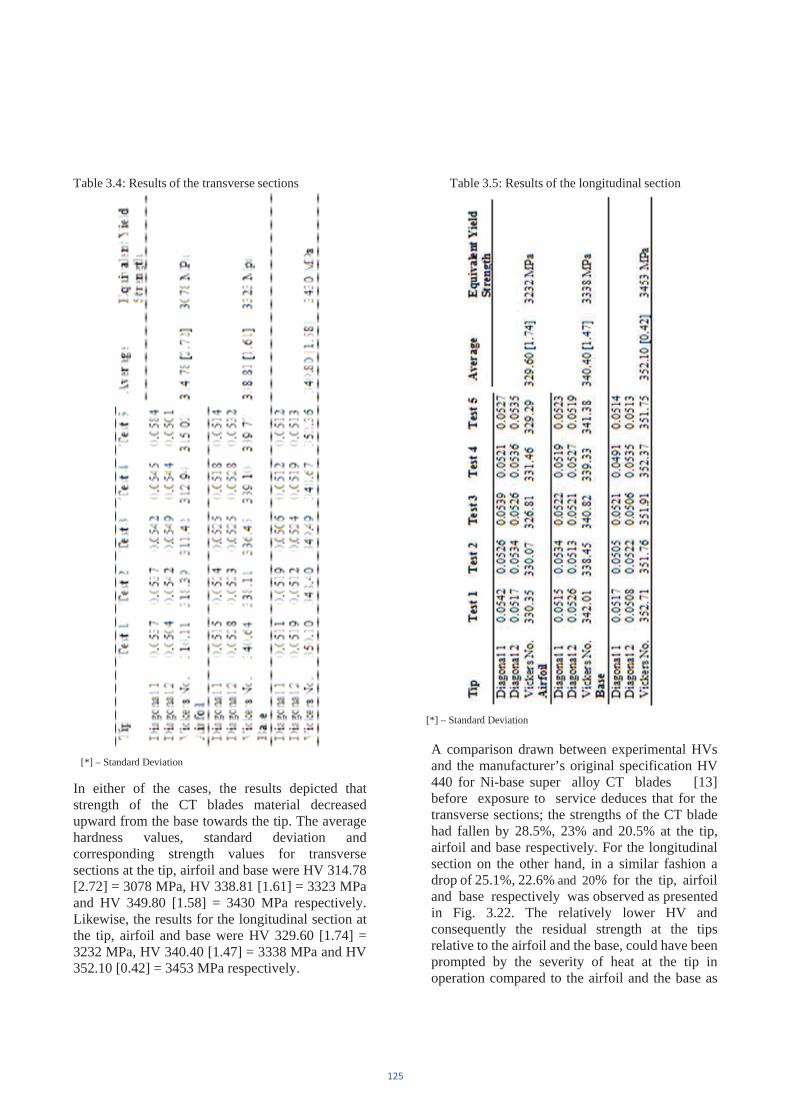
Table 3.4: Results of the transverse sections
[*] – Standard Deviation
In either of the cases, the results depicted that strength of the CT blades material decreased upward from the base towards the tip. The average hardness values, standard deviation and corresponding strength values for transverse sections at the tip, airfoil and base were HV 314.78 [2.72] = 3078 MPa, HV 338.81 [1.61] = 3323 MPa and HV 349.80 [1.58] = 3430 MPa respectively. Likewise, the results for the longitudinal section at the tip, airfoil and base were HV 329.60 [1.74] = 3232 MPa, HV 340.40 [1.47] = 3338 MPa and HV 352.10 [0.42] = 3453 MPa respectively.
Table 3.5: Results of the longitudinal section
[*] – Standard Deviation
A comparison drawn between experimental HVs and the manufacturer’s original specification HV 440 for Ni-base super alloy CT blades [13] before exposure to service deduces that for the transverse sections; the strengths of the CT blade had fallen by 28.5%, 23% and 20.5% at the tip, airfoil and base respectively. For the longitudinal section on the other hand, in a similar fashion a drop of 25.1%, 22.6% and 20% for the tip, airfoil and base respectively was observed as presented in Fig. 3.22. The relatively lower HV and consequently the residual strength at the tips relative to the airfoil and the base, could have been prompted by the severity of heat at the tip in operation compared to the airfoil and the base as
125
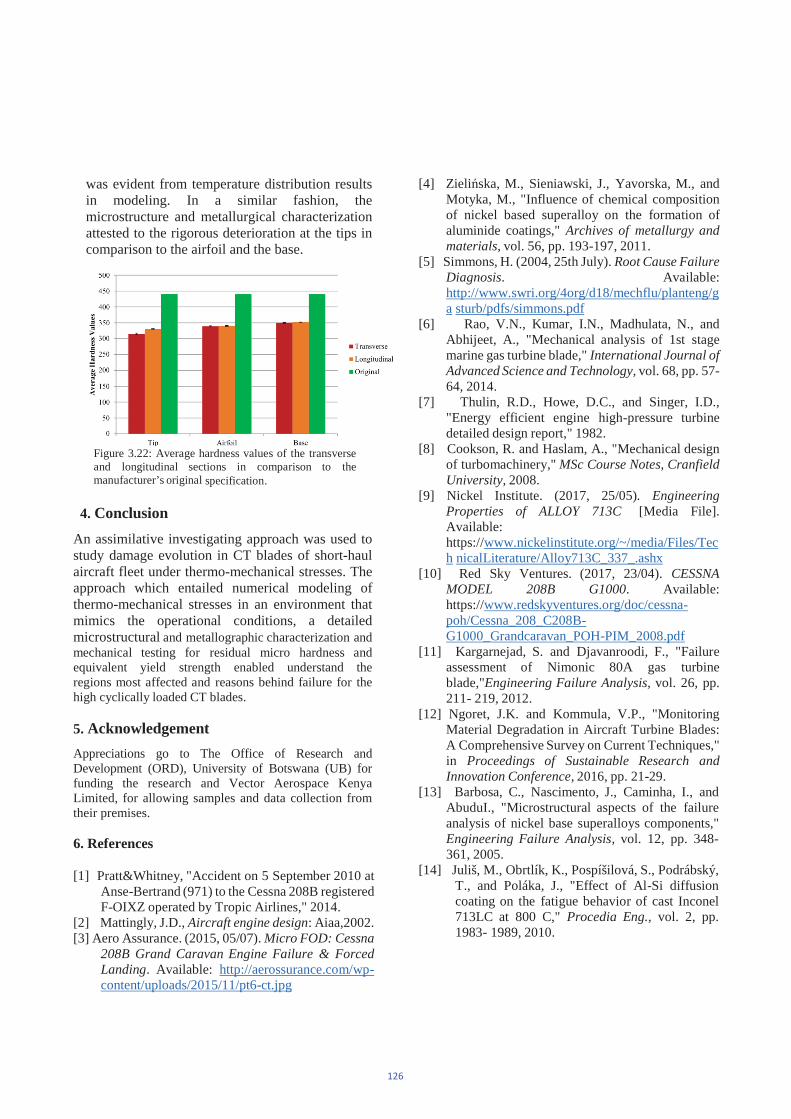
was evident from temperature distribution results in modeling. In a similar fashion, the microstructure and metallurgical characterization attested to the rigorous deterioration at the tips in comparison to the airfoil and the base.
Figure 3.22: Average hardness values of the transverse and longitudinal sections in comparison to the manufacturer’s original specification.
4. ConclusionAn assimilative investigating approach was used to study damage evolution in CT blades of short-haul aircraft fleet under thermo-mechanical stresses. The approach which entailed numerical modeling of thermo-mechanical stresses in an environment that mimics the operational conditions, a detailed microstructural and metallographic characterization and mechanical testing for residual micro hardness and equivalent yield strength enabled understand the regions most affected and reasons behind failure for the high cyclically loaded CT blades.
5. AcknowledgementAppreciations go to The Office of Research and Development (ORD), University of Botswana (UB) for funding the research and Vector Aerospace Kenya Limited, for allowing samples and data collection from their premises.
6. References
[1] Pratt&Whitney, "Accident on 5 September 2010 at Anse-Bertrand (971) to the Cessna 208B registered F-OIXZ operated by Tropic Airlines," 2014.
[2] Mattingly, J.D., Aircraft engine design: Aiaa,2002. [3] Aero Assurance. (2015, 05/07). Micro FOD: Cessna
208B Grand Caravan Engine Failure & Forced Landing. Available: http://aerossurance.com/wp- content/uploads/2015/11/pt6-ct.jpg
[4] Zieli ska, M., Sieniawski, J., Yavorska, M., and Motyka, M., "Influence of chemical composition of nickel based superalloy on the formation of aluminide coatings," Archives of metallurgy and materials, vol. 56, pp. 193-197, 2011.
[5] Simmons, H. (2004, 25th July). Root Cause FailureDiagnosis. Available: http://www.swri.org/4org/d18/mechflu/planteng/ga sturb/pdfs/simmons.pdf
[6] Rao, V.N., Kumar, I.N., Madhulata, N., and Abhijeet, A., "Mechanical analysis of 1st stage marine gas turbine blade," International Journal of Advanced Science and Technology, vol. 68, pp. 57-64, 2014.
[7] Thulin, R.D., Howe, D.C., and Singer, I.D., "Energy efficient engine high-pressure turbine detailed design report," 1982.
[8] Cookson, R. and Haslam, A., "Mechanical design of turbomachinery," MSc Course Notes, Cranfield University, 2008.
[9] Nickel Institute. (2017, 25/05). Engineering Properties of ALLOY 713C [Media File]. Available: https://www.nickelinstitute.org/~/media/Files/Tech nicalLiterature/Alloy713C_337_.ashx
[10] Red Sky Ventures. (2017, 23/04). CESSNA MODEL 208B G1000. Available: https://www.redskyventures.org/doc/cessna- poh/Cessna_208_C208B- G1000_Grandcaravan_POH-PIM_2008.pdf
[11] Kargarnejad, S. and Djavanroodi, F., "Failure assessment of Nimonic 80A gas turbine blade,"Engineering Failure Analysis, vol. 26, pp. 211- 219, 2012.
[12] Ngoret, J.K. and Kommula, V.P., "Monitoring Material Degradation in Aircraft Turbine Blades: A Comprehensive Survey on Current Techniques," in Proceedings of Sustainable Research and Innovation Conference, 2016, pp. 21-29.
[13] Barbosa, C., Nascimento, J., Caminha, I., and AbuduI., "Microstructural aspects of the failure analysis of nickel base superalloys components," Engineering Failure Analysis, vol. 12, pp. 348- 361, 2005.
[14] Juliš, M., Obrtlík, K., Pospíšilová, S., Podrábský, T., and Poláka, J., "Effect of Al-Si diffusion coating on the fatigue behavior of cast Inconel 713LC at 800 C," Procedia Eng., vol. 2, pp. 1983- 1989, 2010.
126

MODELING PROPERTY VALUES USING MULTIPLE REGRESSION ANALYSIS
Johnson Kampambaa* , Alloysius C. Moshab and Aderemi Yankeen Adeyemic
a,b University of Botswana, Department of Architecture and Planningc University of Botswana, Department of Civil Engineering
Email: [email protected]
Abstract
Property tax determination has always dependent on a tax base, which is currently done manually in some parts of the continent, Botswana included. Developed countries have created automated valuation models to assist in property valuation such as computer aided mass appraisal (CAMA) systems. However, such systems are expensive to implement, operate and have a high failure rate. It was also noted that most studies have been conducted in automating the production of valuation rolls but none of the studies have designed a cost effective model that can be used to value property for rating purposes. Countries have tried to improve the delivery of valuation rolls but the challenge has been the use of individual propertytraditional assessment methods of valuation which are time consuming and costly. This study s aim was to design a cost effective valuation model that will help in determining rateable values using multiple regression analysis with a view of reducing the costs of producing valuation rolls in developed and developing countries. The data that was used in the modelwas obtained from registered property sales at Deeds Registry Office in Gaborone and building attribute data was obtainedfrom Google Earth. The property value was determined using the building and land areas, type of boundary, previous rateable value and time the property was sold as independent variables. A coefficient of determination (r2) 78% wasnoted from the model in which building and land areas were significant in determining the rateable value. This modelcan be a sustainable solution to the challenges that are being faced in determining rateable values using traditional valuationmethod as well as where CAMA has failed, as it is faster, accurate and cost effective. Once tested for validity, reliability and accuracy, the COD (7%) and PRD (1.03) tests were within the acceptable range, meaning it can be used for appraisingrateable properties. The contribution to knowledge is through the application of the model using Google earth and MRA to value property in a cost effective way.
Keywords: Mass appraisal, Multiple regression analysis, Property tax, Property values, Rating valuation, Tax base, Traditional valuation method,
1. Introduction and background ofstudy
Most countries (Northern Ireland, USA,Sweden, Australia, Korea, China, South Africaand Tanzania) have transformed their propertyassessment for rating purposes from individualproperty assessment to mass appraisal using automated techniques such as MRA, ANN,Expert systems, GWR/GAWR [1], [2], [3],[4], [5], [6]. Mass appraisal is the quickestway of appraising a large group of propertiesfor rating purposes and has been defined asthe process of preparing assessments for a
group of properties using a given date by applying standardized method, common dataand allowing for statistical testing [7], [8],[9], [3]. However, in Botswana the propertyrating assessment in towns and cities is stilldone using the mannual individual assessment method which is costly and time consuming [10]. The benefits of automating the propertyrating assessment has been a high yield of thetax, promotion of uniformity and fairness/equity across group of properties in
different neighbourhoods [11], [12] and a higher contribution to GDP [13].
In Botswana the property rating practice isregulated by the Townships Act and itsRegulations Cap 40.02 of the Laws ofBotswana [14]. It stipulates that a revaluationcan be done every after five years and asupplementary valuation after one year using the open market value as the basis forvaluation. In Gaborone, the last revaluationwas done in 2008 and the valuation roll was implemented in 2012. There has never been a supplementary valuation roll to cater for newdevelopments, changes and properties thatwere left out. The revaluation was likely to bedue in 2013 and is nowhere closer to be done.This has consequences on the revenue sustainability of the council as moreresponsibilities and needs are cropping up. Even for those properties that were done in 2008, the average estimated cost per propertywas P400.00 for a city with an approximate of 70,000 properties as at 2008 leading to a budgeted cost P29,900,000.00. This figure wasabove the international average figure for
127
property valuation for rating purposes [13], [3]despite having the infrastructure for anautomated valuation.
Botswana government has tried to support theproduction of valuation rolls for councils by funding the projects and having the privatesector valuation companies to implement it asthere have been no manpower within thegovernment setup to undertake valuation oflate. Despite the support by the government,the valuation takes time, costly and the qualityis not as good as the one that has been done by government valuers. Most nations have moved from individual property assessment method toautomated mass appraisal which is cheaperthan the manual individual assessment method. It has also been noted that from thestudies [15], [16], [17], [18], [19], [6], [20],[21], [22], [23], [24], [25], [26], [27] that havebeen reviewed, none of them has ever thought of utilising an open access software likeGoogle Earth for computation of building floor areas in an effort to simplify the
computer assisted mass appraisal (CAMA) inplace of GIS. Despite having automated theirvaluation assessment it is still expensive toimplement and has a higher failure rate [28].This study explored the possibility of utilizing Google Earth in extracting building attributedata as an economical and sustainable way of minimizing costs and speeding up theproduction of valuation rolls using multipleregression analysis (MRA).
The research question was, how does a costeffective model help developing countries inproducing valuation rolls in a faster way? The hypothesis was a cost effective model wouldbe designed and developed taking into accountcost implications and sustainability in orderfor the property tax system to be efficient,effective and fair This paper is part of thePhD project that is currently being undertaken by the author. The title of the main project is
evaluation of rating valuation practicesand administration in Gaborone, Botswan
2. Literature review of related studies
Previous studies on the subject of massappraisal (MA), computer assisted massappraisal (CAMA) and different appraisalmodels that have been used are discussed and reviewed below. The purpose of the review isto appreciate the current level of body of
knowledge and note what has not been done, so that it can be explored using techniques thatcan lead to new knowledge generation in formof contribution. A number of studies havebeen carried out and details of their works arenoted in Table 1 below:
Table 1: Previous studidies on mass appraisal, CAMA, MRA &ANN Details of study Authors of the study Results
Regression vs non-regression models [15] Non regression performed better thanregression models
Possibility of implementing mass appraisalsystem
[29], [33], [35], [4],[38], [40], [41], [43],[3], [45], [46], [32].
Mass appraisal was recommended as it wascheaper and faster than the traditional method ofvaluation.
Rough set theory (RST) vs multipleregression analysis (MRA) An appraisal of multiple regression analysis(MRA) in geographic information systems(GIS) toolsGeographic weighted regression (GWR) vs multiple regression analysis (MRA) The possibility of using MRA to decompose the capital value
[16] Both models produced similar results, however rough set theory was recommended.
[37], [5] It was established that a model can be developedusing MRA and GIS.
[17], [25], [31] Both models yielded good results but GWR performed better than MRA.
[39] It was found out that MRA could be used todecompose the predicted value
GWR vs spatial lag model (SLM) models [18] SLM performed better than GWR using the coefficient of dispersion (COD).
Artificial neural networks (ANN) vsmultiple regression analysis (MRA)
[6], [20], [19], [21],[23], [44].
Non-linear regression models performed betterANN models, however some studies found thatANN produced better results and were found tobe easier to use whilst others established thatMRA models were better than ANN models.
Multiple regression analysis (MRA) vscluster analaysis (CA)
[22] MRA performed better than cluster analysis
128
MRA cost vs MRA sales models [36] MRA sales performed better than MRA cost based models
Source: Various Authors
A critical review of the previous relatedstudies on real estate mass appraisal revealed anumber of issues. It is clear that most studies[15], [16], [17], [18], [19], [6], [20], [21], [22],[23], [24], [25], [26], [27] have beenundertaken to compare the performance ofeither MRA or ANN and or GWR/GAWRthough none of these studies have ever thoght of exploring the use of open accessgeographical data from Google Earth in placeof GIS. It was also noted that ANN had betterperformance capabilities but lacked understanding by the common man thus making it difficult to defend the valuation [6]and that ANN still retains the black box architecture that limits their usefulness to thevaluers community [19], [6], [21] thougheasier to perform could act as an alternativemethod to MRA [20] . GWR have beenrecommended as alternative spatial models toMRA but however have limitations to somejurisdictions that might not have the spatialdata online [27], [25]. It has been noted thatmuch as the models have been compared andtested, most authors [26], [17], [18], [19], [6],[21], [22], [23] still propose that the ANNthough yielded desired results could be used asan alternative to MRA and so was the GWR [27], [25].
It was also noted that other studies that werecarried out looked at the proposal to introduceMRA for property mass appraisal in theirrespective regions [29], [30], [2], [33], [34],[36], [4],[38], [37], [5], [1], [46]. It is alsonoted that only two studies were undertaken toevaluate the equity principles of the assessedvalues against market related sale prices of theproperties [12], [10]. The other study that wascarried out was trying to find out thepossibility of decomposing the assessed value into land and building values respectively[39].
It is clear from the above studies that none ofthese studies have explored the possibility of adopting MRA model using MS Excel and Google Earth for extraction of building atrribute data. Authors such as [19], [6] haveexpressed dissatisfaction on the use of ANNand GWR models as they are expensive and
difficult to implement. This study looked at the possibility of adopting MRA model using MS Excel and Google Earth for building attribute data which is a free open sourcesoftware accessible worldwide by anyone. This would work in the similar way as the GISenvironment though expensive to acquire butthe Google Earth environment comes in as an alternative to GIS applications as an free open access software.
3. Research Design and MethodologyIt is clear from the literature that was reviewed that for property sales data, one needs an organized database where property sales arerecorded and kept in order for the salescomparison method to work well. InBotswana, the Deeds Registry Office is thecustodian of all property transfers and has itsoffices in Gaborone and Francistown. For thepurposes of developing and testing the MRA model, the Botswana Gaborone manual property sales data for the year 2014 to 2016 were used which were obtained from the transfer registers. The total population ofproperty sales was 7,400 properties and these were cleaned by taking out non-market related sales such as sales between relatives/friends,government/council/BHC sales, as they did not meet the requirements of the open market definition [7], [9], [8]. A sample of 380 properties was used to design the model at 95% confidence level with a margin error of 5% and another set was used to test the modelfor validity and accuracy. (NB: formula forsample size using Slovin s formula is n=N/(1+(Nxe2) where n= sample size; N = population; and e = level of significance ormargin of error. The minimum required sample size was 380 properties according to this formula however, since MRA is a datahungry model this study decided to useholdout sample sizes of 400 for low costmodel, 492 for medium cost model and 486for high cost model.
The model equation that was used is additivemultiple regression analysis encompassing thedependent and independent variables. Themodel equation was as follows:
129
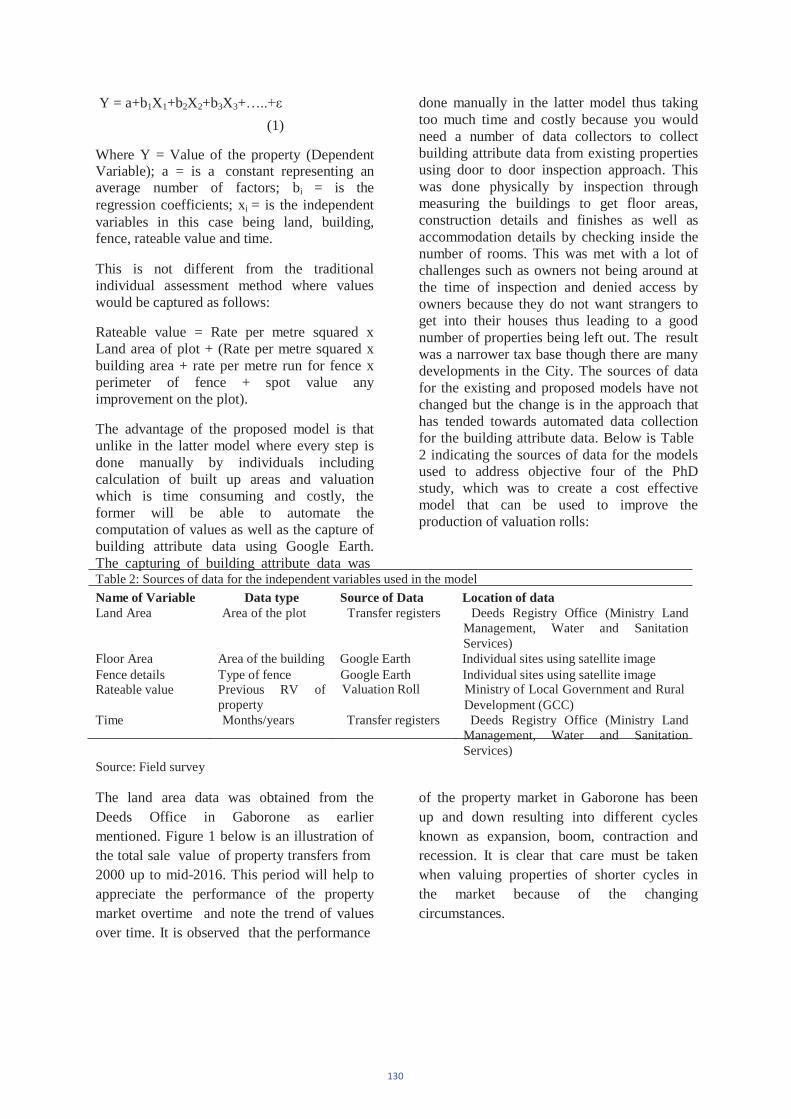
Y = a+b1X1+b2X2+b3X3+ (1)
Where Y = Value of the property (DependentVariable); a = is a constant representing anaverage number of factors; bi = is theregression coefficients; xi = is the independentvariables in this case being land, building, fence, rateable value and time.
This is not different from the traditionalindividual assessment method where valueswould be captured as follows:
Rateable value = Rate per metre squared x Land area of plot + (Rate per metre squared xbuilding area + rate per metre run for fence x perimeter of fence + spot value any improvement on the plot).
The advantage of the proposed model is thatunlike in the latter model where every step isdone manually by individuals including calculation of built up areas and valuationwhich is time consuming and costly, theformer will be able to automate thecomputation of values as well as the capture ofbuilding attribute data using Google Earth.The capturing of building attribute data was
done manually in the latter model thus taking too much time and costly because you wouldneed a number of data collectors to collectbuilding attribute data from existing propertiesusing door to door inspection approach. Thiswas done physically by inspection throughmeasuring the buildings to get floor areas,construction details and finishes as well asaccommodation details by checking inside thenumber of rooms. This was met with a lot ofchallenges such as owners not being around atthe time of inspection and denied access by owners because they do not want strangers toget into their houses thus leading to a good number of properties being left out. The resultwas a narrower tax base though there are many developments in the City. The sources of datafor the existing and proposed models have not changed but the change is in the approach thathas tended towards automated data collectionfor the building attribute data. Below is Table 2 indicating the sources of data for the modelsused to address objective four of the PhD study, which was to create a cost effectivemodel that can be used to improve the production of valuation rolls:
Table 2: Sources of data for the independent variables used in the modelName of Variable Data type Source of Data Location of dataLand Area Area of the plot Transfer registers Deeds Registry Office (Ministry Land
Management, Water and SanitationServices)
Floor Area Area of the building Google Earth Individual sites using satellite image Fence details Type of fence Google Earth Individual sites using satellite imageRateable value Previous RV of
propertyValuation Roll Ministry of Local Government and Rural
Development (GCC)Time Months/years Transfer registers Deeds Registry Office (Ministry Land
Management, Water and SanitationServices)
Source: Field survey
The land area data was obtained from the Deeds Office in Gaborone as earliermentioned. Figure 1 below is an illustration ofthe total sale value of property transfers from 2000 up to mid-2016. This period will help toappreciate the performance of the propertymarket overtime and note the trend of valuesover time. It is observed that the performance
of the property market in Gaborone has beenup and down resulting into different cyclesknown as expansion, boom, contraction andrecession. It is clear that care must be taken when valuing properties of shorter cycles in the market because of the changing circumstances.
130
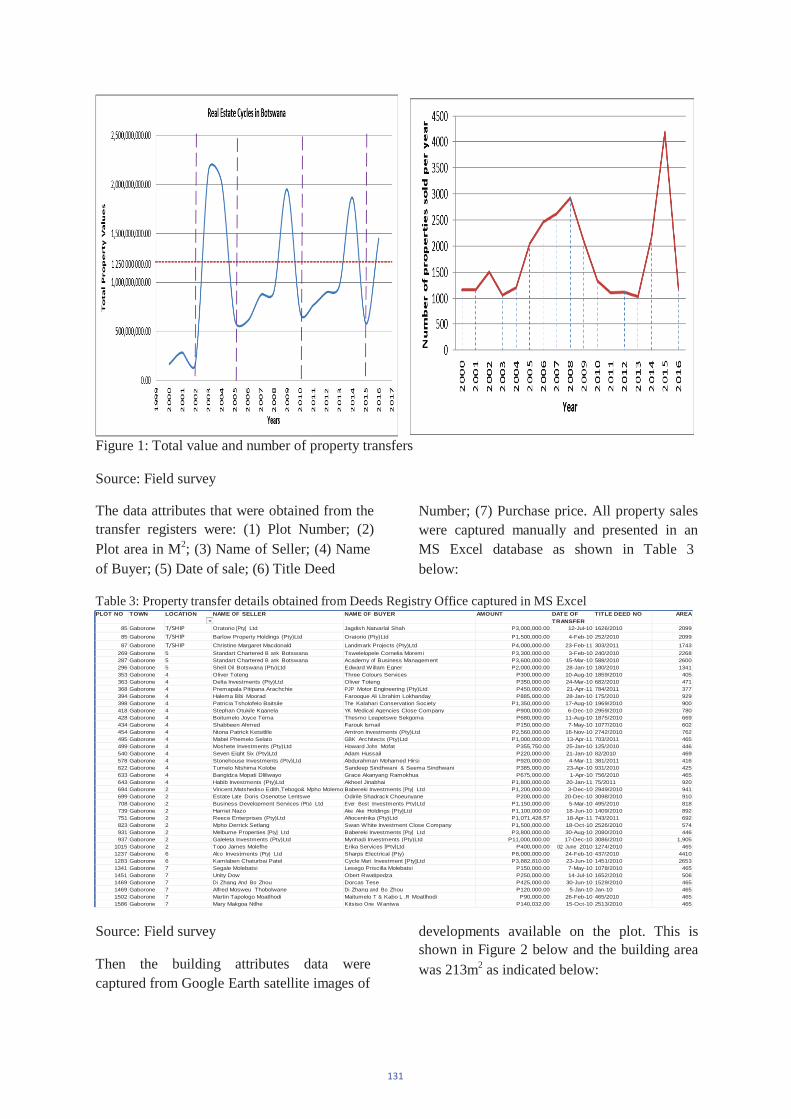
Figure 1: Total value and number of property transfers
Source: Field survey
The data attributes that were obtained from thetransfer registers were: (1) Plot Number; (2)Plot area in M2; (3) Name of Seller; (4) Name of Buyer; (5) Date of sale; (6) Title Deed
Number; (7) Purchase price. All property saleswere captured manually and presented in anMS Excel database as shown in Table 3 below:
Table 3: Property transfer details obtained from Deeds Registry Office captured in MS ExcelPLOT NO TOWN LOCATION NAME OF SELLER NAME OF BUYER AMOUNT DATE OF
TRANSFERTITLE DEED NO AREA
85 Gaborone Oratorio [Pty] Ltd Jagdish Natvarlal Shah P3,000,000.00 12-Jul-10 1626/2010 209985 Gaborone Barlow Property Holdings (Pty)Ltd Oratorio (Pty)Ltd P1,500,000.00 4-Feb-10 252/2010 209987 Gaborone Christine Margaret Macdonald Landmark Projects (Pty)Ltd P4,000,000.00 23-Feb-11 303/2011 1743
269 Gaborone 5 Standart Chartered B ank Botswana Tswelelopele Cornelia Moremi P3,300,000.00 3-Feb-10 240/2010 2268287 Gaborone 5 Standart Chartered B ank Botswana Academy of Business Management P3,600,000.00 15-Mar-10 588/2010 2600296 Gaborone 5 Shell Oil Botswana (Pty)Ltd Edward Willam Egner P2,000,000.00 28-Jan-10 180/2010 1341353 Gaborone 4 Oliver Toteng Three Colours Services P300,000.00 10-Aug-10 1859/2010 405363 Gaborone 4 Delta Investments (Pty)Ltd Oliver Toteng P350,000.00 24-Mar-10 682/2010 471368 Gaborone 4 Premapala Pitipana Arachchie PJP Motor Engineering (Pty)Ltd P450,000.00 21-Apr-11 784/2011 377394 Gaborone 4 Halema Bibi Moorad Farooque Ali Lbrahim Lokhanday P885,000.00 28-Jan-10 175/2010 929398 Gaborone 4 Patricia Tsholofelo Baitsile The Kalahari Conservation Society P1,350,000.00 17-Aug-10 1969/2010 900418 Gaborone 4 Stephan Otukile Kganela YK Medical Agencies Close Company P900,000.00 6-Dec-10 2959/2010 780428 Gaborone 4 Boitumelo Joyce Tema Thesmo Leapetswe Sekgoma P680,000.00 11-Aug-10 1875/2010 669434 Gaborone 4 Shabbeen Ahmed Farouk Ismail P150,000.00 7-May-10 1077/2010 602454 Gaborone 4 Ntona Patrick Ketsitlile Amtron Investments (Pty)Ltd P2,560,000.00 16-Nov-10 2742/2010 762495 Gaborone 4 Mabel Phemelo Selato GBK Architects (Pty)Ltd P1,000,000.00 13-Apr-11 703/2011 465499 Gaborone 4 Moshete Investments (Pty)Ltd Howard John Mofat P355,750.00 25-Jan-10 125/2010 446540 Gaborone 4 Seven Eight Six (Pty)Ltd Adam Hussail P220,000.00 21-Jan-10 82/2010 469578 Gaborone 4 Stonehouse Investments (Pty)Ltd Abdurahman Mohamed Hirsi P920,000.00 4-Mar-11 381/2011 416622 Gaborone 4 Tumelo Ntshima Kolobe Sandeep Sindhwani & Seema Sindhwani P385,000.00 23-Apr-10 931/2010 425633 Gaborone 4 Bangidza Mopati Dliliwayo Grace Akanyang Ramokhua P675,000.00 1-Apr-10 756/2010 465643 Gaborone 4 Habib Investments (Pty)Ltd Akheel Jinabhai P1,800,000.00 20-Jan-11 75/2011 920694 Gaborone 2 Vincent,Matshediso Edith,Tebogo& Mpho Molemo Babereki Investments [Pty] Ltd P1,200,000.00 3-Dec-10 2949/2010 941699 Gaborone 2 Estate Late Doris Osenotse Lentswe Odirile Shadrack Choeunyane P200,000.00 20-Dec-10 3098/2010 910708 Gaborone 2 Business Development Services (Pty) Ltd Ever Best Investments Pty)Ltd P1,150,000.00 5-Mar-10 495/2010 818739 Gaborone 2 Harriet Nazo Ake Ake Holdings [Pty]Ltd P1,100,000.00 18-Jun-10 1409/2010 892751 Gaborone 2 Reece Enterprises (Pty)Ltd Afiocentrika (Pty)Ltd P1,071,428.57 18-Apr-11 743/2011 692823 Gaborone 2 Mpho Derrick Setlang Swan White Investment Close Company P1,500,000.00 18-Oct-10 2526/2010 574931 Gaborone 2 Melbume Properties [Pty] Ltd Babereki Investments [Pty] Ltd P3,800,000.00 30-Aug-10 2080/2010 446937 Gaborone 2 Galeleta Investments (Pty)Ltd Mynhadi Investments (Pty)Ltd P11,000,000.00 17-Dec-10 3086/2010 1,905
1015 Gaborone 2 Topo James Molefhe Erika Services [Pty]Ltd P400,000.00 02 June 2010 1274/2010 4651237 Gaborone 6 Alco Investments (Pty) Ltd Sharps Electrical (Pty) P8,000,000.00 24-Feb-10 437/2010 44101283 Gaborone 6 Kamlaben Chaturbai Patel Cycle Mart Investment [Pty]Ltd P3,882,810.00 23-Jun-10 1451/2010 26531341 Gaborone 7 Segale Molebatsi Lesego Priscilla Molebatsi P150,000.00 7-May-10 1078/2010 4651451 Gaborone 7 Unity Dow Obert Rwatipedza P250,000.00 14-Jul-10 1652/2010 5061469 Gaborone 7 Di Zhang And Bo Zhou Dorcas Tese P425,000.00 30-Jun-10 1529/2010 4651469 Gaborone 7 Alfred Mosweu Thobolwane Di Zhang and Bo Zhou P120,000.00 5-Jan-10 Jan-10 4651502 Gaborone 7 Martin Tapologo Moatlhodi Maitumelo T & Kabo L .R Moatlhodi P90,000.00 26-Feb-10 465/2010 4651586 Gaborone 7 Mary Makgoa Ntlhe Kitsiso One Wantwa P140,032.00 15-Oct-10 2513/2010 465
Source: Field survey
Then the building attributes data werecaptured from Google Earth satellite images of
developments available on the plot. This isshown in Figure 2 below and the building areawas 213m2 as indicated below:
131
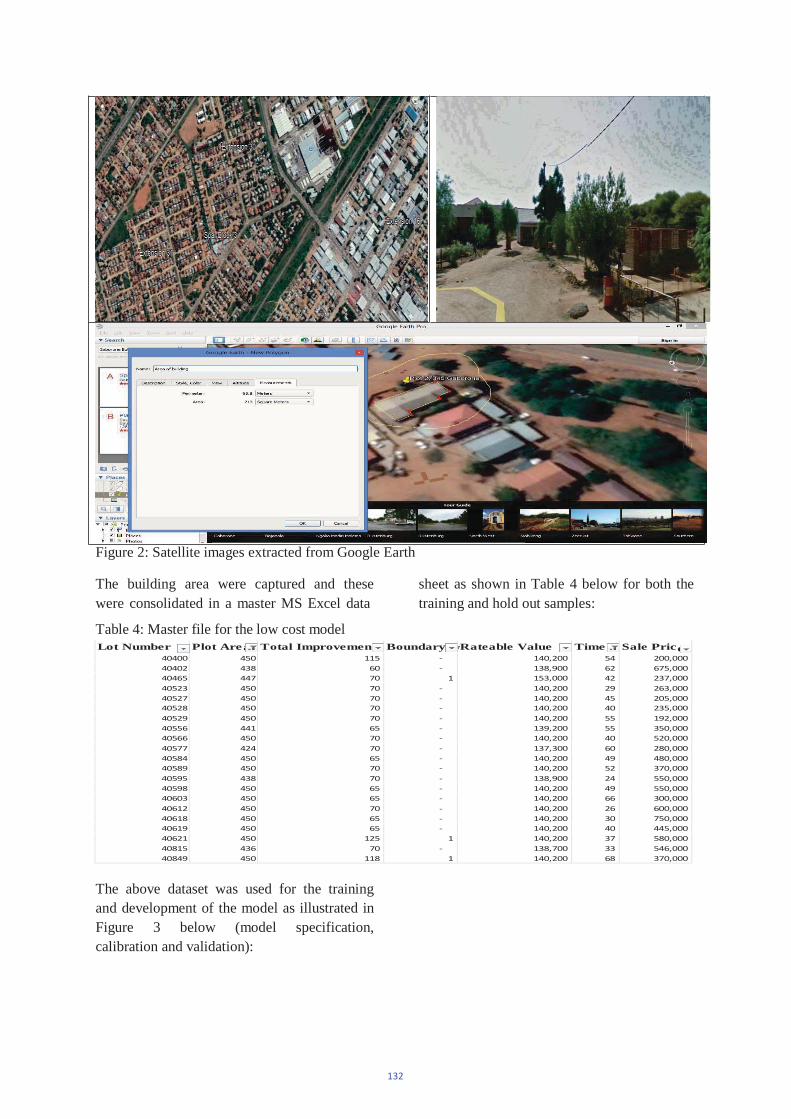
a t w eLot Number Plot Are Total Improvemen Boundary Rateable Value Time Sale Pric
Figure 2: Satellite images extracted from Google Earth
The building area were captured and thesewere consolidated in a master MS Excel data
Table 4: Master file for the low cost model
The above dataset was used for the training and development of the model as illustrated inFigure 3 below (model specification,calibration and validation):
sheet as shown in Table 4 below for both thetraining and hold out samples:
132
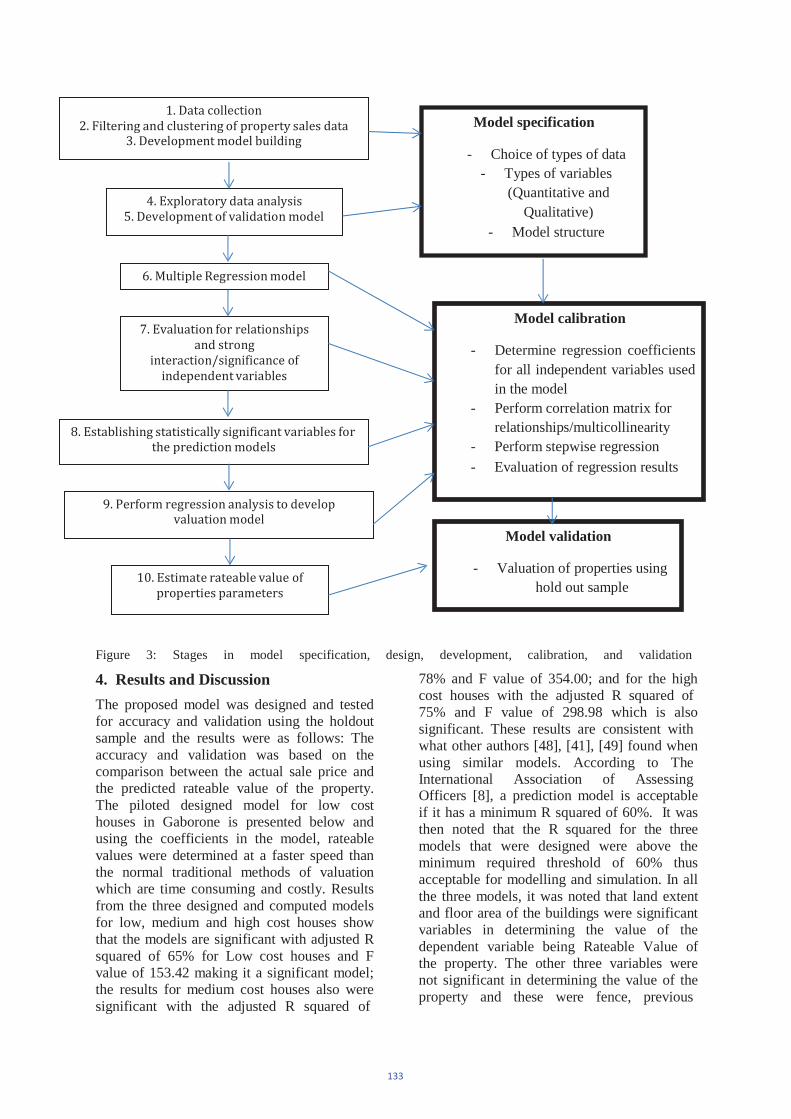
Model specification
- Choice of types of data - Types of variables
(Quantitative and Qualitative)
- Model structure
Model calibration
- Determine regression coefficientsfor all independent variables used in the model
- Perform correlation matrix for relationships/multicollinearity
- Perform stepwise regression - Evaluation of regression results
Model validation
- Valuation of properties using hold out sample
Figure 3: Stages in model specification, design, development, calibration, and validation
4. Results and DiscussionThe proposed model was designed and testedfor accuracy and validation using the holdoutsample and the results were as follows: Theaccuracy and validation was based on thecomparison between the actual sale price andthe predicted rateable value of the property.The piloted designed model for low costhouses in Gaborone is presented below andusing the coefficients in the model, rateablevalues were determined at a faster speed thanthe normal traditional methods of valuationwhich are time consuming and costly. Resultsfrom the three designed and computed modelsfor low, medium and high cost houses show that the models are significant with adjusted Rsquared of 65% for Low cost houses and Fvalue of 153.42 making it a significant model;the results for medium cost houses also weresignificant with the adjusted R squared of
78% and F value of 354.00; and for the highcost houses with the adjusted R squared of 75% and F value of 298.98 which is alsosignificant. These results are consistent with what other authors [48], [41], [49] found whenusing similar models. According to The International Association of Assessing Officers [8], a prediction model is acceptableif it has a minimum R squared of 60%. It wasthen noted that the R squared for the threemodels that were designed were above theminimum required threshold of 60% thusacceptable for modelling and simulation. In allthe three models, it was noted that land extentand floor area of the buildings were significantvariables in determining the value of thedependent variable being Rateable Value ofthe property. The other three variables werenot significant in determining the value of the property and these were fence, previous
133
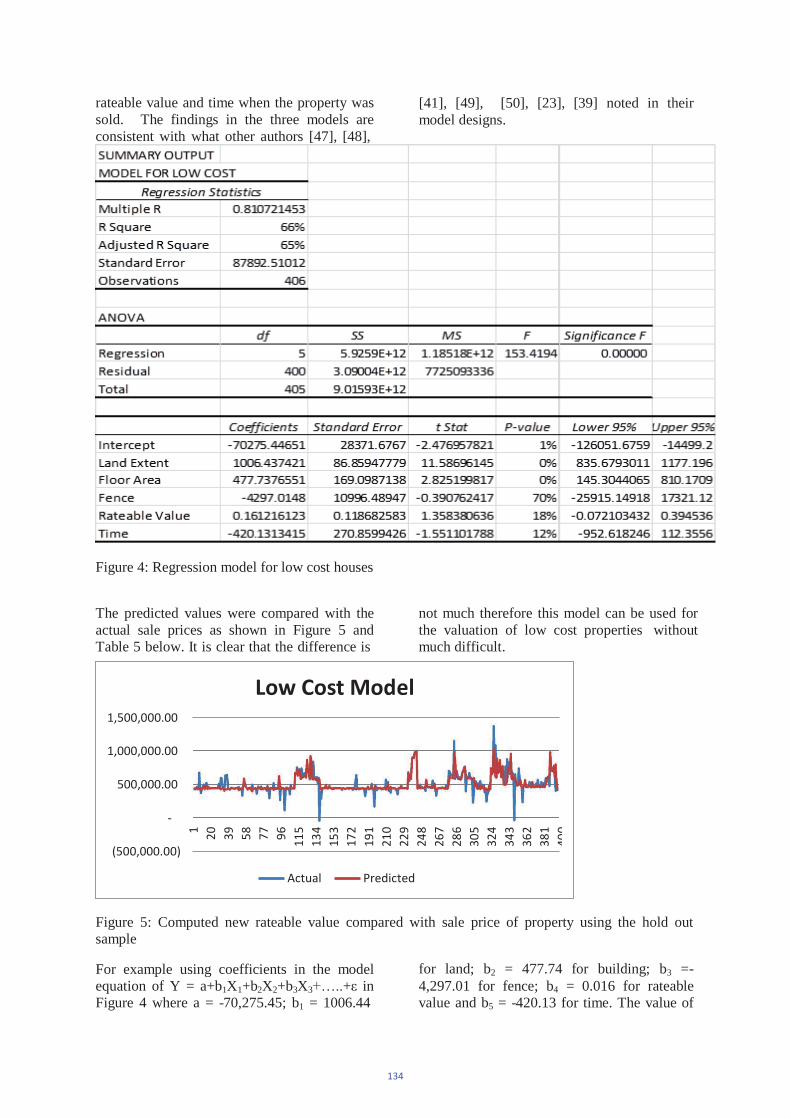
rateable value and time when the property wassold. The findings in the three models are consistent with what other authors [47], [48],
[41], [49], [50], [23], [39] noted in theirmodel designs.
Figure 4: Regression model for low cost houses
The predicted values were compared with theactual sale prices as shown in Figure 5 andTable 5 below. It is clear that the difference is
not much therefore this model can be used for the valuation of low cost properties withoutmuch difficult.
Figure 5: Computed new rateable value compared with sale price of property using the hold outsample
For example using coefficients in the model equation of Y = a+b1X1+b2X2+b3X3 + inFigure 4 where a = -70,275.45; b1 = 1006.44
for land; b2 = 477.74 for building; b3 =- 4,297.01 for fence; b4 = 0.016 for rateablevalue and b5 = -420.13 for time. The value of
134
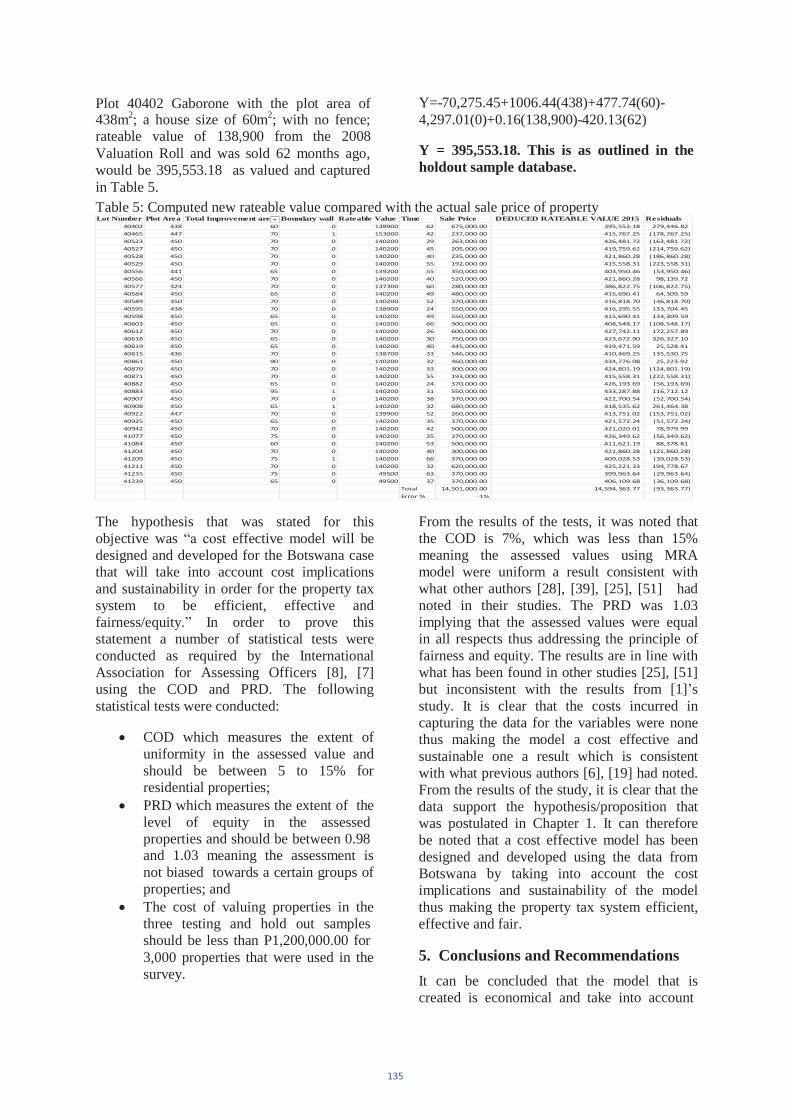
a
Plot 40402 Gaborone with the plot area of438m2; a house size of 60m2; with no fence; rateable value of 138,900 from the 2008 Valuation Roll and was sold 62 months ago, would be 395,553.18 as valued and capturedin Table 5.
Y=-70,275.45+1006.44(438)+477.74(60)- 4,297.01(0)+0.16(138,900)-420.13(62)
Y = 395,553.18. This is as outlined in theholdout sample database.
Table 5: Computed new rateable value compared with the actual sale price of propertyLot Number Plot Area Total Improvement are Boundary wall Rateable Value Time Sale Price DEDUCED RATEABLE VALUE 2015 Residuals
The hypothesis that was stated for thisobjective was st effective model will bedesigned and developed for the Botswana casethat will take into account cost implications and sustainability in order for the property taxsystem to be efficient, effective and fairness/equity In order to prove thisstatement a number of statistical tests wereconducted as required by the InternationalAssociation for Assessing Officers [8], [7]using the COD and PRD. The following statistical tests were conducted:
COD which measures the extent ofuniformity in the assessed value and should be between 5 to 15% for residential properties;
PRD which measures the extent of thelevel of equity in the assessed properties and should be between 0.98 and 1.03 meaning the assessment isnot biased towards a certain groups ofproperties; and
The cost of valuing properties in thethree testing and hold out samples should be less than P1,200,000.00 for 3,000 properties that were used in thesurvey.
From the results of the tests, it was noted thatthe COD is 7%, which was less than 15%meaning the assessed values using MRAmodel were uniform a result consistent withwhat other authors [28], [39], [25], [51] hadnoted in their studies. The PRD was 1.03 implying that the assessed values were equalin all respects thus addressing the principle offairness and equity. The results are in line withwhat has been found in other studies [25], [51]but inconsistent with the results from [1] sstudy. It is clear that the costs incurred incapturing the data for the variables were nonethus making the model a cost effective andsustainable one a result which is consistentwith what previous authors [6], [19] had noted.From the results of the study, it is clear that thedata support the hypothesis/proposition thatwas postulated in Chapter 1. It can thereforebe noted that a cost effective model has beendesigned and developed using the data from Botswana by taking into account the costimplications and sustainability of the model thus making the property tax system efficient,effective and fair.
5. Conclusions and RecommendationsIt can be concluded that the model that iscreated is economical and take into account
135
the principle of fairness and equity when assessing property values for tax purposes.The model that is created can be used to speed up the production of valuation rolls as unlikein the past where production of valuation rollsused to take years and cost a lot of money. This model would ensure 100% coverage of the tax base and that all the rateable propertiescan be captured without hindrance. Thecontribution to knowledge in this study is thata cost effective mass appraisal model iscreated that can be used to value properties forrating purposes in Botswana and any othercountry that may be interested in applying thetechnique. The fact that open access software can be used to capture geographic building attribute data is a new addition to thetheoretical body of knowledge where most studies [1], [18], [28] had initially relied onGIS for the building attribute data.
This model is user friendly for those privateorganisations that are hired to undertake rating valuation services but have no resources to pay for GIS licence and acquisition fees. Forgovernment valuers, it is an easy to use modelthat can help Government and Councils savemoney and direct it to other developmentalprojects that are competing for funding underlimited resources. Policy formulation can be inthe direction of automating valuation for rating purposes as opposed to how it has been in thepast where properties are valued individuallythus time consuming and costly. It is an easy to learn model thus training can be done toempower those in charge of the rating jurisdictions countrywide and in any othercountry where the need to automateproduction of valuation rolls can be done atminimal cost.
It is thus recommended that government should consider trying the model and appreciate how it can help alleviate the problems that are currently being faced in thetraditional individual assessment of propertiesfor tax purposes.
Though it is not an integrated system, it hasthe ability to eliminate reliance anddependence on GIS software, which is costlyto acquire and maintain. For further research,there is need to explore the possibilities ofintegrating Google Earth software and the MS
Excel with other databases such as Deeds Registry and the Cadastre database.
References
P. Bidanset, W. J. McCluskey, P. Davis andM. McCord, "Improving land valuation insparse markets: a comparison of spatial interpolation techniques in mass appraisal," in Annual World Bank Conference on Landand Poverty, Washington DC, March 20-24,2017, Washington DC, 2017.
G. Milevski, "Mass valuation of commercial real estate for taxation and balance sheet purposes," Unpublished Masters Thesis.Retrieved from 26. http://www.diva-portal.org/smash/get/diva2:305542/FULLTEXT02, 2009.
M. L. Geho, "Prospects of applying computer aided mass valuation in Tanzania," FIGworking week 2003, Paris, France, pp. 1-16, 13-17 April 2003.
J. D. Benjamin, R. S. Guttery and C. F.Sirmans, "Mass appraisal: an introduction tomultiple regression analysis for real estate valuation," Journal of Real Estate Practice and Education, vol. 7, no. 1, pp. 65-78.Retrieved fromhttps://www.jstor.org/stable/pdf/24861631.pdf on 15/7/2018, 2004.
P. Ai, "Residential land value modelling:case study of Hankou, China," Unpublished Masters Thesis, 2005.
W. McCluskey, P. Davis, M. Haran, M.McCord and D. McLlhatton, "The potential of artificcial neural networks in massappraisal: the case revisited," Journal ofFinancial Management of Property andConstruction, vol. 17, no. 3, pp. 274-292.Retrieved fromhttps://www.emeraldinsight.com/doi/pdfplus/10.1108/13664381211274371 on 15/7/2018, 2012.
The International Association of AssessingOfficers, Property appraissal and assessmentadministration, Chicago: The International
136
Associationof Assessing Officers, 1990.
The International Association of AssessingOfficers, "Standard on mass appraisal of realproperty," The International Associationof Assessing Officers, Kansas City, Missouri,2013.
Redstone, "Redstome advanced analytics forappraisers: Regression fundamentals.Retrieved from http://appraisalworld.com/i2/docs/Redstone-regression5-15.pdf," nd.
J. Kampamba, A. C. Mosha, A. Y. Adeyemiand T. T. Mooketsi , "An assessment of thecurrent local property tax system in Botswana," Journal of Property TaxAssessment and Administration, vol. 15, no. 1, pp. 27-44, 2018.
C. M. De Cesare and L. Ruddock, "A newapproach to the analysis of assessment equity," Assessment Journal, vol. 5, no. 2, pp. 57-69, 1998.
C. Quintos, "Improving assessment equity in mass appraisal models," Journal of Property Tax Assessment and Administration, vol. 11, no. 4, pp. 53-64. Retrieved fromwww1.nyc.gov/assets/finance/jump/property- data- maps/docs/quintos_equity_in_mass_appraisal .pdf on 15/7/2018, 2014.
R. Bahl and J. Martinez-Vazque, "Theproperty tax in developing countries: currennt practises and prospects," Lincoln Institute of Land Policy, Cambridge MA, 2007.
Republic of Botswana, "Townships Act Cap40.02 of the Laws of Botswana," Government Printers, Gaborone, 1955.
J. Zurada, A. S. Levitan and J. Guan, "Acomparison of regression and artificial intelligence methods in a mass appraisal context," JRER, vol. 33, no. 3, pp. 349-387.Retrieved fromhttp://pages.jh.edu/jrer/papers/pdf/past/vol33n03/03.349_388.pdf, 2011.
M. D'Amato, "Comparing rough set theorywith multiple regression analaysis as automated valuation methodologies," International Real Estate Review, vol. 10, no. 2, pp. 42-65. Retrieved fromhttps://www.umac.mo/fba//irer/papers/past/vol10n2_pdf/03Maurizio%20d%20_42-65.pdfon 15/07/2018., 2007.
T. Dimopoulos and A. Moulas, "A proposal of a mass appraisal system in Greece withCAMA system: Evaluating GWR and MRA techniques in Thessaloniki Municipality," DeGruyter Open Geoscience, vol. 8, pp. 675- 693. Retrieved fromhttps://www.degruyter.com/downloadpdf/j/geo.2016.8.issue-1/geo-2016-0064/geo-2016- 0064.pdf on 15/7/2018, 2016.
E. P. Bidanset and R. J. Lombard,"Evaluating spatial model accuracy in massreal estate appraisal: a comparison ofgeographically weighted regression and thespatial lag model," Journal of PolicyDevelopment and Research, vol. 16, no. 3, pp.169-182. Retrieved from 27.https://www.huduser.gov/portal/periodicals/cityscpe/vol16num3/ch10.pdf on 15/7/2018, 2014.
W. J. McCluskey, M. McCord, P. T. Davis, M. Haran and D. McLlhatton, "Predictionaccuracy in mass appraisal: a comparison ofmodern approaches," Journal of PropertyResearch, vol. 30, no. 4, pp. 239-265.Retrieved fromhttps://www.tandfonline.com/doi/pdf/10.1080/09599916.2013.781204?needAccess=trueon 15/7/2018, 2013.
D. P. Tay and D. K. Ho, "Artificial intelligence and the mass appraisal ofresidential apartments," Journal of PropertyValuation and Investment, vol. 10, no. 2, pp. 525-540. Retrieved fromhttps://www.emeraldinsight.com/doi/pdfplus/10.1108/14635789210031181 on 15/7/2018, 1992.
T. Gunes and U. Yildiz, "Mass valuationtechniques used in land registry and cadastre modernization project of Republic of
137
Turkey," in FIG working week: From theWisdom of the Ages to the Challenges of theModern World, Sofia, Bulgaria, 17-21 May 2015, 2015.
O. Ruzha and S. Ignatjeva, "Construction andthe analysis of the models of mass appraisal of residential real estate in Riga andDaugavpils. Retrieved fromhttps://ojs.utlib.ee/index.php/TPEP/article/download/841/817/ on 15/7/2018," Daugavpils University, Daugavpils, nd.
L. Pi-ying (Peddy), "Analysis of the massappraisal model by using artificial neural network in Kaohsiung City," Journal ofModern Accounting and Auditing, vol. 7, no. 10, pp. 1080-1089, 2011.
V. Kontrimas and A. Verikas, "The massappraisal of the real estate by computational intelligence," Applied Soft Computing, vol.11, pp. 443-448, 2011.
W. Moore and J. Myers, "using geographic attribute weighted regression for CAMAmodeling," Journal of Property TaxAssessment and Administration, vol. 7, no. 3,pp. 5-28, 2010.
E. A. Antipov and E. B. Pokryshevskaya, "Mass appraisal of residential apartments: anapplication of random forest for valuationand a CART -based approach for model diagnostics," Expert Systems with Applications, vol. 39, pp. 1772-1778, 2012.
E. Jahanshiri, T. Buyong and A. R. M.Shariff, "A review of property mass valuation models," Pertanika Journal of Science andTechnology, vol. 19, pp. 23-30, 2011.
W. McCluskey, W. Deddis, A. Mannis, D.McBurney and R. Borst, "Interactive application of computer assisted massappraisal and geographic informationsystems," Journal of Property Valuation andInvestment, vol. 15, no. 5, pp. 448-465, 1997.
W. Bognar, "Automated valuation models: mass appraisals and its application in Romania," nd. [Online]. Available:
http://www.dafi.ase.ro/revista/8/Wiliam%20Bognar%20- %20Automated%20Valuation%20Models.pdf. [Accessed 15 July 2018].
The Appraiser Foundation, "Identifyingcomparable properties in automated valuationmodels for mass appraisal," AppraisalPractices Board. Retrieved fromhttps://www.appraisalfoundation.org/imis/docs/Valuation_Advisory_5_Identifying_Comparable_Properties_AVM_and_Mass_Apprais al_Final_081413.pdf on 15/7/2018.,Washington DC, 2014.
A. R. Borst, "A space -time model forcomputer assisted mass appraisal," XLIIncontro di studio del Ce.S.E.T, pp. 535-545.Retrieved from https://fupress.net/index.php/ceset/article/download/13160/12446 on 15/7/2018, nd.
J. Kampamba, S. Leima and A. Svensson, "A comparative analysis of residential property tax assessment in Botswana andSweden," International Journal of CurrentResearch, vol. 8, no. 3, pp. 27898-27905, 2016.
S. Tian, "Mass appraisal of property tax base based on multivariate linear regression:empirical study on four districts of Jinan," in International Conference on EducationTechnology and Information System, 2013.
D. Brukstaitiene, "Application of massappraisal models," Vilnius Gediminas Technical University, Vilnius, Luthania, nd.
B. Bozic, D. Milicevic, M. Pejic and S.Marosan, "The use of multiple linear regression in property valuation," Geonauka,vol. 1, no. 1, pp. 41-45. Retrieved fromhttps://geonauka.sgs.org.rs/articles/201306.pdf on 15/7/2018, 2013.
R. Dalgiesh and L. Buchart, "Regressionmodeling in Calgary: a practical approach,"Assessment Journal, vol. 5, no. 4, pp. 23-37.Retrieved from https://professional.sauder.ubc.ca/re_creditprogram/course_resources/courses/content/444/
138
calgary.pdf on 15/7/2018, 1998.
S. Brankovic, "Real estate mass appraisal in the real estate cadastre and GISenvironment," Journal of Geodetic list, vol.2, pp. 119-134, 2013.
A. Bagdonavicius and S. Deveikis,"Automated valuation models in Lithuania," nd.
R. J. Gloudemans, "Implementing a landvalue tax in urban residential communities," Journal of Property Tax Assessment andAdministration, vol. 5, no. 4, pp. 1-7, 2000.
P. Zentelis, "Development of a CAMAsystem for the urban property in GreeceBased on cadastre data," Journal of PropertyTax Assessment and Administration, vol. 4,no. 3, pp. 23-40, 2007.
D. L. Jensen, "The use of cross-validation inCAMA modeling to get the most out ofsales," Journal of Property Tax Assessmentand Administration, vol. 8, no. 3, pp. 19-40, 2011.
J. Schreiber, "Developing a statewide CAMAsystem in Vermont: a case study,"Assessment Journal, pp. 67-73, 2003.
R. D. Ward, J. R. Weaver and J. C. German,"Improving CAMA models using Geographic Information Systems/Response surfaceanalysis location factors," Assessmentjournal, pp. 30-38, 1999.
R. B. Abidoye and A. P. Chan, "Critical review of hedonic pricing model application in property price appraisal: a case ofNigeria," International Journal ofSustainable Built Environment, vol. 6, pp. 250-259, 2017.
R. D. Ward, "Demonstration of CAMA inSouth Africa," Assessment Journal, pp. 33- 43, 2001.
K. van der Walt and D. Boshoff, "An analysis of the use of mass appraisal methods for agricultural properties," Actas Structilia,vol. 24, no. 2, pp. 44-76. Retrieved fromhttps://www.ajol.info/index.php/actas/article/viewFile/163740/153215, 2017.
D. Thomas, "Computer assisted valuation in Tasmania: an international review," in Computer Assisted Mass Appraisal, W. J. McCluskey and A. S. Adair, Eds., Aldershot, Ashgate, 1997, pp. 233-256.
R. B. Abidoye and A. P. Chan, "Hedonic valuation of real estate properties in Nigeria," Journal of African Real Estate Research, vol.1, no. 1, pp. 122-140, 2018.
E. Pagourtzi, V. Assimakopoulos, T. Hatzichristos and N. French, "Real estate appraisal: a review of valuation methods," Journal of property Investment & Finance,vol. 21, no. 4, pp. 383-401, 2003.
D. Demetriou, "A spatially based artificial neural nertwork mass valuation model forland consolidation," Environmental andPlanning: Urban Analytics and City Science,vol. 44, no. 5, pp. 864-883, 2017.
139
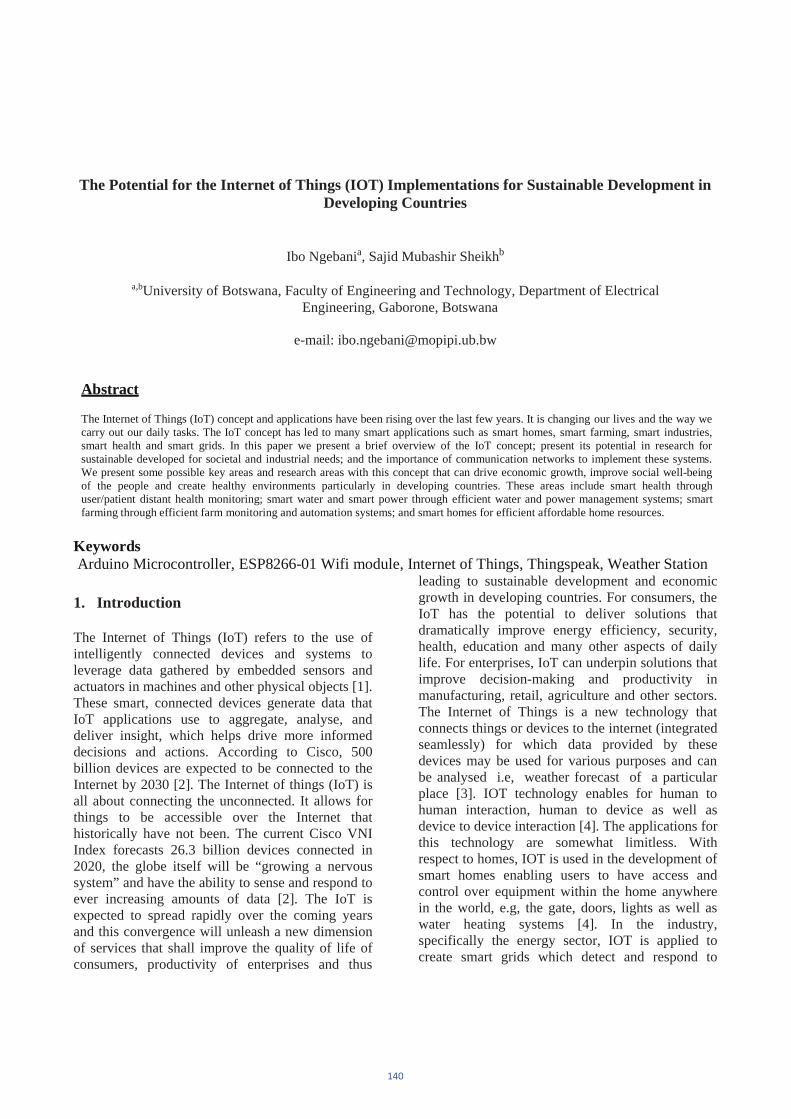
The Potential for the Internet of Things (IOT) Implementations for Sustainable Development in Developing Countries
Ibo Ngebania, Sajid Mubashir Sheikhb
a,bUniversity of Botswana, Faculty of Engineering and Technology, Department of Electrical Engineering, Gaborone, Botswana
e-mail: [email protected]
Abstract
The Internet of Things (IoT) concept and applications have been rising over the last few years. It is changing our lives and the way we carry out our daily tasks. The IoT concept has led to many smart applications such as smart homes, smart farming, smart industries, smart health and smart grids. In this paper we present a brief overview of the IoT concept; present its potential in research for sustainable developed for societal and industrial needs; and the importance of communication networks to implement these systems. We present some possible key areas and research areas with this concept that can drive economic growth, improve social well-being of the people and create healthy environments particularly in developing countries. These areas include smart health through user/patient distant health monitoring; smart water and smart power through efficient water and power management systems; smartfarming through efficient farm monitoring and automation systems; and smart homes for efficient affordable home resources.
Keywords Arduino Microcontroller, ESP8266-01 Wifi module, Internet of Things, Thingspeak, Weather Station
1. Introduction
The Internet of Things (IoT) refers to the use of intelligently connected devices and systems to leverage data gathered by embedded sensors and actuators in machines and other physical objects [1]. These smart, connected devices generate data that IoT applications use to aggregate, analyse, and deliver insight, which helps drive more informed decisions and actions. According to Cisco, 500 billion devices are expected to be connected to the Internet by 2030 [2]. The Internet of things (IoT) is all about connecting the unconnected. It allows for things to be accessible over the Internet that historically have not been. The current Cisco VNI Index forecasts 26.3 billion devices connected in 2020, the globe itself will be “growing a nervous system” and have the ability to sense and respond to ever increasing amounts of data [2]. The IoT is expected to spread rapidly over the coming years and this convergence will unleash a new dimension of services that shall improve the quality of life of consumers, productivity of enterprises and thus
leading to sustainable development and economic growth in developing countries. For consumers, the IoT has the potential to deliver solutions that dramatically improve energy efficiency, security, health, education and many other aspects of daily life. For enterprises, IoT can underpin solutions that improve decision-making and productivity in manufacturing, retail, agriculture and other sectors. The Internet of Things is a new technology that connects things or devices to the internet (integrated seamlessly) for which data provided by these devices may be used for various purposes and can be analysed i.e, weather forecast of a particular place [3]. IOT technology enables for human to human interaction, human to device as well as device to device interaction [4]. The applications for this technology are somewhat limitless. With respect to homes, IOT is used in the development of smart homes enabling users to have access and control over equipment within the home anywhere in the world, e.g, the gate, doors, lights as well as water heating systems [4]. In the industry, specifically the energy sector, IOT is applied to create smart grids which detect and respond to
140
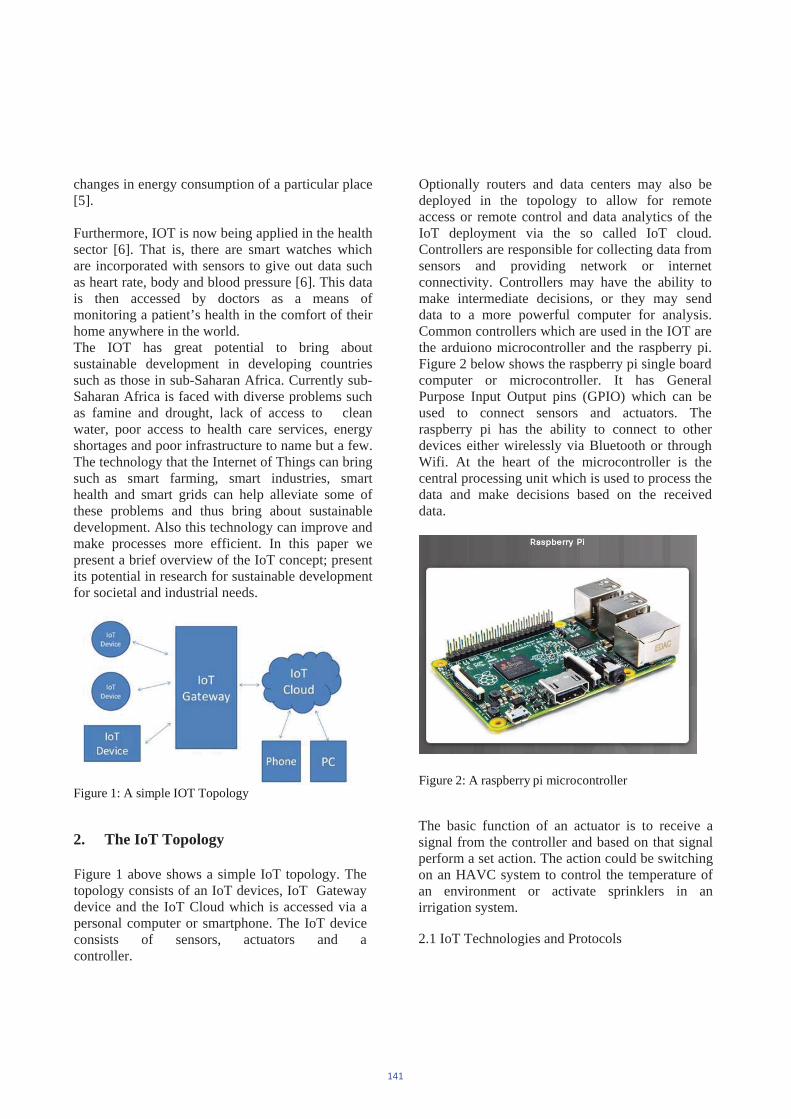
changes in energy consumption of a particular place [5].
Furthermore, IOT is now being applied in the health sector [6]. That is, there are smart watches which are incorporated with sensors to give out data such as heart rate, body and blood pressure [6]. This data is then accessed by doctors as a means of monitoring a patient’s health in the comfort of their home anywhere in the world. The IOT has great potential to bring about sustainable development in developing countries such as those in sub-Saharan Africa. Currently sub- Saharan Africa is faced with diverse problems such as famine and drought, lack of access to clean water, poor access to health care services, energy shortages and poor infrastructure to name but a few. The technology that the Internet of Things can bring such as smart farming, smart industries, smart health and smart grids can help alleviate some of these problems and thus bring about sustainable development. Also this technology can improve and make processes more efficient. In this paper we present a brief overview of the IoT concept; present its potential in research for sustainable development for societal and industrial needs.
Figure 1: A simple IOT Topology
2. The IoT Topology
Figure 1 above shows a simple IoT topology. The topology consists of an IoT devices, IoT Gateway device and the IoT Cloud which is accessed via a personal computer or smartphone. The IoT device consists of sensors, actuators and a controller.
Optionally routers and data centers may also be deployed in the topology to allow for remote access or remote control and data analytics of the IoT deployment via the so called IoT cloud. Controllers are responsible for collecting data from sensors and providing network or internet connectivity. Controllers may have the ability to make intermediate decisions, or they may send data to a more powerful computer for analysis. Common controllers which are used in the IOT are the arduiono microcontroller and the raspberry pi. Figure 2 below shows the raspberry pi single board computer or microcontroller. It has General Purpose Input Output pins (GPIO) which can be used to connect sensors and actuators. The raspberry pi has the ability to connect to other devices either wirelessly via Bluetooth or through Wifi. At the heart of the microcontroller is the central processing unit which is used to process the data and make decisions based on the received data.
Figure 2: A raspberry pi microcontroller
The basic function of an actuator is to receive a signal from the controller and based on that signal perform a set action. The action could be switching on an HAVC system to control the temperature of an environment or activate sprinklers in an irrigation system.
2.1 IoT Technologies and Protocols
141

Different communication media can be used to connect the different components of the IoT topology. The communication media can be in the form of short range wireless technologies such as Bluetooth Low Energy [7], Near Field Communication (NFC), Wi-Fi, WiMax or Zigbee. Medium range wireless can be in the form of Halow, Narrowband IoT (NB-IoT). Examples of long range wireless technologies are LPWAN, LoRA, Cellular 2G, 3G, 4G Mobile technologies [8]. Wired communication also plays an important role in how devices communicate. This can be in the form of serial port communications, ethernet, firewire and powerline communications.
Other protocols which operate at the application layer are the Message Queueing Telemetry Transport (MQTT), Constrained Application Protocol (CoAP), Extensible Messaging and Presence Protocol (XMPP), Representational State Transfer (REST), Simple Object Access Protocol (SoAP) to name but a few [9].
3. IoT Applications in the Agricultural Sector
3.1 Precision Farming
Also known as precision agriculture, precision farming can be thought of as anything that makes the farming practice more controlled and accurate when it comes to raising livestock and growing of crops. In this approach of farm management, a key component is the use of IT and various items like sensors, control systems, robotics, autonomous vehicles, automated hardware, variable rate technology, and so on. Precision agriculture is one of the most famous applications farming sensors located across the field, various data from the environment can be collected and send it to the cloud. The provided measurements can be used to map the climate conditions, choose t the appropriate crops, and take the required measures to improve their capacity (i.e. precision farming). This can lead to increased yields in harvest and thus reducing famine. of IoT in the agricultural sector. The climate in sub-Saharan Africa is
known to be unpredictable from year to year. The IoT can be used to monitor climate conditions. By combining various smart
3.2 Green House Automation
Greenhouse farming is a methodology that helps in enhancing the yield of vegetables, fruits, crops etc. Greenhouses control the environmental parameters through manual intervention or a proportional control mechanism. As manual intervention results in production loss, energy loss, and labor cost, these methods are less effective. A smart greenhouse can be designed with the help of IoT; this design intelligently monitors as well as controls the climate, eliminating the need for manual intervention. For controlling the environment in a smart greenhouse, different sensors that measure the environmental parameters according to the plant requirement are used. A cloud server for remotely accessing the system when it is connected using IoT can be created.
3.3 Agricultural Drones
Figure 3: Agricultural drone for crop monitoring
An agricultural drone is an unmanned aerial vehicle that can be applied to farming in order to help increase crop production and monitor crop growth. Sensors and cameras can be attached to the drones to give farmers a richer picture of their fields. This information may prove useful in improving crop production and farm efficiency. The agricultural drones can also be equipped with pesticides or fertilizers that can be applied to sections of the farm or field with minimum human intervention and thus reducing costs [10]. Drones can be being used in agriculture to enhance
142
various agricultural practices. Some of the ways in which aerial based drones can be used in agriculture are crop health assessment, irrigation, crop monitoring, crop spraying, planting, and soil and field analysis. Drones can also be fitted with sensors to collect data. From the drone data, insights regarding plant health indices, plant counting and yield prediction, plant height measurement e.t.c can be obtained.
3.4 Livestock Monitoring
Large farm owners can utilize wireless IoT applications to collect data regarding the location, well-being, and health of their cattle [11]. This information helps them in identifying animals that are sick so they can be separated from the herd, thereby preventing the spread of disease. It also lowers labor costs as ranchers can locate their cattle with the help of IoT based sensors.
4. IoT applications in the Health Sector
The Internet of Things technology can be applied to make medical centers to function more competently and patients to obtain better treatment [12][13]. This can be quite useful in developing countries which face a dire shortage of medical doctors and practioners. With the help of IoT, patients can be monitored remotely from a centralized location. This can save costs of having a medical officer taking a rounds to observe many patients. Personalized medical information or streaming media which can be either voice or video services can be delivered to personal devices such as smart phones. The IoT can also help integrate location and sensor information to help respond faster to patients with wearable devices which monitor vital signs such as blood pressure, heart beat rate and blood sugar levels.
5. Smart Cities
It has been widely forecasted that within the next 10 years, 70 percent of the world's population will live in cities [14]. This is because many people relocate to urban areas in search of employment
and better living standards. As populations shift to urban areas, developing countries are pressed for answers to the problems of overcrowding, increasing pollution, increased traffic congestion, inadequate parking, inadequate infrastructures resulting in inefficient use of street lighting, water, and waste management. With the help of the IoT technology cities can now solve their most critical problems of parking, traffic management, lighting, water and waste management, and more on a shared and intelligent network infrastructure. Public Wi-Fi can be used to allows citizens to access the Internet. Location-based services can help city planners acquire near real-time data about the challenges of overcrowding, traffic jams, e.t.c. Parking applications can be used to provide citizens with information on real-time parking availability. Traffic applications give traffic operators a real- time view of live traffic conditions and incidents, thus reducing response time. Through the application of the IoT, a variety of data from the environment including levels of humidity, CO2 and particulate matter can be obtained and measures applied to alleviate the problems they poise. Street lights can be remotely controlled or automated to save energy depeding on the amount of ambient light. Cities using these solutions can drastically reduce city energy consumption, costs and maintenance. The IoT enables the use of intelligent, sensor-based IoT innovations to transportation, utilities, public safety, and environmental monitoring without adding significantly to the physical infrastructure. Citizens can be provided with real-time information about available parking and allows them to book spaces in advance using mobile applications. The results are less traffic congestion and a more effective partnership between cities, citizens, local businesses, and parking enforcement agencies. Revenue can also be generated from such parking services.
6. IoT for Manufacturing
IoT solutions improve the business of manufacturing by connecting the right people to the right information. For people involved in all aspects of the manufacturing process, connected sensors
143
provide a unique level of visibility into the factory operations and supply chain flow. As data is collected, it can contribute to identifying trends and relationships that reveal opportunities to improve the manufacturing processes. For xample, car companies now use sensor data to decide if conditions are favorable to paint a car. If the system determines the conditions unfavorable (e.g., too humid), the automobile is routed to another area of the manufacturing process. This reduces repainting and maximizes plant uptime. The adoption of IoT technologies in developing countries can really bring growth to the manufacturing industry.
7. IoT and the Smart Grid
Smart Grid enables a new model of power generation and distribution in which many sources of power, such as solar panels, can contribute to the power grid. In addition, it enables the storage and distribution of excess power in batteries and helps to improve distribution of power based on demand. The Smart Grid involves the use of automated metering which helps reduce costs, improve service and adds value. These smart meters can be installed in homes and businesses to monitor energy consumption and transmit that information back to energy providers. The energy providers can track the energy consumption and throttle the energy consumption on a granular level with demand gets too high. The advantages are a reduction in the amount of blackouts, this can help measure and reduce energy consumption and costs. The technology also help businesses to reduce their carbon foot print. The applications of smart grid in developing countries can also help open up new opportunities for technology companies and thus creating jobs.
8. Conclusion
The Internet of Things has got the potential to lead to sustainable development and solve some of the problems that are experienced by developing countries. This potential also contributes to the realization of the millenium development goals. The applications can be in the agricultural sector, education sector, the health care sector,
manufacturing, smart cities and the smart grid and many more. Currently, IoT is an active area of research in some academic institutions such as University of Botswana being applied to various local problems.
9. References
[1] “Understanding the Internet of Things,” Connected Living, July, 20, 2014, https://www.gsma.com/iot/wp- content/uploads/2014/08/cl_iot_wp_07_14.pdf
[2] "Internet of Things” https://www.cisco.com/c/dam/en/us/products/collat eral/se/internet-of-things/at-a-glance-c45731471.pdf
[3] R.K. Kodali and S. Mandal, “IOT based weather station”, 2016 International Conference on Control, Instrumentation, Communication and Computational Technologies, Kumaracoil, India.
[4] T. Malche and P. Maheshwary, "Internet of Things (IoT) for building smart home system," 2017 International Conference on I- SMAC (IoT in Social, Mobile, Analytics and Cloud) (I-SMAC), Palladam, 2017, pp. 65-70. Things for Health Care: A Comprehensive Survey," in IEEE Access, vol. 3, pp. 678-708, 2015.
[5] Q. Ou, Y. Zhen, X. Li, Y. Zhang and L. Zeng, "Application of Internet of Things in Smart Grid Power Transmission," 2012 Third FTRA International Conference on Mobile, Ubiquitous, and Intelligent Computing, Vancouver, BC, 2012, pp. 96-100.
[6] G. Yang et al., "A Health-IoT Platform Based on the Integration of Intelligent Packaging, Unobtrusive Bio-Sensor, and Intelligent Medicine Box," in IEEE Transactions on Industrial Informatics, vol. 10, no. 4, pp. 2180-2191, Nov.2014.
[7] J. Decuir, "Bluetooth Smart Support forLoBTLE: Applications and connection questions.," in IEEE Consumer Electronics Magazine, vol. 4, no. 2, pp. 67-70, April 2015.
[8] N. Poursafar, M. E. E. Alahi and S. Mukhopadhyay, "Long-range wireless technologies for IoT applications: A
144
review," 2017 Eleventh International Conference on Sensing Technology (ICST),Sydney, NSW, 2017, pp. 1-6.
[9] U. Tandale, B. Momin and D. P. Seetharam, "An empirical study of application layer protocols for IoT," 2017 International Conference on Energy, Communication, Data Analytics and Soft Computing (ICECDS),Chennai, 2017, pp. 2447- 2451.
[10] Spoorthi S., B. Shadaksharappa, Suraj S. and V. K. Manasa, "Freyr drone: Pesticide/fertilizers spraying drone - an agricultural approach," 2017 2ndInternational Conference on Computing andCommunications Technologies (ICCCT),Chennai, 2017, pp. 252-255. doi: 10.1109/ICCCT2.2017.7972289
[11] H. Erden, . A. Kaya and E. Çama ircio lu, "Livestock Monitoring System," 2015 Fourth International Conference on Agro-Geoinformatics (Agro-geoinformatics),Istanbul, 2015, pp. 73-76.
[12] F. Hu, D. Xie and S. Shen, "On the Application of the Internet of Things in the Field of Medical and Health Care," 2013 IEEE International Conference on Green Computing and Communications and IEEE Internet of Things and IEEE Cyber, Physical and Social Computing, Beijing, 2013, pp. 2053-2058.doi: 10.1109/GreenCom-iThings- CPSCom.2013.384
[13] G. Yang et al., "A Health-IoT Platform Based on the Integration of Intelligent Packaging, Unobtrusive Bio-Sensor, and Intelligent Medicine Box," in IEEE Transactions on Industrial Informatics, vol. 10, no. 4, pp. 2180-2191, Nov. 2014.
[14] S. Rhee, "Catalyzing the Internet of Things and smart cities: Global City Teams Challenge," 2016 1st International Workshop on Science of Smart City Operations and Platforms Engineering (SCOPE) in partnership with Global City Teams Challenge (GCTC) (SCOPE - GCTC), Vienna, 2016, pp. 1-4.
145
Strategic Leadership In Zimbabwean Small and Medium Enterprises
Douglas Svotwa1, Yvonne Du Plessis1, Nicolene Barkhuizen2
1North-West University, Business School, South Africa 2Global Innovative Forefront Talent Research Niche Area, North-West
University, South Africa
E-mail address of corresponding author: [email protected]
Abstract It has been well documented that Small and Medium Enterprises (SMEs) are the engines of growth for the majority of developed and emerging economies. SMEs play a critical role in the economy of Zimbabwe and account for 84% of the population’s livelihoods. The problem in developing country SMEs, and specifically in Zimbabwe, is that 85% of SMEs are failing. Literature shows that without effective strategic leadership, firms will find it difficult to cope, and survive the global economic challenges in future. The question arises, “Do SME owner-managers who uphold strategic leadership practices account for SME success in Zimbabwe? A qualitative research design was employed, using semi-structured interviews to collect data from 12 successful owner-managers who were purposively selected from a population of 207 registered manufacturing and engineering SMEs in Zimbabwe. Data were analysed through coding and thematic analysis. It was found that most successful SME owner- managers practiced strategic leadership which will be elaborated on in this paper.
KeywordsDeveloping country, engineering and manufacturing SMEs, owner-managers, strategic leadership, SME success
1. IntroductionThis paper elaborates on the role of strategic
leadership and its importance in the success of small and medium enterprises (SMEs) in the manufacturing and engineering sector of a developing country context. Many SMEs are long-established family businesses, or are managed by the founder and owners, who are holding both management and operational roles, with the aim of achieving personal objectives, in addition to generating shareholder return [1] and [2]. In the context of SMEs, the owner-managers are supposed to be the strategic leaders.
Various researchers have defined strategic leadership as the ability of the leader to anticipate, envision, think strategically, being flexible, and empower others in the creation of strategic change as necessary [3], [4] and [5]. Furthermore, assertions have been made that strategic leadership sets the vision, goals, meaning, purposes, and direction of the organisation. The focal point of strategic leadership is that a small group of people, the strategic leaders, those who are located at the apex of the organisation have a significant effect on organisational outcomes [6], [7] and [8].
The success of an organisation, depends on leaders with strategic decision-making
responsibilities, especially the chief executive officer (CEO), i.e., the SME owner-manager. There is indeed empirical evidence to suggest that CEOs matter when it comes to company performance. Longitudinal studies conducted by [9] on 74 880 firms in Denmark demonstrated that CEOs are extremely important for a firm’s growth prospects and overall performance. Results of the study found out that firms’ prospects were significantly negatively affected by the loss of their CEOs (through death), affecting the firm’s operating profitability, its investment decisions and sales growth. CEOs or founders of SMEs have been found to wield a great deal of influence in the firm as regards the operations and decision making processes of the firm [10].
An important assumption that this study makes in terms of organisational theory at the micro level (individual organisations level) is that the behaviour of the SME is voluntaristic and is not determined by the operating environment. In other words, decisions made by the SME owner-managers drive firm level behaviour. This view is buttressed by [11] and [12] who argued that: “Seen from the voluntaristic orientation, individuals and their created institutions are autonomous, proactive, self-directing agents; individuals are seen as the basic unit of analysis and source of change in
146
organizational life.” Managers in SMEs are therefore viewed as independent in terms of the choices they make and ultimately the decisions they uphold. In addition, SME owner-managers are perceived as proactive in coming up with firm strategy, as opposed to being reactive to the dynamic challenges of the environment. An organisation’s daily operations and setting its future direction is normally overseen by those at the top of organisations, that is, the supposedly strategic leaders [13] and [14]. [14] also posited that the long-term prosperity of an organisation is mainly dependent on having strategic leaders at the helm of the organisation. Strategic leaders in these organisations implement strategies that enhance the long-term survival of the organisation as opposed to managerial leaders who are mostly focused and preoccupied with the status quo. Therefore, strategic leadership and the role of the strategic leader are critical to the success of any firm in driving and implementing the firm’s chosen strategy, working in collaboration with employees of the organisation.
Previous research on SMEs has mainly focused on leadership and strategic management, such as the studies by [15], [16], [17], [18], [19], [20], and [21]. Few studies, such as those by [22] and [23], have attempted to examine the role of strategic leadership in firms. Based on a response rate of 7.6% from the directors of the Financial Mail Top 200 companies in South Africa, [22] concluded that strategic leadership positively contributes to effective strategy implementation in South African organisations. [23] concluded that Hungarian SMEs did not have formal strategic plans in place, and that the majority of the strategic leaders spent 80% of their time on daily operational issues (‘short terminism’), instead of focusing on the strategic issues of the SME. The results showed that only 4% of the strategic leaders spent the majority of their time on strategic tasks and thinking, hence the failure of SMEs. [28] investigated the role of leadership styles on SME performance in Zimbabwe. In light of the foregoing, it is evident that there is a growing interest and need for research in strategy and SMEs, however the gap of SME owner-managers as strategic leaders and the strategic leadership factors to be practiced for SME success is still unexplored within the Zimbabwean SME context.
Research on strategic leadership in SMEs has not received prominence, hence needs to be explored further. Therefore, the research on which this paper is based, explored the role of strategic leadership and the implementation of strategies by SME owner-managers to close this gap in the literature on SMEs failure. The research findings
reported in this paper are based on self-reports by owner-managers in Furthermore, [24], explored what Malawian entrepreneurs as strategic leaders of their entrepreneurial SMEs did to ensure the growth and survival of their firms in a dynamic and competitive business environment. Based on a purposive sampling strategy, twelve local strategic leaders were identified from six entrepreneurial SMEs. Results indicated that strategic leaders, as entrepreneurs displayed four interrelated individual characteristics namely: opportunity-seeking wisdom, the creation of appropriate social capital, entrepreneurial resilience, curiosity, and practice-led learning.
In the context of Zimbabwe, [25] explored the role of strategic management in enhancing the growth of SMEs in Zimbabwe, but did not mention strategic leadership. In addition, [26] investigated the role of strategic leadership in strategy implementation in Zimbabwe’s state-owned enterprises, while [27] conducted research on the factors influencing marketing planning and implementation in Zimbabwean SMEs. [28] investigated the role of leadership styles on SME performance in Zimbabwe. In light of the foregoing, it is evident that there is a growing interest and need for research in strategy and SMEs, however the gap of SME owner-managers as strategic leaders and the strategic leadership factors to be practiced for SME success is still unexplored within the Zimbabwean SME context.
Research on strategic leadership in SMEs has not received prominence, hence needs to be explored further. Therefore, the research on which this paper is based, explored the role of strategic leadership and the implementation of strategies by SME owner-managers to close this gap in the literature on SMEs failure. The research findings reported in this paper are based on self-reports by owner-managers in Zimbabwean SMEs, who are the supposed strategic leaders in their enterprises.
1.1 Problem investigated
Effective strategic leadership seems to be a challenge in developing country SMEs due to the high failure rates and inability to succeed beyond the critical three year time line. The lack of strategic leadership has been found to be a constraint in the organisation’s quest for competitiveness, performance, sustainability and ultimately, success [29]. Many SMEs are failing to meet their set targets as a result of their limited exposure to strategic leadership; knowledge of strategic leadership is critical due to a myriad of demands from an organisation’s array of shareholders and stakeholders [30] and [31].
147
The problem in developing country SMEs, and specifically in Zimbabwe, is that 85% of SMEs are failing. Literature shows that without effective strategic leadership, firms will find it difficult to survive the global economic challenges in future. Therefore, the purpose of this paper is to report on the study that explored strategic leadership and the leadership strategies used by current successful SME owner- managers in the manufacturing and engineering sector to succeed beyond the critical time-line of three years. This study adopted the SME definition of the [32], that is, small enterprise: has 10 to 50 employees and medium enterprises have a workforce ranging from 51 to 100 employees.
1.2 Definition of Key Terms
Table 1 presents the key terms used in this study.
Table 1: Definition of Key Terms
2. Literature Review
2.1 The context of Strategic leadership
One of the key differences between leadership and strategic leadership, noted by [39] is that leadership theory refers to leaders at any level in the organisation, whereas strategic leadership theory relates to the study of people situated at the apex of the organisation. On the other hand, [40], argued that leadership could be understood from four dimensions namely: 1) The person: who are the leaders?; 2) The result: Is it what is achieved by leaders that make them who they are, as leaders?; 3) The position: Does where leaders operate make them leaders?; and 4) The process: Does the process of how leaders get things done distinguish them from non-leaders?. Strategic theory of leadership is concerned with the leadership “of” organisations [41] as opposed to leadership “in” organisations, which is the primary focus of supervisory leadership. Supervisory leadership focuses on the achievement of tasks, it primarily involves individuals, and its time horizon is medium to short-term [42].
The distinction between supervisory leadership and strategic leadership is well articulated by [43] who opined that strategic leadership influence extends to the organisation in its entirety or its major components, whilst supervisory leaders exert their influence primarily on their subordinates. On the other hand, strategic leadership as a responsibility has been viewed by other researchers as permeating all the management levels of the organisation- first line, middle, and top management - and not being limited to only the top management [44] and [45]. Researchers have also focused on leadership as a position and argued that strategic leaders focus on both (day –to-day) - operational issues, and the long- term strategic orientation of the organisation [46]. Reference [39]’s opinion is supported by [47], who argued that leadership refers to the process of influencing other people in an organisation in order to attain the set mission and objectives of the organisation, while strategic leadership focuses on the strategy of the organisation.
Reference [48], cited in [49], proposed what was then known as ‘upper echelon theory’ which asserted that, since leaders operate at a strategic level, organisations are reflections of the personality and values of their top managers, known as The Top Management Team(TMT). The specific knowledge, experience, capabilities, value systems, and preferences of top managers will ultimately influence the choices they make about strategies for their particular organisations [49].
148
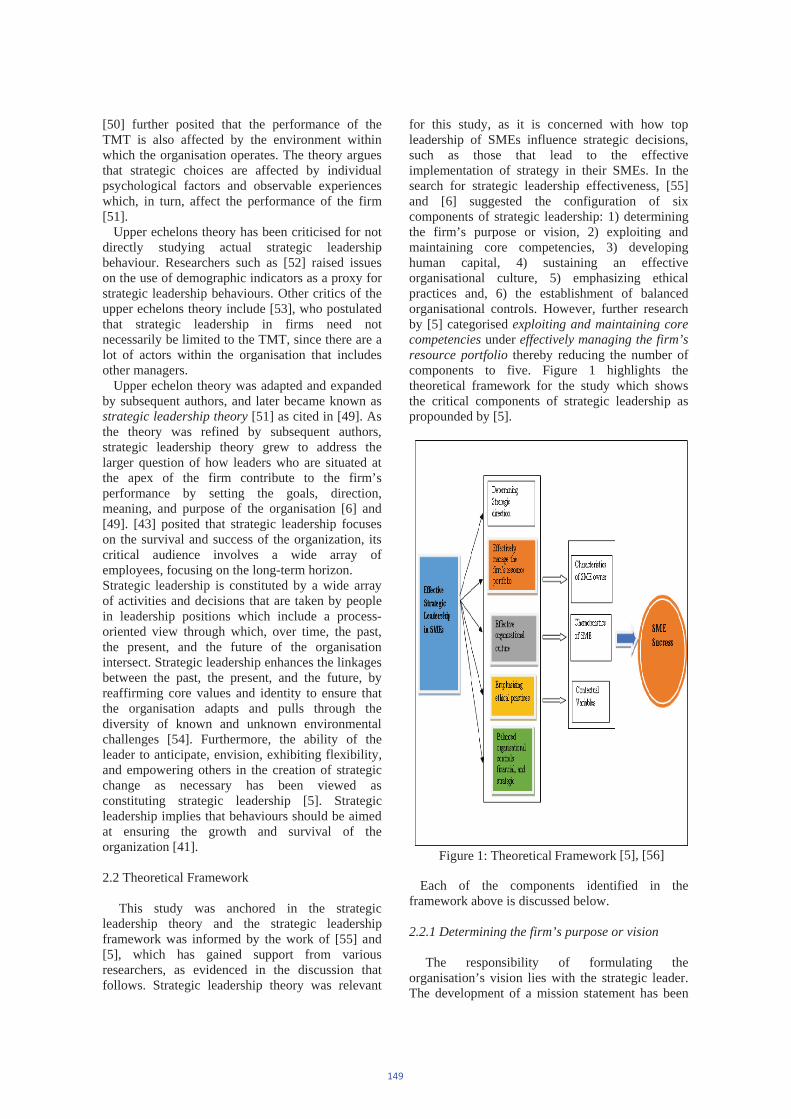
[50] further posited that the performance of the TMT is also affected by the environment within which the organisation operates. The theory argues that strategic choices are affected by individual psychological factors and observable experiences which, in turn, affect the performance of the firm [51].
Upper echelons theory has been criticised for not directly studying actual strategic leadership behaviour. Researchers such as [52] raised issues on the use of demographic indicators as a proxy for strategic leadership behaviours. Other critics of the upper echelons theory include [53], who postulated that strategic leadership in firms need not necessarily be limited to the TMT, since there are a lot of actors within the organisation that includes other managers.
Upper echelon theory was adapted and expanded by subsequent authors, and later became known as strategic leadership theory [51] as cited in [49]. As the theory was refined by subsequent authors, strategic leadership theory grew to address the larger question of how leaders who are situated at the apex of the firm contribute to the firm’s performance by setting the goals, direction, meaning, and purpose of the organisation [6] and [49]. [43] posited that strategic leadership focuses on the survival and success of the organization, its critical audience involves a wide array of employees, focusing on the long-term horizon. Strategic leadership is constituted by a wide array of activities and decisions that are taken by people in leadership positions which include a process-oriented view through which, over time, the past, the present, and the future of the organisation intersect. Strategic leadership enhances the linkages between the past, the present, and the future, by reaffirming core values and identity to ensure that the organisation adapts and pulls through the diversity of known and unknown environmental challenges [54]. Furthermore, the ability of the leader to anticipate, envision, exhibiting flexibility, and empowering others in the creation of strategic change as necessary has been viewed as constituting strategic leadership [5]. Strategic leadership implies that behaviours should be aimed at ensuring the growth and survival of the organization [41].
2.2 Theoretical Framework
This study was anchored in the strategic leadership theory and the strategic leadership framework was informed by the work of [55] and [5], which has gained support from various researchers, as evidenced in the discussion that follows. Strategic leadership theory was relevant
for this study, as it is concerned with how top leadership of SMEs influence strategic decisions, such as those that lead to the effective implementation of strategy in their SMEs. In the search for strategic leadership effectiveness, [55] and [6] suggested the configuration of six components of strategic leadership: 1) determining the firm’s purpose or vision, 2) exploiting and maintaining core competencies, 3) developing human capital, 4) sustaining an effective organisational culture, 5) emphasizing ethical practices and, 6) the establishment of balanced organisational controls. However, further research by [5] categorised exploiting and maintaining core competencies under effectively managing the firm’s resource portfolio thereby reducing the number of components to five. Figure 1 highlights the theoretical framework for the study which shows the critical components of strategic leadership as propounded by [5].
Figure 1: Theoretical Framework [5], [56]
Each of the components identified in the framework above is discussed below.
2.2.1 Determining the firm’s purpose or vision
The responsibility of formulating the organisation’s vision lies with the strategic leader. The development of a mission statement has been
149
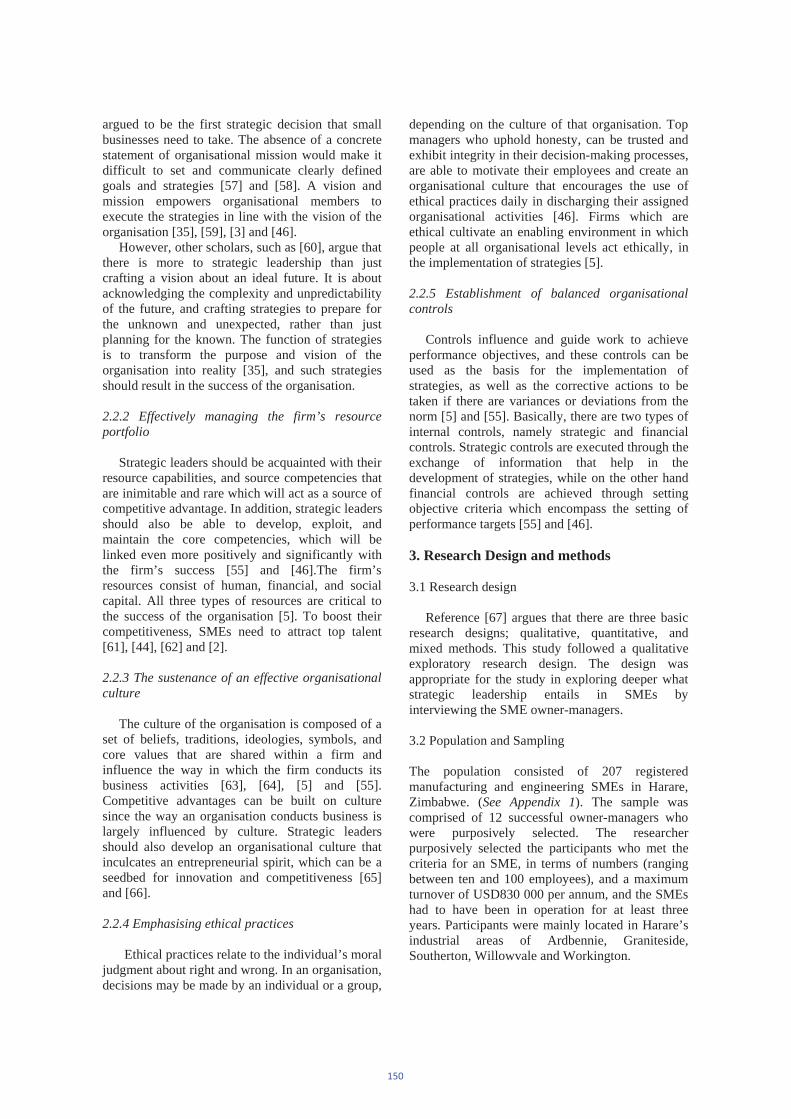
argued to be the first strategic decision that small businesses need to take. The absence of a concrete statement of organisational mission would make it difficult to set and communicate clearly defined goals and strategies [57] and [58]. A vision and mission empowers organisational members to execute the strategies in line with the vision of the organisation [35], [59], [3] and [46].
However, other scholars, such as [60], argue that there is more to strategic leadership than just crafting a vision about an ideal future. It is about acknowledging the complexity and unpredictability of the future, and crafting strategies to prepare for the unknown and unexpected, rather than just planning for the known. The function of strategies is to transform the purpose and vision of the organisation into reality [35], and such strategies should result in the success of the organisation.
2.2.2 Effectively managing the firm’s resource portfolio
Strategic leaders should be acquainted with their resource capabilities, and source competencies that are inimitable and rare which will act as a source of competitive advantage. In addition, strategic leaders should also be able to develop, exploit, and maintain the core competencies, which will be linked even more positively and significantly with the firm’s success [55] and [46].The firm’s resources consist of human, financial, and social capital. All three types of resources are critical to the success of the organisation [5]. To boost their competitiveness, SMEs need to attract top talent [61], [44], [62] and [2].
2.2.3 The sustenance of an effective organisational culture
The culture of the organisation is composed of a set of beliefs, traditions, ideologies, symbols, and core values that are shared within a firm and influence the way in which the firm conducts its business activities [63], [64], [5] and [55]. Competitive advantages can be built on culture since the way an organisation conducts business is largely influenced by culture. Strategic leaders should also develop an organisational culture that inculcates an entrepreneurial spirit, which can be a seedbed for innovation and competitiveness [65] and [66].
2.2.4 Emphasising ethical practices
Ethical practices relate to the individual’s moral judgment about right and wrong. In an organisation, decisions may be made by an individual or a group,
depending on the culture of that organisation. Top managers who uphold honesty, can be trusted and exhibit integrity in their decision-making processes, are able to motivate their employees and create an organisational culture that encourages the use of ethical practices daily in discharging their assigned organisational activities [46]. Firms which are ethical cultivate an enabling environment in which people at all organisational levels act ethically, in the implementation of strategies [5].
2.2.5 Establishment of balanced organisational controls
Controls influence and guide work to achieve performance objectives, and these controls can be used as the basis for the implementation of strategies, as well as the corrective actions to be taken if there are variances or deviations from the norm [5] and [55]. Basically, there are two types of internal controls, namely strategic and financial controls. Strategic controls are executed through the exchange of information that help in the development of strategies, while on the other hand financial controls are achieved through setting objective criteria which encompass the setting of performance targets [55] and [46].
3. Research Design and methods
3.1 Research design
Reference [67] argues that there are three basic research designs; qualitative, quantitative, and mixed methods. This study followed a qualitative exploratory research design. The design was appropriate for the study in exploring deeper what strategic leadership entails in SMEs by interviewing the SME owner-managers.
3.2 Population and Sampling
The population consisted of 207 registered manufacturing and engineering SMEs in Harare, Zimbabwe. (See Appendix 1). The sample was comprised of 12 successful owner-managers who were purposively selected. The researcher purposively selected the participants who met the criteria for an SME, in terms of numbers (ranging between ten and 100 employees), and a maximum turnover of USD830 000 per annum, and the SMEs had to have been in operation for at least three years. Participants were mainly located in Harare’s industrial areas of Ardbennie, Graniteside, Southerton, Willowvale and Workington.
150

3.3 Data collection
The purpose, aims and the expected outcomes of the research were explained to participants before the commencement of the face-to face semi structured interviews. Consent was sought from participants to proceed with data collection and recordings of interviews. Participants were informed that participation was voluntary, that there were no incentives available to them for participating and that they were at liberty to discontinue with the interview at any given point in time without any harm on their part. By the 12th interview theoretical data saturation was evident since there were no new themes emerging from the data.
3.4 Data analyses
The researcher used the principles and process of coding borrowed from grounded theory and thematic analysis to analyse the data transcripts [68]. Coding is the core process in grounded theory, data is combined for themes, topics, phrases, categories and ideas are inductively generated [69] and [70]. Open coding is the first step of data analysis where raw data, important words, or groups of words were labelled. In vivo codes were used as a label to form categories of similar phenomenon [71]. At this stage, the researcher asks a number of questions, among them: ‘What is this data a study of?’, ‘What category does this incident indicate?’, ‘What is actually happening in the data?’, and ‘What is the main concern being faced by the participants?’[72]. Axial coding is the second step in the coding process, and categories were related to their sub-categories, and the relationships compared against data [73]. Axial coding entails the continuation of asking questions and making comparisons, and the inductive and deductive thinking process of relating sub categories to a category [74]. Constant comparison followed which is a simultaneous process where data is coded and analysed, to see if the data support and continue to support emerging themes [70] and [75].
4. Findings
The findings presented here were related to the exploration of whether the successful strategic leaders practiced strategic leadership or not, based on its five major components namely: establishing strategic direction; the effective management of the firm’s resource portfolio; the sustenance of an effective organisational culture; emphasizing ethical practices and the establishment of balanced
organisational controls. The biographical data of participants is shown in Table 2 below. Table 2 reflects that males constituted 75% of the participants indicating that the SME manufacturing and engineering sector is still a male- dominated area. It is also worth noting that 50% of the participants were aged below 40 years, which shows that the SME sector is the dominant sector that accommodates both young upcoming entrepreneurs and older entrepreneurs. With regard to work experience in their business, eight of the twelve participants had managed their SMEs for more than ten years, which showed that their work experience was sufficient that they may have opinions on strategic leadership. The findings in Table 2 further highlights the fact that half the number of participants possessed an Undergraduate diploma while 42% were bachelor degree holders. In view of this finding, one can conclusively argue that the SME sector is mainly dominated by graduates (diploma and degree holders).
Table 2: Biographic Data of Participants
The findings relate to five strategic areas that strategic leaders in successful SME are practicing namely: a) Establishing strategic direction(setting the
vision) b) The effective management of the firm’s
resource portfolio c) The sustenance of an effective organisational
culture
151
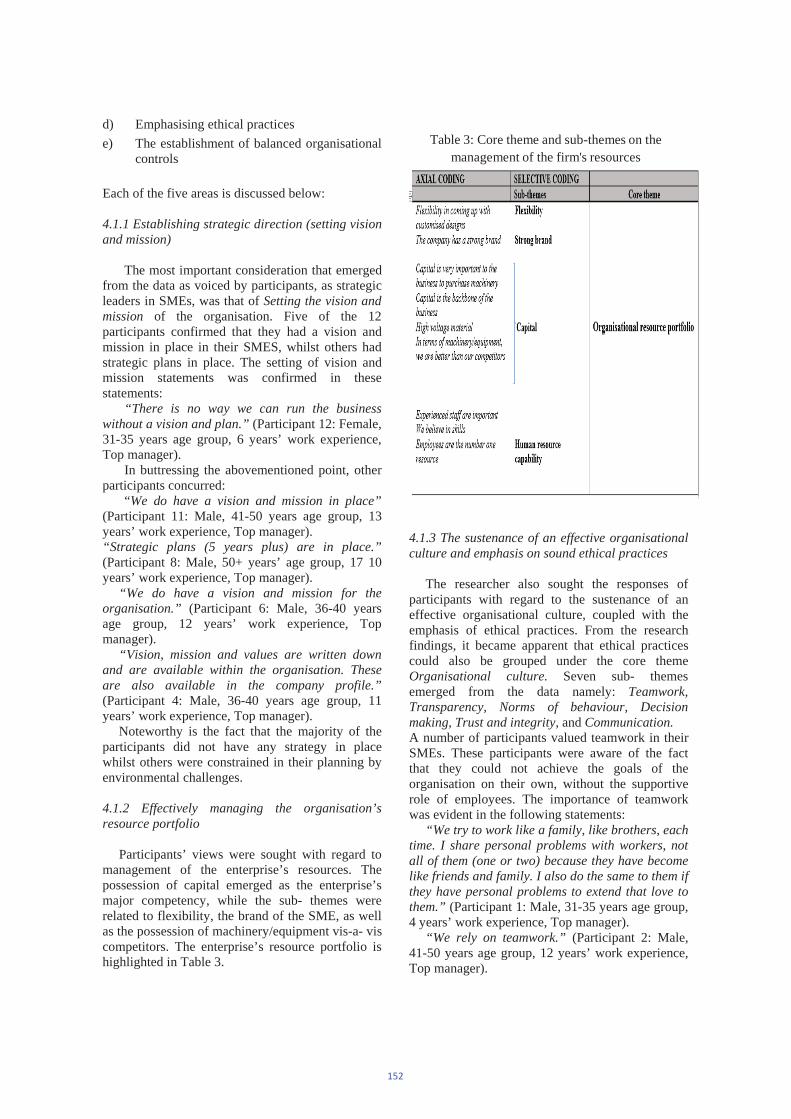
d) Emphasising ethical practices e) The establishment of balanced organisational
controls
Each of the five areas is discussed below:
4.1.1 Establishing strategic direction (setting vision and mission)
The most important consideration that emerged from the data as voiced by participants, as strategic leaders in SMEs, was that of Setting the vision and mission of the organisation. Five of the 12 participants confirmed that they had a vision and mission in place in their SMES, whilst others had strategic plans in place. The setting of vision and mission statements was confirmed in these statements:
“There is no way we can run the business without a vision and plan.” (Participant 12: Female, 31-35 years age group, 6 years’ work experience, Top manager).
In buttressing the abovementioned point, other participants concurred:
“We do have a vision and mission in place” (Participant 11: Male, 41-50 years age group, 13 years’ work experience, Top manager). “Strategic plans (5 years plus) are in place.” (Participant 8: Male, 50+ years’ age group, 17 10 years’ work experience, Top manager).
“We do have a vision and mission for the organisation.” (Participant 6: Male, 36-40 years age group, 12 years’ work experience, Top manager).
“Vision, mission and values are written down and are available within the organisation. These are also available in the company profile.” (Participant 4: Male, 36-40 years age group, 11 years’ work experience, Top manager).
Noteworthy is the fact that the majority of the participants did not have any strategy in place whilst others were constrained in their planning by environmental challenges.
4.1.2 Effectively managing the organisation’s resource portfolio
Participants’ views were sought with regard to management of the enterprise’s resources. The possession of capital emerged as the enterprise’s major competency, while the sub- themes were related to flexibility, the brand of the SME, as well as the possession of machinery/equipment vis-a- vis competitors. The enterprise’s resource portfolio is highlighted in Table 3.
Table 3: Core theme and sub-themes on the management of the firm's resources
4.1.3 The sustenance of an effective organisational culture and emphasis on sound ethical practices
The researcher also sought the responses of participants with regard to the sustenance of an effective organisational culture, coupled with the emphasis of ethical practices. From the research findings, it became apparent that ethical practices could also be grouped under the core theme Organisational culture. Seven sub- themes emerged from the data namely: Teamwork, Transparency, Norms of behaviour, Decision making, Trust and integrity, and Communication. A number of participants valued teamwork in their SMEs. These participants were aware of the fact that they could not achieve the goals of the organisation on their own, without the supportive role of employees. The importance of teamwork was evident in the following statements:
“We try to work like a family, like brothers, each time. I share personal problems with workers, not all of them (one or two) because they have become like friends and family. I also do the same to them if they have personal problems to extend that love to them.” (Participant 1: Male, 31-35 years age group, 4 years’ work experience, Top manager).
“We rely on teamwork.” (Participant 2: Male, 41-50 years age group, 12 years’ work experience, Top manager).
152
“We work like team building.” (Participant 12: Female, 31-35 years age group, 6 years’ work experience, Top manager).
“Internal relations are also very important to the business.” (Participant 4: Male, 36-40 years age group, 11 years’ work experience, Top manager).
“There is commitment on the part of employees.” (Participant 10: Female, 31-35 years age group, 7 years’ work experience, Top manager).
Decision-making was also one of the sub- themes emerging from the data. Although decision making can be a part of ethical practices, such decisions are also based on the cultural practices of the organisation. Participants had varied opinions, with some pointing out that, as owner-managers they made strategic decisions only while other managers made decisions depending on their level in the organisation. In other instances, employees would also be involved in the decision-making processes. The following statements highlight areas where strategic leaders made key decisions in their SMEs:
“There are some decisions that I do make myself. As much as we are a family, there are some decisions that I make alone. They have to understand that I am the leader. There are other critical areas where I make decisions on my own. For example, if we are tight on cash, I just approach the bank I don’t need to consult them, even in cases of financing orders and purchasing material.” (Participant 1: Male, 31-35 years age group, 4 years’ work experience, Top manager).
“You see the problem with SMEs is that power is normally concentrated in one individual and sometimes the issue of corporate governance is compromised.” (Participant 3: Male, 41-50 years age group, 11 years’ work experience, Top manager).
“Majority of decisions are made by us, the owners but we also involve workers.” (Participant 5: Male, 31-35 years age group, 6 years’ work experience, Top manager).
4.1.4 The establishment of balanced organisational goals
Establishing balanced organisational controls was the last major component to be investigated by the researcher to make a determination regarding whether such controls were present in SMEs. Strategic leaders should ensure that effective control systems are in place in a bid to reduce the level of deviations between planned and actual performance. The two main types of internal controls identified were strategic, which were accomplished through information exchanges, and
financial controls, which were achieved through the setting of performance targets [55] and [46]. All the participants concurred that having control systems in place was critical to the organisation in a variety of ways, including the safeguarding of company assets, measuring employee performance, and rewarding employees. These opinions are summarised in the following statements:
“Internal controls are available, everything is recorded.” (Participant 5: Male, 31-35 years age group, 6 years’ work experience, Top manager).
“We do have systems in place there is an internal audit department.” (Participant 6: Male, 36-40 years age group, 12 years’ work experience, Top manager).
“Internal controls are in place, there are strict controls on how to conduct business. Each and every section has its own laid down controls.” (Participant 8: Male, 50+ years’ age group, 17 years’ work experience, Top manager).
“The organisation has a Quality Management System (ISO 9002) which has built- in control systems. Controls are important without them we could be operating in darkness.” (Participant 11: Male, 41-50 years age group, 13 years’ work experience, Top manager).
“Systems and procedures are written.” (Participant 4: Male, 36-40 years age group, 11 years’ work experience, Top manager).
Employee performance was managed either through individual targets, or group performance targets. In instances where targets were not met the concerned individuals, groups or Supervisors had to give an explanation for the variance. The following are some of the statements that confirmed the setting of performance targets:
“Employee performance is managed through performance targets. If targets are not met, the supervisor is taken to task.” (Participant 1: Male, 31-35 years age group, 4 years’ work experience, Top manager).
“Employee performance is managed through individual performance targets. If employees do not meet set targets they will have to explain the reasons.” (Participant 2: Male, 41-50 years age group, 12 years’ work experience, Top manager).
“Employees have performance targets. End of every week performance is evaluated.” (Participant 6: Male, 36-40 years age group, 12 years’ work experience, Top manager).
“There are group targets to be met as well as individual incentives.” (Participant 7: Male, more than 51 years old, 16 years’ work experience, Top manager).
“Performance targets are set for individuals.” (Participant 8: Male, 50+ years’ age group, 17 years’ work experience, Top manager).
153
“Performance targets are set for the sales team.” (Participant 12: Female, 31-35 years age group, 6 years’ work experience, Top manager).
Regarding strategic controls, the majority of the strategic leaders confirmed that they normally communicated information to employees through formal weekly meetings. Such exchanges of information would then be used to develop strategies. The strategic leaders’ statements, below, confirmed the exchange of such information:
“Information is exchanged through weekly meetings.” (Participant 1: Male, 31-35 years age group, 4 years’ work experience, Top manager).
“Exchange of information within the organisation is normally through formal meetings.” (Participant 2: Male, 41-50 years age group, 12 years’ work experience, Top manager).
5. Discussion of findings
The main purpose of this study was to explore the prevalence and role of strategic leadership in successful SMEs in the manufacturing and engineering sector, leading to the success of these firms. The themes which emerged from the data are discussed below:
5.1 Theme 1: Strategic direction: vision, mission and strategic planning
Only five of the 12 participants confirmed that there they would not run their businesses without vision, mission statements, and strategic plans in place. Some of the mission and values of the organisations were written down and available within the organisation. There was great concurrence amongst all the SME strategic leaders in this regard. This finding confirmed the assertion of [57] in which they argued that the first responsibility of strategic leaders is to formulate the organisation’s vision and mission. Literature further confirms that strategic leaders set the vision for the organisation, make strategic decisions, and provide direction to the organisation [41], [61], [76] and [77].
Four of the strategic leaders found it difficult to set strategic plans due to the prevailing harsh economic environment especially from 2008, when the Zimbabwean economy plummeted to its current state. The findings also indicate that strategic planning was a daunting task since the strategic leaders could be overtaken by events while they are still in the process of planning, thus, rendering planning useless. The above findings are quite interesting in the sense that whilst some of these SMEs have not been engaged in some kind of planning since 2008, they have managed to stay
afloat, they are still operational up to today (2018). From the statements it is quite clear that the operating environment has posed great challenges to these SMEs but despite these adversities strategic leaders in such SMEs have been resilient in having their SMEs stay afloat for more than 9 years. Managers in these SMEs employed different strategies in order to survive which included:
a) Flexibility: “We are open to everyone, you can come up with your own design, you can come and change something that we have, if you want something unique” (Participant 1: Male, 31-35 years’ age group, 4 years’ working experience, Top manager). In this regard, SME owner managers rely on customization as a strategy in order to survive, which is also part of the differentiation strategies as argued by Michael Porter [78].
b) Reliance on brand name: “We have managed to build a strong brand over the years which customers are loyal to because of our performance over the years.” (Participant 3: Male, 41-50 years’ age group, 11 years’ work experience, Top manager).
c) Focus on quality: Some of the SME managers relied on the information they got from their salespersons and then focused on supplying quality products in order to remain competitive. “As you might be aware, our country has been invaded by so many suppliers from the Far East, and some of them bring substandard products but we have managed to keep abreast because of the quality products that we maintain.” (Participant 8: Male, 50+ years’ age group, 17 years’ work experience, Top manager). Quality as well has been identified as one of the key areas under Porter’s differentiation strategies [63].
d) Adaptation to the environment: In other instances, some SME owner managers adapted their operations in view of current customer needs as exemplified in the following statement: “We sell pumps, make boilers for small scale farmers, hot water boilers for chickens, different things come up at different times and different people want different things for different industries.” (Participant 9: Female, 50+ years’ age group, 19 years’ work experience, Top manager). These SMEs do not have a product strategy, they do not commit to a specific product line.
154
e) Pricing: Whilst some of the owner managers used pricing in order to remain competitive by underpricing their products as compared to those of competitors, others did not have a fixed price for their products, in fact they negotiated with customers. It was quite possible to have a specific type of product being sold to different customers at varying prices. “Wedon’t have a fixed price. Our competitors have a standard price. We compare our prices with competitors, so we don’t have a fixed price, we negotiate our prices. We have a major supplier who has a fixed price and then we add our mark up. At times we may have a markdown on our prices based on the supplier’s price especially where we can source the product from other suppliers.” (Participant 3: Male, 41-50 years’ age group, 11 years’ work experience, Top manager).
f) Cost containment and management: In managing costs, some of the SMEs did not stock products in warehouses. Instead they would just act like intermediaries in the sense that they would confirm orders with customers and then approach suppliers with orders that they would have secured from their customers. In the process, holding costs and insurance costs would be greatly reduced.
g) Transparency: Some SMEs relied on transparency in their daily activities. “We emphasize on faithfulness to the company, being true to our products, no underhand dealings. In fact that is one of the things that has made us to stand to this day. We never wanted to deal with our customers or anyone outside the organization in an unfaithful manner. In everything that we do is above board.” (Participant 8: Male: 50+ years’ age group, 17 years’ work experience, Top manager).
Some of the strategies mentioned above relate to Michael Porter’s generic strategies and relationship marketing which is a unique manner to ensure customer satisfaction. Relationship marketing aims to build relationships which are mutually beneficial with key stakeholders in order to attract and retain their business [78].
5.2 Theme 2: Effectively managing the firm’s resource portfolio
The second theme that emerged from the data was the competency of effectively managing the resources of the firm. Some of the participants indicated that they possessed machinery and equipment that was better than those of competitors. The possession of capital has been found to be important to the organisation. Capital can be exploited in a variety of ways, but its main function, as identified by participants was to purchase machinery and equipment. The majority of the strategic leaders were of the view that capital was the backbone of their firms, especially in this era of new and advanced technologies.
Human, financial, and social resources are pivotal to the success of the firm as postulated by [5] and [62]. The finding on human capital was also in line with the general human capital theory. [2] concurred with [5], that, for SMEs to be competitive in the market, they need to attract talent, especially employees with the requisite skills. However, there was some variation in the responses given by the strategic leaders in the quantitative phase, which contradicted the qualitative findings.
5.3 Theme 3: Organisational culture and ethical practices
A number of themes emerged from the qualitative findings related to the organisation’s culture and norms of behaviour. One of the themes was honesty. The strategic leaders practised what they said and set an example for their employees. As they pointed out, no one was above the laws, rules, and regulations of the company. Trust and integrity were some of the values espoused by the strategic leaders. Trust builds confidence in people, which also eliminates suspicion regarding the way people conduct business. Making unfulfilled promises to customers destroys trust, and leads to loss of confidence in the business. Owner-managers should therefore be a role model of trustworthy action to promote this value in the organisation. SME strategic leaders have to be trustworthy with regard to the payment dates for salaries.
Communication was one of the sub- themes to emerge from data, especially with regard to ethical practices in SMEs. Without effective communication, which has been argued by some scholars to be the lifeblood of every organisation, it would be difficult to attain organisational goals. If there are changes to the existing cultural values, then communication becomes imperative [5]. The strategic leaders confirmed that they communicated the ethical standards to employees in weekly meetings.
155
5.4 Theme 4: Strategic and control systems
The qualitative findings revealed that the strategic leaders had internal control systems in place; performance management systems and information management were applied in the SMEs. Some of the SMEs had a quality management systems (ISO 9002), which had built- in control systems from purchase, production, sales, and after sales service. An external audit company audited some of their internal processes and systems.
Many strategic leaders disseminated information through meetings and memoranda, whilst group and individual targets were used to manage performance. The above findings confirmed the literature in this regard, that strategic controls are attained through information exchanges that help to develop strategies, while on the other hand financial controls are accomplished through the setting of objective criteria, for instance, performance targets [55] and [46].
6. Managerial Implications and Recommendations
Results from the quantitative study and the qualitative findings confirmed that the majority of SME owner- managers provided direction to their organisations, had sound cultural, and ethical practices, had effective control systems in place and implemented strategies in their SMEs. Findings from this study may aid in the adoption of behaviours that are expected of strategic leaders. This study identified some of the strategies adopted by strategic leaders to stay afloat (unplanned strategies) including flexibility, reliance on brand, focus on quality, negotiable pricing, transparency, cost containment and management, as well as non- committal to a specific product line. It is therefore recommended that such strategies be adopted by strategic leaders whose SMEs are struggling. SME strategic leaders are therefore encouraged to broaden their understanding of strategic leadership, and to develop and nurture such critical knowledge, which could enhance the successful implementation of strategies in their firms.
Results from this study have shown that strategic leadership practices- the provision of strategic direction to the organisation, having systems and control, strategy management, and strategic implementation, coupled with a sound organisational culture, and ethical behaviours, can significantly reduce strategic leadership demands. The display of such strategic leadership knowledge can be a seedbed for Zimbabwean SME success. In light of the above, it is imperative that SME owner-
managers master the principles of strategic leadership with the aim of long term growth and success.
7. Conclusion
The findings indicated that Zimbabwean SME owner-managers and co-owners who succeeded beyond the three year time line practiced strategic leadership. The theoretical strategies were used but due to the socio-economic survival scenario in Zimbabwe they had to devise other means too. Generally, it has been established that successful SME owner managers do provide direction to their firms through strategic plans and short term plans; they have balanced organizational controls in place, their SMEs have strong organizational cultures and they also practice sound ethical practices.
On the contrary, these SME owners have developed new strategies for survival, which are not confirmed in formal strategic leadership literature, but apply to the informal strategic leadership process such as flexibility, branding, adaptation, transparency, pricing, cost containment and management, market intelligence and quality (informal relationship marketing strategies) in developing countries.
Acknowledgements: This paper is part of a PhD study at the NWU Business School, North-West University, Mafikeng, South Africa, with a broader context, using a mixed method sequential exploratory design. The authors would like to convey their sincere gratitude to North-West University for extending financial assistance to Mr Tendai Douglas Svotwa to undertake his PhD study.
REFERENCES
[1] H. S. Ng and D. M. H. Kee, “The core competence of successful owner-managed SMEs,” Manag. Decis., 56(1), 2018, 252–272.
[2] Oxford Economics, “SME Success Factors, A Global Study that Reveals the Key Drivers of Success for SMEs in 2017 and Beyond.” 2017. Available online: http://info.aliceapp.com/hubfs/Amex-Small-Business-Strategies.pdf?t=1497027864089, [Accessed 10 October 2017].
[3] R. D. Ireland and M. A. Hitt, “Achieving and maintaining strategic competitiveness in the 21st century: The role of strategic leadership,” Acad. Manag. Perspect,13(1), 1999, 43–57.
[4] M. A. Hitt, Ireland, R.D, and Hoskisson, R.E, Strategic Management, Competitiveness and
156

Globalization, Concepts and Cases, 6th ed. (Ohio: Thomson/South Western, 2004).
[5] M. A. Hitt, R. D. Ireland, and R. E. Hoskisson, “Strategic management: Globalization and competitiveness,” (Mason OH Thomson South-West., 2007).
[6] B. M. Bass, “Executive and Strategic Leadership.,” Int. J. Bus,12 (1), 2007.
[7] R, Strand, “Strategic leadership of corporate sustainability,” J. Bus. Ethics, 123(4), 2014, 687–706.
[8] Nastase, M., “Developing a Strategic Leadership Approach within the Organisations,” Review of International Comparative Management, 2 (3), 2010, 454–460.
[9] M. Bennedsen, F. Perez-Gonzalez, and D. Wolfenzon, “Do CEOs Matter?,” 2006.
[10] Z. Simsek, J. J. Jansen, A. Minichilli, and A. Escriba-Esteve, “Strategic leadership and leaders in entrepreneurial contexts: A nexus for innovation and impact missed?,” J. Manag. Stud, 52(4), 2015, 463–478.
[11] W. G. Astley and A. H. Van de Ven, “Central perspectives and debates in organization theory,” Adm. Sci. Q, 1983, 245–273.
[12] H. Van de Ven, “The development of an infrastructure for entrepreneurship,” J. Bus. Ventur.,1993, 211–230.
[13] B. J. Davies and B. Davies, “Strategic leadership,” Sch. Leadersh. Manag., 24( 1), 2004, 29–38.
[14] G. Rowe and M. H. Nejad, “Strategic leadership: Short-term stability and long-term viability,” Ivey Bus. J., 73(5), 2009, 2–6.
[15] A. Morrison, “SME management and leadership development: market reorientation,” J. Manag. Dev., 22(9), 2003, 796–808.
[16] X. Huang, “Strategic decision making in Chinese SMEs,” Chin. Manag. Stud., 3( 2),2009. 87–101.
[17] Gold, J, Anderson, L, Kempster, S, George, M, and Thorpe, R, “What works in SME Management and Leadership Development.” 2007.
[18] V. L. Crittenden and W. F. Crittenden, “Building a capable organization: The eight levers of strategy implementation,” Bus. Horiz.,51(4), 2008, 301–309.
[19] A. Ates, “Strategy process in manufacturing SMEs (Small Medium Enterprises),” PhD Thesis, University of Strathclyde, Scotland, 2008.
[20] A. Ates and U. Bititci, “Strategy dynamics in small to medium-sized enterprises: Evidence from UK manufacturing SMEs,” in 16th
International European Operations Management Association Conference, 2009.
[21] A. Ates, P. Garengo, P. Cocca, and U. Bititci, “The development of SME managerial practice for effective performance management,” J. Small Bus. Enterp. Dev.,20(1), 2013, 28–54.
[22] C. Jooste and B. Fourie, “The role of strategic leadership in effective strategy implementation: Perceptions of South African strategic leaders,” South. Afr. Bus. Rev., 13(3),2009.
[23] Karda, L, “The Strategic Leadership of Small and Medium Enterprises.” (University of West Hungary, 2009).
[24] M. Kanyangale, “Exploring the strategic leadership of small and medium size entrepreneurs in Malawi,” J. Contemp. Manag., 14 (1), 2017, 482–508.
[25] Msasanure, M and Mtisi, S, “The Role of Strategic Management in Enhancing the Growth of SMEs in Zimbabwe with Special Reference to the City of Bulawayo.” (University of Johannesburg, 2012).
[26] D. Mapetere, S. Mavhiki, T. Nyamwanza, S. Sikomwe, and C. Mhonde, “Strategic role of leadership in strategy implementation in Zimbabwe’s state owned enterprises,” Int. J. Bus. Soc. Sci., 3(16), 2012.
[27] T. Mpofu and S. Chigwende, “Factors influencing marketing planning and implementation in Zimbabwean SMEs,” Int. J. Sci. Basic Appl. Res,12(1), 2013, 82–92.
[28] Gunhe, P, “Effects of Leadership styles on SMEs Performance: A Survey on Selected SMEs in Zimbabwe.” (Midlands State University, Gweru, 2014).
[29] P. Bansal and M. R. DesJardine, “Business sustainability: It is about time,” Strateg. Organ., 12(1), 2014, 70–78.
[30] A. Carmeli, A. Tishler, and A. C. Edmondson, “CEO relational leadership and strategic decision quality in top management teams: The role of team trust and learning from failure,” Strateg. Organ., 10(1), 2012, 31–54.
[31] S. M. Carter and C. R. Greer, “Strategic leadership: Values, styles, and organizational performance,” J. Leadersh. Organ. Stud.,20 (4), 2013, 375–393.
[32] Government of Zimbabwe, “Industrial Development Policy, 2012-2016.” (Ministry of Industry and Commerce, 2012).
[33] M. Porter, “What is Strategy?,” Harvard. Business. Review, 1996, 61–78.
[34] D. C. Hambrick, “Putting Top Managers back in the Strategy picture- Introduction,”
157
Strategic. Management. Journal, 10(SI), 1989, 5–15.
[35] B. Davies and B. J. Davies, “The Nature and Dimensions of Strategic Leadership,” ISEA,38(1), 2010, 5–21.
[36] R. Harrington, “The Moderating Effects of Size, Manager Tactics and Involvement on Strategy Implementation in Food Service,” International Journal of Hospitality. Management,25(3), 2006,373–397.
[37] Small Development Corporation of Zimbabwe, “Welcome to SEDCO.” Small Enterprise Development Corporation of Zimbabwe, 2010.
[38] G. Beaver, “Strategy and Management in the Smaller Enterprise,” Strategic. Change,11(4), 2002, 175–181.
[39] A. M. Pettigrew, “Commentary on the Donald Hambrick interview,” Acad. Manag. Exec., 15 (3), 2001, 42–44.
[40] K. Grint, Leadership: Limits and possibilities.Macmillan International Higher Education, 2005.
[41] K. B. Boal and R. Hooijberg, “Strategic leadership research: Moving on,” Leadersh. Q., 11(4), 2000, 515–549.
[42] E. Kur, “Developing leadership in organizations: a continuum of choices,” J. Manag. Inq., 4(2) 1995,198–206.
[43] H. Duursema, Strategic Leadership: Moving beyond the leader-follower dyad. 2013. (No. EPS-2013-279-ORG).
[44] M. A. Hitt, L. Bierman, K. Shimizu, and R. Kochhar, “Direct and moderating effects of human capital on strategy and performance in professional service firms: A resource-based perspective,” Acad. Manage. J.,44 (1), 2001, 13–28.
[45] S. J. Zaccaro, The nature of executive leadership: A conceptual and empirical analysis of success. (American Psychological Association, 2001).
[46] N. Slawinski, “Strategic leadership,” Cases Leadersh. (CA N. Y. Sage Publ., 2007).
[47] D. B. Zoogah, “Cultural value orientation, personality, and motivational determinants of strategic leadership in Africa,” Int. J. Leadersh. Stud., 4(2), 2009, 202–222.
[48] D. C. Hambrick and P. A. Mason, “Upper echelons: The organization as a reflection of its top managers,” Acad. Manage. Rev., 9(2),1984, 193–206.
[49] K. A. Phipps and M. E. Burbach, “Strategic leadership in the nonprofit sector: Opportunities for research,” J. Behav. Appl. Manag., 11(2), 2010, 137.
[50] S. Finkelstein, D. C. Hambrick, and A. A. Cannella, Strategic leadership: Theory and research on executives, top management teams, and boards. Strategic Management (Oxford University, 2009).
[51] S. Finkelstein and D. C. Hambrick, “Top-management-team tenure and organizational outcomes: The moderating role of managerial discretion,” Adm. Sci. Q., 1990, 484–503.
[52] R. L. Priem, D. W. Lyon, and G. G. Dess, “Inherent limitations of demographic proxies in top management team heterogeneity research,” J. Manag., 25(6), 1999, 935–953.
[53] M. Kriger and Y. Zhovtobryukh, “Rethinking strategic leadership: stars, clans, teams and networks,” J. Strategy Manag., 6(4), 2013, 411–432.
[54] Boal, K.L, “Strategic Leadership.” In G. R. Goethals, G. J. Sorenson, & J. M. Burns (Eds.), Encyclopedia of Leadership, (Sagepublications, 2004).
[55] M. A. Hitt, R. D. Ireland, and J. S. Harrison, “Mergers and acquisitions: a value creating or value destroying strategy?,” Blackwell Handb. Strateg. Manag., 2005, 377–402.
[56] N. Indarti and M. Langenberg, “Factors affecting business success among SMEs: Empirical evidences from Indonesia,” Second Bi-Annu. Eur. Summer Univ., 2004, 19.
[57] M. Taghi Alavi and A. Karami, “Managers of small and medium enterprises: mission statement and enhanced organisational performance,” J. Manag. Dev., 28(6), 2009, 555–562.
[58] C. N. Toftoy and J. Chatterjee, “Mission statements and the small business,” Bus. Strategy Rev., 15(3), 2004, 41–44.
[59] A. Hagen, R. Vaicys, and M. Hassan, “Suggested Strategies For Effective Implementation Of Strategic Leadership Practices In This Globalization Era,” Int. Bus. Econ. Res. J. IBER, 1(6), 2011.
[60] T. Quong and A. Walker, “Seven principles of strategic leadership.,” Int. Stud. Educ. Adm. Commonw. Counc. Educ. Adm. Manag. CCEAM, 38(1), 2010.
[61] E. Frantz, A. Dugan, K. Hinchberger, B. Maseth, O. Al Sharfa, and J. Al-Jaroodi, “SMEs: The effects of strategic management,” in Technology & Engineering Management Conference (TEMSCON), 2017 IEEE, 2017, 388–393.
[62] E. Lampadarios, “A qualitative perspective of Enterprise Success Factors for SMEs: a case study in the UK Chemical Distribution Industry,” Case Stud. Bus. Manag., 4(1), 2017, 49–76.
158
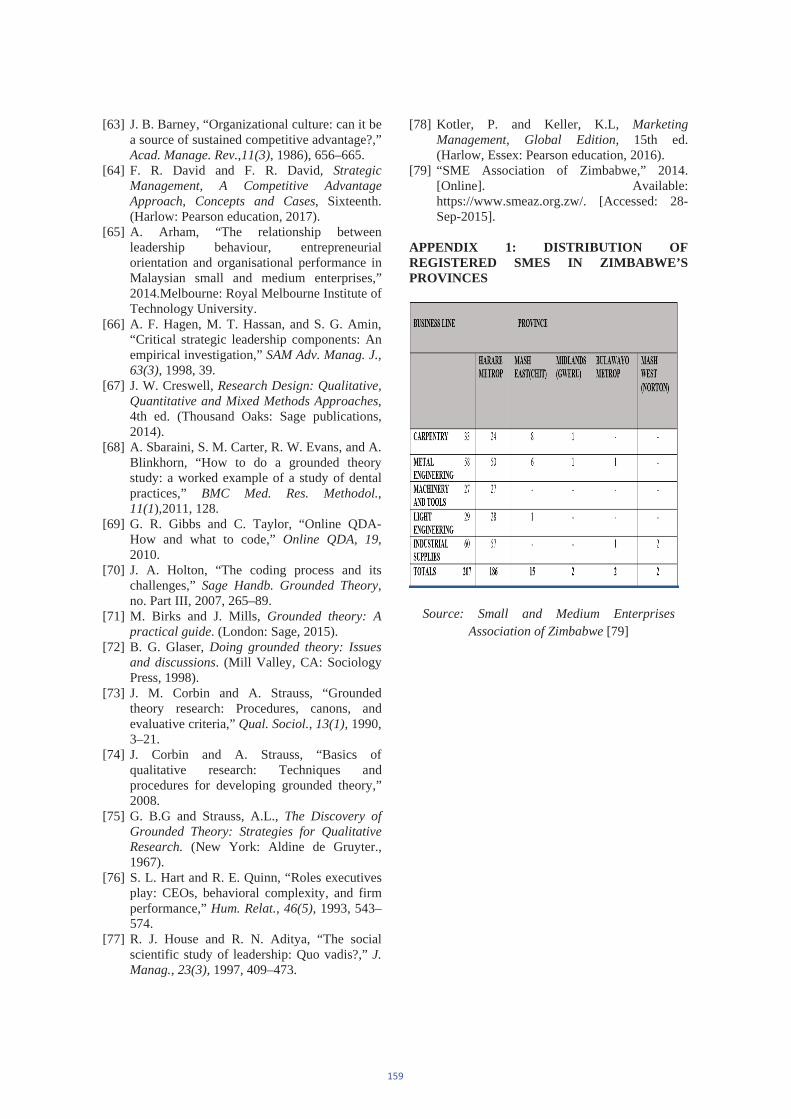
[63] J. B. Barney, “Organizational culture: can it be a source of sustained competitive advantage?,” Acad. Manage. Rev.,11(3), 1986), 656–665.
[64] F. R. David and F. R. David, Strategic Management, A Competitive Advantage Approach, Concepts and Cases, Sixteenth. (Harlow: Pearson education, 2017).
[65] A. Arham, “The relationship between leadership behaviour, entrepreneurial orientation and organisational performance in Malaysian small and medium enterprises,” 2014.Melbourne: Royal Melbourne Institute of Technology University.
[66] A. F. Hagen, M. T. Hassan, and S. G. Amin, “Critical strategic leadership components: An empirical investigation,” SAM Adv. Manag. J.,63(3), 1998, 39.
[67] J. W. Creswell, Research Design: Qualitative, Quantitative and Mixed Methods Approaches,4th ed. (Thousand Oaks: Sage publications, 2014).
[68] A. Sbaraini, S. M. Carter, R. W. Evans, and A. Blinkhorn, “How to do a grounded theory study: a worked example of a study of dental practices,” BMC Med. Res. Methodol.,11(1),2011, 128.
[69] G. R. Gibbs and C. Taylor, “Online QDA-How and what to code,” Online QDA, 19,2010.
[70] J. A. Holton, “The coding process and its challenges,” Sage Handb. Grounded Theory,no. Part III, 2007, 265–89.
[71] M. Birks and J. Mills, Grounded theory: A practical guide. (London: Sage, 2015).
[72] B. G. Glaser, Doing grounded theory: Issues and discussions. (Mill Valley, CA: Sociology Press, 1998).
[73] J. M. Corbin and A. Strauss, “Grounded theory research: Procedures, canons, and evaluative criteria,” Qual. Sociol., 13(1), 1990, 3–21.
[74] J. Corbin and A. Strauss, “Basics of qualitative research: Techniques and procedures for developing grounded theory,” 2008.
[75] G. B.G and Strauss, A.L., The Discovery of Grounded Theory: Strategies for Qualitative Research. (New York: Aldine de Gruyter., 1967).
[76] S. L. Hart and R. E. Quinn, “Roles executives play: CEOs, behavioral complexity, and firm performance,” Hum. Relat., 46(5), 1993, 543–574.
[77] R. J. House and R. N. Aditya, “The social scientific study of leadership: Quo vadis?,” J. Manag., 23(3), 1997, 409–473.
[78] Kotler, P. and Keller, K.L, Marketing Management, Global Edition, 15th ed. (Harlow, Essex: Pearson education, 2016).
[79] “SME Association of Zimbabwe,” 2014. [Online]. Available: https://www.smeaz.org.zw/. [Accessed: 28-Sep-2015].
APPENDIX 1: DISTRIBUTION OF REGISTERED SMES IN ZIMBABWE’S PROVINCES
Source: Small and Medium EnterprisesAssociation of Zimbabwe [79]
159
Cognitive Impacts Of Programme Revision In Teaching Design Sketching As A Modelling Tool For Industrial Design Courses At The University Of Botswana
Yaone Rapitsenyane, Victor Ruele, Matthews Ollyn, Thatayaone Mosepedi University of Botswana, Gaborone, Botswana
Email: [email protected]
Abstract Sketching is one of the creative design tools that allows designers to develop such behaviours as combining, restructuring, lateral and vertical transformation as well as experimentation. Empowering design undergraduate students with this capability requires agood balance between content and pedagogy. This paper reports on a case study research carried out between two groups of industrial design students who learned design sketching in the old programme against those who had just entered the revised programmes at the University of Botswana. The purpose of the study was to identify the extent to which the revised programme develops the sketching capability when compared to the old programme. Two cohorts of students were used in this study (First year students studying under the revised programme and final year students studying under the old programme). The reason for choosing these two cohorts was to compare the quality of the outcomes for new entrants into the revised programme and those who are at the exit level. The results show that the outcomes from the new entrants of the revised programme demonstrate more proficiency in sketching than the final years of the old programme. Students’ proficiency in sketching has been attributed to thedifferences in the amount, type and structure of content in both programmes as well pedagogical approaches. The authors conclude that a supportive hands-on approach to design sketching is critical at the early stages of a design programme in order to build confidence in students to freely express their thinking throughout their design careers.
Keywords Design sketching, industrial design undergraduate students, programme revision, pedagogy.
1. Introduction
Academic programmes are often developed to meet a need in a particular context, hence their development preluded by a situational analysis or needs assessment to inform among other things, the structure of the programme, content, teaching and learning strategies and assessment methods. The quality of the programme is then measured against its ability to; firstly, meet contextual needs, and its ability to be globally competitive. A number of actors including students, academics, administrators, sponsors, government, potential employers, regulating bodies, professional bodies and the society at large should be considered to determine the quality of an academic programme. This is usually at its inception or during review cycles. Such a holistic approach to programme development and review means certain notions of quality from various stakeholders will be captured. The new or revised programme should then reflect “quality exemplified in an exceptionally high standard; quality as transformation; quality in terms of fitness for purpose; quality as quest for zero defect; quality as value for money; and quality as a product evaluated against customer satisfaction” (Fourie, 2000; Harvey and Green, 1993; Strydom et al., 1997).
The Department of Industrial Design and Technology at the University of Botswana has recently revised its two undergraduate programmes (Bachelor of Industrial Design and Bachelor and Design and Technology Education) in order to meet the needs of various stakeholders targeted by the programmes. The first cohort of the approved revised programmes have just completed their Year 1 (August 2017 to May 2018). In a design programme sketching is a very crucial tool to support communication and expression of thoughts and ideas. Sketching supports the cognitive modelling activity (Archer, 1992; Dorst and Cross, 2001) that allows translation of human creative thinking, supported by certain creative behaviours to achieve a set or desired needs (Musta'amal, Norman and Hodgson, 2009). This paper compares students’ design sketching outcomes from the courses intended to impart this skill in both the old and the new programmes and makes observations on sketching as a tool for designers, pedagogical issues in the context of outcome based education to measure the effectiveness of programme revision.
2. Theoretical framework
2.1. Programme review and Outcome Based Education
160
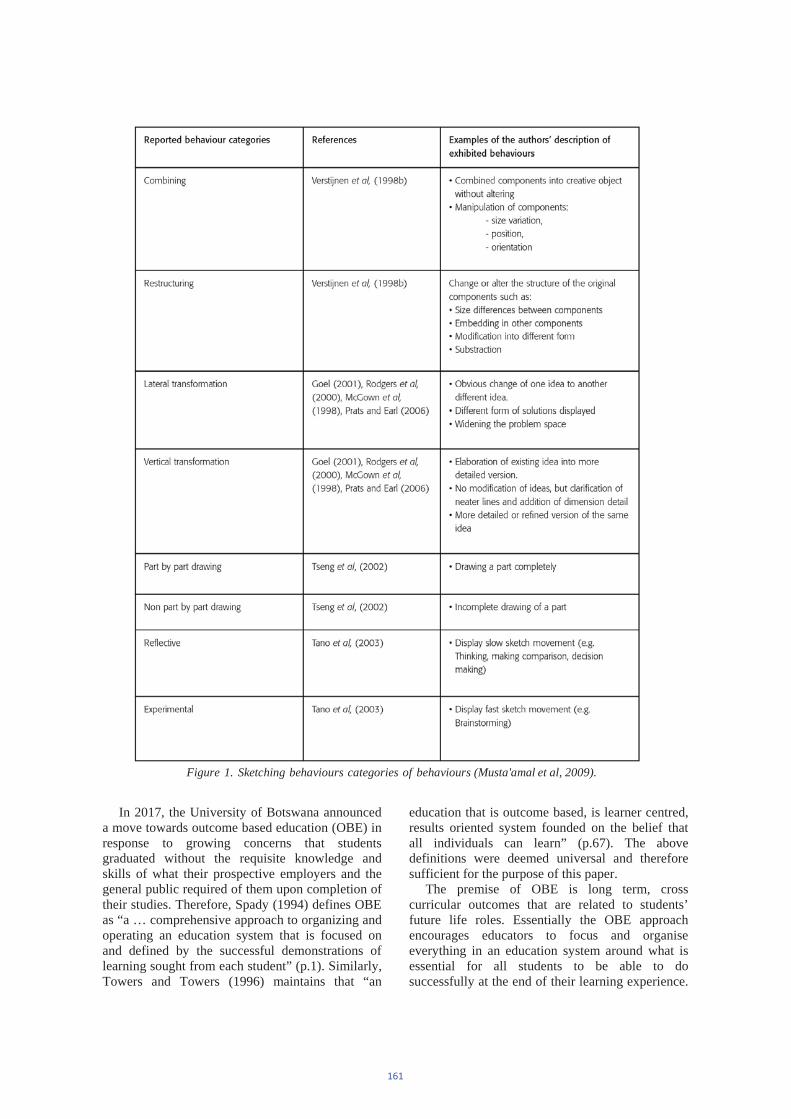
In 2017, the University of Botswana announced a move towards outcome based education (OBE) in response to growing concerns that students graduated without the requisite knowledge and skills of what their prospective employers and the general public required of them upon completion of their studies. Therefore, Spady (1994) defines OBE as “a … comprehensive approach to organizing and operating an education system that is focused on and defined by the successful demonstrations of learning sought from each student” (p.1). Similarly, Towers and Towers (1996) maintains that “an
education that is outcome based, is learner centred, results oriented system founded on the belief that all individuals can learn” (p.67). The above definitions were deemed universal and therefore sufficient for the purpose of this paper.
The premise of OBE is long term, cross curricular outcomes that are related to students’ future life roles. Essentially the OBE approach encourages educators to focus and organise everything in an education system around what is essential for all students to be able to do successfully at the end of their learning experience.
Figure 1. Sketching behaviours categories of behaviours (Musta'amal et al, 2009).
161
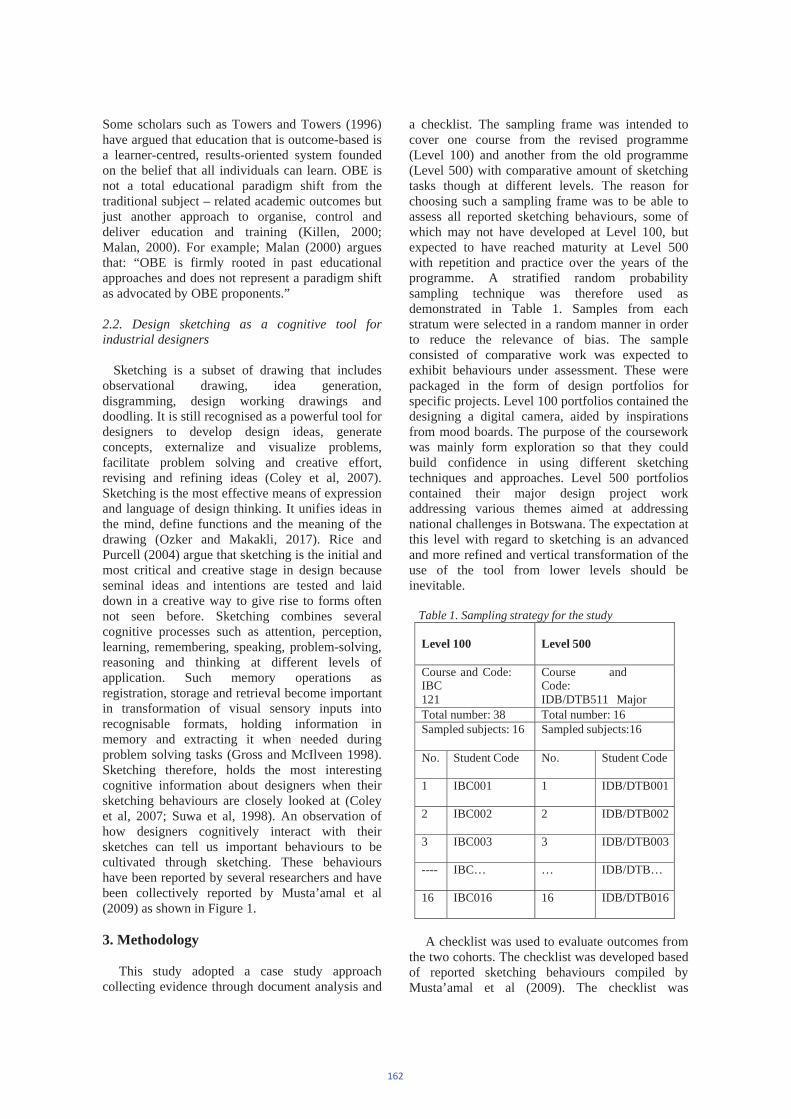
Some scholars such as Towers and Towers (1996) have argued that education that is outcome-based is a learner-centred, results-oriented system founded on the belief that all individuals can learn. OBE is not a total educational paradigm shift from the traditional subject – related academic outcomes but just another approach to organise, control and deliver education and training (Killen, 2000; Malan, 2000). For example; Malan (2000) argues that: “OBE is firmly rooted in past educational approaches and does not represent a paradigm shift as advocated by OBE proponents.”
2.2. Design sketching as a cognitive tool for industrial designers
Sketching is a subset of drawing that includes observational drawing, idea generation, disgramming, design working drawings and doodling. It is still recognised as a powerful tool for designers to develop design ideas, generate concepts, externalize and visualize problems, facilitate problem solving and creative effort, revising and refining ideas (Coley et al, 2007). Sketching is the most effective means of expression and language of design thinking. It unifies ideas in the mind, define functions and the meaning of the drawing (Ozker and Makakli, 2017). Rice and Purcell (2004) argue that sketching is the initial and most critical and creative stage in design because seminal ideas and intentions are tested and laid down in a creative way to give rise to forms often not seen before. Sketching combines several cognitive processes such as attention, perception, learning, remembering, speaking, problem-solving, reasoning and thinking at different levels of application. Such memory operations as registration, storage and retrieval become important in transformation of visual sensory inputs into recognisable formats, holding information in memory and extracting it when needed during problem solving tasks (Gross and McIlveen 1998). Sketching therefore, holds the most interesting cognitive information about designers when their sketching behaviours are closely looked at (Coley et al, 2007; Suwa et al, 1998). An observation of how designers cognitively interact with their sketches can tell us important behaviours to be cultivated through sketching. These behaviours have been reported by several researchers and have been collectively reported by Musta’amal et al (2009) as shown in Figure 1.
3. Methodology
This study adopted a case study approach collecting evidence through document analysis and
a checklist. The sampling frame was intended to cover one course from the revised programme (Level 100) and another from the old programme (Level 500) with comparative amount of sketching tasks though at different levels. The reason for choosing such a sampling frame was to be able to assess all reported sketching behaviours, some of which may not have developed at Level 100, but expected to have reached maturity at Level 500 with repetition and practice over the years of the programme. A stratified random probability sampling technique was therefore used as demonstrated in Table 1. Samples from each stratum were selected in a random manner in order to reduce the relevance of bias. The sample consisted of comparative work was expected to exhibit behaviours under assessment. These were packaged in the form of design portfolios for specific projects. Level 100 portfolios contained the designing a digital camera, aided by inspirations from mood boards. The purpose of the coursework was mainly form exploration so that they could build confidence in using different sketching techniques and approaches. Level 500 portfolios contained their major design project work addressing various themes aimed at addressing national challenges in Botswana. The expectation at this level with regard to sketching is an advanced and more refined and vertical transformation of the use of the tool from lower levels should be inevitable.
Table 1. Sampling strategy for the study
Level 100 Level 500
Course and Code:IBC121
Course and Code: IDB/DTB511 Major
Total number: 38 Total number: 16Sampled subjects: 16 Sampled subjects:16
No. Student Code No. Student Code
1 IBC001 1 IDB/DTB001
2 IBC002 2 IDB/DTB002
3 IBC003 3 IDB/DTB003
---- IBC… … IDB/DTB…
16 IBC016 16 IDB/DTB016
A checklist was used to evaluate outcomes from the two cohorts. The checklist was developed based of reported sketching behaviours compiled by Musta’amal et al (2009). The checklist was
162
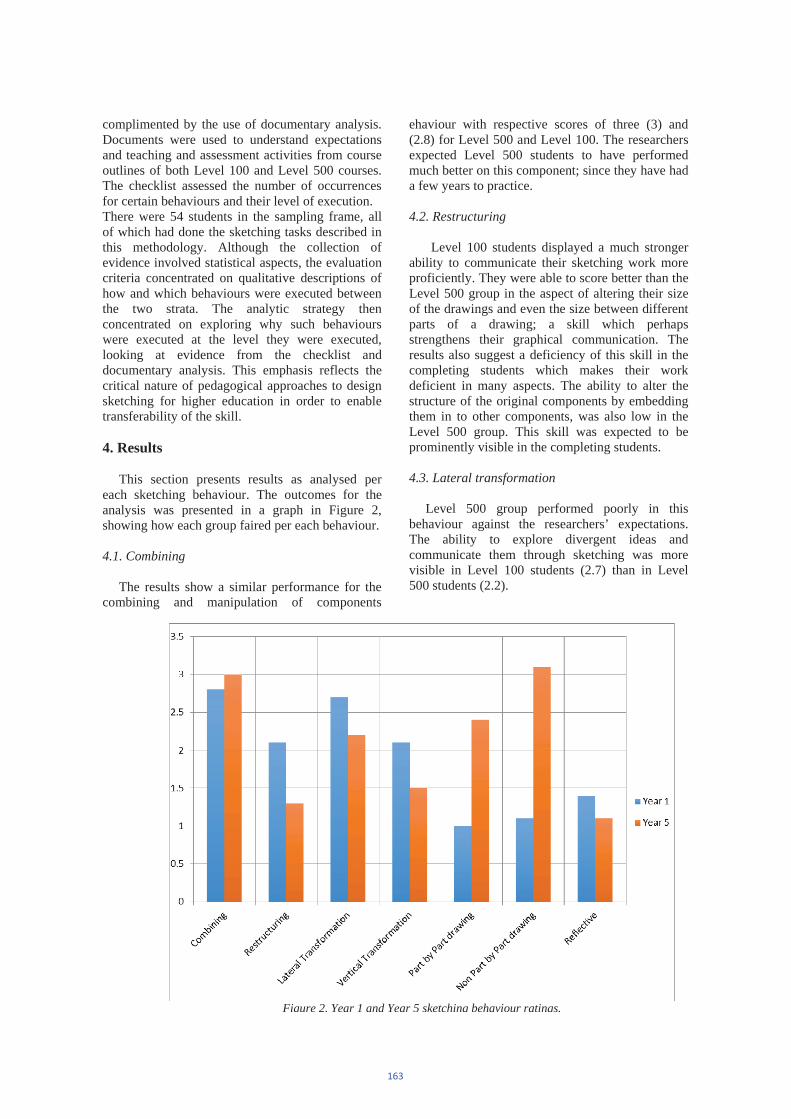
complimented by the use of documentary analysis. Documents were used to understand expectations and teaching and assessment activities from course outlines of both Level 100 and Level 500 courses. The checklist assessed the number of occurrences for certain behaviours and their level of execution. There were 54 students in the sampling frame, all of which had done the sketching tasks described in this methodology. Although the collection of evidence involved statistical aspects, the evaluation criteria concentrated on qualitative descriptions of how and which behaviours were executed between the two strata. The analytic strategy then concentrated on exploring why such behaviours were executed at the level they were executed, looking at evidence from the checklist and documentary analysis. This emphasis reflects the critical nature of pedagogical approaches to design sketching for higher education in order to enable transferability of the skill.
4. Results
This section presents results as analysed per each sketching behaviour. The outcomes for the analysis was presented in a graph in Figure 2, showing how each group faired per each behaviour.
4.1. Combining
The results show a similar performance for the combining and manipulation of components
ehaviour with respective scores of three (3) and (2.8) for Level 500 and Level 100. The researchers expected Level 500 students to have performed much better on this component; since they have had a few years to practice.
4.2. Restructuring
Level 100 students displayed a much stronger ability to communicate their sketching work more proficiently. They were able to score better than the Level 500 group in the aspect of altering their size of the drawings and even the size between different parts of a drawing; a skill which perhaps strengthens their graphical communication. The results also suggest a deficiency of this skill in the completing students which makes their work deficient in many aspects. The ability to alter the structure of the original components by embedding them in to other components, was also low in the Level 500 group. This skill was expected to be prominently visible in the completing students.
4.3. Lateral transformation
Level 500 group performed poorly in this behaviour against the researchers’ expectations. The ability to explore divergent ideas and communicate them through sketching was more visible in Level 100 students (2.7) than in Level 500 students (2.2).
Figure 2. Year 1 and Year 5 sketching behaviour ratings.
163

4.4. Vertical transformation
This behaviour has to do with spending more time on experimenting and developing ideas that have already been externalised. Interestingly the results show Level 100 students outsmarting the Level 500 students on this aspect. Level 500 are expected to have a more detailed or refined version of the same idea. Although the overall performance is below the half way mark for both groups, one would have expected the final year students to show composure and be clinical in showing a display of this skill by reason of their repeated application in different courses at various levels of the programme.
4.5. Part by Part and Non Part by Part drawing
There is a clear distinction between Level 100 and Level 500 students regarding this behaviour. Level 500 students exhibited more use of this behaviour. This can be attributed to demands of the Level 500 project requiring that part and non-part by part drawings be used at the detail design stage to facilitate prototyping. Students have to end their project with a working prototype. Therefore, these extra steps may have steered students to showing more advanced drawing skills.
4.6. Reflective
From the results Level 100 students demonstrate an upper hand in making comparison and decision making a little more confidently than the Level 500 group. The results show a gap in the thinking patterns of the two groups. This misfit may also be attributed to the fact that the new programme accords the learners a platform to internalize and even practice these movements earlier in the programme.
5. Discussion
It was generally observed that even fundamental sketching components such as quality and clarity of lines was a skill that Level 500 students struggled to display efficiently when compared to their juniors. An overview of the results shows that Level 500 students have an edge over Level 100 students in advanced sketching behaviours. However, this trait may be attributed to the nature of the Level 500 project; where there are requirements to have the product being designed and prototyped. Thus, exhibiting advanced skills on the use of sketching. Out of 1 – 5 Likert scale; the results reflects a behaviour competency level below average for both groups under investigation. The
average score of all attributes being investigated for Level 100 is 1.9 and 2.0 for the Level 500 group. However, these type of scores may be expected for the Level 100 students who are just being introduced to design sketching as a design communication tool. Level 100 students were just recently introduced to elements and principles of design. Moreover, the results from the Level 500 students may be interpreted as lack of drawing skills in the areas being investigated.
Level 100 students were observed to be performing slightly higher than Level 500 students on more than half of the behaviours being investigated; Reflective, Vertical and Lateral transformation as well as Restructuring. The logical expectation was that Level 500 students would perform better than Level 100 students in all components, due to their experience through different courses that needed the application of vertical transfer of knowledge and demonstration of acquisition of prior learning. Moreover, Level 500 students were also expected to manage their own progress as they apply all skills in the project, resembling a culmination of knowledge acquired over their entire study period.
The content delivery approach in the revised programme may have supported the development of most behaviours for Level 100 students. The course outline for the Level 100 group shows that the course content is more compact and focused in developing behaviours such as Combining, Restructuring and Lateral transformation with close supervision to make sure students followed the given instructions. Close monitoring of the Level 100 group may have been motivated by the department’s efforts towards seeking professional accreditation of the revised programmes. The hands on teaching approach also cultivated design thinking and decision making behaviours through insistence of the use of mood boards to drive design work. They were able to use the mood boards to come up with a variety of ideas and in-turn explore a lot in the solution space; exploring behaviours such as combining, restructuring and lateral transformation driven by cues from pictures in the mood boards.
6. Conclusions The results question several aspects in the old
programme for the Level 500 students. Was there continuity in sketching education in the years between (Level 200 and Level 400)? Despite the fact that the programme novices were being closely supervised and guided throughout the production of their sketches, one may also question the dismal display of preliminary skills by the Level 500 students as per the results. The crucial sketching
164
skills may have not being promptly infused in to the learners at an early stage. In light of the observations made from the results, the authors conclude that; he revised programme inculcates sketching behaviours early (Level 100) in the students, unlike in the old programme where they started sketching at Level 200 (second year). Sketching and related specific courses are also offered in 2 consecutive semesters as opposed to 1 semester in the old programme.
Less dense content coverage allows more practice in the revised programme and is practice based rather than theory based. Delivery of this content should be closely monitored so that there is consistency in the students’ outcomes at the end of the semester, regardless of who taught the course.
Assessment components should be practice based since the core focus of the sketching courses is developing the use of sketches as a design communication tool. Class tasks should also be broken down into small weekly chunks, feedback on which should be provided through the devil’s advocate to allow students to review others’ work and improve their own work.
Furthermore, we advocate for co-teaching and horizontal curriculum integration across courses offered in the same semester. This allows giving students manageable workloads, setting on manageable deadlines and offering consolidated support in different components of the same students’ design work. Vertical curriculum integration will be crucial when offering courses in the upper levels 200, 300, 400 and 500 to develop these skills further. During this integration, assessment should be used as a monitoring tool to develop the skill.
References
[1] Archer B. As complex as abc. In: Modelling: The Language of Designing. Editors: Roberts P., Archer B and Baynes K. Department of Design and Technology, Loughborough University, 1992.
[2] Coley F, Houseman O and Roy R. An introduction to capturing and understanding the cognitive behaviour of design engineers. Journal of Engineering Design, Vol 18(4), pp. 311-325, 2007.
[3] Dorst K and Cross N. Creativity in the design process: co-evolution of problem–solution. Design studies, Vol 22(5), pp. 425-437, 2001.
[4] Fourie M. Self-evaluation and external quality control at South African universities: Quo vadis. A paper presented at the 22nd annual EAIR Forum, Berlin, 6-9 September 2000.
[5] Gross R and McIlveen R. Psychology: A new introduction. Hodder & Stoughton Educational, London, 1998.
[6] Harvey L and Green D. Defining quality. Assessment & evaluation in higher education, Vol 18(1), pp. 9-34, 1993.
[7] Killen R. Outcomes-based education: Principles and possibilities. Unpublished manuscript, University of Newcastle, Faculty of Education, 2000.
[8] Malan S.P.T. The new paradigm of outcomes-based education in perspective. Journal of Family Ecology and Consumer Sciences, Vol 28(1), pp. 22-28, 2000.
[9] Musta'amal A.H., Norman E., and Hodgson T. Observing creative behaviours. In: The Design and Technology Association International Research Conference. Editors: Norman, E. and Spendlove, D. The Design and Technology Association, Wellesbourne, pp. 60-67, 2009.
[10] Ozke S. and Makakli E. S. Importance of sketching in the design process and education. Journal of Scienec and Technology, Vol 7(2), pp. 73-77, 2017.
[11] Rice, S. and Purcell, T. The importance of early design sketches in architectural education. The 38th International Conference of Architectural Science Association ANZAScA “Contexts of architecture”, Launceston, Tasmania, 10–12 November 2004, pp. 324-329, 2004.
[12] Spady W. G. Outcome-Based Education: Critical Issues and Answers. American Association of School Administrators, Arlington, 1994.
[13] Strydom A. H., Lategan L. O. K. and Muller A.: Editors. Enhancing institutional self-evaluation and quality in South African higher education: National and international perspectives. Unit for Research into Higher Education, University of the Orange Free State, Bloemfontein, 1997.
[14] Suwa M, Purcell T and Gero J. Macroscopic analysis of design processes based on a scheme for coding designers' cognitive actions. Design studies, Vol 19(4), pp. 455-483, 1998.
[15] Towers, G. C, and Towers, J. M. An elementary school principal's experience with implementing an outcome-based curriculum. Contemporary Education, Vol 68(1), pp. 67, 1996.
165

Job creation through Research: A perspective of the Tourism
sector in Tanzania
Keywords
1. Introduction
166
2. Literature Review
167
3. Methodology, Findings and Discussion
168
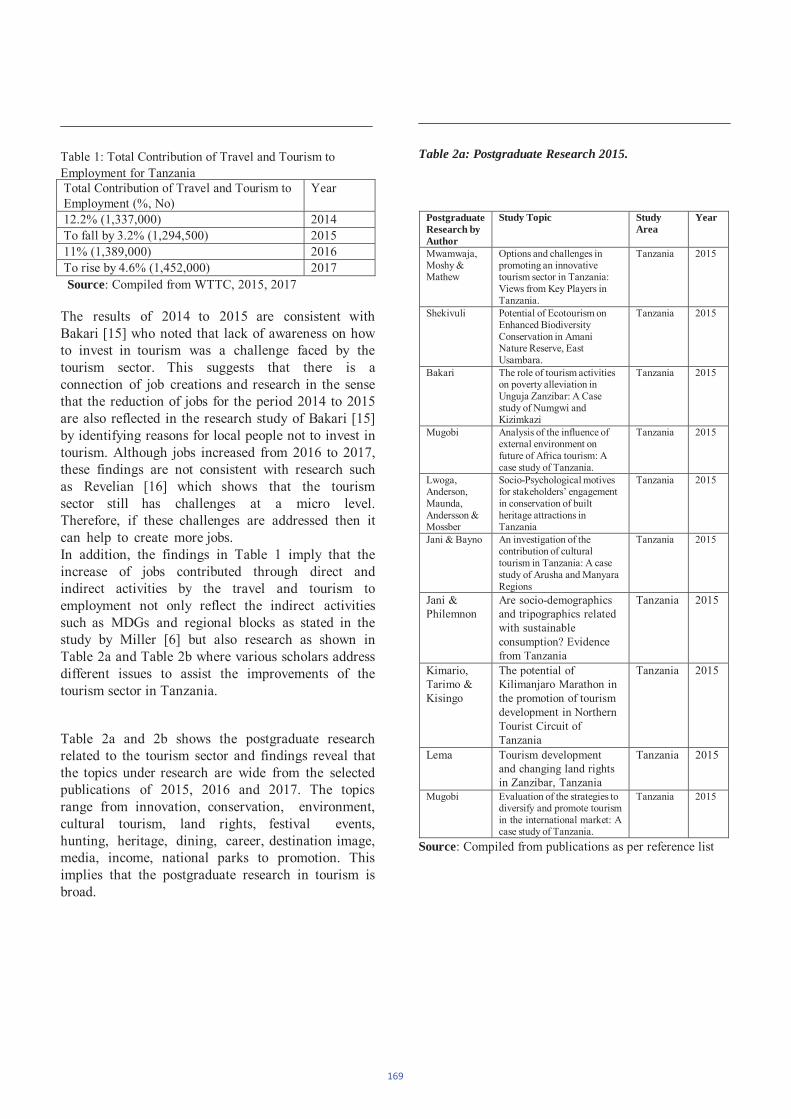
Postgraduate Research byAuthor
Study Topic StudyArea
Year
Table 2a: Postgraduate Research 2015.
Source
Source
169
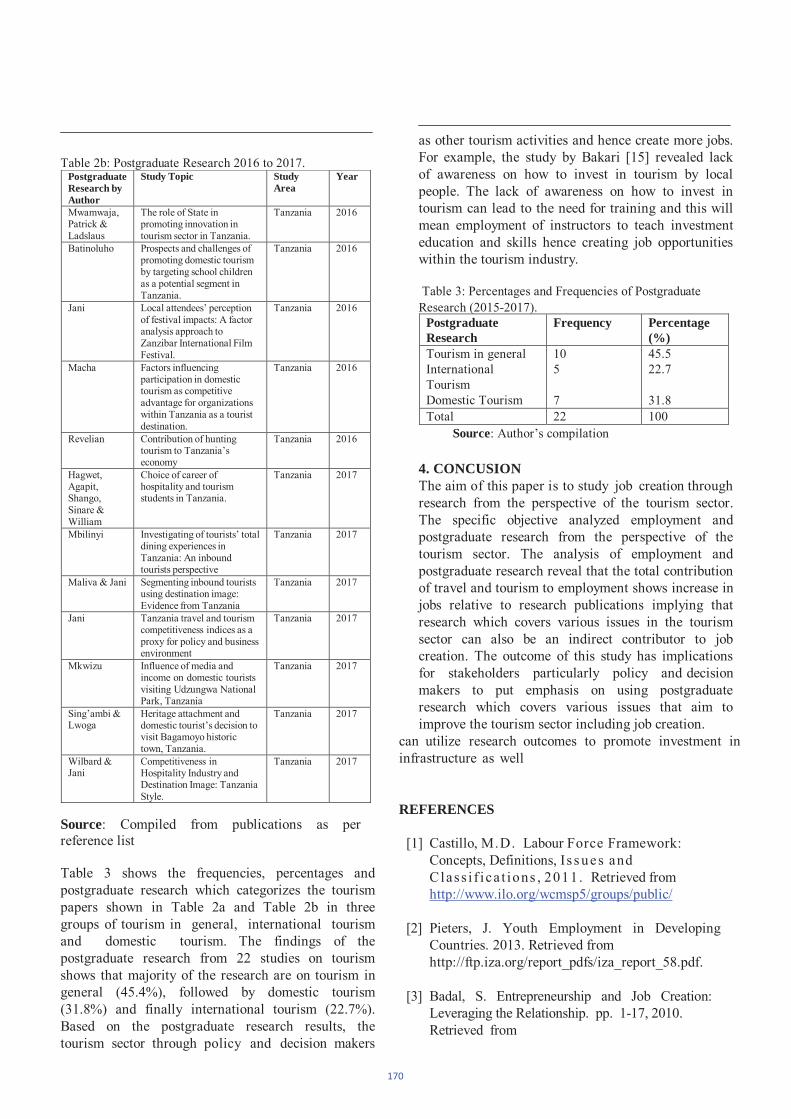
Postgraduate Research byAuthor
Study Topic StudyArea
Year
PostgraduateResearch
Frequency Percentage(%)
Source
4. CONCUSION
SourceREFERENCES
170
Research Methods f o r B u s i n e s s S t u d e n t s
171
172

Graduate Studies Supervisor – Supervisee Relationship
Ndeda Rehemaa, Marumo Rapelanga and Mandu Jeffreya
aUniversity of Botswana, Faculty of Engineering and Technology, P/Bag 0022, Gaborone, Botswana.
Email: [email protected])
Abstract In most graduate schools, the graduate student supervision relationship has been left to a traditional apprenticeship model,
where the established ‘master’ inducts the new apprentice into the ‘mysteries’ of the craft. The academic apprentice has been left to learn by two methods: observing how the master does research, and, more broadly, being an academic; and, learning from his own beginner’s experience of doing sustained academic research, where the master is expected to give feedback to the apprentice’s ideas as these are delivered in both oral and written form. This is a highly personalised relationship. The transmission of the craft occurs through the apprentice producing work which gives witness to how he has been inducted into the craft by the master. The quality of this witness depends on what is an ineffable and fundamentally religious conception of the apprentice’s insight into how the supervisor exemplifies the academic craft of scholarship and research. It is the genius ofthe apprentice which is responsible for how he takes up into his own creative powers the exemplary virtues and skills of the master. This paper seeks to explore the intricacies of the supervisor – supervisee relationship. Based on a survey of literature,key areas that influence the success of this relationship are discussed. The way-forward for fruitful partnership is also provided.
Keywords: Doctoral supervision, Graduate studies, Mentorship, Supervisee, Supervisor
1 Introduction
Enrolling in a postgraduate research (PGR) program such as a PhD is an important long-term commitment that has the potential to transform a student’s life. Throughout the period of PhD studies, a key person in a student’s life is his (her) research supervisor; therefore, an effective working relationship between the supervisor and the student is crucial [1-4]. Latona and Browne [5] state that “the purpose of supervision is to steer, guide, and support students through the process of conducting a doctorate”. Furthermore, a research supervisor’s role is to provide both technical and emotional support [6].
Quality of supervision is one of the most significant issues affecting successful completion of PhD programs in Higher Education Institutions (HEIs) internationally [7-9]. The tangible outputs of the supervision process are often markers of the quality of the supervision process such as journal publications and, eventually, a successful thesis. However, there is often more to the relationship. According to [10], the supervisor intervenes where there are challenges in order to ensure timely completion of the study. Activities such as providing access to tutoring in areas where the supervisee shows weakness; or providing networking opportunities to experts are all inclusive in the role of the supervisor.
The university has a vision of producing top-tier research, while producing graduates with versatility and employment capability[11]. At the same time, the number of doctoral students is on the increase while the number of supervisors remains constant due to reduced funding for tertiary education. The university is focused on timely completion of research and research outputs such as publications and patents, hence placing pressure on the supervisor – supervisee relationship. According to [11], the supervisor-supervisee relationship is the largest cause for low completion rates. This study delves into the relationship between the supervisor and supervisee, with a view of showing its underlying importance in the successful doctoral experience.
2 The landscape of doctoral supervision
The University Policies often governs the role of the PhD supervision. The PhD supervisor has the primary academic responsibility to implement the formal conditions of the program. The presence of structured regulations, guiding the supervision process is important. At the University of Botswana, for example, the following rules guide the appointment of a supervisor: The PhD supervisor is appointed from among the Faculty's full-time academic (professor, reader or associate professor) staff. The PhD supervisor must be a member of the staff of The Doctoral School of Engineering and Science. Members are appointed by
173
the PhD study director following an assessment of documentation regarding the individual staff member's ability to provide the necessary supervision. It is mandatory for newly employed Associate Professors/Professors, who have no experience in PhD supervision, to complete the supervisor course which the Doctoral School offers once a year. The one exception to attend the course demands documentation for completed participation in the "Assistant Professor Course" or equivalent qualifications. The supervisors’ course aims to inculcate certain principles and ethics of required in supervision. The role of the PhD supervisor at the University of Botswana, is defined as follows:
1. Provide professional guidance and supervision regarding both the research project and the components of the PhD course of study.
2. Ensure that the PhD student acquires experience in the communication of scientific knowledge.
3. Ensure that the PhD student becomes a member of active research groups or networks not only at the enrolling institution, but also outside the institution, e.g. through stays at other, primarily foreign, research institutions.
4. Provide guidance regarding the choice of course activities.
5. Co-operate with the doctoral program head and the relevant department on the PhD study program.
6. No later than 2 months after the date of enrolment, prepare a PhD study plan in co- operation with the PhD student and forward it to The Doctoral School of Engineering, Science and Technology. Included in the study plan is the establishment of an agreement on the above topics with the student.
Based on this blue-print, the supervisor-supervisee relationship is constructed. In the traditional supervision model, the supervisor as the “master” is expected to embody vast academic knowledge in the area of research. This defines the supervisor as the provider of the expected outcomes of the research, implying that the mentee does not take part in the process. This one- sidedness does not promote the notion of a relationship that would benefit both parties. However, according to [12], the task of supervision has evolved to involve building a relationship, based on mutual agreement between the supervisor and the supervisee. The role of the supervisor is to provide direction and oversee the research of the supervisee, who in turn is in charge of hands-on study, that will result in a thesis, allowing him admission into the league of the learned in that field of study. However, there should be congruence in the working patterns of both parties, as well as interpersonal awareness of the supervisor [13]. According to [14], when the supervisor espouses personal and interaction skills such as accessibility, listening, impartiality and
fairness, the supervisee has more confidence in the capability of the supervisor.
Lee [15] describes five major dimensions of supervision in recent times. Functional supervision focuses on management of the project. This includes tasks such as agreement on the timelines, funds and time management, preparation of transfer to MPhil to Ph.D. and preparation for the viva. The second aspect of supervision envisions supervision as the process of becoming a member of an academic discipline. Here, the supervisor is viewed as the master whose aim is to progressively move the student to a point of independence in research. The third aspect of supervision is in developing critical thinking of the supervisee. The supervisor criticizes and questions the submissions by the supervisee, pointing out gaps in what the supervisee knows. This challenging of the supervisee’s thinking is useful since it allows the student to appreciate whether the concept or idea is good enough. The fourth role is emancipation where educational activities are to ensure that the student participates in professional activities. The supervisor is the mentor, allowing the student to discover who they are and build up experiences. Relationship development is the fifth dimension [16]. Relationship between the supervisor and the supervisee has been reported as the foremost cause of low completion rates in tertiary education. In Botswana, a report by the Human Resources Development Council [17] indicates that only 25% of the students enrolled in a PhD program are expected to graduate, while for Masters programs, only 33% were expected to graduate. The reasons provided were underestimation of the rigorous nature of the program, loss of morale, or other external factors which detract students from study. In almost all cases, there was minimal to no advice provided by the supervisor on the issues that the student was facing. This lack of guidance draws students away, eventually causing low completion rates. There is clear need to strengthen this dynamic relationship.
3 Navigating the relationship3.1 The role of the supervisor
The commencement of the supervisor – supervisee relationship is on enrolment. According to [18], selection of the supervisor is mainly based on the knowledge and experience of the supervisor in the area of the student, as well their ability to allot time to the student. The supervisee should first determine their own intellectual needs while analyzing the capability of the supervisors. On the other hand, the supervisor also has a choice in agreeing to the student based on the perceived academic ability of the student, relevance of the choice topic of the student to his own, and potential differences in their personality. In certain universities,
174

however, the student does not choose the supervisor; the Faculty Postgraduate Board allocates supervisors, solely based on their academic compatibility; thereby losing out on the potential benefits that would result from proper structuring of supervisor – supervisee relationship.
After selection of the supervisee, the relationship is built on foundational principles. Setting the research agenda is one of the proven means of maintaining good supervisor-supervisee relationship. The goals are set at the beginning of the research journey, with agreement from both the supervisor and the supervisee. Discussion should be conducted to provide clarity on the expectations of both parties, breaking down the work into phases, and meting out timelines for the work. An often overlooked issue in setting up the research timelines is the university guidelines. The supervisor must be aware of the university policy, regulations, procedures and time required for the specific program in order to set realistic timelines with the supervisee. The frequency of review meetings should also be determined. In some universities, for example, a signed contract between the supervisor and the supervisee prior to commencement, provides a baseline of the duties of both the supervisor and supervisee. The supervisor should be a ‘master’ of himself, as a suitable role-model for the student. In order to determine the compatibility of the supervisor and the supervisee, the supervision style should be a point of open discussion. Supervisors can either be hands-off, allowing the student to manage their own project; or hands-on, where the supervisor gives structured instruction on aspects of the study. Supervision approaches can also be classified as problem-oriented or process-oriented. Problem-oriented supervision focuses on the tasks that should be completed by the student in order to attain the degree while process oriented supervision focuses on developing the student professionally. This style places more emphasis on the role of the supervisor providing guidance [11]. Conflict often arises when the supervisee expects a different approach from the one that the supervisor uses. The supervisor should be flexible enough to adjust the approach with different students [13].
‘Good’ supervision is usually measured by progression and completion rates of the students. What cannot be measured, however, is the role of the supervisor between enrolment and completion. Based on the five dimensions mentioned by Lee [15], we surmise that the role of the supervisor in current times is as follows.
First, the supervisor’s scholarly expertise involves continuous interaction within the body of knowledge through conducting research, and publishing widely. In this way, he is easily able to identify gaps in knowledge within this area. The supervisor should also be passionate about learning, thereby creating their own
advancement by advancing the study by the student. He should also have sufficient technical competence in scholarly communication, both oral and written, as well as time and information management. The supervisor should attentively gauge the work of the mentee, discern the weaknesses and errors of their thesis and offer guidance and redirection. The supervisor also draws from his experiences in order to ensure that the student is able to engage with the work in a more productive manner.
Second, the interpersonal intelligence of the supervisor should allow for flexibility in dealing with different personalities and learning types. Conducting an in- depth study requires a deep learning approach where the student engages with the material and questions knowledge in order to create and solve the underlying problem. However, each graduate student often has their own approach to learning, which often differs from that of the supervisor. Honey and Mumford [19] classified learning approaches into four: activists, reflectors, theorists and pragmatists. Activists enjoy active research, such as experimentation and data collection but are poor at deep analysis and theorizing. As their name suggests, reflectors constantly reflect on concepts and are able to integrate them into their research. However, they may overlook other aspects which do not relate to reflection and are prone to over- reflection causing delays. Theorists use the deep learning approach necessary for research, having the ability to theorize, and link the research problem to existing framework. However, active research such as experiments often eludes them. Finally, pragmatists seem to strike a balance between the practical and theorization but face internal challenges when they are unable to glean a practical solution to the research problem. The supervisor should primarily be aware of his own learning style, and thereafter, determine that of the supervisee. In this way, he is able to identify the weaknesses stemming from the student’s learning style, and take appropriate measures to develop that area.
The third aspect of the supervisor’s role is to gauge the progress of the supervisee and take requisite measures to ensure that the supervisee remains on track. A study by McCallin [20] reported that experienced supervisors usually espouse better interpersonal skills due to dealing with many students. The study posited that an experienced supervisor is better able to recognize any danger signals in the student and offer the necessary support. Support could be offered in terms of tutoring, offering requisite technical expertise through networks or even counselling when personal issues threaten the integrity of the work[10]. Progress is regularly monitored through written works by the supervisee, set timelines for completion of certain project phases and review meetings. Written work enables the supervisor to gauge how well the supervisee has understood the requirements of the work. The supervisee, in turn, is
175
able to discover the advising style of the supervisors when work requires review. Though it is understood that the supervisor requires sufficient time to read through the work, morale of the supervisee dips when the responses take too long. Another important benchmark of progress is deadlines which determine if there is any retardation. Whereas not all deadlines can be met due to the unpredictability of research, there should be a guideline between both parties in the event of delays. In review meetings, the supervisor evaluates the direction of the project, the ability of the student vis- à-vis the outputs received, the shortcomings and any aspect which needs re-evaluation. The supervisee is also able to report on challenges experienced, and anything that may hamper work on the next phase of the project. Open conversations should be encouraged during review meetings. The supervisor should be sensitive enough to gauge decline in student’s workmanship and resolve, delays in meeting deadlines, as signs of issues with the process [14]. For example, the supervisee may be capable in managing one task, and be entirely out of their depth on another task, therefore requiring longer periods to complete. It is important to tactfully query these instances, and find assistance where possible. This will enable the supervisee to participate in self- evaluation, thereby being able to suitably adjust and grow. Supervisors should note that apart from academic work, other aspects of the supervisee’s life also affect his ability to work effectively. Personal problems such as family and financial challenges may divert the attention of the student. The supervisee should be sufficiently confident to discuss how personal challenges affecting his work without fear of recrimination.
Fourth, the supervisor should introduce the student to his own network as a way of ensuring that the student learns to create and maintain relationships that will be useful to him beyond the doctoral study. These networks are useful in advising the student as well as establishing a career after completion of their study. In this way, the supervisor is able to inculcate the student in scholarly practice. Of course, this is premised on the active participation of the supervisor in network creation activities such conference attendance, reviewing articles for journals, and maintaining networks with industrial partners. Another benefit of creation of scholarly networks is the fact that the input of the wider research community is often important in indemnifying the supervisor’s criticism of the work. Presentations in university wide colloquia and conferences allows the supervisee to share ideas and also receive feedback from the university community[21].
3.2 The role of the supervisee
According to [22], success of the overall project depends on how much responsibility the student is willing to assume. The onus is on the supervisee to set up and see the research to completion. Initially, the supervisee selects the supervisor on the basis of his charisma – that is, his extraordinary qualities as a scholar-researcher. The work of the supervisee also has to be of a quality as to testify to the value of the supervisor’s influence. He has to demonstrate his own charismatic scholarly quality that he is worthy to be supervised by this supervisor. In this sense, his is a scholarly discipleship. The neophyte should be able to, with the aid of the supervisor, visualize their weak areas and work towards growth. All aspects of research should, therefore, be planned based on this knowledge.
When evaluating the efficacy of the supervision process, students often rank knowledge of the research area highest. Other forms of academic support such as timely feedback from the supervisor, access to tutoring and academic advice are also listed. This points to the need for structure in the supervision process. Supervisees also believe that the interpersonal relationship with the supervisor plays a key role in their success. Interpersonal abilities of the supervisor include communication skills, emotional and social intelligence suitable to provide a conducive environment for growth. For example, ambience during review meetings determines how open the student will be about challenges faced, or suggesting changes in the plan. The social and interpersonal skills of the supervisor enables the student to feel free to clearly outline what he needs and how the supervisor can be of assistance.
Another expectation of the supervisee is mutual respect and consideration. The supervisee accepts that the supervisor is able to train him suitably, and at the same time, the supervisor should show confidence in the student’s ability to learn. For example, the supervisee should, at all times, also strive to keep the timelines agreed upon with the supervisor. When unable to meet the deadline, he should strive to inform the supervisor and consequently, set a different target.
3.3 Challenges and conflict resolution
The challenge of a close working relationship often manifests with time. Apart from understanding each other’s learning styles, mutual understanding of each other’s socialization is a major cause of strife. Age difference is a common socialization challenge. Most cultures peg wisdom to the age of an individual, requiring deference in the presence of these folk. When the PhD supervisor is younger than the supervisee, the question becomes whether the supervisor is able to effectively communicate to and critique the supervisee [23]. On the other hand, when the supervisor is much older than the neophyte, he may be unable to argue
176

against anything presented by the supervisor. Another difference in socialization is in terms of speaking up. Some Western cultures encourage speaking up, whereas Eastern cultures may consider speaking up as disrespectful. Another example is in whether people work better in teams or individually. People who are socialized to work well in a community may not thrive in the often isolated postgraduate environment, and vice versa. These students may either seem needy, requiring constant attention from the supervisor, or for those who work well by themselves, distant. The supervisor – supervisee relationship, therefore, stands a better chance of success if both parties take these factors into account, thereby managing the expectation of each party.
There is inherent inequality between the supervisor and the supervisee. The role of the supervisor of guidance should be made clear at the onset. In the initial stages, the supervisor has more handles on the reins of the project, slowly letting go as the supervisee gains more skill and progress. The expectation is that the supervisee will always take the advice of the master with regard to the project. Where there are negative supervision habits such as inaccessibility, poor feedback as well as harassment, both academic and sexual, there needs to be recourse for the student. On the other hand, when the supervisor is dissatisfied with the progress of the supervisee, there should be a method of resolving discontentment. According to [18], University policy should have a clear channel for conflict resolution.
4 Improving supervisor – supervisee relationship through new approaches
Newer approaches to supervision have had higher supervisee satisfaction, and also higher rates of completion. These different models recognize the different abilities of supervisees, and are able to offer non-conventional support. For instance, the traditional master – apprentice supervision model is best suited for self-directed students who are able to work efficiently independently. Other students who may require a different mode of supervision.
Group supervision includes an aspect of student-student supervision, complementing the work of the supervisor [11]. Scholarly writing groups or peer discussions provide both skills and emotional support that the supervisor may be unable to offer. The supervisor is, therefore, able to provide technical support through provision of relevant technical courses such as research design, exposing the student to the university community through seminars and conferences of interest. This approach is particularly useful since
neophytes learn from discussions with other researchers.
Another approach argued to be effective is known as blended learning which combines the meetings between the supervisor and the supervisee, with virtual self- paced online learning. In this case, the supervisor points out main sources of information to the student, and thereafter evaluates what the student has gained. The supervisor directs students to online courses that would introduce them to the research culture such as literature review, grant writing, journal paper publication. These aspects are difficult for the supervisor to inculcate within the often time-limited meetings with the supervisee. Face-to-face meetings smooth out areas where the critiques by the supervisor may be misconstrued or where the supervisor needs to have an in-depth evaluation of the understanding of the student [11]. This approach is useful in ensuring that there is all- round support for the supervisee, while getting the maximum output from the supervisor.
Expertise of supervisors varies because of the wide variation in their experiences. Structured formal training program for supervisors is slowly becoming a requirement. The supervisory role has changed from the previous technical supervision to include a supporting and guiding role[13], thereby being more demanding, both intellectually and emotionally. Formal training of the supervisor eliminates the trial-and-error method currently used to learn how to supervise, and hastens improvement of research quality. In addition, it educates them on changes to the institutional vision as well as the governmental landscape. For example, the need for actionable research innovation by government could affect research within the university. In addition, aspects such as funding of research within the university and beyond is ever-changing. Such formal programs keep the supervisor abreast on how the funding landscape affects the university as well as the expectations of the university management on all research staff. Further, understanding of the supervision models, based on policy and processes within the university should also be an integral part of the training curricula.
Apart from structured training for supervisors, forming peer support is another method of developing the experience of the supervisor, and enhancing skills in critical reflection [10]. A supervisory team is created where the second supervisor has higher expertise than the former. This serves the purpose of both supporting the student and the inexperienced supervisor to also learn while doing [18]. An added benefit of a supervision team is that there is continuity of supervision when the supervisor is away, or departs from the institution permanently. Changes of supervision usually disorient the student, and cause
177
higher education. 1988, London: MethuenPublishing.
[8] Wright, T., Postgraduate research students:
undue delays in adjustment to the new supervisor, who may not gel well with the student, or may not be quite so knowledgeable in the area of study[12].
5 ConclusionThe supervisor – supervisee relationship is affected by lots of factors including the policies within the institution, the personality of both supervisor and supervisee, the ability of the two parties to work together among others. These factors can often be smoothened out through the presence of an agreement between both parties outlining their expectations from the relationship. Further, policies within the institution should support this relationship and where need be, have recourse for dispute resolution. Above all, the “master” should continually perfect his role of providing guidance as the “apprentice” learns and emulates him, in order to become a scholar in his own right.
References
[1] Bair, C. R. and Hawoth, J. G., Doctoral student attrition and persistence, in Higher education: Handbook of theory and research. 2004, Dordrecht: Kulwer.
[2] Murphy, N., Bain, J. D., & Conard L., Orientation to research higher degree supervision. Higher Education, 2007. 53: p. 209-234.
[3] Shariff, N. M., et al., Factors contributing to the timely completion of PhD at the Malaysian publichigher educational institutions. International Journal of Humanities Social Sciences and Education (IJHSSE), 2015. 2(1): p. 256-263.
[4] Tahir, I. M., et al., Effective supervision from research students’ perspective. International Journal of Education, 2012. 4(2): p. 211-222.
[5] Latona, K. B., M., Factors associated with completion of research degrees. 2001, Canberra, Department of Education, Science and Training: Canberra.
[6] Kuo, J. and Greengard, P., Cyclic nucleotide- dependent protein kinases, IV. Widespread occurrence of adenosine 3 , 5 -monophosphate- dependent protein kinase in various tissues and phyla of the animal kingdom. Proceedings of the National Academy of Sciences, 1969. 64(4): p. 1349-1355.
[7] Brown, G., & Atkins, M., Effective teaching in
People in context? British Journal of Guidance and Counselling, 2003. 31: p. 209-227.
[9] Petersen, E. B., Negotiating academicity: Postgraduate research supervision as category boundary work. Studies in Higher Education, 2007. 32: p. 475-487.
[10] Halse, C. and Malfroy, J., Retheorizing doctoral supervision as professional work. Studies in Higher education, 2010. 35(1): p. 79-92.
[11] De Beer, M. and Mason, R. B., Using a blended approach to facilitate postgraduate supervision. Innovations in Education and Teaching International, 2009. 46(2): p. 213-226.
[12] Lindén, J., Ohlin, M., and Brodin, E. M., Mentorship, supervision and learning experience in PhD education. Studies in Higher Education, 2013. 38(5): p. 639-662.
[13] Hemer, S. R., Informality, power and relationships in postgraduate supervision: Supervising PhD candidates over coffee. Higher Education Research & Development, 2012. 31(6): p. 827-839.
[14] Wisker, G., The good supervisor: Supervising postgraduate and undergraduate research for doctoral theses and dissertations. 2012: Macmillan International Higher Education.
[15] Lee, A., How are doctoral students supervised?Concepts of doctoral research supervision.Studies in Higher Education, 2008. 33(3): p. 267- 281.
[16] S. Taylor, N. B., A handbook for doctoral supervisors. 2005, London: Routledge.
[17] Human Resources Development Council, Tertiary Education at a Glance, Human Resources Development Council, Editor. 2015: Gaborone, Botswana.
[18] Ives, G. and Rowley, G., Supervisor selection orallocation and continuity of supervision: Ph. D. students’ progress and outcomes. Studies in Higher Education, 2005. 30(5): p. 535-555.
[19] Honey, P. M., A., The Learning Styles Helper'sGuide. 2000: Peter Honey Publications.
[20] McCallin, A. and Nayar, S., Postgraduate research supervision: A critical review of current practice. Teaching in Higher Education, 2012. 17(1): p. 63-74.
[21] Atkins, M. and Brown, G., Effective teaching in higher education. 2002: Routledge.
[22] Kam, B. H., Style and quality in research supervision: the supervisor dependency factor. Higher Education, 1997. 34(1): p. 81-103.
[23] Donald, J. G., Saroyan, A., Denison, D. B., Graduate student supervision policies and procedures: A case study of issues and factors affecting graduate study. The Canadian Journal of Higher Education, 1995. XXV-3.
178
Research and Innovation for Development An Experience from Botswana – A Developing Country in Southern Africa
Isaac N Mazonde
Department of Environmental Science, University of Botswana
Email: [email protected]
Abstract The recent act of adding the innovation angle to research for development has assisted to shape investigative scholarship and lead it to solve real development problems directly through the production of products, goods and services. Previously, research had abroad concept which, because it was rather open ended, easily tempted scholars to do more theorizing and philosophizing than produce goods and services for economic development. In particular, narrowing down research to products of innovation has boosted quicker economic returns from knowledge generation. One of its direct result is the income returns that come from products of innovation. More specifically, a combination of research and innovation has improved the bridging of the chasm between the outputs from tertiary education on the one hand and the needs of industry and community activities on the other. Invariably, such linkages between education and the world of work have manifested aspects of the knowledge economy more visibly than was the case. Knowledge economy is easier to achieve in an industrialized environment than in a developing countrycontext. In part, this is due to the fact that the industrialised economies have developed innovation systems at both the regional and the national levels, with efficient sectoral linkages. More importantly, the concept of knowledge economy can take a distinctly different form in a less industrialized country through manifesting that in that setting, social innovation is more meaningful than technological development. In that context, this paper highlights a contrast in the conceptualization and application of knowledge economy in an industrialized nation environment on the one hand and in the developing country context on the other. The paper acknowledges the concept of knowledge economy as used in the industrialized countries and then contrasts that concept with the concept of knowledge economy as used in developing countries, exemplified mainly by cases from Botswana but with a few examples taken in brief from other African countries.
Key Words: Entrepreneurship, indigenous knowledge system, knowledge economy, social innovation.
1.0 Background National development is the result of combined contributions from many stakeholders such as the public sector, the parastatals, the private sector as well as the civil society like the NGOs. The economies of the majority of the developing countries are centered around the public sector. Consequently, most of them are bloated and a number of them have been downsizing for some time now, in most cases as a response to calls from international funding bodies such as the World Bank or the International Monetary Fund (IMF). By contrast, industry forms the larger portion of the economies of the industrialized countries, with the government mainly playing a facilitative role. A comparison of the industrialized countries and the developing ones provides lessons upon which Botswana can build, in its efforts to bring on board the private sector to support research and innovation. The economies of the
industrialized countries, because they are diversified and knowledge based, have created the capability to convert research outputs into
the type of information that directly feeds into the further expansion of those economies. These economies operate in an environment of more clearly defined national and regional innovation systems in which the development paths of theirproducts, goods and services is clearly spelt out and are visibly recognisable. In addition, the industrialized countries have adequate and effective entrepreneurial support systems e.g. diverse and experienced intellectual capital and its institutions, adequate and reliable ICT systems, many types and levels of financial funding sources, various organizational and administrative structures, etc. for the development of their different products and services. These are normally referred to as the innovation and business sophistication factors.
179
Consequently, the goods and services from this economic environment are of high quality, thereby creating effective demand both nationally and internationally. By contrast, economies of most developing countries operate in fragmented innovation systems where the necessary structures for entrepreneurial development are either weak or non-existent at both regional and national levels, resulting in in optimal interpectoral linkages. Such a scenario does not augur well for economic diversification. Botswana falls within the category of these developing countries, and the country’s level of economic development puts it between a resource based economy and an efficiency based one. Furthermore, the country’s economy is not diversified, but relies mainly on minerals, especially diamonds. The structure of the economy is responsible for the failure of the economic diversification drive which has been attempted for some time now. That notwithstanding, Botswana aims to be a knowledge based economy, according to Vision 20136. One of the impediments to R&D growth in Botswana is the dominant role played by the public sector (74% contribution to R&D in 2013) and the low levels of participation of other stakeholders especially the private sector (6%) in R&D activities. Needless to say, all stakeholders require research and innovation in order for them to generate the knowledge that they are using to expand their businesses and their sectors and ultimately to grow the national economy. It is for this reason that different stakeholders were invited to the breakfast meeting and to the conference itself, in accordance with the Botswana National Research Science Technology and Innovation (BNRSTI) Policy of 2005 which calls for an urgent need for a robust stakeholder collaboration where the business enterprise takes the leading role in research and innovation matters. The overall sentiments from captains of industry was that they are willing to engage research as long as they can appreciate the value add that research will bring to their enterprises. Botswana may currently not be having a large industrial base or a well-developed private sector but it still has a number of private sector
entities that can expand their activities through the utilization of research services from the country’s research providers. Hence, the position that the country has adopted, namely that stakeholders other than the public sector will be the main drivers of the economy going forward, is tenable. More importantly, this position forms the framework upon which the knowledge economy will be anchored. In the developing countries context, knowledge economy is anchored upon social innovation,which has a broad framework and is contextual. Social innovation is not necessarily about ‘introducing new types of production or exploiting new markets for the sake of exploiting them, but is about satisfying new needs not provided by the market (even if markets intervene later) or creating new, more satisfactory ways of insertion in terms of giving people a place and a role in production. It matters little whether or not an idea is objectively new as measured by the lapse of time since its first use or discovery. The perceived newness of the idea for the individual determines his or her reaction to it. If the idea seems new to the individual, it is an innovation [1] These authors explain further that ”this means that a social innovation does not necessarily need to be new per se, but rather, new to the territory, sector or field of action [1].As shall be demonstrated later, social innovation has a greater potential for economic development when it is combined or diffused with technological innovation. It becomes the most appropriate driver of the indigenous knowledge system.
2.0 The Indigenous Knowledge System (IKS)
The development debate is currently at the intersection of two most critical themes; namely, sustainability and inclusivity. What this means is that development needs to be sustainable and inclusive in order for it to be meaningful to its beneficiaries. Sustainable development has been the buzz word for some time now, but inclusive development, a concept that brings together the formal and the non-formal sector where the marginalized communities subsist, has just
180

entered the development literature with a loud bang. Two reasons can be advanced for this situation. Firstly, indications show that overall, the rich are getting richer while the poor are getting poorer in spite of the sustainability of the development programmes that they are involved with. Secondly, the non-formal sector, which embraces the low income and marginalized communities, is growing in size, both in the developing and in the developed world. The informal economy provides between 50% and 75% of employment in developing countries and around 18% in developed countries [2]. Clearly, this calls for a change in the development planning systems so that inclusive development can now be foregrounded in the national development agendas of countries, instead of it being merely an appendix, as has been the case so far in the planning patterns of most countries. The non-formal economy is defined as those economic activities which fall outside government regulation, including both the non-formal sector and the non formal employment within the formal sector. Indigenous knowledge systems (IKS) and their activities form the core of the non formal sector. Somolekae notes that because of the small scale and unprofitable arable farming, the informal sector is growing [4]. Thus the growth of the informal sector occurs alongside the growth of the formal sector, which is captured by the impressive macro economic indicators. The combination of low agricultural output and lack of industry, along with the lack of economic diversification is highlighted in Kerven’s discussion of the reasons for rural-urban migration in the country. Kerven notes that Botswana households make ends meet by combining the meagre income from the informal sector in urban areas with the very little produce from arable farming, and still that leaves the households below the poverty datum line [3].More recent data show that as the rural areas have lost most of their ability to sustain people out of agriculture, income transfers have become significant as household members working in urban areas have had to support their relations who live in the rural areas. Hence, attention must now be turned to the informal Knowledge System. This is especiall so because the so
called Asian Tigers (Malaysia, South Korea) made their economic breakthrough and entered the global market though development and application of their Indigenous Knowledge System (IKS). Their experience points to a potential that Botswana, a country with extensive IKS, can exploit. The few examples in this paper will demonstrate that IKS empowers local communities and integrates them into development processes in ways that the government regulated formal sector is unable to do. The cases will further show that the integration of appropriate IK systems into development programmes has contributed to efficiency, effectiveness, and sustainable development impact. Quite clearly, then, embracing indigenous knowledge is extending the borders of inclusivity. It is instructive to unpack the reasons for the success of IK in empowering local communities. ‘Indigenous knowledge provides the basis for problem-solving strategies for local communities, especially the poor. IK is an underutilized resource in the development process. Learning from IK, by investigating first what local communities know and have, canimprove understanding of local conditions and provide a productive context for activities designed to help the communities’ [4].‘Indigenous institutions, indigenous appropriate technology, and low-cost approaches to development can increase the efficiency of development programmes because IK, unlike most hi-techs which are often imported, is a locally owned and locally managed resource. Therefore, building on IK can be particularly effective in helping to reach the poor since IK is often the only asset they control, and certainly one with which they are very familiar.
Utilizing IK helps to increase the sustainability of development efforts because the IK integration process provides for mutual learning and adaptation, which in turn contributes to the empowerment of local communities. Since efficiency, effectiveness, and sustainability are key determinants of the quality of development work, harnessing indigenous knowledge has a clear development business case’ [5]. Another concept that is related to IK and one that embeds mutual learning within an inclusive development
181
setting is social innovation. Correctly understood, social innovation is a mapping of the factors and the environment that enables poor people to overcome social, legal and technological barriers. It is therefore a critical aspect of IK which highlights the reasons for the success of IK systems in mobilising communities for development purposes [6].
The systems of IK function optimally within a socially well structured environment which also has a clearly defined and well managed support system. In order for it to attain this level, it has to be institutionalized. Hence, in a bid to facilitate the integration of IK into development and other socio-economic operations of communities, the Africa Department of the World Bank launched the Indigenous Knowledge for Development Programme (IKDP) in 1998. The overarching goal of this World Bank Programme was to assist in the institutionalization of IK in the development planning process of Africa’s developing countries.
The establishment of the World Bank Indigenous Knowledge for Development Programme was a sequel to the first Global Knowledge Conference that had been held in June 1997 in Toronto, Canada, attended by government leaders and members of civil society. At that conference, it was noted that local communities had a lot of relevant knowledge that could be used for fostering their development. It was therefore agreed that the World Bank would support a global knowledge partnership that would be realized only when the poor participate as both users of and contributors to knowledge. The African Department of the World Bank responded to these challenges bylaunching, in 1998, the Indigenous Knowledge for Development Programme in partnership with over a dozen organizations.
Using its vantage point, the programme focused upon mechanisms for institutionalizing IK systems and their actions in the member countries. It did that in many ways including helping IK Resource Centers in eight countries to improve their national and regional networking capacity. For example, through this
arrangement Uganda received advisory and financial support to help draft a national strategy for the integration of IK into its national Poverty Eradication Action Program and some grant funding to build capacity for the implementation of that national strategy. Botswana and other developing countries could use this opportunity to develop operational structures for delivering their locally designed development programmes for the lower social classes, something that would be equivalent to Botswana’s Poverty Eradication Programme. Other countries have undertaken various activities to build on IK in agriculture, healthcare, and education with the assistance of the IK Programme [7].
The world over, aggre6ssive promotion of entrepreneurship is one major phenomenon that is driving globalization currently. No longer is entrepreneurship solely a feature of business studies. It has penetrated many levels of the academic world, especially in the developed world. Academic institutions are busy linking closely with technology parks and then weaving entrepreneurship into curricula. For example, a number United Kingdom universities have over the past decade been expanding their curricula to include technology or knowledge parks and then running knowledge transfer programmes through which they have been arming their academics with entrepreneurial skills. These skills, applied mainly but not solely within the framework of the knowledge parks now assist the academics to commercialise not only intellectual property but knowledge much more broadly and more effectively than in the past when intellectual property activities were limited to patenting [6].
Even in the developing world, universities are enhancing business studies and streamlining that subject to be taught as a compulsory general course so that all students shall be exposed to business principles in order to be better able to initiate self employment activities upon completion of their studies in the higher education institutions, given the intensifying scarcity of jobs in the job market [6].
In the globalized world of today, information exchange is critical for entrepreneurship.
182
Establishing regional and international networks is a key way of facilitating such information exchange. The Indigenous Knowledge for Development Programme has worked in cooperation with other agencies to support local communities in sharing their IK through community-to-community (C2C) exchanges. It has also brokered partnerships between scientists, legal experts, and IK practitioners to support scientific validation of IK practices, and has supported IK practitioners to form national or regional traditional knowledge networks [7].
The outcomes of the Indigenous Knowledge for Development Programme are quite a few. They include the increase that has been observed in the recognition of indigenous knowledge itself as a part of the development agenda in the member countries of the Programme; the national initiatives and policies that have since emerged; the civil society groups that are forming a broad base of support, and the increasing number of development projects and programmes integrating IK [7].
No form of knowledge is static. Consequently, IK, needs to be subjected to constant review for relevance and for the purpose of improving its efficacy. That review includes analyzing the circumstances under which IK works more optimally. Some cases below show that IK needs to be applied jointly with modern technology for optimal results, just as Emory noted that both systems have strengths that can help the other system when they are invited to work together [10].
3.0 The converging point between indigenous and Modern Business Entrepreneurship
Indigenous knowledge is a collective. This means that it operates mainly within the context or framework of community lines, and to a less extent on individual basis. Consequently, it fits more commonly within the idea of cooperatives and less so within that of individual enterprise. The advantage of its structure is that it focuses upon the entire community and therefore has the
potential to improve the livelihoods of the community broadly, thereby bringing about greater equity in development as opposed to individual enterprise which creates socio-economic inequities that results in skewed income distribution. This phenomenon is illustrated by the cases below, most of them taken from Botswana and a few brief examples coming outside the country. More importantly, the cases demonstrate that to more comprehensively define the knowledge economy in the developing economy set up, IKS needs to be operated or implemented within the framework of a business principle.
The Community Based Natural Resource Management Programme (CBNRMP) is a classic example of the intersection between an indigenous knowledge system and modern business entrepreneurship. In this programme, communities use their indigenous knowledge of tending wildlife for the purpose of making income for themselves as communities through tourism. In the CBNRMP model of development, the economic benefit goes to all members of the community as a collective, that is, they share it as a group. On a positive note, the CBNRM Programme has benefitted its target population in that the economic welfare of the people concerned has generally improved and the programme has also succeeded in integrating its concepts into the tertiary education system of Botswana [1].
However, a few cases have been reported whereby people outside the programme, i.e. those not targeted by the programme, have benefitted more than members of the scheme. In such cases, economically more powerful people from outside the programme have given their guns to members of the scheme and then these gun owners have taken the game killed with the use of their guns [12]. These are criminal cases which are a result of the unequal power relations between the targets of the CBNRMP and the socio-economically more powerful people outside the CBNRMP sites. The cases are also a reflection of weak management and oversight of the CBNRMP by the state, which set it up as a community development programme. This negative aspect of the programme does not
183

justify its scrapping: rather, it calls for closer monitoring and a more effective leadership role by the state which manages it.
In the villages of Maun and Shorobe in Ngamiland, communities have for a long time subsisted on their indigenous knowledge through making baskets for sale to tourists who pass through these villages on their visits to various destinations inside the Okavango delta. The baskets are usually made of reed that grows around the marshes of the Okavango delta. There was a problem when baskets were sold by individual entrepreneurs. The entrepreneurs who had good marketing skills normally received higher prices for their baskets than those individual entrepreneurs with low skills levels. Another problem came from the seasonality of the tourism industry. During spells when tourists visited in smaller numbers, the enterprise became bad and the basket makers were unable to raise sufficient income to feed their families.
The NGOs then intervened to solve the two problems by helping the entrepreneurs to form cooperatives that would handle the marketing of the baskets through agents that accessed both the local and the external market. While such cooperatives have improved the basket industry of Ngamiland economically when compared with those instances when people used to sell their baskets individually, the basket industry still faces hurdles which often leave the entrepreneurs without sufficient funds to run the business in an economically viable manner. My argument in this paper is that this general failure of this industry is a manifestation of lack of institutionalization of IK at the national and regional levels. I aver that the cooperatives lack the support and backing of the state through appropriate cooperative structures and external networks that would ensure a reliable and strong enough framework for continuous marketing of the baskets. Such a framework could be either state supported or supported by the private sector or even the NGO sector.
The case of Dibapalwanageng in Gabane, and two others below, demonstrate that IK is more efficient when combined with modern technology. The Dibapalwanageng is a group of
women who have come together to process various products from the morula fruit. From the nectar of the morula fruit, they produce sweets and jam. Initially, the output of the jam was low as the process was done manually. But in collaboration with the University of Botswana and with funding from the UNDP, members of Dibapalwanageng have been able to secure a machine which peels the fruit so that the nectar is produced in larger quantities [1].
The problems of lack of institutionalization on the one hand and effective networking on the other also face Dibapalwanageng. Due to being under-resourced and due to a lack of a reliable market, some unscrupulous entrepreneurs have been able to take advantage of these women, forcing them to undersell their product(s). This has translated into Dibapalwanageng being an enterprise with low profit margins, something that has driven the younger women in the organization out of this venture, thereby leaving it with only the older women who are unable to work as fast as the younger ones. In Lerala, three hundred kilometers away from Gabane, another indigenous knowledge group by the name of Kgetse Ya Tsie produces veld products which include morula fruit products. Due to a lack of networking, the two groups, Kgetse Ya Tsie and Dibapalwanageng, are not in touch with one another. As a result, the mutual support and knowledge exchange that would result from the collaboration between them is thus lost [1].
Examples of the intersection between IK and modern business extend far beyond Botswana and cover different economic sectors. The case from South Africa below demonstrates how institutionalization and networking have enabled IK groups that are involved in the same product development to increase the scale of growth of their enterprise through working jointly and pooling their resources.
‘The Rooibos tea-growing farmers of Wupperthal in South Africa’s Western Cape Province were generally satisfied with the scale and volume of their tea exports to Europe. An NGO, EMG, thought that other tea-growing communities could benefit from the activity of these Wupperthal tea growing farmers.
184
Subsequently, EMG then arranged in June 2000, a visit of the Wupperthal tea growing farmers to their neighbours, who were also growing Rooibos tea in Suid Bokkeveld. During their visit, the two groups of farmer held discussions on crop quality, processing and marketing. The outcome was amazing by all accounts. It positively impacted both farming communities. Both were excited. As a result they agreed to set up a farmers’ co-operative. The cooperative resulted in improved output from the farms as well as better and more efficient processing of the crop following the harvest. Networking also paid high dividends. A certain European dealer put in an order for tea amounting to a staggering $15,000 [7].
The next example is from the health sector. Health delivery is yet another key sector in which indigenous knowledge has always been active. HIV/AIDS is known to come with a number of opportunistic diseases. Scheinman, reports that in Pangani District, Tanzania, traditional healers have been able to successfully treat the opportunistic diseases of over 2000 HIV/AIDS patients, using medicinal plants from the wild. Some terminally ill patients have reportedly lived longer by five years, as a result of using the medicine from these traditional healers [13]. Consequently, Tanzania seems to be taking the route followed by China, a country that has institutionalized traditional medicine. ‘The Pangani regional hospital in Tanzania has dedicated a ward to these healers which they to treat and counsel patients. The IK Program supported an exchange of experiences between healers, people living with AIDS and staff working with patients with similar groups across the country’ [6].
It became evident that the critical challenge was to leverage local and global knowledge systems to effectively resolve this health challenge. In a bid to facilitate such a process, the IKProgramme expanded outside the continent. It brokered a partnership between the TANGA AIDS Working Group of Pangani, Tanzania, and the US National Institutes of Health for the purpose of jointly working to scientifically validate the strength and quality of the treatments that use traditional medicine [6].
The Tanzania case is a demonstration of the fact that the efficacy of the traditional or indigenous knowledge is improved when such knowledge is complemented by modern or western technology. This is consistent with the observation made by Emery that there is an increasing appreciation of the advantages of using science and technology together with traditional knowledge to find mutually beneficial results from development projects [6].
The engagement between the Botswana Agricultural College (BCA) and its farmers provides the last example of how mutual interaction between indigenous knowledge and scientific technology improves the quality of both systems. BCA runs practical short coursesfor the traditional farmers. During these courses, the College teaches the farmers new farming technologies. The courses are held either at the College or on the field of any farmer whose field has the easiest accessibility. But the College also learns from these farmers the indigenous knowledge systems and techniques that they use. The result is that the College has infused some of the IK technologies into its curriculum thereby increasing the relevance of its mission to its stakeholders while also facilitating the empowerment of the farmers through involvement and participation in their own development [6].
4.0 Conclusion
The objective of this paper was to present the definition of knowledge economy in a developing country and to highlight the context within which that definition emerges and operates. It demonstrated the need to appreciate the difference both in the definition and the context in which the knowledge economy has to be understood in the industrialized countries on the one hand and in the developing countries on the other. In this regard, social innovation was put forward as the driving principle that undergirds the knowledge economy within the developing countries where the narrow industrial base diverts focus to community services engagement and away from engagement with industry, the norm that obtains in the industrialized countries.
185

Furthermore, using IKS as a kind of knowledge economy requires that the IKS be applied within a business framework. This is because knowledge economy is not only an abstract concept but more importantly an empowerment tool. Undergirding social innovation, IKS and entrepreneurship is the overall sustainability goal that the knowledge economy aims to achieve.
References
[1] Kruss, G, 2012. “Reconceptualising engagement: a conceptual framework for analysing university interaction with external social partners”, South African Review of Sociology, 43 (2): 5-26.
[2] Bolaane, MMM; Mazonde, IN; Neba, A; Sekhwela, MBM (2015): The Role of Universities in Facilitating Inclusive Development in Botswana. Universities In Inclusive Development (UNIID) Botswana Report, Gaborone.
[3] Kerven 1980. Rural-Urban Migration Study in Botswana. Central Statistics Office, Gaborone.
[4] Somolekae, G 1994. The environment of small scale business and the informal sector in Botswana: Constraints, problems and prospects. University of Botswana, Gaborone.
[5] Mazonde I N 2017. A case for the promotion of indigenous knowledge for entrepreneurship development in developing countries: The case of Botswana. PULA: Botswana Journal of African Studies. Vol 31, No 2, 2017, 3 –16.
[6] Szogs, A 2011. Building systems of innovation in less developed countries: the role of intermediate organizations
supporting interactions in Tanzania and El Salvador. Unpublished Mimeo, El Salvador.
[7] Botswana Government. Poverty Eradication Programme, Gaborone, 2005.
[8] Botswana Government, 2015: The 2013/2014 Report of Botswana National Survey Of Research and Development, Gaborone.
[9] Mazonde, I.N. (2007). The Enterprise Dimension of the British University: Experiences from Three Scottish Universities. A Commonwealth Fellowship Study Tour to the Universities of Abertay Dundee, St. Andrews and Dundee, 22 October – 30 November, 2007. Gaborone. Unpublished Report
186
Reseach for Sustainable Development in Sub-Saharan Africa in the 21st Century Idowu Biao
Department of Adult Education, University of Botswana Email: [email protected]
Abstract
This paper posits that although the first Sub-Saharan African University was established in 1827, university research has yielded little significant result within the African space. A few reasons have been advanced to explain this situation. They include the fact that African universities have capacity to admit only 7% of qualified candidates. Africa has not demanded solutions forits socio-economic challenges from African universities. African elites still hope that the operationalisation of globalisation will take care of the socio-economic development needed by Africa.In the meantime, between the 1960s (Africa independence period) and the 21st century, the quality of life (as measured by job and social security, psychological stability, safety, etc.) of Africans has gradually deteriorated. And this deterioration did happen in spite of the uplifting of some African countries frompoor to middle income statuses or despite theperiodic announcements that many African countr GDPs were looking up. Development is about pulling up a majority of ordinary persons in society. This phenomenon occurs only when universities (soc think tank) are able to provide solutions to the challenges facing ordinary persons.Within the context of Sub-Saharan Africa, the absence of additional pathways to education, unemployment and livelihood issues, the existence of a virile but disorganised informal sector and life within African cities that are incapable of supporting the survival efforts of citizens are a few current challenges bedevilling the ordinary person. These challenges speak to what may be viewed as compelling research agendas that promise to positively impact the development of Sub-Saharan Africa. No other nations can proffer solutions to these challenges better than Africa itself. This is because the solutions that would most suitably address these concerns need to be derived from the wealth of knowledge (both traditional and modern) that can be adapted to the specific social, economic, environmental and psychological conditions of Africa.
Keywords 21st century, Africa, Livelihoods, Research agenda, Sustainable development, Universities.
1. Introduction
The first Sub-Saharan African university (Fourah Bay College, now University of Sierra Leone) was established in the year 1827 [1]. Beyond the 1960s (the period during which most African countries acceded to independence), a number of tertiary institutions (universities, mono- technics, polytechnics, colleges of education, etc.) got established on African soil. Yet, not much research was demanded from these nascent institutions. Neither did African authorities prescribe an important enough role for research within the developmental framework of the continent. Beyond the request that the academic personnel of African Universities should carry out some amount of community service along teaching and a kind of research that mainly promoted their upward career mobility within university campuses [2], not much was demanded of African academics in the area of development-oriented research before the close of the 20th century.
A number of reasons could have accounted for this situation. First, the period lying between the 1960s and the year 2000 may have been considered as a period of consolidation for African budding tertiary institutions. During this 40-year period, the expectation must have been that African tertiary institutions would develop their human resource and material infrastructures with a view to positioning themselves within the world academic arena. Second, between the 1960s and 1990, the World Bank and other international development partners did not believe that Africa needed universities in any significant number as the view was held that primary and secondary education held the prospect of higher returns on investment in education than did higher education [3];[4].
Consequently, before the end of the 20thcentury, African tertiary institutions counted fewer universities than there now exist. Since high calibre research is usually expected more from universities than from other tertiary institutions, it may have been that the research results produced by a few existing universities 187
were not impactful enough to be visible. Third, the hegemonic powers (colonial metropoles) of African countries did succeed in convincing African leaders that they were able to fill the developmental gaps that non-performing African universities left within the life of these states during the period leading to the end of the 20th century.
In the words of Ajayi et al. (1996), whereas African academics planned to take the nations of Africa to great levels of mental and material development after independence, it was sorrowfully discovered that, After independence, the university people found that they were no longer the ones defining the mission: the state did and universities took their cue from that to define their role. It was the state that crystallized the mission as Development (Ajayi et al., 1996 p. 87 as cited in [5].
In the meantime, African populations have grown exponentially. With the growth in population came numerous educational, economic, health and ecological challenges. The waves of world economic recessions of the 1980s and 1990s [6];[7] combined with the global financial crisis of 2008 [8] have weakened both the willingness and ability of former colonial powers to assist in attenuating the social and economic woes of African nations through the usual channel of financial and material aids, one channel which has itself been discredited in a number of ways [9]. Under these circumstances, some amount of help was expected from universities. However, during this same period, the universities themselves were plagued with their own challenges which include too low student enrolment to impact African socio- economic life [10], production of labour force whose skills stood at variance with the demands of the market [11], neglect of the agricultural sector [11], production of graduates lacking in critical thinking [12] and poor financing of the tertiary education sector [13].
The world economy is yet to stabilise enough for Africa to again expect great financial and material support from the Global North. Indeed, if anything, each country of the Global North is currently re- strategising to save and protect its own economy at home. The rise of populist governments in Europe and the United States America, the development of punishing policies against international migration, the declaration of trade wars, the withdrawal from international partnerships judged to be unprofitable and non-
strategic (e.g. Brexit, withdrawal from climate change agreements by the USA, etc.) and the renewal of arms and nuclear weapon race among advanced and emerging societies during the second decade of the twenty-first century, are evidences of the fact that previous benefactors of Africa are themselves struggling to provide for their own people at home and would not be readily available for Africa as it used to be the case.
Meanwhile the woes of African countries have not abated and learning from the lessons of history, it is now remembered that when the chips were down at various times in human history, it was the philosophers (in ancient Greece and pre- Republican France), the universities (in ancient Rome, pre-industrial Europe and post-industrial Europe) and the early intellectuals (in pre-independence Africa) that proffered the great solutions that pulled societies upward and out of difficulties.
This paper aims to analyse the current developmental challenges facing Sub-Saharan Africa with a view to proffering ways in which African universities may assist in solving some of these challenges through research.
2. Research
Research is an investigation which seeks to either proffer solutions to an already identified problem or one which seeks a more profound understanding of a phenomenon. It has been found that research usually tends to generate two types of knowledge, namely, mode 1 knowledge and mode 2 knowledge [14].
Mode 1 knowledge is the type of knowledge that may be categorised as academic. It includes such pieces of knowing whose discussion pertains to the realm of intellectualism and higher-order thinking. Examples of these pieces include the development of theories, modelling of design prototypes, etc. Mode 2 knowledge, on the other hand, speaks to the social relevance knowledge as a first line impact. In other words, mode 2 knowledge is a type of knowledge that most members of society can relate to and use for the purpose of deriving some practical benefits. These benefits are usually those ones that help community members to resolve issues regarding for example, access to education and learning outside the school system, shortage of housing facilities and access to affordable health care to cite but a few.
188
3. Sustainable development
The concept sustainable development is both a process and outcome of development. It is a process in that it outlines the route developmental activities must take in order to perpetuate therenewal and regeneration of resources soas to enable future generations to use same resources safely [15]. It is an outcome because the process of sustainable development results in physical and psychological end results and benefits. In a physical sense, nature esources remain present within the environment even after a generation has gone bye. In a psychological sense humanity is happier when at no period in his history, he struggles to satisfy his needs in natural resources.
While there have existed numerous theories of development (classical, neo- classical, liberal, human centred and others), the addition of the concept sustainable to development simply suggests that, irrespective of the theories of development espoused by an individual, community and society, both the process and outcome of development should make allowance for the next generation of human beings. Unfortunately, that which defeats the aim of the prescription of sustainable development usually resides within specific theories of development.
For example, the liberal theory of development recommends that all human beings and human organisations should be given a free hand to open and run businesses as they wish each relying on his capabilities, acumen and initiatives. This idea presupposes the enthroning of a cut- throat competition which would encourage the employment of all desperate means to outdo the other competitor. Within this kind of logic, the continued existence of natural resources may not be guaranteed.
4. Development within the sub-saharan African context
Sub-Saharan Africa is one part of the world that has experienced a complicated story of development. As a collective of human beings, Sub-Saharan Africa had its own vision and instruments of development which it used until the period of colonialism. From 1884, the year of the balkanisation of Africa [16] to date,
Africa has vacillated between his pre-colonial world view and his post-colonial world view. On the one hand, beginning from the colonial period the international community has worked hard to integrate Africa into the world systems of politics, education, economy, health and environmental sciences. Unfortunately, the adoption of these world systems come at a cost. Sustained huge monetary budgets that are not available to Africa are needed to bring about a transition from traditional African society to modern African society. Additionally, there exist pockets but sizeably important communities (when pooled together) within Africa that are suspicious of some of the world systems being proposed for adoption. One notable group among these, is the indigenous people of Africa. In connection with the indigenous people generally (including those from Africa), it has been said that, Research has indeed documented the negative impact of formal schooling systems on the significant background knowledge about nature, culture and values that indigenous children have previously acquired in their communities. Because education has been serving as a means of transmission of ideologies of the people in power, indigenous knowledge has been denied and destroyed for centuries through formal education systems conceptualized under western or national norms (depending on the country), which were promoting homogenization rather than plurality (Mato, 2015; Stavenhagen ,2015). Examples from countries such as Canada, the United States and Australia show the unquantifiable amount of indigenous knowledge loss from the beginning of the 20th century [17 P. 11].
As a result of the experience described in the above citation, a number of indigenous people have been converted into the modern way of living. Yet, a large number still exists within Sub-Saharan Africa who are continuing to preserve their ancient ways of living and who are literally hiding away from schooling. As if, this is not enough notorious publicity for modern education, a close examination of the performance of the school system in Africa reveals a pitiable outcome. Only 7% of those qualified to be in African tertiary educational institutions actually get placement [18]. Less than half of students that are qualified to be in secondary schools, are actually in these schools [19] and only about 50% of primary school population reach the final year of primary school education [20].
189
Therefore, if it were accepted that those who have been equipped to drive socio-economic development are those who have gone through university or tertiary education [21], and if it were equally accepted that a critical mass of these university graduates is needed for society to begin to develop, the conclusion to draw here is that Sub-Saharan Africa is yet to start off on the path of socio- economic development.
5. Instruments of development
As suggested earlier, literature shows that financially and materially wealthy nations of the earth have traditionally and are currently doing well in Western education [22]. And they are doing well, irrespective of the fact that the medium (schooling) they have chosen to promote education with, is the most expensive education system available [23]; [24]. This is not surprising. About a hundred years before Africa began to independently run its socio-economic operations using money (modern currency or capital), the Global North has set up the machinery that will perpetually guarantee its unfettered access to the needed capital to fund modern education at home. This machinery includes but is not limited to the three stages that saw to the monetisation of the world. Between 1870 and 1945, a world currency concept was established through the setting against the gold of all individual currencies that may come to exist. Between 1945 and 1971, world currencies exchange rate was set against the United States of America Dollar and between 1971 and 2015, the flexible exchange rate was adopted [25]. The International Monetary Fund (IMF) that was established in the 1940s continues to see to it that the world monetary structures obey the Global Nor concepts of economics, wealth and development.
Therefore, money and all it can buy constitute a veritable instrument of educational development. However, education itself is a more powerful instrument of development. Education is a process of socialisation which seeks not only to perpetuate that which is accepted to be good and beneficial in society but it is an instrument which usually promotes a defined world view. Hence, formal education (the school) is a vehicle for marketing the Global North s world view and non-formal education (sometime referred to, as informal education) advertises traditional societies process of education.
However, within the context of globalisation, all human communities are currently in perpetual contact and interaction and all world views are constantly inter-mingling. The dynamics within the perpetual embrace of all worldviews favour the most economically endowed. As such, through all such international bodies as UNESCO, UNICEF, UNFAO, USAID, DFID, DVV/IZZ, Sub-Saharan Africa has been fairly well integrated into the world systems and schooling has taken a fair foothold on the continent. Yet, all inventories have shown that one and a half centuries of schooling have not brought the desired socio-economic development for Sub- Saharan Africa. Neither would the next two centuries bring any appreciable socio- economic if schooling were the system of education Sub-Saharan Africa was to rely upon going forward since an important amount of capital would be needed to operationalise the school system.
Whereas it is proper and beneficial for Sub-Saharan Africa to hook on to world systems within the context of globalisation, Africa should not develop an over- expectation from the operationalisation of gloablisation. No societies will donate her monies, resources and knowledge to Africa free of charge. Many a people in Africa, including, sadly, academics and government officials have held the view that globalisation will see to the development of Africa. Yet, Those who championed globalization once promised a world of winners, one in which free trade would lift all the world’s boats, and extremes of left and right would give way to universally embraced liberal values. The past few years have shattered this fantasy, as those who’ve paid the price for globalism’s gains have turned to populist and nationalist politicians to express furry at the political, media, and corporate elites they blame for their losses [26].
Where Africa is therefore interested in development, it must begin to create for its own consumption, additional material and knowledge wealth by beginning to mine current opportunities in which it dwells. These current opportunities are its rich traditional knowledge wealth and its world view. It can carry out this mining task through the path of research.
6. Current compelling research areas in sub-saharan Africa
A number of knowledge areas currently exist in Sub-Saharan Africa which, if researched into, would lead to improvement of life and living in 190
the sub- continent. These areas include the unearthing of additional pathways to education, the creation of livelihoods, the refinement of the informal sector of national economies, and a re-examination of African city planning models and philosophies.
6.1 Additional pathways to education In a general sense, that which is understood to be education nowadays is schooling. Schooling or formal education is one system in which Sub-Saharan Africa has shown great weakness as stated earlier. Yet, the human race lives in an era of knowledge economy or learning societies. In other words, human beings everywhere would derive maximum benefits from living only if they are ready to access information and learn about phenomena that ultimately impact their life. As stated earlier, a negligible few Sub-Saharan Africans (7% tertiary learners, less than 50% secondary school students and about 50% primary school pupils) are currently positioning themselves for living in learning societies through schooling.
What then happens to the remaining teeming populations of Sub-Saharan Africa that have no access to the school? Must they not learn too? They must and should learn. But through which channels? The answer to this last question dwells in research. Before the arrival of the concept of school, Sub- Saharan Africa has always learnt. The contents of those learnings were not necessarily those which need to be learnt nowadays but the venues for those learnings, the strategies and approaches for those learnings subsist. Those venues that were used during the pre-school era were usually not paid for in a formal sense. They included public and sacred places, private abodes, chambers of rulers and tree shades. Are there ways in which these educational venues may be revisited by modern educators with a view to reconfiguring them into inexpensive learning venues befitting the modern times?
What about didactic or instructional methods? Is it possible to adopt the praise singerof communication in advancing learning outside the school system? Can the Kgotla communication styles be developed into a veritable instructional method for promoting learning that can be assessed scientifically? Would a combination of school and non- school instructional methods produce any desirable results in learning?
What about curricula contents themselves? School curricula contents may produce a vocationally inclined individual or an academic person or a generalist. Huge budgetary allocations have usually been allotted to the development of many of these curriculum contents which have produced trained individuals who according to [11] have sometimes been said to be unfit for national and/or international markets. The type of the curriculum contents with which learners are impacted is greatly responsible for the nature of the outcome usually obtained. Consequently, in order to partly address the concern of Babalola, research is needed to answer [27] question as to whether Cost-benefit analysis can guide education policy in developing countries. In other words, should Africa and indeed developing countries concern themselves more with socially profitable education or with the cost of education?
6.2 Livelihoods and employment
Employment and livelihood are related terminologies in that that they all talk to human survival and/or decent living. Yet, the terminologies employment and livelihood imply different connotations. Employment implies that persons legally employable are found to be in an activity or series of activities that are paid. This paid activity may go on for a period as short as one day or as long as many years (ILO as cited in [22]). Usually, the payment received by employed people who are generally referred to as employees, is sourced from government coffers, the private sector unds or other non-governmental organisations funds depending on the agency the employee serves. However, livelihood is…………a set of activities and strategies pursued by household members, using their various assets (physical, natural, human, social, financial) in order to make a living. Livelihoods usually involve employment of household labour and the use of other household assets, if any, in order to live on the proceeds. For the large majority of people across all countries, the most important livelihood asset is primarily their own labour, followed by other household assets (physical, financial, social and natural) [28 para 2].
191
A careful study of the two terminologies (employment and livelihood) suggest that persons operating within the realm of employment are in a less tenuous and less tough situation than those operating within the area of livelihood creation. Whereas some organisations assume the responsibility of finding salaries and payments to reward employees in various employment sectors, those left to irk livelihoods, have to rely on their own labour, assets and strategies to come bye.
In most African countries, the development of the private sector is limited and government ultimately finds itself becoming the largest employer of labour. Unfortuanately, under strenuous economic circumstances, there is so much employment these nations of Africa can provide. Consequently, in many nations of Africa, unemployment rates are high and may range between 10 and 40% [29]; [30]. With high unemployment rates come high levels of poverty and with high levels of poverty comes the desire to struggle to irk a living. Research would do well to investigate ways to create livelihoods and sustainable livelihoods for the people fo Africa.
6.3 Informal Sector of the Economy
The activities collectively referred to as informal sector of the economy are peculiar to Africa not only because they have their origin in Africa [31] but also because the highest concentration of informal sector activities is located in Africa. One highly developed informal sector activity in Africa that bears relevance to current modern living is street trading. Yet, this activity is under official assault in almost all countries of Africa where street vendors are subjected not only to numerous city council regulations but also to law enforcement ill-treatment [32].
Street vending not being the only available informal sector activity on the continent, research would be needed to unearth other informal sector activities with a view to making them visible enough to attract unemployed persons in search of employment and livelihoods.
However, a greater role of research within the informal sector would be to sanitise the sector by investigating ways of upgrading and upscaling activities of actors with a view to creating a more prestigious outlook to this sector which is already contributing significantly to the Gross
Domestic Product (GDP) of African states according to [21].
6.4 Sustainable Town Planning
If there is an area of activity before technology that revealed a most high level of human genius, it is town or city planning. From ancient Egypt through ancient Greece to ancient Rome, cities of exceptional characters were built [33]; [34]. Till date, even the ruins of those ancient cities still permit the curious to peep through the exceptional capacities of the human mind to conceive and actualise. Ancient Africa was not left out of these feats of city building. From Alexandria through Gao to Timbuktu, African architectural marvels were displayed for all to see [35]; [36].
Each of these cities creditably served the needs of their builders at the time. Since human needs are not only transient but dynamic, ancient city ideologies have now given way to modern city regimes whose role is to support the promotion of modern human needs and aspirations. One prominent regime of modern city planning is one referred to by [37] as the modernist approach to town planning. This approach emphasises Land-use zoning systems.Land-use zoning systems are systems of town planning which identify and designate specific portions of a city to specific formal uses such as the erecting of residential quarters, the building of commercial spaces and the creation of recreational areas [37]. Once erected, these formal city creations become inviolate and any activities viewed as disruptive to the order laid down is met with severe penalties meted out by City Councils.Africa inherited the modern concept
of city planning from the Global North after World War II in 1945 [37]. Unfortunately, numerous activities remain non-formal in Africa. Unlike in the Global North, numerous trading activities (street vending, artistic works, auto mechanic works, vulaganising, etc.) are not carried out as formal activities in cities. The bulk of those involved in these activities are the peasants of Africa constituting not only the majority of African population but also the heart of the continent. These peasants of Africa can neither be wiped out in a swoop nor deported to anywhere.
Would research therefore not assist Africa to create cities that would cater to the needs of these social strata that cannot be got rid of? Would research in modern town planning and city and regional development assist Africa in building 192
both inclusive and resilient cities and regions? Fortunately,
While in large parts of the world the bulk of urbanisation has already taken place and is embodied in city forms and existing infrastructures, cities in Africa currently have an unprecedented opportunity to shape their urban futures in a more inclusive, sustainable and resilient manner. The decisions taken by governments at national, sub-national and city levels now will have consequences for the functioning, liveability and environmental sustainability of their cities for decades to come. The next decades offer an opportunity to address urban poverty and inequality and shape development priorities to ensure that urbanisation helps foster well-functioning liveable and sustainable cities [38].
The hope therefore still exists that Africa can adopt a different city planning agenda from the Global North with a view to addressing its own peculiar needs even in these modern times. In any case, the modern philosophy of town planning is being currently criticised for its obsoleteness and for its being environmentally unfriendly even within the Global North (Fanglang, 2016)[39].
7. CONCLUSION
Relying on the foregoing discussion, it does appear that Africa esearch agenda must necessarily differ from the Global Nor if it is to pursue a realistic developmental trajectory. The reason for this is not far-fetched. The challenges facing Africa are different from those facing the Global North. If research is a process of searching for solutions to onechallenges or a way of seeking deeper understanding of one own circumstances, then the African university and graduate studies must go back to the drawing table with a view to prioritising African challenges in their research agendas.
These research agendas may elect to prioritise methodologies akin to either mode 1 knowledge or mode 2 knowledge or a combination of both modes of knowledge. That which is paramount is that, irrespective of the methodologies adopted, the bulk of Africa and Africans should begin to feel both the impact and relevance of African universities through the accessing of relevant information and tools with which they may solve their daily challenges.
References[1] D. Teferra, P.G. Altbach, African higher
education: Challenges in the 21st Century, African HigherEducation Journal, vol 47(1),21-50, 2004.
[2]Association of African Universities Implementing the third mission of universities in Africa. Retrieved from PASCALOBSERVATORY: http://pascalobservatory.org/project s/current/implementing-third- mission-universities-africa-itmua, 2018.
[3] G. Psacharopoulos, Higher education in developing countries: A cost- benefit analysis. Retrieved from World Bank Documents: http://documents.worldbank.org/cu rated/en/337771468765265752/Hig her-education-in-developing- countries-a-cost-benefit-analysis, 1980.
[4] C. A. Smith, Literacy and schooling in the development threshold:some historical cases in C A Smith (Ed.), Education and economic development. (USA: Aldine Publishing, 1965).
[5] J. Preece, The African university and community engagement in context, in J. Preece etal. (Eds.), Community engagement in African universities: Perspectives, Prospects and Challenges, (Leicester: National Institute of Adult Continuing Education (NIACE), 2012) 1-29.
[6] J. A.Tapia, From the oil crisis to the Great Recession: Five crises of the world economy. Retrieved from https://marxismocritico.com/2013/. ../from-the-oil-crisis-to-the-great- recession-five-crises-of-the-world- ecpnomy, 2013.
193
[7] J. Hogan, Economic crises anf policy change int the early 1980s: A four country comparison. Retrieved from Dublin Institute of Technology: https://arrow.dit.ie/cgi/viewcontent. cgi?article=1121&context=buschm arart, 2010.
[8] K. Amadeo, 2008 Financial crisis: Causes and costs of worst financial crisis since the great depression. Retrieved from https://www.thebalance.com/2008- financial-crisis-3305679, 2018.
[9] N. Andrews, Foreign aid and development in Africa. Retrieved fromwww.academicjournals.org/art icle/article1379931879_Andrews.p df, 2009.
[10] M. Oketch, Financing higher education in Sub-Saharan Africa: Some reflections and implications for sustainable development. Higher Education, vol 72(4), 525- 539, 2016.
[11] J. B. Babalola, Reinventing Nigerian higher education for youth employment . Retrieved from http://www.gracembipomfoundatio n.org2007, 2007.
[12] S. O. Akinyemi, etal. Graduate turnout and graduate employment in Nigeria. International Journal ofHumanities and Social Science.,2(14), 257-265, 2012.
[13] B. Tilak, Financing higher education in Africa. Retrieved from http://www.gracembipomfoundatio n.org2007, 2009.
[14] D. Coghlan, and M. Brydon-Miller, Mode 1 and Mode 2 Knowledge production: in the SAGE
Encyclopedia of Action Research.(London: SAGE Publishers, 2014).
[15]United Nations. Our common heritage. United Nations (New York: UN, 1987).
[16] B. Neuberger, The Afrian concept of balkanisation. Cambridge Journal ,4(3), 523-529, 1976.
[17] G. Magni, Indigenous knowledge and implications for the sustainable development agenda. (Paris: UNESCO, 2016).
[18] D. T. Teferra, Charting African higher education Perspectives at a glance. . Intern. Journal of AfricanHigher Education, 1(1), 9-21, 2015.
[19]UNICEF. Education: secondary net attendance rate . Retrieved from UNICEF.: Retrieved from http://unicef.globaldatebases/,2016.
[20]United Nations. The millennium development goals report 2015. (New York: United Nations, 2015)
[21]World Bank. Employment and sustainable livelihoods. Retrieved fromhttpssarpn.orgCountryPoverty PapersZambiaStrategychapter2.pdf, 2008.
[22]OECD. Glossary of statistical terminologies. Retrieved from https://stats.oecd.org/glossary/dow nload.asp, 2007.
[23]P. H. Combs Cost analysis in education (New York:World Bank 1987).
[24] I. Illich Deschooling society (London: Penguin, 1971).
[25]World Gold Council Money and gold Retrieved from
194

https://www.goodreads.com/work/ quotes/216356-deschooling-society
[26]I. Bremmer Us vs. Them: The failure of globalism Retrieved from https://www.penguinrandomhouse. com/books/561759/us-vs-them-by- ian-bremmer/9780525533184/2018
[27] E. Jimenez, and H. A. Patrinos, Cancost-benefit analysis guide education policy in developing countries? (New York: World Bank, 2008).
[28]ILO Employment, livelihoods and social protection Retrieved from https://www.ilo.org/wcmsp5/group s/public/ed_emp/documents/public ation/wcms_397636.pdf 2010.
[29] E. Rosenberg, and D. Maclean, Researching green work-An opportunity to rethink how we determine skills demand. 10th International Conference on Researching Work and Learning. Grahamstown: Rhodes University, (2017)
[30]World Bank. Tertiary education—Higher education. . Retrieved from World Bank: Retrieved from http://web.worldbank.org/EXTEDUCATI ON/0,,contentMDK:2282386,00.html, 2915
[31] K. Hart, Informal Income Opportunities and Urban Employment in Ghana. . Journal of ModernAfrican Studies, 11(1), 61-89, 1973.
[32] I. Biao, Road side vending, Growth of the informal sector and learning needs of vendors in Gaborone City of Botswana. World Journal of Education, 4(1), 151-166, 2017.
[33] J. Kotkin, The city (Modern library chronicles). (New York: Random
House USA Inc. . 2006).
[34] V. G. Childe, The Urban Revolution. . Town Planning Review, 21, 3 17, 1950.
[35] P. Jenkins, African perspectives 4: The African city centre re-sourced.. Retrieved from http://web.up.ac.za/sitefiles/, 2009.
[36] C. Coquery-Vidrovitch, The process of urbanisation in Africa From the origins to the beginning of independence. . African Studies Review, 34(1), 1 98, 1991.
[37] M. Joseph, Beyond modernist planning: Understanding urban street vending in Botswana. . Retrieved fromhttps://www.researchgate.net/publi cation/257943477_Beyond_moder nist_planning_understanding_urba n_street_vending_in_Botswana, 2011.
[38]International Council For Science Pathways to sustainable Africa Urban Development. Retrieved from http://bit.ly/2H656os, 2018.
[39]Fanglang Planning theory and practice: From modernism to postmodernism. . Retrieved from https://planningtheorypractice.word press.com/from-modernism- topostmodernism/, 2016
195
The Politics of Water Crisis in the City of Bulawayo
Kwazinkosi Sibanda* Okavango Research Institute-University of Botswana
Private Bag 285, Maun, Botswana Email: [email protected]
ABSTRACT
The current study focuses on the debates over water management and solutions to the water crisis in the city of Bulawayo. The city of Bulawayo has been a hotbed of political contestation centering on the Management of water by the Bulawayo City council and the Zimbabwe National Water Authority (ZINWA), a government parastatal. Using both primary and secondary literature on the water politics of the city of Bulawayo, a critical discourse analysis methodology was utilised in exploring the positions of different scholars, newspapers and individuals about the current water problems in the city of Bulawayo. The different political formations, civic organizations, the Bulawayo City Council (BCC) and individual activists have proffered different solutions to the water crisis in the city of Bulawayo. The paper details the water debates from 1998 up to the present day. The Zimbabwe national Water Authority Act of 1998 marked the takeover of water management from the city council by the government of Zimbabwe. The management of water was resisted by opposition political parties, the city council and civic organizations who are key stakeholders. The literature surveyed in the study notes that a conflict over the control of water resources between BCC and the central government worsened the crisis. A polarization of opinion exists between the pro-government and the anti-government literature. The study concludes that while the debates have publicized the water problems bedeviling the city of Bulawayo, there has been less improvement in access to water on the part of the residents. Keywords - Critical Discourse Analysis, Governance, Hegemony, Water politics
I. INTRODUCTION Water scarcity is normally presented as
natural phenomena in academia and policy discourse. Technical remedies are therefore proffered by policy makers and researchers. Hydro-politics debates are mainly centered on interstate conflicts (Musemwa, 2006, Zeitoun and Warner, 2006). Scholarly interest in the hydro-politics of Zimbabwe and the city of Bulawayo has been recently ignited by the contributions of Professor Muchaparara Musemwa. Bulawayo is the second city of Zimbabwe and has been affected by perennial water scarcities. This has elicited debates from policy makers, politicians and academia.
Both natural factors and anthropogenic factors are instrumental to the water problems of the city of Bulawayo (Musemwa, 2006, 2008, 2014). Musemwa (2006) analyzed the water scarcities in Bulawayo drawing from the perspectives of residents of the city. He
concluded that ZANU PF hegemony was deployed to deny the people of Bulawayo access to water as a punitive measure against the city that was rebellious to its political dominance. Hadebe (2015) chronicled the history with a revisionist stance from Musemwa’s thesis. He noted that both the City Council and the central government were culpable in denying water to the residents of Bulawayo through constant bickering. This paper fills a gap in a polarized political and academic environment in order to analyze the contributions from the different strands of the arguments and the political divide. The paper utilizes a critical discourse analysis of both the primary and secondary sources. The theory of Hegemony was used to analyse the texts.
1.1 Study area – City of Bulawayo
196
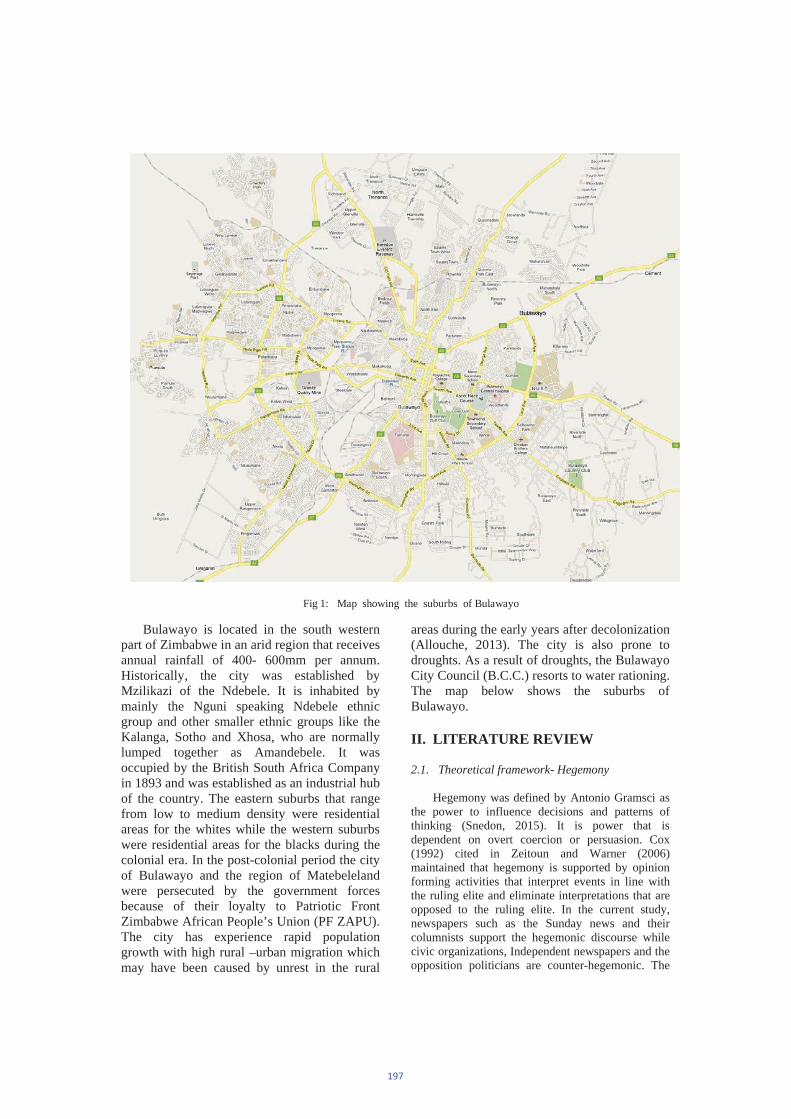
Bulawayo is located in the south western part of Zimbabwe in an arid region that receives annual rainfall of 400- 600mm per annum. Historically, the city was established by Mzilikazi of the Ndebele. It is inhabited by mainly the Nguni speaking Ndebele ethnic group and other smaller ethnic groups like the Kalanga, Sotho and Xhosa, who are normally lumped together as Amandebele. It was occupied by the British South Africa Company in 1893 and was established as an industrial hub of the country. The eastern suburbs that range from low to medium density were residential areas for the whites while the western suburbs were residential areas for the blacks during the colonial era. In the post-colonial period the city of Bulawayo and the region of Matebeleland were persecuted by the government forces because of their loyalty to Patriotic Front Zimbabwe African People’s Union (PF ZAPU). The city has experience rapid population growth with high rural –urban migration which may have been caused by unrest in the rural
areas during the early years after decolonization (Allouche, 2013). The city is also prone to droughts. As a result of droughts, the Bulawayo City Council (B.C.C.) resorts to water rationing. The map below shows the suburbs of Bulawayo.
II. LITERATURE REVIEW
2.1. Theoretical framework- Hegemony
Hegemony was defined by Antonio Gramsci as the power to influence decisions and patterns of thinking (Snedon, 2015). It is power that is dependent on overt coercion or persuasion. Cox (1992) cited in Zeitoun and Warner (2006) maintained that hegemony is supported by opinion forming activities that interpret events in line with the ruling elite and eliminate interpretations that are opposed to the ruling elite. In the current study, newspapers such as the Sunday news and their columnists support the hegemonic discourse while civic organizations, Independent newspapers and the opposition politicians are counter-hegemonic. The
Fig 1: Map showing the suburbs of Bulawayo
197

theory of Hegemony was utilized by Zeitoun and Warner to analyse hydro-politics in the rivers Euphrates, Tigris, Jordan and Nile. The current study used the hegemonic framework to create codes and themes for data analysis.
2.2 Hydro-Politics in Bulawayo
Southern Africa is affected by acute water scarcities due to rapid expansion of urban areas (Makwara and Tavuyanago, 2012). Zimbabwe in general and Bulawayo in particular is not an exception to the domestic water scarcities bedeviling the Southern African cities. According to Musemwa (2006), Bulawayo is a unique case because its water woes are a result of both the natural and anthropogenic causes. This means that governance and distribution issues are partly contributory to the domestic water problems affecting the city of Bulawayo.
Musemwa (2006, 2008, and 2014) maintains that the domestic water crisis in Bulawayo can be traced back to the colonial period. The racial policy of separate development ensured that Whites in the Eastern Suburbs had adequate water while the Blacks in the western suburbs were denied access to adequate quality water and sanitation services. The blacks were treated as visitors in urban centers and hence they did not have stable provisions (Makwara and Tavuyanago, 2012). The white supremacist government used its hegemony to justify a racially skewed water distribution policy. The post-colonial government prioritized water provision in the rural areas during the 1980s and 90s and left urban councils in charge of water provisions in towns. The Prioritization of rural water provision was a political decision, since the rural peasants played a pivotal role in the liberation struggle (Allouche, 2013). The post-colonial ZANU Pf government therefore used water to legitimize its hegemony among the rural population.
Musemwa (2006) argues that Bulawayo was neglected in water provision because of its loyalty to PF ZAPU a rivalry centre of power. He cites the reluctance by the central government to support the plans by the BCC to draw water from the Gwai Shangani dam, Gwai-Khami Confluence and Zambezi River as a political decision aimed at punishing the ‘dissident city’. This has led to the conclusion that ZANU PF government used water for managing ethnic and political rivalry (Musemwa, 2006, Allouche, 2013; Hadebe 2015). The Bulawayo residents and the business community formed a lobby group to raise funds for drawing water from the Zambezi in 1991.The formation of a counter lobby group by the ZANU PF government lend credence to the perception that ZANU PF used the water scarcity for political gains(Hadebe, 2015).
The water Act of 1998 resulted in the formation of Zimbabwe National Water Authority, a parastatal tasked with the provision of water in urban areas. This was viewed as a means of regaining the urban councils, which were dominated by the opposition Movement for Democratic Change (Hadebe, 2015, Musemwa, 2006, Musemwa, 2014). A directive for the takeover of water provision by ZINWA in Bulawayo was resisted by the council, civic groups and residence of Bulawayo, who viewed it as an imposition of the central government in the affairs of the council. Nyathi and Ncube (2017) note that the central government has never wanted to devolve its authority, despite the 2013 constitution that catered for devolution.
III. METHODOLOGY The study used critical discourse analysis, a
qualitative approach of collecting and analyzing data from texts. According to Marchin and Mayr (2012), Critical discourse analysis interprets the meaning of texts, exposing the interrelationship between language, power and ideology. The study collected data from journal articles, books, dissertations and online newspaper articles published from the year 2005 to 2015. Purposive sampling was used for selecting documents that were used. The criteria for samplinig were the content of the document. The study used only the sources which contained discussions of water politics of the city of Bulawayo. The data was coded and grouped into themes using theory as well as the common themes that were obtained from the documents. The paper used Lustick’s mechanisms of gaining compliance namely coercive, utilitarian and ideological to derive themes from the theory of Hegemony (Zeitoun and Warner, 2006).
IV. FINDINGS The paper analyzed data from 4 journal articles,
one book chapter, one Dissertation, one online book review and 13 newspaper articles. The newspaper articles included 2 Government owned papers with 5 articles and 4 independent newspapers contributing 10 articles. News and Opinion sections of the columns were analyzed in the current study. The government papers represented the hegemonic ideology while the independent newspapers represented the counter hegemonic views. The collected data was grouped into 4 themes. These are; Water as a political campaign tool, Water as a weapon against opponents, Water scarcity as a result of poor governance, and Water scarcity as a colonial bequest.
4.1 Water as a political campaign tool
Terms used to describe the use of water by political gladiators in Bulawayo include, ‘a political
198
trump card (Musemwa, 2006, The Independent, 18 February 2005, Zhou and Chilunjika, 2013), ‘an electioneering tool’ (Independent 6 February, 2006), an ‘electoral drawing card’ (Standard 20 August, 2009’ and a means ‘for political gains’ (Hadebe, 2015). This means that water has been used as a means of campaign during elections. Most sources cite ZANU PF using water as a means of campaign promising to implement the projects such as Gwai-Shangani and Matabeleland Zambezi water project (Hadebe, 2015, Musemwa, 2006). Political commentators like Gorden Moyo an opposition politician and the late Edward Simela of Bulawayo United Residents Association were quoted saying that the projects are resurrected towards elections only to hibernate until the next elections (Musemwa, 2006). These assertions represent the counter-hegemonic bloc that is skeptical of the ruling party’s intentions.
On the other hand Zhou and Chilunjika (2013:459) maintain that water scarcity have been used “…for marketing regional marginalization”.Therefore, contrary to the discourse championed by independent papers and scholars like Musemwa, who blamed ZANU PF in using water for electoral campaign, even opposition parties and regional civic organization are equally culpable in politicizing water.
4.2 Water as a weapon against political opponents
According to Musemwa(2006: 241), ZANU PF used water as ‘a tool to brow beat the city council into submission’ This means that water was deliberately withheld, or the Bulawayo city council was not supported by the central government as a means of punishing the opposition party that controlled Bulawayo City Council. Musemwa (2006) maintained that during the 1980s, ZANU PF used water to punish Bulawayo City Council for being loyal to PF ZAPU. Allouche (2013) concurs with Musemwa emphasizing that “the ZANU PF government used the withholding of water as a weapon against the perceived dissidents, despite the unity accord.” Allouche further notes that ZANU PF used water as a means of managing political and ethnic rivalry. This was the perception of the people of Bulawayo who felt that they were marginalized for being the Ndebele ethnic group and supporting PF ZAPU. There was continuity in sabotaging Bulawayo for Supporting the Movement for Democratic Change from the year 2000 according to scholars and independent papers (Musemwa, 2006, Hadebe, 2015). It should be noted that after 2000, all the cities were controlled by the opposition and encountered central government intervention through the minister of local government and ZINWA. Ethnic marginalization thesis may no longer be sustained in the post 2000 era.
4.3 Water scarcity as a result of poor governance
Absence of long term planning has been cited as a cause of water crisis in Bulawayo (Muchadenyika, 2015, Bulawayo 24 news, 16 January 2017). Eddie cross, the former MDC legislator noted that,
“Bulk storage of water in all urban areas is down to 18 months or less rather than the 3 years previously stipulated and plans for new bulk water sources such as the Gwaai/Shangani and Harare North water supplies, have not made any progress despite years of planning and promises”(Bulawayo 24 News, 16 January, 2017)
This means that poor planning by the central government is assigned blame for the water crisis. ZINWA was also said to be lacking in capacity to distribute water to the city of Bulawayo. Even the ZANU PF official, Effort Nkomo argued that ZINWA lacked capacity as compared to the BCC. (Musemwa, 2008). Makwara and Tavuyanago (2012) cited central government bureaucracy as an impediment to the city councils. On the other hand mismanagement by the Bulawayo city council is also fingered as a cause of water scarcity (Ncube, 2012 cited in Hadebe 2015). Muchadenyika (2017) cited ‘corruption and contestation in urban councils’ as culpable in the water scarcities. Therefore scholars and individuals have different perceptions about the mismanagement of water delivery, with both the central government and city council cited by different camps.
4.4 Water scarcity as a colonial bequest
The colonial government is partly blamed for the water scarcity of Bulawayo through its policy of water distribution that neglected the western suburbs (Hadebe, 2015, Musemwa, 2006, Musemwa, 2008). Maromva (2017) in his review of Musemwa (2014)’s book, assigns water problems to the colonial legacy and maintains that Musemwa and other writers have a neo-colonial agenda. In one of his four weeks installments entitled ‘Rethinking Hydro-politics in Bulawayo’ Maromva argues
“It is sensational to attribute water crisis to tribally welded power by the central government. This perspective is ignorant of the fact that the birth of Bulawayo as a city after the Anglo-Ndebele war of 1893heghtened water scarcity. It is the colonial aspirations to industrialise the city that aggravated the water crisis” (The Chronicle, 15 January, 2017).
Maromva contributed articles in the Chronicle, a government controlled newspaper. Therefore his argument is in line with the ZANUPF Hegemonic
199

discourse that assigns blame to colonial legacy for post-colonial service delivery failures.
V. DISCUSSION The study established that different scholars and
newspapers maintained that there has been some degree of politicization of water in the city of Bulawayo. While the counter hegemonic scholars held ZANU PF responsible for using water scarcity for electoral gains, it was established that the opposition and regional civic organizations also used the water crisis to advance the discourse of regional marginalization. This dovetails with Sibanda and Dube (2018) analysis of short stories from Bulawayo which were dominated by regional marginalization discourse. The study notes that the government has been forced to market projects like the Gwai-Shangani dam and national Matabeleland Zambezi water project that are not within the fiscal capacity of the country (Musemwa, 2008, Zhou and Chilunjika, 2013).
The study also established that perceptions of using water as a weapon against the Ndebele ethnic minority could be justified during the1980s. This could be due to the fact that the government imposed food embargoes in Matabeleland during the dissident era. The Ndebeles felt that the government wanted to kill them through thirst and starvation since most of them fled unrest in rural areas to stay in Bulawayo (Thebe, 2013). The thesis of ethnic marginalization therefore cannot be sustained after 2000, with the onset of the nationwide crisis. There could be some justification of the perception that the central government used water to seize control of Bulawayo from the MDC dominated city council. However the study established that Bulawayo city council also used its protest to deprive residents of water.
VI. CONCLUSIONThe study concludes that there has been
politicization of water governance in the city of Bulawayo since the colonial period. The study concurs with Hadebe (2015) that contestation between the city council and the central government has not solved the water problems of Bulawayo.
The study recommends devolution of governance in Zimbabwe as the solution to the water problems and service delivery in Bulawayo. The study recommends that projects that are within the fiscal means of the country should be used to solve the immediate water problems of Bulawayo.
ACKNOWLEDGEMENTS
My supervisors Dr. Mothsolapheko, Prof. Kgati and Prof. Mbaiwa
REFERENCES
[1] Allouche J. The role of informal service providers in post-conflict reconstruction and state building, In: Water and post-conflict peace building. Editors: Weinthal E., Troel J.and Nakayama M. Earth scan, Newyork, pp 31-42, 2013.
[2] Hadebe M. A dry city: History of water problems in Bulawayo1980-2014. ABachelor of Arts in History and Development Studies dissertation, Midlands State University, Gweru, Zimbabwe, 2015.
[3] Makwara E.P. and Tavuyanago B. Water woes in Zimbabwe’s urban areas in the midst of plenty: 2000-present. European Journal of sustainable development Vol 1(2) pp151-180, 2012.
[4] Marchin B. and Mayr A. How to do critical discourse analysis: A multimodal Introduction. Sage. London, 2012.
[5] Maromva M. Rethinking ‘hydro-politics’ in Bulawayo. The Sunday News, 15 January 2017.
[6] Muchadenyika D. Review: Water History and politics in Zimbabwe: Bulawayo struggles with the environment: 1894-2008. (Musemwa M.2014 Africa world press). Available online https//www.uburnafrica.net/review-water- history-politics-in-zimbabwe-bulawayos- struggles-with-the-environment-1894-2008/
[7] Muchadenyika D. Civil society, social accountability and service delivery in Zimbabwe. Development policy review: pp 1-18, 2017.
[8] Musemwa M. Disciplining a ‘Dissident City’: Hydro-politics in the city of Bulawayo, Matabeleland, Zimbabwe. Southern African Studies, Vol 32(2), pp 239-254
[9] Musemwa M. Early Struggles over Water: From Private to Public Water Utility in the City of Bulawayo, Zimbabwe, 1894-1924’, Journal of Southern African Studies, Vol 34(4), pp 881-898, 2008
[10] Musemwa M. ‘Politics of Water in Post-colonial Zimbabwe, 1980-2007’ Paper presented at the African Studies Centre seminar, University o f Leiden, Netherlands, pp1-32, 19 June 2008.
[11] Musemwa M. Water, History and politics in Zimbabwe: Bulawayo’s struggles with the
200
environment 1894-2008, Africa World Press, Trenton, 2014.
[12] Nyathi M. and Ncube M. The myth of devolution in Zimbabwe: The reality- post may 2013.University of Botswana Law Journal. Pp 27-51, June 2017.
[13] Sibanda N. and Dube S. Recollecting the memory of Bulawayo through naming in short writings from Bulawayo. European Journal of English Language and literature studies, Vol 6(1) pp 43-52, 2018.
[14] Thebe V. “Discipline and Disengagement” Cross border migration and the quest for identity among the Ndebele of South-western Zimbabwe, In: Bondage of boundaries and identity politics in post-colonial Africa. Editors: Ndlovu-Gatsheni S. J. and Mhlanga B. Africa Institute of South Africa, Pretoria, pp 205-221, 2013.
[15] Zeiton M. and Warner J. Hydro-Hegemony: A framework of analysis of trans-boundary water conflicts. Water policy Vol 8, pp 435-460.
[16] Zhou G. and Chilunjika A. “A peep into the sources of policy implementation inertia in Africa: The case of the Matebeleland Zambezi Water Project (MZWP) in Zimbabwe. Asian Journal of empirical research, Vol 3(4) pp447- 463, 2013.
[17] Newspaper: Bulawayo 24 news, 6 January 2017
[18] Newspaper: Newzimbabwe.com, 24 June 2018
[19] Newspaper: Sunday news 8 January 2017 [20] The Independent 18 February 2005 [21] The Standard, 20 August 2009
201
1. Introduction
Renowned universities acquire their fame from two sources: producing cutting edge research, good corporate and political leaders. Consequently, universities focused on how to be competitive in global and national rankings “are often looking for ways to improve research and teaching efforts” [1]. Postgraduate training constitutes one of the essential components of improving research output and visibility. As Litalien and Guay [2] observed, postgraduate training confers many benefits to the individuals (in the form of greater professional and personal mobility, better working conditions and higher income) and to the society (in the form of tax incomes, knowledge production, innovation and socio-economic development). As noted by Crest [3], graduate studies, notably doctoral research, facilitate generation of new knowledge, skills and innovations that underpin the modern knowledge economy. Studies (e.g. [4], [5]) have shown that innovation and information technology (IT) driven countries are investing heavily in research and support for postgraduate studies. This implies that
graduate research is not a simple academic exercise but a critical strategy for improving the performance of both private and public sectors. Products and findings from graduate research provide solid bases and empirical evidences for decision making, policy formulation and programme evaluation to ensure sustainable development [6]. Postgraduate students later become smart consumers, agents and promoters of new innovations and research products as they seek to improve their mandates.
Despite the overwhelming benefits driven from postgraduate studies and research, several studies (e.g. [7], [8], [9], [10],) have revealed that attrition and failure to complete studies or submit thesis on time are quite widespread among masters and doctoral students. Attrition, with regard to academic programmes, is defined as a process whereby students drop out of an enrolled programme due to forced or un-forced circumstances. Graduate Attrition Rate (GAR) is the percentage of students who drop out of a programme versus the total initial cohort enrolment. In addition, completion Period (CP) is the time it takes a student to complete a degree after
Postgraduate Candidates’ Attrition and Completion Periods in the Master of Project Management Programme, University of Botswana
Joseph, K. Ssegawaa and Faustin Kalabamub
Department of Civil Engineering, University of BotswanaDepartment of Architecture & Planning, University of Botswana
Email: [email protected]
AbstractThis paper seeks to explore the extent and factors affecting completion periods and attrition among postgraduate candidates
with particular reference to Master of Project Management (MPM) programme at the University of Botswana. It notes that, despite enormous benefits associated with acquisition of postgraduate qualifications, over half of students who register for theMPM and other postgraduate degree programmes at the University of Botswana and elsewhere in the world drop out or take periods longer than prescribed to complete their studies. Long Completion Periods and Attrition (LCPA) is often associated with writing of dissertation after successful completion of taught courses for Masters programmes or writing of thesis for doctorate degrees. Long completion periods and, in particular, attrition have adverse financial, psychological and opportunity costs to affected candidates as well as university faculty, sponsors and other stakeholders. Data for this paper is largely drawnfrom an on-going study on “Challenges Associated with Research Based Postgraduate Degrees”. Findings from the study indicate that while postgraduate candidates pursuing course-only-based programmes complete their degree requirements on time, those writing dissertations either drop out or require numerous semester extensions before they qualify for award of the expected degrees. The paper attributes the delays and attrition in the MPM programme at the University of Botswana to inadequate / lack of funding / sponsorship for postgraduate studies, inadequate academic integration and, to some extent, weak supervisory skills and processes. The paper ends with recommendations as to how to reduce student attrition and completion periods within the MPM programme and beyond.
Keywords Attrition, completion periods, post-graduate research, Botswana.
202
initial enrolment while Completion Variance (CV) is the difference between the minimum stipulated period for completing a programme and actual period a student takes to complete his or her studies. The minimum stipulated period for completing a Master’s degree programmes at the University of Botswana is two (2) years for full-time students and three (3) years for part-time study while the minimum stipulated period for PhD studies is four years of full-time students and eight (8) years for part-time students [12]. Any additional year expended by a student during study will create a negative completion variance (positive variances are possible where the student completes in less than the stipulated minimum period).
As noted by some scholars (e.g. [7], [2]) attrition is a costly affair not only to the individual student but also to the university department, employer, the family and to the nation as whole. First, attrition translates into waste of resources (including money, enrolment space, study materials and supervision effort) expended on a student before he/she drops out of the programme. Resources and energies spent in supervising the student constitute a huge loss to the University and faculty staff. Second, and related to the foregoing, the university may also lose income or revenue in countries where universities are rewarded by governments for books and articles published, innovations produced and PhD degrees completed. Third, attrition may lead to fewer employment opportunities, stress and lower self-esteem on the part of the candidate. Fourth, attrition lowers productivity and competitiveness within a region, nation and beyond. Taking longer than the minimum completion period is equally undesirable because it clogs the systems and leads to high and unbearable numbers of students per supervisor.
In light of the foregoing, several studies on postgraduate attrition and completion rates have been conducted in North America and Europe. However, few similar studies (e.g. [13], [14], [15]) have been undertaken in African and the University of Botswana in particular. The only study conducted at the University of Botswana [12] was not specific to postgraduate attrition and completion rates – its focus was on graduate supervision and covered all master’s and doctoral programmes at the university. In order to provide further insights on postgraduate attrition and completion rates at the University of Botswana, a study on this phenomenon was conducted in May 2018 based on the Master of Project Management (MPM) programme offered in the Faculty of
Engineering and Technology. This article presents some of the key findings from the study. It is divided into five sections including this introduction. The next section briefly explores literature relating to causes and impacts of attrition and long completion periods. The third section presents the case study while the fourth section discusses the findings and the way forward. The fifth section provides concluding remarks.
2. An Overview of Attrition and Completion Periods
Attrition and low completion rates have affected programmes and university for quite some time now. According to [16] average attrition rate in USA ranged between 55% and 65%. A report, by the Council of Graduate Schools (CGS) gave the median period of completion of a full-time doctoral degree as 15 semesters (6 years) instead of 8 semesters (4 years) stipulated by programmes ([17], 18]) while for accredited Masters the median has been 9 semesters (4.5 years) instead of 4 semesters (2 years). Both reports of the CGS and the University of Dalhousie [19] showed that attrition rates varied across the major disciplines, with humanities and social sciences recording the highest attrition rate of about 70% as compared to 20% in STEM (science, technology, engineering, and mathematics) related programmes. The low attrition rates in sciences were attributed to the manner in which students interact and bond as a research community, through laboratory sessions, as opposed to the research isolation found in humanities and social sciences. However, the most compelling reason for paying attention to attrition issues lies on its impacts on students' lives and the image created to the university faculties. Smallwood’s [20] brief description of Barbara E. Lovitts experience emphasises the agony and impact of attrition. Lovitts left two doctoral programs before completing a third one, in sociology, at the University of Maryland in 1996. Following her doctoral debacle, she too, investigated the attrition phenomenon - digging deeper into its root causes [21].
Attrition and long completion periods are outcomes of multiple and layered factors including student capabilities and limitations, funding problems, quality and relationships with supervisor, institutional support and work environments [22]. While some of the factors may be internal to the student, others are external and beyond student’s control. We briefly discuss these factors below.
203
2.1 Capabilities and Characteristics of a Student
Student’s capabilities and characteristics are critical in determining whether they may or may not complete his/her studies. According to Devos et al. [11], the key ingredients are: (a) working on a project that makes sense to him/her – that is, knowing where one is going, having ownership of the research project, and believing that study will produce useful results; (b) being satisfied with progress in the research project – getting significant results, not going in circles but developing materials that might constitute a thesis, or being stuck/blocked by the supervisor; and (c) experiencing no or limited emotional stress. Although invariably almost all postgraduate research students experience ups and downs, calm and stressful episodes, joy and doubts, these should not be as overwhelming and exhausting as to lead to attrition.
The Task Group report [12] revealed that while some postgraduate students at the University of Botswana pursue graduate studies in order to generate new knowledge or expand their intellectual knowledge and deeper understanding of their profession, some do so in order to raise their competitive edge in the job market or qualify for promotion at the work place or simply to occupy themselves as they look for employment. A later study showed that some enrol for postgraduate studies due to peer pressure as ‘most of my colleagues are seeking’ graduate degrees [23]. Consequently, as noted by Cooper et al. [24] and Ssegawa [25], some candidates may not withstand the emotional stress associated with postgraduate research studies and readily drop out when they get attractive job opportunities or experience difficulties in identifying viable research topics.
Other factors cited in various literature regrading attrition and long completion periods include gender, social and family issues. According van de Schoot et al. [1] changes in marital status, family size and domestic responsibilities affects men and women differently. For example, while female candidates are negatively affected by changes in marital status, men are rarely affected. Men are, however, negatively affected by having children who are less than 18 years old. Some postgraduate students at University of Botswana attributed delays in completing their studies due to family responsibilities including being obliged to work in order to provide financial support their families. The latter observation was in line with the Council of Graduate Schools [26] report which noted that
major factor which is most likely to lead to the inability of a student to earn a master’s degree was interference from employment.
2.2 Availability and Sustainability of Funding
Variations in the financial support availed to research students also play a significant role in promoting or inhibiting attrition and long completion periods. According to some scholars (e.g. [7], [27]), candidates who hold research or teaching assistantships and fellowships, or graduate research grants are more likely to complete their master’s or doctoral degrees than students who rely on other types of funding. Bair and Haworth [7] further note that completion rates are lowest (as low as 14.2% in some institutions) for students relying on their own support or self-sponsored students. Other scholars (e.g. [27], [28], [29], [1]) also report similar findings – that is, candidates with scholarships or stable funding are often successful in completing their studies within the expected or pre-set time periods. According to Bair and Haworth [7], students who continue to work on full- or part-time basis during their research studies cite employment responsibilities as a reason for dropping out or taking too long to complete their studies.
The report of the Task Group [12] revealed that while the majority of foreign students enrolled in postgraduate programs at the University of Botswana had stable scholarships, most citizen students were self-sponsored. To avoid going on half salary, the few citizen postgraduate students sponsored by the government of Botswana, often chose to resume full time employment and part-time studentship at the University during the second and subsequent years. Lack of stable scholarship has persistently adversely affected completion rates and periods at the University.
2.3 Relationship with the Supervisor
Student supervision is mentioned by many scholars ([7], [15], [11], [30]) as one of the major causes of graduate attrition and long completion periods. Bacwayo et al. [13] identify three types of student-supervisor relationships, namely (a) ‘hands on’ where the supervisor interacts with the student all the time; (b) ‘hands off’ whereby the student works independently but meets the supervisor regularly or at scheduled times; and (c) ‘learning alliance’ which is based on responsibility and relationship rather than rights and rules as the
204
student and the supervisor agree on common goals and work towards achieving them. ‘Hands on’ student-supervisor relationship is reportedly common in scientific laboratory work where student’s research is closely linked to supervisor’s research. According to van de Schoot et al. [1] ‘hands on’ and ‘learning alliance’ are the most appropriate since the supervisor is involved as a principal investigators which provides continuous opportunities for advising and supervising student’s work including writing of the thesis.
Like any other human relationship, supervision process requires a cordial partnership between the student and the supervisor. According to University of Otago [30] an effective supervisor should not display a superior and selfish attitude or display a lack of respect for a student; push research topic and direction down a student’s throat; nor treat the student as their intellectual property. In order to avoid attrition and long completion periods, the supervisor must be competent and enthusiastic about student work. He/she must be readily available to guide and support student’s work throughout the entire research process.
It is worth noting that while supportive supervisory styles and relationships often increase students’ chances to stay on track and complete their studies while negative supervision may lead to discouragement and dropping out, this is not always the case because it all depends on how each student deals with the situation [11]. The most critical element, as observed by Devos et al.[11], is how the students react (in relation to other factors) and manage to progress with their research work despite their supervisors’ behaviour.
According to the report by the Task Group [12], most postgraduate students from all faculties had good working relationships with their supervisors. Few attributed their delays in completing their research work on inadequate supervision and supervisors going on leave.
2.4 Academic Integration and Institutional Support
As noted by Bair and Haworth [7], Allan and Dory and Devos et al. [11], students’ social integration and institutional support are critical factors in determining attrition and completion rates. Social integration is defined as a process through which postgraduate research are invited and motivated to adopt values, skills, attitudes, norms and knowledge associated with the academic community. According to Devos et al. [11], the extent to which postgraduate candidates interact
daily with fellow students and faculty staff beyond supervisors plays a plays an important role in degree completion. Student isolation was also noted by a Canadian study on the completion of graduate studies as a strong challenge for Universities for increasing graduation rates [31].
Institutional support relates to resources and facilities made available to students to enable them to carry out their research. These include appropriate reading and writing spaces; up-to-date library facilities (both physical and virtual); availability of research laboratory space, materials and equipment; and access to field and published data. Furthermore, programme design, student enrolment, progress, examination and graduation processes are all carried through a university’s administration. Its inefficiency and ineffectiveness may lead to attrition and long completion periods. Scholars (e.g. [32], [33]) have noted that deficiencies in these areas, for example, constrained access to data may keep the student waiting for a long time or may lead to abandonment of the research.
In 2009, inadequate institutional support was cited as one of the major problems that contributed to long completion periods [12]. Both students and supervisors complained of lack of research inputs, such as, chemicals, equipment and appropriate software; frequent instrument breakdown; and inefficient and uncooperative administrative / support staff. Nothing was reported regarding academic integration.
3. The Case of MPM Programme
Launched in 2005, the Master of Project Management (MPM) is one of the postgraduate programmes offered in the Department of Civil Engineering at the University of Botswana (UB). Given that project management cuts along all sectors of the economy, the MPM programme literally admits applicants with all forms of undergraduate qualifications including STEM related subjects, business, medicine, economics, law, etc. As a result, the MPM programme was launched as a collaborative initiative between various faculties and departments with expectation that all partners would provide academic staff for teaching and research supervision. Similar to most Master’s degree programmes at UB, the MPM programme is divided into two parts. Part I consists of taught courses while Part II is dedicated to writing a supervised thesis. The expected duration for students registered on full-time basis is one year
205
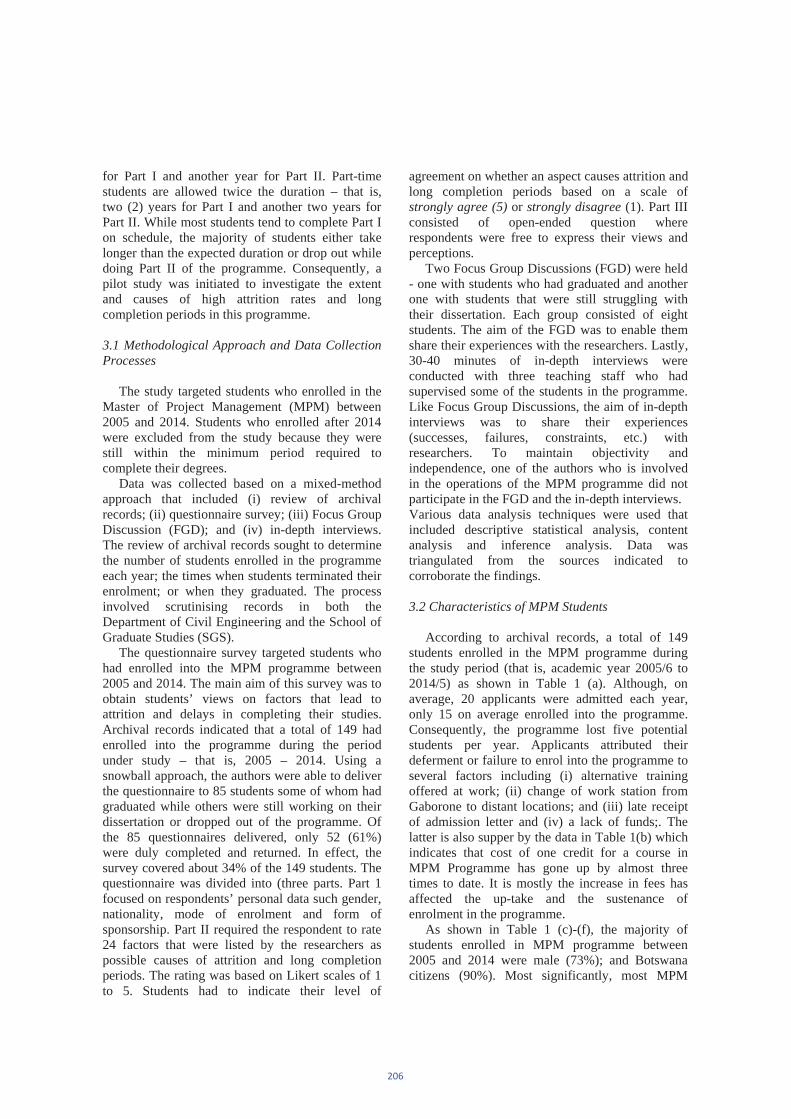
for Part I and another year for Part II. Part-time students are allowed twice the duration – that is, two (2) years for Part I and another two years for Part II. While most students tend to complete Part I on schedule, the majority of students either take longer than the expected duration or drop out while doing Part II of the programme. Consequently, a pilot study was initiated to investigate the extent and causes of high attrition rates and long completion periods in this programme.
3.1 Methodological Approach and Data Collection Processes
The study targeted students who enrolled in the Master of Project Management (MPM) between 2005 and 2014. Students who enrolled after 2014 were excluded from the study because they were still within the minimum period required to complete their degrees.
Data was collected based on a mixed-method approach that included (i) review of archival records; (ii) questionnaire survey; (iii) Focus Group Discussion (FGD); and (iv) in-depth interviews. The review of archival records sought to determine the number of students enrolled in the programme each year; the times when students terminated their enrolment; or when they graduated. The process involved scrutinising records in both the Department of Civil Engineering and the School of Graduate Studies (SGS).
The questionnaire survey targeted students who had enrolled into the MPM programme between 2005 and 2014. The main aim of this survey was to obtain students’ views on factors that lead to attrition and delays in completing their studies. Archival records indicated that a total of 149 had enrolled into the programme during the period under study – that is, 2005 – 2014. Using a snowball approach, the authors were able to deliver the questionnaire to 85 students some of whom had graduated while others were still working on their dissertation or dropped out of the programme. Of the 85 questionnaires delivered, only 52 (61%) were duly completed and returned. In effect, the survey covered about 34% of the 149 students. The questionnaire was divided into (three parts. Part 1 focused on respondents’ personal data such gender, nationality, mode of enrolment and form of sponsorship. Part II required the respondent to rate 24 factors that were listed by the researchers as possible causes of attrition and long completion periods. The rating was based on Likert scales of 1 to 5. Students had to indicate their level of
agreement on whether an aspect causes attrition and long completion periods based on a scale of strongly agree (5) or strongly disagree (1). Part III consisted of open-ended question where respondents were free to express their views and perceptions.
Two Focus Group Discussions (FGD) were held - one with students who had graduated and another one with students that were still struggling with their dissertation. Each group consisted of eight students. The aim of the FGD was to enable them share their experiences with the researchers. Lastly, 30-40 minutes of in-depth interviews were conducted with three teaching staff who had supervised some of the students in the programme. Like Focus Group Discussions, the aim of in-depth interviews was to share their experiences (successes, failures, constraints, etc.) with researchers. To maintain objectivity and independence, one of the authors who is involved in the operations of the MPM programme did not participate in the FGD and the in-depth interviews. Various data analysis techniques were used that included descriptive statistical analysis, content analysis and inference analysis. Data was triangulated from the sources indicated to corroborate the findings.
3.2 Characteristics of MPM Students
According to archival records, a total of 149 students enrolled in the MPM programme during the study period (that is, academic year 2005/6 to 2014/5) as shown in Table 1 (a). Although, on average, 20 applicants were admitted each year, only 15 on average enrolled into the programme. Consequently, the programme lost five potential students per year. Applicants attributed their deferment or failure to enrol into the programme to several factors including (i) alternative training offered at work; (ii) change of work station from Gaborone to distant locations; and (iii) late receipt of admission letter and (iv) a lack of funds;. The latter is also supper by the data in Table 1(b) which indicates that cost of one credit for a course in MPM Programme has gone up by almost three times to date. It is mostly the increase in fees has affected the up-take and the sustenance of enrolment in the programme.
As shown in Table 1 (c)-(f), the majority of students enrolled in MPM programme between 2005 and 2014 were male (73%); and Botswana citizens (90%). Most significantly, most MPM
206
students (96%) were employed, self-sponsored and studying on part-time basis.
3.3 Reasons for Enrolling in the MPM Programme
Respondents were asked to rate nine (9) reasons (on a scale from 1 to 5) for deciding to pursue the project management programme. On average, the ‘Subject is very popular and emphasised in most organisations’ obtained the highest score (3.85) followed by the need ‘To become more competitive in the job market’ (3.75); ‘Most people at work have or are pursuing a graduate degree …’ (3.70) and the desire to ‘Qualify for promotion at the place of employment. Focus Group Discussion confirmed that the desire to do project management (score 3.85) drove the quest to join the programme. Participants emphasised the importance of graduate project management skills in providing a competitive edge for promotion at the place of work and in the job market. Factors such as the desire for ‘Self-development’ or to contribute to knowledge creation were lowly scored at 2.5 and 2.1, respectively. These findings are consistent with earlier studies at the University of Botswana [12] and CGS [26]. The latter noted that Master’s enrolment is driven by students’ desires to support professional aspirations, such as to improve their skills and knowledge and the desire to increase opportunities for promotion, advancement, and/or
pay, and to learn more about something in which they were particularly interested [26].
3.4 Extent of Attrition and Completion Periods in the MPM programme
Despite strong motivational factors for enrolling in MPM programme, Table 2 shows that of the 149 students who enrolled in the Programme between 2005 and 2014, only 39 (26.2%) had graduated by 2017, 15 (10.0%) had not completed their studies and 95 (63.8%) had dropped out of the programme. MPM’s attrition rate is within the same range (65%-55%) as recorded in American Universities, ([16], [26]). The MPM attrition rate is however lower than the 86 - 91% reported for two programmes at the Makerere University Business School [15].
Table 3(a) indicates that the 39 students who have graduated, took an average of 9.5 semesters (which is slightly over 4 years) to complete their studies. Table 3(b) further indicates that of the 39 students who have graduated, 15 (38%) completed their studies within the stipulated duration while 24 (62%) had their study period extended by several semesters. It is worth noting that all the 6 students who were sponsored by either their Governments or some other agencies and enrolled in the programme on a full-time basis [see Table 1(e) and (g)] completed their studies within the maximum permitted period.
Table 3(c) show that of the 24 students who extended their study periods, 8 took 1-2 additional semesters, 10 students took 3-4 extra semesters while 3 needed 5-6 additional semesters. The longest completion duration was by a student who graduated after 20 semesters (or 10 years) since her first enrolment. Her story (plus another two who are still working on their dissertations) has become to be known in the department as the ‘Halley’s Comet’ phenomenon, based on the famed interstellar meteor which disappears and appears once in every 75 years [34].The student would give
207
plausible reasons to defer her studies, disappear and reappear a year or two later.
Table 3(d) indicates that of the 15 MPM students who had not completed their dissertation, 10 (67%) had more than doubled the stipulated duration. Two students had already spent 20 semesters but had not completed due to the Halley’s Comet phenomenon.
3.5 Causes of Attrition and Long Completion Periods in the MPM programme
As noted earlier, 95 or 63.8%) of the 149 students who enrolled in the MPM programme dropped out (see Table 2). Scrutiny of archival records revealed that of the 95 drop outs, 8 (8.5%) students dropped out due to ‘forced’ attrition (situations beyond the student’s control) while 70 students dropped out due to ‘un-forced’ attrition factors as shown in Table 4(a) and 4(b), respectively.
Of all drop outs, 5 (5.3%) were caused by death of students, 3 (3.2%) by work transfer to distant work stations). ‘Failing’ course work led to 4 (4.2%) students to drop out while an additional 13 (13.7%) students also dropped out during Part I of the programme for undisclosed reasons. However, the majority (73.7% of drop outs) abandoned their MPM studies during Part II of the programme. It clear from the results that the dissertation stage contributes the highest proportion of attrition. Therefore, it was worthwhile seeking the students’
and lectures’ perspective as to why a great number of candidates dropped out at this stage or took long to complete.
3.5.1 Students’ perception of the causes of attrition and long completion periods
Students were asked to score (on a scale of 1 to 5) 24 possible reasons for attrition. The results of their scores are summarised in Table 5. With an average score of 4.33, inadequate funding was rated the most common cause of student attrition in the MPM programme. As noted earlier, tuition fee costs have escalated by over 300% in eleven years from P450 in 2006 to P1, 380 in 2017 thereby increasing the financial burden for self-sponsored students. Students, in particular, singled out the fact that the dissertation stage requires a lot of money to be paid up-front. One student noted that ‘for me the research phase, which is about 15 credits, was about as much as P18,750 ... this was hard for me to raise in January when the payment coincided with school fees’. Incidentally the same reason, of luck of funding, was ranked top in a survey conducted among both Canadian and American Universities ([31], [26]). Inadequate funding was closely followed by job related constraints (such as being transferred or assigned additional responsibilities), and supervisor’s lack of interest in the student’s topic. Besides funding, other factors which students viewed as major causes of attrition and delays in their completion of the dissertation include ‘student capability’ related factors (notably difficulty in identifying a viable research topic); ‘supervisor related’ matters (e.g. lack of interest, dedication or adequate knowledge in the student’s research topic); and, lastly, ‘institutional support factors (e.g. delays in obtaining research permits and examination processes).
These factors are similar to findings from previous studies except that, in the context of the
208
MPM programme, lack of adequate and guaranteed funding is the most outstanding cause of attrition and delays among self-sponsored students.
3.5.2 Academic staff’s perceptions regarding the causes of attrition and long completion periods
Academic staff who teach and supervise the research work of some of the students provided their view about the topic of study during the interviews held. First, all the staff interviewed noted that for students to have an initial leap in their research, they need to have a viable research topic. This means they must have a topic for which they are able to define the research problem; for which the scope is commensurate with a Master’s degree, and which they are able to access and collect data. One staff member noted ‘...one of my students kept changing the topic every time we met while another was clueless for some time as to what he was supposed to investigate... this is despite the fact that students are encouraged to have working topic as they undertake the research methodology course...’ Second, just as students had indicated, staff noted that the issue of the increased cost of tuition fees is becoming a real issue. As a result, students are increasingly requesting for deferments
of their studies for a semester or entire academic year due to financial reasons. Some do not even resume their studies after the stated period. Third, all staff interviewed agreed that most students experience bouts of procrastination. One staff noted ‘...perhaps because students are not required to attend classes as during dissertation stage, they tend to lose focus, commitment and momentum in conducting their research tasks... and with a slight distraction from work or personal
issues, students find it gratifying to give all sorts excuses for spending the whole semester postponing their research work'. This scenario has led students to make unjustified requests for extensions at both proposal and research stages’.The observation is in line with what Hussain and Sultan [35] noted that academic procrastination occurs when students postpone and delay their research work becoming self-excusive and thus negating their commitment and responsibilities. Fourth, staff noted that as a result of students’ extension and hence taking long to complete their degrees, there are more students to supervise, than it would have been if the throughput was at an appreciable level. One staff put it in a more succinct manner ‘...because the number which comes in [enrolment] is not existing [graduating] at the same rate, the programme pipeline seems to be clogged’.
On another but related issue staff also noted 'that it also seems that the system does not fully recognise supervision load and the task of dissertation examination because though the supervision load is increasing our teaching load has remained the same... the points given in the PMS are not commensurate with the supervision load and yet if a student drops from the
209
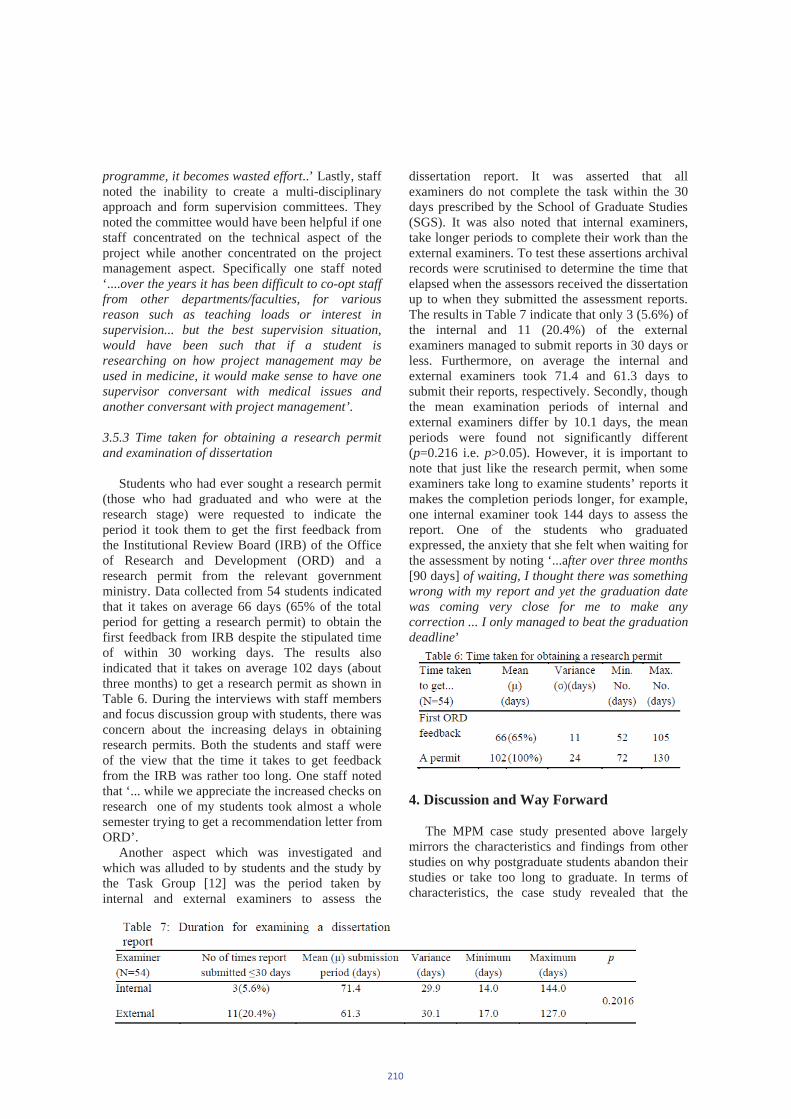
programme, it becomes wasted effort..’ Lastly, staff noted the inability to create a multi-disciplinary approach and form supervision committees. They noted the committee would have been helpful if one staff concentrated on the technical aspect of the project while another concentrated on the project management aspect. Specifically one staff noted ‘....over the years it has been difficult to co-opt staff from other departments/faculties, for various reason such as teaching loads or interest in supervision... but the best supervision situation, would have been such that if a student is researching on how project management may be used in medicine, it would make sense to have one supervisor conversant with medical issues and another conversant with project management’.
3.5.3 Time taken for obtaining a research permit and examination of dissertation
Students who had ever sought a research permit (those who had graduated and who were at the research stage) were requested to indicate the period it took them to get the first feedback from the Institutional Review Board (IRB) of the Office of Research and Development (ORD) and a research permit from the relevant government ministry. Data collected from 54 students indicated that it takes on average 66 days (65% of the total period for getting a research permit) to obtain the first feedback from IRB despite the stipulated time of within 30 working days. The results also indicated that it takes on average 102 days (about three months) to get a research permit as shown in Table 6. During the interviews with staff members and focus discussion group with students, there was concern about the increasing delays in obtaining research permits. Both the students and staff were of the view that the time it takes to get feedback from the IRB was rather too long. One staff noted that ‘... while we appreciate the increased checks on research one of my students took almost a whole semester trying to get a recommendation letter from ORD’.
Another aspect which was investigated and which was alluded to by students and the study by the Task Group [12] was the period taken by internal and external examiners to assess the
dissertation report. It was asserted that all examiners do not complete the task within the 30 days prescribed by the School of Graduate Studies (SGS). It was also noted that internal examiners, take longer periods to complete their work than the external examiners. To test these assertions archival records were scrutinised to determine the time that elapsed when the assessors received the dissertation up to when they submitted the assessment reports. The results in Table 7 indicate that only 3 (5.6%) of the internal and 11 (20.4%) of the external examiners managed to submit reports in 30 days or less. Furthermore, on average the internal and external examiners took 71.4 and 61.3 days to submit their reports, respectively. Secondly, though the mean examination periods of internal and external examiners differ by 10.1 days, the mean periods were found not significantly different (p=0.216 i.e. p>0.05). However, it is important to note that just like the research permit, when some examiners take long to examine students’ reports it makes the completion periods longer, for example, one internal examiner took 144 days to assess the report. One of the students who graduated expressed, the anxiety that she felt when waiting for the assessment by noting ‘...after over three months [90 days] of waiting, I thought there was something wrong with my report and yet the graduation date was coming very close for me to make any correction ... I only managed to beat the graduation deadline’
4. Discussion and Way Forward
The MPM case study presented above largely mirrors the characteristics and findings from other studies on why postgraduate students abandon their studies or take too long to graduate. In terms of characteristics, the case study revealed that the
210

MPM programme is dominated by male and local students. The gender bias in favour of male students enrolment does not reflect the university’s desire to be an equal opportunity centre of academic development neither does the ratio of non-citizen enrolment (10%) reflect UB’s Policy on Internationalisation [36]. In UK, for example, international students accounted for 19% of all students registered at UK universities and spent an estimated £6.1 (P82) billion in the economy in 2014/5 [37]. Apart from complimenting the university’s revenues and the national economy at large, attracting international students or facilitating exchanges, has been associated with cross fertilisation of ideas and increasing diplomatic and cultural understanding of the nations involved. The MPM needs to internationalise by increasing enrolment of non-citizen students. The Univeristy of Botswana could do by increasing the solicitation of scholarships which are tenable at its campus and this would also foster increased income to the University.
Similar to the Task Group [12] findings, the case study has revealed that MPM students leave or abandon their studies during the second or dissertation part of the program – when students are left to work alone literally on their own with no obligation to visit the university, attend classes or meet other students. Currently, the programme’s division of two parts i.e. course work and dissertation separates, isolates and polarises students’ academic spirit and feelings while allowing them to concentrate and spend more time and energy on work related assignments. There could be justification to review the programme structure to enable writing of the dissertation to run concurrently with attendance of course work.
Given that the MPM programme admits applicants from literally any field (e.g. STEM disciplines, law, medicine, business, community and social development), it is imperative that it draws teaching and research supervision staff from other faculties as envisaged at the inception stage. Consequently, the dissertation stage requires a multi-disciplinary approach where requisite staff from other departments/faculties are co-opted to form multidisciplinary supervisory committee.
Since a considerable number of studies have shown that high and timely completion rates in STEM are attributed to the manner in which students interact and bond as a research community, it is prudent to develop a similar culture in social sciences and the MPM programme in particular whereby students undertake research
on a thematic area under one or two supervisors. Besides enabling sustained student interaction and cooperation, thematic research has potential to attract funding from industry, stakeholders, local and international organisations. Availability of funds through research grants will enable self-sponsored to refrain from returning or taking up full-time employment.
To complement the MPM case study findings presented in this paper, we recommend a comprehensive university-wide study that will provide data on attrition and completion periods for all postgraduate programmes. The study should explore inter-discipline similarities and differences, gender related factors, drop-out periods and supervisory experiences. In addition, the study should analyse experiences of past and current students to establish longitudinal trends.
5. Conclusion
This paper has reaffirmed earlier findings on the nature, extent and causes of attrition and long completion periods among postgraduate students in various universities. It has, however, noted that within the context of University of Botswana, attrition and long completion periods recorded in the Master of Project Management programme are caused by inadequate funding, solo scholarship during research and dissertation writing and to lesser extent inadequate academic integration and lack of supervisory capacity for the large alley of students admitted to the programme. The paper recommends the formation of multi-disciplinary supervision teams during the research phase of the respective students. Finally, it recommends supporting self-sponsored students with research grants and awards obtained through thematic research initiatives.
References
[1] R.Van de Schoot, M.A. Yerkes, J.M. Mouw, and H. Sonneveld, “What Took Them So Long? Explaining PhD Delays among Doctoral Candidates”, PLOS ONE, Vol. 8, No. 7, pp. 1-11, 2003.
[2] D. Litalien and F. Guay, “Dropout Intentions in PhD Studies”, Contemporary Educational Psychology”, Vol. 4, 1 pp. 218-231, 2013.
[3] Crest, Centre for Research on Science and Technology, Postgraduate Studies in South Africa: A Statistical Profile. Council on Higher Education (CHE), Pretoria, 2009
211
[4] W. L. Filho, “About the role of universities and their contribution to sustainable development”, Higher Education Policy, Vol. 24, No. 4, pp. 427 – 438, 2011.
[5] World-Bank, “The Africa competitiveness report”, World-Bank, Geneva, 2013.
[6] M. J. R. Romero, “The role of the university in sustainable development: challenge and opportunities” , Higher Education Policy, Vol.8, No. 4, 26–29, 1995
[7] C. R. Bair and J. G. Haworth, “Doctoral Student Attrition and Persistence: A Meta-Synthesis of Research”, Paper presented at the Annual Meeting of the Association for the Study of Higher Education (ASHE), San Antonio, Texas, 2013.
[8] P. Allan and J. Dory, “Understanding Doctoral Program Attrition: An Empirical Study”, Working Paper No. 195, Lubin School of Business, Pace University, 2001.
[9] S. Bourke, A. Holbrook, T. Lovat and P. Farley, “Attrition, Completion and Completion Times of PhD Candidates”. Paper presented at the AARE Annual Conference, Melbourne, Australia, 2004.
[10] O. Klein, “Doctoral students’ experiences leading to completion or attrition: a matter of sense, progress and distress”, European Journal of Psychology and Education, Vol. 32, No. 1, pp. 61-77, 2016
[11] Task Group, “The future of graduate research supervision at the Univeristy of Botswana”, School of Graduate Studies, University of Botswana, Gaborone, 2009.
[12] K. E. Bacwayo, P. Nampala, and I. N. Oteyo, “Challenges and Opportunities Associated with Supervising Graduate Students Enrolled in African Universities, International Journal of Education and Practice, Vol .5, No. 3, 29-39, 2007
[13] Crest, Centre for Research on Science and Technology, Postgraduate Studies in South Africa: A Statistical Profile. Council on Higher Education (CHE), Pretoria, 2009.
[14] S. Eyangu, V. Bagire and M. Kibrai, “An Examination of the Completion Rate of Masters Pro-grams at Makerere University Business School”, Creative Education, Vol 5, 1913-1920, 2014.
[15] W. G. Bowen and N. L. Rudenstine, Inpursuit of the Ph. D., Princeton University Press, Princeton, 1992.
[16] P. J. Buckley and G. J. Hooley G J, The non-completion of doctoral research in
management: symptoms, causes and cures, Educational Research, Vol. 30, No. 2, 110-119, 1988.
[17] D. D. Denecke, “Ph. D Completion Project: Preliminary Results from baseline data”, Communicator, Council Graduate School (CGS), Vol. 38, No. 9, Nov., 2005.
[18] UD (2001, July 23), “What is to know about student retention, University of Dalhousie (UD)”,http://institutionalanalysis.dal.ca/Docs/StudentRetention.pdf#search=%22Phd%20attrition%20rate %22.
[19] S. Smallwood, “High attrition from Ph.D. programs is sucking away time, talent, and money and breaking some hearts, too”, TheFaculty, Vol. 50, No. 19, pp. A10, 2004
[20] B. E. Lovitts and M. Nelson (2006, August 5) “The Hidden Crisis in Graduate Education: Attrition from Ph.D. Programs”, Academe Online [Online] Vol. 92, No. 4, July-August, 2006. Available: http://www.aaup.org/publications/Academe/2000/ 00nd/ND00LOVI.HTM) (5-08-2006).
[21] J. K. Ssegawa and P. D. Rwelamila, The research skill factor as a cause for high postgraduate attrition rate, Journal of Engineering, Design and Technology, Vol. 7, No. 3, 293-322, 2009.
[22] J. K. Ssegawa and D. Kasule, A self-assessment of the propensity to obtain future employment: a case of final-year engineering students at the University of Botswana, European Journal of Engineering Education, Vol. 42, No. 5, 513-532. 2017.
[23] J. Cooper, D. Jr. Mitchell, K. Eckerle and K. Martin, Addressing Perceived Skill Deficiencies in Student Affairs Graduate Preparation Programs, Journal of Student Affairs Research and Practice, Vol. 53, No. 2, 107-117, 2016.
[24] J. K. Ssegawa, Challenges Associated with Research Based Postgraduate Degrees,Seminal Paper, Department of Civil Engineering, Univeristy of Botswana, Gaborone, 2013.
[25] CGS, “Completion and Attrition in STEM Master’s Programs”, Council of Graduate Schools (CGS), Washing DC, USA, 2014.
[26] R. Spronken-Smith, R. Cameron, and R. Quigg, “Factors Contributing to High PhD Completion Rates: a case study in a research-intensive University in New Zealand”,
212
Assessment & Evaluation in Higher Education,Vol. 43 No. 1 pp. 94-109, 2018.
[27] S. Kyvik and T. B. Olsen, “Increasing Completion Rates in Norwegian Doctoral Training: Multiple Causes for Efficiency Improvements.” Studies in Higher Education, Vol. 39, No. 9, pp: 1668–1682, 2014
[28] R. G. Ehrenberg and P. Mavros, “Do Doctoral Students’ Financial Support Patterns Affect Their times-to-Degree and Completion Probabilities?”, The Journal of Human Resources, Vol. 30, pp 581–609, 1995.
[29] UO (2017, August 31) Postgraduate Research supervision, University of Otago (UO),[Online]available: https://www.otago.ac.nz/graduate-research/otago612829.pdf.
[30] CAGS (2107, May 20), “The Completion of Graduate Studies in Canadian Universities: Report & Recommendations”, Canadian Association for Graduate Studies (CAGS), available at: https://cags.ca/documents/publications/working/completion_grad_studies_2004.pdf
[31] B.A. Anderson, “The Role of Data in Research and Policy: Report 14-818”, Population Studies Centre, University of Michigan, [Online] available at: https://www.psc.isr.umich.edu/pubs/pdf/rr14-818.pdf.
[32] N. H. Steneck, “Introduction to the responsible conduct of research” , Office of Research Integrity, Government Printing Office, Washington, D.C., 2004 [Online] Available at: http://ori.dhhs.gov/documents/rcrintro.pdf.
[33] Wikipedia (2006), Halley’s Comet, Wikipedia, [Online], available at https://en.wikipedia.org/wiki/Halley%27s_Comet
[34] I. Hussain and S. Sultan, “Analysis of procrastination among university students”, Procedia Social and Behavioural Sciences,Vol. 5, pp. 1897–1904 [Online], Available: doi:10.1016/j.sbspro.2010.07.385
[35] UB, “Policy on internationalisation”, Office of the Director for International Education and Partnerships, Univeristy of Botswana (UB), Gaborone, 2007
[36] UK Universities, “The Economic Impact of International Students”, available: https://www.universitiesuk.ac.uk/policy-and-analysis/reports/Documents/2017/briefing-economic-impact-international-students.pdf
213

Model for University-Industry Partnership based on System Dynamics of UniversityPerformance and Industry Needs: A Case Study at the University of Botswana.
Anderson G. O1., Obok Opok, A2
1Dean School of Graduate Studies 2Department of Electrical Engineering, University of Botswana
Email: [email protected]
Abstract The need for Universities and industries, which for long have been operating in separate domains, are rapidly inching closer to each other to create synergies. University funding and support by governments to universities is constantly being reduced while the costs of university education and research are systematically rising. A productive University-Industry collaboration is neededin response to such challenges and to the growing complexity of the industry environment which necessitates such partnership.Higher education institutions not only contribute skilled human resources to industry, but also research outputs. The intersecting needs and mutually interdependent relationship requires identifying means of further strengthening University-industry partnerships.
This paper explores how the University of Botswana can work closely with industry, study the dimensions of university-industry partnership, and develops a model for University-Industry partnership from which a model for implementing UB-Industry has been proposed. The study approach draws from the results of staff productivity study, information from staff and stakeholders. The model for implementing University-Industry partnership identifies areas where industry’s contribution to the University would be most effective and vice versa.
Keywords University–industry partnership, university performance, industry needs.
1. Introduction
Partnerships between universities and industry areincreasingly a critical component in fostering socioeconomic development of countries [1]. Ankrah and Al-Tabbaa [2] examined three main phases in University-Industry collaboration: formation (identifying partners, making contact, assessing partners, negotiation, agreement signing),organizational forms (informal and formal personal relationships, third party, targeted and untargeted formal agreements, focused structures), andoperational phase activities (meetings, communication, trainings, personal mobility, employment, otheractivities). Partnership can also provide newopportunities for universities to reconfigure the way instruction gets funded, developed, marketed, delivered, and supported” [3]. Both universities and industry can derive benefits from partnerships. For universities, these partnerships provide financialsupport for the educational, research, and servicemissions; broaden the experience of students and faculty; identify significant, interesting, and relevant problems; enhance regional economic development; and increase employment opportunities for students. For industry, such partnerships provide access toexpertise they did not have; aid in the renewal and
expansion of technology; improve access to studentsas potential employees; expand precompetitive research; and leverage internal research capabilities [1]. These partnerships, however, are not without risks. Conflicts of interest between university and industry researchers,suppression of information from fellow researchers,and “undermining of academic standards” are realpossibilities and must be managed appropriately in such partnerships [4]. A key requirement is for universities to proactively manage university- industrypartnerships and to put processes in place to minimizethe risks to the greatest extent possible whilemaximizing the benefits.
This paper presents models on options for UB-Industry partnerships and collaboration, and a model forimplementation, both motivated by the need toenhance academic, research, and financialsustainability against the backdrop of decreasing government funding and increasing costs of university education.
2. Motivation and Barriers for University- Industry Partnership
The University of Botswana has laid a foundation forintensification of University-Industry partnership
214
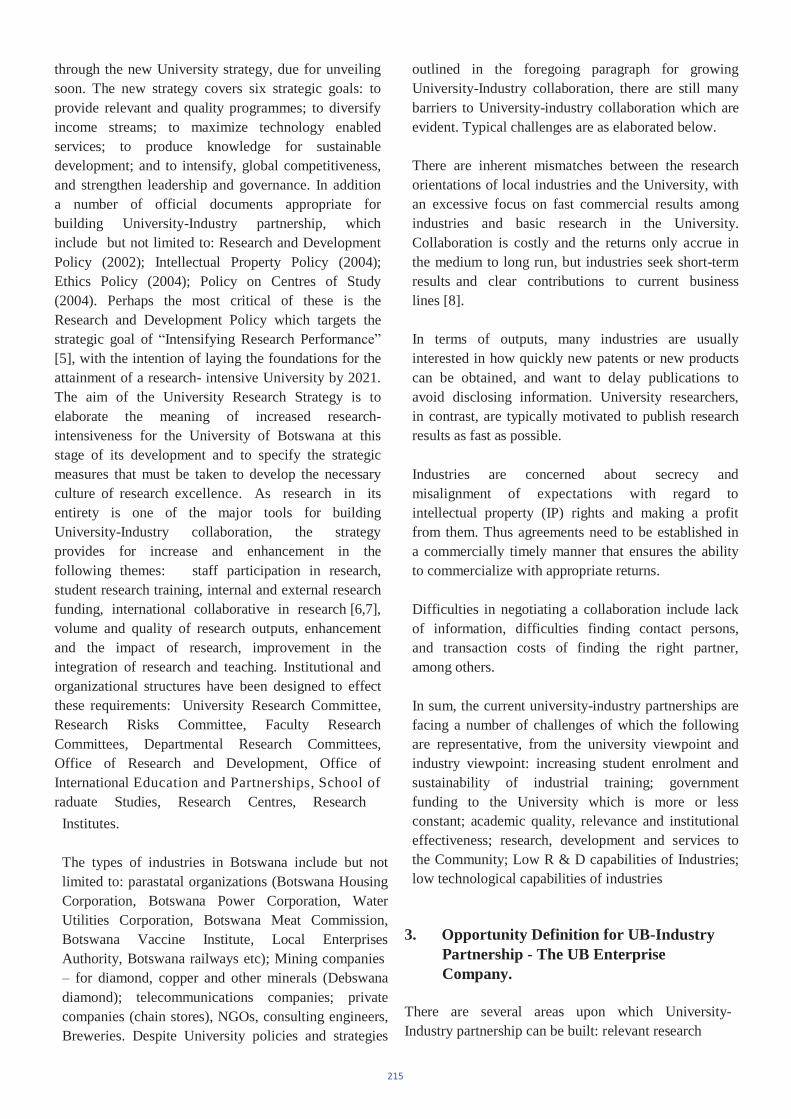
through the new University strategy, due for unveiling soon. The new strategy covers six strategic goals: to provide relevant and quality programmes; to diversifyincome streams; to maximize technology enabledservices; to produce knowledge for sustainabledevelopment; and to intensify, global competitiveness, and strengthen leadership and governance. In addition a number of official documents appropriate forbuilding University-Industry partnership, whichinclude but not limited to: Research and Development Policy (2002); Intellectual Property Policy (2004);Ethics Policy (2004); Policy on Centres of Study(2004). Perhaps the most critical of these is theResearch and Development Policy which targets thestrategic goal of “Intensifying Research Performance”[5], with the intention of laying the foundations for theattainment of a research- intensive University by 2021. The aim of the University Research Strategy is toelaborate the meaning of increased research- intensiveness for the University of Botswana at thisstage of its development and to specify the strategicmeasures that must be taken to develop the necessaryculture of research excellence. As research in itsentirety is one of the major tools for building University-Industry collaboration, the strategy provides for increase and enhancement in thefollowing themes: staff participation in research,student research training, internal and external research funding, international collaborative in research [6,7], volume and quality of research outputs, enhancementand the impact of research, improvement in theintegration of research and teaching. Institutional and organizational structures have been designed to effectthese requirements: University Research Committee,Research Risks Committee, Faculty ResearchCommittees, Departmental Research Committees,Office of Research and Development, Office ofInternational Education and Partnerships, School ofraduate Studies, Research Centres, Research
Institutes.
The types of industries in Botswana include but notlimited to: parastatal organizations (Botswana Housing Corporation, Botswana Power Corporation, WaterUtilities Corporation, Botswana Meat Commission,Botswana Vaccine Institute, Local Enterprises Authority, Botswana railways etc); Mining companies – for diamond, copper and other minerals (Debswanadiamond); telecommunications companies; privatecompanies (chain stores), NGOs, consulting engineers, Breweries. Despite University policies and strategies
outlined in the foregoing paragraph for growing University-Industry collaboration, there are still many barriers to University-industry collaboration which areevident. Typical challenges are as elaborated below.
There are inherent mismatches between the research orientations of local industries and the University, withan excessive focus on fast commercial results among industries and basic research in the University.Collaboration is costly and the returns only accrue inthe medium to long run, but industries seek short-termresults and clear contributions to current businesslines [8].
In terms of outputs, many industries are usuallyinterested in how quickly new patents or new productscan be obtained, and want to delay publications toavoid disclosing information. University researchers,in contrast, are typically motivated to publish research results as fast as possible.
Industries are concerned about secrecy and misalignment of expectations with regard to intellectual property (IP) rights and making a profitfrom them. Thus agreements need to be established in a commercially timely manner that ensures the abilityto commercialize with appropriate returns.
Difficulties in negotiating a collaboration include lackof information, difficulties finding contact persons,and transaction costs of finding the right partner, among others.
In sum, the current university-industry partnerships are facing a number of challenges of which the following are representative, from the university viewpoint and industry viewpoint: increasing student enrolment and sustainability of industrial training; government funding to the University which is more or lessconstant; academic quality, relevance and institutionaleffectiveness; research, development and services to the Community; Low R & D capabilities of Industries;low technological capabilities of industries
3. Opportunity Definition for UB-Industry Partnership - The UB Enterprise Company.
There are several areas upon which University- Industry partnership can be built: relevant research
215
directed at key industries; consultancy services tovarious industries; specialized services requiringadvances techniques and skills, particularly related to science, health sciences; engineering and technology; built environment; climate and environmental change;technology services; agricultural services and animal production; renewable energy research and services.To capture the array of available opportunities whichcan enhance University-Industry partnership, theUniversity has recently formed the UB EnterpriseCompany. The company represents the apex of building University-Industry partnership. The UBEnterprise Company which is due for officiallaunching is autonomous and comprises of four (4)subsidiaries: (i) Business Services: including security, cleaning, landscaping, health, day-care, career &counselling, psychology, legal, catering, insurance, printing & publication, procurement & logistics, insurance brokerage and all other related services; (ii)Consultancy and Entrepreneurship: ExecutiveDevelopment Programmes, short courses, workshops, staff & student enterprises, spinoff companies and allother related activities; (iii) Enterprises:commercialization of research, knowledge transfer,intellectual property, patents, licenses; (iv) Properties:property development, management, maintenance, andother related ventures. The key features of thecompany are: it is 100% UB owned; has a comprehensive business plan; it is capitalized by UB;plans to commercialize the none-core activities of theUB; it will adopt a governance structure with autonomous management; it will develop andimplement an on-line Monitoring & Evaluation Plan(M&E), and structures and procedures for facilitationand mobilization of resources company shall be undertaken in due course. 4. Approach & Methodology
The scope of the study was both external and internalto the University. The methodology adopted was mainly qualitative. Both primary and secondary sources of data were collected and used. Inductive and deductive methodological processes were used.Qualitative system dynamics approach was used forsynthesis of results obtained. Data from the Key stakeholders identified for the study as follows. Thekey methods of the study were based on: interviewapproach with University staff; use of questionnairesin the university and with appropriate samplingframes; workshop of 15 people selected from variousfaculties of the university; secondary data–typically
reports, policy documents, strategic plans for universityand industries; interviews with industry stakeholders- numbering 10 restricted to individuals in executivemanagement.
5. Results and Analysis
5.1 Key Results From Industry Stakeholders
The analysis of results of the interviews from industry stakeholders revealed a number of very insightfulissues upon which a sustainable university-industry partnership can be constructed. The main results and analysis from the survey of industry stakeholder may be summarized as follows.(a) Rationale for Partnership between the
University and Stakeholder Industries remainweak and varies with industries. The partnershipis limited to industries providing industrialtraining places for students, uncoordinatedservices such as training and short-termconsultancy work. Partnerships due to researchcollaboration are not significant;
(b) Organizational capacity of stakeholderindustries for University-industry partnership tocollaborate with the university is thin asreflected in skilled manpower resources andresources;
(c) Organizational structures and form for stakeholder Industry are not well designed foreffective and sustainable university-industrypartnership;
(d) Failure of industries to take opportunities and advantages of national developmental and socio- economic activities and policies such as Public
Private Partnership (PPP) framework; (e) Failure of industries to use opportunities created
by the Government Department of Science and Technology through the Research and Development Plan and the National InnovationSystem Database.
5.2 Key Results from the University
Data and information collected through interviews,questionnaire survey, indicate a variety of perceptionsof staff on productivity and quality. The variations inperceptions are not entirely surprising since theuniversity employs a broad range of staff: Executivemanagement (VC, DVCs, Directors, Deputy.
216
Directors); Senior management and senioracademic staff (Deans, Heads of Department, P/AP, SL, Senior Research Fellows); junior academic staff (Lecturers, Research Fellows, Tutors, Instructors); junior management (Managers, Chief technicians). The broadspectrum of perceptions identified from the study is mixed and relate to organizational procedures, processes and operations [9]. From the study there are varying degrees of concern with following issues:(a) Governance & planning within the
university: the issues raised in the interviews related to institutional planning were: (i) shortage of suitably qualifiedmanpower- a situation that has led neglectof major planning issues; (ii) representatives of the department do not maintain regular and sustained presence at departmental and faculty levels for planning purposes; and (iii) lack of universal framework for university wide planning.
(b) Middle management and the universityenvironment: the key issues around leadership were connected with weaknessesin providing strategic direction and motivation. At the middle management, the problems faced by Heads of Departments (HoDs) and Deans of faculties were viewed as complex, making it difficult forthem to be effective.
(c) Structure, functions and finance efficiency:the organizational form of the University was viewed as a hindrance to research and development functions of the university, particularly at the departmental level.
(d) Institutional capability (research, teaching and services), mission and incentives: because of the
e) ratio (11%) of academic staff atprofessorial level in comparison to overall staff number is low- suggest that outputfrom the university is likely to suffer in the areas of research and development; servicesto the community, and quality of teaching.
(f) Information systems, communication andmanagement: the information system though available, is far from perfect –regarding regularly interruption, capacity for handling large Internet files, and for
effective communication services. (g) Teaching and learning environment: there
is a perception that the teaching and learning environment requires seriousattention regarding teaching facilities andlearning strategies.
(h) Quality of staff and performance: staff training and professional development continue to be centerpiece of the University policy. However inadequate motivation and incentives as well asinappropriate culture have hindered progress for staff performance.
(i) Community service and stakeholder satisfaction: the perception prevailing within the university is that inadequate services to the community- either inconsultancy form of R&D form are being offered. The nature, scope and extent of these issues are available from the "Study of Productivity and Quality in the University of Botswana".
217
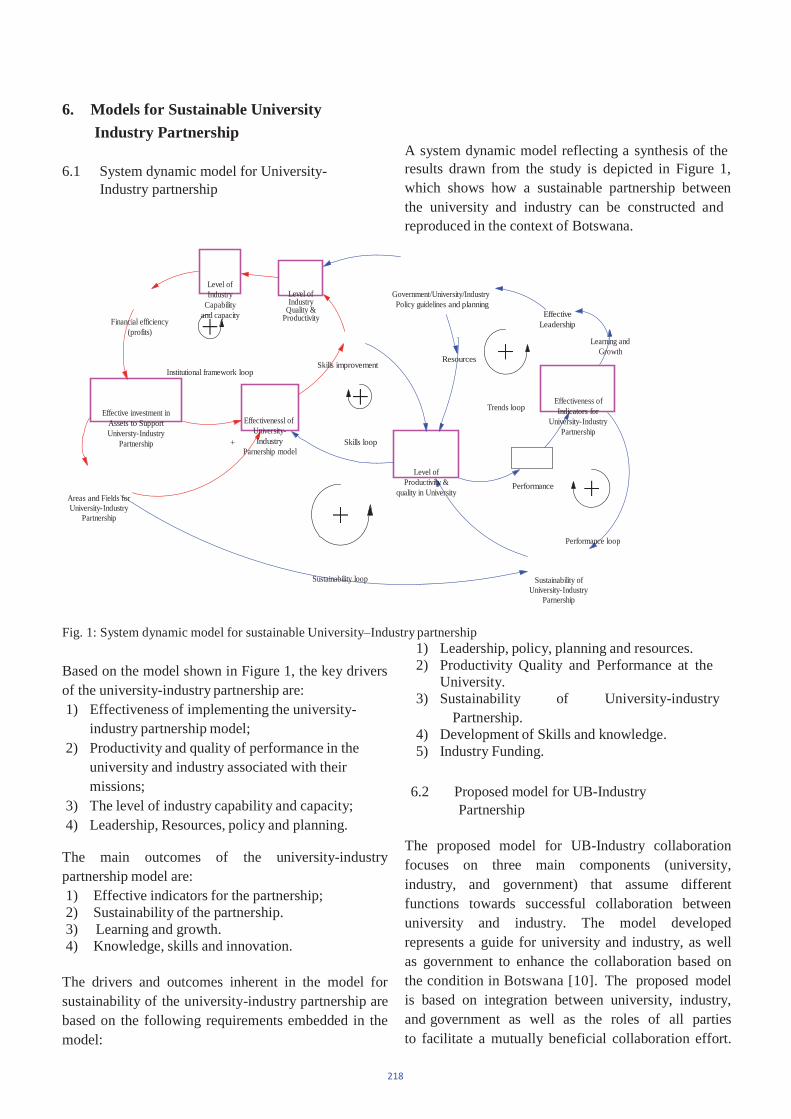
6. Models for Sustainable University Industry Partnership
A system dynamic model reflecting a synthesis of the6.1 System dynamic model for University-
Industry partnership results drawn from the study is depicted in Figure 1, which shows how a sustainable partnership between the university and industry can be constructed andreproduced in the context of Botswana.
Financial efficiency(profits)
Level of Industry
Capabilityand capacity
Level of Industry
Quality &Productivity
Skills improvement
Government/University/IndustryPolicy guidelines and planning
Resources
Effective Leadership
Learning andGrowth
Institutional framework loop
Effective investment inAssets to SupportUniversty-Industry
Partnership
Effectivenessl ofUniversity-
+ Industry Parnership model
Skills loop
Trends loop Effectiveness of Indicators for
University-IndustryPartnership
Areas and Fields for University-Industry
Partnership
Level of Productivity &
quality in UniversityPerformance
Performance loop
Sustainability loop Sustainability of University-Industry
Parnership
Fig. 1: System dynamic model for sustainable University–Industry partnership
Based on the model shown in Figure 1, the key drivers of the university-industry partnership are: 1) Effectiveness of implementing the university-
industry partnership model; 2) Productivity and quality of performance in the
university and industry associated with theirmissions;
3) The level of industry capability and capacity; 4) Leadership, Resources, policy and planning.
The main outcomes of the university-industrypartnership model are: 1) Effective indicators for the partnership; 2) Sustainability of the partnership. 3) Learning and growth. 4) Knowledge, skills and innovation.
The drivers and outcomes inherent in the model for sustainability of the university-industry partnership are based on the following requirements embedded in themodel:
1) Leadership, policy, planning and resources. 2) Productivity Quality and Performance at the
University. 3) Sustainability of University-industry
Partnership. 4) Development of Skills and knowledge. 5) Industry Funding.
6.2 Proposed model for UB-Industry Partnership
The proposed model for UB-Industry collaboration focuses on three main components (university, industry, and government) that assume different functions towards successful collaboration between university and industry. The model developed represents a guide for university and industry, as wellas government to enhance the collaboration based onthe condition in Botswana [10]. The proposed model is based on integration between university, industry, and government as well as the roles of all parties to facilitate a mutually beneficial collaboration effort.
218

It is interesting to note that Botswana QualificationsAuthority, and HRDC can be incorporated in this model can probably improve the communication between university, industry and government. Theinteraction between these three parties would have thesignificant effect to achieve the goals for UB-Industry collaboration.
219
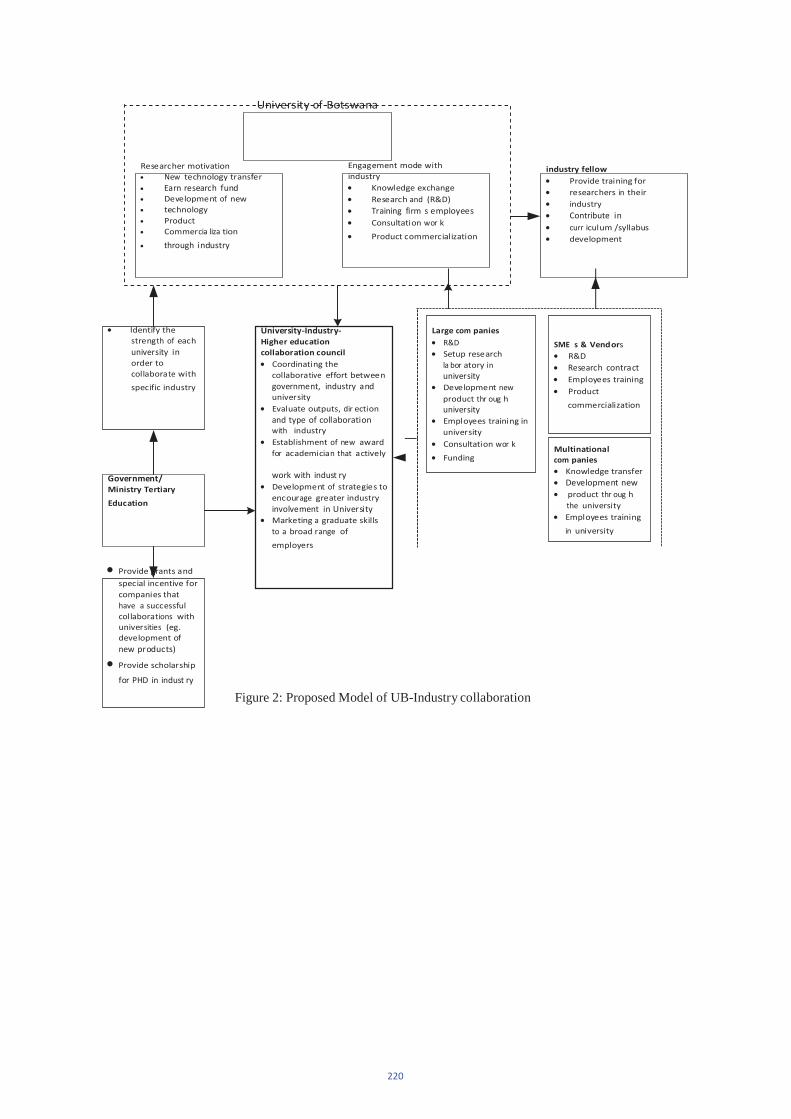
Large com panies R&D SME s & Vend ors Setup research R&D la bor atory in Research contract university Employees training Development new Product product thr oug h university commercialization Employees training in univer sity Consultation wor k
Multinational Funding com panies
Knowledge transfer Development new product thr oug h the university Employees training
in university
University of Botswana
Researcher motivation New technology transfer Earn research fund Development of new technology Product Commer cia liza tion
through industry
Engag ement mode with industry Knowledge exchange Research and (R&D) Training firm s employees Consultation wor k
Product commercialization
industry fellow Provide training for researchers in their industry Contribute in curr iculum /syllabus development
Identify the streng th of each university in order to collabora te with specific industry
Government/ Ministry Tertiary
Education
Provide grants a nd special incentive for companies that have a successful collabora tions with univer sities (eg. development of new products)
Provide scholar ship
for PHD in indust ry
University-Industry- Higher education collaboration council
Coordinating the collabora tive effort between government, industry and univer sity Evaluate outputs, dir ection and type of collaboration with industry Establishment of new award for academicia n that a ctively
work with indust ry Development of strategies to encour age greater industry involvement in University Marketing a graduate skills to a broad r ange of
employers
Figure 2: Proposed Model of UB-Industry collaboration
220
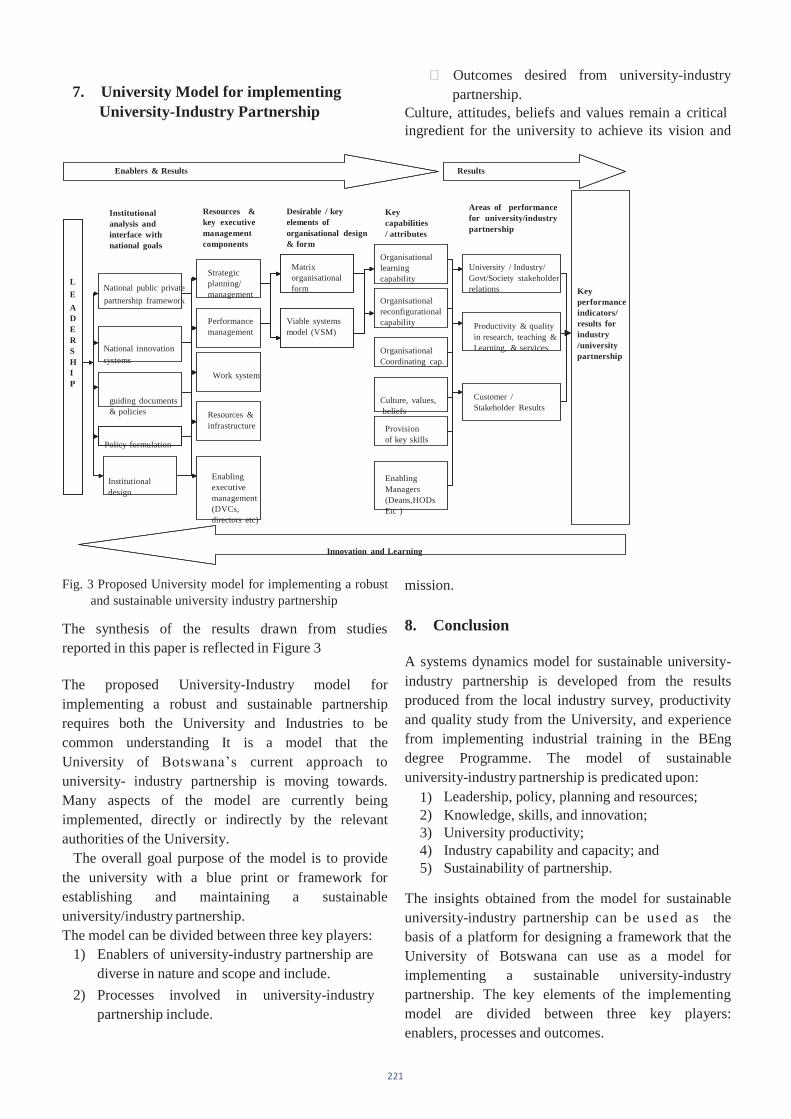
7. University Model for implementingUniversity-Industry Partnership
Outcomes desired from university-industrypartnership.
Culture, attitudes, beliefs and values remain a criticalingredient for the university to achieve its vision and
Enablers & Results Results
Institutionalanalysis and interface withnational goals
L National public private
E partnership framework
ADERS National innovationH systemsIP
guiding documents& policies
Policy formulation
Resources &key executivemanagement components
Strategicplanning/ management
Performancemanagement
Work system
Resources & infrastructure
Desirable / key elements of organisational design& form
Matrixorganisationalform
Viable systemsmodel (VSM)
Keycapabilities/ attributes
Organisationallearning capability
Organisationalreconfigurationalcapability
OrganisationalCoordinating cap.
Culture, values,beliefs
Provisionof key skills
Areas of performance for university/industry partnership
University / Industry/Govt/Society stakeholder relations
Productivity & qualityin research, teaching &Learning, & services
Customer /Stakeholder Results
Keyperformance indicators/results for industry/university partnership
Institutionaldesign
Enabling executivemanagement (DVCs,directors etc)
Enabling Managers(Deans,HODsEtc )
Innovation and Learning
Fig. 3 Proposed University model for implementing a robustand sustainable university industry partnership
The synthesis of the results drawn from studiesreported in this paper is reflected in Figure 3
The proposed University-Industry model for implementing a robust and sustainable partnershiprequires both the University and Industries to becommon understanding It is a model that theUniversity of Botswana’s current approach touniversity- industry partnership is moving towards. Many aspects of the model are currently beingimplemented, directly or indirectly by the relevant authorities of the University.
The overall goal purpose of the model is to provide the university with a blue print or framework forestablishing and maintaining a sustainableuniversity/industry partnership. The model can be divided between three key players:
1) Enablers of university-industry partnership are diverse in nature and scope and include.
2) Processes involved in university-industrypartnership include.
mission.
8. Conclusion
A systems dynamics model for sustainable university- industry partnership is developed from the resultsproduced from the local industry survey, productivity and quality study from the University, and experiencefrom implementing industrial training in the BEngdegree Programme. The model of sustainableuniversity-industry partnership is predicated upon:
1) Leadership, policy, planning and resources;2) Knowledge, skills, and innovation; 3) University productivity; 4) Industry capability and capacity; and 5) Sustainability of partnership.
The insights obtained from the model for sustainableuniversity-industry partnership can be used as thebasis of a platform for designing a framework that the University of Botswana can use as a model for implementing a sustainable university-industrypartnership. The key elements of the implementing model are divided between three key players:enablers, processes and outcomes.
221
9. References
[1] Prigge, G. W. 2005. University-industrypartnerships: What do they mean touniversities? A review of the literature. Industryand Higher Education 19 (3): 221–29.
[2] Ankrah, S.; AL-Tabbaa, O. Universities-industrycollaboration: A systematic review. Scand. J.Manag. 2015, 31, 387–408. [CrossRef]
[3] Educause. 2003. Come toge the r : Campusesfind the road to success lined with partnerships and collaborations. In NLII [National Learning Infrastructure I n i t i a t i v e ] 2 0 0 3 a n n u a l review. http://www.educause.edu/ir/library/html/nlii_ar_2003/cometogether.as p.
[4] Prigge, G. W. 2006. Establishing andmaintaining successful industry partnerships at research universities. Ph.D. diss., University of Nebraska–Lincoln.
[5] University o f Botswana Draft Strategic Plan 2018-2028.
[6] University of Botswana Research Strategy 2009-2018
[7] Alleh, M . S .; O m a r , M . Z . University-industrycollaboration models in Malaysia. Procedia Soc.Behav. Sci. 2013, 102, 654–664. [CrossRef]
[8] Bossel H., “Indicators for SustainableDevelopment: Theory, Method, Applications”,International Institute for SustainableDevelopment, Manitoba, (1999).
[9] Mothibi J . Obok O p o k A ., “ Productivity and Quality Awareness Perceptions of Staff” in the University of Botswana, (2005).
[10] Ackoff R.L., “Redesigning the Future”. A Systems Approach to Societal Problems.Wiley, New York, (1974).
[11] Draft UN Enterprise Company Draft, 2018
222

Towards a conceptual framework for iversities-industries-government-Otherscollaboration for sustainable development in industry 4.0 revolution
Joseph Evans Agolla Department of management, School of Business and management, Botswana Open University
Email: [email protected]
Abstract
Studies has shown that universities-industries-government and other research institutions (U-I-G-O) collaboration act as seedbedfor sustainable development in industry 4.0 revolution, yet little attempts have been made to investigate this nexus with reference to developing countries. The present study investigates universities-industry-government collaboration for sustainable development from a developing economy perspective th rough intensive literature review. To accomplish t h e aims of this research, threeresearch questions were formulated. Methodologically, t h e paper adopts an in depth enquiry to mine data. Online databases such as Emeraldinsight, Ebsco , Inderscience, Springer and Google Scholar were consulted. To achieve the purpose of thispaper, keywords: R and D, collaboration, university-industry, networks, and partnerships were utilised to narrow down on those journals or articles that met the set criteria. These data was c r i t i c a l l y subjected to scrutiny and thematicallyanalysed. First, the paper contributes to o u r understanding of the nature and dynamics of universities-industry collaboration through an extension of triple helix theory, thereby proposing quadruple model. Second, this research offers some insights on policy and practice imperatives that could be applicable to most U-I-G-O collaborations. Thirdly, theoretically the study contributes to the body of knowledge through recent literature on universities-industry collaboration, a field that is still in a developing state. Despite the contribution claims, readers should exercise caution as the results are based purely on qualitative data; hence someweaknesses that are inherent to this approach may have interfered partly.
Keywords Collaboration, Governance, industry, Innovation, Intellectual property rights, Networks, Organization Sustainable development, R&D, Universities
1. Introduction
Universities-industries-governmentcollaboration/network has recently gained a lot of attention from both scholars as well as policy makers. This attention is as a result of the benefits that accrue from the collaboration between them, which is based on the mutual benefits. In addition, universities-industry-government (U-I-G-O) collaboration is recognised as a viable option to turn creative ideas into tangible sustainable development and innovation [1]. Such creative ideas generated through collaboration are a source of knowledge that propels both parties to greater competitiveness. For instance, study [2] point out that in order to trigger, encourage, and stimulate the business and territorial processes of innovation, it is fundamental to establish interactions and partnerships between universities, industry and the government. First, of interest to note is that the quest for U-I-G-O collaboration arises from the fact that, universities are morally obliged to supply workforce that serve the need of the society, government and industries in general. Second, the society and
industries are expected to absorb the universities outputs (students and knowledge, R&D). Third, government acts as a source of public procurement for the universities and industries outputs. The quadruple collaboration between U-I-G-O is an important source of new knowledge that can lead to sustainable commercial innovation [3].
In industry 4.0 revolution, knowledge is earmarked as the powerful tool that nations willuse to out-perform one another. The term
ndustry 4.0 stands for the fourth industrial revolution. Other related terms include the
ndustrial Internet or the Digital Factory ,although neither takes as complete a view. While Industry 3.0 focused on the automation of singlemachines and processes, Industry 4.0 focuses on the end-to-end digitisation of all physical assets and integration into digital ecosystems with value chain partners. Generating, analysing and communicating data seamlessly underpin thegains Industry 4.0 promised, which network awide range of new technologies to create value[4]; [5]). Simply put, industry 4.0 revolution emphasises the elimination of physical space
223
through connectivity via digital means [6]; [5])
It is noteworthy that the idea and conceptsassociated with universities-industries- government and others partnerships are not new and it is commonly agreed that universities are an important source of new knowledge for industry [11]; [9]; [2]; [12]). In the USA some of the most prestigious universities, for example, Massachusetts Institute of Technology (MIT) were established more than one century ago to support close research relationships between universities-industry-government and other research institutions U-I-G-O [13]; [12]). Thecollaboration (U-I-G-O) has been considered asone of the main factors contributing to successful US innovation and growth in the past two decades[13]; [12]). There is a plethora of research studies on identifying and analysing cultural, technical, legal and macro-organisational factors governing the success of U-I collaboration [2]; [12]), yet these studies have ignored important contributions that can be made by ther institutions in the collaboration. This is a deficiency, which this paper sets out to address.
Firstly, the present study contributes to our understanding through extension of Triple HelixModel (THM) of university-industries- government collaborations to propose a moreinclusive framework (QM). Secondly, this research offers new insights, and implores futurescholars to empirically tests the QM as away to validate the findings. The paper is organised asfollows: Firstly, the paper presents the literaturereview on universities-industries-government collaboration. Secondly, the paper discusses theperspective of study in developing countries and the adopted methodology with the aim of identifying the challenges and issues related to collaboration between universities-industries and government. Thirdly, based on in-depth inquiry and literature review, the paper formulates threeresearch questions to guide its purpose. Lastly, thepaper presents a model U-I-G-O collaboration and discusses the implication of the application of such model.
2. Study context
For many years, most developing economies, particularly those from Africa have been
struggling to attain economic development and independence in terms of economic prosperity and therefore little has been achieved compared to developed economies. Africa is still heavilydependent on the West and East countries, though it has the largest repository of the world s naturalresources. Africa s failure has been a cause of concern locally and internationally. International opinion leaders have been left
wondering as to what is wrong with a continent that is well endowed with plenty of natural resources. On the other hand, it is well known that natural resources lay a strong foundation for sustainable economic growth and development. For the most part, African countries by large have failed to make their presence felt at the international stage [8]. This poor performance has resulted in the continen s over- reliance on external assistance ranging from financial support to general infrastructures (security, transportation, education, medicines, technologies, engineering etc.).
A country s sustainable development is hingedupon the quality and effectiveness of its institutions and human capital (Agolla, 2018). Collaborations between U-I-G-O presentopportunities that can be exploited to enhance theeconomies of these nations. Africa hosts somemajor multinational organisations (MNTs) that areattracted by the continen s abundant naturalresources such as oil, gas, diamond, gold and many others that can be leveraged to create employment opportunities to the ever-increasing population through U-I-G-O [9]; [10]). Evidence suggests that these MTNs have thecapacity to inject capital that can be used as seed funds to small micro medium enterprises. In addition, they can assist universities to producecompetent market oriented graduates who aremarket ready [1]; [13]).
Therefore, to achieve the main aims of the presentstudy, the following three questions are presentedas a guide:
RQ 1. How can government-universities- industries-others collaborate for mutual benefitsfor sustainable development in industry 4.0 revolution?
RQ 2. How can government play a role inuniversities-industries - others collaborations?
224
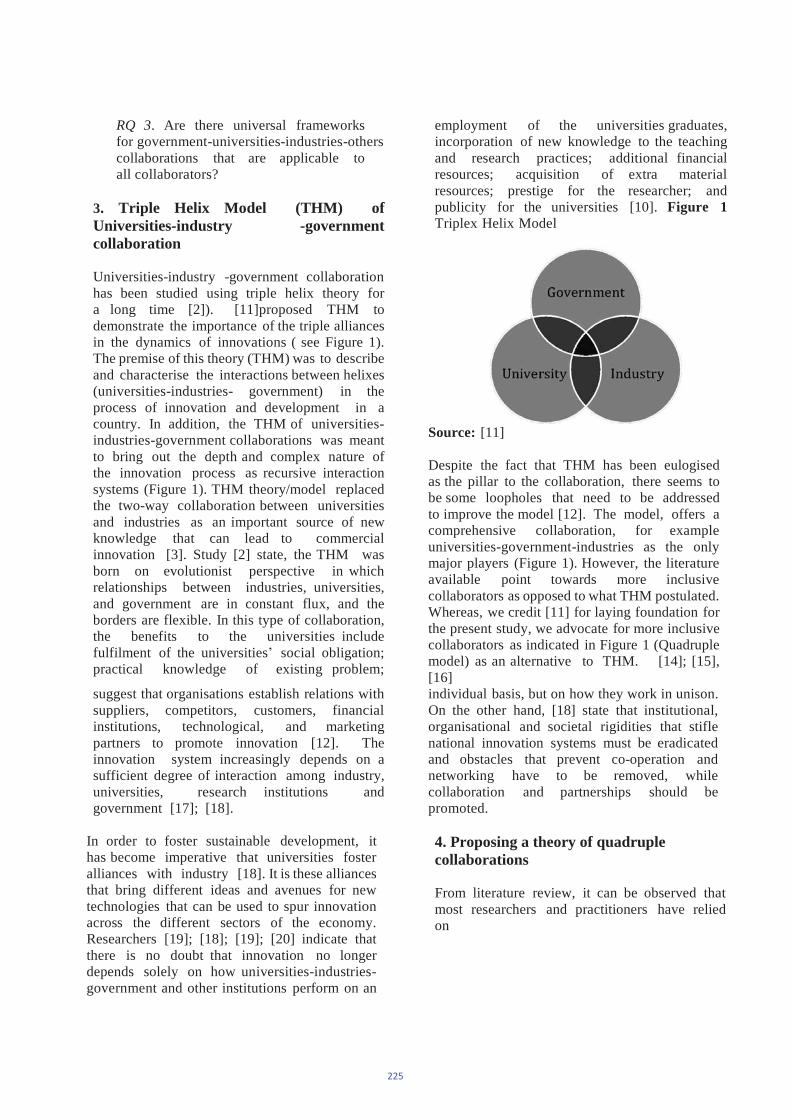
RQ 3. Are there universal frameworks for government-universities-industries-others collaborations that are applicable to all collaborators?
3. Triple Helix Model (THM) of Universities-industry -government collaboration
Universities-industry -government collaborationhas been studied using triple helix theory for a long time [2]). [11]proposed THM to demonstrate the importance of the triple alliances in the dynamics of innovations ( see Figure 1). The premise of this theory (THM) was to describe and characterise the interactions between helixes (universities-industries- government) in the process of innovation and development in a country. In addition, the THM of universities-industries-government collaborations was meant to bring out the depth and complex nature of the innovation process as recursive interaction systems (Figure 1). THM theory/model replaced the two-way collaboration between universities and industries as an important source of new knowledge that can lead to commercial innovation [3]. Study [2] state, the THM was born on evolutionist perspective in which relationships between industries, universities, and government are in constant flux, and the borders are flexible. In this type of collaboration, the benefits to the universities include fulfilment of the universities social obligation; practical knowledge of existing problem;
employment of the universities graduates, incorporation of new knowledge to the teaching and research practices; additional financial resources; acquisition of extra material resources; prestige for the researcher; and publicity for the universities [10]. Figure 1 Triplex Helix Model
Source: [11]
Despite the fact that THM has been eulogised as the pillar to the collaboration, there seems to be some loopholes that need to be addressed to improve the model [12]. The model, offers acomprehensive collaboration, for exampleuniversities-government-industries as the onlymajor players (Figure 1). However, the literatureavailable point towards more inclusivecollaborators as opposed to what THM postulated.Whereas, we credit [11] for laying foundation for the present study, we advocate for more inclusive collaborators as indicated in Figure 1 (Quadruple model) as an alternative to THM. [14]; [15], [16]
suggest that organisations establish relations withsuppliers, competitors, customers, financial institutions, technological, and marketing partners to promote innovation [12]. The innovation system increasingly depends on a sufficient degree of interaction among industry, universities, research institutions and government [17]; [18].
In order to foster sustainable development, it has become imperative that universities fosteralliances with industry [18]. It is these alliances that bring different ideas and avenues for new technologies that can be used to spur innovationacross the different sectors of the economy. Researchers [19]; [18]; [19]; [20] indicate that there is no doubt that innovation no longer depends solely on how universities-industries-government and other institutions perform on an
individual basis, but on how they work in unison. On the other hand, [18] state that institutional,organisational and societal rigidities that stiflenational innovation systems must be eradicatedand obstacles that prevent co-operation andnetworking have to be removed, while collaboration and partnerships should bepromoted.
4. Proposing a theory of quadruple collaborations
From literature review, it can be observed that most researchers and practitioners have relied on
225
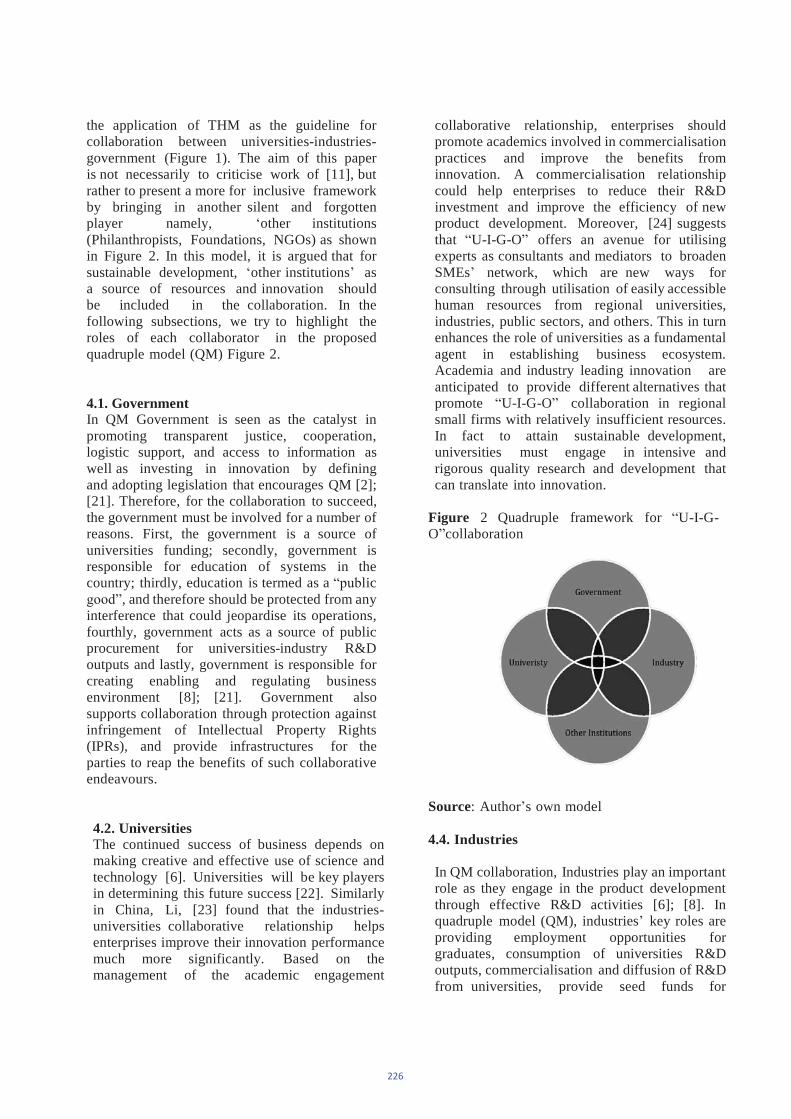
the application of THM as the guideline for collaboration between universities-industries- government (Figure 1). The aim of this paper is not necessarily to criticise work of [11], but rather to present a more for inclusive framework by bringing in another silent and forgotten player namely, other institutions (Philanthropists, Foundations, NGOs) as shown in Figure 2. In this model, it is argued that for sustainable development, other institutions as a source of resources and innovation should be included in the collaboration. In the following subsections, we try to highlight the roles of each collaborator in the proposed quadruple model (QM) Figure 2.
4.1. Government In QM Government is seen as the catalyst inpromoting transparent justice, cooperation, logistic support, and access to information as well as investing in innovation by defining and adopting legislation that encourages QM [2]; [21]. Therefore, for the collaboration to succeed, the government must be involved for a number of reasons. First, the government is a source of universities funding; secondly, government isresponsible for education of systems in thecountry; thirdly, education is termed as a lic
, and therefore should be protected from any interference that could jeopardise its operations, fourthly, government acts as a source of public procurement for universities-industry R&Doutputs and lastly, government is responsible for creating enabling and regulating business environment [8]; [21]. Government also supports collaboration through protection againstinfringement of Intellectual Property Rights(IPRs), and provide infrastructures for the parties to reap the benefits of such collaborativeendeavours.
4.2. Universities The continued success of business depends on making creative and effective use of science and technology [6]. Universities will be key players in determining this future success [22]. Similarly in China, Li, [23] found that the industries-universities collaborative relationship helps enterprises improve their innovation performance much more significantly. Based on the management of the academic engagement
collaborative relationship, enterprises should promote academics involved in commercialisation practices and improve the benefits from innovation. A commercialisation relationship could help enterprises to reduce their R&D investment and improve the efficiency of new product development. Moreover, [24] suggests that U-I-G-O offers an avenue for utilising experts as consultants and mediators to broaden SMEs network, which are new ways for consulting through utilisation of easily accessible human resources from regional universities, industries, public sectors, and others. This in turn enhances the role of universities as a fundamental agent in establishing business ecosystem. Academia and industry leading innovation are anticipated to provide different alternatives that promote U-I-G-O collaboration in regional small firms with relatively insufficient resources. In fact to attain sustainable development, universities must engage in intensive and rigorous quality research and development that can translate into innovation.
Figure 2 Quadruple framework for U-I-G-O collaboration
Source: Autho s own model
4.4. Industries
In QM collaboration, Industries play an importantrole as they engage in the product developmentthrough effective R&D activities [6]; [8]. In quadruple model (QM), industries key roles are providing employment opportunities for graduates, consumption of universities R&D outputs, commercialisation and diffusion of R&D from universities, provide seed funds for
226
conducting R&D and knowledge transfer for practical purposes [25]. On the one hand, Industries provide internships for student work experience and expose them to modern managerial and organisation processes and structures that can supplement theoretical understandings provided at the universities [10]. On the otherhand, industry practitioners can be involved incurriculum development processes, universities programmes and courses that might be aligned toindustry needs [10]. In addition industries could also offer opportunities for members of academic staff through exposure to real life problems and solutions through sabbatical arrangements in these industries. Through this collaboration in quadruple network universities are likely to come up with outputs that have practical solutions to societal problems.
4.5. Other research institutions To achieve a robust sustainable development, collaboration should be extended to include other institutions (Independent research organisations,
Philanthropists individuals / organisations, Foundations, NGOs), which has long beenignored as earlier scholars concentrated their efforts on THM as the only way for sustainabledevelopment [25]. Theseother institutions are a source of R&D and
knowledge transfer that can be useful in severalways. In QM, for example, universities and government in particular are encouraged to explore collaboration possibilities in the areas of mutual interests and funding of R&D from other institutions. Interaction between academia
and external organisations can facilitate the transfer of knowledge and even stimulate the production of new knowledge [26]. Other institutions offer a rich reservoir of researchers, consultants, and funding with real life practical experiences that can be used by both universities-industries-government for sustainabledevelopment. Some of these ther institutionsare highly engaged in specialised projects that can assist in knowledge transfer and dissemination between different players in the QM (Figure 2) [25]; [24]). Of interest to note is that, collaborationcould come from organisations such as Rockefeller foundation, Melinda-Bill Gatesfoundation, European Organisation for the
Research and Treatment of Cancer (EORTC), European Plant Science Organisation, Danish Councils for Independent Research, UnitedNations Development Programme (UNEP), andUnited Nations Population Fund (UNFP) just tomention but a few. These are organisations thatassist universities in attaining high quality research output with possibility of turning theminto sustainable development and innovation.
4.6. Governance The question that quadruple model will have toanswer is, how do collaborators deal withmanagement of the competing interests of thoseinvolved? To answer this question, thesequadruple collaborators must enter into anopenness agreement with one another without suspicion. The quadruple collaboration must be clear on the contents and duration of such collaboration, for example, is the collaboration meant for short-term and long term? Empirical evidence [3] found that in collaboration, continuity is important as trust comes from continuous collaboration and the concrete results it leads to. In addition, innovation activity is based on trust. Trust requires transparency and clear rules of engagement that are communicated properly. Governance requiresthat there should be proper management of thequadruple relationship in order to create long-term relationships. The sustainability of thisrelationship will heavily depend on how governance is implemented across the board. Governance is based on shared interests that weedout any skewed interests that may jeopardise therelationships, for example, the case of how R&D will be funded, ownership of (IPRs), owner of Patents, and the apportionment of the proceedsthereon [8]; [27].
4.7. Collaboration Collaboration is the focal point where the major collaborators share ideas that could be turned intosustainable development and innovation. [3] state that one knowledge exchange success factor is the ability to discuss with different parties from universities, industry, government and others institutions and recognising the competing interests of these parties. This involves the diplomatic facilitation of this knowledge exchange so that different parties
227
interests converge on neutral ground, able to build a common . Collaboration in QM requires legal framework to guide parties on how the proceeds from any co-creation of products areshared. For example, [28] point out that in collaboration, the orchestrators need tounderstand both motives for participating in the network and the desired type of innovations andknowledge generation. They should carefullyconsider if they are mainly striving for explorativepurposes (the transformative trading zone) or exploitation (the performative) and adapt levels of diversity, type of relationship, and collaboration configurations accordingl . Hence, the networkmust find ways to deal with appropriability and capability assurance. In addition, in order to combine their specific knowledge base ininnovative ways, collaboration participants need to establish communication channels for sustainable development.
5. Conclusions and implicationsFrom the synthesis and analysis of streams of literature, this study presents the QM each actor roles in the process of sustainable development.We note the role of each actor in QM for achieving critical sustainable development and competitive advantage for countries. We developed a framework (U-I-G-O) that we believeincludes the most important actors necessary for the successful collaboration between universities and industries in Figure 2. Our study has proved that quadruple collaboration / alliances would be more suitable for a robust collaboration for sustainable development as it comprises of actors, which complement one another based on mutual understanding. In one our QM, we propose that sustainable development cannot be achieved without collaborative efforts of the four pillars (universities-government, industries and otherinstitutions), which are a source of knowledge,funding, and R&D (Figure 2). Government shoulddevelop a framework that can assist itsinstitutions, particularly universities, to develop and promote technologies, participate in theestablishment of science parks and innovation system, promote universities technology transferand commercialisation as well as strengthening international technical innovation collaboration.These require collaborative efforts and appropriate legislation that allow country s institutions to engage in collaboration both
locally and internationally. The quality of these institutions and R&D needs to be strengthened in order to translate research and development outputs to innovation and commercialisation. It is worth noting that R&D alone cannot lead to innovation, unless it is of highly quality and well disseminated to the rightful audience with the purpose of buying in. This underscores the importance of quadruple collaboration amongst various stakeholders as shown in Figure 2.
The paper makes a contribution by pointing out the interconnection of U-I-G-O for sustainable development and innovation in industry 4.0 revolution. The study highlights the importance of knowledge exchange with different types of universities, industries, government and others, and the different learning modes related tosustainable development and innovation. Priorknowledge and contacts vary in organisations, andinteraction should be supported to utilise external resources of different organisational and individual backgrounds. For organisations tocontribute meaningfully to sustainable development, there is need to open to externalknowledge through collaboration. Engaging externally is likely to create a pool of knowledgeand create a better understanding on how to solveproblems that need multi-stakeholders for sustainable development and innovation. Therefore, the study implores universities to comeup with the research focus areas that are societydriven in nature in order to contribute tosustainable development that can positiondeveloping countries for industry 4.0 revolution. Industry 4.0 revolution is knowledge intensive and only those countries that will developcollaborative approach to knowledge generation will foster sustainable development both in the short and long run.
The present study does suffer some weakness;first of all, the study relied on English publications in order to mine data, ignoring other publications that were written in other international languages. Secondly, in terms of methodology, the study dependent on qualitative approach could have undermined some of the fundamental principles. And lastly, further research into this area should consider in-depth interviews with senior researchers, academia,
228
and policy makers in order to validate the study sclaims.
References
[1] Agolla, J.E. and Van Lill, J.B. An empirical investigation into innovation drivers and barriers in public sector organisations, International Journal of Innovation Science, vol. 8 (4), pp.404- 422, 2016.
[2] Natário, M.M, Couto, J.P.A. and de Almeida, C.F.R. The triple helix model and dynamics of innovation: a case study, Journal of Knowledge-based Innovation in China, vol. 4 (1), pp. 36-54, 2012.
[3] Moilanen, H., Halla, M., and Alin, P. Openness in university-industry collaboration: probing managerial perceptions, European Journal of Innovation Management, vol. 18 (4),pp. 493-507, 2015.
[4] Global Industry 4.0 Survey.https://www.pwc.com/gx/en/industries/industries-4.0/landing-page/industry-4.0-building-your- digital-enterprise-april-2016.pdf. Accessed on 20May 2018.
[5] Mario, H,Tobias, P. and Boris, O. Design Principles for Industrie 4.0 Scenarios: A Literature Review. Working paper No.1, pp. 1-15, 2015. www.snom.mb.tu-dortmund.de. Accessed on 10 June, 2018.
[6] Agolla, J.E. Human Capital in Smart Manufacturing and Industry 4.0 Revolution. In Digital Transformation in Smart Manufacturing.http://www.intechopen.com/articles/show/title/hu man-capital-in-the-smart-manufacturing-and- industry-4-0-revolution. ISBN 978-953-51-5780- 9, 2018.
[8] Agolla, J.E. and Van Lill, J.B. A structural equation modelling of innovation in public sector organisations, African Journal of Business and Economic Research, vol. 12 (1), pp.107-139, 2017a.
[9] Agolla, J.E. and Van Lill, J.B. Insights intoinnovation in Kenya s public sector: the case of managers, International Journal of Innovation Science, vol. 9 (4), pp. 225-243, 2017b.
[10] Ishengoma, E. and Vaaland, T.I. Can university- industry linkages stimulate studentemployability? Education+Training, vol. 58 (1), pp. 18-44, 2016.
[11] Leydesdorff, L. and Zawdie, G. The triple helix perspective of innovation systems, Technology Analysis & Strategic Management,vol. 22 (7), pp. 789-804, 2010.
[12] Worasinchai, L., Ribie`re, V.M. and Arntzen,A.A.B. Working knowledge, the university- industry linkage in Thailand: concepts and issues, VINE: The journal of information and knowledge management systems, vol. 38 (4),pp. 507-524, 2008.
[13] Hall, B. University-Industry-ResearchPartnerships in the United States, in Contzen, Jean-Pierre, David Gibson, and Manuel V. Heitor(eds.), Rethinking Science Systems andInnovation Policies, Proceedings of the 6thInternational Conference on Technology Policyand Innovation, Purdue University Press, 2014.
[14] Adler, P., Heckscher, C. and Prusak, L. Building a collaborativeenterprise. Harvard Business Review, vol. 89 (7/8), pp. 94-101, 2011.
[15] OECD. Ministerial Report on the OECD InnovationStrategy.Available: http://www.oecd.org. Accessed on May 23, 2010. Organisation for Economic Co-operation and Development.
[16] Serrano-Bedia, A. M., López-Fernández,
229

M. C. and García-Piqueres, G. Complementarity between innovation activities and innovation performance: Evidence from Spanish innovative firms. Journal of Manufacturing Technology Management, vol. 23 (5), pp. 557-577, 2012.
[17] Jauhari, V. Fostering effective university-industry partnerships: concluding remarks. Worldwide Hospitality and Tourism Themes, vol. 5 (3), 301- 306, 2013.
[18] Lee, S.M., Hwang, T. and Choi, D. Open innovation in the public sector of leading countries. Management Decision, vol. 50 (1), pp. 147-162, 2012.
[19] Albury, D. Creating the conditions for Radical Public Service Innovation. The Australian Journal of Public Administration,vol. 70 (3), 227-235, 2011.
[20] Tsekouras, G., Poulis, E. and Poulis, K. Innovation and dynamic capabilities in a traditional service sector Evidence from shipping companies. Baltic Journal of Management, vol. 6 (3),pp. 320-341, 2011.
[21] Su, D., Zhou, D., Liu, C. and Kong, L. Government-driven universities-industry linkages in an emerging country: the case of China. Journal of Science & Technology Policy Management, vol. 6 (3), pp.263-282, pp.2015.
[22] OECD (2003), Promoting Better Public-Private Partnerships Industry-University Relations, Business and Industry Advisory Committee (BIAC) to the OECD, OECD, Paris.
[23] Li, F., Chen, J. and Su, Y-S. Managing theuniversity-industry collaborative innovation in China: The case of Zhejiang HU Company, Journal of Organisational Change Management, vol. 31 (1), pp. 62-82, 2018.
[24] Kim, C., Park, S-H. and Seol, B-M. The role of university for the change of a network structure inthe regional business ecosystem, Asia Pacific Journal of Innovation and Entrepreneurship, vol.12 (1), pp. 77- 89, 2018.
[25] Agolla, J.E. and Makara, T. A conceptual framework of innovation for economic diversification and sustainable growth, African journal of Economic and SustainableDevelopment, (in-production), 2018
[26] Gertner, D., Roberts, J. and Charles, D. University-industry collaboration: a CoPs approach to KTPs, Journal of Knowledge Management, vol. 15 (4), pp. 625-647, 2011.
[27] Dooley, L. and Kirk, D. University-industry collaboration: Grafting the entrepreneurial paradigm onto academic structures, European Journal of Innovation Management, vol. 10 (3),pp.316-332, 2007.
[28] Sandberg, J., Holmström, J., Napier, N. and Levén, P. Balancing diversity in innovation networks Trading zones in university- industry R&D collaboration, European Journal ofInnovation Management, vol. 18 (1), pp. 44-69,2015
230
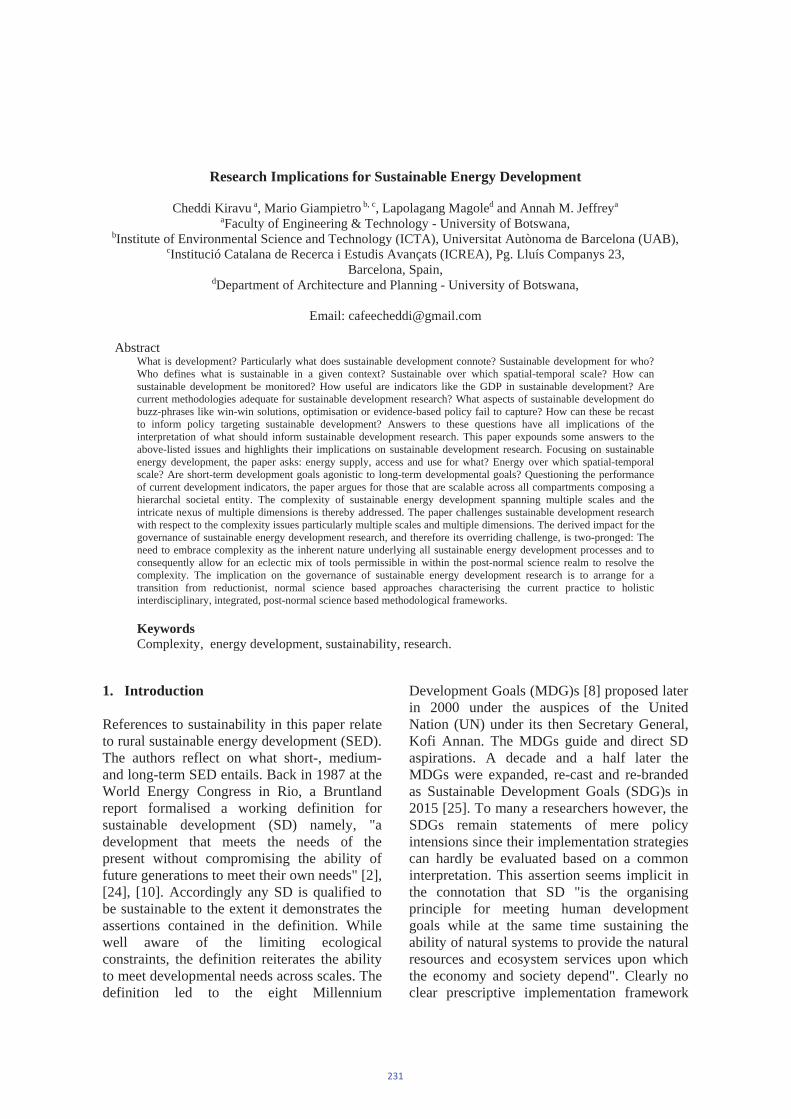
Research Implications for Sustainable Energy Development
Cheddi Kiravu a, Mario Giampietro b, c, Lapolagang Magoled and Annah M. Jeffreya
aFaculty of Engineering & Technology - University of Botswana, bInstitute of Environmental Science and Technology (ICTA), Universitat Autònoma de Barcelona (UAB),
cInstitució Catalana de Recerca i Estudis Avançats (ICREA), Pg. Lluís Companys 23, Barcelona, Spain,
dDepartment of Architecture and Planning - University of Botswana,
Email: [email protected]
Abstract What is development? Particularly what does sustainable development connote? Sustainable development for who? Who defines what is sustainable in a given context? Sustainable over which spatial-temporal scale? How can sustainable development be monitored? How useful are indicators like the GDP in sustainable development? Are current methodologies adequate for sustainable development research? What aspects of sustainable development do buzz-phrases like win-win solutions, optimisation or evidence-based policy fail to capture? How can these be recast to inform policy targeting sustainable development? Answers to these questions have all implications of the interpretation of what should inform sustainable development research. This paper expounds some answers to the above-listed issues and highlights their implications on sustainable development research. Focusing on sustainable energy development, the paper asks: energy supply, access and use for what? Energy over which spatial-temporal scale? Are short-term development goals agonistic to long-term developmental goals? Questioning the performance of current development indicators, the paper argues for those that are scalable across all compartments composing a hierarchal societal entity. The complexity of sustainable energy development spanning multiple scales and the intricate nexus of multiple dimensions is thereby addressed. The paper challenges sustainable development research with respect to the complexity issues particularly multiple scales and multiple dimensions. The derived impact for the governance of sustainable energy development research, and therefore its overriding challenge, is two-pronged: The need to embrace complexity as the inherent nature underlying all sustainable energy development processes and to consequently allow for an eclectic mix of tools permissible in within the post-normal science realm to resolve the complexity. The implication on the governance of sustainable energy development research is to arrange for a transition from reductionist, normal science based approaches characterising the current practice to holistic interdisciplinary, integrated, post-normal science based methodological frameworks.
Keywords Complexity, energy development, sustainability, research.
1. Introduction
References to sustainability in this paper relate to rural sustainable energy development (SED). The authors reflect on what short-, medium- and long-term SED entails. Back in 1987 at the World Energy Congress in Rio, a Bruntland report formalised a working definition for sustainable development (SD) namely, "a development that meets the needs of the present without compromising the ability of future generations to meet their own needs" [2], [24], [10]. Accordingly any SD is qualified to be sustainable to the extent it demonstrates the assertions contained in the definition. While well aware of the limiting ecological constraints, the definition reiterates the ability to meet developmental needs across scales. The definition led to the eight Millennium
Development Goals (MDG)s [8] proposed later in 2000 under the auspices of the United Nation (UN) under its then Secretary General, Kofi Annan. The MDGs guide and direct SD aspirations. A decade and a half later the MDGs were expanded, re-cast and re-branded as Sustainable Development Goals (SDG)s in 2015 [25]. To many a researchers however, the SDGs remain statements of mere policy intensions since their implementation strategies can hardly be evaluated based on a common interpretation. This assertion seems implicit in the connotation that SD "is the organising principle for meeting human development goals while at the same time sustaining the ability of natural systems to provide the natural resources and ecosystem services upon which the economy and society depend". Clearly no clear prescriptive implementation framework
231

can be inferred from this underlying SD principle. The lack of a valid SD implementation framework at multiple temporal scales remains a challenge that only a few researchers [22], [1], [19], [16], [8] and [7] have undertaken. In this paper, the authors contribute to the scholarly debate on the SD issues raised basing their arguments on MuSIASEM, a complexity-science based framework developed by Giampietro et al. [7, 8, 9] and co-workers at the Autonomous University of Barcelona. MuSIASEM guides research on Multi-scale Integrated Analysis of Societal and Ecosystems Metabolism.
2. Critiquing and Purposing SED
In the context of MuSIASEM, SED connotes an energy development geared towards short- to medium-term energy efficiency requiring increasing technological capitalisation for improving the material standards of living (MSL), and a gradual transition in the long-term towards energy use for consumptive services and leisure activities. This background understanding provokes a reflection on the cardinal SED questions: SED for who? Who defines what SED is in a given context? SED over what spatial-temporal scale? What indicators correctly reflect SED? Such a reflection reveals misunderstandings and contradictions hindering a holistic appreciation of the complexity of SED. A critique of SED approaches is therefore worthwhile. The critique provides a methodological guide for understanding what SED research focus ought to be. First off, SED needs to be conceptualised from a complexity point of view. Such a view underscores the consideration of multiple scales, the integration of multiple dimensions, attention to nonlinearity effects and feedback loops, the participation of multiple stakeholders, the simultaneous evaluation of non-equivalent variables and emergence in the analysis of SED. Such complexity punctuates the characterisation of self-organising systems and underscores the essence of becoming systems that SED essentially are. Most of the current SED research fails to accommodate the gamut of complexity concerns just raised and
therefore rarely attempt a holistic characterisation of SED. Implicitly most SED perpetuate methodologies that clearly are incapable of addressing the complexity issues raised. In particular, current SED research methodologies rely heavily on normal science underscoring the scientific method based on observability and the implied measurement and repeatability of scientific results. Despite the evidence of complex SED, research establishments are still strictly disciplinary. They expect SED researchers to apply disciplinary endeavours while resolving what clearly transcend disciplinary academic boarders. Therefore collaboration across disciplines is required to collate both the skills and the tools found across disciplines and spanning philosophical, technical, social, demographic, economic, environmental and ecological system specialists. When done, the objective of sustainable SED is to exhort researchers to provide a holistic analysis of SED based on the inextricable nexus of multi-dimensional subsystems of a dynamically-evolving self-organising SED system operating at multi-scales.
3. Methodological and Methodical Design
In order to achieve the objective outlined in the purpose set for this paper, we draw lessons from a metabolic case study of the Mmokolodi village in Botswana. We use data from the metabolic pattern to illustrate the important issues delineating energy demand, supply, access and use at the village in relation to the village’s prospective development. In the illustration, the authors guide the reader through a consideration of the sustainability of the observed Mmokolodi metabolic pattern while simultaneously expounding the arguments and contentions raised in the opening introductory section of the paper. The Mmokolodi case study was carried out under the auspices of the PARTICIPIA project1
3.1. Methodological and Methodical Design
1 (Contract DCI-AFS/2013/320-333) funded under the ACP-EU Cooperation Programme in Higher Education (EDULINK); a Programme of the ACP Group of States, with the financial assistance of the European Union.
232

The Mmokolodi case study sought to reveal the metabolic characteristic pattern of energy and resources consumption at the village. The aim was to obtain a baseline metabolic scenario indicating how the village accesses and uses energy and resources and towards what end. This diagnostic pattern analysed the pattern of energy uses at the village in the absence of a predetermined final cause. Such a case is analysed for sustainability clues and compared to a simulated case where a final cause is predetermined and foreseen. The simulation provide pointers to the sustainability metrics worth accounting for in any SED. The study was designed under the premise that the village could be modelled as a self-organising societal entity metabolising resources as living organisms do. Accordingly the village model reflects the essence of a functional village structure viewed as self-organising living entity. The definition of the functional roles at Mmokolodi village was possible following the results of two participatory processes: A participatory structured questionnaire (PSQ) and a participatory Graphical Information Systems (PGIS) process.
3.1.1 Participatory Structured Questionnaire The PSQ provided multidimensional data reflecting the demographics, social-economic realities, environmental other important aspects of the 55 households composing the Mmokolodi village in which a total of 383 household members lived.
3.1.2 Participatory Graphical Information Systems
The Participatory Graphical Information Systems (PGIS) process was carried out with participants invited on the basis of their indigenous knowledge of Mmokolodi village paying particular attention to the peculiar roles those individuals played in the village. The PGIS was aimed at constructing the primary data involving land-use patterns at the village. It was used to map out the village boundaries, demarcate the extents of the study area and form the basis for the location of important topographical landmarks for the Mmokolodi case study in relation to land-uses. The PSQ and PGIS data was subjected to a MuSIASEM
analysis. The analytical time frame selected was the meso scale spanning up to 1 year. This means the material and resource flows as well as the funds as well as the material inputs and outputs considered were defined as annual averages. The analysis was organised by integrating the PGIS data with the democratic, socio-economic, ecological and technical data derived from the PSQ.
4. Findings
The resulting diagnostic metabolic data delineated flows: energy, water, food and money; and funds: human activity time, Ricardian land and technological capital. These together with other inputs/outputs flow into/out of the metabolic process from/into the social-economic system. Equally, bio-physical inputs/outputs flow between the metabolic process and the ecological system. The typologies of land uses derived out of the total available land (TAL) amounting 1322 ha included 673 ha forming non-managed land (NML). Of the balance of 490 ha making up managed land (ML), 159.9 ha was built-up area of which 138.7 ha was land occupied by HHs and buildings and the remainder 21.2 ha was the total surface area for pathways and roads at the village. The total human activity time (THA) amounted to 3381 kh based on the 383 Mmokolodi residents with each appropriating 8760 h/annum. The THA bifurcates into the Household (HH) compartment and the livelihood-sustaining work (LWO) compartment each appropriating 2569 kh and 812 kh respectively. The LWO compartment comprises formal work (FWO), informal work (IWO), other work (OWO) and unpaid subsistence work (SWO) in livestock and agricultural farming. The analysis shows that the available HA in HHs is expended in physiological overhead (PO): 1151 kh, household chores (CHO): 856 kh, transportation (TRA): 21 kh, leisure (LES): 503 kh, education (EDN): 2 kh and in community services (CSE): 35 kh. The diagnostic metabolic data indicated that energy was primarily used in the HHs and within the Services & Government (S&G) compartments at Mmokolodi. None of it was invested in
233
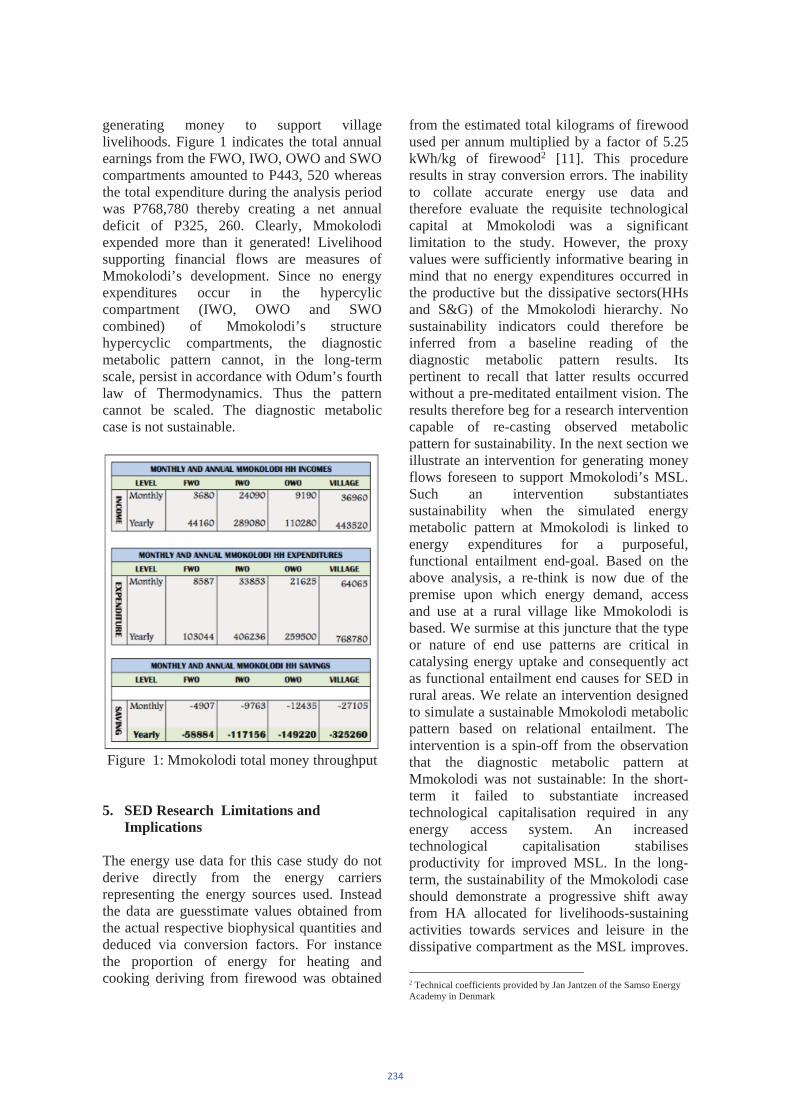
generating money to support village livelihoods. Figure 1 indicates the total annual earnings from the FWO, IWO, OWO and SWO compartments amounted to P443, 520 whereas the total expenditure during the analysis period was P768,780 thereby creating a net annual deficit of P325, 260. Clearly, Mmokolodi expended more than it generated! Livelihood supporting financial flows are measures of Mmokolodi’s development. Since no energy expenditures occur in the hypercylic compartment (IWO, OWO and SWO combined) of Mmokolodi’s structure hypercyclic compartments, the diagnostic metabolic pattern cannot, in the long-term scale, persist in accordance with Odum’s fourth law of Thermodynamics. Thus the pattern cannot be scaled. The diagnostic metabolic case is not sustainable.
Figure 1: Mmokolodi total money throughput
5. SED Research Limitations and Implications
The energy use data for this case study do not derive directly from the energy carriers representing the energy sources used. Instead the data are guesstimate values obtained from the actual respective biophysical quantities and deduced via conversion factors. For instance the proportion of energy for heating and cooking deriving from firewood was obtained
from the estimated total kilograms of firewood used per annum multiplied by a factor of 5.25 kWh/kg of firewood2 [11]. This procedure results in stray conversion errors. The inability to collate accurate energy use data and therefore evaluate the requisite technological capital at Mmokolodi was a significant limitation to the study. However, the proxy values were sufficiently informative bearing in mind that no energy expenditures occurred in the productive but the dissipative sectors(HHs and S&G) of the Mmokolodi hierarchy. No sustainability indicators could therefore be inferred from a baseline reading of the diagnostic metabolic pattern results. Its pertinent to recall that latter results occurred without a pre-meditated entailment vision. The results therefore beg for a research intervention capable of re-casting observed metabolic pattern for sustainability. In the next section we illustrate an intervention for generating money flows foreseen to support Mmokolodi’s MSL. Such an intervention substantiates sustainability when the simulated energy metabolic pattern at Mmokolodi is linked to energy expenditures for a purposeful, functional entailment end-goal. Based on the above analysis, a re-think is now due of the premise upon which energy demand, access and use at a rural village like Mmokolodi is based. We surmise at this juncture that the type or nature of end use patterns are critical in catalysing energy uptake and consequently act as functional entailment end causes for SED in rural areas. We relate an intervention designed to simulate a sustainable Mmokolodi metabolic pattern based on relational entailment. The intervention is a spin-off from the observation that the diagnostic metabolic pattern at Mmokolodi was not sustainable: In the short-term it failed to substantiate increased technological capitalisation required in any energy access system. An increased technological capitalisation stabilises productivity for improved MSL. In the long-term, the sustainability of the Mmokolodi case should demonstrate a progressive shift away from HA allocated for livelihoods-sustaining activities towards services and leisure in the dissipative compartment as the MSL improves.
2 Technical coefficients provided by Jan Jantzen of the Samso Energy Academy in Denmark
234
Latter tendency is a characteristic of all developed countries having attained a high level of development in their MSL. The intervention, based on Figure 2 and dubbed, Demand-pull Supply-push (DpSp) is conceptualised as follows: The financial target defines and pulls a chain of resources from the underlying sub-processes, all using energy, starting from the marketing processor of a defined mix of horticultural produce and ending with the energy processor at the beginning of the chain. Each of the processor pushes the required resources in turn. Each processor is characterised by a set of inputs, outputs, funds and flows as shown by the processor key on the right hand at the middle section of the figure as required by the MuSIASEM methodology. The resource inputs, deriving from the ecological environment are provided with the catalytic mediation of a set of committed funds to effect the emergence of the output. In so doing the process sinks a concomitant set of outputs into the environment. The simulated model is implemented in MATLAB-SIMULINK following Rosen’s modelling relation of the Mmokolodi hierarchical metabolic-repair (M,R)-system for the defined financial entailment. MATLAB-SIMULINK provides an environment for an interactive inputting of the variable parameter values, the analysis of the metabolic outputs and their post-processing to assess the sustainability of the intervention.
5.1 Simulated DpSp Mmokolodi Intervention Results
The village’s functional structure was aligned with the DPSP results. Where affirmative policy support mechanisms are arranged to incentivise the DpSp energy-use processes, the metabolic pattern of the DpSp is demonstratively sustainable. The level of technological capitalisation substantiates not only increased energy throughputs across the compartments composing the village structure, but also scalable metabolic rates, densities and intensities across those compartments consistent with the expected scales of the compartments. Hence by drawing an analogy between the simulated metabolic pattern to metabolism in living organisms, where the
Basal Metabolic Rate (BMR) inversely relate to the body mass index, it can be inferred that the simulated DpSp metabolic pattern is sustainable in the short- to medium-term. In the long-term, the sustainability could be tracked using an innovative indicator, the bio-economic pressure (BEP). The BEP is a measure of the material well-being of a society resulting from the increased metabolic rates as a result of increasing technological capitalisation. The indicator can be shown to reproduce all positive attributes associated with the gross nation product (GDP) with one important distinction: Whereas the GDP represents an indicator of development at the national level (where alone it is applicable), the BEP is scalable across the entire functional structure composing the village hierarchy: From the village level, all the way down to the village individuals and vice-versa.
6 An Alternative Intervention to the Case Study
6.1 Research Implications of the Mmokolodi Case Study The Mmokolodi diagnostic metabolic pattern cited indicates that no matter how many additional kWh of energy are supplied to the village, as long as this supply is merely for consumption in the dissipative compartments of the village, the measure would not affect the sustainability merit of the energy use there. Thus to the extent that an additionally installed3
20kWp solar photovoltaic (SPV)4 power plant supplies a few households, the village development community (VDC) houses and some S&G public places like the clinic or the Kgotla, this does not change the MSL at Mmokolodi.
Therefore the energy use of the SPV plant would still not be sustainable. We submit that to be sustainable, energy use at the village needs to be tied to a passional vision sustaining an aspect defining the village’s functional identity. An intervention that resolves the complexity of SED is based on conceiving
3 Involving the University of Botswana (UB), the Kwame Nkrumah University of Science & Technology (KNUST) in Kumasi Ghana, and the University of Flensburg (UF) in Germany4 30kWp of the total 50 kWp were installed at Wale Wale village in Ghan2
235

Mmokolodi village as a self-organising societal entity akin to a living organism. In this view the village metabolises resources within a functional structure akin to hierarchical structures of living organisms. But how does a SED researcher accomplish this? It is here where the inevitability and need to integrate concepts, models, theories, laws, rules and methodologies derived from disparate academic disciplines comes in! As the village metabolises resources it: requires inputs from the ecological environment, performs its societal functions, sinks several outputs as waste into the environment, simultaneously handles material resources like energy, water, food etc, enters into self-preservation through autocatalytic feedback loops and operates away from thermodynamic equilibrium in accordance with Odum’s fourth law of thermodynamics.
Figure 2: Conceptual DpSp
Latter guards against the thermodynamic meltdown of the village entity predicted by the entropy law!. Further as a living organism, the village’s functional structure is accorded a description commensurate with the hierarchical metabolic-repair (M-R)-systems of living organisms propounded in relational biology. Hence the village metabolic models lend themselves to category theory These descriptors represent just a fraction of a whole gamut of innovative concepts, theories, laws or principles necessary to frame the complexity of self-organising societal entities. The list however transcend academic disciplinary boundaries as all cannot be found within any one academic disciplines. The primary
236
implication of the resolution of the Mmokolodi diagnostic metabolic pattern problem therefore is that it demands for an innovative interdisciplinary approach. The university of Botswana (UB) foresaw the demand early and consequently enshrined it in its research strategy, "the advancement of interdisciplinary research, education and advocacy" in 7 identified key thematic areas. This led to the formation of research centres targeting clean energy, HIV& AIDS, tourism, indigenous knowledge among others. However the specific strategies for implementing interdisciplinary strategy in each of the 7 thematic areas was not prescribed. UB could have ensured the integration of this vision with its main scholarly teaching mission. Instead the implementation resolve was left to individual’s own motivation. It was hoped that individuals, for the sake of their academic development, would increasingly demonstrate a propensity towards interdisciplinary research. Limited researchers’ time and its management however meant, that priority was given to departmental academic endeavours directly supervised by the respective Head of Department (HoD). HoDs who saw the merit of interdisciplinary endeavours would be useful in promoting the UB vision. Those that didn’t would constitute its Achille’s heels. Interdisciplinary SED endeavours are agonistic to disciplinary upbringings. The traditional disciplinary upbringing believes that anyone engaging in interdisciplinary demonstrates academic weakness, constitutes an academic aberration and doesn’t deserve recognition. The arguments against interdisciplinary and disguised in defence of academic excellence, arises due to the challenge inherent in interdisciplinarity itself. Many are not challenged enough to abandon their disciplinary comfort zones and venture into the unknown. The main strategy for the governance of interdisciplinary SED must to regulate its integration mainstream research. SED researchers must be encouraged to draw synergies between their research across disciplinary boundaries. Reductionist approaches, the hallmark of normal science resolving complexity issues by addressing them as isolated single dimensions one scale at a time cannot resolve SED issues. SED issues
form a class of their own in terms of the approach to their resolution. They are unlike cook-book type issues that lend themselves to observations/measurements in a laboratory-type experimental setups and whose results are therefore reproducible and guaranteed by following a recipe-type procedure. They are unlike complicated problems, whose resolutions are informed and improved by past performance experiences and therefore depend dividing the complicated problems into smaller subproblems. The sub-problems use mathematical formulae, are optimised and are ultimately integrated to compose the final result. The process is essentially a divide-and-conquer approach. SED issues compose a class of complex systems known as becoming systems. For becoming SED systems, no cook-book type recipe nor mathematical formulae, past experiences or optimisation techniques can resolve them. Each SED system comes into being as a unique emergent system unlike any of its predecessors. Thus the resolution of the complexity of SED cannot be approached with tools found only within a given disciplinary area. Instead innovative post-normal science approaches need to be invoked.
7 Discussion
This paper has provoked a discussion of a select number of SED issues whose awareness may inform how we go about carrying holistic SED research. The paper introduced a diagnostic Mmokolodi metabolic case to illustrate why its metabolic pattern could not be sustainable. In view of the diagnostic metabolic results, an illustrative simulated intervention was introduced. Based on a defined end entailment, the simulation was argued to be scalable over spatial- temporal expanses and therefore by implication, it was deemed to be sustainable. The paper is limited to the extent that it does not provide the full details of the two separate studies. The authors considered this more expedient than risking the tractability of the arguments conflated in a lengthy excessive methodological detail. Future publications shall address this shortcoming. The issues in SED are multiscale, multi-dimensional and unlike problems amenable to the reductionist divide-and-conquer maxim in
237

normal science, SED phenomena are complex "messes"5 that dynamically emerge. As such SED phenomena are classified as becoming systems. Latter must be catalysed for their emergent properties to be manifest. Thus normal science, bent on tracking every truth through scientific measurements cannot apply to SED phenomena. The challenge to SED research must thus be how to embrace its complexity nature and the derived implications, being the necessity of post-normal scientific tools for resolving the complexity and the institution of mechanisms to integrate diverse principles, theories, laws found in multiple disciplines for the sole purpose of enriching the quality of the SED representation and analysis. The paper addressed the challenge by recommending the MuSIASEM framework. The new approach to doing science is referred to as post-normal science [5, 6], [3]. On the basis of the inextricable linkages between concurrently acting systems, MuSIASEM advocates for integrative multi-dimensional, multiscale analysis. As an example sustainable energy research cannot be conducted in isolation of the nexus between energy, water, money or land uses [23]. Further, the consideration of the technical dimension of energy analysis cannot be conducted in isolation of the coupled environmental, economic, ecological and social-demographic dimensions. In our opinion an SED research embracing, the simultaneity of multiple dimensions at multiple scales must concede the inherent richness of holistic interdisciplinary approaches for resolving SED messes. That acknowledgement is then consequently followed up by mainstreaming the development of relevant interdisciplinary curricula at the higher institutions of learning and research. The authors have designed a Master’s Program in Integrated Energy Systems (MPIES6) [15], [13], [12], [14], [12] at the UB.
8 Conclusions
SED research must first acknowledge the complexity nature of SED processes. Latter represent a class of complex systems referred
5 Ramalingam [21, Ramalingam Ben [20], Frej William and Ramalingam [4]6 The MPIES is currently undergoing the final approval process
to as becoming systems. Becoming systems dynamically evolve as a result of the catalysis of interlinked multiple-dimensional systems operating at multiple spatial-temporal scales. Once the complex nature of SED is presumed, SED must secondly concede the inadequacy of normal science, based on the reductionism, to holistically resolve SED messes. The wider implication is for SED research to transit away from reliance on normal science to the embrace of post-normal science frameworks. Latter allow an eclectic mix of tools drawn from across disciplinary boundaries for the purpose of enhancing the quality of SED analysis. Thus SED research must be founded on interdisciplinary approaches. In conclusion, the governance of SED research is challenged to find means of advancing interdisciplinary research at the institutional level. This shall improve the standing of interdisciplinary SED research. This paper provided background notes for the evaluation of the sustainability of the Mmokolodi 20 kWp SPVP. The sustainability considered Mmokolodi’s short-term ability to deploy increasing levels of technological capitalisation as required by the village’s BEP and Mmokolodi’s long-term ability to a progressively embrace the consumption of goods and services as expressions of sustainable development. The articulation of sustainability was based on the results of a baseline metabolic and a simulated metabolic scenario. The former scenario indicated no sustainability on account of a violation of Odum’s maximum power principle. The latter metabolic scenario was demonstrably sustainable in that it indicated scaled energy throughputs and metabolic rates expected of a self-organising Mmokolodi. The 20 kWp SPVP was arguably not sustainable in its current state until and unless its energy use were directed towards an income-generating activity within Mmokolodi’s hypercyclic compartment. However the paper noted that the sustainability aspired for does not emerge spontaneously of its own accord. The Mmokolodi 20kWp SPVP, like the DpSp intervention, must be catalysed. The initial financial outlay must be present. This could be affirmed by direct Government support. Indeed the intervention could be the basis for supportive energy policy to catalyse the
238
promotion of increased SPV adoption by linking energy use to an identified income-generating activity at a rural village.
References
[1] Allen T.F.H and Thomas B. Starr. Towards A Unified Ecology. ISBN 0-231-06919-7. Columbia University Press, New York, 1992.
[2] Brundtland Gro Harlem. Report of the world commission on environment and development: Our common future. http:// www.un-documents.net/our-common-future.pdf, March 1987. Accessed August 2018.
[3] Durrett Rick. Post-normal science. https://www.ime.usp.br/ ebp/ebp11/documentos/minicurso-durrett.pdf, August 2007. XI Brazilian Summer School August 5-11, 2007.
[4] Frej William and Ben Ramalingam. Foreign policy and com- plex adaptive systems: Exploring new paradigms for analysis and action. https://www.santafe.edu/media/workingpapers/ 11-06-022.pdf, June 2011. SFI Working paper: 2011-06-022 Accessed April 2016.
[5] Funtowicz S.O. and Ravetz J.R. Post normal science: A new science for new times. http://www.uu.nl/wetfilos/wetfil10/ sprekers/Funtowicz_Ravetz_Futures_1993.pdf, 1993. Accessed, May 2016.
[6] Funtowicz S.O. and Ravetz J.R. Post-normal science. http: //leopold.asu.edu/sustainability/sites/default/files/Norton,%20Post%20Normal%20Science,%20Funtowicz_{1.pdf}, 2003. Accessed, May 2016.
[7] Giampietro M., Kozo Mayumi, and Alevgul H. Sorman. The Metabolic Pattern of Societies - Where economists fall short.Earthscan from Routledge, London and New York, 2012.
[8] Giampietro M., Kozo Mayumi, and Alevgul H. Sorman. Energy Analysis for a Sustainable future - Multi-scale integrated analysis of societal and ecosystem metabolism.Earthscan from Routledge, London and New York, 2013.
[9] Giampietro M., R.J. Aspinall, Jesus Ramos-Martin, and Sandra G.F. Bukkens. Resource Accounting for Sustainability Assessment - The nexus between energy, food, water, and land use. Earthscan from Routledge, London and New York, 2014.
[10] IISD. What is sustainable development? https://www.iisd. org/sd/, 2015. InternationalInstitute for Sustainable Development,Accessed July 2015.
[11] Jan Jantzen. Samso Energy Academy: Appraisal of Renew- able Energy Projects with Cases from Samso, Appendix B, Energy - Calculating in KWh. http://seacourse.dk/wiki/ tiki-index.php?page=Calculating+in+KWh,July 2014. Samso Energy Academy, Accessed November 2017.
[12] Kiravu Cheddi, Lapologang Magole, Sandra Bukkens, Anna Mandu Jeffrey, François Diaz Maurin, and Mario Giampietro. The Metabolic Patterns of Rural Villages: Botswana’s Mmokolodi Case Study. In International Renewable Energy (IREC) Conference. Gaborone, Botswana, 2016.
[13] Kiravu Cheddi, Lapologang Magole, Sandra Bukkens, Anna Mandu Jeffrey, François Diaz Maurin, and Mario Giampietro. Presentation of the University of Botswana’s New Masters in Participatory Integrated Analysis of Energy Systems (MPIES). In International Association for Technology and Energy for Development (IASTED) Conference. Gaborone, Botswana, 2016.
[14] Kiravu Cheddi, Lapologang Magole, Sandra Bukkens, Anna Mandu Jeffrey, François Diaz Maurin, and Mario Giampietro. Participatory integrated analysis of energy systems to promote energy access and energy efficiency (PARTICIPIA). In International
239

Renewable Energy (IREC) Conference.Gaborone, Botswana, 2016.
[15] Kiravu Cheddi, François Diaz-Maurin, Mario Giampietro, Alan C. Brent, Sandra G.F. Bukkens, Zivayi Chiguvare, Anna Mandu Gasennelwe-Jeffrey, Gideon Gope, Zora Kovacic, Lapologang Magole, Josephine Kaviti Musango, Ulpiano Ruiz- Rivas Hernando, Suzanne Smit, Antonio Vázquez Barquero, and Felipe Yunta Mezquita. Proposing a master’s programme on participatory integrated assessment of energy systems to promote energy access and energy efficiency in Southern Africa. International Journal of Sustainability in Higher Education, 19 (3):622–641, 2018.
[16] Louie A.H. Functional entailment and immanent causation in relational biology. Axiomathes, 18(3):289–302, 2008.
[17] Mario Giampietro and Maddalena Ripa. In: Report on Nexus Security using Quantitative Story-Tel ling MAGIC (H2020-GA 689669) Project Deliverable 4.1, chapter :The MuSIASEM toolkit for studying the sustainability of metabolic patterns of socio- ecological systems, pages 64–138. ICTA, July 2017.
[18] Modi V., S. MacDade J. Saghir, and D. Lallement. Energy and the Millennium Development Goals. New York: Energy Sec- tor Management Assistance Programme, United Nations Development Programme, UN Millennium Project, and World Bank. http://www.unmillenniumproject.org/documents/MP_ Energy_Low_Res.pdf, 2006. A world Bank Report accessed, February 2016.
[19] Odum Howard T. Self-Organization and Maximum Empower, chapter 30 in the book, Maximum Power: The Ideas and Ap- plications of H.T. Odum, edited by Charles A.S. Hall, pages 311–330. University Press of Colorado, 1995.
[20] Ramaligam Ben. Evaluation and the science of complexity. http://www.outcomemapping.ca/resource/ evaluation-and-the-science-of-complexity, May
2008. Evaluating Complexity Conference NORAD.
[21] Ramaligam Ben, Harry Jones, Toussaint Reba, and John Young. Exploring the science of complexity: Ideas and implications for development and humanitarian efforts. http://www.odi.org/sites/odi.org.uk/files/odi-assets/ publications-opinion-files/833.pdf, October 2008. ODI Working paper No. 285, Accessed April 2016.
[22] Rosen R. Life itself: a comprehensive inquiry into the nature, origin, and fabrication of life. Columbia University Press, New York, 1991.
[23] Southern African Academy of Sciences. Energy and water link- age: Challenge to a sustainable future. http://www.scj.go. jp/ja/info/kohyo/pdf/kohyo-22-s2.pdf, December 2012. Accessed May 2018.
[24] UN. Our common future. http://www.un-documents.net/ our-common-future.pdf, 2002. UN Document - Page 43, Accessed July 2015.
[25] United Nations. Sustainable Development Goals.http://www.un.org/sustainabledevelopment/ sustainable-development-goals/, September 2015. Accessed February 2016.
240
Employment Creation, a Spillover Effect of doing Research: An Auto ethnographicPerspective
Balisi Shadreck Botswana Open University
Email: [email protected]
Abstract Research and scholarly expectations have increased on institutions of higher learning across the globe as scholarly productivity has become an increasingly important priority in the academic profession. Research provides much of the foundation for knowledge that makes possible the innovations and advancements in wider society, thereby creating social, economic, cultural and environmental impacts. Research is often conducted for the sake of increasing and advancing a knowledge base, seeks to offer potential solutions to problems and it attempts to improve the intervention or solution or it may be summative and attempt to evaluate the effectiveness of the solution or program. In the process of solving societal problems and generating knowledge, research has spillover effects to the society. This paper therefore looks at employment creation as one of the spillover effects of doing research. The paper argues that research can either result in the creation of permanent or temporary jobs. The paper focuses more on temporary research employment and looks at its benefits to the temporary employees. Using an auto ethnographic approach the paper provides a narrative description of the authors lived experience considering the benefits of temporary employment in research. The paper covers achievements and success stories of the author as a result of his engagement in temporary research employment from various researches as a temporary research assistant. The author argues that engagement in temporary research employment can help cater for basic living needs such as education, accommodation, meals, transportation and clothing thereby reducing poverty and inequalities in the society. The paper further argues that although temporary research assistants’ employment is not sustainable because of its tenure, its benefits are equally important as benefits from the sustainable permanent employment created by research. The paper concludes that the focus on research for sustainable development and the utilization of research outputs for industrial development for the creation of sustainable (permanent) employment and economic growth should not overlook the contribution of research in temporary employment creation.
Key words Effects, Employment Creation, Research, Spillover
1. Introduction
Generally research is the systematic investigation/enquiry of a subject matter for the purpose of adding to the body of knowledge. Research and scholarly expectations have increased on institutions of higher learning across the globe as scholarly productivity has become an increasingly important priority in the academic profession. The research being conducted on universities and other institutions covers a range of purposes and has academic and non- academic implications. Research provides much of the foundation for knowledge that makes possible the innovations and advancements in wider society, thereby creating social, economic, cultural and environmental i m p a c t s [1]. Thus, research is conducted to generate knowledge a n d t h i s k n o w l e d g e s h o u l d b e relevant to the needs of local communities and impact lives. Research is often conducted for the sake of increasing and advancing a knowledge base, enhances understanding, offers heuristic insight, seeks to
offer potential solutions to problems and it attempts to improve the intervention, asolution or it may be summative and attempt to evaluate the effectiveness of a solution or program [1, 2, and 3]. In the event a research is being conducted, it has many spillover effects to the society. This paper looks at employment creation as one of the spillover effects of doing research. The paper argues that research can either result in the creation of permanent or temporary jobs. The paper focuses more on temporary employment and looks at its benefits to the temporary employees. Using an auto ethnographic approach the paper provides a narrative description of the authors lived experience considering the benefits of temporary employment in research. The paper covers achievements and success stories of the author as a result of his engagement in temporary research employment from various researches undertaken as a temporary research assistant.
2. Methodology Used
This is a qualitative inquiry which uses a narrative research approach. There are various
241

types of narratives which researchers can use for guiding the collection of stories. Examples of narrative approaches include a biographical study, an auto ethnographic study and an oral history [2]. This study therefore adopts an auto ethnographic approach and takes up the author (self) as the focus of inquiry. The use of auto ethnography as a qualitative inquiry technique allows researchers to contribute as story tellers and share insights into their own research and learning experiences [4, 5]. Hence in this study, the author uses ethnographic methods to critically describe and analyze his own lived experience and narrates his achievements and success stories as a result of his engagement in temporary research employment from various researches. This method has been found suitable for this study because the focus here is on the self, the personal lived experience of the author that warrants narration. As rightly observed, Rallis & Rossman [1] argued that “auto ethnography exemplifies the hybridity and flux of typologies, as this approach can be viewed as aligned with personal narrative inquiry”. Cresswell & Poth [2] emphasized that auto ethnography contain the personal story of the author as well as the larger cultural meaning for the individual’s story. The study therefore provides an auto ethnographic narrative of the author’s achievements and success stories as a result of his engagement in various researches as a temporary research assistant.
3. Temporary Research AssistantEmployment History
The author was engaged for six (6) years as a temporary research assistant by different organizations and individual researchers. The six (6) years covered a period from June 2006 to July 2012. In these six (6) years, the author was engaged as a temporary research assistant on a number of portfolios which included but not limited to a: Data Collector, Interviewer, Transcriber, Translator, Data Entry Clerk, Data Quality Control Clerk, Data Coder, Supervisor and a Consultant. The table below shows a detailed employment history of the author as a temporary research assistant.
4. Achievements and Success Stories, aPersonal Experience
This section outlines selected achievements and success stories as a result of my engagement in research as a temporary research
assistant. Although there are financial and non-financial achievements, this section looks at financial achievements and success stories relating thereto. That is, achievements and success stories as a result of monetary benefits in the form of wages, salaries and allowances obtained from temporary research assistant employment as outlined in table 1 above. The achievements and success stories are outlined in the following categories, self- sponsorship for tertiary education, accommodation, transport, groceries, remittances and clothing.
4.1 Self-Sponsorship for TertiaryEducation
This is one of my greatest achievements ever and a success story indeed. I completed my BA degree in May 2005. The BA degree was sponsored by the Botswana Government through the Ministry of Education. My intention was to enroll immediately for a master’s degree programme after completing my BA degree programme. That is, I completed my BA degree programme in May 2005 and I intended to enrol for a master’s degree programme in August 2005. This was not possible as I did not have funds to enrol for a master’s degree. It was a painful experience since some of my colleagues at degree level enrolled for a master’s degree in August 2005. Although this was the case, I was determined to make sure that I do not miss the next enrolment period which was August 2006. Securing a permanent employment as a fresh graduate was not easy at that time. Fortunately, I was employed as a temporary research assistant by the University of Botswana for a period of three (3) months from June 2006 to August 2006.I managed to save for a master’s degree tuition fees from the wages and allowances I got from this temporary employment. In August 2006 I was able to self-sponsor myself for a master’s degree programme in Public Administration (MPA) from the University of Botswana using the income I got from temporary research employment as a research assistant. The self- sponsorship catered for tuition fees, books, accommodation and meals. That was my greatest achievement ever to see myself enrolled as a self-sponsored student for a master’s degree programme. In life it is always difficult to start anything but once started opportunities may come your way. This was a two year programme and I
242
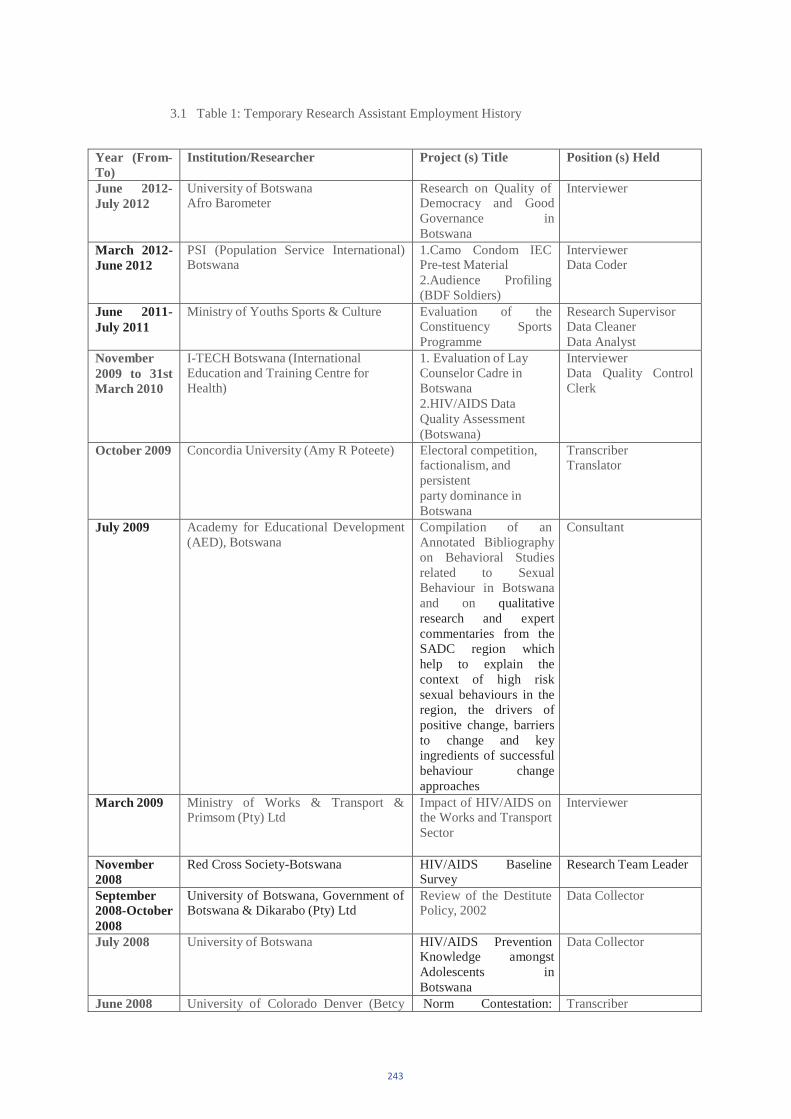
Year (From- To)
Institution/Researcher Project (s) Title Position (s) Held
June 2012-July 2012
University of BotswanaAfro Barometer
Research on Quality ofDemocracy and GoodGovernance in Botswana
Interviewer
March 2012-June 2012
PSI (Population Service International)Botswana
1.Camo Condom IECPre-test Material2.Audience Profiling(BDF Soldiers)
InterviewerData Coder
June 2011-July 2011
Ministry of Youths Sports & Culture Evaluation of theConstituency SportsProgramme
Research SupervisorData CleanerData Analyst
November2009 to 31stMarch 2010
I-TECH Botswana (InternationalEducation and Training Centre forHealth)
1. Evaluation of LayCounselor Cadre inBotswana2.HIV/AIDS Data Quality Assessment (Botswana)
InterviewerData Quality ControlClerk
October 2009 Concordia University (Amy R Poteete) Electoral competition,factionalism, and persistentparty dominance inBotswana
TranscriberTranslator
July 2009 Academy for Educational Development(AED), Botswana
Compilation of anAnnotated Bibliography on Behavioral Studies related to Sexual Behaviour in Botswana and on qualitative research and expertcommentaries from the SADC region which help to explain the context of high risk sexual behaviours in the region, the drivers of positive change, barriers to change and key ingredients of successful behaviour change approaches
Consultant
March 2009 Ministry of Works & Transport &Primsom (Pty) Ltd
Impact of HIV/AIDS onthe Works and TransportSector
Interviewer
November2008
Red Cross Society-Botswana HIV/AIDS Baseline Survey
Research Team Leader
September2008-October2008
University of Botswana, Government of Botswana & Dikarabo (Pty) Ltd
Review of the DestitutePolicy, 2002
Data Collector
July 2008 University of Botswana HIV/AIDS Prevention Knowledge amongst Adolescents in Botswana
Data Collector
June 2008 University of Colorado Denver (Betcy Norm Contestation: Transcriber
3.1 Table 1: Temporary Research Assistant Employment History
243

Jose) Non-Materialist Insights into the Violation of Armed Conflict Norms
February2007- March2007
Foodsafe International Food safety Knowledge Attitudes and Practice (KAP) Survey
Interviewer
September2007
Quest (Pty) Ltd Mobile line Providers in Botswana
Data Collector
May 2007-August 2007
University of Botswana Trade Union Rights in Botswana
Interviewer
June 2006-August 2006
University of Botswana Public Administration Training in Botswana: The Case of District Commissioners and District Officers
Interviewer
Source: [6]
managed to pay for myself for the first academic year which ended in May 2007. I then received good news that the University of Botswana (UB) Foundation will sponsor me for the remaining period of my studies, which was a sponsorship for the remaining year. The UB foundation sponsored me because I was one of the best students in the Faculty of Social Sciences considering the performance of all masters’ students in their first year.
4.2 Accommodation
As a self-sponsored student I had to pay for my accommodation as well. I managed to secure accommodation on campus because the fees were affordable as compared to leased private housing in the city. The UB Foundation took over sponsorship for the second year and I was able to divert money obtained from temporary research employment for something else. My parents had built a seven roomed house at home and I had to assist them financially to complete the house. I took over the responsibility of floor tiling the house and managed to complete the project. The house was built a long time back the time I was doing my first degree.
4.3 Transport
I was engaged in many research projects as indicated in table 1 above. Some projects had very attractive salaries and allowances while other projects were average in terms of wages and allowances. One of my success stories in this regard is that I also managed to save for an affordable car. I bought a second hand car from the market and I was able to relieve myself from the inconveniences of using public transport. This was one of my biggest
achievements in that era.
4.4 Groceries and Clothing
I was able to fend for myself in terms of basic food items needed for survival during my master’s degree study period. The UB Foundation Scholarship did not provide for meal allowances. The money received from several temporary research assistant jobs was sufficient to cater for my groceries and clothing needs.
4.5 Remittances
After completing my MPA degree from the University of Botswana I was able to assist my parents back home to cater for their different basic needs such as paying for utility bills, buying food groceries, catering for transport needs and other basic needs for survival. In our culture it is good practice to give your parents money whether they are in need of cash or not and I was very delighted to find myself exercising this as well as helping my parents were I can.
5. Discussion
Research done by institutions and individual researchers can contribute to employment creation. Research can results in sustainable employment in the event that research outputs are utilized for industrial development. Researches which have an employment creation component are the ones that contribute to economic growth through conversion of research results into products and services that support commercialization and industrialization as critical catalysts to economic growth. Research and Development has long been considered an important source

of knowledge and productivity improvement. Research and Development not only affects the productivity of the firm that conducts Research and Development, but may also, through spillover effects, increase the productivity of other firms by creating new or upgrading existing products and production processes [7]. That will also lead to employment creation as spillover effects of research and innovation. Equally important to note is employment creation in the process of carrying out the research itself. That is, conducting research involves a lot of activities that requires research assistants. In many cases research employs data collectors, enumerators, interviewers, transcribers, coders, data entry clerks, data quality control clerks, supervisors, consultants and translators as temporary research assistants. Therefore, this paper argues that employment creation is one of the major important spillover effects of doing research and that research can lead to the creation of either permanent or temporary jobs. This paper further argues that although temporary research assistants’ employment is not sustainable because of its tenure, its benefits are equally important as benefits from the sustainable permanent employment created by research. The argument here is that temporary research assistants’ employment can lead to beneficiaries investing in sustainable projects, products and services. For instance, my investment in education as illustrated above is more sustainable than the temporary research employment which gave me the opportunity to invest in the sustainable. Although this paper provides a narrative of my achievements and success stories it does also take into account the fact that there might be someone out there or many other research assistants out there who have achieved more than I have achieved and who have more success stories to share as a result of their engagement as temporary research assistants. Considering the Maslow’s hierarchy of needs [8], I can say temporary employment in research helped me to meet some of the lower order needs (physiological needs) and some of the higher order needs (affiliation needs and esteem needs). Therefore, temporary research employment can help reduce poverty, inequality and help individuals to become independent in terms of providing for themselves. This paper therefore argues that the focus on research for sustainable development and the utilization of research outputs for industrial development for the creation of sustainable (permanent) employment and economic growth should not
overlook the contribution of research in temporary employment creation. That is, research should be used to create employment rather than researchers using temporary research assistants to achieve their goals and overlooking their contribution to research. Reliable research inputs (information) relies a lot on the research assistants so is the development of the country due to the research outputs. As long as research exists, temporary research assistants’ jobs will always exist, that translates to making the temporary research assistants jobs sustainable.
6. Conclusion
Using auto ethnographic approach, this study has looked at the contribution of research in employment creation. The study provides a narration of achievements and success stories of the author as a result of his engagement in temporary research employment as a research assistant by different researchers. The author argues that engagement in temporary research employment can help cater for basic living needs such as education, accommodation, meals, transportation and clothing thereby reducing poverty and inequalities in the society. The author has highlighted self- sponsorship for a master’s degree programme as one of his major achievements and success stories as a result of financial benefits of being a temporary research assistant. The author emphasized that although research assistants jobs are temporary in nature (not sustainable), they can help individuals to invest in the sustainable. The emphasis of the paper is on temporary research employment as spillover effects of doing research. The paper argues that employment creation is one of the major important spillover effects of doing research and that research can lead to the creation of either permanent or temporary jobs. The paper further argues that although temporary research assistants’ employment is not sustainable because of its temporary nature, its benefits are equally important as benefits from the sustainable permanent employment created by research. This paper therefore argues that the focus on research for sustainable development and the utilization of research outputs for industrial development for the creation of sustainable (permanent) employment and economic growth should not overlook the contribution of research in temporary employment creation. That is, research should be used to create employment rather than researchers using temporary research assistants to achieve their goals and overlooking their contribution to research. The study concludes
245
by arguing that as long as research exists, temporary research assistants’ jobs will always exist, and that will make the unsustainable temporary research assistant jobs “sustainable”.
References
[1] Rossman B.G. and Rallis F.S. An Introduction to Qualitative Research, Learning in the Field, Fourth Edition. SAGE. London, 2017.
[2] Cresswell J.W. and Poth C.N. Qualitative Inquiry and Research Design Choosing among Five Approaches, fourth Edition. SAGE. London, 2018.
[3] Cresswell J.W. and Cresswell D.J. Research Design, Qualitative, Quantitative & Mixed Methods Approaches, Fifth Edition. SAGE. London, 2018
[4] Adams T.E., Holman-Jones S. and Ellis C. Autoethnography. Oxford University Press. UK, 2014.
[5] Chang H. Autoethnography in Health Research-Growing Pains? Qualitative Health Research, vol 24(4), pp.443-451, 2010.
[6] Balisi S. Carriculum Vitae, 2018, Gaborone, Botswana.
[7] Bhattacharya M., Chen R.J. and Pradeep V. Spillover Effects of Research and Development, Exports and Foreign Investment on Productivity: Empirical Evidence from Indian Manufacturing. Journal of South Asian Development, vol 12(1), pp.18–41, 2017.
[8] Brevis T., Cronje J.G.J., Smit P.J. and Vrba M.J. Management Principles, A Contemporary Edition for Africa, Fourth Edition. JUTA. Cape Town, 2008
246
Are there environmental problems or just social problems: Experiences of Botswana horticultural farmers with climate change, environmental education and
transformative learning.
Ntseane, P.G. and Tladi-Sekgwama, F.M.
Department of Adult Education, University of Botswana
Abstract
The environmental factor is becoming increasingly important and can hardly be ignored in education, research and transformative learning perspectives critical for raising both environmental awareness and promoting positive environmental action. This paper argues that environmental education and research cannot continue to be purely scientific and technology oriented but should also address environmental social issues. In fact, locating environmental problems within the social context of people’s daily lives and actions is important and this requires research that embraces the roles of indigenousknowledge and transformative learning. Findings from a pilot qualitative study on “Climate change and experiences ofBotswana Horticultural famers in Gaborone” are used to demonstrate that environmental problems are mostly social problems. Therefore, addressing the impact of climate change on both the environment and the agricultural produce requires both indigenous and modern (scientific) environmental education. In conclusion, the paper argues that environmental education and research has the potential to bring about transformative learning and action at individual, community and governmental levels.
Key words:Climate change, environmental education, indigenous climate knowledgesystems, transformative learning.
1. Background
If the term “climate” is described as the average weather over a period of time, “climate change” is therefore, a significant change in the measures of the climate such astemperature, rainfall or wind [1]. According to the literature [2, 3, 4], the Earth’s climate has changed many times with events ranging from ice ages to long periods of warms. What is different is that about these periods is that human activities are significantly contributing to natural climate change through our emissions of greenhouse gases. It has observed that these extreme climatic changes result in increased air and ocean temperatures, drought, melting ice and snow, rising sea levels, increasing rainfall, flooding and other influences that about these periods isthat human activities are significantlycontributing to natural climate change through our emissions
of greenhouse gases. It has observed that these extreme climatic changes result in increased air and ocean temperatures, drought, melting ice and snow, rising sea levels, increasing rainfall, flooding and other influences. Overall, impacts of climate change in Southern Africa included extreme heat, floods, drought years (i.e. no water) thesechanges have had strains on food security,production levels. For example, extreme weather disasters have affected wildlife,livestock, arable production fishing and bee keeping. On the other hand, mitigation actions tended to focus on education, knowledge and training; whatclimate change and possible impacts as well as possible adaptation efforts are; water resourcemanagement; disaster management e.g. floods, droughts, storms, as well as food security and land [2].
247
In spite of the growing scientific evidenceabout the risks of climate change, especially,global warming effects, research frequentlyportrays the subject as one of scientific debates. In fact, very little attention is given to the public’s subjective assessment of the risks of global warming and climate change.We would argue that the public, especiallyfarmers are not perceived as informed about climate change or their role in affecting and/or contributing to climate change has not been sufficiently been examined. No wonder the results of a survey by Kellstedt, Zahram and Verdilitz [5] showed that respondents of the study said, they “feel less personallyresponsible or concerned about globalwarming.” As these researchers rightlyobserved, a result like this tells a lot about the interaction between scientists and the publicon issues of climate change. This raises several questions that include, “does this mean the general public has a lot of confidence on scientists in dealing with global warming or this could be a form of resistance? We would argue that this imbalance has to be addressed because the public has knowledge and experiences with climate change events, vulnerability, impact and mitigation of climate change. Even if it is indigenous and not scientific knowledge it is important that research document and understand other perspectives on climate change and sustainable development. Existing information tends to focus on environmental knowledge, attitudesand processes rather than educationalexperiences, preferences and outcomes. Wewould argue that expanding environmental research has to benefit from diverseenvironmental knowledge contexts and allstakeholders. This will ensure that indigenous environmental knowledge systems are not overlooked. We believe that it is the responsibility of ‘Adult environmental education’ to disseminate knowledge about the environment’s direct and indirect physical and related social impact. Limited research [6] on the social dimension of climate change hasconsistently shown that much of environmental education and research is stillpurely science and technology oriented,
rather than addressing social issues in an integrated way. In fact, UNDCCC-Article 1 of 2007 confirmed that there were limited discussions on the social dimensions of climate change in Africa. This is unfortunate because, although climate change can result from natural processes such as volcanos, change in Ocean currents and changes in the sun’s rays, more recently, climate change is mostly associated with human activities and examples include emissions through land use changes such as deforestation, urbanization and desertification. Although, the impacts also affect human beings and these include constrained agricultural production, increased water stress, current conservation education is biased to basic resources and very little on community environment and its associated problems. Webelieve that while environmental problems are legitimate concerns for the relevantgovernments departments, however, the responsibility for their solutions rests largely with citizens. We observe that in the era of climate change there are no environmental problems but rather many and complex social problems. In particular challenges of food security have provided enough lessons for transformative learning.
2. Environmental education andTransformative learning
According to a working definition provided in by UNEP/UNESCO/OECD [7] at a conferenceheld in Paris, environmental education is a“permanent process in which individuals gainawareness of their environment and acquire the knowledge, values, skills, experiences, and also the determination which will enable them to actindividually and collectively to solve present and future environmental problems aswell as to meet their needs without compromising those of future generations.”[7]. With the intertwined relationship between changes in the physical environment, social and political problems, environmental education can only assume an important social function.
248

As the definition alludes, current emphasis of environmental education should go beyond creating awareness and providing skills to creating a sense of commitment and stimulating individual and collective action. This has implication for transformative learning.
Transformative Learning Theory c a n b e d e s c r i b e d as being “a constructivist, an orientation which holds that the way the learners interpret and re-interpret their sense of experience is centered to make meaning and hence learning. We think this is appropriate for understanding and climate issues as well ascoming up with appropriate solutions to the impact and/or mitigation efforts. All stakeholders in our opinion have to create time to understand and learn from each other if collectively they are to commit to strategies for dealing with climate changes in their respective localities. That is, environmental scientist, indigenous climate guru’s, farmers, and educators have to collaborate especially in research and dissemination of relevant information. Transformative learning “isabout change, dramatic and fundamental change in the way we see ourselves and the World in which we live”. Through transformative learning human being have to change their perception of seeing themselves as only vulnerable to the impact of climate change but should more importantly be aware of their actions on the environment and commitment to support that will change how they use and manage the natural resources. As said earlier, the public cannot continue to see climate change as the responsibility of someone else but them.
A focus on environmental education that tends to be purely science and technology oriented, rather than addressing both environmental and social issues in an integrated way has to be re-examined if impacts of climate change are to beaddressed collectively by all stakeholders. In support of our suggestion for a transformative learning perspective, the literature [7] has identified some of the major challenges of environmental adult education as the need tochange the widespread belief that what happens
to the environment is not caused by people’s own actions, thus can be addressed bysomeone else, probably environmental experts and governments. We agree that research and environmental education in Africa hasconsistently undermined indigenous knowledge systems, including those related to food production and sustainable environments. Impacts and lessons from most recent harsh climate change experiences call for collaboration efforts between environmentalist,researchers and adult educators if effective sustainable development is to be achieved. The next section presents the Botswana’sexperience with climate change.
3. Botswana and Climate Change an overview
Botswana like many countries of the globe hasnot been spared by climate change. The literature [8, 9] defines climate change or global warming as the rise in average surfacetemperatures on Earth and it is mostly due tothe burning of fossil fuels such as oil and coal.The changes associated with climate changes for Botswana include longer drought episodes,changes in rainfall patterns, out breaks of crop diseases. Although droughts have been more common than floods, the North East has had relatively more severe rain events. Flood impacts have affected road design standards such as bridges and culverts. According to [8], Botswana was expected to experiencetemperature rise from .05 to 2,0 Celsius by 2015; a decline in river flow of 13%. On the other hand the impact of this climate changes was to decrease crop production by30% for the main crops maize and sorghum.
Efforts to address the impacts of climate are mainstreamed and focus on helping people to adapt to drought episodes which have beendescribed as cyclical include the following, identified by the Sunday Standard Newspaper (published Monday 3/9/2018):
a) Reducing vulnerability byemphasizing support on availability of water, health and
249
Agriculture (crop and livestock) b) Developed a National Adaptation
Plan (NAP) which highlights priorityareas such as “climate – SmartAgriculture”
c) The Government has set a target of 15% greenhouse gases emission reduction by 2030.
d) The country is guided and informed bydocuments the following; the Second National Communication to the United Nations Framework Convention onClimate Change (UNCCC); Sustainable Land Management; as well as the National Water Master Plan.
Furthermore, regulations have been developed for environmental assessment including those of drinking water quality and biogases.Botswana has also started building capacity for the implementation of UN FrameworkConvention for climate change (UNFCCC) as well as capacity for climate change modelling and understanding under the SADC Umbrella. Finally, there is the development of ecotourism.
It is important to acknowledge the positive effort from the government of Botswana and the relevant department expertise who areworking timelessly to understand, plan and execute these positive mitigation strategies and programmes. However, as educators we had tosituate the role education and training in the era of climate change impacts and sustainable development. A closer examination of the literature on environmental education identifiedgaps that in our opinion needs still needresearch and appropriate information andeducation. First, as said earlier currentconservation education is focuses on basic resources and very little on community environment and its associated social problems. Second, few programmes on conservation focus on the role of the citizen in working both individually and collectively towards the solutions of climate change problems that affect people’s well-being. We would advocate for an educationalapproach that will effectively educate everybody (i.e. children, men, women, leaders,
politicians, etc.) about human being relationship with the environment in its totality. We concur with Zelezny [10] that educational interventions of climate change should be those that improve environmental behavior. Informed by the transformative learning theory, we believe that extended programmes are more likely to lead to change of attitudes critical for behavioral change.
Informed by missing link betweenenvironmental education and climate changeissues, the next section presents the findings of a pilot study done by the authors on “Experiences of Horticultural farmers on climate change in Botswana: Is there room fortransformative learning”.
4. Pilot Study Research Objectives
Results presented in this section are based on the analysis of data from a pilot studyconducted in Gaborone Region. The specific objectives were to:
a) Assess the knowledge about environmental and climate change of horticultural farmers.
b) Identify the climate change conditions that usually affect horticulturalproduction in Gaborone Region.
c) Determine impacts of climate change conditions on participant horticulturalprojects.
d) Identify the lessons from the experiencesof the resent environmental climate change conditions.
e) Solicit ideas on how to deal with challenges of climate change on horticultural project in the future.
5. Data Collection and Methods
The pilot study comprised 10 purposelyselected farmers with horticultural enterprises infields along Notwane River, around Gaborone, Glen Valley, Oodi, Morwa, and Mochudi (inMapole area). These are farms depending on
250
effluent water deposited after treatment at the Gaborone waste water treatment plant intoNotwane River for agricultural use. Semi- structured interviews were conducted to assess the knowledge farmers had about climate change, challenges, and measures taken tominimize damage of horticultural crops by climate change conditions. Interviewschedules were used to insure all questions are covered and provide a guided flow of answers.
6. Findings of the Pilot Study on the
experiences of Horticultural Farmers
6.1Farmer Biographic Data
Respondents were mostly men (60%) and women (40%). The age of respondents rangedfrom 31 to 35 years (50%), 36 to 40 years (10%) and over 45years (30%) with horticultural project sizes of one to two hectares (40%), two hectares (20%) and more than five hectares (40%) hectares and employed labour of three (60%), and four to eight (40%). Six respondents rented the land and therefore owned the horticultural farming enterprise, while four (40%) were employed asfarm managers and ran the farm business on behalf of the owners. The education levelrange was secondary school education (70%) to tertiary (30%) (certificate and diploma qualification). Crops on the farms were beetroot, cabbage, water melons, butternuts, green maize,lettuce, green pepper, spinach, rape, cauliflower, broccoli, sweet corn, onions and tomatoes. Most farms produced spinach and rape with a frequency of 70 % and 60% respectively.
6.2 Challenge Faced by Horticultural Farmers
Challenges farmers had were pests, market, transport for produce and heat/high temperatures, cold temperatures (cold morningsand hot days), flooding, hail storm and the climate change conditions affecting the crops were heat and excessively high and cold, low temperatures. Lack of Market was the most mentioned general challenge (70%) while temperature changes due to heatwave (80%)
and cold fronts (60%) were the most frequently mentioned climate change related challenges. The conditions led to cold or hot soiltemperatures, delayed or uneven germination, stunted crop growth, late harvest, affecting production levels, supply and market. Some farmers were not able to do anything to protectcrops against adverse climate change conditions while others provided shading (nets), tunnels, and cultural measures such as more watering when it is to hot, burning tyres around tomato beds to warm the soil when cold and ridging orplanting on ridges to improve drainage and avoid flooding.
6.3 Farmer Environmental and Climate Change Knowledge
Farmers associated climate change with unpredictable weather conditions, strangeweather at the wrong time, heat, or unusualhigh temperatures, cold temperatures, prolonged summers and winters. The farmerscame to know about climate change and conditions mainly through, the media (70%) weather reports on radio, internet, television (90%), experience “as the weather happened”,one farmer responded. Other knowledge is from observation, comparing planting schedules over time. Farmers drew mainly from their experience (90% frequency) to develop methods for protecting their crops against adverse climate change conditions. One farmer reported that to protect crops from high temperatures she over watered the plants, “when it is too hot, too much watering will cool the soil and plants’, she said. When askedabout how he mitigated against floods, another farmer said he used “common sense”. Hemoved the crops away from the flooded area.Knowledge about protection measures against climate change conditions was also gained through discussion with others (40% frequency), learning from others ((30%), social media (10%), agrishops (10%), and farmers union (10%).
6.4 Lessons from the Resent Environment and Climate Change Conditions around Gaborone
Several lessons were reported by farmers. This included: the fact that even with over watering
251
high temperatures affected crops when they are still growing but also reduced the shelf life;that with cold temperatures, delayed plantingfor crops like tomatoes, green pepper, cabbage helps protect them against lower temperaturesand frost; to always listen to the weather reports and plan planting accordingly; delayedplanting is not necessarily a good remedy as it leads to late harvest and therefore late arrival on the market; delayed planting for crops such as cabbage gets a good crop to the market but does not increase the shelf life; early harvesting for crops such astomato helps escape frost but leave the farm not fully ripe. This becomes a market issue as the product will not attractcustomers and by the time the tomatoes ripen, the shelf life has shortened; not being nearer to the water source does not always workout as this makes crops prone to flooding; the need to have shades, nets to protect crops from heat. Farmers suggested subsidies to buy frost covers, shades, nets, seeds, and chemicals especially after floods and heatwave.
6. Conclusions and Implications forSustainable Environments
It has been demonstrated in this paper that both Horticulture crops and climate change conditions vary. The results of the pilot study done in an urban area, namely, Gaborone attest to the fact that in both urban and rural communities of Botswana, people have daily and direct contact with basic natural resources including their immediate environment. Thus research in Botswana should strengthen the social dimension of environment and climate change if we are to understand the sources of environmental problems and to find lasting solutions. As argued in this paper, we believe that causes and impacts of climate change are more social than environmental.
Due to climate changes in Botswana horticultural farmers have knowledge and experience including both loses and/or profitson their harvest, especially due to heatwaves or lack of rainfall. Thus, environmental education should go beyond creating understanding and awareness, to developing skills, creating a sense of commitment and stimulating individual and collective action at individual, community and government levels.
7. Implications for SustainableEnvironments
Since climate change is not a new phenomenon, all people and especially farmers haveknowledge (both indigenous and modern)about their experiences with climate change. This has to be tapped and assessed through research and where possible be properly packaged and be used for adaptation and mitigation purposes. We agree that responsible environmental behaviour must begin with early childhood. This is a period that has been ignored by environmental education research. If raising awareness and promoting environmentally supportive action is becoming increasingly important, then environmental education should have a social function. Adult education is better placed to deal with environmental social issues because it is multi-disciplinary education for the most production, experienced and progressive sector of the population such as farmers. Furthermore, adult environmental education has to be supported as it is also important for disseminating knowledge and relevant information about both direct and indirect physical and social impacts of climate change. As one of the Adult Education Scholars, namely, Paulo Freire observes in his motto, “reading the word to reading the world”,collaborative research and education have to help people to explore the social, political and
252

physical environments for transformative learning and action.
References
[1] Werndl, C. On defining climate and climate change. The British Journal for the Philosophy of Science, Vol (2), pp.337-364.
[2] Wlokas, H.L. The impacts of climate change on food security and health in Southern Africa. Journal of Energy in Southern Africa. Vol 19(4): pp12-21, 2008
[3] Boko M.I, Niang, A., Nyong C. Vogel A, Githeko M., Medany B, Osman-Elasha R, Tabo and Yanda P. Africa climate change: impacts, adaptation and vulnerability-Contribution of working Group II to the fourth assessment report of the intergovernmental panel on climate change. Pp 433-467, 2007.
[4] Parry M.C, Canziani O.F., Palutikof J.P, Van de Linden P.J and Hansson C.E> (Eds). Climate change: Impacts, adaptation and vulnerability. IPCC Third Assessment Report summary for policymakers. Geneva:Intergovernmental Panel on Climate Change Cambridge: Cambridge UniversityPress, 2001.
[5] Kellstedt P. M., Zahram, S. and Vertitz, A. Personal efficacy, the information environment an attitudes towards global warming and climate change in the USA,2008. http://goi.org/10.1111/j.1539-
6924.01010. x
[6] Stapp, W.B. The concept of environmental education, 2014.http://doi.org/10.1080/00139254.196
8-10801479
[7] UNESCO. “Theme6-Adult environmental education: Awareness and environmental action”. A series of 29, 1997
[8] Government of Botswana and UNDP. Botswana Technological needs assessment on climate change. Gaborone: Department of Metorological Services, 2004.
[9] Government of Botswana. Botswana initial national communication to the UnitedNations Framework Convention on climate change. Gaborone: Ministry of Works, Transport and Communication, 2001
[10] Zelezny, L.C. (). Educational interventions that improve environmental behavior. Journal of Environmental Education, Vol 31(1) pp5-14, 1999. Taylor and Francis Online, (Google Scholar).
253
Facilitating Research through REDCap® at the University of Botswana
Kagiso Ndlovua, Nkwebi Motlogelwaa, Audrey Masizanaa, Tebo Leburu-Dingaloa, Tomas Andersenb , Roseyln Matlob
aDepartment of Computer Science, University of Botswana, Gaborone. BotswanabPerelman School of Medicine, University of Pennsylvania,
USA
Email: [email protected]
Abstract Postgraduate researchers at the University of Botswana (UB) struggled to engage in secure data-intensive health research and quality operational projects due to limited access to secure, safe, user-friendly survey and database management tools. This problem was exacerbated by the fact that the Ministry of Health and Wellness (MoHW) does not allow for sensitive health information to be stored and managed externally in non-secure systems. One novel tool for collecting, storing, and managing health data for research and operational projects is Research Electronic Data Capture (REDCap®). In September 2016, the eHealth Research unit at the UB Computer ScienceDepartment set up the first REDCap® instance in Botswana and sensitized UB faculty and students and non-UB researchers through University-wide REDCap® workshops and training for first-time users of REDCap®. To assess the impact of this intervention, program administers considered such outcome measures as the number of users, total projects, complex projects (>50 items), active projects, projects in production, and the number of downtimes. As at September 1, 2018, the UB REDCap instance has 220 unique users and 87 projects. Of the 87 unique registered projects, there are 56 research projects (basic, clinical, translational, behavioral, epidemiology), 8 operational support projects, 22 quality improvement projects, and 1 Other ject. Total number of records is 3,515 from the 325 survey response to date. Further classification of the research projects is shown in Table 1. Overall, 23 projects are in production mode, meaning they are finalised and collecting real data and 64 are in development mode, meaning they are not yet final and still working with dummy data. 35 projects had more than 50 items. There are 26 users utilizing the mobile application for a total of 10 mobile application projects. Since January 2018, the REDCap® server has had one instance of downtime. Overall, the introduction of REDCap® combined with educational initiatives has spurred growth in the number of local faculty, staff, and students collecting electronic data for research or quality improvement. Nonetheless, user feedback indicates the need for further training to improve the rigor of electronic data management.
Keywords Botswana, REDCap, Research, University of Botswana
1. Introduction Data is a vital component in any field of study. Integrity and accuracy of the data is crucial to any research and is dependent on the available efficient storage and management approaches. A notable approach in this regard is the application of ICT technologies especially faced with the increased complexity and abundance of today s big data. This has proved a challenge for many researchers in resource-constrained regions due to lack of infrastructure and policies to support such implementation. At the University of Botswana (UB), postgraduate researchers in the medical field have struggled to engage in secure data-intensive health research and quality operational projects due to limited access to secure, safe, user-friendly survey and database management tools. This problem was exacerbated by the fact that there are no standards or
policies to govern the use of such tools, a consequence being the Ministry of Health and Wellness (MoHW) not allowing for sensitive health related data to be stored and managed externally in systems it deemed to be non-secure. This not only affects the university sability to produce notable scholars and researchers but also negatively affects the country s ability to harness its human resource and data in addressing the challenges faced by the community. The field of open source present potential to alleviate these challenges especially lack of resources, through the provision of cost-effective, secure and user friendly data management solutions. REDCAP (Research Electronic Data Capture) is an example of such technology which has been widely used around the world [9];[2]. REDCAP is a data management system that allows the electronic capture and management of data to be captured both locally and remotely. The data is stored in a centralized repository allowing for secure and collaborative access. Through an implementation of web enabled interfaces, researchers from various fields are able to
254
capture, access and analyse their data from anywhere in the world. In addition the relatively easy to use graphical user interfaces mean even users with less technical knowledge are able to use the system. Other key benefits of the system include the ability to import and export data from and to other systems such as Microsoft Excel, PDF, SAS, Stata, R, or SPSS for further analysis. REDCAP can also be enhanced to perform other tasks through integration with other tools utilizing Open API (Application Programming Interface) to link with external applications remotely in a programmatic or automated fashion. Moreover, REDCap mobile enables secure data capture even where there is no connectivity [2] The purpose of this paper is to describe the implementation of REDCap at the Department of Computer Science, University of Botswana. Through a description of the system we attempt to illustrate the potential benefits to resource-restrained researchers seeking a secure, easy to use and cost-effective solution to support research activities.
In section 2 we discuss related work, section 3 describes the adopted approach, while section 4 presents the results, followed by discussion in section 5 and a conclusion as section 6.
2 . Related work
According to [9] the REDCAP projec ..was developed to provide scientific research teams intuitive and reusable tools for collecting, storing and disseminating project-specific clinical and translational research dat Key to the project was the inclusion of components essential in research projects such as interdepartmental collaborative and secure access to data, mechanisms for ensuring data quality, centralized storage and backup, interfaces with other packages for data exchange as well as the ability to collect data across a wide array of scientific disciplines [9]. A study by [5], utilized simple rules to automate the process of extracting data from REDCap, transforming it, and loading it into a relational or other database for analysis and reporting. REDCap offered a faster, easier, reliable way for clinicians to transform data for analysis instead of repetitively exporting and reorganizing data [5].
Hamadani et.al (2018), eliminated data chaos in their study through use of REDCap branching logic and piping feature to guide project workflow. Their use of quality control reports and custom dashboards insured data integrity and identification of sources of data chaos [7].
Neuhaus [4], utilized an external module, REDCap Admin Dashboard, to provide a sortable table view of
various reports on REDCap metadata including users, projects etc. Neuhaus, added custom SELECT sequential query language (SQL) queries for complex content filtering, special formatting, and data export options [4].
In a study conducted at the BC Children's Hospital Research Data Management, [6] implemented a clinical REDCap infrastructure (Database & Web servers) that is not exposable to external networks while retaining the functionality to send surveys worldwide. Personal health information is stored in a dedicated clinical REDCap platform only accessible to clinicians within the hospital network. A separate REDCap survey platform in the demilitarized zone (DMZ) is used to generate and send the survey links as well as receive survey data back from respondents. All data from the survey platform is passed through the firewall to the clinical platform according to programmed rules and triggers with secure socket layer (SSL) encryption using the Data Integrity Trigger (DET) - Application Program Interface (API) feature of REDCap. The team insured all data is scrubbed from the survey platform immediately upon transmission to the clinical platform. Their implementation retains REDCap survey functionalities, including survey invitations, survey reminders, and survey queue. [6].
In their study, [3] utilized REDCap to share patient information, across a 5 county region, view patients with an ordered list by follow up date and time, view all patient data in an easy to read format through custom plugin development. The ability to communicate across countries and with other organizations improved patient care and outcomes [3].
[10] utilize REDCAP to develop an audit tool with a built-in database to assess if more than one expert in the evaluation of cases of antimicrobial treatment is required. By collecting data from patients treated with systemic antimicrobials and engaging experts to evaluate the treatment related flow charts, the authors explore the development of a system that allows for individual evaluation as well as measure the level of agreement among the experts to answer their question.
A study by Cochran et.al (2018), utilized REDCAP to collect data from patients who underwent a pancreaticoduodenectomy. The data was used to generate prediction models for use by clinicians in determining postoperative outcomes based on variables such as demographics, physical status and family history.
255
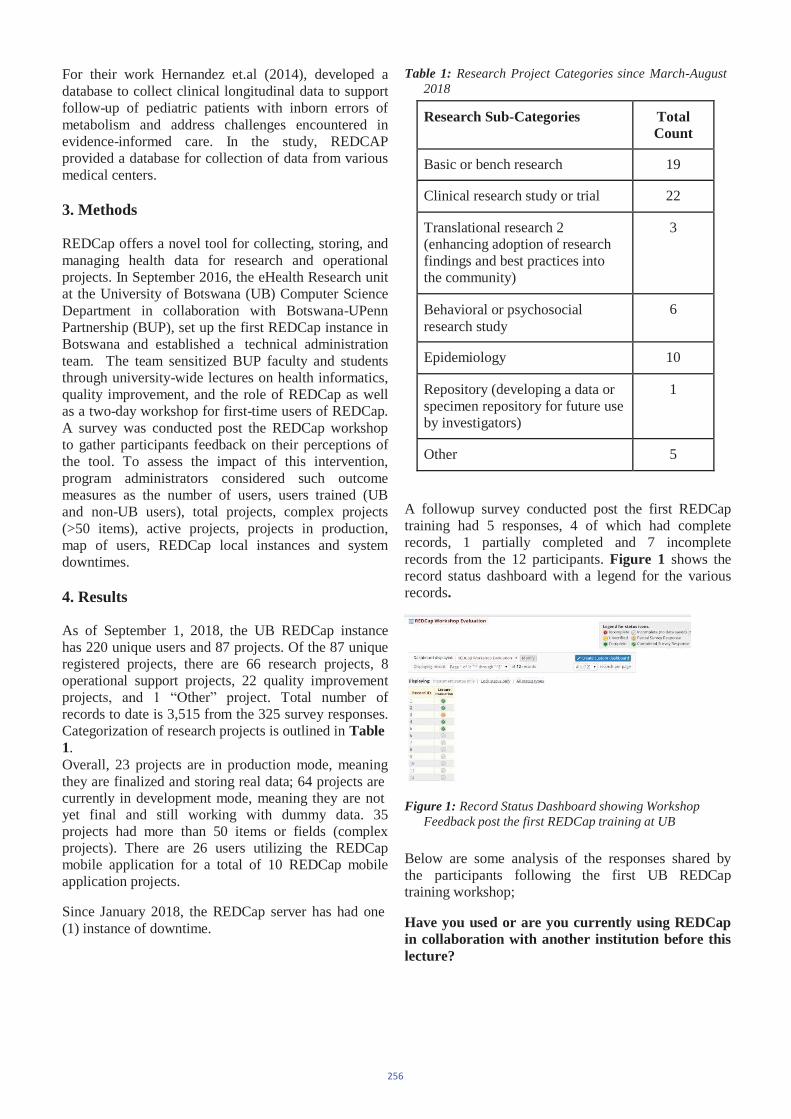
For their work Hernandez et.al (2014), developed a database to collect clinical longitudinal data to support follow-up of pediatric patients with inborn errors of metabolism and address challenges encountered in evidence-informed care. In the study, REDCAP provided a database for collection of data from various medical centers.
3. Methods
REDCap offers a novel tool for collecting, storing, and managing health data for research and operational projects. In September 2016, the eHealth Research unit at the University of Botswana (UB) Computer Science Department in collaboration with Botswana-UPenn Partnership (BUP), set up the first REDCap instance in Botswana and established a technical administration team. The team sensitized BUP faculty and students through university-wide lectures on health informatics, quality improvement, and the role of REDCap as well as a two-day workshop for first-time users of REDCap. A survey was conducted post the REDCap workshop to gather participants feedback on their perceptions of the tool. To assess the impact of this intervention, program administrators considered such outcome measures as the number of users, users trained (UB and non-UB users), total projects, complex projects (>50 items), active projects, projects in production, map of users, REDCap local instances and system downtimes.
4. Results
As of September 1, 2018, the UB REDCap instance has 220 unique users and 87 projects. Of the 87 unique registered projects, there are 66 research projects, 8 operational support projects, 22 quality improvement project ther roject. Total number of records to date is 3,515 from the 325 survey responses. Categorization of research projects is outlined in Table1.Overall, 23 projects are in production mode, meaning they are finalized and storing real data; 64 projects are currently in development mode, meaning they are not yet final and still working with dummy data. 35 projects had more than 50 items or fields (complex projects). There are 26 users utilizing the REDCap mobile application for a total of 10 REDCap mobile application projects.
Since January 2018, the REDCap server has had one (1) instance of downtime.
Table 1: Research Project Categories since March-August2018
Research Sub-Categories TotalCount
Basic or bench research 19
Clinical research study or trial 22
Translational research 2 (enhancing adoption of researchfindings and best practices intothe community)
3
Behavioral or psychosocial research study
6
Epidemiology 10
Repository (developing a data or specimen repository for future use by investigators)
1
Other 5
A followup survey conducted post the first REDCap training had 5 responses, 4 of which had complete records, 1 partially completed and 7 incomplete records from the 12 participants. Figure 1 shows the record status dashboard with a legend for the various records.
Figure 1: Record Status Dashboard showing WorkshopFeedback post the first REDCap training at UB
Below are some analysis of the responses shared by the participants following the first UB REDCap training workshop;
Have you used or are you currently using REDCap in collaboration with another institution before this lecture?
256
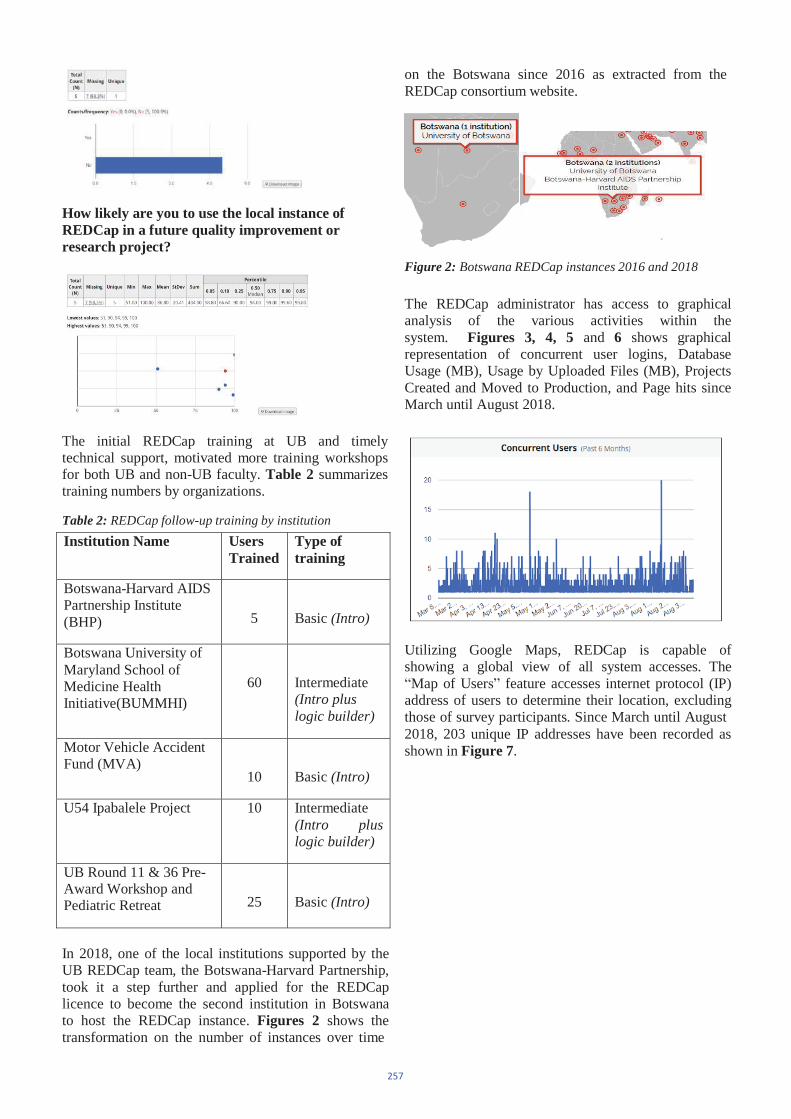
Institution Name UsersTrained
Type oftraining
Botswana-Harvard AIDS Partnership Institute (BHP) 5 Basic (Intro)
Botswana University of Maryland School of Medicine Health Initiative(BUMMHI)
60 Intermediate(Intro plus logic builder)
Motor Vehicle Accident Fund (MVA)
10 Basic (Intro)
U54 Ipabalele Project 10 Intermediate (Intro pluslogic builder)
UB Round 11 & 36 Pre- Award Workshop andPediatric Retreat 25 Basic (Intro)
How likely are you to use the local instance of REDCap in a future quality improvement or research project?
The initial REDCap training at UB and timely technical support, motivated more training workshops for both UB and non-UB faculty. Table 2 summarizes training numbers by organizations.
Table 2: REDCap follow-up training by institution
on the Botswana since 2016 as extracted from the REDCap consortium website.
Figure 2: Botswana REDCap instances 2016 and 2018
The REDCap administrator has access to graphical analysis of the various activities within the system. Figures 3, 4, 5 and 6 shows graphical representation of concurrent user logins, Database Usage (MB), Usage by Uploaded Files (MB), Projects Created and Moved to Production, and Page hits since March until August 2018.
Utilizing Google Maps, REDCap is capable of showing a global view of all system accesses. The Map of User feature accesses internet protocol (IP)
address of users to determine their location, excluding those of survey participants. Since March until August 2018, 203 unique IP addresses have been recorded as shown in Figure 7.
In 2018, one of the local institutions supported by the UB REDCap team, the Botswana-Harvard Partnership, took it a step further and applied for the REDCap licence to become the second institution in Botswana to host the REDCap instance. Figures 2 shows the transformation on the number of instances over time
257
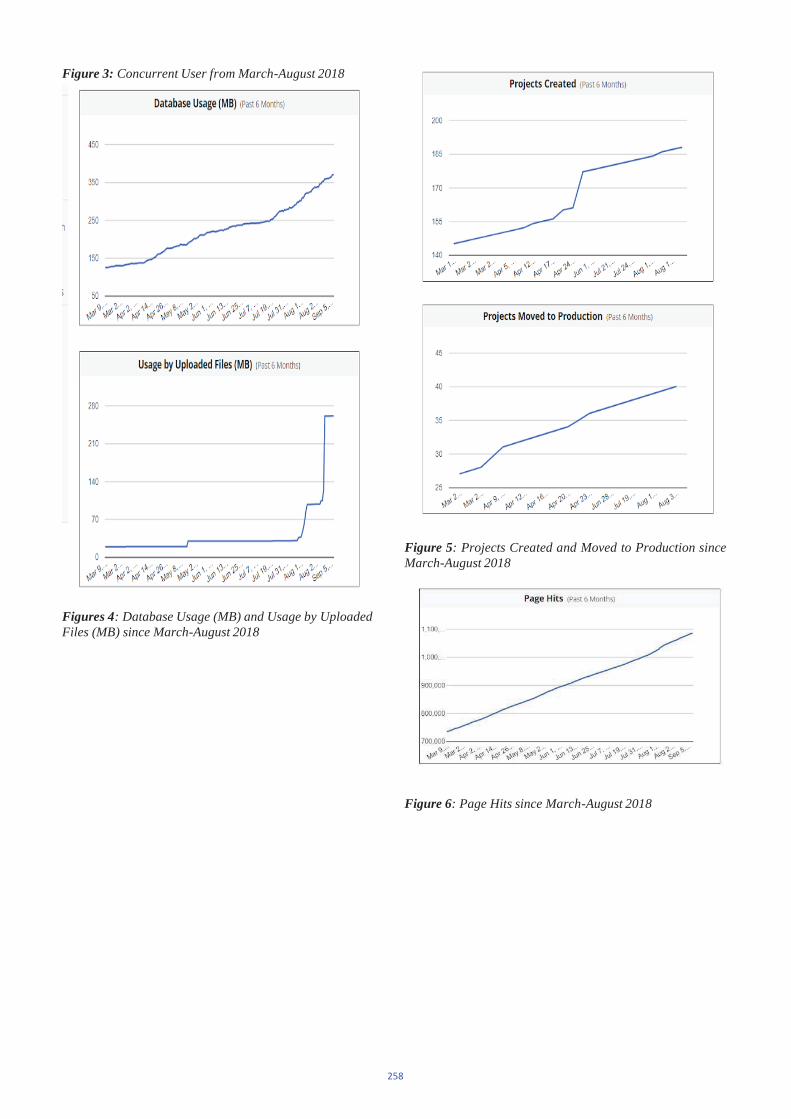
Figure 3: Concurrent User from March-August 2018
Figures 4: Database Usage (MB) and Usage by UploadedFiles (MB) since March-August 2018
Figure 5: Projects Created and Moved to Production sinceMarch-August 2018
Figure 6: Page Hits since March-August 2018
258
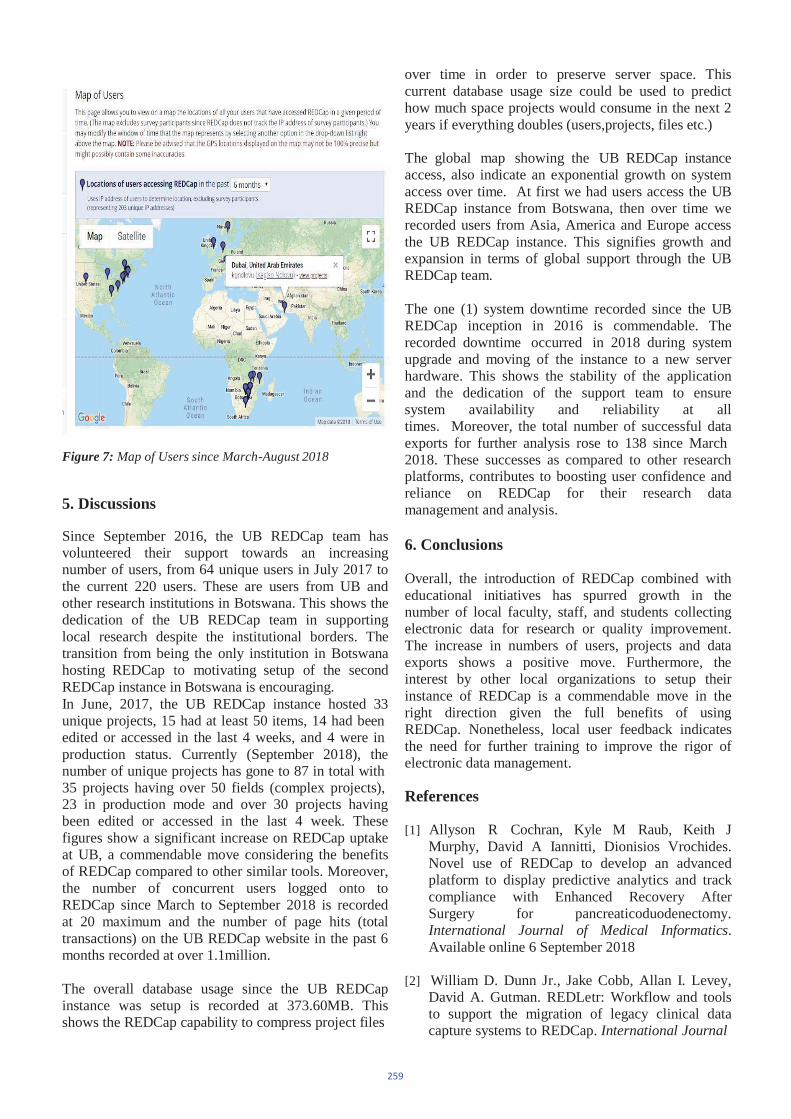
Figure 7: Map of Users since March-August 2018
5. Discussions
Since September 2016, the UB REDCap team has volunteered their support towards an increasing number of users, from 64 unique users in July 2017 to the current 220 users. These are users from UB and other research institutions in Botswana. This shows the dedication of the UB REDCap team in supporting local research despite the institutional borders. The transition from being the only institution in Botswana hosting REDCap to motivating setup of the second REDCap instance in Botswana is encouraging. In June, 2017, the UB REDCap instance hosted 33 unique projects, 15 had at least 50 items, 14 had been edited or accessed in the last 4 weeks, and 4 were in production status. Currently (September 2018), the number of unique projects has gone to 87 in total with 35 projects having over 50 fields (complex projects), 23 in production mode and over 30 projects having been edited or accessed in the last 4 week. These figures show a significant increase on REDCap uptake at UB, a commendable move considering the benefits of REDCap compared to other similar tools. Moreover, the number of concurrent users logged onto to REDCap since March to September 2018 is recorded at 20 maximum and the number of page hits (total transactions) on the UB REDCap website in the past 6 months recorded at over 1.1million.
The overall database usage since the UB REDCap instance was setup is recorded at 373.60MB. This shows the REDCap capability to compress project files
over time in order to preserve server space. This current database usage size could be used to predict how much space projects would consume in the next 2 years if everything doubles (users,projects, files etc.)
The global map showing the UB REDCap instance access, also indicate an exponential growth on system access over time. At first we had users access the UB REDCap instance from Botswana, then over time we recorded users from Asia, America and Europe access the UB REDCap instance. This signifies growth and expansion in terms of global support through the UB REDCap team.
The one (1) system downtime recorded since the UB REDCap inception in 2016 is commendable. The recorded downtime occurred in 2018 during system upgrade and moving of the instance to a new server hardware. This shows the stability of the application and the dedication of the support team to ensure system availability and reliability at all times. Moreover, the total number of successful data exports for further analysis rose to 138 since March 2018. These successes as compared to other research platforms, contributes to boosting user confidence and reliance on REDCap for their research data management and analysis.
6. Conclusions
Overall, the introduction of REDCap combined with educational initiatives has spurred growth in the number of local faculty, staff, and students collecting electronic data for research or quality improvement. The increase in numbers of users, projects and data exports shows a positive move. Furthermore, the interest by other local organizations to setup their instance of REDCap is a commendable move in the right direction given the full benefits of using REDCap. Nonetheless, local user feedback indicates the need for further training to improve the rigor of electronic data management.
References
[1] Allyson R Cochran, Kyle M Raub, Keith J Murphy, David A Iannitti, Dionisios Vrochides. Novel use of REDCap to develop an advanced platform to display predictive analytics and track compliance with Enhanced Recovery After Surgery for pancreaticoduodenectomy. International Journal of Medical Informatics.Available online 6 September 2018
[2] William D. Dunn Jr., Jake Cobb, Allan I. Levey, David A. Gutman. REDLetr: Workflow and tools to support the migration of legacy clinical data capture systems to REDCap. International Journal
259
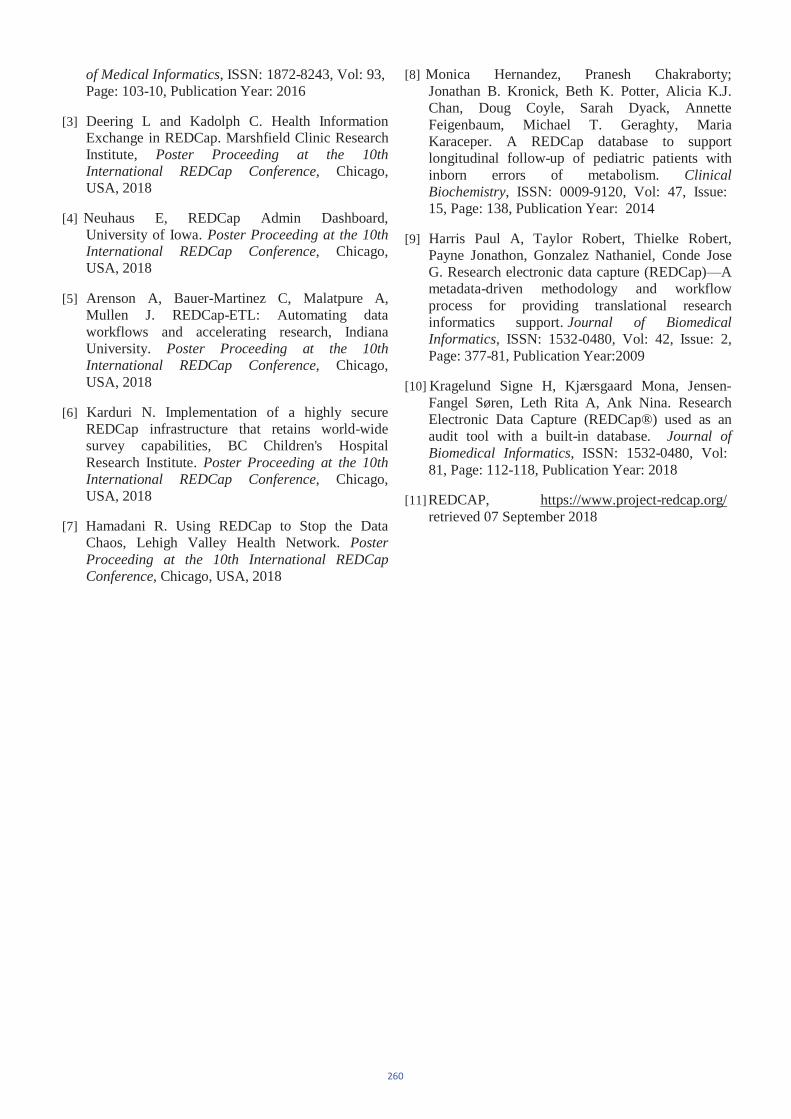
of Medical Informatics, ISSN: 1872-8243, Vol: 93, Page: 103-10, Publication Year: 2016
[3] Deering L and Kadolph C. Health Information Exchange in REDCap. Marshfield Clinic Research Institute, Poster Proceeding at the 10th International REDCap Conference, Chicago, USA, 2018
[4] Neuhaus E, REDCap Admin Dashboard, University of Iowa. Poster Proceeding at the 10th International REDCap Conference, Chicago, USA, 2018
[5] Arenson A, Bauer-Martinez C, Malatpure A, Mullen J. REDCap-ETL: Automating data workflows and accelerating research, Indiana University. Poster Proceeding at the 10th International REDCap Conference, Chicago, USA, 2018
[6] Karduri N. Implementation of a highly secure REDCap infrastructure that retains world-wide survey capabilities, BC Children's Hospital Research Institute. Poster Proceeding at the 10th International REDCap Conference, Chicago, USA, 2018
[7] Hamadani R. Using REDCap to Stop the Data Chaos, Lehigh Valley Health Network. Poster Proceeding at the 10th International REDCap Conference, Chicago, USA, 2018
[8] Monica Hernandez, Pranesh Chakraborty; Jonathan B. Kronick, Beth K. Potter, Alicia K.J. Chan, Doug Coyle, Sarah Dyack, Annette Feigenbaum, Michael T. Geraghty, Maria Karaceper. A REDCap database to support longitudinal follow-up of pediatric patients with inborn errors of metabolism. Clinical Biochemistry, ISSN: 0009-9120, Vol: 47, Issue: 15, Page: 138, Publication Year: 2014
[9] Harris Paul A, Taylor Robert, Thielke Robert, Payne Jonathon, Gonzalez Nathaniel, Conde Jose G. Research electronic data capture (REDCap) Ametadata-driven methodology and workflow process for providing translational research informatics support. Journal of Biomedical Informatics, ISSN: 1532-0480, Vol: 42, Issue: 2, Page: 377-81, Publication Year:2009
[10] Kragelund Signe H, Kjærsgaard Mona, Jensen- Fangel Søren, Leth Rita A, Ank Nina. Research Electronic Data Capture (REDCap®) used as an audit tool with a built-in database. Journal of Biomedical Informatics, ISSN: 1532-0480, Vol: 81, Page: 112-118, Publication Year: 2018
[11] REDCAP, https://www.project-redcap.org/ retrieved 07 September 2018
260
GRADUATE RESEARCH FOR SUSTAINABLE DEVELOPMENT G. O. Anderson1.
M. Jeffrey2
Electrical Engineering Department, University of Botswana [email protected]; [email protected]
Abstract
Research supervision is a process of fostering and enhancing learning, research and communication
at the highest level. It is also the most advanced level of teaching in the education system..
In this paper, the focus is on Graduate Research at the University of Botswana. The roles and
functions of the supervisor have been highlighted. The criteria for staff who qualify to teach and to
supervise graduate research is presented and those who could be appointed internal examiners have
been indicated. A supervisory agreement has also been developed and presented.
Keywords
Graduate Research, Sustainable Development
1. Introduction
Research supervision is a process of fostering
and enhancing learning, research and
communication at the highest level (Laske and
Zuber-Skerritt, 1996).
Connell (1985) maintained that research
supervision is the most advanced level of
teaching in the educational system.
The supervisory process is crucial to the
success of graduate students and certainly
complex, subtle, pivotal and responsible.
Although there have been calls to
conceptualize research supervision as a
teaching/learning process, there is still a
tendency to equate it with research training and
with the research responsibilities of the
academic role (Johnston, 1999).
Research supervision are multiple and vary in
perception of its different stakeholders. In the
view of the student, the ideal supervision helps
them to achieve a scientific, professional or
personal goal, and to learn about research and
how to conduct research against the quality
standards of the system.
The roles and functions of research supervision
are multiple and vary in perception of its
different stakeholders.
In the view of the student, the ideal supervision
helps them to achieve a scientific, professional
or personal goal, and to learn about research
and how to conduct research against the quality
standards of the system.
In the view of the supervisors, their supervision
should be able to contribute to advancement of

scientific knowledge through creating effective
learning/research situations and entail
opportunities for supervisors to conduct
research projects with students which may
enhance their own learning, research and
reputation.
The supervisor is in a very real way the agent of the university in ensuring that a particular candidate is maintaining satisfactory progress within the prescribed terms of the candidature; That the candidate receives adequate advice both on the substance of the thesis and on the form its presentation will ultimately take; and that the work being done on the thesis is reviewed critically on a continuous basis.
2. Supervision processes
In order to carry out the supervision duties
effectively a number of factors need to be taken
into consideration, including teaching load.
The enhanced supervisory processes and
recommendations help to achieve timely
completion of the programmes, which in turn
helps to boost the image of the a University
3. Proficiency Expectations
The proficiencies (outcome expectations) of the student have been defined. The Competency expectations of the different categories of the University of Botswana (UB) graduates have been provided. The UB School of Graduate Studies has addressed this problem by defining the proficiencies expected of graduates, and by encouraging students and their research supervisors to agree on their expectations of each other.
The definition of proficiencies (outcome
expectations) provides a clear statement about
the need to balance between knowledge
obtained from classes and the research
experience.
3.1 Competency expectations
of UB graduates
Graduation with a Master’s degree
by Coursework and Dissertation:
The student must have a factual knowledge
beyond the undergraduate level, as appropriate
for two years of advanced study. He / She must
demonstrate problem-solving ability in the
field of study and must have an ability to
discuss at least one aspect of the field in depth.
The student must have understanding of
cutting-edge research questions in the field and
must be able to discuss relevant research
methodology. He / she must successful
complete an independent research project.
Graduation with the Master of
Philosophy degree:
The student must have a factual knowledge
beyond the undergraduate level as appropriate
for two years of advanced study. He / She must
demonstrate problem-solving ability in the
field of study and must have an ability to
discuss at least one aspect of the field in depth.
The student must have understanding of
cutting-edge research questions in the field and
must be able to discuss relevant research
methodology. He / she must successfully
complete an independent research project and
submit a manuscript to a prestigious peer-
reviewed journal.
Graduation with Doctor of
Philosophy degree:
There should be a high level of scholarship,
demonstrated by participation in departmental
seminars and in conferences. The student must
be able to discuss several cutting-edge research
questions in the field, and understand the
principles, values and limitations of several
relevant research methods.
He / she must have the ability to organize
material appropriately and give professional
presentations and lectures
He / She must successfully complete an
independent research project that makes a
significant contribution to knowledge in the
field.
The student must submit at least one
manuscript to a prestigious peer-reviewed
journal and at least a presentation at an
international Conference with paper
publication in the conference proceedings.
The expectation that the student will become
able to discuss relevant research methodology
is based on the expectation that there will be
appropriate discussions with the Supervisor.
The expectation that a successfully completed
research project will contribute to knowledge
in the field carries with it the expectation that
the supervisor will stimulate the student to
engage in creative and analytical thought. This
frequently requires more contact and discussion
between student and supervisor
4. Roles of Supervisors and Students
The roles and functions of research supervision
are multiple and vary in perception of its
different stakeholders.
4.1 Roles of the Student
In the view of the student, the ideal supervision
helps them to achieve a scientific, professional
or personal goal, and to learn about research
and how to conduct research against the quality
standards of the system.
4.2 Roles of the Supervisor
In the view of the supervisors, their supervision
should be able to contribute to advancement of
scientific knowledge through creating effective
learning/research situations and entail
opportunities for supervisors to conduct
research projects with students that may
enhance their own learning, research and
reputation.
The supervisor is in a very real way the agent
of the university in ensuring that a particular
candidate is maintaining satisfactory progress
within the prescribed terms of the candidature;
That the candidate receives adequate advice
both on the substance of the thesis and on the
form its presentation will ultimately take;
And that the work being done on the thesis is
reviewed critically on a continuous basis.
In order to carry out the supervision duties
effectively a number of factors need to be taken
into consideration such as supervision load;
Need for a co-supervisor; Agreement about
supervisory arrangement; The
procedural/administrative knowledge each
supervisor should have; The role of supervisor
in ensuring the appropriateness of the thesis
topic, The preparation of the research proposal
and for reviews; Adequate leave planning;
Adequate regularity of meetings/contact;
Critical assessment of the students work;
Recommendations regarding courses of study,
Contact with relevant experts; Adequate notice
of submission,
5. Experiences at the University of
Botswana (UB)
Overall, most students are first-generation
university students from widely varied cultural
backgrounds, whose understanding of the
requirement of postgraduate study have come
from their undergraduate university years
rather than from many years of living with
family members who have Master’s or
Doctoral degrees.
The situation creates divergent impressions and
expectations about the requirements of
advanced course work and research
These students understand that the academic
programmes require that certain courses be
passed, but often flounder when they embark
on a research project.
The UB School of Graduate Studies has
addressed this problem by defining the
proficiencies expected of graduates, and by
encouraging students and their research
supervisors to agree on their expectations of
each other.
The definition of proficiencies (outcome
expectations) provides a clear statement about
the need to balance between knowledge
obtained from classes and the research
experience.
6. Supervision Agreement
6.1 Memorandum of understanding between
graduate student and supervisors
All students writing the research assay,
dissertation or thesis must complete this form
contingent with submission of a research topic
for approval.
The signatures of student, supervisor and co-
supervisor(s) indicate that they intend to abide
by the terms and provisions of this agreement.
A copy of the signed Memorandum should be
sent to School of Graduate Studies (SGS).
6.2 Roles and responsibilities of the
supervisor
All supervisors are expected to have good
knowledge of the Graduate Program. The

following conditions have been read and
agreed upon by the student and supervisor.
The supervisor should provide a work plan for
the research work.
The supervisor will guide the graduate program
of the student (including assistance with course
selection) and facilitate timely completion of
course work, research, thesis writing and
defense, in accordance with SGS regulations.
The supervisor will provide mentorship (for
instance, opportunities for funding, ensuring
the student has opportunities to present his/her
work at academic forums, facilitating access to
study data/subjects).
The supervisor will be available to meet
regularly to discuss ongoing progress and
issues.
The frequency and regularity of meetings with
the student will vary depending on the stage at
which a student is at but the supervisor and the
student should meet a minimum of 3 times per
semester and the research project committee
should meet a minimum of once a semester.
The supervisor will ensure timely feedback to
the student. Normally, written work should be
returned within 10-15 working days, or at an
agreed time which may vary depending on the
volume of the work to be reviewed.
The supervisor will ensure appropriate ongoing
supervision of the student during any leave of
absence from the University as per SGS
regulations.
The supervisor will facilitate funding from a
research grant, if possible, and support the
student in applications for fellowship grants.
6.3 Roles and responsibilities of the
student
All students are expected to have good
knowledge of the Graduate Program. The
following conditions have been read and
agreed upon by the student and supervisor.
The student is responsible for keeping in touch
with the supervisor and providing progress
reports.
The student is responsible for informing the
supervisor of any changes in contact details (e-
mail, mailing address, telephone).
The student is responsible for keeping the
supervisor informed in writing of any problems
that could delay (or prevent) completion of the
research.
The student is responsible for preparing and
submitting the thesis research for relevant
ethics approval (with input from supervisor).
The student is responsible for undertaking the
research according to relevant regulations and
guidelines (and as agreed with the supervisory
committee).
The student is responsible for indicating how
advice and suggestions from the supervisor and
committee have been integrated into the thesis
work.
In addition, the student and supervisor should
discuss/define:
Ownership and use of data
A plan for presentations and publications based
on the thesis
Authorship protocols for presentations and
publications

6.4 Disagreement between student and
supervisor
If there is a disagreement between the student
and supervisor, an appeal should be presented
in writing to the program coordinator.
The program coordinator will investigate the
problem with the assistance of the head of the
department. If the student is not satisfied with
the decision, he/she could appeal to the Dean of
School of Graduate Studies.
The Dean of School of Graduate Studies will
set up a committee from members of the SGS
Board to investigate and recommend
accordingly.
The recommendation will be considered by the
SGS Board and its decision would be
communicated to the Vice Chancellor (VC) for
final approval.
SIGNATURES
Student :____________________
Date:___________
Supervisor
:____________________
Date:___________ Co-Supervisor
:____________________
Date:___________
Co-Supervisor :____________________
Date:___________
Co-Supervisor :____________________
Date:___________
7. Supervision Criteria
7.1 Criteria for staff who supervise graduate
student research
7.1.1 Supervisor/Internal Examiner
PhD degree and rank of Senior Lecturer (or
higher)
Demonstrated knowledge of the field of the
student’s research
Experience in supervising or co-supervising
graduate student research
Evidence of current scholarly activity (peer-
reviewed publications)
7.1.2 Co-Supervisor:
PhD degree and rank of Lecturer (or higher)
Demonstrated knowledge in at least one aspect
of the student’s research
Evidence of current scholarly activity (peer-
reviewed publications)
7.2 Criteria for staff who teach a graduate
course
7.2.1 General criteria:
PhD degree and at least 3 years of teaching
experience
or
PhD degree with course work and a personal
portfolio that shows teaching experience. The
portfolio will be reviewed by the HOD and a
recommendation forwarded to the SGS.
Demonstrated knowledge of the field
7.3. Special situations:
Criteria may differ in professional fields.
Criteria for special situations will be
recommended by the HOD and considered by
the SGS Board.
8. Conclusion
In this paper measures to be taken by
supervisor to ensure an enhanced supervision,
leading to timely completion of the research
work are presented The role of the student is
also indicated. The paper is of value to
supervisors who would wish their students to
complete timely with excellent research output.
A successful completion of research work is of
interest to the supervisor and the student. Such
excellent results will brighten the image of a
University. Relevant graduate research will
ultimately address some of the seventeen
United Nations Sustainable Development
Goals.
References
[1] Future of Graduate Research Supervision, Report to the University of Botswana Management. September 2009
[2] School of Graduate Studies. Academic Calendar. University of Botswana. 2018/19
[3] Anderson G. O. Graduate Research Supervision. Workshop Faculty of Education, University of Botswana, 2017


Copyright © 2022 FDOKUMEN


![[Acronym] Proceedings - UFG](https://static.fdokumen.com/doc/165x107/631430486ebca169bd0abf4b/acronym-proceedings-ufg.jpg)