Proceedings of the 6th Ph.D. Retreat of the HPI Research ...
248
Technische Berichte Nr. 76 des Hasso-Plattner-Instituts für Softwaresystemtechnik an der Universität Potsdam Proceedings of the 6th Ph.D. Retreat of the HPI Research School on Service-oriented Systems Engineering Christoph Meinel, Hasso Plattner, Jürgen Döllner, Mathias Weske, Andreas Polze, Robert Hirschfeld, Felix Naumann, Holger Giese, Patrick Baudisch
-
Upload
khangminh22 -
Category
Documents
-
view
0 -
download
0
Transcript of Proceedings of the 6th Ph.D. Retreat of the HPI Research ...
Technische Berichte Nr. 76
des Hasso-Plattner-Instituts für Softwaresystemtechnik an der Universität Potsdam
Proceedings of the 6th
Ph.D. Retreat of the
HPI Research School
on Service-oriented
Systems Engineering
Christoph Meinel, Hasso Plattner, Jürgen Döllner, Mathias Weske, Andreas Polze, Robert Hirschfeld, Felix Naumann, Holger Giese, Patrick Baudisch


Technische Berichte des Hasso-Plattner-Instituts für Softwaresystemtechnik an der Universität Potsdam

Technische Berichte des Hasso-Plattner-Instituts für Softwaresystemtechnik an der Universität Potsdam | 76
Proceedings of the 6th Ph.D. Retreat of the HPI Research School on Service-oriented
Systems Engineering
herausgegeben von Christoph Meinel
Hasso Plattner Jürgen Döllner
Mathias Weske Andreas Polze
Robert Hirschfeld Felix Naumann
Holger Giese Patrick Baudisch
Universitätsverlag Potsdam

Bibliografische Information der Deutschen Nationalbibliothek Die Deutsche Nationalbibliothek verzeichnet diese Publikation in der Deutschen Nationalbibliografie; detaillierte bibliografische Daten sind im Internet über http://dnb.de/ abrufbar. Universitätsverlag Potsdam 2013 http://verlag.ub.uni-potsdam.de/ Am Neuen Palais 10, 14469 Potsdam Tel.: +49 (0)331 977 2533 / Fax: 2292 E-Mail: [email protected] Die Schriftenreihe Technische Berichte des Hasso-Plattner-Instituts für Softwaresystemtechnik an der Universität Potsdam wird herausgegeben von den Professoren des Hasso-Plattner-Instituts für Softwaresystemtechnik an der Universität Potsdam. ISSN (print) 1613-5652 ISSN (online) 2191-1665 Das Manuskript ist urheberrechtlich geschützt. Online veröffentlicht auf dem Publikationsserver der Universität Potsdam URL http://pub.ub.uni-potsdam.de/volltexte/2013/6677/ URN urn:nbn:de:kobv:517-opus-66777 http://nbn-resolving.de/urn:nbn:de:kobv:517-opus-66777 Zugleich gedruckt erschienen im Universitätsverlag Potsdam: ISBN 978-3-86956-256-8
Contents
Synonym Discovery in RDF Data 1Ziawasch Abedjan
Methodologies for Goal-Oriented Process Performance Management 11Evellin Cardoso
Hybrid parallel computing with Java 21Frank Feinbube
On the Complex Nature of MDE Evolution – A Meta Study 31Regina Hebig
Steuerung der Datenübertragung in öffentlichen zellularen Netzen imKontext telemedizinischer Anwendungen 41
Uwe Hentschel
Heterogeneous Computing for Algorithms with Low Numerical Intensity 53Fahad Khalid
3D Gevisualization Services for Efficient Distribution of 3D Geodata 63Jan Klimke
Applications of Virtual Collaboration Monitoring in Software DevelopmentProjects 73
Thomas Kowark
Muscle Propelled Force-feedback: ultra-mobile haptic devices 85Pedro Lopes
Discovering SPARQL Query Templates for Dynamic RDF TriplePrefetching 95
Johannes Lorey
The Role of Objects in Process Model Abstraction 107Andreas Meyer
Fall Workshop 2012 i
Contents
Comprehensible 3D Maps and Building Panoramas 117Sebastian Pasewaldt
Demonstrating Test-driven Fault Navigation 133Michael Perscheid
Migrating Traditional Web Applications into Multi-Tenant SaaS 145Eyad Saleh
Challenges in the Visualization of Large Multi-Dimensional Hierarchies 157Sebastian Schmechel
Memory Management in a Many-Core Distributed Hypervisor 165Jan-Arne Sobania
Interleaving Programming Tasks: Challenges for Interruption Handlingin Programming Environments 179
Marcel Taeumel
Workload Prediction and Utilization Change Detection in Virtualized DataCenters 191
Ibrahim Takouna
Understanding Code with Execution Traces 205Arian Treffer
Duplicate Decision for Data Quality Web Services 209Tobias Vogel
Integrated Software Development for Embedded Robotic Systems 221Sebastian Wätzoldt
ii Fall Workshop 2012
Synonym Discovery in RDF Data
Ziawasch Abedjan
Information Systems GroupHasso-Plattner-Institut
Linked Open Data brings new challenges and opportunities for the data miningcommunity. Its underlying data model RDF is heterogeneous and contains machinereadable semantic relations. The amount of available open data requires profiling andintegration for desired applications. One of the promising underlying techniques is as-sociation rule mining. However there has been only limited application of associationrules on semantic web data. We introduce the concept of mining configurations thatallows us to mine RDF data on statement level. We described elaborated use casessuch as ontology engineering, data imputation that are based on configurations in thecontext of RDF subjects. A novel application that is based on mining configurationsis synonym discovery. Synonym discovery is useful for discovering globally valid syn-onyms for a thesauros as well supporting the completeness of SPARQL query resultsby including results that are connected to synonym predicates. We show that synonymdiscovery in RDF data can be done efficiently using the proposed techniques based onassociation rule mining.
1 Synonyms in LOD
The increasing amount of Linked Open Data (LOD) in the World Wide Web raises newopportunities and challenges for the data mining community [13]. LOD is often repre-sented in the Resource Description Framework (RDF) data model: Data is representedby a triple structure consisting of a subject, a predicate, and an object (SPO). Eachtriple represents a statement/fact. Fig.1 illustrates some RDF facts describing BarackObama. When processing RDF data, meta information such as ontological structuresand exact range definitions of predicates are desirable and ideally provided by a knowl-edge base. However in the context of LOD, knowledge bases are usually incomplete orsimply not available. When dealing with an LOD source without a satisfiable knowledgebase, it is useful to automatically generate meta information, such as ontological de-pendencies, range definitions, and topical associations of resources. These metadatafaciliate the understanding and integration of the data source. Data mining applica-tions, such as association rule mining and frequency analysis are obvious approachesto create such metadata.
The URI representation of subjects, predicates, and objects and their connectionswithin statements harbor many hidden relations that might lead to new insights aboutthe data and its domain. Resources are connected with each other through multi-ple predicates, co-occurring in multiple relations. At this point, frequencies and co-occurrences of statement elements become an interesting object of investigation.
Fall Workshop 2012 1

Synonym Discovery in RDF Data
subject http://dbpedia.org/resource/Barack_Obamapredicate http://dbpedia.org/ontology/birthDate
object 1961-08-04subject http://dbpedia.org/resource/Barack_Obama
predicate http://dbpedia.org/ontology/birthPlaceobject http://dbpedia.org/resource/Honolulu
subject http://dbpedia.org/resource/Barack_Obamapredicate http://dbpedia.org/ontology/orderInOffice
object President of the United States.subject http://rdf.freebase.com/ns/en.barack_obama
predicate http://rdf.freeb. . . /celebrities.friendship.friendobject http://rdf.freebase.com/ns/en.oprah_winfrey
Table 1: RDF triples from DBpedia and Freebase
One sort of meta data that can be derived by applying association rule mining onRDF data is synonymic relations. Synonym discovery might first of all be interesting forthe general purpose of enriching an existing synonym thesaurus using new synonymsthat have been evolving through the time as multiple people use different terms fordescribing the same phenomenon. Current research on synonym discovery is mostlybased on web mining techniques [5, 19]. We elaborate the task of synonym discoveryin LOD sources. Linked Open Data is semi structured. Therefore synonym candidateterms are easy to extract and easier to compare with regard to their contextual occur-rence. Note, synonym discovery in unstructured data such as web documents needsto consider natural language processing rules. In addition to the general purpose ofcreating a synonym database, the discovery of synonym predicates benefits the us-age of LOD. As we mentioned before for many data sources meta-data is only poorlyprovided. Identifying synonymly used predicates can support the evaluation and im-provement of the underlying ontology and schema definitions. Furthermore the qualityof query results on RDF corpora can be improved. When a user is looking for artists ofa movie and uses the predicate artist, the knowledge base could also provide himwith artists that are connected to movies by the predicate starring. Usage of globalsynonym databases is not sufficient and might lead to misleading facts in this scenariobecause of the heterogeneity of LOD, as predicates are used in different knowledgebases for different purposes by different data publishers. So it is necessary to have adata-driven approach dissolving the existing synonym dependencies. We introduce anapproach that is based on aggregating positive and negative association rules at state-ment level based on the concept of mining configurations. A configuration specifiesthe context of rule mining (the transaction identifiers) and the target of rule mining (theitems and transactions) within a triple. As a proof-of-concept we applied our algorithmseveral LOD sources including the popular DBpedia data set [6].
The rest of this paper is organized as follows: In the next section we present re-lated work with regard to synonym discovery and schema matching. Next we presentnecessary foundations with regard to RDF and association rules. In Section 4 we de-scribe our algorithm. Section 5 contains our evaluation plan and some results and weconclude in Section 6
2 Fall Workshop 2012
2 Related Work
2 Related Work
In this paper, we apply existing data mining algorithms on the new domain of LOD andpropose a resulting synonym discovery approach. Therefore, we present related workwith regard to data mining in the semantic web as well as existing applications in thefields of synonym discovery. As most of our techniques for synonym discovery de-rive from schema matching approaches, we also give an overview of existing schemamatching approaches.
2.1 Mining the Semantic Web
There is already much work on mining the semantic web in the fields of inductive logicprogramming and approaches that make use of the description logic of a knowledgebase [14]. Those approaches concentrate on mining answer-sets of queries towardsa knowledge base. Based on a general reference concept, additional logical relationsare considered for refining the entries in a answer-set. This approach depends on aclean ontological knowledge base, which is usually not available. Furthermore, thatapproach ignores the interesting opportunities of mining of rules among predicates.
As RDF data spans a graph of resources connected by predicates as edges, an-other related field of research is mining frequent subgraphs or subtrees [15]. However,in LOD no two different nodes in an RDF graph have the same URI. Therefore, fre-quency analysis cannot be performed unless we assume duplicate entries in the dataset. But if we consider the corresponding type of each URI pattern analysis can beperformed because multiple URIs belong to the same type. Thus, any graph miningwould be restricted to type mining and not data mining.
Among profiling tools, ProLOD is a tool for profiling LOD, which includes associationrule mining on predicates for the purpose of schema analysis [7]. The method of miningassociation rules on predicates is also applied in our work, however we go furtherthan just analyzing the schema und show concrete applications that are based on thismethod and show how it can be combined to rule mining scenarios that also involvethe objects of RDF statements.
2.2 Synonym Discovery
Most existing work for discovering synonyms is based on different language processingand information retrieval techniques. A commmon approach is to look for co-occurenceof synonym candidates in web documents [5, 19]. The idea behind this approach isthat synonymous word co-occur in documents. So they calculate the ratio of real co-occurrence of two terms and the independent occurrence of each term. Note that forthese approaches there are already known candidate pairs that have to be validated.In our scenario this assumption does not hold as we also have to retrieve the candidatepairs.
While Baronis work concentrates on globally valid synonyms the authors of [19]address context sensitive synonym discovery by looking at co-clicked query results.
Fall Workshop 2012 3
Synonym Discovery in RDF Data
Whenever the distance between two clusters of clicked query results is below a certainthreshold, the query terms can be seen as synonyms.
The approaches so far are very different from our domain where we want to dis-cover synonym schema elements in semi-structured data. An approach that has asimilar characteristic is the synonym discovery approach based on eextraced webta-bles [9]. The authors introduce a metric that enables to discover synonyms amongtable attributes. However their approach is quite restrictive as they assume a contextattribute given for making attributes comparable. Furthermore they ignore instance-based techniques as they only process extracted table schemata.
2.3 Schema Matching
Schema matching differs from synonym discovery within schemata in the sense, thattwo schema elements may be synonyms but still may not share a remarkable numberof values. On the other hands two attributes may share a lot of values but their cor-responding labels may not be synonyms from a global point of view. Still approachesfor the discovery of attribute matches and synonyms follow similar intuitions [18]. Ac-cording to the classification of Rahm and Bernstein, we would classify our approachas mixture of an instance-based and a schema level matching algorithms. On schemalevel we apply existing techniques to RDF data and evaluate their effectivity.
Existing instance-based approaches are different from our work as they comparethe content of each attribute column-wise [10,11,17]. Chosing features for matching iscumbersome and algorithms that look for value overlaps lack efficiency. We proposean association rule based approach that discoveres overlaps between attribute valuesin an RDF corpus.
One could also perform schema matching on schema element level by using dic-tionaries but existing work already neglects the fact it works well in real data sce-narios [16]. Furthermore as RDF data does not always conform to dictionaries andcontains abbreviations and domain-specific labels as predicates makes it even moredifficult to discover similarities on this level.
3 Association Rules and Triples
We briefly define the relevant foundations of association rule mining on RDF data.
3.1 Association Rule Mining
The concept of association rules has been widely studied in the context of marketbasket analysis [3], however the formal definition is not restricted by any domain: Givena set of items I = {i1, i2, . . . , im}, an association rule is an implication X→Y consisting ofthe itemsets X ,Y ⊂ I with X∩Y = /0. Given a set of transactions T = {t|t ⊆ I}, associationrule mining aims at discovering rules holding two thresholds: minimum support andminimum confidence.
4 Fall Workshop 2012
3 Association Rules and Triples
Support s of a rule X → Y denotes the fraction of transactions in T that include theunion of the antecedent (left-hand side itemset X) and consequent (right-hand sideitemset Y ) of the rule, i.e., s% of the transactions in T contain X ∪Y . The confidencec of a rule denotes the statistical dependency of the consequent of a rule from theantecedent. The rule X → Y has confidence c if c% of the transactions T that containX also contain Y . There are also other metrics for evaluating rules, such as lift andconviction [8], but for our approach support and confidence as the basic metrics aresufficient. Algorithms to generate association rules decompose the problem into twoseparate steps: (1) Discover all frequent itemsets, i.e., itemsets that hold minimal sup-port. (2) For each frequent itemset a generate rules of the form l→ a− l with l ⊂ a, andcheck the confidence of the rule.
While the second step of the algorithm is straightforward, the first step marks thebottleneck of any algorithm. The three best known approaches to this problem areApriori [4], FP-Growth [12], and Eclat [20]. We use the FP-Grwoth algorithm for ourpaper.
3.2 Association Rules on RDF Statements
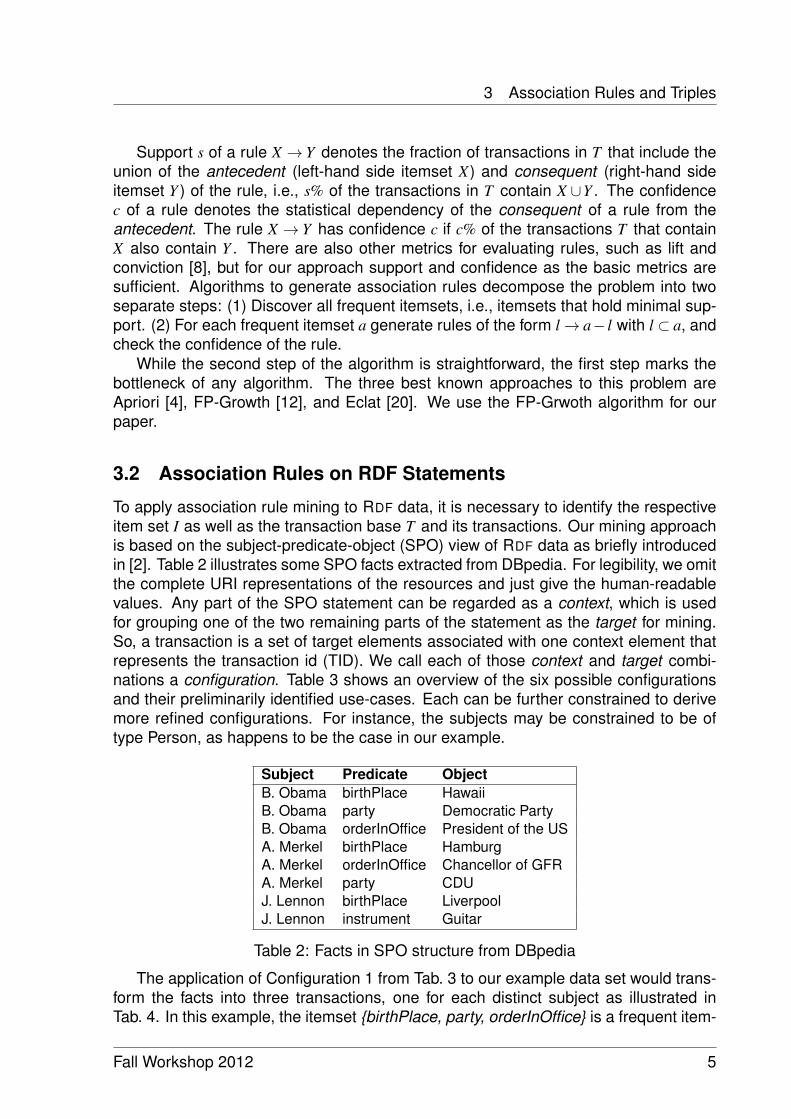
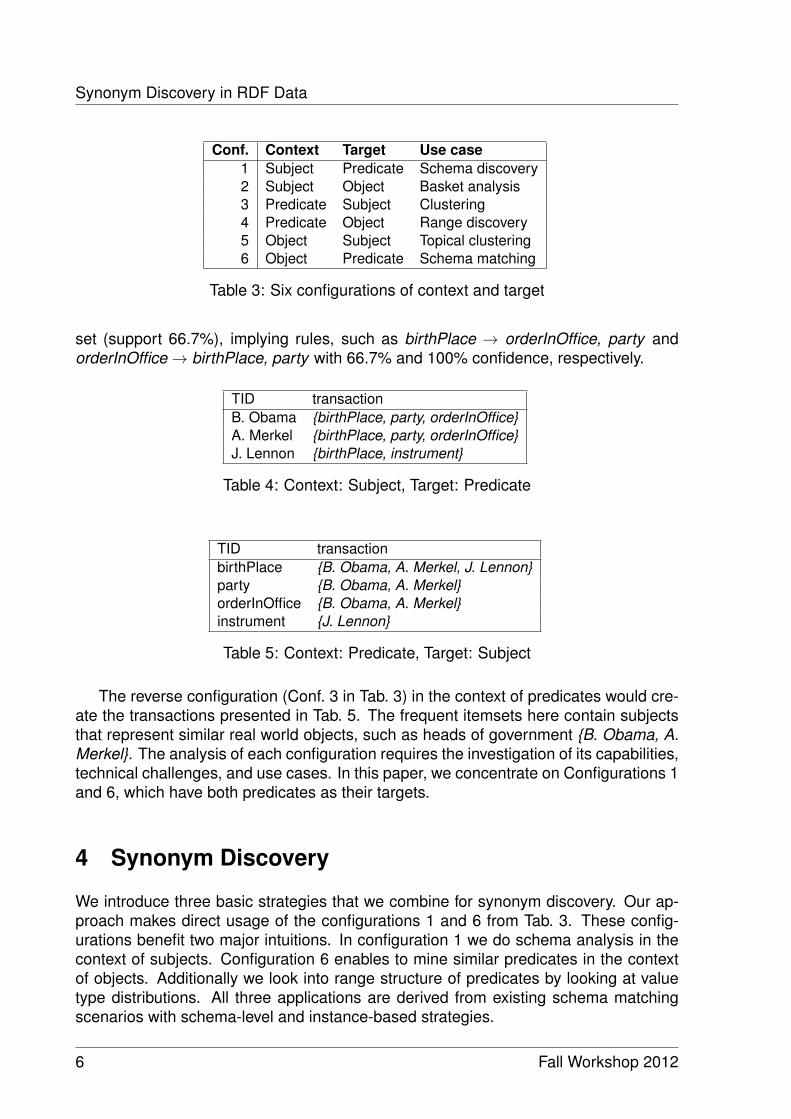
To apply association rule mining to RDF data, it is necessary to identify the respectiveitem set I as well as the transaction base T and its transactions. Our mining approachis based on the subject-predicate-object (SPO) view of RDF data as briefly introducedin [2]. Table 2 illustrates some SPO facts extracted from DBpedia. For legibility, we omitthe complete URI representations of the resources and just give the human-readablevalues. Any part of the SPO statement can be regarded as a context, which is usedfor grouping one of the two remaining parts of the statement as the target for mining.So, a transaction is a set of target elements associated with one context element thatrepresents the transaction id (TID). We call each of those context and target combi-nations a configuration. Table 3 shows an overview of the six possible configurationsand their preliminarily identified use-cases. Each can be further constrained to derivemore refined configurations. For instance, the subjects may be constrained to be oftype Person, as happens to be the case in our example.
Subject Predicate ObjectB. Obama birthPlace HawaiiB. Obama party Democratic PartyB. Obama orderInOffice President of the USA. Merkel birthPlace HamburgA. Merkel orderInOffice Chancellor of GFRA. Merkel party CDUJ. Lennon birthPlace LiverpoolJ. Lennon instrument Guitar
Table 2: Facts in SPO structure from DBpedia
The application of Configuration 1 from Tab. 3 to our example data set would trans-form the facts into three transactions, one for each distinct subject as illustrated inTab. 4. In this example, the itemset {birthPlace, party, orderInOffice} is a frequent item-
Fall Workshop 2012 5
Synonym Discovery in RDF Data
Conf. Context Target Use case1 Subject Predicate Schema discovery2 Subject Object Basket analysis3 Predicate Subject Clustering4 Predicate Object Range discovery5 Object Subject Topical clustering6 Object Predicate Schema matching
Table 3: Six configurations of context and target
set (support 66.7%), implying rules, such as birthPlace → orderInOffice, party andorderInOffice→ birthPlace, party with 66.7% and 100% confidence, respectively.
TID transactionB. Obama {birthPlace, party, orderInOffice}A. Merkel {birthPlace, party, orderInOffice}J. Lennon {birthPlace, instrument}
Table 4: Context: Subject, Target: Predicate
TID transactionbirthPlace {B. Obama, A. Merkel, J. Lennon}party {B. Obama, A. Merkel}orderInOffice {B. Obama, A. Merkel}instrument {J. Lennon}
Table 5: Context: Predicate, Target: Subject
The reverse configuration (Conf. 3 in Tab. 3) in the context of predicates would cre-ate the transactions presented in Tab. 5. The frequent itemsets here contain subjectsthat represent similar real world objects, such as heads of government {B. Obama, A.Merkel}. The analysis of each configuration requires the investigation of its capabilities,technical challenges, and use cases. In this paper, we concentrate on Configurations 1and 6, which have both predicates as their targets.
4 Synonym Discovery
We introduce three basic strategies that we combine for synonym discovery. Our ap-proach makes direct usage of the configurations 1 and 6 from Tab. 3. These config-urations benefit two major intuitions. In configuration 1 we do schema analysis in thecontext of subjects. Configuration 6 enables to mine similar predicates in the contextof objects. Additionally we look into range structure of predicates by looking at valuetype distributions. All three applications are derived from existing schema matchingscenarios with schema-level and instance-based strategies.
6 Fall Workshop 2012

4 Synonym Discovery
4.1 Schema Analysis
Configuration 1 enables us to do frequency analysis and rule discovery per entities. Forinstance positive rules between predicates can be used for re-validating existing ontolo-gies [1]. In our use case we have a different intuition. Synonym predicates should notco-occur for entities. It is more likely for entities to include only one representative ofa synonymous predicate group within their schema. That is why we look for negativecorrelations in Configuration 1. For this purpose we adapted an FP-Growth [12] imple-mentation that retrieves all negative correlations for a set of synonym candidate pairs.The approach can also be used stand-aloe looking at all possible pairs that have anegative correlation in the data set. Negative correlation can be expressed by severalscore functions. One could look at the bidirectional correlation coefficient or considersome kind of aggregations of the negative rules’ confidence values such as minimum,maximum or the f-measure of both.
Bare schema analysis leads also to results including pairs such as birthDateand author as both occur for different entities. So a negative correlation is not asufficient condition. The context or the range of the predicates should also be takeninto account. In [9] the authors introduce an approach for synonym discovery in dif-ferent webtables that includes a context attribute. We also adapted this score functionand compared the results to the scoring functions named before. In the following wedescribe our strategies that complement the schema analysis by considering also therange of predicates.
4.2 Range Content filtering
The first intuition is that as synonym predicates will have a similar meaning they alsoshare a similar range of object values. Configuration 6 constitutes a mining scenariowhere each transaction is defined by a distinct object value. So each transaction con-sists of all predicates containing the distinct object value in there range. Frequentpatterns in this configuration are sets of predicates that share a significant number ofobject values in their range. As each Configuration is an adaption of frequent itemsetmining the threshold that decides whether two predicates are similar or not is supportand depends on the number of all baskets or all existing distinct objects. Normally whentrying to compute the value overlap between two predicates one would look at the ratioof overlaps depending on the total number of values of such a predicate. Furthermoreour approach ignores value overlaps that occur because of multiple occurrence of onedistinct value in the ranges. We will analyze the effect of these differences and showthat our approach is much more efficient without any loss of quality. We further restrictthe configuration to discover only frequent predicate pairs that will be regarded as syn-onym candidate pairs in the schema analysis or range structure filtering phase. Similarto the schema analysis strategy also the range content filtering based on value over-laps is not a sufficient condition for discovering synonyms. For example the predicatesbirthPlace and deathPlace will share a remarkable percentage of their ranges butare obviously no synonyms. However this candidate pair can be pruned looking at theirexclusion rate per entity during schema analysis.
Fall Workshop 2012 7
Synonym Discovery in RDF Data
4.3 Range Structure Filtering
In some scenarios value range content filtering might not be the most appropriate tech-nique as it requires two synonym predicates to share a portion of exactly equal values.However, real world data might contain synonym predicates with completely disjointrange sets where the range elements are only ontologically similar. This is often thecase when looking at predicates describing numbers and dates. Therefore existingwork not only looks at exact overlaps but also on general string or token characteristicssuch as string length and character distributions [10, 17]. However as the motivationof our work was to analyze the capabilities of mining on statement level we do not ap-proach this problem on string level. Instead we look at type distributions in predicateranges. So for every object in the range of a predicate we retrieve its type from thegraph and create type vectors per predicate containing the number of the occurencesof this type. As each entity in RDF might have several types due to existing type hierar-chies, i.e., Barack Obama is a Politician as well as a Person, we examined two differentvector constructions. The first construction just retrieves all types per entity in a pred-icate range and the second construction only considers the most specific type of anentity. Having type vectors for a predicate pair both can be compared using measuressuch as cosine similarity or weighted jaccard similarity. After preliminary experimentsweighted jaccard similarity seems more promising because cosine similarity resultsinto high scores as soon as one component value of one vector is very large while allother components have very small values. Missing type values, e.g., in case of datesand other numerical values, have been handled as unknown types, whereas no twounknown types are equal.
4.4 Combined Approach
We have introduced three different ways of generating or evaluating synonym candi-date pairs. It is crucial to find a reasonable order for combining those three to makebest use of the intuitions and achieve optimal quality and to be efficient at the sametime. One strategy is to first retrieve all predicate pairs through range content filter-ing filter those pairs by range structure filtering and then analyzing their schema co-occurrences. This strategy has two advantages: as retrieving negative correlationsand type vectors is inefficient, it is reasonable to perform both on given candidatesinstead of using them on the complete data set to retrieve candidates. Furthermoreas we compare very different correlation measures on schema level all of them can beperformed at the end of the discovery process after having done the instance-basedapproaches first.
5 Evaluation Plan
We will evaluate the synonym discovery algorithm on different levels. First of all, we willcompare all measures on each level of our synonym discovery approach. Further wewill compare our three strategies each as a stand alone approach to another and iden-
8 Fall Workshop 2012
6 Summary and Future Work
tify weaknesses and strengths in our use case. Finally, we will evaluate the algorithmwith regard to our claims that are:
• There are synonym predicates in RDF data sets that can be useful for optimizingqueries.• Configuration 6 is as effective as a naive overlap approach but more efficient.
6 Summary and Future Work
We proposed a statement-level mining methodology for RDF data that is based on sixbasic configurations with the aid of different real examples. On this basis, further re-search directions include reasoning and formalizing constraints and refinements thatallow unlimited configuration scenarios for different purposes. We use this method-ology for creating a syonym discovery algorithm that identifies synonymous predicatepairs in RDF data sets. All described approaches have been implemented and the nextstep is to evaluate the claims. Further study aims at combining the first and secondConfiguration as a pre-processing step for advancing frequent graph mining in RDFdata.
References[1] Ziawasch Abedjan, Johannes Lorey, and Felix Naumann. Advancing the Discovery of
Unique Column Combinations. In Proceedings of the International Conference on Infor-mation and Knowledge Management (CIKM), Maui, Hawaii, October 2012.
[2] Ziawasch Abedjan and Felix Naumann. Context and target configurations for miningRDF data. In Proceedings of the International Workshop on Search and Mining Entity-Relationship Data (SMER), Glasgow, 2011.
[3] Rakesh Agrawal, Tomasz Imielinski, and Arun Swami. Mining association rules betweensets of items in large databases. In Proceedings of the ACM International Conference onManagement of Data (SIGMOD), pages 207–216, Washington, D.C., USA, 1993. ACM.
[4] Rakesh Agrawal and Ramakrishnan Srikant. Fast Algorithms for Mining Association Rulesin Large Databases. In Proceedings of the International Conference on Very LargeDatabases (VLDB), pages 487–499, Santiago de Chile, Chile, 1994.
[5] Marco Baroni and Sabrina Bisi. Using cooccurrence statistics and the web to discoversynonyms in technical language. In International Conference on Language Resourcesand Evaluation, pages 1725–1728, 2004.
[6] Christian Bizer, Jens Lehmann, Georgi Kobilarov, Sören Auer, Christian Becker, RichardCyganiak, and Sebastian Hellmann. DBpedia - A crystallization point for the Web of Data.Journal of Web Semantics (JWS), 7:154–165, September 2009.
[7] Christoph Böhm, Felix Naumann, Ziawasch Abedjan, Dandy Fenz, Toni Grütze, DanielHefenbrock, Matthias Pohl, and David Sonnabend. Profiling linked open data with Pro-LOD. In Proceedings of the International Workshop on New Trends in Information Integra-tion (NTII), pages 175–178, 2010.
Fall Workshop 2012 9

References
[8] Sergey Brin, Rajeev Motwani, Jeffrey D. Ullman, and Shalom Tsur. Dynamic itemsetcounting and implication rules for market basket data. In Proceedings of the 1997 ACMSIGMOD international conference on Management of data, Proceedings of the ACM In-ternational Conference on Management of Data (SIGMOD), pages 255–264, New York,NY, USA, 1997. ACM.
[9] Michael J. Cafarella, Alon Halevy, Daisy Zhe Wang, Eugene Wu, and Yang Zhang. WebTa-bles: exploring the power of tables on the web. Proceedings of the VLDB Endowment,1:538–549, August 2008.
[10] AnHai Doan, Pedro Domingos, and Alon Y. Halevy. Reconciling schemas of disparatedata sources: a machine-learning approach. In Proceedings of the ACM InternationalConference on Management of Data (SIGMOD), pages 509–520, New York, NY, 2001.
[11] Georg Gottlob and Pierre Senellart. Schema mapping discovery from data instances.Journal of the ACM, 57(2):6:1–6:37, 2010.
[12] Jiawei Han, Jian Pei, and Yiwen Yin. Mining frequent patterns without candidate gen-eration. In Proceedings of the ACM International Conference on Management of Data(SIGMOD), pages 1–12, 2000.
[13] Tom Heath and Christian Bizer. Linked Data: Evolving the Web into a Global Data Space.Morgan Claypool Publishers, 2011.
[14] Joanna Józefowska, Agnieszka Lawrynowicz, and Tomasz Lukaszewski. The role of se-mantics in mining frequent patterns from knowledge bases in description logics with rules.Theory Pract. Log. Program., 10:251–289, 2010.
[15] Michihiro Kuramochi and George Karypis. Frequent subgraph discovery. In Proceedings ofthe IEEE International Conference on Data Mining (ICDM), pages 313–320, Washington,D.C., 2001.
[16] Wen-Syan Li and Chris Clifton. Semint: A tool for identifying attribute correspondencesin heterogeneous databases using neural networks. Data and Knowledge Engineering(DKE), 33(1):49 – 84, 2000.
[17] Felix Naumann, Ching-Tien Ho, Xuqing Tian, Laura M. Haas, and Nimrod Megiddo. At-tribute classification using feature analysis. In Proceedings of the International Conferenceon Data Engineering (ICDE), page 271, 2002.
[18] Erhard Rahm and Philip A. Bernstein. A survey of approaches to automatic schemamatching. VLDB Journal, 10(4):334–350, December 2001.
[19] Xing Wei, Fuchun Peng, Huihsin Tseng, Yumao Lu, and Benoit Dumoulin. Context sen-sitive synonym discovery for web search queries. In Proceedings of the InternationalConference on Information and Knowledge Management (CIKM), pages 1585–1588, NewYork, NY, USA, 2009.
[20] Mohammed J. Zaki. Scalable Algorithms for Association Mining. IEEE Transactions onKnowledge and Data Engineering (TKDE), 12:372–390, May 2000.
10 Fall Workshop 2012
Methodologies for Goal-OrientedProcess Performance Management
Evellin Cardoso
Business Process Technology GroupHasso Plattner Institute
Although modeling goals provide a more strategic view for business processes;little attention is devoted to explicitly modeling goals as well as using the concept ofgoal to increase the value of the process modeling techniques. The purpose of thisreport is to enhance the current BPM lifecycle with new activities in order to supportgoal-oriented process performance management. In order to so, we propose newmethodological steps within the BPM lifecycle that must be done in order to supportsuch goal-orientation and how the existent methodologies can support the executionof these new activities.
1 Introduction
The increasing competitiveness drives organizations to constantly evaluate their po-sition in the market and promote changes in an attempt to improve the quality of theservices and products they offer. In recent years, many of the efforts related to themanagement of organizations have been conducted in the scope of Business ProcessManagement (BPM) activities. BPM is based on the fact that each product or servicethat a company provides to the market is the outcome of a process. As a consequence,changes in processes should generate radical improvements in critical performancemeasures (such as cost and quality).
However, predicting how an environment should respond to changes by simplyadopting a process-centered view is unfeasible since there are a large number of is-sues to be considered, such as infrastructure, power and politics, managerial control,organizational culture, among others. Given this multitude of issues, understanding anorganizational setting often requires a number of perspectives or domains.
Among these perspectives, the domain of "motivation" has been recognized as animportant element of organizations as highlighted in Zachman framework’s motivationcolumn. Goal modeling is the artifact employed for capturing the motivational aspectand strategies behind the organizational practices. Moreover, by adopting goal model-ing, the company can systematically express the choices behind multiple alternativesand explore new possible configurations for an organizational setting. This is essentialfor business improvement once changes in the company’s goals have significant con-sequences within all domains of the organization. However, although modelling goals
Fall Workshop 2012 11

Methodologies for Goal-Oriented Process Performance Management
provide a more strategic view for business processes; little attention is devoted to ex-plicitly modelling goals as well as using the concept of goal to increase the value ofthe process modelling techniques. Moreover, few approaches in process performancemanagement and business process management address the problem of monitoringprocesses in order to quantify the progress towards strategic goals, rather taking anoperational view for process performance.
The purpose of this report is to situate our goal-oriented approach within the currentBPM lifecycle and how it enhances the current state of art. In order to so, we describethe current state of art in each of the phases of the BPM lifecycle in terms of languagesand methodologies and how we enhance some phases of this lifecycle. The rest ofthis paper is organized as follows: section 2 describes the state of art in the currentBPM lifecycle (in terms of activities, languages and methodologies that support a goal-oriented view) and how we intend to enhance this lifecycle with this thesis and section3 concludes the paper with directions for future research.
2 General Overview of a Goal-Oriented Methodologyfor Process Performance Management
In order to obtain the benefits from adopting the alignment between goal-related con-cepts and the business processes in enterprise architectures, researchers must relyon two main components [1]. The first one is a metamodel for defining the modelinglanguage for goals and business process models, i.e., a metamodel for defining themodeling constructs syntax, semantics and graphical notation used to create models.The second component corresponds to a systematic methodology for creating alignedmodels. During this process different ways of working are applied in order to elicit anddevelop the knowledge of business stakeholders or domain experts.
Regarding the language component, we have already provided a framework [8] withthe correspondent concepts for modeling goals, indicators and business processes. Inrelation to the methodology component, this report intends to enhance the current BPMlifecycle with the correspondent activities to perform a goal-oriented analysis of busi-ness processes. The current BPM lifecycle required to manage operational businessprocesses [28] [26] [25] consists of four major phases, namely: business process strat-egy, business process design, business process implementation and business processcontrolling. The addition of strategic concepts in the BPM lifecycle in fact do not requirethe creation of additional phases, but instead, only requires the introduction of new ac-tivities within the existent phases.
In the remainder, we have two sections, namely business process strategy andbusiness process controlling, each one corresponding to the phases of the BPM lifecy-cle that we contribute. For each section, we present a current overview of the existentstate of art (in terms of activities, languages and methodologies) with their open pointsfor contribution and how we already contributed with our framework. In the following,we enumerate how our framework addresses some open points in terms of languageand the methodologies that we have obtained so far.
12 Fall Workshop 2012
2 General Overview of a Goal-Oriented Methodology for Process PerformanceManagement
2.1 Business Process Strategy Phase
The Business Process Strategy phase forms the foundation for aligning businessprocesses with general corporate strategy [27], establishing the organizational prereq-uisites for the project that implement business processes management initiatives. Oncethe long-term strategies are set up, projects can be established to implement them [28].In this phase, the strategies are captured as organizational requirements that supportthe designing and management of enterprise architectures [22]. Further, the numericalquantification in which extent goals have been achieved is also addressed in this phaseby providing a set of metrics and Key Performance Indicators (KPI) that are used tomeasure organizational/processes performance in later phases [28]. Currently, thesegoals and strategies are established in an ad hoc manner, but no explicit knowledgeabout goals and strategies are currently captured in some artifact like a model. Wedivide the approaches for addressing the performance within business processes intotwo groups:
2.1.1 Approaches for Goal Modeling
These approaches are concerned about providing languages and methods for goalmodeling. Approaches:
Enterprise Architecture Methods (Business Requirement Modelling). Enter-prise modelling approaches structure an enterprise architecture in terms of variousrelated architectural domains or viewpoints which focus on specific aspects of the en-terprise like business processes, information systems that support organizational activ-ities, organizational structures and so forth. Among the various architectural domains,the domain of "motivation" has been recognized as an important element of enterprisearchitectures. Within these approaches, goal modelling is the artefact employed forcapturing the motivational aspect and strategies behind the organizational practices,helping in clarifying interests and intentions from different stakeholders. Among theapproaches, architectural methods are the only methodologies that explicitly modelgoals and strategies in the format of artefacts (goal models). The explicit modelling ofsuch artefacts enables the development of automated and model-based techniques toanalyze business goals. However, in terms of languages for goal modeling, there isa little support in the current literature, as evidenced in [2]. Among these languages,the most expressive as argued in [22] is the so called Motivational ArchiMate Exten-sion or ARMOR language. The language enables one to model business goals andrequirements for enterprise architectures, but do support KPI modeling. Concerningmethodologies, an open point in literature is how to identify, elicit and model businessgoals in the context of enterprise architectures, since any papers concerning this topichave been found.
Our contributions here are twofold:
• Language: We proposed a framework [8] that provides the concept of goals tocapture the organizational goals as in the ArchiMate Motivational Extension. Thecontribution here is that we include some goal attributes that are important tocharacterize goals and exclude other concepts whose practical application is not
Fall Workshop 2012 13
Methodologies for Goal-Oriented Process Performance Management
clear according to [7]. Furthermore, the language is not precise with respect tothe semantics for one to decide if goals are achieved or not. A precise relationwith the concepts of Enterprise Architecture would be sufficient to assign thissemantics. However, the only current relation of the goal language with the en-terprise architecture is the realization (means-end relationship) between a Goaland the Services/Processes. We solve this problem creating a relation betweena Goals and a KPI, that in its turn, the KPIs serve to measure in which extent thegoals are achieved.
• Methodology: we propose a methodology for goal modeling here based in theattributes that must characterize goals and how to measure their achievement.
2.1.2 Approaches for KPI Modeling
These approaches are concerned about providing languages and methods for KPImodeling. It is also important to highlight that indicators must be derived from the or-ganizational goals to monitor the organizational performance in this phase. Concerningthe creation of process indicators, they may be set up in this phase (through a refine-ment of the organizational indicators) or it can be postponed until the business processdesign phase where process indicators are modeled together with the business pro-cess (and subsequently aligned with the organizational indicators). Approaches:
Business Activity Monitoring approaches (BAM) [11,15]. BAM approaches areconcerned about determining process performance by monitoring indicators valuesin a real-time fashion. For this reason, there are several approaches that provide alanguage for KPI modeling [11] [6] [3] [4] (in order of expressiveness of modeling lan-guage), but no methodology standpoint to elicit and derive KPIs on the basis of existentones.
Performance Measurement Systems [9, 18, 21, 23]. Performance Measurement(PM) systems consist of a number of indicators (and their relationships) that are used todescribe and evaluate the organizational performance. These approaches arise fromseveral areas, mainly in management sciences, such as strategy management, oper-ations management, human resources, organizational behavior, information systems,marketing, and management accounting and control [9] and for this reason, they do notprovide languages for KPI modeling, but instead, methodologies for the construction ofPM systems. Basically speaking, there are two types of methodologies for developingPM systems [27]: (1) develop the indicator system based on existing generic indicatorsand/or complete PM systems libraries and (2) develop the indicator system selectingthe appropriate indicators for the company on the basis of its business objectives andsuccess factors, resulting in a list that it is company-specific.
In the first type, several PM libraries for the development of PM systems within acompany-wide scope are available, such as the best-known Balanced Scorecard [14],Performance Prism [20], SMART System/Performance Pyramid [5]. These librarieshave a number of indicators and come with a methodology perspective associatedso that who use the library also is able to derive indicators for a specific organization,adapting the questions suggested in the library to some specific organizational context.The challenge consists in selecting the appropriate indicators from an extensive list of
14 Fall Workshop 2012
2 General Overview of a Goal-Oriented Methodology for Process PerformanceManagement
potential indicators. Furthermore, other disadvantage that can be mentioned is the factthat these libraries aim at providing indicators for determining the performance of theentire company or organization units (the indicators are very high-level and related withseveral business process at the same time), in opposition to the evaluation of individualbusiness processes [27] [16].
The second type of methodologies is based on the evidence that it seems very un-likely that a universal set of performance indicators can be applied successfully to allbusiness processes. For this reason, some papers propose methodologies for deriva-tion of process-specific indicators on the basis of goals. In contrast to the use of li-braries, these methodologies (i) develop PM systems to evaluate the performance ofbusiness processes (in opposition to measure the performance of entire corporationsor organizational units) and (ii) are related to the goals of each business process thatare a good starting point for gathering the right indicators [16] [27] [10]. However, whilethere is a plethora of libraries for business indicators and methodologies for derivationof process-specific indicators, only very few approaches propose a modeling methodfor indicators [10].
Our contribution here is:
• Creation of modeling methodology for the development of process-indicator sys-tem based on the previously modeled goals. In relation to the existing methods,we may highlight that our method adds value because: (i) present a modelingmethod (just one related methodology does [10]) (ii) concentrate in the derivationof process-specific indicators instead of in organizational ones like literature inPM systems (iii) assume goals models before deriving indicators in opposition touse strategic goals in a ad-hoc manner as the proposals in current literature.
2.2 Business Process Controlling Phase
Once the implementation of measurements has been defined in the previous phase,the Business Process Controlling phase enables the obtainment of insights aboutqualitative and quantitative measures, revealing areas with potential for improvement.These insights can be motivated by either performance or compliance considerations[27]. From a performance perspective, the intent of process analytics is to shortenthe reaction time of decision makers to events that may affect changes in the processperformance, and to allow a more immediate evaluation of the impact of process man-agement decisions on process metrics. From a compliance perspective, the intent ofprocess analytics is to establish the adherence of process execution with governingrules and regulations, and to ensure that contractual obligations and quality of ser-vice agreements are met. From a compliance perspective, although there is a bodyof knowledge that addresses the enforcement of "compliance goals" during the de-sign/execution time of business processes; our focus is concentrated on performanceissues within business processes. We divide the approaches for addressing the per-formance within business processes into two groups:
Fall Workshop 2012 15
Methodologies for Goal-Oriented Process Performance Management
2.2.1 Approaches for guiding the (re)design
These approaches are concerned about guiding the (re)design of processes so thatthey contain only activities that generate value for the organization (i.e., they addressthe structural properties of business processes). Approaches:
Business process reengineering. Constitutes an area which is closely related tooptimizing business process quality. Reengineering approaches commonly compriserecommended best practices and other informal methods like "classic" reengineeringview [13] which are mostly based on anecdotal evidence. This view is also reflected inthe OMG Business Process Maturity Model [12] which suggest criteria to allocate busi-ness processes to maturity levels without giving clear evidence on how this structure isdevised. While this informal character fits well with practical applicability, we still lackan overarching comprehensive model to ensure causal relations between measuresrecommended and intended results as well as completeness of coverage of qualityaspects [19].
Architectural Analysis (Enterprise Architecture Methods) [17]. Functional anal-ysis is performed to gain insight into the functional aspects of an architecture, illustrat-ing the dynamic behavior of a system. Among others, it is used to understand how asystem that conforms to an architecture works, to find the impact of a change on anarchitecture, or to validate the correctness of an architecture.
2.2.2 Approaches for evaluating the operating process
Once the business process has already structurally designed e evaluated accordingly,the operating quality of the executing business process must be evaluated. In that re-spect, there are three types of analysis that can be made on the basis of the executionof business processes [27]: to evaluate what happened in the past (past analysis), todetect what is happening at the moment (real-time analysis) and to predict what mayhappen in the future (predictive analysis):
Past analysis. Process Controlling [30] focuses on post analysis of completedprocesses that may or may not be based on a pre-existing formal representation ofthe business process. Process mining techniques [24] inductively discover the processmodel when no explicit process model exists,
Real-time analysis. Business Activity Monitoring (BAM) [15, 29] is concernedabout real-time monitoring of currently active business process,
Predictive analysis. Process Intelligence [3, 11] uses business process data toforecast the future behavior of the organization through techniques such as scenarioplanning and simulation. Quantitative simulation in enterprise architecture methods[17] is used to make statistical statements about the quantitative measures of a sys-tem based on multiple simulation runs. It can be seen as performing measurementsin a given model, enabling the examination of performance measures in a model in aspecific situation. Further, Analytical techniques [17] are not statistical by nature andproduce a unique and reproducible result. They are usually more suitable for quantita-tive analysis than quantitative simulation, usually providing architects with indicationsof performance measures and bottlenecks in a given process model. They are useful
16 Fall Workshop 2012
3 Conclusions
when a comparison of a large number of alternatives is needed in a so called "what-if"analysis.
Currently, no activities for process analysis considering explicitly modeled goalshave been found. In order to perform a goal-oriented analysis, we identified threemethodological steps:
• Mapping the goals to the other architectural domains (operationalization),
• Determine if the goals are being achieved in the current enterprise architecture,
• If not, one must:
– Redesign the business processes considering structural issues like remov-ing activities that are adding no value, decisions that are no longer required,
– Redesign the business processes addressing performance violations liketrends of negative performance in the target values of indicators.
The current surveyed methods can be used to perform these aforementioned method-ological steps in the following way:
• Approaches for guiding the (re)design can be used to redesign business processconsidering structural issues
• Approaches for evaluating the operating process can be used to redesign thebusiness processes addressing performance violations.
At this moment, the literature review is pointing out that the best methodologies tobe adapted in order to perform a goal-oriented analysis are the techniques for enter-prise architecture analysis depicted in [17]. Furthermore, we are not sure yet about thescope of the thesis, i.e., which of the aforementioned steps we aim at solving with thisthesis.
3 Conclusions
This paper reported the state of art in BPM in terms of activities, languages andmethodologies to support a goal-oriented BPM. Furthermore, it positions our approachfor a goal-oriented methodology, by depicts the current achievements in terms of lan-guage and methodologies that we have obtained so far.
As a general conclusion, we may say that there is a huge gap between linking busi-ness strategies to the management of operational performance from a methodologicalpoint of view, as also noticed by [19]. This can be accounted by the fact that goals arestated from a management perspective, while the existent methods in BPM for evalua-tion of process quality are not yet fully effective from a management perspective [19].
A roadmap of this thesis can be summarized as follows:
• Contributions obtained up to this moment: proposal of a framework to tackle thelanguage component of the problem of goal-oriented process analysis,
Fall Workshop 2012 17
References
• Work in progress: methodology for goal elicitation and modeling and modelingmethodology for process specific indicators,
• Expected future contributions: goal operationalization and goal-oriented enter-prise architecture redesign method, however, the scope is not well-defined yet.
References
[1] Persson Anne Bubenko, Janis and Janis Stirna. D3 Appendix B: EKD User Guide.Project Deliverable, 2001.
[2] Evellin Cristine Souza Cardoso, João Paulo A. Almeida, and Renata S. S. Guiz-zardi. On the support for the goal domain in enterprise modelling approaches. InEDOCW, pages 335–344, 2010.
[3] M. Castellanos, F. Casati, U. Dayal, and M. Shan. A Comprehensive and Auto-mated Approach to Intelligent Business Processes Execution Analysis. Distrib.Parallel Databases, 16:239–273, November 2004.
[4] M. Castellanos, F. Casati, M. Shan, and U. Dayal. iBOM: A Platform for IntelligentBusiness Operation Management. Data Engineering, International Conferenceon, 0:1084–1095, 2005.
[5] K. Cross and R. Lynch. The SMART way to define and sustain success. 1989.
[6] A. del Rio-Ortega, M. Resinas, and A. Ruiz-Cortes. Defining process performanceindicators: An ontological approach. In Robert Meersman, Tharam Dillon, andPilar Herrero, editors, On the Move to Meaningful Internet Systems: OTM 2010,volume 6426 of Lecture Notes in Computer Science, pages 555–572. SpringerBerlin / Heidelberg, 2010. 10.1007/978-3-642-16934-2_41.
[7] Wilco Engelsman and Roel Wieringa. Goal-oriented requirements engineeringand enterprise architecture: Two case studies and some lessons learned. InBjörn Regnell and Daniela Damian, editors, Requirements Engineering: Founda-tion for Software Quality, volume 7195 of Lecture Notes in Computer Science,pages 306–320, London, March 2012. Springer Verlag.
[8] Cardoso Evellin. A Conceptual Framework for Goal-Oriented Process Monitoring.BPT Technical Report 12, 2012.
[9] M. Franco-Santos, M. Kennerley, P. Micheli, V. Martinez, S. Mason, B. Marr,D. Gray, and A. Neely. Towards a definition of a business performance mea-surement system. International Journal of Operations & Production Management,27(8):784–801, 2007.
[10] Ulrich Frank, David Heise, Heiko Kattenstroth, and Hanno Schauer. Design-ing and utilising business indicator systems within enterprise models-outline ofa method. In MobIS, pages 89–105, 2008.
18 Fall Workshop 2012

References
[11] D. Grigori, F. Casati, M. Castellanos, U. Dayal, M. Sayal, and M. Shan. Businessprocess intelligence. Comput. Ind., 53:321–343, April 2004.
[12] The Object Management Group. Business process maturity model (bpmm), 2008.
[13] James Hammer, Michael und Champy. Reengineering the Corporation: A Mani-festo for Business Revolution. Harper Business, 2003.
[14] R. Kaplan and D. Norton. Using the Balanced Scorecard as a Strategic Manage-ment System. Harvard Business Review, (January-February):75–85, 1996.
[15] J. Kolar. Business Activity Monitoring. PhD thesis, Czech Republic, 2009.
[16] P. Kueng and A. J. W. Krahn. Building a process performance measurementsystem: some early experiences. Journal of Scientific and Industrial Research,58:149–159, 1999.
[17] Marc Lankhorst. Enterprise Architecture at Work: Modelling, Communication andAnalysis. Springer, 3 edition, 2012.
[18] M.J. Lebas. Performance measurement and performance management. 1995.
[19] Matthias Lohrmann and Manfred Reichert. Understanding business process qual-ity. In Advances in Business Process Management. Springer, 2012.
[20] A. Neely, C. Adams, and P. Crowe. The performance prism in practice. 2001.
[21] A. Neely, M. Gregory, and K. Platts. Performance measurement system design:A literature review and research agenda. International Journal of Operations &Production Management, 15(4), 1995.
[22] Dick Quartel, Wilco Engelsman, Henk Jonkers, and Marten Sinderen van. A goal-oriented requirements modelling language for enterprise architecture. In Proceed-ings of the IEEE International Enterprise Distributed Object Computing Confer-ence, EDOC ’09, pages 3–13, Los Alamitos, CA, USA, 2009. IEEE ComputerSociety Press.
[23] S. and J. Ballantine. Performance measurement in service businesses revisited.International Journal of Service Industry Management, 7:6–31, 1996.
[24] Wil M. P van der Aalst. Process Mining - Discovery, Conformance and Enhance-ment of Business Processes. Springer, 2011.
[25] W.M.P. van der Aalst, A. H. M. Ter Hofstede, and M. Weske. Business ProcessManagement: A Survey. In Proceedings of the 1st International Conference onBusiness Process Management, volume 2678 of LNCS, pages 1–12. Springer-Verlag, 2003.
[26] Jan vom Brocke and Michael Rosemann. Handbook on Business Process Man-agement 1: Introduction, Methods, and Information Systems. Springer PublishingCompany, Incorporated, 1st edition, 2010.
Fall Workshop 2012 19
References
[27] Jan vom Brocke and Michael Rosemann. Handbook on Business Process Man-agement 2:Strategic Alignment, Governance, People and Culture. Springer Pub-lishing Company, Incorporated, 1st edition, 2010.
[28] M. Weske. Business Process Management: Concepts, Languages, Architectures.Springer, 2 edition, 2012.
[29] B. Wetzstein, P. Leitner, F. Rosenberg, I. Brandic, S. Dustdar, and F. Leymann.Monitoring and Analyzing Influential Factors of Business Process Performance.In 2009 IEEE International Enterprise Distributed Object Computing Conference,pages 141–150. IEEE, September 2009.
[30] Michael zur Muehlen. Workflow-Based Process Controlling: Foundation, Design,and Application of Workflow-Driven Process Information Systems. Logos Berlin,2004.
20 Fall Workshop 2012
Hybrid parallel computing with Java
Frank Feinbube
State-of-the-art computer systems are a combination of general purpose proces-sors and special function accelerators. The most common type of accelerators areGPU compute devices, which are used for some years to compute a variety of dataparallel tasks fast and energy efficient. Since the release of Intel’s Sandy Bridge ar-chitecture and AMD’s APU technology graphic compute units are integrated into eachnew processor. Despite their wide availability only a relatively small amount of projectsmakes extensive use of these hybrid systems. That applies in particular to projects thatare realized in standard languages like Java. One main reason for this is the fact thatit is laborious to learn to use the software libraries for hybrid architectures and that adeep understanding of the characteristics of the underlying hardware is often neces-sary, as well. The burden of that this creates is often too much for small and mid-sizedenterprises and project teams.
In this paper we show a way to allow such projects to get access to the hidden per-formance of hybrid systems while keeping the effort to learn new language constructsas low as possible. Our solution supports the development of new software projects aswell as the refactoring of existing software systems.
1 Introduction
The solution that we present in this paper serves as a bridge between developers usingstandard languages and state-of-the-art hybrid hardware that can be found in almostevery computer system on the market. These two classes are described in detail inSection 1.1 and 1.2.
1.1 Target Group
Standard languages like Java and C# still have a strong popularity. [24] This is not sur-prising, since they enable developers to create portable programs for different domainsand tasks in a time and cost efficient way. This is achieved mainly by abstraction.The virtual machine (JVM, .NET Framework, ...) allows developers to focus on theirapplication logic without having to think about the underlying hardware and operatingsystem. This is particularly interesting for small and medium-sized projects, becausethey rarely can afford experts that get into the details of the underlying systems. De-velopers in such projects are usually already working to their full capacity with theimplementation of the business logic. Thus they want to be able to rely on a runtimelibrary, which supports them with all tasks that they need to implement and if neces-sary use a few special libraries with which they have experience or that provide veryfast and easy access - which means in most cases, a limited set of special features.
Fall Workshop 2012 21
Hybrid parallel computing with Java
There is a huge code base of such Java-based projects. And ideally this code isreused in follow-up or side projects. If the code has to be changed in order to suit theseprojects, usually refactoring and subsequent expansion is applied. Thereby the code isconverted to a more appropriate representation, which then allows the implementationof the new features. As for the rebuild of software development time and costs areimportant here as well.
1.2 Target Systems
Computer system architectures are currently at a crossroads. Due to the power wall,the ILP wall and the memory wall it is clear that the economic potential of traditional so-lutions to improve performance with new generations of processors are exhausted. [23]Nevertheless, in order to provide further resources for performance-hungry applica-tions alternative architectures are tested, that violate well-established system featuressuch as cache coherence or fixed memory mappings. [12] Also, accelerators are stud-ied [7, 10] and integrated into end-user systems progressively. [3, 25, 26] Hybrid sys-tems of accelerators and conventional general purpose processors are now availablein almost all computer classes: from server systems [15] to COTS computers to net-books [20]. The current trend in smartphones suggests that their powerful acceleratorswill be programmable soon, as well.
The most common type of accelerators is GPU compute devices. Many successfulprojects show what performance gains can be achieved with them. [4, 18] This perfor-mance potential is waiting in a myriad of systems to accelerate computationally inten-sive projects of all kinds.
Currently, it is necessary to have a deep understanding of the characteristics of thehardware of the accelerator and the interaction with the host system in order to takeadvantage of hybrid systems. But that is about to change soon ...
2 Bridging the Gap
How to bridge the gap between the target audience introduced in Section 1.1 and cur-rent hardware presented in Section 1.2 while making it as easy as possible to programnew software and adapt existing software. In this chapter, the possible approaches tobring hybrid computing to developers using standard languages are presented.
2.1 Don’t do anything
The first way to deal with this situation is to do nothing at all. In this case, developersrough the additional performance gain and the accelerator resources remain untapped.The advantage of this solution is clear in the minimum effort for the developer - namelynone at all. The biggest disadvantage beside the untapped potential is mainly the factthat such software systems cannot expect any performance gains by future generationsof processors, since these will not be faster, but more parallel instead. [23]
22 Fall Workshop 2012
2 Bridging the Gap
2.2 Let the Operating System / Virtual Machine handle it
The main task of operating systems and virtual machines is the abstraction from andstandardization of access to lower system layers. Therefore, they are the ones whotake care of the provision of uniform interfaces to existing hardware. Particularly forthe management of execution resources and the distribution of tasks and data, theoperating system and the virtual machines were responsible.
The new generations of hardware are supported already indeed and NUMA-basedsystems can be used also, and their run-time behavior can be improved by the use ofthread pinning, for accelerators, however, this does not apply. Both GPU compute de-vices as well as the integrated GPU compute units of Intel’s Sandy Bridge architectureand AMD’s APUs are neither managed automatically by the virtual machines nor bythe operating system. Initial work regarding the integration of these accelerators withthe operating system exist already [21], but an actual implementation in mainstreamoperating systems will leave some time in coming. In contrast to this, there are alreadypromising approaches to accelerate parts of the runtime libraries of common virtualmachine. [16]
The advantage for the developers is clearly the lack of additional effort. The down-side is the unpredictability of whether and how their software systems will benefit fromfuture enhancements in the operating system and virtual machines. Short to mediumterm we cannot expect any performance gains this way.
2.3 Use Special Libraries
Accelerators have been designed for a specific purpose; the primary function of GPUcompute devices for example, is the transformation and rendering of vertices, matricesand textures. Therefore usually there are already some libraries that include an efficientimplementation of algorithms related to their specific purposes for the correspondingaccelerators. They range from matrix multiplications and fast Fourier transforms toradix sort, and more. Many of these libraries are freely available and some of themeven combine a variety of useful functions. [6,11] The portfolio of libraries that providespecial solutions grows daily.
From the perspective of a developer these libraries are especially interesting be-cause the cost of developing and maintaining the functionality is being taken care ofby others. On the other hand, however, one needs to become acquainted with theselibraries and meet the conditions of open source licenses where necessary. Moreover,developers using special libraries become dependent on them; if such a special libraryis no longer maintained, it could negatively affect their software project. Also, as auser of such a library one usually has only limited influence on its further developmentdirection.
2.4 Dig into Details
If developers want to have full control of the implementation of an algorithm essentialfor their project or want to implement their own, accelerated algorithms not yet pro-
Fall Workshop 2012 23
Hybrid parallel computing with Java
vided by others, they need to familiarize themselves with the details of the acceleratorshardware. This demands the use of C/C++ and low level APIs. [17, 19] In any case,it is necessary to know the manufacturer-specific and version-specific features of thehardware in the system and to take into account. [8] This is often realized by shippinga variety of specific implementations with the program - one implementation for eachhardware generation / configuration of each manufacturer. The appropriate implemen-tation is selected, compiled and executed at runtime.
The advantage of this approach is the full control of every detail of the implemen-tation and the associated possibility of achieving the best possible performance. How-ever, this approach also results in the greatest effort. In general, this approach is,therefore, impractical for small and medium projects.
2.5 Use Abstractions
There are already some APIs that promise abstractions and easier access indeed, [1,5]but in order to achieve acceptable performance, it is still necessary to be aware of theexecution behavior and the memory hierarchy of the accelerators and evaluate specificbest practices. [9] Still it is important to be aware of the specific characteristics of dif-fering manufacturers, hardware generations, and the configuration of the acceleratorsthat are available in the system where the program is running and to respond to this incode accordingly at runtime.
For developers, these APIs are very promising because they allow integrating theaccelerator-specific algorithms seamlessly into their software and reducing the cod-ing overhead that is required to use of low-level APIs. Unfortunately, it is still oftennecessary to formulate the code that is executed on the accelerator in a C/C++ deriva-tive. [5,22]
Our solution that overcomes these disadvantages and combines the advantages ofabstractions with the advantages of special libraries is presented below.
3 HyFor.parallel - Hybrid Loops in Java
Although there are already technologies that make it possible to use accelerators, thereis still no solution, which allows an efficient and convenient use of hybrid systems. Oursolution fills this gap.
3.1 Requirements
From the approaches presented in Section 2, as well as, the experiences of otherprojects [13] we conclude that the following properties are relevant for acceptable, use-ful solutions:
1. The effort (lines of code, code complexity, time, and cost) for new development,software advancement (refactoring) and maintenance should be as low as possi-ble. Then the solution is suitable for small and medium sized projects, as well.
24 Fall Workshop 2012
3 HyFor.parallel - Hybrid Loops in Java
2. The available resources should be utilized. The performance gain should berewarding.
3. A good share of the large variety of compute devices types that are available onthe market should be supported. The solution should also be suited for futurehardware generations.
4. The details of the underlying hardware (execution behavior, memory hierarchy)should be abstracted. This division of responsibilities also makes it possible thatdifferent developers focus on their respective area of expertise.
5. Common functions (sorting, linear algebra, ...) should be part of the package andimplemented as efficiently as possible. [13]
6. A solution should be comprehensive. In this way, it reduces the number of de-pendencies, which arise in projects that use many partial solutions.
7. Developers should have comprehensive control on the execution characteristicsof the library. In particular it should be possible to conduct high-level performancetuning. [13]
8. The solution should be implemented as a high-level API, so that it seamlesslyintegrates with the developer’s language of choice.
9. The execution layer should realize the known best practices as well as possibleto ensure good execution performance. [9]
3.2 Concept
In order to reduce the burden of training and to ensure seamless integration in a familiarenvironment, we decided to use a parallel loop as an interface to our implementation.Loops are a fundamental programming construct; parallel loops in which the indepen-dent loop bodies are executed in parallel, are widespread. [2,14] Parallel port loops arethereby suitable for both task parallel problems and for the calculation of data-parallelalgorithms. (Requirement 1, 4, 8)
The access to the accelerators is realized via OpenCL [17]. This standard wasprecisely designed to create a bridge between high-level languages, as well as, ab-stractions and the underlying hybrid systems. It is thus very detailed and close tohardware. Since we use OpenCL, we can not only support all current accelerators, butat the same time guarantee the future viability of our solution. (Requirement 3, 2)
The best practices in the area of performance optimization of hybrid systems showthat many of them can be implemented automatically by the execution layer. To en-able this static and dynamic code analysis can be used. Better results are achieved,however, if developers enrich their code with information to improve runtime decisionson possible optimizations. In Java this could be realized with Java annotations. Inparticular the distribution of data to the different kinds of memory in the memory hier-archy and to individual devices is very performance-critical. By using annotations toprovide information to influence these mappings, developers can conduct performance
Fall Workshop 2012 25
Hybrid parallel computing with Java
tuning and influence the realization of best practices by the runtime. Here is a ruleof thumb that the solution should already deliver good performance with little effort -namely the absence of annotations - and that a slightly higher effort should result ina large potential for further performance. The effort to performance gain ratio shouldtherefore be reasonable. (Requirement 7, 9) To ensure that the abstraction remainsand that developers are relieved from learning the details of the accelerator hardware,these annotations are only used to describe the data access pattern of the algorithm.The mapping on the memory of the accelerator is taken care of by our execution layer.Because developers know their algorithms best, they are able to describe the typeof access, the access frequency, the relative sequence of accesses, etc., which arecrucial for the mapping. (Requirement 1, 4, 8)
In addition, our solution delivers a portfolio of useful and commonly used functionsthat are applied in many data-parallel application domains: sorting, graph algorithms,linear algebra, ... (Requirement 5)
Our solution opens the way for the use of hybrid systems in Java projects. Thespecial focus is on light-weight, seamless integration, the full control of your own code,and the resulting mapping onto the accelerator hardware. While developers focus onthe description of their algorithms, our library takes care of the realization of possi-ble optimizations. Because we support a fundamental construct countless algorithmscan be implemented and parallelized. To further increase the comfort and improvethe performance of the projects based on our solution even further, we provide a set ofhigh-performance implementations for frequently used functions. By using our compre-hensive solution the dependence on many small projects that provide partial solutionsusing hybrid systems is reduced. (Requirement 6)
3.3 Implementation
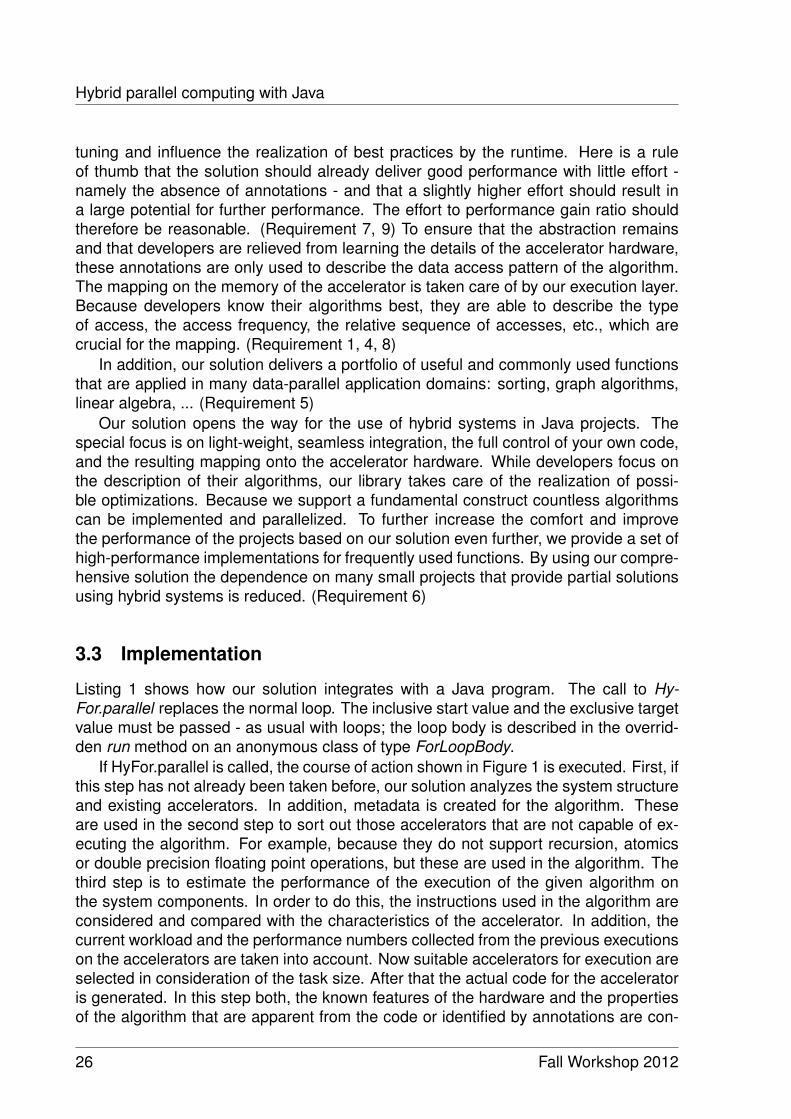
Listing 1 shows how our solution integrates with a Java program. The call to Hy-For.parallel replaces the normal loop. The inclusive start value and the exclusive targetvalue must be passed - as usual with loops; the loop body is described in the overrid-den run method on an anonymous class of type ForLoopBody.
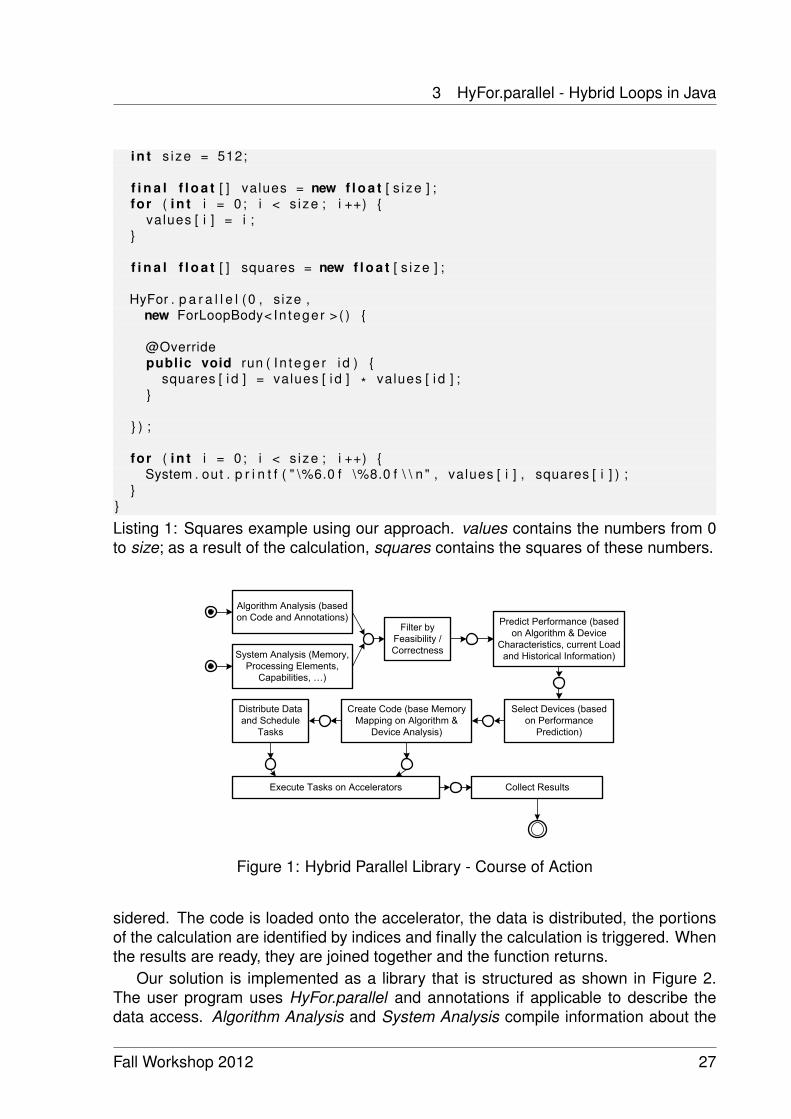
If HyFor.parallel is called, the course of action shown in Figure 1 is executed. First, ifthis step has not already been taken before, our solution analyzes the system structureand existing accelerators. In addition, metadata is created for the algorithm. Theseare used in the second step to sort out those accelerators that are not capable of ex-ecuting the algorithm. For example, because they do not support recursion, atomicsor double precision floating point operations, but these are used in the algorithm. Thethird step is to estimate the performance of the execution of the given algorithm onthe system components. In order to do this, the instructions used in the algorithm areconsidered and compared with the characteristics of the accelerator. In addition, thecurrent workload and the performance numbers collected from the previous executionson the accelerators are taken into account. Now suitable accelerators for execution areselected in consideration of the task size. After that the actual code for the acceleratoris generated. In this step both, the known features of the hardware and the propertiesof the algorithm that are apparent from the code or identified by annotations are con-
26 Fall Workshop 2012
3 HyFor.parallel - Hybrid Loops in Java
i n t s ize = 512;
f i n a l f l o a t [ ] values = new f l o a t [ s i ze ] ;for ( i n t i = 0 ; i < s ize ; i ++) {
values [ i ] = i ;}
f i n a l f l o a t [ ] squares = new f l o a t [ s i ze ] ;
HyFor . p a r a l l e l (0 , s ize ,new ForLoopBody< In teger > ( ) {
@Overridepublic void run ( I n tege r i d ) {
squares [ i d ] = values [ i d ] * values [ i d ] ;}
} ) ;
for ( i n t i = 0 ; i < s ize ; i ++) {System . out . p r i n t f ( " \%6.0 f \%8.0 f \ \ n " , values [ i ] , squares [ i ] ) ;
}}
Listing 1: Squares example using our approach. values contains the numbers from 0to size; as a result of the calculation, squares contains the squares of these numbers.
Algorithm Analysis (based
on Code and Annotations)
System Analysis (Memory,
Processing Elements,
Capabilities, …)
Filter by
Feasibility /
Correctness
Predict Performance (based
on Algorithm & Device
Characteristics, current Load
and Historical Information)
Create Code (base Memory
Mapping on Algorithm &
Device Analysis)
Distribute Data
and Schedule
Tasks
Select Devices (based
on Performance
Prediction)
Execute Tasks on Accelerators Collect Results
Figure 1: Hybrid Parallel Library - Course of Action
sidered. The code is loaded onto the accelerator, the data is distributed, the portionsof the calculation are identified by indices and finally the calculation is triggered. Whenthe results are ready, they are joined together and the function returns.
Our solution is implemented as a library that is structured as shown in Figure 2.The user program uses HyFor.parallel and annotations if applicable to describe thedata access. Algorithm Analysis and System Analysis compile information about the
Fall Workshop 2012 27
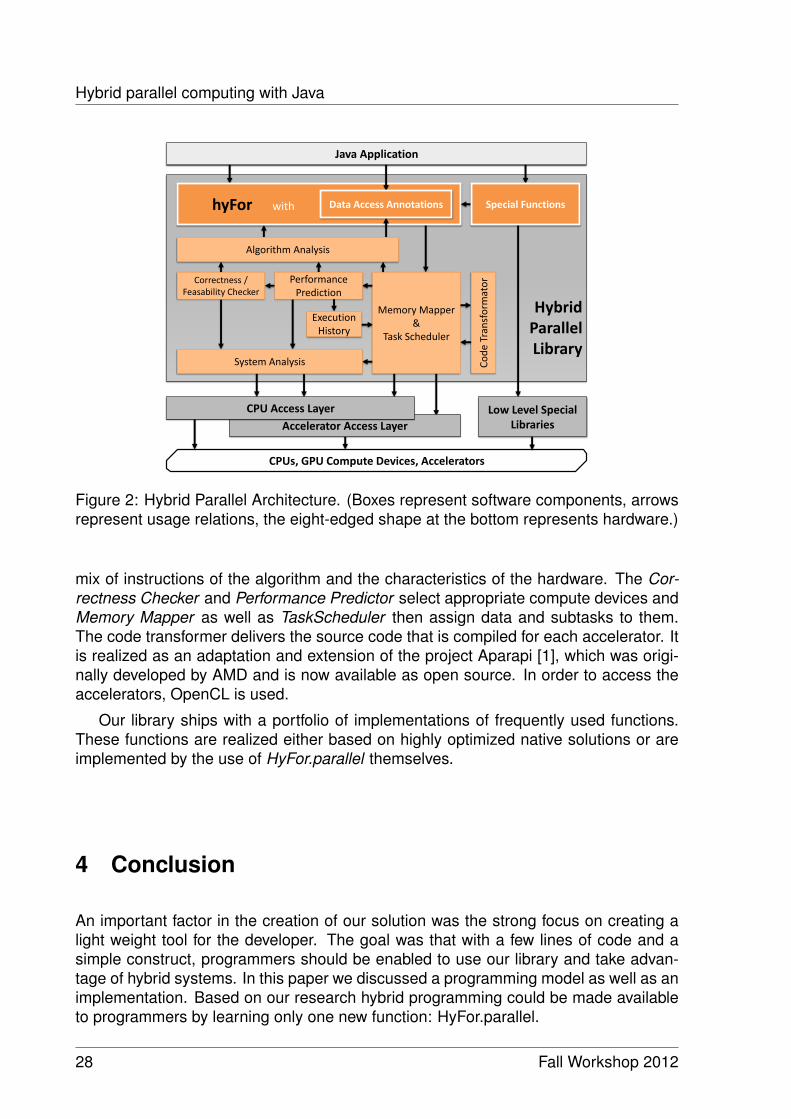
Hybrid parallel computing with Java
Hybrid Parallel Library
hyFor with _
Java Application
Correctness / Feasability Checker
Performance Prediction
Algorithm Analysis
Execution History
Data Access Annotations
CPUs, GPU Compute Devices, Accelerators
Accelerator Access Layer
Low Level Special Libraries
System Analysis
Special Functions
CPU Access Layer
Memory Mapper &
Task Scheduler
Co
de
Tra
nsf
orm
ato
r
Figure 2: Hybrid Parallel Architecture. (Boxes represent software components, arrowsrepresent usage relations, the eight-edged shape at the bottom represents hardware.)
mix of instructions of the algorithm and the characteristics of the hardware. The Cor-rectness Checker and Performance Predictor select appropriate compute devices andMemory Mapper as well as TaskScheduler then assign data and subtasks to them.The code transformer delivers the source code that is compiled for each accelerator. Itis realized as an adaptation and extension of the project Aparapi [1], which was origi-nally developed by AMD and is now available as open source. In order to access theaccelerators, OpenCL is used.
Our library ships with a portfolio of implementations of frequently used functions.These functions are realized either based on highly optimized native solutions or areimplemented by the use of HyFor.parallel themselves.
4 Conclusion
An important factor in the creation of our solution was the strong focus on creating alight weight tool for the developer. The goal was that with a few lines of code and asimple construct, programmers should be enabled to use our library and take advan-tage of hybrid systems. In this paper we discussed a programming model as well as animplementation. Based on our research hybrid programming could be made availableto programmers by learning only one new function: HyFor.parallel.
28 Fall Workshop 2012
References
References
[1] Advanced Micro Devices, Inc. Aparapi .
[2] and Chuck Koelbel. High Performance Fortran Specification Version 2.0, January1997.
[3] A. Branover, D. Foley, and M. Steinman. AMD Fusion APU: Llano . Micro, IEEE,32:28–37 , 2012.
[4] Shuai Che, Michael Boyer, Jiayuan Meng, David Tarjan, Jeremy Sheaffer, Sang-Ha Lee, and Kevin Skadron. Rodinia: A benchmark suite for heterogeneous com-puting. IEEE Workload Characterization Symposium, 0:44–54, 2009.
[5] CLyther. CLyther. http://srossross.github.com/Clyther/.
[6] J. Diaz, C. Munoz-Caro, and A. Nino. A Survey of Parallel Programming Modelsand Tools in the Multi and Many-Core Era. 23:1369 –1386 , 2012.
[7] A. Duran and M. Klemm. The Intel®Many Integrated Core Architecture. In HighPerformance Computing and Simulation, pages 365 –366.
[8] Frank Feinbube, Bernhard Rabe, Martin Löwis, and Andreas Polze. NQueens onCUDA: Optimization Issues. In 2010 Ninth International Symposium on Paralleland Distributed Computing, pages 63–70, Washington, DC, USA, 2010. IEEEComputer Society.
[9] Frank Feinbube, Peter Tröger, and Andreas Polze. Joint Forces: From Multi-threaded Programming to GPU Computing. IEEE Software, 28:51–57, October2010.
[10] H. Franke, J. Xenidis, C. Basso, B. Bass, S. Woodward, J. Brown, and C. John-son. Introduction to the wire-speed processor and architecture. IBM Journal ofResearch and Development, 54, 2010.
[11] Jared Hoberock and Nathan Bell. Thrust: open-source template library for de-veloping CUDA applications.
[12] Intel Labs. SCC External Architecture Specification (EAS), April 2010.
[13] Ken Kennedy, Charles Koelbel, and Hans Zima. The rise and fall of High Perfor-mance Fortran: an historical object lesson. In third ACM SIGPLAN conference onHistory of programming languages, pages 7–1, New York, NY, USA, 2007. ACM.
[14] Daan Leijen and Judd Hall. Parallel Performance - Optimize Managed Code ForMulti-Core Machines, 2007.
[15] E. Lindholm, J. Nickolls, S. Oberman, and J. Montrym. NVIDIA Tesla: A unifiedgraphics and computing architecture. Micro, IEEE, 28:39–55, 2008.
[16] Microsoft Corporation. Microsoft Accelerator v2 Programming Guide, 2011.
Fall Workshop 2012 29
References
[17] Aaftab Munshi. The OpenCL Specification - Version 1.1, June 2010.
[18] Nvidia. CUDA Show Case.
[19] NVIDIA. CUDA Developer Zone. http://developer.nvidia.com/category/zone/cuda-zone, 2011.
[20] Nvidia. NVIDIA ION Graphics Processors. http://www.nvidia.com/object/picoatom_specifications.html, October 2012.
[21] Christopher J. Rossbach, Jon Currey, Mark Silberstein, Baishakhi Ray, EmmettWitchel, Ted Wobber, and Peter Druschel. PTask: operating system abstractionsto manage GPUs as compute devices. In Proceedings of the 23rd ACM Sympo-sium on Operating Systems Principles 2011, pages 233–248. ACM, 2011.
[22] SourceForge. OpenCL .Net.
[23] Herb Sutter. The Free Lunch Is Over: A Fundamental Turn Toward Concurrencyin Software. Dr. Dobb’s Journal, 30, March 2005.
[24] TIOBE Software. TIOBE Programming Community Index. http://www.tiobe.com/index.php/content/paperinfo/tpci/index.html, October 2012.
[25] M. Yuffe, E. Knoll, M. Mehalel, J. Shor, and T. Kurts. A fully integrated multi-CPU,GPU and memory controller 32nm processor . In Solid-State Circuits ConferenceDigest of Technical Papers, pages 264 –266. IEEE International.
[26] Ying Zhang , Baton Rouge, and Lu Peng. Architecture comparisons betweenNvidia and ATI GPUs: Computation parallelism and data communications . InWorkload Characterization, pages 205–215. IEEE.
30 Fall Workshop 2012
On the Complex Nature of MDEEvolution – A Meta Study
Regina HebigSystem Analysis and Modeling Group
Hasso-Plattner-Institut
In context of MDE, evolution plays an important role to improve productivity and ad-dress newly arising requirements on the usually built software, like the need to providefunctionality in form of services. Therefore, it is of paramount importance to under-stand how MDE evolves in organizations. In this report, we approach the question howMDE evolution manifests in practice. Using a meta study we systematically comparedliterature that proposes techniques for evolving or changing MDE settings with reportsabout actual applications of MDE in industry. We categorize the observed evolutionsteps and illustrate a mismatch between literature and practice. In that context, wecharacterize an important class of evolution steps that has substantial impact on theMDE settings and has been not recognized yet.
1 Introduction
Model-driven engineering (MDE) is used in many domains for software development.The overarching characteristic of MDE is the use of models and dedicated automateddevelopment steps that operate on models to systematically derive large fractions ofthe software from models rather than general purpose programming language code.
In context of MDE evolution plays an important role to improve productivity andreduce time-to-market, e.g., by improving automation of development. Also newly aris-ing requirements on the usually built software can be addressed by evolution, e.g., byevolving applied domain specific languages (DSLs). Therefore, it is of paramount im-portance to understand how MDE evolves in organizations and how to cost-effectivelyrealize the necessary evolution steps.
The literature on MDE evolution is mainly considering language evolution [2, 10,26], phenomena related to metamodel evolution, and the corresponding adjustment ofconsuming or generating transformations [13,20,33,35]. An additional form of evolutionfocuses on adding languages to the MDE settings [32]. Literature that targets theproblem at a broader scope, looking at aspects such as Capability Maturity Model(CMM) for MDE [28] or the life cycle for transformation development [11], employsa similar understanding of evolution. However, in a number of studies on capturingMDE settings (the details how the models and manual as well as automated activitiesrelate to each other) in practice [12], we got the feedback that the people have beenexposed to rather substantial changes during the evolution of MDE settings in theirorganizations. Thereby, they experienced great impact on their daily work.
Fall Workshop 2012 31
On the Complex Nature of MDE Evolution – A Meta Study
In this report, we approach the question how MDE evolution manifests in practice.In a first step we performed a meta study comparing systematically literature that pro-poses techniques for evolving or changing MDE settings with reports about actual MDEsettings in industry. We categorize the observed evolution steps and illustrate a mis-match between literature and practice. In that context, we characterize an importantclass of evolution steps that has substantial impact on the MDE settings and has notbeen recognized yet.
2 Meta Study on Evolution
We performed a meta study to answer the question, whether the scope of currentresearch approaches is sufficient to capture evolution of MDE settings that occur inpractice. Following the review process is described followed by a survey of researchsupport for evolution and reports on evolution that occurred in practice. We classifychange types that occur in practice and change types that are supported by researchapproaches. We discuss differences between the change types and characterize alack in literature that prevents us from understanding the nature of MDE evolution.
2.1 Review process
To identify literature for this meta study, we systematically searched through the pro-ceedings of the MODELS conference from 2007 to 2011 and ECMFA, respectivelyECMDA-FA conferences from 2007 to 2012. the proceedings of the Workshop onModels and Evolution ME, as well as its predecessors MCCM (Workshop on ModelCo-Evolution and Consistency Management) and MoDSE (Workshop on Model-DrivenSoftware Evolution) from 2007 to 2011, the proceedings of the OOPSLA Workshopson Domain-Specific Modeling from 2007 to 2011, as well as the Software and SystemsModeling journal (SoSyM) from 2007 to 2012, including papers published online firstuntil end of July 2012. In addition, we performed online key word search and followedreferences in reviewed papers. In particular we used ACM digital library for keywordsearch in the proceedings of the ICSE conference. First, we searched for approachesthat aim to support changes in model operations (e.g., transformations and genera-tion of code), languages, or combinations of modeling techniques. The sample in thisreport was chosen so that the existing diversity of types of supported changes is rep-resented: [2,4,6,7,10,13,16,18–20,22–27,31,33,35].
Second, we searched for reports on the application of model-driven techniques ordomain-specific modeling languages in practice. Thereby, we identified thirteen reportsor case studies that describe MDE introduction or usage: [1,3,5,7,17,21,25,29,30,34]and three case studies in [14]. Cases where different aspects of the same applicationare described in multiple papers are counted as one report. We filtered the reportsaccording to two criteria. First, it was necessary to ensure that the chosen reportscapture a period of time that is long enough to expect evolution. Thus, reports thatfocus only on the an initial introduction of MDE or on settings that were used for asingle project only, were not suitable. Second, the changes need to be describedsufficiently for rating. Reports that only mention changes without further descriptions
32 Fall Workshop 2012

2 Meta Study on Evolution
could not be included. Finally, we chose five reports for this meta study: [3, 7, 17, 25,30]. These reports stem from different domains, such as telecommunication industry,financial organizations, and development of control systems.
2.2 Literature on support for evolution
In this section we give an overview of evolution steps or changes in MDE approachesthat are expected and supported by literature approaches. A first group of approachesdeals with the application of changes to the implementation of a transformation (re-ferred to as change type C1 in the following). For example, the MDPE workbench,which is introduced in [8, 9] and further discussed as one of the case studies in [25],contains a transformation chain that transforms input models of different (partly pro-prietary) languages to a representation that conforms to an intermediate meta-model(Tool-independent Performance Model (TIPM)). The TIPM models are then automati-cally transformed to input formats of different performance analysis tools. The analysisresults are transformed back to be presented within the context of the input model.Due to this mechanism, the MDPE workbench enables the extension of the quality as-surance with additional performance analysis tools. From the perspective of the user,such an extending evolution step only has effects on the results. Thus, the evolution isexperienced as an evolution of the implementation of an automated analysis activity.
Evolutionary changes are not the only motivation for changing a transformation. Forexample, in [18], a generator is built so that it can easily be configured to implementarchitectural decisions met within a project. In [19], the incremental development of atransformation chain is discussed. Thereby, implementations of involved transforma-tions are evolved systematically to reach the desired result.
A second group of approaches deals with language evolution and migration of mod-els, such that they become valid for a new version of a meta-model (referred to aschange type C2 in the following). In [26], the Model Change Language (MCL) is intro-duced. MCL can be used to specify migration rules for models between two versionsof a meta-model. In [10], the differences between two meta-models are analyzed andused to generate a transformation that can be used to migrate the corresponding mod-els. In [2], the Modif meta-model for describing meta-model evolution is introduced.Based on that description the new meta-model version and a transformation for migrat-ing corresponding models is generated. Further examples are [31], [24], or [4], wherethe usage of higher-order model transformations to support co-evolution of models tochanges in the corresponding meta-model is proposed.
A third group of approaches deals with the adaption of transformations when meta-models of consumed models change. For some of these approaches the change of alanguage is the motivation for providing techniques for modular design and adaptionstrategies for transformations. For example, Yie et al. [35] deal with the question how afully automated transformation chain can be adapted due to additional concepts in theinput language. They propose a solution where the initial transformation chain is com-plemented by a further chain of transformations that handles the additional conceptsand a correspondence model to maintain the relations between the different transfor-mation results. Similarly, the flexibility of the MasterCraft code generator presentedin [18] is motivated by the introduction of additional concepts.
Fall Workshop 2012 33
On the Complex Nature of MDE Evolution – A Meta Study
Other approaches deal with the question how information about language changescan be used systematically to adapt consuming transformations (e.g., [13]). In [20],a semi-automated approach for the adaption of the model transformations is intro-duced. Vermolen et al. lift the semi-automated evolution of models and consumingtransformations to a more technology-independent layer by allowing also migrations ofprogramming languages or data structures [33].
Similar to the third group of approaches, the fourth group of approaches is basedon exchanging modeling languages and transformations. However, here the motivationis not the evolution of a language, but the migration to a new platform. As already pro-posed in the OMG’s MDA [27], the transformation between platform-independent modeland platform-specific model might be exchanged to address the needs of a new plat-form during generation. In [7], a corresponding migration process is presented. Theproposed approach has to be configured by exchanging the transformation betweenplatform-independent model and platform-specific model. In addition, languages ofcode might change. Meyers et al. present a combined view of evolution approaches.They subdivide language- and model evolution into four primitive scenarios, describ-ing how evolution of models, meta-models, or transformations enforces co-evolutionamong each other [22,23]. The considered scenarios are combinations of the changessupported by the approaches described above (supporting change types C1 and C2).
Finally, we identified two examples for approaches that lead to an addition of inputmodels to an automated transformation or generation activity, which is exchanged orevolved (referred to as change type C3 in the following). This changes not only thenumber of models that play a role within the affected MDE approach (referred to aschange type C4 in the following), but might also increase the number of used (model-ing) languages (referred to as change type C5 in the following). Furthermore, addingnew input models can imply a change in the number of manual modeling activities (re-ferred to as change type C6 in the following). This is not necessarily the case, sincethe new models might be reused or automatically created. However, the changes C4,C5, and C6 introduced here are manifested in change C3. As it will be shown below,the numbers of used models, languages, and manual activities can also be affected forother reasons than the addition of an input model to an automated activity.
Motivated by the need to raise the level of abstraction, starting from an existingDSL, Johannes et al. present an approach where a composition system is used toautomatically compose models of different DSLs that are defined hierarchically on topof an existing DSL in [16]. Thus, the definition of a new DSL within this approach willlead to an additional input language for the automated composition and generationbased on the composition result. Estublier et al. present a similar approach for thecomposition of DSLs as an alternative to extending existing DSLs in [6]. They presenta modifiable interpreter, where a composition model can be used to define how differentdomain-specific models are related. Additionally, this approach allows adaptation forthe interpreter in case of changes in the DSL (manifestation of C1).
34 Fall Workshop 2012
2 Meta Study on Evolution
2.3 Evolution observed in practice
In the following we summarize the results of the five reports (selected in Section 2.1)on changes of MDE settings in practice. Since the description of the change was notthe main focus of the papers, we can only include changes explicitly described in thepapers, but cannot exclude that certain types of changes are part of the example.
As described in Section 2.2, Fleurey et al. present a process for the migration ofsystems to new platforms in [7]. To apply the process it is proposed to substitute theused transformations to fit the current use case. In addition, they describe how theyactually did adapt the process to apply it for the migration of a banking application.Interestingly, the changes actually applied differ strongly from the proposed changes.In this special case, it was necessary that the resulting system conforms to the de-velopment standards of the customer. Thus, it was not sufficient to produce code,but to provide corresponding models that were synchronized with the code, such thatround-trip engineering on the migrated system was possible. Therefore, they replacedthe code generation with an automated UML extraction. They integrated the Ratio-nal Rose code generator used by the customer to generate code skeletons out of themodels. Thus, the number of tools changed (referred to as change type C7 in thefollowing). Further, they added a generation to migrate the remaining code from theplatform-independent model (extracted from the original code) into the code skeletons(C1, C2, C4,C5). Not only the chain of automated steps was affected. Conformingto the round trip engineering, some manual migration tasks have to be applied to themodels (C6). The corresponding reapplication of the Rational Rose code generationadds an additional automated step to the MDE settings (referred to as change type C8in the following). Thus, instead of being only followed by manual migration, the auto-mated migration is followed by manual migration activities on the Rational Rose model,a generation of code and further manual migration activities on the code. Thereby, theorder of manual and automated tasks change, as manual migration is intermixed withautomated code generation (referred to as change type C9 in the following).
For the Telefónica case study presented in [25], it is reported that the developedDSML for the generation of configuration files was changed later on. The first changewas the integration of the verification language EVL to incrementally check the correct-ness of the models during development. This feedback mechanism intermixes manualmodeling activities with an added automated analysis for correctness (C8,C9).
As a second change, the generation of the configuration files was exchanged byan implementation that is based on a composition system conforming to the approachreported in [16], which was already discussed in Section 2.2. Motivation for this changewas the wish to be flexible to reach higher levels of abstraction. Thus, the number ofinput models and used modeling languages changed from one to a flexible number(C3,C4,C5). With it, also the number of manual modeling activities changes for thedeveloper, who has to create a number of different DSL models (C6).
In [17], a tool vendor reports how the language FBL together with its engineeringenvironment changed. They started with providing the visual programming languageFBL together with an editor and a code generator. Over time they introduced the toolfunction test to enable developers to debug FBL (C7 ). Starting from manual program-ming with a following automated generation, the introduction of automated verification
Fall Workshop 2012 35
On the Complex Nature of MDE Evolution – A Meta Study
or debugging operations changes the order of manual and automated tasks. As resultmanual programming is followed by automated debugging and further manual correc-tion before the automated generation is applied (C8,C9). A second evolution step wasthe introduction of templates to allow programming on a higher level of abstraction. De-velopers have to choose and configure templates by specifying parameters. A chosentemplate with parameters is then automatically translated to FBL and from there codeis generated. Thus, the used language (templates instead of FBL) and the generationimplementation (transformation plus generation) changed (C1,C2).
In [30], the adoption of MDE in a financial organization is reported. The report endswith a note that further changes to the MDE settings are planned in the future. Theywant to reach better integration of different used tools (C7 ) and more automation ofthe construction phase of the lifecycle (C8). In [3], Baker et al. describe the usage ofMDE within Motorola. They report about changing tools (C7 ) and a changing numberof languages and used models (C4,C5) with the introduction of Message SequenceCharts (MSC) and SDL. Further, they report about changes in MSC (C2) that enabledthe introduction of automated generation of test cases (C8).
2.4 Summary of change types
In the following we compare changes supported by literature approaches with changesoccurring in practice. Therefore, we want to discuss the extent of the change types.Change C1 concerns exchanging or evolution of an automated activity, which might beany model operation or code generation. Whether C1 is applied or a new automatedactivity is added C8, is sometimes difficult to distinguish. Here, we consider all caseswhere an automated activity is added and used in each case together with an existingautomated activity as a change of type C1. C2 concerns exchanging or evolving aused language, while C5 concerns the addition of languages in use. Thereby, bothchanges concern modeling languages as well as programming languages or otherkinds of artifacts. Change C3 actually describes a set of constellations how changesC4, C5, and C6 can be applied. C4 concerns the change of artifact roles (i.e., expectedinput and output of manual or automated activities). Thereby, an artifact can be a modelor code. In case of additions of input models, we rated the modeling activity for creatingthe additional model as an additional manual activity (C6). However, whether modelingof two distinct models is experienced as two modeling activities or not is a subjectivequestion. Similarly, it is not always distinguishable how an additional tool is experiencedby developers. If a new tool is highly integrated into am already used tool or framework,developers might recognize it as new feature, while in other cases an additional toolcan lead to extra effort (e.g., when artifacts have to be explicitly exported and importedto be used). Finally, the change of the order of activities (C9) describes a consequenceof the application of change C6 or C8.
2.5 Structural changes vs. non-structural changes
Evolution supported in literature results from a combination of three change types:change of a model’s or artifact’s language (C2), change of a model operation’s imple-
36 Fall Workshop 2012
2 Meta Study on Evolution
mentation (C1), and addition of input artifacts consumed in a model operation (C3).However, combinations of these change types do not always suffice to describe evo-lution in practice. We first differentiate between non-structural and structural changes.Structural changes affect the number and order of tools, activities, languages, andmodels a developer has to deal with. In contrast, non-structural change only concernwhich (modeling) language is concretely used for an artifact/model and how an auto-mated activity (i.e., transformation or generation) is implemented. Thus, only one kindof structural change is currently supported in the literature, which is the addition of inputartifacts to an automated activity.
Changing an MDE setting leads to changes for developers and a company. Thiscan affect the degree of automation of development, the complexity to work with theMDE setting, and the changeability and maintainability of the software that it built withthe MDE setting. Further, the effort for maintaining consistency and integration effortwhen working with different tools is affected. Finally, tools and automated activities thatare used in an MDE setting, need to be maintained and, therefore, affect the costs ofownership of a company. Since these aspects imply potentials and risks for the pro-ductivity of developers or the overall productivity of a company, respectively, we callthem productivity dimensions in the following. Changes in an automated activity (C1)as well as changes in the number of automated activities (C8) can affect the degreeof automation. Changing a used (modeling) language (C2) or the number of used lan-guages (C5) can have benefits concerning the degree of abstraction, but yields the riskthat the developers lack the know how to use that language (affecting the complexity ofthe MDE settings) [3]. Similarly, a growing number of models (C4), necessary manualactivities (C6), or tools (C7 ) increases complexity for developers. In addition, a changein the number of models affects the need to maintain the consistency of different mod-els [15]. Further, additional tools might lead to additional activities to move artifactsbetween them (increasing the integration effort). As tools and implementations of au-tomated activities have to be maintained, changes in both, number of tools C7 andnumber of automated activities C8, can affect the costs of ownership.
Finally, a main risk results from the addition of automated or manual activities if thisleads to a change of the order how manual and automated activities occur (C6, C8, andC9). This is not only due to growing complexity for developers, but also the occurrenceof constellations where automatically created artifacts are touched manually. Furtherthese changes can lengthen the chain of activities that is required to apply a change.This implies risks for changeability and maintainability, when the automated step hasto be reapplied. The main risks and potentials for non-structural changes concern thedegree of automation and the complexity of the MDE settings. In contrast, structuralchanges imply some important additional risk and potentials, like changes in the ef-fort required to maintain consistency of all required artifacts or changes in the costs ofownership. Further structural changes can have stronger effects on the different do-mains of productivity than non-structural changes. For example, increasing the numberof used languages (C5) has in most cases a worse impact on the required know howthan just applying changes to a used language (C2). Finally, there is a group of struc-tural changes (C6, C8, and C9) that can affect the changeability and maintainability ofthe software that is built with the MDE settings. This group of changes can lead to MDEsettings that contain constellations that are well known for their risks, but has also the
Fall Workshop 2012 37
On the Complex Nature of MDE Evolution – A Meta Study
potential to eliminate these risks. Therefore, we call these structural changes substan-tial structural changes in the following. Interestingly, the only structural change that isproposed in literature (C3: adding additional input artifacts to an automated activity) isrestricted in its risks to an increasing complexity and increasing effort in maintainingconsistency between the different models. With the introduction of additional input ar-tifacts C3 might lead to the additional introduction of manual activities preceding thechanges activity for creating these input artifact (unless these artifacts are reused). Ifthis change type is not combined with the introduction of automated activities C8 tosupport the creation of the additional input artifacts automatically, C3 does not lead toa risky change of the order of manual and automated activities.
To sum up, non-structural changes tend to affect only single productivity dimensions(C1 affects degree of automation, C2 affects the complexity ). In contrast, a structuralchange affects multiple productivity dimensions (e.g., C8 affects degree of automation,costs of ownership, and changeability and maintainability ). In consequence, structuralchanges yield the difficulty that improvements in one productivity dimension can comealong with a change for the worse for another dimension. Evolution of MDE settingsresults from a single or combined occurrence of changes. A change can comply withmultiple change types. E.g., adding a new automated activity (C8) in between two man-ual activities changes the order of automated and manual activities (C9), too. However,different changes can also occur in combination, e.g., exchanging the implementationof an automated activity (C1) can render a manual activity unnecessary (C6). Evo-lution consists of evolution steps, which include one or more changes. Thereby, anevolution step contains all changes that modified a version of an MDE setting that waspractically used to another version that is or was practically used. We call an evolu-tion step structural evolution step if the set of changes contains at least one structuralchange. Similarly, we call an evolution step substantial evolution step if the set ofchanges contains at least one substantial structural change. We call the evolution ofan MDE setting that contains a least one structural evolution step structural evolution.The combined occurrence of different changes in one evolution steps can enhancethe difficulty to improve one productivity dimension without a change for the worse foranother dimension.
Subsuming, changes that occur in practice (like substantial structural changes) canimply risks that are not caused by changes supported by literature approaches. Fur-ther, especially structural evolution, affects multiple productivity dimensions.
2.6 Threats to validity
We identified that structural changes occur. However, we cannot provide any empiricalstatement about the probability that an MDE settings is affected by structural changes.We do not expect structural changes to be seldom, since we found occurrences forstructural changes not only in the meta study. Initially we were confronted with struc-tural changes in a field study, where we did not focus on evolution. Further, it cannotbe claimed that structural changes occur in every domain in software engineering.However, the examples discussed in this report are from different domains, such astelecommunication industry, financial organizations, and enterprise applications.
38 Fall Workshop 2012

3 Conclusion
3 Conclusion
Using the meta study we identified the class of structural evolution steps that can beobserved in industry. It turned out that this kind of evolution steps is rarely or, in caseof substantial structural evolution steps, not at all covered by techniques proposed inliterature for evolving or changing MDE settings.
References[1] Thomas Aschauer, Gerd Dauenhauer, and Wolfgang Pree. A modeling language’s evolution driven by tight interaction
between academia and industry. In Proceedings of the 32nd ACM/IEEE International Conference on Software Engineering- Volume 2, ICSE ’10, pages 49–58, 2010. ACM.
[2] Jean-Philippe Babau and Mickael Kerboeuf. Domain Specific Language Modeling Facilities. In Proceedings of the 5thMoDELS workshop on Models and Evolution, pages 1–6, October 2011.
[3] Paul Baker, Shiou Loh, and Frank Weil. Model-Driven Engineering in a Large Industrial Context – Motorola Case Study. InLionel Briand and Clay Williams, editors, Model Driven Engineering Languages and Systems, volume 3713 of Lecture Notesin Computer Science, pages 476–491. Springer Berlin / Heidelberg, 2005.
[4] Antonio Cicchetti, Davide Di Ruscio, Romina Eramo, and Alfonso Pierantonio. Automating Co-evolution in Model-DrivenEngineering. In Proceedings of the 2008 12th International IEEE Enterprise Distributed Object Computing Conference,pages 222–231, 2008. IEEE Computer Society.
[5] Gan Deng, Tao Lu, Emre Turkay, Aniruddha Gokhale, Douglas C. Schmidt, and Andrey Nechypurenko. Model Driven Devel-opment of Inventory Tracking System. In Proceedings of the ACM OOPSLA 2003 Workshop on Domain-Specific ModelingLanguages, October 2003.
[6] Jacky Estublier, German Vega, and Anca Ionita. Composing Domain-Specific Languages for Wide-Scope Software En-gineering Applications. In Lionel Briand and Clay Williams, editors, Model Driven Engineering Languages and Systems,volume 3713 of Lecture Notes in Computer Science, pages 69–83. Springer Berlin / Heidelberg, 2005.
[7] Franck Fleurey, Erwan Breton, Benoît Baudry, Alain Nicolas, and Jean-Marc Jézéquel. Model-Driven Engineering for Soft-ware Migration in a Large Industrial Context. In Gregor Engels, Bill Opdyke, Douglas Schmidt, and Frank Weil, editors, ModelDriven Engineering Languages and Systems, volume 4735 of Lecture Notes in Computer Science, pages 482–497. SpringerBerlin / Heidelberg, 2007.
[8] Mathias Fritzsche, Hugo Brunelière, Bert Vanhooff, Yolande Berbers, Frédéric Jouault, and Wasif Gilani. Applying Meg-amodelling to Model Driven Performance Engineering. In ECBS ’09: Proceedings of the 2009 16th Annual IEEE InternationalConference and Workshop on the Engineering of Computer Based Systems, pages 244–253, 2009. IEEE Computer Society.
[9] Mathias Fritzsche and Jendrik Johannes. Putting Performance Engineering into Model-Driven Engineering: Model-DrivenPerformance Engineering. In Holger Giese, editor, Models in Software Engineering, volume 5002 of Lecture Notes in Com-puter Science, pages 164–175. Springer Berlin / Heidelberg, 2008.
[10] Kelly Garcés, Frédéric Jouault, Pierre Cointe, and Jean Bézivin. Managing Model Adaptation by Precise Detection of Meta-model Changes. In ECMDA-FA ’09: Proceedings of the 5th European Conference on Model Driven Architecture - Founda-tions and Applications, pages 34–49, Berlin, Heidelberg, 2009. Springer-Verlag.
[11] Esther Guerra, Juan de Lara, Dimitrios Kolovos, Richard Paige, and Osmar dos Santos. Engineering model transformationswith transML. Software and Systems Modeling, pages 1–23. 10.1007/s10270-011-0211-2.
[12] Regina Hebig and Holger Giese. MDE Settings in SAP. A Descriptive Field Study. Technical Report 58, Hasso-PlattnerInstitut at University of Potsdam, 2012.
[13] Markus Herrmannsdoerfer, Daniel Ratiu, and Guido Wachsmuth. Language Evolution in Practice: The History of GMF. InMark Van den Brand, Dragan Gasevic, and Jeff Gray, editors, Software Language Engineering, volume 5969 of LectureNotes in Computer Science, pages 3–22. Springer Berlin / Heidelberg, 2010.
[14] John Hutchinson, Mark Rouncefield, and Jon Whittle. Model-driven engineering practices in industry. In Proceeding of the33rd international conference on Software engineering, ICSE ’11, pages 633–642, 2011. ACM.
[15] John Hutchinson, Jon Whittle, Mark Rouncefield, and Steinar Kristoffersen. Empirical assessment of MDE in industry. InProceeding of the 33rd international conference on Software engineering, ICSE ’11, pages 471–480, 2011. ACM.
[16] Jendrik Johannes and Miguel Fernandez. Adding Abstraction and Reuse to a Network Modelling Tool Using the ReusewareComposition Framework. In Thomas Kühne, Bran Selic, Marie-Pierre Gervais, and FranÇois Terrier, editors, Modelling Foun-dations and Applications, volume 6138 of Lecture Notes in Computer Science, pages 132–143. Springer Berlin / Heidelberg,2010.
[17] M. Karaila. Evolution of a Domain Specific Language and its engineering environment – Lehman’s laws revisited. In Pro-ceedings of the 9th OOPSLA Workshop on Domain-Specific Modeling, 2009.
[18] Vinay Kulkarni, Souvik Barat, and Uday Ramteerthkar. Early Experience with Agile Methodology in a Model-Driven Approach.In Jon Whittle, Tony Clark, and Thomas Kühne, editors, Model Driven Engineering Languages and Systems, volume 6981of Lecture Notes in Computer Science, pages 578–590. Springer Berlin / Heidelberg, 2011.
Fall Workshop 2012 39

References
[19] Jochen Küster, Thomas Gschwind, and Olaf Zimmermann. Incremental Development of Model Transformation Chains UsingAutomated Testing. In Model Driven Engineering Languages and Systems: 12th International Conference, MODELS 2009,volume 5795/2009 of Lecture Notes in Computer Science (LNCS), pages 733–747. Springer Berlin / Heidelberg, 2009.
[20] Tihamer Levendovszky, Daniel Balasubramanian, Anantha Narayanan, and Gabor Karsai. A Novel Approach to Semi-automated Evolution of DSML Model Transformation. In Mark Van den Brand, Dragan Gasevic, and Jeff Gray, editors,Software Language Engineering, volume 5969 of Lecture Notes in Computer Science, pages 23–41. Springer Berlin / Hei-delberg, 2010.
[21] Nikolai Mansurov and Djenana Campara. Managed Architecture of Existing Code as a Practical Transition Towards MDA. InNuno Jardim Nunes, Bran Selic, Alberto Rodrigues da Silva, and Ambrosio Toval Alvarez, editors, UML Modeling Languagesand Applications, volume 3297 of Lecture Notes in Computer Science, pages 219–233. Springer Berlin / Heidelberg, 2005.
[22] Bart Meyers, Raphael Mannadiar, and Hans Vangheluwe. Evolution of Modelling Languages. In 8th BElgian-NEtherlandssoftware eVOLution seminar (BENEVOL), 2009.
[23] Bart Meyers and Hans Vangheluwe. A framework for evolution of modelling languages. Science of Computer Programming,Special Issue on Software Evolution, Adaptability and Variability, 76(12):1223 – 1246, 2011.
[24] Bart Meyers, Manuel Wimmer, Antonio Cicchetti, and Jonathan Sprinkle. A generic in-place transformation-based approachto structured model co-evolution. In Proceedings of the 4th International Workshop on Multi-Paradigm Modeling (MPM’10)@ MoDELS’10. Electronic Communications of the EASST, 2010.
[25] Parastoo Mohagheghi, Wasif Gilani, Alin Stefanescu, Miguel Fernandez, Bjørn Nordmoen, and Mathias Fritzsche. Wheredoes model-driven engineering help? Experiences from three industrial cases. Software and Systems Modeling, pages1–21. 10.1007/s10270-011-0219-7.
[26] Anantha Narayanan, Tihamer Levendovszky, Daniel Balasubramanian, and Gabor Karsai. Automatic Domain Model Migra-tion to Manage Metamodel Evolution. In Andy Schürr and Bran Selic, editors, Model Driven Engineering Languages andSystems, volume 5795 of Lecture Notes in Computer Science, pages 706–711. Springer Berlin / Heidelberg, 2009.
[27] Object Management Group. MDA Guide Version 1.0.1, June 2003. Document – omg/03-06-01.
[28] Erkuden Rios, Teodora Bozheva, Aitor Bediaga, and Nathalie Guilloreau. MDD Maturity Model: A Roadmap for IntroducingModel-Driven Development. In Model Driven Architecture – Foundations and Applications, volume 4066/2006 of LectureNotes in Computer Science, pages 78–89. SpringerLink, 2006.
[29] Andrey Sadovykh, Lionel Vigier, Eduardo Gomez, Andreas Hoffmann, Juergen Grossmann, and Oleg Estekhin. On StudyResults: Round Trip Engineering of Space Systems. In Richard Paige, Alan Hartman, and Arend Rensink, editors, ModelDriven Architecture - Foundations and Applications, volume 5562 of Lecture Notes in Computer Science, pages 265–276.Springer Berlin / Heidelberg, 2009.
[30] Dov Shirtz, Michael Kazakov, and Yael Shaham-Gafni. Adopting model driven development in a large financial organization.In Proceedings of the 3rd European conference on Model driven architecture-foundations and applications, ECMDA-FA’07,pages 172–183, Berlin, Heidelberg, 2007. Springer-Verlag.
[31] Mark Van den Brand, Zvezdan Protic’, and Tom Verhoeff. A Generic Solution for Syntax-Driven Model Co-evolution. In JudithBishop and Antonio Vallecillo, editors, Objects, Models, Components, Patterns, volume 6705 of Lecture Notes in ComputerScience, pages 36–51. Springer Berlin / Heidelberg, 2011.
[32] Arie van Deursen, Eelco Visser, and Jos Warmer. Model-Driven Software Evolution: A Research Agenda. In D. Tamzalit,editor, CSMR Workshop on Model-Driven Software Evolution (MoDSE 2007), pages 41–49, March 2007.
[33] Sander Vermolen and Eelco Visser. Heterogeneous Coupled Evolution of Software Languages. In Krzysztof Czarnecki,Ileana Ober, Jean-Michel Bruel, Axel Uhl, and Markus Völter, editors, Model Driven Engineering Languages and Systems,volume 5301 of Lecture Notes in Computer Science, pages 630–644. Springer Berlin / Heidelberg, 2008.
[34] Regis Vogel. Practical case study of MDD infusion in a SME: Final Results. In Dalila Tamzalit, Dirk Deridder, and BernhardSchätz, editors, Models and Evolution Joint MODELS’09 Workshop on Model-Driven Software Evolution (MoDSE) and ModelCo-Evolution and Consistency Management (MCCM),, pages 68–78, 2009.
[35] Andrés Yie, Rubby Casallas, Dennis Wagelaar, and Dirk Deridder. An Approach for Evolving Transformation Chains. InAndy Schürr and Bran Selic, editors, Model Driven Engineering Languages and Systems, volume 5795 of Lecture Notes inComputer Science, pages 551–555. Springer Berlin / Heidelberg, 2009.
40 Fall Workshop 2012
Steuerung der Datenübertragung inöffentlichen zellularen Netzen im Kontext
telemedizinischer Anwendungen
Uwe Hentschel
FG Betriebssysteme & MiddlewareHasso-Plattner-Institut
Die Bearbeitung und Weiterleitung von medizinischen Daten folgt dem Grundsatzder Datensicherheit. Das bedeutet vor allem, dass einmal erfasste Daten nicht mehraus dem System verschwinden dürfen, auch wenn einzelne Teile oder das gesamteSystem ausfallen sollten. Speziell für die Übertragung heißt das, dass alle Daten beimSender zumindest solange dauerhaft gespeichert werden, bis der Empfänger seiner-seits die erfolgreiche Speicherung quittiert. Das heißt, eine reine Empfangsquittungdes Empfängers ist nicht ausreichend, um die Daten auf der Senderseite zu löschen.
Verallgemeinert man die aus dem Fontane Projekt bekannte medizinische Nutzungder Endgeräte auf der Klientenseite, kann man von einer oder mehreren medizini-schen Anwendungen auf jedem Endgerät ausgehen. Bei der Nutzung gemeinsamerNetzwerkressourcen müssen also unterschiedliche Endgeräte im Netzwerk als auchunterschiedliche Anwendungen auf jedem der Endgeräte synchronisiert werden.
1 Synchronisation auf Anwendungsebene
Die Anwendungen auf den mobilen Endgeräten sollen Daten entsprechend ihrer Dring-lichkeit an den zentralen Server übermitteln und sich dabei auf unterschiedliche Kom-munikationsbedingungen einstellen, indem sie die Menge der pro Zeiteinheit gesende-ten Daten variieren. Dafür muss sich das Verhalten der Anwendungen entsprechendanpassen lassen – wir benötigen ein adaptives System innerhalb der Endgeräte. Die-ser Ansatz geht davon aus, dass jedes Endgerät ein autonomes Element entsprechenddes MAPE-K Modells darstellt [12,13]. In unserem Fall ist das verwaltete Element die,für die Kommunikation zwischen den Client-Geräten und dem Server, zur Verfügungstehende Datenübertragungsrate; verwaltet wird es auf Anwendungsebene. Dieser An-satz lässt sich mit Standardkomponenten für die Hardware, das Betriebssystem undden Protokollstapel realisieren.
1.1 Anwendung des MAPE-K Modells
Obwohl die Art und Weise wie sich die Kommunikationsstrategie einer Anwendungändert, stark vom Zweck ihres Einsatzes abhängig ist, erscheint die Implementierung
Fall Workshop 2012 41
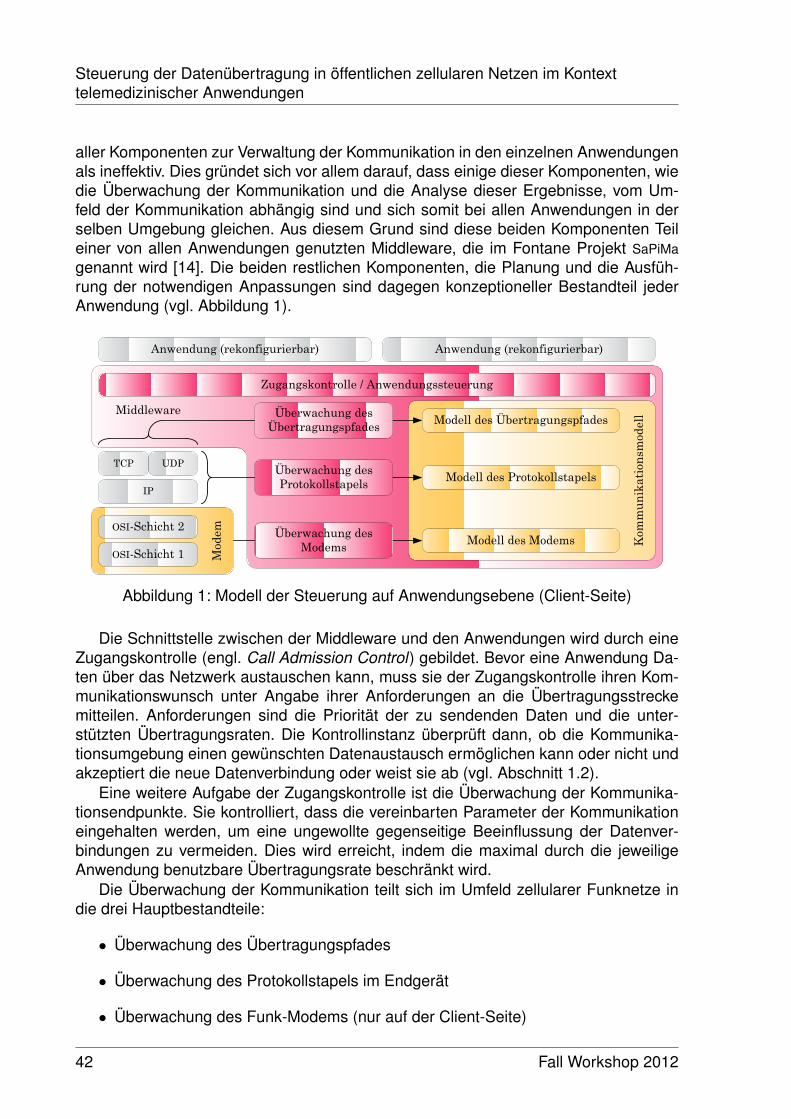
Steuerung der Datenübertragung in öffentlichen zellularen Netzen im Kontexttelemedizinischer Anwendungen
aller Komponenten zur Verwaltung der Kommunikation in den einzelnen Anwendungenals ineffektiv. Dies gründet sich vor allem darauf, dass einige dieser Komponenten, wiedie Überwachung der Kommunikation und die Analyse dieser Ergebnisse, vom Um-feld der Kommunikation abhängig sind und sich somit bei allen Anwendungen in derselben Umgebung gleichen. Aus diesem Grund sind diese beiden Komponenten Teileiner von allen Anwendungen genutzten Middleware, die im Fontane Projekt SaPiMagenannt wird [14]. Die beiden restlichen Komponenten, die Planung und die Ausfüh-rung der notwendigen Anpassungen sind dagegen konzeptioneller Bestandteil jederAnwendung (vgl. Abbildung 1).
Middleware
Kom
mun
ikat
ions
mod
ell
IP
Anwendung (rekonfigurierbar) Anwendung (rekonfigurierbar)
Überwachung desModems
Überwachung desProtokollstapels
Überwachung des Übertragungspfades
Modell des Modems
Modell des Protokollstapels
Modell des Übertragungspfades
Zugangskontrolle / Anwendungssteuerung
UDP
Mod
emOSI-Schicht 2
OSI-Schicht 1
TCP
Abbildung 1: Modell der Steuerung auf Anwendungsebene (Client-Seite)
Die Schnittstelle zwischen der Middleware und den Anwendungen wird durch eineZugangskontrolle (engl. Call Admission Control) gebildet. Bevor eine Anwendung Da-ten über das Netzwerk austauschen kann, muss sie der Zugangskontrolle ihren Kom-munikationswunsch unter Angabe ihrer Anforderungen an die Übertragungsstreckemitteilen. Anforderungen sind die Priorität der zu sendenden Daten und die unter-stützten Übertragungsraten. Die Kontrollinstanz überprüft dann, ob die Kommunika-tionsumgebung einen gewünschten Datenaustausch ermöglichen kann oder nicht undakzeptiert die neue Datenverbindung oder weist sie ab (vgl. Abschnitt 1.2).
Eine weitere Aufgabe der Zugangskontrolle ist die Überwachung der Kommunika-tionsendpunkte. Sie kontrolliert, dass die vereinbarten Parameter der Kommunikationeingehalten werden, um eine ungewollte gegenseitige Beeinflussung der Datenver-bindungen zu vermeiden. Dies wird erreicht, indem die maximal durch die jeweiligeAnwendung benutzbare Übertragungsrate beschränkt wird.
Die Überwachung der Kommunikation teilt sich im Umfeld zellularer Funknetze indie drei Hauptbestandteile:
• Überwachung des Übertragungspfades
• Überwachung des Protokollstapels im Endgerät
• Überwachung des Funk-Modems (nur auf der Client-Seite)
42 Fall Workshop 2012

1 Synchronisation auf Anwendungsebene
Die Überwachung des Übertragungspfades basiert auf Ende-zu-Ende Messungen derverfügbaren Datenübertragungsrate. Die Überwachung des Protokollstapels erfolgt mitHilfe der Funktionalität, die die pcap-Bibliothek1 und das Socket-API bieten. Für dieÜberwachung des Funkmodems werden AT-Kommandos benutzt.
Zur Analyse der Ergebnisse der Überwachung wird ein modell-basierter Ansatz ge-wählt. Das Modell besteht aus drei Teilmodellen, die den jeweils überwachten Teilkom-ponenten der Kommunikation – dem Übertragungspfad, dem Protokollstapel und demFunk-Modem – entsprechen. Jedes dieser Modelle leitet aus den Daten der Überwa-chung eigene Parameter ab, die dann zur Beurteilung des Umfeldes der Kommunikati-on benutzt werden. Die Middleware löst bei Änderungen des Kommunikationsumfeldesdie Anpassung der jeweiligen Anwendungen aus.
1.2 Aufteilung der verfügbaren Übertragungsrate
Die Zugangskontrolle teilt die verfügbare Übertragungsrate entsprechend der Priori-tät der Daten auf die Anwendungen auf, die bereit sind Daten zu übertragen. Dafürerhält sie mit der Anmeldung des Übertragungswunsches von jeder Anwendung dieDatenpriorität und eine Liste der unterstützten Übertragungsraten. Für die Aufteilungder verfügbaren Übertragungsrate gibt es zwei grundsätzliche Verfahren, deren Ziel esist, dass entweder nur die Anwendungen mit den jeweils höchsten Datenprioritäten ihreDaten übertragen dürfen, oder die Zahl der Anwendungen, die ihre Daten übertragendürfen maximiert werden soll.
Variante 1: Wenn nur die Anwendungen mit den jeweils höchsten Datenpriori-täten ihre Daten übertragen sollen, dann muss die Zugangskontrolle die folgendenSchritte ausführen:
1. Weise der Anwendung mit der höchsten Datenpriorität die größtmögliche Über-tragungsrate aus der Liste zu. Gibt es mehrere Anwendungen mit dieser Daten-priorität, dann:
(a) Weise jeder von Ihnen die minimale Übertragungsrate aus der jeweiligenListe zu.
(b) Erhöhe die zugewiesene Übertragungsrate jeder Anwendung bis entwederdie verfügbare Übertragungsrate vollständig ausgeschöpft oder die maxima-le Rate für jede Anwendung erreicht ist. Ist es nicht möglich, jeder Anwen-dung ihre maximale Übertragungsrate zuzuweisen, soll jeder dieser Anwen-dungen eine annähernd gleich große Datenrate ermöglicht werden.
2. Wiederhole den Schritt 1 mit der Anwendung mit der nächstkleineren Datenprio-rität, bis entweder die verfügbare Übertragungsrate komplett aufgeteilt ist oderallen Anwendungen die größte unterstützte Rate zugewiesen wurde.
Variante 2: Wenn die verfügbare Übertragungsrate möglichst auf alle Anwendun-gen aufgeteilt werden soll, dann müssen die folgenden Schritte ausgeführt werden:
1Weitere Informationen sind für Windows Systeme unter http://www.winpcap.org/ bzw. für alleanderen Betriebssysteme unter http://www.tcpdump.org/ zu finden.
Fall Workshop 2012 43

Steuerung der Datenübertragung in öffentlichen zellularen Netzen im Kontexttelemedizinischer Anwendungen
1. Weise der Anwendung mit der höchsten Datenpriorität die niedrigste Datenra-te aus der Liste zu. Gibt es mehrere Anwendungen mit dieser Datenpriorität,dann verfahre mit allen anderen auf die gleiche Weise bis die verfügbare Über-tragungsrate ausgeschöpft ist oder allen Anwendungen kleinste unterstützte Ratezugewiesen wurde.
2. Wiederhole den Schritt 1 mit der Anwendung mit der nächstkleineren Datenprio-rität, bis entweder die verfügbare Übertragungsrate vollständig aufgeteilt ist oderallen Anwendungen die kleinste unterstützte Rate zugewiesen wurde.
3. Erhöhe die zugewiesenen Übertragungsrate der Anwendung mit der höchstenDatenpriorität auf den größtmöglichen Wert aus der zugehörigen Liste. Gibt esmehrere Anwendungen mit dieser Datenpriorität, dann erhöhe die zugewieseneÜbertragungsrate bis entweder die verfügbare Übertragungsrate vollständig aus-geschöpft oder die maximale Rate für jede Anwendung erreicht ist. Ist es nichtmöglich, jeder Anwendung ihre maximale Übertragungsrate zuzuweisen, soll je-der dieser Anwendungen eine annähernd gleich große Datenrate ermöglicht wer-den.
4. Wiederhole den Schritt 3 mit der Anwendung mit der nächstkleineren Datenprio-rität, bis entweder die verfügbare Übertragungsrate komplett aufgeteilt ist oderallen Anwendungen die größte unterstützte Rate zugewiesen wurde.
1.3 Überwachung des Modems
Die Daten werden vom Funkmodem mit Hilfe von AT-Kommandos abgefragt, die mit-tels eines virtuellen seriellen Ports über eine USB-Verbindung gesendet werden. DieUSB-Schnittstelle wird sowohl für das interne als auch das externe Modem verwendet.Das Format der Daten und deren Umfang hängt stark vom verwendeten Modem ab. Esgibt zwar eine Vielzahl standardisierter AT-Kommandos, aber ihre Implementierung istgrößtenteils optional [1,3]. Gleiches gilt für die von den Abfragekommandos zurückge-lieferten Parameter. Zudem kann der Hersteller eines Funkmodems auch zusätzlicheselbst definierte AT-Kommandos zur Verfügung stellen.
Je nach Modem stehen demzufolge unterschiedliche Informationen zur Verfügung.Beim GenPro 35e von Erco & Gener, einem externen Funkmodem, kann man mit Hilfeder Kommandos AT!GSTATUS?, AT!GSMINFO?, AT+COPS?, AT!GETRAT?, AT+CSQ, AT*CNTI=0,AT+USET?x, AT+RSCP?, AT+ECIO?, AT!HSDCAT? und AT!HSUCAT? z. B. die folgenden Datenermitteln:
• Zugriffstechnologie (Global System for Mobile Communications (GSM), UniversalMobile Telecommunications System (UMTS), . . . )
• Übertragungsverfahren (Enhanced Data Rates for GSM Evolution (EDGE), HighSpeed Uplink Packet Access (HSUPA), . . . )
• Ortsinformationen (Location Area Code (LAC), Base Station Color Code (BCC),. . . )
44 Fall Workshop 2012
1 Synchronisation auf Anwendungsebene
• Statusinformationen von Protokollautomaten (GPRS Mobility Management (GMM),Radio Resource Control (RRC), . . . )
• Empfangspegel für die aktuell genutzte Zelle und ihre Nachbarn
• Auswahlkriterien beim Wechsel einer Zelle (Path loss criterion C1, Reselectioncriterion C2, . . . )
Das Modem HP un2400 stellt im Vergleich dazu deutlich weniger Informationenzur Verfügung. Mit den Kommandos AT+COPS?, AT+CGREG?, AT+CGATT?, AT+CSQ undAT*CNTI=0 lassen sich folgende Daten ermitteln:
• Zugriffstechnologie
• Anschluss an die paketvermittelnden Domäne
• Empfangspegel der aktuellen Zelle (Received Signal Strength Indicator (RSSI))
In Smartphones mit Windows Phone als Betriebssystem gibt es eine andere Mög-lichkeit Informationen aus den untersten Schichten des Protokollstapels zu erhalten –das Application Programming Interface (API) des Microsoft .NET Framework . Die zurVerfügung gestellten Informationen entsprechen im Umfang etwa denen des Modemsvon HP, sind inhaltlich aber weniger präzise. Folgende Daten können ermittelt werden:
• Zugriffstechnologie (GSM nur indirekt über das Übertragungsverfahren)
• Verfügbare und aktuell genutztes Übertragungsverfahren (General Packet RadioService (GPRS), EDGE, High Speed Downlink Packet Access (HSDPA))
• Anschluss an die paketvermittelnden Domäne
• Empfangspegel der aktuellen Zelle als prozentualer Anteil der vollen Signalstärke
1.4 Modell des Modems
Das Modemmodell leitet aus den Daten, die vom Funkmodem gewonnen werden kön-nen, Informationen zu Ressourcen des Zugangsnetzes ab. Da in Abhängikeit des ver-wendeten Modems die zur Verfügung gestellte Datenbasis sehr stark variieren kann,sind auch die, aus dem Modell gewonnen Informationen, stark vom eingesetzten Funk-modem abhängig. Im Rahmen dieser Arbeit wurde die Mehrzahl der Analysen mit demexternen Funkmodem durchgeführt.
In Abhängigkeit der genutzten Zugriffstechnologie werden unterschiedliche techni-sche Verfahren auf der Luftschnittstelle eingesetzt – z. B. Frequency Division Duplex(FDD) und Time Division Multiple Access (TDMA) bei GSM aber FDD und Wideband CD-MA (WCDMA) bei UMTS. Sie wird also auf die grundlegenden Übertragungsparameter,wie Übertragungsrate und Übertragungsdauer, Einfluss ausüben.
Das aktuelle Übertragungsverfahren, z. B. GPRS oder Enhanced GPRS (EGPRS) imFall von GSM, und das verwendete Modulations- und Kodierungsschema (MKS) be-stimmen die maximal mögliche Datenübertragungsrate der logischen Kanäle auf der
Fall Workshop 2012 45
Steuerung der Datenübertragung in öffentlichen zellularen Netzen im Kontexttelemedizinischer Anwendungen
Luftschnittstelle [5]. Dieser Punkt kann im Rahmen der Arbeit jedoch nicht umgesetztwerden, da bei keinem der eingesetzten Funkmodems das verwendete MKS abgefragtwerden kann.
Die Ortsinformationen geben den Aufenthaltsort des mobilen Endgerätes im Fun-knetz an. Sie können lokale und globale Gültigkeit haben. Globale Bezeichner, wie dieCell Global Identification (CGI), beschreiben den Ort eindeutig innerhalb des gesamtenFunknetzes; lokale Bezeichner dagegen, wie der Base Station Identity Code (BSIC),sind nur im Umkreis des jeweiligen Strukturelementes, hier eine Basisstation, gültigund können innerhalb des Funknetzes mehrfach verwendet werden. Mit Hilfe der Orts-informationen können Zellwechsel erkannt und die Endgeräte in Abhängigkeit ihresAufenthaltsortes gruppiert werden.
Parameter, die den Status von Protokollautomaten beschreiben, können zur Be-stimmung von Zustandes der Kommunikationsverbindung genutzt werden. Damit lässtsich z. B. erkennen, ob dem Endgerät ein Kanal zur Übertragung von Daten zugewie-sen ist oder nicht, oder ob gerade ein Zellwechsel stattfindet.
Die Auswahl einer Zelle erfolgt oft anhand des Pegels des Empfangssignals. Einhoher Empfangspegel macht ein hohes Signal-Rausch-Verhältnis und damit eine guteSignalqualität wahrscheinlich. Deshalb bilden die Empfangssignalpegel die Grundlagezur Bestimmung der Auswahlkriterien für die zu benutzende Zelle. Im Fall von GSMmuss vor einem Zellwechsel das Kriterium C1 (Path loss criterion) erfüllt sein [4]. Eswird wie folgt berechnet [6]:
C1 = A−max(B,0
)A = RLA_C−RXLEV_ACCESS_MINB = MS_TXPWR_MAX_CCH−P
wobei alle Parameter in dBm angegeben werden. Der Wert A entspricht dabei dem, mitdem minimal notwendigen Empfangssignalpegel (RXLEV_ACCESS_MIN) bewerteten,gleitenden Mittelwert des gemessenen Pegels des empfangenen Signals (RLA_C). Erist ein Maß für die Qualität des Empfangssignals. Der Wert B gibt an in welchem Ver-hältnis die maximal mögliche Sendeleistung des mobilen Endgerätes (P) und die maxi-mal notwendigen Leistung liegt, die benötigt wird, um mit dem Netzwerk Informationenauszutauschen (MS_TXPWR_MAX_CCH). Er ist ein Maß für die Leistungsreserve desSenders. Das Kriterium C1 ist erfüllt, wenn der berechnete Wert größer als Null ist. MitKenntnis dieser Parameter von allen Zellen, die gerade vom Endgerät empfangbarsind, lassen sich so Zellwechsel mit gewisser Wahrscheinlichkeit vorhersagen.
1.5 Überwachung des Übertragungspfades
Bei den aktiven Ende-zu-Ende Messungen muss beachtet werden, dass die Messun-gen parallel zur Übertragung der Nutzerdaten durchgeführt werden sollen. Es ist al-so nicht möglich, eine eigenständige Datenquelle zu benutzen, die die Kapazität desÜbertragungspfades voll auslastet, oder davon auszugehen, dass während des ge-samten Messzyklus keine weiteren Daten gesendet werden. Deshalb wurde ein Ver-fahren eingesetzt, das auf der Übertragung von Paketpaaren beruht [10]. Die beidenPakete müssen die gleiche Größe haben und direkt nacheinander gesendet werden.
46 Fall Workshop 2012
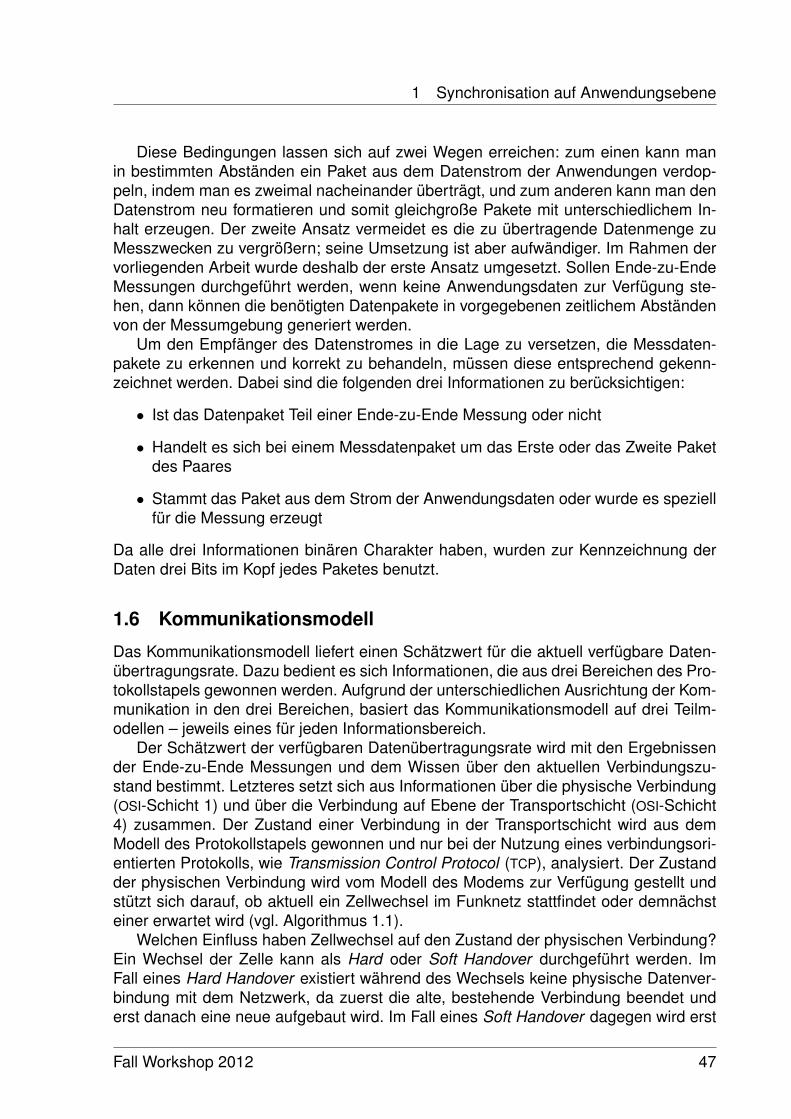
1 Synchronisation auf Anwendungsebene
Diese Bedingungen lassen sich auf zwei Wegen erreichen: zum einen kann manin bestimmten Abständen ein Paket aus dem Datenstrom der Anwendungen verdop-peln, indem man es zweimal nacheinander überträgt, und zum anderen kann man denDatenstrom neu formatieren und somit gleichgroße Pakete mit unterschiedlichem In-halt erzeugen. Der zweite Ansatz vermeidet es die zu übertragende Datenmenge zuMesszwecken zu vergrößern; seine Umsetzung ist aber aufwändiger. Im Rahmen dervorliegenden Arbeit wurde deshalb der erste Ansatz umgesetzt. Sollen Ende-zu-EndeMessungen durchgeführt werden, wenn keine Anwendungsdaten zur Verfügung ste-hen, dann können die benötigten Datenpakete in vorgegebenen zeitlichem Abständenvon der Messumgebung generiert werden.
Um den Empfänger des Datenstromes in die Lage zu versetzen, die Messdaten-pakete zu erkennen und korrekt zu behandeln, müssen diese entsprechend gekenn-zeichnet werden. Dabei sind die folgenden drei Informationen zu berücksichtigen:
• Ist das Datenpaket Teil einer Ende-zu-Ende Messung oder nicht
• Handelt es sich bei einem Messdatenpaket um das Erste oder das Zweite Paketdes Paares
• Stammt das Paket aus dem Strom der Anwendungsdaten oder wurde es speziellfür die Messung erzeugt
Da alle drei Informationen binären Charakter haben, wurden zur Kennzeichnung derDaten drei Bits im Kopf jedes Paketes benutzt.
1.6 Kommunikationsmodell
Das Kommunikationsmodell liefert einen Schätzwert für die aktuell verfügbare Daten-übertragungsrate. Dazu bedient es sich Informationen, die aus drei Bereichen des Pro-tokollstapels gewonnen werden. Aufgrund der unterschiedlichen Ausrichtung der Kom-munikation in den drei Bereichen, basiert das Kommunikationsmodell auf drei Teilm-odellen – jeweils eines für jeden Informationsbereich.
Der Schätzwert der verfügbaren Datenübertragungsrate wird mit den Ergebnissender Ende-zu-Ende Messungen und dem Wissen über den aktuellen Verbindungszu-stand bestimmt. Letzteres setzt sich aus Informationen über die physische Verbindung(OSI-Schicht 1) und über die Verbindung auf Ebene der Transportschicht (OSI-Schicht4) zusammen. Der Zustand einer Verbindung in der Transportschicht wird aus demModell des Protokollstapels gewonnen und nur bei der Nutzung eines verbindungsori-entierten Protokolls, wie Transmission Control Protocol (TCP), analysiert. Der Zustandder physischen Verbindung wird vom Modell des Modems zur Verfügung gestellt undstützt sich darauf, ob aktuell ein Zellwechsel im Funknetz stattfindet oder demnächsteiner erwartet wird (vgl. Algorithmus 1.1).
Welchen Einfluss haben Zellwechsel auf den Zustand der physischen Verbindung?Ein Wechsel der Zelle kann als Hard oder Soft Handover durchgeführt werden. ImFall eines Hard Handover existiert während des Wechsels keine physische Datenver-bindung mit dem Netzwerk, da zuerst die alte, bestehende Verbindung beendet underst danach eine neue aufgebaut wird. Im Fall eines Soft Handover dagegen wird erst
Fall Workshop 2012 47
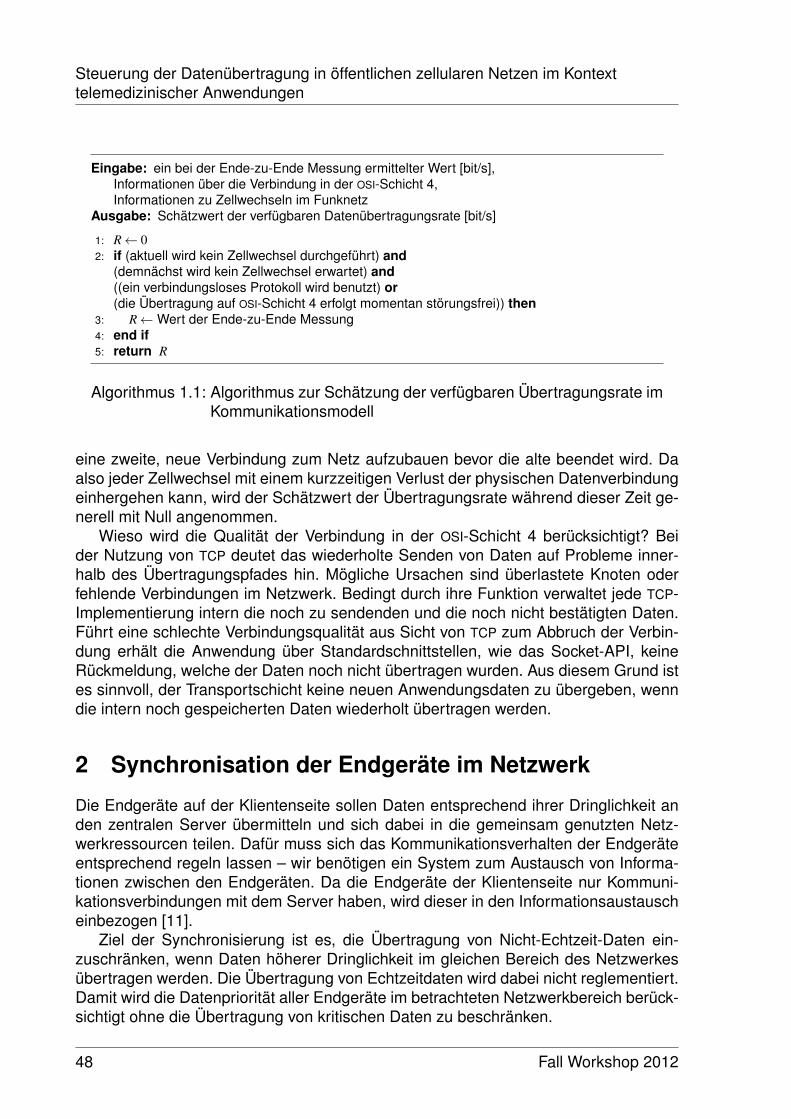
Steuerung der Datenübertragung in öffentlichen zellularen Netzen im Kontexttelemedizinischer Anwendungen
Eingabe: ein bei der Ende-zu-Ende Messung ermittelter Wert [bit/s],Informationen über die Verbindung in der OSI-Schicht 4,Informationen zu Zellwechseln im Funknetz
Ausgabe: Schätzwert der verfügbaren Datenübertragungsrate [bit/s]
1: R← 02: if (aktuell wird kein Zellwechsel durchgeführt) and
(demnächst wird kein Zellwechsel erwartet) and((ein verbindungsloses Protokoll wird benutzt) or(die Übertragung auf OSI-Schicht 4 erfolgt momentan störungsfrei)) then
3: R←Wert der Ende-zu-Ende Messung4: end if5: return R
Algorithmus 1.1: Algorithmus zur Schätzung der verfügbaren Übertragungsrate imKommunikationsmodell
eine zweite, neue Verbindung zum Netz aufzubauen bevor die alte beendet wird. Daalso jeder Zellwechsel mit einem kurzzeitigen Verlust der physischen Datenverbindungeinhergehen kann, wird der Schätzwert der Übertragungsrate während dieser Zeit ge-nerell mit Null angenommen.
Wieso wird die Qualität der Verbindung in der OSI-Schicht 4 berücksichtigt? Beider Nutzung von TCP deutet das wiederholte Senden von Daten auf Probleme inner-halb des Übertragungspfades hin. Mögliche Ursachen sind überlastete Knoten oderfehlende Verbindungen im Netzwerk. Bedingt durch ihre Funktion verwaltet jede TCP-Implementierung intern die noch zu sendenden und die noch nicht bestätigten Daten.Führt eine schlechte Verbindungsqualität aus Sicht von TCP zum Abbruch der Verbin-dung erhält die Anwendung über Standardschnittstellen, wie das Socket-API, keineRückmeldung, welche der Daten noch nicht übertragen wurden. Aus diesem Grund istes sinnvoll, der Transportschicht keine neuen Anwendungsdaten zu übergeben, wenndie intern noch gespeicherten Daten wiederholt übertragen werden.
2 Synchronisation der Endgeräte im Netzwerk
Die Endgeräte auf der Klientenseite sollen Daten entsprechend ihrer Dringlichkeit anden zentralen Server übermitteln und sich dabei in die gemeinsam genutzten Netz-werkressourcen teilen. Dafür muss sich das Kommunikationsverhalten der Endgeräteentsprechend regeln lassen – wir benötigen ein System zum Austausch von Informa-tionen zwischen den Endgeräten. Da die Endgeräte der Klientenseite nur Kommuni-kationsverbindungen mit dem Server haben, wird dieser in den Informationsaustauscheinbezogen [11].
Ziel der Synchronisierung ist es, die Übertragung von Nicht-Echtzeit-Daten ein-zuschränken, wenn Daten höherer Dringlichkeit im gleichen Bereich des Netzwerkesübertragen werden. Die Übertragung von Echtzeitdaten wird dabei nicht reglementiert.Damit wird die Datenpriorität aller Endgeräte im betrachteten Netzwerkbereich berück-sichtigt ohne die Übertragung von kritischen Daten zu beschränken.
48 Fall Workshop 2012
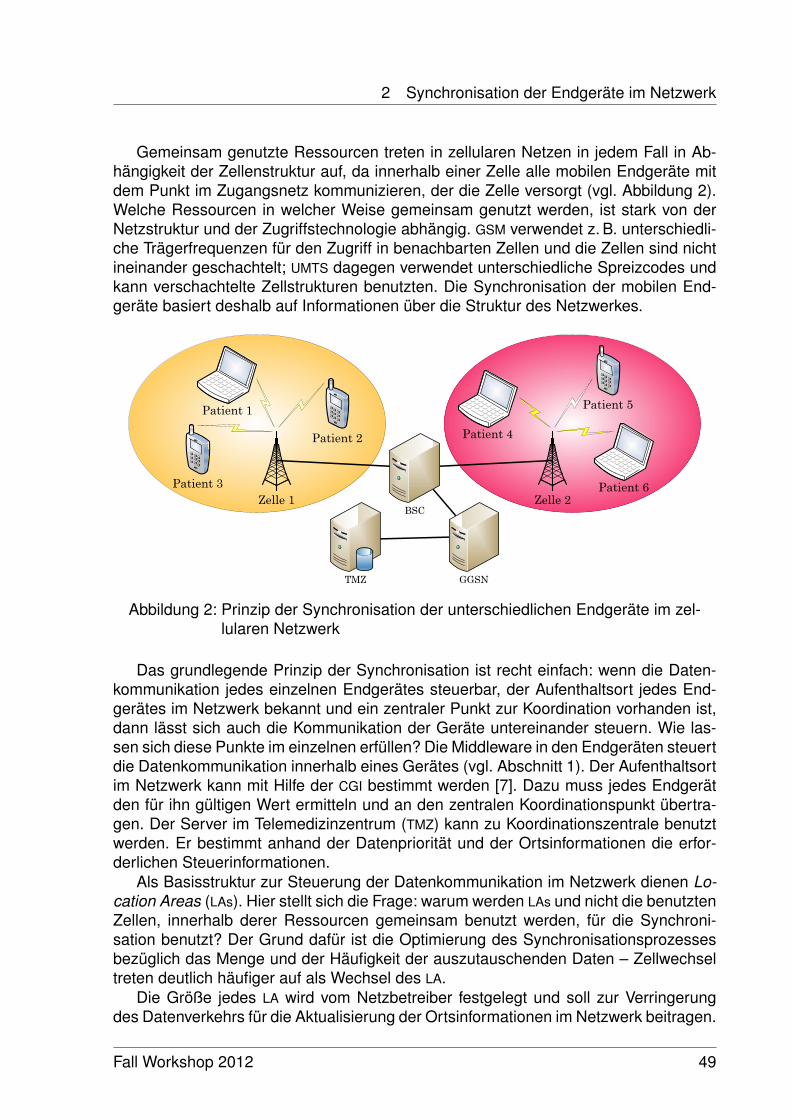
2 Synchronisation der Endgeräte im Netzwerk
Gemeinsam genutzte Ressourcen treten in zellularen Netzen in jedem Fall in Ab-hängigkeit der Zellenstruktur auf, da innerhalb einer Zelle alle mobilen Endgeräte mitdem Punkt im Zugangsnetz kommunizieren, der die Zelle versorgt (vgl. Abbildung 2).Welche Ressourcen in welcher Weise gemeinsam genutzt werden, ist stark von derNetzstruktur und der Zugriffstechnologie abhängig. GSM verwendet z. B. unterschiedli-che Trägerfrequenzen für den Zugriff in benachbarten Zellen und die Zellen sind nichtineinander geschachtelt; UMTS dagegen verwendet unterschiedliche Spreizcodes undkann verschachtelte Zellstrukturen benutzten. Die Synchronisation der mobilen End-geräte basiert deshalb auf Informationen über die Struktur des Netzwerkes.
Patient 1
Patient 4
Patient 6
Patient 2
Patient 5
Patient 3Zelle 2
GGSN
BSC
TMZ
Zelle 1
Abbildung 2: Prinzip der Synchronisation der unterschiedlichen Endgeräte im zel-lularen Netzwerk
Das grundlegende Prinzip der Synchronisation ist recht einfach: wenn die Daten-kommunikation jedes einzelnen Endgerätes steuerbar, der Aufenthaltsort jedes End-gerätes im Netzwerk bekannt und ein zentraler Punkt zur Koordination vorhanden ist,dann lässt sich auch die Kommunikation der Geräte untereinander steuern. Wie las-sen sich diese Punkte im einzelnen erfüllen? Die Middleware in den Endgeräten steuertdie Datenkommunikation innerhalb eines Gerätes (vgl. Abschnitt 1). Der Aufenthaltsortim Netzwerk kann mit Hilfe der CGI bestimmt werden [7]. Dazu muss jedes Endgerätden für ihn gültigen Wert ermitteln und an den zentralen Koordinationspunkt übertra-gen. Der Server im Telemedizinzentrum (TMZ) kann zu Koordinationszentrale benutztwerden. Er bestimmt anhand der Datenpriorität und der Ortsinformationen die erfor-derlichen Steuerinformationen.
Als Basisstruktur zur Steuerung der Datenkommunikation im Netzwerk dienen Lo-cation Areas (LAs). Hier stellt sich die Frage: warum werden LAs und nicht die benutztenZellen, innerhalb derer Ressourcen gemeinsam benutzt werden, für die Synchroni-sation benutzt? Der Grund dafür ist die Optimierung des Synchronisationsprozessesbezüglich das Menge und der Häufigkeit der auszutauschenden Daten – Zellwechseltreten deutlich häufiger auf als Wechsel des LA.
Die Größe jedes LA wird vom Netzbetreiber festgelegt und soll zur Verringerungdes Datenverkehrs für die Aktualisierung der Ortsinformationen im Netzwerk beitragen.
Fall Workshop 2012 49

References
Vom 3rd Generation Partnership Project (3GPP) wird ein LA wie folgt definiert:
The Location Area (LA) is defined as an area in which a mobile stationmay move freely without updating the VLR. A location area includes one orseveral GERAN/UTRAN cells. [9]
A location area is an area in which, after having performed a locationupdate once, MSs may roam without being required to perform subsequentlocation updates for reason of location change. A location area consists ofone or more cells. [8]
Ein zweiter Punkt, der hier beachtet werden muss, ist der Aufbau einer Verbin-dung zu einem mobilen Endgerät. Will das Netzwerk eine solche Verbindung aufbau-en, muss die Zelle bekannt sein, von der das Endgerät versorgt wird. Da das Endgerätdas Netzwerk nur auf Ebene von LAs über seinen Aufenthaltsort informiert, sendet dasNetzwerk eine Broadcast-Nachricht im gesamten LA, um das Endgerät zu suchen. Die-ser Vorgang wird als Paging bezeichnet [2]. Im Fall von GPRS wird die Paging Prozedurwie folgt beschrieben:
In A/Gb mode, paging is used by the network to identify the cell the MShas currently selected, or to prompt the mobile to re-attach if necessary asa result of network failure. . . . In Iu mode, paging is used by the networkto request the establishment of PS signalling connection or to prompt themobile to re-attach if necessary as a result of network failure. [2]
LAs sollen dazu beitragen, die Übertragung von Signalisierungsinformationen zwi-schen dem mobilen Endgerät und dem Netzwerk zu optimieren. Die Größe eines LA istalso ein Kompromiss: es muss groß genug sein, um die Anzahl der Aktualisierungsmel-dungen zu reduzieren und es muss klein genug sein, um die Suche nach einem Gerätnoch schnell und effizient zu gestalten. Es liegt also nahe anzunehmen, dass die Nut-zung vonLA anstatt von Zellen auch zu einer besseren Synchronisation der Endgeräteim Netzwerk führt.
Die Synchronisation der Endgeräte wurde experimentell durch Einführung einesSteuerprotokolls und eines Kontrollalgorithmus umgesetzt und mit Hilfe von OMNet++(siehe auch http://www.omnetpp.org/) simuliert.
References
[1] 3GPP. Technical Specification Group Core Network and Terminals; AT commandset for User Equipment (UE) (3GPP TS 27.007 V10.4.0 (Release 10)), June 2011.
[2] 3GPP. Technical Specification Group Core Network and Terminals; Mobile radiointerface Layer 3 specification; Core network protocols; Stage 3 (3GPP TS 24.008V10.3.0 (Release 10)), June 2011.
50 Fall Workshop 2012
References
[3] 3GPP. Technical Specification Group Core Network and Terminals; Use of DataTerminal Equipment - Data Circuit terminating Equipment (DTE - DCE) interfacefor Short Message Service (SMS) and Cell Broadcast Service (CBS) (3GPP TS27.005 V10.0.0 (Release 10)), March 2011.
[4] 3GPP. Technical Specification Group GSM/EDGE Radio Access Network; Func-tions related to Mobile Station (MS) in idle mode and group receive mode (3GPPTS 43.022 V10.0.0 (Release 10)), March 2011.
[5] 3GPP. Technical Specification Group GSM/EDGE Radio Access Network; Phys-ical layer on the radio path; General description (3GPP TS 45.001 V10.1.0 (Re-lease 10)), November 2011.
[6] 3GPP. Technical Specification Group GSM/EDGE Radio Access Network; Radiosubsystem link control (3GPP TS 45.008 V10.1.0 (Release 10)), May 2011.
[7] 3GPP. Technical Specification Group Services and System Aspects; Vocabularyfor 3GPP Specifications (3GPP TR 21.905 V10.3.0 (Release 10)), March 2011.
[8] 3GPP. Technical Specification Group Core Network and Terminals; Location man-agement procedures (3GPP TS 23.012 V11.0.0 (Release 11)), June 2012.
[9] 3GPP. Technical Specification Group Services and System Aspects; Networkarchitecture (3GPP TS 23.002 V11.3.0 (Release 11)), June 2012.
[10] Constantinos Dovrolis, Parameswaran Ramanathan, and David Moore. Packet-Dispersion Techniques and a Capacity-Estimation Methodology. IEEE/ACMTransactions on Networking, 12:963–977, December 2004.
[11] Uwe Hentschel, Fahad Khalid, and Andreas Polze. An Approach to Con-trol Transmission of Medical Data over Cellular Networks Using Location Infor-mation. In Proceedings of the 2012 15th IEEE International Symposium onObject/Component/Service-Oriented Real-Time Distributed Computing, ISORC’12, pages 87–94, Washington, DC, USA, 2012. IEEE Computer Society.
[12] IBM. An architectural blueprint for autonomic computing, 2003.
[13] Jeffrey O. Kephart and David M. Chess. The Vision of Autonomic Computing.Computer, 36:41–50, January 2003.
[14] Friedrich Köhler. Gesundheitsregion der Zukunft – Nordbrandenburg [FONTANE],2009.
Fall Workshop 2012 51

Heterogeneous Computing forAlgorithms with Low Numerical Intensity
Fahad Khalid
Operating Systems and Middleware GroupHasso-Plattner-Institut
The Scientific Computing community has witnessed a significant increase in ap-plications that utilize GPUs as accelerators; complementing CPU based processing.However, the feasibility of porting an algorithm to the GPU is dependent on a com-plex combination of factors that include numerical intensity, data access patterns anddata reuse. E.g. algorithms with very low numerical intensity are less likely to gainperformance if implemented on a GPU.
In this report, a problem from Systems Biology is taken as a case study for uti-lizing heterogeneous computing to improve the performance of an algorithm with lownumerical intensity. It is shown that the Map-Reduce structural pattern for parallel ap-plications can be used to split the algorithm into two phases; where the Map phasecan be optimized for a GPU implementation, while the Reduce phase can be efficientlyimplemented on the CPU. The result is a significant performance gain over a serialCPU-only implementation.
The primary objective of this research project is to determine performance improve-ment strategies that can be generalized to broader classes of low numerical intensityalgorithms. If so, heterogeneous computing can be utilized to accelerate processingfor a much larger set of problems.
1 Introduction
In recent years, research community in the High Performance Computing (HPC) andScientific Computing sectors has witnessed an increasing application of Heteroge-neous Computing [10]. The term Heterogeneous Computing (as used in this docu-ment) refers to the design of applications that can harness the power of both the CPUand the GPU for problems amenable to massive parallelism.
The rapid adaptation of the scientific community to Heterogeneous Computing isoften attributed to the GPUs’capability to perform massive amounts of arithmetic oper-ations, at very high speeds. Majority of the silicon chip area in a GPU is dedicated to anumber of arithmetic processing units. This makes it possible for the GPU to execute avery large number of arithmetic instructions in parallel. However, since most of the chiparea is committed to arithmetic processing, only small amounts of low latency memoryresides on-chip. Therefore, a memory hierarchy (similar to the traditional CPU basedsystems) is employed, but with very small sizes for low latency memory as comparedto the CPU.
Fall Workshop 2012 53
Heterogeneous Computing for Algorithms with Low Numerical Intensity
A significant number of algorithms have been successfully ported to GPUs, attain-ing up to 100x speedup over serial execution on a CPU [7]. However, due to theaforementioned architectural limitations (w.r.t. low latency memory size), this successholds only for a certain set of algorithms that can take full advantage of the GPU archi-tecture. This set of algorithms typically shows one important execution characteristic;i.e. high arithmetic/numerical intensity (compute-to-memory access ratio). The mostcommon example for such an algorithm is matrix-matrix multiplication [1].
Nevertheless, even for algorithms with high numerical intensity, porting and opti-mizing the algorithm is a tedious task that requires investing a significant amount oftime and effort. Moreover, several important algorithms have low numerical intensitye.g. Sparse Matrix-Vector Multiplication [2]. With the advent of Big Data revolution,the significance of such algorithms is further amplified; since this involves algorithmsassociated with processing of very large datasets. For such algorithms, CPU-only ar-chitectures (equipped with the much larger low latency memory) would appear moresuitable.
In the context of Heterogeneous Computing, the above considerations raise thefollowing important question:
• Is it possible to effectively utilize Heterogeneous Computing for algorithms withlow numerical intensity? Or must such algorithms be executed on CPU-only sys-tems?
In the sections to follow, the above posed question is approached by looking at a lownumerical intensity algorithm from the domain of Systems Biology. The algorithm hasalready been successfully parallelized on both shared-memory [13] and distributed-memory [4] CPU based architectures. Here, a heterogeneous architecture basedparallelization is presented.
2 Heterogeneous Computing for Enumeration of Ele-mentary Flux Modes
The set of all Elementary Flux Modes (EFM) represents the complete set of minimalpathways in the metabolic network of an organism [11]. Under steady-state conditions,the problem of enumerating EFMs is mathematically equivalent to the enumeration ofextreme rays of polyhedral cone [3]. The Nullspace algorithm [14] is known to be themost efficient algorithm for EFM enumeration. It consists of the following steps:
1. Solve a system of linear equations to get the Kernel matrix
2. Process the Kernel matrix to remove redundancies and permute it so that it isfeasible for further processing
3. For each row in the Kernel matrix (EM Matrix):
(a) Generate Candidate EM vectors
54 Fall Workshop 2012
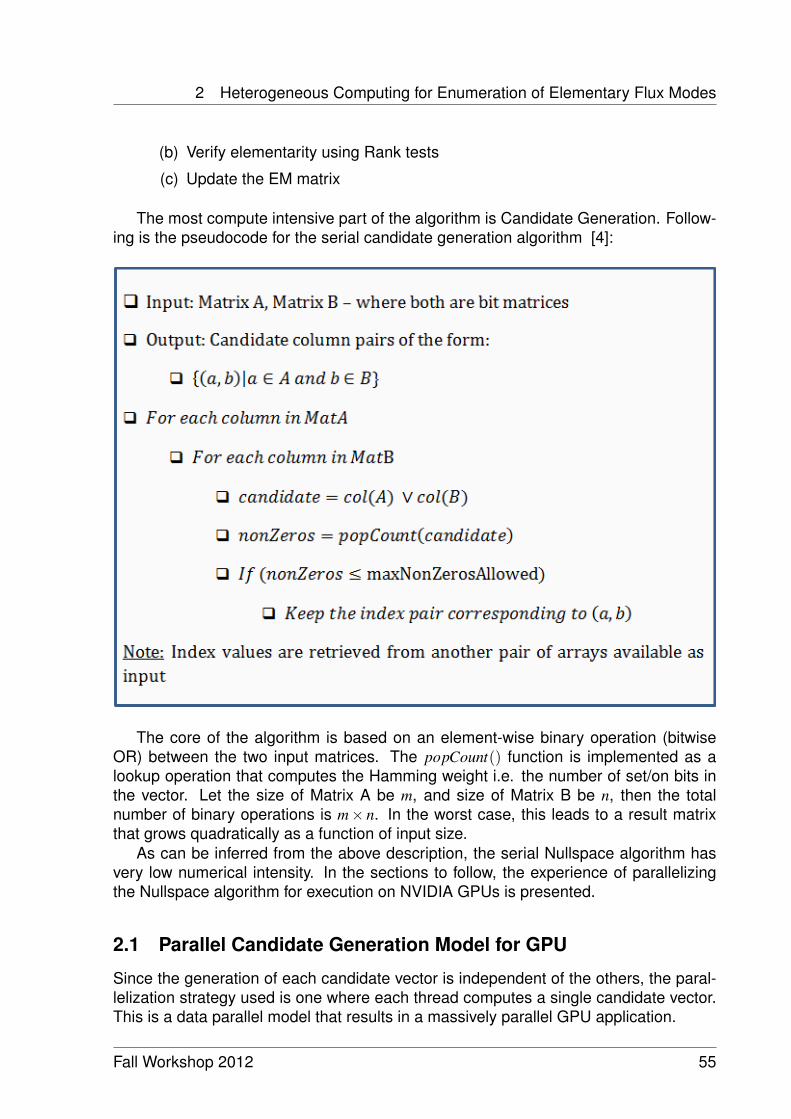
2 Heterogeneous Computing for Enumeration of Elementary Flux Modes
(b) Verify elementarity using Rank tests
(c) Update the EM matrix
The most compute intensive part of the algorithm is Candidate Generation. Follow-ing is the pseudocode for the serial candidate generation algorithm [4]:
The core of the algorithm is based on an element-wise binary operation (bitwiseOR) between the two input matrices. The popCount() function is implemented as alookup operation that computes the Hamming weight i.e. the number of set/on bits inthe vector. Let the size of Matrix A be m, and size of Matrix B be n, then the totalnumber of binary operations is m× n. In the worst case, this leads to a result matrixthat grows quadratically as a function of input size.
As can be inferred from the above description, the serial Nullspace algorithm hasvery low numerical intensity. In the sections to follow, the experience of parallelizingthe Nullspace algorithm for execution on NVIDIA GPUs is presented.
2.1 Parallel Candidate Generation Model for GPU
Since the generation of each candidate vector is independent of the others, the paral-lelization strategy used is one where each thread computes a single candidate vector.This is a data parallel model that results in a massively parallel GPU application.
Fall Workshop 2012 55

Heterogeneous Computing for Algorithms with Low Numerical Intensity
2.2 Memory Partitioning and Multiple Grid Invocations
The input size for the Nullspace algorithm grows very fast [6] and as a result just afew iterations lead to a very large size for the result data structure. The GPU globalmemory is quite limited; only 1GB for GTX 295. Therefore, a mechanism is requiredto divide the result data structure into smaller partitions that easily reside in the GPUglobal memory.
Even though partitioning is an obvious procedure, it has a rather important conse-quence in terms of performance. Ideally, a single kernel invocation should execute theentire candidate generation algorithm. However, the use of partitioning results into atleast one kernel invocation per partition. This in turn leads to a lower bound on thenumber of kernel invocations, which is equal to the number of partitions.
lower bound on number o f kernel invocations = number o f partitions
For each kernel invocation, the result values have to be copied from the device tothe host. This adds a performance penalty.
Moreover, there is an upper bound on the maximum number of blocks per grid. ForGTX 295 as well as for Tesla 2050, this limit is 65535. The upper bound on the numberof threads per grid is then derived as:
upper bound on number o f threads per grid =number o f threads per block × maximum number o f blocks per grid
The datasets computed by the Nullspace algorithm are very large, and as a result,multiple girds must be utilized. Therefore, for large input sizes, not only are multiplepartitions required, multiple grid invocations per partition are necessary as well.
2.3 Index Algebra
In order for each thread to correctly index into the input matrices and the distributedresult data structure, an Index Algebra is required. The unique thread ID for the corre-sponding element of the result matrix is given by:
indexMatC = (blockIndex × blockDim + threadIndex)+ (gridId × gridDim × blockDim)
This thread ID is unique within a single partition. A thread ID unique over all parti-tions is then derived as:
uniqueId = indexMatC + (partitionId × partitionDim)
The input matrices are indexed using Modular arithmetic. The required values arecomputed as follows:
56 Fall Workshop 2012
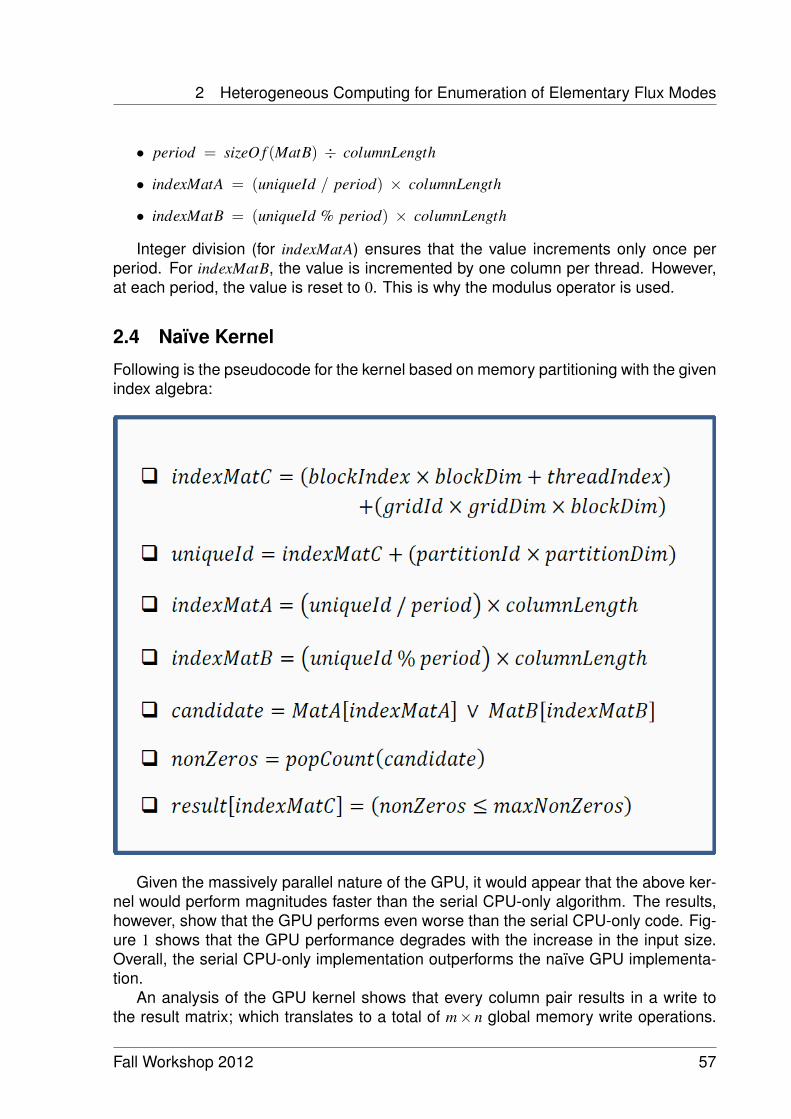
2 Heterogeneous Computing for Enumeration of Elementary Flux Modes
• period = sizeO f (MatB) ÷ columnLength
• indexMatA = (uniqueId / period) × columnLength
• indexMatB = (uniqueId % period) × columnLength
Integer division (for indexMatA) ensures that the value increments only once perperiod. For indexMatB, the value is incremented by one column per thread. However,at each period, the value is reset to 0. This is why the modulus operator is used.
2.4 Naïve Kernel
Following is the pseudocode for the kernel based on memory partitioning with the givenindex algebra:
Given the massively parallel nature of the GPU, it would appear that the above ker-nel would perform magnitudes faster than the serial CPU-only algorithm. The results,however, show that the GPU performs even worse than the serial CPU-only code. Fig-ure 1 shows that the GPU performance degrades with the increase in the input size.Overall, the serial CPU-only implementation outperforms the naïve GPU implementa-tion.
An analysis of the GPU kernel shows that every column pair results in a write tothe result matrix; which translates to a total of m× n global memory write operations.
Fall Workshop 2012 57

Heterogeneous Computing for Algorithms with Low Numerical Intensity
Figure 1: Performance comparison between the serial CPU-only implementation (blue)and the naïve GPU code (red). X-axis represents iterations of the Nullspace algorithm,which correspond to the growing input size. Y-axis represents the time taken in sec-onds.
Given that each result value is a 64-bit integer, this results in a very large result array.Therefore, most of the time is spent in transferring the result data structure betweenthe device and the host.
2.5 Employing the Map-Reduce Structural Pattern for Parallel Ap-plications
In the aforementioned pseudocode for the GPU kernel, the final step is a comparisonthat results in a Boolean value i.e. ‘0’ or ‘1’. However, as per the serial version of thealgorithm, this is just an intermediate step that eventually leads to fetching and storingthe index pair corresponding to the input elements. The kernel has been designedin a way so that only the Boolean value is computed on the GPU, and the index paircomputation is left as a post-processing step to be performed on the CPU. This divisionof work between the GPU and the CPU corresponds to the Map-Reduce structuralpattern [5] with the following two phases:
• Map: The GPU kernel. Generates candidates and stores Boolean values as theresult. Each result value represents the decision whether the pair of input vectorsshould be stored.
58 Fall Workshop 2012
2 Heterogeneous Computing for Enumeration of Elementary Flux Modes
• Reduce: A post-processing step performed on the CPU. Parses the result datastructure populated by the GPU. For all values where the decision is positive, thecorresponding pair of indices is fetched and stored in a dynamic data structure.This phase is implemented as a shared-memory parallel procedure.
One of the benefits of implementing a heterogeneous Map-Reduce pattern is thatthe GPU kernel is relieved from executing further memory intensive index fetch opera-tions. Also, the massively parallel nature of a GPU application results in concurrencyissues (mutual exclusion) if a dynamic global data structure is used to store the re-sulting index values. Therefore, relegating such operations to the CPU, results in arelatively efficient kernel.
2.6 Introducing the Compression Factor
A significant advantage of employing the Map-Reduce pattern is the possibility to ex-ploit the Boolean nature of the result computed per thread, in order to reduce the num-ber of global memory write operations by a constant factor. Since each result value isa Boolean, instead of storing the result as an integer, it is stored as a single bit. There-fore, with compressionFactor = 64, 64 results can be stored in one element of the resultarray (assuming 64-bit unsigned integers are being used in the result data structure).This makes it possible to compute compressionFactor number of candidates per thread.
As a result, size of the result data structure for the Map phase is reduced by afactor of compressionFactor. Following are two major advantages of the reduction inresult size:
1. Previously, the time spent in data transfer between the device and the host over-shadowed the time spent on computation. With the compressionFactor scheme,the balance is shifted in the favor of computation time i.e. time spent in device-host-device data transfers is negligible in comparison to the time spent in kernelexecution. This results in better utilization of the GPU resources.
2. Much more efficient user-managed caching [12] schemes can now be employed.
The performance results after implementing the Map-Reduce pattern withcompressionFactor are shown in Figure 2. The heterogeneous algorithm outperformsthe serial CPU version by achieving a relative speedup of ∼ 3.5x. Please note thatthis speedup does not include all the typical performance optimizations [9] applied toCUDA code. Efforts to further improve the performance by applying such optimiza-tions are underway. These optimizations are well known within the CUDA program-mers’ community, and therefore, will not be discussed in detail here.
2.7 Brief Overview of Planned Optimizations
Following is a brief discussion of further optimizations applicable to the heterogeneousimplementation:
Fall Workshop 2012 59

Heterogeneous Computing for Algorithms with Low Numerical Intensity
Figure 2: Performance comparison between serial CPU-only implementation (blue)and the heterogeneous Map-Reduce based implementation with compressionFactor(red). X-axis represents iterations of the Nullspace algorithm, which correspond to thegrowing input size. Y-axis represents the time taken in seconds.
• Coalesced Global Memory Access and Result Caching: Due to the use ofcompressionFactor, access to the global memory is no longer coalesced fromthreads in the same block. An improved index algebra, coupled with a coop-erative caching mechanism is being implemented to ensure coalesced accessedto the global memory. This is expected to result in a significant performanceimprovement.
• Tiled Input and Caching: Tiling can be used to implement efficient caching for theinput data. However, it is not clear at the moment if this will result in a significantperformance gain.
• Asynchronous Map-Reduce: The current implementation executes the Map andReduce phases in sequence. A multi-threaded asynchronous implementationmay lead to better overall performance.
In addition to the above mentioned possible optimizations, several typical CUDAoptimizations will be implemented.
60 Fall Workshop 2012
3 Open Questions
3 Open Questions
At this point, not all possible optimizations have been implemented. Therefore, the fullpotential of heterogeneous computing is yet to be measured for the candidate genera-tion algorithm.
The scope of this research project, however, is not limited to the implementationand optimization of the candidate generation algorithm. In terms of generalization ofresults, an attempt will be made to address the following questions:
• In the context of Heterogeneous Computing, can the use of the Map-Reducestructural pattern be generalized to a broad class of algorithms?
• For a given serial algorithm, how can one determine the optimal hardware archi-tecture in order to maximize performance?
– This is a critical decision in most situations, since cost is often a major con-straint.
– Also, this is a valid question even if the choice of hardware architecturesexcludes GPUs. Even for CPUs alone, it has been shown that the value fortheoretical FLOPS is not always an accurate measure of CPU performance[8]. It depends on factors such as the numerical intensity of the algorithm.
4 Conclusions and Outlook
In order for software designers to take full advantage of heterogeneous computing,generic patterns in low numerical intensity algorithms need to be identified that canmake it possible to gain significant performance gains over multi-threaded shared-memory CPU-only implementations. A positive result in this direction is presentedby utilizing the Map-Reduce structural pattern to improve algorithm efficiency for analgorithm from Systems Biology.
A set of further optimizations will be implemented for this application, which willprovide further insight into the full potential for utilizing Heterogeneous Computing forthis particular problem. Moreover, research will be carried out in order to see if theresults can be generalized for a broader class of algorithms.
References
[1] Aydın Buluç, John R. Gilbert, and Ceren Budak. Solving path problems on thegpu. Parallel Computing, 36(5-6):241–253, 2010.
[2] John D. Davis and Eric S. Chung. Spmv: A memory-bound application on thegpu stuck between a rock and a hard place. Technical report, Microsoft ResearchSilicon Valley, September 2012.
Fall Workshop 2012 61
References
[3] Julien Gagneur and Steffen Klamt. Computation of elementary modes: a unifyingframework and the new binary approach. BMC Bioinformatics, 5(1):175, 2004.
[4] Dimitrije Jevremovic, Cong T. Trinh, Friedrich Srienc, Carlos P. Sosa, and DanielBoley. Parallelization of nullspace algorithm for the computation of metabolic path-ways. Parallel Computing, 37(6-7):261–278, 2011.
[5] Kurt Keutzer, Berna L. Massingill, Timothy G. Mattson, and Beverly A. Sanders. Adesign pattern language for engineering (parallel) software: merging the plpp andopl projects, 2010.
[6] Steffen Klamt and Jörg Stelling. Combinatorial complexity of pathway analysis inmetabolic networks. Molecular Biology Reports, 29(1):233–236, 2002.
[7] Victor W. Lee, Changkyu Kim, Jatin Chhugani, Michael Deisher, Daehyun Kim,Anthony D. Nguyen, Nadathur Satish, Mikhail Smelyanskiy, Srinivas Chennupaty,Per Hammarlund, Ronak Singhal, and Pradeep Dubey. Debunking the 100x gpuvs. cpu myth: an evaluation of throughput computing on cpu and gpu. In Proceed-ings of the 37th annual international symposium on Computer architecture, pages451–460. ACM, 2010.
[8] Josh Mora. Do theoretical flops matter for real application performance?, 2012.HPC Advisory Council Spain Workshop.
[9] NVIDIA. Cuda c best practices guide. Design guide, January 2012.
[10] John D. Owens, David Luebke, Naga Govindaraju, Mark Harris, Jens Krüger,Aaron E. Lefohn, and Timothy J. Purcell. A survey of general-purpose compu-tation on graphics hardware. Computer Graphics Forum, 26(1):80–113, 2007.
[11] S. Schuster and C. Hilgetag. On elementary flux modes in biochemical reactionsystems at steady state. J. Biol. Syst, 2:165–182, 1994.
[12] Mark Silberstein, Assaf Schuster, Dan Geiger, Anjul Patney, and John D. Owens.Efficient computation of sum-products on gpus through software-managed cache.In Proceedings of the 22nd annual international conference on Supercomputing,ICS ’08, pages 309–318, New York, NY, USA, 2008. ACM.
[13] Marco Terzer and Jörg Stelling. Accelerating the Computation of ElementaryModes Using Pattern Trees, volume 4175 of Lecture Notes in Computer Science,pages 333–343. Springer Berlin / Heidelberg, 2006.
[14] C. Wagner. Nullspace approach to determine the elementary modes of chemicalreaction systems. The Journal of Physical Chemistry B, 108(7):2425–2431, 2004.
62 Fall Workshop 2012

3D Geovisualization Services for EfficientDistribution of 3D Geodata
Jan Klimke
Computer Graphics SystemsHasso-Plattner-Institut
Design, implementation, and operation of services for interactive 3D geovisualiza-tion are faced with a large number of challenges including (a) processing and integra-tion of massive amounts of heterogeneous and distributed 2D and 3D geodata suchas terrain models, buildings models, and thematic georeferenced data, (b) assembling,styling, and rendering 3D map contents according to application requirements and de-sign principles, and (c) interactive provisioning of created 3D maps on mobile devicesand thin clients as well as their integration as third-party components into domain-specific web and information systems. This report presents a concept and implemen-tation of a service-oriented platform that addresses these major requirements of 3Dweb mapping systems. It is based on a separation of concerns for data management,3D rendering, application logic, and user interaction. The main idea is to divide 3Drendering process into two stages. In the first stage, at the server side, an image-based representation of the 3D scene is created by means of multi-layered virtual 3Dpanoramas; in the second stage, at the client side, the 3D scene is interactively recon-structed based on these panoramas. Beside the interactive client introduced earlier,scalable variant for provisioning of virtual 3D city models is described, that utilizes thecapabilities of our rendering service for data preparation.
1 Introduction
The availability of 3D geodata, its volume and its quality are constantly growing. There-fore, a high quality 3D visualization of massive and detailed data sets represents acomputationally expensive task: It consumes large amounts of main memory, disk,network, CPU, and GPU resources in order to deliver an interactive user experienceand a constantly good visual quality. For distribution of such 3D contents in a web envi-ronment, two principal concepts can be found in existing 3D web mapping approaches,client-side 3D rendering, i.e., assembly and streaming of 3D display elements such as3D geometry and textures by a 3D server, whereby the corresponding 3D clients man-age scene graphs and perform real-time 3D scene rendering (e.g., Google Earth, OGCW3DS); and server-side 3D rendering, i.e., assembly and rendering of 3D display ele-ments by the 3D server, which delivers views of 3D scenes to lightweight clients (e.g.,OGC WVS).
Taking into account the increasing complexity and size of geodata for 3D maps(e.g., complex 3D city models), the need for high-quality visualization (e.g., illustrative
Fall Workshop 2012 63
3D Geovisualization Services for Efficient Distribution of 3D Geodata
or photorealistic rendering), and rapidly growing use of mobile applications (e.g., smartphones and tablets), these principal concepts are faced by fundamental limitations:client-side 3D rendering fails to provide fast access to massive models due to band-width limitations and cannot guarantee high-quality rendering results as the graphicscapabilities of nearly all mobile devices differ significantly, while a pure server-side 3Drendering is inherently limited with respect to interactivity and does not take advantageof todays mobile device graphics capabilities.
In this report i will present a framework based on a Web View Service as core com-ponent encapsulating the complexity of 3D model data and computer graphic tech-niques. Conventional techniques for visualization of 3D geodata, in particular virtual3D city models, are built upon client-side rendering of 3D geometry and texture datatransmitted from remote servers to client applications. These approaches are usuallylimited in terms of complexity of models and the visual quality they can provide, sincehigh-end computer graphic technique demand for state of the art 3D hardware.
Utilizing this type of service as a basis for client applications allows for provisioninghigh quality visualization of 3D model data of nearly arbitrary sizes on devices and plat-forms, that would otherwise not be able to provide usable, high-quality 3D visualization.Through externalizing image-generation from client side on server side, a consistentpresentation of 3D geodata is possible, regardless of client hardware or software.
Approaches for image-based client applications presented earlier, are allays boundby the performance of the underlying rendering server system in order to provide afully interactive user experience. In applications, this full 3D interactivity is often notnecessary and leads to a larger complexity for users regarding camera interaction.Therefore, in Section 5, we introduce a scalable application that was implemented formobile devices as well as for web browsers. These applications addresses these twochallenges, be limiting the possible camera interaction. This allows to pregenerate thenecessary image data that has to be transmitted to clients.
The remainder of this report is organized as follows. Section 2 introduces relatedwork in the are of image based remote visualization. Section 3 introduces the specificchallenges that arise when building service-based visualization system in more detail.Section 4 describes briefly the overall architecture of the visualization system whichforms the basis of my work. Finally, an outlook of planned future work concludes thisreport in Section 6.
2 Related Work
The interoperability of systems and applications dealing with geodata is an central is-sue in order to build systems out of interoperable software components for geodataaccess, processing, and visualization. Beside a common understanding on informa-tion models [3], definitions of service interfaces are necessary. The Open GeospatialConsortium (OGC) defines a set of standardized services, models, and formats forgeodata encoding and processing. For example, a Web Feature Service (WFS) [16]can provide geodata, encoded in the Geography Markup Language (GML) [13] or CityGeography Markup Language (CityGML) [6], and processed by a Web ProcessingService (WPS) [15]. For geovisualization processes a general portrayal model is pro-
64 Fall Workshop 2012
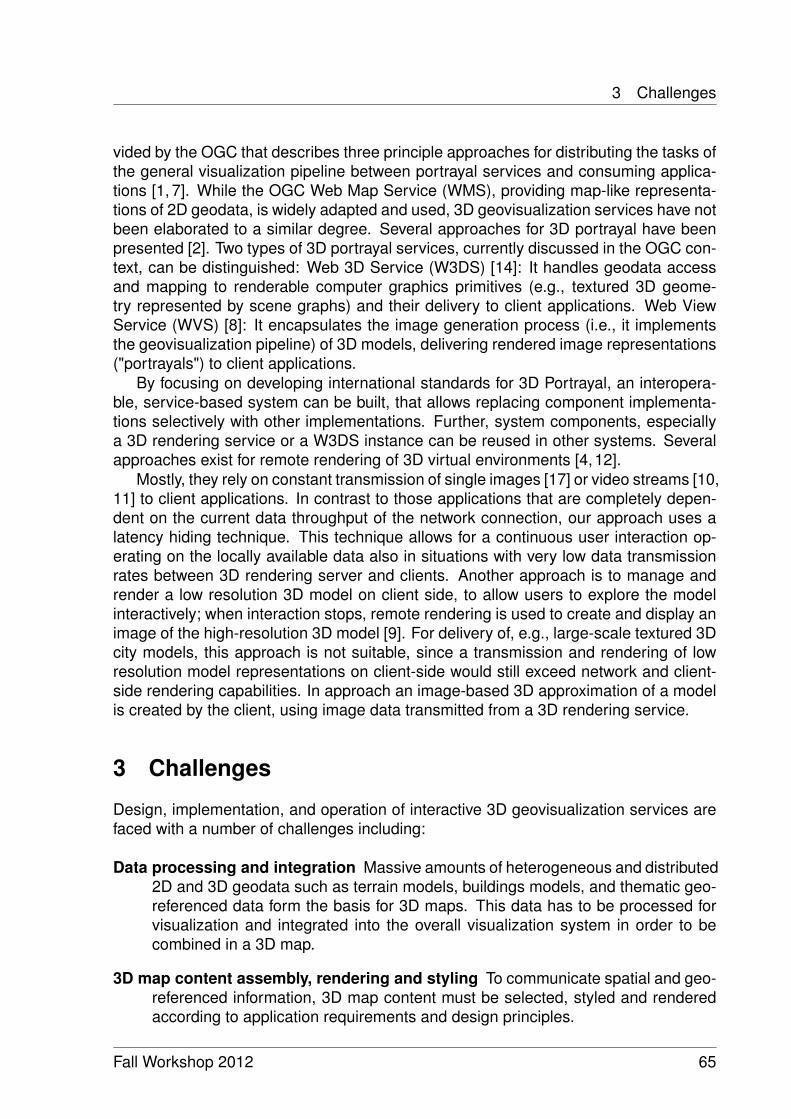
3 Challenges
vided by the OGC that describes three principle approaches for distributing the tasks ofthe general visualization pipeline between portrayal services and consuming applica-tions [1, 7]. While the OGC Web Map Service (WMS), providing map-like representa-tions of 2D geodata, is widely adapted and used, 3D geovisualization services have notbeen elaborated to a similar degree. Several approaches for 3D portrayal have beenpresented [2]. Two types of 3D portrayal services, currently discussed in the OGC con-text, can be distinguished: Web 3D Service (W3DS) [14]: It handles geodata accessand mapping to renderable computer graphics primitives (e.g., textured 3D geome-try represented by scene graphs) and their delivery to client applications. Web ViewService (WVS) [8]: It encapsulates the image generation process (i.e., it implementsthe geovisualization pipeline) of 3D models, delivering rendered image representations("portrayals") to client applications.
By focusing on developing international standards for 3D Portrayal, an interopera-ble, service-based system can be built, that allows replacing component implementa-tions selectively with other implementations. Further, system components, especiallya 3D rendering service or a W3DS instance can be reused in other systems. Severalapproaches exist for remote rendering of 3D virtual environments [4,12].
Mostly, they rely on constant transmission of single images [17] or video streams [10,11] to client applications. In contrast to those applications that are completely depen-dent on the current data throughput of the network connection, our approach uses alatency hiding technique. This technique allows for a continuous user interaction op-erating on the locally available data also in situations with very low data transmissionrates between 3D rendering server and clients. Another approach is to manage andrender a low resolution 3D model on client side, to allow users to explore the modelinteractively; when interaction stops, remote rendering is used to create and display animage of the high-resolution 3D model [9]. For delivery of, e.g., large-scale textured 3Dcity models, this approach is not suitable, since a transmission and rendering of lowresolution model representations on client-side would still exceed network and client-side rendering capabilities. In approach an image-based 3D approximation of a modelis created by the client, using image data transmitted from a 3D rendering service.
3 Challenges
Design, implementation, and operation of interactive 3D geovisualization services arefaced with a number of challenges including:
Data processing and integration Massive amounts of heterogeneous and distributed2D and 3D geodata such as terrain models, buildings models, and thematic geo-referenced data form the basis for 3D maps. This data has to be processed forvisualization and integrated into the overall visualization system in order to becombined in a 3D map.
3D map content assembly, rendering and styling To communicate spatial and geo-referenced information, 3D map content must be selected, styled and renderedaccording to application requirements and design principles.
Fall Workshop 2012 65
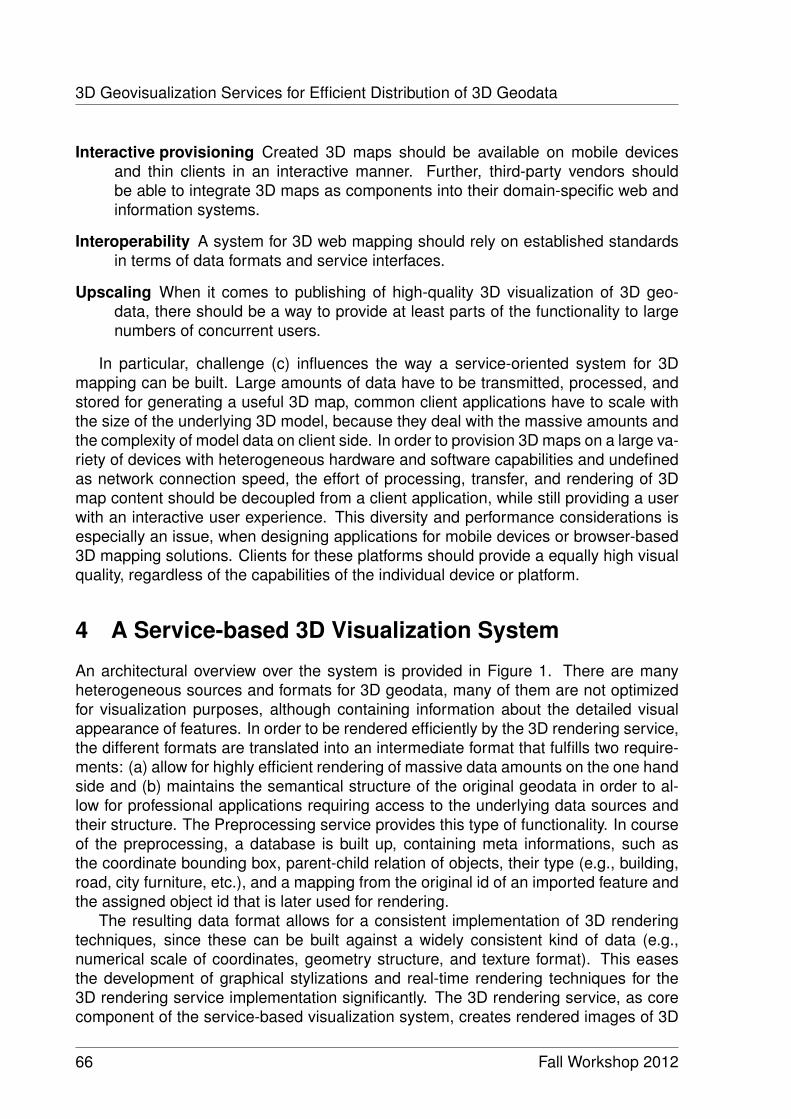
3D Geovisualization Services for Efficient Distribution of 3D Geodata
Interactive provisioning Created 3D maps should be available on mobile devicesand thin clients in an interactive manner. Further, third-party vendors shouldbe able to integrate 3D maps as components into their domain-specific web andinformation systems.
Interoperability A system for 3D web mapping should rely on established standardsin terms of data formats and service interfaces.
Upscaling When it comes to publishing of high-quality 3D visualization of 3D geo-data, there should be a way to provide at least parts of the functionality to largenumbers of concurrent users.
In particular, challenge (c) influences the way a service-oriented system for 3Dmapping can be built. Large amounts of data have to be transmitted, processed, andstored for generating a useful 3D map, common client applications have to scale withthe size of the underlying 3D model, because they deal with the massive amounts andthe complexity of model data on client side. In order to provision 3D maps on a large va-riety of devices with heterogeneous hardware and software capabilities and undefinedas network connection speed, the effort of processing, transfer, and rendering of 3Dmap content should be decoupled from a client application, while still providing a userwith an interactive user experience. This diversity and performance considerations isespecially an issue, when designing applications for mobile devices or browser-based3D mapping solutions. Clients for these platforms should provide a equally high visualquality, regardless of the capabilities of the individual device or platform.
4 A Service-based 3D Visualization System
An architectural overview over the system is provided in Figure 1. There are manyheterogeneous sources and formats for 3D geodata, many of them are not optimizedfor visualization purposes, although containing information about the detailed visualappearance of features. In order to be rendered efficiently by the 3D rendering service,the different formats are translated into an intermediate format that fulfills two require-ments: (a) allow for highly efficient rendering of massive data amounts on the one handside and (b) maintains the semantical structure of the original geodata in order to al-low for professional applications requiring access to the underlying data sources andtheir structure. The Preprocessing service provides this type of functionality. In courseof the preprocessing, a database is built up, containing meta informations, such asthe coordinate bounding box, parent-child relation of objects, their type (e.g., building,road, city furniture, etc.), and a mapping from the original id of an imported feature andthe assigned object id that is later used for rendering.
The resulting data format allows for a consistent implementation of 3D renderingtechniques, since these can be built against a widely consistent kind of data (e.g.,numerical scale of coordinates, geometry structure, and texture format). This easesthe development of graphical stylizations and real-time rendering techniques for the3D rendering service implementation significantly. The 3D rendering service, as corecomponent of the service-based visualization system, creates rendered images of 3D
66 Fall Workshop 2012
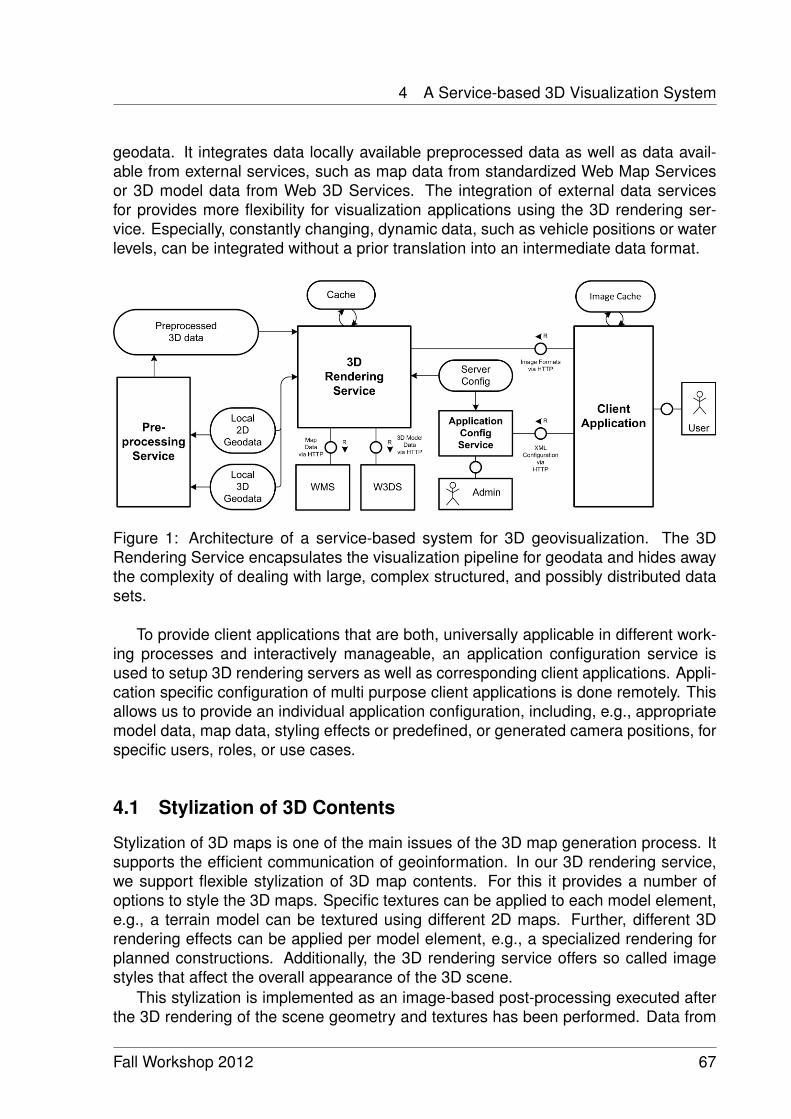
4 A Service-based 3D Visualization System
geodata. It integrates data locally available preprocessed data as well as data avail-able from external services, such as map data from standardized Web Map Servicesor 3D model data from Web 3D Services. The integration of external data servicesfor provides more flexibility for visualization applications using the 3D rendering ser-vice. Especially, constantly changing, dynamic data, such as vehicle positions or waterlevels, can be integrated without a prior translation into an intermediate data format.
Figure 1: Architecture of a service-based system for 3D geovisualization. The 3DRendering Service encapsulates the visualization pipeline for geodata and hides awaythe complexity of dealing with large, complex structured, and possibly distributed datasets.
To provide client applications that are both, universally applicable in different work-ing processes and interactively manageable, an application configuration service isused to setup 3D rendering servers as well as corresponding client applications. Appli-cation specific configuration of multi purpose client applications is done remotely. Thisallows us to provide an individual application configuration, including, e.g., appropriatemodel data, map data, styling effects or predefined, or generated camera positions, forspecific users, roles, or use cases.
4.1 Stylization of 3D Contents
Stylization of 3D maps is one of the main issues of the 3D map generation process. Itsupports the efficient communication of geoinformation. In our 3D rendering service,we support flexible stylization of 3D map contents. For this it provides a number ofoptions to style the 3D maps. Specific textures can be applied to each model element,e.g., a terrain model can be textured using different 2D maps. Further, different 3Drendering effects can be applied per model element, e.g., a specialized rendering forplanned constructions. Additionally, the 3D rendering service offers so called imagestyles that affect the overall appearance of the 3D scene.
This stylization is implemented as an image-based post-processing executed afterthe 3D rendering of the scene geometry and textures has been performed. Data from
Fall Workshop 2012 67
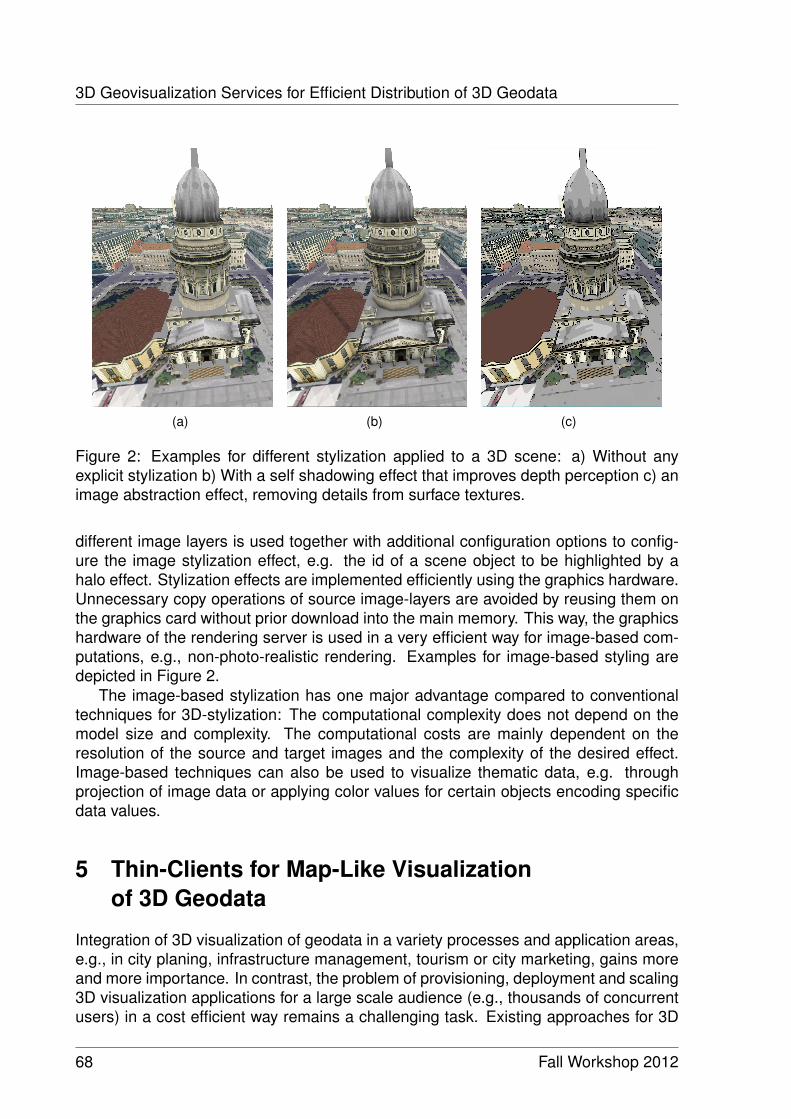
3D Geovisualization Services for Efficient Distribution of 3D Geodata
(a) (b) (c)
Figure 2: Examples for different stylization applied to a 3D scene: a) Without anyexplicit stylization b) With a self shadowing effect that improves depth perception c) animage abstraction effect, removing details from surface textures.
different image layers is used together with additional configuration options to config-ure the image stylization effect, e.g. the id of a scene object to be highlighted by ahalo effect. Stylization effects are implemented efficiently using the graphics hardware.Unnecessary copy operations of source image-layers are avoided by reusing them onthe graphics card without prior download into the main memory. This way, the graphicshardware of the rendering server is used in a very efficient way for image-based com-putations, e.g., non-photo-realistic rendering. Examples for image-based styling aredepicted in Figure 2.
The image-based stylization has one major advantage compared to conventionaltechniques for 3D-stylization: The computational complexity does not depend on themodel size and complexity. The computational costs are mainly dependent on theresolution of the source and target images and the complexity of the desired effect.Image-based techniques can also be used to visualize thematic data, e.g. throughprojection of image data or applying color values for certain objects encoding specificdata values.
5 Thin-Clients for Map-Like Visualizationof 3D Geodata
Integration of 3D visualization of geodata in a variety processes and application areas,e.g., in city planing, infrastructure management, tourism or city marketing, gains moreand more importance. In contrast, the problem of provisioning, deployment and scaling3D visualization applications for a large scale audience (e.g., thousands of concurrentusers) in a cost efficient way remains a challenging task. Existing approaches for 3D
68 Fall Workshop 2012
6 Conclusions and Future Work
visualization of geodata often require a client system that is capable of performingcomplex 3D rendering for massive amounts of data. The server-side requirements andespecially the complexity of implementing high-quality rendering techniques for a largenumber of highly heterogeneous client hardware and software platforms makes it veryhard to implement a usable 3D visualization component that can be integrated into thirdparty applications.
Recently, we presented a client application that reconstructs a lightweight represen-tation of a complex server-side model in order to allow and interactive user explorationand free navigation in 3D world [5]. While this kind of application addresses a lot ofissues that arise when massive amounts of 3D geodata, such as virtual 3D city models,is used in mobile or web-based visualization applications, the issue of the complexityof 3D navigation in 3D geovirtual environments remains. To address this issue, and toprovide a solution for exploring 3D city models in connection with related 2D and 3Dapplication data, we created a map-like visualization that uses image data that can bepregenerated while still keeping the connection between underlying 3D geometry andthe semantic data they represent. Therefore we use parts of the framework presentedin Section 4, in particular preprocessing and rendering services, to generate tileableviews of a 3D dataset. A restriction of user interaction, conceptually to a motion inparallel to the earth’s surface and a modification of the distance between surface andcamera, makes it possible to create sets of image tiles for applications that cover aspecific spatial region. In contrast to earlier clients, which where using a conventionalperspective projection for image generation, this application works with an orthographicprojection. In this way, it is possible to generate we can create a specific image for eachnumbered spatial region (image tile). This way, each tile does exclusively contain a cer-tain part of the overall model geometry. A script is used to generate all tiles for a spatialregion, in our case the region covered by the city model of Berlin, in several discretezoom levels (discrete distance steps for surface-camera distance).
The files for image tiles are organized in conformance to the Tiles Map Service, asa quasi standard for providing a simple access scheme for tiles georeferenced imagedata. The corresponding client application, depicted in Figure 3, requests tiles that areneeded for the current zoom level and visible spatial region.
Besides the efficient visual presentation of 3D geodata, linkage of the visual entitiesand their underlying geodata plays a major role for visualization solutions to be applica-ble in every day working processes. Therefore, images containing object identifiers foran color image tile are generated. They can be used to get object identifiers for specificpositions given in pixel coordinates for single tiles. The rendering service instance isthen able to map these identifiers back to the original identifier in the source dataset.Besides these capabilities for data access, id images can be utilized for rendering ef-fects on client side, e.g., highlighting of single objects.
6 Conclusions and Future Work
In this report I presented a service-based framework for 3D portrayal of 3D geodataimplementing the 3D visualization process. Using the extended image generation ca-pabilities of the 3D Rendering service, significant amounts of computational complexity
Fall Workshop 2012 69

3D Geovisualization Services for Efficient Distribution of 3D Geodata
Figure 3: Example for a Web-based Visualization of the virtual 3D city model of Berlincreated using the service pipeline. The created map-like visualization can be arbitrarilystyled and customized. Underlying image data can be pregenerated in order to servea large number of clients.
can be implemented on server-side, allowing for a more resource efficient implementa-tion of client applications. Besides interactive, image-based, real-time 3D-clients pre-sented earlier, map-like applications using pregenerated image-data provide furtheradvantages with regard to server-side effort. Generated image-tiles can be servedeasily for a large number of users, e.g. by using highly scalable cloud storage services.
The next steps in research on our framework for service-based 3D visualization willbe to perform performance tests and evaluations for several large-scale datasets inorder to reveal potential for further optimizations and extensions to the overall systemand explicitly to interactive client applications. Measuring the performance of the ser-vice based visualization system will be part of my work during the next month. Both,the performance of the rendering service itself, as well as the performance of the over-all image-based visualization system need to be explored in more detail in order toidentify possible bottlenecks, arising, e.g., from client accessing the rendering serviceconcurrently.
Further we see, that 3D interaction and rendering techniques that support latencyhiding seem promising in order to improve the overall user experience of image-based3D visualization applications. Within the next term i am therefore going to focus onsuch techniques in connection with specific rendering technique for that purpose.
70 Fall Workshop 2012
References
References
[1] A. Altmaier and T. H. Kolbe. Applications and Solutions for Interoperable 3D Geo-Visualization. In Proceedings of the Photogrammetric Week 2003, pages 251–267, Stuttgart, 2003. Wichmann.
[2] J. Basanow, P. Neis, S. Neubauer, A. Schilling, and A. Zipf. Towards 3D Spa-tial Data Infrastructures (3D-SDI) based on open standards experiences, resultsand future issues. In Advances in 3D Geoinformation Systems, Lecture Notes inGeoinformation and Cartography, pages 65–86, 2008. Springer.
[3] Y. Bishr. Overcoming the semantic and other barriers to GIS interoperability. In-ternational Journal of Geographical Information Science, 12(4):299–314, 1998.
[4] A. Boukerche and R.WN Pazzi. Remote rendering and streaming of progressivepanoramas for mobile devices. In Proceedings of the 14th annual ACM . . . , pages691–694, 2006.
[5] J. Doellner, B. Hagedorn, and J. Klimke. Server-based rendering of large 3dscenes for mobile devices using g-buffer cube maps. In Proceedings of the 17thInternational Conference on 3D Web Technology, Web3D ’12, pages 97–100,New York, NY, USA, 2012. ACM.
[6] Gerhard Gröger, Thomas H. Kolbe, Claus Nagel, and Karl-Heinz Häfele. OpenGISCity Geography Markup Language (CityGML) Encoding Standard Version 2.0.0.Technical report, Open Geospatial Consortium Inc., 2012.
[7] R. B. Haber and D. A. McNapp. Visualization Idioms: A Conceptual Model forScientific Visualization Systems. In Visualization in Scientific Computing, pages74–93. IEEE, 1990.
[8] B. Hagedorn. Web view service discussion paper, Version 0.6. 0. Open GeospatialConsortium Inc, 2010.
[9] D. Koller, M. Turitzin, and M. Levoy. Protected Interactive 3D Graphics via RemoteRendering. Transactions on Graphics (TOG), 2004, ACM.
[10] F. Lamberti and A. Sanna. A streaming-based solution for remote visualization of3D graphics on mobile devices. IEEE transactions on visualization and computergraphics, 13(2):247–60, 2007.
[11] D. Pajak, R. Herzog, E. Eisemann, K. Myszkowski, and H.-P. Seidel. ScalableRemote Rendering with Depth and Motion-flow Augmented Streaming. ComputerGraphics Forum, 30(2):415–424, April 2011.
[12] G. Paravati, A. Sanna, F. Lamberti, and L. Ciminiera. An open and scalable ar-chitecture for delivering 3D shared visualization services to heterogeneous de-vices. Concurrency and Computation: Practice and Experience, 23(11):1179–1195, 2011.
Fall Workshop 2012 71
References
[13] C. Portele. OpenGIS Geography Markup Language (GML) Encoding Standard,Version 3.2.1, July 2007, Open Geospatial Consortium.
[14] A. Schilling and T.H. Kolbe. Draft for Candidate OpenGIS Web 3D Service Inter-face Standard, Version 0.4.0, 2010, Open Geospatial Consortium.
[15] P. Schut. OpenGIS Web Processing Service, Version 1.0.0, 2007, Open Geospa-tial Consortium.
[16] P.A. Vretanos. OGC Web Feature Service Implementation Specification, 2005,Open Geospatial Consortium.
[17] A. Wessels, M. Purvis, J. Jackson, and S. (S.) Rahman. Remote Data Visual-ization through WebSockets. 2011 8th International Conference on InformationTechnology: New Generations, pages 1050–1051, April 2011, IEEE.
72 Fall Workshop 2012
Applications of Virtual CollaborationMonitoring in Software Development
Projects
Thomas Kowark
This report summarises my research work of the last six months. The focus residedon the creation of a concept to include process metrics within Team Collaboration Net-works (TCN) to enable reasoning about effects of virtual collaboration behaviour. Theconcept was prototypically implemented and applied in a classroom software engineer-ing project to analyse the effects of conformance with software development principleson team progress. Based on the experiences of this case study, further applications inthe analysis of existing open-source project data and experiments in software engineer-ing research are outlined. The report concludes with initial insights from an ongoingtest project that applies our prototype platform for virtual collaboration analysis in anindustry setting.
1 Introduction
Virtual collaboration analysis aims to detect correlations between the way project mem-bers interact with groupware systems and different metrics that determine the state ofa project. Two basic approaches are available for detecting such indicators and theireffects on the measured process metrics.
In the top-down approach, researchers start by modelling potential indicators forthe adherence-to or violation-of investigated collaboration activities. In the domain ofsoftware engineering, these activities usually relate to principles of the used develop-ment process. Secondly, data needs to be collected from the systems employed by theteams under investigation or by using an openly available data set. Finally, the indica-tors need to be translated into queries on the data and occurrences can be statisticallytested for correlations with collected process metrics.
The bottom-up approach starts with the captured data and extracts frequently oc-curring usage patterns that correlate with process metrics. These patterns are subse-quently described in a formal manner to enable their usage in a top-down analysis ofother data sets. By that, project-specific phenomena can be separated from behaviourwith general validity regarding its correlation with process metrics.
The main challenge for this kind of research is reproducibility. In case a freely avail-able dataset has been used, it needs to be specified how the data was prepared (e.g.,conversion of files in comma-separated-value (CSV) format into a database schema)and which queries have been carried out. In case a custom data set was created, e.g.,
Fall Workshop 2012 73
Applications of Virtual Collaboration Monitoring in Software Development Projects
by analysing an industry case study or conducting experiments, even more informa-tion is required. Tools employed by the team, programs used to capture data from thedifferent groupware systems, data structures used to store the data, and queries thatwere executed on the data need to be made available for complete reproducibility. Asimplification of this approach requires the following three components:
• open access to the investigated data,
• a common data format for storing traces of virtual collaboration activity,
• a standardised query language that allows to formally model the previously de-scribed indicators and reproducibly detect their occurrences across projects.
1.1 Data Repositories in Empirical Software Engineering
Researchers have previously acknowledged that data sharing is essential to promoterigour in empirical software engineering research. An approach like the PROMISErepository of empirical software engineering data [11] provides a quasi-standard dataset that can be used to verify or falsify theories about the correlations between differentsoftware process metrics (e.g. [2]) across multiple projects. Thereby, such repositoriesprovide a solution for the first challenge. In their current implementation, however,they do not cover the second challenge. Data is stored in a CSV format and potentialsemantic links are described in accompanying text files, leaving room for interpretationby users of the data.
Linked open data provides a solution to this challenge. Repositories like SeCold[6] are based on ontologies that describe the different concepts of the mined datasources, such as source code repositories and bug trackers, and consequently removeambiguity in data handling. The named repository contains data from approximately18,000 software development projects. Though the ontologies slightly differ from theones created in the Team Collaboration Network (TCN) approach [12], the conceptualsimilarities confirm the viability of our approach and the provided data set will be usedas an extension to the database created through data capturing in our own case studies[8–10] .
The third aspect is partly covered by SPARQL, which is the de-facto standard querylanguage for Resource Description Framework (RDF) data. Queries created for a sam-ple project can be applied to other projects without adoptions as long as the sameontologies are used. Query results, however, will have a project specific bias, as termi-nology, cardinalities, or timeframes can differ between projects. Hence, either querieshave to be created in a very generic manner, or abstract descriptions of the monitoredactivities (e.g., using Business Process Modelling Notation (BPMN) or Event-DrivenProcess Chains (EPC)) are translated into SPARQL queries, taking into account thecharacteristics of the projects. We have presented a potential solution for this in [7].
1.2 Outline
An aspect that is currently not handled by the aforementioned approach is the explicitrepresentation of process metrics within the linked data. This is required to not only
74 Fall Workshop 2012
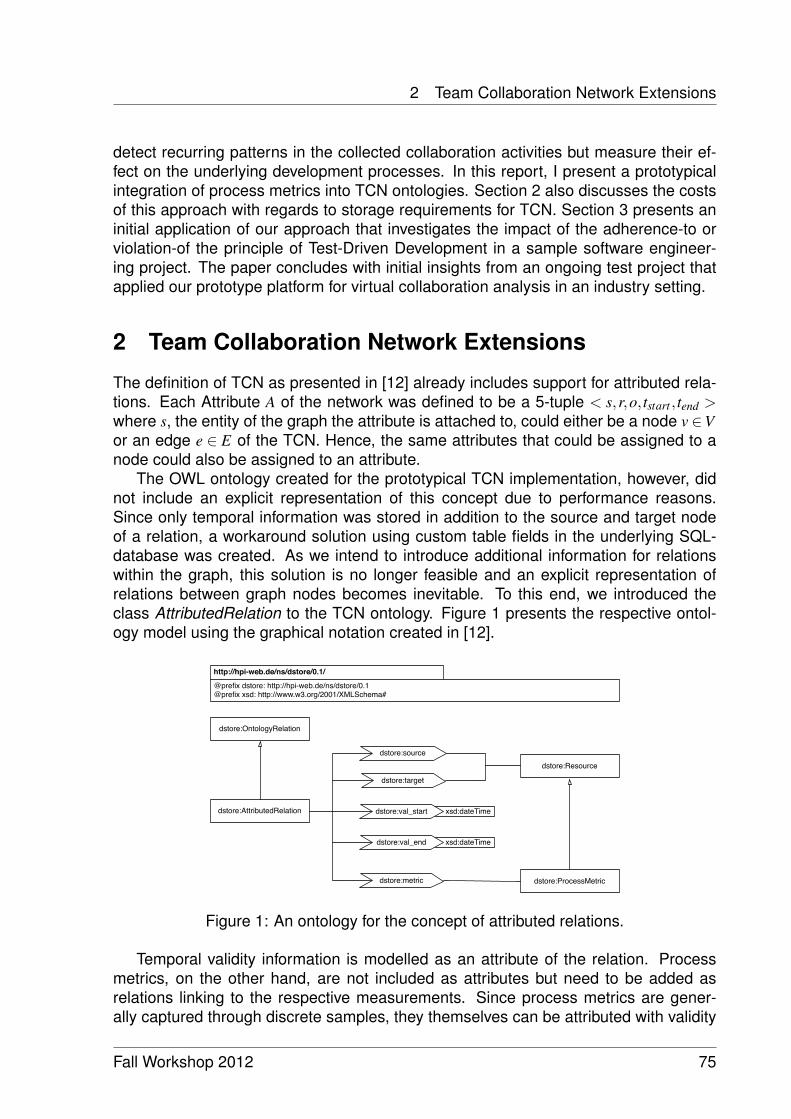
2 Team Collaboration Network Extensions
detect recurring patterns in the collected collaboration activities but measure their ef-fect on the underlying development processes. In this report, I present a prototypicalintegration of process metrics into TCN ontologies. Section 2 also discusses the costsof this approach with regards to storage requirements for TCN. Section 3 presents aninitial application of our approach that investigates the impact of the adherence-to orviolation-of the principle of Test-Driven Development in a sample software engineer-ing project. The paper concludes with initial insights from an ongoing test project thatapplied our prototype platform for virtual collaboration analysis in an industry setting.
2 Team Collaboration Network Extensions
The definition of TCN as presented in [12] already includes support for attributed rela-tions. Each Attribute A of the network was defined to be a 5-tuple < s,r,o, tstart , tend >where s, the entity of the graph the attribute is attached to, could either be a node v ∈Vor an edge e ∈ E of the TCN. Hence, the same attributes that could be assigned to anode could also be assigned to an attribute.
The OWL ontology created for the prototypical TCN implementation, however, didnot include an explicit representation of this concept due to performance reasons.Since only temporal information was stored in addition to the source and target nodeof a relation, a workaround solution using custom table fields in the underlying SQL-database was created. As we intend to introduce additional information for relationswithin the graph, this solution is no longer feasible and an explicit representation ofrelations between graph nodes becomes inevitable. To this end, we introduced theclass AttributedRelation to the TCN ontology. Figure 1 presents the respective ontol-ogy model using the graphical notation created in [12].
xsd:dateTime
xsd:dateTime
http://hpi-web.de/ns/dstore/0.1/
@prefix dstore: http://hpi-web.de/ns/dstore/0.1@prefix xsd: http://www.w3.org/2001/XMLSchema#
dstore:AttributedRelation
dstore:OntologyRelation
dstore:source
dstore:target
dstore:val_start
dstore:val_end
dstore:Resource
dstore:ProcessMetricdstore:metric
Figure 1: An ontology for the concept of attributed relations.
Temporal validity information is modelled as an attribute of the relation. Processmetrics, on the other hand, are not included as attributes but need to be added asrelations linking to the respective measurements. Since process metrics are gener-ally captured through discrete samples, they themselves can be attributed with validity
Fall Workshop 2012 75
Applications of Virtual Collaboration Monitoring in Software Development Projects
dates (e.g., the reported developer satisfaction over a given timeframe, velocity for agiven sprint, etc.) and linking relations to those discrete samples reduces the overallstatement count. Furthermore, not storing process metrics directly with relations allowsrule-based inference of metrics, e.g., by specifying that relations are always linked tothe measurement that was valid at the moment of their creation. By that, the statementcount within the repository can be further reduced, however, at the cost of computa-tional overhead required by the inference engine. In total, the statements describingthe measurements plus one additional statement per measurement per relation (i.e.,the link to the measurement) need to be added to include process metrics within TCN.
3 Classroom Application
In this section we present experiences from applying the system presented in [9] ina classroom software engineering setting. From this application we infer guidelinesfor future applications and outline experiment settings that can enhance rigour in theevaluations and minimise project specific influences.
3.1 Project Background
The lecture under investigation is a third year undergraduate software engineeringclass [8]. The 96 participants of the course were divided into two development groups,each consisting of eight teams. Those eight teams had the task of jointly developing acustomer relationship management system (CRM). We used the approach presentedin [7] to model indicators for violations of different practices prescribed in the courseand continuously monitored the captured TCN for occurrences. A feedback system wasinstalled to allow project tutors to provide subjective judgements about team progressand effort. After each meeting, they had to rank the perceived effort that the team putinto the work and their progress (i.e., the fraction of planned work that was successfullycompleted) on a 10-point Likert scale (higher values indicate greater effort or progress).The collected metrics were included into the project TCN as described in Section 2.
3.2 Modelling Process Violations
Process violations were modelled according to a template created by Zazworka et.al [13]. It contains the process name, a categorisation, a textual description, data re-quired to observe violations, and a description of investigated violations. The originaltemplate permits description of violations in a language of choice. To enhance repro-ducibility of analyses, we limit the possible languages to ones that can be mapped toSPARQL queries on TCN. Consequently, we use the notation presented in [7] to modelindicators for potential violations of well-established software engineering principles [3].Furthermore, the required data needs to be specified using TCN terminology and bydefining types of resources, attributes, and relations that need to be present within thenetworks.
76 Fall Workshop 2012
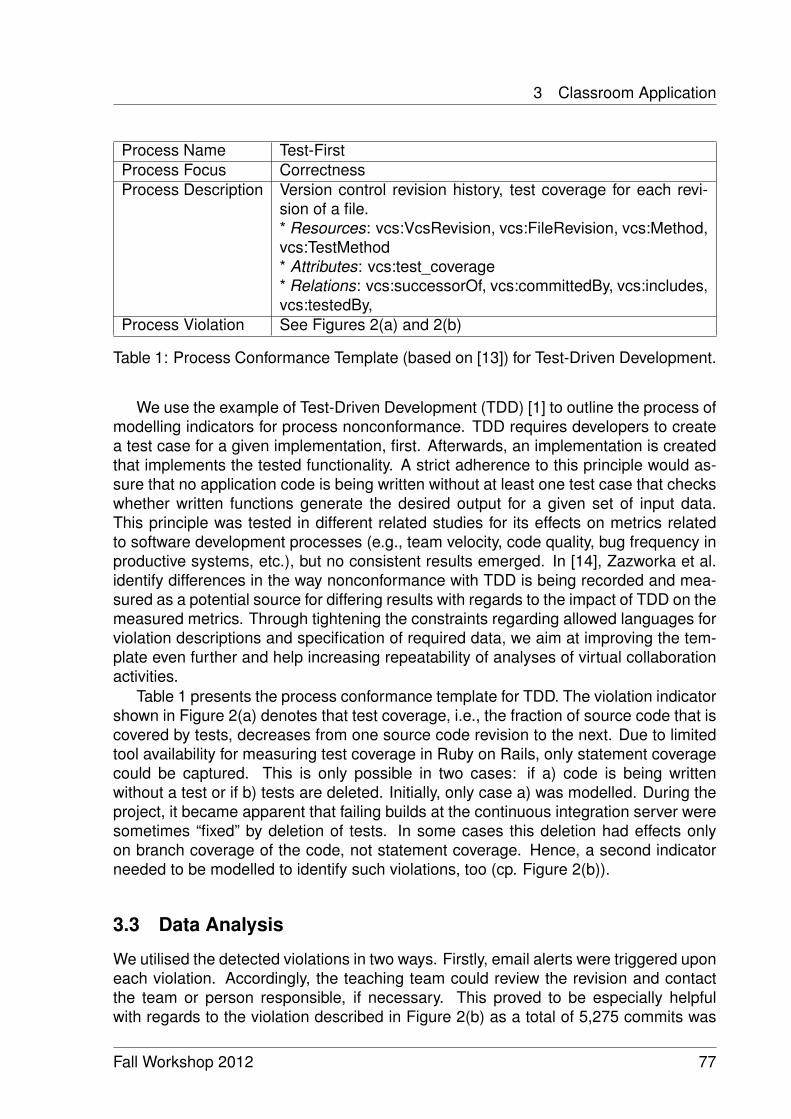
3 Classroom Application
Process Name Test-FirstProcess Focus CorrectnessProcess Description Version control revision history, test coverage for each revi-
sion of a file.* Resources: vcs:VcsRevision, vcs:FileRevision, vcs:Method,vcs:TestMethod* Attributes: vcs:test_coverage* Relations: vcs:successorOf, vcs:committedBy, vcs:includes,vcs:testedBy,
Process Violation See Figures 2(a) and 2(b)
Table 1: Process Conformance Template (based on [13]) for Test-Driven Development.
We use the example of Test-Driven Development (TDD) [1] to outline the process ofmodelling indicators for process nonconformance. TDD requires developers to createa test case for a given implementation, first. Afterwards, an implementation is createdthat implements the tested functionality. A strict adherence to this principle would as-sure that no application code is being written without at least one test case that checkswhether written functions generate the desired output for a given set of input data.This principle was tested in different related studies for its effects on metrics relatedto software development processes (e.g., team velocity, code quality, bug frequency inproductive systems, etc.), but no consistent results emerged. In [14], Zazworka et al.identify differences in the way nonconformance with TDD is being recorded and mea-sured as a potential source for differing results with regards to the impact of TDD on themeasured metrics. Through tightening the constraints regarding allowed languages forviolation descriptions and specification of required data, we aim at improving the tem-plate even further and help increasing repeatability of analyses of virtual collaborationactivities.
Table 1 presents the process conformance template for TDD. The violation indicatorshown in Figure 2(a) denotes that test coverage, i.e., the fraction of source code that iscovered by tests, decreases from one source code revision to the next. Due to limitedtool availability for measuring test coverage in Ruby on Rails, only statement coveragecould be captured. This is only possible in two cases: if a) code is being writtenwithout a test or if b) tests are deleted. Initially, only case a) was modelled. During theproject, it became apparent that failing builds at the continuous integration server weresometimes “fixed” by deletion of tests. In some cases this deletion had effects onlyon branch coverage of the code, not statement coverage. Hence, a second indicatorneeded to be modelled to identify such violations, too (cp. Figure 2(b)).
3.3 Data Analysis
We utilised the detected violations in two ways. Firstly, email alerts were triggered uponeach violation. Accordingly, the teaching team could review the revision and contactthe team or person responsible, if necessary. This proved to be especially helpfulwith regards to the violation described in Figure 2(b) as a total of 5,275 commits was
Fall Workshop 2012 77
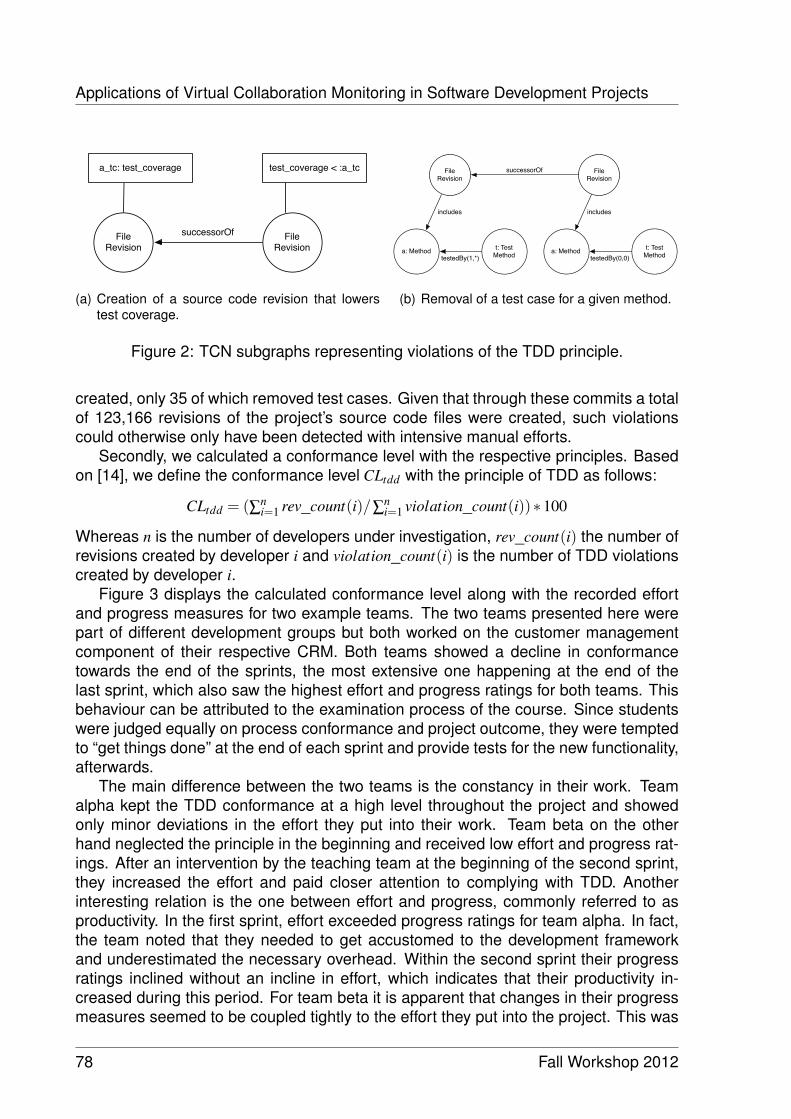
Applications of Virtual Collaboration Monitoring in Software Development Projects
FileRevision
FileRevision
a_tc: test_coverage test_coverage < :a_tc
successorOf
(a) Creation of a source code revision that lowerstest coverage.
FileRevision
FileRevision
successorOf
a: Method t: Test Method a: Method t: Test
Method
includes
testedBy(1,*) testedBy(0,0)
includes
(b) Removal of a test case for a given method.
Figure 2: TCN subgraphs representing violations of the TDD principle.
created, only 35 of which removed test cases. Given that through these commits a totalof 123,166 revisions of the project’s source code files were created, such violationscould otherwise only have been detected with intensive manual efforts.
Secondly, we calculated a conformance level with the respective principles. Basedon [14], we define the conformance level CLtdd with the principle of TDD as follows:
CLtdd = (∑ni=1 rev_count(i)/∑
ni=1 violation_count(i))∗100
Whereas n is the number of developers under investigation, rev_count(i) the number ofrevisions created by developer i and violation_count(i) is the number of TDD violationscreated by developer i.
Figure 3 displays the calculated conformance level along with the recorded effortand progress measures for two example teams. The two teams presented here werepart of different development groups but both worked on the customer managementcomponent of their respective CRM. Both teams showed a decline in conformancetowards the end of the sprints, the most extensive one happening at the end of thelast sprint, which also saw the highest effort and progress ratings for both teams. Thisbehaviour can be attributed to the examination process of the course. Since studentswere judged equally on process conformance and project outcome, they were temptedto “get things done” at the end of each sprint and provide tests for the new functionality,afterwards.
The main difference between the two teams is the constancy in their work. Teamalpha kept the TDD conformance at a high level throughout the project and showedonly minor deviations in the effort they put into their work. Team beta on the otherhand neglected the principle in the beginning and received low effort and progress rat-ings. After an intervention by the teaching team at the beginning of the second sprint,they increased the effort and paid closer attention to complying with TDD. Anotherinteresting relation is the one between effort and progress, commonly referred to asproductivity. In the first sprint, effort exceeded progress ratings for team alpha. In fact,the team noted that they needed to get accustomed to the development frameworkand underestimated the necessary overhead. Within the second sprint their progressratings inclined without an incline in effort, which indicates that their productivity in-creased during this period. For team beta it is apparent that changes in their progressmeasures seemed to be coupled tightly to the effort they put into the project. This was
78 Fall Workshop 2012
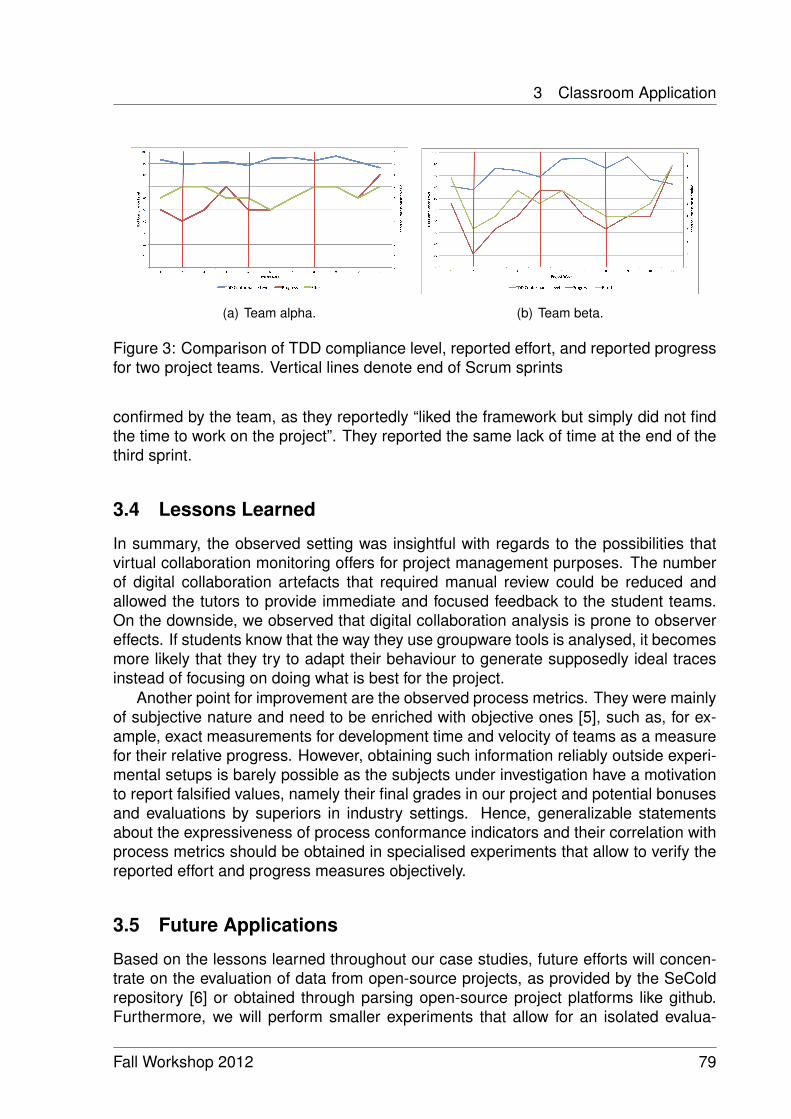
3 Classroom Application
(a) Team alpha. (b) Team beta.
Figure 3: Comparison of TDD compliance level, reported effort, and reported progressfor two project teams. Vertical lines denote end of Scrum sprints
confirmed by the team, as they reportedly “liked the framework but simply did not findthe time to work on the project”. They reported the same lack of time at the end of thethird sprint.
3.4 Lessons Learned
In summary, the observed setting was insightful with regards to the possibilities thatvirtual collaboration monitoring offers for project management purposes. The numberof digital collaboration artefacts that required manual review could be reduced andallowed the tutors to provide immediate and focused feedback to the student teams.On the downside, we observed that digital collaboration analysis is prone to observereffects. If students know that the way they use groupware tools is analysed, it becomesmore likely that they try to adapt their behaviour to generate supposedly ideal tracesinstead of focusing on doing what is best for the project.
Another point for improvement are the observed process metrics. They were mainlyof subjective nature and need to be enriched with objective ones [5], such as, for ex-ample, exact measurements for development time and velocity of teams as a measurefor their relative progress. However, obtaining such information reliably outside experi-mental setups is barely possible as the subjects under investigation have a motivationto report falsified values, namely their final grades in our project and potential bonusesand evaluations by superiors in industry settings. Hence, generalizable statementsabout the expressiveness of process conformance indicators and their correlation withprocess metrics should be obtained in specialised experiments that allow to verify thereported effort and progress measures objectively.
3.5 Future Applications
Based on the lessons learned throughout our case studies, future efforts will concen-trate on the evaluation of data from open-source projects, as provided by the SeColdrepository [6] or obtained through parsing open-source project platforms like github.Furthermore, we will perform smaller experiments that allow for an isolated evalua-
Fall Workshop 2012 79
Applications of Virtual Collaboration Monitoring in Software Development Projects
tion of the correlations between presence of (non)conformance indicators for certainsoftware development principles and objectively recorded process metrics.
Also, we will focus on the analysis of not only the structural properties of the cap-tured TCN but the attributes of the contained nodes. A co-supervised master’s the-sis provided a first insight into possible applications of data mining techniques on thestored graphs [4]. By applying the statistical model Latent Dirichlet Allocation (LDA) onthe captured TCN, we were, for example, able to determine which topics the projectteams have dealt with and which project members were mainly involved with certaintopics over which periods of time.
Building on these efforts, we want to investigate the application of different datamining techniques to identify the “regular” working behaviour of developers. This in-cludes, amongst others, the following properties: People that developers have fre-quently collaborated with, frequently occurring subgraphs that reflect their usual work-ing behaviour (e.g., regular ticket updates after check-ins), average properties of cre-ated artefacts (e.g., average size of source code revisions, average email length, etc.),and topics that developers have been involved with on a frequent basis. Based on thisdata, we can detect deviations from the regular working behaviour and reason aboutpossible learning effects, potential problems within the project teams (e.g., unevenlydistributed workload between team members), or impacts of newly prescribed meth-ods.
4 Industry Application
AnalyzeD [9], our prototype platform for virtual team collaboration analysis, is currentlydeployed in an industry setting at SAP. The test project aims at identifying a generalframework for future applications with regards to technical and legal aspects.
On a technical level, data privacy and scalability are primary concerns. By repli-cating a subset of the information originally stored in, for example, project emails, bugtracking systems, or documentation tools, potential data leaks of the platform can re-veal secret information to unauthorised third parties. Various approaches for solvingsuch issues exist and can be integrated into the platform but a complete evaluationis beyond the scope of my work. The platform design accounts for an intra-companydeployment and application of analyzeD in various projects, simultaneously. The re-spective graphs are stored independent from each other, hence, dedicated databasesfor each team and a central directory that links to their addresses could provide a sim-ple, yet effective, scale out strategy.
Legal aspects are pervasive in the application of the platform. On the one hand,data privacy needs to be assured to comply with non-disclosure agreements. On theother hand, the system – at least in Germany – must not enable the identification ofpeople involved in the projects as it could be used to, theoretically, “judge people’s per-formance”. To avoid such issues in the test project, German users were automaticallyfiltered from the data collection process. As such filtering reduces the expressivenessof the collected data, future work needs to include the creation of guidelines that allowplatform application even under such regulations.
80 Fall Workshop 2012

5 Summary and Outlook
As a first evaluation, the manager of the test project confirmed that the system isa viable aid for his project management tasks. It, for example, helped him to detectpotential information loss due to some of his team members sharing viable project-related information only via email instead of using the designated documentation sys-tem. Analysis of the captured data and interviews with project members are currentlyongoing and will be finished by the end of 2012. Results will be summarised in a jointpaper with the project partners at SAP.
5 Summary and Outlook
This report presented extensions to the TCN implementation that allow to explicitlyinclude process metrics into the process of virtual team collaboration analysis. Thisapproach was used to analyse the virtual collaboration behaviour of student teams andreason about the effects of process conformance on team progress. These evaluationswill be extended towards analysis of open-source projects in future work. Finally, wepresented insights gained within an industry application of our monitoring and analysissystem. Based on this work, next efforts will concentrate primarily on the evaluationof the applicability of the platform as a project management tool. To this end, we willperform an experiment that requires a chosen set of test subjects to perform differentproject management tasks, such as detecting violations of the described principles orfinding experts for different project topics. Our concept will then be tested along withother project management tools that offer comparable features and we will measure,for example, the average time for violation detection or the number of found violations.
Teaching Assistance
• Organisation and teaching support – Global Team-Based Product Innovation andEngineering 2011/12
• Assistance in corporate sponsor acquisition – Global Team-Based Product Inno-vation and Engineering 2012/13
• Preparation of exercise and lecture – Softwaretechnik II WS 2012/13
• Co-supervised master’s thesis Agile Methodologies for Large Enterprises - AnAnalysis of Scaling Strategies by Markus Steiner
• Co-supervised master’s thesis Extracting Topics from Heterogeneous Digital Col-laboration Artifacts of Software Engineering Teams by Ralf Gehrer
References
[1] Kent Beck. Test-Driven Development: By Example. The Addison-Wesley Signa-ture Series. Addison-Wesley, 2003.
Fall Workshop 2012 81

References
[2] Nicolas Bettenburg, Meiyappan Nagappan, and Ahmed E. Hassan. Think locally,act globally: Improving defect and effort prediction models. In MSR ’12: Pro-ceedings of the 9th Working Conference on Mining Software Repositories, pages60–69. IEEE, 2012.
[3] James O. Coplien and Neil B. Harrison. Organizational Patterns of Agile SoftwareDevelopment. Prentice-Hall, Inc., Upper Saddle River, NJ, USA, 2004.
[4] Ralf Gehrer. Extracting topics from heterogeneous digital collaboration artifactsof software engineering teams. Master’s thesis, Hasso Plattner Institute for ITSystems Engineering, 2012.
[5] Lorin Hochstein, Victor R. Basili, Marvin V. Zelkowitz, Jeffrey K. Hollingsworth, andJeff Carver. Combining self-reported and automatic data to improve programmingeffort measurement. SIGSOFT Softw. Eng. Notes, 30:356–365, September 2005.
[6] Iman Keivanloo, Christopher Forbes, Aseel Hmood, Mostafa Erfani, ChristopherNeal, George Peristerakis, and Juergen Rilling. A Linked Data platform for min-ing software repositories. In 9th IEEE Working Conference on Mining SoftwareRepositories, MSR 2012, June 2-3, 2012, Zurich, Switzerland, pages 32–35,2012.
[7] Thomas Kowark, Philipp Dobrigkeit, and Alexander Zeier. Towards a sharedrepository for patterns in virtual team collaboration. In 5th International Confer-ence on New Trends in Information Science and Service Science, 2011.
[8] Thomas Kowark, Jürgen Müller, Stephan Müller, and Alexander Zeier. An edu-cational testbed for the computational analysis of collaboration in early stages ofsoftware development processes. In Proceedings of the 44th Hawaii InternationalConference on System Sciences (HICSS), January 2011.
[9] Thomas Kowark and Hasso Plattner. AnalyzeD: A Shared Tool for Analyzing Vir-tual Team Collaboration in Classroom Software Engineering Projects. In The 2012International Conference on Frontiers in Education: Computer Science and Com-puter Engineering, July 2012.
[10] Thomas Kowark, Matthias Uflacker, and Alexander Zeier. Towards a shared plat-form for virtual collaboration analysis. In The 2011 International Conference onSoftware Engineering Research and Practice (SERP ’11), 2011.
[11] Tim Menzies, Bora Caglayan, Ekrem Kocaguneli, Joe Krall, Fayola Peters, andBurak Turhan. The promise repository of empirical software engineering data,June 2012.
[12] Matthias Uflacker. Monitoring Virtual Team Collaboration: Methods, Applications,and Experiences in Engineering Design. PhD thesis, Hasso Plattner Institute forIT Systems Engineering, Potsdam, Germany, 2010.
82 Fall Workshop 2012

References
[13] Nico Zazworka, Victor R. Basili, and Forrest Shull. Tool supported detection andjudgment of nonconformance in process execution. In Proceedings of the 20093rd International Symposium on Empirical Software Engineering and Measure-ment, ESEM ’09, pages 312–323, Washington, DC, USA, 2009. IEEE ComputerSociety.
[14] Nico Zazworka, Kai Stapel, Eric Knauss, Forrest Shull, Victor R. Basili, and KurtSchneider. Are developers complying with the process: an XP study. In Proceed-ings of the 2010 ACM-IEEE International Symposium on Empirical Software En-gineering and Measurement, ESEM ’10, pages 14:1–14:10, New York, NY, USA,2010. ACM.
Fall Workshop 2012 83


Muscle Propelled Force-feedback:ultra-mobile haptic devices
Pedro Lopes
Human Computer Interaction Group, Prof. Patrick BaudischHasso-Plattner-Institut
Unlike many other areas in computer science and HCI, force-feedback devices re-sist miniaturization, because in order to build up force they require physical motors. Wepropose mobile force-feedback devices based on actuating the user’s muscles usingelectrical stimulation. Since this allows us to eliminate motors and reduce battery size,our approach results in devices that are substantially smaller and lighter than traditionalmotor based devices. We present a prototype device that we mount to the back of amobile phone. It actuates users’ forearm muscles via four electrodes, causing the mus-cles to contract involuntarily, so that users tilt the device sideways. As users resist thismotion using their other arm, they perceive these counter forces as force-feedback. Wedemonstrate the interaction at the example of an interactive videogame in which userstry to steer an airplane through winds rendered using force feedback. We evaluate ourapproach in three experiments. In Study 1, we measured that the device delivers upto 17.5N of force when applied to the palm flexor. In Study 2, participants correctlyidentified force feedback direction with 97.7% accuracy eyes-free. Finally, in Study 3participants reported their experiences playing the video game described above.
1 Introduction
Force-feedback has been used to enable eyes-free targeting [15], to increase taskrealism [2], and to enhance immersion in video games [17]. For such applications,force-feedback is preferred over vibrotactile, because it provides physical forces thatcan counter the users’ movements, providing a strong haptic sensation [16]. Recentresearch has started to create increasingly smaller force-feedback devices, such asdeformable devices (e.g., SqueezeBlock [3]), motor-based haptics based on pulleys(e.g., FlexTensor [14]). What limits researchers’ miniaturization effort, though, is that itinvolves physical actuators that are hard to scale down without losing force [16].
In this paper, we attempt to push this evolution forward with the ultimate goal ofbringing force feedback to mobile devices. In order to achieve this, we explore usingthe user’s own muscle power as a replacement for motors. We actuate the user’smuscles using electrical muscle stimulation (EMS), a technique first explored in the60’s and 70’s [11] and more recently in Possessed Hand [13].
Fall Workshop 2012 85
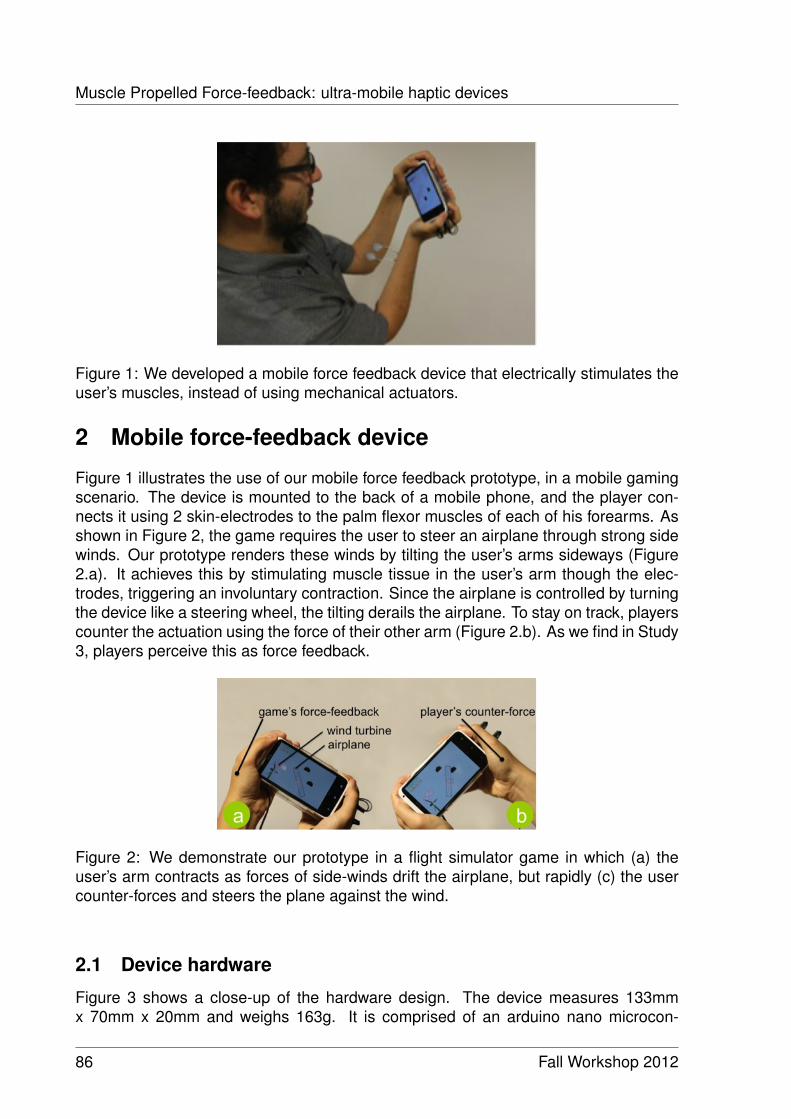
Muscle Propelled Force-feedback: ultra-mobile haptic devices
Figure 1: We developed a mobile force feedback device that electrically stimulates theuser’s muscles, instead of using mechanical actuators.
2 Mobile force-feedback device
Figure 1 illustrates the use of our mobile force feedback prototype, in a mobile gamingscenario. The device is mounted to the back of a mobile phone, and the player con-nects it using 2 skin-electrodes to the palm flexor muscles of each of his forearms. Asshown in Figure 2, the game requires the user to steer an airplane through strong sidewinds. Our prototype renders these winds by tilting the user’s arms sideways (Figure2.a). It achieves this by stimulating muscle tissue in the user’s arm though the elec-trodes, triggering an involuntary contraction. Since the airplane is controlled by turningthe device like a steering wheel, the tilting derails the airplane. To stay on track, playerscounter the actuation using the force of their other arm (Figure 2.b). As we find in Study3, players perceive this as force feedback.
Figure 2: We demonstrate our prototype in a flight simulator game in which (a) theuser’s arm contracts as forces of side-winds drift the airplane, but rapidly (c) the usercounter-forces and steers the plane against the wind.
2.1 Device hardware
Figure 3 shows a close-up of the hardware design. The device measures 133mmx 70mm x 20mm and weighs 163g. It is comprised of an arduino nano microcon-
86 Fall Workshop 2012

3 Benefits and Contribution
troller, which communicates via USB or Bluetooth to its host device, such as a mobilephone, a battery-powered signal generator with medical compliant operational ampli-fiers which outputs a maximum current of 50V/100mA over a 500 ohm load, and reedrelays. The device induces involuntary muscle contraction by generating a biphasicwave (frequency: 25Hz, pulse with of 290µs).
Figure 3: Hardware design specifications of the prototype.
3 Benefits and Contribution
Our main contribution is the concept of creating mobile force feedback using computer-controlled muscle stimulation. Our approach achieves miniaturization by (1) eliminatingmechanical actuators, such as motors and (2) substantially reducing battery size, as itis two orders of magnitude more energy efficient to actuate a muscle (which receivesits energy from the human body) than to drive a motor (we found muscles to requireless than 100 mA to contract, while motors can use up to several Amps). With threesimple user studies, we verify that our prototype creates sufficient force and that itseffect is indeed perceived as force-feedback.
Limitations: the on-skin electrodes used by our prototype limit miniaturization [13]and deployment speed, in that users need to attach the device to their muscles beforeuse. In addition to miniaturizing the circuit boards, future prototypes may overcomeboth of these limitations by using implanted intra-muscular electrodes [6].
4 Related Work
Force feedback is distinct from vibrotactile feedback in that it displaces the joints, withcounter-forces. Force feedback devices administer force to body joints mechanically,by pulley systems [9], exoskeletons [14], and more recently deformable interfaces [3].
4.1 Motor-based Force-Feedback
An example of a pulley system is SPIDAR [9], which displaces the fingertip by pullingusing four motors. Exoskeletons such as the Utah Dextrous Hand [5] or FlexTensor [14]
Fall Workshop 2012 87
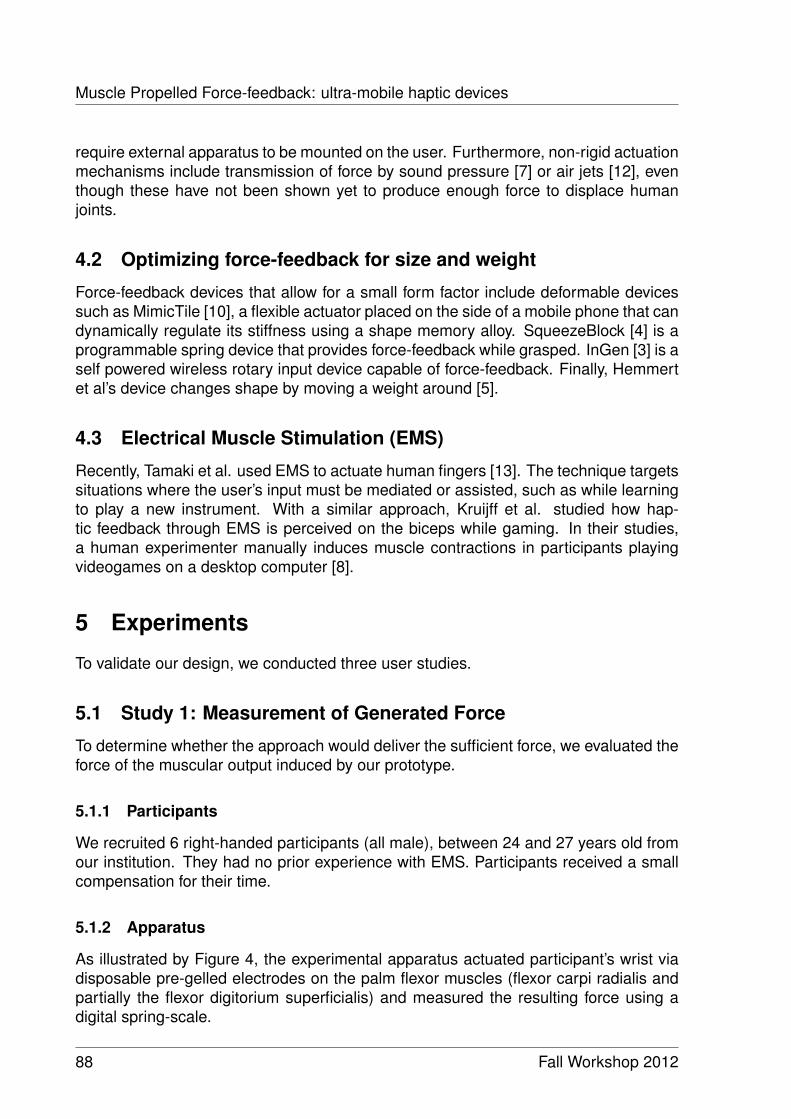
Muscle Propelled Force-feedback: ultra-mobile haptic devices
require external apparatus to be mounted on the user. Furthermore, non-rigid actuationmechanisms include transmission of force by sound pressure [7] or air jets [12], eventhough these have not been shown yet to produce enough force to displace humanjoints.
4.2 Optimizing force-feedback for size and weight
Force-feedback devices that allow for a small form factor include deformable devicessuch as MimicTile [10], a flexible actuator placed on the side of a mobile phone that candynamically regulate its stiffness using a shape memory alloy. SqueezeBlock [4] is aprogrammable spring device that provides force-feedback while grasped. InGen [3] is aself powered wireless rotary input device capable of force-feedback. Finally, Hemmertet al’s device changes shape by moving a weight around [5].
4.3 Electrical Muscle Stimulation (EMS)
Recently, Tamaki et al. used EMS to actuate human fingers [13]. The technique targetssituations where the user’s input must be mediated or assisted, such as while learningto play a new instrument. With a similar approach, Kruijff et al. studied how hap-tic feedback through EMS is perceived on the biceps while gaming. In their studies,a human experimenter manually induces muscle contractions in participants playingvideogames on a desktop computer [8].
5 Experiments
To validate our design, we conducted three user studies.
5.1 Study 1: Measurement of Generated Force
To determine whether the approach would deliver the sufficient force, we evaluated theforce of the muscular output induced by our prototype.
5.1.1 Participants
We recruited 6 right-handed participants (all male), between 24 and 27 years old fromour institution. They had no prior experience with EMS. Participants received a smallcompensation for their time.
5.1.2 Apparatus
As illustrated by Figure 4, the experimental apparatus actuated participant’s wrist viadisposable pre-gelled electrodes on the palm flexor muscles (flexor carpi radialis andpartially the flexor digitorium superficialis) and measured the resulting force using adigital spring-scale.
88 Fall Workshop 2012
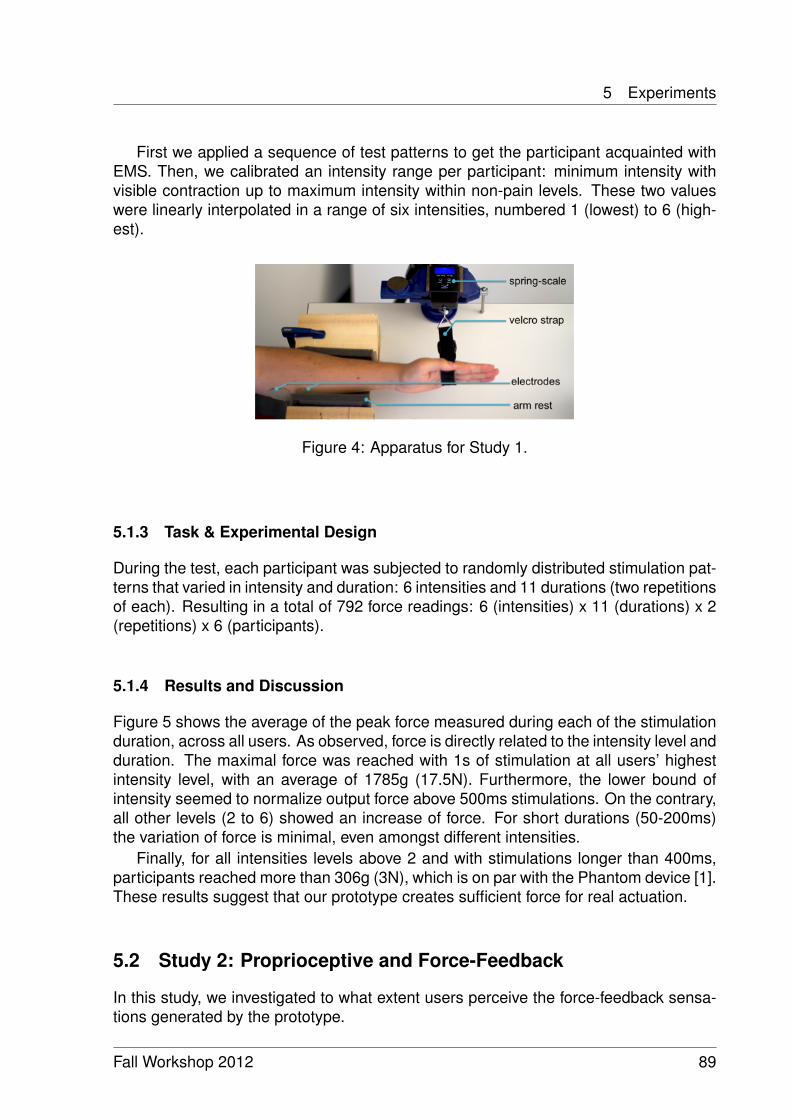
5 Experiments
First we applied a sequence of test patterns to get the participant acquainted withEMS. Then, we calibrated an intensity range per participant: minimum intensity withvisible contraction up to maximum intensity within non-pain levels. These two valueswere linearly interpolated in a range of six intensities, numbered 1 (lowest) to 6 (high-est).
Figure 4: Apparatus for Study 1.
5.1.3 Task & Experimental Design
During the test, each participant was subjected to randomly distributed stimulation pat-terns that varied in intensity and duration: 6 intensities and 11 durations (two repetitionsof each). Resulting in a total of 792 force readings: 6 (intensities) x 11 (durations) x 2(repetitions) x 6 (participants).
5.1.4 Results and Discussion
Figure 5 shows the average of the peak force measured during each of the stimulationduration, across all users. As observed, force is directly related to the intensity level andduration. The maximal force was reached with 1s of stimulation at all users’ highestintensity level, with an average of 1785g (17.5N). Furthermore, the lower bound ofintensity seemed to normalize output force above 500ms stimulations. On the contrary,all other levels (2 to 6) showed an increase of force. For short durations (50-200ms)the variation of force is minimal, even amongst different intensities.
Finally, for all intensities levels above 2 and with stimulations longer than 400ms,participants reached more than 306g (3N), which is on par with the Phantom device [1].These results suggest that our prototype creates sufficient force for real actuation.
5.2 Study 2: Proprioceptive and Force-Feedback
In this study, we investigated to what extent users perceive the force-feedback sensa-tions generated by the prototype.
Fall Workshop 2012 89
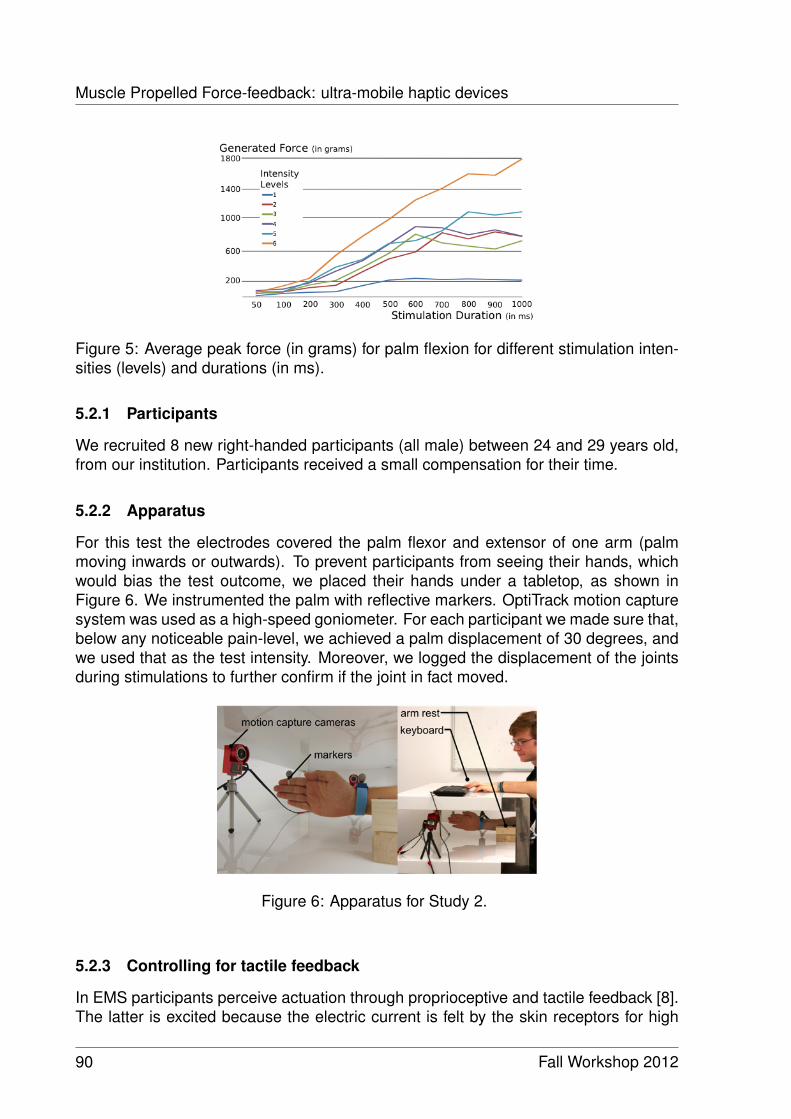
Muscle Propelled Force-feedback: ultra-mobile haptic devices
Figure 5: Average peak force (in grams) for palm flexion for different stimulation inten-sities (levels) and durations (in ms).
5.2.1 Participants
We recruited 8 new right-handed participants (all male) between 24 and 29 years old,from our institution. Participants received a small compensation for their time.
5.2.2 Apparatus
For this test the electrodes covered the palm flexor and extensor of one arm (palmmoving inwards or outwards). To prevent participants from seeing their hands, whichwould bias the test outcome, we placed their hands under a tabletop, as shown inFigure 6. We instrumented the palm with reflective markers. OptiTrack motion capturesystem was used as a high-speed goniometer. For each participant we made sure that,below any noticeable pain-level, we achieved a palm displacement of 30 degrees, andwe used that as the test intensity. Moreover, we logged the displacement of the jointsduring stimulations to further confirm if the joint in fact moved.
Figure 6: Apparatus for Study 2.
5.2.3 Controlling for tactile feedback
In EMS participants perceive actuation through proprioceptive and tactile feedback [8].The latter is excited because the electric current is felt by the skin receptors for high
90 Fall Workshop 2012
5 Experiments
stimulation levels. We minimized this effect by: lowering skin resistance with conduc-tive gel and by lightly stimulating both muscles simultaneously below visible motionthreshold, therefore causing the tactile sensation in both.
5.2.4 Experimental Design
Each participant was subjected to 44 trials of randomly distributed direction and dura-tion (2 directions x 11 durations x 2 repetitions), a total of 352 samples for the study.Per trial, the participant entered on the keyboard the perceived direction (left or right).
5.2.5 Results and Discussion
Overall recognition rate of force-feedback direction was 97.73%, on average for allusers. In detail, for brief stimulation (50ms), the recognition rate was 87.5%, for 100msit was 90.63%, and 96.88% for 200ms. For all durations above 300ms, recognition ratewas 100%, which pinpoints the potential of the approach for real mobile applications.
5.3 Study 3: Mobile force-feedback gaming
Finally, we examined actual use of the prototype. Participants played the game shownin Figure 1 including the force-feedback enhancements.
5.3.1 Participants
We recruited 10 participants (2 female) between 20 and 32 years old. Two of them hadparticipated in Study 2.
5.3.2 Apparatus
We deployed the game from Figure 2 on an HTC One X. To win the game, playershad to keep the airplane on screen while collecting white clouds and avoiding blackclouds. Staying on screen required players to resist the wind turbines that âAIJpushedthe airplane off screenâAI. Participants steered the airplane left and right by tilting thedevice; and, touching the screen with the thumb allowed them to fly higher or lower.
5.3.3 Experimental Design
Participants played the videogame with and without force feedback for at least 5 min-utes. Interface order was counterbalanced, i.e., half of the participants started withforce-feedback. In the end of each condition they filled a questionnaire.
Fall Workshop 2012 91
References
5.3.4 Questionnaire Results and Discussion
Participants rated the game as more enjoyable when playing with force-feedback (avg=4of 5, sd=1.15), than without (avg=3.3 of 5, sd=0.95). While playing with muscle-propelled force feedback, participants stated to easily perceive the direction of thewinds that derail the airplane in the game (avg=4 of 5, sd=1.63), confirming the resultsof Study 2. On the contrary, in the absence of the haptic sensation, subjects stated thatwind direction and force was harder to perceive (avg= 2.7 of 5, sd=0.95). Also, partici-pants rated the wind forces in the game as harder to counter when force-feedback wasactive (avg=3.8 of 5, sd=1.03), when compared to no force feedback (avg= 2.5 of 5,sd=0.85), which was expected after the force readings obtained in Study 1. After play-ing both games, all subjects expressed to prefer force-feedback to no force-feedback.Furthermore, all participants agreed that force-feedback sensations delivered by ourprototype contributed to a positive gaming experience (avg=4.7 of 5, sd=0.48). Finally,we also registered several positive comments concerning sense of increased realismand excitement when gaming with force-feedback.
6 Conclusion
In this paper, we presented a mobile force-feedback device based on EMS. We demon-strated a prototype and illustrated its effect using a mobile gaming application. In threeuser studies we find that the device (1) generates up to 17.5N of force, (2) is correctlyperceived 97.73% of the times by the users in eyes-free condition, and (3) contributesto an enjoyable mobile gaming experience. We believe our research points out a newdirection of how force-feedback can effectively be miniaturized. We expect this to en-able new application areas for mobile force-feedback in the future.
References
[1] Phantom senseable haptic device, http://www.sensable.com last accessed in10/09/2012.
[2] Roland Arsenault and Colin Ware. Eye-hand co-ordination with force feedback. InProceedings of the SIGCHI conference on Human factors in computing systems,CHI ’00, pages 408–414, New York, 2000. ACM.
[3] Akash Badshah, Sidhant Gupta, Gabe Cohn, Nicolas Villar, Steve Hodges, andShwetak N. Patel. Interactive generator: a self-powered haptic feedback device.In Proceedings of the 2011 annual conference on Human factors in computingsystems, CHI ’11, pages 2051–2054, New York, 2011. ACM.
[4] Sidhant Gupta, Tim Campbell, Jeffrey R. Hightower, and Shwetak N. Patel.Squeezeblock: using virtual springs in mobile devices for eyes-free interaction.In Proceedings of the 23nd annual ACM symposium on User interface softwareand technology, UIST ’10, pages 101–104, New York, 2010. ACM.
92 Fall Workshop 2012
References
[5] John Hollerbach and Stephen C. Jacobsen. Haptic interfaces for teleoperation andvirtual environments. In in Proc. of First Workshop on Simulation and Interactionin Virtual Environments, Iowa City, pages 13–15, 1995.
[6] Christian Holz, Tovi Grossman, George Fitzmaurice, and Anne Agur. Implanteduser interfaces. In Proceedings of the 2012 ACM annual conference on HumanFactors in Computing Systems, CHI ’12, pages 503–512, New York, 2012. ACM.
[7] Takayuki Iwamoto, Mari Tatezono, and Hiroyuki Shinoda. Non-contact method forproducing tactile sensation using airborne ultrasound. In Proceedings of the 6thinternational conference on Haptics: Perception, Devices and Scenarios, Euro-Haptics ’08, pages 504–513, Berlin, Heidelberg, 2008. Springer.
[8] Ernst Kruijff, Dieter Schmalstieg, and Steffi Beckhaus. Using neuromuscular elec-trical stimulation for pseudo-haptic feedback. In Proceedings of the ACM sympo-sium on Virtual reality software and technology, VRST ’06, pages 316–319, NewYork, 2006. ACM.
[9] Jun Murayama, Laroussi Bougrila, Yanlinluo Katsuhito Akahane, ShoichiHasegawa, Béat Hirsbrunner, and Makoto Sato. Spidar g&g: A two-handed hapticinterface for bimanual vr interaction. In Proceedings of EuroHaptics 2004, pages138–146, 2004.
[10] Yusuke Nakagawa, Akiya Kamimura, and Yoichiro Kawaguchi. Mimictile: a vari-able stiffness deformable user interface for mobile devices. In Proceedings of the2012 ACM annual conference on Human Factors in Computing Systems, CHI ’12,pages 745–748, New York, 2012. ACM.
[11] Strojnik P, Kralj A, and Ursic I. Programmed six-channel electrical stimulator forcomplex stimulation of leg muscles during walking. IEEE Trans Biomed Eng,26(2):112–116, 02 1979.
[12] Yuriko Suzuki, Minoru Kobayashi, and Satoshi Ishibashi. Design of force feedbackutilizing air pressure toward untethered human interface. In CHI ’02 extendedabstracts on Human factors in computing systems, CHI EA ’02, pages 808–809,New York, 2002. ACM.
[13] Emi Tamaki, Takashi Miyaki, and Jun Rekimoto. Possessedhand: techniques forcontrolling human hands using electrical muscles stimuli. In Proceedings of the2011 annual conference on Human factors in computing systems, CHI ’11, pages543–552, New York, 2011. ACM.
[14] Dzmitry Tsetserukou. Flextorque, flextensor, and hapticeye: exoskeleton hapticinterfaces for augmented interaction. In Proceedings of the 2nd Augmented Hu-man International Conference, AH ’11, pages 33:1–33:2, New York, 2011. ACM.
[15] Malte Weiss, Chat Wacharamanotham, Simon Voelker, and Jan Borchers. Fin-gerflux: near-surface haptic feedback on tabletops. In Proceedings of the 24thannual ACM symposium on User interface software and technology, UIST ’11,pages 615–620, New York, 2011. ACM.
Fall Workshop 2012 93

References
[16] Alex Wright. The touchy subject of haptics. Commun. ACM, 54(1):20–22, January2011.
[17] Lining Yao, Sayamindu Dasgupta, Nadia Cheng, Jason Spingarn-Koff, OstapRudakevych, and Hiroshi Ishii. Rope revolution: tangible and gestural rope in-terface for collaborative play. In Proceedings of the 8th International Conferenceon Advances in Computer Entertainment Technology, ACE ’11, pages 11:1–11:8,New York, 2011. ACM.
94 Fall Workshop 2012
Discovering SPARQL Query Templates forDynamic RDF Triple Prefetching
Johannes LoreyInformation Systems Group
Hasso Plattner [email protected]
When issuing SPARQL queries against remote public endpoints, a user usually faces anumber of limitations, e.g., regarding latency and availability. Especially when implementinga service relying on the information provided by the SPARQL endpoint, this can become achallenge as the service’s quality directly depends on these factors. Here, it would be beneficialto detect similar requests and aggregate suitable information provided by the endpoint. Storingthis data locally helps to respond to subsequent requests in a timely manner. In this work, wepresent an algorithm to detect similar queries and introduce the notion of query templates.Additionally, we illustrate several ways to augment SPARQL queries to prefetch data neededto answer subsequent queries. Lastly, we provide a brief evaluation of our approach based onreal-world query logs.
1 IntroductionPublic SPARQL endpoints provide valuable resources for a multitude of information needs,e.g., about drugs1, government spendings2, or cross-domain knowledge3. However, accessingthis data is cumbersome as the capabilities of these endpoints are usually rather moderate. Asmost data is generated in a research context, the hardware resources available for hosting sucha public infrastructure are limited, e.g., data is not replicated for fast access from differentlocations, query processing might take up to several seconds, or the endpoints suffer fromavailability restrictions.
For services querying data from SPARQL endpoints, these limitations may present a seriouschallenge. Processing retrieved data for future actions, such as integration or visualization, isdelayed by at least the latency required to retrieve the results. This will impede interactiveapplications responding to dynamic user feedback, such as clicking on a point of interest ona map to retrieve information about a city. While circumventing some of these problems,downloading and integrating RDF data locally may also not be desirable (e.g., if there arefrequent updates in datasets) or feasible (e.g., if such datasets are not provided) either.
Hence, there is a clear need for retrieving results for sequences of SPARQL queries in amore efficient way. In this work, we especially focus on detecting similar queries and sequencesof such queries. We will use this information to rewrite queries early in the sequence to retrieve
1http://www4.wiwiss.fu-berlin.de/drugbank/sparql2http://govwild.hpi-web.de/sparql3http://dbpedia.org/sparql
Fall Workshop 2012 95

Discovering SPARQL Query Templates for Dynamic RDF Triple Prefetching
(a subset of) the results of later queries. We can then store these results locally to reduce thelatency for subsequent queries by querying this local RDF store.
The rest of this work is organized as follows: In Sec. 2 we present some preliminarieson SPARQL, the de facto query language for RDF data, and basic notations required forour approach. After that, we introduce an algorithm for detecting query templates, i.e.,SPARQL queries that non-trivially subsume other SPARQL queries, in Sec. 3. In Sec. 4,we illustrate various rewriting strategies that can be applied to queries in a query session toretrieve results that may be useful to answer subsequent queries in the same session. Wecall this process query augmentation. To evaluate both contributions, i.e., template discoveryand query augmentation, we conducted a number of experiments and present some results inSec. 5. We conclude this work and comment on future work in Sec. 6.
2 SPARQLSPARQL is the de facto standard query language for RDF triples. One central concept of aSPARQL query is that of a triple pattern T = (s,p,o) ∈ (V ∪U)× (V ∪U)× (V ∪U ∪L) withV being a set of variables, U being a set of URIs, and L being a set of literals. A SPARQL queryQ contains a number of graph patterns P1,P2, . . . which are defined recursively: (i) A validtriple pattern T is a graph pattern. (ii) If P1 and P2 are graph patterns, then P1 AND P2, P1UNION P2, and P1 OPTIONAL P2 are graph patterns [5]. Notice that curly braces surrounding agraph pattern (i.e., {P}) are syntactically required for both P1 and P2 in a UNION statement,only for P2 in an OPTIONAL statement, and are optional elsewhere. However, to increasereadability, we will usually omit them in this work.
In terms of relational operations, the keyword AND represents an inner join of the two graphpatterns, UNION unsurprisingly denotes their union, and OPTIONAL indicates a left outer joinbetween P1 and P2. Whereas UNION and OPTIONAL are reserved keywords in actual SPARQLqueries to indicate the corresponding connection between two graph patterns, the AND keywordis omitted. In [5], it is shown that there exists a notion of a normal form for SPARQLqueries based on the recursive graph pattern structure presented earlier and the precedence ofthe operators connecting those graph patterns. Hence, for this work we assume a SPARQLSELECT query can always be expressed as a composition of graph patterns, connected eitherby UNION, AND, or OPTIONAL.
For this work, we define the three functions ΘUNION(P ), ΘAND(P ), and ΘOPTIONAL(P ) asfollows (all n≥ 2):
ΘUNION(P ) =
{P1, . . . ,Pn}, iff P := P1 UNION P2 . . . UNION Pn
∅, else.
ΘAND(P ) =
{P}, iff P is a triple pattern{P1, . . . ,Pn}, iff P := P1 AND P2 . . . AND Pn
∅, else.
ΘOPTIONAL(P ) =
{P1, . . . ,Pn}, iff P := P1 OPTIONAL P2 . . . OPTIONAL Pn
∅, else.
96 Fall Workshop 2012
3 Discovering Query Templates
We also define the function Θ(P ):
Θ(P ) =
ΘUNION(P ), if ΘUNION(P ) 6= ∅ΘOPTIONAL(P ), if ΘOPTIONAL(P ) 6= ∅ΘAND(P ), else.
We call |P |= |Θ(P )| the size of a graph pattern. Moreover, we call the graph pattern Pin a query Q the query pattern PQ of Q if for all graph patterns Pi in Q (including P itself)P 6∈Θ(Pi). Note that every query has exactly one query pattern PQ.
In addition, we also introduce a keyword function κ(P ):
κ(P ) =
UNION, iff ∃P1 ∈ PQ : P ∈ΘUNION(P1)OPTIONAL, iff ∃P1,P2 ∈ PQ : P,P2 ∈ΘOPTIONAL(P1)∧P2 OPTIONAL PAND, else.
3 Discovering Query TemplatesIn real-world applications, a large number of queries processed by a SPARQL endpoint exhibitsimilar structures and vary only in a certain number of resources. In this section, we presentquery templates that can be used to cluster these similar SPARQL query structures. To identifysuch query structures, we present a triple pattern similarity metric that is used for our graphpattern matching algorithm. In contrast to [6], we do not rely on knowledge of the underlyingRDF graph for this.
3.1 Triple Pattern Similarity and MergingWe first define triple patterns that can be mapped to and merged with one another. Toestablish a mapping between two triple patterns T1 = (s1,p1,o1) and T2 = (s2,p2,o2), we tryto match the individual elements of T1 with the corresponding part of T2, i.e., we align x1with x2 for x ∈ {s,p,o}.
To calculate the distance of such mappings, we introduce the score ∆(x1,x2):
∆(x1,x2) =
13 ∗
d(x1,x2)max(|x1| , |x2|) + 1 , if x1 ∈ V ∧x2 ∈ V
d(x1,x2)max(|x1| , |x2|) + 1 , if (x1 ∈ U ∧x2 ∈ U)∨ (x1 ∈ L∧x2 ∈ L)
1, else.
Here, |x| is the string length of x and d(x1,x2)→ N0 is a string distance metric withd(x1,x2) = 0⇔ x1 = x2. In our work, we use the Levenshtein distance. Notice that we applythe Levenshtein distance on the entire resource strings, i.e., including possible prefix definitionsfor URIs or types for literals.
Fall Workshop 2012 97
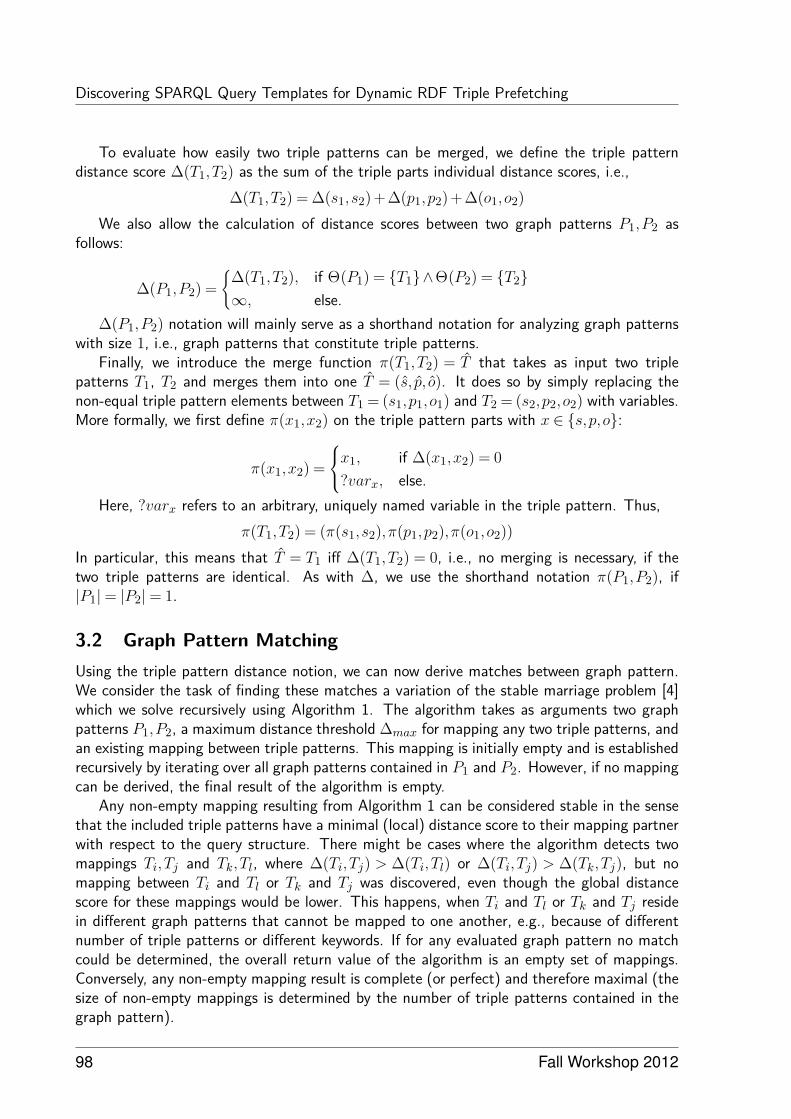
Discovering SPARQL Query Templates for Dynamic RDF Triple Prefetching
To evaluate how easily two triple patterns can be merged, we define the triple patterndistance score ∆(T1,T2) as the sum of the triple parts individual distance scores, i.e.,
∆(T1,T2) = ∆(s1, s2) + ∆(p1,p2) + ∆(o1,o2)We also allow the calculation of distance scores between two graph patterns P1,P2 as
follows:
∆(P1,P2) ={
∆(T1,T2), if Θ(P1) = {T1}∧Θ(P2) = {T2}∞, else.
∆(P1,P2) notation will mainly serve as a shorthand notation for analyzing graph patternswith size 1, i.e., graph patterns that constitute triple patterns.
Finally, we introduce the merge function π(T1,T2) = T that takes as input two triplepatterns T1, T2 and merges them into one T = (s, p, o). It does so by simply replacing thenon-equal triple pattern elements between T1 = (s1,p1,o1) and T2 = (s2,p2,o2) with variables.More formally, we first define π(x1,x2) on the triple pattern parts with x ∈ {s,p,o}:
π(x1,x2) =
x1, if ∆(x1,x2) = 0?varx, else.
Here, ?varx refers to an arbitrary, uniquely named variable in the triple pattern. Thus,π(T1,T2) = (π(s1, s2),π(p1,p2),π(o1,o2))
In particular, this means that T = T1 iff ∆(T1,T2) = 0, i.e., no merging is necessary, if thetwo triple patterns are identical. As with ∆, we use the shorthand notation π(P1,P2), if|P1|= |P2|= 1.
3.2 Graph Pattern MatchingUsing the triple pattern distance notion, we can now derive matches between graph pattern.We consider the task of finding these matches a variation of the stable marriage problem [4]which we solve recursively using Algorithm 1. The algorithm takes as arguments two graphpatterns P1,P2, a maximum distance threshold ∆max for mapping any two triple patterns, andan existing mapping between triple patterns. This mapping is initially empty and is establishedrecursively by iterating over all graph patterns contained in P1 and P2. However, if no mappingcan be derived, the final result of the algorithm is empty.
Any non-empty mapping resulting from Algorithm 1 can be considered stable in the sensethat the included triple patterns have a minimal (local) distance score to their mapping partnerwith respect to the query structure. There might be cases where the algorithm detects twomappings Ti,Tj and Tk,Tl, where ∆(Ti,Tj) > ∆(Ti,Tl) or ∆(Ti,Tj) > ∆(Tk,Tj), but nomapping between Ti and Tl or Tk and Tj was discovered, even though the global distancescore for these mappings would be lower. This happens, when Ti and Tl or Tk and Tj residein different graph patterns that cannot be mapped to one another, e.g., because of differentnumber of triple patterns or different keywords. If for any evaluated graph pattern no matchcould be determined, the overall return value of the algorithm is an empty set of mappings.Conversely, any non-empty mapping result is complete (or perfect) and therefore maximal (thesize of non-empty mappings is determined by the number of triple patterns contained in thegraph pattern).
98 Fall Workshop 2012
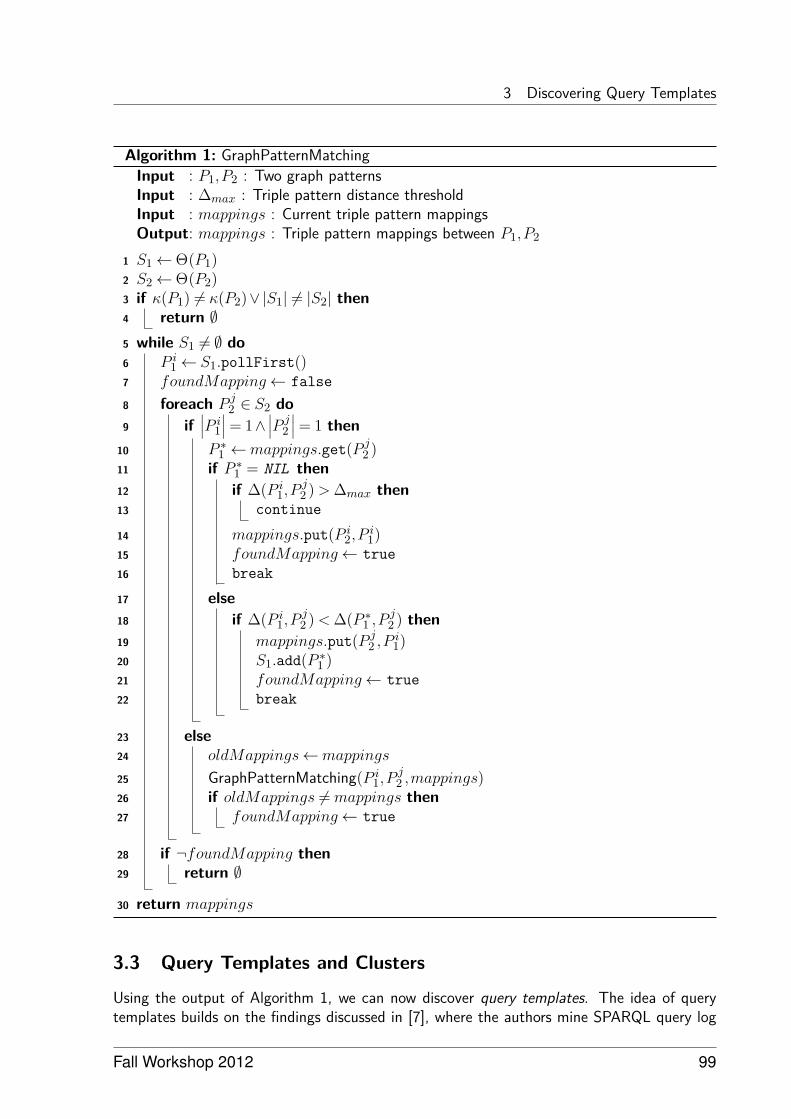
3 Discovering Query Templates
Algorithm 1: GraphPatternMatchingInput : P1,P2 : Two graph patternsInput : ∆max : Triple pattern distance thresholdInput : mappings : Current triple pattern mappingsOutput: mappings : Triple pattern mappings between P1,P2
1 S1←Θ(P1)2 S2←Θ(P2)3 if κ(P1) 6= κ(P2)∨|S1| 6= |S2| then4 return ∅5 while S1 6= ∅ do6 P i
1← S1.pollFirst()7 foundMapping← false8 foreach P j
2 ∈ S2 do9 if
∣∣∣P i1∣∣∣= 1∧
∣∣∣P j2∣∣∣= 1 then
10 P ∗1 ←mappings.get(P j
2 )11 if P ∗
1 = NIL then12 if ∆(P i
1,Pj2 )>∆max then
13 continue
14 mappings.put(P i2,P
i1)
15 foundMapping← true16 break
17 else18 if ∆(P i
1,Pj2 )<∆(P ∗
1 ,Pj2 ) then
19 mappings.put(P j2 ,P
i1)
20 S1.add(P ∗1 )
21 foundMapping← true22 break
23 else24 oldMappings←mappings
25 GraphPatternMatching(P i1,P
j2 ,mappings)
26 if oldMappings 6=mappings then27 foundMapping← true
28 if ¬foundMapping then29 return ∅
30 return mappings
3.3 Query Templates and Clusters
Using the output of Algorithm 1, we can now discover query templates. The idea of querytemplates builds on the findings discussed in [7], where the authors mine SPARQL query log
Fall Workshop 2012 99
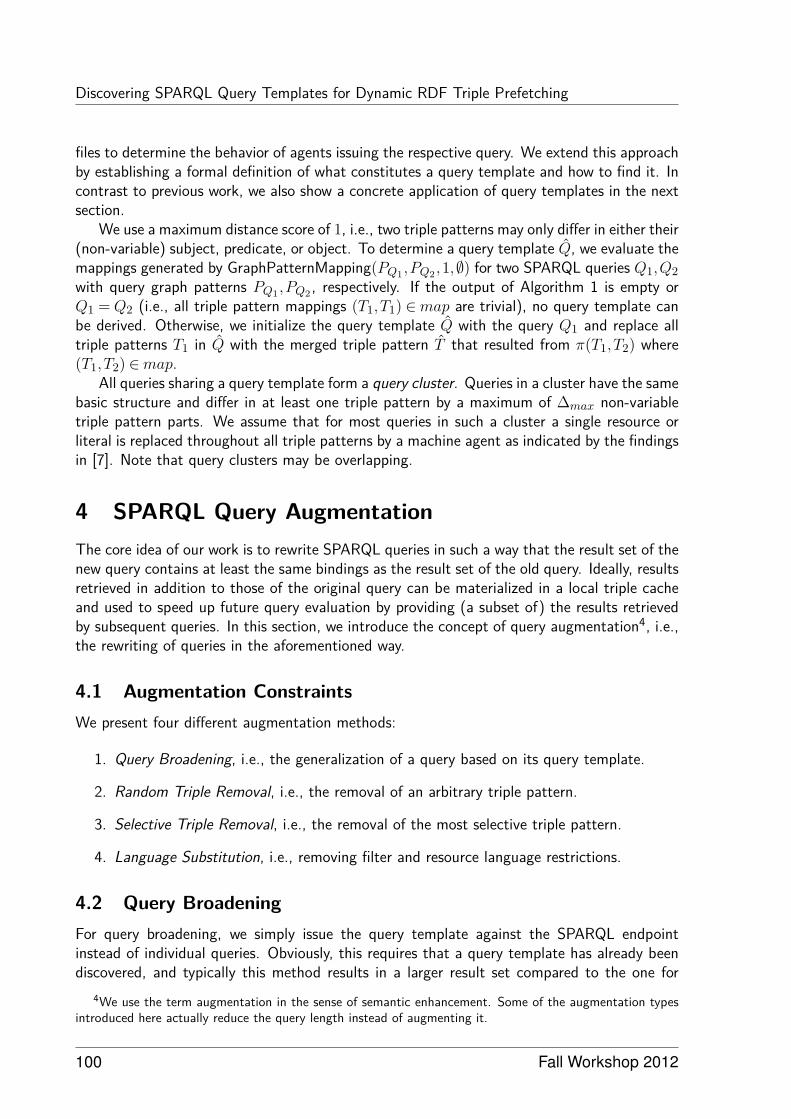
Discovering SPARQL Query Templates for Dynamic RDF Triple Prefetching
files to determine the behavior of agents issuing the respective query. We extend this approachby establishing a formal definition of what constitutes a query template and how to find it. Incontrast to previous work, we also show a concrete application of query templates in the nextsection.
We use a maximum distance score of 1, i.e., two triple patterns may only differ in either their(non-variable) subject, predicate, or object. To determine a query template Q, we evaluate themappings generated by GraphPatternMapping(PQ1 ,PQ2 ,1,∅) for two SPARQL queries Q1,Q2with query graph patterns PQ1 ,PQ2 , respectively. If the output of Algorithm 1 is empty orQ1 = Q2 (i.e., all triple pattern mappings (T1,T1) ∈map are trivial), no query template canbe derived. Otherwise, we initialize the query template Q with the query Q1 and replace alltriple patterns T1 in Q with the merged triple pattern T that resulted from π(T1,T2) where(T1,T2) ∈map.
All queries sharing a query template form a query cluster. Queries in a cluster have the samebasic structure and differ in at least one triple pattern by a maximum of ∆max non-variabletriple pattern parts. We assume that for most queries in such a cluster a single resource orliteral is replaced throughout all triple patterns by a machine agent as indicated by the findingsin [7]. Note that query clusters may be overlapping.
4 SPARQL Query AugmentationThe core idea of our work is to rewrite SPARQL queries in such a way that the result set of thenew query contains at least the same bindings as the result set of the old query. Ideally, resultsretrieved in addition to those of the original query can be materialized in a local triple cacheand used to speed up future query evaluation by providing (a subset of) the results retrievedby subsequent queries. In this section, we introduce the concept of query augmentation4, i.e.,the rewriting of queries in the aforementioned way.
4.1 Augmentation ConstraintsWe present four different augmentation methods:
1. Query Broadening, i.e., the generalization of a query based on its query template.
2. Random Triple Removal, i.e., the removal of an arbitrary triple pattern.
3. Selective Triple Removal, i.e., the removal of the most selective triple pattern.
4. Language Substitution, i.e., removing filter and resource language restrictions.
4.2 Query BroadeningFor query broadening, we simply issue the query template against the SPARQL endpointinstead of individual queries. Obviously, this requires that a query template has already beendiscovered, and typically this method results in a larger result set compared to the one for
4We use the term augmentation in the sense of semantic enhancement. Some of the augmentation typesintroduced here actually reduce the query length instead of augmenting it.
100 Fall Workshop 2012
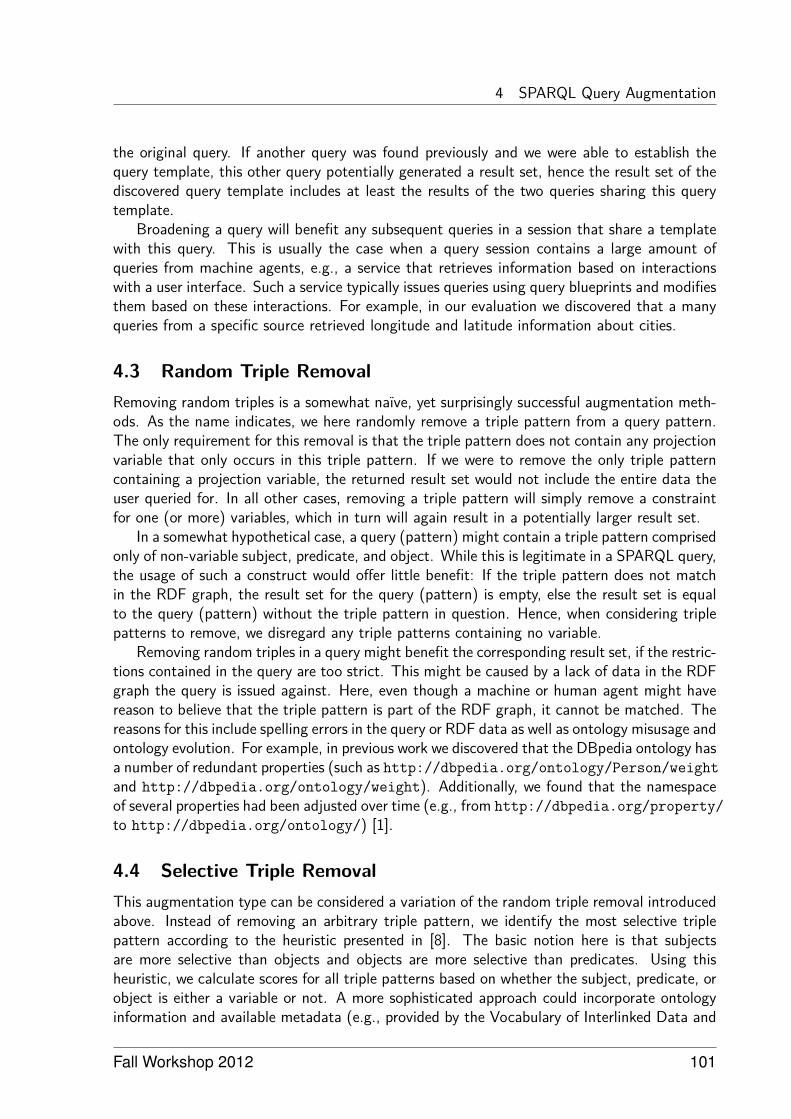
4 SPARQL Query Augmentation
the original query. If another query was found previously and we were able to establish thequery template, this other query potentially generated a result set, hence the result set of thediscovered query template includes at least the results of the two queries sharing this querytemplate.
Broadening a query will benefit any subsequent queries in a session that share a templatewith this query. This is usually the case when a query session contains a large amount ofqueries from machine agents, e.g., a service that retrieves information based on interactionswith a user interface. Such a service typically issues queries using query blueprints and modifiesthem based on these interactions. For example, in our evaluation we discovered that a manyqueries from a specific source retrieved longitude and latitude information about cities.
4.3 Random Triple RemovalRemoving random triples is a somewhat naïve, yet surprisingly successful augmentation meth-ods. As the name indicates, we here randomly remove a triple pattern from a query pattern.The only requirement for this removal is that the triple pattern does not contain any projectionvariable that only occurs in this triple pattern. If we were to remove the only triple patterncontaining a projection variable, the returned result set would not include the entire data theuser queried for. In all other cases, removing a triple pattern will simply remove a constraintfor one (or more) variables, which in turn will again result in a potentially larger result set.
In a somewhat hypothetical case, a query (pattern) might contain a triple pattern comprisedonly of non-variable subject, predicate, and object. While this is legitimate in a SPARQL query,the usage of such a construct would offer little benefit: If the triple pattern does not matchin the RDF graph, the result set for the query (pattern) is empty, else the result set is equalto the query (pattern) without the triple pattern in question. Hence, when considering triplepatterns to remove, we disregard any triple patterns containing no variable.
Removing random triples in a query might benefit the corresponding result set, if the restric-tions contained in the query are too strict. This might be caused by a lack of data in the RDFgraph the query is issued against. Here, even though a machine or human agent might havereason to believe that the triple pattern is part of the RDF graph, it cannot be matched. Thereasons for this include spelling errors in the query or RDF data as well as ontology misusage andontology evolution. For example, in previous work we discovered that the DBpedia ontology hasa number of redundant properties (such as http://dbpedia.org/ontology/Person/weightand http://dbpedia.org/ontology/weight). Additionally, we found that the namespaceof several properties had been adjusted over time (e.g., from http://dbpedia.org/property/to http://dbpedia.org/ontology/) [1].
4.4 Selective Triple RemovalThis augmentation type can be considered a variation of the random triple removal introducedabove. Instead of removing an arbitrary triple pattern, we identify the most selective triplepattern according to the heuristic presented in [8]. The basic notion here is that subjectsare more selective than objects and objects are more selective than predicates. Using thisheuristic, we calculate scores for all triple patterns based on whether the subject, predicate, orobject is either a variable or not. A more sophisticated approach could incorporate ontologyinformation and available metadata (e.g., provided by the Vocabulary of Interlinked Data and
Fall Workshop 2012 101
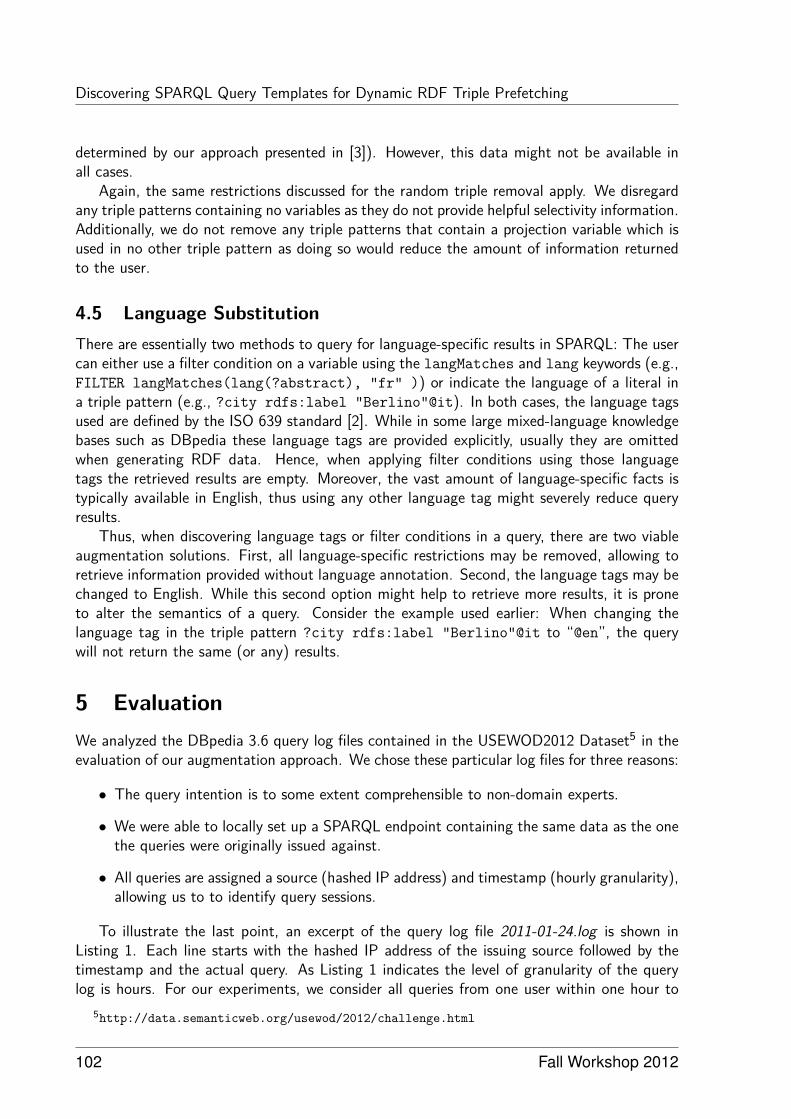
Discovering SPARQL Query Templates for Dynamic RDF Triple Prefetching
determined by our approach presented in [3]). However, this data might not be available inall cases.
Again, the same restrictions discussed for the random triple removal apply. We disregardany triple patterns containing no variables as they do not provide helpful selectivity information.Additionally, we do not remove any triple patterns that contain a projection variable which isused in no other triple pattern as doing so would reduce the amount of information returnedto the user.
4.5 Language SubstitutionThere are essentially two methods to query for language-specific results in SPARQL: The usercan either use a filter condition on a variable using the langMatches and lang keywords (e.g.,FILTER langMatches(lang(?abstract), "fr" )) or indicate the language of a literal ina triple pattern (e.g., ?city rdfs:label "Berlino"@it). In both cases, the language tagsused are defined by the ISO 639 standard [2]. While in some large mixed-language knowledgebases such as DBpedia these language tags are provided explicitly, usually they are omittedwhen generating RDF data. Hence, when applying filter conditions using those languagetags the retrieved results are empty. Moreover, the vast amount of language-specific facts istypically available in English, thus using any other language tag might severely reduce queryresults.
Thus, when discovering language tags or filter conditions in a query, there are two viableaugmentation solutions. First, all language-specific restrictions may be removed, allowing toretrieve information provided without language annotation. Second, the language tags may bechanged to English. While this second option might help to retrieve more results, it is proneto alter the semantics of a query. Consider the example used earlier: When changing thelanguage tag in the triple pattern ?city rdfs:label "Berlino"@it to “@en”, the querywill not return the same (or any) results.
5 EvaluationWe analyzed the DBpedia 3.6 query log files contained in the USEWOD2012 Dataset5 in theevaluation of our augmentation approach. We chose these particular log files for three reasons:
• The query intention is to some extent comprehensible to non-domain experts.
• We were able to locally set up a SPARQL endpoint containing the same data as the onethe queries were originally issued against.
• All queries are assigned a source (hashed IP address) and timestamp (hourly granularity),allowing us to to identify query sessions.
To illustrate the last point, an excerpt of the query log file 2011-01-24.log is shown inListing 1. Each line starts with the hashed IP address of the issuing source followed by thetimestamp and the actual query. As Listing 1 indicates the level of granularity of the querylog is hours. For our experiments, we consider all queries from one user within one hour to
5http://data.semanticweb.org/usewod/2012/challenge.html
102 Fall Workshop 2012
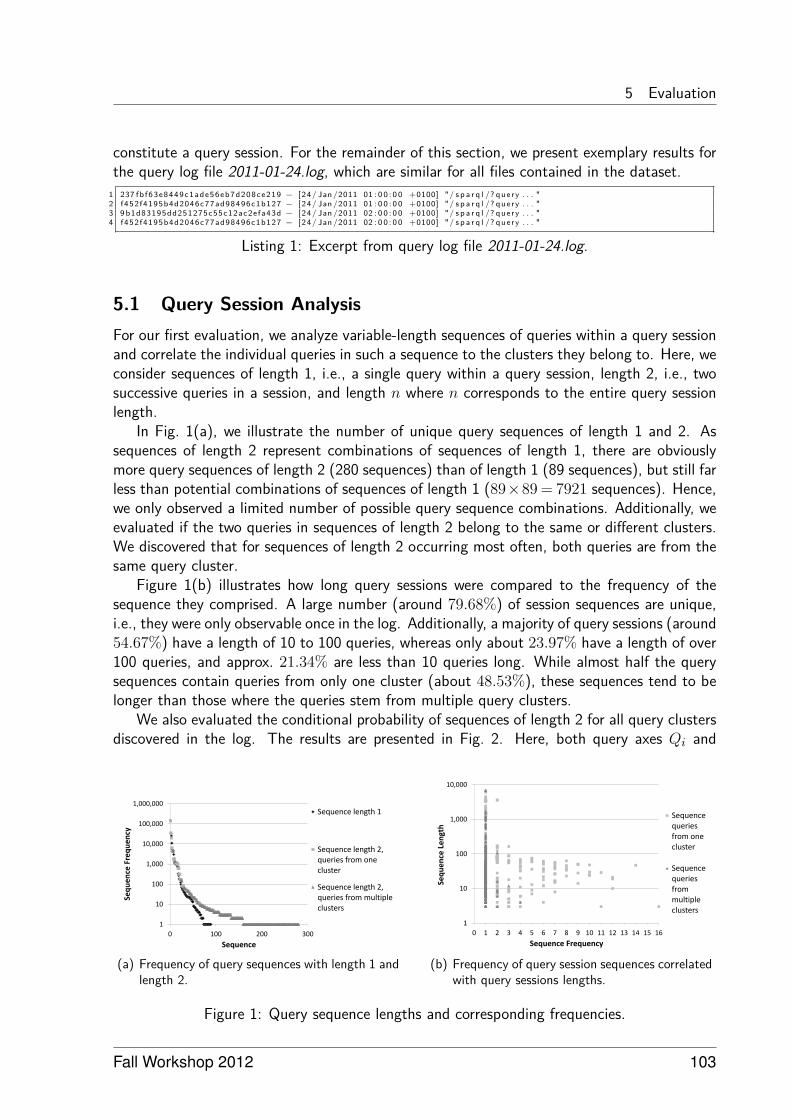
5 Evaluation
constitute a query session. For the remainder of this section, we present exemplary results forthe query log file 2011-01-24.log, which are similar for all files contained in the dataset.
1 237 fb f63e8449c1ade56eb7d208ce219 − [ 24/ Jan /2011 01 : 0 0 : 0 0 +0100] "/ s p a r q l /? query . . . "2 f452f4195b4d2046c77ad98496c1b127 − [ 24/ Jan /2011 01 : 0 0 : 0 0 +0100] "/ s p a r q l /? query . . . "3 9 b1d83195dd251275c55c12ac2efa43d − [ 24/ Jan /2011 02 : 0 0 : 0 0 +0100] "/ s p a r q l /? query . . . "4 f452f4195b4d2046c77ad98496c1b127 − [ 24/ Jan /2011 02 : 0 0 : 0 0 +0100] "/ s p a r q l /? query . . . "
Listing 1: Excerpt from query log file 2011-01-24.log.
5.1 Query Session AnalysisFor our first evaluation, we analyze variable-length sequences of queries within a query sessionand correlate the individual queries in such a sequence to the clusters they belong to. Here, weconsider sequences of length 1, i.e., a single query within a query session, length 2, i.e., twosuccessive queries in a session, and length n where n corresponds to the entire query sessionlength.
In Fig. 1(a), we illustrate the number of unique query sequences of length 1 and 2. Assequences of length 2 represent combinations of sequences of length 1, there are obviouslymore query sequences of length 2 (280 sequences) than of length 1 (89 sequences), but still farless than potential combinations of sequences of length 1 (89×89 = 7921 sequences). Hence,we only observed a limited number of possible query sequence combinations. Additionally, weevaluated if the two queries in sequences of length 2 belong to the same or different clusters.We discovered that for sequences of length 2 occurring most often, both queries are from thesame query cluster.
Figure 1(b) illustrates how long query sessions were compared to the frequency of thesequence they comprised. A large number (around 79.68%) of session sequences are unique,i.e., they were only observable once in the log. Additionally, a majority of query sessions (around54.67%) have a length of 10 to 100 queries, whereas only about 23.97% have a length of over100 queries, and approx. 21.34% are less than 10 queries long. While almost half the querysequences contain queries from only one cluster (about 48.53%), these sequences tend to belonger than those where the queries stem from multiple query clusters.
We also evaluated the conditional probability of sequences of length 2 for all query clustersdiscovered in the log. The results are presented in Fig. 2. Here, both query axes Qi and
1
10
100
1,000
10,000
100,000
1,000,000
0 100 200 300
Seq
ue
nce
Fre
qu
en
cy
Sequence
Sequence length 1
Sequence length 2, queries from one cluster
Sequence length 2, queries from multiple clusters
(a) Frequency of query sequences with length 1 andlength 2.
1
10
100
1,000
10,000
0 1 2 3 4 5 6 7 8 9 10 11 12 13 14 15 16
Seq
uen
ce L
en
gth
Sequence Frequency
Sequence queries from one cluster
Sequence queries from multiple clusters
(b) Frequency of query session sequences correlatedwith query sessions lengths.
Figure 1: Query sequence lengths and corresponding frequencies.
Fall Workshop 2012 103
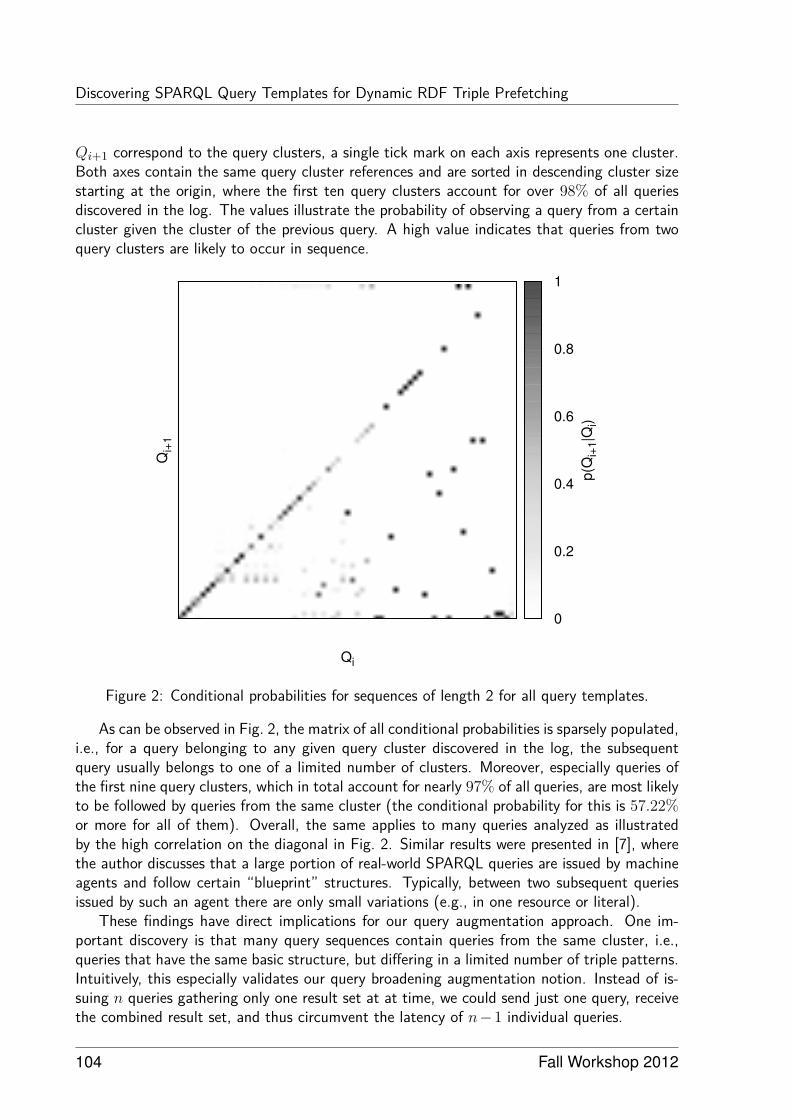
Discovering SPARQL Query Templates for Dynamic RDF Triple Prefetching
Qi+1 correspond to the query clusters, a single tick mark on each axis represents one cluster.Both axes contain the same query cluster references and are sorted in descending cluster sizestarting at the origin, where the first ten query clusters account for over 98% of all queriesdiscovered in the log. The values illustrate the probability of observing a query from a certaincluster given the cluster of the previous query. A high value indicates that queries from twoquery clusters are likely to occur in sequence.
Qi
Qi+
1
0
0.2
0.4
0.6
0.8
1
p(Q
i+1|
Qi)
Figure 2: Conditional probabilities for sequences of length 2 for all query templates.
As can be observed in Fig. 2, the matrix of all conditional probabilities is sparsely populated,i.e., for a query belonging to any given query cluster discovered in the log, the subsequentquery usually belongs to one of a limited number of clusters. Moreover, especially queries ofthe first nine query clusters, which in total account for nearly 97% of all queries, are most likelyto be followed by queries from the same cluster (the conditional probability for this is 57.22%or more for all of them). Overall, the same applies to many queries analyzed as illustratedby the high correlation on the diagonal in Fig. 2. Similar results were presented in [7], wherethe author discusses that a large portion of real-world SPARQL queries are issued by machineagents and follow certain “blueprint” structures. Typically, between two subsequent queriesissued by such an agent there are only small variations (e.g., in one resource or literal).
These findings have direct implications for our query augmentation approach. One im-portant discovery is that many query sequences contain queries from the same cluster, i.e.,queries that have the same basic structure, but differing in a limited number of triple patterns.Intuitively, this especially validates our query broadening augmentation notion. Instead of is-suing n queries gathering only one result set at at time, we could send just one query, receivethe combined result set, and thus circumvent the latency of n−1 individual queries.
104 Fall Workshop 2012
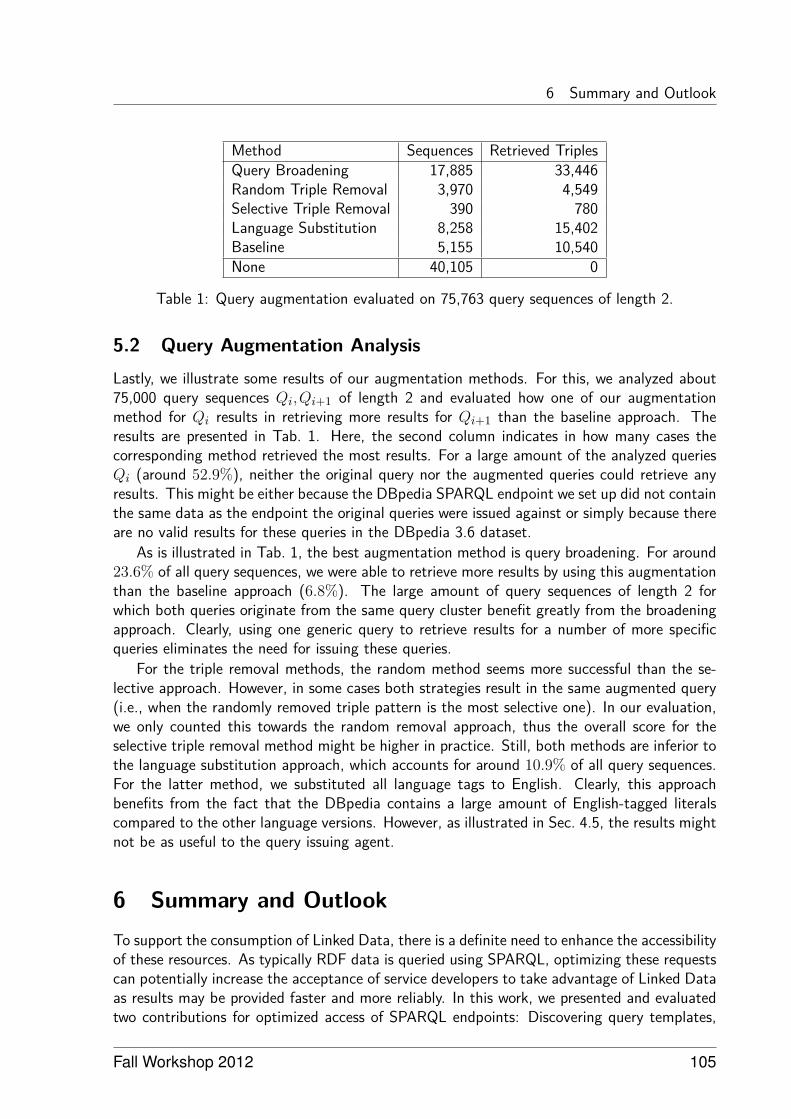
6 Summary and Outlook
Method Sequences Retrieved TriplesQuery Broadening 17,885 33,446Random Triple Removal 3,970 4,549Selective Triple Removal 390 780Language Substitution 8,258 15,402Baseline 5,155 10,540None 40,105 0
Table 1: Query augmentation evaluated on 75,763 query sequences of length 2.
5.2 Query Augmentation AnalysisLastly, we illustrate some results of our augmentation methods. For this, we analyzed about75,000 query sequences Qi,Qi+1 of length 2 and evaluated how one of our augmentationmethod for Qi results in retrieving more results for Qi+1 than the baseline approach. Theresults are presented in Tab. 1. Here, the second column indicates in how many cases thecorresponding method retrieved the most results. For a large amount of the analyzed queriesQi (around 52.9%), neither the original query nor the augmented queries could retrieve anyresults. This might be either because the DBpedia SPARQL endpoint we set up did not containthe same data as the endpoint the original queries were issued against or simply because thereare no valid results for these queries in the DBpedia 3.6 dataset.
As is illustrated in Tab. 1, the best augmentation method is query broadening. For around23.6% of all query sequences, we were able to retrieve more results by using this augmentationthan the baseline approach (6.8%). The large amount of query sequences of length 2 forwhich both queries originate from the same query cluster benefit greatly from the broadeningapproach. Clearly, using one generic query to retrieve results for a number of more specificqueries eliminates the need for issuing these queries.
For the triple removal methods, the random method seems more successful than the se-lective approach. However, in some cases both strategies result in the same augmented query(i.e., when the randomly removed triple pattern is the most selective one). In our evaluation,we only counted this towards the random removal approach, thus the overall score for theselective triple removal method might be higher in practice. Still, both methods are inferior tothe language substitution approach, which accounts for around 10.9% of all query sequences.For the latter method, we substituted all language tags to English. Clearly, this approachbenefits from the fact that the DBpedia contains a large amount of English-tagged literalscompared to the other language versions. However, as illustrated in Sec. 4.5, the results mightnot be as useful to the query issuing agent.
6 Summary and OutlookTo support the consumption of Linked Data, there is a definite need to enhance the accessibilityof these resources. As typically RDF data is queried using SPARQL, optimizing these requestscan potentially increase the acceptance of service developers to take advantage of Linked Dataas results may be provided faster and more reliably. In this work, we presented and evaluatedtwo contributions for optimized access of SPARQL endpoints: Discovering query templates,
Fall Workshop 2012 105
References
i.e., detecting similar SPARQL queries, and query augmentation, i.e., rewriting queries toretrieve more results fitting for subsequent requests.
In future work, we plan on using the evaluation results presented in Sec. 5 to train a classifierto augment queries once they are issued by the agent. This will enable us to gradually enricha local cache of RDF triples that can then be used to provide results for subsequent queries.For managing this cache, we will also focus on how query results from one agent can be usedfor other users and how cache results are invalidated. Additionally, we plan on implementingmore augmentation methods better suited for the query sequences we found in our evaluation.For this, we want to analyze how human and machine agent requests differ, and how thisknowledge can be used to find proper augmentation methods.
References[1] Ziawasch Abedjan, Johannes Lorey, and Felix Naumann. Reconciling ontologies and the
web of data. In Proceedings of the International Conference on Information and KnowledgeManagement (CIKM), Maui, HI, USA, October 2012.
[2] Harald Alvestrand. RFC 3066 - tags for the identification of languages. Technical report,IETF, 2001.
[3] Christoph Böhm, Johannes Lorey, and Felix Naumann. Creating voiD descriptions forweb-scale data. Journal of Web Semantics, 9(3):339–345, 2011.
[4] David Gale and Lloyd Shapley. College admissions and the stability of marriage. TheAmerican Mathematical Monthly, 69(1):9–15, 1962.
[5] Claudio Gutierrez Jorge Pérez, Marcelo Arenas. Semantics and complexity of SPARQL.ACM Transactions on Database Systems (TODS), 34(3):16:1–16:45, September 2009.
[6] Jens Lehmann and Lorenz Bühmann. AutoSPARQL: let users query your knowledge base.In Proceedings of the Extended Semantic Web Conference (ESWC), pages 63–79, Crete,Greece, 2011.
[7] Aravindan Raghuveer. Characterizing machine agent behavior through SPARQL querymining. In Proceedings of the International Workshop on Usage Analysis and the Web ofData (USEWOD), Lyon, France, April 2012.
[8] Markus Stocker, Andy Seaborne, Abraham Bernstein, Christoph Kiefer, and DaveReynolds. SPARQL basic graph pattern optimization using selectivity estimation. In Pro-ceedings of the International World Wide Web Conference (WWW), pages 595–604, NewYork, NY, USA, April 2008. ACM.
106 Fall Workshop 2012
Meyer
The Role of Objectsin Process Model Abstraction
Andreas Meyer
Business Process Technology GroupHasso Plattner Institute
This report outlines my phd research project targeting the field of process model ab-straction. While currently existing techniques allow the abstraction of control flow invarious kinds, e.g., semantically or structurally, objects are not considered yet in theprocess of process model abstraction. Therefore, we will provide new means for pro-cess model abstraction involving object abstraction – as extension to existing controlflow abstractions to enrich these techniques as well as as standalone approach withoutaffecting control flow. However, the process model to be abstracted needs to be cor-rect to provide meaningful and useful abstraction results. Again, for control flow, manycorrection criteria and checking methods do exist, e.g., various soundness checks andthe field of process compliance, but object specific correctness is supported rarely. Wewill introduce the notion of weak conformance, which extends the existing conformancenotion with means to handle not fully specified process models with respect to the givenobject life cycle as for instance abstracted process models. Thereby, object life cyclesdetermine the actions allowed to be performed by an activity on the corresponding ob-ject based on the current state of the object. Finally, the proposed techniques for objectabstraction and object correctness will be evaluated in a user study, for which processmodel collections are required, which provide process models with explicit object mod-eling. Unfortunately, such collections are very rare. Therefore, we will introduce anapproach to derive object information from activity and event labels and to transformthe given process model with no or incomplete object specification into one with a morecomplete explicit object specification.
1 Introduction
Business process management as “a systematic, structured approach to analyze, im-prove, control, and manage processes with the aim of improving the quality of productsand services” [5] is an important approach to manage work in organizations, with pro-cess models being the key artifacts [20]. Process modeling usually comprises two as-pects: Control flow and object flow. Control flow defines possible execution sequencesof activities, whereas object flow describes the exchange of information between theactivities by writing to and reading from these objects. An object can be formalized as
Fall Workshop 2012 107
The Role of Objects in Process Model Abstraction
set of object states and transitions between them, i.e., as labeled transition system,which is usually referred to as object life cycle. An object life cycle can be used to iden-tify the current object state of the object and the set of reachable object states fromthe current one [3]. Additionally, objects have dependencies amongst each other, e.g.,is-a and part-of relationships. These can be represented by using a class diagram –an object model.
The work managed by business process management is interesting for many dif-ferent stakeholders of the organization, e.g., the board, the middle management, theclerk, or the IT staff, who is implementing the business processes to support the clerkswith IT infrastructure while they execute their processes. Each of these groups has dif-ferent requirements with respect to the information to be displayed in the correspondingprocess model, usually provided by the use of process model views [2,19]. One methodto create such views is process model abstraction [17,18] as it allows the presentationof the very same business process in different views to various stakeholders by avoid-ing inconsistencies through several independent models; each view is adapted to thespecific needs of the corresponding stakeholder by leaving out, aggregating, and/ orrefining elements of the process model [6]. Thereby, existing techniques only con-sider control flow aspects for abstraction although objects are the driving force for pro-cess execution and important for process controlling and understanding as mentionedabove. Therefore, we add object support to process model abstraction by extendingthe existing techniques relying on fragment-based control flow abstraction, e.g., [16].We assume structurally sound process models and an explicitly defined object model.Object abstraction decisions are based on occurrences of objects in the process modeland their relations in the object model as follows. Specifically, control flow and objectbehavior correspond to each other such that we provide a rule set, which allows objectabstraction closely related to control flow abstraction. The utilized existing fragment-based control flow abstraction technique identifies the elements of the process modelsaffected for a single abstraction step and based on this information, the objects getdeleted, composed, or are preserved as is.
However, object abstraction requires correct object specifications in the source pro-cess model to be able to provide useful abstraction results with correctness referring to,for instance, safe execution of process models; i.e. the execution shall terminate prop-erly. The execution semantics of process models are often described by Petri nets [14],which describe which activities can be executed based on activity enablement. In or-der to achieve safe execution, it must be ensured that every time an activity tries toaccess an object, the object is in a certain expected object state or is able to reachthat expected object state from the current one via, for instance, implicitly or externallyinitiated object state transitions following the definitions of the corresponding object lifecycle.
While there exists a large variety of correctness notions targeting control flow as-pects of process models, only few exist to check whether objects are correctly used.The existing notions as, for instance, the conformance notion from [8], require fullyspecified process models such that only finalized process models on the lowest levelof abstraction, the implementation level, can be checked. The conformance notionfrom [8] evaluates whether all object state transitions occurring in the process modelcan be mapped to a object state transition of the corresponding object life cycle. How-
108 Fall Workshop 2012
2 Execution Semantics
ever process model creation is an iterative process and process models may exist ondifferent levels of abstractions – or are intentionally created that way to cater for thespecific needs of a stakeholder. Being able to check also these process models allowsthe identification of errors in early process development stages and in underspecifiedprocess models as well as the post-check whether object abstraction preserved theproperty of conformance. We introduce the notion of weak conformance between aprocess model and the object life cycles of the objects utilized in the process to ensurethis correctness criteria for fully as well as underspecified process models.
For evaluation purposes, example sets of process models need to have attachedobject information. Unfortunately, the freely available process collections mainly lacksuch process models. Therefore, we provide means to derive information about objectutilization from activity and event labels such that the resulting process model gets an-notated with this object information. The derivation bases on findings from [10] as theauthors state that each activity label can be decomposed in up to three components:An action, a object an action is performed upon, and an fragment providing furtherdetails (e.g., locations, resources or regulations). However, completeness cannot beguaranteed by only deriving object information from labels as, for instance, possibleimplicit dependencies are not comprised in all cases. Nevertheless, the approach pro-vides a process model more complete than the source process model and therefore,allows or increases usefulness of a process model for evaluation application.
The remainder of this report is as follows. Section 2 describes the execution seman-tics of process models with focusing on objects dependencies. Afterwards, Sections 3to 5 summarize the current state of three main contributions the phd research projectwill deliver before we conclude this report. First, we sketch the approach of enrichingprocess models with explicit objects from labels followed by the notion of weak con-formance and proposals of how to apply the notion. Finally, we introduce one objectabstraction technique as extension to a subclass of the existing control flow abstractiontechniques in Section 5.
2 Execution Semantics
This section introduces the semantics of process models presented by Petri nets. Eachprocess model aligning with the definitions from [11] and [13] can be transformed intoa Petri net by a set of rules. Thereby, we apply commonly used and accepted rules forcontrol flow transformation, e.g., activities are transformed to transitions, they are la-beled with the corresponding activity names, e.g., check order, and they are connectedalong there execution paths by edges via places to ensure the bipartite property. Addi-tionally, we add further nop transitions – transitions not performing any work – which wewill use for object and control flow synchronization as explained blow. Object accessis usually considered as passive part of a process model and therefore representedby places in Petri nets (compare for instance [1]) – if at all. However, the process ofreading and writing objects to respectively from, for instance, a database is active work.Objects to be stored must be prepared to meet the requirements of the correspondingobject store as the data schema might be different to the one utilized in the processmodel. Similarly, objects to be read must also be preprocessed. Additionally, the ac-
Fall Workshop 2012 109

The Role of Objects in Process Model Abstraction
Check stock
Order.
confirmed
Product.
notInStock
Product.
inStock
Order.
warehoused
Order
Product
Figure 1: Semantics of process models presented by Petri net excerpt
tual object storage and retrieval comprise several atomic tasks like consistency checksand object access initiation including authentication. Persisting the object processedduring process execution is necessary to allow, amongst others, fallback strategies inemergency cases. Therefore, we decided to represent objects as transitions as well inthe resulting Petri net.
For space reasons, we omit the complete rule set but provide an overview aboutthe transformation result. Assuming an order and delivery process, one of the activ-ities undertaken during process execution might be check stock. The next executionstep within the process is based on the outcome of the current activity one out of twoalternatives. This activity requires the object order in object state confirmed as inputrequirements, i.e., as precondition to allow the activity to get executed. Executing thisactivity results in an object Product either in object state inStock or notInStock to indi-cate whether the ordered items are available or not. Additionally, the order object gettransitioned into object state warehoused. Finally, it is also to be mentioned that nottwo activities access an object simultaneously as long as on of them is going to updatethe object for avoiding lost update issues (transaction property).
Figure 1 shows the Petri net excerpt describing the execution semantics. Thereby,the large places with labels inside are used as semaphores and their usage ensure thementioned transaction property. The shaded transitions are the nop ones mentionedabove for object and control flow synchronization. The dotted elements are used todefine xor-split semantics deterministically based on object information; take the upperpath, if the object state is notInStock, and take the lower path, if the object state isinStock. The remaining blank transitions and places describe the control and objectflow of the process model. As described above, transition (or activity in the processmodel) Check stock can only fire (be executed), if the control flow reaches the placesjust before the transition and if object Order can be read in object state confirmed, i.e.,
110 Fall Workshop 2012
3 Extracting Objects and Object States
earlier stages of the process must have provided the object in that object state, and ifthe object Product is currently not utilized by another transition, i.e., the correspondingsemaphore place is marked. Completing transition Check stock results in two actionsbesides passing on the control flow. First, object Order is transitioned into object statewarehoused and the object Product is transitioned either in object state inStock orobject state notInStock depending on the execution of the corresponding businessprocess activity. Second, the semaphore places for both data objects get marked againto signal data access completion. As the reader can see within this example, the noptransition before the activity in question is used to get all necessary objects in therequired object states (read) while the nop transition after the activity is used to providethe updated objects in their new object states to the process context (write).
3 Extracting Objects and Object States
Usually, information about objects is hidden in activity labels such that process modelscovering control flow only can be enriched with these implicit information to provideinsights about object usage. [10] describes that each activity label can be decomposedin up to three components: An action, an object an action is performed upon, anda fragment providing further details (e.g., locations, resources or regulations). Forinstance, the activity labels order material from supplier and create order from templateencode the information, that objects material and order respectively are processedby the corresponding activity. The actions performed are order and create while theadditional fragments provide information which additional resource is involved in theorder action and that regulation stating a specific template is to be used has to befulfilled. Following, we aim to enrich process models with information about the utilizedobjects in general and about the objct states of these objects specifically for eachassociation between an object and and activity.
The algorithm sketched below can be generally applied to most process modelsfrom various notations as it focuses on core business process aspects as activities,gateways, and control flow edges as input for object information derivation. The onlyrequirement is, that the notation of choice is capable of modeling objects, which ba-sically all current notations allow [12], such that we can create the enriched processmodel within that notation. However, we also provide the opportunity to input processmodels in a notation not capable of modeling objects. But in these cases, the processmodel needs to be transformed in a canonical format – we use jbpt, a Java-basedlibrary containing techniques for managing and analyzing business processes. Seehttp://code.google.com/p/jbpt/ for details. The output will be a jbpt processmodel with explicit objects attached. Moreover, this algorithm can be easily adapted tobe specifically tailored for a chosen notation. Thereby, additions are possible to benefitfrom all information a notation of choice can provide to increase the derivation resultquality. We will provide (but omit here for space reasons) adaptations for the BusinessProcess Model and Notation (BPMN) [15], Event-driven Process Chains (EPC) [7],and extended Event-driven Process Chains (eEPC), developed by ARIS and extend-ing EPCs, where the latter two extend the algorithm to incorporate information providedby events preceding and succeeding the activities.
Fall Workshop 2012 111
The Role of Objects in Process Model Abstraction
The basic algorithm comprises four steps to enrich the given process model. First,a preprocessing is applied to ensure that all labels match the so-called verb-object-style, where a verb is followed by a noun, which, in turn, may be followed by additionalinformation as in the examples above. Using the algorithm proposed in [9], we receivethe desired labeling style. Next, all activity labels of the process model get analyzedsuch that the noun is considered as object and the verb is considered as indicator forthe state of that object after activity execution. The final two steps add the objects to theactivities. The objects named in the label will get output objects to the correspondingactivity. All objects being output of a directly preceding activity will get input objects tothe corresponding activity. Therewith, the enriched process model is provided.
However, there are many opportunities to fine tune this approach. For instance, theresource assignments and object access rights can be taken into account such thatonly objects, which have been executed by a certain resource (role) get input object ofan activity. Additionally, the access rights might also limit the number of objects beinginput to an activity as only the ones, which the resource executing the according activityis allowed to access, may get input objects.
4 Notion of Weak Conformance
Given a process scenario composed of a process model, a set of object life cyclesutilized within this scenario, and a set of synchronization edges describing the de-pendencies between the object states of the different objects, we say that the processscenario satisfies weak conformance, if the process model satisfies weak conformancewith respect to each of its objects. Weak object conformance is satisfied, if for eachtwo directly succeeding states of an object in a process model there exists an execu-tion sequence from the first to the second object state in the corresponding object lifecycle and if the dependencies specified by synchronization edges with a target statematching the second object state of the two succeeding ones hold such that all depen-dency conjunctions and disjunctions are fulfilled. Two object states are succeeding inthe process model, if either (i) they are accessed by the same activity with one beingpart of an input and one being part of an output object flow edge or (ii) there exists anexecution sequence in the process model in which two different activities access thesame object in two object states with no further access to this object in-between.
Computation of weak conformance can be performed using various techniques, asfor instance the following ones. First, paths in the process model and the correspondingobject life cycles may be analyzed and evaluated with respect to reachability of objectstates to decide about weak conformance. Second, the concept of soundness checkingcan be utilized. Therefore, the process model and the object life cycles are transformedinto Petri nets and integrated into a single Petri net to be checked for soundness. Third,model checking can be used by checking computational tree logic formulas, derivedfrom the object life cycles, against a Kripke structure derived from the process model.The first faces the issue of high complexity with respect to the synchronization edges.However, we will propose an algorithm, which allows to compute weak conformancevia path analysis, if no synchronization edges are specified in a process scenario. ThePetri net approach deals with very large and complex Petri nets, but thanks to ex-
112 Fall Workshop 2012
5 Object Abstraction
isting services, e.g., LoLA (see http://service-technology.org/tools/lolafor details), they can be handled automatically and no human needs to interact withthese very complex Petri nets. However, there exist cases, when decidability relies onrelaxed soundness but determination of accepting traces is complex. Model checkingis also an expensive task but provides a result without compromises. The number ofCTL formulas is exponential to the number of object states in the object life cycle asfor each possible implicit, external and in-process object state transition, one formulamust be derived and put into the correct combination with the others. This can be donecompletely automatically based on a set of rules. For three object states in sequence,formulas must be derived to cover the facts that we stay in the first forever, move to thsecond, move directly to the third, stay forever in the second, move from the second tothe third, and stay in the third forever. Additionally, rules for the synchronization edgesmust be derived and incorporated in the model checking procedure. The increase ofcomplexity is linear to the number of rules specified.
5 Object Abstraction
There exist two alternatives with respect to the relation between control flow and ob-jects: Object abstraction follows control flow abstraction and object abstraction as stan-dalone approach independently from control flow. In this report, we focus on the firstoption, i.e., we extend existing process model abstraction techniques with the capabil-ity to abstract objects as well. The only requirement, a technique must fulfill, is that itutilizes fragment-based control flow abstraction. Thereby, the complete process modelgets fully partitioned into a set of process fragments with each only allowed to shareentry or exit nodes with an other fragment. During the abstraction process, a selectedfragment is abstracted to a single activity. We basically do not restrict the type of pro-cess model, which can be abstracted using the object abstraction extension, but as werequire correct process models (see above), a process model to be abstracted mustbe structural sound, i.e., it has exactly one source and final node and each activityis on a path from the source to the final node. Additionally, also the notion of weakconformance must hold such that also the object part of the process model correct.Finally, a data model must be explicitly specified, which determines the relations anddependencies between the single objects utilized in the business process. The datamodel is a UML class diagram restricted generalization, aggregation, composition, andassociation relations; for further details, see [13].
The object abstraction is realized with a rule set consisting of six rules from threeareas, which are applied iteratively. One deals with process quality and ensures thatthe granularity level between the activities and the objects is preserved in each ab-straction step as well as that the all objects utilized on one abstraction level are on thesame abstraction level, i.e., there exist no parent-child relations between any two uti-lized objects. Second, object combination aims to combine several objects into a singleone. The third field, object preservation, deals with the decision whether an object iskept or removed within an process model abstraction iteration. A summary of all ruleis provided in Table 1. More details about object abstraction including the completeformal specifications of the mentioned rule set can be found in [13].
Fall Workshop 2012 113

The Role of Objects in Process Model Abstraction
1 Process Quality
Abstraction Consistency All representations of an object must be equally ab-stracted, if at least one of the representations gets ab-stracted. Therefore, this rule ensures abstraction con-sistency by enforcing identical object abstraction for allrepresentations of one object.
Preserving GranularityAlignment
Assuming an alignment between object and control flowrepresentations of a process model exists before ab-straction, it must exist afterwards as well. The alignmentis achieved by avoiding abstraction of objects being as-sociated to activities, which have not been selected forcontrol flow abstraction (except above rule requires it).
2 Object Combination
Object Combination This rule reduces the number of objects in the processmodel by combining them, if several objects being partof one fragment, which get abstracted, do have commonancestor nodes in the data model. These objects willbe combined to the common ancestor node first foundwhile traversing through the data model from the utilizedobjects.
3 Object Preservation
Lower Bound of Objects After data abstraction, an activity might not be associ-ated to objects any more. But, objects are important inthe context of process management. Therefore, this ruleintroduces a configurable number stating the minimumassociations to exist after object abstraction.
Reoccurring Object An object utilized in the fragment, which gets abstracted,and associated to at least one more activity, not part ofthis fragment, will be preserved as it is considered impor-tant for a larger part of the process (it is not used locallyonly in that fragment). Otherwise it is marked for removal.
Full Object ActivityAssociation
Objects only utilized in a process fragment and nowhereelse can still be of importance for the complete processmodel, if they are input or output to this process fragment.Therefore, all objects being input or output process frag-ment, which get abstracted, are preserved. All others getremoved.
Table 1: Object abstraction rules overview
114 Fall Workshop 2012
6 Conclusion
6 Conclusion
This report outlines the phd research project about the role of objects in process modelabstraction and introduces the main contributions briefly. First, there will be a mappingof process models to Petri nets to explicitly and formally describe the execution seman-tics. This mapping also ensures the transaction property for object access allow trueparallelism between various activities. Second, process models can be enriched withexplicit information about object utilization. The proposed algorithm works for generalprocess models and can easily be adapted to align with most existing process modelnotations as shown for BPMN and EPC. Further, the correctness ob object utilizationduring process execution can be checked via the notion of weak conformance, whichalso supports underspecified process models. Fourth, this research allows to extendexisting process model abstraction techniques with means to abstract objects as well.These objects will be abstracted along with the control flow and remain aligned withthe control flow for each abstraction step.
Publications 2012
Workshop paper: Conformance of Process Models with respect to Data Objects [11]and A Platform for Research on Process Model Collections [4]Conference paper: Data Support in Process Model Abstraction [13]
Teaching Summer Term 2012
Master project on Analysis of Complex Process Model RepositoriesBachelor project on Billing Process as a ServiceMaster seminar on Process Repositories topic supervision
References
[1] A. Awad. A Compliance Management Framework for Business Process Models.PhD thesis, Hasso Plattner Institute, 2011.
[2] R. Bobrik, M. Reichert, and T. Bauer. View-Based Process Visualization. In Busi-ness Process Management, pages 88–95. Springer, 2007.
[3] G. Booch. Object-Oriented Analysis and Design with Applications (3rd Edition).Addison Wesley Longman Publishing Co., Inc., Redwood City, CA, USA, 2004.
[4] R.H. Eid-Sabbagh, M. Kunze, A. Meyer, and M. Weske. A Platform for Researchon Process Model Collections. In BPMN, pages 8–22. Springer, 2012.
Fall Workshop 2012 115
References
[5] D.J. Elzinga, T. Horak, C.Y. Lee, and C. Bruner. Business process manage-ment: survey and methodology. IEEE Transactions on Engineering Management,42(2):119–128, 1995.
[6] R. Eshuis and P. Grefen. Constructing Customized Process Views. Data & Knowl-edge Engineering, 64(2):419–438, 2008.
[7] G. Keller, M. Nüttgens, and A. Scheer. Semantische Prozessmodellierung auf derGrundlage “Ereignisgesteuerter Prozessketten (EPK)”. Technical Report Heft 89,Institut für Wirtschaftsinformatik, University of Saarland, 1992.
[8] J. Küster, K. Ryndina, and H. Gall. Generation of Business Process Models forObject Life Cycle Compliance. In BPM, pages 165–181. Springer, 2007.
[9] H. Leopold, S. Smirnov, and J. Mendling. On the Refactoring of Activity Labels inBusiness Process Models. Information Systems, 37(5):443–459, 2012.
[10] J. Mendling, H.A. Reijers, and J. Recker. Activity Labeling in Process Modeling:Empirical Insights and Recommendations. Inf. Systems, 35(4):467–482, 2010.
[11] A. Meyer, A. Polyvyanyy, and M. Weske. Weak Conformance of Process Modelswith respect to Data Objects. In ZEUS, pages 74–80, 2012.
[12] A. Meyer, S. Smirnov, and M. Weske. Data in Business Processes. EMISA Forum,31(3):5–31, 2011.
[13] A Meyer and M Weske. Data Support in Process Model Abstraction. In ConceptualModeling, pages 292–306. Springer, 2012.
[14] T. Murata. Petri nets: Properties, Analysis and Applications. Proceedings of theIEEE, 77(4):541–580, 1989.
[15] OMG. Business Process Model and Notation (BPMN), Version 2.0, January 2011.http://www.omg.org/spec/BPMN/2.0/ accessed August 5, 2013.
[16] A. Polyvyanyy, S. Smirnov, and M. Weske. The Triconnected Abstraction of Pro-cess Models. In Business Process Management, pages 229–244. Springer, 2009.
[17] A. Polyvyanyy, S. Smirnov, and M. Weske. Business Process Model Abstraction.In Handbook on BPM 1, pages 149–166. Springer, 2010.
[18] S. Smirnov. Business Process Model Abstraction. PhD thesis, Hasso PlattnerInstitute, 2012.
[19] A. Streit, B. Pham, and R. Brown. Visualization support for managing large busi-ness process specifications. In BPM, pages 205–219. Springer, 2005.
[20] M. Weske. Business Process Management: Concepts, Languages, Architectures.Second Edition. Springer, 2012.
116 Fall Workshop 2012
Comprehensible 3D Maps and BuildingPanoramas
Sebastian Pasewaldt
Computer Graphics Systems GroupHasso-Plattner-Institut
3D geovirtual environments (3D GeoVEs), such as 3D virtual city and landscapemodels, have become established tools to communicate geoinformation to experts andnon-experts of different application domains. In contrast to 2D geovisualization tools(e.g., topographic and thematic maps) 3D GeoVEs primarily depict geoinformation uti-lizing a perspective view. A perspective view on geodata yields a number of advantages(e.g., immersion and improved spatial cognition due to depth cues) but also introducesnumerous disadvantages, such as occlusion and perspective distortion. The advan-tages as well as the disadvantages of 3D geovisualization have been considered bycartographers and landscape artist and resulted in a different form of communicationgeoinformation: 3D panoramic maps.
Panoramic maps seamlessly combine multiple perspectives views in one image,providing additional information by revealing occluded geoobjects, or emphasizing rel-evant information (e.g., landmarks). The additional information supports a user atnavigation and orientation tasks. This work presents two novel concepts and proto-typical implementations that utilize MPVs for an effective visualization of 3D GeoVEs:Comprehensible 3D maps and building panoramas. Further, MPVs are classified withrespect to their cartographic scale and conceptual integration. Finally, potentials andchallenges of multi-perspective 3D GeoVEs are discussed.
1 Introduction
Geovisualization is a broad visualization discipline that utilizes images or image se-quences to effectively communicate geodata (spatial data with a reference to the earth)to a user. Although 2D digital maps are still an established tool to communicate geo-data, 3D GeoVEs have advanced in application domains like geoanalysis, disastermanagement and navigation systems. In contrast to 2D geovisualization tools, whichencode the third dimension in an additional (visual) attribute, 3D GeoVEs offer a morenatural access to geodata. This is further supported by utilizing a perspective view,which facilitates the human’s 3D visual perception. A perspective view yields a num-ber of advantages for the communication of geodata, such as immersion into- and anintuitive communication of 3D geodata, but also introduces disadvantages, such asocclusion, perspective distortion and multiple cartographic scales.
Fall Workshop 2012 117
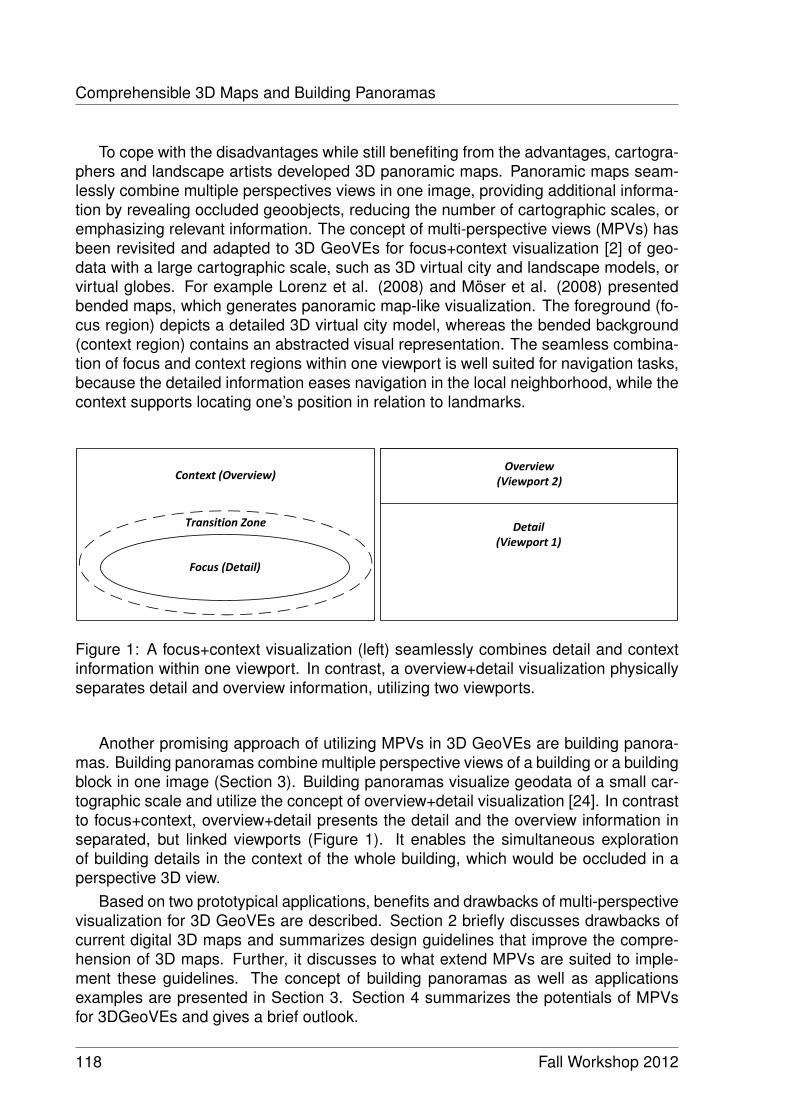
Comprehensible 3D Maps and Building Panoramas
To cope with the disadvantages while still benefiting from the advantages, cartogra-phers and landscape artists developed 3D panoramic maps. Panoramic maps seam-lessly combine multiple perspectives views in one image, providing additional informa-tion by revealing occluded geoobjects, reducing the number of cartographic scales, oremphasizing relevant information. The concept of multi-perspective views (MPVs) hasbeen revisited and adapted to 3D GeoVEs for focus+context visualization [2] of geo-data with a large cartographic scale, such as 3D virtual city and landscape models, orvirtual globes. For example Lorenz et al. (2008) and Möser et al. (2008) presentedbended maps, which generates panoramic map-like visualization. The foreground (fo-cus region) depicts a detailed 3D virtual city model, whereas the bended background(context region) contains an abstracted visual representation. The seamless combina-tion of focus and context regions within one viewport is well suited for navigation tasks,because the detailed information eases navigation in the local neighborhood, while thecontext supports locating one’s position in relation to landmarks.
Detail(Viewport 1)
Overview(Viewport 2)Context (Overview)
Transition Zone
Focus (Detail)
Figure 1: A focus+context visualization (left) seamlessly combines detail and contextinformation within one viewport. In contrast, a overview+detail visualization physicallyseparates detail and overview information, utilizing two viewports.
Another promising approach of utilizing MPVs in 3D GeoVEs are building panora-mas. Building panoramas combine multiple perspective views of a building or a buildingblock in one image (Section 3). Building panoramas visualize geodata of a small car-tographic scale and utilize the concept of overview+detail visualization [24]. In contrastto focus+context, overview+detail presents the detail and the overview information inseparated, but linked viewports (Figure 1). It enables the simultaneous explorationof building details in the context of the whole building, which would be occluded in aperspective 3D view.
Based on two prototypical applications, benefits and drawbacks of multi-perspectivevisualization for 3D GeoVEs are described. Section 2 briefly discusses drawbacks ofcurrent digital 3D maps and summarizes design guidelines that improve the compre-hension of 3D maps. Further, it discusses to what extend MPVs are suited to imple-ment these guidelines. The concept of building panoramas as well as applicationsexamples are presented in Section 3. Section 4 summarizes the potentials of MPVsfor 3DGeoVEs and gives a brief outlook.
118 Fall Workshop 2012

2 Comprehensible 3D Maps
2 Comprehensible 3D Maps
For centuries, maps have been essential resources for humankind to aid orientation,navigation, exploration, and analysis tasks. With the digital revolution in the last quarterof the 20th century, 2D digital maps started to foster an interactive communication ofgeoinformation, allowing, for the first time, to customize map contents to tasks and con-texts based on a service-oriented architecture (SOA) [3]. Recent advancements in theacquisition, provision, and visualization of 3D geodata, such as virtual 3D city and land-scape models, yield new possibilities for 3D mapping services. Today these servicesrepresent key components to a growing number of applications, like navigation, educa-tion, or disaster management. In particular mapping services based on 3D geovirtualenvironments (3D GeoVEs), such as Google Earth
TMor the OGC’s Web View Ser-
vice (WVS) [7], provide users various information overlays to customize visualizationto tasks and contexts, such as as thematic or topographic maps. The customizationsoften focus on embedding 2D overlays for points-(or areas-)-of-interest, for instanceto highlight public transport networks, traffic information and landmarks, or to modifythe map presentation (e.g., photorealistic or non-photorealistic). A photorealistic pre-sentation tries to visualize geoobjects as realistic as possible, which eases the mentalmapping between the visualization and the reality. By contrast, a non-photorealisticpresentation abstracts from reality and provides the prerequisites to simplify and filterdetailed elements as well as to clearly encode displayed information of complex geo-data [4]. A specialized class of 3D GeoVEs is the digital 3D map (D3DM), which isbased on a generalized data model and utilizes a symbolized (abstracted) visualizationof 3D geoobjects.
In contrast to traditional 2D maps, D3DMs utilize a central perspective view, whichis similar to the humans 3D visual perception, offering a natural access to geoinforma-tion [10] and immersion [16] into the geodata, and thus increasing a user’s effective-ness on spatial tasks [26]. During the last decade cartographers discussed and estab-lished guidelines to further increase the effectiveness and expressiveness of D3DMs(for example [6,9,20]). However, current products, systems, and applications providingD3DMs are still faced by a number of drawbacks that impact the comprehension of 3Dmap contents:
(D1) Occlusion. Due to overlapping of 3D geometric representations, occluded mapcontent cannot be perceived in a perspective view.
(D2) Visual clutter. Because of perspective distortion, the size of distant map objectsdecreases. As a result, they are no longer recognized as single objects and are per-ceived as "visual noise" (e.g., because they occupy only one pixel).
(D3) Insufficient use of screen-space. In perspective views at pedestrian level, alarge amount of the screen-space is occupied by the horizon or visual clutter. In thisarea no information can be communicated.
(D4) Unlimited number of cartographic scales. Due to perspective distortion, a 3Ddigital map includes an unlimited number of map scales. This complicates the estima-tion and comparison of spatial relationships.
Fall Workshop 2012 119

Comprehensible 3D Maps and Building Panoramas
Figure 2: Digital 3D map of the virtual city model of Chemnitz showing a route: A view-dependent, multi-perspective view is utilized to increase the screen-space utilization bybending the background upwards. A cartograhpy-oriented stylization is applied off theroute to lower visual complexity.
Previous work showed how view-dependent MPVs [18] and cartography-oriented vi-sualization (COV) [25] can be used to partially overcome the drawbacks D1–D4. MPVs,on the one hand, enable the seamless combination of different 3D perspectives in a sin-gle view and thus feature less occlusion, a reduced number of cartographic scales, andan increased utilization of screen space. COV, on the other hand, facilitates guidance ofa viewer’s gaze to important or prioritized information, thus providing saliency-guidedvisualization. Both techniques adapt visualization to different contexts and contentswith respect to user interaction or dynamically changing thematic information, but havenot been applied concurrently in a single system.
In the following a prototype that combines MPVs with COV for comprehensibleD3DMs (Figure 2) is discussed. For this purpose, cartographic design principles areidentified that aim to increase the expressiveness and effectiveness of D3DMs. Ac-cording to this classification, a prototypical implementation demonstrates the bene-fits of multi-perspective and non-photorealistic rendering techniques for the compre-hension of D3DMs. In particular, the prototype enables (1) a seamless combinationof cartography-oriented and photorealistic graphic styles while (2) increasing screen-space utilization and (3) simultaneously directing a viewer’s gaze to important or prior-itized information.
120 Fall Workshop 2012
2 Comprehensible 3D Maps
2.1 Design Principles
The International Cartographic Association (ICA) defines a map as "a symbolized im-age of geographical reality, representing selected features or characteristics, resultingfrom the creative effort of its author’s execution of choices, and is designed for usewhen spatial relationships are of primary relevance" [8]. According to this definition,a perspective view in a 3DGeoVE is not a D3DM per se. Häberling et al. suggestthat the term 3D map is applicable to 3DGeoVEs if the virtual environment is basedon a generalized data model and utilizes a symbolized visualization of classified mapobjects [6] (e.g., by using the class model of CityGML [13]).
The aim of a map is to successfully communicate geoinformation between a car-tographer (the map producer) and a user (the map consumer). Geoinformation areencoded using a semiotic model and transferred by the map. For a successful com-munication, the map consumer must understand the semiotic model to decode theinformation. Further, a map should satisfy the needs of the map consumer to improvethe communication process: the map should be readable, comprehensible, and visu-alized in a way that the information can be memorized easily, and that not only rationalbut also emotional aspects [12] are addressed. According to Broderson the geocom-munication process is successful if the map producer and the map consumer "agree"on aspects of location or space [1]. In order to achieve this agreement, cartographersdeveloped different high-level design guidelines for D3DMs that are summarized in thefollowing:
(A1) Decrease of visual complexity by classification, symbolization and ab-straction.Häberling et al. define the following three design steps [6] for D3DMs: (1) modeling,(2) symbolization and (3) visualization. For each design step the map producer canchoose between different design aspects to configure the map to fit a user’s needsand ease the communication process (Table 1). Modeling includes aspects of filteringraw geodata and mapping these to a 3D geometric representation of map objects suit-able for rendering. The visual appearance of the 3D-geoobject (e.g., color, texture anddegree-of-abstraction) are configured during symbolization. The visualization step de-fines the mapping of a 3D geometric representation to the presentation medium and iscontrolled by parameterizing the virtual camera (e.g., the field-of-view, and projection),as well as using scene specific parameters (e.g., lighting, shading, and atmosphericrendering effects). Based on this classification, Häberling et al. performed a userstudy to identify atomic design guidelines that assist the map producer to reduce visualcomplexity and improve comprehension.
(A2) Decrease of occlusion and visual clutter.Although Häberling et al. proposed different design variables for parametrizing theprojection of the virtual camera (e.g., orthographic and cylindric projection), the per-spective projection is the most applied projection for digital D3DMs, mainly because itfacilitates the human visual system and thus produces a familiar visualization. Accord-ing to Jobst and Döllner (2008) the perspective view comprises a number of drawbacks,such as occlusion of map-objects and visual clutter due to perspective distortion in thedistant parts of the D3DM, which reduces the effectiveness of geocommunication.
Fall Workshop 2012 121
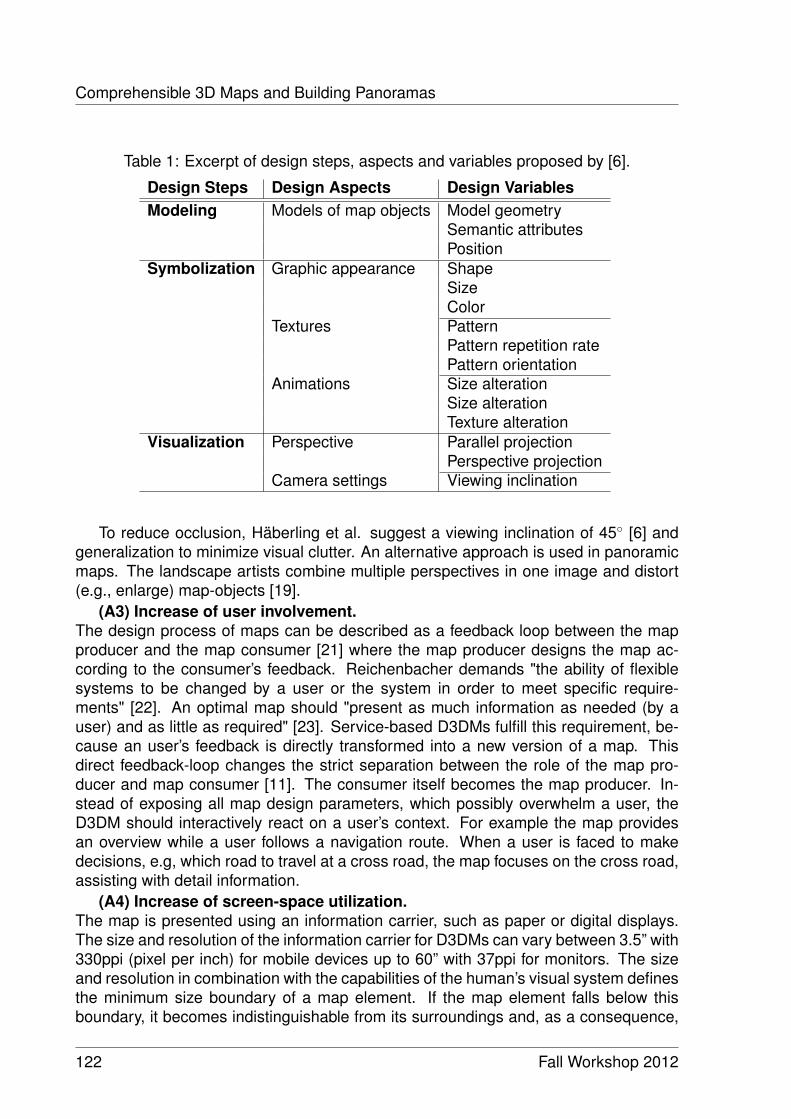
Comprehensible 3D Maps and Building Panoramas
Table 1: Excerpt of design steps, aspects and variables proposed by [6].
Design Steps Design Aspects Design VariablesModeling Models of map objects Model geometry
Semantic attributesPosition
Symbolization Graphic appearance ShapeSizeColor
Textures PatternPattern repetition ratePattern orientation
Animations Size alterationSize alterationTexture alteration
Visualization Perspective Parallel projectionPerspective projection
Camera settings Viewing inclination
To reduce occlusion, Häberling et al. suggest a viewing inclination of 45◦ [6] andgeneralization to minimize visual clutter. An alternative approach is used in panoramicmaps. The landscape artists combine multiple perspectives in one image and distort(e.g., enlarge) map-objects [19].
(A3) Increase of user involvement.The design process of maps can be described as a feedback loop between the mapproducer and the map consumer [21] where the map producer designs the map ac-cording to the consumer’s feedback. Reichenbacher demands "the ability of flexiblesystems to be changed by a user or the system in order to meet specific require-ments" [22]. An optimal map should "present as much information as needed (by auser) and as little as required" [23]. Service-based D3DMs fulfill this requirement, be-cause an user’s feedback is directly transformed into a new version of a map. Thisdirect feedback-loop changes the strict separation between the role of the map pro-ducer and map consumer [11]. The consumer itself becomes the map producer. In-stead of exposing all map design parameters, which possibly overwhelm a user, theD3DM should interactively react on a user’s context. For example the map providesan overview while a user follows a navigation route. When a user is faced to makedecisions, e.g, which road to travel at a cross road, the map focuses on the cross road,assisting with detail information.
(A4) Increase of screen-space utilization.The map is presented using an information carrier, such as paper or digital displays.The size and resolution of the information carrier for D3DMs can vary between 3.5” with330ppi (pixel per inch) for mobile devices up to 60” with 37ppi for monitors. The sizeand resolution in combination with the capabilities of the human’s visual system definesthe minimum size boundary of a map element. If the map element falls below thisboundary, it becomes indistinguishable from its surroundings and, as a consequence,
122 Fall Workshop 2012
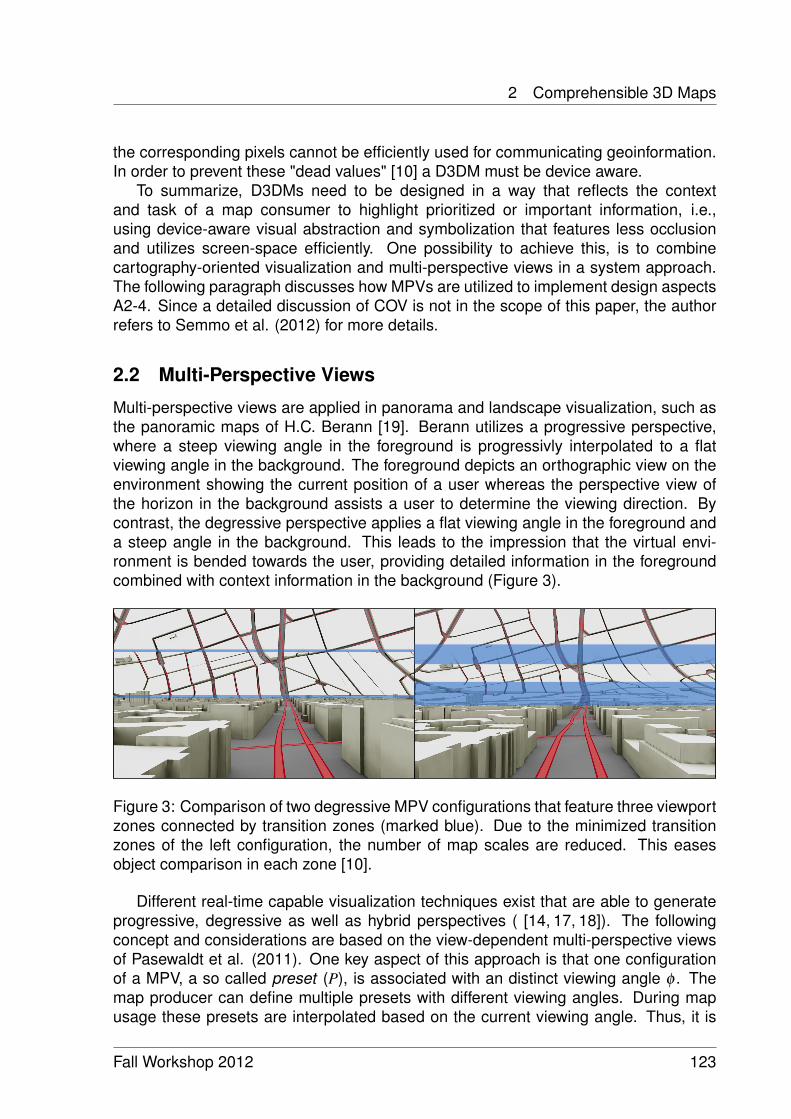
2 Comprehensible 3D Maps
the corresponding pixels cannot be efficiently used for communicating geoinformation.In order to prevent these "dead values" [10] a D3DM must be device aware.
To summarize, D3DMs need to be designed in a way that reflects the contextand task of a map consumer to highlight prioritized or important information, i.e.,using device-aware visual abstraction and symbolization that features less occlusionand utilizes screen-space efficiently. One possibility to achieve this, is to combinecartography-oriented visualization and multi-perspective views in a system approach.The following paragraph discusses how MPVs are utilized to implement design aspectsA2-4. Since a detailed discussion of COV is not in the scope of this paper, the authorrefers to Semmo et al. (2012) for more details.
2.2 Multi-Perspective Views
Multi-perspective views are applied in panorama and landscape visualization, such asthe panoramic maps of H.C. Berann [19]. Berann utilizes a progressive perspective,where a steep viewing angle in the foreground is progressivly interpolated to a flatviewing angle in the background. The foreground depicts an orthographic view on theenvironment showing the current position of a user whereas the perspective view ofthe horizon in the background assists a user to determine the viewing direction. Bycontrast, the degressive perspective applies a flat viewing angle in the foreground anda steep angle in the background. This leads to the impression that the virtual envi-ronment is bended towards the user, providing detailed information in the foregroundcombined with context information in the background (Figure 3).
Figure 3: Comparison of two degressive MPV configurations that feature three viewportzones connected by transition zones (marked blue). Due to the minimized transitionzones of the left configuration, the number of map scales are reduced. This easesobject comparison in each zone [10].
Different real-time capable visualization techniques exist that are able to generateprogressive, degressive as well as hybrid perspectives ( [14, 17, 18]). The followingconcept and considerations are based on the view-dependent multi-perspective viewsof Pasewaldt et al. (2011). One key aspect of this approach is that one configurationof a MPV, a so called preset (P), is associated with an distinct viewing angle φ . Themap producer can define multiple presets with different viewing angles. During mapusage these presets are interpolated based on the current viewing angle. Thus, it is
Fall Workshop 2012 123
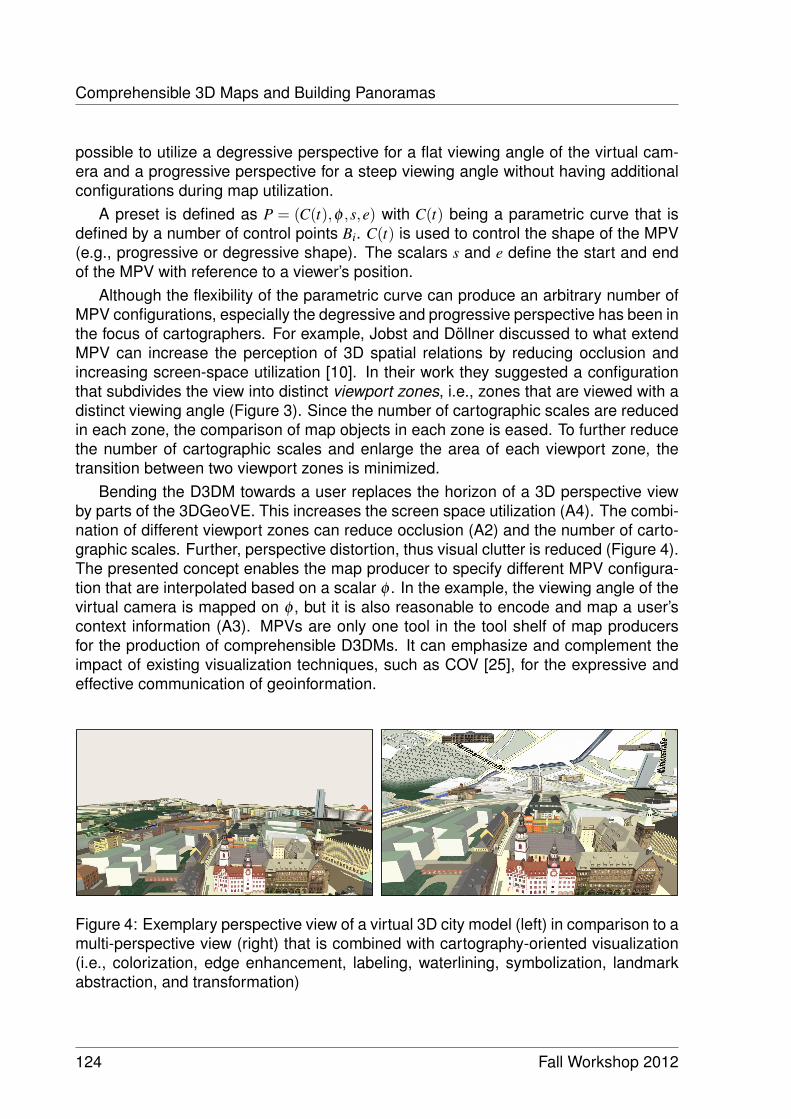
Comprehensible 3D Maps and Building Panoramas
possible to utilize a degressive perspective for a flat viewing angle of the virtual cam-era and a progressive perspective for a steep viewing angle without having additionalconfigurations during map utilization.
A preset is defined as P = (C(t),φ ,s,e) with C(t) being a parametric curve that isdefined by a number of control points Bi. C(t) is used to control the shape of the MPV(e.g., progressive or degressive shape). The scalars s and e define the start and endof the MPV with reference to a viewer’s position.
Although the flexibility of the parametric curve can produce an arbitrary number ofMPV configurations, especially the degressive and progressive perspective has been inthe focus of cartographers. For example, Jobst and Döllner discussed to what extendMPV can increase the perception of 3D spatial relations by reducing occlusion andincreasing screen-space utilization [10]. In their work they suggested a configurationthat subdivides the view into distinct viewport zones, i.e., zones that are viewed with adistinct viewing angle (Figure 3). Since the number of cartographic scales are reducedin each zone, the comparison of map objects in each zone is eased. To further reducethe number of cartographic scales and enlarge the area of each viewport zone, thetransition between two viewport zones is minimized.
Bending the D3DM towards a user replaces the horizon of a 3D perspective viewby parts of the 3DGeoVE. This increases the screen space utilization (A4). The combi-nation of different viewport zones can reduce occlusion (A2) and the number of carto-graphic scales. Further, perspective distortion, thus visual clutter is reduced (Figure 4).The presented concept enables the map producer to specify different MPV configura-tion that are interpolated based on a scalar φ . In the example, the viewing angle of thevirtual camera is mapped on φ , but it is also reasonable to encode and map a user’scontext information (A3). MPVs are only one tool in the tool shelf of map producersfor the production of comprehensible D3DMs. It can emphasize and complement theimpact of existing visualization techniques, such as COV [25], for the expressive andeffective communication of geoinformation.
Figure 4: Exemplary perspective view of a virtual 3D city model (left) in comparison to amulti-perspective view (right) that is combined with cartography-oriented visualization(i.e., colorization, edge enhancement, labeling, waterlining, symbolization, landmarkabstraction, and transformation)
124 Fall Workshop 2012
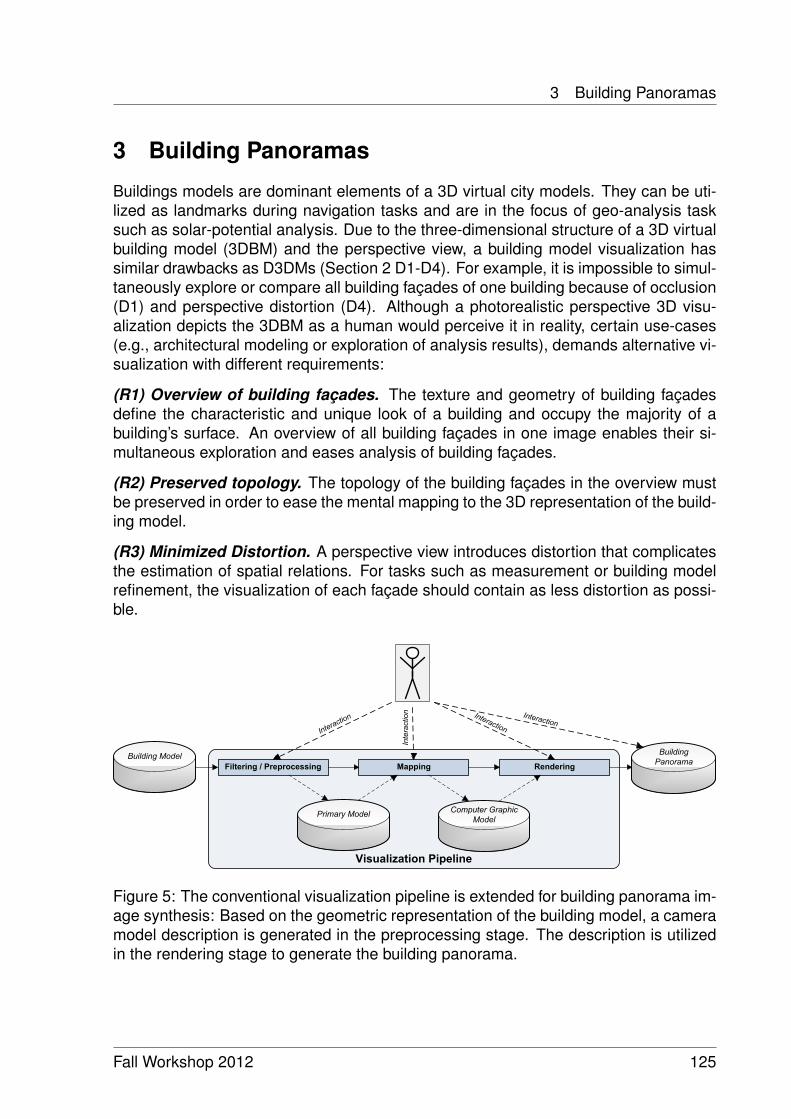
3 Building Panoramas
3 Building Panoramas
Buildings models are dominant elements of a 3D virtual city models. They can be uti-lized as landmarks during navigation tasks and are in the focus of geo-analysis tasksuch as solar-potential analysis. Due to the three-dimensional structure of a 3D virtualbuilding model (3DBM) and the perspective view, a building model visualization hassimilar drawbacks as D3DMs (Section 2 D1-D4). For example, it is impossible to simul-taneously explore or compare all building façades of one building because of occlusion(D1) and perspective distortion (D4). Although a photorealistic perspective 3D visu-alization depicts the 3DBM as a human would perceive it in reality, certain use-cases(e.g., architectural modeling or exploration of analysis results), demands alternative vi-sualization with different requirements:
(R1) Overview of building façades. The texture and geometry of building façadesdefine the characteristic and unique look of a building and occupy the majority of abuilding’s surface. An overview of all building façades in one image enables their si-multaneous exploration and eases analysis of building façades.
(R2) Preserved topology. The topology of the building façades in the overview mustbe preserved in order to ease the mental mapping to the 3D representation of the build-ing model.
(R3) Minimized Distortion. A perspective view introduces distortion that complicatesthe estimation of spatial relations. For tasks such as measurement or building modelrefinement, the visualization of each façade should contain as less distortion as possi-ble.
Visualization Pipeline
Filtering / Preprocessing Mapping RenderingBuilding Model
Primary Model Computer GraphicModel
Interaction Interaction
Inte
ract
ion
Building Panorama
Interaction
Figure 5: The conventional visualization pipeline is extended for building panorama im-age synthesis: Based on the geometric representation of the building model, a cameramodel description is generated in the preprocessing stage. The description is utilizedin the rendering stage to generate the building panorama.
Fall Workshop 2012 125
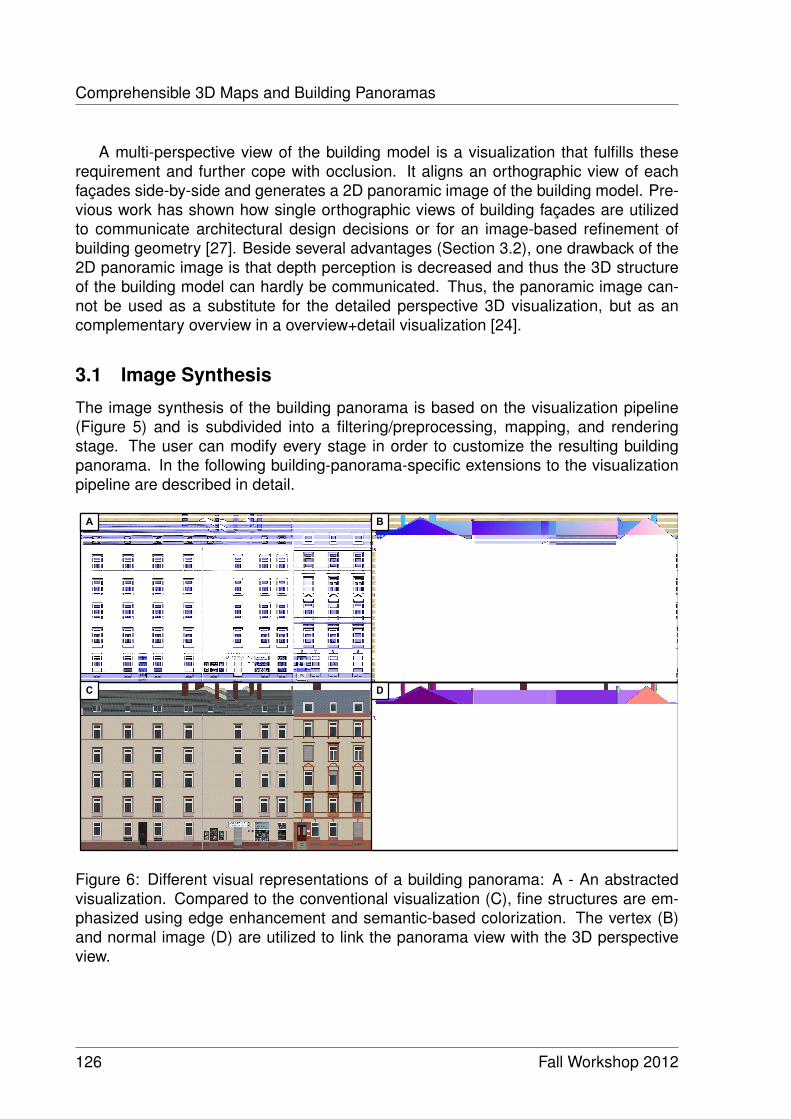
Comprehensible 3D Maps and Building Panoramas
A multi-perspective view of the building model is a visualization that fulfills theserequirement and further cope with occlusion. It aligns an orthographic view of eachfaçades side-by-side and generates a 2D panoramic image of the building model. Pre-vious work has shown how single orthographic views of building façades are utilizedto communicate architectural design decisions or for an image-based refinement ofbuilding geometry [27]. Beside several advantages (Section 3.2), one drawback of the2D panoramic image is that depth perception is decreased and thus the 3D structureof the building model can hardly be communicated. Thus, the panoramic image can-not be used as a substitute for the detailed perspective 3D visualization, but as ancomplementary overview in a overview+detail visualization [24].
3.1 Image Synthesis
The image synthesis of the building panorama is based on the visualization pipeline(Figure 5) and is subdivided into a filtering/preprocessing, mapping, and renderingstage. The user can modify every stage in order to customize the resulting buildingpanorama. In the following building-panorama-specific extensions to the visualizationpipeline are described in detail.
A B
C D
Figure 6: Different visual representations of a building panorama: A - An abstractedvisualization. Compared to the conventional visualization (C), fine structures are em-phasized using edge enhancement and semantic-based colorization. The vertex (B)and normal image (D) are utilized to link the panorama view with the 3D perspectiveview.
126 Fall Workshop 2012

3 Building Panoramas
Preprocessing In the preprocessing stage the raw data (e.g., a City-GML [13]) de-scription of the building model, is filtered and converted to a topology-preserving datastructure (e.g., Half-Edge data structure) that is the input for a panorama-specific ge-ometry analysis algorithm and the mapping stage. The algorithm determines a orderedlist of building façades F = {F1, ...,Fn}; n ∈ N . For each Fi ∈ F, a camera description Ciis generated that exactly matches the camera view-frustum with the width of Fi. Theheight of the frustum equals the highest façade. The set of camera descriptions C isutilized during rendering to generate the building panorama. The user can configurethe preprocessing stage to generate a panorama image containing a subset of F.
Mapping In the mapping stage, the filtered and preprocessed building model ismapped to geometric primitives. Further, the visual appearance of the building model(e.g., color or texture) can be configured. If semantic information is available, it can beutilized for a semantic-based rendering such as façade abstraction [15], which gener-ates a non-photorealistic visualization. The output of the mapping stage is a computergraphic representation of the 3DBM (computer graphic model).
Rendering In the rendering stage the computer graphic model is utilized for theimage synthesis of the 3D perspective view as well as for the synthesis of the 2Dpanorama image. For each Ci, a rendering pass is performed, which generates animage of the Fi as part of the final panorama image. In addition to the color image,a vertex and a normal image are generated, which are utilized to link the 2D and 3Dview (Figure 6). Since F is a list of order-preserving façades, the final panorama imagefulfills R2. Instead of a perspective, a parallel projection is utilized, which eliminatesperspective distortion (R3).
3.2 Application Examples
The 3D perspective view and 2D panorama image are utilized in a overview+detail vi-sualization, i.e., the two images are organized in two separate viewports [24] (Figure7). Between these viewports a bidirectional link is established that updates or synchro-nizes the viewports. Based on the application example, either the 3D perspective viewor the 2D panorama image serves as overview. In the following, advantages as well asdisadvantages are discussed using three applications examples.
Geometry Refinement Geometry refinement denotes operations that increase thecomplexity of a geometric representations. Xiao et al. (20008) utilize an orthographicimage of a textured block building model to fully-automatic add openings (e.g., windowsand doors), or exterior installation (e.g., stairs or rain pipes). The image is decomposedinto distinct subsections ((e.g., one section per opening) using computer vision algo-rithms. If depth information is available (e.g., based on a 3D point cloud) these subsec-tions are automatically extruded. Wanner et al. (2012) evaluate interaction metaphorsthat can assist the user in altering the sub section and thus configure the refinementprocess. The overview+detail visualization is well suited for an user-controlled geome-try refinement, since refinement operations can be performed on the panoramic image(the detail view). Direct feedback on user actions is provided in the 3D perspective
Fall Workshop 2012 127
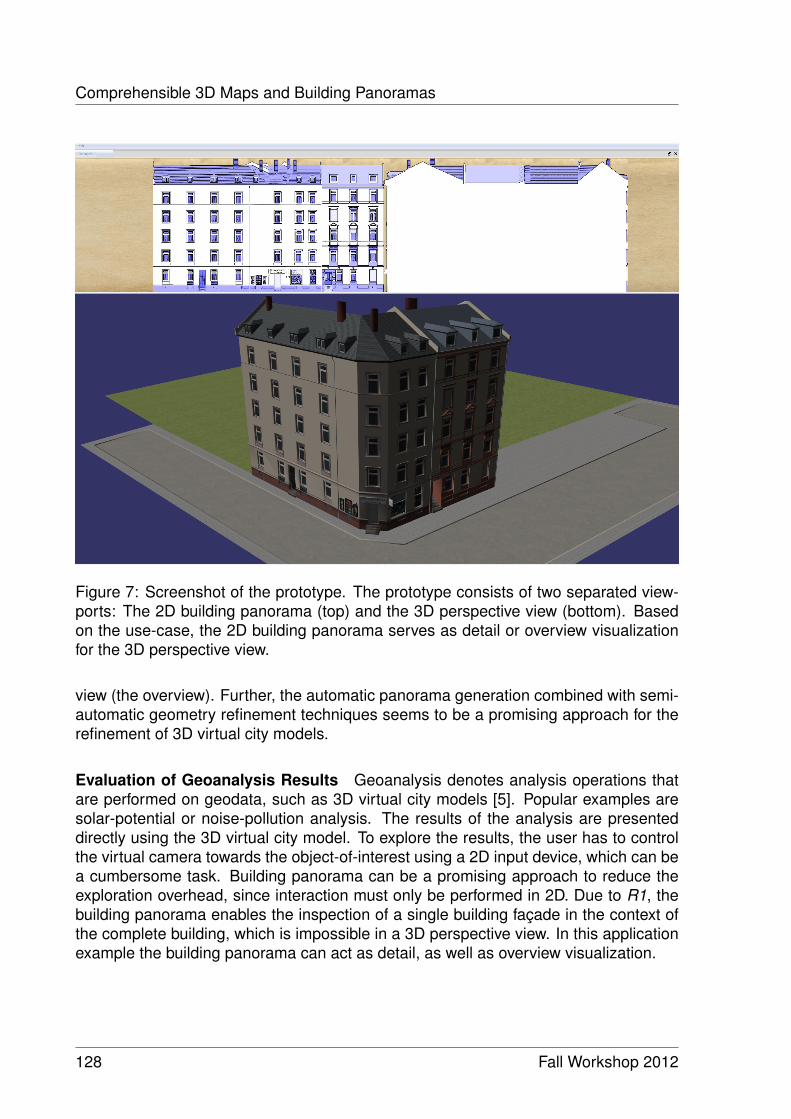
Comprehensible 3D Maps and Building Panoramas
Figure 7: Screenshot of the prototype. The prototype consists of two separated view-ports: The 2D building panorama (top) and the 3D perspective view (bottom). Basedon the use-case, the 2D building panorama serves as detail or overview visualizationfor the 3D perspective view.
view (the overview). Further, the automatic panorama generation combined with semi-automatic geometry refinement techniques seems to be a promising approach for therefinement of 3D virtual city models.
Evaluation of Geoanalysis Results Geoanalysis denotes analysis operations thatare performed on geodata, such as 3D virtual city models [5]. Popular examples aresolar-potential or noise-pollution analysis. The results of the analysis are presenteddirectly using the 3D virtual city model. To explore the results, the user has to controlthe virtual camera towards the object-of-interest using a 2D input device, which can bea cumbersome task. Building panorama can be a promising approach to reduce theexploration overhead, since interaction must only be performed in 2D. Due to R1, thebuilding panorama enables the inspection of a single building façade in the context ofthe complete building, which is impossible in a 3D perspective view. In this applicationexample the building panorama can act as detail, as well as overview visualization.
128 Fall Workshop 2012
4 Summary & Outlook
Comparison of Architectural Designs In the design process of a building, differentvariants are developed and discussed with multiple participants. These discussions aremainly based on architectural sketches, or the 3DBM. On the one hand, architecturalsketches are well suited for a discussion, because they depict many relevant detailsand can be printed on paper, but on the other hand too many details and missing depthcues complicate discussion with non-experts. Further, sketches only depict the 3DBMfrom one distinct view, which complicates the generation of a mental map. In contrast,a 3D visualization offers a more realistic experience, even for non-experts but requiresIT infrastructure to be utilized. A building panorama can bridge the gap between the 2Darchitectural sketches and the virtual 3D building model. The discussion can be basedon a printed version of the panoramic image by using a overview+detail visualization.Due to the flexibility of the rendering pipeline, a photorealistic as well as an architecture-oriented stylization can be generated.
4 Summary & Outlook
A multi-perspective view is an expressive and effective approach to communicate 3Dgeoinformation. The seamless combination of multiple perspectives views in one im-age reduces occlusion and enables new insights into geodata. Applied to digital 3Dmaps using focus+context visualization techniques, it increases screen-space utiliza-tion and reduces visual clutter. Compared to traditional perspective views, more pixelsare used to communicate geoinformation, thus increasing the efficiency. Further, theseamless combination of focus and context regions reduces context switches, whichlowers a user‘s mental load. As a result, the user can focus on the task. Drawbacks ofmulti-perspective maps are the unnatural view and the computational complexity. A firstpreliminary user study pointed out that users prefers MPV 3D maps over traditional 3Dmaps [18] for navigation task, but whether the efficiency is increased must be provedin future studies.
The application of MPVs as part of an overview+detail visualization of a small car-tographic scale, such as buildings and building blocks, seems a promising approach tosimplify user interaction and thus reduce a user’s burden on tasks, such as geometryrefinement. The presentation of detailed information, while maintaining an overview ofthe complete data set, may ease visual analysis tasks and helps a user to gain newinsights. A drawback of the overview+detail approach is context switches because ofthe two separate views. A user study will show whether the benefits outweigh thedrawbacks.
Beside an evaluation of the presented approaches, future research will focus onthe integration of comprehensible digital 3D maps in a service-oriented architecture.Therefore, different engineering challenges, e.g., the flexible combination of differentshader programs, or a simple but versatile service interface, as well as conceptual chal-lenges have to be addressed. The building panoramas are in a very early but promisingprototypical stage with open research questions concerning the image synthesis andstylization.
Fall Workshop 2012 129

References
References
[1] Lars Brodersen. Paradigm shift from cartography to geo-communication. In XXIIIInternational Cartographic Conference. ICA, 2007.
[2] Andy Cockburn, Amy Karlson, and Benjamin B. Bederson. A review ofoverview+detail, zooming, and focus+context interfaces. ACM Comput. Surv.,41(1):2:1–2:31, 2009.
[3] Jeff de la Beaujardiere. OpenGIS Web Map Server Implementation Specification,Version 1.3.0. OpenGIS Implementation Specification, 2006.
[4] Jürgen Döllner and Jan Eric Kyprianidis. Approaches to Image Abstraction forPhotorealistic Depictions of Virtual 3D Models. In Cartography in Central andEastern Europe, pages 263–277, 2010.
[5] Juri Engel and Jürgen Döllner. Approaches towards visual 3d analysis for digi-tal landscapes and its applications. Digital Landscape Architecture Proceedings2009, pages 33–41, 2009.
[6] Christian Häberling, Hansruedi Bär, and Lorenz Hurni. Proposed CartographicDesign Principles for 3D Maps: A Contribution to an Extended Cartographic The-ory. Cartographica: The International Journal for Geographic Information andGeovisualization, 43(3):175–188, 2008.
[7] Benjamin Hagedorn. OGC Web View Service. OGC Discussion Paper, February2010.
[8] ICA. International Cartographic Association, Organisation and activities 1999 –2003. Netherlands. Cartographic Society., 2000.
[9] Markus Jobst. Überlegungen für perzeptive Grössen in multimedialen 3D Karten.Kartographische Schriften, 10:117–126, 2006.
[10] Markus Jobst and Jürgen Döllner. Better Perception of 3D-Spatial Relations byViewport Variations. In Proceedings of the 10th International Conference on Vi-sual Information Systems, VISUAL ’08, pages 7–18, 2008.
[11] Markus Jobst and Jürgen Döllner. Neo-Cartographic Influence on Map Communi-cation in LBS. In Location Based Services and TeleCartography II, From SensorFusion to Context Models, pages 207–219, 2008.
[12] A Kolacny. Cartographic Information–a Fundamental Concept and Term in Mod-ern Cartography. Cartographic Journal, 6:47–49, 1969.
[13] Thomas H. Kolbe. Representing and exchanging 3d city models with citygml. InProceedings of the 3rd International Workshop on 3D Geo-Information, LectureNotes in Geoinformation & Cartography, page 20, Seoul, Korea, 2009. Springer.
130 Fall Workshop 2012
References
[14] Haik Lorenz, Matthias Trapp, Jürgen Döllner, and Markus Jobst. Interactive Multi-Perspective Views of Virtual 3D Landscape and City Models. In Proc. AGILEConference, pages 301–321, 2008.
[15] Aniruddha Loya, Neeharika Adabala, Amitav Das, and Pragyan Mishra. A prac-tical approach to image-guided building facade abstraction. Computer GraphicsInternational, 2008.
[16] Alan M. MacEachren, Robert Edsall, Daniel Haug, Ryan Baxter, George Otto,Raymon Masters, Sven Fuhrmann, and Liujian Qian. Virtual environments for ge-ographic visualization: potential and challenges. In Proceedings of the 1999 work-shop on new paradigms in information visualization and manipulation (NPIVM),pages 35–40. ACM, 1999.
[17] Sebastian Möser, Patrick Degener, Roland Wahl, and Reinhard Klein. ContextAware Terrain Visualization for Wayfinding and Navigation. Computer GraphicsForum, 27(7):1853–1860, 2008.
[18] Sebastian Pasewaldt, Matthias Trapp, and Jürgen Döllner. Multiscale Visualizationof 3D Geovirtual Environments Using View-Dependent Multi-Perspective Views.Journal of WSCG, 19(3):111–118, 2011.
[19] Tom Patterson. A View From on High: Heinrich Berann’s Panoramas and Land-scape Visualization Techniques For the US National Park Service. In CartographicPerspectives, number 36, pages 38–65. NACIS, 2000.
[20] Dave Pegg. Design Issues with 3D Maps and the Need for 3D Cartographic De-sign Principles, 2012.
[21] Michael P. Peterson. Interactive and animated cartography. Prentice Hall, 2005.
[22] Tumasch Reichenbacher. Adaptation in mobile and ubiquitous cartography. InMultimedia Cartography, chapter 27, pages 383–397. Springer, 2007.
[23] Tumasch Reichenbacher. The concept of relevance in mobile maps. In LocationBased Services and TeleCartography, pages 231–246. Springer, 2007.
[24] Jonathan C. Roberts. State of the art: Coordinated & multiple views in exploratoryvisualization. In Proceedings of the Fifth International Conference on Coordinatedand Multiple Views in Exploratory Visualization, CMV ’07, pages 61–71, Washing-ton, DC, USA, 2007. IEEE Computer Society.
[25] Amir Semmo, Matthias Trapp, Jan Eric Kyprianidis, and Jürgen Döllner. Interac-tive Visualization of Generalized Virtual 3D City Models using Level-of-AbstractionTransitions. Computer Graphics Forum, 31(3):885–894, 2012. Proceedings Eu-roVis 2012.
[26] Desney S. Tan, Darren Gergle, Peter G. Scupelli, and Randy Pausch. Physicallylarge displays improve path integration in 3D virtual navigation tasks. In Proc.ACM CHI, pages 439–446, 2004.
Fall Workshop 2012 131

References
[27] Jianxiong Xiao, Tian Fang, Ping Tan, Peng Zhao, Eyal Ofek, and Long Quan.Image-based façade modeling. ACM Trans. Graph., 27(5):161:1–161:10, Decem-ber 2008.
132 Fall Workshop 2012
Demonstrating Test-driven FaultNavigation
Michael Perscheid
Software Architecture GroupHasso-Plattner-Institut
In this paper, we present a demonstration of our test-driven fault navigation ap-proach. This interconnected guide for debugging reproducible failures analyzes failure-reproducing test cases and supports developers in following infection chains back toroot causes. With the help of a motivating error from the Seaside Web framework, weshow how to reveal suspicious system parts, identify experienced developers for help,and debug erroneous behavior and state in the execution history.
1 Introduction
The correction of ubiquitous software failures can cost a lot of money [19] because theirdebugging is often a time-consuming development activity [3, 7]. During debugging,developers largely attempt to understand what causes failures: Starting with a testcase, which reproduces the observable failure, they have to follow failure causes on theinfection chain back to the root cause (defect) [22]. This idealized procedure requiresdeep knowledge of the system and its behavior because failures and defects can be farapart [8]. Unfortunately, common debugging tools are inappropriate to systematicallyinvestigate such infection chains in detail [9]. Thus, developers have to primarily rely ontheir intuition and the localization of failure causes takes up a lot of time [10]. To preventdebugging by trial and error, experienced developers apply the scientific method and itssystematic hypothesis-testing [10,22]. However, even when using the scientific methodthe search for failure causes can still be a laborious task. First, missing expertise aboutthe system makes it hard to understand incorrect behavior and to create reasonablehypotheses [11]. Second, contemporary debugging approaches still provide little orno support for the scientific method. For these reasons, we summarize our researchquestion as follows:
How can we effectively support developers in creating, evaluating, and re-fining failure cause hypotheses so that we reduce debugging costs withrespect to time and effort?
In this paper, we present a demonstration of our test-driven fault navigation thatguides the debugging of reproducible failures [13, 14, 20]. Based on the analysis ofpassing and failing test cases, we reveal anomalies and integrate them into a breadth
Fall Workshop 2012 133
Demonstrating Test-driven Fault Navigation
first search that leads developers to defects. This systematic search consists of fourspecific navigation techniques that together support the creation, evaluation, and re-finement of failure cause hypotheses for the scientific method. First, structure nav-igation [14] localizes suspicious system parts and restricts the initial search space.Second, team navigation [14] recommends experienced developers for helping withfailures even if defects are still unknown. Third, behavior navigation [14,15] allows de-velopers to follow emphasized infection chains of failing test cases backwards. Fourth,state navigation [5,6] identifies corrupted state and reveals parts of the infection chainautomatically. We implement test-driven fault navigation in our Path tools frame-work [12, 14, 15, 20] for the Squeak/Smalltalk development environment and limit itscomputation costs with the help of our incremental dynamic analysis [5, 12, 15]. Thislightweight dynamic analysis ensures a feeling of immediacy when debugging with ourtools by splitting the run-time overhead over multiple test runs depending on develop-ers’ needs. Hence, our test-driven fault navigation in combination with our incrementaldynamic analysis answers important questions in a short time: where to start debug-ging, who understands failure causes best, what happened before failures, and whichprogram entities are in question.
The remainder of this paper is organized as follows: Section 2 explains the moti-vating example for demonstrating our approach. Section 3 briefly introduces our test-driven fault navigation. Section 4 demonstrates our approach and how it supportsdebugging of the motivating example. Section 5 concludes and presents next steps.
2 Motivating Example: Typing Error in Seaside
We introduce a motivating example error taken from the Seaside Web framework [2,16]that serves as a basis for demonstrating our test-driven fault navigation approach in thefollowing sections.
Seaside1 is an open source Web framework implemented in Smalltalk [4]. Theframework provides a uniform, pure object-oriented view of Web applications and com-bines a component-based with a continuation-based approach [17]. With this, everycomponent has its own control flow which leads to high reusability, maintainability anda high level of abstraction. Additionally, it is written in Smalltalk that allows developersto debug and update applications on the fly. It provides a layer over HTTP and HTMLthat let you build highly interactive Web applications that come very close to the imple-mentation of real desktop applications. Finally, Seaside consists of about 650 classes,5,500 methods and a large test suite with more than 700 test cases.
We have inserted a defect into Seaside’s Web server and its request/response pro-cessing logic (WABufferedResponse class, writeHeadersOn: method). Figure 1illustrates the typing error inside the header creation of buffered responses. Once aclient opens a Seaside Web application, its Web browser sends a request to the cor-responding Web server. This request is then processed by the framework leading toa corresponding response to the browser. Depending on the Web application, this re-sponse is either a streamed or buffed response object. While the first transfers the
1www.seaside.st
134 Fall Workshop 2012

3 Anomalous Guide to Localize Causes in Failing Test Cases
Figure 1: An inconspicuous typo in writing buffered response headers leads to faultyresults of several client requests.
message body as a stream, the latter buffers and sends the response as a whole. Dur-ing the creation of buffered responses, there is a typo in writing the header. The typo in“Content-Lenght” is inconspicuous but leads to invalid results in browser requests thatdemand buffered responses. Streamed responses are not influenced and still workcorrectly. Although the typo is simple to characterize, observing it can be laborious.First, some clients hide the failure since they are able to handle corrupted header infor-mation. Second, as the response header is built by concatenating strings, the compilerdoes not report an error. Third, by reading source code like a text, developers tend tooverlook such small typos [18].
3 Anomalous Guide to Localize Causes in Failing TestCases
Based on test cases that reproduce the observable failure [20], we introduce a novelsystematic top-down debugging process with corresponding tools called test-drivenfault navigation. It does not only support the scientific method with a breadth-firstsearch [21] but also integrates hidden test knowledge for guiding developers to failurecauses. Starting with a failure-reproducing test case as entry point, we reveal suspi-cious system parts, identify experienced developers for help, and navigate developersalong the infection chain step by step. In doing so, anomalies highlight corrupted be-havior and state and so assist developers in their systematically hypothesis-testing.Figure 2 summarizes our complete test-driven fault navigation process and its primaryactivities:
Reproducing failure: As a precondition for all following activities, developers have toreproduce the observable failure in the form of at least one test case. Besidesthe beneficial verification of resolved failures, we require tests above all as entrypoints for analyzing erroneous behavior. For this activity, we have chosen unittest frameworks because of their importance in current development projects.Our approach is neither limited to unit testing nor does it require minimal testcases as proposed by some guidelines [1].
Fall Workshop 2012 135
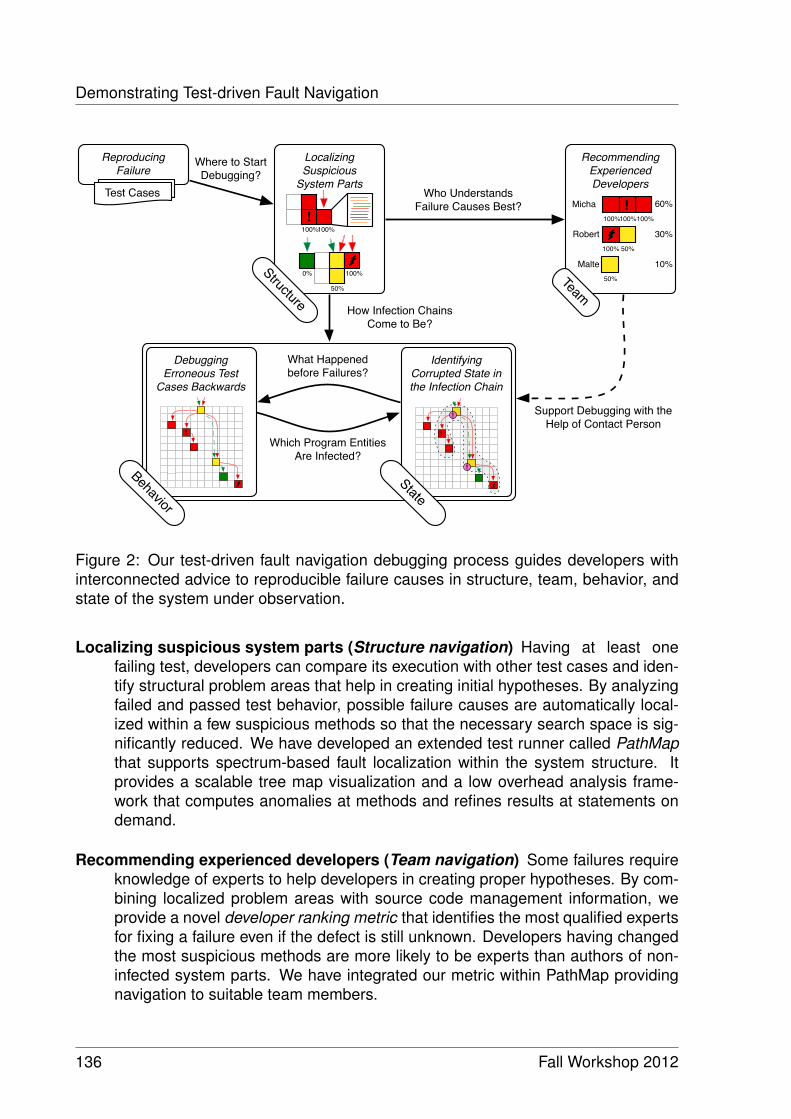
Demonstrating Test-driven Fault Navigation
How Infection Chains Come to Be?
Reproducing Failure
Test CasesTest Cases
Localizing Suspicious
System Parts
Structure
Where to Start Debugging?
Recommending Experienced Developers
100%100%100%
50%
100% 50%
!Micha
Robert
Malte
60%
30%
10%
Team
Who Understands Failure Causes Best?
What Happened before Failures?
Which Program Entities Are Infected?
Debugging Erroneous Test
Cases Backwards
!
!
Behavior
Identifying Corrupted State in the Infection Chain
!
!
State
Support Debugging with the Help of Contact Person
!
!
50%
100%0%
100%100%!
Figure 2: Our test-driven fault navigation debugging process guides developers withinterconnected advice to reproducible failure causes in structure, team, behavior, andstate of the system under observation.
Localizing suspicious system parts (Structure navigation) Having at least onefailing test, developers can compare its execution with other test cases and iden-tify structural problem areas that help in creating initial hypotheses. By analyzingfailed and passed test behavior, possible failure causes are automatically local-ized within a few suspicious methods so that the necessary search space is sig-nificantly reduced. We have developed an extended test runner called PathMapthat supports spectrum-based fault localization within the system structure. Itprovides a scalable tree map visualization and a low overhead analysis frame-work that computes anomalies at methods and refines results at statements ondemand.
Recommending experienced developers (Team navigation) Some failures requireknowledge of experts to help developers in creating proper hypotheses. By com-bining localized problem areas with source code management information, weprovide a novel developer ranking metric that identifies the most qualified expertsfor fixing a failure even if the defect is still unknown. Developers having changedthe most suspicious methods are more likely to be experts than authors of non-infected system parts. We have integrated our metric within PathMap providingnavigation to suitable team members.
136 Fall Workshop 2012
4 Example: Debugging Seaside’s Typo
Debugging erroneous test cases backwards (Behavior navigation) For refiningtheir understanding of erroneous behavior, developers experiment with theexecution and state history of a failing test case. To follow the infection chainback to the defect, they choose a proper entry point such as the failing test orone of its suspicious methods and start PathFinder our lightweight back in timedebugger. If anomalies are available, we classify the executed trace and so allowdevelopers to create proper hypotheses that assist the behavioral navigation todefects.
Identifying corrupted state in the infection chain (State navigation) Besides theclassification of executed behavior with spectrum-based anomalies, we also high-light parts of the infection chain with the help of state anomalies. We derive stateproperties from the hidden knowledge of passing test cases, create generalizedcontracts, and compare them with failing tests. Such dynamic invariants revealstate anomalies by directly violating contracts on the executed infection chain andso assist developers in creating and refining hypotheses. For this state naviga-tion, our PathMap automatically harvests objects and creates contracts while ourPathFinder integrates the violations into the execution history.
Besides our systematic top down process for debugging reproducible failures, thecombination of testing and anomalies also provides the foundation for interconnectednavigation with a high degree of automation. All four navigation activities and theiranomalous results are affiliated with each other and so allow developers to explorefailure causes from combined perspectives. An integration supports developers in an-swering more difficult questions and allows other debugging tasks to benefit even fromanomalies. Linked views between suspicious source code entities, erroneous behav-ior, and corrupted state help not only to localize causes more efficiently but also toidentify the most qualified developers for understanding the current failure. Our Pathtools support these points of view in a practical and scalable manner with the help ofour incremental dynamic analysis. With a few user interactions, we split the expen-sive costs of dynamic analysis over multiple test runs and varying granularity levels sothat we can provide both short response times and suitable results. Thus, developersare able to answer with less effort where to start debugging; who understands failurecauses best; what happened before failures; and which program entities are infected.
4 Example: Debugging Seaside’s Typo
With respect to our debugging process, we demonstrate each navigation step withthe help of Seaside’s typing error in more detail. Therefore, we start with the imple-mentation of a failing test case that reproduce the observable failure. In the case ofour example, developers have to implement a simple server request waiting for a cor-rupted response that cannot be parsed correctly. After that, they are able to apply ourapproach and its specific navigations as follows:
Fall Workshop 2012 137
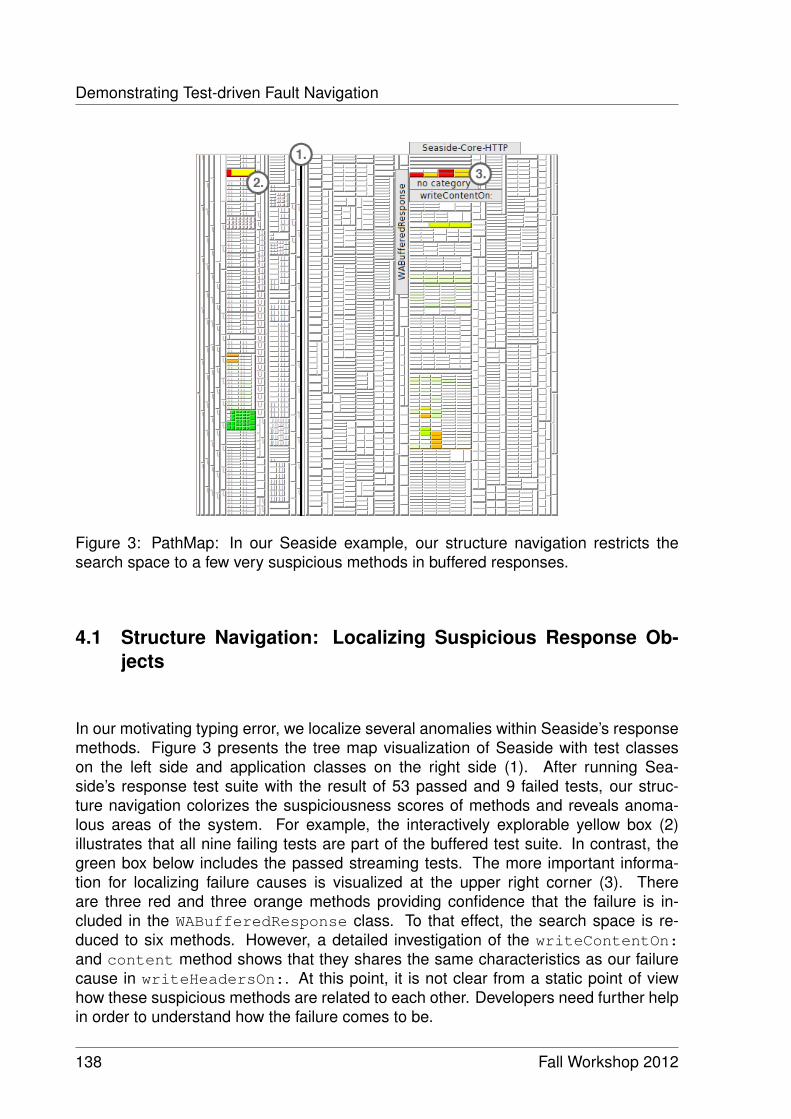
Demonstrating Test-driven Fault Navigation
Figure 3: PathMap: In our Seaside example, our structure navigation restricts thesearch space to a few very suspicious methods in buffered responses.
4.1 Structure Navigation: Localizing Suspicious Response Ob-jects
In our motivating typing error, we localize several anomalies within Seaside’s responsemethods. Figure 3 presents the tree map visualization of Seaside with test classeson the left side and application classes on the right side (1). After running Sea-side’s response test suite with the result of 53 passed and 9 failed tests, our struc-ture navigation colorizes the suspiciousness scores of methods and reveals anoma-lous areas of the system. For example, the interactively explorable yellow box (2)illustrates that all nine failing tests are part of the buffered test suite. In contrast, thegreen box below includes the passed streaming tests. The more important informa-tion for localizing failure causes is visualized at the upper right corner (3). Thereare three red and three orange methods providing confidence that the failure is in-cluded in the WABufferedResponse class. To that effect, the search space is re-duced to six methods. However, a detailed investigation of the writeContentOn:and content method shows that they shares the same characteristics as our failurecause in writeHeadersOn:. At this point, it is not clear from a static point of viewhow these suspicious methods are related to each other. Developers need further helpin order to understand how the failure comes to be.
138 Fall Workshop 2012
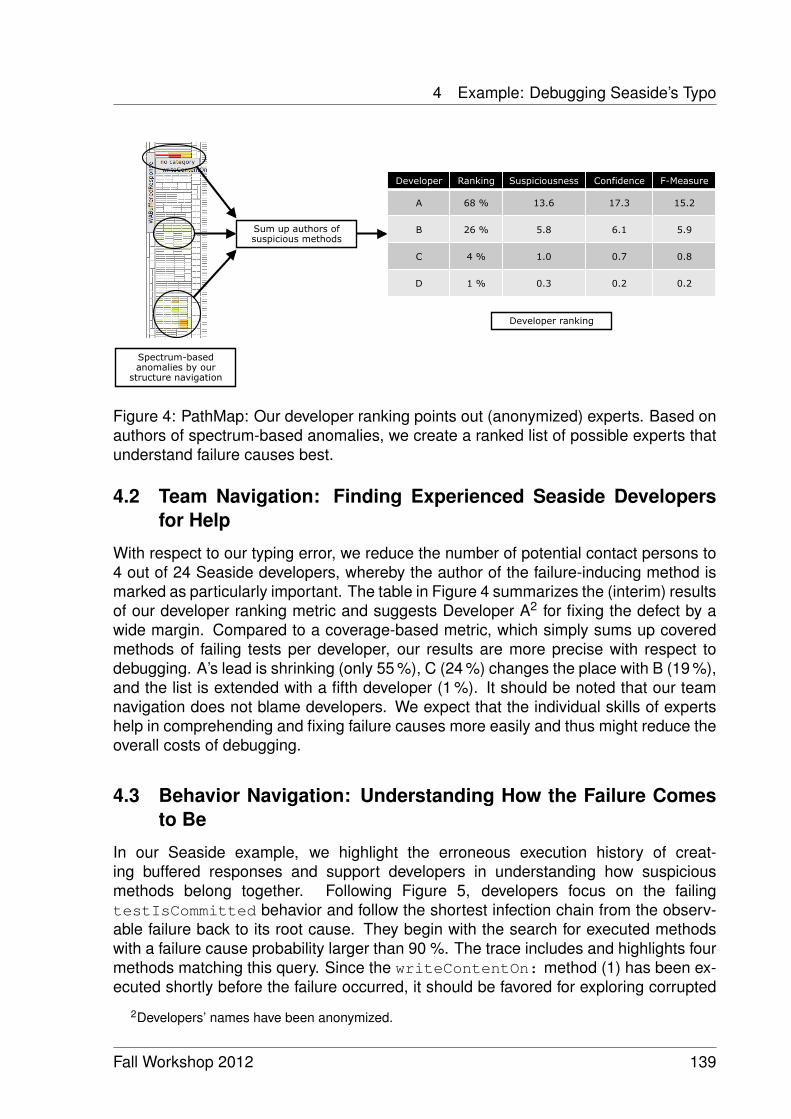
4 Example: Debugging Seaside’s Typo
Identification of Experienced Developers
Test-driven Perspectives | Michael Perscheid | Research School Retreat | Fall 2011
8
Sum up authors of suspicious methods
Developer Ranking Suspiciousness Confidence F-Measure
A 68 % 13.6 17.3 15.2
B 26 % 5.8 6.1 5.9
C 4 % 1.0 0.7 0.8
D 1 % 0.3 0.2 0.2
Developer ranking
Spectrum-based anomalies by our
structure navigation
Figure 4: PathMap: Our developer ranking points out (anonymized) experts. Based onauthors of spectrum-based anomalies, we create a ranked list of possible experts thatunderstand failure causes best.
4.2 Team Navigation: Finding Experienced Seaside Developersfor Help
With respect to our typing error, we reduce the number of potential contact persons to4 out of 24 Seaside developers, whereby the author of the failure-inducing method ismarked as particularly important. The table in Figure 4 summarizes the (interim) resultsof our developer ranking metric and suggests Developer A2 for fixing the defect by awide margin. Compared to a coverage-based metric, which simply sums up coveredmethods of failing tests per developer, our results are more precise with respect todebugging. A’s lead is shrinking (only 55 %), C (24 %) changes the place with B (19 %),and the list is extended with a fifth developer (1 %). It should be noted that our teamnavigation does not blame developers. We expect that the individual skills of expertshelp in comprehending and fixing failure causes more easily and thus might reduce theoverall costs of debugging.
4.3 Behavior Navigation: Understanding How the Failure Comesto Be
In our Seaside example, we highlight the erroneous execution history of creat-ing buffered responses and support developers in understanding how suspiciousmethods belong together. Following Figure 5, developers focus on the failingtestIsCommitted behavior and follow the shortest infection chain from the observ-able failure back to its root cause. They begin with the search for executed methodswith a failure cause probability larger than 90 %. The trace includes and highlights fourmethods matching this query. Since the writeContentOn: method (1) has been ex-ecuted shortly before the failure occurred, it should be favored for exploring corrupted
2Developers’ names have been anonymized.
Fall Workshop 2012 139
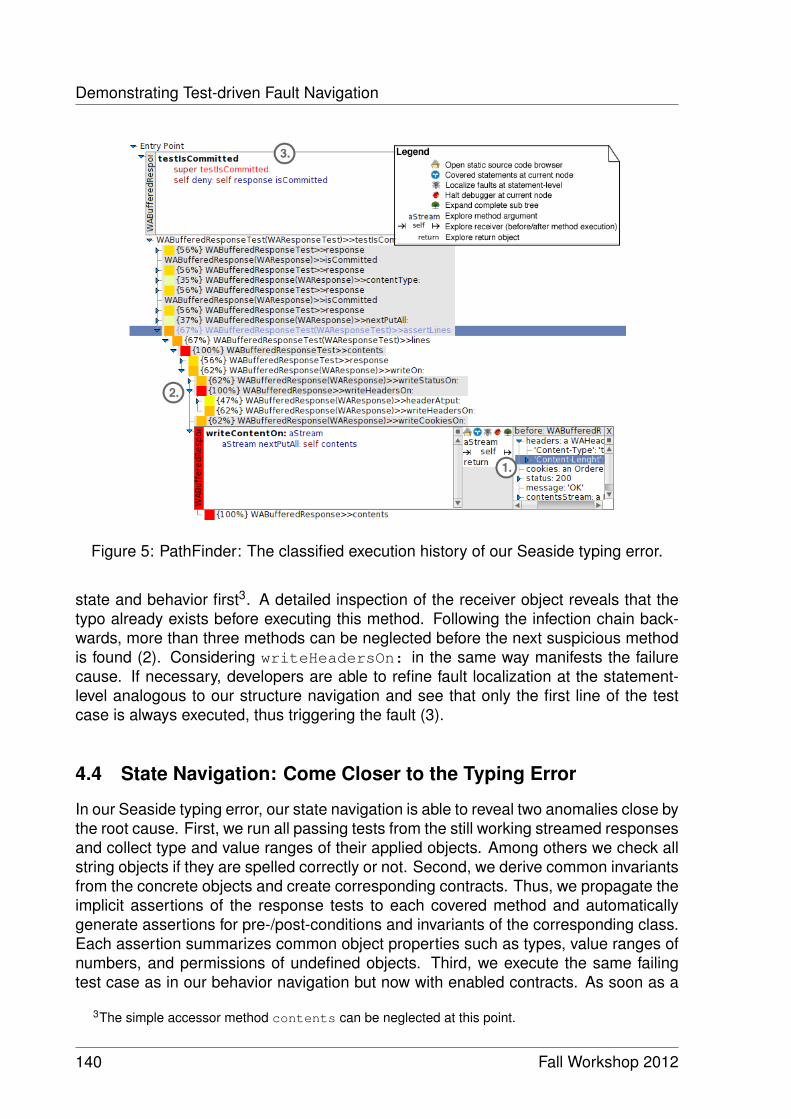
Demonstrating Test-driven Fault Navigation
Figure 5: PathFinder: The classified execution history of our Seaside typing error.
state and behavior first3. A detailed inspection of the receiver object reveals that thetypo already exists before executing this method. Following the infection chain back-wards, more than three methods can be neglected before the next suspicious methodis found (2). Considering writeHeadersOn: in the same way manifests the failurecause. If necessary, developers are able to refine fault localization at the statement-level analogous to our structure navigation and see that only the first line of the testcase is always executed, thus triggering the fault (3).
4.4 State Navigation: Come Closer to the Typing Error
In our Seaside typing error, our state navigation is able to reveal two anomalies close bythe root cause. First, we run all passing tests from the still working streamed responsesand collect type and value ranges of their applied objects. Among others we check allstring objects if they are spelled correctly or not. Second, we derive common invariantsfrom the concrete objects and create corresponding contracts. Thus, we propagate theimplicit assertions of the response tests to each covered method and automaticallygenerate assertions for pre-/post-conditions and invariants of the corresponding class.Each assertion summarizes common object properties such as types, value ranges ofnumbers, and permissions of undefined objects. Third, we execute the same failingtest case as in our behavior navigation but now with enabled contracts. As soon as a
3The simple accessor method contents can be neglected at this point.
140 Fall Workshop 2012

5 Summary and Next Steps
Figure 6: PathFinder: State anomalies highlight the typing error and reveal the infectionchain in the near of the defect.
contract is violated, we mark the corresponding exception in the execution history andso reveal for our testIsCommitted two state anomalies that are close by the defect.
Figure 6 summarizes the result of our state navigation. We mark method calls trig-gering a violation with small purple exclamation marks (1). Developers can furtherinspect these violations and see that a precondition fails. There is a spelling violationin the first argument of this method—all streamed responses used correctly spelledidentifier keys for their header information. The corrupted state is opened for further ex-ploration on the right (2). As our typo in “content-lenght” is automatically revealed, ourstate navigation gives developers helpful advice about the real failure cause. Anotherspelling violation is close by and developers can easily follow the infection chain back(3). Finally, the next very suspicious spectrum-based anomaly at writeHeadersOn:highlights the last step to the root cause. Following both state and spectrum-basedanomalies directly guides developers to the defect of our Seaside typing error and alsoallows them to understand what causes the failure.
5 Summary and Next Steps
In this paper, we presented a demonstration of our test-driven fault navigation by de-bugging a small example. Starting with the structure navigation, we restrict the initialsearch space and lower speculations about failure causes. Based on this information,we are able to recommend experienced developers that can further help with debug-ging this failure. After that, developers apply our behavior and state navigation andfollow the highlighted infection chain back to its root cause.
Fall Workshop 2012 141

References
Future work deals with finishing the dissertation. So far, there is a first completedraft including 180 pages in total with 135 pages of content. We plan to submit thethesis at the end of this year.
References
[1] K. Beck. Test-driven Development: By Example. Addison-Wesley Professional,1st edition, 2003.
[2] S. Ducasse, A. Lienhard, and L. Renggli. Seaside: A Flexible Environment forBuilding Dynamic Web Applications. IEEE Software, 24(5):56–63, 2007.
[3] M. Eisenstadt. My Hairiest Bug War Stories. Communications of the ACM,40(4):30–37, 1997.
[4] A. Goldberg and D. Robson. Smalltalk-80: The Language and its Implementation.Addison-Wesley, 1st edition, 1983.
[5] M. Haupt, M. Perscheid, and R. Hirschfeld. Type Harvesting A Practical Approachto Obtaining Typing Information in Dynamic Programming Languages. In Proceed-ings of the Symposium on Applied Computing, SAC, pages 1282–1289. ACM,2011.
[6] R. Hirschfeld, M. Perscheid, C. Schubert, and M. Appeltauer. Dynamic ContractLayers. In Proceedings of the Symposium on Applied Computing, SAC, pages2169–2175. ACM, 2010.
[7] Z. Li, L. Tan, X. Wang, S. Lu, Y. Zhou, and C. Zhai. Have Things Changed Now?:An Empirical Study of Bug Characteristics in Modern Open Source Software. InProceedings of the Workshop on Architectural and System Support for ImprovingSoftware Dependability, ASID, pages 25–33. ACM, 2006.
[8] B. Liblit, M. Naik, A. Zheng, A. Aiken, and M. Jordan. Scalable Statistical BugIsolation. In Proceedings of the Conference on Programming Language Designand Implementation, PLDI, pages 15–26. ACM, 2005.
[9] H. Lieberman and C. Fry. Will Software Ever Work? Communications of the ACM,44(3):122–124, 2001.
[10] R. Metzger. Debugging by Thinking - A Multidisciplinary approach. Elsevier DigitalPress, 1st edition, 2003.
[11] N. Palix, J. Lawall, G. Thomas, and G. Muller. How Often Do Experts MakeMistakes? In Proceedings of the Workshop on Aspects, Components, and Pat-terns for Infrastructure Software, ACP4IS, pages 9–15. Technical report 2010-33Hasso-Plattner-Institut, University of Potsdam, 2010.
142 Fall Workshop 2012
References
[12] M. Perscheid, D. Cassou, and R. Hirschfeld. Test Quality Feedback - ImprovingEffectivity and Efficiency of Unit Testing. In Proceedings of the Conference onCreating, Connecting and Collaborating through Computing, C5, pages 60–67.IEEE, 2012.
[13] M. Perscheid, M. Haupt, R. Hirschfeld, and H. Masuhara. Test-driven Fault Navi-gation for Debugging Reproducible Failures. In Proceedings of the Japan Societyfor Software Science and Technology Annual Conference, JSSST, pages 1–17.J-STAGE, 2011.
[14] M. Perscheid, M. Haupt, R. Hirschfeld, and H. Masuhara. Test-driven Fault Nav-igation for Debugging Reproducible Failures. Journal of the Japan Society forSoftware Science and Technology on Computer Software, 29(3):188–211, 2012.
[15] M. Perscheid, B. Steinert, R. Hirschfeld, F. Geller, and M. Haupt. Immediacythrough Interactivity: Online Analysis of Run-time Behavior. In Proceedings of theWorking Conference on Reverse Engineering, WCRE, pages 77–86. IEEE, 2010.
[16] M. Perscheid, D. Tibbe, M. Beck, S. Berger, P. Osburg, J. Eastman, M. Haupt, andR. Hirschfeld. An Introduction to Seaside. Software Architecture Group (Hasso-Plattner-Institut), 1st edition, 2008.
[17] C. Queinnec. The Influence of Browsers on Evaluators or, Continuations to Pro-gram Web Servers. In Proceedings of the International Conference on FunctionalProgramming, ICFP, pages 23–33. ACM, 2000.
[18] G. Rawlinson. The Significance of Letter Position in Word Recognition. PhDthesis, University of Nottingham, 1976.
[19] RTI. The Economic Impacts of Inadequate Infrastructure for Software Testing.Technical report, National Institute of Standards and Technology, 2002.
[20] B. Steinert, M. Perscheid, M. Beck, J. Lincke, and R. Hirschfeld. Debugging intoExamples: Leveraging Tests for Program Comprehension. In Proceedings of theInternational Conference on Testing of Communicating Systems, TestCom, pages235–240. Springer, 2009.
[21] I. Vessey. Expertise in Debugging Computer Programs: A Process Analysis. In-ternational Journal of Man-Machine Studies, 23(5):459–494, 1985.
[22] A. Zeller. Why Programs Fail: A Guide to Systematic Debugging. Morgan Kauf-mann, 2nd edition, 2009.
Fall Workshop 2012 143

Migrating Traditional Web Applicationsinto Multi-Tenant SaaS
Eyad Saleh
Internet Technologies and Systems - Prof. Dr. Christoph MeinelHasso-Plattner-Institut
Software-as-a-Service (SaaS) is emerging as a new model of delivering a software,where users utilize software over the internet as a hosted service rather than an in-stallable product. Multi-tenancy is the principle of running a single instance of the soft-ware on a server to serve multiple companies (tenants). Large number of applicationshave been built into non-SaaS mode, re-engineering such applications from scratchinto SaaS requires tremendous efforts in terms of cost, manpower, and time. Thus,Migrating existing applications into SaaS mode becomes a requirement. In my firsttechnical report [25], I introduced several challenges in SaaS and multi-tenancy, oneof those challenges is software migration into SaaS. In this report, I highlight this chal-lenge, discuss the related work and existing approaches, then I introduce my proposedapproach.
1 Introduction: Multi-tenancy Evolution
History has shown that advances in technology and computing changes the way soft-ware are designed, developed, and delivered to the end users. These advances yield tothe invention of personal computers (PCs) and graphical user interfaces (GUIs), whichin turn adopted the client/server architecture over the old big, super, and expensivemainframes. Currently, fibers and fast internet connections, Service-Oriented Architec-tures (SOAs), and the high-cost of managing and maintaining on-premises dedicatedapplications raised the flag for a new movement in the software industry, and the resultwas the introducing of a new delivery model called Software-as-a-Service (SaaS) [1].
SaaS provides major advantages to both service providers as well as consumers.Service providers can provision a single set of hardware to host their applications andmanage thousands of clients (tenants). As an alternative, they can easily install andmaintain their software using any IaaS provider. As for consumers, they can use theapplication anywhere and any time, they are relieved from maintaining and upgradingthe software (on-premises scenario), and benefit from cost reduction by following thepay-as-you-go model [2].
Multi-tenancy is a requirement for a SaaS vendor to be successful (Marc Benioff,CEO, Salesforce) [3]. Multi-tenancy is the core of SaaS; it is the ability to use a single-instance of the application hosted by a provider to serve multiple clients (tenants).
Software applications have been built for decades into non-SaaS mode, reengineer-ing or re-designing such applications from scratch requires tremendous efforts in terms
Fall Workshop 2012 145

Migrating Traditional Web Applications into Multi-Tenant SaaS
of cost, manpower, and time. Therefore, researchers have been proposing several ap-proaches to migrate such applications into SaaS mode.
While migrating non-SaaS applications into SaaS mode, certain issues need tobe considered, such as database architecture, security isolation, UI customizations,data-model extensions, business logic configuration, and workflow management. Inthis report, I propose an approach to facilitate the migration process with the focus onbusiness logic configuration and workflow customization.
After this introduction, Section 2 discusses the related work and Section 3 outlinesour proposed approach. In Section 4, we describe the use case followed by the imple-mentation. Finally, we close with future work in Section 5.
2 Related Work
Migrating legacy applications to the cloud has received considerable attention recentlyas SaaS is becoming more popular. Existing approaches [4,5,7,10–12] typically focuson UI customization and basic database modifications. The goal of such approachesis rather the ability to convert a legacy application into SaaS; they didn’t consider towhich level the migrated application will cope with changing business and users’ re-quirements. For example, Cai et al. [4] and Nitu [10] concentrate on the look-and-feeland some basic configuration options; critical points such as business logic, workflowcustomization and data-model extension are not considered. An interesting approachfor migrating traditional web applications into SaaS automatically without changing thesource code is propose by Song et al. [5]. They adopt several technologies to ac-complish this goal: (1) page template to fulfill configurability, (2) memory in thread tomaintain tenant-info, and (3) JDBC proxy to adopt the modified database. Practically,migrating an application from non-SaaS mode into SaaS without having or changingthe source code is very hard to achieve. Another transparent approach is introducedby Cai et al. [6], they focus on intercepting web requests and deriving tenant context,then carry this context with a thread in the web container. Additionally, they categoriseseveral isolation points to achieve multi-tenancy.
Experienced reports are also reported in the literature, one example is Bezemer etal. [7], they report on a use case of converting an industrial, single-tenant application(CRM) for a company called Exact2 into a multi-tenant one. They propose a patternto migrate the application taking into account hardware sharing, high degree of config-urability, and shared database instance. Another example is Chauhan et al. [8], theyreport on their efforts in migrating Hackystat [9], an open-source legacy application tothe cloud.
Back-end customization was the focus of Müller et al. [11], they identify differentcategories of customization, such as desktop integration and UI customization. Addi-tionally, they identify two cornerstones for a customizable, multi-tenant aware infras-tructure, namely, dynamic instance composition and abstraction from the persistencylayer.
2http://www.exact.com
146 Fall Workshop 2012
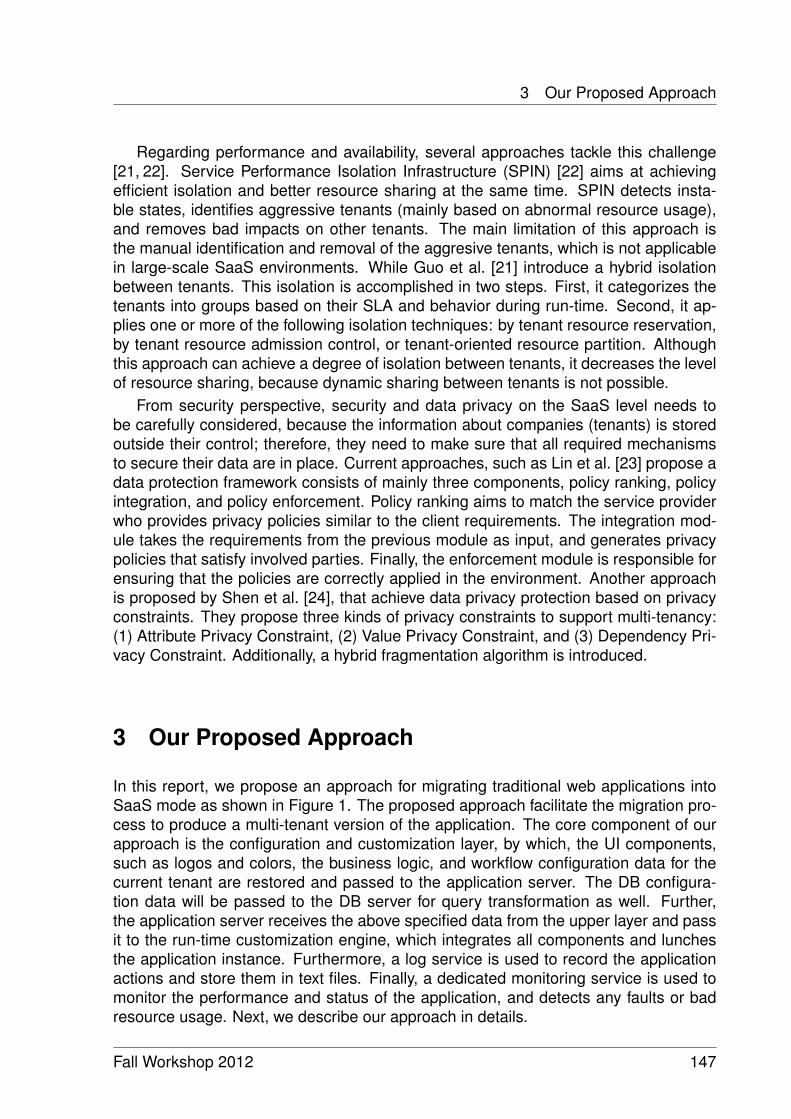
3 Our Proposed Approach
Regarding performance and availability, several approaches tackle this challenge[21, 22]. Service Performance Isolation Infrastructure (SPIN) [22] aims at achievingefficient isolation and better resource sharing at the same time. SPIN detects insta-ble states, identifies aggressive tenants (mainly based on abnormal resource usage),and removes bad impacts on other tenants. The main limitation of this approach isthe manual identification and removal of the aggresive tenants, which is not applicablein large-scale SaaS environments. While Guo et al. [21] introduce a hybrid isolationbetween tenants. This isolation is accomplished in two steps. First, it categorizes thetenants into groups based on their SLA and behavior during run-time. Second, it ap-plies one or more of the following isolation techniques: by tenant resource reservation,by tenant resource admission control, or tenant-oriented resource partition. Althoughthis approach can achieve a degree of isolation between tenants, it decreases the levelof resource sharing, because dynamic sharing between tenants is not possible.
From security perspective, security and data privacy on the SaaS level needs tobe carefully considered, because the information about companies (tenants) is storedoutside their control; therefore, they need to make sure that all required mechanismsto secure their data are in place. Current approaches, such as Lin et al. [23] propose adata protection framework consists of mainly three components, policy ranking, policyintegration, and policy enforcement. Policy ranking aims to match the service providerwho provides privacy policies similar to the client requirements. The integration mod-ule takes the requirements from the previous module as input, and generates privacypolicies that satisfy involved parties. Finally, the enforcement module is responsible forensuring that the policies are correctly applied in the environment. Another approachis proposed by Shen et al. [24], that achieve data privacy protection based on privacyconstraints. They propose three kinds of privacy constraints to support multi-tenancy:(1) Attribute Privacy Constraint, (2) Value Privacy Constraint, and (3) Dependency Pri-vacy Constraint. Additionally, a hybrid fragmentation algorithm is introduced.
3 Our Proposed Approach
In this report, we propose an approach for migrating traditional web applications intoSaaS mode as shown in Figure 1. The proposed approach facilitate the migration pro-cess to produce a multi-tenant version of the application. The core component of ourapproach is the configuration and customization layer, by which, the UI components,such as logos and colors, the business logic, and workflow configuration data for thecurrent tenant are restored and passed to the application server. The DB configura-tion data will be passed to the DB server for query transformation as well. Further,the application server receives the above specified data from the upper layer and passit to the run-time customization engine, which integrates all components and lunchesthe application instance. Furthermore, a log service is used to record the applicationactions and store them in text files. Finally, a dedicated monitoring service is used tomonitor the performance and status of the application, and detects any faults or badresource usage. Next, we describe our approach in details.
Fall Workshop 2012 147
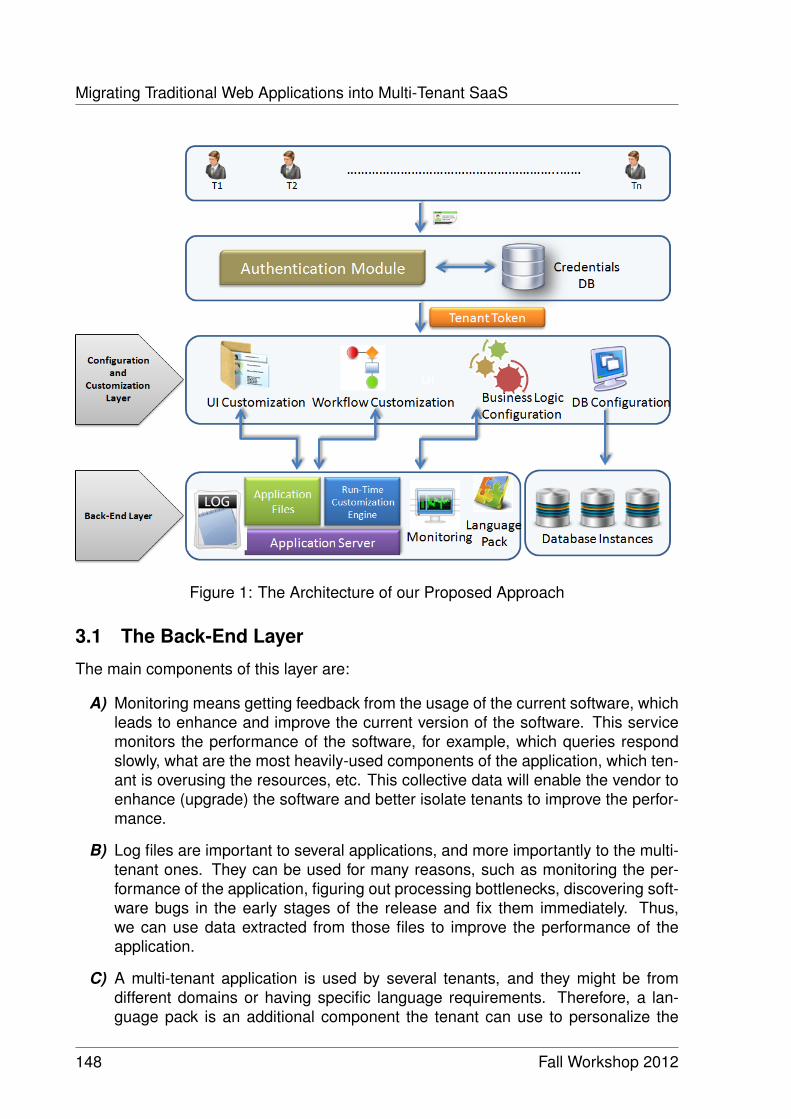
Migrating Traditional Web Applications into Multi-Tenant SaaS
Figure 1: The Architecture of our Proposed Approach
3.1 The Back-End Layer
The main components of this layer are:
A) Monitoring means getting feedback from the usage of the current software, whichleads to enhance and improve the current version of the software. This servicemonitors the performance of the software, for example, which queries respondslowly, what are the most heavily-used components of the application, which ten-ant is overusing the resources, etc. This collective data will enable the vendor toenhance (upgrade) the software and better isolate tenants to improve the perfor-mance.
B) Log files are important to several applications, and more importantly to the multi-tenant ones. They can be used for many reasons, such as monitoring the per-formance of the application, figuring out processing bottlenecks, discovering soft-ware bugs in the early stages of the release and fix them immediately. Thus,we can use data extracted from those files to improve the performance of theapplication.
C) A multi-tenant application is used by several tenants, and they might be fromdifferent domains or having specific language requirements. Therefore, a lan-guage pack is an additional component the tenant can use to personalize the
148 Fall Workshop 2012

3 Our Proposed Approach
language settings. This component is responsible for managing language files,and providing the settings that correspond to the tenant preferences to the run-time customization engine. Several languages could be defined in the languagepack such as English, Arabic, German, Chinese, etc.
3.2 The Configuration and Customization Layer
A) User Interface Customization: UI customization means changing the look-and-feel of the application to be tenant-specific. This includes general layout, logos,buttons, colors, and locale settings. To utilize this customization, we propose theusage of Microsoft’s ASP.NET master page concept [16].
ASP.NET master page allows the developer to create a consistent look for allpages (group of pages) in the application; one or more master pages could becreated for each tenant and used in the application. The master page providesa shared layout and functionality for the pages of the application, when usersrequest any page, ASP.NET engine merges the master page that contains thelayout with the requested content-page, and sends the merged page to the useras shown in Figure 2.
Figure 2: ASP.NET Master Page [16]
Application developers can define a master page for each tenant by applyingthe master page technique, which contains the required layout, color, buttons,and other design components. Moreover, several master pages could be definedfor each tenant. Therefore, tenants will have the chance to get benefit of usingdynamic look-and-feel.
B) Workflow Customization: The workflow of the application might vary from onetenant to another, for instance, a recruitment agency (Tenant A) might wait until
Fall Workshop 2012 149
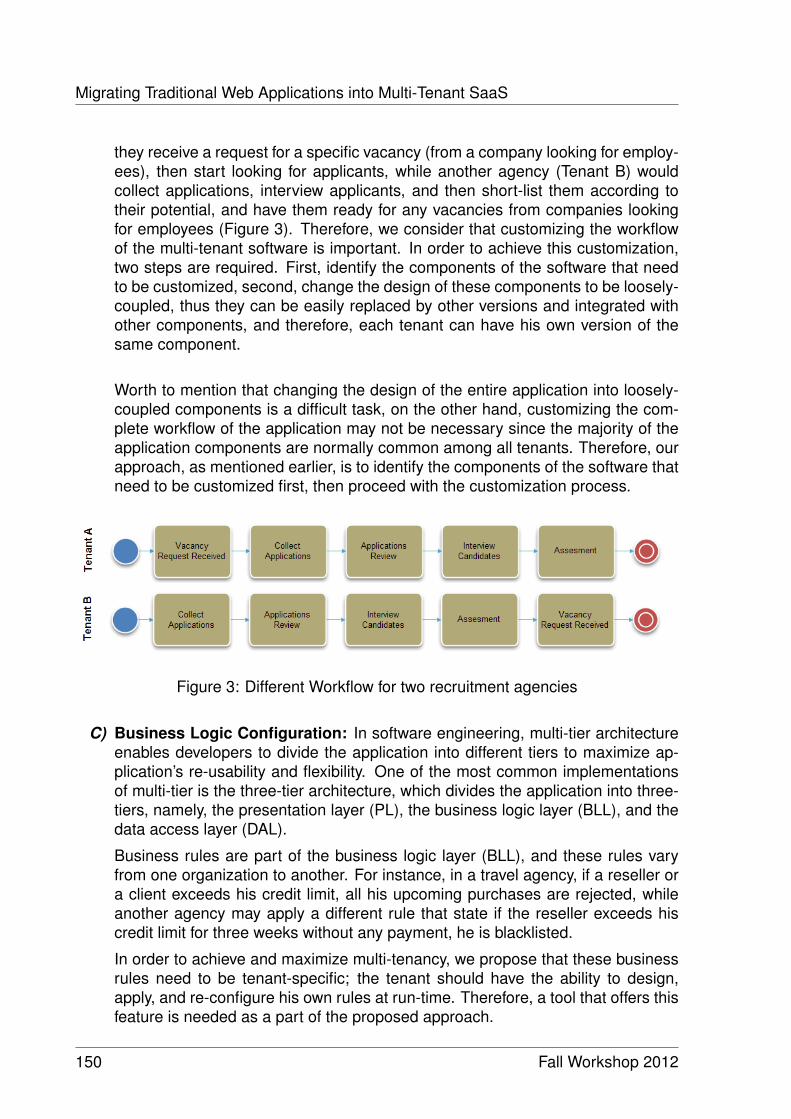
Migrating Traditional Web Applications into Multi-Tenant SaaS
they receive a request for a specific vacancy (from a company looking for employ-ees), then start looking for applicants, while another agency (Tenant B) wouldcollect applications, interview applicants, and then short-list them according totheir potential, and have them ready for any vacancies from companies lookingfor employees (Figure 3). Therefore, we consider that customizing the workflowof the multi-tenant software is important. In order to achieve this customization,two steps are required. First, identify the components of the software that needto be customized, second, change the design of these components to be loosely-coupled, thus they can be easily replaced by other versions and integrated withother components, and therefore, each tenant can have his own version of thesame component.
Worth to mention that changing the design of the entire application into loosely-coupled components is a difficult task, on the other hand, customizing the com-plete workflow of the application may not be necessary since the majority of theapplication components are normally common among all tenants. Therefore, ourapproach, as mentioned earlier, is to identify the components of the software thatneed to be customized first, then proceed with the customization process.
Figure 3: Different Workflow for two recruitment agencies
C) Business Logic Configuration: In software engineering, multi-tier architectureenables developers to divide the application into different tiers to maximize ap-plication’s re-usability and flexibility. One of the most common implementationsof multi-tier is the three-tier architecture, which divides the application into three-tiers, namely, the presentation layer (PL), the business logic layer (BLL), and thedata access layer (DAL).
Business rules are part of the business logic layer (BLL), and these rules varyfrom one organization to another. For instance, in a travel agency, if a reseller ora client exceeds his credit limit, all his upcoming purchases are rejected, whileanother agency may apply a different rule that state if the reseller exceeds hiscredit limit for three weeks without any payment, he is blacklisted.
In order to achieve and maximize multi-tenancy, we propose that these businessrules need to be tenant-specific; the tenant should have the ability to design,apply, and re-configure his own rules at run-time. Therefore, a tool that offers thisfeature is needed as a part of the proposed approach.
150 Fall Workshop 2012

4 Use Case and Implementation
D) Database Configuration: Database design is considered as one of the mostcritical issues in multi-tenant SaaS because multiple tenants are mapped into onephysical database. Therefore, a robust database architecture must be modeledand implemented.
Consolidating multiple tenants into one database requires changes to the designof the tables and the queries as well, thus, a query transformation is required. Forinstance, in a traditional hospital management system, a simple query to fetch apatient record would be "select * from patient where SSN=1234", while in a multi-tenant system, this will not work, since the "patient" table would have informationfor many tenants (i.e., hospitals). Therefore, the query should be changed tosomething similar to "select * from patient where tenant_id=12 and SSN=1234",in this case, the patient record that belongs to the tenant 12 (i.e., hospital 12) isretrieved. Based on that, the rules for query transformation should be stored inthe database configuration files and restored by the transformation engine.
4 Use Case and Implementation
In Jan 2011, Forrester Research published a report with the title "Which Software Mar-kets Will SaaS Disrupt?" [18], one of the conclusions was that Human Resource Man-agement Software (HRMS) is a good candidate for SaaS. Thus, we decided to selectan HRMS as our use case. Orange Human Resource Management (OrangeHRM)is the world’s most popular open source HRM application with more than one millionusers globally and more than 600,000 downloads [17]. OrangeHRM released under theGNU General Public License and targets small and medium enterprises. The systemfunctionality includes employee information management, absence and leave manage-ment, recruitment management, performance evaluation, etc. From technical point ofview, OrangeHRM is implemented using PHP and MySQL, and its relational data modelcontains about 115 tables. The implementation of our approach is described below.
The main components of our implementation can be classified as follows:
A) Tenant Subscription: A dedicated module is responsible of handling tenantssubscription. The tenant fills the required information in a simple form and re-ceives access to the system within 10 minutes.
B) Authentication Module: Two additional tables are created, to store tenant’s in-formation and credentials. The first table stores general information about eachtenant, while the second table stores the usernames and passwords for all ten-ant’s users.
C) UI Customization: UI Customization is achieved by separating the code fromthe view layer, then allowing the tenants to customize the view layer to matchtheir needs. OrangeHRM follows the three-tiers architecture we proposed in ourarchitecture, therefore, in order to accomplish UI customization, we will developa tool to allow tenants to configure the Presentation Layer (PL) according to their
Fall Workshop 2012 151
Migrating Traditional Web Applications into Multi-Tenant SaaS
needs. thus, the tenant is able to change the look-and-feel of the system, suchas general layout, colors, images, font-type, menu design, etc.
D) Business Logic Configuration: As mentioned earlier, OrangeHRM is built ontop of Symfony, and Symfony was developed using standard OO techniques, andtherefore, all the business logic is encapsulated in classes. As a result, customiz-ing the business logic means having different classes for different tenants.
First, for each unit of business logic, a base class is created which contains thecommon business logic shared by all tenants. Second, a second class is cre-ated for every tenant which inherits from the base class, thus all data membersand member functions are available for this child class. A dedicated tool will bedeveloped to allow the tenant to customize the code of the child class, it will besimilar in concept to the query builder in known DBMSs such as Oracle or SQLServer. The tenant will be able to define new variables, insert different program-ming statements such as if-else or loops, use HTTP objects, such as Requestand Response, etc. It is worth mentioning that the tenant will not be able to writeany single line of code manually, simply for validation purposes. It will be verycomplex to validate code entered by tenants manually.
E) Database Configuration: Several schema-mapping techniques are available formulti-tenancy and SaaS in general [13,15,20]. In terms of schema managementand DDL, these techniques can be classified in two types, first, the databaseowns the schema, such as private tables, extension tables, and sparse columns(in Microsoft SQL Server), second, the application owns the schema, such asXML and pivot tables.
We decided to select the second option where the application owns the schemabased on our assumption that the application needs to be customized as much aspossible, especially in terms business logic. The XML technique is ideal for ourwork because it allows us to dynamically (i.e., on the fly) customize the databaseby attaching an XML document to every table we feel appropriate. In this XMLdocument, we can define custom fields belong to some tenants over the others.
F) Tenant Termination: This module has four different cases where the tenant ac-count can be terminated: (1) the duration of the subscription period has ended,and the tenant is not intended to renew, (2) the tenant decides to voluntarily termi-nate his subscription, (3) the vendor detects bad behaviour from the tenant duringservice monitoring, such as bad resources usage, and (4) automatic terminationof tenant account without notification, and this option might be available in somecases. However, this should be mentioned in the availability SLA and terms ofuse policies.
G) Tenant Management: In this module, the vendor is able to list all the tenants,view their details, such as subscription date, expiry date, etc. Also the vendoris able to view the specific customizations done by each tenant. Moreover, thevendor can monitor the performance of the tenants and check their resourcesusage. contact with tenants is also done using this module.
152 Fall Workshop 2012
5 Summary and Future Work
5 Summary and Future Work
In this report, we explored the challenge of migrating existing web applications intoSaaS. We discussed the related work and introduced our approach to handle such achallenge. We propose a new approach to facilitate the migration process. Primarily,we explored the configuration and customization of the application from several layers,such as UI, business logic, workflow, and database design. The future work will focuson applying our approach on OrangeHRM, and conduct several experiments to validatethe proposed approach. Additionally, we will conduct a survey to understand the users’experience and to highlight key requirements from their perspective.
References
[1] T. McKinnon: The Force.com Multitenant Architecture: Understanding the De-sign of Salesforce.com’s Internet Application Development Platform, White Paper,USA, 2008.
[2] M. Armbrust, A. Fox, R. Griffith, A. Joseph, R. Katz, A. Konwinski, G. Lee, D.Patterson, A. Rabkin, and M. Zaharia: Above the Clouds: A Berkeley View ofCloud Computing. Technical Report, University of California, Berkeley, USA, 2009.
[3] D. Woods: Salesforce.com Secret Sauce, Forbes, January 2009. [On-line]. Available: http://www.forbes.com/2009/01/12/cio-salesforce-multitenancy-tech-cio-cx_dw_0113salesforce.html [retrieved: 10, 2012]
[4] H. Cai, K. Zhang, M. J. Zhou, W. G., J. J. Cai, and X. Mao: An End-to-End Method-ology and Toolkit for Fine Granularity SaaS-ization. In IEEE International Confer-ence on Cloud Computing, Bangalore, India, 2009.
[5] J. Song, F. Han, Z. Yan, G. Liu, and Z. Zhu: A SaaSify Tool for Converting Tra-ditional Web-Based Applications to SaaS Application. In IEEE 4th Int. Conf. onCloud Computing, Washington, DC, USA, 2011.
[6] H. Cai, N. Wang, and M. Zhou: A Transparent approach of enabling SaaS multi-tenancy in the cloud. In IEEE 6th World Congress on Services, Miami, Florida,USA, 2010.
[7] C. Bezemer, A. Zaidman, B. Platzbeecker, T. Hurkmans, A. Hart: Enabling multi-tenancy: An industrial experience report. In the 26th IEEE International Confer-ence on Software Maintenance, Timisoara, Romania, 2010.
[8] M. Chauhan and M. Babar: Migrating service-oriented system to cloud computing:An experience report. In IEEE 4th Int. Conf. on Cloud Computing, Washington DC,USA, 2011.
[9] Hackystat website. [Online]. Available: http://code.google.com/p/hackystat [re-trieved: 10, 2012]
Fall Workshop 2012 153

References
[10] Nitu: Configurability in SaaS (software as a service) applications. In the 2nd IndiaSoftware Engineering Conference, Pune, India, 2009.
[11] J. Müller, J. Krüger, S. Enderlein, M. Helmich, and A. Zeier: Customizing Enter-prise Software as a Service Applications: Back-end Extension in a multi-tenancyEnvironment. In the 11th International Conference on Enterprise Information Sys-tems, Milan, Italy, 2009.
[12] D. Yu, J. Wang, B. Hu, J. Liu, and L. Zhang: A Practical architecture of cloudifica-tion of legacy applications. In IEEE 7th World Congress on Services, WashingtonDC, USA, 2011.
[13] F. Chong, C. Gianpaolo, and R. Wolter: Multi-Tenant Data Architecture, MicrosoftCorporation, http://www.msdn2.microsoft.com, 2006.
[14] W. Tsai, Q. Shao, Y. Huang, X. Bai: Towards a scalable and robust multi-tenancySaaS. In the Second Asia-Pacific Symposium on Internetware, Suzhou, China,2010.
[15] S. Aulbach, T. Grust, D. Jacobs, A. Kemper, and J. Rittinger: Multi-TenantDatabases for Software as a Service: Schema-Mapping Techniques. In the 2008ACM SIGMOD international conference on Management of data, Vancouver,Canada, 2008.
[16] ASP.NET Master Page on Microsoft.com. [Online]. Available:http://msdn.microsoft.com/en-us/library/wtxbf3hh.aspx [retrieved: 10, 2012]
[17] OrangeHRM Website. [Online]. Available: http://www.orangehrm.com [retrieved:10, 2012]
[18] A. Bartels, L. Herbert, C. Mines, and Sarah Musto: Forrester Re-search. [Online]. Available: http://www.forrester.com/Which+Software+Markets+Will+SaaS+Disrupt/fulltext/-/E-RES57405 [retrieved: 10, 2012]
[19] Symfony Website. [Online]. Available: http://www.symfony-project.org/ [retrieved:10, 2012]
[20] S. Aulbach, D. Jacobs, A. Kemper, and M. Seibold: A Comparison of FlexibleSchemas for Software as a Service. SIGMOD Conference (SIGMOD 2009), Prov-idence, Rhode Island, USA, 2009.
[21] C. J. Guo, W. Sun, Y. Huang, Z. H. Wang, and B. Gao: A framework for nativemulti-tenancy application development and management. In The 9th IEEE Int.Conf. on E-Commerce Technology and The 4th IEEE Int. Conf. on EnterpriseComputing, E-Commerce and E-Services, Tokyo, Japan, 2007.
[22] X. H. Li, T. C. Liu, Y. Li, and Y. Chen: SPIN: Service Performance Isolation In-frastructure in Multi-tenancy Environment. In the 6th International Conference onService-Oriented Computing, Sydney, Australia, 2008.
154 Fall Workshop 2012

References
[23] Dan Lin and Anna Squicciarini: Data protection models for service provisioning inthe cloud. In the 15th ACM symposium on Access control models and technolo-gies, Pittsburgh, Pennsylvania, USA, 2010.
[24] Y. Shen, W. Cui, Q. Li, Y. Shi: Hybrid Fragmentation to Preserve Data Privacy forSaaS. In the 2011 Eighth Web Information Systems and Applications Conference,Chongqing, China, 2011.
[25] Eyad Saleh. “Multi-tenans SaaS: Challenges and Approaches". Technical report,Hasso-Plattner-Institut, Potsdam, Germany, April 2012.
Fall Workshop 2012 155

Challenges in the Visualization of LargeMulti-Dimensional Hierarchies
Sebastian SchmechelComputer Graphics Systems Group
Hasso-Plattner-Institute
The visualization of hierarchically ordered data has an important role in the researchfield of information visualization. In extension to the parent-child-relationship betweennodes in such hierarchy, the encoding of additional attributes and their evolution overtime results in a major challenge in this research area. To handle challenges like largedata visualization, the stability of layout algorithms, to support user’s pattern recog-nition and through it the memorability of visualization parts, and the interaction andconfiguration depending on users’ needs, new rendering, interaction and visualizationtechniques are needed. This report presents the main challenges of multidimensionalhierarchy visualization and discusses special issues like constrained hierarchies as wellas time-dependent changes and their consequences.
1 Introduction
The visualization of hierarchicall ordered data has an important role in the researchfield of information visualization. Its primary goal, supporting a user to achieve a fastvisual extraction of the underlying data-structure, is enabled either explicit, throughnode-link diagrams, implicit, through recursive partitioning of a given root-space, or ina hybrid way [10]. The commonality of these three ways is the creation of geomet-rical representations of a hierarchy’s nodes — the visualization artifacts. In general,the hierarchically ordered nodes, represented by those artifacts, contain additional in-formation dimensions. Using various visual variables, e.g., size, color or position (adetailed overview can be found in [2]), as a basis for the visualization artifacts the pos-sibility to encode these additional dimensions is given.
For example, a file-system visualized by a simple Treemap algorithm (Slice’n DiceTreemap [11]) containing folders and files (shortcuts are not included due to the de-struction of the basic tree structure), represents the hierarchical data with files as leafsand folders, that can recursively contain folders and files, as nodes. In addition tothe hierarchical parent-child relationship information of files and directories meta in-formation for both types about the label, creator or editing authors and permissiondetails are attached, as well as specific information for leaf nodes (files), e.g., size ortype-specifier. The aforementioned Slice’n Dice Treemap algorithm partitions a given
Fall Retreat 0-1Fall Workshop 2012 157
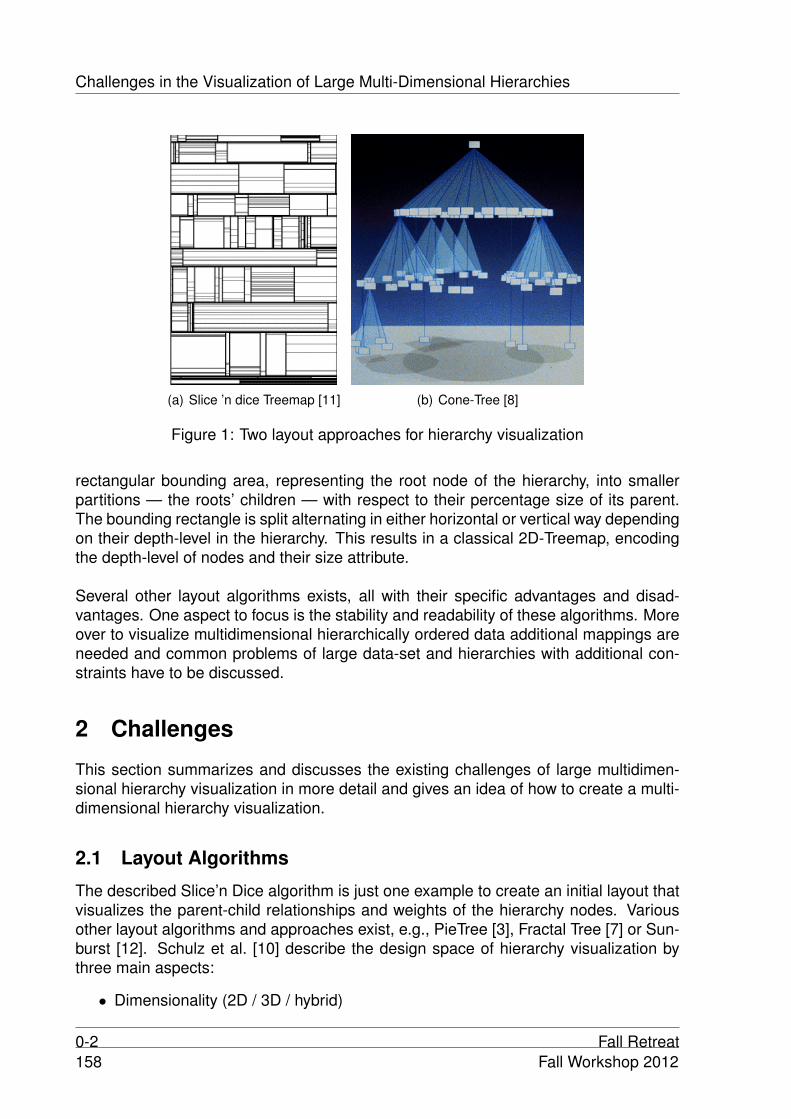
Challenges in the Visualization of Large Multi-Dimensional Hierarchies
(a) Slice ’n dice Treemap [11] (b) Cone-Tree [8]
Figure 1: Two layout approaches for hierarchy visualization
rectangular bounding area, representing the root node of the hierarchy, into smallerpartitions — the roots’ children — with respect to their percentage size of its parent.The bounding rectangle is split alternating in either horizontal or vertical way dependingon their depth-level in the hierarchy. This results in a classical 2D-Treemap, encodingthe depth-level of nodes and their size attribute.
Several other layout algorithms exists, all with their specific advantages and disad-vantages. One aspect to focus is the stability and readability of these algorithms. Moreover to visualize multidimensional hierarchically ordered data additional mappings areneeded and common problems of large data-set and hierarchies with additional con-straints have to be discussed.
2 Challenges
This section summarizes and discusses the existing challenges of large multidimen-sional hierarchy visualization in more detail and gives an idea of how to create a multi-dimensional hierarchy visualization.
2.1 Layout Algorithms
The described Slice’n Dice algorithm is just one example to create an initial layout thatvisualizes the parent-child relationships and weights of the hierarchy nodes. Variousother layout algorithms and approaches exist, e.g., PieTree [3], Fractal Tree [7] or Sun-burst [12]. Schulz et al. [10] describe the design space of hierarchy visualization bythree main aspects:
• Dimensionality (2D / 3D / hybrid)
0-2 Fall Retreat158 Fall Workshop 2012

2 CHALLENGES
(a) Software System Files at Revision x (b) Software System Files at Revision x+n
Figure 2: Visual effect of time-dependent changes in the underlying data attributes
• Edge Representation (explicit / implicit / hybrid)
• Node Alignment (radial / axis-parallel / free)
For Example: The aforementioned Slice’n Dice algorithm of Johnson and Shneidermanis a 2D (dimensionality), axis-parallel (node alignment) layout with an implicit edge rep-resentation (Figure 1(a)), whereas the Cone-Tree [8] of Robertson et al. is a 3D, radiallayout, which visualizes its edges explicitly (Figure 1(b)).
This huge variation of algorithms that are used to create an initial layout brings upthe question of comparability with respect to the users needs. For it, there are twomain properties of layout algorithms:
2.1.1 Readability
The readability describes the cognitive effort of a user to create a mental model ofthe underlying hierarchical relationship and their attributes. It involves the ability tocompare items’ attributes with each other. The aforementioned Slice’n Dice algorithmfor example, has a bad readability for item size comparison because of its alternatingchange of the slice-axis in horizontal and vertical way. In it, it is possible to create itemswith equal area size but totally different aspect ratios.
2.1.2 Stability
The degree of stability of a layout algorithm is determined by its visual change due tochanges in the hierarchy and the nodes’ attributes. If small changes in the hierarchy,e.g., adding or removing a node, have a large effect on the visual appearance of theresulting visualization one speaks off instable layouts. This property gets important in
Fall Retreat 0-3Fall Workshop 2012 159
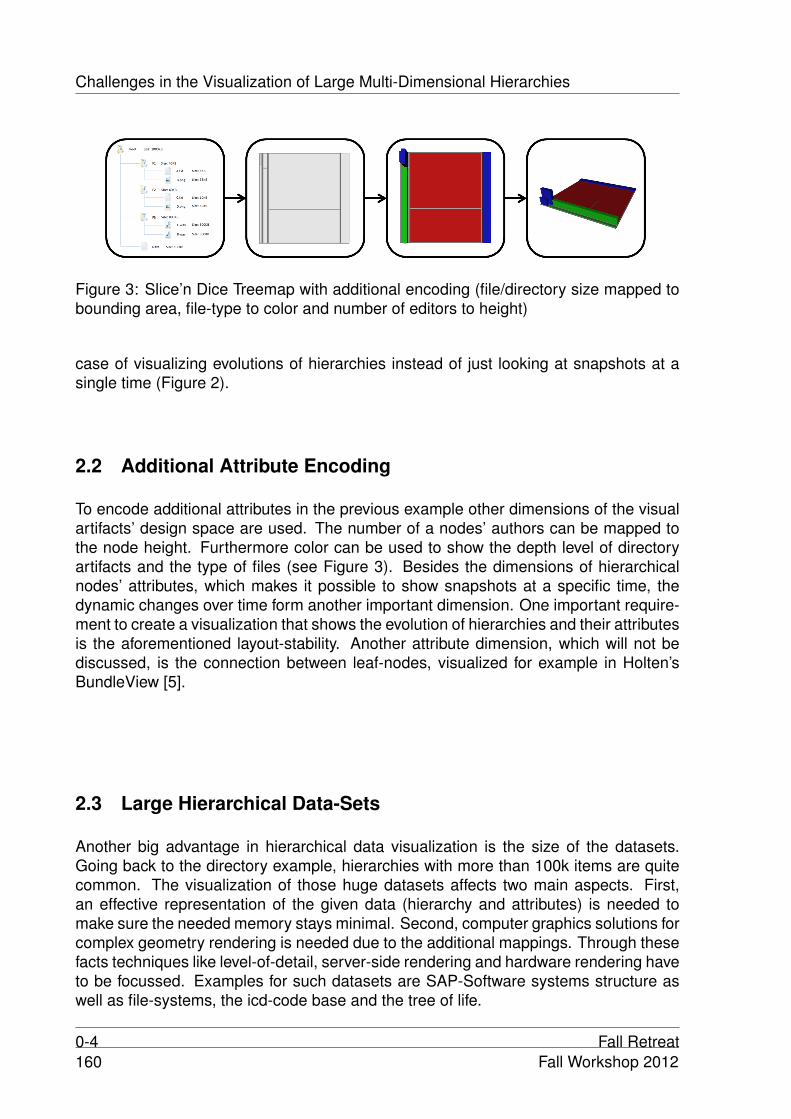
Challenges in the Visualization of Large Multi-Dimensional Hierarchies
Figure 3: Slice’n Dice Treemap with additional encoding (file/directory size mapped tobounding area, file-type to color and number of editors to height)
case of visualizing evolutions of hierarchies instead of just looking at snapshots at asingle time (Figure 2).
2.2 Additional Attribute Encoding
To encode additional attributes in the previous example other dimensions of the visualartifacts’ design space are used. The number of a nodes’ authors can be mapped tothe node height. Furthermore color can be used to show the depth level of directoryartifacts and the type of files (see Figure 3). Besides the dimensions of hierarchicalnodes’ attributes, which makes it possible to show snapshots at a specific time, thedynamic changes over time form another important dimension. One important require-ment to create a visualization that shows the evolution of hierarchies and their attributesis the aforementioned layout-stability. Another attribute dimension, which will not bediscussed, is the connection between leaf-nodes, visualized for example in Holten’sBundleView [5].
2.3 Large Hierarchical Data-Sets
Another big advantage in hierarchical data visualization is the size of the datasets.Going back to the directory example, hierarchies with more than 100k items are quitecommon. The visualization of those huge datasets affects two main aspects. First,an effective representation of the given data (hierarchy and attributes) is needed tomake sure the needed memory stays minimal. Second, computer graphics solutions forcomplex geometry rendering is needed due to the additional mappings. Through thesefacts techniques like level-of-detail, server-side rendering and hardware rendering haveto be focussed. Examples for such datasets are SAP-Software systems structure aswell as file-systems, the icd-code base and the tree of life.
0-4 Fall Retreat160 Fall Workshop 2012
4 APPROACHES
2.4 Constraints in Hierarchies
The last aspect to focus on are hierarchies that are constrained in a several way. Goingback to the SAP-Software System example, the given hierarchy is represented by thestructure packages as group nodes and development objects as leaf nodes. Besidesthat, there are 2 other hierarchies that work as constraints and should be able to bedisplayed in a visualization — the maintenance component hierarchy and the appli-cation component hierarchy. They are logical hierarchical representations created bygrouping elements of the structure package hierarchy, which can originate from dif-ferent levels and parents. These constraints, that do not effect the structure packagehierarchy itself but the positioning of their nodes require an extra handling.
3 Related Work
Schulz et al. give a good overview about hierarchical visualization [9]. The huge vari-ety of visualization listed there shows two things. The visualization techniques do notdiffer a lot for the last decade and there are still no visualizations that handle all of theaforementioned challenges. One of the main problems is that visualizations are oftentoo static to bring a solution for these complex problems. For it, the use of hybrid ap-proaches is a good entry point.
Steinbruckner and Lewerentz introduced a metaphor-based method to create a stablehierarchy visualization with additional informations about the hierarchies evolution [13].A road network created by using a fractal algorithm is created that represents the hi-erarchy nodes. Leafs are mapped onto building located on the side of their road (par-ent node). The elevation buildings standing on represents a node’s age in the graph.Nodes that are removed or moved in the hierarchy are painted with a low alpha valuewhile the rest of the items has color mapping.
Balzer and Deussen present another approach to create hierarchy visualization witha higher stability — Voronoi treemaps [1]. They use Voronoi diagrams as bases forthe recursive layout algorithm. A random point set, representing the nodes children, isinitally used to create a Voronoi diagram. After that the centroid of the created cells arecalculated and used as new sites. The Voronoi diagram is iteratively calculated untila threshold of movement for these new calculate centroid sites is reached. Severalother publications improve the calculation time by using either hardware accelaration,parallel processing or totally different algorithms like [14], [4]or [6].
4 Approaches
To create visualizations with higher layout stability the use of Voronoi diagrams or theirgeneralization — power diagram — is a well proved way. However no 3D visualizationsbased on Voronoi diagrams are published yet. One of the main problems in existing
Fall Retreat 0-5Fall Workshop 2012 161
Challenges in the Visualization of Large Multi-Dimensional Hierarchies
approaches is the start with a random point set as basis for the layout and through itthe need for an iterative calculation of it until a defined stability threshold is reached.By using an algorithm that creates a unique pointset to a given polygon this will be notneeded anymore.
For the visualization of constrained hierarchies only explicit edge representations areuseful. The use of implicit edge representation would result in recursive partitioning ofa given parent space. Through it, the rearrangement of nodes from different parents asgroup become impossible without destroying the readability of the basic hierarchy. Tohandle this, a layout algorithm, similar to the one Steinbruckner and Lewerentz used,but with configurable curves as group nodes is one possible solution. Users then canget an idea of the hierarchy by viewing the structural road network and deform the visu-alized roads to make the relations or constraints clear by creating regional groups. An-other more automatically way to create the regional groups is to use a force metaphor,similar to the dust and magnet visualization technique for multi-variate data [15]. Thecomputation of the constraint regions can then be done by mapping a gravity forcevalue onto the distance of a node to a specified region.
The challenge of rendering high complex 3d scenes with simple items, e.g., boxes inTreemaps, polygons in Voronoi-Treemaps, can be solved by an approach we submittedat the GRAPP conference. For it, we use a geometry shader, that handles the creationof simple shapes (triangle strips), with its desired shape attributes as input values (size/ height). This approach also comes with another advantage, the representation of thecomplex scenes can be simplified to point plus attribute representations to decreasethe needed memory and through it makes it possible to visualize millions of items.
5 Next Steps
As next steps I’m planning to prototypical implement the aforementioned aspects withprimary focus on stable layouting, constraints in hierarchies and configurability of lay-outs. After that I want to focus more on interaction topics in 2.5D or 3D Voronoitreemaps like rearrangement of nodes and testing focus and content techniques init. Furthermore the use of other visual variables like shape or texture has not beenfocused on yet.
6 Further Activities
In the last semester I co-organized the seminar for software visualization and analy-sis. There I supervised a student working on an image-based approach for Treemap-comparison to identify and visualize changes in multiple Treemap layouts generatedfrom snapshots of a hierarchy at different evolution steps. More over I was teaching as-sistant in the “Visualization” lecture. Furthermore I’m taking part of the SAP InnovationCenter / HPI Cooperation for Software Visualization. The main goal in it, is to create
0-6 Fall Retreat162 Fall Workshop 2012
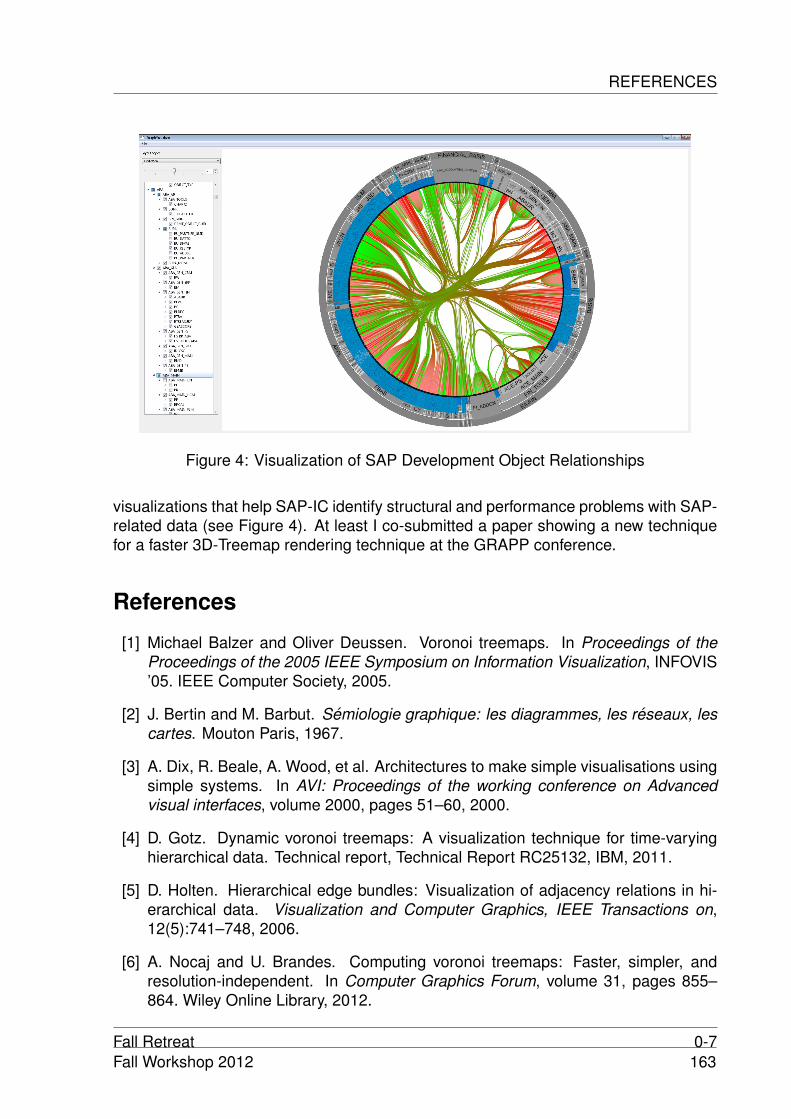
REFERENCES
Figure 4: Visualization of SAP Development Object Relationships
visualizations that help SAP-IC identify structural and performance problems with SAP-related data (see Figure 4). At least I co-submitted a paper showing a new techniquefor a faster 3D-Treemap rendering technique at the GRAPP conference.
References
[1] Michael Balzer and Oliver Deussen. Voronoi treemaps. In Proceedings of theProceedings of the 2005 IEEE Symposium on Information Visualization, INFOVIS’05. IEEE Computer Society, 2005.
[2] J. Bertin and M. Barbut. Semiologie graphique: les diagrammes, les reseaux, lescartes. Mouton Paris, 1967.
[3] A. Dix, R. Beale, A. Wood, et al. Architectures to make simple visualisations usingsimple systems. In AVI: Proceedings of the working conference on Advancedvisual interfaces, volume 2000, pages 51–60, 2000.
[4] D. Gotz. Dynamic voronoi treemaps: A visualization technique for time-varyinghierarchical data. Technical report, Technical Report RC25132, IBM, 2011.
[5] D. Holten. Hierarchical edge bundles: Visualization of adjacency relations in hi-erarchical data. Visualization and Computer Graphics, IEEE Transactions on,12(5):741–748, 2006.
[6] A. Nocaj and U. Brandes. Computing voronoi treemaps: Faster, simpler, andresolution-independent. In Computer Graphics Forum, volume 31, pages 855–864. Wiley Online Library, 2012.
Fall Retreat 0-7Fall Workshop 2012 163

Challenges in the Visualization of Large Multi-Dimensional Hierarchies
[7] T.J. Ong, J.J. Leggett, and U. Yun. Visualizing hierarchies and collection struc-tures with fractal trees. In Computer Science, 2005. ENC 2005. Sixth MexicanInternational Conference on, pages 31–40. IEEE, 2005.
[8] G.G. Robertson, J.D. Mackinlay, and S.K. Card. Cone trees: animated 3d visu-alizations of hierarchical information. In Proceedings of the SIGCHI conferenceon Human factors in computing systems: Reaching through technology, pages189–194. ACM, 1991.
[9] H.J. Schulz. Treevis. net: A tree visualization reference. Computer Graphics andApplications, IEEE, 31(6):11–15, 2011.
[10] H.J. Schulz, S. Hadlak, and H. Schumann. The design space of implicit hierarchyvisualization: A survey. Visualization and Computer Graphics, IEEE Transactionson, 17(4):393–411, 2011.
[11] B. Shneiderman. Tree visualization with tree-maps: 2-d space-filling approach.ACM Transactions on graphics (TOG), 11(1):92–99, 1992.
[12] J. Stasko and E. Zhang. Focus+ context display and navigation techniques for en-hancing radial, space-filling hierarchy visualizations. In Information Visualization,2000. InfoVis 2000. IEEE Symposium on, pages 57–65. IEEE, 2000.
[13] F. Steinbruckner and C. Lewerentz. Representing development history in softwarecities. In Proceedings of the 5th international symposium on Software visualiza-tion, pages 193–202. ACM, 2010.
[14] A. Sud, D. Fisher, and H.P. Lee. Fast dynamic voronoi treemaps. In VoronoiDiagrams in Science and Engineering (ISVD), 2010 International Symposium on,pages 85–94. IEEE, 2010.
[15] J.S. Yi, R. Melton, J. Stasko, and J.A. Jacko. Dust & magnet: multivariate informa-tion visualization using a magnet metaphor. Information Visualization, 4(4):239–256, 2005.
0-8 Fall Retreat164 Fall Workshop 2012
Memory Management in a Many-CoreDistributed Hypervisor
Jan-Arne Sobania
Operating Systems and MiddlewareHasso-Plattner-Institut
Computer architecture for mainstream desktop and server machines is changing.What began with single-core machines and is mostly multi-core today will be many-core in the future – much more processor cores, and consequentially overall differentsystem architecture and interconnect. This provides challenges for designers and en-gineers to provide backwards compatibility for existing software on modern machines:hardware may no longer provide features, like cache coherency, programmers havebeen accustomed to and software relies on. This report proposes a solution in form ofvirtualization layer, consisting of distributed hypervisors, to provide those features thereal machines lack, thus allowing coexistence of old and new applications on modernplatforms.
1 Introduction
Due to advancements in processor manufacturing processes over the last years, theclassic architecture of “mainstream” computers – especially, those based on the Intel32-bit architecture and its descendants – is changing. What first started with the single-processor 8086 as the IBM PC is now one of the most successful architectures in themarket, ranging from small laptops to mid- and high-end servers. All these systemsare multi-core machines today, following the well-known shared-memory symmetricmulti-processing (SMP) model.
However, SMP has its drawbacks. With an increasing number of cores, inter-corecommunication overhead increases as well. If each core needs to communicate witheach other, for example to maintain cache coherency (a necessary prerequisite forSMP operation), it places a natural limit on how many cores can be integrated. Eventhough these limits can be increased by using well-known techniques from cluster ma-chines [12] – like directory nodes to restrict the set of cores that need to receive cache-related messages – this merely delays the problem. Therefore, researchers are strivingfor other architectures to build future many-core chips; processors with far higher num-bers of cores than today’s, and a potentially very different system and interconnectarchitecture.
An example of a potential prototype for such an architecture is the Intel Single-chip Cloud Computer (SCC) [5], a 48-core research processor developed at Intel LabsBraunschweig, Germany. Even though individual cores still use the well-known x86 in-struction set and can execute a standard operating system like Linux, the chip does not
Fall Workshop 2012 165
Memory Management in a Many-Core Distributed Hypervisor
support an SMP OS (like a single standard Linux kernel instance running concurrentlyon more than one core) due to missing cache coherency.
A different architecture also poses different problems, though: there is much ex-isting software for x86-based systems, and new architectures would need to be ableto execute it to be successful in the market. If the hardware does not offer featuresrequired by old applications, these would need to be added in software. We proposeto use virtualization to transparently add such features to the platform.
The report is organized as follows: section 2 presents a model of the potentialfuture many-core processor we want to virtualize. Section 3 discussed how basic SMPemulation via a hypervisor can be achieved. Section 4 details memory managementnecessary for such a hypervisor. Section 5 discusses related work, and section 6concludes the report.
2 System Model
Before we can go into details on the architecture of a hypervisor for upcoming many-core architectures, it is necessary to describe its underlying system first. Our model fornew many-core architectures is based on the following principles:
1. All processors are identical in computation capabilities. That is, they support thesame instruction set and the same set of features in the processor architecture(e.g., pipeline stages, caches, model-specific registers and so on).
2. Processors are grouped into multi-core islands. A single multi-core islands re-sembles a traditional symmetric multi-processing (SMP) chip with all requiredinternal communication, like for cache coherency and inter-processor interrupts.
3. All islands form nodes on an on-chip network, over which all external communi-cation is carried out. The network is formed of message routers. We model alllinks as having infinite bandwidth and no congestion. Messages use fixed routesonly, and router latency is finite and constant.
4. Multi-core islands do not communicate with each other, unless explicitly requestedby software running on them. Specifically, if processors from different islands ex-change messages, other islands that happen to be connected to network routerson that path do not take note of the other communication, and are not affected byit in any way.
5. A restricted form of backwards compatibility is designed into the system. If thenetwork and routers are configured appropriately, arbitrary software (including anoperating system kernel) running on the new machine behaves as it did on thepredecessors, as long as it runs on only a single multi-core island. The onlynotable difference could be timing of memory accesses, because these couldtarget memory connected to different message routers.
166 Fall Workshop 2012
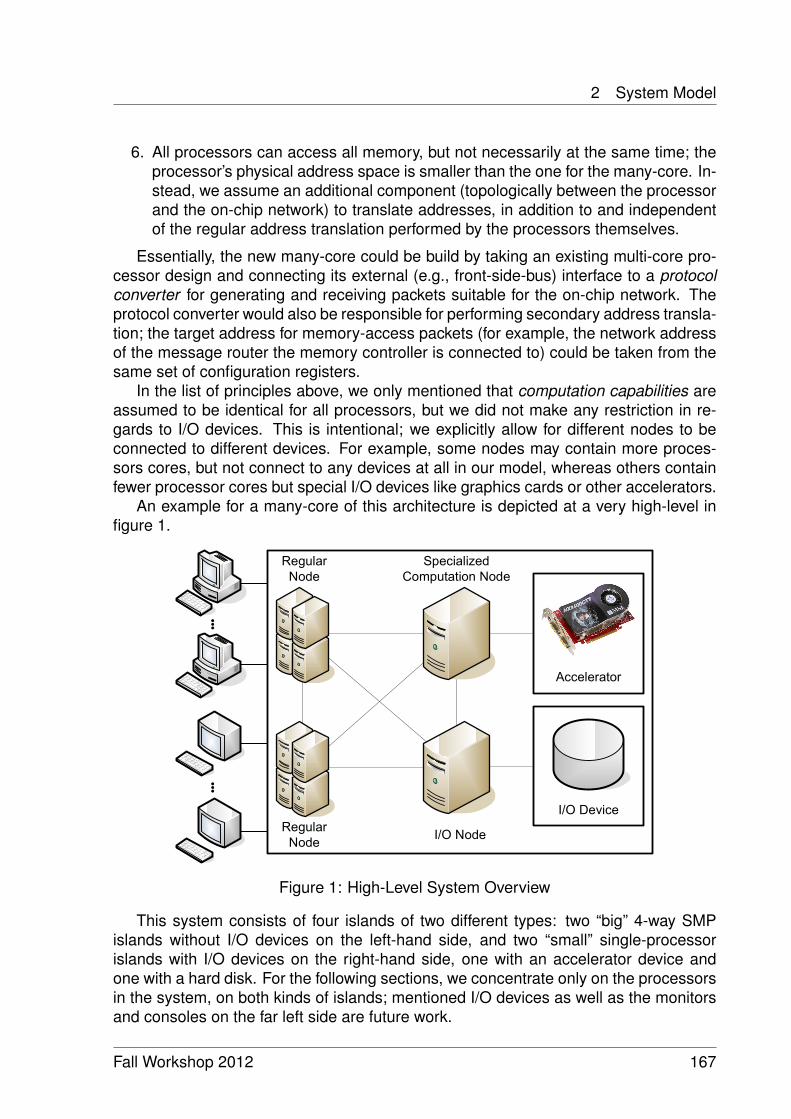
2 System Model
6. All processors can access all memory, but not necessarily at the same time; theprocessor’s physical address space is smaller than the one for the many-core. In-stead, we assume an additional component (topologically between the processorand the on-chip network) to translate addresses, in addition to and independentof the regular address translation performed by the processors themselves.
Essentially, the new many-core could be build by taking an existing multi-core pro-cessor design and connecting its external (e.g., front-side-bus) interface to a protocolconverter for generating and receiving packets suitable for the on-chip network. Theprotocol converter would also be responsible for performing secondary address transla-tion; the target address for memory-access packets (for example, the network addressof the message router the memory controller is connected to) could be taken from thesame set of configuration registers.
In the list of principles above, we only mentioned that computation capabilities areassumed to be identical for all processors, but we did not make any restriction in re-gards to I/O devices. This is intentional; we explicitly allow for different nodes to beconnected to different devices. For example, some nodes may contain more proces-sors cores, but not connect to any devices at all in our model, whereas others containfewer processor cores but special I/O devices like graphics cards or other accelerators.
An example for a many-core of this architecture is depicted at a very high-level infigure 1.
���������
���� �����
�����������������
��������
���� ���
����
���� ���
����
�� ������
Figure 1: High-Level System Overview
This system consists of four islands of two different types: two “big” 4-way SMPislands without I/O devices on the left-hand side, and two “small” single-processorislands with I/O devices on the right-hand side, one with an accelerator device andone with a hard disk. For the following sections, we concentrate only on the processorsin the system, on both kinds of islands; mentioned I/O devices as well as the monitorsand consoles on the far left side are future work.
Fall Workshop 2012 167

Memory Management in a Many-Core Distributed Hypervisor
3 SMP-Emulation via Virtualization
When faced with a many-core system as discussed above, the question of how to writecorresponding software arises. One possibility would be to treat the many-core asa collection of independent processors (i.e., a “cluster-on-a-chip”) and use establishedprogramming techniques for such an environment; for example, sockets (over emulatedon-chip Ethernet links) or the Message Passing Interface (possibly over an optimizedprocessor-specific communication mechanism).
However, cluster programming has a set of drawbacks, especially for the area of“mainstream computing” – PCs or compatible systems based on the Intel 32-bit ar-chitecture (known as IA32) and its extension to 64-bit. These architectures dominatethe desktop as well as the entry- to mid-level server markets, support a large baseof existing programs and developers, and have a long-standing tradition of backwardscompatibility. “Traditional” x86-based systems all follow the symmetric multi-processing(SMP) model with shared memory, which programmers for these platforms have alsobeen accustomed to, but unfortunately there is no straight-forward way of porting pro-grams between the two models. Therefore, a future many-core which does not supportthe SMP model would be likely to fail in this market, as bringing existing programs tothe new architecture would require a complete rewrite; given the huge amount of timeand money that went into the development of the old programs, this does not seem tobe an option for most developers.
As a solution to this dilemma, we use a virtualization layer on the new many-coreto emulate a traditional SMP system. This way, the new system can not only executeapplications written for the old architecture – which would also be possible by using asingle-system image (SSI) operating system known from traditional cluster computing– but an entire SMP operating system as well. This also allows for applications thathave dependencies on operating system implementation details to make use of thenew architecture, something which may not be easily possible by just re-implementingoperating system functions.
For virtualization, one can distinguish two broad architectures: the control program(or virtual machine monitor (VMM), as it is commonly called today) can either run as thelowest-level system software, directly on the hardware (“bare-metal” or Type 1 VMM),or as a regular application on top of an underlying operating system (“hosted VMM”or Type 2 VMM). We chose the hosted approach for our system, which we named“RockyVisor”. The resulting architecture is depicted in figure 2. The term “hypervisor”is used as a synonym for “virtual machine monitor” in this work.
All processors (or, more general: multi-core islands) run within their own privatememory space – therefore resembling our model of a future many-core system above– and run a base operating system called the Level 1 Operating System (LV1). WithinLV1, the hypervisor container runs as a regular application (Type 2 VMM). The set ofhypervisor processes then provide a virtual machine, with virtual CPUs running insidea shared memory block and executing the guest operating system, which we call theLevel 2 Operating System (LV2). LV2 is a regular SMP OS like Linux that can then runarbitrary SMP applications.
168 Fall Workshop 2012
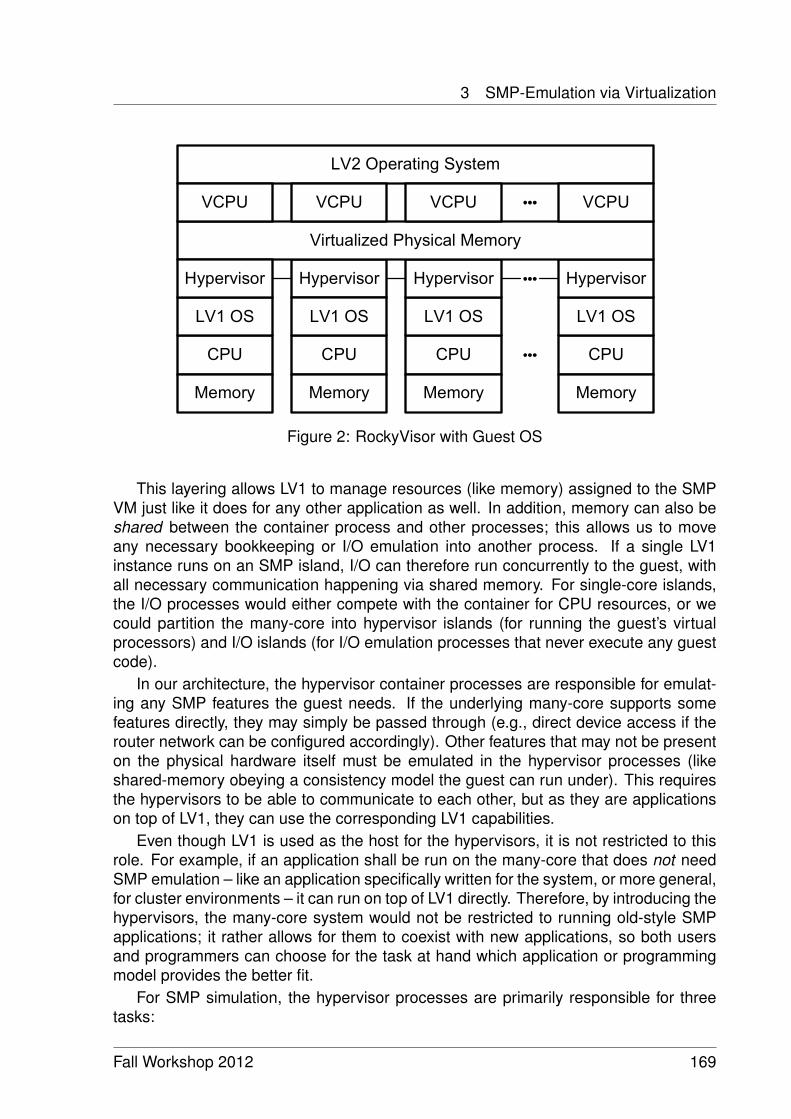
3 SMP-Emulation via Virtualization
��� ��� ��� ���
����� ����� �����
�� ������ �� ������ �� ������
��������� ������������ ����
������ ���������� �
���� ���� ���� ����
� ���� � ���� � ����
�� ������
�����
� ����
Figure 2: RockyVisor with Guest OS
This layering allows LV1 to manage resources (like memory) assigned to the SMPVM just like it does for any other application as well. In addition, memory can also beshared between the container process and other processes; this allows us to moveany necessary bookkeeping or I/O emulation into another process. If a single LV1instance runs on an SMP island, I/O can therefore run concurrently to the guest, withall necessary communication happening via shared memory. For single-core islands,the I/O processes would either compete with the container for CPU resources, or wecould partition the many-core into hypervisor islands (for running the guest’s virtualprocessors) and I/O islands (for I/O emulation processes that never execute any guestcode).
In our architecture, the hypervisor container processes are responsible for emulat-ing any SMP features the guest needs. If the underlying many-core supports somefeatures directly, they may simply be passed through (e.g., direct device access if therouter network can be configured accordingly). Other features that may not be presenton the physical hardware itself must be emulated in the hypervisor processes (likeshared-memory obeying a consistency model the guest can run under). This requiresthe hypervisors to be able to communicate to each other, but as they are applicationson top of LV1, they can use the corresponding LV1 capabilities.
Even though LV1 is used as the host for the hypervisors, it is not restricted to thisrole. For example, if an application shall be run on the many-core that does not needSMP emulation – like an application specifically written for the system, or more general,for cluster environments – it can run on top of LV1 directly. Therefore, by introducing thehypervisors, the many-core system would not be restricted to running old-style SMPapplications; it rather allows for them to coexist with new applications, so both usersand programmers can choose for the task at hand which application or programmingmodel provides the better fit.
For SMP simulation, the hypervisor processes are primarily responsible for threetasks:
Fall Workshop 2012 169

Memory Management in a Many-Core Distributed Hypervisor
• CPU core virtualization, for running guest code inside the virtual machine. Thiscan be implemented like processor virtualization on traditional systems; e.g., viatrap-and-emulate (if the cores support it), binary translation, or para-virtualization.
• SMP interconnect simulation, so the virtual CPUs effectively appear as in a nor-mal SMP system. Since the many-core does not support all necessary featuresdirectly, the hypervisors must intervene and emulate them. For this, certain hard-ware features (like, for example second-level address translation like Intel’s En-hanced Page Tables (EPT) [6, 7], or AMD’s Nested Page Tables [1]) can also beused to reduce runtime overhead.
• Device I/O redirection. In the most simple model, the many-core’s network canbe configured such that devices are accessible from all cores, and the virtual ma-chine can access them directly. If this is not possible (because, for example, a de-vice’s DMA operations would interfere with the memory management performedby the hypervisors), I/O can be intercepted by the hypervisors and redirected toan appropriate emulation process on one of the participating LV1 instances.
For the current report, we concentrate on memory management. This mainly re-lates to the first (page table manipulation, which interacts with MMU virtualization) andsecond category (for the memory consistency model).
4 Memory Management in the Hypervisor
4.1 Memory Consistency Model
The memory consistency model of an x86-SMP is not formally defined in the proces-sor manual [6, 7]. Instead, it is described in informal prose, as the result of severalinteracting settings and mechanisms from the processor core and support hardware– like memory caching attributes, cache organization, write-combining buffers, instruc-tion reordering and so on. Owens et al. have interpreted the descriptions from themanuals and constructed a formal model, which was later refined by the same authorsto better match the behavior of real processors [11]. However, we did not base thememory consistency model implemented by our hypervisor on their work; we use thenatural consistency of the underlying hardware instead, where possible, and simplesequential consistency [9] otherwise, for reasons outlined below.
By construction of our many-core, each multi-core island already fulfills a memoryconsistency model considered “correct” for the guest operating system; this is guar-anteed by the backwards compatibility property mentioned above. Therefore, whenrunning multiple hypervisor processes on one multi-core island, each of them provid-ing one virtual processor to the guest, and each virtual processor having mapped aparticular page, the guest also behaves correctly: the hypervisors are not involvedin any memory access after page tables have been set up, and the processors justperform regular memory accesses under their “native” consistency model. For thesecases, a formal treatment is not necessary.
170 Fall Workshop 2012
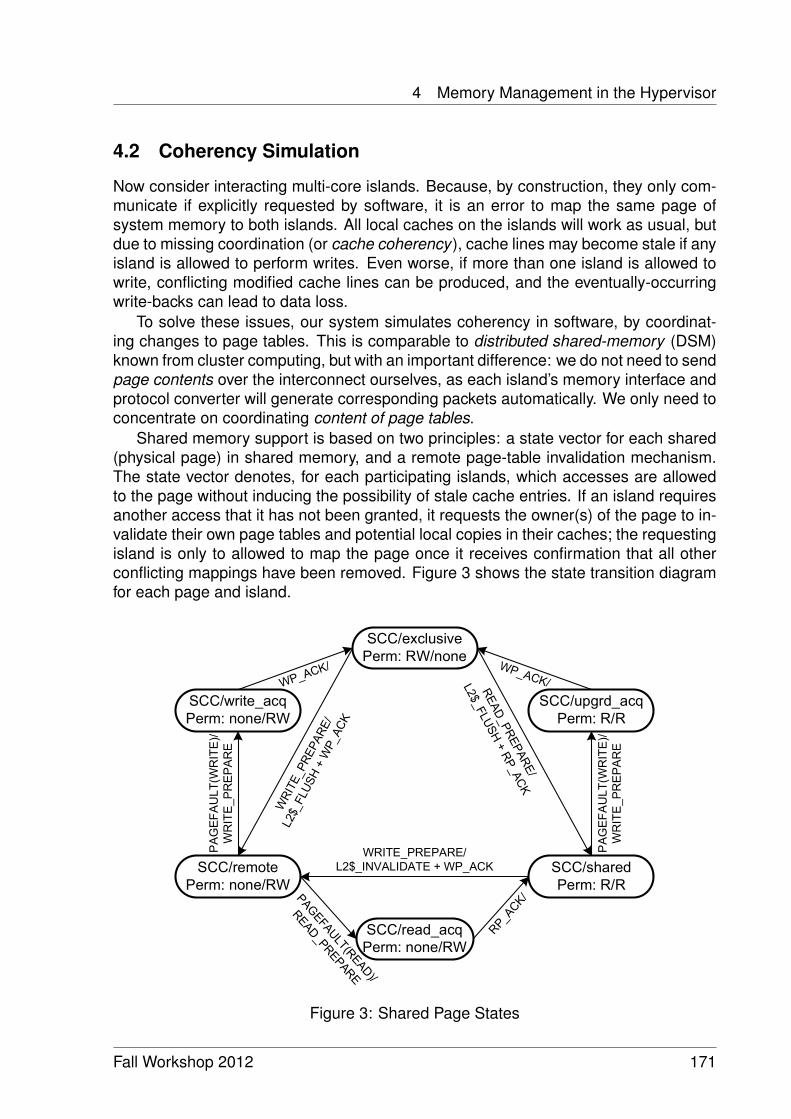
4 Memory Management in the Hypervisor
4.2 Coherency Simulation
Now consider interacting multi-core islands. Because, by construction, they only com-municate if explicitly requested by software, it is an error to map the same page ofsystem memory to both islands. All local caches on the islands will work as usual, butdue to missing coordination (or cache coherency ), cache lines may become stale if anyisland is allowed to perform writes. Even worse, if more than one island is allowed towrite, conflicting modified cache lines can be produced, and the eventually-occurringwrite-backs can lead to data loss.
To solve these issues, our system simulates coherency in software, by coordinat-ing changes to page tables. This is comparable to distributed shared-memory (DSM)known from cluster computing, but with an important difference: we do not need to sendpage contents over the interconnect ourselves, as each island’s memory interface andprotocol converter will generate corresponding packets automatically. We only need toconcentrate on coordinating content of page tables.
Shared memory support is based on two principles: a state vector for each shared(physical page) in shared memory, and a remote page-table invalidation mechanism.The state vector denotes, for each participating islands, which accesses are allowedto the page without inducing the possibility of stale cache entries. If an island requiresanother access that it has not been granted, it requests the owner(s) of the page to in-validate their own page tables and potential local copies in their caches; the requestingisland is only to allowed to map the page once it receives confirmation that all otherconflicting mappings have been removed. Figure 3 shows the state transition diagramfor each page and island.
������������� ����������
������ ���� ������
���� ������� ����������
�������������
���� �!�"�#������$
��%&����������
���� �!�"�#������$
���� ������'�� ����������
��%&��������������%()��%��&��#������$
��*� �!
�&+����
,�
����
�������
�
�����$�
�����-. ����'�� ������
��*� �!�&+�
�%&�,�
��%&���������
�����$�
����/ �����'�� ����������
��*� �!�&+�
�%&�,�
��%&���������
�����
$�
Figure 3: Shared Page States
Fall Workshop 2012 171
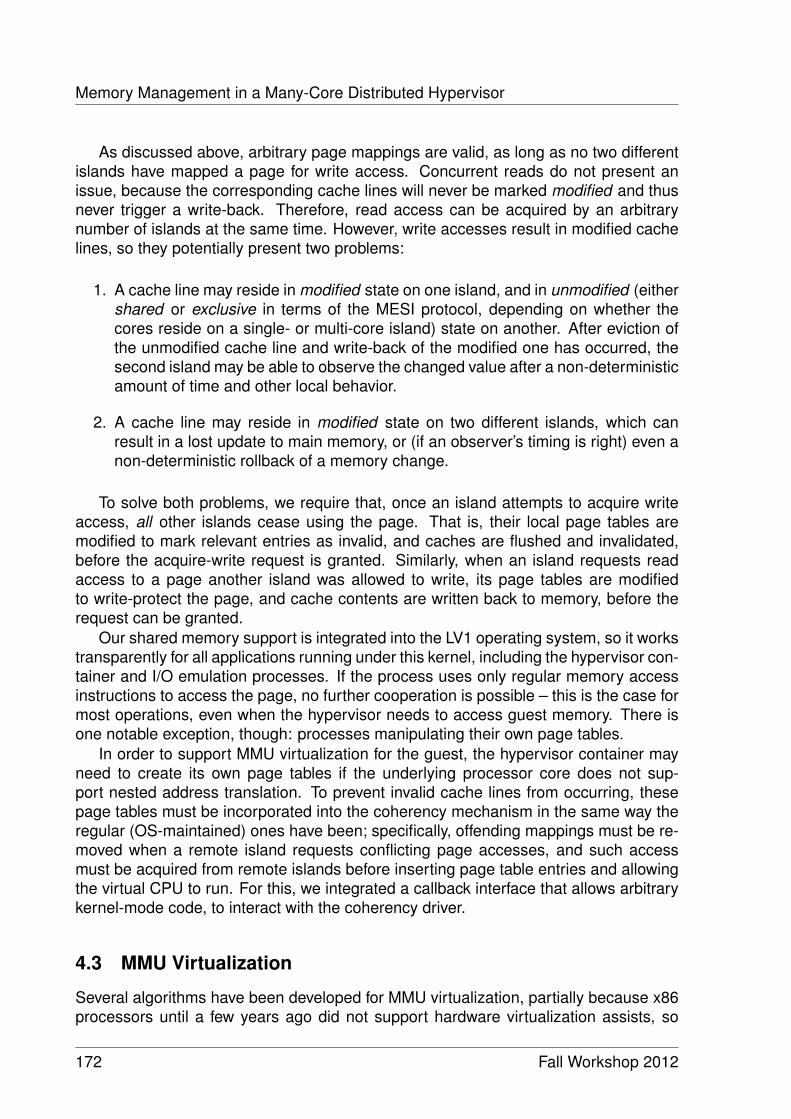
Memory Management in a Many-Core Distributed Hypervisor
As discussed above, arbitrary page mappings are valid, as long as no two differentislands have mapped a page for write access. Concurrent reads do not present anissue, because the corresponding cache lines will never be marked modified and thusnever trigger a write-back. Therefore, read access can be acquired by an arbitrarynumber of islands at the same time. However, write accesses result in modified cachelines, so they potentially present two problems:
1. A cache line may reside in modified state on one island, and in unmodified (eithershared or exclusive in terms of the MESI protocol, depending on whether thecores reside on a single- or multi-core island) state on another. After eviction ofthe unmodified cache line and write-back of the modified one has occurred, thesecond island may be able to observe the changed value after a non-deterministicamount of time and other local behavior.
2. A cache line may reside in modified state on two different islands, which canresult in a lost update to main memory, or (if an observer’s timing is right) even anon-deterministic rollback of a memory change.
To solve both problems, we require that, once an island attempts to acquire writeaccess, all other islands cease using the page. That is, their local page tables aremodified to mark relevant entries as invalid, and caches are flushed and invalidated,before the acquire-write request is granted. Similarly, when an island requests readaccess to a page another island was allowed to write, its page tables are modifiedto write-protect the page, and cache contents are written back to memory, before therequest can be granted.
Our shared memory support is integrated into the LV1 operating system, so it workstransparently for all applications running under this kernel, including the hypervisor con-tainer and I/O emulation processes. If the process uses only regular memory accessinstructions to access the page, no further cooperation is possible – this is the case formost operations, even when the hypervisor needs to access guest memory. There isone notable exception, though: processes manipulating their own page tables.
In order to support MMU virtualization for the guest, the hypervisor container mayneed to create its own page tables if the underlying processor core does not sup-port nested address translation. To prevent invalid cache lines from occurring, thesepage tables must be incorporated into the coherency mechanism in the same way theregular (OS-maintained) ones have been; specifically, offending mappings must be re-moved when a remote island requests conflicting page accesses, and such accessmust be acquired from remote islands before inserting page table entries and allowingthe virtual CPU to run. For this, we integrated a callback interface that allows arbitrarykernel-mode code, to interact with the coherency driver.
4.3 MMU Virtualization
Several algorithms have been developed for MMU virtualization, partially because x86processors until a few years ago did not support hardware virtualization assists, so
172 Fall Workshop 2012
4 Memory Management in the Hypervisor
also did not provide nested paging. The purpose of these algorithms is to map a two-level page translation scheme to the one level the hardware supports natively. In thetwo-level scheme, the “outer” (lower) level represents the address translation of thehost (which runs the hypervisor as an application), whereas the “inner” (higher) levelrepresents the address translation of the guest. This two-level scheme is shown infigure 4.
�������������� ����������
������������� ����������
����������������
�������������� ��
���������������� ��
������������� ��
��������������� ��
���������������
���������������������
��������������
��������������������� �����
����
���
Figure 4: Two-Level Address Translation with TLBs
Each level of page tables has an associated (physical or virtual) Translation Looka-side Buffer (TLB). The physical TLB is controlled by the host, and must be invalidatedaccording to the processor manual; it is an incoherent cache for the real page tables.For example, on multi-core islands, if certain changes to page tables are made by onecore, but another core is referencing these page tables as well, it may have conflictinginformation in its TLB. Therefore, the operating systems must perform a TLB shoot-down whenever such a change is performed.
The need for TLB shootdowns lies in the processor architecture, so relevant codeis present in both the host and guest operating system – at least if the latter one is ableto run on non-virtualized machines as well. Our method for MMU virtualization, whichwill be discussed later, uses this to its advantage.
4.3.1 Classic MMU Virtualization Approaches
Of the several MMU virtualization approaches, the Emulated TLB algorithm is probablythe most simple one. As the name implies, it emulates the guest TLB, by changing thereal page tables as the guest runs. The virtual CPU starts with an empty (real) pagetable. When page fault occurs, the hypervisor interprets the guest’s page tables, and
Fall Workshop 2012 173

Memory Management in a Many-Core Distributed Hypervisor
constructs corresponding mappings as needed. When the guest switches to anotheraddress space, the real page table is cleared again; therefore mimicking the operationof a hardware TLB.
The main downside of the emulated TLB is a large number of “hidden” page faults:page faults that occur due to virtualization, not due to non-existent or restrictive pagetable entries installed by the guest. Hidden page faults constitute overhead, so ap-proaches for eliminating them have been proposed and implemented. We mention twoof them Shadow Page Tables, and the approach pioneered by XEN [2].
For Shadow Page Tables, the hypervisor saves a set of page tables, and fills themas needed from page faults. However, when the guest switches to another addressspace, the previous page table is not cleared. Instead, it is retained and can be reusedlater, if the guest decides to switch back to this address space. This saves hidden pagefaults, but has another major drawback: the guest may, now that its previous page tableis unused, make arbitrary changes to it without informing the hypervisor. Therefore, thecontents of the guest page table and corresponding shadow page table may run outof sync, unless the hypervisor recognizes such changes and reacts accordingly. TheVMware hypervisor uses a technique called “traces”: it marks guest pages containingpage table data as read only, so any write attempt by the guest will trigger a page fault.The page fault handler then recognizes that the fault is due to a page table change,and can take down the shadow page table if it still exists.
XEN [2], if running on hardware without virtualization support, uses a different ap-proach. If running under XEN, the guest needs to be aware of the real (machine)addresses of its pages, and it computes the outer page mapping itself. The guest OSthen simply installs the real machine address in its page tables; the hypervisor sim-ply needs to check that these addresses are in the desired range (thus preventing theguest from accessing memory it is not supposed to), but it can save on costly softwarepage table walks.
4.3.2 Our Approach: Cooperative Shadow Page Tables
For our many-core hypervisor, we use a different MMU virtualization scheme that isbased on shadow page tables. We call it “Cooperative Shadow Page Tables”, becauseit is based on the concept shortly described above, but also requires cooperation be-tween the hypervisor and guest.
Cooperative Shadow Page Tables also involves a set of cached real page tablesin the hypervisor, which are activated when the guest switches to the correspondingaddress space. However, invalidation of these caches is handled differently. Followingthe assumption that the guest is an SMP operating system, it is aware of the (G)TLBthat functions as an incoherent cache of its page tables. We now intercept the TLBflushes of the guest to know exactly when certain shadow page tables need to beinvalidated.
On a real machine, the guest would need to perform TLB shootdowns if it modifiedpage tables in certain ways. This involves a message (or, more specifically: an IPI) toall CPUs that use the page table. Because this may influence a potentially very largenumber of CPUs, and IPIs are relatively “expensive” runtime-wise, the corresponding
174 Fall Workshop 2012

5 Related Work
code paths in operating systems are highly optimized. No IPI is sent out unless ab-solutely necessary, which means for real machines the hardware is actively using thetarget page table; i.e., the corresponding address space is active.
In our approach, we now modify the notion of when an address space is consideredactive in our guest (LV2) OS. On regular machines, an address space is active if it isreferenced by the hardware; that is, if the hardware page-table walker can access it,because the page table base address is stored in the corresponding control register.Therefore, a context switch from A to B on processor X happens in three steps:
1. Mark address space B as in-use by processor X .
2. Store base address of address space B in control register.
3. Mark address space A as not in-use by processor X .
The mark operations are carried out in this order to prevent a possible race condi-tion: modifying the address space on another core between unmarking and changingthe base address. Therefore, up to two address spaces may be marked in-use by anyprocessor at any point in time.
For our guests, we perform steps 1 and 2 as usual, but omit step 3. Therefore, whena virtual CPU switches to a new address space, it is marked to be in-use on the targetprocessor, but the old address space still remains as being marked this way. This isthe desired operation, because the corresponding hypervisor may still have cached theshadow page table for the old address space.
If the address space is later changed in a way that would require a TLB flush, theTLB shootdown code examines the list of processors on which it is active, and informsthem to flush their cached mappings. Consequentially, in our architecture, the flushwould be executed on all processors that had the address space active somewherein the past. Therefore, all hypervisors are guaranteed to be informed whenever theshadow page tables need to be invalidated.
Up to now, changing address spaces works as on regular hypervisors, without any“cooperation” with the guest. The “cooperative” part of the approach’s name handles acertain subtle point: as of now, address spaces can only be marked active, but neverunmarked. Therefore, even if a hypervisor decided to delete a shadow page table, itwould still receive TLB flush IPIs. To prevent these unneeded IPIs from occurring, weinform the hypervisor, during the context switch, where the in-use marking area of theguest is located. Having this knowledge, a hypervisor can then perform unmarkingwhen it deletes the corresponding shadow page table. This eliminates any unwantedand unneeded flush IPIs, safe the ones occurring due to races between guest’s modi-fications and hypervisor page table deletes.
5 Related Work
Our RockyVisor is an extension of lguest [13], which has been developed by RustyRussel. It is a minimal, but fully-functional hypervisor that is included with the Linux
Fall Workshop 2012 175

Memory Management in a Many-Core Distributed Hypervisor
kernel. It supports para-virtualization only, so the guest kernel must be changed ac-cordingly; guest implementations exist for Linux and Plan 9. Unlike XEN [2] or KVM [8],lguest is meant as a platform for research and experimentation; specifically, lguest fa-vors readability of the hypervisor code over performance wherever possible.
vNUMA [3], developed by Matthew Chapman as part of his Ph.D. thesis, is a dis-tributed hypervisor for IA-64 processors that simulates an SMP system on networkedworkstations, using Gigabit Ethernet as node interconnect. NEX [15] by Xiao Wang etal. is a similar effort based on the open-source XEN hypervisor, but requires hardwareextensions for virtualization. Versatile SMP [14] by ScaleMP is a commercial prod-uct that claims to support up to 1024 processors (with up to 8192 cores) on standardcomputers, interconnected via Infiniband, in a virtual SMP system.
Finally, MetalSVM [10] is another project aiming at hypervisor-based SMP on theSCC. MetalSVM itself is a small operating system kernel, for which Jacek Galowiczhas ported the lguest driver and user-mode code as part of his B.Sc. thesis [4]. Itis therefore comparable to the RockyVisor, both being Type 2 VMMs that run on topof an underlying operating system. The main difference, at the time of writing, is thatthe RockyVisor is functional for 2-way SMP, whereas the MetalSVM virtualization layeronly supports single-processor guests, just like the lguest hypervisor.
6 Conclusion and Future Work
We have presented a model of a many-core processor that consists of smaller multi-and single-core islands, interconnected by an on-chip network. Whereas each indi-vidual processor core follows an established architecture (like IA-32) and can executeexisting software on its own, such software cannot run on the entire system, due tomissing hardware features like memory coherency.
To bridge this gap, we presented an architecture of a distributed hypervisor, namedRockyVisor, that can not only be used to run an application, but an entire shared-memory symmetric multi-processing (SMP) operating system on the system. Becausean operating system for the predecessor architecture now runs on the new many-coreprocessor, this also allows arbitrary applications to work on the new system. We haveshown details on memory management and virtualization of the processor’s memory-management unit in such a system, and outlined our cooperative shadow page tablemechanism, in which the hypervisor works together with the guest operating system tocoordinate views of processes’ address space across the many-core processor.
Our architecture also allows for a peaceful coexistence of applications written for theold and new machine. Existing applications do not need to be ported or re-written forthe new cluster-like environment, they can simply run unchanged in a virtual machine.Furthermore, because we use a hosted VMM approach, native applications can runside-by-side with older ones in the new environment.
A prototype of our hypervisor has been implemented on the Intel Single-chip CloudComputer (SCC) [5]. In its current state, the RockyVisor runs on two single-core tilesof the SCC. It uses a Linux kernel as its host (Level 1) operating system that has beenextended with our memory coherency driver. The guest (Level 2) operating system is
176 Fall Workshop 2012
References
another Linux kernel, extended with a corresponding sub-architecture layer that imple-ments the para-virtualization interface for the RockyVisor.
Further work involves finalizing the I/O emulation and redirection infrastructure, aswell as a specification of the para-virtualization interface between the guest and hyper-visor.
References
[1] Advanced Micro Devices, Inc. AMD-V Nested Paging, July 2008.
[2] Paul Barham, Boris Dragovic, Keir Fraser, Steven Hand, Tim Harris, Alex Ho, RolfNeugebauer, Ian Pratt, and Andrew Warfield. Xen and the art of virtualization.SIGOPS Oper. Syst. Rev., 37:164–177, October 2003.
[3] Matthew Chapman. vNUMA: Virtual Shared-Memory Multiprocessors. PhD the-sis, Computer Science and Engineering, The University of New South Wales,2008.
[4] Jacek Galowicz. Design and Implementation of a Virtualization Layer for the Op-erating System Kernel “MetalSVM”. Master’s thesis, 2012.
[5] Jason Howard, Saurabh Dighe, Yatin Hoskote, Sriram Vangal, David Finan, Gre-gory Ruhl, David Jenkins, Howard Wilson, Nitin Borkar, Gerhard Schrom, andet al. A 48-Core IA-32 message-passing processor with DVFS in 45nm CMOS.2010 IEEE International SolidState Circuits Conference ISSCC, 9:58–59, 2010.
[6] Intel Corporation. Intel Architecture Software Developer’s Manual, Volume 3a:System Programming, 2010.
[7] Intel Corporation. Intel Architecture Software Developer’s Manual, Volume 3b:System Programming, 2010.
[8] Avi Kivity, Yaniv Kamay, Dor Laor, Uri Lublin, and Anthony Liguori. KVM: TheLinux virtual machine monitor. In Ottawa Linux Symposium, pages 225–230, July2007.
[9] Leslie Lamport. How to Make a Multiprocessor Computer That Correctly ExecutesMultiprocess Programs. IEEE Trans. Comput., 28:690–691, September 1979.
[10] Stefan Lankes. MetalSVM: A Bare-Metal Hypervisor for Non-Coherent Memory-Coupled Cores. http://www.lfbs.rwth-aachen.de/content/metalsvm,2011.
[11] Scott Owens, Susmit Sarkar, and Peter Sewell. A better x86 memory model:x86-TSO (extended version). Technical Report UCAM-CL-TR-745, March 2009.
[12] Gregory F. Pfister. In search of clusters. Prentice-Hall, Inc., Upper Saddle River,NJ, USA, 2 edition, 1998.
Fall Workshop 2012 177

References
[13] Rusty Russel. lguest: Implementing the little Linux hypervisor. In OLS ’07: Pro-ceedings of the Linux Symposium, volume 2, pages 173–178, June 2007.
[14] ScaleMP. Versatile SMP (vSMP) Architecture. http://www.scalemp.com/architecture.
[15] Xiao Wang, Mingfa Zhu, Limin Xiao, Zhonglin Liu, Xiao Zhang, and XiangshanLi. NEX: Virtual Machine Monitor Level Single System Support in Xen. In Inter-national Workshop on Education Technology and Computer Science, volume 3,pages 1047–1051, Los Alamitos, CA, USA, 2009. IEEE Computer Society.
178 Fall Workshop 2012
Interleaving Programming Tasks:Challenges for Interruption Handling in
Programming Environments
Marcel Taeumel
Software Architecture GroupHasso-Plattner-Institut
Whenever programmers stop working on one task to start or continue another, thereis a time-consuming overhead. Such task switches are often initiated by informationneeds to gain a better understanding about the software system. If questions areanswered, the interrupted task will be resumed hence switching will happen again.Thus, designers of programming environments are challenged to either reduce thoseinterruptions or support task resumption efficiently.
We propose several ideas considering interruption handling in programming toolsand describe our concept for environments that reduces interruptions and supportstask resumption for code-centric comprehension activities. Our current research ad-dresses direct manipulation environments and tool-supported software classification.
1 Introduction
Programming is a difficult activity that involves huge mental effort for transforming inten-tions originated in natural human language into a representation that can be processedby computers [4]. When doing so, working with computer interfaces does not just meanto write source code in a programming language, but also to interact with interfaces ofprogramming tools and environments.
During programming tasks, programmers need to access, comprehend, and applydifferent kinds of information [12]. For example, this could be abstract documentationto a module interface, concrete information about program behavior, or more generalsystem design rationals. Unfortunately, such information is often not immediately avail-able. Accessing it involves several sub-steps and hence interrupts the current task.
Interruptions increase the time to complete tasks. Altmann et al. [1] described twodelays that occur in case of an interruption: (1) the interruption lag and (2) the resump-tion lag. Before an interrupting task can be started, programmers need time to finishthe current step and prepare for resumption, e.g., take some notes [14]. After the inter-rupting task is finished, programmers need time to regain focus for the interrupted taskalong with reminding task-related details and understanding existent tool state.
This is where programming tools can support programmers:
Fall Workshop 2012 179
Challenges for Interruption Handling in Programming Environments
• Provide more direct access to information access to make task switching be lessinterrupting, i.e., reduce interruption lags
• Support immediate interruption recovery for any kind of tool-driven activity thatshifts programmers’ focus to a different kind of information, i.e., reduce resump-tion lags
Traditional programming environments like Eclipse1 already connect various sourcesof information. For example, tooltips embed valuable documentation, context menusprovide links to associated source code artifacts, or panels show items in shared repos-itories (e.g., bug trackers, version control systems). Thus, tool developers are improv-ing static information access in traditional environments for quite some time. However,programmers often have difficulties in understanding program run-time behavior andhence require more than just access to static information. Unfortunately, accessinginformation about program run-time is time-consuming and interrupting (e.g., usingbreakpoint debugging) [15].
Current research reveals many new ideas for tools that aim for directly answeringrelevant questions [25] and hence satisfying information needs of programmers [12].Mostly, those questions target program run-time. Prominent examples include directsupport for Why-questions [13], direct access to run-time context using tests [26] andideas for environments that immediately reflect run-time effects as source code is writ-ten2. By doing so, the chance for interruptions, which involve a noticeable overheadbetween task switches, is reduced because the feedback loop is shortened.
Other research projects try to improve interruption recovery by providing support forexternalizing the mental model [31] of programmers into the environment. This com-pares with manual note taking but should shorten the interruption lag and the resump-tion lag. For example, using spatial context can be very supportive when remindingtasks [17]. Thus, Bragdon et al. allow programmers in Code Bubbles [5] to freely ar-range source code artifacts. Kersten et al. propose a degree-of-interest model [11] toonly show task-relevant artifacts and avoid cluttering of information on the screen. Thisalso shortens the amount of time that is needed to recover from an interruption.
However, there are still many shortcomings in addressing interruptions. Program-ming environments do not sufficiently reflect the conceptual model that programmershave in mind when thinking about object-oriented programs. On the one hand, thismakes information access often feel interrupting and on the other hand interruptionrecovery time-consuming.
Thus, our current research focuses on the following topics:
• A feasible approximation of the conceptual model that programmers have in mindwhen thinking about object-oriented programs
• A concept for programming environments that reflects this model and hence re-duces noticeable interruptions while supporting interruption recovery
1http://www.eclipse.org2http://worrydream.com/LearnableProgramming, accessed on 2012-10-04
180 Fall Workshop 2012
2 Why Interruptions are Time-consuming
The remainder of this paper is structured as follows. Section 2 explains the gap be-tween programmers’ goals and programming environment interfaces. It also describeswhat direct information access means and when interruption recovery becomes dif-ficult. Section 3 describes our current research progress in the field of interruptionhandling in programming environments. A new concept for accessing and arrangingstatic and dynamic program information should address several challenges for han-dling interruptions when comprehending programs in a code-centric fashion. Finally,section 4 sketches open hypotheses and next steps.
2 Why Interruptions are Time-consuming
Programmers are frequently interrupted due to information needs. They cannot knowevery detail about a system part but need to query available information sources to ver-ify assumptions and extend system knowledge. There are two reasons, which makethose queries be interrupting and time-consuming: (1) programmers need to map theirinformation goals to tool-specific intentions thus involving unnecessary task switchesand (2) programmers often do not notice task switches thus missing to prepare opti-mized task resumption.
2.1 False Assumptions
If programmers should describe programming environments, they would think of a setof tools that allow for finding, modifying, executing, and sharing source code while ex-changing intermediate results. They would think of tasks like enhancing the programwith a new feature, debugging the program to fix a defect, or refactoring the code baseto reduce technical debt [8]. Designers of such environments create an appropriateconceptual model (design model) that captures all common scenarios and implementthis model. Having this, programmers use the implementation and form their con-ceptual model (user’s model) using the given features and inferring purposes, whichhopefully match the designer’s ones. As Norman [18, pp.189] explained, designersonly communicate their models to users via such a materialized system image. Havingthis fact in mind, programming environments like Eclipse are improved continuouslywith each new release considering user feedback.
However, programmers think of object-oriented programs in a different way, thusrendering the basic (and stable) assumptions of traditional programming environmentsinvalid. Programmers do not think of writing statements into files. They do not think ofsetting breakpoints to interrupt control flows for state inspection. They do not think ofcommitting code snippets into a repository for shared use. They think of objects. Be-fore any code is written, programmers think about collaborating objects to achieve theirgoals–at least when using object-oriented languages. In general, programmers think interms of the language model underlying the programming language that is appropriatefor the given problem. Hutchings et al. [10] coined the term semantic distance, whichdescribes the mismatch between the user’s goals and the features an interface pro-vides. To overcome this distance, the user has to restate the goals into fine-granular
Fall Workshop 2012 181
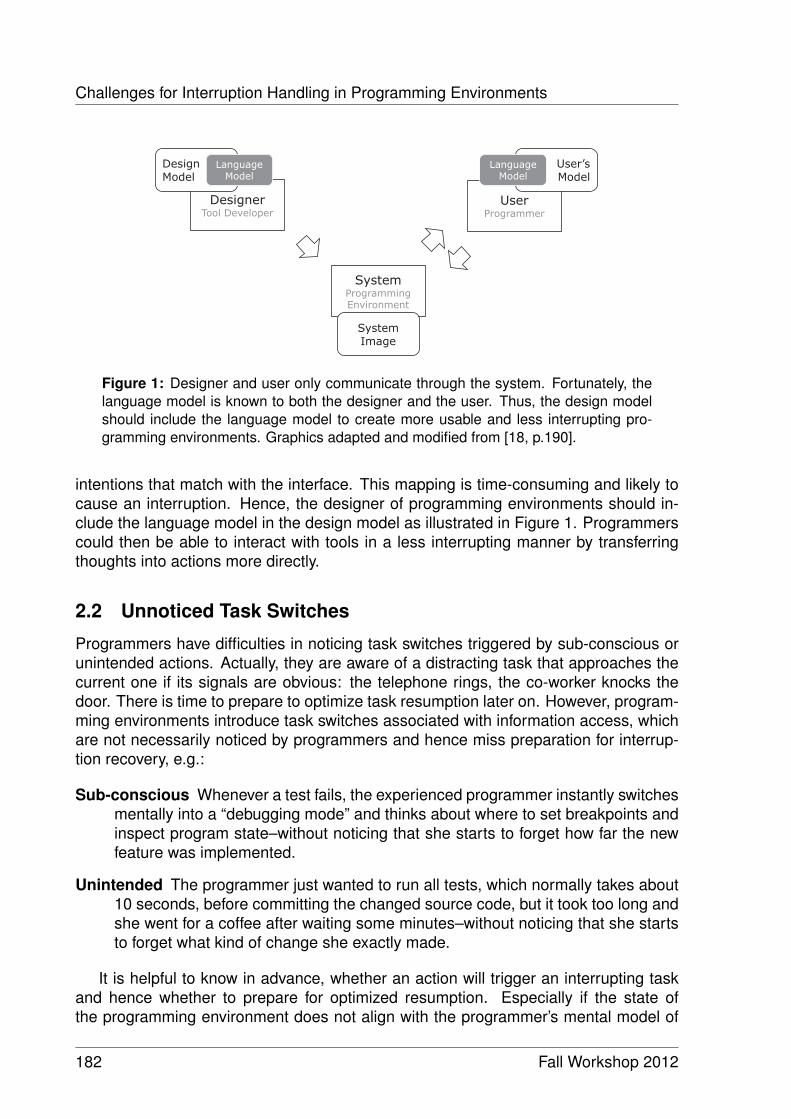
Challenges for Interruption Handling in Programming Environments
User Programmer
Designer Tool Developer
Design Model
Language Model
User’s Model
Language Model
System Programming Environment
System Image
Figure 1: Designer and user only communicate through the system. Fortunately, thelanguage model is known to both the designer and the user. Thus, the design modelshould include the language model to create more usable and less interrupting pro-gramming environments. Graphics adapted and modified from [18, p.190].
intentions that match with the interface. This mapping is time-consuming and likely tocause an interruption. Hence, the designer of programming environments should in-clude the language model in the design model as illustrated in Figure 1. Programmerscould then be able to interact with tools in a less interrupting manner by transferringthoughts into actions more directly.
2.2 Unnoticed Task Switches
Programmers have difficulties in noticing task switches triggered by sub-conscious orunintended actions. Actually, they are aware of a distracting task that approaches thecurrent one if its signals are obvious: the telephone rings, the co-worker knocks thedoor. There is time to prepare to optimize task resumption later on. However, program-ming environments introduce task switches associated with information access, whichare not necessarily noticed by programmers and hence miss preparation for interrup-tion recovery, e.g.:
Sub-conscious Whenever a test fails, the experienced programmer instantly switchesmentally into a “debugging mode” and thinks about where to set breakpoints andinspect program state–without noticing that she starts to forget how far the newfeature was implemented.
Unintended The programmer just wanted to run all tests, which normally takes about10 seconds, before committing the changed source code, but it took too long andshe went for a coffee after waiting some minutes–without noticing that she startsto forget what kind of change she exactly made.
It is helpful to know in advance, whether an action will trigger an interrupting taskand hence whether to prepare for optimized resumption. Especially if the state ofthe programming environment does not align with the programmer’s mental model of
182 Fall Workshop 2012
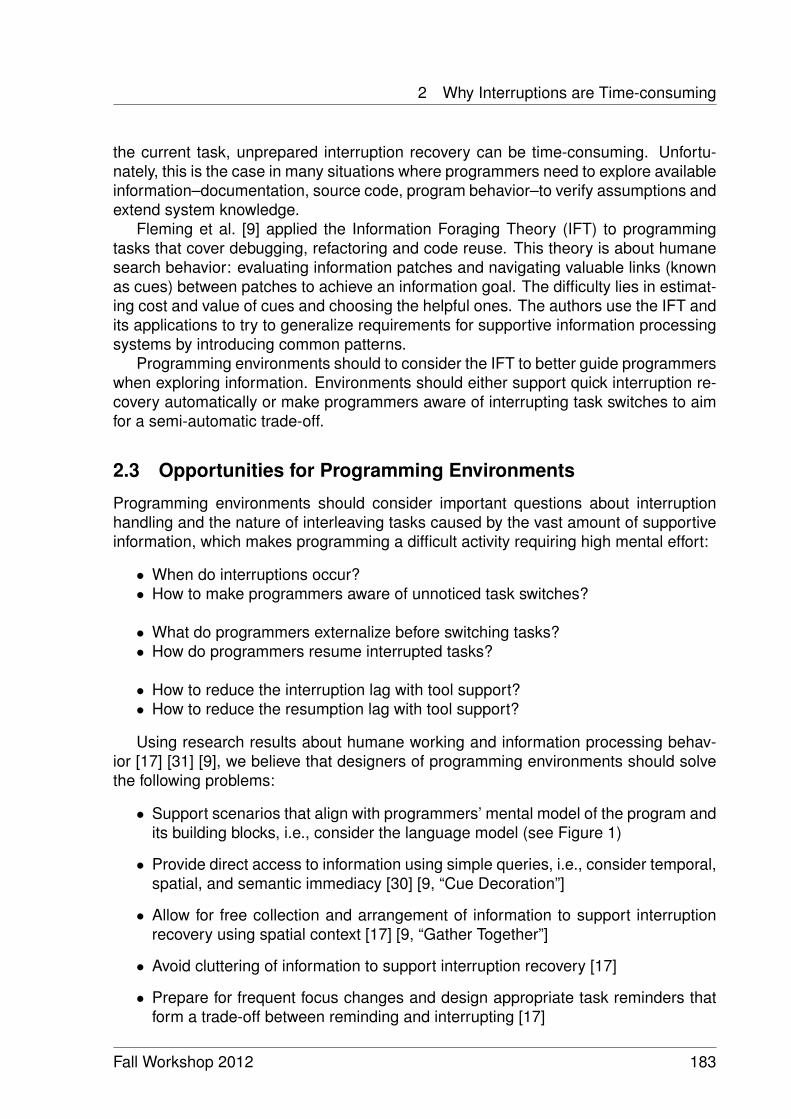
2 Why Interruptions are Time-consuming
the current task, unprepared interruption recovery can be time-consuming. Unfortu-nately, this is the case in many situations where programmers need to explore availableinformation–documentation, source code, program behavior–to verify assumptions andextend system knowledge.
Fleming et al. [9] applied the Information Foraging Theory (IFT) to programmingtasks that cover debugging, refactoring and code reuse. This theory is about humanesearch behavior: evaluating information patches and navigating valuable links (knownas cues) between patches to achieve an information goal. The difficulty lies in estimat-ing cost and value of cues and choosing the helpful ones. The authors use the IFT andits applications to try to generalize requirements for supportive information processingsystems by introducing common patterns.
Programming environments should to consider the IFT to better guide programmerswhen exploring information. Environments should either support quick interruption re-covery automatically or make programmers aware of interrupting task switches to aimfor a semi-automatic trade-off.
2.3 Opportunities for Programming Environments
Programming environments should consider important questions about interruptionhandling and the nature of interleaving tasks caused by the vast amount of supportiveinformation, which makes programming a difficult activity requiring high mental effort:
• When do interruptions occur?• How to make programmers aware of unnoticed task switches?
• What do programmers externalize before switching tasks?• How do programmers resume interrupted tasks?
• How to reduce the interruption lag with tool support?• How to reduce the resumption lag with tool support?
Using research results about humane working and information processing behav-ior [17] [31] [9], we believe that designers of programming environments should solvethe following problems:
• Support scenarios that align with programmers’ mental model of the program andits building blocks, i.e., consider the language model (see Figure 1)
• Provide direct access to information using simple queries, i.e., consider temporal,spatial, and semantic immediacy [30] [9, “Cue Decoration”]
• Allow for free collection and arrangement of information to support interruptionrecovery using spatial context [17] [9, “Gather Together”]
• Avoid cluttering of information to support interruption recovery [17]
• Prepare for frequent focus changes and design appropriate task reminders thatform a trade-off between reminding and interrupting [17]
Fall Workshop 2012 183
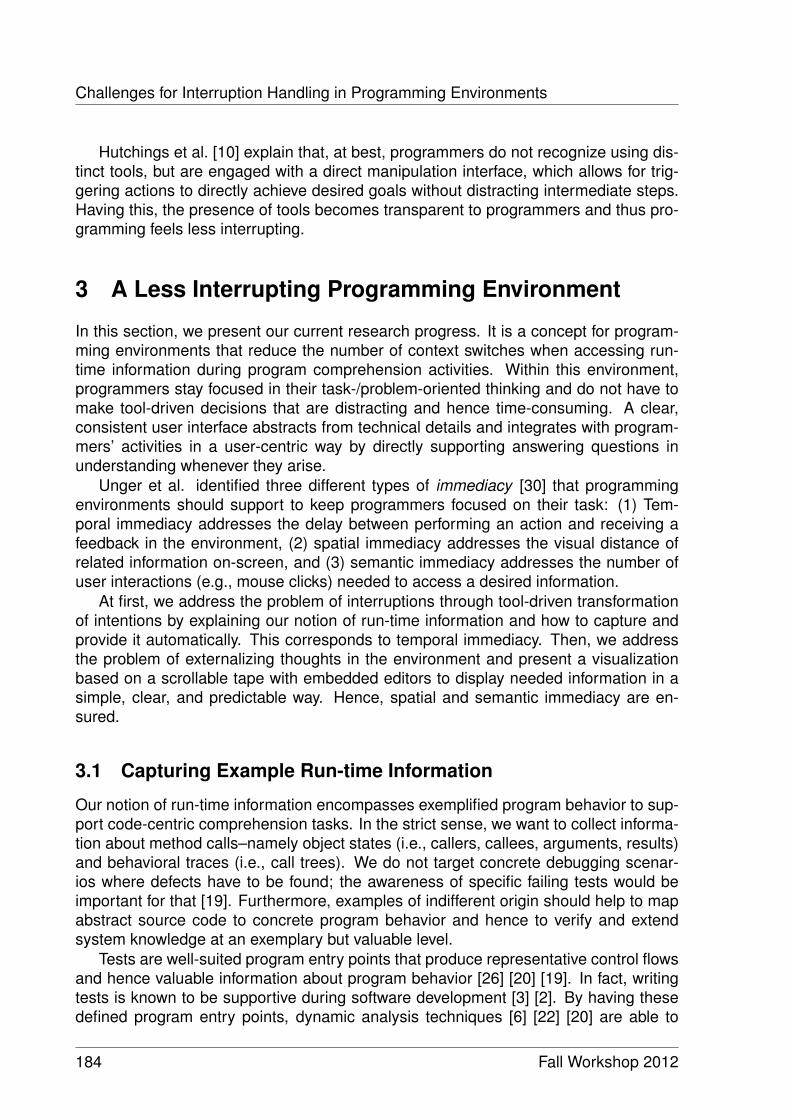
Challenges for Interruption Handling in Programming Environments
Hutchings et al. [10] explain that, at best, programmers do not recognize using dis-tinct tools, but are engaged with a direct manipulation interface, which allows for trig-gering actions to directly achieve desired goals without distracting intermediate steps.Having this, the presence of tools becomes transparent to programmers and thus pro-gramming feels less interrupting.
3 A Less Interrupting Programming Environment
In this section, we present our current research progress. It is a concept for program-ming environments that reduce the number of context switches when accessing run-time information during program comprehension activities. Within this environment,programmers stay focused in their task-/problem-oriented thinking and do not have tomake tool-driven decisions that are distracting and hence time-consuming. A clear,consistent user interface abstracts from technical details and integrates with program-mers’ activities in a user-centric way by directly supporting answering questions inunderstanding whenever they arise.
Unger et al. identified three different types of immediacy [30] that programmingenvironments should support to keep programmers focused on their task: (1) Tem-poral immediacy addresses the delay between performing an action and receiving afeedback in the environment, (2) spatial immediacy addresses the visual distance ofrelated information on-screen, and (3) semantic immediacy addresses the number ofuser interactions (e.g., mouse clicks) needed to access a desired information.
At first, we address the problem of interruptions through tool-driven transformationof intentions by explaining our notion of run-time information and how to capture andprovide it automatically. This corresponds to temporal immediacy. Then, we addressthe problem of externalizing thoughts in the environment and present a visualizationbased on a scrollable tape with embedded editors to display needed information in asimple, clear, and predictable way. Hence, spatial and semantic immediacy are en-sured.
3.1 Capturing Example Run-time Information
Our notion of run-time information encompasses exemplified program behavior to sup-port code-centric comprehension tasks. In the strict sense, we want to collect informa-tion about method calls–namely object states (i.e., callers, callees, arguments, results)and behavioral traces (i.e., call trees). We do not target concrete debugging scenar-ios where defects have to be found; the awareness of specific failing tests would beimportant for that [19]. Furthermore, examples of indifferent origin should help to mapabstract source code to concrete program behavior and hence to verify and extendsystem knowledge at an exemplary but valuable level.
Tests are well-suited program entry points that produce representative control flowsand hence valuable information about program behavior [26] [20] [19]. In fact, writingtests is known to be supportive during software development [3] [2]. By having thesedefined program entry points, dynamic analysis techniques [6] [22] [20] are able to
184 Fall Workshop 2012
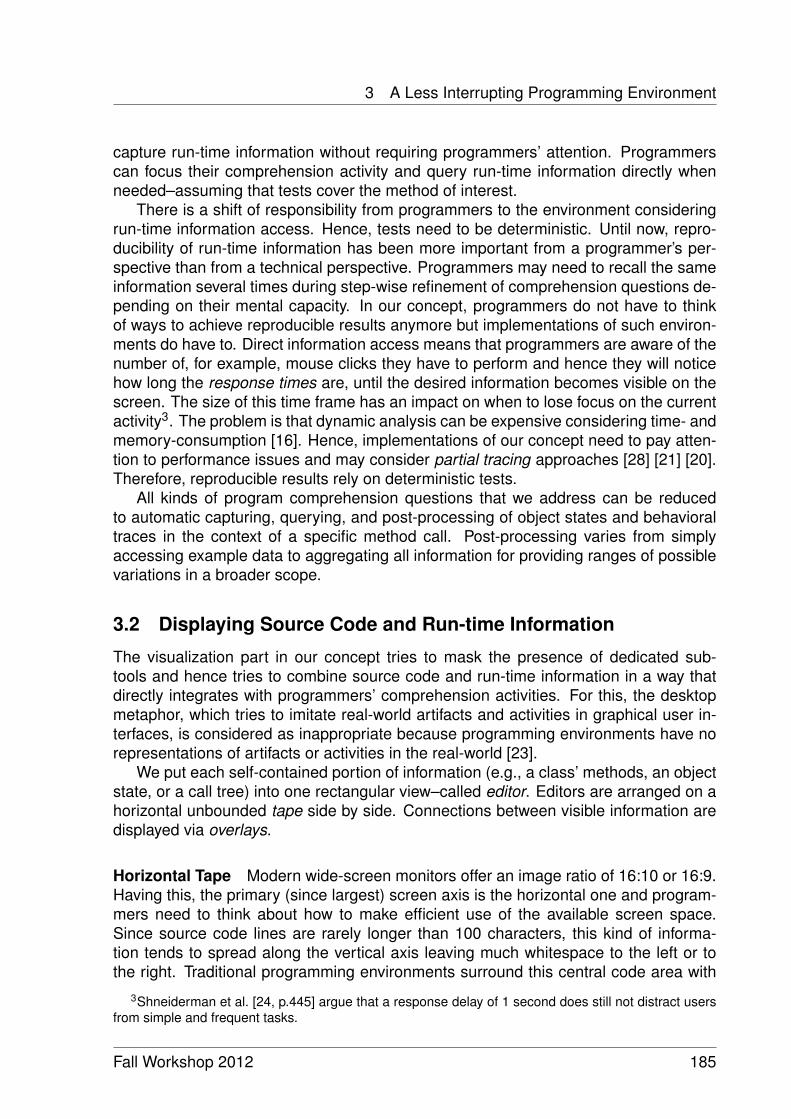
3 A Less Interrupting Programming Environment
capture run-time information without requiring programmers’ attention. Programmerscan focus their comprehension activity and query run-time information directly whenneeded–assuming that tests cover the method of interest.
There is a shift of responsibility from programmers to the environment consideringrun-time information access. Hence, tests need to be deterministic. Until now, repro-ducibility of run-time information has been more important from a programmer’s per-spective than from a technical perspective. Programmers may need to recall the sameinformation several times during step-wise refinement of comprehension questions de-pending on their mental capacity. In our concept, programmers do not have to thinkof ways to achieve reproducible results anymore but implementations of such environ-ments do have to. Direct information access means that programmers are aware of thenumber of, for example, mouse clicks they have to perform and hence they will noticehow long the response times are, until the desired information becomes visible on thescreen. The size of this time frame has an impact on when to lose focus on the currentactivity3. The problem is that dynamic analysis can be expensive considering time- andmemory-consumption [16]. Hence, implementations of our concept need to pay atten-tion to performance issues and may consider partial tracing approaches [28] [21] [20].Therefore, reproducible results rely on deterministic tests.
All kinds of program comprehension questions that we address can be reducedto automatic capturing, querying, and post-processing of object states and behavioraltraces in the context of a specific method call. Post-processing varies from simplyaccessing example data to aggregating all information for providing ranges of possiblevariations in a broader scope.
3.2 Displaying Source Code and Run-time Information
The visualization part in our concept tries to mask the presence of dedicated sub-tools and hence tries to combine source code and run-time information in a way thatdirectly integrates with programmers’ comprehension activities. For this, the desktopmetaphor, which tries to imitate real-world artifacts and activities in graphical user in-terfaces, is considered as inappropriate because programming environments have norepresentations of artifacts or activities in the real-world [23].
We put each self-contained portion of information (e.g., a class’ methods, an objectstate, or a call tree) into one rectangular view–called editor. Editors are arranged on ahorizontal unbounded tape side by side. Connections between visible information aredisplayed via overlays.
Horizontal Tape Modern wide-screen monitors offer an image ratio of 16:10 or 16:9.Having this, the primary (since largest) screen axis is the horizontal one and program-mers need to think about how to make efficient use of the available screen space.Since source code lines are rarely longer than 100 characters, this kind of informa-tion tends to spread along the vertical axis leaving much whitespace to the left or tothe right. Traditional programming environments surround this central code area with
3Shneiderman et al. [24, p.445] argue that a response delay of 1 second does still not distract usersfrom simple and frequent tasks.
Fall Workshop 2012 185
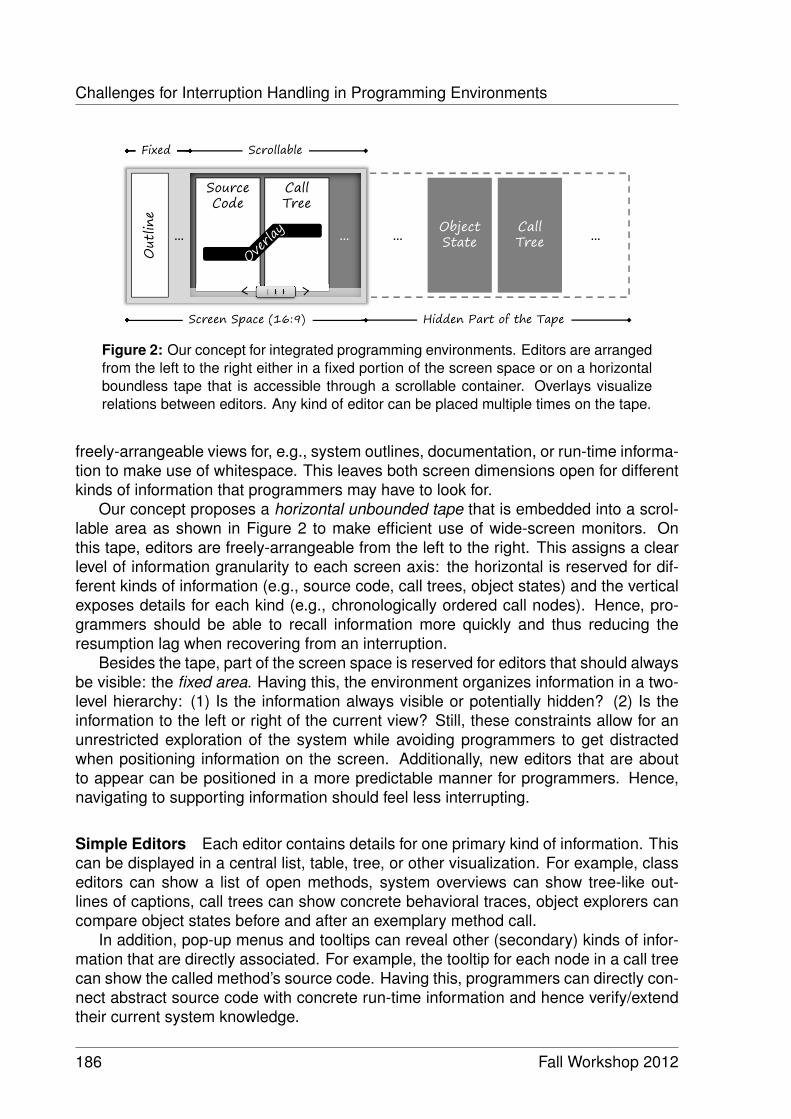
Challenges for Interruption Handling in Programming Environments
����������
��
� �
��������
… … … …�������
�����������
����� �������������
����� ����������
����� ������ !� ����
��������
Figure 2: Our concept for integrated programming environments. Editors are arrangedfrom the left to the right either in a fixed portion of the screen space or on a horizontalboundless tape that is accessible through a scrollable container. Overlays visualizerelations between editors. Any kind of editor can be placed multiple times on the tape.
freely-arrangeable views for, e.g., system outlines, documentation, or run-time informa-tion to make use of whitespace. This leaves both screen dimensions open for differentkinds of information that programmers may have to look for.
Our concept proposes a horizontal unbounded tape that is embedded into a scrol-lable area as shown in Figure 2 to make efficient use of wide-screen monitors. Onthis tape, editors are freely-arrangeable from the left to the right. This assigns a clearlevel of information granularity to each screen axis: the horizontal is reserved for dif-ferent kinds of information (e.g., source code, call trees, object states) and the verticalexposes details for each kind (e.g., chronologically ordered call nodes). Hence, pro-grammers should be able to recall information more quickly and thus reducing theresumption lag when recovering from an interruption.
Besides the tape, part of the screen space is reserved for editors that should alwaysbe visible: the fixed area. Having this, the environment organizes information in a two-level hierarchy: (1) Is the information always visible or potentially hidden? (2) Is theinformation to the left or right of the current view? Still, these constraints allow for anunrestricted exploration of the system while avoiding programmers to get distractedwhen positioning information on the screen. Additionally, new editors that are aboutto appear can be positioned in a more predictable manner for programmers. Hence,navigating to supporting information should feel less interrupting.
Simple Editors Each editor contains details for one primary kind of information. Thiscan be displayed in a central list, table, tree, or other visualization. For example, classeditors can show a list of open methods, system overviews can show tree-like out-lines of captions, call trees can show concrete behavioral traces, object explorers cancompare object states before and after an exemplary method call.
In addition, pop-up menus and tooltips can reveal other (secondary) kinds of infor-mation that are directly associated. For example, the tooltip for each node in a call treecan show the called method’s source code. Having this, programmers can directly con-nect abstract source code with concrete run-time information and hence verify/extendtheir current system knowledge.
186 Fall Workshop 2012

3 A Less Interrupting Programming Environment
Different to views in traditional programming environments, all editors in our conceptare of equal priority for program comprehension activities. Editors for source code arenot more important than editors for run-time information and vice versa.
Connecting Overlays Programmers open and arrange editors on the tape duringcomprehension activities. Thus, there is a relation between open editors correspondingto the navigation history and hence the programmers’ mental model of the system. Ourconcept uses overlays as a third technique to illustrate those relations and hence allowsprogrammers to recall information more quickly while reducing the cognitive load andthe task resumption lag.
3.3 Interacting within the Environment
In our concept, direct access to run-time information means to provide supportive infor-mation to an arising comprehension question with as few user interactions (e.g., mouseclicks) as possible. Having this, we believe that programmers will keep on exploring theprogram without noticing the environment as a distracting intermediate. To achieve this,our concept considers common starting points for comprehension activities and simplequeries using a consistent vocabulary in pop-up menus to navigate between differentkinds of information.
Starting Points Code-centric program comprehension starts with source code read-ing and looking for promising beacons [31]. This could mean to browse overviews ofsystem parts or detailed sources of methods. To achieve this, editors that show the ap-propriate information need to be directly accessible using search mechanisms. In thefirst place, a text-based search is sufficient because programmers start with looking foridentifiers (e.g., class names or method signatures) that seem to correspond with do-main concepts when exploring systems [25]. When getting more knowledgeable withthe system, this search could be extended to make use of run-time information.
However, our concept tries to reduce the complexity of queries. Programmersshould not have to translate rather complex comprehension questions into the com-plicated vocabulary of environments. We want to keep the semantic distance [10] lowfor code-centric program comprehension tasks.
Simple Queries Simplicity is important when directly accessing run-time information.At first, programmers need to transform their question into one out of three elementarypurposes: Browse Code, Explore Object, View Trace.
This transformation is supposed to be straightforward because programmers areaware of the language model that underlies object-oriented programs as illustratedin Figure 1. This simple vocabulary should be visualized with pop-up menus and in-tegrated into all editors consistently. By doing so, programmers are free to decidewhether, for example, focused pieces of run-time information benefit from additionalrun-time data or source code.
Fall Workshop 2012 187

References
Figure 3: Screenshot of our prototypical implementation called VIVIDE. The column-oriented layout allows for simple collection and arrangement of important information.Overlays visualize navigation history. Static and dynamic information are comparableside-by-side and hence should reduce interruption and resumption lags.
4 Conclusions and Next Steps
Programmers experience frequent interruptions due to switches between unfinishedtasks during programming activities. Since programming tasks interleave, the occurringlags form an overhead that disturbs the workflow. Most interruptions are initiated by theprogrammers themselves when accessing required information. Thus, programmingtools could either simplify this access to avoid context switches completely or ease thesteps between interrupted and interrupting task to minimize overhead.
We implemented a prototype of our concept for programming environments–calledVIVIDE [27]. It supports code-centric comprehension activities by simplifying access torun-time information (see Figure 3). For evaluation purposes, students created a smallTetris game with it. Observations revealed that programmers’ ways to explore object-oriented programs are still different to how editors present information. Additionally,cluttering of information will become a problem if the environment is overpopulatedwith source code, object explorers, and call trees.
At the moment, we are investigating how to better support querying static and dy-namic information to provide immediate starting points in the environment and hencesupport interruption recovery. This also involves the entire field of software classifica-tion [7] because modularity issues are still present in programming languages [29] andtools [11]. Actually, programmers are way more flexible in grouping artifacts mentally,hence forming abstractions to ease comprehension, than they can do with such toolsor languages.
References
[1] E. M. Altmann and J. G. Trafton. Task Interruption: Resumption Lag and the Role of Cues.In Proceedings of the 26th Annual Conference of the Cognitive Science, 2004.
188 Fall Workshop 2012
References
[2] K. Beck. Test-driven Development: By Example. Addison-Wesley, 2003.
[3] K. Beck and C. Andres. Extreme Programming Explained: Embrace Change. Addison-Wesley, 2004.
[4] A. F. Blackwell. What is Programming. In Proceedings of the 14th Workshop of the Psy-chology of Programming Interest Group, pages 204–218. PPIG, 2002.
[5] A. Bragdon, R. Zeleznik, S. P. Reiss, S. Karumuri, W. Cheung, J. Kaplan, C. Coleman,F. Adeputra, and J. J. LaViola Jr. Code Bubbles: A Working Set-based Interface for CodeUnderstanding and Maintenance. In Proceedings of the 28th International Conference onHuman Factors in Computing Systems, pages 2503–2512. ACM, 2010.
[6] B. Cornelissen, A. Zaidman, A. van Deursen, L. Moonen, and R. Koschke. A SystematicSurvey of Program Comprehension Through Dynamic Analysis. IEEE Transactions onSoftware Engineering, 35(5):684–702, September/October 2009.
[7] K. De Hondt. A Novel Approach to Architectural Recovery in Evolving Object-orientedSystems. PhD thesis, Vrije Universiteit Brussel, 1998.
[8] M. Doernhoefer. Surfing the Net for Software Engineering Notes. ACM SIGSOFT SoftwareEngineering Notes, 37(3):10–17, 2012.
[9] S. Fleming, C. Scaffidi, D. Piorkowski, M. Burnett, R. Bellamy, J Lawrence, and Kwan I. AnInformation Foraging Theory Perspective on Tools for Debugging, Refactoring, and ReuseTasks. ACM Transactions on Software Engineering and Methodology, 2012 (to appear).
[10] E. L. Hutchins, J. D. Hollan, and D. A. Norman. Direct Manipulation Interfaces. Human-Computer Interaction, 1(4):311–338, 1985.
[11] M. Kersten and G. C. Murphy. Mylar: A Degree-of-Interest Model for IDEs. In Proceed-ings of the 4th International Conference on Aspect-oriented Software Development, pages159–168. ACM, 2005.
[12] A. J. Ko, R. DeLine, and G. Venolia. Information Needs in Collocated Software Develop-ment Teams. In Proceedings of the 29th International Conference on Software Engineer-ing, pages 344–353. ACM/IEEE, 2007.
[13] A. J. Ko and B. A. Myers. Debugging Reinvented: Asking and Answering Why and Why NotQuestions about Program Behavior. In Proceedings of the 30th International Conferenceon Software Engineering, pages 301–310. ACM/IEEE, 2008.
[14] A. J. Ko, B. A. Myers, M. J. Coblenz, and H. H. Aung. An Exploratory Study of HowDevelopers Seek, Relate, and Collect Relevant Information During Software MaintenanceTasks. IEEE Transactions on Software Engineering, 32(12):971–987, December 2006.
[15] T. D. LaToza and B. A. Myers. Developers Ask Reachability Questions. In Proceedings ofthe 32nd International Conference on Software Engineering - Volume 1, pages 185–194.ACM/IEEE, 2010.
[16] B. Lewis. Debugging Backwards in Time. In Proceedings of the 5th International Workshopon Automated Debugging, Ghent, Belgium, September 2003.
Fall Workshop 2012 189
References
[17] Y. Miyata and D. A. Norman. Psychological Issues in Support of Multiple Activities. UserCentered System Design, pages 265–284, 1986.
[18] D. A. Norman. The Design of Everyday Things. Basic Books, 1988.
[19] M. Perscheid, M. Haupt, R. Hirschfeld, and H. Masuhara. Test-driven Fault Navigation forDebugging Reproducible Failures. Journal of the Japan Society for Software Science andTechnology, 29, 2012.
[20] M. Perscheid, B. Steinert, R. Hirschfeld, F. Geller, and M. Haupt. Immediacy throughInteractivity: Online Analysis of Run-time Behavior. In Proceedings of the 17th WorkingConference on Reverse Engineering, pages 77–86. IEEE, 2010.
[21] D. Röthlisberger, M. Denker, and É. Tanter. Unanticipated Partial Behavioral Reflection:Adapting Applications at Runtime. Computer Languages, Systems & Structures, 34(2-3):46–65, July–October 2008.
[22] D. Röthlisberger, O. Greevy, and O. Nierstrasz. Exploiting Runtime Information in the IDE.In Proceedings of the 16th International Conference on Program Comprehension, pages63–72. IEEE, 2008.
[23] D. Röthlisberger, O. Nierstrasz, and S. Ducasse. Autumn Leaves: Curing the WindowPlague in IDEs. In Proceedings of the 16th Working Conference on Reverse Engineering,pages 237–246. IEEE, 2009.
[24] B. Shneiderman and C. Plaisant. Designing the User Interface: Strategies for EffectiveHuman-Computer Interaction. Addison-Wesley, 5th edition, 2009.
[25] J. Sillito, G. C. Murphy, and K. De Volder. Asking and Answering Questions During aProgramming Change Task. IEEE Transactions on Software Engineering, 34(4):434–451,July 2008.
[26] B. Steinert, M. Perscheid, M. Beck, J. Lincke, and R. Hirschfeld. Debugging into Examples.Testing of Software and Communication Systems, pages 235–240, 2009.
[27] M. Taeumel, B. Steinert, and R. Hirschfeld. The VIVIDE Programming Environment: Con-necting Run-time Information With Programmers’ System Knowledge. In Proceedings ofthe 11th Symposium on New Ideas, New Paradigms, and Reflections on Programmingand Software. ACM, 2012 (to appear).
[28] É. Tanter, J. Noyé, D. Caromel, and P. Cointe. Partial Behavioral Reflection: Spatial andTemporal Selection of Reification. In Proceedings of the 18th Conference on Object-oriented programing, systems, languages, and applications, pages 27–46. ACM SIG-PLAN, 2003.
[29] P. Tarr, H. Ossher, W. Harrison, and S. M. Sutton Jr. N Degrees of Separation: Multi-dimensional Separation of Concerns. In Proceedings of the 21st International Conferenceon Software Engineering, pages 107–119. ACM, 1999.
[30] D. Ungar, H. Lieberman, and C. Fry. Debugging and the Experience of Immediacy. Com-munications of the ACM, 40(4):38–43, April 1997.
[31] A. Von Mayrhauser and A. M. Vans. Program Comprehension during Software Mainte-nance and Evolution. Computer, 28(8):44–55, 1995.
190 Fall Workshop 2012
Workload Prediction and UtilizationChange Detection in Virtualized Data
Centers
Ibrahim Takouna
Internet-technologies and SystemsHasso-Plattner-Institute
Cloud computing as a consolidation environment assists in reducing energy con-sumption by computing services. Cloud’s providers provide on-demand computingservices where customers pay based on the actual resource usage. In this context,capacity planning becomes a significant issue to handle the trade-off between perfor-mance and energy.
Thus, this report presents an implementation of an adaptive workload prediction bywhich we can predict the number of active VMs for the next planning period. Then, itpresents an online CPU-utilization state change detection approach that helps to takeefficient decisions to perform any action (e.g., VM migration). Furthermore, it presentsthe modeling and implementation of memory bandwidth demand of the NAS ParallelBenchmark suite. In this report, we discuss the results of each contribution. The resultsdemonstrate the efficiency of our approach for capacity planning in virtualized data cen-ters. Finally, as future work, we investigate improving the accuracy of CPU-utilizationprediction and increasing the number of lookahead steps. Additionally, we implementa robust optimization technique for capacity planning exploiting our proposed workloadprediction approach.
1 Introduction
In the last retreat, we presented a framework for energy-aware resource managementin virtualized data centers where many Clouds providers such as Amazon EC2 lever-age virtualization technologies to increase the utilization of physical servers and reducethe number of active physical servers. Realization of an efficient resource managementin cloud data centers implies determining the number of the required servers for host-ing the active VMs and the number of VMs to be co-hosted (i.e., server consolidation)on a physical server.
Although much research work has been done in this context [1] [2] [3], many re-searchers did not consider the overhead of changing the power-state of servers andthe energy wastage due to this action. A normal server takes time to go from power-state to another, during this time the server consumes energy without performing anyuseful work (e.g., execution workload). Figure 1-(a) shows the time spent by a nor-mal PC to switch from power-state to another with different types of operating system.
Fall Workshop 2012 191
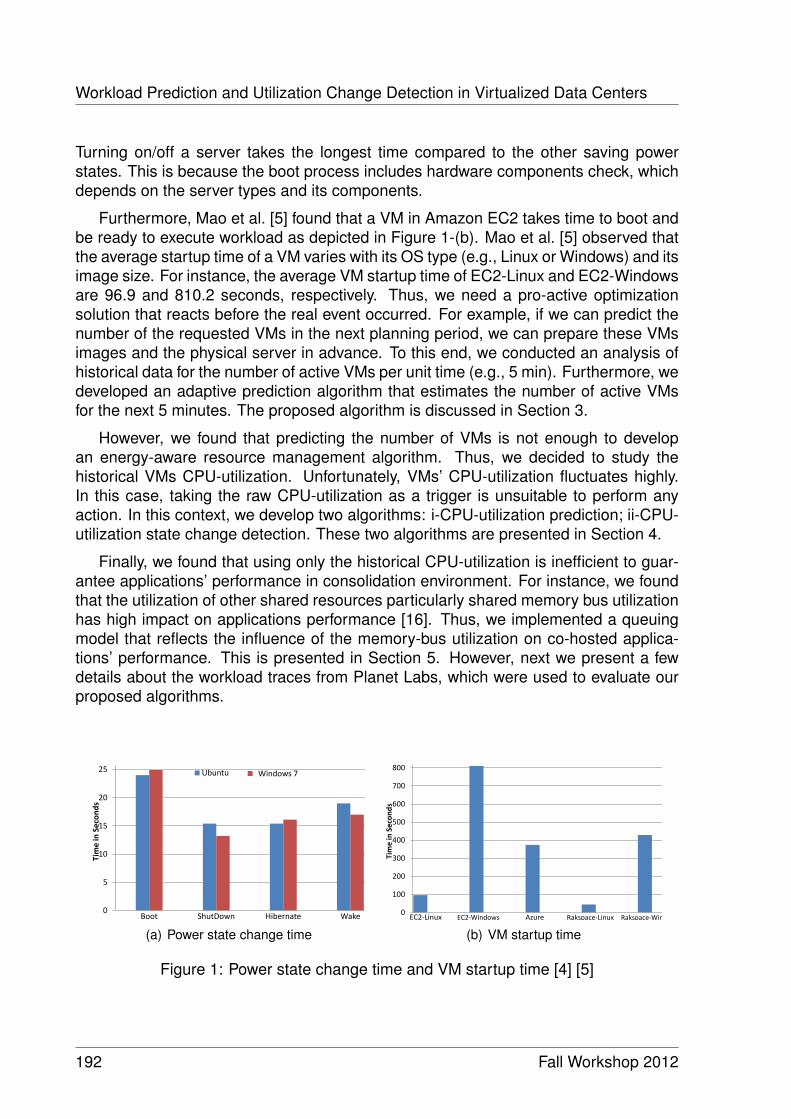
Workload Prediction and Utilization Change Detection in Virtualized Data Centers
Turning on/off a server takes the longest time compared to the other saving powerstates. This is because the boot process includes hardware components check, whichdepends on the server types and its components.
Furthermore, Mao et al. [5] found that a VM in Amazon EC2 takes time to boot andbe ready to execute workload as depicted in Figure 1-(b). Mao et al. [5] observed thatthe average startup time of a VM varies with its OS type (e.g., Linux or Windows) and itsimage size. For instance, the average VM startup time of EC2-Linux and EC2-Windowsare 96.9 and 810.2 seconds, respectively. Thus, we need a pro-active optimizationsolution that reacts before the real event occurred. For example, if we can predict thenumber of the requested VMs in the next planning period, we can prepare these VMsimages and the physical server in advance. To this end, we conducted an analysis ofhistorical data for the number of active VMs per unit time (e.g., 5 min). Furthermore, wedeveloped an adaptive prediction algorithm that estimates the number of active VMsfor the next 5 minutes. The proposed algorithm is discussed in Section 3.
However, we found that predicting the number of VMs is not enough to developan energy-aware resource management algorithm. Thus, we decided to study thehistorical VMs CPU-utilization. Unfortunately, VMs’ CPU-utilization fluctuates highly.In this case, taking the raw CPU-utilization as a trigger is unsuitable to perform anyaction. In this context, we develop two algorithms: i-CPU-utilization prediction; ii-CPU-utilization state change detection. These two algorithms are presented in Section 4.
Finally, we found that using only the historical CPU-utilization is inefficient to guar-antee applications’ performance in consolidation environment. For instance, we foundthat the utilization of other shared resources particularly shared memory bus utilizationhas high impact on applications performance [16]. Thus, we implemented a queuingmodel that reflects the influence of the memory-bus utilization on co-hosted applica-tions’ performance. This is presented in Section 5. However, next we present a fewdetails about the workload traces from Planet Labs, which were used to evaluate ourproposed algorithms.
1 20 39 58 77 96 115 134 153 172 191
Time
0
5
10
15
20
25
30
Boot
ShutDown
Hibernate
Wake
Tim
e in
Sec
on
ds
PC state
Ubuntu
Windows 7
(a) Power state change time
0
100
200
300
400
500
600
700
800
900
EC2-Linux EC2-Windows Azure Rakspace-Linux Rakspace-Window
Tim
e in
Sec
on
ds
(b) VM startup time
Figure 1: Power state change time and VM startup time [4] [5]
192 Fall Workshop 2012
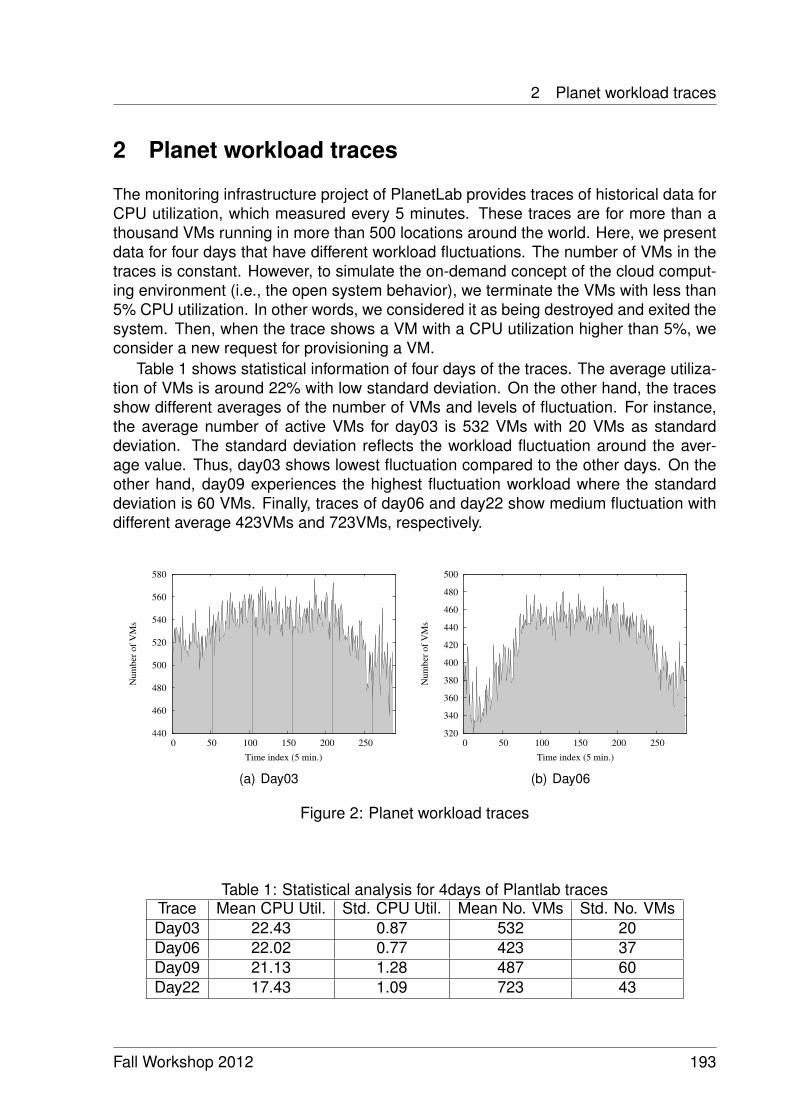
2 Planet workload traces
2 Planet workload traces
The monitoring infrastructure project of PlanetLab provides traces of historical data forCPU utilization, which measured every 5 minutes. These traces are for more than athousand VMs running in more than 500 locations around the world. Here, we presentdata for four days that have different workload fluctuations. The number of VMs in thetraces is constant. However, to simulate the on-demand concept of the cloud comput-ing environment (i.e., the open system behavior), we terminate the VMs with less than5% CPU utilization. In other words, we considered it as being destroyed and exited thesystem. Then, when the trace shows a VM with a CPU utilization higher than 5%, weconsider a new request for provisioning a VM.
Table 1 shows statistical information of four days of the traces. The average utiliza-tion of VMs is around 22% with low standard deviation. On the other hand, the tracesshow different averages of the number of VMs and levels of fluctuation. For instance,the average number of active VMs for day03 is 532 VMs with 20 VMs as standarddeviation. The standard deviation reflects the workload fluctuation around the aver-age value. Thus, day03 shows lowest fluctuation compared to the other days. On theother hand, day09 experiences the highest fluctuation workload where the standarddeviation is 60 VMs. Finally, traces of day06 and day22 show medium fluctuation withdifferent average 423VMs and 723VMs, respectively.
440
460
480
500
520
540
560
580
0 50 100 150 200 250
Nu
mb
er
of
VM
s
Time index (5 min.)
(a) Day03
320
340
360
380
400
420
440
460
480
500
0 50 100 150 200 250
Nu
mb
er
of
VM
s
Time index (5 min.)
(b) Day06
Figure 2: Planet workload traces
Table 1: Statistical analysis for 4days of Plantlab tracesTrace Mean CPU Util. Std. CPU Util. Mean No. VMs Std. No. VMsDay03 22.43 0.87 532 20Day06 22.02 0.77 423 37Day09 21.13 1.28 487 60Day22 17.43 1.09 723 43
Fall Workshop 2012 193
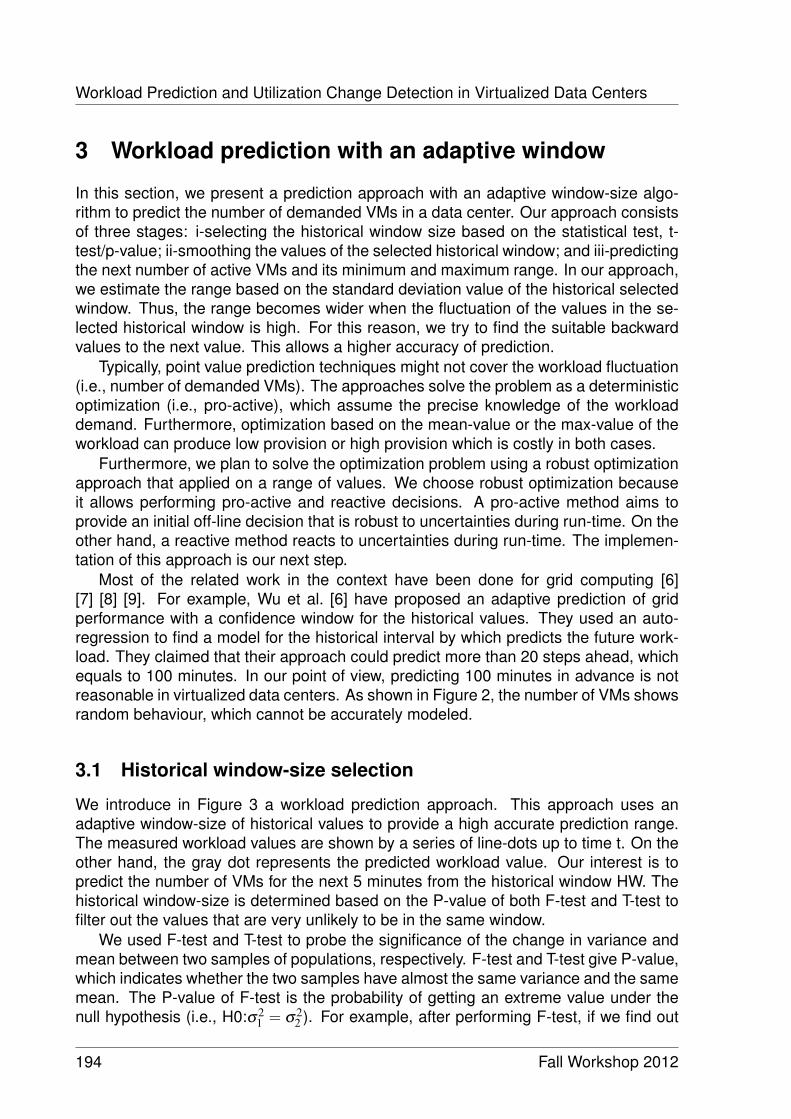
Workload Prediction and Utilization Change Detection in Virtualized Data Centers
3 Workload prediction with an adaptive window
In this section, we present a prediction approach with an adaptive window-size algo-rithm to predict the number of demanded VMs in a data center. Our approach consistsof three stages: i-selecting the historical window size based on the statistical test, t-test/p-value; ii-smoothing the values of the selected historical window; and iii-predictingthe next number of active VMs and its minimum and maximum range. In our approach,we estimate the range based on the standard deviation value of the historical selectedwindow. Thus, the range becomes wider when the fluctuation of the values in the se-lected historical window is high. For this reason, we try to find the suitable backwardvalues to the next value. This allows a higher accuracy of prediction.
Typically, point value prediction techniques might not cover the workload fluctuation(i.e., number of demanded VMs). The approaches solve the problem as a deterministicoptimization (i.e., pro-active), which assume the precise knowledge of the workloaddemand. Furthermore, optimization based on the mean-value or the max-value of theworkload can produce low provision or high provision which is costly in both cases.
Furthermore, we plan to solve the optimization problem using a robust optimizationapproach that applied on a range of values. We choose robust optimization becauseit allows performing pro-active and reactive decisions. A pro-active method aims toprovide an initial off-line decision that is robust to uncertainties during run-time. On theother hand, a reactive method reacts to uncertainties during run-time. The implemen-tation of this approach is our next step.
Most of the related work in the context have been done for grid computing [6][7] [8] [9]. For example, Wu et al. [6] have proposed an adaptive prediction of gridperformance with a confidence window for the historical values. They used an auto-regression to find a model for the historical interval by which predicts the future work-load. They claimed that their approach could predict more than 20 steps ahead, whichequals to 100 minutes. In our point of view, predicting 100 minutes in advance is notreasonable in virtualized data centers. As shown in Figure 2, the number of VMs showsrandom behaviour, which cannot be accurately modeled.
3.1 Historical window-size selection
We introduce in Figure 3 a workload prediction approach. This approach uses anadaptive window-size of historical values to provide a high accurate prediction range.The measured workload values are shown by a series of line-dots up to time t. On theother hand, the gray dot represents the predicted workload value. Our interest is topredict the number of VMs for the next 5 minutes from the historical window HW. Thehistorical window-size is determined based on the P-value of both F-test and T-test tofilter out the values that are very unlikely to be in the same window.
We used F-test and T-test to probe the significance of the change in variance andmean between two samples of populations, respectively. F-test and T-test give P-value,which indicates whether the two samples have almost the same variance and the samemean. The P-value of F-test is the probability of getting an extreme value under thenull hypothesis (i.e., H0:σ2
1 = σ22 ). For example, after performing F-test, if we find out
194 Fall Workshop 2012
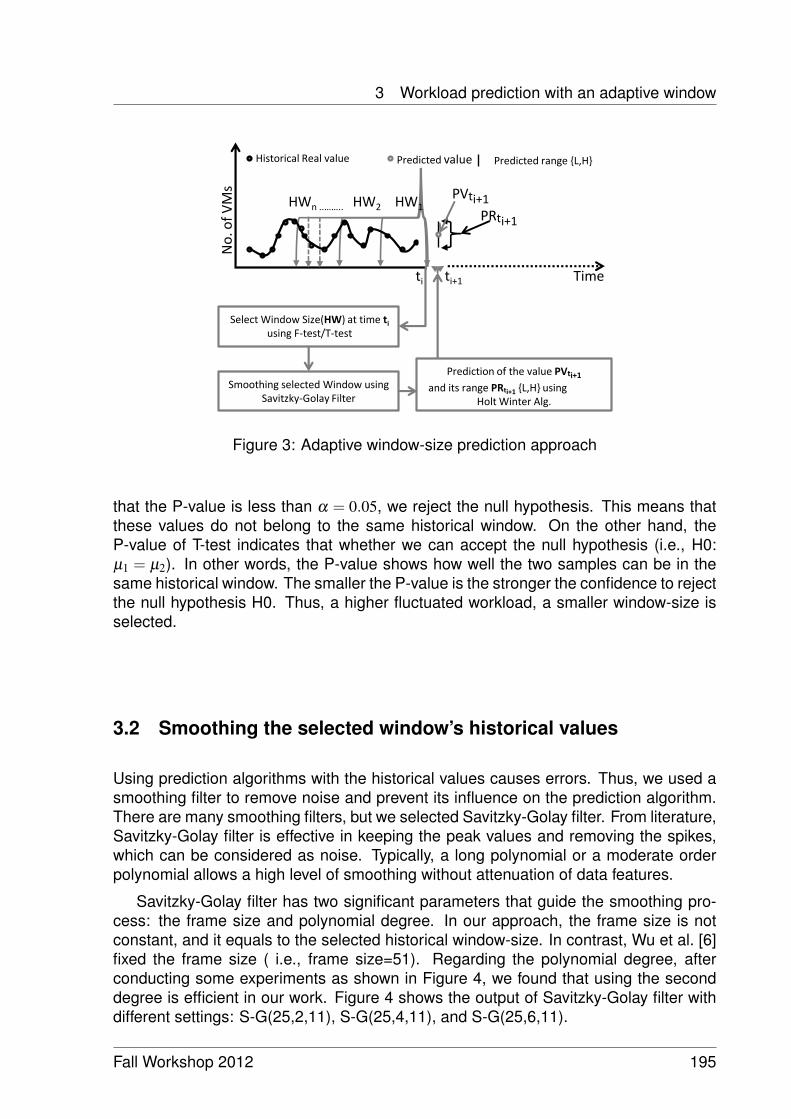
3 Workload prediction with an adaptive window
Predicted range {L,H}
Smoothing selected Window using Savitzky-Golay Filter
Prediction of the value PVti+1
and its range PRti+1 {L,H} using Holt Winter Alg.
Select Window Size(HW) at time ti using F-test/T-test
No
. of
VM
s
Time
HWn ..…….. HW2 HW1
PRti+1
ti ti+1
Historical Real value Predicted value
PVti+1
Figure 3: Adaptive window-size prediction approach
that the P-value is less than α = 0.05, we reject the null hypothesis. This means thatthese values do not belong to the same historical window. On the other hand, theP-value of T-test indicates that whether we can accept the null hypothesis (i.e., H0:µ1 = µ2). In other words, the P-value shows how well the two samples can be in thesame historical window. The smaller the P-value is the stronger the confidence to rejectthe null hypothesis H0. Thus, a higher fluctuated workload, a smaller window-size isselected.
3.2 Smoothing the selected window’s historical values
Using prediction algorithms with the historical values causes errors. Thus, we used asmoothing filter to remove noise and prevent its influence on the prediction algorithm.There are many smoothing filters, but we selected Savitzky-Golay filter. From literature,Savitzky-Golay filter is effective in keeping the peak values and removing the spikes,which can be considered as noise. Typically, a long polynomial or a moderate orderpolynomial allows a high level of smoothing without attenuation of data features.
Savitzky-Golay filter has two significant parameters that guide the smoothing pro-cess: the frame size and polynomial degree. In our approach, the frame size is notconstant, and it equals to the selected historical window-size. In contrast, Wu et al. [6]fixed the frame size ( i.e., frame size=51). Regarding the polynomial degree, afterconducting some experiments as shown in Figure 4, we found that using the seconddegree is efficient in our work. Figure 4 shows the output of Savitzky-Golay filter withdifferent settings: S-G(25,2,11), S-G(25,4,11), and S-G(25,6,11).
Fall Workshop 2012 195
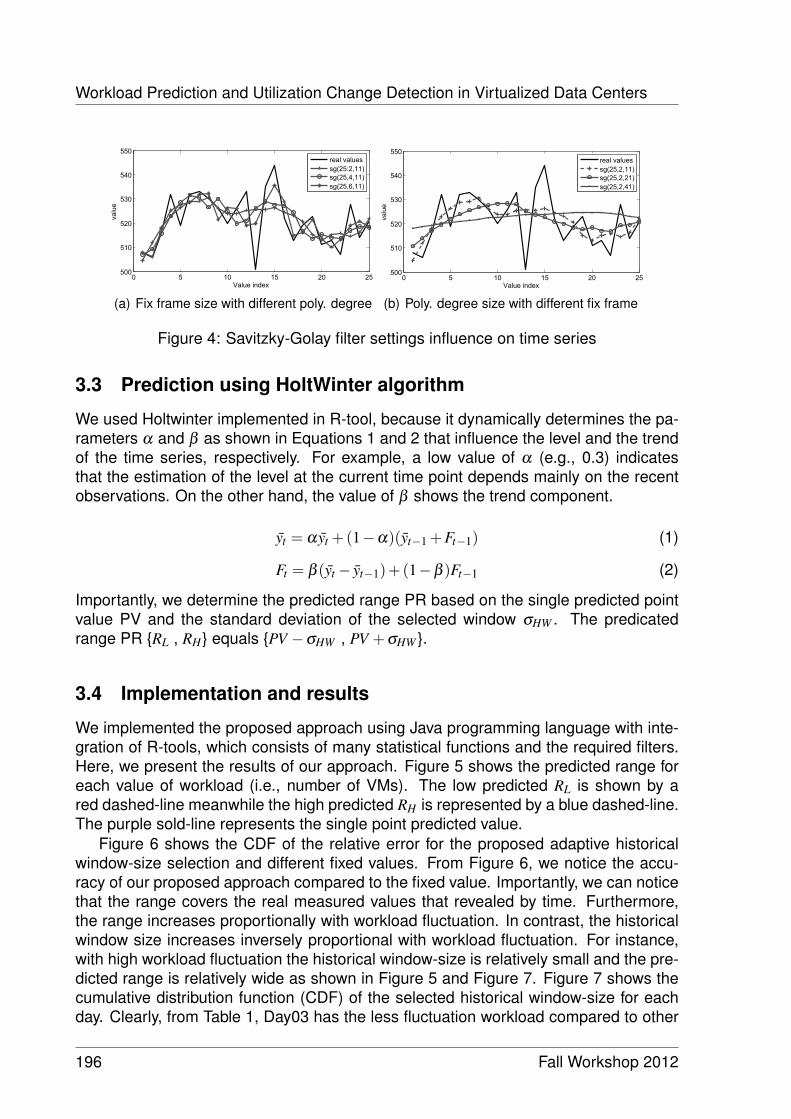
Workload Prediction and Utilization Change Detection in Virtualized Data Centers
0 5 10 15 20 25500
510
520
530
540
550
Value index
valu
e
real valuessg(25:2,11)sg(25,4,11)sg(25,6,11)
(a) Fix frame size with different poly. degree
0 5 10 15 20 25500
510
520
530
540
550
Value index
valu
e
real valuessg(25,2,11)sg(25,2,21)sg(25,2,41)
(b) Poly. degree size with different fix frame
Figure 4: Savitzky-Golay filter settings influence on time series
3.3 Prediction using HoltWinter algorithm
We used Holtwinter implemented in R-tool, because it dynamically determines the pa-rameters α and β as shown in Equations 1 and 2 that influence the level and the trendof the time series, respectively. For example, a low value of α (e.g., 0.3) indicatesthat the estimation of the level at the current time point depends mainly on the recentobservations. On the other hand, the value of β shows the trend component.
yt = α yt +(1−α)(yt−1 +Ft−1) (1)
Ft = β (yt− yt−1)+(1−β )Ft−1 (2)
Importantly, we determine the predicted range PR based on the single predicted pointvalue PV and the standard deviation of the selected window σHW . The predicatedrange PR {RL , RH} equals {PV −σHW , PV +σHW }.
3.4 Implementation and results
We implemented the proposed approach using Java programming language with inte-gration of R-tools, which consists of many statistical functions and the required filters.Here, we present the results of our approach. Figure 5 shows the predicted range foreach value of workload (i.e., number of VMs). The low predicted RL is shown by ared dashed-line meanwhile the high predicted RH is represented by a blue dashed-line.The purple sold-line represents the single point predicted value.
Figure 6 shows the CDF of the relative error for the proposed adaptive historicalwindow-size selection and different fixed values. From Figure 6, we notice the accu-racy of our proposed approach compared to the fixed value. Importantly, we can noticethat the range covers the real measured values that revealed by time. Furthermore,the range increases proportionally with workload fluctuation. In contrast, the historicalwindow size increases inversely proportional with workload fluctuation. For instance,with high workload fluctuation the historical window-size is relatively small and the pre-dicted range is relatively wide as shown in Figure 5 and Figure 7. Figure 7 shows thecumulative distribution function (CDF) of the selected historical window-size for eachday. Clearly, from Table 1, Day03 has the less fluctuation workload compared to other
196 Fall Workshop 2012
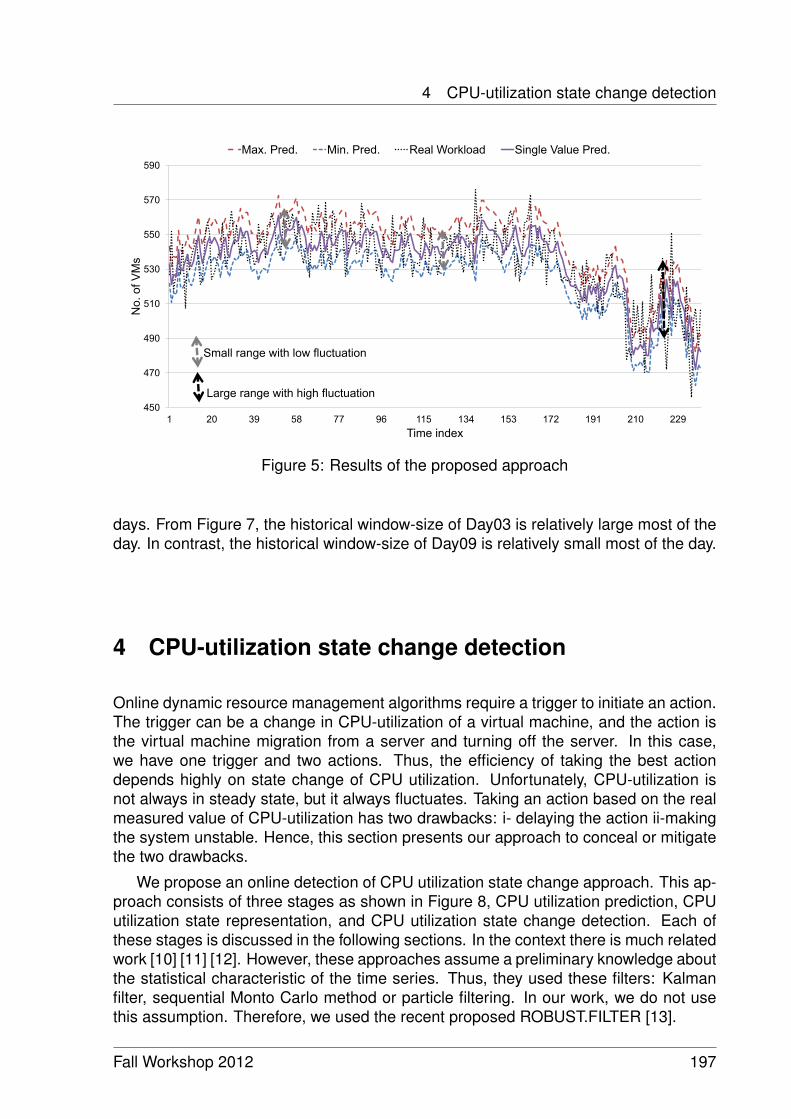
4 CPU-utilization state change detection
450
470
490
510
530
550
570
590
1 20 39 58 77 96 115 134 153 172 191 210 229
No
. o
f V
Ms
Time index
Max. Pred. Min. Pred. Real Workload Single Value Pred.
Small range with low fluctuation Large range with high fluctuation
Figure 5: Results of the proposed approach
days. From Figure 7, the historical window-size of Day03 is relatively large most of theday. In contrast, the historical window-size of Day09 is relatively small most of the day.
4 CPU-utilization state change detection
Online dynamic resource management algorithms require a trigger to initiate an action.The trigger can be a change in CPU-utilization of a virtual machine, and the action isthe virtual machine migration from a server and turning off the server. In this case,we have one trigger and two actions. Thus, the efficiency of taking the best actiondepends highly on state change of CPU utilization. Unfortunately, CPU-utilization isnot always in steady state, but it always fluctuates. Taking an action based on the realmeasured value of CPU-utilization has two drawbacks: i- delaying the action ii-makingthe system unstable. Hence, this section presents our approach to conceal or mitigatethe two drawbacks.
We propose an online detection of CPU utilization state change approach. This ap-proach consists of three stages as shown in Figure 8, CPU utilization prediction, CPUutilization state representation, and CPU utilization state change detection. Each ofthese stages is discussed in the following sections. In the context there is much relatedwork [10] [11] [12]. However, these approaches assume a preliminary knowledge aboutthe statistical characteristic of the time series. Thus, they used these filters: Kalmanfilter, sequential Monto Carlo method or particle filtering. In our work, we do not usethis assumption. Therefore, we used the recent proposed ROBUST.FILTER [13].
Fall Workshop 2012 197
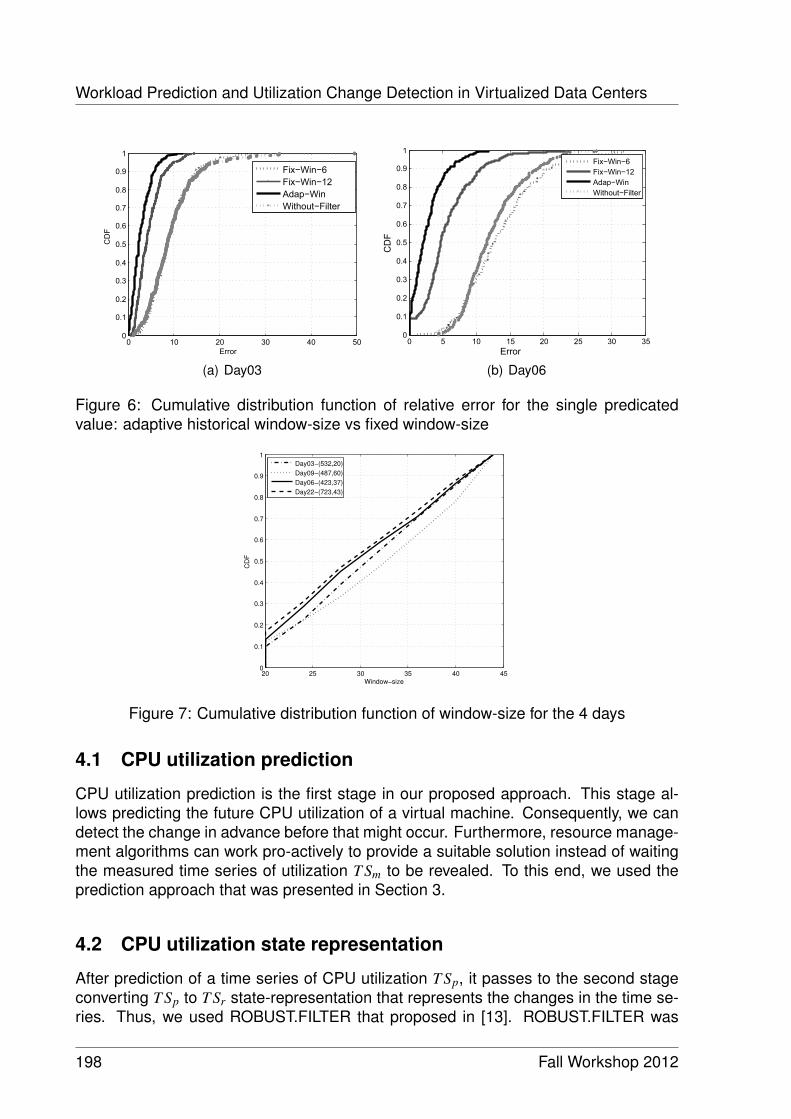
Workload Prediction and Utilization Change Detection in Virtualized Data Centers
0 10 20 30 40 500
0.1
0.2
0.3
0.4
0.5
0.6
0.7
0.8
0.9
1
Error
CD
F
Fix−Win−6Fix−Win−12Adap−WinWithout−Filter
(a) Day03
0 5 10 15 20 25 30 350
0.1
0.2
0.3
0.4
0.5
0.6
0.7
0.8
0.9
1
Error
CD
F
Fix−Win−6Fix−Win−12Adap−WinWithout−Filter
(b) Day06
Figure 6: Cumulative distribution function of relative error for the single predicatedvalue: adaptive historical window-size vs fixed window-size
20 25 30 35 40 450
0.1
0.2
0.3
0.4
0.5
0.6
0.7
0.8
0.9
1
Window−size
CD
F
Day03−(532,20)Day09−(487,60)Day06−(423,37)Day22−(723,43)
Figure 7: Cumulative distribution function of window-size for the 4 days
4.1 CPU utilization prediction
CPU utilization prediction is the first stage in our proposed approach. This stage al-lows predicting the future CPU utilization of a virtual machine. Consequently, we candetect the change in advance before that might occur. Furthermore, resource manage-ment algorithms can work pro-actively to provide a suitable solution instead of waitingthe measured time series of utilization T Sm to be revealed. To this end, we used theprediction approach that was presented in Section 3.
4.2 CPU utilization state representation
After prediction of a time series of CPU utilization T Sp, it passes to the second stageconverting T Sp to T Sr state-representation that represents the changes in the time se-ries. Thus, we used ROBUST.FILTER that proposed in [13]. ROBUST.FILTER was
198 Fall Workshop 2012
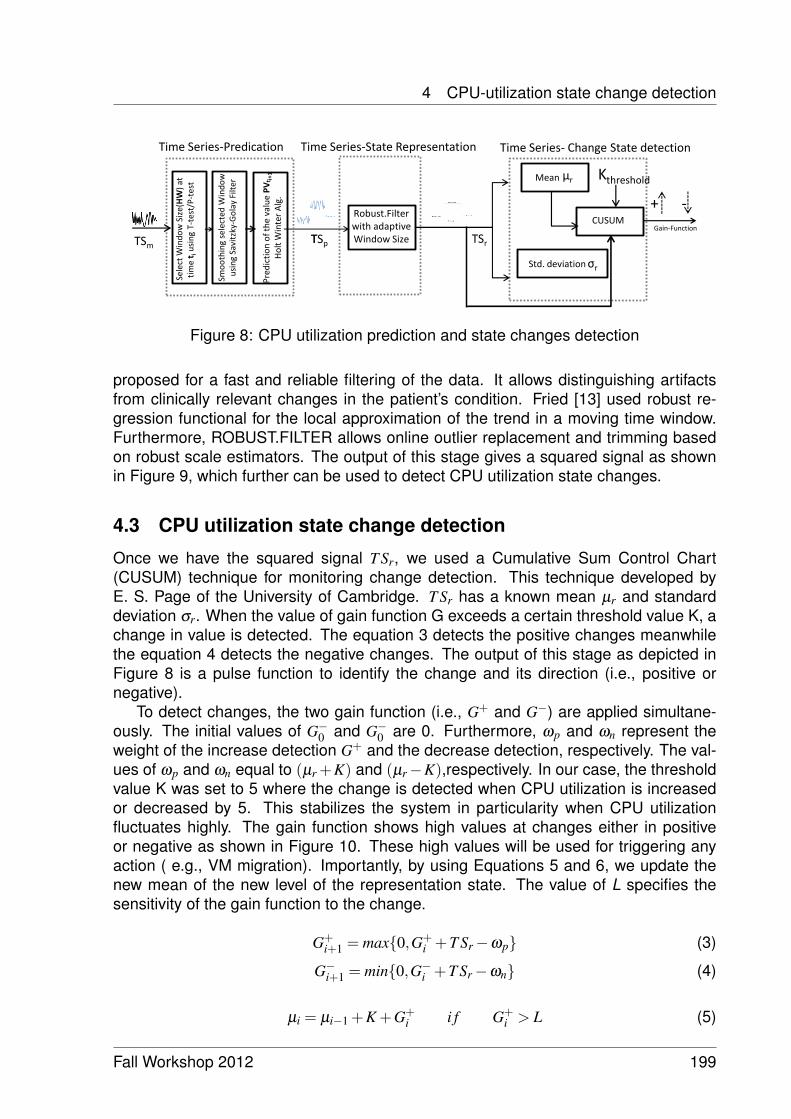
4 CPU-utilization state change detection
Robust.Filter with adaptive Window Size
CUSUM
TSp TSr
Mean μr
σr Std. deviation
Kthreshold
+ -
Gain-Function
Time Series-State Representation Time Series- Change State detection Time Series-Predication
Smo
oth
ing
sele
cted
Win
do
w
usi
ng
Savi
tzky
-Go
lay
Filt
er
Pre
dic
tio
n o
f th
e va
lue
PV
t i+1
Ho
lt W
inte
r A
lg.
Sele
ct W
ind
ow
Siz
e(HW
) at
ti
me
t i u
sin
g T-
test
/P-t
est
TSm T
Figure 8: CPU utilization prediction and state changes detection
proposed for a fast and reliable filtering of the data. It allows distinguishing artifactsfrom clinically relevant changes in the patient’s condition. Fried [13] used robust re-gression functional for the local approximation of the trend in a moving time window.Furthermore, ROBUST.FILTER allows online outlier replacement and trimming basedon robust scale estimators. The output of this stage gives a squared signal as shownin Figure 9, which further can be used to detect CPU utilization state changes.
4.3 CPU utilization state change detection
Once we have the squared signal T Sr, we used a Cumulative Sum Control Chart(CUSUM) technique for monitoring change detection. This technique developed byE. S. Page of the University of Cambridge. T Sr has a known mean µr and standarddeviation σr. When the value of gain function G exceeds a certain threshold value K, achange in value is detected. The equation 3 detects the positive changes meanwhilethe equation 4 detects the negative changes. The output of this stage as depicted inFigure 8 is a pulse function to identify the change and its direction (i.e., positive ornegative).
To detect changes, the two gain function (i.e., G+ and G−) are applied simultane-ously. The initial values of G−0 and G−0 are 0. Furthermore, ωp and ωn represent theweight of the increase detection G+ and the decrease detection, respectively. The val-ues of ωp and ωn equal to (µr +K) and (µr−K),respectively. In our case, the thresholdvalue K was set to 5 where the change is detected when CPU utilization is increasedor decreased by 5. This stabilizes the system in particularity when CPU utilizationfluctuates highly. The gain function shows high values at changes either in positiveor negative as shown in Figure 10. These high values will be used for triggering anyaction ( e.g., VM migration). Importantly, by using Equations 5 and 6, we update thenew mean of the new level of the representation state. The value of L specifies thesensitivity of the gain function to the change.
G+i+1 = max{0,G+
i +T Sr−ωp} (3)
G−i+1 = min{0,G−i +T Sr−ωn} (4)
µi = µi−1 +K +G+i i f G+
i > L (5)
Fall Workshop 2012 199
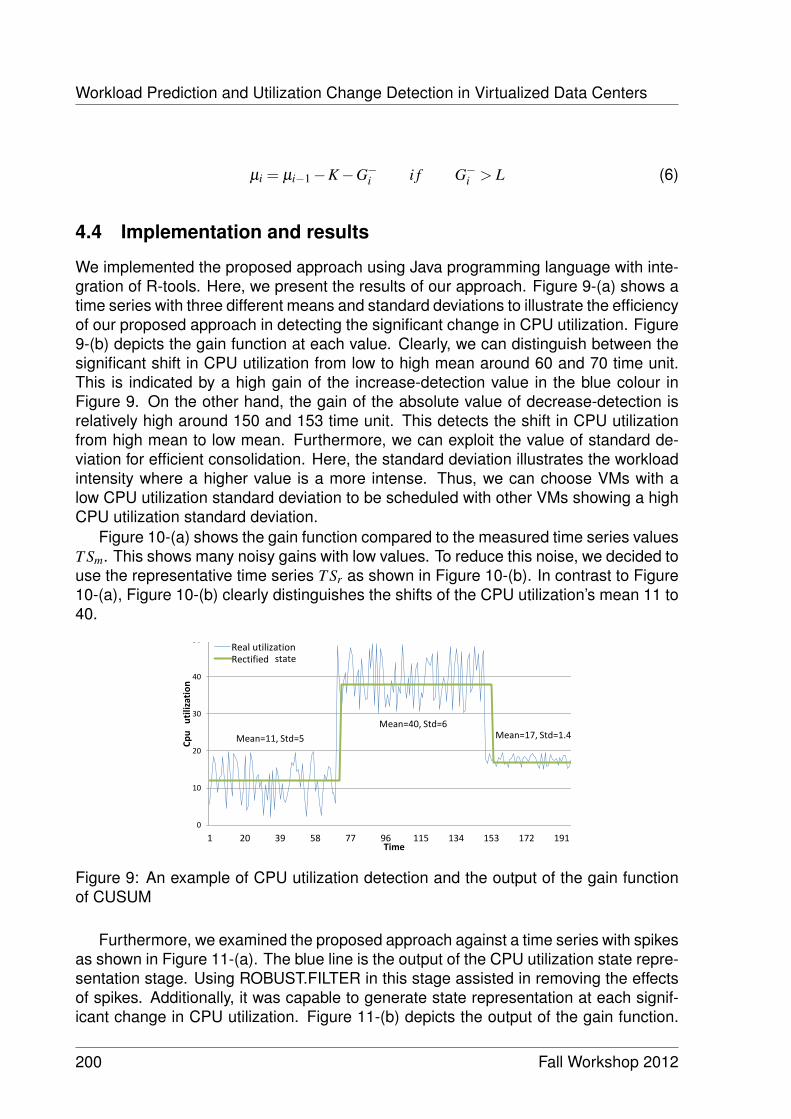
Workload Prediction and Utilization Change Detection in Virtualized Data Centers
µi = µi−1−K−G−i i f G−i > L (6)
4.4 Implementation and results
We implemented the proposed approach using Java programming language with inte-gration of R-tools. Here, we present the results of our approach. Figure 9-(a) shows atime series with three different means and standard deviations to illustrate the efficiencyof our proposed approach in detecting the significant change in CPU utilization. Figure9-(b) depicts the gain function at each value. Clearly, we can distinguish between thesignificant shift in CPU utilization from low to high mean around 60 and 70 time unit.This is indicated by a high gain of the increase-detection value in the blue colour inFigure 9. On the other hand, the gain of the absolute value of decrease-detection isrelatively high around 150 and 153 time unit. This detects the shift in CPU utilizationfrom high mean to low mean. Furthermore, we can exploit the value of standard de-viation for efficient consolidation. Here, the standard deviation illustrates the workloadintensity where a higher value is a more intense. Thus, we can choose VMs with alow CPU utilization standard deviation to be scheduled with other VMs showing a highCPU utilization standard deviation.
Figure 10-(a) shows the gain function compared to the measured time series valuesT Sm. This shows many noisy gains with low values. To reduce this noise, we decided touse the representative time series T Sr as shown in Figure 10-(b). In contrast to Figure10-(a), Figure 10-(b) clearly distinguishes the shifts of the CPU utilization’s mean 11 to40.
0
10
20
30
40
50
60
1 20 39 58 77 96 115 134 153 172 191
Cp
u
uti
lizat
ion
Time
Real utilization
Rectified
-
state
Mean=11, Std=5
Mean=40, Std=6
Mean=17, Std=1.4
Figure 9: An example of CPU utilization detection and the output of the gain functionof CUSUM
Furthermore, we examined the proposed approach against a time series with spikesas shown in Figure 11-(a). The blue line is the output of the CPU utilization state repre-sentation stage. Using ROBUST.FILTER in this stage assisted in removing the effectsof spikes. Additionally, it was capable to generate state representation at each signif-icant change in CPU utilization. Figure 11-(b) depicts the output of the gain function.
200 Fall Workshop 2012
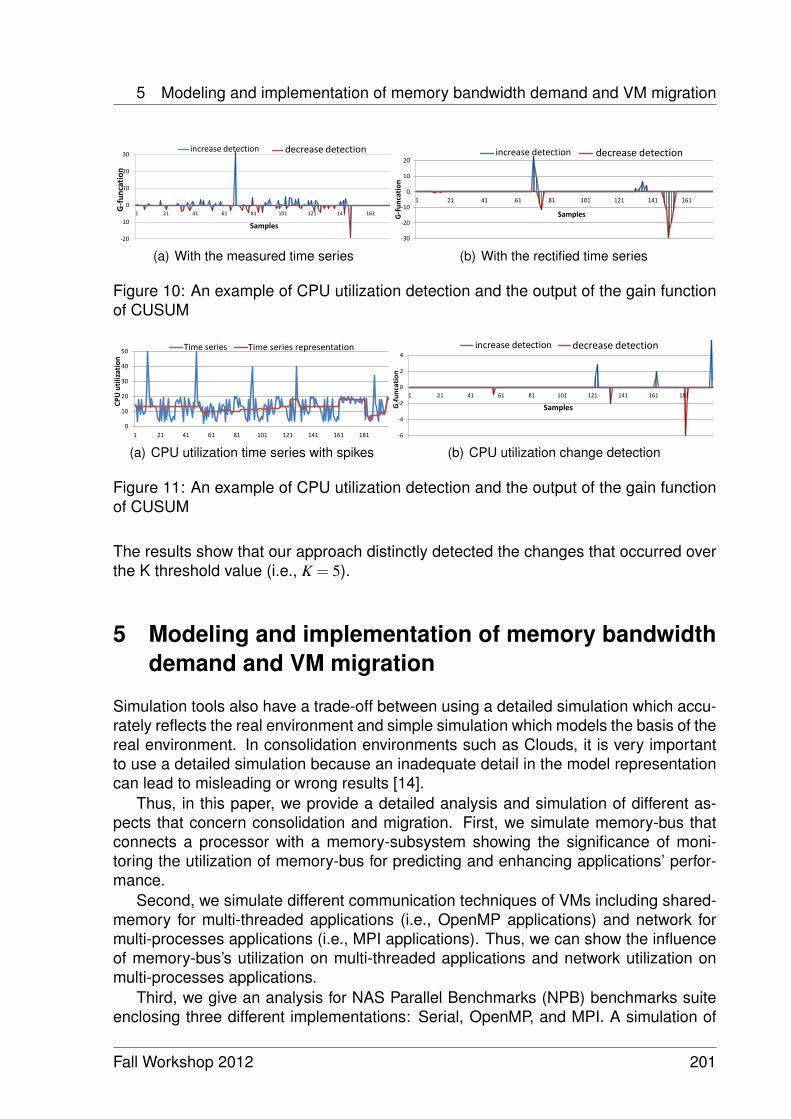
5 Modeling and implementation of memory bandwidth demand and VM migration
-30
-20
-10
0
10
20
30
40
18
1
18
6
19
1
19
6 G-f
un
cati
on
Samples
increase detection decrease detection
1 21 41 61 81 101 121 141 161
(a) With the measured time series -40
-30
-20
-10
0
10
20
30
1 21 41 61 81 101 121 141 161 181
G-f
un
cati
on
Samples
increase detection decrease detection
(b) With the rectified time series
Figure 10: An example of CPU utilization detection and the output of the gain functionof CUSUM
0
10
20
30
40
50
60
1 21 41 61 81 101 121 141 161 181
CP
U u
tiliz
atio
n
Time series Time series representation
(a) CPU utilization time series with spikes -8
-6
-4
-2
0
2
4
8
1 21 41 61 81 101 121 141 161 181 G
-fun
cati
on
Samples
increase detection
decrease detection
(b) CPU utilization change detection
Figure 11: An example of CPU utilization detection and the output of the gain functionof CUSUM
The results show that our approach distinctly detected the changes that occurred overthe K threshold value (i.e., K = 5).
5 Modeling and implementation of memory bandwidthdemand and VM migration
Simulation tools also have a trade-off between using a detailed simulation which accu-rately reflects the real environment and simple simulation which models the basis of thereal environment. In consolidation environments such as Clouds, it is very importantto use a detailed simulation because an inadequate detail in the model representationcan lead to misleading or wrong results [14].
Thus, in this paper, we provide a detailed analysis and simulation of different as-pects that concern consolidation and migration. First, we simulate memory-bus thatconnects a processor with a memory-subsystem showing the significance of moni-toring the utilization of memory-bus for predicting and enhancing applications’ perfor-mance.
Second, we simulate different communication techniques of VMs including shared-memory for multi-threaded applications (i.e., OpenMP applications) and network formulti-processes applications (i.e., MPI applications). Thus, we can show the influenceof memory-bus’s utilization on multi-threaded applications and network utilization onmulti-processes applications.
Third, we give an analysis for NAS Parallel Benchmarks (NPB) benchmarks suiteenclosing three different implementations: Serial, OpenMP, and MPI. A simulation of
Fall Workshop 2012 201
References
the memory demands behavior and communication patterns of each benchmark arealso presented. To validate simulation, we compare the results with the real experi-ments that have been presented in [15].
Finally, many migration algorithms consider only CPU utilization to trigger live migra-tion, but they do not consider the consequences of migration’s overheads on the otherserver resource such as memory bus and network. Hence, we illustrate the effectsof migration on CPU, memory bus, and network and their consequences on migrationtime and power consumption. The details of this work are presented in [16].
6 Summary and Next step
In this report, we presented our work that included implementation of an adaptive work-load prediction, CPU utilization state changes detection, and modeling and implemen-tation of memory bandwidth demand of the NAS Parallel Benchmark suite. Further-more, we presented the results of our work for the adaptive workload prediction andCPU utilization state changes detection. These results showed the efficiency of ourapproach to be used for capacity planning in virtualized data centers.
Regarding our next step, we will investigate improving the accuracy of CPU utiliza-tion prediction and increasing the number of lookahead steps. Furthermore, we willconduct more experiments to study the efficiency of our algorithm in server consolida-tion based on CPU utilization state changes detection. As we mentioned earlier, wecan use the standard deviation of the CPU utilization state to identify the running jobintensity instead of just using the mean value. This will be investigated within the next6 months.
As we implemented the prediction approach based on a range not a single value,we will study the implementation of robust optimization for capacity planning. Robustoptimization deals with optimization problems where robustness is sought against un-certainty or deterministic variability in the value of a parameter of the problem (i.e.,the workload). The principle of robust optimization considers point prediction mean-ingless and it replaced by range prediction. Thus, robust optimization addresses datauncertainty by assuming that uncertain parameters belong to a bounded range.
In our approach, we avoid the assumption that considers the precise knowledgeof the workload demand in the planning horizon where many proposed solutions havesolved the problem as a deterministic optimization (i.e., pro-active) [1] [2] [3].
References
[1] D. Kusic, JO. Kephart, JE. Hanson, N. Kandasamy, and G. Jiang, ”Power andperformance management of virtualized computing environments via lookaheadcontrol, " Proceedings of the 5th IEEE ICAC. Chicago, USA, June 2008.
[2] A. Verma, P. Ahuja, A. Neogi, ”pMapper: Power and migration cost aware applica-tion placement in virtualized systems," Proceedings of the 9th ACM/IFIP/USENIX
202 Fall Workshop 2012
References
International Conference on Middleware (Middleware 2008), Springer, Leuven,Belgium, 2008; 243-264.
[3] A. Gandhi, M. Harchol-Balter, R. Das, C. Lefurgy, ”Optimal power allocation inserver farms," Proceedings of the 11th International Joint Conference on Mea-surement and Modeling of Computer Systems, ACM New York, NY, USA, 2009;157-168.
[4] BOOTING-TIME.[Online]. Available:http://www.tomshardware.co.uk/ubuntu-oneiric-ocelot-benchmark-review,review-32377-15.html.[Accessed: 1-Jun-2012].
[5] M. Mao and M. Humphrey, ” a performance study on the VM startup time in thecloud," Proc. of fifth IEEE International Conference on Cloud Computing, 2012.
[6] Y. Wu, K. Hwang, Y. Yuan , and W. Zheng, ”Adaptive Workload Prediction of GridPerformance in Confidence Windows," IEEE Trans. on Parallel and DistributedSystem, 2009.
[7] M. J. Clement and M.J. Quinn, ”Analytical Performance Prediction on Multicom-puters," J. Supercomputing, pp. 886-894, 1993.
[8] J. Dongarra, I. Fister, G. Fox, W. Gropp, K. Kennedy, L. Torczon, and A. White,eds. Kaufman Publishers, 2002.
[9] I. Foster and C. Kesselman, ”The Grid: Blueprint for a New Computing Infrastruc-ture," Kaufmann Publishers, 2004.
[10] M. Andreolini, S. Casolari, M. Colajanni, ”Models and framework for supportingrun-time decisions in web-based systems," ACM Tran. on the Web 2 (3)(2008).
[11] P. Dinda, D. O’Hallaron, ”Host load prediction using linear models," Cluster Com-puting 3 (4) (2000) 265-280.
[12] E. Hartikainen, S. Ekelin, ”Enhanced network-state estimation using change de-tection," in: Proc. of the 31st IEEE Conf. on Local Computer Networks, Nov. 2006.
[13] R. Fried, ”Robust filtering of time series with trends," Journal of NonparametricStatistics, vol. 16, no. 3-4, pp. 313-328, Jun. 2004.
[14] D. Cavin, Y. Sasson, and A. Schiper, ” On the accuracy of manet simulators,"In POMC ’02: Proc. of the Second ACM Int. Workshop on Principles of MobileComputing, pages 38-43, New York, NY, USA, 2002. ACM Press.
[15] U. K. Medisetty, V. Beltran, D. Carrera, M. Gonzalez, J. Torres, and E. Ayguade,”Efficient HPC application placement in Virtualized Clusters using low level hard-ware monitoring," [Online]. Available:http://www.udaykiranm.com/hpcvirt.pdf
[16] I. Takouna, W. Dawoud, and Ch. Meinel, ”Analysis and Simulation of HPC Appli-cations in Virtualized Data Centers,"IEEE GreenCom, 2012.
Fall Workshop 2012 203

Understanding Code with ExecutionTraces
Arian Treffer
Enterprise Platform and Integration ConceptsHasso-Plattner-Institut
This report outlines research ideas that were formed over the last few months. Wepropose to use an in-memory database to store and access execution traces, espe-cially of unit tests. Based on this, IDEs can be extended to search and visualize thedata in the context of its source. This might help to increase developer productivitywhen understanding code or searching for bugs.
1 Introduction
Most developers spend much time understanding existing code. Especially in largesystems, another important task is finding the code in the first place [4]. Programmerssearch code for various reasons, for instance,
• finding code that implements a feature,
• finding existing solutions to similar problems, or
• understanding how a code unit is used.
At development time, runtime information is not available. However, unit tests area source for reproducible runtime data. In a well-tested system, the tests should pro-vide enough runtime information of common executions paths, as well as anticipatedexcpetional cases, to answer typical questions about a program’s behavior.
There are several different approaches to work on runtime data of unit tests. Somedevelopment tools collect only parts of the data, and discard information that is nolonger regarded relevant [1]. Others re-execute tests repeatately, collecting only thedata that is currently needed [5].
However, for a system-wide search these approaches cannot be used, as all data isneeded at once. A third, and maybe the most obvious approach, is to collect and storeeverything that happens during the execution. This approach has been successfullyused to implement omniscient debuggers [2]. However, it is generally assumend that,especially for large systems, this approach creates more data than can be handled ina reasonable manner [1,2,5].
We want to challenge this assumption and propose that a modern database is ca-pable of handling the trace data of unit tests even for business size applications. Re-cent development in databases allows the fast execution of analytical queries on largeamounts of data [6]. This technology was already succesfully applied to static codesearch [3]. However, this system does not include runtime information.
Fall Workshop 2012 205
Understanding Code with Execution Traces
2 Research Idea
Execution traces of unit tests can be stored in a database. Then, an extension tothe developer’s IDE can allow searching this data in a meaningful way. It does notseem reasonable to expect the developer to formulate an exact query (e.g., in an SQL-like language) of what she is looking for. Instead, a graphical interface can help withthe construction of the query. The developer begins with browsing the results of avery broad query, which then can be refined incrementally, until the result set is smallenough so that each result can be examined individually. Using an in-memory willensure the fast response time that is necessary for performing incremental searches.
The research will show which data layouts are optimal for efficiently answering de-velopers’ questions, how user interfaces can be designed to incrementally formulatequeries on execution traces, and how complex queries are that developers want toask.
3 Further Applications
There more useful applications to trace data, that can build upon a fast analyticalsearch. For instance, the IDE can quickly visualize execution paths and variable val-ues that a developer should expect in a given method, show the typical history of anobject’s state, or provide a usage-search for virtual methods that is more precise thanthe current search, based solely on static analysis.
Furthermore, it should be possible to implement an omniscient debugger on top ofthe database. This debugger would not only allow forward and backward stepping, butcould also perfom semantic steps, such as
• “step to the next invocation of this method,”
• “find another invocation of this method (maybe even in a different trace), whereone parameter is different,” or
• “go back to the last step where this field was read or written.”
Until now, we only considered unit tests as a source for reproducible executiontraces. However, when the entire trace is stored, it does not have to be reproducible.Thus, the proposed system could also be used to find non-deterministic bugs, for in-stance, bugs that are caused by racing conditions or arbitrary output of external sys-tems.
4 Summary
Searching code using runtime information can help to find code that implements afeature of interest or to locate the source of a bug. An incremental approach shouldallow to formulate complex queries that will yield a sufficiently narrow result set. Usingan in-memory database should ensure good response times even for large systems.
206 Fall Workshop 2012

References
Once a prototype is implemented, user studies will have to show which questionsare asked, how the construction of queries can be supported, and to which extend thishelper can increase developer productivity.
References
[1] Christoph Hofer, Marcus Denker, and Stéphane Ducasse. Design and implemen-tation of a backward-in-time debugger. NODe 2006, pages 17–32, 2006.
[2] Bil Lewis. Debugging Backwards in Time arXiv : cs / 0310016v1 [ cs . SE ] 9 Oct2003. (September):225–235, 2003.
[3] Oleksandr Panchenko, Jan Karstens, Hasso Plattner, and Alexander Zeier. Preciseand Scalable Querying of Syntactical Source Code Patterns Using Sample CodeSnippets and a Database. In 2011 IEEE 19th International Conference on ProgramComprehension, pages 41–50. IEEE, June 2011.
[4] Oleksandr Panchenko, Hasso Plattner, and Alexander Zeier. What do developerssearch for in source code and why. Proceeding of the 3rd international workshopon Search-driven development: users, infrastructure, tools, and evaluation - SUITE’11, pages 33–36, 2011.
[5] Michael Perscheid, Bastian Steinert, Robert Hirschfeld, Felix Geller, and MichaelHaupt. Immediacy through Interactivity: Online Analysis of Run-time Behavior.In 2010 17th Working Conference on Reverse Engineering, pages 77–86. IEEE,October 2010.
[6] H. Plattner and A. Zeier. In-Memory Data Management: An Inflection Point forEnterprise Applications. Springer, 2011.
Fall Workshop 2012 207

Duplicate Decision for Data Quality WebServices
Tobias Vogel
ForschungskollegHasso-Plattner-Institut
Data Quality is an abstract measure of how well data can be utilized. Data Cleans-ing is the process of establishing this quality. This report describes this process andshows how to reduce the computational effort while keeping up the accuracy. More-over, means to further automate the duplicate decision process are outlined.
1 Data Quality Services
“The only thing constant in life is change”1 as the socio-economic change of the last200 years shows. Developing from an agrarian society over the industrial and serviceera, mankind has reached the information society age. Many companies now base onand trade data. The enormous amount of data is continuously rising as well as therate of interchange between different stakeholders, whether companies, governmentalinstitutions, or divisions within.
To enable this interchange and to generally manage the mass of data, the informa-tion’s data quality has to be high. This renders the data comparable, interchangeable,searchable, etc. Data quality refers to the data being complete, relevant, trustworthy,accessible, . . . , and duplicate-free. Data cleansing helps assuring these properties.Moreover, this activity shall be fast, cheap, and accurate.
Automatic data cleansing services promise to serve these requirements. A datacleansing service identifying multiple representations of same real-world objects (du-plicates) adheres to the following workflow shown in Figure 1.
1.1 Analyze Input
In the first phase, preparative tasks are performed. This comprises, for example, theremoval of noise (special or non-printable characters) or stop words. If the datasetoriginates from different sources, the different schemas might be aligned to make thedatasets comparable. With that, attributes may have to be joined together (such asstreet addresses) or be separated (such as given and family names). Records andtheir properties have to be separated and sorted to be individually accessible. Thefollowing sequence is applied.
1Heraklit of Ephesus
Fall Workshop 2012 209
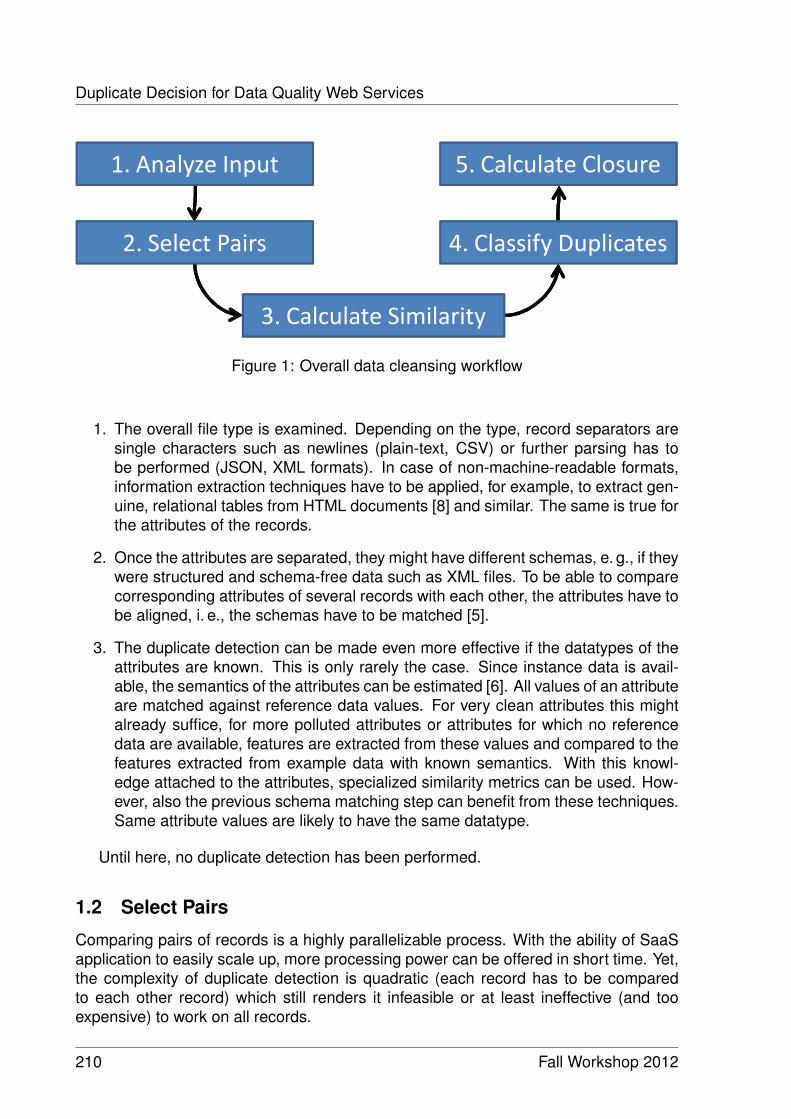
Duplicate Decision for Data Quality Web Services
������������ �����
������������� ��������� ���������
������� �� ����� ������������ �������
Figure 1: Overall data cleansing workflow
1. The overall file type is examined. Depending on the type, record separators aresingle characters such as newlines (plain-text, CSV) or further parsing has tobe performed (JSON, XML formats). In case of non-machine-readable formats,information extraction techniques have to be applied, for example, to extract gen-uine, relational tables from HTML documents [8] and similar. The same is true forthe attributes of the records.
2. Once the attributes are separated, they might have different schemas, e. g., if theywere structured and schema-free data such as XML files. To be able to comparecorresponding attributes of several records with each other, the attributes have tobe aligned, i. e., the schemas have to be matched [5].
3. The duplicate detection can be made even more effective if the datatypes of theattributes are known. This is only rarely the case. Since instance data is avail-able, the semantics of the attributes can be estimated [6]. All values of an attributeare matched against reference data values. For very clean attributes this mightalready suffice, for more polluted attributes or attributes for which no referencedata are available, features are extracted from these values and compared to thefeatures extracted from example data with known semantics. With this knowl-edge attached to the attributes, specialized similarity metrics can be used. How-ever, also the previous schema matching step can benefit from these techniques.Same attribute values are likely to have the same datatype.
Until here, no duplicate detection has been performed.
1.2 Select Pairs
Comparing pairs of records is a highly parallelizable process. With the ability of SaaSapplication to easily scale up, more processing power can be offered in short time. Yet,the complexity of duplicate detection is quadratic (each record has to be comparedto each other record) which still renders it infeasible or at least ineffective (and tooexpensive) to work on all records.
210 Fall Workshop 2012
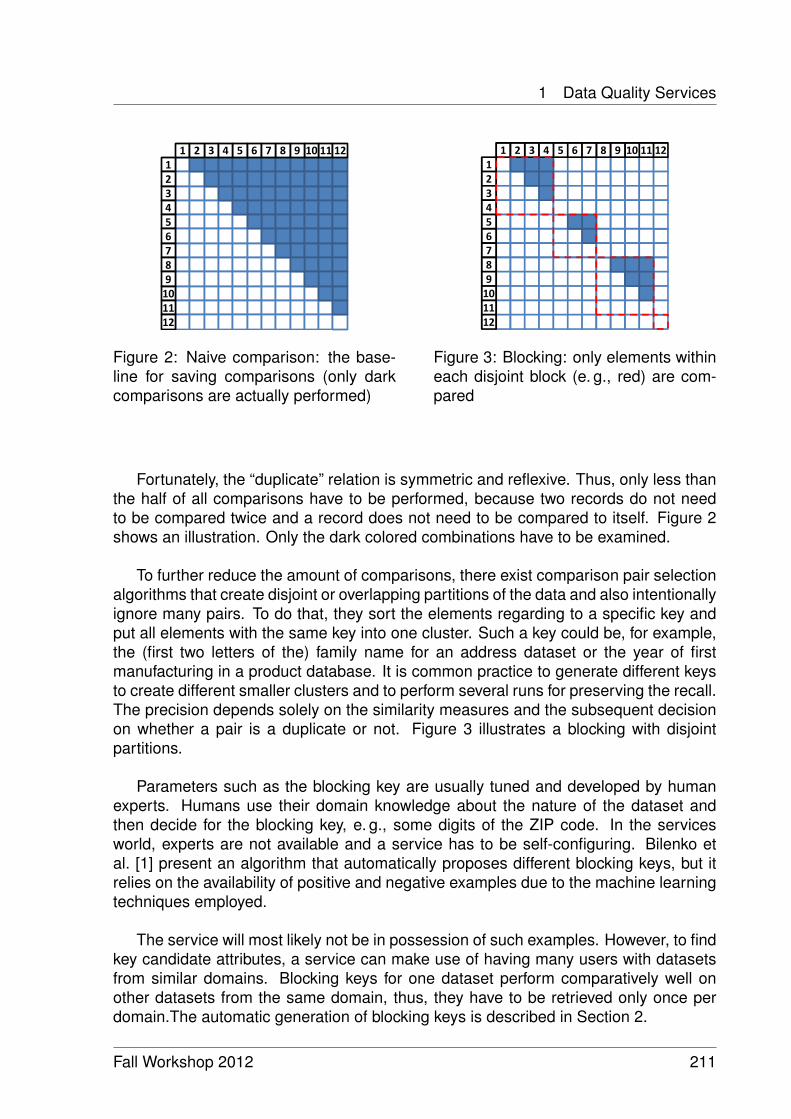
1 Data Quality Services
11101 3 54 6 87 9 12123456789101112
2
Figure 2: Naive comparison: the base-line for saving comparisons (only darkcomparisons are actually performed)
����� � � � �� � ��
�
�
�
�
�
�
�
�
�
��
��
��
� �
Figure 3: Blocking: only elements withineach disjoint block (e. g., red) are com-pared
Fortunately, the “duplicate” relation is symmetric and reflexive. Thus, only less thanthe half of all comparisons have to be performed, because two records do not needto be compared twice and a record does not need to be compared to itself. Figure 2shows an illustration. Only the dark colored combinations have to be examined.
To further reduce the amount of comparisons, there exist comparison pair selectionalgorithms that create disjoint or overlapping partitions of the data and also intentionallyignore many pairs. To do that, they sort the elements regarding to a specific key andput all elements with the same key into one cluster. Such a key could be, for example,the (first two letters of the) family name for an address dataset or the year of firstmanufacturing in a product database. It is common practice to generate different keysto create different smaller clusters and to perform several runs for preserving the recall.The precision depends solely on the similarity measures and the subsequent decisionon whether a pair is a duplicate or not. Figure 3 illustrates a blocking with disjointpartitions.
Parameters such as the blocking key are usually tuned and developed by humanexperts. Humans use their domain knowledge about the nature of the dataset andthen decide for the blocking key, e. g., some digits of the ZIP code. In the servicesworld, experts are not available and a service has to be self-configuring. Bilenko etal. [1] present an algorithm that automatically proposes different blocking keys, but itrelies on the availability of positive and negative examples due to the machine learningtechniques employed.
The service will most likely not be in possession of such examples. However, to findkey candidate attributes, a service can make use of having many users with datasetsfrom similar domains. Blocking keys for one dataset perform comparatively well onother datasets from the same domain, thus, they have to be retrieved only once perdomain.The automatic generation of blocking keys is described in Section 2.
Fall Workshop 2012 211
Duplicate Decision for Data Quality Web Services
1.3 Calculate Similarity and Classify Duplicates
In this phase, the similarity between the records is calculated, that have been markedas promising in the pair selection phase (Section 1.2). Once the pairs are selected,specific similarity measures are applied on each pair of attribute values. There areseveral general-purpose similarity measures such as Edit Distance, Jaro-Winkler, andJaccard similarity. However, knowing about the very nature of an attribute, commonmisspellings, and – more important – acceptable differences (known from the analysisphase (Section 1.1)), strongly increases the significance of the similarity measure.
After similarity scores for all relevant pairs are calculated, they have to be used todecide, whether a pair of records should be regarded as duplicate. This can be donevia weighted sums or decision trees, for example. Section 3 outlines how the blockinginformation can be re-used to take the duplication decision.
1.4 Calculate Closure
With the previous step, a list of duplicate pairs was declared. However, it is not clearwhether there are only pairwise duplicates. There are probably clusters of duplicatesfrom which only a small fraction is explicitly listed, up to this point. Thus, the pairs haveto be joined to clusters. For example, the transitive closure can be calculated or someother clustering means has to be applied.
2 Blocking
It is possible to find suitable blocking keys (see Section 1.2) automatically for a datasetequipped with a gold standard, the training dataset. Those blocking keys can be re-used for datasets from similar domains lacking a gold standard [7], the test dataset(s).To be general and to support a large variety of data types, blocking keys are createdbased on unigrams.
2.1 Problem Formalization
The formalized problem is as follows: Given a dataset and its schema, find a validblocking key (or a set of k valid blocking keys) that achieves the optimal trade-off be-tween pairs completeness and efficiency. The details are explained below. A blockingkey consists of a set of unikeys. Each unikey is a combination of an attribute (e.g., ZIPcode) and a position within this attribute. Applying such a unikey on actual attributevalues yields said unigrams.
Validity
Usually, a dataset different from the training dataset will comprise other attributes. Agiven blocking key is called valid in a test dataset, iff all of its unikeys are available inthe test dataset, both regarding the availability of the schema attributes as well as the
212 Fall Workshop 2012
2 Blocking
attribute lengths. The attribute length is defined by the schema (e. g., a CHAR(100) inSQL) or is infinite for other data sources (e. g., CSV files).
Pairs completeness
The pairs completeness [2, 4] is the measure of how many of the duplicates can befound for a blocking key, i. e., how effective the blocking key is.
A blocking key is used to create a partitioning to pre-classify duplicate records. Sub-sequently, a similarity measure is applied on each possible pair within each partition. Ifthe pair’s similarity is above a given threshold, it is treated as a duplicate, otherwise asa non-duplicate. The ratio of actual duplicates among the declared pairs divided by allduplicates is called recall and serves as the pairs completeness. In our experiments,we replace such a similarity measure by a lookup in the true matches.
Efficiency
A blocking key is efficient if it uses relatively few comparisons to achieve a given pairscompleteness. Thus, the measure for efficiency is the average number of performedcomparisons for each found duplicate.
In practice, however, the number of comparisons should not exceed a fixed thresh-old θ . We express efficiency by normalizing the number of comparisons c according toθ and subtract it from 1 to align it to the pairs completeness. Thus, efficiency is definedas 1− ( c
θ) ∈ [0,1], assuming c≤ θ .
This measure resembles the term Filtered Reduction Ratio [2]. Yet using the actualnumber of potential comparisons (5 ·1010 for 100,000 tuples) in the denominator wouldusually create a value close to 1. Therefore, we adapt the notion by Gu and Baxter,but instead of a filtering step, we give the efficiency in relation to a baseline approach.In our case this is the number of comparisons, the Sorted Neighborhood approach [3]would have created.
Overall Blocking Key Quality (BQ)
A good blocking key should be effective and efficient. Therefore, we define the Over-all Blocking Key Quality BQ as the harmonic mean between pairs completeness andefficiency (BQ = 2·PC·Ey
PC+Ey ), where PC is pairs completeness and Ey is efficiency.
2.2 Key Generation Workflow
Automatic blocking key generation is performed in two steps. First, for a training datasetwith a given gold standard, all combinatorially possible blocking keys are evaluated.Second, for a test dataset, typically lacking a gold standard, the previously created listof blocking keys is iterated to find the best valid blocking key.
Fall Workshop 2012 213

Duplicate Decision for Data Quality Web Services
Training Phase
As the first step, good blocking keys are identified:
1. Generate all possible unikey combinations (i. e., blocking keys).
2. For each blocking key perform a duplicate detection experiment on the referencedataset:
(a) If the number of comparisons exceeds the threshold θ , discard this blockingkey.
(b) Else, calculate the achieved overall blocking key quality (BQ) for the blockingkey.
3. Sort all non-discarded blocking keys descendingly by BQ.
Production Phase
The keys from the training phase can subsequently be used to find duplicates in testdatasets of similar domains.
1. For each blocking key in the previously calculated list, check for validity for thecurrent dataset.
2. For each remaining valid blocking key (still ordered by BQ), start a duplicate de-tection run.
(a) If the number of comparisons exceeds a certain threshold, abort the run,keeping the so-far detected duplicates.
(b) Else, finish the duplicate detection run until one of the following abortioncriteria is fulfilled: the desired number of passes have been executed, thetotal number of actually performed comparisons over all runs exceeds athreshold, the overall efficiency sinks below a given threshold (i. e., no ornot enough new duplicates are found), or the number of detected duplicatesis sufficient. Note that the thresholds might be domain dependent or givenby a user.
2.3 Evaluation
The experiments were performed on different random samples of two address datasetsexamining 6 million blocking keys. Table 1 shows the most successful blocking keyswith regard to the number of found duplicates, comparisons, pairs completeness, effi-ciency, and BQ. To compare, an “expert guess” – the ad-hoc blocking key [city-0,familyname-0, givenname-0, zip-0] a human expert might have come up with– only found 274 of the 804 duplicates to find. However, achieving a very high efficiencyvalue is typical for user-provided blocking keys.
214 Fall Workshop 2012
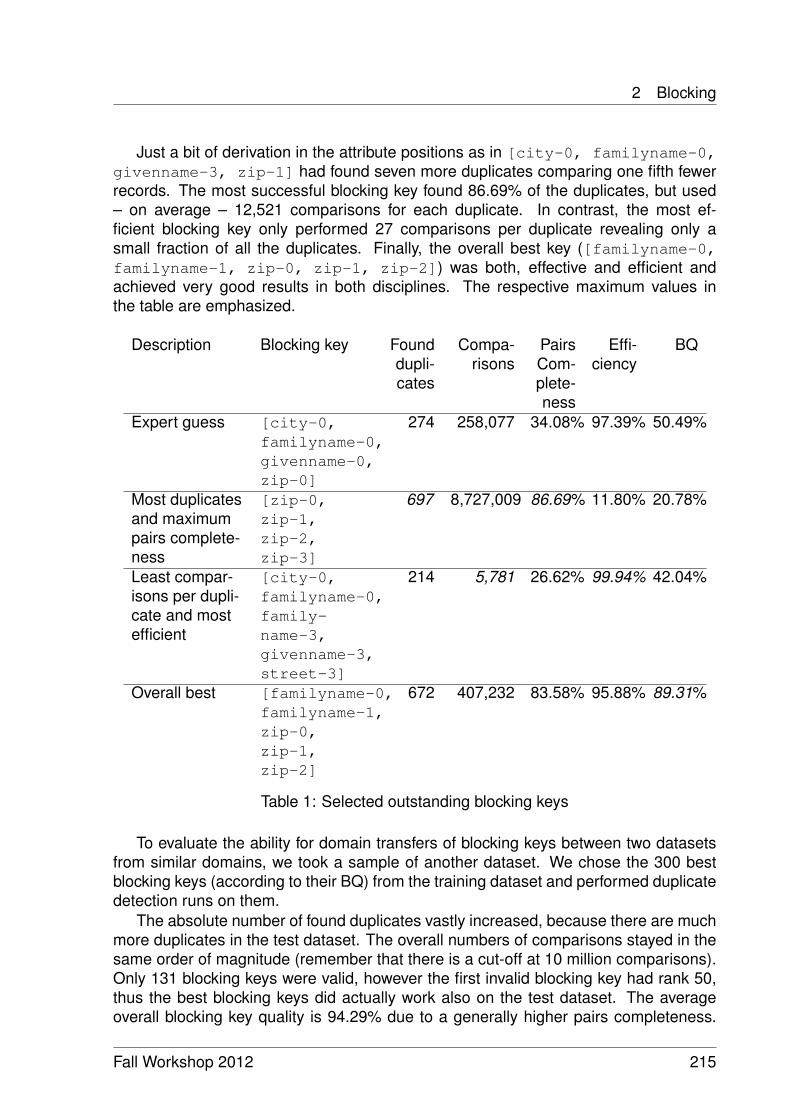
2 Blocking
Just a bit of derivation in the attribute positions as in [city-0, familyname-0,givenname-3, zip-1] had found seven more duplicates comparing one fifth fewerrecords. The most successful blocking key found 86.69% of the duplicates, but used– on average – 12,521 comparisons for each duplicate. In contrast, the most ef-ficient blocking key only performed 27 comparisons per duplicate revealing only asmall fraction of all the duplicates. Finally, the overall best key ([familyname-0,familyname-1, zip-0, zip-1, zip-2]) was both, effective and efficient andachieved very good results in both disciplines. The respective maximum values inthe table are emphasized.
Description Blocking key Founddupli-cates
Compa-risons
PairsCom-plete-ness
Effi-ciency
BQ
Expert guess [city-0,familyname-0,givenname-0,zip-0]
274 258,077 34.08% 97.39% 50.49%
Most duplicatesand maximumpairs complete-ness
[zip-0,zip-1,zip-2,zip-3]
697 8,727,009 86.69% 11.80% 20.78%
Least compar-isons per dupli-cate and mostefficient
[city-0,familyname-0,family-name-3,givenname-3,street-3]
214 5,781 26.62% 99.94% 42.04%
Overall best [familyname-0,familyname-1,zip-0,zip-1,zip-2]
672 407,232 83.58% 95.88% 89.31%
Table 1: Selected outstanding blocking keys
To evaluate the ability for domain transfers of blocking keys between two datasetsfrom similar domains, we took a sample of another dataset. We chose the 300 bestblocking keys (according to their BQ) from the training dataset and performed duplicatedetection runs on them.
The absolute number of found duplicates vastly increased, because there are muchmore duplicates in the test dataset. The overall numbers of comparisons stayed in thesame order of magnitude (remember that there is a cut-off at 10 million comparisons).Only 131 blocking keys were valid, however the first invalid blocking key had rank 50,thus the best blocking keys did actually work also on the test dataset. The averageoverall blocking key quality is 94.29% due to a generally higher pairs completeness.
Fall Workshop 2012 215
Duplicate Decision for Data Quality Web Services
This means that the duplicate characteristics resemble the blocking keys very well,even with data from different languages and domains. Table 2 shows key figures forthe first 10 blocking keys.
3 Duplication Decision
It is common to weigh the similarities concerning to their relevance (for example, gen-der might not be as relevant as family name) to calculate a weighted sum. If this sum isabove a given threshold, the pair is regarded as being duplicate, otherwise not. How-ever, global thresholds are too inflexible. Different partitions might have completelydifferent similarity distributions. For example, John Does from a large city will be fre-quent and only have tiny differences in their pairwise similarities. In contrast, anotherpartition (say) containing inhabitants of a smaller city will have very diverse similarities.Applying a global high threshold will keep the John Does apart but will result in miss-ing all the duplicates in the other partition. Applying a global low threshold will workwell in the second partition but will not classify any pair of John Doe as duplicate. Aglobal fixed threshold is easy to set by a user but will result in poor duplicate decisioncapabilities.
Threshold-based Duplicate Decision The global threshold has to be adapted foreach block. Let there be two blocks of records. Block 1 contains pairwise similaritiesbetween 80% and 95%, block 2 contains similarities between 30% and 90%. A theo-retical, global threshold of 70% would result in an actual threshold of 90.5% for block 1and 72% in block 2. Thus, the different similarity distributions within the specific blocksare taken into consideration.
Blocking-key-based Duplicate Decision More flexibility is offered by a rule-basedapproach. In this case, the similarities are used as predicates within a disjunctivenormal form or in a decision tree. With that, specific irregularities in the dataset canbe covered. For example, if the date and name similarities are above high thresholds,the pair is regarded as a duplicate, ignoring, say, the city similarity. Also negative rulesare possible: if the dates of birth do not match, the pair is classified as non-duplicateregardless of the (possibly high) similarity for family names.
Duplication classifiers need these parameters as input to aggregate a given setof similarities between attributes of a duplicate candidate into a duplication decision.Typically, these parameters change over domains, datasets, and even parts of thedata and a global parameter setting is too inflexible. For example, address recordsmight share the same ZIP code. For ZIP codes belonging to large cities, the cityname is irrelevant as well as parts of the phone number whereas for small cities, thecity name is very distinctive, because several smaller cities might share the same ZIPcode. Consequently, there should be different parameters for different partitions of thedataset.
In the blocking phase (Section 2), partitions were generated whose participantsshare specific characteristics. Those partitions (basing on blocking keys) can be re-
216 Fall Workshop 2012

4 Conclusion
used for the duplicate decision step. Following the pre-requisite, that a gold standardfor a training dataset is available, this standard does also serve for learning appropriaterules for the duplication decision. Again, this knowledge can be transferred to otherdatasets from similar domains. I. e., if the described city example is a general principle,it will generally hold for other datasets. Creating a mapping from blocking keys to rulesets will enable an automated duplicate detection service to autonomously decide onduplication in new, unknown datasets.
4 Conclusion
The process of data cleansing in general and duplicate detection in particular posesmany research opportunities towards increasing effectiveness and efficiency and au-tomating it as a whole. While it has been subject of innumerable efforts since morethan 40 years now, the Software-as-a-Service community did not yet fully investigatethe potential of the particularities of this new approach, namely having many differentcustomers and datasets from different domains as well as being used by unexperi-enced users who cannot tune and tweak all the necessary parameters.
I presented the overall duplicate detection workflow (Section 1) and particularlyshowed how to achieve a good blocking to reduce the computation effort while main-taining accuracy (Section 2). Once these blocks are known, pairwise similarities can becalculated. The next challenge is to make use of these similarities to actually classifya pair of records as being duplicate. I presented two means to do that automaticallywithout human intervention (Section 3). The evaluation of this duplicate decision phaseis left as a next step.
References
[1] Mikhail Bilenko, Beena Kamath, and Raymond J. Mooney. Adaptive blocking:Learning to scale up record linkage. In 6th IEEE International Conference on DataMining (ICDM), 2006.
[2] Lifang Gu and Rohan Baxter. Adaptive filtering for efficient record linkage. Pro-ceedings of the SIAM International Conference on Data Mining (SDM), 2004.
[3] Mauricio A. Hernández and Salvatore J. Stolfo. The merge/purge problem for largedatabases. In Proceedings of the ACM International Conference on Managementof Data (SIGMOD), 1995.
[4] Matthew Michelson and Craig A. Knoblock. Learning blocking schemes for recordlinkage. In Proceedings of the 21st National Conference on Artificial Intelligence(AAAI), 2006.
[5] Erhard Rahm and Philip A. Bernstein. A survey of approaches to automatic schemamatching. VLDB Journal, 2001.
Fall Workshop 2012 217

References
[6] Tobias Vogel and Felix Naumann. Instance-based "one-to-some" assignment ofsimilarity measures to attributes. In Proceedings of the International Conferenceon Cooperative Information Systems (CoopIS), 2011.
[7] Tobias Vogel and Felix Naumann. Automatic blocking key selection for duplicate de-tection based on unigram combinations. In Proceedings of the International Work-shop on Quality in Databases (QDB), 2012.
[8] Yalin Wang and Jianying Hu. Detecting tables in html documents. In Proceedingsof the International World Wide Web Conference (WWW), 2002.
218 Fall Workshop 2012
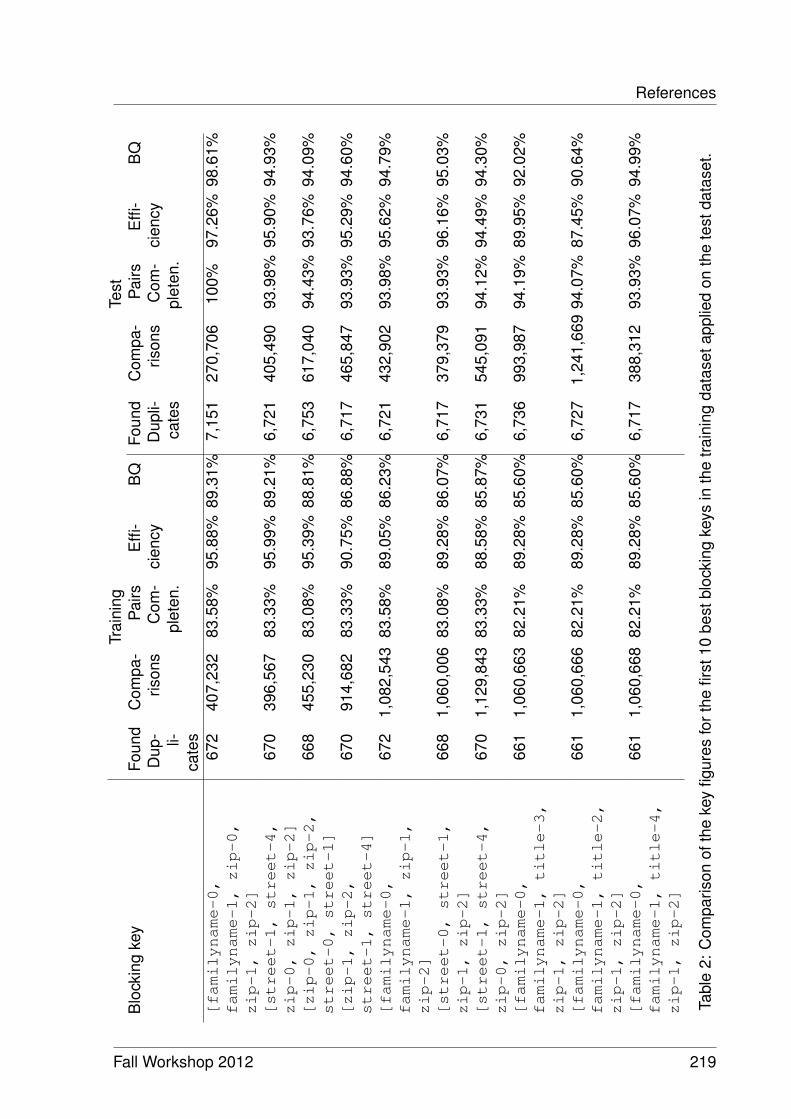
ReferencesTr
aini
ngTe
stB
lock
ing
key
Foun
dD
up- li-
cate
s
Com
pa-
rison
sP
airs
Com
-pl
eten
.
Effi
-ci
ency
BQ
Foun
dD
upli-
cate
s
Com
pa-
rison
sP
airs
Com
-pl
eten
.
Effi
-ci
ency
BQ
[familyname-0,
familyname-1,zip-0,
zip-1,zip-2]
672
407,
232
83.5
8%95
.88%
89.3
1%7,
151
270,
706
100%
97.2
6%98
.61%
[street-1,street-4,
zip-0,zip-1,zip-2]
670
396,
567
83.3
3%95
.99%
89.2
1%6,
721
405,
490
93.9
8%95
.90%
94.9
3%
[zip-0,zip-1,zip-2,
street-0,street-1]
668
455,
230
83.0
8%95
.39%
88.8
1%6,
753
617,
040
94.4
3%93
.76%
94.0
9%
[zip-1,zip-2,
street-1,street-4]
670
914,
682
83.3
3%90
.75%
86.8
8%6,
717
465,
847
93.9
3%95
.29%
94.6
0%
[familyname-0,
familyname-1,zip-1,
zip-2]
672
1,08
2,54
383
.58%
89.0
5%86
.23%
6,72
143
2,90
293
.98%
95.6
2%94
.79%
[street-0,street-1,
zip-1,zip-2]
668
1,06
0,00
683
.08%
89.2
8%86
.07%
6,71
737
9,37
993
.93%
96.1
6%95
.03%
[street-1,street-4,
zip-0,zip-2]
670
1,12
9,84
383
.33%
88.5
8%85
.87%
6,73
154
5,09
194
.12%
94.4
9%94
.30%
[familyname-0,
familyname-1,title-3,
zip-1,zip-2]
661
1,06
0,66
382
.21%
89.2
8%85
.60%
6,73
699
3,98
794
.19%
89.9
5%92
.02%
[familyname-0,
familyname-1,title-2,
zip-1,zip-2]
661
1,06
0,66
682
.21%
89.2
8%85
.60%
6,72
71,
241,
669
94.0
7%87
.45%
90.6
4%
[familyname-0,
familyname-1,title-4,
zip-1,zip-2]
661
1,06
0,66
882
.21%
89.2
8%85
.60%
6,71
738
8,31
293
.93%
96.0
7%94
.99%
Tabl
e2:
Com
paris
onof
the
key
figur
esfo
rthe
first
10be
stbl
ocki
ngke
ysin
the
train
ing
data
seta
pplie
don
the
test
data
set.
Fall Workshop 2012 219

Integrated Software Development forEmbedded Robotic Systems
Sebastian Wätzoldt
Systems Analysis and Modeling GroupHasso Plattner Institute
In the recent years, improvements in robotic hardware have not been matched byadvancements in robotic software and the gap between those two areas has beenwidening. To cope with the increasing complexity of novel robotic embedded systemsan integrated and continuous software development process is required supporting dif-ferent development activities and stages being integrated into an overall developmentmethodology, supported by libraries, elaborated tools and toolchains. For an efficientdevelopment of robotic systems a seamless integration between different activities andstages is required. In the domain of automotive systems, such an overall develop-ment methodology, consisting of different development activities/stages and supportedby elaborated libraries, tools and toolchains, already exists. In this report, we showhow to adapt an existing methodology for the development of automotive embeddedsystems for being applicable on robotic systems.
1 Introduction
In novel robotics applications steady improvements in robotic hardware is not matchedby advancement in robotic software leading to an increasing gap between those twoareas. The increasing complexity of modern robotic systems requires to further sup-port several different software development activities such as modeling, simulation andtesting that allow the incremental development of robot systems, starting with a sin-gle sensor and resulting in a complex application. Elaborated tools and toolchains arerequired to support the different activities and integrate them into an overall and wellstructured development methodology. To realize an efficient software development pro-cess, on the one hand, one has to provide libraries supporting individual developmentactivities at different levels, e.g., at the level of individual sensors and control functionsor at the level of systems or sub-systems, being incrementally composed. On the otherhand, a seamless migration between individual development activities and stages hasto be achieved. Furthermore, one crucial aspect that needs to be considered for alarge portion of robotic systems is real-time behavior.
Accordingly, the following aspects need to be considered for bridging the gap be-tween hardware and software development in novel robotic systems: (I) An overallmethodology is required that supports (II) different development activities like model-ing, simulation and testing at (III) different stages, e.g., simulation, prototyping and
Fall Workshop 2012 221
Integrated Software Development for Embedded Robotic Systems
(pre-)production. Such a methodology has to be supported by (IV) elaborated toolsand (V) libraries integrated into (VI) an overall toolchain allowing a seamless migrationbetween the different development stages and artifacts. (VII) Simulation and testingsupport is required for the stages, allowing to validate created functionality, developedsub-systems or systems, e.g., by providing executable functional models, simulationenvironments and plant models. (VIII) Last but not least, real-time constraints need tobe reflected.
As an example, in the automotive domain large complex real-time embedded sys-tems are developed using different development stages, e.g., simulation, prototyping,and pre-production. Advanced tools and libraries have emerged during the recentyears, integrated into sophisticated toolchains supporting different development stagesas well as a seamless migration between them. To deal with the increasing complexityand to further reduce software development costs as well as time, advanced frame-works for the distributed and component-based development have been developed. Inthis report, we propose adapting the existing software development methodology usedin the domain of automotive embedded systems to support the software developmentof novel, complex embedded robotic systems. The proposed methodology includes anoverall development process consisting of tools included into an overall toolchain aswell as libraries. We apply this existing approach to the domain of robotic systems andevaluate as a proof of concept, which modifications have to be made. The approach isevaluated using a mobile robot developed according to the adapted methodology. Spe-cial attention is given to real-time constraints that need to be considered in a slightlydifferent way than in the case of automotive real-time embedded systems. Therefore,we show a new approach for combining hard and soft real-time behavior in the existingautomotive framework.
The remainder of this report is organized as follows. Section 2 briefly discusses thefoundations of robotic as well as automotive systems and introduces a running exam-ple for this report. Section 3 describes our development approach including differentstages and highlights our used tools as well as simulation and verification possibilities.The report discusses related work in Section 4 and concludes in Section 5.
2 Foundations – Robotic and Automotive Systems
2.1 Robot Laboratory
For the evaluation of our research activities, we use our CPSLab1 robot laboratoryconsisting of three Robotino robots.2 The robots can be equipped with several sensors(e.g., laser scanner, infrared (IR) distance sensors, GPS like indoor navigation sys-tems) as well as different actuators (e.g., servo motors, omnidirectional drive, gripper).The general idea of our evaluation scenario is the realization of a variable productionsetting, where robots are capable of transporting small pucks (representing goods ina production system) to different locations. Robots have to fulfill different requirement,
1www.cpslab.de2www.festo-didactic.com
222 Fall Workshop 2012
2 Foundations – Robotic and Automotive Systems
e.g., they have to provide basic functionality like moving and avoiding obstacles in hardreal-time (reacting on obstacles within a few milliseconds). Further, the robots haveto reflect high level goals, e.g., energy saving of the battery, short routing to the desti-nation points and optimizing the throughput while transporting the pucks. While basicfunctionalities, such as obstacle avoidance, have to be realized in hard real-time, weuse existing libraries to realize higher functionalities such as path planning or creatinga map by evaluating measured distance values. The latter can rarely be realized un-der hard real-time constraints because of insufficient libraries.3 Furthermore, we run aRTAI Linux operating system4 on the robot to enable hard real-time execution.
As a running example, we use a single robot with the following hardware/ softwareconfiguration: The robot has three wheels realizing an omnidirectional drive. The driveunit provides an incremental encoder to realize odometry functionality, which calcu-lates the relative position over time according to the drive speed and the orientation ofthe omnidirectional drive of the robot. Due to the fact that this odometry calculation be-comes more and more imprecise over time, we use an additional GPS like (NorthStar5)indoor navigation system to correct the position in the long run. IR distance sensorsare used to avoid obstacles during movement. A more complex navigation logic usesthese sensors for maintaining a map3 as well as computing an appropriate route forthe robot while avoiding obstacles.
2.2 Automotive Development Process
A commonly applied development process for the development of automotive embed-ded real-time systems according to [4] is depicted on the left in Fig. 2. The develop-ment process includes three different stages, namely the simulation, prototyping andpre-production stage. During the simulation stages models are extensively used forrealizing control functionality as well as for representing the environment. At the pro-totyping stage, a transition from a model-based to a software centric development ap-proach is realized. Often, this is achieved by using code generators that automaticallyderive source code from the models used in the previous stage. In the pre-productionstage, more and more aspects of the real system are involved, e.g., by using prototyp-ing HW including the processor type (with additional debugging support) that is laterused. Furthermore, parts of the real plant enable a realistic validation of the real-timebehavior.
2.3 AUTOSAR
The AUTomotive Open System ARchitecture was invented to further support the devel-opment of complex and distributed systems. AUTOSAR6 is the new de facto standardin the automotive domain. It defines a layered architecture, standardized communi-cation mechanism and a whole development methodology. Furthermore, it supports
3For path planning and creating a map the MRPT library is used (www.mrpt.org).4www.rtai.org5www.evolution.com/products/northstar/6www.autosar.org
Fall Workshop 2012 223
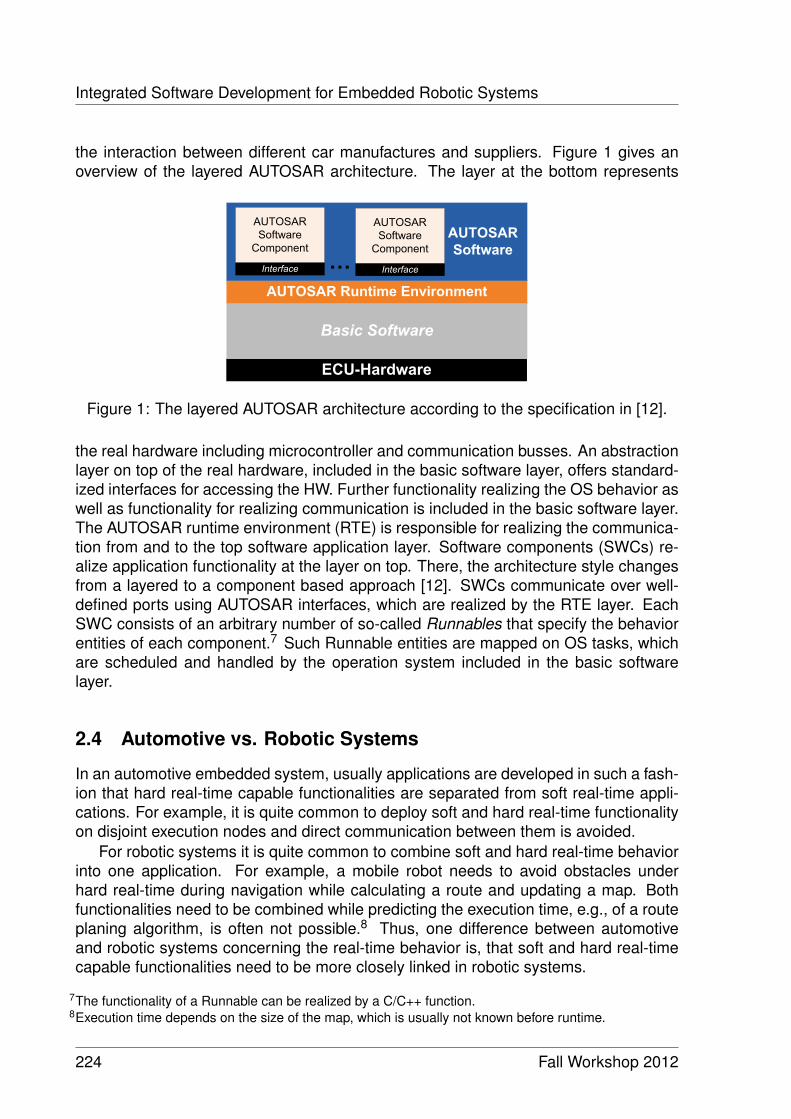
Integrated Software Development for Embedded Robotic Systems
the interaction between different car manufactures and suppliers. Figure 1 gives anoverview of the layered AUTOSAR architecture. The layer at the bottom represents
ECU-Hardware
Basic Software
AUTOSAR Runtime Environment
AUTOSAR
Software
AUTOSAR
Software
Component
Interface
AUTOSAR
Software
Component
Interface…
Figure 1: The layered AUTOSAR architecture according to the specification in [12].
the real hardware including microcontroller and communication busses. An abstractionlayer on top of the real hardware, included in the basic software layer, offers standard-ized interfaces for accessing the HW. Further functionality realizing the OS behavior aswell as functionality for realizing communication is included in the basic software layer.The AUTOSAR runtime environment (RTE) is responsible for realizing the communica-tion from and to the top software application layer. Software components (SWCs) re-alize application functionality at the layer on top. There, the architecture style changesfrom a layered to a component based approach [12]. SWCs communicate over well-defined ports using AUTOSAR interfaces, which are realized by the RTE layer. EachSWC consists of an arbitrary number of so-called Runnables that specify the behaviorentities of each component.7 Such Runnable entities are mapped on OS tasks, whichare scheduled and handled by the operation system included in the basic softwarelayer.
2.4 Automotive vs. Robotic Systems
In an automotive embedded system, usually applications are developed in such a fash-ion that hard real-time capable functionalities are separated from soft real-time appli-cations. For example, it is quite common to deploy soft and hard real-time functionalityon disjoint execution nodes and direct communication between them is avoided.
For robotic systems it is quite common to combine soft and hard real-time behaviorinto one application. For example, a mobile robot needs to avoid obstacles underhard real-time during navigation while calculating a route and updating a map. Bothfunctionalities need to be combined while predicting the execution time, e.g., of a routeplaning algorithm, is often not possible.8 Thus, one difference between automotiveand robotic systems concerning the real-time behavior is, that soft and hard real-timecapable functionalities need to be more closely linked in robotic systems.
7The functionality of a Runnable can be realized by a C/C++ function.8Execution time depends on the size of the map, which is usually not known before runtime.
224 Fall Workshop 2012
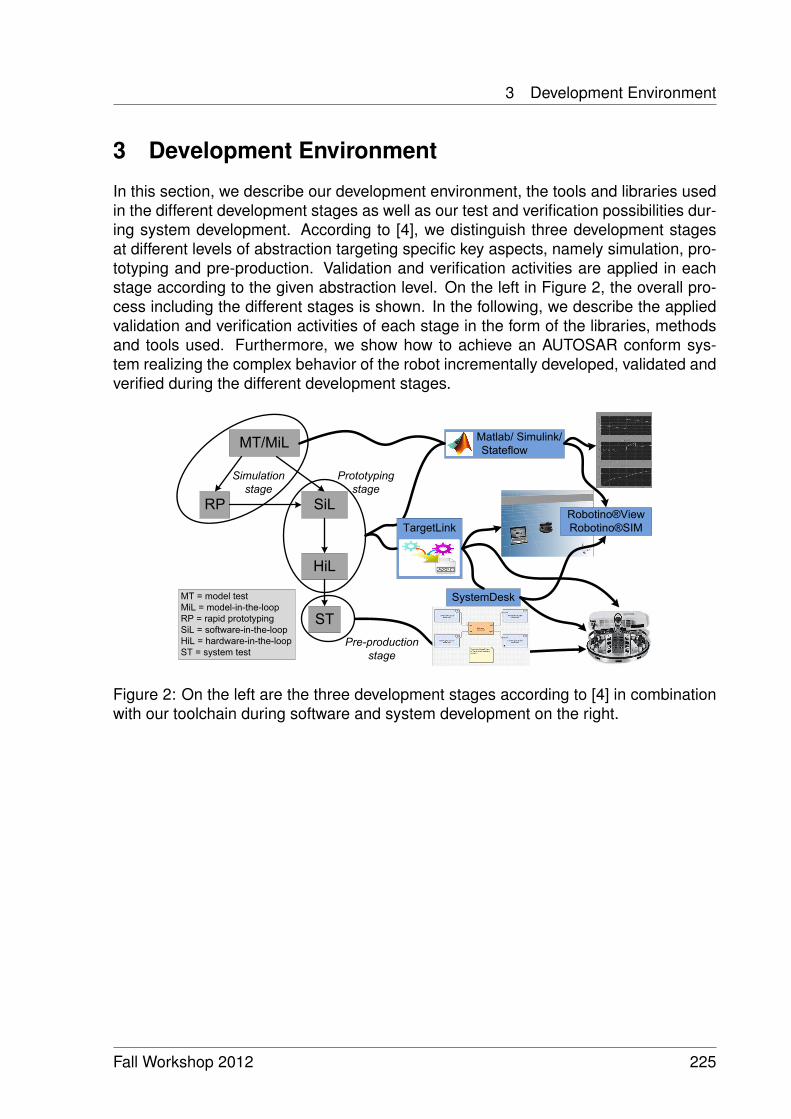
3 Development Environment
3 Development Environment
In this section, we describe our development environment, the tools and libraries usedin the different development stages as well as our test and verification possibilities dur-ing system development. According to [4], we distinguish three development stagesat different levels of abstraction targeting specific key aspects, namely simulation, pro-totyping and pre-production. Validation and verification activities are applied in eachstage according to the given abstraction level. On the left in Figure 2, the overall pro-cess including the different stages is shown. In the following, we describe the appliedvalidation and verification activities of each stage in the form of the libraries, methodsand tools used. Furthermore, we show how to achieve an AUTOSAR conform sys-tem realizing the complex behavior of the robot incrementally developed, validated andverified during the different development stages.
MT/MiL
RP SiL
HiL
ST
MT = model test
MiL = model-in-the-loop
RP = rapid prototyping
SiL = software-in-the-loop
HiL = hardware-in-the-loop
ST = system test
SystemDesk
Robotino®View
Robotino®SIM
Simulation
stage
Prototyping
stage
Pre-production
stage
Matlab/ Simulink/
Stateflow
TargetLink
Figure 2: On the left are the three development stages according to [4] in combinationwith our toolchain during software and system development on the right.
Fall Workshop 2012 225
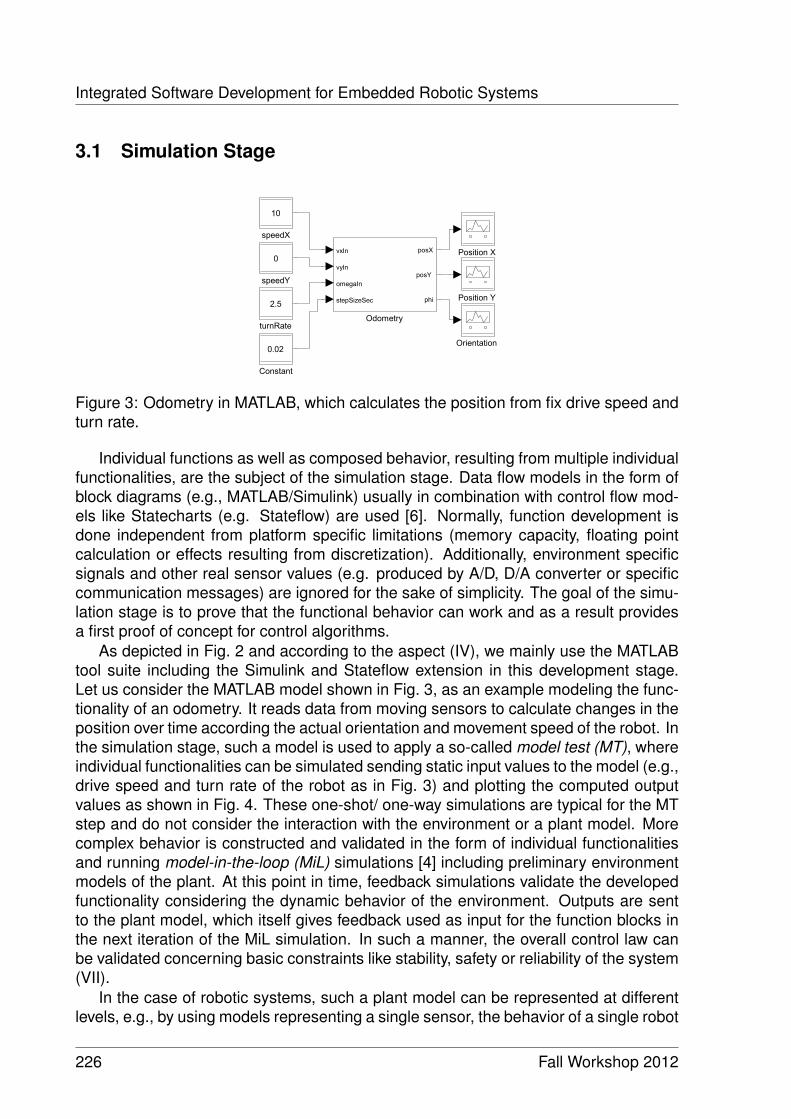
Integrated Software Development for Embedded Robotic Systems
3.1 Simulation Stage
turnRate
2.5
speedY
0
speedX
10
Runnable
FUNCTION
Position Y
Position X
Orientation
Odometry
vxIn
vyIn
omegaIn
stepSizeSec
posX
posY
phi
Constant
0.02
DRA_CommunicationOutport_connected1
Figure 3: Odometry in MATLAB, which calculates the position from fix drive speed andturn rate.
Individual functions as well as composed behavior, resulting from multiple individualfunctionalities, are the subject of the simulation stage. Data flow models in the form ofblock diagrams (e.g., MATLAB/Simulink) usually in combination with control flow mod-els like Statecharts (e.g. Stateflow) are used [6]. Normally, function development isdone independent from platform specific limitations (memory capacity, floating pointcalculation or effects resulting from discretization). Additionally, environment specificsignals and other real sensor values (e.g. produced by A/D, D/A converter or specificcommunication messages) are ignored for the sake of simplicity. The goal of the simu-lation stage is to prove that the functional behavior can work and as a result providesa first proof of concept for control algorithms.
As depicted in Fig. 2 and according to the aspect (IV), we mainly use the MATLABtool suite including the Simulink and Stateflow extension in this development stage.Let us consider the MATLAB model shown in Fig. 3, as an example modeling the func-tionality of an odometry. It reads data from moving sensors to calculate changes in theposition over time according the actual orientation and movement speed of the robot. Inthe simulation stage, such a model is used to apply a so-called model test (MT), whereindividual functionalities can be simulated sending static input values to the model (e.g.,drive speed and turn rate of the robot as in Fig. 3) and plotting the computed outputvalues as shown in Fig. 4. These one-shot/ one-way simulations are typical for the MTstep and do not consider the interaction with the environment or a plant model. Morecomplex behavior is constructed and validated in the form of individual functionalitiesand running model-in-the-loop (MiL) simulations [4] including preliminary environmentmodels of the plant. At this point in time, feedback simulations validate the developedfunctionality considering the dynamic behavior of the environment. Outputs are sentto the plant model, which itself gives feedback used as input for the function blocks inthe next iteration of the MiL simulation. In such a manner, the overall control law canbe validated concerning basic constraints like stability, safety or reliability of the system(VII).
In the case of robotic systems, such a plant model can be represented at differentlevels, e.g., by using models representing a single sensor, the behavior of a single robot
226 Fall Workshop 2012
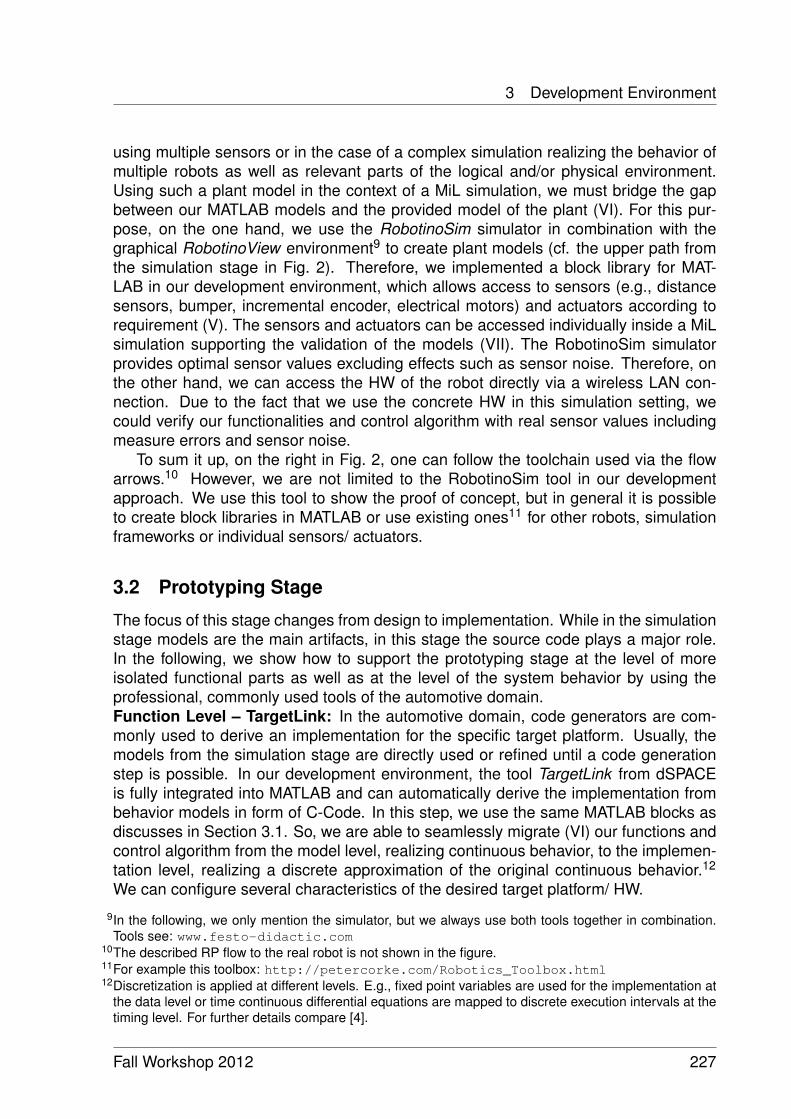
3 Development Environment
using multiple sensors or in the case of a complex simulation realizing the behavior ofmultiple robots as well as relevant parts of the logical and/or physical environment.Using such a plant model in the context of a MiL simulation, we must bridge the gapbetween our MATLAB models and the provided model of the plant (VI). For this pur-pose, on the one hand, we use the RobotinoSim simulator in combination with thegraphical RobotinoView environment9 to create plant models (cf. the upper path fromthe simulation stage in Fig. 2). Therefore, we implemented a block library for MAT-LAB in our development environment, which allows access to sensors (e.g., distancesensors, bumper, incremental encoder, electrical motors) and actuators according torequirement (V). The sensors and actuators can be accessed individually inside a MiLsimulation supporting the validation of the models (VII). The RobotinoSim simulatorprovides optimal sensor values excluding effects such as sensor noise. Therefore, onthe other hand, we can access the HW of the robot directly via a wireless LAN con-nection. Due to the fact that we use the concrete HW in this simulation setting, wecould verify our functionalities and control algorithm with real sensor values includingmeasure errors and sensor noise.
To sum it up, on the right in Fig. 2, one can follow the toolchain used via the flowarrows.10 However, we are not limited to the RobotinoSim tool in our developmentapproach. We use this tool to show the proof of concept, but in general it is possibleto create block libraries in MATLAB or use existing ones11 for other robots, simulationframeworks or individual sensors/ actuators.
3.2 Prototyping Stage
The focus of this stage changes from design to implementation. While in the simulationstage models are the main artifacts, in this stage the source code plays a major role.In the following, we show how to support the prototyping stage at the level of moreisolated functional parts as well as at the level of the system behavior by using theprofessional, commonly used tools of the automotive domain.Function Level – TargetLink: In the automotive domain, code generators are com-monly used to derive an implementation for the specific target platform. Usually, themodels from the simulation stage are directly used or refined until a code generationstep is possible. In our development environment, the tool TargetLink from dSPACEis fully integrated into MATLAB and can automatically derive the implementation frombehavior models in form of C-Code. In this step, we use the same MATLAB blocks asdiscusses in Section 3.1. So, we are able to seamlessly migrate (VI) our functions andcontrol algorithm from the model level, realizing continuous behavior, to the implemen-tation level, realizing a discrete approximation of the original continuous behavior.12
We can configure several characteristics of the desired target platform/ HW.
9In the following, we only mention the simulator, but we always use both tools together in combination.Tools see: www.festo-didactic.com
10The described RP flow to the real robot is not shown in the figure.11For example this toolbox: http://petercorke.com/Robotics_Toolbox.html12Discretization is applied at different levels. E.g., fixed point variables are used for the implementation at
the data level or time continuous differential equations are mapped to discrete execution intervals at thetiming level. For further details compare [4].
Fall Workshop 2012 227
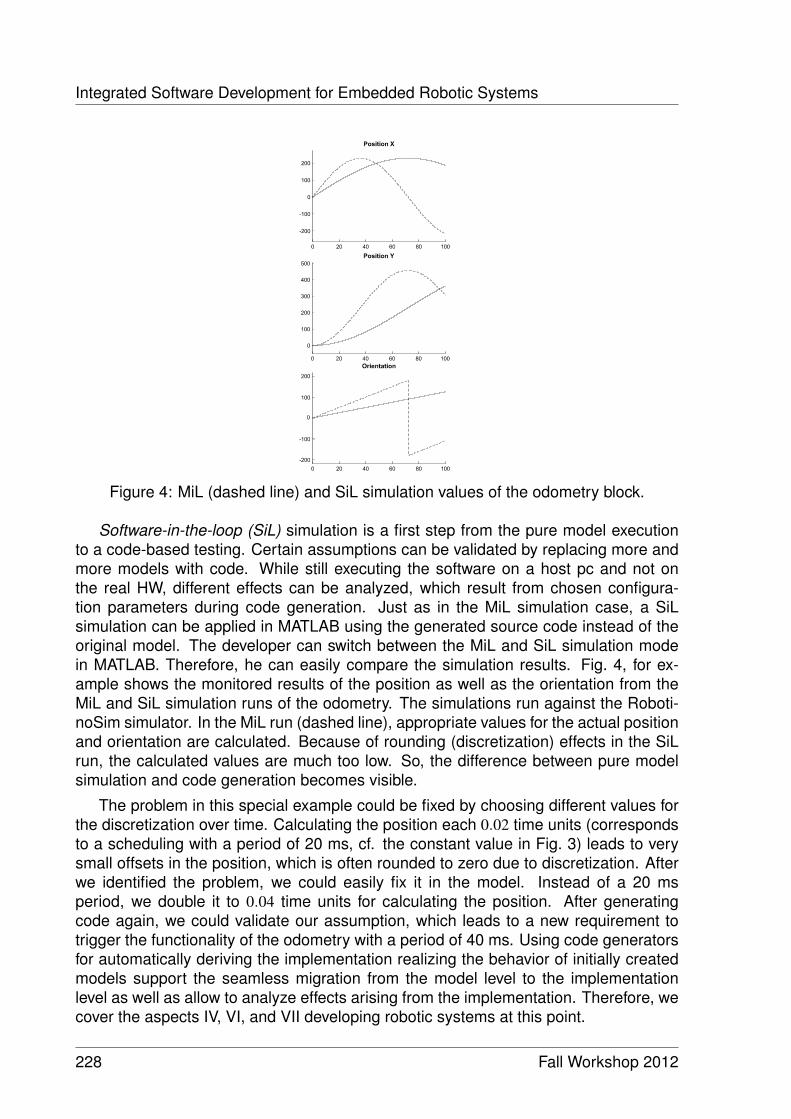
Integrated Software Development for Embedded Robotic Systems
Figure 4: MiL (dashed line) and SiL simulation values of the odometry block.
Software-in-the-loop (SiL) simulation is a first step from the pure model executionto a code-based testing. Certain assumptions can be validated by replacing more andmore models with code. While still executing the software on a host pc and not onthe real HW, different effects can be analyzed, which result from chosen configura-tion parameters during code generation. Just as in the MiL simulation case, a SiLsimulation can be applied in MATLAB using the generated source code instead of theoriginal model. The developer can switch between the MiL and SiL simulation modein MATLAB. Therefore, he can easily compare the simulation results. Fig. 4, for ex-ample shows the monitored results of the position as well as the orientation from theMiL and SiL simulation runs of the odometry. The simulations run against the Roboti-noSim simulator. In the MiL run (dashed line), appropriate values for the actual positionand orientation are calculated. Because of rounding (discretization) effects in the SiLrun, the calculated values are much too low. So, the difference between pure modelsimulation and code generation becomes visible.
The problem in this special example could be fixed by choosing different values forthe discretization over time. Calculating the position each 0.02 time units (correspondsto a scheduling with a period of 20 ms, cf. the constant value in Fig. 3) leads to verysmall offsets in the position, which is often rounded to zero due to discretization. Afterwe identified the problem, we could easily fix it in the model. Instead of a 20 msperiod, we double it to 0.04 time units for calculating the position. After generatingcode again, we could validate our assumption, which leads to a new requirement totrigger the functionality of the odometry with a period of 40 ms. Using code generatorsfor automatically deriving the implementation realizing the behavior of initially createdmodels support the seamless migration from the model level to the implementationlevel as well as allow to analyze effects arising from the implementation. Therefore, wecover the aspects IV, VI, and VII developing robotic systems at this point.
228 Fall Workshop 2012
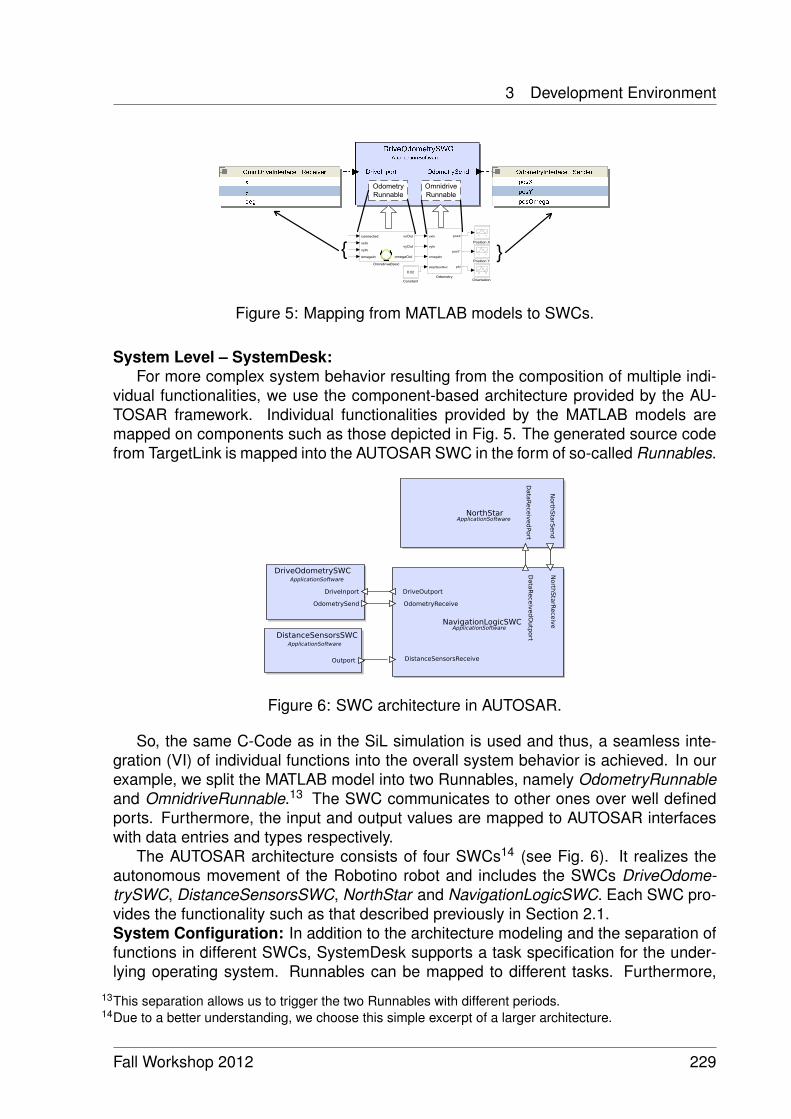
3 Development Environment
Odometry
Runnable
Omnidrive
Runnable
}
}
Figure 5: Mapping from MATLAB models to SWCs.
System Level – SystemDesk:For more complex system behavior resulting from the composition of multiple indi-
vidual functionalities, we use the component-based architecture provided by the AU-TOSAR framework. Individual functionalities provided by the MATLAB models aremapped on components such as those depicted in Fig. 5. The generated source codefrom TargetLink is mapped into the AUTOSAR SWC in the form of so-called Runnables.
Figure 6: SWC architecture in AUTOSAR.
So, the same C-Code as in the SiL simulation is used and thus, a seamless inte-gration (VI) of individual functions into the overall system behavior is achieved. In ourexample, we split the MATLAB model into two Runnables, namely OdometryRunnableand OmnidriveRunnable.13 The SWC communicates to other ones over well definedports. Furthermore, the input and output values are mapped to AUTOSAR interfaceswith data entries and types respectively.
The AUTOSAR architecture consists of four SWCs14 (see Fig. 6). It realizes theautonomous movement of the Robotino robot and includes the SWCs DriveOdome-trySWC, DistanceSensorsSWC, NorthStar and NavigationLogicSWC. Each SWC pro-vides the functionality such as that described previously in Section 2.1.System Configuration: In addition to the architecture modeling and the separation offunctions in different SWCs, SystemDesk supports a task specification for the under-lying operating system. Runnables can be mapped to different tasks. Furthermore,
13This separation allows us to trigger the two Runnables with different periods.14Due to a better understanding, we choose this simple excerpt of a larger architecture.
Fall Workshop 2012 229
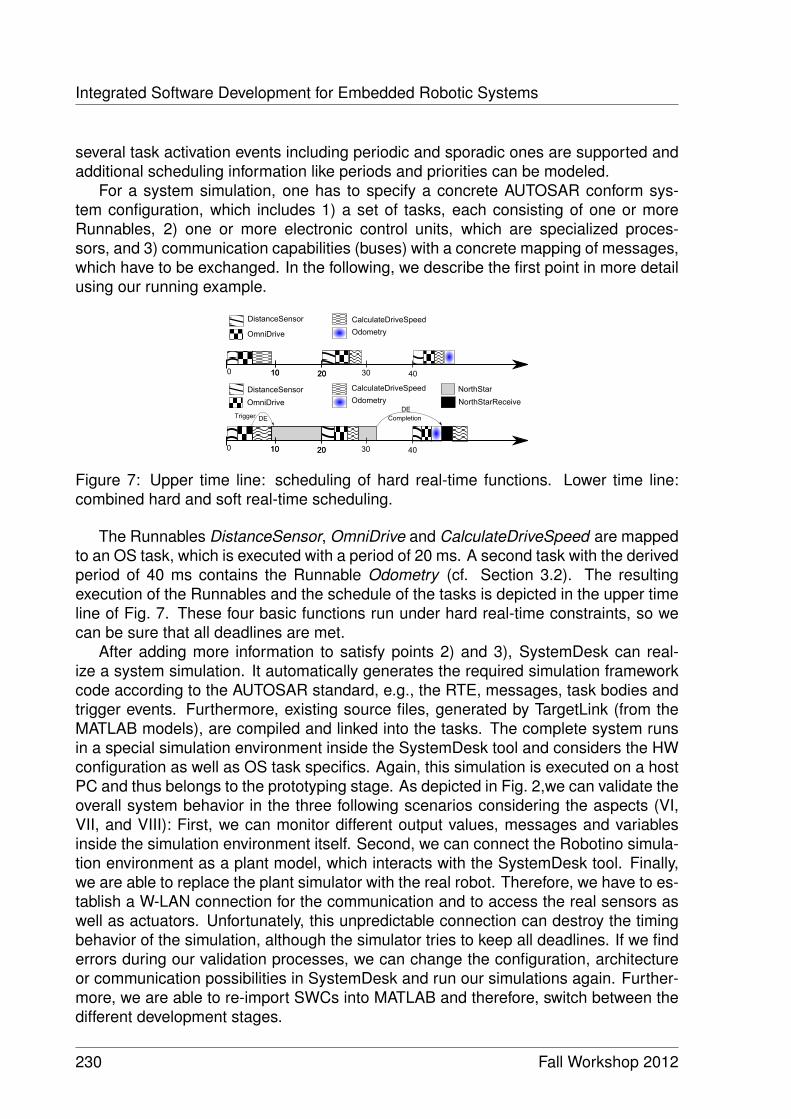
Integrated Software Development for Embedded Robotic Systems
several task activation events including periodic and sporadic ones are supported andadditional scheduling information like periods and priorities can be modeled.
For a system simulation, one has to specify a concrete AUTOSAR conform sys-tem configuration, which includes 1) a set of tasks, each consisting of one or moreRunnables, 2) one or more electronic control units, which are specialized proces-sors, and 3) communication capabilities (buses) with a concrete mapping of messages,which have to be exchanged. In the following, we describe the first point in more detailusing our running example.
0 10 2010 20 30 40
DistanceSensor
OmniDrive
CalculateDriveSpeed
Odometry
0 10 2010 20 30 40
DistanceSensor
OmniDrive
CalculateDriveSpeed
Odometry
NorthStar
NorthStarReceive
DEDE
Trigger Completion
Figure 7: Upper time line: scheduling of hard real-time functions. Lower time line:combined hard and soft real-time scheduling.
The Runnables DistanceSensor, OmniDrive and CalculateDriveSpeed are mappedto an OS task, which is executed with a period of 20 ms. A second task with the derivedperiod of 40 ms contains the Runnable Odometry (cf. Section 3.2). The resultingexecution of the Runnables and the schedule of the tasks is depicted in the upper timeline of Fig. 7. These four basic functions run under hard real-time constraints, so wecan be sure that all deadlines are met.
After adding more information to satisfy points 2) and 3), SystemDesk can real-ize a system simulation. It automatically generates the required simulation frameworkcode according to the AUTOSAR standard, e.g., the RTE, messages, task bodies andtrigger events. Furthermore, existing source files, generated by TargetLink (from theMATLAB models), are compiled and linked into the tasks. The complete system runsin a special simulation environment inside the SystemDesk tool and considers the HWconfiguration as well as OS task specifics. Again, this simulation is executed on a hostPC and thus belongs to the prototyping stage. As depicted in Fig. 2,we can validate theoverall system behavior in the three following scenarios considering the aspects (VI,VII, and VIII): First, we can monitor different output values, messages and variablesinside the simulation environment itself. Second, we can connect the Robotino simula-tion environment as a plant model, which interacts with the SystemDesk tool. Finally,we are able to replace the plant simulator with the real robot. Therefore, we have to es-tablish a W-LAN connection for the communication and to access the real sensors aswell as actuators. Unfortunately, this unpredictable connection can destroy the timingbehavior of the simulation, although the simulator tries to keep all deadlines. If we finderrors during our validation processes, we can change the configuration, architectureor communication possibilities in SystemDesk and run our simulations again. Further-more, we are able to re-import SWCs into MATLAB and therefore, switch between thedifferent development stages.
230 Fall Workshop 2012
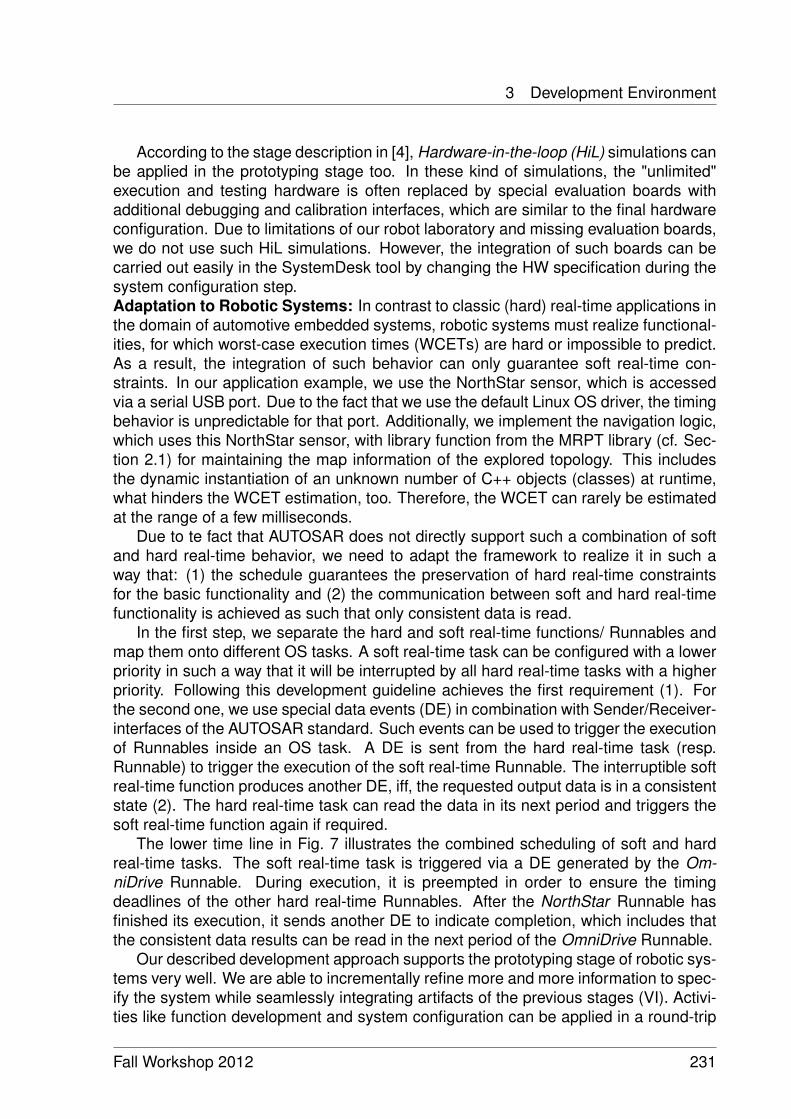
3 Development Environment
According to the stage description in [4], Hardware-in-the-loop (HiL) simulations canbe applied in the prototyping stage too. In these kind of simulations, the "unlimited"execution and testing hardware is often replaced by special evaluation boards withadditional debugging and calibration interfaces, which are similar to the final hardwareconfiguration. Due to limitations of our robot laboratory and missing evaluation boards,we do not use such HiL simulations. However, the integration of such boards can becarried out easily in the SystemDesk tool by changing the HW specification during thesystem configuration step.Adaptation to Robotic Systems: In contrast to classic (hard) real-time applications inthe domain of automotive embedded systems, robotic systems must realize functional-ities, for which worst-case execution times (WCETs) are hard or impossible to predict.As a result, the integration of such behavior can only guarantee soft real-time con-straints. In our application example, we use the NorthStar sensor, which is accessedvia a serial USB port. Due to the fact that we use the default Linux OS driver, the timingbehavior is unpredictable for that port. Additionally, we implement the navigation logic,which uses this NorthStar sensor, with library function from the MRPT library (cf. Sec-tion 2.1) for maintaining the map information of the explored topology. This includesthe dynamic instantiation of an unknown number of C++ objects (classes) at runtime,what hinders the WCET estimation, too. Therefore, the WCET can rarely be estimatedat the range of a few milliseconds.
Due to te fact that AUTOSAR does not directly support such a combination of softand hard real-time behavior, we need to adapt the framework to realize it in such away that: (1) the schedule guarantees the preservation of hard real-time constraintsfor the basic functionality and (2) the communication between soft and hard real-timefunctionality is achieved as such that only consistent data is read.
In the first step, we separate the hard and soft real-time functions/ Runnables andmap them onto different OS tasks. A soft real-time task can be configured with a lowerpriority in such a way that it will be interrupted by all hard real-time tasks with a higherpriority. Following this development guideline achieves the first requirement (1). Forthe second one, we use special data events (DE) in combination with Sender/Receiver-interfaces of the AUTOSAR standard. Such events can be used to trigger the executionof Runnables inside an OS task. A DE is sent from the hard real-time task (resp.Runnable) to trigger the execution of the soft real-time Runnable. The interruptible softreal-time function produces another DE, iff, the requested output data is in a consistentstate (2). The hard real-time task can read the data in its next period and triggers thesoft real-time function again if required.
The lower time line in Fig. 7 illustrates the combined scheduling of soft and hardreal-time tasks. The soft real-time task is triggered via a DE generated by the Om-niDrive Runnable. During execution, it is preempted in order to ensure the timingdeadlines of the other hard real-time Runnables. After the NorthStar Runnable hasfinished its execution, it sends another DE to indicate completion, which includes thatthe consistent data results can be read in the next period of the OmniDrive Runnable.
Our described development approach supports the prototyping stage of robotic sys-tems very well. We are able to incrementally refine more and more information to spec-ify the system while seamlessly integrating artifacts of the previous stages (VI). Activi-ties like function development and system configuration can be applied in a round-trip
Fall Workshop 2012 231

Integrated Software Development for Embedded Robotic Systems
engineering approach (I, II). First, we develop the control functions in MATLAB (II). Af-terwards, we generate code using the TargetLink code generation capabilities (IV). Atthis point, we can manually integrate additional, arbitrary functionality in C/ C++or useexisting libraries (V). As soon as sufficient code artifacts and libraries are provided, weare able to use the code generation and simulation capabilities of the SystemDesk tool(IV, VII). Existing SWCs, e.g., developed in a previous project can be seamlessly in-tegrated into the system architecture and new components can be exported as libraryelements for other projects. Additionally, we have shown the idea of creating a com-bination of hard and soft real-time tasks using the AUTOSAR framework during thisstage (VIII).
3.3 Pre-Production Stage
Within the pre-production stage, usually, a prototype of the real system is built. Thisprototype is tested against external environmental influences (such as temperature,vibration or other disturbances). The goal of this stage is to prove whether all require-ments and constraints are still met on the real HW. During this last integration of allcomponents and system parts, upcoming problems should be fixed as early as possi-ble and before the final production of the product starts [4]. In our setting, we did notbuilt any HW prototypes. Instead, we integrate the overall functions, components aswell as the generated RTE and tasks to a complete system, compile and run it on thetarget processor of the robot15. So in this last step, we have no simulation semanticand W-LAN connection to other tools. We can fully operate the behavior of the robotin hard real-time. For verification, we use some hard real-time logging mechanism ofthe robot OS. Furthermore, we can change the hardware composition of the robot byadding or removing special sensors and actuators (see Section 2.1).
4 Related Work
Tackling the complexity of robotic and other embedded systems, we found a great dealof previous work covering partial aspects of developing such systems. According to ourfound aspects in Section 1 and our focus on the automotive domain, we combine theexisting development methodology from [4] and the AUTOSAR standard. We evaluateour approach in a robotic production scenario using the component-based AUTOSARarchitecture [12]. Other frameworks often cover only parts of the found aspects. RT-Middleware [1, 2] and ORCA [5] focus on the specification of components includinginterfaces and ports (aspects IV, V, and VII). They lack the integration of an overallmethodology as well as architecture specification. Very similar to the AUTOSAR ap-proach but with the focus on the robotic domain is the MOAST framework [3], whichcovers the points II, III, IV, and partially VII. However, a seamless integration of an over-all methodology and the support for different tools is missing. A good comparison withother frameworks can be found in [8].
15We can automatically transform AUTOSAR compliant applications to the RTAI Linux.
232 Fall Workshop 2012
5 Conclusion
In the embedded world, testing and simulation are the major activities to verify thebehavior of the system [4]. We have made intensive use of the MATLAB, Robotino andSystemDesk simulators. However, other simulators like Gazebo [7] or Webots [9] areapplicable as well.
Furthermore, there are other tools for modeling and simulation of AUTOSAR con-form parts of the system architecture as the Real-Time Workshop(RTW) (MATLABextension) from the MathWorks company.16 The RTW extension is limited to compo-nent functionality and interfaces. The overall system architecture description is neededbeforehand [11]. Parts of this description can be built by the Volcano Vehicle Sys-tems Architect17 (VSA), which can import and export AUTOSAR conform architecturedescription [10]. However, all these different tools can be used instead of the tools pre-sented in this report, if the integration in the overall methodology as well as the supportfor the different development stages is guaranteed.
Considering real-time constraints and combining hard and soft real-time tasks areimportant because of the support for library functionalities in different use-cases. Forexample, our navigation logic in this report cannot be done in a predictive amount oftime. Combining soft and hard real-time guarantees (1) a basic hard real-time be-havior of the robotic system and (2) supports the development of complex algorithmand higher system components. Existing robotic frameworks as the Robot OperatingSystem18 or Microsoft Robotics Studio19 are well established for developing complexrobotic systems. They have drawbacks concerning the integration of hart real-timeconstraints.
5 Conclusion
We have shown in this report an overall methodology (I) along with different exemplarydevelopment activities as well as artifacts on different levels of abstraction (II, III). Weknow that not all tasks can be executed in HRT. Therefore, we have shown the ideaof combining different hard and soft real-time tasks into the overall system using theAUTOSAR approach (VIII). Furthermore, we are able to integrate several tools and ex-ternal libraries into our overall toolchain (IV, V, VI). However, we are not limited to thetools we show in this report. This provided flexibility is stabilized by a clear structureof different development stages (III) allowing a round-trip engineering for different func-tions, the integration of components as well as the simulation and testing of the devel-opment artifacts to the point of the complete system on the target platform. Therefore,we adapt ideas of the automotive domain to the development of robotic systems.
As future work, we want to build a complex robot production scenario applying theproposed methodology of this report and evaluate the interaction of soft and hard real-time system parts.
16www.mathworks.com/embedded-systems/17www.mentor.com/18www.ros.org19www.microsoft.com/robotics/
Fall Workshop 2012 233
References
Acknowledgment
This report is based on joint work with Stefan Neumann and Falk Benke. For moreinformation see [13].
References[1] N. Ando, T. Suehiro, K. Kitagaki, T. Kotoku, and Y. Woo-Keun. RT-middleware: distributed compo-
nent middleware for RT (robot technology). In 2005 IEEE/RSJ International Conference on Intelli-gent Robots and Systems, pages 3933–3938, 2005.
[2] Noriaki Ando, Takashi Suehiro, and Tetsuo Kotoku. A software platform for component basedrt-system development: Openrtm-aist. In Proceedings of the 1st International Conference on Sim-ulation, Modeling, and Programming for Autonomous Robots, SIMPAR ’08, pages 87–98, Berlin,Heidelberg, 2008. Springer.
[3] Stephen Balakirsky, Frederick M. Proctor, Christopher J. Scrapper, and Thomas R. Kramer. Amobile robot control framework: From simulation to reality. In Proceedings of the 1st Interna-tional Conference on Simulation, Modeling, and Programming for Autonomous Robots, SIMPAR’08, pages 111–122, Berlin, Heidelberg, 2008. Springer.
[4] Bart Broekman and Edwin Notenboom. Testing Embedded Software. Wesley, 2003.
[5] A. Brooks, T. Kaupp, A. Makarenko, S. Williams, and A. Oreback. Towards component-basedrobotics. In International Conference on Intelligent Robots and Systems, pages 163–168, 2005.
[6] Holger Giese, Stefan Neumann, Oliver Niggemann, and Bernhard Schätz. Model-Based Integra-tion. In Model-Based Engineering of Embedded Real-Time Systems, Dagstuhl Castle, Germany,volume 6100 of LNCS, pages 17–54. Springer, 2011.
[7] Nathan Koenig and Andrew Howard. Design and use paradigms for gazebo, an open-source multi-robot simulator. In In IEEE/RSJ International Conference on Intelligent Robots and Systems, pages2149–2154, 2004.
[8] Luis Manso, Pilar Bachiller, Pablo Bustos, Pedro Núñez, Ramón Cintas, and Luis Calderita. Robo-comp: a tool-based robotics framework. In Proceedings of the 2nd international conference on Sim-ulation, modeling, and programming for autonomous robots, SIMPAR’10, pages 251–262, Berlin,Heidelberg, 2010. Springer.
[9] O. Michel. Webots: Professional Mobile Robot Simulation. International Journal of AdvancedRobotic Systems, 1:39–42, 2004.
[10] G. Sandmann and M Seibt. AUTOSAR-Compliant Development Workflows: From Architecture toImplementation - Tool Interoperability for Round-Trip Engineering and Verification and Validation.Technical Report 2012-01-0962, SAE International, 2012.
[11] G. Sandmann and R Thompson. Development of AUTOSAR Software Components within Model-Based Design. Technical Report 2008-01-0383, SAE International, 2008.
[12] http://www.autosar.org/. AUTOSAR_EXP_LayeredSoftwareArchitecture.pdf, 2011. pageid: 94ju5.
[13] Sebastian Wätzoldt, Stefan Neumann, Falk Benke, and Holger Giese. Integrated Software Devel-opment for Embedded Robotic Systems. In Proceedings of the 3rd International Conference onSimulation, Modeling, and Programming for Autonomous Robots (SIMPAR), volume 7628, pages335–348, October 2012.
234 Fall Workshop 2012


Aktuelle Technische Berichte des Hasso-Plattner-Instituts
Band ISBN Titel Autoren / Redaktion
75 978-3-86956-
246-9 Modeling and Verifying Dynamic Evolving Service-Oriented Architectures
Holger Giese, Basil Becker
74 978-3-86956-245-2
Modeling and Enacting Complex Data Dependencies in Business Processes
Andreas Meyer, Luise Pufahl, Dirk Fahland, Mathias Weske
73 978-3-86956-241-4
Enriching Raw Events to Enable Process Intelligence
Nico Herzberg, Mathias Weske
72 978-3-86956-
232-2 Explorative Authoring of ActiveWeb Content in a Mobile Environment
Conrad Calmez, Hubert Hesse, Benjamin Siegmund, Sebastian Stamm, Astrid Thomschke, Robert Hirschfeld, Dan Ingalls, Jens Lincke
71 978-3-86956-231-5
Vereinfachung der Entwicklung von Geschäftsanwendungen durch Konsolidierung von Programmier- konzepten und -technologien
Lenoi Berov, Johannes Henning, Toni Mattis, Patrick Rein, Robin Schreiber, Eric Seckler, Bastian Steinert, Robert Hirschfeld
70 978-3-86956-230-8
HPI Future SOC Lab - Proceedings 2011 Christoph Meinel, Andreas Polze, Gerhard Oswald, Rolf Strotmann, Ulrich Seibold, Doc D'Errico
69 978-3-86956-229-2
Akzeptanz und Nutzerfreundlichkeit der AusweisApp: Eine qualitative Untersuchung
Susanne Asheuer, Joy Belgassem, Wiete Eichorn, Rio Leipold, Lucas Licht, Christoph Meinel, Anne Schanz, Maxim Schnjakin
68 978-3-86956-225-4
Fünfter Deutscher IPv6 Gipfel 2012 Christoph Meinel, Harald Sack (Hrsg.)
67 978-3-86956-228-5
Cache Conscious Column Organization in In-Memory Column Stores
David Schalb, Jens Krüger, Hasso Plattner
66 978-3-86956-227-8
Model-Driven Engineering of Adaptation Engines for Self-Adaptive Software
Thomas Vogel, Holger Giese
65 978-3-86956-226-1
Scalable Compatibility for Embedded Real-Time components via Language Progressive Timed Automata
Stefan Neumann, Holger Giese
64 978-3-86956-217-9
Cyber-Physical Systems with Dynamic Structure: Towards Modeling and Verification of Inductive Invariants
Basil Becker, Holger Giese
63 978-3-86956-204-9
Theories and Intricacies of Information Security Problems
Anne V. D. M. Kayem, Christoph Meinel (Eds.)
62 978-3-86956-212-4
Covering or Complete? Discovering Conditional Inclusion Dependencies
Jana Bauckmann, Ziawasch Abedjan, Ulf Leser, Heiko Müller, Felix Naumann
61 978-3-86956-194-3
Vierter Deutscher IPv6 Gipfel 2011 Christoph Meinel, Harald Sack (Hrsg.)
60 978-3-86956-201-8
Understanding Cryptic Schemata in Large Extract-Transform-Load Systems
Alexander Albrecht, Felix Naumann


ISBN 978-3-86956-256-8ISSN 1613-5652