
HPI future SOC lab : proceedings 2012 - Hasso-Plattner-Institut
130
Technische Berichte Nr. 85 des Hasso-Plattner-Instituts für Softwaresystemtechnik an der Universität Potsdam HPI Future SOC Lab: Proceedings 2012 Christoph Meinel, Andreas Polze, Gerhard Oswald, Rolf Strotmann, Ulrich Seibold, Bernhard Schulzki (Hrsg.)
-
Upload
khangminh22 -
Category
Documents
-
view
2 -
download
0
Transcript of HPI future SOC lab : proceedings 2012 - Hasso-Plattner-Institut

Technische Berichte Nr. 85
des Hasso-Plattner-Instituts für Softwaresystemtechnik an der Universität Potsdam
HPI Future SOC Lab: Proceedings 2012Christoph Meinel, Andreas Polze, Gerhard Oswald, Rolf Strotmann, Ulrich Seibold, Bernhard Schulzki (Hrsg.)
ISBN 978-3-86956-276-6ISSN 1613-5652


Technische Berichte des Hasso-Plattner-Instituts für Softwaresystemtechnik an der Universität Potsdam


Technische Berichte des Hasso-Plattner-Instituts für Softwaresystemtechnik an der Universität Potsdam | 85
Christoph Meinel | Andreas Polze | Gerhard Oswald | Rolf Strotmann | Ulrich Seibold | Bernhard Schulzki (Hrsg.)
HPI Future SOC Lab
Proceedings 2012
Universitätsverlag Potsdam

Bibliografische Information der Deutschen Nationalbibliothek Die Deutsche Nationalbibliothek verzeichnet diese Publikation in der Deutschen Nationalbibliografie; detaillierte bibliografische Daten sind im Internet über http://dnb.dnb.de/ abrufbar. Universitätsverlag Potsdam 2014 http://verlag.ub.uni-potsdam.de/ Am Neuen Palais 10, 14469 Potsdam Tel.: +49 (0)331 977 2533 / Fax: 2292 E-Mail: [email protected] Die Schriftenreihe Technische Berichte des Hasso-Plattner-Instituts für Softwaresystemtechnik an der Universität Potsdam wird herausgegeben von den Professoren des Hasso-Plattner-Instituts für Softwaresystemtechnik an der Universität Potsdam. ISSN (print) 1613-5652 ISSN (online) 2191-1665 Das Manuskript ist urheberrechtlich geschützt. Druck: docupoint GmbH Magdeburg ISBN 978-3-86956-276-6 Zugleich online veröffentlicht auf dem Publikationsserver der Universität Potsdam: URL http://pub.ub.uni-potsdam.de/volltexte/2014/6899/ URN urn:nbn:de:kobv:517-opus-68991 http://nbn-resolving.de/urn:nbn:de:kobv:517-opus-68991

Contents
Spring 2012
Prof. Dr. Ben Juurlink, Architektur eingebetteter Systeme, Technische UniversitatBerlin
Parallelizing H.264 Decoding with OpenMP Superscalar . . . . . . . . . . . . . . . . . . . . 1
Prof. Dr. Jurgen Dollner, Computer Graphics Systems, Hasso-Plattner-Institut
Service-Based 3D Rendering and Interactive 3D Visualization . . . . . . . . . . . . . . . . . 7
Dr. Ralf Kuhne, SAP Innovation Center, Potsdam
Benchmarking and Tenant Placement for Efficient Cloud Operations . . . . . . . . . . . . . . 11
Prof. Dr. Christoph Meinel, Internet-Technologies and Systems Group, Hasso-Plattner-Institut
Towards Multi-Core and In-Memory for IDS Alert Correlation: Approaches and Capabilities . 15
Multicore-Based High Performance IPv6 Cryptographically Generated Addresses (CGA) . . . 21
Blog- Intelligence Extension with SAP HANA . . . . . . . . . . . . . . . . . . . . . . . . . . 27
Accurate Mutlicore Processor Power Models for Power-Aware Resource Management . . . . . 29
VMs Core-allocation scheduling Policy for Energy and Performance Management . . . . . . . 35
Prof. Dr. Andreas Polze, Operating Systems & Middleware Group, Hasso-Plattner-Institut
Parallelization of Elementary Flux Mode Enumeration for Large-scale Metabolic Networks . . 41
Dr. Felix Salfner, SAP Innovation Center, Potsdam
Early Anomaly Detection in SAP Business ByDesign . . . . . . . . . . . . . . . . . . . . . . 47
Prof. Dr. Michael Schottner, Betriebssysteme, Universitat Dusseldorf
ECRAM (Elastic Cooperative Random-Access Memory) . . . . . . . . . . . . . . . . . . . . 53
Prof. Dr. Steffen Staab, Institute for Web Science and Technologies, UniversitatKoblenz-Landau
KONECT Cloud — Large Scale Network Mining in the Cloud . . . . . . . . . . . . . . . . . 55
Prof. Dr. Rainer Thome, Chair in Business administration and business computing,Universitat Wurzburg
Integrated Management Support with Forward Business Recommendations . . . . . . . . . . 59
i

Fall 2012
Prof. Dr. Jurgen Dollner, Hasso-Plattner-Institut Potsdam
Service-Based 3D Rendering and Interactive 3D Visualization . . . . . . . . . . . . . . . . . 63
Prof. Dr. Jorge Marx Gomez, Carl von Ossietzky University Oldenburg
Smart Wind Farm Control . . . . . . . . . . . . . . . . . . . . . . . . . . . . . . . . . . . . . 65
Prof. Dr. Helmut Krcmar, Technical University of Munich
Measurement of Execution Times and Resource Requirements for single user requests . . . . . 69
Dr. Ralph Kuhne, SAP Innovation Center Potsdam
Benchmarking for Efficient Cloud Operations . . . . . . . . . . . . . . . . . . . . . . . . . . 71
Prof. Dr. Christoph Meinel, Hasso-Plattner-Institut Potsdam
Instant Intrusion Detection using Live Attack Graphs and Event Correlation . . . . . . . . . . 73
Prof. Dr. Andreas Polze, Hasso-Plattner-Institut Potsdam
Exploiting Heterogeneous Architectures for Algorithms with Low Arithmetic Intensity . . . . 77
Dr. Felix Salfner, SAP Innovation Center Potsdam
Using In-Memory Computing for Proactive Cloud Operations . . . . . . . . . . . . . . . . . . 83
Prof. Dr. Kai-Uwe Sattler, Ilmenau University of Technology
Evaluation of Multicore Query Execution Techniques for Linked Open Data . . . . . . . . . . 89
Dr. Sascha Sauer, Max Planck Institute for Molecular Genetics (MPIMG) Berlin
Next Generation Sequencing: From Computational Challenges to Biological Insight . . . . . . 95
Prof. Dr. Michael Schottner, Heinrich Heine University of Dusseldorf
ECRAM (Elastic Cooperative Random-Access Memory) . . . . . . . . . . . . . . . . . . . . 99
Prof. Assaf Schuster, HPI research school, Technion IIT
Analysis of CPU/GPU data transfer bottlenecks in multi-GPU systems for hard real-time datastreams . . . . . . . . . . . . . . . . . . . . . . . . . . . . . . . . . . . . . . . . . . . . . 103
Prof. Dr. Steffen Staab, University of Koblenz and Landau
KONECT Cloud — Large Scale Network Mining in the Cloud . . . . . . . . . . . . . . . . . 107
Prof. Dr. Rainer Thome, University of Wurzburg
Adaptive Realtime KPI Analysis of ERP transaction data using In-Memory technology . . . . 111
Till Winkler, Humboldt University of Berlin
The Impact of Software as a Service . . . . . . . . . . . . . . . . . . . . . . . . . . . . . . . 115
ii

Parallelizing H.264 Decoding with OpenMP Superscalar
Chi Ching Chi, Ben Juurlink Embedded Systems Architecture
Einsteinufer 1710551 Berlin
{chi.c.chi,b.juurlink}@tu-berlin.de
Abstract
Since the advent of multi-core processors and systems,programmers are faced with the challenge of exploit-ing thread-level parallelism (TLP). In the past yearsseveral parallel programming models have been intro-duced to simplify the development of parallel applica-tions. OpenMP Superscalar is a novel task-based pro-gramming model, which incorporates advanced fea-tures such as automated runtime dependency reso-lution, while maintaining simple pragma-based pro-gramming for C/C++. We have parallelized H.264decoding using OpenMP Superscalar to investigate itsease-of-use and performance.
1 Introduction
Because multi-core processors have become om-nipresent, there is a lot of renewed interest in parallelprogramming models that are easy to use while beingexpressive, and allow to write performance-portableapplications. An important question is, however, howto evaluate the ease of use, expressiveness, and perfor-mance of a programming model. In this work we tryto answer this question by describing our experiencesin parallelizing H.264 decoding using OmpSs, a noveltask-based parallel programming model. To evaluateits performance, the performance of the OmpSs appli-cation is compared to a similary structured Pthreadsapplications. H.264 decoding is an excellent casestudy because it is highly irregular and dynamic, ex-hibits many different types of data dependencies aswell as rather fine-grained tasks, and requires differ-ent types of parallelism to be exploited.In OmpSs [3], in addition to OpenMP functionality,programmers can express parallelism by annotatingcertain code sections (typically functions) as tasks,as well as the inputs, outputs, and inputs/outputs ofthese tasks. When these functions are called, they areadded to a task graph instead of being executed. Thetask dependencies are resolved at runtime, using theinput/output specification of the function arguments.
Once all input dependencies of a task are resolved, itis scheduled for execution.A key difference between OmpSs and other task-basedparallel programming models is the ability to add tasksbefore they are ready to execute. This is a power-ful feature which allows more complex paralleliza-tion strategies that simultaneously exploit function-level and data-level parallelism. In this paper we showhow these features can be used to implement a parallelimplementation of H.264 decoding.The structure of this paper is as follows: Sections 2to 5 describe the implementation and optimization ofparallel H.264 video decoding using OmpSs. In Sec-tion 6 the performance of the OmpSs version is eval-uated and compared to an optimized Pthreads imple-mentation. Conclusions are drawn in Section 7.
2 Pipelining H.264
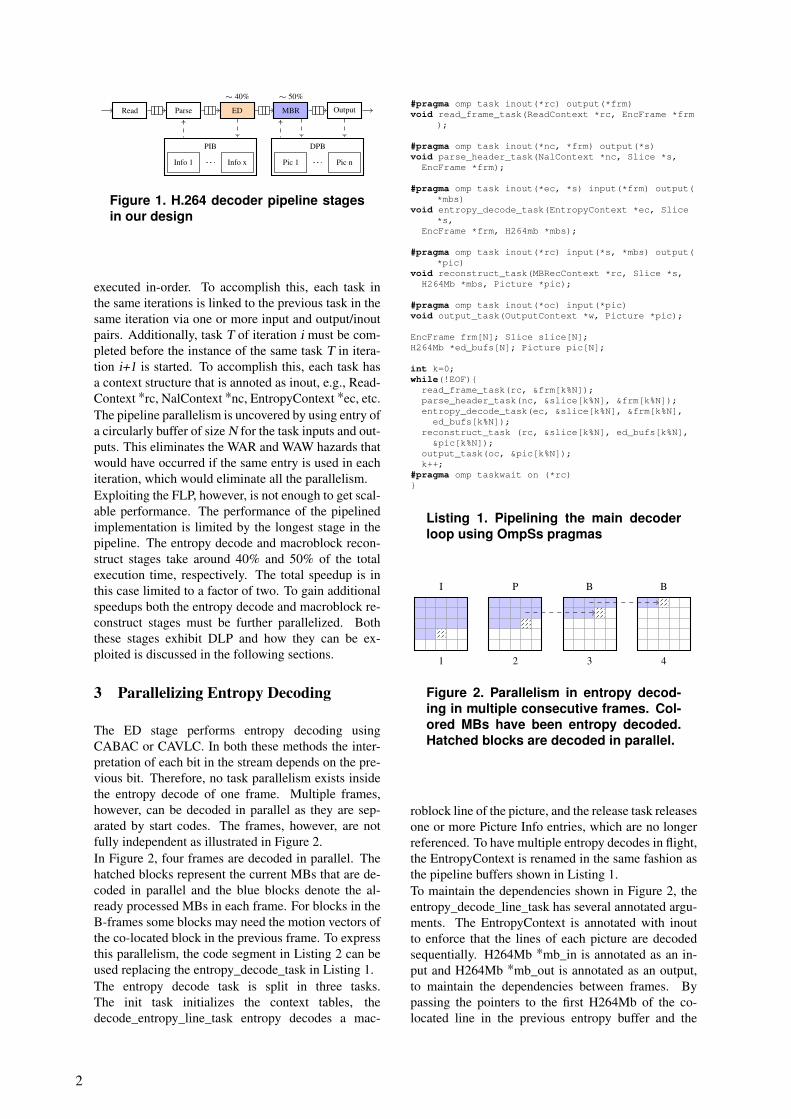
The H.264 decoder pipeline consists in our design of5 pipeline stages, shown in Figure 1. In the read stagethe bitstream is read from the disk and parsed into sep-arated frames. In the parse stage the headers of theframe are parsed and a picture info entry in the pic-ture info buffer (PIB) is allocated. The entropy decode(ED) stage performs a lossless decompression by ex-tracting the syntax elements for each macroblock inthe frame. Some syntax elements are directly pro-cessed, e.g. the motion vectors differences are trans-formed into motion vectors. The macroblock recon-struction stage allocates a picture in the decoded pic-ture buffer (DPB) and reconstructs the picture usingthe syntax elements and motion vectors. The outputstage reorders and outputs the decoded pictures eitherto an output file or the display.In contrast to other task-based programming models,like Cilk++ [7] and OpenMP [2], pipeline parallelismcan be straightforwardly expressed in OmpSs, becauseOmpSs tasks can be spawned before its dependencieshave been resolved [8, 6]. Listing 1 presents the sim-plified code of the pipelined main decoder loop usingOmpSs pragmas. A task is created for each pipelinestage in each loop iteration. For correct pipelining ofthe tasks, it is required that all tasks in iteration i are
1
Read Output
Info 1 Info x
PIB
Pic 1 Pic n
DPB
Parse ED MBRED
∼ 40%
MBR
∼ 50%
Figure 1. H.264 decoder pipeline stagesin our design
executed in-order. To accomplish this, each task inthe same iterations is linked to the previous task in thesame iteration via one or more input and output/inoutpairs. Additionally, task T of iteration i must be com-pleted before the instance of the same task T in itera-tion i+1 is started. To accomplish this, each task hasa context structure that is annoted as inout, e.g., Read-Context *rc, NalContext *nc, EntropyContext *ec, etc.The pipeline parallelism is uncovered by using entry ofa circularly buffer of size N for the task inputs and out-puts. This eliminates the WAR and WAW hazards thatwould have occurred if the same entry is used in eachiteration, which would eliminate all the parallelism.Exploiting the FLP, however, is not enough to get scal-able performance. The performance of the pipelinedimplementation is limited by the longest stage in thepipeline. The entropy decode and macroblock recon-struct stages take around 40% and 50% of the totalexecution time, respectively. The total speedup is inthis case limited to a factor of two. To gain additionalspeedups both the entropy decode and macroblock re-construct stages must be further parallelized. Boththese stages exhibit DLP and how they can be ex-ploited is discussed in the following sections.
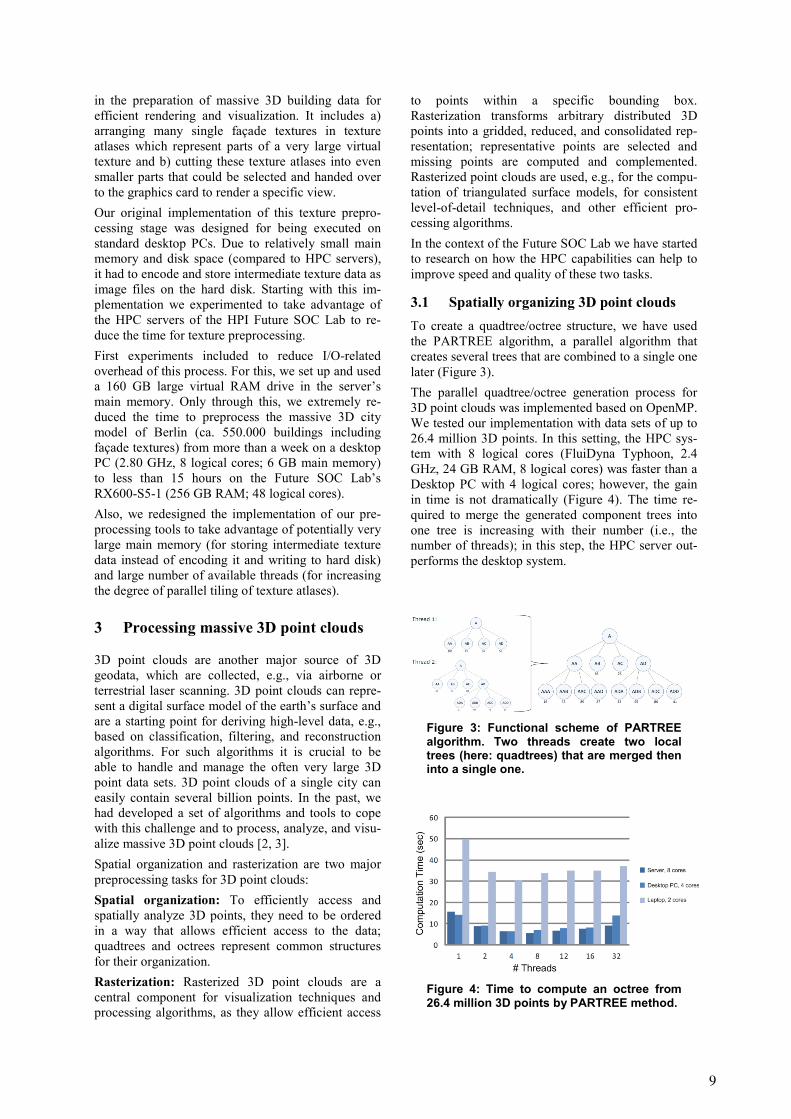
3 Parallelizing Entropy Decoding
The ED stage performs entropy decoding usingCABAC or CAVLC. In both these methods the inter-pretation of each bit in the stream depends on the pre-vious bit. Therefore, no task parallelism exists insidethe entropy decode of one frame. Multiple frames,however, can be decoded in parallel as they are sep-arated by start codes. The frames, however, are notfully independent as illustrated in Figure 2.In Figure 2, four frames are decoded in parallel. Thehatched blocks represent the current MBs that are de-coded in parallel and the blue blocks denote the al-ready processed MBs in each frame. For blocks in theB-frames some blocks may need the motion vectors ofthe co-located block in the previous frame. To expressthis parallelism, the code segment in Listing 2 can beused replacing the entropy_decode_task in Listing 1.The entropy decode task is split in three tasks.The init task initializes the context tables, thedecode_entropy_line_task entropy decodes a mac-
#pragma omp task inout(*rc) output(*frm)void read_frame_task(ReadContext *rc, EncFrame *frm
);
#pragma omp task inout(*nc, *frm) output(*s)void parse_header_task(NalContext *nc, Slice *s,
EncFrame *frm);
#pragma omp task inout(*ec, *s) input(*frm) output(*mbs)
void entropy_decode_task(EntropyContext *ec, Slice*s,
EncFrame *frm, H264mb *mbs);
#pragma omp task inout(*rc) input(*s, *mbs) output(*pic)
void reconstruct_task(MBRecContext *rc, Slice *s,H264Mb *mbs, Picture *pic);
#pragma omp task inout(*oc) input(*pic)void output_task(OutputContext *w, Picture *pic);
EncFrame frm[N]; Slice slice[N];H264Mb *ed_bufs[N]; Picture pic[N];
int k=0;while(!EOF){
read_frame_task(rc, &frm[k%N]);parse_header_task(nc, &slice[k%N], &frm[k%N]);entropy_decode_task(ec, &slice[k%N], &frm[k%N],
ed_bufs[k%N]);reconstruct_task (rc, &slice[k%N], ed_bufs[k%N],
&pic[k%N]);output_task(oc, &pic[k%N]);k++;
#pragma omp taskwait on (*rc)}
Listing 1. Pipelining the main decoderloop using OmpSs pragmas
I
1
P
2
B
3
B
4
Figure 2. Parallelism in entropy decod-ing in multiple consecutive frames. Col-ored MBs have been entropy decoded.Hatched blocks are decoded in parallel.
roblock line of the picture, and the release task releasesone or more Picture Info entries, which are no longerreferenced. To have multiple entropy decodes in flight,the EntropyContext is renamed in the same fashion asthe pipeline buffers shown in Listing 1.To maintain the dependencies shown in Figure 2, theentropy_decode_line_task has several annotated argu-ments. The EntropyContext is annotated with inoutto enforce that the lines of each picture are decodedsequentially. H264Mb *mb_in is annotated as an in-put and H264Mb *mb_out is annotated as an output,to maintain the dependencies between frames. Bypassing the pointers to the first H264Mb of the co-located line in the previous entropy buffer and the
2

#pragma omp task inout(*ec, *s, *mbs) input(*frm)void init_entropy_task(EntropyContext *ec, Slice *s
,EncFrame *frm, H264Mb *mbs);
#pragma omp task inout(*ec, *s) input(*mb_in)output(mb_out[0;columns])
void entropy_decode_line_task(EntropyContext *ec,int line, Slice *s, H264Mb *mb_in, H264Mb *mb_out
);
#pragma omp task inout(*s, *dummy)void release_PI_task(Slice *s, int *dummy);
...init_entropy_task(&ec[k%N], &slice[k%N], &frm[k%N],ed_bufs[k%N]);
for(int i=0; i<row; i++){entropy_decode__line_task(&ec[k%N], i, &slice[k%N
],&ed_bufs[(k+N-1)%N][i], &ed_bufs[k%N][i]);
}release_PI_task(&slice[k%N], &k);...
Listing 2. Code fragment replacing theentropy task to perform parallel entropydecoding.
first H264Mb of the current line in the current entropybuffer to mb_in and mb_out, respectively, it is ensuredthat each line x in frame n is decoded before startingto decode line x in frame n+1. A task for each mac-roblock line is created instead for each macroblock toincrease the task granularity at expense of parallelism.The parallelism is still sufficient, however, with a max-imum of 135 for QFHD resolution videos.
4 Parallelizing Macroblock Reconstruc-tion
In the macroblock reconstruction stage the image is re-constructed using the syntax elements produced by theentropy decoding stage. To reconstruct a macroblockin H.264 several pixel areas from adjacent recon-structed macroblock are required. For each hatchedmacroblock in Figure 3, the adjacent red pixels areneeded for the intra-prediction and the deblocking fil-ter kernels. Therefore, only macroblocks on a wave-front are parallel. The wavefront parallelism is notmassive, but sufficient with a maximum of 120 freemacroblocks in 4k × 2k resolution videos. The wave-front parallelism can be exploited using the code frag-ment in Listing 3.The wavefront dependencies are static and are coveredby the dependencies to the left macroblock and theupper right macroblock. The wavefront dependenciesof the reconstruct_mb_task are maintained through itsH264mb*arguments by annotating the left macroblockml and upper right macroblock mur as inputs andthe current macroblock m as inout. Since the recon-struct_mb_tasks are added in scan line order, this in-put and the output specification ensures that the wave-
Decoded MBs
Dependency data
Parallel MBs
Figure 3. Wavefront parallelism in H.264macroblock reconstruction.
#pragma omp task input(*rc, *s, *ml, *mur) inout(*m)
void reconstruct_mb_task(MBRecContext *rc, Slice *s,
H264mb *ml, H264mb *mur, H264mb *m);
#pragma omp task inout(*rc) input(*s, mbs[0;rows*cols])
output(*pic)void reconstruct_task(MBRecContext *rc, Slice *s,
H264Mb *mbs, Picture *pic){init_ref_list(s);get_picture_buffer(rc, s);for(int i=0; i< rows; i++){
for(int j=0; j< cols; j++){H264mb *m = &mbs[i*cols + j];H264mb *ml = m - ((j > 0) ? 1: 0);H264mb *mur = m - (((j < cols-1) && (i >0))
? cols-1: 0);reconstruct_mb_task(rc, s, ml, mur, m);
}}H264mb *lastmb = &mbs[smb_width*smb_height -1];
#pragma omp taskwait on (*lastmb)release_ref(rc, s);*pic = s->pic;
}
Listing 3. Wavefront algorithmexpressed in OmpSs.
front dependencies are maintained. In addition to thepragmas, only the code that computes the left and up-per right macroblock must be added to the sequen-tial code. The ability to express dependencies be-tween tasks makes the OmpSs implementation rela-tively clean and simple.
5 Optimizing Task Granularity
The OmpSs implementation of parallel macroblockreconstruction shown in Listing 3 is a clean wayto express the wavefront parallelism. The de-code_mb_tasks, however, are fine-grained and have anaverage execution time of around 2µs on a commodityprocessor. The task management overhead of OmpSsdoes not allow such fine-grained tasks to perform well.A technique to overcome this is to coarsen the tasks bygrouping several macroblocks. Due to the wavefrontdependencies, however, macroblocks must be groupedin tetris-block shapes, as shown in Figure 4.Expressing task dependencies between these tetris-shaped superblocks directly is not straightforward, es-pecially when it is desired to support an arbitrary pic-ture and superblock sizes. To overcome this the su-
3

perblocks are remapped to a regular structure. Inde-pendent of their shapes, all superblock variants still ex-hibit wavefront dependencies. The dependencies canbe easily checked, in the same way as the regular un-grouped macroblocks when they are remapped to aregular matrix form as depicted in Figure 4.
1 2 3 45
6 7 8 910
11 12 13 14 15
1 2 3 4 5
6 7 8 9 10
11 12 13 14 15
Figure 4. Remapping the irregular su-perblock shapes back to regular shapessimplifies the dependency expressionfor the programmer and task depen-dence checking for the runtime system.
The remapping does somewhat increase the code com-plexity. First, it must be calculated how many su-perblocks fit in the width and the height of a pic-ture. Second, when decoding the superblock it mustbe checked which macroblocks belong to this particu-lar superblock. This can be performed by checking ifthe macroblocks covered by the superblock shape areinside the picture.If it is ensured that every first superblock in a line hasthe maximum number of macroblocks in its top row,as is the case in Figure 4, then the code fragment inListing 4 can be used instead of the code fragment inListing 3 to reconstruct coarsened superblocks insteadof individual macroblocks, for an arbitrary block andpicture size.The code in Listing 4 resembles the code in Listing 3.The main differences are the reduced loop bound-aries smb_rows and smb_columns, calling the recon-struct_super_mb_task, and checking for valid mac-roblocks covered by the superblock before calling theinner reconstruct_mb function. This method is gen-erally applicable to specify coarsened wavefront par-allelism in OmpSs for arbitrary superblock sizes andpicture dimensions with minimal runtime dependencychecking overhead.
6 Experimental Results
A 4-socket cc-NUMA machine with a total of 32 coresis used for the performance evaluation. The full hard-ware and software specification of our evaluation plat-form is listed in Table 1.Figure 5 shows the effect of increasing the task gran-ularity described in the previous section. From thefigure we can see that the highest performance isachieved with a superblock size of 8×8. When thetask size is too small the performance is bottlenecked
#pragma omp task input(*rc, *s, *ml, *mur) inout(*m)
void reconstruct_super_mb_task(MBRecContext *rc,Slice *s, Supermb *ml, Supermb *mur, Supermb *m){for (int k=0, i=mby; i< m->mby + sheight; i++, k
++)for (int j= m->mbx -k ; j< m->mbx- k + swidth;
j++){// if (i,j) is a valid macroblockif (i< rows && j>=0 && j<columns)
reconstruct_mb(rc, s, i, j);}
}
#pragma omp task inout(*rc) input(*s,smbs[0;srows*scols]) output(*pic)
void reconstruct_task(MBRecContext *rc, Slice *s,Supermb *smbs, Picture *pic){init_ref_list(s);get_picture_buffer(rc, s);for(int i=0; i< srows; i++)
for(int j=0; j< scols; j++){Supermb *m = &smbs[i*scols + j];Supermb *ml = m - ((j > 0) ? 1: 0);Supermb *mur = m - (((j < scols-1) && (i >0))
?scols-1: 0);
reconstruct_super_mb_task(rc, s, ml, mur, m);}
Supermb *lastmb = &smbs[srows*scols -1];#pragma omp taskwait on (*lastmb)
release_ref(rc, s);*pic = s->pic;
}
Listing 4. Decoding tetris-shaped superblocks instead of singlemacroblocks.
Hardware SoftwareProcessor Xeon X7550 OS Ubuntu 10.10Cores 8 Kernel 2.6.35.10Frequency 2.00 GHz Compiler GCC 4.4.5Last level cache 18 MB OmpSs
compilerMercurium(git Aug’11)Sockets 4
Total cores 32 OmpSsruntime
Nanos++ (gitAug’11)Total memory 1 TiB
Total mem. BW 102.3 GB/s Opt. level -O2SMT DisabledTurbo mode Disabled
Table 1. Experimental setup.
by the runtime dependence checking. Increasing theblock size from 2×2 to 4×4 improves the performancealmost proportional to the increase in block size. Toolarge block sizes, on the other hand show again lowerperformance, because the parallelism is reduced toomuch.The performance of the OmpSs H.264 decoder is com-paring to an optimized Pthreads implementation [1]for up to 32 cores in Figure 6. For the OmpSs vari-ant a block size of 8 × 8 is used. The figure showsthat the performance results of the two are similar upto 8 cores, but are drifting further apart at higher corecounts. By grouping the macroblocks, however, theparallelism is limited, which in turn limits the perfor-mance at higher core counts. In the Pthreads versionof h264dec the synchronization is highly optimized us-
4

0
5
10
15
20
25
30
35
40
45
50
1 2 3 4 5 6 7 8 9 10 11 12 13 14 15 16
Frames
per
second
Cores
2×24×48×812×1216×16
Figure 5. Performance impact of the dif-ferent superblock sizes.
ing a line decoding strategy and, therefore, grouping oftasks is not necessary, resulting in a higher scalability.
5
10
15
20
25
30
Spee
dup
1 8 16 24 32
Cores
PthreadsOmpSs
Figure 6. Speedup results for an opti-mized Pthreads and OmpSs variant ofthe full H.264 decoder
To improve the scalability more parallelism can be ex-ploited by starting to decode the next frame before thecurrent frame is completely decoded. Because the mo-tion vectors have limited sizes some macroblocks ofthe next frame can already be decoded. The difficultyis that another dependency must be added betweenmacroblocks in consecutive frames, which could in-crease the task dependence checking overhead morethan the additional parallelism gains in performance.Another way to increase the scalability is to reducethe task dependency checking overhead. This can beachieved by changing the order tasks are submitted, inorder to reduce the tasks-in-flight without reducing theparallel schedulable tasks. Less tasks-in-flight lead toa lowere cost for task dependency checking.
7 Conclusions
In this report we have discussed how H.264 decod-ing can be parallelized in OmpSs to capture both thefunction-level and data-level parallelism. In OmpSsthis can be done intuitively in contrast to Pthreads andother task-based programming models such as Cilk++and OpenMP. The runtime task overhead, however,forces that the granularity of the tasks is increased,which reduces the scalability at higher core counts. Infuture work we will investigate how parallelism canbe exploited in consecutive frames. Also we will tryto reduce the task dependence checking overhead byreducing the task window size for a given amount ofparallelism.
8 Acknowledgements
This research has been supported by the Euro-pean Community’s Seventh Framework Programme[FP7/2007-2013] under the ENCORE Project(www.encore-project.eu), grant agreement n◦
248647 [4]. Computational support has been providedby the Future SOC Lab of Hasso-Plattner-InstitutePotsdam [5].
References
[1] C. C. Chi and B. Juurlink. A QHD-Capable ParallelH.264 Decoder. In Proc. 25th Int. Conf. on Supercom-puting, 2011.
[2] L. Dagum and R. Menon. OpenMP: A Proposed In-dustry Standard API for Shared Memory Programming.IEEE Computing in Science and Engineering, 1997.
[3] A. Duran, E. Ayguadé, R. M. Badia, J. Labarta, L. Mar-tinell, X. Martorell, and J. Planas. OmpSs: A Proposalfor Programming Heterogeneous Multi-Core Architec-tures. Parallel Processing Letters, 21, 2011.
[4] Encore Project. ENabling technologies for a futuremany-CORE.
[5] Hasso-Plattner-Institut Potsdam. Fu-ture SOC Lab. http://www.hpi.uni-potsdam.de/forschung/future_soc_lab.html.
[6] A. Pop and A. Cohen. A Stream-Computing Exten-sion to OpenMP. In Proc. 6th Int. Conf. on High Per-formance and Embedded Architectures and Compilers,2011.
[7] K. H. Randall. Cilk: Efficient Multithreaded Comput-ing. PhD thesis, Department of Electrical Engineeringand Computer Science, Massachusetts Institute of Tech-nology, 1998.
[8] H. Vandierendonck, P. Pratikakis, and D. Nikolopou-los. Parallel Programming of General-Purpose Pro-grams Using Task-Based Programming Models. InProc. 3rd USENIX Workshop on Hot Topics in Paral-lelism, 2011.
5


Service-Based 3D Rendering and Interactive 3D Visualization
Benjamin Hagedorn Hasso-Plattner-Institut
Prof.-Dr.-Helmert-Str. 2-3 D-14482 Potsdam
Jürgen Döllner Hasso-Plattner-Institut
Prof.-Dr.-Helmert-Str. 2-3 D-14482 Potsdam
Abstract
This report describes the subject and preliminary results of our work in the context of the HPI Future SOC Lab, which generally aims on how to exploit high performance computing (HPC) capabilities for service-based 3D rendering and service‐based, inter-active 3D visualization. A major focus is on the ap-plication of HPC technologies for the creation, man-agement, analysis, and visualization of and interac-tion with virtual 3D environments, especially with complex 3D city models.
1 Motivation
Virtual 3D city models represent a major type of virtual 3D environments. They can be defined as a digital, geo-referenced representation of spatial ob-jects, structures and phenomena of a distinct geo-graphical area; its components are specified by geo-metrical, topological, graphical and semantically data and in different levels of detail. Virtual 3D city models are, e.g., composed of digital terrain models, aerial images, building models, vege-tation models, and city furniture models. In general, virtual 3D city models serve as information models that can be used for 3D presentation, 3D analysis, and 3D simulation. Today, virtual 3D city models are used, e.g., for urban planning, mobile network plan-ning, noise pollution mapping, disaster management, or 3D car and pedestrian navigation. In general, virtual 3D city models represent promi-nent media for the communication of complex spatial data and situations, as they seamlessly integrate het-erogeneous spatial information in a common refer-ence frame and also serve as an innovative, effective user interface. Based on this, virtual 3D city models, as integration platforms for spatial information, rep-resent essential building blocks of today’s and future information infrastructures.
1.1 Complexity of 3D city models Virtual 3D city models are inherently complex in multiple dimensions, e.g., semantics, geometry, ap-
pearance, and storage. Major complexities are de-scribed in the following: Massive amounts of data: Virtual 3D city models typically include massive amounts of image data (e.g., aerial images and façade images) as well as massive amounts of geometry data (e.g., large num-ber of simple building models, or smaller number of buildings modeled in high detail). Vegetation models represent another source of massive data size; a sin-gle tree model could contain, e.g., approximately 150,000 polygons). Distributed resources: In today’s so called geospa-tial data infrastructures (GDIs), the different compo-nents (i.e., base data) of virtual 3D city models as well as functionalities to access, and process (e.g., analyze) virtual 3D city models can be distributed over the Internet. In specific use cases such as in emergency response scenarios, they need to be identi-fied, assembled, and accessed in an ad-hoc manner. Heterogeneity: Virtual 3D city models are inherently heterogeneous, e.g., in syntax (file formats), schemas (description models), and semantics (conceptual models). As an example, the virtual 3D city model of Berlin contains about 550,000 building models in moderate and/or high detail, textured with more than 3 million single (real-world) façade textures. The aerial image of Berlin (covering an area of around 850 km2) has a data size of 250 GB. Together with additional the-matic data (public transport data, land value data, solar potential) the total size of the virtual 3D city model of Berlin is about 700 GB.
1.2 Service-based approach The various complexities of virtual 3D city models have an impact on their creation, analysis, publishing, and usage. Our overall approach to tackle these com-plexities and to cope with these challenges is to de-sign and develop a distributed 3D geovisualization system as a technical framework for 3D geodata integration, analysis, and usage. For this, we apply and combine principles from Service-Oriented Com-puting (SOC), general principles from 3D visualiza-
7

tion systems, and standards of the Open Geospatial Consortium (OGC).
Figure 1: 3D client for exploring the 3D city model of Berlin, running on an iPod.
To make complex 3D city models available even for small devices (e.g., smart phones, tablets), we have developed a client/server-system that is based on server-side management and 3D rendering [1]: A portrayal server is hosting a 3D city model in a pre-processed form that is optimized for rendering, syn-thesizes images of 3D views of this data, and trans-fers these images to a client, which (in the simplest case) only displays these images. By this, the 3D client is decoupled from the complexity of the under-lying 3D geodata. Also, we can optimize data struc-tures, algorithms and rendering techniques with re-spect to specialized software and hardware for 3D geodata management and 3D rendering at the server-side. – Figure 1 shows our 3D client running on an iPod; it allows a user to interactively explore the virtual 3D city model of Berlin. Our project in the context of the HPI Future SOC Lab aims on research and development of how to exploit its capabilities for such a distributed 3D visualization
system, especially for 3D geodata preprocessing, analysis, and visualization. The capabilities of inter-est include the availability of many cores, large main-memory, GPGPU-based computing, and parallel rendering.
2 Processing massive 3D city models
As raw geodata cannot be used directly for visualiza-tion and rendering purposes, this data needs to be transformed into graphics representations that can be rendered by a 3D rendering engine. Geodata prepara-tion includes preprocessing of terrain data (geometry and textures, e.g., aerial images) as well as prepro-cessing of building data (geometry and façade tex-tures). Building data are, e.g., originally provided in the CityGML format, an XML-based standard model and format for the specification of 3D city models, including semantics, geometry, attributes, and ap-pearance information. Figure 2 illustrates the prepro-cessing of such CityGML building data, which in-cludes the following three major stages and sub tasks: Data extraction: building feature extraction, geome-try extraction and triangulation, object-id assignment to each building object, spatial organization of all buildings in a quadtree structure. Geometry optimization: geometry batching, data serialization. Façade texture optimization: texture atlas computa-tion, texture atlas tiling, texture coordinate adjust-ment. Typically, the texture data of a large virtual 3D city model does not completely fit into a graphics card’s texture memory. Thus, rendering large 3D city mod-els requires selecting and loading the data (in appro-priate level of detail) that is required for a specific camera position and view frustum. Texture prepro-cessing and optimization is a time-consuming stage
Figure 2: Preprocessing scheme for 3D geodata for 3D rendering.
8
in the preparation of massive 3D building data for efficient rendering and visualization. It includes a) arranging many single façade textures in texture atlases which represent parts of a very large virtual texture and b) cutting these texture atlases into even smaller parts that could be selected and handed over to the graphics card to render a specific view. Our original implementation of this texture prepro-cessing stage was designed for being executed on standard desktop PCs. Due to relatively small main memory and disk space (compared to HPC servers), it had to encode and store intermediate texture data as image files on the hard disk. Starting with this im-plementation we experimented to take advantage of the HPC servers of the HPI Future SOC Lab to re-duce the time for texture preprocessing. First experiments included to reduce I/O-related overhead of this process. For this, we set up and used a 160 GB large virtual RAM drive in the server’s main memory. Only through this, we extremely re-duced the time to preprocess the massive 3D city model of Berlin (ca. 550.000 buildings including façade textures) from more than a week on a desktop PC (2.80 GHz, 8 logical cores; 6 GB main memory) to less than 15 hours on the Future SOC Lab’s RX600-S5-1 (256 GB RAM; 48 logical cores). Also, we redesigned the implementation of our pre-processing tools to take advantage of potentially very large main memory (for storing intermediate texture data instead of encoding it and writing to hard disk) and large number of available threads (for increasing the degree of parallel tiling of texture atlases).
3 Processing massive 3D point clouds
3D point clouds are another major source of 3D geodata, which are collected, e.g., via airborne or terrestrial laser scanning. 3D point clouds can repre-sent a digital surface model of the earth’s surface and are a starting point for deriving high-level data, e.g., based on classification, filtering, and reconstruction algorithms. For such algorithms it is crucial to be able to handle and manage the often very large 3D point data sets. 3D point clouds of a single city can easily contain several billion points. In the past, we had developed a set of algorithms and tools to cope with this challenge and to process, analyze, and visu-alize massive 3D point clouds [2, 3]. Spatial organization and rasterization are two major preprocessing tasks for 3D point clouds: Spatial organization: To efficiently access and spatially analyze 3D points, they need to be ordered in a way that allows efficient access to the data; quadtrees and octrees represent common structures for their organization. Rasterization: Rasterized 3D point clouds are a central component for visualization techniques and processing algorithms, as they allow efficient access
to points within a specific bounding box. Rasterization transforms arbitrary distributed 3D points into a gridded, reduced, and consolidated rep-resentation; representative points are selected and missing points are computed and complemented. Rasterized point clouds are used, e.g., for the compu-tation of triangulated surface models, for consistent level-of-detail techniques, and other efficient pro-cessing algorithms. In the context of the Future SOC Lab we have started to research on how the HPC capabilities can help to improve speed and quality of these two tasks.
3.1 Spatially organizing 3D point clouds To create a quadtree/octree structure, we have used the PARTREE algorithm, a parallel algorithm that creates several trees that are combined to a single one later (Figure 3). The parallel quadtree/octree generation process for 3D point clouds was implemented based on OpenMP. We tested our implementation with data sets of up to 26.4 million 3D points. In this setting, the HPC sys-tem with 8 logical cores (FluiDyna Typhoon, 2.4 GHz, 24 GB RAM, 8 logical cores) was faster than a Desktop PC with 4 logical cores; however, the gain in time is not dramatically (Figure 4). The time re-quired to merge the generated component trees into one tree is increasing with their number (i.e., the number of threads); in this step, the HPC server out-performs the desktop system.
Figure 3: Functional scheme of PARTREE algorithm. Two threads create two local trees (here: quadtrees) that are merged then into a single one.
Figure 4: Time to compute an octree from 26.4 million 3D points by PARTREE method.
9

3.2 Rasterization of 3D point clouds Rasterization is a multi-step process which 1) identi-fies for each point of an unordered 3D point cloud the corresponding raster cell and assigns the raster cell ID, 2) ordering the points according to their raster cell ID, 3) computing one characteristic 3D point for each raster cell (representing the relevant input points), and 4) interpolating cell points for empty raster cells. For sorting the points according to their raster cell ID, our implementation uses the Bitonicsort algorithm, which requires to establish a bitonic order before sorting. We have implemented the rasterization algorithm in two versions: a) a version for multi-core processors (using OpenMP) and b) a data-parallel GPU-based version (using CUDA). The CUDA version has been tested with the Future SOC Lab’s TESLA system. It can rasterize a point cloud of 30.5 million 3D points in only 22 minutes in contrast to more than 5 hours of a single threaded CPU-version.
4 Next Steps
The continuation of our work in the area of exploita-tion of HPC capabilities for service-based 3D render-ing and 3D visualization systems and in the context of the HPI Future SOC Lab will include further im-provement of our algorithms, processes, and tools. Also, we plan to extend our work to research and development on HPC-based analysis of massive 3D geodata (such as solar potential analysis) and on service-based technologies for assisted interaction and camera control in massive virtual 3D city models [4]. For this, we will exploit parallel and GPU-based algorithms to generate so called “best views” on virtual 3D city models based on visual, geometrical and usage-related characteristics.
5 Conclusions
This report briefly described the subject of our re-search and development in the context of the HPI future SOC Lab, preliminary results, as well as in-tended future work. Work and results were mainly in the areas of preprocessing massive 3D city model data and processing of massive 3D point clouds. Here, we could dramatically increase the time re-quired to preprocess raw 3D geodata (CityGML data with geometry and textures; and massive 3D point clouds). Also, we identified additional opportunities for optimizing these algorithms. More generally, this work leads to new opportunities for research and development on advanced and innovative technolo-gies for the exploitation (e.g., analysis and visualiza-tion) of massive spatial 3D data sets.
Acknowledgment We would like to thank Markus Behrens for his help with the implementation and evaluation of 3D point cloud processing and its evaluation.
References [1] D. Hildebrandt, J. Klimke, B. Hagedorn, J. Döllner:
Service-oriented Interactive 3D Visualization of Mas-sive 3D City Models on Thin Clients. In: Proc. of 2nd Int. Conf. on Computing for Geospatial Research & Application COM.Geo 2011, 2011.
[2] R. Richter, J. Döllner: Out-of-Core Real-Time Visual-ization of Massive 3D Point Clouds. In: Proc. of 7th Int. Conf. on Virtual Reality, Computer Graphics, Visualisation and Interaction in Africa, pp. 121-128, 2010.
[3] R. Richter, J. Döllner: Potentiale von massiven 3D Punktwolkendatenströmen. In: Proc. of Geoinformatik 2012, Braunschweig, 2012.
[4] J. Klimke, B. Hagedorn, J. Döllner: A Service-based Concept for Camera Control in 3D Geovirtual Envi-ronments. In: Proc. of 7th Int. 3D GeoInfo Conference 2012. (accepted)
10

Future SOC Lab Autumn Term Project Activities Report: Benchmarking and Tenant Placement for
Efficient Cloud Operations
Multi-Tenancy Project Team SAP Innovation Center Potsdam
Prof.-Dr.-Helmert-Str. 2-3 14482 Potsdam, Germany
Jan Schaffner EPIC Chair, Hasso-Plattner-Institute
August-Bebel-Straße 88 14482 Potsdam, Germany
Abstract
Cloud computing mainly turns the overall IT costs of companies that move into the cloud into operational expenditures that they pay for the consumed services to a cloud provider. Consequently, the risk of cor-rectly dimensioning the infrastructure as well as the need to keep capital expenditures as well as adminis-trative costs at viable levels is transferred to the cloud provider. Multi-tenancy, i.e. consolidating several customers onto the same infrastructure, is one method to achieve higher utilization and there-fore a more efficient cloud operation.
This project’s main focus is on the efficiency and reliability of cloud services provided by server ma-chines in virtualized, multi-tenant environments. By intelligently placing and later migrating tenants in this environment, we aim to achieve load balancing and a consistent service quality of the provided cloud services while keeping operational costs minimal. Before these investigations can take place, an evalua-tion and testing environment must be built up and suitable testing scenarios, e.g. in the form of bench-marks, need to be defined. This was the first major work stream that we followed out in the past lab term. The second work stream relates to tenant placement. Both are work-in-progress and are con-cisely described in the following. A proposal for continuation of this project in the coming lab term concludes this report.
1 Introduction
Having instantaneous access to relevant business information anywhere and anytime is becoming more and more important [1]. To realize this economically, it is necessary to deal with huge amounts of data and load at fewer costs. Big companies that felt this pres-
sure like Amazon [2] and Google [3] developed ap-proaches to handle these requirements that are now called Cloud Computing.
The idea behind the cloud is to offer computing as a service with seemingly endless capacity that can be added or removed on demand [4]. The user keeps the data inside the cloud infrastructure and has access to the performance of a data center to execute complex operations on it. Through the network, data can be accessed in an easy way with various devices.
One essential aspect to achieve the required cost savings is multi-tenancy [4], which describes consol-idating multiple clients on a small hardware set. An additional advantage is that clients can not only share the server hardware, but also applications, content and data. When thinking about multi-tenancy, several chal-lenges become obvious [5, 6], such as tenant place-ment and tenant migration. Another very important topic is benchmarking. It is not enough to develop new technologies, but also to demonstrate where exactly the strengths of a system are and how it per-forms compared to others. Furthermore, there is a need to support the development process with tools that can help checking the quality of the implemented approach. To do this, benchmarks can be helpful tool.
2 Benchmarking
Current database benchmarks do not support cloud computing scenarios and multi-tenancy. To realize this, the following tasks have to be tackled: • handling of data sizes and user scenarios that are
typical for cloud computing• supporting multi-tenant environments• defining an industry benchmark to compare dif-
ferent approaches
11

The goal of this first work stream is to implement a first benchmark that fits the needs described above. Our approach is guided through the reuse of the al-ready existing database benchmark called Composite Benchmark for Transactions and Reporting (CBTR) [7] developed by Anja Bog at the EPIC chair of HPI.
This system brings in several useful functionalities compared to other database benchmarks. It provides the possibility to mix analytical and transactional workloads and it operates on a dataset based on real customer data. Furthermore, it uses the Order-to-Cash scenario with a schema definition typical for SAP customers, namely implementing several tables with more than 100 columns.
The original implementation can handle one ten-ant that maintains the connection to the database. This tenant serves several clients that continuously query the database, to identify its properties under maximum load. This scenario had to be extended to a multi-tenant system with variable load profiles and think times.
Based on the original CBTR implementation we conducted an extension of the existing architecture as well as implemented new functionalities to support multiple tenants. We call the resulting Benchmark CBTRmt.
The following functionalities are part of CBTRmt: • Maintaining multiple tenants at the same time,
where each of them handles a number of differentclients.
• Maintaining connection pooling for each of thetenants.
• Configurable think times between the queriessubmitted by each client.
• A load profile that specifies the workload of eachtenant on the base of a 24h day.
• Exchangeable tenants.While developing the described benchmark, the
need to create an arbitrary number of tenants with different sizes, loads and datasets became apparent. The so-called Experiment Generator (ExpG) was therefore conceptualized to be able to create all nec-essary files and setting for a complete experiment setup.
The functionality covered by the ExpG includes the generation of realistic data sets for the database schema used in the CBTR benchmark. The imple-mentation not only considers the data type, length, primary key and foreign key specifications, but also the size relation between the input tables. In parallel to the data generation, also query parameters are generated. This allows the querying of the generated data, just as it would be the original customer data. The ExpG is implemented in Java, based on a ran-domization algorithm. By specifying the seed of the Random object, one can influence the data generation
directly. It is also possible to regenerate an old da-taset by knowing its seed value.
One open issue for the ExpG is the support of dif-ferent database schemas, which is already planned for the upcoming project phase. The output of the ExpG can then be directly loaded into the CBTRmt Bench-mark and run as a whole experiment on the database.
This work stream heavily employed the SAP HANA machine in the Future SOC Lab as well as one to two high-performance servers to generate the tenant load on the SAP HANA machine as client machines.
3 Tenant Placement
The second work stream focuses on the Robust Tenant Placement and Migration Problem (RTP). The goal of this optimization problem is to assign r ≥ 2 copies of a given number of tenants to a number of (cloud) servers such that
• no server is overloaded in terms of memory andCPU,
• no server contains more than one copy per ten-ant,
• the failure of a single server does not causeoverloading any other server, and
• the number of active servers is minimal.A tenant comprises a set of database tables as well
as users issuing requests against those tables. Any tenant t is characterized by its size σ(t) (i.e. the amount of main memory each replica of the tenant consumes) and its load l(t). For in-memory column databases, the latter depends on the current request rates of the tenant’s users as well as the size of a tenant. For more information about how to experi-mentally obtain l(t) for a given set of database tables and workload, we refer to our previous work on per-formance prediction for in-memory column data-bases [9]. Note that we assume that l(t) is additive across multiple tenants. We assume that queries are load balanced across tenant replicas in a round-robin fashion. Thus, a server only receives a fraction of the total load of a tenant, depending on the number of replicas.
Tenants are placed on servers. We call a server ac-tive if the server holds at least one tenant with non-zero size and non-zero load.
Example 1. Figure 1 (left) depicts an exemplary placement. Tenants A, B, C, D, E each have two copies and are distributed on four servers S1–S4. Each server has load capacity lcap = 1.0 and memory is limit-less (σcap = ∞). The load consumption of the tenants are depicted as small numbers in the boxes. The total load of a tenant is split across all its replicas (e.g. the total load of tenant A is 0.2). The failure of a server, say server S2, means that server S4 must in
12

turn handle the load that was formerly shared be-tween servers S2 and S4. This must not lead to the overload of S4. In this example, S4 gets a load of 0.3 after failure of S2, which does not lead to overload-ing server S4.
Figure 1: Left: Greedy-Placement and Mirror-ing. Right: Interleaving
At first glance, RTP resembles the two-dimensional bin- packing with conflicts, where the conflicts arise from the constraint that no server should hold more than one copy of the same tenant.
However, RTP is different from the two-dimensional bin-packing [8] with conflicts [9] prob-lem because we are interested in finding an assign-ment of tenants to servers such that the assignment is robust towards server failures. A server failure causes a load increase on those servers that hold copies of tenants that were placed on the failed server. This excess load is shared among the remaining servers that hold replicas of those tenants. While it is com-mon to handle replication using a static placement strategy (e.g. mirroring), we let the tenant placement be flexible within the following constraints: tenants can be placed on arbitrary servers, as long as no two copies of any particular tenant reside on the same server; and, each server must have enough spare capacity to deal with extra load coming from tenants on a failed servers. As a result of allowing a flexible placement strategy, assignments with fewer active servers can often be found, as we shall see in the following example.
Example 2. Fig. 1 (right) shows an example with five tenants, A, B, C, D, and E, as well as their load l(t) (we neglect σ(t) in this example). A conventional approach to assigning those tenants to servers would be to sort the tenants by load (in descending order), use a simple greedy algorithm assuming only one copy per tenant must be placed, and finally mirroring the resulting placement. This approach, shown on the left side of the figure, requires four servers. A flexi-ble way to place the same tenants, which we shall call interleaving, shown on the right side of the fig-ure, requires only three servers. Table 1 shows the total load on each server both for normal operations and with one other server failing. For example, in the
mirrored case, a failure of server S1 doubles the load on S3, while the load on S2 and S4 remains constant. With interleaving, the excess load caused by a failure is distributed among multiple servers.
In addition to guaranteeing that placements are ro-bust towards single-server failures, we acknowledge that dealing with a variable number of servers re-quires frequent migration of tenant replicas between servers. RTP is an incremental problem in the sense that it has to be solved periodically using an existing placement as a starting point. The frequency of the reassignment interval limits the amount of change that can be applied to the original placement. In pre-vious work we have found that migrating tenants away from or onto an active server temporarily re-duces the server’s ability to serve requests [10]. In the case of in-memory column databases, we are able to precisely quantify the reduction of a servers query processing capacity lcap incurred by migration for a given set of database tables and workload. The size of a tenant does not impact how much the capacity of a server is reduced during migration but it affects how long it takes to migrate the tenant [10]. Thus, the amount of migration that is permissible in each step depends on the length of the reorganization interval and to what degree migrations can be performed in parallel.
Currently, we are conducting experiments on a va-riety of algorithmic approaches to solve the RTP as well as experiments for finding a good benchmark. Algorithms we evaluate on the Future SOC Lab computing resources range from special purpose greedy-heuristics to meta-heuristics and, finally, exact algorithms. Our experiments are work-in-progress.
4 Project Proposal for Next Lab Term
As both work streams are still work-in-progress we propose a continuation of the current project also in the Future SOC Lab spring term of 2012. We plan to apply current implementations and findings in order to achieve the defined goals. The focus remains on efficiency and reliability of cloud services provided by server machines in virtualized, multi-tenant envi-ronments. By migrating tenants in this environment, we aim to achieve load balancing and a consistent service quality of the provided cloud services. A migration manager responsible for this process shall act as follows: First, a forecasting method esti-mates the load that tenants are likely to produce. This forecast could be based on load profiles of customers as well as business information such as a factory calendar. Based on this forecast, a multi-criteria op-timization takes place. Examples for objectives in the optimization could be cost of the migration process
13

and possible re-migration, benefit of load balancing and expected quality of service. Success will be evaluated based on fulfillment of given service level agreements in experiments based on real-world scenario as well as on other criteria that will be defined as part of this project. In a next step we plan to extend the approach to include failure prediction algorithms for migration decision-making once a potential failure has been identified. This aims at increasing the reliability of the overall cloud solu-tion for cases in which server machines may fail. These activities would make use of the FutureSOC Lab computing resources in a similar way as in the first project phase.
5 Acknowledgements
The project members wish to thank Bernhard Rabe of Future SOC Lab/HPI for his invaluable administra-tive support to setup and run the numerous tests as part of the benchmarking efforts.
6 References
[1] Shuai Zhang, Shufen Zhang, Xuebin Chen, Xiuzhen Huo. Cloud Computing Research and Development Trend. Future Networks, International Conference on, pp. 93-97, 2010 Second International Conference on Future Networks, 2010.
[2] Amazon Elastic Compute Cloud [URL]. http://aws.amazon.com/ec2/, access on Feb. 2012.
[3] Google App Engine [URL]. http://code.google.com/appengine/, access on Feb. 2012.
[4] Peter Mell, Timothy Grance. The NIST Definition of the Cloud Computing. NIST Special Publication 800-145. 2011.
[5] Curino, Carlo et al. Relational Cloud: A Database-as-a-Service for the Cloud. 5th Biennial Conference on Innovative Data Systems Research, CIDR 2011, January 9-12, 2011 Asilomar, California.
[6] Dean Jacobs, Stefan Aulbach. Ruminations on Multi-Tenant Databases. BTW 2007: 514-521
[7] Anja Bog, Hasso Plattner, Alexander Zeier. A mixed transaction processing and operational reporting benchmark. Springer Science + Business Media, LLC 2010.
[8] W. Leinberger, G. Karypis, and V. Kumar. Multi-Capacity Bin Packing Algorithms with Applications to Job Scheduling under Multiple Constraints. In ICPP, pages 404–412, 1999.
[9] L. Epstein and A. Levin. On Bin Packing with Con-flicts. SIAM Journal on Optimization, 19(3):1270–1298, 2008.
[10] J. Schaffner, B. Eckart, D. Jacobs, C. Schwarz, H. Plattner, and A. Zeier. Predicting in-memory data-base performance for automating cluster manage-ment tasks. In Proceedings of the 27th International Conference on Data Engineering, ICDE 2011, April
11-16, 2011, Hannover, Germany, pages 1264–1275, 2011
14

Towards Multi-Core and In-Memory for IDS Alert Correlation:Approaches and Capabilities
Sebastian Roschke, Seraj Fayyad, David Jaeger, Feng Cheng, Christoph Meinel Hasso-Plattner-Institut
Prof.-Dr.-Helmert-Str. 2-314482 Potsdam
{sebastian.roschke, seraj.fayyad, feng.cheng, meinel}@hpi.uni-potsdam.de{david.jaeger}@student.hpi.uni-potsdam.de
Abstract
Intrusion Detection Systems (IDS) have been widelydeployed in practice for detecting malicious behavioron network communication and hosts. The problemof false-positive alerts is usually addressed by corre-lation and clustering of alerts. As real-time analysisis crucial for security operators, this process needs tobe finished as fast as possible, which is a challengingtask as the amount of alerts produced in large scaledeployments of distributed IDS is significantly high.We identify the data storage and processing algorithmsto be the most important factors influencing the per-formance of clustering and correlation. The SecurityAnalytics Lab (SAL) is developed to make use of multi-core and in-memory processing. Using the SAL, a mul-titude of algorithms is implemented, such as Attack-Graph based correlation using HMMs, QROCK cate-gorical clustering, and rule-based correlation using aknowledge base. The SAL is using the Common EventExpression (CEE) and supports generic flat log data.
1 Alert Correlation and its Performance
The alert correlation framework usually consists ofseveral components [4]: Normalization, Aggrega-tion (Clustering), Correlation, False Alert Reduction,Attack Strategy Analysis, and Prioritization. Overthe last years, alert correlation research focused onnew methods and technologies for these components.IDMEF[5], CEE [7] and CVE [6] are important effortsin the field of Normalization. Approaches of aggrega-tion are mostly based on similarity of alerts or gen-eralization hierarchies. The correlation algorithms [4]can be classified as: Scenario-based correlation, Rule-based correlation, Statistical correlation, and Tempo-ral correlation. The aspect of performance and qualityis the focus of the “Security Analytics Lab“ (SAL) [2].The SAL is developed to provide an experiment envi-
ronment for IDS correlation algorithms to support se-curity operators with real-time monitoring and foren-sics. The SAL is designed with efficiency in mind,i.e., optimized quality and performance of the algo-rithms as well as the storage and organization of orig-inal alerts. The platform introduced in [2] consid-ers different storage mechanisms and can handle mas-sive amounts of data for specific algorithms that makeheavy use of the caching mechanisms of the platform.For storage, a column-based database, an In-Memoryalert storage, and memory-based index tables lead tosignificant improvements of the performance. Further-more, the SAL supports the usage of GPU-based algo-rithms by providing necessary APIs.We believe that research in the area of IDS and net-work security as application for multi-core and In-memory based platforms can provide new paradigmsfor conducting security. Correlation and clustering iscurrently only done in a limited way using filtered datasets. Using the multi-core and In-memory platforms,it might be possible to do correlation and clustering onan unfiltered data set. Thus, it might not be necessaryto fine tune (e.g., exclude certain detection rules) theIDS sensors anymore, as the correlation and clusteringcan do meaningful reasoning on all alerts in a shorttime. Furthermore, we expect correlation and cluster-ing services offered in the Cloud. A flexible and exten-sible correlation platform can provide the foundationwork for a new paradigm in security.
2. Results and Achievements
During the last few month, we have been working onimproving the implementation on the Common Eventexpression (CEE) [7]. Furthermore, we have been im-plementing several convenience features to improvethe handling of the platform in case of multiple datasets. A data set switching mechanism is implementedthat allows the switching of data bases from the webUI. To improve the Attack Graph (AG) based corre-lation, we optimized the modeling of the attack graph
15

and adjusted the corresponding AG correlation mod-ule. The AG-based algorithm was redesigned to fitadditional attack scenarios. We further developedan algorithm for evaluating attack paths and attacksprogress depending on multiple conditions, such asimportance of the target, existence of a public exploit,etc.Apart from the practical achievements, we have beenable to publish a paper on the Attack Graph based al-gorithm [3], which is currently finalized for a Journalpublication. A detailed description of the results isgiven in the following subsections.We deployed the prototype of the correlation platforma FutureSOC VM (1 CPU, 4 GB Ram) and developedmultiple features to improve performance and usabil-ity. Furthermore, we conducted some tests and exper-iments using the NVIDIA FluiDyna System as well asthe Fujitsu RX600 S5 1.
3 Towards High-quality Attack-Graph-based Correlation
In this section, a modified AG based correlation al-gorithm is described which only creates explicit cor-relations. Implicit correlations, as described in [14],make it difficult to use the correlated alerts in thegraph for forensic analysis of similar attack scenarios.Furthermore, the hardware environment used for theIn-Memory databases provides machines with hugeamounts of main memory which downgrades the prior-ity of memory efficiency for this work. The algorithmsconsists of five steps, while each step can be parame-terized to fine tune the results: 1) preparation, 2) alertmapping, 3) aggregation of alerts, 4) building of analert dependency graph, and 5) searching for alert sub-sets that are related. In the preparation phase, all nec-essary information is loaded, i.e., the system and net-work information is gathered, the database with alertclassifications is imported, and the AG for the networkis loaded. The proposed algorithm works based on theexploit dependency graph created by MulVAL [15].This type of attack graph is used simply because thetool is freely available. MulVAL is used to generatean AG which describes the corresponding system andnetwork information for the target network. The out-put of MulVAL is a simple graph description which isnot using a standardized format. Thus, the MulVALoutput is interpreted and a corresponding graph struc-ture is build in memory.The algorithm is based on a set of basic definitions.
3.1 Definitions
Let T be the set of all timestamps, H be the set ofpossible hosts, and C be the set of classifications. Acan be defined as:
A = T ×H ×H× C (1)
Let a single alert a ∈ A be a tuple a = (t, s, d, c)while the following functions are defined:
• ts(a) = t - returns t ∈ T , the timestamp of thealert
• src(a) = s - returns s ∈ H , the source host ofthe alerts
• dst(a) = d - returns d ∈ H , the destination hostof the alert
• class(a) = c - returns c ∈ C, the classificationof the alert
Let I be the set of impacts described by MulVAL [15]and VR be the set of known vulnerabilities. Let V bea set of vertices defined as:
V = I ×H × VR (2)
For each triple v = (im, h, r) | v ∈ V , the followingfunctions are defined:
• imp(v) = im - returns im ∈ I, the impact of thevertex
• host(v) = h - returns h ∈ H, the host of thevertex
• ref(v) = r - returns r ∈ VR, the vulnerabilityreference of the vertex
Let AG = (V,E) be an AG with vertices V and edgesE. An edge e ∈ E ⊆ V 2 is an ordered tuple of vertices(v, v′) with v ∈ V ∧v′ ∈ V . PAG defines all the pathsin the AG. The path P ∈ PAG is defined as a set ofedges P = (v, v′) ∈ E. ord(P ) defines the number ofedges in the path P . in(v, P ) depicts whether a vertexlies in the path:
in(v, P ) := ∃(v, v′) ∈ P ∨ ∃(v′, v) ∈ P (3)
3.2 Mapping
The mapping function mapi maps matching alerts tospecific nodes in the AG and is defined as:
mapi : a 7→ {v ∈ V | Φi(a, v)} (4)
There are different kinds of Φi(a, v) defined in (5), (6),(7), (8), and (9) to parameterize the mapping function.
Φ1(a, v) := ∃v′ ∈ V : (src(a) = host(v′))
∧(dst(a) = host(v))
∧(class(a) = ref(v)) (5)
Φ2(a, v) := (dst(a) = host(v))∧(class(a) = ref(v))(6)
16

Figure 1. AG-based Correlation Algo-rithm - Mapping
Φ3(a, v) := (class(a) = ref(v)) (7)
Φ4(a, v) := ∃v′ ∈ V : (src(a) = host(v′))
∧(dst(a) = host(v)) (8)
Φ5(a, v) := (dst(a) = host(v)) (9)
In this work, the modes use a specific Φi(a, v). Thematch modes are named as follows:
• Φ1(a, v) - match mode cvesrcdst
• Φ2(a, v) - match mode cvedst
• Φ3(a, v) - match mode cve
• Φ4(a, v) - match mode srcdst
• Φ5(a, v) - match mode dst
Figure 1 shows the principle of the mapping step. Thestream of alerts is mapped to the nodes of the AG, i.e.,a filtering is done based on the match mode.
3.3 Aggregation
Let A ⊂ A be the set of alert that is supposed to beaggregated. Let th be a threshold and x ∈ A, y ∈ Atwo alerts, then the relation RA is defined as:
RA = {(x, y) ∈ A2 :
(| ts(x)− ts(y) |< th) ∧ (src(x) = src(y))
∧(dst(x) = dst(y))
∧(class(x) = class(y))} (10)
R∗A defines an equivalence relation on the transitiveclosure of RA. The alert aggregation combines alertsthat are similar but where created together in a shorttime, i.e., the difference of the timestamps is below acertain threshold th. It defines a set of equivalenceclasses A/R∗
Aover the equivalence relation R∗A.
3.4 Alert Dependencies
Let Am ⊂ A be the set of alerts that have beenmatched to a node in an AG:
Am = {[a] ∈ A/R∗A| mapi(a) 6= ∅} (11)
The alert dependencies are represented by a graphDG = (Am, Em,k), with Em,k as defined in (12).
Em,k = {([x], [y]) ∈ (A/R∗A
)2 | Ψk([x], [y])} (12)
The set Em,k can be parameterized by the functionsΨk as shown in (13), (14), and (15).
Ψ1([x], [y]) := (ts([x]) < ts([y]))
∧(∃(v, w) ∈ E : (v ∈ mapsi(x)
∧w ∈ mapsi(y))) (13)
Ψ2([x], [y]) := (ts([x]) < ts([y]))
∧(∃P ∈ PAG : (ord(P ) = n)
∧(∃v, w :
(v ∈ mapsi(x) ∧ w ∈ mapsi(y)
∧in(v, P ) ∧ in(w,P )))) (14)
Ψ3([x], [y]) := (ts([x]) < ts([y]))
∧(∃P ∈ PAG : ∃v, w :
(v ∈ mapsi(x) ∧ w ∈ mapsi(y)
∧in(v, P ) ∧ in(w,P ))) (15)
The dependency graph DG is defined by the matchedand aggregated alerts Am as vertices and the relationsbetween these alerts as edges Em,k. There are threepossible ways to define these relations using Ψk. Ψ1
defines two alerts as related, if they are mapped toneighboring vertices in AG. Ψ2 defines two alerts asrelated, if they are mapped to two vertices in AG thatare connected by the path P with the length of n. Ψ3
defines two alerts as related, if they are mapped to twovertices in AG that are part of the same path P .As shown in Figure 2, the alert dependency graph iscreated based on the mapping results.
3.5 Searching
Each path in the alert dependency graph DG identi-fies a subset of alerts that might be part of an attackscenario. DG is used in the last step to determinethe most interesting subsets of alerts, respectively themost interesting path in the alert dependency graph.The last step of searching alert subsets is done by per-forming a Floyd Warshall algorithm [16, 17] to find all
17

Figure 2. AG-based Correlation Algo-rithm - Creation
Figure 3. AG-based Correlation Algo-rithm - Finding
the shortest paths. Furthermore, the diameter dia (i.e.the value of the longest instance of the shortest paths)is determined and each path DPi that has the lengthord(DP ) = dia is converted in subsets of alerts. Allthe subsets Sx are defined as:
Sx = {a ∈ A | in(a,DPi)} (16)
Figure 3 shows the identified attack subsets in the de-pendency graph that correspond to the diameter.With a simple optimization, the algorithm allows toidentify multiple different attack scenarios of the sameanatomy. By sorting the suspicious alert subsets ac-cording to the smallest difference between alert a1 andan, the algorithm will identify the alerts that are neareach other on the time-line as related to one attack sce-nario. Let as = {a1, ..., an} and bs = {b1, ..., bn} betwo alert sets where the only difference between ai andbi is the times-tamp ts(ai) 6= ts(bi). There are threedifferent combinations how these alerts can be locatedon a time-line:
1. as and bs are not overlapping at all, i.e., ts(an) <ts(b1)
2. as = {a1, a2, ..., ak, ...an} and bs = {b1, ..., bn}are partially overlapping, i.e., ∃k ∈ N∀ai∈{1,k} |ts(ak) > ts(b1)
3. bs is completely overlapped by as, i.e., (ts(a1) <ts(b1)) ∧ (ts(an) > ts(bn))
The modified algorithm can identify both suspiciousalert sets in case 1. Due to the memory limitation,this algorithm only considers the last matching alertfor each node in the AG. The cases 2 and 3 are diffi-cult to be identified correctly.
4 Evaluation and Analysis of AttackGraphs
Attack Graphs describe a pre-defined known set of at-tack scenarios that are existing in the current networkunder surveillance. These scenarios can be used tomatch attack steps very closely and to follow an at-tacker through the network in real-time. Additionally,the different attack paths can be evaluated accordingto certain severity scores. Thus, having a low severityscore on a currently exploited attack path, the securityoperators might be able to finish more urgent tasks be-fore dealing with this specific attack. Whereas if anattacker is exploiting an attack path that covers veryimportant systems and therefore having a high severityscore, the security operators might need to deal withthis attack urgently. One example application of theevaluation of the attack paths is the sensor placement.Before data can be monitored and be managed in theSAL, sensors have to be installed in the scenario.These sensors can come in two possible forms, i.e.,as host-based IDS (HIDS) or as network-based IDS(NIDS). Each of these forms is suited for the detectionof its specific kind of attack. Host-based sensors canbe used to monitor unexpected behavior on a specifichost while Network-based sensors can be used to mon-itor unexpected behavior on the network. Our goal isan effective monitoring infrastructure, which only em-ploys a small number of sensors that can detect eachpossible attack in the scenario. With these conditionsand the outlined preferences for the sensors, we canplace sensors with the following strategy.HIDS sensors are the only way to detect local exploits,thus installing a HIDS on all hosts that have at leastone locally exploitable vulnerability might be neces-sary. NIDS on the other hand, can only detect re-mote exploits but can detect these for multiple hosts,depending on the host they are installed on. In thisrespect it is necessary to find all possible remote ex-ploits and extract the hosts that are routing the net-work traffic for these exploits. The severity score canbe considered to find an optimal solution according tothe scenario. In order to do this, all single step attackpaths can be extracted from the attack graph and thenetwork route between the source and target of the at-tack path can be determined. Eventually, all hosts needto be listed in the network route, except the startingnode (e.g. the external network connection), becausethis one can be considered to be under control of theattacker. Using the set cover algorithm described in[18], a minimal number of hosts can be found, whichare able to intercept all remote exploits. Finally, thesehosts are directly used for the placement of the NIDS.
5. Future Work
Within the next few months, we want to conduct a fewmore step to improve the quality of the correlation al-
18

gorithms deployed on this platform. We would liketo work towards our vision with the following prac-tical steps. Setting up a real deployment with mul-tiple sensors to conduct practical experiments mightbe very useful. Testing the platform with a dataset of1 TB as well as implementation of more algorithmswith multi-core support will prove the applicability ofthe platform. The implementation of HANA supportcan provide a performance boost and improves theflexibility of the SAL. An interactive coding modulefor security operators would provide exploration func-tionality for data sets. Apart from the implementationrequirements, the are multiple research topics, suchas research on correlation algorithms that are usingenvironment information and attack graphs, researchon statistical correlation algorithms, research on vi-sualization techniques for correlation results, researchon prediction of alerts and events, research evaluationof attack paths and attackers, research on preventiontechniques, simulation of attack traffic and alerts, aswell as research on correlation of log events and cor-responding requirements (in contrast to correlation ofIDS alerts). We hope that we can open one or two ofthese new research areas by prolonging the project.
References
[1] S. Roschke, F. Cheng, Ch. Meinel: Using Vul-nerability Information and Attack Graphs for In-trusion Detection In: Proceedings of 6th Interna-tional Conference on Information Assurance andSecurity (IAS’10), IEEE Press, Atlanta, UnitedStates, pp. 104-109 (August 2010).
[2] Roschke, S., Cheng, F., Meinel, Ch.: An AlertCorrelation Platform for Memory-SupportedTechniques. In: Concurrency and Computation,Wiley Blackwell, 2011 (to appear).
[3] Roschke, S., Cheng, F., Meinel, Ch.: A New Cor-relation Algorithm based on Attack Graph. In:Proceedings of the 4th Conference on Compu-tational Intelligence in Security for InformationSystems (CISIS’11), Springer LNCS 6694, Tor-remolinos, Spain, pp. 58-67 (2011).
[4] R. Sadoddin, A. Ghorbani: Alert CorrelationSurvey: Framework and Techniques, In: Pro-ceedings of the International Conference on Pri-vacy, Security and Trust (PST’06), ACM Press,Markham, Ontario, Canada, pp. 1-10 (2006).
[5] Debar, H., Curry, D., Feinstein, B.: The Intru-sion Detection Message Exchange Format, Inter-net Draft, Technical Report, IETF Intrusion De-tection Exchange Format Working Group (July2004).
[6] Mitre Corporation: Common vulnerabil-ities and exposures (CVE), WEBSITE:http://cve.mitre.org/ (accessed Mar 2012).
[7] Mitre Corporation: Common Event Expres-sion (CEE), WEBSITE: http://cee.mitre.org/ (ac-cessed Apr 2011).
[8] H. Plattner: A Common Database Approach forOLTP and OLAP Using an In-Memory ColumnDatabase, In: Proceedings of the ACM SIG-MOD International Conference on Managementof Data (SIGMOD’09), ACM Press, Providence,Rhode Island, USA, pp. 1-2 (2009).
[9] S. Roschke, F. Cheng, Ch. Meinel: An Extensi-ble and Virtualization-Compatible IDS Manage-ment Architecture, In: Proceedings of 5th Inter-national Conference on Information Assuranceand Security (IAS’09), IEEE Press, vol. 2, Xi’an,China, pp. 130-134 (August 2009).
[10] Ning, P. and Xu, D.: Adapting Query Optimiza-tion Techniques for Efficient Intrusion Alert Cor-relation, Technical Report, North Carolina StateUniversity at Raleigh, 2002.
[11] Northcutt, S., Novak, J.: Network Intrusion De-tection: An Analyst’s Handbook, New RidersPublishing, Thousand Oaks, CA, USA (2002).
[12] Tedesco, G. and Aickelin, U.: Real-Time AlertCorrelation with Type Graphs, In: Proceedingsof the 4th international Conference on Informa-tion Systems Security (ISS’09), Springer LNCS5352, Hyderabad, India, pp. 173-187 (2008).
[13] Ning, P., Cui, Y., Reeves, D.: Constructing at-tack scenarios through correlation of intrusionalerts, In: Proceedings of the 9th ACM Confer-ence on Computer and Communications Security(CCS’02), ACM, New York, NY, USA, pp. 245-254 (2002).
[14] Wang, L., Liu, A., and Jajodia, S.: Using attackgraphs for correlation, hypothesizing, and pre-dicting intrusion alerts In: Journal of ComputerCommunications, Elsevier, Volume 29, Issue 15,pp. 2917-2933 (September 2006).
[15] Ou, X., Govindavajhala, S., and Appel, A.: Mul-VAL: A Logic-based Network Security Ana-lyzer, In: Proceedings of 14th USENIX SecuritySymposium, USENIX Association, Baltimore,MD, pp. 8 (August 2005).
[16] Floyd, R.: Algorithm 97 (SHORTEST PATH), In:Communications of the ACM, vol. 5, Issue 6, pp.345 (1962).
[17] Warshall, S.: A Theorem on Boolean Matrices,In: Journal of the ACM, vol. 9, Issue 1, pp. 11-12(1962).
[18] Noel, S., Jajodia, S.: Attack Graphs for SensorPlacement, Alert Prioritization, and Attack Re-sponse, In: Cyberspace Research Workshop, pp.3-20 (2007).
19


Multicore-Based High Performance IPv6 Cryptographically Generated
Addresses (CGA)
Hosnieh Rafiee, Ahmad AlSa’deh, and Christoph Meinel Hasso-Plattner-Institut, University of Potsdam P.O. Box 900460, 14440 Potsdam, Germany
{Hosnieh.Rafiee, Ahmad.Alsadeh, Christoph.Meinel}@hpi.uni-potsdam.de
Abstract
Neighbor Discovery Protocol (NDP) is one of the
main protocols in the IPv6 suite. It is used extensively
in several critical functions such as discovering other
existing nodes on the same link, determining others’
link layer addresses, etc. but it is known to be vulner-
able to critical attacks. Thus, SEcure Neighbor Dis-
covery (SEND) is offered to counter the NDP security
threats. SEND is computing intensive. SEND is com-
puting intensive. The computing intensive aspect of
SEND comes in fulfilling the Hahs2 condition for the
address generation of the Cryptographically Gener-
ated Addresses (GGA). Unfortunately the CGA com-
putation speed cannot be significantly improved by
using a multicore processor because the algorithm
used for the CGA generation supports a sequential
process. In this paper we will describe an approach
that breaks down the CGA algorithms in order to
spread their processes over all of the available cores
in the computing device. This proposal suggests the
automatic detection of the number of cores available
on a machine and then creates an equivalent number
of working tasks to compute the Hash2 condition.
When one task meets the CGA Hash2 condition, the
other cores processes stop. To test our approach,
several experiments were carried out in the future
Soc servers. The results of our experiments show that
the CGA creation time can be spedup by increasing
the number of cores in the computing device.
1 Introduction
Cryptographically Generated Addresses (CGA) [1] is designed to provide for the authentication of IPv6 addresses and to prevent malicious nodes from taking ownership of others’ addresses. Unfortunately CGA, as an essential option in SEcure Neighbor Dis-covery (SEND) [2], is computationally intense, espe-cially when; meeting high security level require-ments. The security parameter (Sec) designates the security level of the CGA address. For Sec values greater than zero, there is no guarantee that the se-quential brute-force search will cease after a certain time period. For example, it may take several hours or even days to find the CGA parameters when secu-
rity level of “2”is being used. This long delay is un-acceptable for several applications.
Today multicore processors greatly increase the computational capacity of computers and their use has become the norm. Nearly every computer has a processor with at least two cores. Some desktops have up to 8 CPUs. These CPU numbers are likely to increase in the future. Multicore processors thus pro-vide a potential opportunity for remarkable speed improvements in CGA computation. However a dual-core processor will not automatically double the CGA computational performance because the CGA generation algorithm is a sequential process and will not fully utilized the available CPU cores. In this paper we will introduce our approach to mul-ticore processing in order to achieve better perfor-mance for CGA computations [3]. In our algorithm we do a brute-force search to find a valid modifier in parallel rather than sequentially. The number of cores in the computing device determines the number of parallel threads that will be used to compute the CGA address parameters. The multicore CGA version drastically reduces the CGA generation time. The experiment results are validated and evaluated by comparing the performance of the proposed approach with the conventional approach in the future Soc servers. This paper is structured in the following manner. Section 2 presents the CGA algorithm and our pro-posal to use multicore threading in the generation of a CGA. . Section 3 outlines the details of our parallel approach and presents our experimental results using the future Soc servers. Section 4 concludes the work and describes future steps.
2 Project Description
CGA was first proposed as a mechanism for authen-ticating location updates in Mobile IPv6 [4]. Later, CGAs were standardized in the context of the SEcure Neighbor Discovery (SEND) [2] in order to protect Neighbor Discovery (ND) for IPv6 [5] and the IPv6 Stateless Address Autoconfiguration [6] against known attacks [7].
21

SHA-1
Hash2
(112 bits)16*Sec=0?
Increment
Modifier
No
Final
Modifier
(128 bits)
Subnet
Prefix
(64 bits)
Colision
Count
(8 bits)
Public Key
RSA
(variable)
SHA-1
Hash1
Subnet Prefix Interface ID u g
Yes
CGA
64 bits
S e c
64 bits
leftmost 64 bits
16*Sec leftmost Hash2
bits must be zero
0
CGA
parameters
· Generate/ Obtain an RSA key pairs
· Pick random Modifier
· Select Sec value
· Set Colision Count to 0
U=g=1
Modifier
(128 bits)
0
(64 bits)
0
(8 bits)
Public Key
RSA
(variable)
0 1 2 ... 6 7
( 59 bits are in used)
Compute Intensive part
Figure 1: CGA Generation Algorithm
CGA was also proposed to prevent Denial-of-Service (DoS) attacks and to authenticate the Binding Update messages in Mobile IPv6 [8, 9]. The main disad-vantage of using CGA for these purposes is the com-putational cost. This high computational cost is due to the fact that the CGA algorithm is a sequential process and thus, as it stands now, does not lend itself to relief in processing time by running in a multicore environment. CGA computations may take a long time especially when a high security value is used. The fact is that satisfying the Hash2 condition is ac-tually the most computational expensive part of CGA generation algorithm
2.1 Cryptographically Generated Address-
es (CGA) Algorithm
In CGA, the interface identifier portion of the IPv6 address is created from a cryptographic hash of the address owner’s public key and other auxiliary pa-rameters. Since the 64-bit are not enough to provide sufficient security against brute-force attacks in the foreseeable future, the standard CGA uses the Hash Extension in order to increase the security strength above 64 bits. The address owner computes two in-dependent hash values (Hash1 and Hash2) by using the public key and other parameters. The Hash Ex-tension (Hash2, or a portion of it) value sets an input parameter for Hash1. The combination of the two hash values increases the computational complexity for generating a new address and thus the cost of using brute-force attacks. The CGA generation algo-rithm should fulfill two conditions [1]: 1. The leftmost 64-bit of Hash1 is set to equal the interface identifier. The Sec, “u” and “g” bits are ignored for this comparison.
2. The 16×Sec leftmost bits of Hash2 are equal to zero. The security parameter (Sec) indicates the security level of the generated address being used against the brute-force attacks. Increasing the Sec value by “1” adds 16 bits to the length of hash that the attacker must break. The Sec is an unsigned 3-bit integer hav-ing a value between “0” and “7”. The CGA parame-ter data structure contains the following parameters: 1. Modifier (128-bit): initialized to a random value. 2. Subnet Prefix (64-bit): set to the routing prefix value advertised by the router at the local subnet. 3. Collision Count (8-bits): is a counter used for Du-plicate Address Detection (DAD) to ensure the uniqueness of the generated address. 4. Public Key (variable length): set to the DER-encoded public key of the address owner. 5. Extension Field: variable length field for future needs. A schematic of the CGA generation algorithm is shown in Figure 1. CGA generation begins by deter-mining the address owner’s public key and selecting the proper Sec value. The process continues with the Hash2 computation loop until the Final Modifier is found. The Hash2 value is a hash value comprises of a combination of the Modifier and the Public Key which is concatenated with a zero-value of Subnet Prefix and Collision Count. The address generator tries different values of the Modifier until the 16×Sec-leftmost-bits of Hash2 reaches zero. Once a match is found, the loop for the Hash2 computation terminates. At this point the Final Modifier value is saved and used as an input for the Hash1 computa-tion. The Hash1 value is a hash combination of the entire CGA parameter data structure.
22

After the interface identifier (IID) is derived from Hash1 the hash value is truncated to the appropriate length (64-bit). The Sec value is encoded into the three leftmost bits of the interface identifier. The 7th and 8th bits from the left of IID are reserved for a special purpose. Finally the Duplicated Address De-tection (DAD) process is done to ensure that there is no address collision within the same subnet.
3 Results and Achievements
We implemented a multicore-based CGA and conducted several practical experiments by running the system in a Future SOC infrastructure. We could then divide the CGA sequential algorithm into small-er tasks according to the number of cores available in the Future Soc VMs. We then assigned each task in order to run them in parallel. Even though the CGA algorithm speedup is influenced by tightly-coupled dependencies between the parts of the algorithm, we could achieve a speedup in the parallel mode. In the following subsections we explain our CGA parallel algorithm and our results.
3.1 Implementation
CGA generation is a sequential algorithm. There-fore the main challenge of CGA parallelization is to break down the CGA algorithm into parallel parts and then to assemble those individual results from each process into the final result. To parallelize a CGA algorithm two things should be determined: which part of the CGA algorithm can be parallelized and into how many parallel processes can it be bro-ken. The Hash2 condition needs to be broken into a number of tasks because it is the most intensive part of the CGA computation. To utilize all cores on a
device, the number of tasks is determined based on the number of CPU cores. In this way, the CGA gen-eration algorithm can scale its performance based on the available CPU cores [3]. Figure2 shows how the CGA generation can be paral-lelized to use an n-core computing device [3]. In this approach each task is run in one core to prevent the CPU from switching between the parallel tasks dur-ing the CGA generation. The Tasks Generator (TG) passes particular continuous sets of modifier for each task, i.e. each task dedicated to do brute-force searches within a certain range. If the task1 process modifier range is from 0 to n, then task2 would pro-cess in a range of n+1 to 2*n, and so on. TG also passes a termination token to the CGA Generation (CGAGen) function in order to control and terminate all tasks when one of the tasks succeeds in finding a valid modifier which fulfills the Hash2 conditions. If none of the tasks succeeds in finding the valid modi-fier within the assigned range, then new tasks with new ranges of modifiers are generated. We use some customized classes in the Task Parallel Library (TPL) [9] to simplify the parallelization management. TPL simplifies this process and provides a number of clas-ses and methods which allows the running of a num-ber of jobs in a parallel fashion. TPL has a Task Fac-tory Class [10] which provides support for creating and scheduling Task Objects without sacrificing their power and flexibility.
3.2 Experiments
We ran our CGA multicore implementation on two VMs with a Windows 7 64-bit operating system. In our experiments the first VM machine was a quad-core CPU and the second VM machine was a single-core CPU. Both machines had 2 GB of RAM. The
Ke
y a
nd
mo
dif
ier
ge
ne
rati
on
Reading
the number
of CPU cores
Tasks
Generator
(TG)
Task # 1
CGAGen(m, Termination token)
Task # n*(x-1)
CGAGen(m,Termination token)
Analyze
Results
(Modifier
found)
YES
NO
Task Termination
1
n*(x-1)
NoYes
SHA-1
Modifier
(range n)0 0 Public Key
Hash2 (112 bits)0
16*Sec=0?
16*Sec
Increment
Modifier
Return Modifier
and stop
other threads
Task n*(x-1)
start
End
Figure 2: Flowchart of the Proposed Parallel CGA Generation Process
23

CPUs in both VMs were Intel(R) Xeon(R) E5540 with 2.53GHz speed. Figure 3 shows our CGA multi-core analyzer user interface. The user can select the RSA key size, algorithm type and determine the number of samples. All the measurements are done for a RSA key size equal to 1024-bit. The CGA ad-dress was generated 1000 times to ensure sufficient samples. The average (avg.), the minimum (min.) and the maximum (max.) values of CGA generation times for both sequential and parallel mode and a Sec value “1” are recorded in Table 1. The CGA Multicore Analyzer has the ability to draw charts and store the output results, such as average, the standard devia-tion, the variance, etc., in a file. As shown in Table 1, the parallel approach spedup the CGA computation by 70.1%, when using 4 cores It is clear from the results that the process of compu-
ting the CGA benefited from the use of a multicore processor. These results show that even though the sequential process did improve using a multicore processor, the most dramatic improvements were achieved by using the parallel processing approach that we introduced here. In our parallel approach, described above, more mips are used because of the ability to process some aspects of the address calcula-tion functions simultaneously, i.e. in each core, thus lowering the overall process time. Figure 4 shows the CPU performance in multi-core for both parallel and sequential algorithms while running CGA algorithm.
Figure 3: Multicore CGA Analyzer User Interface. The top chart shows the result of each CGA generation time and the bottom chart shows the average time needed to generate the CGA
Table1: CGA Average Generation Time Comparison of Sequential and Parallel
Number
CPU cores
CGA average generation time
(Milliseconds)
1024-bit RSA key, Sec=1 Percentage of
Speedup Parallel Mode (CPU usage 85%) Sequential Mode (CPU usage 29%)
Min. Max. Avg. Min. Max. Avg.
1 - - - 28 66 47 -
4 1 45 13,36 8 281 45,7 70.7%
24

4 Future Works
We implemented the multicore CGA using the most CPU power in a computing device. We would like to extend our work to a Linux operating system. We would like to work towards this goal using the fol-lowing steps:
· Complete our CGA multicore algorithm forthe Linux operating platform
· Test the performance of the foregoing algo-rithm in the future Soc servers.
· Research on better ways to utilize the CPU'smemory in order to manipulate the CGA al-gorithm more efficiently.
References
[1] T. Aura: Cryptographically Generated Address, RFC3972, WEBSITE: http://tools.ietf.org/html/rfc3972 , In: Internet Engi-neering Task Force (March 2005)
[2] J. Arkko, J. Kempf, B. Zill and P. Nikander: SEcure
Neighbor Discovery (SEND), RFC 3971 (Proposed Standard), WEBSITE: http://tools.ietf.org/html/rfc3971, In : Internet Engi-neering Task Force (March 2005)
[3] H. Rafiee, A. Alsa’deh, and Ch. Meinel : Multicore-
Based Auto-Scaling SEcure Neighbor Discovery for
Windows Operating Systems, In: in Proceedings of the 26th International Conference on Information Net-
working (ICOIN 2012), IEEE Press, Bali, Indonesia (February 2012)
[4] G. O’Shea and M. Roe : Child-proof authentication
for MIPv6 (CAM), In: ACM Computer Communica-tions Review, vol. 31, no 2. (2001)
[5] T. Narten, E. Nordmark, W. Simpson, and H. Soli-man: Neighbor Discovery for IP version 6 (IPv6), RFC 4861, WEBSITE: http://tools.ietf.org/html/rfc4861, In: Internet Engi-neering Task Force (September 2007)
[6] S. Thomson, T. Narten and T. Jinmei : IPv6 Stateless Address Autoconfiguration , RFC 4862, WEBSITE: http://tools.ietf.org/html/rfc4862, In: Internet Engi-neering Task Force (September 2007)
[7] P. Nikander, J. Kempf and E. Nordmark : IPv6 Neigh-
bor Discovery (ND) Trust Models and Threats, RFC 3756 (Informational), WEBSITE: http://tools.ietf.org/html/rfc3756, In: Internet Engi-neering Task Force (May 2004)
[8] J. Arkko, C. Vogt and W. Haddad : Enhanced route optimization for mobile IPv6, RFC 4866, WEBSITE: http://tools.ietf.org/html/rfc4866, In: Internet Engi-neering Task Force (May 2007)
[9] Microsoft TechNet, Task Parallelism (Task Parallel Library), WEBSITE: http://msdn.microsoft.com/
en-us/library/dd537609.aspx (2011)
[10] Microsoft TechNet, Task Factory, WEBSITE: http://msdn.microsoft.com/en-
us/library/system.threading.tasks.task.factory.aspx
Figure 3: Top figure shows CPU performance in sequential mode and bottom figure shows in par-allel mode
25


Blog- Intelligence Extension with SAP HANA
Patrick HennigHasso-Plattner-Institut
Prof.-Dr.-Helmert-Str. 2-314482 Potsdam
Philipp BergerHasso-Plattner-Institut
Prof.-Dr.-Helmert-Str. 2-314482 Potsdam
Patrick SchilfHasso-Plattner-Institut
Prof.-Dr.-Helmert-Str. 2-314482 Potsdam
Christoph MeinelHasso-Plattner-Institut
Prof.-Dr.-Helmert-Str. 2-314482 Potsdam
Abstract
Blog-Intelligence is a blog analysis framework, inte-grated into a web portal, with the objective to leveragecontent- and context-related structures and dynamicsresiding in the blogosphere and to make these findingsavailable in an appropriate format to anyone inter-ested. The portal has by now reached a mature func-tionality, however, requires ongoing optimization ef-forts in any of its three layers: data extraction, dataanalysis and data provision.
1 Introduction
With a wide circulation of 180 million weblogs world-wide, weblogs with good reason are one of the killerapplications of the worldwide web. For users it is stilltoo complicated to analyze the heavily linked blogo-sphere as a whole. Therefore, mining, analyzing, mod-eling and presenting this immense data collection isof central interest. This could enable the user to de-tect technical trends, political atmospheric pictures ornews articles about a specific topic.The basis of the Blog-Intelligence project is the bigamount of data provided by all weblogs in the world.These data is gathered in the past and in the future byan intelligent crawler.Blog-Intelligence already provides some basic analy-sis functionality for the crawled data. Through the im-provement of the crawler and the consequent growingamount of data, the analysis gets into big performanceissues. Since these performance problems, the analy-ses are only calculated in a weekly manner to reducethe run time of the analyses algorithms. Therefore theup-to-dateness of the results is not given any more andthe web portal is only able to show already deprecated
results.
2 Fields of application
With SAP HANA totally new opportunities are com-ing up. The fast execution of the analysis algorithmsprovides completely new and better interaction withthe system for the end-user. Beside the advantage ofexploring the blogosphere in real time, it is possible toprovide analyses for the end-user calculated separatelyfor each user with his interests. Furthermore, formertime-consuming text and graph analysis algorithm cannow get integrated into our framework because SAPHANA offers fast variants of these algorithms. Thisopens new perspectives onto the data and the blogo-sphere for the user.For example, it is now possible to figure out, howand what is discussed about products or companies in-side the blogosphere. Traditional providers limit theseanalyses to the biggest blogs worldwide. With Blog-Intelligence and SAP HANA it gets possible to calcu-late analyses over all weblogs worldwide.In addition to the personalized illustration of the bl-ogosphere, companies can figure out how their ownweblogs perform and influence the blogosphere. Eventhe monitoring of competitors’ social media influenceis imaginable.
3 Used Future SOC Resources
Currently, we are running a small test machine thatis embedded into the Future SOC network. This ma-chine runs a SAP HANA instance that is used as testdatabase for our current crawler developement. Thedevelopment state of the crawler becomes a stable ver-sion and the current version is able to crawl fast andmore enriched data. Therefore, we observed the SAP
27

Concept
1
Blog Crawler
60 TB Storage
Crawler Database
HANA
8 GBit
Analysis
High PerformanceDatabase
0.8 TB – 1.3 TB analytical data
per year
~20 TB per year
~20 TB per year
Figure 1. Technical Concept of Blog-Intelligence
HANA instance on our test machine to run out of re-sources. Hence, we revise our current setup and comeup with a new Blog-Intelligence deployment describedin the following section.
4 Blog-Intelligence deployment
Our overall technical setup is shown in figure 1. Inorder to increase the amount of data and to keep thedata up-to-date, the weblogs are visited and revisitedwith the help of a crawler. The crawler is based onthe MapReduce framework from Apache. The firststructural analyses are done at crawling time like thelanguage detection. The overall detection whether theweb site is a blog, a news portal or a regular HTMLpage is also done by the crawler.This crawler is executed in parallel and distributed on aHadoop Cluster and saves the data directly into a SAPHANA instance. The complete extracted data, espe-cially large objects like the original HTML content, isstored as well. Nevertheless, the large data objects getoutsourced to a data storage provided by EMC with anoverall capacity of 60TB. Although large objects getoutsourced, an huge amount of data stays in-memoryfor the analytics component.
5 Computational Effort Estimation
In the worldwide web approximately 10 million highlyactive blogs exists with more than one post each week.An important part of these blogs is the news portalblogs, like ”theguardian” with several new posts eachday. Of the widespread 180 million weblogs these10 million weblogs are the most important weblogs.Therefore, we want to store these weblogs inside aSAP HANA database to provide up-to-date real time
analyses. As a result, we expect 0.8TB to 1.3 TB ofcompressed data for our analyses.
6 Next Steps
As mentioned before, the crawler implementation isnearly stable. Hence, we will start a permanent runusing the Future SOC resources and create an ade-quate set of crawled weblog sites. Given this datasetin a running SAP HANA instance, we get able to thetest in-memory data analysis algorithms of HANA. Weexpect to measure a significant performance improve-ment for the analytics. Thereby, we get able to evalu-ate real-time and user-centric analysis approaches forthe blogosphere. Based on our findings about the blo-gosphere, we will adapt, develop and re-engineer ourexisting exploration interfaces for this new level of an-alytics.
References
[1] P. Berger, P. Hennig, J. Bross, and C. Meinel. Mappingthe blogosphere–towards a universal and scalable blog-crawler. In Privacy, Security, Risk and Trust (PASSAT),2011 IEEE Third International Conference on and 2011IEEE Third International Confernece on Social Com-puting (SocialCom), pages 672–677. IEEE, 2011.
[2] J. Bross, P. Hennig, P. Berger, and C. Meinel.Rss-crawler enhancement for blogosphere-mapping.IJACSA Editorial, page 51, 2010.
[3] J. Bross, M. Quasthoff, P. Berger, P. Hennig, andC. Meinel. Mapping the blogosphere with rss-feeds. InProceedings of the 2010 24th IEEE International Con-ference on Advanced Information Networking and Ap-plications, AINA ’10, pages 453–460, Washington, DC,USA, 2010. IEEE Computer Society.
28

Accurate Mutlicore Processor Power Models for Power-Aware ResourceManagement
Christoph Meinel, Ibrahim Takouna, and Wesam DawoudHasso-Plattner-Institut (HPI)
University of PotsdamPotsdam, Germany
{christoph.meinel, ibrahim.takouna, wesam.dawoud}@hpi.uni-potsdam.de
Abstract
In this project, we develop three statistical CPU-Power models based on number of active cores and av-erage running frequency using a multiple liner regres-sion. Our models were built upon a virtualized server.The models are validated statistically and experimen-tally. Statistically, our models cover 97% of systemvariations. Furthermore, we test our models with dif-ferent workloads and different benchmarks. The re-sults show that our models achieve better performancecompared to the recently proposed model for powermanagement in virtualized environments. Our mod-els provide highly accurate predictions for un-sampledcombinations of frequency and cores; 95% of the pre-dicted values have less than 7% error.
1 Introduction and Project Idea
There are several proposed approaches for power man-agement. Mostly, these approaches consider the CPUfrequency and CPU utilization to build power models.For instance, Urgaonkar et al. [1] and Gandhi et al. [2]have adopted non-liner quadric models of power con-sumption for power management in virtualized envi-ronments. The relationship between power consump-tion of multicore processor and frequency cannot becovered with one fitting curve, as we will see in Sec-tion II. For instance, the curve of power consumptionof 1 core slightly increases with cores frequency com-pared to 4 cores and 8 cores. Moreover, Fan et al. [4]have included CPU utilization in their proposed powermodel. However, using utilization to build a powermodel for a multicore processor could be not accurate,because the power consumed by a multicore proces-sor with one active core with 100% utilization is morethan the power consumed by two active cores each ofthem 50% utilized for the same workload. We foundthis result by conducting an experiment using a virtualmachine (VM) with a mutlithreaded application. ThisVM ran with 1 virtual CPU and had 100% utilization
and only ran on one physical core. In this scenario, thepower consumed by the physical CPU was 26 watts.On the other hand, when the same VM ran with 2virtual CPU and the VM had the same total CPU uti-lization 100%. In this scenario, the physical CPU justconsumed 17 watts, and each core was 50% utilized.Importantly, both of the configuration gave the sameperformance. Indeed, the latter could be better due toexploiting the multithreading. Thus, we conclude thatonly using CPU frequency and CPU utilization only asinputs for power modeling could be inefficient in par-ticular for power estimation of mutlicore processors.
The purpose of this work is to build CPU-Power con-sumption models that accurately estimate the powerconsumption of virtualized servers with multicore pro-cessor. These models could be employed into power-aware resource management to achieve better powersavings. Our work is distinct from others as follows.This project phase presents CPU-Power consumptionmodels taking into account number of the actual activecores N and average running clock frequency F at eachsample. It analyzes and evaluates the performance ofour proposed models statistically and experimentally.The statistical analysis using the regression R2 indi-cates that our models could cover more than 97% ofsystem variations. Experimentally, our proposed mod-els achieve better performance compared to the modeladopted by [1][2]. We evaluate models using three dif-ferent applications with different characteristics (i.e.,CPU-intensive, Memory-intensive, and IO-intensive).The results show that 95% of the predicted values haveless than 7% error. Furthermore, the maximum predic-tion error is less than 4% error for Memory-intensiveand IO-intensive applications. As future work, we willuse these models to build a dynamic optimizer that op-timizes number of cores and their frequency settingsand dynamically configures a VM to cope with work-load and meet power consumption constrains.
29

2 Used Lab Resources and Experimentalsetup
The evaluation experiments were performed on FujitsuPRIMERGY RX300 S5 server that has a CPU-Powermeasurement capability. It has a processor of Intel(R)Xeon(R) CPU E5540 with 4-cores. The frequencyrange is 2.53GHz to 1.59GHz. Each core enables 2-logical cores. The server is equipped with 12GB phys-ical memory. The experiments were run on a virtual-ized server using Xen-4.1 hypervisor.To build our models, we used a CPU-intensive bench-mark EP Embarrassing Parallel which is one of NASParallel Benchmarks (NPB) [5]. However, more de-tails about the characteristics of NPB benchmarks isfound in [6].Finally, we used xenpm tool to measure average run-ning frequency and number of active cores. We usedthe CPU-Power measurement capability of our serverto measure the power consumption of the CPU. Inour experiments, the percentile average was consid-ered to get accurate power readings. Fig. 1 summa-rizes the system overview and the procedures of CPU-Power models development. Fig. 1 shows the out-put of xenpm tool; it illustrates the change of averagefrequency, performance states (P0-P8), and sleepingstates (C0-C3). Furthermore, the output demonstratesthe percentage of time for each core and for each state.
3 Findings
Several works have used linear models to representthe power consumption of a system or just a proces-sor. These models are based on CPU utilization orother concerned resources such as memory. As cur-rent processors have multicores which could operateat different frequency levels at runtime using DVFS,in this section we discuss the relationship between theCPU-Power consumption and CPU-frequency fromone side, and the CPU-Power consumption and num-ber of active cores from the other side.
3.1 CPU-Power and frequency rela-tionship
CPU-Power consumption is composed of dynamic andstatic power. The dynamic power is the important fac-tor for reducing power consumption using DVFS tech-nique. The dynamic consumed power by a CPU witha capacitance c, frequency f, and supplied voltage v iscomputed by equation P = c.f.v2dd. However, Kimet al. [7] have considered power proportional to thecubic of frequency because the frequency is usually inproportion to the supplied voltage.
P(F ) = Pmin + θ(F − Fmin)2 (1)
Virtualized Server(Xen)
Multiple Linear
Regression
Measured CPU-Power
Number of active cores
Average Frequency
GeneratedCPU-Power
Model
VM-1
VM-2
VM
-3
Predict CPU-Power for non-measured
Configurations
Start sampling, waiting for CTRL-C or SIGINT or SIGALARM signal ...^CElapsed time (ms): 6956CPU0: Residency(ms) Avg Res(ms)C0 319 (4.59%) 0.35C1 18 ( 0.27%) 0.44C2 6619 (95.14%) 7.71P0 206 (71.48%)P1 0 ( 0.00%)P2 0 ( 0.00%)P3 0 ( 0.00%)P4 0 ( 0.00%)P5 0 ( 0.00%)P6 0 ( 0.00%)P7 0 ( 0.00%)P8 82 (28.52%)Avg freq 2477440 KHz
CPU1: Residency(ms) Avg Res(ms)C0 36 ( 0.53%) 0.11C1 63 ( 0.92%) 1.18C2 6856 (98.56%) 23.32
P0 0 ( 0.00%)P1 0 ( 0.00%)P2 0 ( 0.00%)P3 0 ( 0.00%)P4 0 ( 0.00%)P5 0 ( 0.00%)P6 0 ( 0.00%)P7 0 ( 0.00%)P8 32 (100.00%)Avg freq 1921280 KHz
Figure 1: Overview of the system and CPU-Powermodels development.
y = 0.6607x2 - 0.5393x + 36.7R² = 0.9987
y = 0.1607x2 + 0.0464x + 18.9R² = 0.9796
0
10
20
30
40
50
60
70
1.6 1.72 1.86 1.99 2.2 2.4
CP
U-P
ow
er
(Wa
tt)
Frequency (GHz)
8 cores 4 cores 1 core Poly. (8 cores) Poly. (1 core)
(a)
y = 2.4167x + 18.5R² = 0.9662
y = 4.7857x + 21.214R² = 0.9548
0
10
20
30
40
50
60
70
1 2 3 4 5 6 7 8
CP
U-P
ow
er
(Wa
tt)
Number of Active Cores
Freq 1.6 Freq 1.99 Freq 2.4 Linear (Freq 1.6) Linear (Freq 2.4)
(b)
Figure 2: CPU-Power consumption relationship withfrequency and number of active cores.
To obtain the relationship between CPU-Power con-sumption and frequency, we ran EP-NPB CPU-intensive benchmark on a virtual machine at differentCPU frequencies. We measured the power consump-tion only for the CPU. Thus, we obtained the curvesin Fig. 2-(a). Then, by applying the multiple linearregression, we found that the best relationship couldbe fit in polynomial linear with regression R2 = 0.99.we could generalize it as a quadric model in equation1 which resembles the proposed model by [1][2] to es-timate the power consumption of a server. AlthoughFig. 2-(a) shows perfect fitting for each curve of anumber of cores, the total system variations cannot becovered with considering only frequency.
Table 1: The determined values of CPU-Power modelscoefficients and statistics.
Model θ2 θ1 α C Std.Err. R2
0.Eq.2 6.3 -7.2 0 24.6 7.9 0.291.Eq.3 6.3 -7.2 3.3 9.7 1.4 0.972.Eq.4 3.8 2.6 3.3 0 1.4 0.99
Hence, we need different values of θ and Pmin ateach number of active cores. For example, to esti-mate CPU-Power at frequency 1.72 GHz when 8 ac-tive cores using equation 1 the best values for θ andPmin are 37 watts and 37 Watt/GHz2 respectively.The estimated power is 37.6 watts which is approxi-
30

mately equal to the measured value 38 watts. Never-theless, The values of θ and Pmin should be adaptedagain to predicted the power when just 4 cores are ac-tive. Accordingly, we study the relationship betweenthe power consumption and number of active cores innext section.
3.2 CPU-Power and number of activecores relationship
To estimate the power consumption of multicore pro-cessors, we found that it is important to study the re-lationship between CPU-Power and number of activecores. To this end, we obtained the curves in Fig.2-(b). The curves have a linear trendline. The rela-tionship is well approximated by a linear model withregression R20.95, which means that the power con-sumption and number of active cores have a stronglinear association and can be represented by EquationP(N) = Pmin + α.N . N is number of active cores,and Pmin is the power consumed by one core runningat frequency F. αF is the slope of the power-to-activecores curve at frequency F. Importantly, each curve hastwo different slopes. The first one is when the numberof active cores is less than 4 cores and the other one iswhen the number of active cores is more than 4 cores.Moreover, the first slope is greater than the second one.The main reason of this case was that we had a proces-sor with 4 physical cores. Each physical core has twologic cores, and the power consumed by a logical coreis less than the power consumed by a physical core.
3.3 CPU-Power estimation models
From previous sections, we found a strong relationshipbetween CPU-Power consumption and both frequencyand number of active cores. In this section, we referto the model adopted by [1][2] as Model-0. Model-0which is represented by equation 2 does not includenumber of active cores. Our first model is denoted byModel-1. Model-1 presented in equation 3 is a mul-tiple linear regression with the intercept constant C.Equation 4 represents Model-2. Model-2’s interceptconstant C is zero. Finally, we removed the first de-gree term of frequency of Model-2. However, we willstudy the predication accuracy of these models show-ing the worst and the best cases for each model.
P(F,N) = θ2.F2 + θ1.F + C (2)
P(F,N) = θ2.F2 + θ1.F + α.N + C (3)
P(F,N) = θ2.F2 + θ1.F + α.N (4)
3.4 Statistical analysis
This section discusses some statistical analysis of ourCPU-Power estimation models focusing on Model-1
to show its efficiency to predict the power consump-tion of a processor.Table 1 summarizes the determined values of CPU-Power models coefficients and statistics. However,Model-2 is a regression with zero constant. Further-more, the regression statistics in Table 1 show that theregression R2 of our models is higher than R2 of theModel-0. For instance, Model-2 has regression R2
0.99 which means that these two models could explain99% of the power variations. The power variationswere determined by variations in the independent vari-ables (i.e., frequency and active cores). In contrast,Model-0, which only considers frequency, has regres-sion R2 0.259. Model-0 explained only 25% of powervariations using frequency.
3.5 Performance evaluation
As we discussed models performance statistically, inthis section we show and compare the performance ofthe models experimentally. To achieve this, we con-ducted three experiments using three different bench-marks of NPB benchmark namely EP, CG, and BT.These benchmarks represent CPU-Intensive, Memory-Intensive, and IO-Intensive applications respectively.
3.5.1 CPU-intensive applications
To evaluate our models against CPU-Intensive applica-tions, we used EP benchmark to generate a workloadwhich was changed with time. As shown in Fig. 3, westarted with a low workload which increased with timeuntil it reached its maximum approximately at time205 sec. Then, it started to decrease after time 250 sec.During the experiment, we measured the CPU-Powerconsumption every 5 seconds. Then, we computed theestimated power using the four different models. Ob-viously, the curve shows that Model-0 has a big differ-ence between its estimation and the measured powerwhen low-workload and few of cores are actives (i.e.,1-3 active cores). However, it shows a good perfor-mance in high-workload when all the cores are active.This case is similar to estimation power consumptionof a processor as a unit regardless of active cores num-ber.As our models include the number of active cores andthe average frequency, they accurately estimated thepower in both areas of workload (i.e., low-workloadand high-workload). Furthermore, although Model-2statistically (i.e., regression R2) is better than Model-1, the experiment demonstrated that Model-1 withconstant C achieved better performance than the othermodels. Finally, slight percentage of error could beobserved in our models due to the fact that we con-sidered each logical core as physical core, but as wementioned before in section II-B the power consumedby a logical core is less than the power consumed by aphysical core.
31

0
50
100
150
200
250
300
350
400
450
500
0
5
10
15
20
25
30
35
40
45
50
0 10 20 30 40 50 60 70 80 90 100 110 120 130 140 150 160 170 180 190 200 210 220 230 240 250 260 270 280 290 300 310 320 330 340
CP
U-P
ow
er
(Wa
tt)
Time (sec.)
Model-0 Model-1 Model-2 Model-3 Measured Power Workload
Work
load (
MF
lops/s
ec)
F=1.6-1.82GHzN= 1-3 cores
F=2.4GHzN= 3-5 cores
F=1.6-1.7GHzN= 4-7 cores
F=1.7-1.82GHzN= 1-3 cores
Figure 3: Trace of measured consumed CPU-Power and predicted CPU-Power for the four models.
0 10 20 30 40 50 600
0.2
0.4
0.6
0.8
0.9
0.95
1
Percentage of Error (PoE) -Model-0
CD
F(P
oE
)
0 1 2 3 4 5 6 7 80
0.2
0.4
0.6
0.8
0.90.95
1
Percentage of Error (PoE) - Model-1
CD
F(P
oE
)
0 1 2 3 4 5 6 7 8 90
0.1
0.2
0.3
0.4
0.5
0.6
0.7
0.8
0.90.95
1
Percentage of Error (PoE)- Model-2
CD
F(P
oE
)
Figure 4: Prediction accuracy of the CPU-Power models.
Now, we discuss the prediction accuracy by computingthe percentage of error using the following formula.
PoE = |(Estimiated−Measured)/Measured|∗100%
Furthermore, we obtained the Empirical Cumula-tive Distribution Function of Percentage of ErrorCDF(PoE). The plot of CDF(PoE) for each model isdepicted in fig.4. The x-axis represents the Percent-age of Error (PoE), and y-axis shows the percentage ofdata points (i.e., predicted power values) that achieveerror less than each value of x. For instance, 90%of the predicted values using Model-0 have less than40%, and this error could increase to 50%. On theother hand, our models show that 90% of values werepredicted with less than 9% error. Although R2 valueof Model-1 is less than R2 value of Model-2, Model-1 showed the best results where 95% of the predictedvalues had error less than 7% error. Generally, the pre-diction accuracy of Model-1 empirically outperformsthe prediction accuracy of Model-2.Significantly, our proposed models achieve high pre-diction accuracy due to considering both number ofactive cores and the average running frequency. Ad-ditionally, the accurate readings of CPU-Power thatwas realized using CPU-Power measurement capabil-ity of our server assisted us to build these accuratemodels. To test our models’ ability to predict those
un-sampled combinations of frequency and number ofcores, we conducted some experiments with differ-ent un-sampled combinations frequency 2.53GHz andnumber of cores. Table 2 presents the results of theseexperiments. The results proved that our models arecapable to predict with high accuracy even un-sampledcombinations of frequency and number of cores.
3.5.2 Memory-intensive applications
In this section, we evaluated performance of themodels for applications that are considered memory-intensive using CG benchmark. Fig. 5 shows the esti-mated power versus the measured power. The diagonalline represents the perfect predication line which illus-trates the deviation of the estimated values from themeasured values. In other words, the predicted valueis equal or close to the measured value if it is one of
Table 2: The predicted CPU-Power for un-sampledcombination of frequency 2.53GHz and number ofcores.
Cores Measured Model-0 Model-1 Model-23 42 47.09 42.27 41.234 45 47.09 45.57 44.538 58 47.09 58.77 57.73
32

the perfect predication line points or close to this line.From Fig. 5, the data points that represent our modelsare either on or close to perfect predication line. Fur-thermore, we computed the maximum prediction errorof each Model. We found that Model-1 and Model-2 had less maximum prediction error compared to theother two models. However, with less than 6% maxi-mum prediction error for Model-1 and Model-2, thesetwo models are still accurate. The maximum predic-tion error of Model-0 was 14.4%.
20
25
30
35
40
45
50
55
20 25 30 35 40 45 50 55
Pre
dic
ted P
ow
er
(Watt)
Measured Power (Watt)
Model-0 Model-1 Model-2 Model-3 Perfect Prediction Line
Max Error of Model-0: 5.6 , 14.4% errorMax Error of Model-1: 1.7, 5.9 % errorMax Error of Model-2: 1.04, 5.07 % errorMax Error of Model-3: 3.76, 12.12 % error
Figure 5: CPU-Power models fit for CG-Memory-Intensive: measured vs. estimated.
3.5.3 IO-intensive applications
As we presented the performance of our models forCPU-intensive and Memory-intensive applications inthe previous sections, this section presents perfor-mance of the models for IO-intensive applications. Werepeated the experiments procedure of the previoussection using BT benchmark. Fig. 6 also shows theestimated power versus the measured power. We cansee that the predicted values of Model-1 are on perfectpredication line or very close to it. In contrast, Model-0 shows large deviation of the perfect line. Moreover,we found that Model-1 and Model-2 had less maxi-mum prediction error compared to the other two mod-els. Model-1 and Model-2 achieved less than 5% max-imum prediction error. Finally, the maximum predic-tion error of Model-0 became worse with 22.07% er-ror.
4 Conclusions and Next Steps
we developed models to estimate the power consump-tion of multicore processors. Our work is distin-guished from previous works in combining number ofactive cores with P-state of multicore processor. Wevalidated our proposed models using statistical analy-sis and experimental approach using varied workloads.The results of the experiment showed that our modelachieved high accuracy of CPU-Power estimation. Asa future work, we will apply our proposed models to
20
25
30
35
40
45
50
55
20 25 30 35 40 45 50 55
Pre
dic
ted P
ow
er
(Watt)
Measured Power (Watt)
Model-0 Model-1 Model-2 Model-3 Perfect Prediction Line
Max Error of Model-0: 11.03, 22.07% errorMax Error of Model-1: 1.14, 4.23 % errorMax Error of Model-2: 1.12, 3.63 % errorMax Error of Model-3: 3.16, 11.70 % error
Figure 6: CPU-Power models fit for BT-IO-Intensive:measured vs. estimated.
dynamic power-aware configuration for a virtual ma-chine in terms of number of cores and frequency. Thisenables new adaptive power management solution forvirtualized servers.
References
[1] R. Urgaonkar, U.C. Kozat, K. Igarashi, and M.J. Neely. Dynamic resource allocation and power management in virtualized data centers. 2010 IEEE Network Operations and Manage-ment Symposium (NOMS), IEEE, 2010, pp. 479-486.
[2] A. Gandhi, M. Harchol-Balter, R. Das, andC. Lefurgy. Optimal power allocation in serverfarms. In Proceedings of SIGMETRICS, June2009.
[3] S. Chatterjee and A. S. Hadi, Regression analysisby example. John Wiley and Sons, 2006.
[4] X. Fan, W.-D. Weber, and L.A. Barroso. Powerprovisioning for a warehouse-sized computer.In Proceedings of the 34th annual interna-tional symposium on Computer architecture, SanDiego, California, USA: ACM, 2007, pp. 13-23.
[5] R. V. der Wijngaart. NAS Parallel Benchmarks v. 2.4. NAS Technical Report NAS-02-007, October2002.
[6] J. Subhlok, S. Venkataramaiah, and A. Singh.Characterizing NAS Benchmark Performance onShared Heterogeneous Networks. InternationalParallel and Distributed Processing Symposium:IPDPS 2002 Workshops, vol. 2, 2002, pp. 0086.
[7] K. H. Kim, A. Beloglazov, and R. Buyya. Power-aware provisioning of virtual machines for real-time Cloud services. Concurrency and Compu-tation: Practice and Experience. John Wiley andSons, 2011.
33


VMs Core-allocation scheduling Policy for Energy and PerformanceManagement
Christoph Meinel, Ibrahim Takouna, and Wesam DawoudHasso-Plattner-Institut (HPI)
University of PotsdamPotsdam, Germany
{christoph.meinel, ibrahim.takouna, wesam.dawoud}@hpi.uni-potsdam.de
Abstract
In this phase of the project, we investigate the sensi-tivity of a VM performance running scientific multi-threading applications to changes in clock frequencyand VM performance dependency on Domain-0 forIO-intensive applications. Then, using sensitivityanalysis to schedule VM to suitable core with suitablefrequency settings. Currently, our work is built on astatic heterogenous system, next we are going to in-vestigate building a dynamic heterogenous system torealize power consumption proportional to a servicerequirements. However, our test environment showedthat we can gain power savings up to 17%.
1 Project Idea
Merging between multi-core processors and virtual-ization technologies has prompted us to investigate thepossibility of achieving power saving for such com-bination for scientific multithreading applications. Inthis project, we investigated the advantages of virtu-alizing heterogeneous multicore systems where theycould provide better performance per watt comparedto homogeneous processors [1,2,3]. A single proces-sor will contain hundreds of cores that vary in somemicro-architecture features such as clock frequency,cache size, power consumption, and others [4], butthese cores exploit the same instruction-set architec-ture. A single chip might have several complex coresand many simple cores. The simple cores are charac-terized as low-speed clock frequency, cache size, andlow power consumption while fast cores are equippedwith high-performance features such as high-speedclock frequency, cache size, and high power consump-tion. Consequently, their potential to achieve differ-ent levels of performance that meet applications het-erogeneity has prompted researchers in the operatingsystems domain to implement heterogeneous awareschedulers [5,6,7].With heterogeneity of applications’ characteristics, a
Hypervisors’ scheduler is efficient if it assigns a vir-tual CPU (vCPU) to run on the appropriate cores basedon the application characteristics in terms of CPU-intensive, Memory-intensive, or IO-intensive. Fur-ther, it should have knowledge of the physical pro-cessors’ architecture and their characteristics such ascores’ clock frequency. By this knowledge, VMswith CPU-intensive applications should be assignedto complex fast cores to be executed faster. Gener-ally, scientific applications are CPU-intensive, multi-threaded, and fewer CPU stalls due to infrequent mem-ory accesses or I/O operations. On the other hand, I/O-intensive could be assigned to simple slow cores with-out losing significant performance and achieving thepower savings. However, Hypervisors’ scheduling-policy is based on the round-robin algorithm to ensurefairness among VMs. Emerging heterogeneous sys-tem and virtualization bring more power savings andbetter resources utilization. This combination needs anew scheduler, which schedules each VM to an appro-priate core based on its characteristics.we used NAS Parallel Benchmarks [8] as CPU-intensive application and netperf benchmark [9] asI/O-intensive application. We denoted performancesensitivity to CPU clock frequency as ”performance-frequency sensitivity” and performance dependencyon Domain-0 as ”performance-Domain-0 depen-dency”. Our scheduling-policy based on thesetwo categories: ”performance-frequency sensitivity”and ”performance-Domain-0 dependency” to assigna vCPU to the appropriate core. Consequently,the results showed good performance improvementsfor VMs with CPU-intensive applications and forVMs with IO-intensive applications as well. Finally,our heterogeneous experimental environment achievespromising power savings reach to 17% which theoret-ically could reach to 45% . The power savings aregained from this architecture, which runs on two coreswith high frequency and other two cores with low fre-quency.
35

2 Used SOC Lab resources
The evaluation tests were performed on FujitsuPRIMERGY RX300 S5 server. It has a processor ofIntel(R) Xeon(R) CPU E5540 with 4-cores and the fre-quency range is 2.53GHz to 1.59GHz. the server isequipped with 12GB physical memory. Additionally,We used ServerView Remote Management to monitorpower consumption for CPU.
3 Findings
In this section, we analyzed sensitivity of VMs’ per-formance to changes in CPU clock frequency for VMsthat run CPU-intensive and IO-intensive applications.Then, we illustrated dependency of VMs’ on Domian-0 for VMs with IO-intensive applications.
3.1 VMs with NBP Analysis
To analyze VMs performance-frequency sensitivity,we used NBP-SER and NPB-OMP benchmarks asCPU-intensive programs. In this experiment, wepinned vCPUs of Domain-0 to cores (0,1) and vCPUsof VMs were pinned to the another two cores (2,3)to avoid Domain-0’s influence on the VMs; in otherwords, to prevent Domain-0 from being queued withthe VMs in the same queue. First, the experiment wasrun while the cores (2,3) were set to run with high fre-quency FF =2.53GHz as fast cores. Then, it was runagain after changing frequency settings of the cores(2,3) to low frequency FS=1.59GHz as slow cores.Finally, we used the price elasticity of demand eco-nomics formula to determine program’s completiontime and throughput sensitivity of clock frequency. Weconsidered T the completion time and Th the through-put as the demand, and F clock frequency as the price.ET,F is the completion time sensitivity of clock fre-quency, and ETh,F is throughput sensitivity of clockfrequency.
ET,F =TF − TS
FF − FS∗ FF + FS
TF + TS(1)
ETh,F =ThF − ThS
FF − FS∗ FF + FS
ThF + ThS(2)
Due to the inverse relationship between CPU fre-quency and completion time, ET,F values are nega-tive, so completion time increases as CPU frequencydecreases and vice versa. On the other hand, ETh,F
values are positive because of the direct relation-ship between CPU frequency and throughput. Pro-gram speedup depends on program characteristics, soit does not have a liner relationship with CPU fre-quency. However, CPU-intensive programs mighthave a semi-liner relation with frequency because ofeither infrequent memory accesses or I/O operations.
(a) (b)
Figure 1: Performance-frequency sensitivity for NPB-OMP and NPB-SER versions run on a VM with twovCPUs. (a)sensitivity of completion time to frequency,and (b)sensitivity of throughput to frequency.
Figure 1 shows NPB-OMP and NPB-SER bench-marks performance-frequency sensitivity (i.e., com-pletion time and throughput). NPB benchmark eachprogram has different memory access behavior andvarious inter-process communication patterns. Thesecharacteristics determine sensitivity of a program tofrequency changes. For example, the completion timeof EP-OMP and EP-SER programs had the same sen-sitivity and they gained the highest sensitivity. Thesimilarity between these two programs is that EP-OMP a multithreaded program but has negligible inter-process communication and EP-SER is a single threadprogram without inter-process communication. Fur-ther, EP-OMP is seldom memory access comparedwith CG-OMP and LU-OMP. Generally, NPB-SERprograms sensitivity to frequency changes was higherthan NBP-OMP due to the sequential execution ofinstructions in NPB-SER and inter-process commu-nication patterns or IO operations in some of NBP-OMP programs such as CG and BT respectively. Onthe other hand, NBP-OMP programs with intensiveinter-process communication were less sensitive to fre-quency such as CG-OMP and LU-OMP. FT, a mixedtype program, almost had the same sensitivity in NPB-SER and NPB-OMP. Unlike LU-OMP, BT-OMP in-cludes a number of I/O operations that do not needsynchronization among its threads.
3.2 VMs with I/O Analysis
We analyzed sensitivity of VMs performance with I/O-intensive to CPU frequency. Then, as I/O operationsdepend on Domain-0, we tested VMs performance-Domain-0 dependency.
3.2.1 CPU Frequency Sensitivity
In this experiment, we ran netperf with TCP-STREAMand UDP-STRAEM options to test I/O performance-frequency sensitivity using formula 2. The setting ofthis experiment was the same setting when we testedVM with NBP sensitivity. As shown in figure 2-(a),TCP test is more sensitive to core frequency than UDPdue to the nature of TCP-packet; UDP does neithermessage fragmentation nor reassembly. Further, the
36

(a) (b)
Figure 2: Performance-frequency sensitivity andDomain-0 dependency for NPB-OMP and NPB-SER versions run on a VM with two vCPUs.(a) performance-frequency sensitivity, and (b)performance-Domain-0 dependency.
aggregate costs of non-data touching overheads con-sume majority of the total software processing time. The non-data touching overheads come from as net-work buffer manipulation, protocol-specific process-ing, operating system functions, data structure manip-ulations (other than network buffers), and error check-ing[16]. To validate our test, we used SCP application TCP-based to transfer a 500 MB file between two VMs and we found the same results obtained using netperf-TCP.
3.2.2 VMs with I/O Domain-0 Dependency
In this experiment, we ran netperf benchmark withTCP-STREAM and UDP-STRAEM options to testI/O performance-Domain-0 dependency. For thisend, we reversed the scenario of VM performance-frequency sensitivity, so the cores (2,3) settingswere not changed and were set to high frequencyFF =2.53GHz where VMs were pinned in cores (2,3).On the other hand, The cores (0,1) were set to high fre-quency FF =2.53 GHz where Domain-0 was pinned.Then, we ran it again while the frequency of cores(0,1) is low FS=1.59GHz. Finally, we computedthe performance-Domain-0 dependency using formula(2). The result of this experiment is shown in figure2-(b). It illustrates that both netperf-TCP and netperf-UDP depend on Domain-0 for commutation betweento VMs, but netperf-TCP depends on Domain-0 morethan netperf-UDP.The conclusion is that applications based on TCP pro-tocol are frequency sensitive and they are Domain-0dependant as depicted in figure 2-(a) and figure 2-(b)respectively.
4 PERFORMANCE EVALUATIONS
In this section, we evaluated our improved scheduling-policy with the following rules:
• The weight of VM is proportional to the numberof vCPUs.
• CPU-intensive vCPU should not being queuedwith I/O-intensive vCPU. Further CPU-intensivevCPU should be placed in the fast pCPU’s queueand I/O-intensive vCPU in the slow pCPU’squeue.
• A virtual machine with CPU-intensive applica-tion and a single vCPU should be placed in fastpCPU’s queue to accelerate the sequential execu-tion.
• The time-slice for the fast pCPU’s queue is 30msand time-slice for slow cores is 10ms as show infigure 3. We chose the value 10ms for the shortslice as one tick to avoid high context switchingand to keep consistent credit accounting.
• The settings of cores in the experiments are thefast cores (0,1) with FF =2.53GHz and the slowcores (2,3) with FS=1.59GHz.
(a) (b)
Figure 3: Scheduling time-slice modifications. (a) time-slice = 30ms for fast cores, and (b) time-slice = 10ms for slow cores. The accounting period of vCPU is 30ms for both fast and slow cores.
4.0.3 I/O and CPU-intensive Isolation
In this experiment, we created three VMs one withtwo vCPUs and the other two each has one vCPUs.We ran netperf on the two VMs with one vCPU fortesting TCP and UDP bandwidth channels betweenthem. The VM with two vCPUs used to run NPB-SER, then NBP-OMP. We ran the three VMs with ournew scheduling-policy. First, we used EP and CG pro-grams in NPB-SER with netperf, then EP and CG ofNPB-OMP were used. We pinned the VMs with I/O tothe slow cores (2,3) and the VM with CPU-intensivewas pinned to the fast cores (0,1). Performance im-provement for both I/O and CPU-intensive VMs com-pared to the default scheduler is illustrated in figure4. Figure 4-(c) shows that the performance gain ofCG.C is better than EP.C. Indeed, EP.C has negligi-ble inter-process communication compared to CG.Cwhich has also memory accesses. On the other hand,netperf-TCP throughput when co-hosted with VM thatran NBP-SER is better than when co-hosted with VMthat ran NBP-OMP. As seen in figure 3-(b), netperf de-pends on Domain-0 and NPB-SER is a single threadtest that gave Domain-0 chance to be scheduled infast cores and improve I/O operations for netperf-TCP.The aggregate average gain is depicted in figure 4-(c).
37

Obviously, isolating CPU-intensive vCPUs from IO-intensive vCPUs was the main reason for performanceimprovement. Using isolation eliminated the sourcesof delay that effect on CPU-intensive vCPUs perfor-mance.
(a) (b) (c)
Figure 4: I/O and CPU-intensive Isolation Perfor-mance improvements; netperf-TCP run on a VM withone vCPU,and NPB-OMP run on a VM with two vC-PUs. (a) Throughput gain for NPB-OMP and netperf-TCP benchmark, (b) throughput gain for NPB-OMPand netperf-TCP benchmark, and (c) the average im-provement of the overall system.
4.1 VMs with sensitive Inter-processComm.
In this experiment, we tested the performance gainfor inter-process communication intensive such as CGand LU of NPB-OMP version. The performance ofNPB-OMP benchmark in VM is near to the perfor-mance in physical server as long as the vCPUs areless than pCPUs, and LU-OMP is the most sensitiveprogram to communication delay [10]. For testinginter-process communication intensive program per-formance improvement, we created one VM with onevCPU and another VM with four vCPU. Neverthe-less, we had five vCPUs in addition to four vCPUs forDomain-0. The performance gain is illustrated in fig-ure 5 where figure 5-(a) shows Throughput gain andcompletion time speedup for NPB-OMP while figure5-(b)illustrates Throughput gain and completion timespeedup for NPB-SER. Figure 5-(c) shows the averageaggregated performance gain for NPB programs withtwo versions. Nevertheless, LU-OMP gained about70% performance improvement. This improvementdue to changing the time-slice of the slow pCPUs’to 10ms which increases scheduling frequency. In-creasing scheduling frequency gave chance for inter-process communication and synchronization. Further,decreasing time-slice decreases holding time whenvCPU status ”busy blocking” holds pCPU [11]. A lotof ”busy blocking” wastes pCPU cycles and degradesthe overall system performance.
5 Next Steps
The next steps of our project will be as follows:
(a) (b) (c)
Figure 5: CPU-intensive with inter-process commu-nication intensive performance improvements; NPB-OMP run on a VM with four vCPUs and NPB-SER run on a VM with one vCPU. (a) Throughput gain and completion time speedup for NPB-OMP, (b) through-put gain and completion time for NPB-SER, and (c) the average improvement of the overall system.
• Analyzing energy characteristics of scientificmutlithreading applications executed on VM withmulti-Virtual-CPU to provide a dynamic mecha-nism for saving energy while satisfying perfor-mance requirements. As we studied the NPBbenchmarks performance sensitivity of changingin CPU frequency, Our method is to determinenumber of virtual-CPUs for a virtual machine andcores frequency settings in order to minimize en-ergy consumption.
• We would like to use SOC LAB resource that has64-cores which enable many configuring com-binations of Frequency, Voltage, and number ofcores where the used machine only has 4 cores.Using 64-cores machine also could be useful toapply our idea of cores clustering based on CPUclock frequency and other features.
References
[1] K. Asanovic, R. Bodik, B. Catanzaro, J. Gebis,and P. Husbands, ”The Landscape of ParallelComputing Research: A View From Berke-ley,” UC Berkeley Technical Report UCB/EECS-2006-183, 2006.
[2] T. Y. Morad, U. C. Weiser, A. Kolodny, M.Valero, and E. Ayguade, ”Performance, PowerEfficiency and Scalability of Asymmetric Clus-ter Chip Multiprocessors,” IEEE Computer Ar-chitecture Letters 5(1):4, 2006.
[3] R. Kumar, K. I. Farkas, and N. Jouppi et al,”Single-ISA Heterogeneous Multi-Core Archi-tectures: The Potential for Processor Power Re-duction,” In Proc. of MICRO 36, 2003.
[4] S. Borkar, ”Thousand Core Chips-A TechnologyPerspective,” in Proc. of the DAC, 2007.
38

[5] R. Kumar, Dean M. Tullsen, P. Ranganathan, N.Jouppi, and K. Farkas, ”Single-ISA Heteroge-neous Multicore Architectures for MultithreadedWorkload Performance,” in Proc. of the 31st An-nual International Symposium on Computer Ar-chitecture, 2004.
[6] R. Kumar, D. M. Tullsen, and P. Ranganathan etal, ”Single-ISA Heterogeneous Multi-Core Ar-chitectures for Multithreaded Workload Perfor-mance,” in Proc. of ISCA, 2004.
[7] M. Becchi and P. Crowley, ”Dynamic Thread As-signment on Heterogeneous Multiprocessor Ar-chitectures,” in Proc. of the Conference on Com-puting Frontiers, 2006.
[8] R. V. der Wijngaart, ”NAS Parallel Benchmarksv. 2.4”, NAS Technical Report NAS-02-007, Oc-tober 2002.
[9] R Jones, ”NetPerf:a Network performancebenchmark,” http://www.netperf.org.
[10] C. Xu, Y. Bai, and C. Luo, ”Performance Eval-uation of Parallel Programming in Virtual Ma-chine Environment,” In Proc. of Sixth IFIP In-ternational Conference on Network and ParallelComputing, pp. 140-147, 2009.
[11] H. Chen, H. Jin, K. Hu, and J. Huang, ”Dy-namic Switching-Frequency Scaling: Schedul-ing pinned Domains in Xen VMM,” in Proc. of 39th International Conference on Parallel Pro-cessing,pp. 287-296, 2010.
[12] D. Shelepov and A. Fedorova, ”Scheduling onHeterogeneous Multicore Processors Using Ar-chitectural Signatures,” in Proc. of the Workshopon the Interaction between Operating Systemsand Computer Architecture, in conjunction withthe 35th International Symposium on ComputerArchitecture (Beijing, China, June 21-25, 2008).WIOSCA ’08.
39


Parallelization of Elementary Flux Mode Enumeration for Large-scale
Metabolic Networks
Fahad Khalid Hasso-Plattner-Institut,University of Potsdam
14482 Potsdam, Germany [email protected]
Abstract
Elementary Flux Modes (EFM) is a concept from
Systems Biology, describing a set of minimal path-
ways in the metabolic network of an organism. Under
steady-state conditions, the problem of finding EFMs
in a metabolic network is mathematically equivalent
to the enumeration of extreme rays of a polyhedral
cone. This problem is computationally challenging
and currently mostly solved with sequential algo-
rithms, which are inappropriate for the analysis of
large-scale metabolic networks.
In this project we aim to implement a parallel solu-
tion to the problem that is targeted towards hybrid
many-core architectures. So far, we have utilized the
hardware available in the FutureSOC Lab to under-
stand the memory consumption behavior of the algo-
rithm on shared-memory architectures. We have
identified memory consumption as a priority issue,
and are currently working towards designing a better
solution.
1 Introduction
This project is aimed at solving a computational problem from the field of Systems Biology. It is a collaborative effort between the Max Planck Institute of Molecular Plant Physiology and the Hasso-Plattner-Insitute at the Universtiy of Potsdam. The following sections provide a brief introduction to the problem, the computational challenge that it pos-es and also findings from the experiments conducted so far.
1.1 Metabolism
The metabolism is a collection of chemical reactions responsible for supporting life in a living organism. They include reactions that breakdown organic mat-ter in order to harvest energy; as well as those that utilize energy to construct the required chemicals e.g. proteins and nucleic acids. When considered at the scale of the whole organism, these chemical reactions
form networks that consist of a very large number of chemicals interacting with each other.
1.2 The study of Metabolic Networks
Analysis of metabolic networks serves an important tool in Systems Biology research. Following are two examples of how a thorough understanding of the structure and function of metabolic networks can be useful: Diseases such as cancer cause significant alterations in the intracellular metabolism [1, 2]. This is due to the fact that metabolic activities in tumor cells are different from healthy cells. Therefore, understanding the metabolic pathway flux of tumor cells can help identify drug targets that may help develop improved therapies for cancer patients. There exist in nature several organisms that on an intracellular level produce chemicals useful for hu-man consumption. However, the rate of production of these chemicals is optimized by evolution for objec-tives such as growth and reproduction of the organ-ism [3]. In order to optimize the metabolism of these chemicals for human needs, the rate of production has to be altered. In metabolic engineering, a promis-ing method to achieve this is the mathematical pre-diction of metabolic fluxes.
1.3 Elementary Flux Modes
Elementary Flux Modes (EFMs) describe a set of minimal pathways in the metabolic network of an organism. A system can have multiple steady states, and each of these unique states can be expressed as a nonnegative linear combination of elementary flux modes.
1.4 Enumeration of EFMs
This project deals with the problem of enumerating all EFMs of a given metabolic network, for a given steady state. The following major steps are involved in the enumeration process:
1. The metabolic network under considerationis represented as a node weighted directedhypergraph. The chemical reactions in-
41

volved in the network are represented by the edges of the hypergraph, while the vertices represent the chemical compounds involved in those reactions. These chemical com-pounds are referred to as metabolites.
2. The incidence matrix of this hypergraph iscreated. This matrix shows the relationshipbetween the metabolites and reactions in-volved in the network. This matrix is knownas the Stoichiometric matrix. Throughout therest of this document, we shall represent thestoichiometric matrix as S.
3. Under steady state conditions, the followingrelationship holds:
S = 0 where S is the stoichiometric matrix, and is flux vector.
4. The EFMs that we are looking for, reside inthe nullspace matrix corresponding to thissystem of linear equations.
5. An algorithm is used to get the nullspacematrix, and then systematically search forsolution vectors that qualify as EFMs. Thealgorithm used in this project is the Null-space algorithm [4].
1.5 The Computational Challenge
The core computational challenge presented by the problem of EFM enumeration is that of combinatorial explosion. The number of EFMs grows very rapidly with the size of the network, and therefore puts very high demands on both computation and memory. A parallelization based approach to the solution ena-bles us to exploit the inherently parallel architecture of modern processors, thereby reducing the time that it takes to enumerate EFMs. However, the attempts so far have only marginally increased the capacity to compute EFMs, and it is still not possible to enumer-ate EFMs for genome scale networks.
2 Our Approach
The traditional algorithmic model in HPC is aiming at parallelized shared-nothing architectures with deep memory hierarchies, as with the IBM BlueGene ar-chitecture and MPI as programming model. This is contrary to one of the most recent trends, where CPU and GPU hardware is mixed for speeding up specific steps in the algorithmic processing. Also, the current trend in multi-core and many-core architectures pro-vides the opportunity to exploit shared-memory ar-chitectures with multiple cores. Considering the above mentioned trends, our ap-proach is to tailor the algorithm and implementation in such a way, that not only can we take advantage of distributed memory cluster like environments, but
also hybrid shared-memory parallel architectures within a single box.
2.1 Current Status
The progress so far is in line with the proposed pro-ject plan. A state-of-the-art algorithm has been se-lected for parallelization [5]. While adapting the al-gorithm to shared-memory architectures, a major memory consumption bottleneck was identified. Work is currently in progress on optimizing memory consumption, as well as further adapting the algo-rithm for efficient execution on shared-memory ar-chitectures. The challenge now is to optimize memory consump-tion for shared-memory architectures. This requires efforts both on the algorithmic and implementation levels. The use of FutureSOC machines is vital for the verification and validation of the required im-provements. This is due to the fact that the memory bottleneck is only apparent for a large number of processes running in parallel, which requires the use of high-end hardware available in the FutureSOC lab.
3 Results
The results are presented in tabular form in the at-tached Appendix. The experiments were conducted using two of the machines available in the FutureSOC Lab. Hyper-threading was enabled on both machines, which means that total number of hardware threads availa-ble on each machine is 128. Table 1 presents the execution times of networks of different sizes, executed using different number of processes. The most important message here is that memory consumption increases almost linearly with the number of processes. The consequences are ap-parent in row 7. The maximum number of processors that can compute this Yeast network is 16. If we in-crease the number of processes to 32, the amount of memory consumption increases as well, and the pro-gram eventually runs out of memory. The Yeast net-work in the last row could not be computed at all. It consumes all the memory even if executed using just 2 processes. Therefore, parallel execution of the last network is not possible on this machine due to the inept memory consumption behavior. Table 2 presents the results of execution on a similar machine, but this time with 2 terabytes of memory (which is considerably larger than was available on the first machine). As can be seen here, the Yeast network that could only be computed with a maxi-mum of 16 processes on the first machine, can be computed with even 128 processes. This results in a significant reduction in execution time. Fort the last network, however, we again have an upper bound on the number of processes. In this case, with even 2
42

terabytes of memory, not more than 32 processes can be used in parallel.
3.1 Conclusions
As can be inferred from the results presented above, parallel computing is indeed as suitable approach to solve this problem in two ways:
1. Minimizing execution time for currentlycomputable network sizes.
2. Extending the computable network size tomore than that computable with serial pro-cessing alone.
However, considerable work is required in order to make the computation feasible for genome-scale networks. The major bottleneck at the moment is that of memory consumption, which is what we would like to improve upon in the near future.
References
[1] R. J. DeBerardinis, J. J. Lum, G. Hatzivassiliou, and C. B. Thompson, "The Biology of Cancer: Metabolic Reprogramming Fuels Cell Growth and Proliferation," Cell Metabolism, vol. 7, pp. 11-20, 2008.
[2] L. G. Boros, N. J. Serkova, M. S. Cascante, and W.-N. P. Lee, "Use of metabolic pathway flux information in targeted cancer drug design," Drug Discovery Today: Therapeutic Strategies,
vol. 1, pp. 435-443, 2004. [3] H. U. Kim, T. Y. Kim, and S. Y. Lee, "Metabolic
flux analysis and metabolic engineering of microorganisms," Molecular BioSystems, vol. 4, pp. 113-120, 2008.
[4] C. Wagner, "Nullspace Approach to Determine the Elementary Modes of Chemical Reaction Systems," The Journal of Physical Chemistry B,
vol. 108, pp. 2425-2431, 2004. [5] D. Jevremović, C. T. Trinh, F. Srienc, C. P. Sosa,
and D. Boley, "Parallelization of Nullspace Algorithm for the computation of metabolic pathways," Parallel Computing, vol. 37, pp. 261-278, 2011.
43

4 Appendix
Hewlett Packard DL980 G7 – 2, 8 x Xeon X6550, 128 GB RAM
# Network Size (Original) Network Size (Compressed)
# of Processes Time taken # of EFMs
1 E. coli 47 × 59(21) 26 × 38(13)
128 1s
44354 16 0.6s
1 3s
2 E. coli 41 × 61(19) 26 × 40(12)
128 0.9s
38002 16 0.62s
1 2.5s
3 E. coli 49 × 64(19) 26 × 41(12) 128 < 2s 92594
4 E. coli 50 × 66(19) 27 × 43(13) 128 3.1s 188729
5 E. coli 50 × 66(28) 29 × 45(19)
128 41s
1224785 64 53s
32 57s
6 S. cerevisiae 62 × 78(31) 35 × 54(17)
128 42s
1515314 64 48s
32 63s
7 S. cerevisiae 62 × 80(31) 38 × 57(19)
16 1 hour 45 minutes
13322463
32 and > could not be
computed
8 S. cerevisiae 63 × 83(34) 40 × 61(23) - - -
Table 1 Execution results with 128 Gigabytes of RAM
44

Hewlett Packard DL980 G7 – 1, 8 x Xeon X7560, 2048 GB RAM
# Network Size (original) Network Size (Compressed)
# of Processes Time taken # of EFMs
1 S. cerevisiae 62 × 80(31) 38 × 57(19) 128 ~ 32 minutes 13322463
2 S. cerevisiae 63 × 83(34) 40 × 61(23)
32 ~ 5.2 hours
68874836 64 and >
could not be computed
Table 2 Execution results with 2 Terabytes of RAM
45


Early Anomaly Detection in SAP Business ByDesignReport March 2012
Felix SalfnerSAP Innovation Center
Prof.-Dr.-Helmert-Straße 2-3 14482 Potsdam
Peter Tröger, Eyk KnyHasso-Plattner-Institut
Prof.-Dr.-Helmert-Straße 2-3 14482 Potsdam
Abstract
The management of cloud computing infrastructureson operator side is a true challenge. An ever-growingnumber of servers, the heterogeneity of software, nec-essary elastic load handling, energy consumption andother non-functional aspects have to be taken into ac-count – continuously and in an adaptive fashion.In this report we discuss one specific idea for smartcloud operation. Anomaly detection triggers preven-tive maintenance activities when some part of the sys-tem is about to enter an erroneous state. Examples forsuch activities are administrator alarming and auto-mated load migration. We combine this approach withthe idea of semi-automated root cause analysis to re-duce time-to-repair and improved availability. Proto-typical experiments for this approach were conductedwith SAP’s enterprise cloud infrastructure called Busi-ness ByDesign. All measurements and prototypical im-plementations were performed in the HPI FutureSOClab.
1 Introduction
Cloud computing is currently one of the predominanttrends in computer science and IT industry. Its po-tential impact on IT infrastructures and software plat-forms cannot be underestimated: The cloud paradigmwill change the way how IT companies make businessas well as how end-users (private and corporate) per-ceive software and IT. It moves the burden of IT infras-tructure management and operation away from users,and shifts it to specialized providers that can guaranteefast, reliable, and secure operation of the cloud infras-tructure.Satisfying the users’ expectations turns the manage-ment of cloud computing infrastructures into a truechallenge. An ever-growing number of servers, theheterogeneity of software, multiple interacting mech-anisms to elastically react on changing load, theconsideration of energy consumption and other non-functional aspects have to be taken into account. Op-erating such systems requires intelligent managementtools to deliver the guaranteed service-level to the userin a profitable way.
One of the key features of system monitoring at thescale of a cloud computing center is to aggregate low-level monitoring events in order to present only criticalevents to the operation personnel. To achieve this goal,current monitoring systems rely on temporal as wellas spatial correlation mechanisms and infrastructure-centric rule-based aggregation. These techniques usu-ally have a snapshot-like view on the system and ig-nore problems that evolve in the system over a longperiod of time. In our project, we focus on such evolv-ing phenomena and explore a new monitoring tech-nique that is based on computing correlations betweenmonitoring signals in order to identify the spreading ofproblems within the system.This report summarizes the first project phase and doc-uments our project results. In summary we have:
• created a general monitoring and computation in-frastructure for anomaly detection,
• implemented the necessary signal correlationalgorithm using SAP’s in-memory databaseHANA,
• identified potential anomaly signal data sourcesin SAP Business ByDesign, and have
• collected data from other use cases, i.e., fromthe Python BuildBot infrastructure and the TACCRanger High-Performance Computing System.
2 Approach
In 2010, Oliner et al. [3] have presented an algorithmto infer shared influence in complex production sys-tems. The algorithm is based on anomaly signals,which are real values between zero and one indicat-ing how much a measurement signal deviates from“normal behavior”. By computing the correlation be-tween any pair of anomaly signals, the “spreading” ofanomalies across the system can be quantified. Moreprecisely, if there is a high correlation between theanomaly signals of two components, we can specu-late that the abnormal states of both components arerelated.The time lag at which the correlation reaches its max-imum can be used to determine the temporal interde-
47
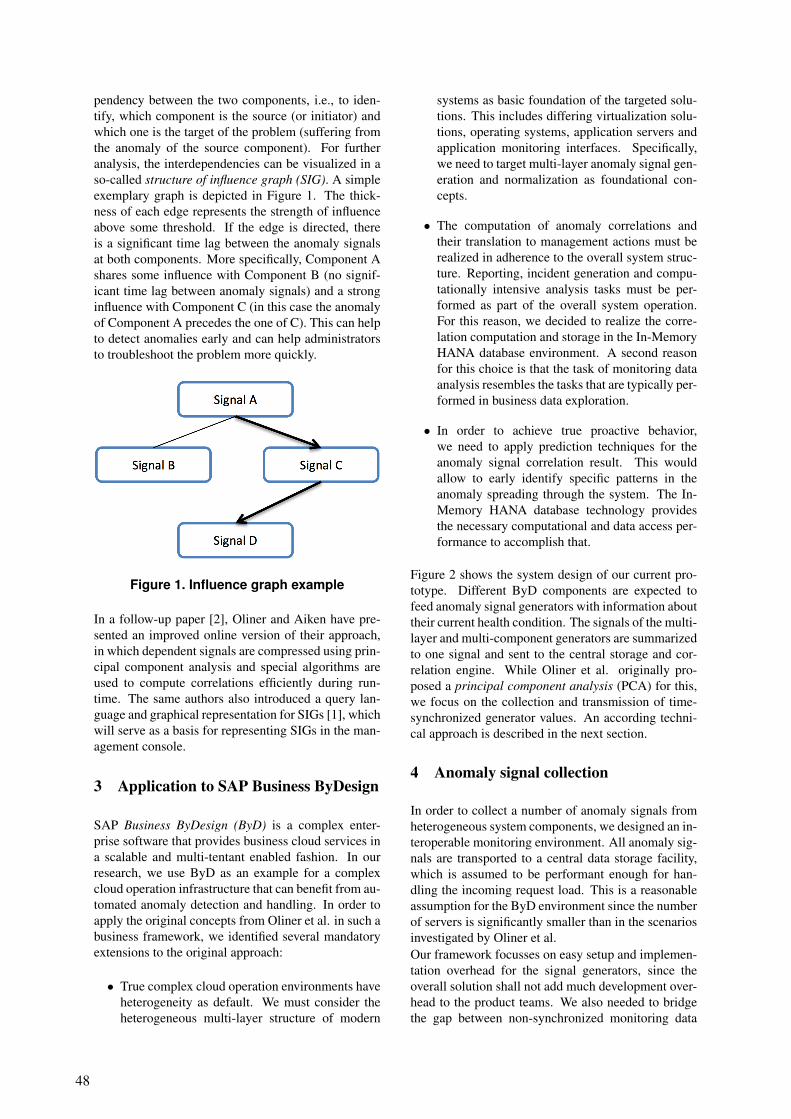
pendency between the two components, i.e., to iden-tify, which component is the source (or initiator) andwhich one is the target of the problem (suffering fromthe anomaly of the source component). For furtheranalysis, the interdependencies can be visualized in aso-called structure of influence graph (SIG). A simpleexemplary graph is depicted in Figure 1. The thick-ness of each edge represents the strength of influenceabove some threshold. If the edge is directed, thereis a significant time lag between the anomaly signalsat both components. More specifically, Component Ashares some influence with Component B (no signif-icant time lag between anomaly signals) and a stronginfluence with Component C (in this case the anomalyof Component A precedes the one of C). This can helpto detect anomalies early and can help administratorsto troubleshoot the problem more quickly.
Figure 1. Influence graph example
In a follow-up paper [2], Oliner and Aiken have pre-sented an improved online version of their approach,in which dependent signals are compressed using prin-cipal component analysis and special algorithms areused to compute correlations efficiently during run-time. The same authors also introduced a query lan-guage and graphical representation for SIGs [1], whichwill serve as a basis for representing SIGs in the man-agement console.
3 Application to SAP Business ByDesign
SAP Business ByDesign (ByD) is a complex enter-prise software that provides business cloud services ina scalable and multi-tentant enabled fashion. In ourresearch, we use ByD as an example for a complexcloud operation infrastructure that can benefit from au-tomated anomaly detection and handling. In order toapply the original concepts from Oliner et al. in such abusiness framework, we identified several mandatoryextensions to the original approach:
• True complex cloud operation environments haveheterogeneity as default. We must consider theheterogeneous multi-layer structure of modern
systems as basic foundation of the targeted solu-tions. This includes differing virtualization solu-tions, operating systems, application servers andapplication monitoring interfaces. Specifically,we need to target multi-layer anomaly signal gen-eration and normalization as foundational con-cepts.
• The computation of anomaly correlations andtheir translation to management actions must berealized in adherence to the overall system struc-ture. Reporting, incident generation and compu-tationally intensive analysis tasks must be per-formed as part of the overall system operation.For this reason, we decided to realize the corre-lation computation and storage in the In-MemoryHANA database environment. A second reasonfor this choice is that the task of monitoring dataanalysis resembles the tasks that are typically per-formed in business data exploration.
• In order to achieve true proactive behavior,we need to apply prediction techniques for theanomaly signal correlation result. This wouldallow to early identify specific patterns in theanomaly spreading through the system. The In-Memory HANA database technology providesthe necessary computational and data access per-formance to accomplish that.
Figure 2 shows the system design of our current pro-totype. Different ByD components are expected tofeed anomaly signal generators with information abouttheir current health condition. The signals of the multi-layer and multi-component generators are summarizedto one signal and sent to the central storage and cor-relation engine. While Oliner et al. originally pro-posed a principal component analysis (PCA) for this,we focus on the collection and transmission of time-synchronized generator values. An according techni-cal approach is described in the next section.
4 Anomaly signal collection
In order to collect a number of anomaly signals fromheterogeneous system components, we designed an in-teroperable monitoring environment. All anomaly sig-nals are transported to a central data storage facility,which is assumed to be performant enough for han-dling the incoming request load. This is a reasonableassumption for the ByD environment since the numberof servers is significantly smaller than in the scenariosinvestigated by Oliner et al.Our framework focusses on easy setup and implemen-tation overhead for the signal generators, since theoverall solution shall not add much development over-head to the product teams. We also needed to bridgethe gap between non-synchronized monitoring data
48

Figure 2. Computing structure of influence graphs using SAP’s in-memory database HANA
fetching and synchronous data availability assumed bythe correlation framework.
The monitoring code for signal generation must exe-cute under truly diverse conditions. One example areoperating system sensors, which are typically devel-oped in native C language. On the other hand, high-level software sensors may be developed in Java orABAP. Anomaly signal generators also encode verydomain-specific knowledge. They will in many casesbe programmed by domain experts. The monitoringframework should hence allow maximum flexibility inorder to put a minimum burden on anomaly signal gen-erator programmers.
Figure 3 shows our resulting infrastructure for a multi-server environment.
Figure 3. Monitoring infrastructure foranomaly signal collection.
Our typical client-server architecture consists of theByDAY server and one ByDAY client per server. Thedata between both entities is exchanged via JAXB se-rialization of Java objects. The setup procedure per-forms time synchronization (or appropriate time shiftdetermination) between the two parties, in order to geta consistent time mapping of sensor values.The support for heterogeneous generator implementa-tions is ensured by the usage of XML-RPC as proto-col between the ByDAY client and the domain-specificgenerator instances. While the wire encoding of XML-RPC truly adds some overhead, it must be noted thatthis kind of communication only happens locally be-tween the ByDAY client and the generator instances.All generators acting as XML-RPC server have to im-plement two methods:
<boolean> setup(<struct> config)<double> pullSignal(<int> signalID,
<dateTime> timestamp)
The ByDAY client starts all anomaly signal genera-tors (on the same machine) and calls their setup()procedure to configure generator-specific parameters.This enables to configure all anomaly signal genera-tors of one machine to be configured using just oneconfiguration file (the one of the ByDAY client).Our approach to bridge the gap between asyn-chronously available (raw) monitoring signals andthe need to collect anomaly signals for one system-wide synchronized timestamp is the following: Eachanomaly signal generator acquires its raw monitoringdata asynchronously. Synchronization is achieved bythe ByDAY client asking for the anomaly signal valueat some given timestamp in the past. It is generator’s
49

duty to store enough history so that this request canbe answered. If there is no value for the exact times-tamp requested, it is the generator’s duty to provide anapproximate value for the requested timestamp, as theaccording approximation, rounding and logging activ-ities are signal-specific. To request an anomaly sig-nal, the ByD client - in coordination with the ByDAYserver - will periodically call the pullSignal()method to ask for the anomaly value of the given sig-nal at the given timestamp.In order to limit the need for monitoring data stor-age, the ByDAY client sets a config parametermaxTimeLag along with the setup() call, whichdetermines the maximum time delta into the past forwhich the ByDAY client can request a value. In orderto enable an anomaly signal generator to serve multi-ple signals, setup() also requires a config parametersignalID.After having collected the anomaly signals of all lo-cal anomaly signal generators, the ByD server sendsback the data as timestamp-based tuple to the By-DAY server, which persists it for later processing inthe HANA database.
5 HANA-based correlation engine
Investigating the root cause of a problem that has oc-curred in a cloud environment frequently requires toanalyze monitoring data and to compare the systembehavior of the current faulty case to system behav-ior at other fault-free times. In order to do this, anefficient analysis framework has to enable the opera-tor to quickly move forth and back in the monitoringdata, to drill down at specific points in time or to getan overview on higher levels of granularity. These re-quirements make root cause analysis similar to busi-ness data exploration. In-memory database technol-ogy is a key enabling technology to perform on-the-flydata analysis — and we believe that it has the poten-tial to also boost efficiency for root cause analysis. Forthis reason, we implemented the correlation algorithmwith on-the-fly data aggregation on the database level.Our approach builds on the tight integration of theSAP HANA in-memory database and the statisticalcomputing framework R. Figure 4 shows the setup.The implementation of the ByDAY server was possiblethrough the usage of the HPI FutureSOC Lab HANAinstallation.
6 Collecting Test and Real-world Data
In order to test the described prototypical implemen-tation, we started to collect historical execution andfailure logs from different clue infrastructures.
6.1 ByDesign execution traces
SAP Business ByDesign is a complex cloud enterprisesoftware platform that is built on top of a cloud in-frastructure. The system is operated and maintainedby multiple groups and we first focused on getting anoverview of the monitoring data that is available. Thevarious data sources reach from infrastructure-levelmonitors, e.g., from network switches, up to incidentsreported by external users of Business ByDesign. Wealso have talked to experts that integrate monitoringdata from various sources and architectural levels toperform impact analysis and event correlation. Wehave identified data sources that can be used once wehave finished and tested our monitoring data collectionframework.
6.2 Buildbot execution traces
Buildbot is a continuous integration system designedto automate the build/test cycle. By automatically re-building and testing the tree each time something haschanged, build problems are pinpointed quickly, be-fore other developers are inconvenienced by the fail-ure. The Python interpreter development is usinga Buildbot infrastructure1 for continuous integrationpurposes. Based on personal contact with Dr. Martinv. Lowis, we were able to gather a set of log files forthe Python Buildbot infrastructure. We are currentlydeveloping an anomaly generator implementation thatcan replay the logs and generate anomaly signals.
6.3 TACC Ranger execution traces
The Texas Advanced Computing Center (TACC) op-erates their largest HPC supercomputer, Ranger, withdifferent software and hardware facilities at a largescale. Ranger can perform 579.4 trillion operationsper second (or teraflops), and is nearly 30,000 fasterthan today’s desktop computers. Based on personalcontact with Edward Chuah, we were able to gain fail-ure logs from the Ranger operation over a time periodof 24 months. We are currently preparing a log replayanomaly signal generator similar to the Buildbot casein order to test our framework also with this data set.
7 Initial Results
We have performed experiments using artificial datagenerators to test our monitoring and computation in-frastructure and to see how the approach scales. Fig-ure 5 plots the computation time needed to computethe correlation between all signals as a function of thenumber of signals. The family of curves in the plotshow computation time if the correlation is computedfor a maximum time lag of 50, 240, and 1500 samples,
1http://bit.ly/zrjRec
50

Figure 4. Overview of the HANA-based correlation engine.
i.e., for each pair of signals, the correlation is com-puted with an offset of [0 . . . 50] samples.
Figure 5. Computation time for a vary-ing number of signals with 50000 samplepoints each.
8 Conclusions and Next Steps
Operating a cloud computing infrastructure at mini-mum cost while at the same time offering service at aguaranteed level is a challenge. This project attemptsto adapt a new correlation-based monitoring data anal-ysis method to the cloud context. One major new as-pect is to include in-memory databases in the pictureto facilitate on-the-fly data analysis and exploration.In this first phase of the project we have built the in-frastructure and have collected several datasets that weare going to analyze in the next phase. Further top-ics will include sophisticated methods for structure-of-influence graph analysis and visualization.
References
[1] Adam Oliner and Alex Aiken. A query languagefor understanding component interactions in pro-duction systems. In 24th ACM International Con-ference on Supercomputing, pages 201–210, NewYork, NY, USA, 2010. ACM.
[2] Adam Oliner and Alex Aiken. Online Detection ofMulti-Component Interactions in Production Sys-tems. In Dependable Systems and Networks, pages49–60. IEEE, 2011.
[3] Adam J. Oliner, Ashutosh V. Kulkarni, and AlexAiken. Using Correlated Surprise to Infer SharedInfluence. In Dependable Systems and Networks,pages 191–200, Los Alamitos, CA, USA, 2010.IEEE Computer Society.
51


ECRAM (Elastic Cooperative Random-Access Memory)HPI Future SOC Lab Project Report March 2012
Kim-Thomas Rehmann, Kevin Beineke, Michael SchöttnerInstitut für Informatik, Heinrich-Heine-Universität Düsseldorf,
Universitätsstraße 1, 40225 Düsseldorf, GermanyE-Mail: [email protected]
Abstract
The ECRAM storage implements in-memory objectsfor data-centric cloud applications. In order tomake objects availe on shared-nothing architectures,ECRAM replicates objects. An adaptive replicationmechanism analyses object access patterns to switchdynamically between update and invalidate protocol.We have evaluated the impact of different replica-tion strategies on performance using HPI Future SOCLab’s resources. The experiments demonstrate thatadaptive replication scales better than update and in-validate replication for the applications under exami-nation.
1 Project Idea
The ECRAM project addresses current research top-ics related to storage for cloud applications. ECRAMsimulates a shared in-memory storage on shared-nothing clusters. The object-based storage providedby ECRAM is comparable to a key-value store, wherethe keys are object identifiers and the values containbinary object data. In contrast to most existing key-value stores, ECRAM increases availability by repli-cating data. It synchronizes objects optimistically inorder to allow atomic multi-object operations.ECRAM does not restrict the format of objects itstores. It neither associates any semantics with objectcontent. Applications can therefore implement row-based or column-based tables, or they can define aflexible data format, such as graph structures.Cloud applications often have read-optimized objectaccess patterns. Access patterns with prevailing readsare a benign workload for optimistic concurrencycontrol. Therefore, ECRAM implements optimisticmulti-version concurrency control using the concept ofmemory transactions. In contrast to traditional DBMStransactions, memory transactions operate on repli-cated rather than partitioned data. Replication relievesECRAM from the need to handle distributed transac-
tions. Transactions can access distributed storage, butthey always execute on a single node. The coloca-tion of in-memory storage and application code allowsECRAM to restart transactions transparently for appli-cations.By caching replicas in the application address space,ECRAM achieves zero-latency object accesses at thebest. Transparent access detection using virtualmemory hardware simplifies application development.ECRAM’s adaptive caching mechanism is able toswitch dynamically between update and invalidate se-mantics and to prefetch objects to reduce access la-tency. Adaptive caching monitors and analyses accesspatterns to predict future accesses.Our experiments on HPI Future SOC Lab resources in-vestigate the performance of ECRAM’s adaptive repli-cation on a multicore machine with huge main mem-ory. ECRAM can run on conventional compute clus-ters over TCP/IP networking as well as on a single ma-chine over the loopback network interface.
2 Future SOC Lab Resources
We are executing our experiments on a HewlettPackard ProLiant DL980 G7 Server. The server isequipped with 8 Xeon Nehalem X7560 CPUs, eachhaving 8 hyper-threaded cores. The CPU clock ratesare 2,27 GHz, the L3 caches 24 MB large, and TurboBoost is enabled. The DL980 has 128 GB of RAM.Given that our experiments run in main memory ofthe single machine, they do not use the hard disks,neither the Fibre Channel network card. The DL980boots Ubuntu Server 10.10 from a local harddisk andmounts the home file-system from a NAS device.
3 Findings
Our previous project report from October 2011 hasdocumented the initial results of running ECRAM onFuture SOC Lab. In the Winter 2011/2012 period, wehave assessed ECRAM’s performance more in detailwith a special focus on adaptive replication.
53

Figure 1. Execution time of raytracerusing ECRAM on DL980, image size1800x2400 pixels
Figure 1 shows the runtime of the raytracer applica-tion with an image size of 1800x2400 pixels and 228objects in the scene graph. The raytracer applicationis implemented using ECRAM’s framework for in-memory MapReduce [1]. In the map phase, the workernodes calculate the pixels in disjoint regions, and inthe reduce phase, the output image is produced. Theraytracer’s map phase is an embarrassingly parallelworkload, because each pixel in the output image istraced independent of any other pixel. The raytracer’sreduce phase simply collates all regions computed bydifferent nodes into the final output image. The invali-date protocol causes the reduce jobs to pull the outputfrom the map jobs, which increases the amount of syn-chronous network messages and thereby the overall la-tency. The update protocol distributes all data gener-ated to all other nodes, most of which do not accessthe data lateron. The bandwidth required to tranferthe huge amount of data limits scalability. The adap-tive replication protocol notices that the output of themap jobs is afterwards accessed by the reduce jobs.It sends updates directly from map workers to reduceworkers, which keeps the required bandwidth low andat the same time avoids synchronous requests to pullreplicas.Figure 2 shows the runtime of the KMeans applica-tion with 100,000 points in the 3D space, which aregrouped into 16 clusters. The KMeans algorithm isgenerally not so well parallelizable, because the it-erative execution often updates data. However, theadaptive replication protocol often successfully pre-dicts where data is required in the next round, so itscales better than the invalidate or update protocol.
4 Next Steps
In the context of cloud computing, network and ma-chine failures are common. Therefore, the reliability
Figure 2. Execution time of KMeans us-ing ECRAM on DL980, 100,000 points in3D space with 16 cluster centers
of distributed storage is an important research topic.Until now, ECRAM provides reliability by means ofreplication in volatile memory. We are currently work-ing on providing persistency within ECRAM by log-ging and storing objects to durable storage such asharddisks, flash memory, solid state drives and phase-change memory. Each of these storage technologieshas its own characteristics, such that persistent storageshould implement different policies for different tech-nologies. If time and resources permit, we intend toevaluate our distributed in-memory file-system, whichis based on ECRAM and FUSE, on Future SOC Lab.ECRAM enhances fault tolerance of parallel appli-cations by executing each thread in a private protec-tion domain. However, using this approach, differentthreads executing on the same machine cannot bene-fit from their colocation. OS-level IPC mechanismscould allow them to access shared data directly. Directsharing can potentially boost the performance of appli-cations on powerful multicore machines like the onesin HPI Future SOC Lab. We plan to implement directsharing techniques in ECRAM and evaluate them onFuture SOC Lab.
References
[1] Kim-Thomas Rehmann and Michael Schöttner.An in-memory framework for extended MapRe-duce. In Proceedings of the Seventeenth IEEEInternational Conference on Parallel and Dis-tributed Systems 2011 (ICPADS 2011), Tainan,Taiwan, 12 2011.
54

KONECT Cloud – Large Scale Network Mining in the CloudReport, Winter 2011/2012
Dr. Jerome KunegisWeST – Institute for Web Science and Technologies
University of Koblenz–[email protected]
Abstract
In the Winter 2011/2012 run at the Future SOC Lab,we used the KONECT framework (Koblenz NetworkCollection) to compute ten different network statisticson a large collection of downsampled versions of alarge network dataset, with the goal of determiningwhether sampling of a large network can be used toreduce the computational effort needed to compute anetwork statistic. Preliminary results show that this isindeed the case.
1. Introduction
Networks are everywhere. Whenever we look at theinteractions between things, a network is formed im-plicitly. In the areas of data mining, machine learning,information retrieval and others, networks are modeledas graphs. Many, if not most problem types can be ap-plied to graphs: clustering, classification, prediction,pattern recognition, and others. Networks arise in al-most all areas of research, commerce and daily life inthe form of social networks, road networks, communi-cation networks, trust networks, hyperlink networks,chemical interaction networks, neural networks, col-laboration networks and lexical networks. The contentof text documents is routinely modeled as document-word networks, taste as person-item networks and trustas person-person networks. Databases, the data stor-age method par excellence, are essentially complexnetwork storage engines.In fact, a majority of research projects in the areasof Web Mining, Web Science and related areas usesdatasets that can be understood as networks. Exam-ples are social networks, hyperlink networks, bipar-tite rating graphs, and many more. Unfortunately, re-sults from different papers cannot be compared easilyif they use different datasets. Therefore, the goal ofthe KONECT project is to provide a consistent accessto network datasets. To achieve this goal, KONECTcontains a large number of network datasets (about150) of all different types. This also has the advan-tage that a typical study may use several networks for
their research, since all networks offered by KONECTare provided in the same data format, which is cho-sen to be easily usable from a large number of pro-gramming language and environments. The KONECTproject also provides the code for the computation ofthe ten network statistics which we investigated in thisproject.In the run of the Winter 2011/2012 Future SOC LabCall, KONECT was used to compute statistics on alarge collection of downsampled versions of a sin-gle large social network, in order to test the feasibil-ity of sampling as a strategy to reduce the comput-ing overhead of analysing very large networks. Ourpreliminary results indicate that sampling can indeedbe used effectively to significantly reduce the compu-tational overhead when calculating many diverse net-work statistics.
2. KONECT
KONECT, the Koblenz Network Collection, is aframework for the analysis of large network datasets,as well as a collection of such datasets. KONECTcurrently contains 147 network datasets. In additionto these datasets, KONECT also consists of code togenerate statistics and plots about them, which can beviewed on the KONECT website1. Of the 147 datasets,the largest is the Twitter social network with 42 mil-lion nodes and 1.5 billion edges [2], and the smallestdataset is the metabolic network of C. elegans, with453 nodes and 4,596 edges [1]. Figure 1 shows a scat-ter plot of all network by the number of nodes and thenetwork’s density, i.e. the average degree of nodes.
3 Architecture
KONECT is both a collection of datasets and codeto generate statistics and plots, as well as a websiteshowing all these. Starting with datasets publicallyavailable on the World Wide Web, the different com-ponents of KONECT generate the standard networkformat files, compute all network statistics, generate
1konect.uni-koblenz.de
55

100
102
104
106
108
100
101
102
103
Nc
SI
PM
Shf
A@Rpa
Na
Shf
AS
Sh
PSPG
PW
HA
Pi
ADRro
Ff
IN
GC
CI
GN
M1
DGMti
Mui
Mut
RL
EL
ST
YG
TO
THc
CN
nfr
GE
AP
bfr
th
TM
PHc
GH
EU
RerSZ
ht
nds
JE
Ws
Rda
qen
bn
R2
ocbr
BX
cyEIEP
nen
lv
M2
Ow
RM
W3VutEN Sf
mde CS
Vti
benVui
Fc
Ol
gleuel
EXAM
WC
sk
vi
eo
Wti
But WK
Sc
Cut
GO
Bui
sr
CtiBti
Cui
WU
Pa
RO
Sd
DB
FG
ar
BS
Wut
caWT
SK
mfrmen
Sc
MUM3
sv
LI
TH
zh PC
PH
Pc
ER
Wui
Wa
pt
Lb
pl
Ls
nl
Fr
jaYT
ruit
es
RE
FL
WP
LJ
fr
de
Size (|V|) [vertices]
De
nsity (
d)
[ed
ge
s / v
ert
ex]
Figure 1. An overview of the size of alldatasets: all networks of KONECT ar-ranged by the size (the number of nodes)and the density (the average numberof neighbors of all nodes). Each net-work is represented by a code whosecolor corresponds to the network cate-gory (e.g., social network or hyperlinknetwork). The complete list of networksand their codes is available online atkonect.uni-koblenz.de/networks.
graphical analyses, evaluate link-prediction methodsand finally generate the KONECT website on whichall results are browsable. All code is available underthe GNU GPL on konect.uni-koblenz.de. The archi-tecture of the KONECT system consists of the follow-ing components:
• Extraction code that reads out publically avail-able network datasets from the Web and gener-ates standard-format files. The extraction code isspecific to each network extracted, and generatesdataset files in a simple, unified file format. Thisfile format is designed to be usable from withinas many programming languages as possible, andtherefore uses only text which is easy to parse,but still is flexible enough to allow for the varietyof structural properties in all network datasets.
• Analysis code to generate network statistics, in-cluding network statistics over time and variousmatrix decompositions. This code is written inMatlab and in the C++ programming language,and is optimized for scalability to very large net-works.
• Code to generate plots from the computed num-bers. This code is written in Matlab. There arecurrently more than 23,000 plots in KONECT.These include plots generated for each individualnetwork (e.g., the degree distribution) and plotscomparing all networks in this paper).
• Code that implements various link prediction al-gorithms. In different types of networks, the gen-eralized link prediction problem is known by dif-ferent names, for instance friend recommenda-tion in social networks, rating prediction in bi-partite rating graphs or trust prediction in trustnetworks. This code implements a large selec-tion of basic and advanced link prediction algo-rithms, and an evaluation of these. This allowslink prediction algorithms to be compared acrossa large number of networks, something which isdone only in a small number of studies.
• The website konect.uni-koblenz.de is finally gen-erated from the generated plots and numericalstatistics.
4 Graph Sampling
In the Winter 2011/2012 run, we used a single nodein the Future SOC Lab with 1 TiB of RAM to inves-tigate graph sampling in the following way. Samplingis the operation on a graph that consists in finding asubset of a graph such that the resulting graph can beused instead of the original graph to greatly reduce theruntime when computing network statistics such as thenetwork diameter or spectral norm.Taking a very large graph dataset containing 200 mil-lion edges, we computed samplings of it containingfrom 5% to 100% of all edges, in steps of 5%. Foreach sample size, we generated twenty different sam-plings randomly, and computed all KONECT networkstatistics for them. As a result, we can observe bywhat amount the individual statistics are changed bythe sampling, and thus whether sampling will affectthe statistics, and if it does, in what way.Preliminary results are given in Figure 2. As prelimi-nary observations, we can cite the following:
• The effective diameter is not affected by a sam-pling of at least 60% of all edges.
• The spectral norm is affected in a linear fashionwith respect to the sampling coefficient.
• The size of the largest connected component, thecontrollability, the (normalized) degree distribu-tion entropy and the power-law exponent are af-fected by sampling, but in a very predictable way.
We plan to publish these and other results in order togive network researchers tools to analyse very largenetworks with computing ressource smaller than thoseavailable at the Future SOC Lab.
5. Conclusion
We thus conjecture that graph sampling can be usedto make the computation of certain network statistics
56

0 20 40 60 80 100Sampling
0.00
0.05
0.10
0.15
0.20
0.25
0.30
0.35
0.40
clusco
ibm-flat -- clusco
EE+3sigmaE-3sigmaMaxMin
(a) Clustering coefficient
0 20 40 60 80 100Sampling
485000
490000
495000
500000
505000
510000
coco
ibm-flat -- coco
EE+3sigmaE-3sigmaMaxMin
(b) Largest connected component
0 20 40 60 80 100Sampling
0
5000
10000
15000
20000
25000
30000
35000
controlla
bility
ibm-flat -- controllability
EE+3sigmaE-3sigmaMaxMin
(c) Controllability
0 20 40 60 80 100Sampling
0.00
0.01
0.02
0.03
0.04
0.05
0.06
0.07
dentropy
+1.267e1 ibm-flat -- dentropy
EE+3sigmaE-3sigmaMaxMin
(d) Degree distribution entropy
0 20 40 60 80 100Sampling
0.9670
0.9675
0.9680
0.9685
0.9690
0.9695
dentropy
n
ibm-flat -- dentropyn
EE+3sigmaE-3sigmaMaxMin
(e) Normalized degree distribution entropy
0 20 40 60 80 100Sampling
3.5
4.0
4.5
5.0
5.5
6.0
6.5
7.0
7.5
8.0
diam
eter
ibm-flat -- diameter
EE+3sigmaE-3sigmaMaxMin
(f) Effective diameter (90 percentile)
0 20 40 60 80 100Sampling
0.634
0.635
0.636
0.637
0.638
0.639
0.640
gini
ibm-flat -- gini
EE+3sigmaE-3sigmaMaxMin
(g) Gini coefficient of degree distribution
0 20 40 60 80 100Sampling
0.260
0.261
0.262
0.263
0.264
0.265
0.266
own
ibm-flat -- own
EE+3sigmaE-3sigmaMaxMin
(h) Balanced inequality ratio
0 20 40 60 80 100Sampling
1.20
1.22
1.24
1.26
1.28
1.30
1.32
1.34
1.36
1.38
power
ibm-flat -- power
EE+3sigmaE-3sigmaMaxMin
(i) Estimated power-law exponent
0 20 40 60 80 100Sampling
0
5000
10000
15000
20000
25000
30000
35000
40000
snorm
ibm-flat -- snorm
EE+3sigmaE-3sigmaMaxMin
(j) Spectral norm
Figure 2. The results of graph sampling. Each plot represents one network statistic, andshows the sampling coefficient (i.e., the amount of retained edges) on the X axis, and themeasured network statistic on the Y axis.
57
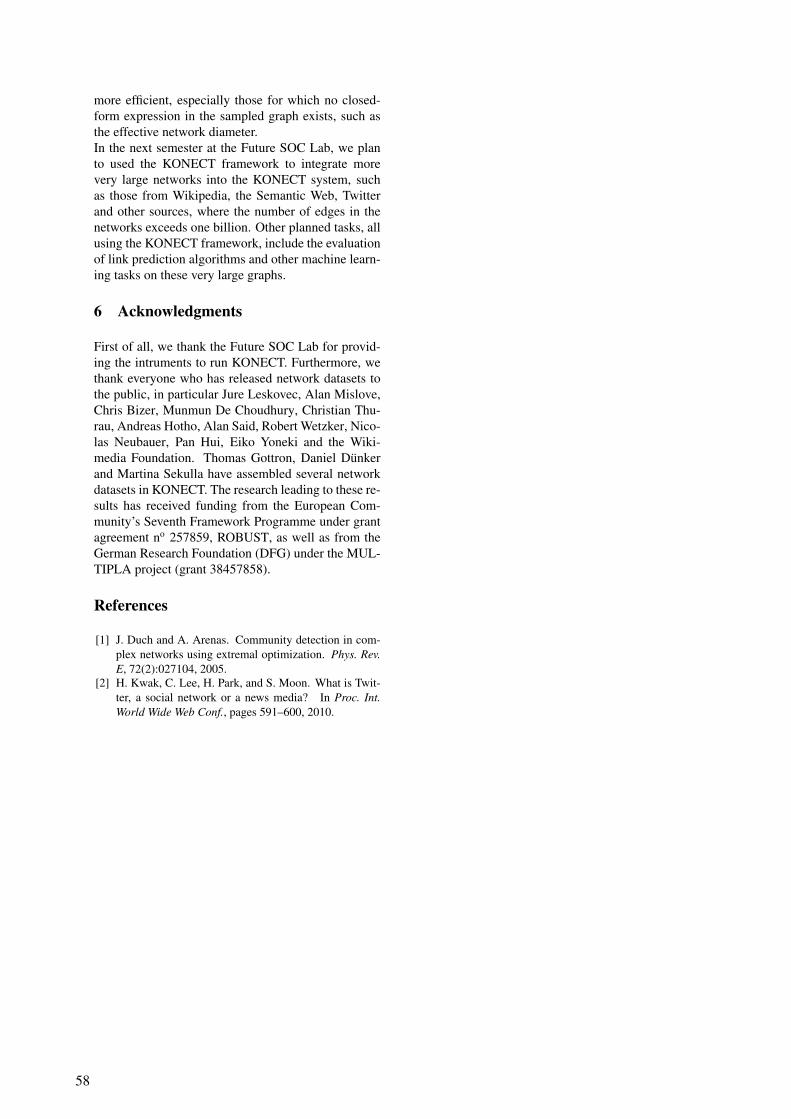
more efficient, especially those for which no closed-form expression in the sampled graph exists, such asthe effective network diameter.In the next semester at the Future SOC Lab, we planto used the KONECT framework to integrate morevery large networks into the KONECT system, suchas those from Wikipedia, the Semantic Web, Twitterand other sources, where the number of edges in thenetworks exceeds one billion. Other planned tasks, allusing the KONECT framework, include the evaluationof link prediction algorithms and other machine learn-ing tasks on these very large graphs.
6 Acknowledgments
First of all, we thank the Future SOC Lab for provid-ing the intruments to run KONECT. Furthermore, wethank everyone who has released network datasets tothe public, in particular Jure Leskovec, Alan Mislove,Chris Bizer, Munmun De Choudhury, Christian Thu-rau, Andreas Hotho, Alan Said, Robert Wetzker, Nico-las Neubauer, Pan Hui, Eiko Yoneki and the Wiki-media Foundation. Thomas Gottron, Daniel Dunkerand Martina Sekulla have assembled several networkdatasets in KONECT. The research leading to these re-sults has received funding from the European Com-munity’s Seventh Framework Programme under grantagreement no 257859, ROBUST, as well as from theGerman Research Foundation (DFG) under the MUL-TIPLA project (grant 38457858).
References
[1] J. Duch and A. Arenas. Community detection in com-plex networks using extremal optimization. Phys. Rev.E, 72(2):027104, 2005.
[2] H. Kwak, C. Lee, H. Park, and S. Moon. What is Twit-ter, a social network or a news media? In Proc. Int.World Wide Web Conf., pages 591–600, 2010.
58

Integrated Management Support with Forward Business Recommendations
Prof. Dr. Rainer Thome Dipl.-Kff. Patricia Kraft
Chair in Business administration and business computing Joseph-Stangl Platz 2
97070 Würzburg [email protected] [email protected]
Dr. Andreas Hufgard Dipl.-Kff. Stefanie Krüger
IBIS Labs Mergentheimer Str. 76a
97082 Würzburg [email protected]
Abstract
Data provisioning plays an increasingly
pivotal role in business today. Decision-
makers need relevant information at their
fingertips in time to make well-informed,
sustainable decisions. The Forward Busi-
ness Recommendations approach attempts
to provide just this. The team at IBIS Labs
would use a project extension to analyze
various scenarios to find an optimum bal-
ance between user benefit and practicabil-
ity.
1 Rule based Business Matrix Pro-
cessing and Forward Business Rec-
ommendations
The primary object at project launch was to create a rule base that could be used to ex-tract relevant information from the ERP system. This original idea formed the foun-dation of Rule based Business Matrix Pro-cessing, which defined processes whose sequence and results were monitored with the aid of these rules.
The next phase consisted in applying For-ward Business Recommendations to forecast potential problems and future business op-portunities. One example is the order-to-cash process. It analyzes opportunities and their impact on future stock and liquidity levels, and on project deadlines, to deliver
vital information early on, so decision-makers have ample time to respond. For instance, if FBR forecast a liquidity squeeze, management could trigger redeployment of capital or arrange for loan negotiations with the bank before liquidity levels plummeted. The organization would gain flexibility, which would enable decision-makers to avert critical situations. Processes are simi-lar in every business, but companies’ dis-similarities must also be modeled in a rule base. For this reason, the project team ex-plored customization options and integrated them into the prototype, where appropriate.
The FBR prototype contains a model of the opportunity-to-production process. It was conceived using tools from the SAP Busi-ness ByDesign solution and implemented externally, because in the beginning stages, direct integration into ByDesign was not possible. Team members therefore utilized the vast capabilities offered by SAP ByDesign Excel Add-in’s integrated data export to deposit corresponding rule logic outside of ByDesign.
The upshot: the prototype furnishes a con-crete recommendation for each opportunity already contained in ByDesign and each new one entered. It suggests how decision-makers should best handle this specific op-portunity and reveals effects on the compa-ny’s future development. For example, if decision-makers receive an opportunity and
59

the organization has all components for it in stock, the prototype will recommend offer-ing a discount as an incentive and so, in-crease the probability of implementing this opportunity. When sales reps meet with a client, they cannot know current and future stock levels for all products. Often sales reps are not even authorized to view this infor-mation. In this way, reps receive the vital information in the form of a recommenda-tion, without having to search through data from other user departments.
2 Status quo
The prototype was recently upgraded to be compatible with the new SAP ByDesign release FP 3.0. This enabled the project team to test new options available in the current release and their relevance to the prototype. Furthermore, team members examined the possibilities in the ByDesign Studio devel-opment environment, Software Developer Kit (SDK). They also gained valuable in-struction and project experience by develop-ing enhancements in SAP Business ByDesign.
3 Current developments
The project team is currently working to design an integrated solution for the FBR prototype. Creating a solution that can work within ByDesign would afford a great num-ber of advantages but would also have a few disadvantages.
3.1 Advantages
One advantage of development using SAP ByDesign Studio is that the solution is inte-grated into the original product. The user would not notice a difference between the core ByDesign system and the app, because everything would have the same look and feel.
Besides being more user-friendly, integra-tion with ByDesign would be a huge ad-
vantage. It would shorten communication channels and vastly increase possibilities for data exchange between user departments. Whereas an external solution requires that data be made available to it, an internal solu-tion could independently trigger a targeted revaluation whenever a change was made to the data pool (as an extreme example), and so, deliver up-to-the-minute data. This de-gree of currency is a decisive factor in day-to-day business.
3.2 Disadvantages
While the advantages mentioned are great, it is important to remember that the conditions for internal ByDesign solutions are very strict. In some cases, users have access to a larger body of data when the solution is ex-ternal, rather than integrated. The Public Solution Model (PSM) includes data sources accessible to the public and SAP has re-leased only these data sources for use in apps.
In addition, the ERP system’s rigid division into work center views makes it more diffi-cult to integrate FBR. The team will address this problem and implement a workable so-lution in the next project phase (see Section 4).
3.3 Evolving the new app
In summary, the project team has completed the design of the prototype, revision of the first set of rules and definition of possibili-ties in ByDesign Studio. The team can now move to the next phase, in which it evolves the prototype into an app.
4 Next steps and required resources
The following project phase is divided into two stages. The first stage consists in evalu-ating each of the scenarios and weighing costs and benefits. This includes analyzing usage in the scenarios for each user group and comparing practicability of the scenari-os.
60

4.1 Scenario 1: Integrated alarm function
The first scenario offers the greatest poten-tial for integration. The developers will try to generate alarms, warnings and notifica-tions in the background. A notification will appear on the screen only when a significant incident occurs. However, this solution can-not be employed using ByDesign Studio in its current release, because ByDesign Studio has no back-end access, and background operations require deliberate user interac-tion. This solution would be the most con-venient for the user, since s/he would re-ceive the recommendation and a concrete reference without having to actively search for the data. For example, if during a specific period a very high-volume opportunity generated a critical liquidity level as a result of related purchase orders, the manager could be alert-ed to this as soon as the opportunity was created, so that s/he could take appropriate action. This would greatly increase the com-pany’s flexibility and ensure certainty with respect to company resources.
4.2 Scenario 2: Work center-oriented
This scenario addresses the work centers. A monitoring function would be deployed in a specific location in the system and used equally by all employees. A new work cen-ter view would appear within an existing one. For example, the New Business work center view might appear with reference to opportunities. Alternatively, the Purchase Orders and Purchase Requisitions work cen-ter view might pop up when purchase orders needed to be executed ASAP in order to implement a last-minute opportunity that promises high probability.
4.3 Scenario 3: User-oriented
The third scenario addresses individual us-ers. If a change were made in their applica-tion area that could influence their actions, they would be notified of the change. This could be done by inserting an activity over-view (Figure 1) on the start screen. In this scenario, as in the first, back-end processing presents a problem. If these obstacles were not present, it would be possible for the sys-tem to send a message to the user when, for example, s/he needs to deal with a certain opportunity that cannot be implemented.
Figure 1: ByDesign Work Center Home - Inbox
61

4.4 Scenario 4: Central work center-
oriented
The fourth and final scenario is the easiest to implement. It consists in creating a separate, centralized work center in which all data is grouped as in the Corporate Performance work center (Figure 2). However, this view would be developed for management, who would then pass on the necessary recom-mendations and instructions to the respec-tive employees. One drawback is that execu-tives would be the only ones furnished with an overview of the entire organization. Business processes would not be supported directly at transaction level.
4.5 Required resources
Finally, the question of necessary resources remains. To deploy the prototype in ByDesign, the project team requires a ByDesign system with a connection to SDK. It would be best to use the latest version of ByDesign Studio (FP 3.5) because of marked programming improvements. Up to now the team has had access to a ByDesign Studio based on release FP 3.0. But because of the Public Solution Model, far fewer de-velopment options are possible.
Figure 2: ByDesign Corporate Performance work center
62

Service-Based 3D Rendering and Interactive 3D Visualization
Benjamin Hagedorn Hasso Plattner Institute for
Software Systems Engineering Prof.-Dr.-Helmert-Str. 2-3 14482 Potsdam, Germany
Jürgen Döllner Hasso Plattner Institute for
Software Systems Engineering Prof.-Dr.-Helmert-Str. 2-3 14482 Potsdam, Germany
Abstract
This short report describes our work in the context of the HPI Future SOC Lab. This work generally aims on exploiting high performance computing (HPC) capabilities for service-based 3D rendering and service-based, interactive 3D visualization. A major focus is on the application of HPC technologies for the creation, management, analysis, and visualization of and interaction with virtual 3D environments, especially with complex 3D city and landscape mod-els.
1 Latest Work and Results
During the last project phase, the Computer Graphics Systems group at the HPI did continue its research and development on fundamental concepts and tech-niques in the area of service-based 3D rendering and service‐based, interactive 3D visualization. The tech-niques developed so far rely on and take advantage of multi‐core/multi‐threading processing capabilities, the availability of large memory, and GPGPU sys-tems as provided by the HPI Future SOC Lab.
1.1 Massive Texture Processing We successfully continued our research on the pro-cessing of very large 3D city model data (including massive 3D geometries and 2D texture data) and its service-based and image-based visualization and distribution [1]. Especially, we experimented on the optimization of workflows and tools for the prepro-cessing of large sets of raster data by parallel compu-tation and usage of massive main memory. Based on earlier work on generally reducing processing times, we have been able to enhance our algorithms for the preprocessing and optimization of massive texture data, which forms a major input for high-quality 3D rendering techniques. Through this, we could dramat-ically increase the visual quality of the rendering output leaving the texture data footprint nearly the same.
1.2 Web View Services Also, the Future SOC system forms part of the im-plementation of an experimental web view service currently developed within an ongoing international initiative at the Open Geospatial Consortium OGC. As one milestone in that context, the so called OGC 3D Portrayal Interoperability Experiment has been finished in September 2012 and results have been published as an OGC Public Engineering Report [2].
2 Next Steps
To continue our research in the area of ser-vice‐based 3D rendering and service‐based, interac-tive 3D visualization, we would like to continue our scientific work using the Future SOC Lab. In particular, we will continue our research on server-based 3D rendering techniques as well as on design and construction of service‐based, cloud-enabled systems for interactive real‐time 3D visualization. For example, we are planning to continue our work to research and development on service-based technol-ogies for assisted interaction and camera control in massive virtual 3D city models. Based on previous work in exploiting the Future SOC Lab capabilities for processing massive 3D point cloud data (such as generated through laser scanning), we are planning to design and implement a fast technique and system for automatically classifying large 3D point clouds. Also, we also planning to extend our work on processing spatially related data to the preprocessing, and on-demand exploration and analysis of 3D trajectory information (such as flight information data).
References [1] J. Döllner, B. Hagedorn, J. Klimke: Server-Based
Rendering of Large 3D Scenes for Mobile Devices Using G-Buffer Cube Maps. 17th Int. Conference on 3D Web Technology, 2012.
[2] B. Hagedorn, Ed.: “Web View Service Discussion Paper, Version 0.3.0, OGC 09-166r2.” Open Geospa-tial Consortium Inc., 2010.
63


Smart Wind Farm Control
Patrick Böwe University of Oldenburg
Department of Computing Science Uhlhornsweg 84
D-26129 Oldenburg [email protected]
Ronja Queck University of Oldenburg
Department of Computing Science Uhlhornsweg 84
D-26129 Oldenburg [email protected]
Michael Schumann University of Oldenburg
Department of Computing Science Uhlhornsweg 84
D-26129 Oldenburg [email protected]
Deyan Stoyanov University of Oldenburg
Department of Computing Science Uhlhornsweg 84
D-26129 Oldenburg [email protected]
Benjamin Wagner vom Berg University of Oldenburg
Department of Computing Science Uhlhornsweg 84
D-26129 Oldenburg [email protected]
Abstract
The occurrences of fossil sources of energy are re-stricted and the energy extraction gets more and more expensive. In order to meet the energy demand in the long term, renewable energy technologies are promoted. Most notably, wind energy plays a central role in this context. The number of installed and operating wind turbines has risen rapidly over the past years. There are two types of wind farms – on-shore and offshore. One of the biggest cost-factors of both types is maintenance. While onshore wind farms are relatively easy to maintain, offshore wind farms cause high maintenance costs. There are a variety of reasons for this: restricted means of transportation, dependency on meteorological conditions and a more complex supply chain. The project Smart Wind Farm deals with the identifi-cation of average lifetimes of the individual compo-nents of wind turbines in order to optimize the maintenance work for the offshore sector. By using different analyses, the current condition and approx-imate remaining lifetime of the wind turbine compo-nents shall be identified. This knowledge can be used to replace components with a short remaining life-time proactively in a routine maintenance. This way, unscheduled repairs can be minimized.
SAP HANA will be used in a different context to realize these goals. Normally, in-memory technology (and Business intelligence in general) is used in the business domain. In this project, SAP HANA is ap-plied by engineers.
1 Wind Farms
Against the backdrop of global challenges like cli-mate change, growing energy demand, constantly rising prices for primary fossil fuels as well as the Fukushima nuclear disaster, renewable energies are providing an increasingly important contribution to the energy sector [1]. In the Federal Republic of Germany, the last nuclear power plants will be de-commissioned by the end of 2022. Until then, the renewable energies will become the supporting pillar of the future energy supply, making up at least 35 percent of the energy mix. In the year 2050, 50 per-cent of the energy mix will be created by renewable energies [2]. Energy scenarios have shown that wind energy will play a central role in generating electrici-ty in 2050. This requires a massive expansion of wind energy plants, and offshore wind parks in par-ticular. Wind energy offers the most economic and effective potential for expanding renewable energies in the short and medium term [3]. Hence, the number
65

of wind turbines has risen rapidly over the past years (see Figure 1). Generally, the capacity of a wind turbine (WT) is defined by its rotor diameter. The rotor diameter determines the proportion of the wind flow which is available to the WT for conversion into electric ener-gy. The energy of the wind flow rises to the third power to the wind speed, which increases with the height above ground level. By building higher tow-ers, the turbines can use increased wind speed and thus realize a higher return. In order to evaluate and compare wind turbines, the annual energy supply is related to the rated output. This number is called full load hours and depends on the local conditions [5].
Figure 1: Annual onshore and offshore installa-tions in MW [4] A distinction is made between offshore and onshore wind farms. Onshore wind farms are located on the main land and can be subdivided into landscape cate-gories. A normal onshore wind turbine produces 2 to 3 MW. The German average for a new WT is be-tween 1552 and 1667 full load hours. All German WTs which were built before 2002 are qualified for repowering. Repowering means the replacement of older wind turbines with more modern multi-megawatt machines. Offshore wind farms are located at sea. Modern off-shore wind turbines produce around 5 MW. Because of increased average wind speed, the revenues are a lot higher than on the main land. Offshore wind farms can generate between 3000 to 4500 full load hours [5].
2 Maintenance of Wind Turbines
Wind turbines have a planned lifespan of 20 years. During this period, many main components have to be maintained or replaced. The maintenance of offshore WTs is a lot more prob-lematic than onshore WTs, because they can only be reached by ship and helicopter. Therefore, offshore maintenance causes costs which are six times higher than those on the mainland [1].
For ships, the wave height determines significantly the access of an offshore wind turbine. Usually, weather conditions with a wave height above 1.5 m are called “weather days”, because the WTs cannot be reached hazard-free. The annual number of “weather days” for different German offshore wind farms is shown in Figure 2 [5].
Figure 2: Accessibility of offshore wind farms [5] In addition to the above-mentioned difficulties (re-stricted means of transportation and dependency on meteorological conditions), offshore maintenance also has a more complex supply chain. It is very important to ensure a reliable and cost-efficient parts supply. Since the topic of offshore wind farming is still very new, it has not been possible to standardize any maintenance concepts yet. The long-term relia-bility of wind turbines is still unknown. Hence, no spare part storage concept from other industries may be adopted [1].
3 Objective Target
The main objective target is to develop a wind farm management maintenance system based on new tech-nologies and scientific approaches. The principal objective targets of this system can be separated into the following topics: Proactive management system The proactive management system intends to evalu-ate all relevant physical values, which are provided by the offshore wind park. Real-time monitoring and reporting should be based on a dataset containing 400 records per second per turbine. Particularly, the use of any averages for faster calculations as well as the reduction of storage space like in other systems has to be avoided. Furthermore, the system should pro-vide an automated error detection and error classifi-cation unit. Realistic forecasts for the cost/income ratio Based on the large amount of physical values and supplementary data, like historical data or mainte-nance efforts, a more realistic cost/income ratio fore-cast should be developed.
66

Exact forecasts for maintenance periods Focusing on the turbine maintenance, the target is to forecast lifetime estimation and breakdowns. Fore-cast reports and pre-alerting for all turbine compo-nents should be created automatically by the system. Based on different researches in this area, it is possi-ble to develop algorithms which make the system able to generate these reports and alerting using weather data, resource data, operational data and maintenance history data. On demand statistic functions for physical re-search Resting on new database technologies, more complex analyses can be executed on a larger dataset. Finally, the period of computation is shorter. Thus, faster responses are possible to improve the workflow in research, like developing algorithms or analyzing complex diagrams.
4 Reasons to Use SAP HANA for this Project
The main task of the proactive maintenance of off-shore turbines is to calculate the average remaining life expectancy. As mentioned in chapter 3, the cur-rent analyses are performed on aggregated data, alt-hough more granular data could lead to more precise calculations. An advantage is that the 400 sensors of the wind turbine are already delivering data on a per second basis. In order to analyze this data set, which is increased by a factor of 600 compared to aggregat-ed data on a 10 minute basis, SAP HANA has to be used. By using SAP HANA, the creation of OLAP cubes can be omitted. Hence, more data can be analyzed and new analyses can be performed directly on the data. SAP HANA offers the possibility for the engi-neers to create new analyses, test them directly and subsequently continue their work with new findings. SAP HANA and Business Intelligence Tools will be used to achieve the objective targets of the Smart Wind Farm Control project. The use of these infor-mation technologies for optimization and support of science/engineer researches makes this project unique.
5 New Insights
One of the first insights gained from working with SAP HANA is the easy handling as well as the clean and organized layout. It offers many interfaces to integrate its in-memory technology into almost any IT landscape. The project group has developed a virtual wind farm in order to simulate sensor data. This data source can be connected to SAP HANA via JDBC. Consequently, it is possible to simulate work-flow conditions, like real-time data transfer process-es. Besides storing this operational data, it is also used as a source for analytical processes. This way, one of the most important features of the product SAP HANA can be used – one database containing transactional and analytical processes. However, there are some features which are not sup-ported by SAP HANA at the moment. A crucial aspect of the maintenance of wind farms is alerting. This feature is only possible when using worka-rounds with 3rd party software. Hopefully, SAP HANA will integrate this feature in future releases. SAP HANA should not be used for simple reporting or data storage but instead for complex workflows, calculations and evaluations. Otherwise, the in-memory technology just leads to resource waste because there are no actual added values. SAP HANA offers benefits when the amount of data to be processed is very large and it is used for both transac-tional and analytical processes. Furthermore, in-memory technology enables real-time reporting [6].
6 Further Steps and Outlook
Currently, the project group has only limited access to real data and has to use a virtual wind farm to simulate the data sets instead. The project group is conducting negotiations with the companies ForWind and ENBW in order to receive larger data sets. Once the larger data sets are inserted into SAP HANA, different analyses can be tested. As men-tioned in chapter 5, HANA offers no alerting func-tion. Therefore, the project group is implementing a workaround in a Java environment. The proactive maintenance can only be fully tested on real data sets. As soon as those are given, these analyses will have to be refined. If the data sets con-tain information on the repair and replacement of the individual components, the results can be checked. The project group could then calculate the improve-ment rate of their analyses compared to currently applied procedures.
67

References [1] J. Westerholt: Entwicklung eines Ersatzteilbevorra-
tungskonzeptes für die Instandhaltung von Offshore Windenergieanlagen. Diplomarbeit. Bremen, 2012.
[2] D. Böhme, W. Dürrschmidt, M. van Mark, F. Musiol, T. Nieder, T. Rüther, M. Walker, U. Zimmer, M. Memmler, S. Rother, S. Schneider, K. Merkel: Erneu-erbare Energien in Zahlen - Nationale und internatio-nale Entwicklung. Bundesministerium für Umwelt, Naturschutz und Reaktorsicherheit. 1. Auflage, Berlin, 2012.
[3] Bundesministerium für Wirtschaft und Technologie: Energiekonzept für eine umweltschonende, zuverlässi-ge und bezahlbare Energieversorgung. Niestetal, 2010.
[4] J. Wilkes, J. Moccia, M. Dragan: Wind in power – 2011 European statistics. European wind energy asso-ciation. 2012
[5] S. Pfaffel, V. Berkhout, S. Faulstich, P. Kühn, K. Linke, P. Lyding, R. Rothkegel: Windenergie Report Deutschland 2011. Fraunhofer Institut für Windener-gie und Energiesystemtechnik. Kassel, 2012.
[6] SAP HANA http://www.sap.com/solutions/technology/in-memory-computing-platform/hana/overview/index.epx
68

Measurement of Execution Times and Resource Requirements for single us-er requests
Alexandru Danciu Technische Universität München Chair for Information Systems
Boltzmannstr. 3, 85748 Garching, Germany
Helmut Krcmar Technische Universität München Chair for Information Systems
Boltzmannstr. 3, 85748 Garching, Germany
Abstract
In an ERP environment with limited resources and imposed service levels, user requests have to be scheduled according to their priority and expected response time. For predicting the response time of an incoming user request, the impact of the request on the resource consumption has to be known. Measuring the impact of single user requests on the hardware resource consumption represents a diffi-cult challenge, especially in a production ERP envi-ronment. The reason is that a large amount of re-quests are processed at any time. Therefore only the impact of the whole set can be observed. The se-quential execution and measurement of single user requests in an experimental ERP environment would be very time consuming. This research proposes an approach for measuring the execution times and resource requirements of single user requests in an ERP environment.
1 Introduction
Enterprise resource planning (ERP) systems support the execution of business processes within large companies. Because their performance, availability and scalability are very critical for companies, these systems are often implemented as distributed systems [5]. A prerequisite for exploiting the advantages of distributed computing is the allocation of resources based on the system load [1]. Scheduling algorithms require information on the execution time of each incoming request [4]. Information on the resource requirements of requests is desired for load balanc-ing purposes [2]. The goal of this research is the development of an approach for measuring the execution times and resource requirements of single user requests.
2 HPI Future SOC Lab resources
During this research the hardware and software re-sources of the HPI Future SOC Lab were not used at all. Instead, several interviews were conducted with performance management experts from SAP AG. The interviews first aimed at the elicitation of func-tional and non-functional requirements for measur-ing the response times and resource requirements of requests in productive ERP environments. Based on the identified requirements, existing means for measuring these performance metrics in the context of SAP ERP systems were evaluated.
3 Conclusions
This research identified the tools for measuring re-sponse times and resource requirements supported by SAP ERP systems which are most suitable for pro-ductive environments. Using distributed statistical records, performance measurements such as executions time and resource utilization can be collected across multiple heteroge-neous systems for each request. This type of moni-toring is a standard functionality even in productive system and does not influence the measured values. The main challenge identified during this research is the operationalization of the term request and the mapping of requests to user activities. To overcome this challenge, we will focus on user interactions via external RFC and web service calls. This way, a function or web service call can be mapped directly to a user activity. An important limitation of the proposed approach is the lack of a measurement for the I/O caused by sin-gle requests. Using distributed statistical records it is possible to measure the database calls, but not the file and network I/O.
69

4 Further work
Further research is based on the assumption that resource requirements and execution times of activi-ties depend on the context, e.g. the input parameters and environmental factors like tasks executed in parallel. We will focus on the development of an approach for estimating the response times and re-source demands for incoming user requests. Tech-niques for identifying correlations between the input parameters and the performance of single requests will be identified in literature. The proposed ap-proach will be instantiated in a SAP landscape. Fi-nally, the approach will be evaluated. The evaluation will be performed using multiple methods based on [3]. First an analytical evaluation - an architecture analysis - will be performed to evaluate the ability of integrating the approach in system landscapes. Second, a controlled experiment will be used to evalu-ate the prototypical implementation of the approach. The feedback provided by the evaluation will be used to improve the approach.
References
[1] Casavant, T.L.; Kuhl, J.G. (1988): A taxonomy of scheduling in general-purpose distributed computing systems. In: IEEE Transactions on Software Engi-neering, Vol. 14 (1988) No. 2, pp. 141-154.
[2] Devarakonda, M.V.; Iyer, R.K. (1989): Predictability of process resource usage: a measurement-based study on UNIX. In: IEEE Transactions on Software Engineering, Vol. 15 (1989) No. 12, pp. 1579-1586.
[3] Hevner, A.R.; March, S.T.; Park, J.; Ram, S. (2004): Design science in information systems research. In: MIS Quarterly, Vol. 28 (2004) No. 1, pp. 75-105.
[4] Iverson, M.A.; Ozguner, F.; Potter, L. (1999): Statis-tical prediction of task execution times through ana-lytic benchmarking for scheduling in a heterogeneous environment. In: IEEE Transactions on Computers, Vol. 48 (1999) No. 12, pp. 1374-1379.
[5] Yung-Terng, W.; Morris, R.J.T. (1985): Load Sharing in Distributed Systems. In: IEEE Transactions on Computers, Vol. C-34 (1985) No. 3, pp. 204-217.
70

Future SOC Lab Spring Term Project Activities Report:
Benchmarking for Efficient Cloud Operations
Multitenancy Project Team SAP Innovation Center Potsdam
Prof.-Dr.-Helmert-Str. 2-3 14482 Potsdam, Germany
Abstract
This project’s main focus in the now-ending lab term
was on the efficiency of cloud services provided in a
multitenant environment. Several approaches to
multitenancy have been implemented and evaluated
using a multitenant-variant of the CBTR (Composite
Benchmark for Transactions and Reporting) bench-
mark. Tenant workloads were varied in intensity and
composition (analytical and transactional shares)
and the effects on throughput and response time were
measured. The results allowed interesting insights
into the behavior of the approach implementations,
but have been classified as company confidential and
therefore must not be presented in this report. A
proposal for continuation of this project in the com-
ing lab term concludes this short report.
1 Report
The idea behind the cloud is to offer computing as a service with seemingly endless capacity that can be added or removed on demand [1]. The cloud custom-er keeps the data inside the cloud infrastructure and has access to the performance of a data center to execute complex operations on it. Through the net-work, data can be accessed in an easy way with vari-ous devices.
Cloud computing turns the IT investments of companies that move into the cloud into operational expenditures that they pay for the consumed services to a cloud provider. Consequently, the risk of correct-ly dimensioning the infrastructure as well as the need to keep capital expenditures as well as administrative costs at viable levels is transferred to the cloud pro-vider. Multitenancy, i.e. consolidating several cus-tomers onto the same infrastructure, is one method to achieve higher utilization and therefore a more effi-cient cloud operation. [2]
In the now-ending lab term this project investigat-ed several ways of accomodating several customers on one server, such as shared machine, shared data-base process, and shared table [2]. These approaches were compared with respect to their effect on throughput and on response time using two server machines of the Future SOC Lab. One served as database server (32 cores) and the second one as client machine (64 cores) from which the client re-quests were submitted and where the performance were measured.
The experiments employed CBTRmt, our mul-titenancy extension of CBTR, which is a mixed-workload benchmark based on SAP’s Order-to-Cash process [3] comprising four analytical-type queries and nine transactional-type queries. Our extension allowed us to simulate a larger number of client or-ganizations (for most experiments we selected 20 tenants) with various data sizes and request behavior in a highly concurrent manner.
In a first batch of experiments, we used analytical load, then added transactional load (20% and 80% share) and finally simulated time zone-diverse tenant localizations, i.e. not all tenants were active at all times, but followed an overlapping diurnal load pat-tern with one group entering night time while the other group woke up.
The results that we gathered allowed interesting insights into the approach implementations and their effect on system performance, but have been classi-fied as company confidential and therefore must not be detailed in this public report.
2 Project Proposal for Next Lab Term
In the coming lab term we would like to continue our investigations for a further approach to realize mul-titenancy based on the virtualization platform Xen.
3 Acknowledgements
The project members wish to thank Bernhard Rabe of Future SOC Lab/HPI for his invaluable administra-tive support to setup and run the numerous experi-ments that were conducted as part of the project.
4 References
[1] Peter Mell, Timothy Grance: The NIST Definition of
the Cloud Computing. NIST Special Publication 800-145. 2011.
[2] Dean Jacobs, Stefan Aulbach: Ruminations on Multi-
Tenant Databases. BTW 2007: 514-521
[3] Anja Bog, Hasso Plattner, Alexander Zeier: A mixed
transaction processing and operational reporting
benchmark. Springer Science + Business Media, LLC 2010.
71


Instant Intrusion Detection using Live Attack Graphs and Event Correlation
Amir Azodi, David Jaeger, Feng Cheng, Christoph Meinel
Hasso Plattner InstituteUniversity of Potsdam
14482, Potsdam, Germany
{amir.azodi, david.jaeger, feng.cheng, meinel}@hpi.uni-potsdam.de
Abstract—Today, with the growing complexity of computer networks and companies dependence on such networks, se-curing them is more important than ever. Intrusion Detection systems have become a necessary tool to protect networks and privileged data from falling into the wrong hands. However IDS systems are limited by the amount of environmental information they process; including network and host infor-mation. Additionally the speed at which they receive such information can have a tremendous effect in the time needed to detect attacks. We have pinpointed three areas of Event Normalization, Alert Gathering and Event Correlation, where improvements can lead to better and faster results produced by the IDS.
I. INTRODUCTION
The current state of IDS systems does have some weak-nesses. One of the biggest problems is the inability to detect some of the more complex attacks; due to lack of access to the information which would have led to a successful detection. An underlying reason for this problem is the limitations of the viewpoint of any single sensor in the network. An example of such a scenario is the access to log files. Log files can contain large amounts of information regarding any attempts to breach security of a system. This problem becomes more evident when application logs are considered. The possibility to correlate between events gathered from different logs and systems, provides a unique level of access to information needed to detect the more advanced and well hidden attacks [3].
The rest of this report is organized as follows.• Review of HPI Security Analytics Lab: In this section
an overview of the legacy Security Analytics Lab (SAL)is given as background information.
• Updates - Design and Architecture: This section out-lines the changes that were made to the legacy SALsystem in order to incorporate new features and possi-bilities for detecting attacks.
• Leveraging Live Environment Information for InstantAttack Detection: This section describes the gatheringof information in order to generate a sound and com-plete network graph to be used in conjunction with a
comprehensive vulnerability database for the generationof a live attack graph.
• Extracting Attack Activities from Logging Information:Discusses the methods behind extracting all possiblelog information and to normalize them into one singleformat.
• Results and Achievements: In this section particularattention is given to the deliverables and completedobjectives of the new phase, so far.
II. REVIEW OF HPI SECURITY ANALYTICS LAB
The SAL represents a system to encounter the challenges and provide a high level of security in a network. Different Log Gatherers and IDS Sensors provide a variety of data sources for the complex analysis on the In-Memory based platform. A multi-core-supporting architecture is the foun-dation for high performance as well as real-time and forensic analysis. Using efficient algorithms and various visualization techniques supports security operators with the challenging task of defending the network by identifying and preventing attacks [2].
The present deployment of SAL on the FutureSOC Labhas the following features listed below. This is a featurefreeze instance and excludes the latest changes implementedinto SAL. The latest changes will be added as part of thenext deployment phase throughout the next six months.
• Detection of complex attack scenarios• In-Memory based platform with up to 2 TB of main
memory• Multi-Core support with thousands of cores• Correlation of events from a variety of data sources• Utilization of environment information represented by
attacks graphs• Ranking of complex alert dependency graphs• Visualization of attack scenarios and complex alert
relations
III. UPDATES: DESIGN AND ARCHITECTURE
The new design follows the 3 level architecture or chainof command system. First there is a component named
73

Enforcer/Gatherer, which is in charge of gathering andsending information relating to the host it is installed on.This information includes log files, system data such asinstalled software, available hardware and system status.At the second level a component named Agent receivesthe information from the Enforcer and normalizes it intoCEE[5] events or control messages before sending them tothe Server. Finally the Server will make the informationpersistent and continues on to generating an attack graph andcorrelating events received in order to find attacks. Figure 1illustrates this workflow.
Enforcer /Gatherer Agent
Log Data,Installed Software,
Network Info,...
System Logs,Application Logs
Server
Network Info
System Information,Installed Software, ...
Enforced Commands
Events,Installed Software,
Network Info,...
Enforced Commands
Figure 1. Message workflow in the SAL
IV. LEVERAGING LIVE ENVIRONMENT INFORMATIONFOR INSTANT ATTACK DETECTION
The design proposed in this report allows for complete access to the host information of every host on which the Gatherer is deployed. This information includes, but is not limited to, log files (e.g. syslog), memory information, pro-cessor information, network information (e.g. hostname, IP addresses and MAC addresses) and application information (e.g. their CPE [6], which allows SAL to compile a list of current vulnerabilities present on any host).
Having imported all the information into SAL, a networkgraph can be created. Using a vulnerability database we canthen construct a comprehensive attack graph to be used bySAL. In order to always have the most up-to-date attackgraph, the SAL system continuously updates its underlyingdata structures, i.e. the network graph and the vulnerabilitydatabase. Therefore at any moment an up-to-date attackgraph can be compiled from the live information presentin the underlying data structures.
V. SUPPORTING INTRUSION DETECTION WITH EVENTLOG INFORMATION
A common way for reporting intrusions are securityalerts, which are generated by so called intrusion detectionsystems. Generally, these alerts are generated as a resultof observed activities in an environment that are poten-tially harmful. However, an alert is not a guarantee thatan actual intrusion has taken place. In addition, alerts areonly limited to detected malicious activity, but they donot give information about the attackers activities beforeand after his intrusion attempt. An approach to solve the
shortcomings of an intrusion detection with alerts only isthe consideration of additional details about the attackeractivities. One type of such information are event logs. Theyare produced by applications, monitoring systems, operatingsystems, etc. and are give an insight into all observed eventsin an environment. The next subsections show how theseevent logs can be gathered from different locations in anenvironment, how they are normalized into an automaticallyprocessable format [4].
A. Information Gathering
Event logs usually originate from a multitude of sources,such as IDSs, firewalls or applications, where each sourceproduces a different log representation and output format.Examples for log representations are Syslog or the IDMEFspecification and typical output formats are binary, CSV andXML. In order to read events from the log sources, thepreviously mentioned gatherers are employed. They can beattached to the log files on their host and are able to sendthe file content to their centrally connected agent.
B. Normalization
The received event logs are interpreted event by event, which makes it necessary to split the sequential event stream into single events. The SAL realizes this splitting with the help of regular expressions that are on the matching of event separators. Once the events have been extracted from the event stream, they are still in a format being specific to the generating event source. Therefore, each event is further transformed into a common and easily processable representation. In the concrete SAL implementation, the Common Event Expression (CEE)[5] has been chosen as the common representation of events, to which all custom event are normalized to. The CEE makes use of event containers that contains the properties of the event as key-value-pairs.
In order to normalize events to the CEE format, informa-tion from the raw events have to be extracted and put intothe corresponding fields. This extraction of event propertiesfrom the raw events is performed with the support of regularexpression, or more specifically with the group mechanismsin regular expressions. The idea is to first define the formatof a single raw event in the expression and then surroundstructured information with regular expression groups, sothat they can be matched and finally used as the propertiesof the event.
VI. RESULTS AND ACHIEVEMENTS
The mechanisms that have been described in the lasttwo sections allow the SAL to react on live changes inthe network, verify intrusions and uncover intrusions thatcould not be detected with the legacy SAL. In addition, it ispossible to correlate the discovered intrusion attempts to thenodes in an attack graph. The described changes are mainlyrealized by interpreting dynamic and static environment
74

information as well as using event logs instead of only alertlogs.
VII. CONCLUSION
As we work to secure networks from ever more sophisti-cated attacks, it is clear that the industry is in need of moreintelligent protection mechanisms that actively protect ournetworks. As part of this project we aim to design intelligentsolutions that consider a wide array of information relatinga network and are therefore better able to detect intrusions.The initial results of our method show considerable promise.In the next phases of the project, we will focus finishing aPOC implementation of our design principles and functionalrequirements. We also look to publish the results of ourPOC implementation and the effectiveness of the system asa whole in subsequent reports aimed at the Future SOC Lab.
REFERENCES
[1] Sebastian Roschke, Feng Cheng, Robert Schuppenies, andChristoph Meinel: Towards Unifying Vulnerability Informa-tion for Attack Graph Construction , in Proceedings of 12th Information Security Conference (ISC’09), Springer LNCS, Pisa, Italy, pp. 218-233 (September 2009).
[2] Christoph Meinel, Andreas Polze, Alexander Zeier,GerhardOswald, Dieter Herzog, Volker Smid, Doc DErrico and Zahid Hussain (Eds.): Proceedings of the Fall 2010 Future SOC Lab Day , Technical Report of Hasso-Plattner-Institute, Heft 42 (2011).
[3] Sebastian Roschke: Towards High Quality Security EventCorrelation Using In-Memory and Multi-Core Processing , PhD Thesis, Hasso Plattner Institute at University Potsdam (May 2012).
[4] David Jaeger: Monitoring in Scenario-based Security Exper-iments , Master Thesis, Hasso Plattner Institute at University Potsdam (August 2012).
[5] The CEE Board: CEE Overview. Available from:http://cee.mitre.org/docs/overview.html.
[6] Common Platform Enumeration:. Available from:http://cpe.mitre.org/.
75


Exploiting Heterogeneous Architectures for Algorithms with Low Arithme-
tic Intensity
Fahad Khalid Hasso-Plattner-Institute, University of
Potsdam 14482 Potsdam, Germany
Andreas Polze Hasso-Plattner-Institute, University of
Potsdam 14482 Potsdam, Germany
Abstract
The Scientific Computing community has witnessed a
significant increase in applications that utilize GPUs
as accelerators; complementing CPU based pro-
cessing. However, the feasibility of porting an algo-
rithm to the GPU is dependent on a complex combi-
nation of factors that include arithmetic intensity,
data access patterns and data reuse. E.g. algorithms
with very low arithmetic intensity are less likely to
gain performance if implemented on a GPU.
In this report, a problem from Systems Biology is
taken as a case study for utilizing heterogeneous
computing to improve the performance of an algo-
rithm with low arithmetic intensity. It is shown that
the Map-Reduce structural pattern for parallel appli-
cations can be used to split the algorithm into two
phases; where the Map phase can be optimized for a
GPU implementation, while the Reduce phase can be
efficiently implemented on the CPU. The result is a
significant performance gain over a serial CPU-only
implementation. The results presented were obtained
by running the algorithms on the FutureSOC hard-
ware.
In addition, the idea of Constraint-based Adaptive
Memory Management is introduced; targeted to-
wards combinatorial algorithms.
1 Motivation
In recent years, research community in the High Per-formance Computing (HPC) and Scientific Compu-ting sectors has witnessed an increasing application of Heterogeneous Computing [1]. The term Hetero-geneous Computing (as used in this document) refers to the design of applications that can harness the power of both the CPU and the GPU for problems amenable to massive parallelism.
The rapid adaption of the scientific community to Heterogeneous Computing is often attributed to the GPUs’ capability to perform massive amounts of arithmetic operations, at very high speeds. Majority
of the silicon chip area in a GPU is dedicated to a number of arithmetic processing units. This makes it possible for the GPU to execute a very large number of arithmetic instructions in parallel. However, since most of the chip area is committed to arithmetic pro-cessing, only small amounts of low latency memory resides on-chip. Therefore, a memory hierarchy (sim-ilar to the traditional CPU based systems) is em-ployed, but with very small sizes for low latency memory as compared to the CPU. A significant number of algorithms have been suc-cessfully ported to GPUs, attaining up to 100x speedup over serial execution on a CPU [2]. Howev-er, due to the aforementioned architectural limitations (w.r.t. low latency memory size), this success holds only for a certain set of algorithms that can take full advantage of the GPU architecture. This set of algo-rithms typically shows one important execution char-acteristic; i.e. high arithmetic/numerical intensity (compute-to-memory access ratio). The most com-mon example for such an algorithm is matrix-matrix multiplication [3]. Nevertheless, even for algorithms with high arithme-tic intensity, porting and optimizing the algorithm is a tedious task that requires investing a significant amount of time and effort. Moreover, several im-portant algorithms have low arithmetic intensity e.g. Sparse Matrix-Vector Multiplication [4]. With the advent of Big Data revolution, the significance of such algorithms is further amplified; since this in-volves algorithms associated with processing of very large datasets. For such algorithms, CPU-only archi-tectures (equipped with the much larger low latency memory) would appear more suitable. In the context of Heterogeneous Computing, the above considerations raise the following important question: Is it possible to effectively utilize Heterogeneous
Computing for algorithms with low arithmetic inten-
sity? Or must such algorithms be executed on CPU-
only systems?
In the sections to follow, the above posed question is approached by looking at a low arithmetic intensity algorithm from the domain of Systems Biology. The
77

algorithm has already been successfully parallelized on both shared-memory [5] and distributed-memory [6] CPU based architectures. Here, a heterogeneous architecture based parallelization is presented.
2 Heterogeneous Computing for
Enumeration of Elementary Flux
Modes
The set of all Elementary Flux Modes (EFM) repre-sents the complete set of minimal pathways in the metabolic network of an organism [7]. Under steady-state conditions, the problem of enumerating EFMs is mathematically equivalent to the enumeration of ex-treme rays of polyhedral cone [8]. The Nullspace algorithm [9] is known to be the most efficient algo-rithm for EFM enumeration. It consists of the follow-ing steps: 1. Solve a system of linear equations to get the
Kernel matrix2. Process the Kernel matrix to remove redundan-
cies and permute it so that it is feasible for fur-ther processing
3. For each row in the Kernel matrix (EM Matrix):a. Generate Candidate EM vectorsb. Verify elementarity using Rank testsc. Update the EM matrix
The most compute intensive part of the algorithm is Candidate Generation. Following is the pseudocode for the serial candidate generation algorithm [6]:
The core of the algorithm is based on an element-wise binary operation (bitwise OR) between the two input matrices. The function is imple-mented as a lookup operation that computes the Hamming weight i.e. the number of set/on bits in the vector. Let the size of Matrix A be , and size of Matrix B be n, then the total number of binary opera-tions is . In the worst case, this leads to a re-sult matrix that grows quadratically as a function of input size. As can be inferred from the above description, the serial Nullspace algorithm has very low arithmetic intensity. In the sections to follow, the experience of
parallelizing the Nullspace algorithm for execution on NVIDIA GPUs is presented.
2.1 Parallel Candidate Generation Model
for GPU
Since the generation of each candidate vector is inde-pendent of the others, the parallelization strategy used is one where each thread computes a single can-didate vector. This is a data parallel model that re-sults in a massively parallel GPU application.
2.2 A Naïve Kernel
Following is the pseudocode for the kernel based on memory partitioning with the given index algebra:
Given the massively parallel nature of the GPU, it would appear that the above kernel would perform magnitudes faster than the serial CPU-only algo-rithm. The results, however, show that the GPU per-forms even worse than the serial CPU-only code. Figure 1 shows that the GPU performance degrades with the increase in the input size. Overall, the serial CPU-only implementation outperforms the naïve GPU implementation.
Figure 1: Performance comparison between the serial CPU-only im-
plementation (blue) and the naïve GPU code (red). X-axis represents
iterations of the Nullspace algorithm, which correspond to the growing
input size. Y-axis represents the time taken in seconds.
An analysis of the GPU kernel shows that every col-umn pair results in a write to the result matrix; which translates to a total of global memory write operations. Given that each result value is a 64-bit integer, this results in a very large result array. There-fore, most of the time is spent in transferring the re-sult data structure between the device and the host.
78

2.3 Employing the Map-Reduce Structural
Pattern for Parallel Applications
In the aforementioned pseudocode for the GPU ker-nel, the final step is a comparison that results in a Boolean value i.e. ‘0’ or ‘1’. However, as per the serial version of the algorithm, this is just an inter-mediate step that eventually leads to fetching and storing the index pair corresponding to the input ele-ments. The kernel has been designed in a way so that only the Boolean value is computed on the GPU, and the index pair computation is left as a post-processing step to be performed on the CPU. This division of work between the GPU and the CPU corresponds to the Map-Reduce structural pattern [11] with the fol-lowing two phases: Map The GPU kernel. Generates candidates
and stores Boolean values as the result. Each re-sult value represents the decision whether thepair of input vectors should be stored.
Reduce A post-processing step performed onthe CPU. Parses the result data structure popu-lated by the GPU. For all values where the deci-sion is positive, the corresponding pair of indicesis fetched and stored in a dynamic data structure.This phase is implemented as a shared-memoryparallel procedure.
One of the benefits of implementing a heterogeneous Map-Reduce pattern is that the GPU kernel is re-lieved from executing further memory intensive in-dex fetch operations. Also, the massively parallel nature of a GPU application results in concurrency issues (mutual exclusion) if a dynamic global data structure is used to store the resulting index values. Therefore, relegating such operations to the CPU, results in a relatively efficient kernel.
2.4 Introducing the Compression Factor
A significant advantage of employing the Map-Reduce pattern is the possibility to exploit the Boole-an nature of the result computed per thread, in order to reduce the number of global memory write opera-tions by a constant factor. Since each result value is a Boolean, instead of storing the result as an integer, it is stored as a single bit. Therefore, with , 64 results can be stored in one element of the result array (assuming 64-bit unsigned integers are being used in the result data structure). This makes it possible to compute number of candidates per thread. As a result, size of the result data structure for the Map phase is reduced by a factor of . Following are two major ad-vantages of the reduction in result size: 1. Previously, the time spent in data transfer be-
tween the device and the host overshadowed thetime spent on computation. With the scheme, the balance is
shifted in the favor of computation time i.e. time spent in device-host-device data transfers is neg-ligible in comparison to the time spent in kernel execution. This results in better utilization of the GPU resources.
2. Much more efficient user-managed caching [12]schemes can now be employed.
The performance results after implementing the Map-Reduce pattern with are shown in Figure 2. The heterogeneous algorithm outper-forms the serial CPU version by achieving a relative speedup of ~3.5x. Please note that this speedup does not include all the typical performance optimizations [13] applied to CUDA1 code. Efforts to further im-prove the performance by applying such optimiza-tions are underway. These optimizations are well known within the CUDA programmers’ community, and therefore, will not be discussed in detail here.
Figure 2: Performance comparison between serial CPU-only implemen-
tation (blue) and the heterogeneous Map-Reduce based implementation
with (red). X-axis represents iterations of the
Nullspace algorithm, which correspond to the growing input size. Y-axis
represents the time taken in seconds.
2.5 Brief Overview of Planned Optimiza-
tions
Following is a brief discussion of further optimiza-tions applicable to the heterogeneous implementa-tion: Coalesced Global Memory Access and Result
Caching: Due to the use of , access to the global memory is no longer coalesced from threads in the same block. An improved index algebra, coupled with a cooperative caching mechanism is being implemented to ensure coalesced ac-cessed to the global memory. This is expected to result in a significant performance improvement.
Tiled Input and Caching: Tiling can be used toimplement efficient caching for the input data.However, it is not clear at the moment if this willresult in a significant performance gain.
Asynchronous Map-Reduce: The current imple-mentation executes the Map and Reduce phases
1 NVIDIA CUDA, http://www.nvidia.com/cuda
79

in sequence. A multi-threaded asynchronous im-plementation may lead to better overall perfor-mance.
In addition to the above mentioned possible optimi-zations, several typical CUDA optimizations will be implemented.
3 Constraint-based Adaptive Memory
Management
The Candidate Generation algorithm (as presented in the previous Section), is combinatorial in nature. Such combinatorial algorithms often deal with the exploration of very large solution spaces. This explo-ration process can lead to the intermittent generation of a very large number of combinations, only some of which might eventually be required by the algorithm. The intermittent combinatorial explosion results in excessive memory consumption, which is only tem-porary. Nevertheless, if the consumption exceeds the amount of available physical memory, the program can crash. A possible approach to control the memory consump-tion behavior of such an algorithm is to apply an up-per-bound on the maximum amount of memory that can be consumed by a process at a given time. In the case of EFM enumeration, this means that each thread running in parallel must not process more than a certain number of candidate vectors per iteration of the Nullspace algorithm. We intend to design a constraint definition system, coupled with a constraint enforcement runtime that makes it possible to define resource constraints for individual processes/threads. This requires altera-tion of the program flow, so that more iterations are executed with less data per iteration. Formally, it can be defined as the problem of Optimal Dynamic Parti-
tioning of Program Flow. At this point, the proposal is in the idea phase. We intend to develop it further into a prototype imple-mentation during the next phase of our FutureSOC Lab project.
4 Conclusions
In order for software designers to take full advantage of heterogeneous computing, generic patterns in low arithmetic intensity algorithms need to be identified that can make it possible to gain significant perfor-mance gains over multi-threaded shared-memory CPU-only implementations. A positive result in this direction is presented by utilizing the Map-Reduce structural pattern to improve algorithm efficiency for an algorithm from Systems Biology. A set of further optimizations will be implemented for this application, which will provide further insight into the full potential for utilizing Heterogeneous
Computing for this particular problem. Moreover, research will be carried out in order to see if the re-sults can be generalized for a broader class of algo-rithms. Moreover, we intend to develop a constraint-based adaptive memory management system. This is ex-pected to result in an effective and efficient memory consumption behavior for combinatorial algorithms.
References
[1] J. D. Owens, D. Luebke, N. Govindaraju, M. Harris, J. Krüger, A. E. Lefohn, and T. J. Purcell, "A Survey of General-Purpose Computation on Graphics Hardware", Computer Graphics Forum, vol. 26, pp. 80-113, 2007. [2] V. W. Lee, C. Kim, J. Chhugani, M. Deish-er, D. Kim, A. D. Nguyen, N. Satish, M. Smelyan-skiy, S. Chennupaty, P. Hammarlund, R. Singhal, and P. Dubey, "Debunking the 100X GPU vs. CPU myth: an evaluation of throughput computing on CPU and GPU", presented at the Proceedings of the 37th annu-al international symposium on Computer architec-ture, Saint-Malo, France, 2010. [3] A. Buluç, J. R. Gilbert, and C. Budak, "Solving path problems on the GPU", Parallel Com-puting, vol. 36, pp. 241-253, 2010. [4] J. D. Davis and E. S. Chung, "SpMV: A Memory-Bound Application on the GPU Stuck Be-tween a Rock and a Hard Place", Microsoft Research Silicon Valley, Technical Report14 September 2012 2012. [5] M. Terzer and J. Stelling, "Accelerating the Computation of Elementary Modes Using Pattern Trees", in Algorithms in Bioinformatics. vol. 4175, P. Bücher and B. Moret, Eds., ed: Springer Berlin / Heidelberg, 2006, pp. 333-343. [6] D. Jevremović, C. T. Trinh, F. Srienc, C. P. Sosa, and D. Boley, "Parallelization of Nullspace Algorithm for the computation of metabolic path-ways", Parallel Computing, vol. 37, pp. 261-278, 2011. [7] S. Schuster and C. Hilgetag, "On elementary flux modes in biochemical reaction systems at steady state", J. Biol. Syst, vol. 2, pp. 165–182, 1994. [8] J. Gagneur and S. Klamt, "Computation of elementary modes: a unifying framework and the new binary approach", BMC Bioinformatics, vol. 5, p. 175, 2004.[9] C. Wagner, "Nullspace Approach to Deter-mine the Elementary Modes of Chemical Reaction Systems", The Journal of Physical Chemistry B, vol. 108, pp. 2425-2431, 2004. [10] S. Klamt and J. Stelling, "Combinatorial Complexity of Pathway Analysis in Metabolic Net-works", Molecular Biology Reports, vol. 29, pp. 233- 236, 2002.
80

[11] K. Keutzer, B. L. Massingill, T. G. Mattson, and B. A. Sanders, "A design pattern language for engineering (parallel) software: merging the PLPP and OPL projects", presented at the Proceedings of the 2010 Workshop on Parallel Programming Pat-terns, Carefree, Arizona, 2010. [12] M. Silberstein, A. Schuster, D. Geiger, A. Patney, and J. D. Owens, "Efficient computation of sum-products on GPUs through software-managed cache," presented at the Proceedings of the 22nd an-nual international conference on Supercomputing, Island of Kos, Greece, 2008. [13] NVIDIA, "CUDA C BEST PRACTICES GUIDE," Design GuideJanuary 2012 2012. [14] J. Mora, "Do Theoretical FLOPS Matter for Real Application Performance?", presented at the HPC Advisory Council Spain Workshop, 2012.
81


Using In-Memory Computing for Proactive Cloud OperationsFuture SOC Lab Report October 2012
Felix Salfner, Marcus KrugSAP Innovation Center, Potsdam
Peter Troger, Eyk KnyHasso Plattner Institute, Potsdam
Abstract
The management of cloud computing infrastructureson operator side is a true challenge. An ever-growingnumber of servers, the heterogeneity of software, nec-essary elastic load handling, energy consumption andother non-functional aspects have to be taken into ac-count – continuously and in an adaptive fashion.Proactive cloud operations tries to trigger preventivemaintenance activities when some part of the system isabout to enter an erroneous state. Examples for suchactivities are administrator alarming and automatedload migration. We combine this approach with theidea of semi-automated root cause analysis to reducetime-to-repair and improved availability. In-memorycomputing provides a well-suited technology for this.We have implemented a prototype to analyze feasibil-ity of the approach and analyzed data sets from HPCclusters.
1 Introduction
Cloud computing is currently one of the predominanttrends in computer science and IT industry. Its po-tential impact on IT infrastructures and software plat-forms cannot be underestimated: The cloud paradigmwill change the way how IT companies make businessas well as how end-users (private and corporate) per-ceive software and IT. It moves the burden of IT infras-tructure management and operation away from users,and shifts it to specialized providers that can guaranteefast, reliable, and secure operation of the cloud infras-tructure.Satisfying the users’ expectations turns the manage-ment of cloud computing infrastructures into a truechallenge. An ever-growing number of servers, theheterogeneity of software, multiple interacting mech-anisms to elastically react on changing load, theconsideration of energy consumption and other non-functional aspects have to be taken into account. Op-erating such systems requires intelligent managementtools to deliver the guaranteed service-level to the userin a profitable way.One of the key features of system monitoring at thescale of a cloud computing center is to aggregate low-
level monitoring events in order to present only criticalevents to the operation personnel. To achieve this goal,current monitoring systems rely on temporal as wellas spatial correlation mechanisms and infrastructure-centric rule-based aggregation. These techniques usu-ally have a snapshot-like view on the system and ig-nore problems that evolve in the system over a longerperiod of time. In our project, we focus on such evolv-ing phenomena and explore a new monitoring tech-nique that is based on computing correlations betweenmonitoring signals in order to identify the spreading ofproblems within the system.This report summarizes the second project phase anddocuments our project results. In summary we have:
• optimized the monitoring and computation in-frastructure for anomaly detection, which was de-veloped in the first phase
• optimized the computation of signal correlationusing SAP’s in-memory database HANA,
• built a web-based front-end for interaction withstructure-of-influence graphs
• developed a new graphical representation for cor-relation of hierarchical monitoring signals
• investigated ways how to use structure-of-influence graphs for the prediction of upcomingfailures
2 Approach
Oliner et al. [4] have presented an algorithm to infershared influence in complex production systems. Thealgorithm is based on anomaly signals, which are realvalues between zero and one indicating how much ameasurement signal deviates from “normal behavior”.Anomaly signals are obtained from monitoring signalsby applying a transformation function that encodes lo-cal domain knowledge. By computing the correla-tion between any pair of anomaly signals, the “spread-ing” of anomalies across the system can be quantified.More precisely, if there is a high correlation between
83

A B C D
Correlation
A B
C D
Monitoring signals
f(A
)
g(B
)
f(C
)
g(D
)
tt
anomaly
t
lag
correlation B,D
lag
correlation A,C
lag
correlation A,D
anomaly anomaly
Figure 1. Creation of structure-of-influence graphs.
the anomaly signals of two components, we can spec-ulate that the abnormal states of both components arerelated.The time lag at which the correlation reaches its max-imum can be used to determine the temporal interde-pendency between the two components, i.e., to iden-tify, which component is the source (or initiator) andwhich one is the target of the problem (suffering fromthe anomaly of the source component). For furtheranalysis, the interdependencies can be visualized ina so-called structure of influence graph (SIG). Thenodes of the SIG are monitoring signals and an edge isadded to the graph if there is a significant correlationbetween the two signals. The edge is directed, if thetime lag of maximum correlation is larger than somethreshold. Figure 1 depicts the procedure of generat-ing a SIG.The primary use case for SIGs is root cause analy-sis. Given a SIG, which represents how anomalieshave spread throughout the system, the initiating firstanomaly can be detected and the component, to whichthe anomaly signal belongs, appears to be a good can-didate for further inspection. Please note that suchanalysis is based on correlation, which can but not nec-essarily does represent causation.
3 Predicting Failures
SIGs have been used successfully for root cause anal-ysis in complex systems, such as high-performancecomputing centers. As an extension, we propose touse extended SIGs for an early detection of anomalyspreading that might eventually turn into a failure. Weaccomplish this by checking whether a currently ob-served SIG might develop into a SIG that is known tohave led to a system failure in the past.As can be seen in Figure 2, this is not an easy task
IHG
CBA
FED
IHG
CBA
FED
a) b)
Figure 2. Prediction by computing simi-larity between two structure of influencegraphs: Currently observed (a) which re-sembles the beginning of a previous fail-ure occurrence (b).
since two graphs will probably never be equal, i.e.,there can be missing or additional edges, the spreadingof anomalies might exhibit short “detours” or “short-cuts”, and even if the edges are the same their weighttuples will most likely differ. For these reasons, thecomparison of SIGs has to be based on some metric ofsimilarity. Examples include:
• Gromov–Hausdorff distance, which builds on amapping of graphs to metric spaces and measur-ing how far the two spaces are from being isomet-ric.
• Sequence-based approaches such as proposed in[5] that build on the assumption that two graphsare similar if they share many sequences of ver-tices and edges.
• Scoring-based approaches that score the exis-tence (and similarity of the weight tuple) of anedge in both graphs.
• Graph isomorphism algorithms or their approxi-mations (see, e.g., [1]).
Computing such similarity metrics is computationallychallenging. Hence, computational complexity willplay a significant role in the evaluation of metrics. Thebi-variate structure of edge weights might put addi-tional complexity to the evaluation. Additional aspectsto be considered include the efficient storage of SIGsor their signatures in a database of failure SIGs as wellas efficient ways to search for failure SIGs matchingthe currently observed SIG. We also investigate waysto simplify the graph by, e.g., collapsing cliques of ver-tices, clustering, etc.In addition to the search for the best similarity metric,there are two general approaches to deal with the as-pect of spreading. In the first approach, we comparethe currently observed SIG to stored SIGs that werepreviously saved at system failure time. The secondapproach compares the current SIG development, i.e.,a sequence of several successive SIGs, to stored SIGdevelopments from previous failure cases.
84

Figure 3. Overview of the HANA-based correlation engine.
4 A Use-case for In-memory Computing
Investigating the root cause of a problem that has oc-curred in a cloud environment frequently requires toanalyze monitoring data and to compare the systembehavior of the current faulty case to system behav-ior at other fault-free times. In order to do this, anefficient analysis framework has to enable the opera-tor to quickly move forth and back in the monitoringdata, to drill down at specific points in time or to getan overview on higher levels of granularity. These re-quirements make root cause analysis similar to busi-ness data exploration. In-memory database technol-ogy is a key enabling technology to perform on-the-flydata analysis — and we believe that it has the poten-tial to also boost efficiency for root cause analysis. Forthis reason, we implemented the correlation algorithmwith on-the-fly data aggregation on the database level.Our approach builds on SAP’s HANA in-memorydatabase. This means that all computationally com-plex and data-intensive operations have been imple-mented in SAP’s computational database languageSQLScript. Figure 3 shows the setup. The implemen-tation was supported by hardware of the FutureSOClab.
5 Dealing With Complex SIGs
SIGs can very quickly become too large to be un-derstandable. Even medium-sized systems can haveseveral thousand monitoring variables. The number
of monitoring variables becomes prohibitive ratherquickly as the number of correlations that need to becomputed grow quadratically. However, in real-worldsystems measurement signals (and hence also anomalysignals) are organized in a hierarchical fashion. Forexample, application queue length measurements be-long to some application, which runs on a specificserver, which resides in some rack in the data center.One example for such a signal hierarchy is shown inFigure 4.The present hierarchy of signals can be leveraged forfour general ways to reduce complexity:
1. Selection of anomaly signals
2. Aggregation of anomaly signals
3. Algorithmic simplification
4. Hierarchical visualization
In the first approach, complexity is reduced simply byselecting a subset of anomaly signals, for which a SIGis computed and for which a graph is rendered. For ex-ample, a SIG can be computed only for anomaly sig-nals that belong to one specific server. Another exam-ple is the selection of temperature monitoring signalsacross the entire system. In order to facilitate the userof a SIG-based tool to perform such a selection the toolneeds to provide facilities to navigate and slice the sig-nal hierarchy.In the second approach, data of anomaly signal iscondensed via aggregation. Aggregation can be per-formed either on the time axis, which simplifies com-putation of each single correlation but does not reduce
85

Figure 4. Example hierarchy of monitoring signals
the number of correlations and it does also not sim-plify the resulting SIG. A second way of aggregatinganomaly signals again makes use of the hierarchy: Forexample, a SIG can be computed on rack level. Thatmeans that for example all temperature anomaly sig-nals that belong to one rack are combined into onetemperature anomaly signal. The same approach canalso be applied to anomaly signals that do not derivefrom the same domain: for example, all anomaly sig-nals of a rack, i.e., memory, load, and temperature sig-nals, are aggregated on rack level. This is possiblebecause anomalies are normalized to the range [0, 1].
Algorithmic simplifications include various machinelearning techniques such as clustering, principal com-ponent analysis (as has been proposed by [3]), orstochastic techniques. Another promising candidateare frequency-based techniques that operate in thefrequency domain rather than the temporal domain,which would also speed up computation of correla-tions tremendously. More advanced topics include net-work exploration, path extraction, etc.
Although not reducing the computational complexity,visualizations of the SIG play an important role in en-abling the user to get maximum information out of aSIG. An example is shown in Figure 5. In Graph (a)some clusters and shared influence can be identified.However, it is almost impossible to defer any infor-mation from Graph (b). This was the motivation forinvestigating new ways to visualize SIG data. Fol-lowing some discussions with the research group byProf. Dollner, we had the idea to adapt a hierarchi-cal edge bundles visualization [2], as it is also used insoftware visualization. An example for such a graphis shown in Figure 6. In such a graph, the hierarchy ofanomaly signals is indicated by rings, where the inner-most elements are single anomaly signals (leafs in the
tree of Figure 4), and the outer rings combine elementsto larger units. For reasons of confidentiality, the la-bels in the graph have been blurred. The correlationitself is indicated by vector bundles in the middle ofthe circle. In the figure, we used a color gradient fromgreen to red to indicate the direction of the arc. Futureversions will feature grading to transparency and linethickness to indicate strength of a correlation.
6 Conclusions and Next Steps
Operating a cloud computing infrastructure at mini-mum cost while at the same time offering service at aguaranteed level is a challenge. This project attemptsto adapt a new correlation-based monitoring data anal-ysis method to the cloud context. One major aspect isto include in-memory databases to facilitate on-the-flydata analysis and exploration. A second major focusof the work is on reducing computational complexityusing advanced pre-processing techniques and to makestructure-of-influence graphs easier to consume by ex-ploring new graphical representations. Future workwill focus on the exploration of simplification tech-niques as well as the usage of structure-of-influencegraphs for predicting upcoming problems.
References
[1] Matthias Dehmer, Frank Emmert-Streib, andJurgen Kilian. A similarity measure for graphswith low computational complexity. AppliedMathematics and Computation, 182:447–459,November 2006.
86

cal Data. Transactions on Visualization and Com-puter Graphics, 12:741–748, 2006.
[3] Adam Oliner and Alex Aiken. Online Detection ofMulti-Component Interactions in Production Sys-tems. In Dependable Systems and Networks, pages49–60. IEEE, 2011.
[4] Adam J. Oliner, Ashutosh V. Kulkarni, and AlexAiken. Using Correlated Surprise to Infer SharedInfluence. In Dependable Systems and Networks,pages 191–200. IEEE Computer Society, 2010.
[5] Panagiotis Papadimitriou, Ali Dasdan, and Hec-tor Garcia-Molina. Web Graph Similarity forAnomaly Detection. Technical Report 2008-1,January 2008.
[2] Danny Holten. Hierarchical Edge Bundles: Vi-sualization of Adjacency Relations in Hierarchi-
87

(a) (b)
Figure 5. Two examples for SIG visualizations.
Figure 6. Sunburst visualization of SIGs
88

Evaluation of Multicore Query Execution Techniquesfor Linked Open Data
Ahmed Imad Aziz, Heiko Betz and Kai-Uwe Sattler
Database and Information Systems GroupIlmenau University of Technology
{first.last}@tu-ilmenau.de
Abstract
LODcache – a project of the Database & InformationSystems Group at Ilmenau University of Technology– aims at developing an in-memory database systemfor managing Linked Data in RDF format and pro-cessing SPARQL queries. One of the main goals ofthis project is to investigate techniques for exploit-ing modern hardware architectures such as many-coreCPUs, cache hierarchies, large main memory, and co-processing.In this context, the specific focus of the project per-formed at the HPI Future SOC Lab was to evalu-ate and improve newly developed indexing and par-allelization techniques. In this paper, we give a briefreport on the main results of this work.
1. LODcache Architecture
The idea of the LODcache system is to build aMemcached-like system for Linked Open Data whichfetches data from the sources, materializes them inan in-memory cache database and evaluates querieson this database only. Furthermore, query process-ing in LODcache leverages features of modern hard-ware architectures: it follows the in-memory process-ing paradigm using hash indexes and stores data in acompressed and columnar-oriented way. In addition,it uses the Intel Thread Building Blocks library to ex-ploit parallel processing techniques on multicore ar-chitectures.The architecture of LODcache comprises two maincomponents: a storage layer and a query engine. Atthe storage layer triple data are organized in chunks offixed size where they are stored column-wise. Eachtriple is stored and indexed three times: using a hash-based subject index, predicate index, and object index.Furthermore, all triples on the chunks assigned withan index are stored in the order of the index. Finally,the triple components encoded using a dictionary com-pression scheme.
The query engine provides the standard set of queryoperators for implementing a SPARQL algebra in-cluding different join implementation to evaluate basicgraph patterns (BGP).As an in-memory database system, LODcache facesin principle the problems of the memory wall [1] suchas latency, limited memory and bus bandwidth. Theseproblems become even worse when there is more thanone CPU sharing the same memory, and the solutionapplicable to the single processor system is less effec-tive when considered under multiprocessor or multi-core assumptions. Therefore, parallelization strategiesfor efficient query processing on big datasets need todeal with various issues such memory architecture ef-fects, cache obliviousness but also with data skew andload balancing issues.
2. Parallel LODcache
In database query processing different parallelizationstrategies exist on the query level: inter- and intra-query parallelism. Inter-query parallelism allows mul-tiple queries to run in parallel, while intra-query par-allelism considers the parallel execution of a singlequery. In our work, we have chosen two different intra-query strategies. The first approach is based on paral-lel query branches by duplicating the query executiontree multiple times and executes all branches in par-allel. The second strategy is an intra-operator strat-egy for processing joins called pipeline join. Here, theavailable input data is split into partitions and assignedto join works running in parallel.
2.1. Parallel Query Branches
The idea of parallel query branches is shown in Fig-ure 1. The right-hand side shows a sequence ofoperators which forms an operator tree. The left-hand side shows the same query but with three par-allel query branches which are coordinated by theparallel do operator as the root node. How-ever, the parallel version is not an exact copy of
89

Figure 1. Parallel query branches vs. se-rial query execution plan
the original execution plan: the join and scan opera-tors are replaced by corresponding coop join andcoop scan implementations.Parallel query branches can be easily derived from se-rial query execution plans just by replacing the joinand scan operators, replicating the whole plan to mul-tiple branches, partition the input, and adding a newroot operator parallel do. Finally, each branch isassigned to a single physical thread.
The coop scan Operator. The coop scan oper-ator is quite similar to the normal scan operator. Everycoop scan operator receives one part of the avail-able input chunks for initial load balancing. Due topossible data skew, the chunks do not all contain thesame number of triples and in the end, the sum of alltriples over all assigned chunks can be different be-tween different branches. To address this issue, a workstealing strategy is used.After processing all available chunks, the coop scanoperator asks his right-hand neighbor from anotherbranch to share work. If the neighbor has more thanone chunk not processed yet, the asker “steals” someof these chunks. Otherwise, it keeps the last chunkand nothing is transfered. In this case, the next branchis asked until none of the neighbors has any chunknot processed yet. For synchronization purposes eachchunk contains only a single atomic variable for indi-cating the processing state.Using the same physical thread for processing datareduces the operation system overhead. Only the re-quested data between the local memory and processingunit must be transfered.
The coop join Operator. The defaultindex join processes its outer input relationby looking up the join value in an index for the innerrelation. Here, a problem is that it is unknown howmany chunks have to be processed from the inner
relation, i.e. the workload per chunk is not knownwhich makes a direct mapping of input workload toworker threads unfair. To address this, a strategy likework stealing would be useful, but a direct applicationwould result in significant overhead due to the finergranularity in the join operator.A solution is the so-called coop join opera-tor, which implements work sharing between allcoop join operators of the same level in differentbranches. When one operator instance has no morework to do, it asks its siblings for portions of the re-maining work; full chunks and parts of a single chunkcan be transferred. Here, no explicit synchronizationis required, because only the sibling can decide whichchunk can be accessed and transferred. On the otherhand, the asker has to register in the givers list and thegiver has to check periodically if some asker is avail-able. Periodical checking the giver list is negligiblecompared to the waiting time between sending a re-quest and receiving a response. The overhead can befurther reduced, when the asker performs busy waitinginstead of thread sleeping.
2.2. Pipelined Join
The pipelined join approach uses the TBB1 par-allelization approach, which is called task- based loadbalancing. This method splits up the available workinto small partitions. Every partition is mapped to atask and finally the task can be mapped to a physicalthread. Faster threads have to process more tasks thanothers. The more tasks and the smaller the partitions,the higher is the load balancing between threads. It isa portable approach for almost every application.Unfortunately, increasing the number of tasks and de-creasing the partition size is not for free, but resultsin an overhead for each created task. The problemsize must be big enough; otherwise the overhead is toohuge and the performance will decrease. The num-ber and size of task limits the load balancing betweenthreads if the problem size is too small to be dividedinto many smaller tasks. There is also no possibility toshare work between different tasks.The goal of the pipelined join operator is to finda way to make use of the task-based load balancingstrategy, without the need for any work sharing orstealing. The work task should be complex enoughto be parallelized, it needs a dividable nature and fi-nally it should be applicable to our query executiontree. A good place for applying this strategy is the in-dex join operator, which implements an index-basednested loops strategy. The pipelined join opera-tor just creates tasks for processing partitions of inputdata. However, the challenge is to collect the resultsof all tasks in a single result chunk. If all tasks have
1Intel Threading Building Blocks library is a highly optimizedlibrary for implementing parallelized software. It can be found athttp://threadingbuildingblocks.org.
90

to access a single chunk list to store their results, wewould need to pay the cost of concurrency for each re-sult tuple. If we would allow each task to return itsown chunk of result tuples we would end up with alarge number of result lists. The implementation of thepipeline join relies on the fact that although we createmany tasks we have no more than C tasks active at anymoment on the C threads. Thus, we need only C con-tainers to be alternatively mapped to each of the activetasks.
2.3. TBB Scheduler
Assigning tasks to physical threads is done by the TBBScheduler. For small queries and unbalanced operatortrees it is not efficient to use all available processingunits of the system. Therefore, a combination of intra-and inter-query parallelization is necessary to reallyutilize the available cores. We address this issue byproviding our own implementation of a TBB sched-uler.The scheduler takes the first query, uses the paral-lel branches of the operator tree and assigns everybranch to a physical thread. Before the last branch isstarted the scheduler is called again in order to sched-ule the subsequent query. This query is again splitinto branches but not started before any free physi-cal thread is available. The process stops when thescheduled query has at least one pending task wait-ing to start executing. This helps to improve CPU uti-lization, because we have always tasks ready to runwhen any thread becomes free when there are enoughqueries waiting in the queue.
2.4. Boost Mode
Using the default TBB task-based load balancing ap-proach has two disadvantages. The first is the logi-cal creation of tasks by using the TBB scheduler. Thesecond is the assignment of created tasks to threads,which is also handled by the TBB scheduler and needssupport from the operating system. The latter oneis more expensive than the first one and should beavoided. It happens, when the TBB scheduler doesnot find any free task to execute. The physical threadis going to sleep. A solution is to deny sleeping by us-ing active waiting. Every thread, which has no work,is waiting active for some given time. If a new queryarrives during the waiting phase, it splits up in tasks,which are assigned to waiting threads.
3. Evaluation
In this section, we give a brief overview on the mainresults of our experimental evaluation. The hardwareplatform was a Hewlett Packard DL980 G7-1 serverand was provided by the Future SOC Lab of the Hasso-Plattner-Institute (HPI). The server contains 8 Xeon
Figure 3. Speedup with respect to differ-ent number of chunks and threads.
(Nehalem EX) X7560 CPUs, each with 8 physical andlogical cores, and 2048 MB RAM. The total sum ofphysical cores is 64, with 64 logical cores. Otherhardware specifications are 2.26 GHz clock frequency,32 KB data and 32 KB instruction set per core (L1cache). The L2 cache provides 256 KB per core andthe L3 cache has 24 MB accessible by all cores.Apart from several micro benchmarks for measuringmemory latencies, NUMA effects etc. we have per-formed several tests with different queries on differ-ent data sizes. In the following we present the resultsfor a single query execution plan where we have var-ied the number of chunks (input size) and the numberof parallel working threads to determine the possiblespeedup. Furthermore, only the join operation is con-sidered, because executing SPARQL on triple storesresults in very join-intensive query execution plans andmore than 99% of runtime is spent by the join opera-tor. Thus, the result can be generalized for almost allqueries which uses joins. More results including theresults of the micro benchmarks can be found in [2].
Parallel Query Branches. The parallel querybranch experiment uses the coop scan andcoop join operators. The speedup graph in Fig-ure 3 shows the speedup variation with respect todifferent numbers of chunks at scan level. Morechunks at scan level results in better speedup, be-cause the distribution among branches is easier.The 2-chunks series gained a speedup of 21 byusing 40 threads in parallel. Here, the speedup isachieved mainly by to the coop join operator. The15-chunks series touches the 30 by using 40 threads.Both 342 and 6200-chunk series starts with quite lin-ear behavior and the deviation from the ideal speedupis not noticeable with less than 32 threads. After 20respective 28 threads the slope is decreasing. Themaximum achieved speedup is 51 with 57 respective61 threads.The load unbalancing in terms of runtime between dif-ferent branches is shown in Figure 4. In the worst case,the unbalance is always less than 7%.Figure 5 shows the ratio between useful work andoverhead on the 342-chunk example. The overhead in-
91
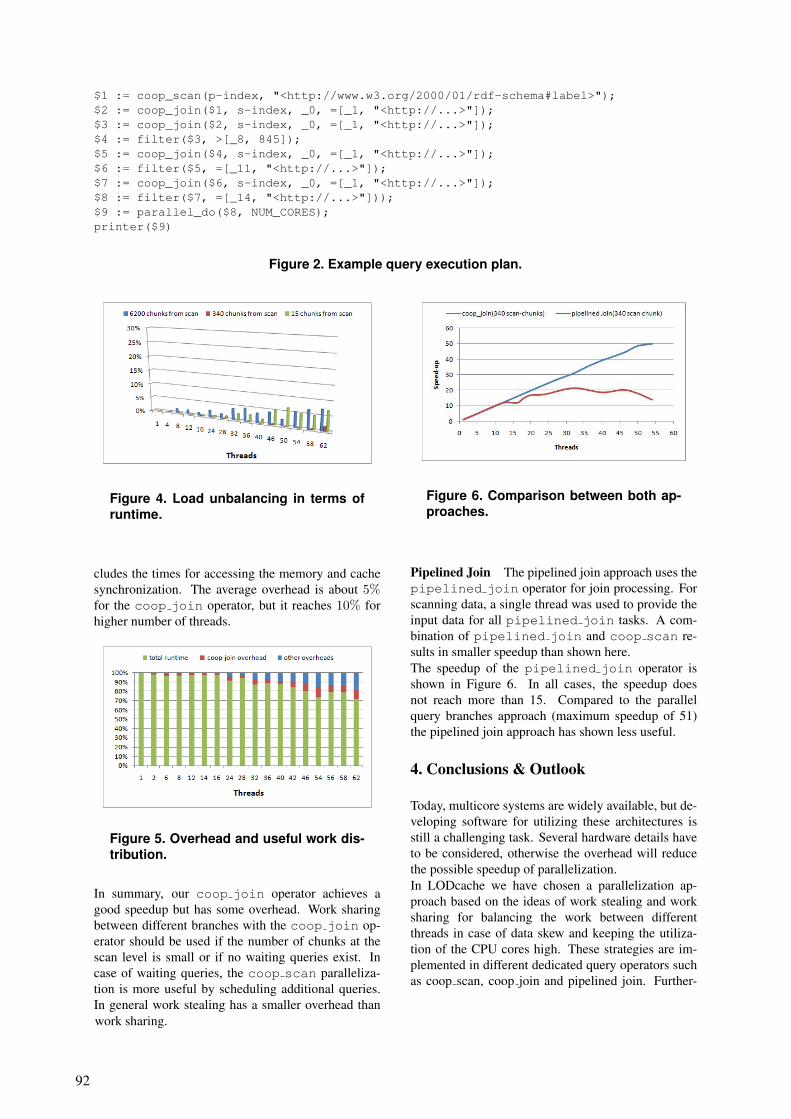
$1 := coop_scan(p-index, "<http://www.w3.org/2000/01/rdf-schema#label>");$2 := coop_join($1, s-index, _0, =[_1, "<http://...>"]);$3 := coop_join($2, s-index, _0, =[_1, "<http://...>"]);$4 := filter($3, >[_8, 845]);$5 := coop_join($4, s-index, _0, =[_1, "<http://...>"]);$6 := filter($5, =[_11, "<http://...>"]);$7 := coop_join($6, s-index, _0, =[_1, "<http://...>"]);$8 := filter($7, =[_14, "<http://...>"]));$9 := parallel_do($8, NUM_CORES);printer($9)
Figure 2. Example query execution plan.
Figure 4. Load unbalancing in terms ofruntime.
cludes the times for accessing the memory and cachesynchronization. The average overhead is about 5%for the coop join operator, but it reaches 10% forhigher number of threads.
Figure 5. Overhead and useful work dis-tribution.
In summary, our coop join operator achieves agood speedup but has some overhead. Work sharingbetween different branches with the coop join op-erator should be used if the number of chunks at thescan level is small or if no waiting queries exist. Incase of waiting queries, the coop scan paralleliza-tion is more useful by scheduling additional queries.In general work stealing has a smaller overhead than
Figure 6. Comparison between both ap-proaches.
work sharing.
Pipelined Join The pipelined join approach uses thepipelined join operator for join processing. Forscanning data, a single thread was used to provide theinput data for all pipelined join tasks. A com-bination of pipelined join and coop scan re-sults in smaller speedup than shown here.The speedup of the pipelined join operator isshown in Figure 6. In all cases, the speedup doesnot reach more than 15. Compared to the parallelquery branches approach (maximum speedup of 51)the pipelined join approach has shown less useful.
4. Conclusions & Outlook
Today, multicore systems are widely available, but de-veloping software for utilizing these architectures isstill a challenging task. Several hardware details haveto be considered, otherwise the overhead will reducethe possible speedup of parallelization.In LODcache we have chosen a parallelization ap-proach based on the ideas of work stealing and worksharing for balancing the work between differentthreads in case of data skew and keeping the utiliza-tion of the CPU cores high. These strategies are im-plemented in different dedicated query operators suchas coop scan, coop join and pipelined join. Further-
92

more, all these operators work in a cache-aware wayby processing larger chunks of triples represented in acolumnar memory layout.Using the provided hardware at the HPI Future SOCLab we were able to evaluate these strategies with bigdata sets on a CPU with 64 cores. Our evaluation re-sults show a linear speedup up to 28 cores. The maxi-mum achieved speedup is up to 51 by using 60 threads.We found also only a small overhead for synchroniza-tion between the threads for work stealing (up to 10%for coop join) and 7% unbalancing between branchesin terms of runtime.In future work, we plan to further investigate mainmemory layouts taking the characteristics of NUMAinto account. Furthermore, dynamic scheduling ofqueries, i.e. assigning cores to incoming queries, toimprove the query throughput is another issue we willaddress.
References
[1] Peter A. Boncz, Martin L. Kersten, Stefan Manegold:Breaking the Memory Wall in MonetDB. Commun.ACM 51(12): 77-85, 2008.
[2] Ahmed Imad Aziz: Parallelization Techniques for In-Memory Processing of Linked Data. Master’s Thesis,Ilmenau University of Technology, Department of Com-puter Science and Automation, September 2012.
93


Next Generation Sequencing: From Computational Challenges toBiological Insight
Cornelius [email protected]
Annabell [email protected]
Sascha SauerNutrigenomics and Gene Regulation
Otto-Warburg LaboratoryMax Plank Institut for Molecular Genetics, Ihnestr. 63-73, 14195 Berlin, Germany
Abstract
Next generation sequencing (NGS) is changing theway researchers approach analysis of biological in-formation. However, one of the main bottlenecks inNGS applications is the computational analysis of ex-perimental data. Using the Future SOC Lab resourceswe established and used a computational pipeline forthe analysis of sequencing data that we recently gen-erated. We found that the provided resources workedvery robust and fast. This enabled us to move rapidlyfrom raw NGS data to initial biological insights.
1. Project idea
Transcription factors are crucial proteins that are in-volved in controlling gene expression. Thus, activitiesof transcription factors determine how cells functionand respond to environmental stimuli. Many transcrip-tion factors bind directly to DNA close to the genesthey regulate. The determination of the genomic loca-tion of transcription factor binding sites provides im-portant insights into the mechanism of regulation thatwill potentially be used to develop drugs for preven-tion and treatment of metabolic disorders. We there-fore analysed the binding sites of a transcription fac-tor of interest (TFI) that is involved in metabolic andinammatory signal integration. Transcription factorbinding is often DNA sequence specific. However, itbecomes clear that features beyond DNA sequencesdefine where transcription factors bind. It has previ-ously been shown that transcription factor binding cor-relates with regions of open chromatin that representactive regulatory elements [3]. Therefore, we deter-mined the openness of chromatin that accompanies thebinding of the TFI. Collectively, our studies aimed toprovide an initial framework for understanding and in-vestigating TFI-dependent gene regulations in human
cells by the use of integrative analysis strategies.
2. Used Future SOC Lab Resources
We used a Hewlett Packard DL980 G7 server that wasequipped with eight 8-core Intel Xeon X6550 pro-cessors and 128 GB of RAM running Ubuntu Server12.04 LTS. This powerful system was perfectly suitedfor our approach. The only disadvantage regardingflexibility was the restriction to weekly user time slots.
Figure 1. Dynamic pipeline for computa-tional analysis of high-throughput NGSdata.
3. Methods and tools
Genomic binding sites of the TFI were determinedby sequencing the DNA that was bound by the TFI,
95
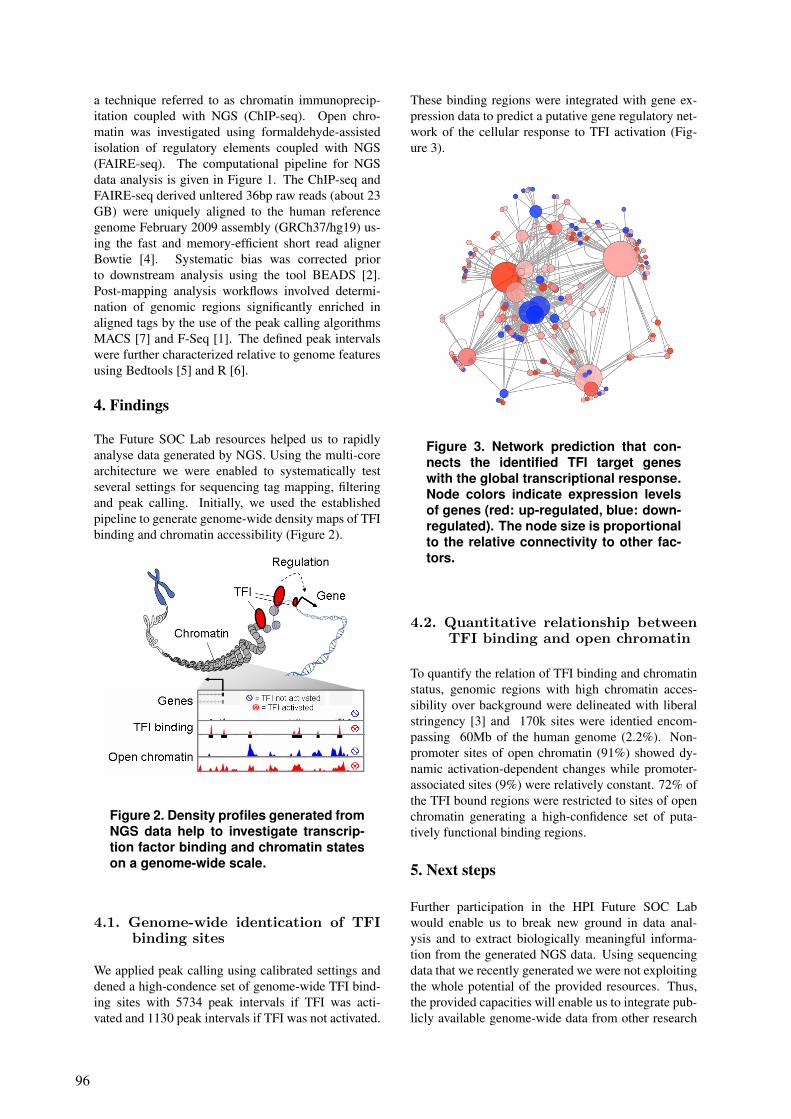
a technique referred to as chromatin immunoprecip-itation coupled with NGS (ChIP-seq). Open chro-matin was investigated using formaldehyde-assistedisolation of regulatory elements coupled with NGS(FAIRE-seq). The computational pipeline for NGSdata analysis is given in Figure 1. The ChIP-seq andFAIRE-seq derived unltered 36bp raw reads (about 23GB) were uniquely aligned to the human referencegenome February 2009 assembly (GRCh37/hg19) us-ing the fast and memory-efficient short read alignerBowtie [4]. Systematic bias was corrected priorto downstream analysis using the tool BEADS [2].Post-mapping analysis workflows involved determi-nation of genomic regions significantly enriched inaligned tags by the use of the peak calling algorithmsMACS [7] and F-Seq [1]. The defined peak intervalswere further characterized relative to genome featuresusing Bedtools [5] and R [6].
4. Findings
The Future SOC Lab resources helped us to rapidlyanalyse data generated by NGS. Using the multi-corearchitecture we were enabled to systematically testseveral settings for sequencing tag mapping, filteringand peak calling. Initially, we used the establishedpipeline to generate genome-wide density maps of TFIbinding and chromatin accessibility (Figure 2).
Figure 2. Density profiles generated fromNGS data help to investigate transcrip-tion factor binding and chromatin stateson a genome-wide scale.
4.1. Genome-wide identication of TFIbinding sites
We applied peak calling using calibrated settings anddened a high-condence set of genome-wide TFI bind-ing sites with 5734 peak intervals if TFI was acti-vated and 1130 peak intervals if TFI was not activated.
These binding regions were integrated with gene ex-pression data to predict a putative gene regulatory net-work of the cellular response to TFI activation (Fig-ure 3).
Figure 3. Network prediction that con-nects the identified TFI target geneswith the global transcriptional response.Node colors indicate expression levelsof genes (red: up-regulated, blue: down-regulated). The node size is proportionalto the relative connectivity to other fac-tors.
4.2. Quantitative relationship betweenTFI binding and open chromatin
To quantify the relation of TFI binding and chromatinstatus, genomic regions with high chromatin acces-sibility over background were delineated with liberalstringency [3] and 170k sites were identied encom-passing 60Mb of the human genome (2.2%). Non-promoter sites of open chromatin (91%) showed dy-namic activation-dependent changes while promoter-associated sites (9%) were relatively constant. 72% ofthe TFI bound regions were restricted to sites of openchromatin generating a high-confidence set of puta-tively functional binding regions.
5. Next steps
Further participation in the HPI Future SOC Labwould enable us to break new ground in data anal-ysis and to extract biologically meaningful informa-tion from the generated NGS data. Using sequencingdata that we recently generated we were not exploitingthe whole potential of the provided resources. Thus,the provided capacities will enable us to integrate pub-licly available genome-wide data from other research
96

groups with our own data in future work. Therefore,the already established computational pipeline shall beused to help to identify and understand the mechanismof metabolic pathologies and inflammatory processes.
References
[1] A. P. Boyle, J. Guinney, G. E. Crawford, and T. S. Furey.F-seq: a feature density estimator for high-throughputsequence tags. Bioinformatics (Oxford, England),24(21):2537–2538, Nov. 2008. PMID: 18784119.
[2] M.-S. Cheung, T. A. Down, I. Latorre, and J. Ahringer.Systematic bias in high-throughput sequencing data andits correction by BEADS. Nucleic Acids Research,39(15):e103, Aug. 2011. PMID: 21646344 PMCID:PMC3159482.
[3] K. J. Gaulton, T. Nammo, L. Pasquali, J. M. Si-mon, P. G. Giresi, M. P. Fogarty, T. M. Panhuis,P. Mieczkowski, A. Secchi, D. Bosco, T. Berney,E. Montanya, K. L. Mohlke, J. D. Lieb, and J. Ferrer.A map of open chromatin in human pancreatic islets.Nature genetics, 42(3):255–259, Mar. 2010. PMID:20118932.
[4] B. Langmead, C. Trapnell, M. Pop, and S. L. Salzberg.Ultrafast and memory-efficient alignment of short DNAsequences to the human genome. Genome biology,10(3):R25, 2009. PMID: 19261174.
[5] A. R. Quinlan and I. M. Hall. BEDTools: a flexible suiteof utilities for comparing genomic features. Bioinfor-matics (Oxford, England), 26(6):841–842, Mar. 2010.PMID: 20110278.
[6] R Core Team. R: A Language and Environment for Sta-tistical Computing. R Foundation for Statistical Com-puting, Vienna, Austria, 2012. ISBN 3-900051-07-0.
[7] Y. Zhang, T. Liu, C. A. Meyer, J. Eeckhoute, D. S.Johnson, B. E. Bernstein, C. Nusbaum, R. M. Myers,M. Brown, W. Li, and X. S. Liu. Model-based analy-sis of ChIP-Seq (MACS). Genome Biology, 9(9):R137,2008. PMID: 18798982 PMCID: PMC2592715.
97


ECRAM (Elastic Cooperative Random-Access Memory)HPI Future SOC Lab Project Report September 2012
Kim-Thomas Rehmann Kevin BeinekeMichael Schöttner
Institut für Informatik, Heinrich-Heine-Universität Düsseldorf,Universitätsstraße 1, 40225 Düsseldorf, Germany
E-Mail: [email protected]
Abstract
The ECRAM storage system is an experimental plat-form for data-centric cloud applications. In con-trast to a traditional one-copy serializable database,ECRAM allows highly concurrent accesses to storageobjects. It replicates objects in order to make themavaile on shared-nothing architectures. An adaptivereplication mechanism analyses object access patternsto switch dynamically between update and invalidateprotocol. We have evaluated the impact of differentreplication strategies on performance using HPI Fu-ture SOC Lab’s resources. The experiments demon-strate that adaptive replication scales better than up-date and invalidate replication for the applications un-der examination.
1 Project Idea
The ECRAM project addresses current research topicsrelated to storage for cloud applications [6]. ECRAMsimulates a shared in-memory storage [3] on shared-nothing clusters. The object-based storage providedby ECRAM is comparable to a key-value store, wherethe keys are object identifiers and the values containbinary object data. In contrast to most existing key-value stores, ECRAM increases availability by repli-cating data. It synchronizes objects optimistically inorder to allow atomic multi-object operations.ECRAM does not restrict the format of objects itstores. It neither associates any semantics with objectcontent. Applications can therefore implement row-based or column-based tables, or they can define aflexible data format, such as graph structures.Cloud applications often have read-optimized objectaccess patterns. Access patterns with prevailing readsare a benign workload for optimistic concurrencycontrol. Therefore, ECRAM implements optimisticmulti-version concurrency control using the concept ofmemory transactions. In contrast to traditional DBMStransactions, memory transactions operate on repli-
cated rather than partitioned data. Replication relievesECRAM from the need to handle distributed transac-tions. Transactions can access distributed storage, butthey always execute on a single node. The coloca-tion of in-memory storage and application code allowsECRAM to restart transactions transparently for appli-cations.By caching replicas in the application address space,ECRAM achieves zero-latency object accesses at thebest. Transparent access detection using virtualmemory hardware simplifies application development.ECRAM’s adaptive caching mechanism is able toswitch dynamically between update and invalidate se-mantics and to prefetch objects to reduce access la-tency. Adaptive caching monitors and analyses accesspatterns to predict future accesses.ECRAM can run on conventional compute clustersover TCP/IP networking as well as on a single ma-chine over the loopback network interface. Our exper-iments on HPI Future SOC Lab resources investigatethe performance of ECRAM’s adaptive replication ona multicore machine with huge main memory.This report is structured as follows. Section 2 sketchesdesign and implementation of the ECRAM distributedin-memory storage and of EMR, the in-memoryMapReduce implementation based on ECRAM. Sec-tion 3 describes the Future SOC Lab resources usedfor experiments with EMR, and Section 4 presents theresults of the measurements. Section 5 concludes thisreport.
2 Using ECRAM for in-memory MapRe-duce
The ECRAM in-memory storage implements update-anywhere objects on shared-nothing clusters. In or-der to make objects available on all participatingnodes ECRAM replicates objects. Therefore, consis-tency handling is an important part of its functionality.ECRAM’s builtin consistency handling enables lock-free implementation of applications and of program-ming frameworks such as EMR.
99

2.1 The ECRAM distributed in-memory storage
ECRAM’s consistency handling bases on memorytransactions in the sense of distributed transactionalmemory [2,7]. A memory transaction is a sequence ofread or write accesses by one computing node. If thetransaction’s read and write set does not intersect withtransactions committed in the meantime, the transac-tion is said to be valid and commits its changes atom-ically to the shared storage. If ECRAM detects an in-valid transaction, it transparently rolls back the spec-ulative transaction’s changes and restarts it. For effi-cient comparison of read and write sets, ECRAM hasa conflict unit size of 4 KB. In order to ensure theglobal serializability of transactions, ECRAM’s cur-rent implementation uses a central validator node. Ob-ject content is transferred directly between computingnodes.Accessing objects outside transactions is possible withECRAM, however read accesses may return out-of-date content, and changes are not stored permanently.In the course of optimizing ECRAM for MapReduceworkload, we have developed a relaxed transactionalconsistency targeted towards the needs of MapReduceapplications, which we describe in the next subsection.ECRAM implements three replication modes. The in-validation mode replicates objects only on demand. Toavoid frequent accesses to outdated object versions,ECRAM multicasts object invalidations using trans-action commit notifications. Invalidation mode con-sumes least bandwidth, but requires synchronous com-munication when accessing recently modified objects.The update mode sends the content of each modifiedobjects along with the commit notifications. Updatereplication has a high bandwidth requirements, but en-sures that replicas are almost always available withoutnetwork communication. The third replication mode,adaptive replication, monitors object accesses to de-tect object access patterns. In case of regular accesspatterns, the adaptive mode replicates objects only tothose nodes that will probably access the version ofthe object soon. Besides replicating objects for perfor-mance, ECRAM creates backup replicas to improvefault tolerance in case of failures.
2.2 The EMR Framework for In-memory MapReduce
In order to demonstrate the utility of distributed in-memory storage for MapReduce, we have devel-oped the EMR extended MapReduce framework [6].MapReduce applications running on EMR share in-formation by means of the ECRAM1 distributed in-memory storage. The EMR framework implements an
1ECRAM is an acronym for elastic cooperative random-accessmemory.
split
master
shuffle
merge
map jobs
reduce jobs
workers
whileiterate
in-memorystorage
inputobjects
outputobjects
inter-mediateobjects
Figure 1. Execution model of in-memoryMapReduce
extended MapReduce model comprising one-pass, it-erative and on-line execution of the MapReduce se-quence. Figure 1 illustrates the execution model ofin-memory extended MapReduce.The EMR framework stores application data as repli-cated objects in the ECRAM in-memory storage. Dur-ing MapReduce execution, the EMR framework auto-matically prepares input, intermediate and output ob-jects according to the application’s specification. Fur-thermore, worker nodes can create objects on theirown using the function ecram_alloc, which re-turns zero-initialized objects of the requested size. Ifan object is not needed any longer, it must be destroyedusing ecram_free. Objects in ECRAM may con-tain references to other objects, which allows applica-tions to implement distributed data structures.In general, transactional consistency is well-suited forirregular access patterns with low conflict probability.However, for applications that conform strictly to iter-ative MapReduce with alternating, stateless map andreduce phases, transactional consistency is slightly toostrong because the sequence of map and reduce phaseseliminates concurrent accesses. If the programmer canpreclude access conflicts, validation of transactions isdispensable. We have implemented a special weakconsistency which encapsulates accesses in transac-tions but assumes the absence of conflicts and omitsthe validation phase. The programmer selects non-validating transactions when calling ecram_bot.Like other MapReduce frameworks, EMR comprisesa scheduler for map and reduce jobs [5]. EMR storeswork-queues, jobs and configuration data in ECRAMto take advantage of automatic replication and consis-tency. To avoid busy waiting for conditions, EMR usesthe ecram_wait function that blocks until a stor-age object fulfills a given condition. Each work-queuehas a field specifying the current number of jobs inthe queue, which serves as a condition variable for theecram_wait synchronization primitive.EMR keeps a queue of map and reduce jobs foreach worker with the intention to minimize contentionon the queues. High contention would lead to hightransaction conflict rates and therefore degrade perfor-
100

mance. For a given number of worker nodes n, thefirst n jobs are assigned round-robin, and successivejobs are distributed randomly to the nodes. A moreadvanced load leveling policy could be implementedin a future version of EMR.In some MapReduce applications, job execution timehas significant outliers [1]. EMR implements a simplework-stealing approach to counteract workers idlingwhile others still have jobs in their queue. If a workerfinds that he is about to block on his empty queue, hescans the work-queues of his peers for jobs to stealfrom them. Given that work-queues are stored asshared objects, there is no danger of deadlocks or lostjobs.
3 Future SOC Lab Resources
We have executed our experiments on a HewlettPackard ProLiant DL980 G7 Server. The server isequipped with 8 Xeon Nehalem X7560 CPUs, eachhaving 8 hyper-threaded cores. The CPU clock ratesare 2,27 GHz, the L3 caches 24 MB large, and TurboBoost is enabled. The DL980 has 2 TB of RAM. Giventhat our experiments run in main memory of the sin-gle machine, they do not use the hard disks, neitherthe Fibre Channel network card. The DL980 bootsUbuntu Server 10.10 from a local harddisk and mountsthe home file-system from a NAS device.
4 Findings
Our previous project reports from October 2011 andMai 2012 have documented the initial results of run-ning ECRAM on Future SOC Lab. We had con-firmed that ECRAM runs on HPI Future SOC Laband scales comparably, and in some cases significantlybetter than on a distributed compute cluster. In theSpring 2012 period, we have assessed ECRAM’s per-formance more in detail with a special focus on adap-tive replication. Considering that ECRAM is a fullydistributed system, running several ECRAM programson one multicore machine constitutes a best case testenvironment because of the low latency and the highbandwith.Figure 2 shows the runtime of the raytracer applica-tion with an image size of 1800x2400 pixels and 228objects in the scene graph. The raytracer applicationis implemented using ECRAM’s framework for in-memory MapReduce [6]. In the map phase, the workernodes calculate the pixels in disjoint regions, and inthe reduce phase, the output image is produced. Theraytracer’s map phase is an embarrassingly parallelworkload, because each pixel in the output image istraced independent of any other pixel. The raytracer’sreduce phase simply collates all regions computed bydifferent nodes into the final output image. The invali-date protocol causes the reduce jobs to pull the output
Figure 2. Execution time of raytracerusing ECRAM on DL980, image size1800x2400 pixels
Figure 3. Execution time of KMeans us-ing ECRAM on DL980, 100,000 points in3D space with 16 cluster centers
from the map jobs, which increases the amount of syn-chronous network messages and thereby the overall la-tency. The update protocol distributes all data gener-ated to all other nodes, most of which do not accessthe data lateron. The bandwidth required to tranferthe huge amount of data limits scalability. The adap-tive replication protocol notices that the output of themap jobs is afterwards accessed by the reduce jobs.It sends updates directly from map workers to reduceworkers, which keeps the required bandwidth low andat the same time avoids synchronous requests to pullreplicas.Figure 3 shows the runtime of the KMeans applica-tion with 100,000 points in the 3D space, which aregrouped into 16 clusters. The KMeans algorithm isgenerally not so well parallelizable, because the it-erative execution often updates data. However, theadaptive replication protocol often successfully pre-dicts where data is required in the next round, so it
101

scales better than the invalidate or update protocol.
5 Next Steps
In the context of cloud computing, network and ma-chine failures are common. Therefore, the reliabilityof distributed storage is an important research topic.Until now, ECRAM provides reliability by means ofreplication in volatile memory. We are currently work-ing on providing persistency within ECRAM by log-ging and storing objects to durable storage such asharddisks, flash memory, solid state drives and phase-change memory. Each of these storage technologieshas its own characteristics, such that persistent stor-age should implement different policies for differenttechnologies. If time and resources permit, we intendto evaluate our distributed in-memory file-system [4],which is based on ECRAM and FUSE, on Future SOCLab.ECRAM enhances fault tolerance of parallel appli-cations by executing each thread in a private protec-tion domain. However, using this approach, differentthreads executing on the same machine cannot bene-fit from their colocation. OS-level IPC mechanismscould allow them to access shared data directly. Directsharing can potentially boost the performance of appli-cations on powerful multicore machines like the onesin HPI Future SOC Lab. We plan to implement directsharing techniques in ECRAM and evaluate them onFuture SOC Lab. Given that ECRAM was designedfor data sharing in shared-nothing compute clusters,we are also interested in evaluating ECRAM’s perfor-mance on a cluster of multicore machines.
References
[1] Ganesh Ananthanarayanan, Srikanth Kandula, Al-bert Greenberg, Ion Stoica, Yi Lu, Bikas Saha, andEdward Harris. Reining in the outliers in Map-Reduce clusters using Mantri. In Proceedings ofthe 9th USENIX conference on Operating systemsdesign and implementation, OSDI’10, pages 1–16, Berkeley, CA, USA, 2010. USENIX Associ-ation.
[2] Maurice Herlihy and Victor Luchangco. Dis-tributed computing and the multicore revolution.SIGACT News, 39(1):62–72, 2008.
[3] Hasso Plattner and Alexander Zeier. In-MemoryData Management. Springer, Berlin and Heidel-berg, Germany, 2011.
[4] Kim-Thomas Rehmann and Michael Schöttner.Adaptive meta-data management and flexible con-sistency in a distributed in-memory file-system.In Proceedings of the Twelfth International Con-ference on Parallel and Distributed Computing,
Applications and Technologies (PDCAT 2011),Gwangju, Korea, 10 2011.
[5] Kim-Thomas Rehmann and Michael Schöttner.Applications and evaluation of in-memory mapre-duce. In Proceedings of the Third InternationalIEEE Conference on Cloud Computing Technol-ogy and Science 2011 (CloudCom 2011), Athens,Greece, 12 2011.
[6] Kim-Thomas Rehmann and Michael Schöttner.An in-memory framework for extended MapRe-duce. In Proceedings of the Seventeenth IEEEInternational Conference on Parallel and Dis-tributed Systems 2011 (ICPADS 2011), Tainan,Taiwan, 12 2011.
[7] Paolo Romano, Luis Rodrigues, Nuno Carvalho,and Joäo Cachopo. Cloud-TM: harnessing thecloud with distributed transactional memories.SIGOPS Oper. Syst. Rev., 44:1–6, April 2010.
102

Analysis of CPU/GPU data transfer bottlenecks in multi-GPU systems for
hard real-time data streams
Uri Verner Technion IIT
Technion City, 32000 Haifa, Israel
Assaf Schuster Technion IIT
Technion City, 32000 Haifa, Israel
Avi Mendelson Technion IIT
Technion City, 32000 Haifa, Israel
Abstract
This project is a part of our effort to extend the
framework to multi-GPU systems. In this scope, we
focused on the analysis of data transfers between a
host and multiple GPU devices, for streaming work-
loads. We identified important bottlenecks in data
transfers, and showed that data transfers to different
GPUs are interdependent. By changing the configu-
ration of GPU cards in the Tesla machine, we in-
creased the overall bandwidth between the main
memory and the GPUs, and stabilized it.
1 Introduction
Modern real-time data stream processing systems typically use high-bandwidth connections both inter-nally and to external sources of data, and have high computational demands. The increasing amounts of collected data and the demand for its processing have far passed the compute capabilities of traditional CPU-only systems. Compute accelerators, such as FPGAs, DSPs and GPUs, are a common way to in-crease a systems’ computing capabilities for specific tasks. However, processing real-time data on a heter-ogeneous system poses great challenges in data trans-fer, scheduling, load balancing, software design, syn-chronization, and more. Previously, we have developed a high-throughput software framework for processing of multiple real-time streams on a heterogeneous system with a multi-core CPU and a single GPU [1]. The framework re-ceives a configuration of the workload – the number of data streams and their compute and latency re-quirements – and statically distributes the streams between the CPU and the GPU in a way that guaran-tees that their execution will not result in a deadline miss. Then, each stream is processed on the device it was assigned. This project is a part of our effort to extend the framework to multi-GPU systems. In this scope, we focused on the analysis of data transfers between a host and multiple GPU devices, for streaming work-loads. We identified important bottlenecks in data transfers, and showed that data transfers to different
GPUs are interdependent. The last observation is contrary to the basic assumption that each data trans-fer to a GPU takes a unique path over a separate, per-GPU, PCI-Express bus.
2 CPU/GPU data transfers
We begin by describing the underlying hardware architecture of a large multi-GPU system.
Figure 1: System architecture of a multi-GPU platform
2.1 Architectural description
Figure 1 depicts the high-level architecture of a large GPU-based system. There are five major types of components in the CPU/GPU data transfer pipeline: main memory, multicore CPUs, I/O hubs (IOH), PCI Express switches (gray boxes in Fig. 1), and GPUs. An on-chip memory controller connects the multicore CPUs to the memory bus. The CPUs are linked with fast interconnects between themselves and to the I/O hubs. These interconnects communicate directly with the memory controller. Thus, I/O hubs also have ac-cess to main memory. I/O hubs connect to GPUs over a PCI-Express tree-shaped bus hierarchy. Each I/O hub supports two links. Each link is multiplexed using a PCI Express switch to two or more links, and eventually these links are attached to GPUs.
CPU
CPU
MEM
MEM
IOH
IOH
GPU
GPU
GPU
GPU
103

2.2 Streaming data transfers
In GPU applications, data is most commonly copied from main memory to GPU memory, and back. In this work, in the context of extending our hard real-time stream processing framework to multi-GPU systems, we concentrate on transferring data streams to multiple GPUs and back continuously and simul-taneously. Therefore, we redirect input streaming data from main memory to the GPUs over the follow-ing path: main memory CPU IOH PCIe switch GPU memory. Output is redirected over the same path in the opposite direction.
2.3 Transfer bandwidth and predictability
The workload for our framework is hard real-time data streams. Hence, it is essential that the latency of data processing will be predictable. Data transfers are a major part of processing, so the framework needs to be able to compute a tight bound on their duration. Transfer bandwidth to and from the GPUs is also an issue of great importance to the system, since its throughput is limited by the effective bandwidth for data transfers in and out of the GPUs. In this project, we examine how the latency and throughput of a data transfer between the main memory and a GPU are influenced by concurrent data transfers to different GPUs.
3 Experiments
We ran benchmarks that measure the latency and throughput of data transfers between the host and the GPUs. In each experiment, a data chunk of 128MB is transferred to or from one or more GPUs. The data transfers are concurrent and are always done in the same direction (host-to-device or device-to-host). The results were calculated as an average over 100 transfers. We used the Tesla machine in the Future SOC lab for the experiments. The architecture and initial setup of the machine is illustrated in figure 2. The system has two Xeon (Nehalem) E5620 processors and supports 8 GPUs, but only has four GPUs of type NVIDIA Tesla C2050. The main board in use was TYAN FT72B7015, which has eight x16 PCI Express 2.0 slots. The CPUs and the IOHs are connected with point-to-point QPI links.
Figure 2: Architecture of the Tesla machine
3.1 Bandwidth maximization by card rear-
rangement
The bandwidth test results for the system were incon-sistent; repeating executions of the same experiment gave different results. At its highest value, the band-width to the four GPUs was limited by twice the bandwidth of a PCIe link, due to the use of multi-plexing PCIe switches. Hence, we recommended that the configuration of GPUs be changed in a way that no two GPUs share a PCIe switch, as illustrated in figure 3.
Figure 3: Architecture of the Tesla machine with altered configuration of GPUs
As a result, the benchmark results stabilized and re-turned similar values in repeating executions. The total bandwidth improved as well.
3.2 Latency of data transfers
Predictable and persistent latency of data transfer operations is critical to our framework, since hard real-time stream processing requires a priori schedul-ing. For each data transfer, we measured the time from issue to completion. We ran experiments that transfer data from the host to all possible groups of one or more GPUs. The results showed that the latencies of data transfers to different GPUS are inter-dependant. Moreover, in some cases, the transfers are serialized, and the order of serialization is arbitrary.
4 Conclusions and discussion
High bandwidth and predictable latency of data trans-fers between the host and the GPUs are essential to the hard real-time data stream framework. System architecture and its configuration have great influ-ence on these parameters. We increased the total bandwidth between the main memory and the GPUs, and made it stable, by rear-ranging the GPU cards so that no two GPU cards share a PCI Express switch. The latency of a data transfer to a GPU depends on concurrent transfers to other GPUs. Hence, the stream processing framework cannot schedule data transfers independently. As a result, we recommend that the framework perform data transfers to all the
CPU
CPU
MEM
MEM
IOH
IOH
GPU
GPU
GPU
GPU
CPU
CPU
MEM
MEM
IOH
IOH GPU
GPU
104

GPUs in a single stage. The latency of this stage can be predicted by dividing the total amount of trans-ferred data and divide it by the aggregate bandwidth to all GPUs. Even though it is not known in which order the transfers are finished, the overall transfer time is stable and can easily be predicted. Further research is required to determine the reasons for the inconsistent latency results and the bottle-necks for throughput.
References
[1] U. Verner, A. Schuster and M. Silberstein: Processing data streams with hard real-time constraints on heter-ogeneous systems. Proceedings of the 2011 ACM In-
ternational Conference on Supercomputing, June 2011.
105


KONECT Cloud – Large Scale Network Mining in the CloudReport, Spring 2012
Dr. Jerome KunegisWeST – Institute for Web Science and Technologies
University of Koblenz–[email protected]
Abstract
In the Spring 2012 run at the Future SOC Lab, weused the KONECT framework (Koblenz Network Col-lection) to compute network statistics, distributions,plots, matrix decompositions and link prediction eval-uations on the network of KONECT. The results areused on the project website konect.uni-koblenz.de, andinternally at the University of Koblenz–Landau fornetwork analysis research.
1 Introduction
KONECT (the Koblenz Network Collection [2],konect.uni-koblenz.de) is a project to collect networkdatasets, provide a framework for the computation net-work statistics, and display them online. One of theproject’s goals is to include a high number of diversenetwork datasets of many different types. Currently,KONECT holds 186 network datasets from 15 cate-gories; an overview is given in Figure 1 and Table 1.Networks in KONECT are also diverse in their struc-ture – they can be directed, undirected, bipartite, un-weighted, have multiple edges, signed, have ratings,and timestamps. At the same time, KONECT strivesto implement and compute many different numericalnetwork statistics, analysis plots, distributions, ma-trix decompositions and link prediction algorithms.This combination leads to a high number of differentnetwork-statistic combinations that must be computed.In addition to providing a website in which the net-work statistics are navigable and browsable, the com-puted statistics are used for network analysis research.For instance, papers studying measures of diversityand power law have used the data compute by theKONECT project [3, 4].
2 Performed Analyses
The analyses computed in KONECT include the fol-lowing; a detailed definition for each of these is givenin the KONECT Handbook [1].
101
102
103
104
105
106
107
108
100
101
102
103
104
G2
ZAHT
SWAN Nc
SI
PM
FWFD
EF
A@
UG
Na
Shf
AS
ShRpa
PSPG
FB
OF
AF
IF
PW
HY
HA
SBPi
ADRro
AC
UF
Ff
INSX
UC
WRTL
GC
GN
M1
PR
DGMti
Mui
Mut
OCRL
EL
LOST
GPSD YG
TO
EA
nfrTHc
GE
bfr
thAPBK
GH
PHc
EU
Rer
CN
TM
SA
SZWOW2
JE
Ws
Rda
qen
WN
R2
BX
EPnen
M2
Ow
RM
NDW3
Vut
GWEN
mde
FI
CS
Vti
benVui
Fc
SF
Ol
SO
YD
BArEX
R2AM
WC
Sc
But
R1
BuiBti
Wti
Cut
CtiCui
WU
GO
WKRO
DB
Sd
Pa
FG
BSWutZHi
CO
TH
WT
LIc
PH
SK
AR
mfr
HUi
Scd
men
M3
BAiHUr
LI
PC
ER
Wui
Wa
Pc
Lb
Ls
Fr
YT
ites
Wpl
Ic
RE
WptFL
Wja
ZS
WPWru
LJ
Wde
frde
TRWit
LG
FSG
Wfr
OR
IF
DL
NX
OG
YS
en
Dui
Dut
Dti
WenTWTF
Size (|V|) [vertices]
Avera
ge d
egre
e (
d)
[edges / v
ert
ex]
Figure 1. All networks in KONECT ar-ranged by the size (the number of nodes)and the average number of neighbors ofall nodes. Each network is representedby a two- or three-character code. Thecolor of each code corresponds to thenetwork category as given in Table 1.
The numerical analyses computed include the con-nected components, the diameter, the radius, the es-timated power-law exponent, the Gini coefficient, thedegree distribution entropy, the algebraic connectivity,the algebraic conflict, the frustration, the bipartivity,the number of triangles and the clustering coefficient.The computed plots include the edge weight and de-gree distributions, the Lorenz curve, spectral plots andhop plots. A sample of computed plots is shown inFigure 2, showing a screenshot of the Plots section ofthe KONECT website.Computed matrix distributions include the eigenvaluedecomposition, the singular value decomposition andDEDICOM-type decompositions (Decomposition intoDirected Components) of various characteristic graphmatrices including the adjacency matrix, the normal-ized adjacency matrix, the Laplacian matrix, asym-metric matrices, complex matrix, and other, experi-mental decompositions.Computed link prediction algorithms include preferen-tial attachment, counting connecting paths, graph ker-nels and solving logistic regression models.
107

Figure 2. Network analysis plots computed in KONECT and shown on the KONECT website.
108

Table 1. The network categories in KONECT. Each category is assigned a color, which isused in plots, for instance in Figure 1. The given dataset counts are current as of April 2013.
Category Vertices Edges Count
Affiliation Actors, groups Memberships 8 Authorship Authors, works Authorships 18 Co-occurrence Items Co-occurrences 2 Communication Persons Messages 8 Contact Persons Interactions 4 Features Items, features Properties 5 Folksonomy Users, tags, items Tag assignments 17 Interaction Persons, items Interactions 14 Lexical Words Lexical relationships 5 Physical Various Physical connections 13 Ratings Users, items Ratings 11 Reference Documents References 28 Semantic Entities Relationships 1 Social Persons Ties 29 Text Documents, words Occurrences 5
3 Implementation
The KONECT code executed on Future SOC Labservers is written in the Matlab programming lan-guage. The code is available in form of a Matlab tool-box.1
We used a single server having 2 terabytes of mem-ory (RAM) and 128 cores. Each computation used be-tween one and seven CPUs in parallel; with the matrixdecompositions using the most parallelism. To controlthe execution, a Makefile-based framework was used,using the -j option to enable parallelization. In accor-dance with our previous experiments with KONECT,the bottleneck for the computation of network statis-tics is memory, not CPU. Thus, we were able to fullyuse the 2 terabytes available.
4 Conclusions and Acknowledgements
The computation of network analyses is not finished.First, the available runtime was not enough to executeall analyses for all networks. Furthermore, more net-work analyses and networks are added to KONECTconstantly, and we are constantly computing new data.We thank the Future SOC Lab for supporting theKONECT project through making available hardware.KONECT was written by Jerome Kunegis, DanielDunker and Holger Heinz. We also thank every-one who has made available network datasets; seehttp://konect.uni-koblenz.de/about for a full list.
1konect.uni-koblenz.de/toolbox
References
[1] J. Kunegis. Handbook of network analysis [KONECT –the Koblenz Network Collection], 2013.
[2] J. Kunegis. KONECT – The Koblenz Network Collec-tion. In Proc. Int. Web Observatory Workshop, 2013.
[3] J. Kunegis and J. Preusse. Fairness on the web: Alter-natives to the power law. In Proc. Web Science Conf.,pages 175–184, 2012.
[4] J. Kunegis, S. Sizov, F. Schwagereit, and D. Fay. Di-versity dynamics in online networks. In Proc. Conf. onHypertext and Social Media, pages 255–264, 2012.
109


Adaptive Realtime KPI Analysis of ERP transaction data using In-Memory
technology
Prof. Dr. Rainer Thome Dipl.-Kff. Patricia Kraft
Chair of Business Administration and Business Computing
Joseph-Stangl Platz 2 97070 Würzburg
[email protected] [email protected]
Dr. Andreas Hufgard Dipl.-Kfm. Fabian Krüger Dipl.-Kfm. Ralf Knauer
IBIS Labs Mergentheimer Str. 76a
97082 Würzburg [email protected] [email protected] [email protected]
Abstract
The adaptable real-time analysis provides an answer
to the greater complexity and size of advanced ERP
systems (big data), and increased market demands
for speed and quality of decision-related data. In-
memory storage enables direct access to document or
change data, and allows greater flexibility when se-
lecting by date, organization and many other charac-
teristics. During this project we have been able to
gain some basic knowledge about SAP HANA and
establish a data connection between HANA and SAP
ERP using the SAP Landscape Transformation Serv-
er.
1 Setting up the environment
In the beginning of the project we were given access to the Windows Terminal Server (WTS) in order to connect to a SAP HANA instance hosted in Walldorf.
This should bridge the time gap until the system in Potsdam at HPI is available. Therefore the Walldorf system was kind of a playground for working through tutorials, creating the first tables and views.
1.1 Difficulties
The HANA instance accessed via WTS was running an old release at the beginning (as of November 2011). This led to a lack of functionality, for instance, it was not possible to upload data to the tables from a local .csv file. After the first upgrade we still found some bugs or glitches. Especially importing date-related data was very complicated due to local set-tings as well as SAP HANA creating columns of the type “timestamp” instead of “date” when using the .csv import. The issues have been reported to our contact person at HPI and have been fixed in the fol-lowing revisions.
1.2 Lessons learned
In SAP HANA you can create Attribute Views, Ana-
Figure 1: Creating an analytical view in SAP HANA Studio
111

lytical Views (Figure 1), Graphical Calculation Views, SQL Script Calculation Views and (stored) Procedures. Each of these Objects has some capabili-ties and restrictions and their complexity increases from the simple graphical Attribute Views to the complex scripted procedures. For example, an Attribute View has no measures and therefore can be used for master data analysis. Ana-lytical Views are usually used for creating star schemes when combining a transactional table with the corresponding master data. When it comes to time-travel and other special types of Analysis, only scripted views or procedures provide the necessary capabilities. Therefore we also had to acquire some knowledge about SQL Script, the language used to create procedures.
2 Project related progress
The project aim is to create a fully functional proto-type of an interactive realtime analysis environment. There are three separate activities needed to achieve this goal: You need a user interface or presentation layer, data to run the analysis on and last but not least the calculations which turn the data into KPIs to be displayed.
2.1 Presentation layer
SAP HANA Studio has an integrated analysis client for data preview (Figure 2). Although it provides a wide range of different chart types and the ability to “drag-and-drop” columns into the label axis, the val-ue axis or filter, it will not be suitable as output medi-um. First, the preview is limited to a maximum of 5,000 rows, and second, people in the target group for these reports won’t be running SAP HANA Stu-dio, which is made for developers. For this project we intend to use “Analysis for Microsoft Excel”, which
is part of the Business Objects Suite. The connection from Excel to SAP HANA is working flawless and is an easy way to present the data. However, the filter-ing of Data is not as interactive as in the HANA Stu-dio and organizing a lot of Excel files and sheets can be very confusing. Drill-Down-Possibilities are lim-ited, too. Therefore we plan to use some of the other SAP BusinessObjects tools for presentation. We will need to evaluate those and find one which fits our needs. There is a tool called SAP BusinessObjects Information Steward which looks very promising.
2.2 Connection to SAP ERP
In order to do realtime analysis you need realtime data. That’s why we connected SAP HANA to an SAP ERP System by using SAP System Landscape Transformation (Figure 3). The SLT Server creates a database Trigger in the source system (we used a pre-configured IDES system at SAP) and replicates all changes (in the selected tables) to the SAP HANA database. Another fact that requires a continuous stream of data is that we want to do some time-travel analysis. If you have only one point in time where the table is created and initially filled with data, a time travel analysis makes no sense at all. Updating the data in intervals of weeks or month wouldn’t do the job either, that’s why we rely on realtime replication of the transactional ERP data. Currently we have the connection between the SAP HANA database at SAP and an IDES system at SAP which is the source system and SLT server at the same time. Since the HANA System at SAP will be replaced by the one in Potsdam at HPI, we will need to configure a new connection for replication. As we can’t create a VPN tunnel from Potsdam to the internal SAP net-work, we will also need a new SAP ERP system as data source as well as an SLT server.
Figure 2: Built-in analysis view in SAP HANA Studio
112

There is a SAP ERP available at the University of Wuerzburg which contains up-to-date transactional data from case studies in training courses. We would like to use this system, but we would need to get the DMIS addon/license installed in order to allow SLT connections. Additionally an SLT server would have to be set up at HPI in Potsdam. In case the process of getting the required licenses and addons for the SAP ERP in Wuerzburg is too complicated we would need a SAP ERP and SAP SLT system hosted in Potsdam at HPI.
2.3 KPI Calculations
Since building star schemas is not a real innovation in SAP HANA, we focus our research on the historic tables and time travel. This means we build a KPI which is normally dependent from a reference date. For example you can calculate the open sales order items by joining the tables VBAK (Sales document: header data), VBAP (Sales document: items data) and VBUP (Sales document: item status). You count the rows where the document category is ‘C’ (Order), the overall processing status is ‘A’, the overall delivery status is ‘A’ and there is no lock or cancellation on header and item level. You can run this query on every database to get the open orders at this point of time (=now). But on SAP
HANA you can classify the tables as ‘historic table’ and add a time-travel clause to the select statement. By appending ‘AS OF UTCTIMESTAMP […]’ you can calculate the open orders at any point of time. To make things easier we created a procedure called ‘open_orders_as_of’ which has a timestamp as input parameter. The result table of this function call is shown in Figure 4. Once we activated this function we simply call it mul-tiple times for the last X days, union the X result ta-bles into a single one and then we already have the KPI ‘Open sales order items’ in a timeline for the last days. From now on it would also be easy to add the sum of the net price or add other columns than sales organization and item category. This historic data can then be used for automated monitoring and triggering alerts as well as context for interpreting the numbers.
3 Further research and needed re-
sources
Until now we have already proven that SAP HANA has all capabilities to enable the interactive reporting we looked for. We created our first KPI and were able to retrieve the values even for dates in the past. Nevertheless, there is still a lot of research to do:
The analysis period for the KPI is only static right now. In the scenario of an interactive analysis the user should be able to set the analysis timeframe by himself.
Until now we only have built one KPI. We need to build other KPIs to prove our con-
Figure 3: Connection from SAP HANA to SLT and Source System
Figure 4: Result table of function call
113

cept. There are similar ones like blocked, cancelled and completed orders and some which need to be calculated differently like ‘changed orders’.
We are planning to make use of the native R Integration to calculate trends, recognize patterns and trigger alerts based on customer specific data from the past. This way the threshold for the alerts can be set automati-cally without the need of a manual defini-tion.
As mentioned before we need to find a way to present the data and controls for the inter-active analysis. Excel is a first step but we will need to evaluate some of the Busi-nessObjects tools.
3.1 Needed resources
This project requires the following resources: Access to the HANA database at HPI
through SAP HANA Studio
SAP HANA link to an ERP database via SAP landscape trans-formation (SLT) repli-cation server (trigger-based replication)
SAP Business Objects or Microsoft Excel for visualizing reports
The following requirements have been met and can be used for the project:
SAP ERP incl. database, located in Wuerzburg, 100/100 Mbit connection
114

The Impact of Software as a Service
Till WinklerHumboldt-Universitat zu Berlin
10178 Berlin, [email protected]
Abstract
Dieses Dokument beschreibt den Stand und Zwischen-ergebnisse der empirischen Studie ”The Impact ofSoftware as a Service”, welche von der Humbodt-Universitat zu Berlin (HU) mit Unterstutzung des HPIFuture SOC Lab und der SAP AG durchgefuhrt wur-de. Insgesamt konnten uber diese Kooperation 32vollstandige Datensatze zur Nutzung von verschie-denen SaaS-Losungen in Anwenderunternehmen ge-wonnen werden. Prasentiert werden hier einige aus-gewahlte deskriptive Merkmale dieses Datensatzes.Fur weiterfuhrende Auswertungen ist geplant, dieseDaten mit denen einer weiteren Erhebung zusammenzu fuhren und wissenschaftlich auszuwerten.
1. Hintergrund
Die wachsende Verbreitung von Software as a Service(SaaS) ist im Begriff die Zusammenarbeit von Fach-und IT-Bereichen in Unternehmen zu verandern. Da-durch dass weite Teile des Anwendungs- und Infra-strukturmanagements fur SaaS von externer Anbieter-seite ubernommen werden, andert sich ebenfalls dieinterne Aufteilung von Rollen und Verantwortlichkei-ten (die Governance) zwischen Nutzern und IT Mitar-beitern in Unternehmen.An der Humbodt-Universitat wurden in diesem Kon-text verschiedene qualitativ und quantitativ ausgerich-tete Arbeiten durchgefuhrt, welche nun durch die ak-tuelle Studie ”The Impact of Software as a Service”erganzt werden sollen. Ziel dieser Studie ist insbeson-dere zu erforschen, inwieweit sich verschiedene Auf-teilungen der IT-Verantwortlichkeiten auf die Qualitatder internen Zusammenarbeit – und damit auf die Qua-litat der SaaS-Nutzung insgesamt – auswirken.Das HPI Future SOC Lab und seine Kooperationspart-ner (insbesondere die SAP AG) haben sich im Rah-men des vergangenen Future SOC Day bereit erklart,im Rahmen einer akademischen Partnerschaft diesesProjekt und die notwendige Datenerhebung zu un-terstutzen.
2. Vorgehen und ausgewahlte deskriptiveErgebnisse
Vorgehen und ausgewahlte deskriptive Ergebnisse ImMai-Juni 2012 wurde ein bestehendes Instrumentals Online-Fragebogen umgesetzt und im Hinblickauf die Datenerhebung unter SAP-Kunden inhaltlichund Layout-technisch umgestaltet sowie die Umfragevorbereitet. Qualitatssicherung und Pretests erfolgtendurch verschiedene Mitarbeiter der SAP.Ab dem 2. Juli wurde die Umfrage uber verschiedeneOnline-Kanale beworben. Hierzu gehorten insbeson-dere der SAP Blog1, die LinkedIn Gruppe SAP Busi-ness By Design2, die SAP ByDesign-Gruppe in Xing3,die Facebook-Seite SAP Cloud Solutions4 sowie einPost im Tweet SAP Cloud Solutions uber Twitter5.Aufgrund des vergleichsweise schwachen Rucklaufs,wurde die Umfrage ab Mitte Juli zusatzlich auch in di-versen Usergruppen der SAP AG weltweit gepostet so-wie die offizielle Fragebogenlaufzeit auf Ende Augustverlangert. Abbildung 1 zeigt den Verlauf der (nutzba-ren und nicht nutzbaren) Antworten uber die Zeit.
Vorgehen und ausgewählte deskriptive Ergebnisse
Im Mai-Juni 2012 wurde ein bestehendes Instrument als Online-Fragebogen umgesetzt und im Hinblick auf die Datenerhebung unter SAP-Kunden inhaltlich und Layout-technisch umgestaltet sowie die Umfrage vorbereitet. Qualitätssicherung und Pretests erfolgten durch verschiedene Mitarbeiter der SAP.
Ab dem 2. Juli wurde die Umfrage über verschiedene Online-Kanäle beworben. Hierzu gehörten insbesondere der SAP Blog1, die LinkedIn Gruppe SAP Business By Design2, die SAP ByDesign-Gruppe in Xing3, die Facebook-Seite SAP Cloud Solutions4 sowie ein Post im Tweet SAP Cloud Solutions über Twitter5. Aufgrund des vergleichsweise schwachen Rücklaufs, wurde die Umfrage ab Mitte Juli zusätzlich auch in diversen Usergruppen der SAP AG weltweit gepostet sowie die offizielle Fragebogenlaufzeit auf Ende August verlängert. Abbildung 1 zeigt den Verlauf der (nutzbaren und nicht nutzbaren) Antworten über die Zeit.
Abbildung 1. Teilnehmer über die Fragebogenlaufzeit
Der Fragebogen gliederte sich in fünf große Abschnitte:
I. Company and Participant Profile II. IT Organisation Characteristics
III. SaaS Application Details IV. Business and IT Role in Managing SaaS (focus topic) V. Outcomes of using SaaS
Insgesamt haben 245 Personen den Fragebogen aufgerufen. 84 Personen haben den ersten Abschnitt ausgefüllt, 32 Teilnehmer haben den Fragebogen beendet. Die genaue Teilnahme über die gesamte Länge des Fragebogens (bzw. der „Dropout“) ist in Abbildung 2 dargestellt. Insgesamt bewegt sich der Verlust von Teilnehmern im normalen Bereich. Die Dauer zum Ausfüllen des Fragebogens betrug laut dem Umfrage-Tool durchschnittlich rund 20 Minuten.
1 http://blogs.sap.com/cloud/2012/07/02/scientific-study-among-users-of-sap-cloud-products-please-participate-by-the-end-of-august/ 2 http://www.linkedin.com/groups?gid=138840&trk=hb_side_g 3 https://www.xing.com/net/prib961b4x/sapbyd/. 4 http://www.facebook.com/SAPCloudSolutions 5 https://twitter.com/#!/SAPCloud
64
Abbildung 1. Teilnehmer uber die Frage-bogenlaufzeit.
1http://blogs.sap.com/cloud/2012/07/02/scientific-study-among-users-of-sap-cloud-products-please-participate-by-the-end-of-august/
2http://www.linkedin.com/groups?gid=138840&trk=hb side g3https://www.xing.com/net/prib961b4x/sapbyd/4http://www.facebook.com/SAPCloudSolutions5https://twitter.com/#!/SAPCloud
115

Der Fragebogen gliederte sich in funf große Abschnit-te:
I Company and Participant Profile
II IT Organisation Characteristics
III SaaS Application Details
IV Business and IT Role in Managing SaaS (focustopic)
V Outcomes of using SaaS
Insgesamt haben 245 Personen den Fragebogen auf-gerufen. 84 Personen haben den ersten Abschnitt aus-gefullt, 32 Teilnehmer haben den Fragebogen beendet.Die genaue Teilnahme uber die gesamte Lange desFragebogens (bzw. der ”Dropout“) ist in Abbildung2 dargestellt. Insgesamt bewegt sich der Verlust vonTeilnehmern im normalen Bereich. Die Dauer zumAusfullen des Fragebogens betrug laut dem Umfrage-Tool durchschnittlich rund 20 Minuten.
Abbildung 2. Gültige Teilnahmen pro Fragebogenabschnitt
Die überwiegende Mehrheit der Teilnehmer wurde offenbar über die SAP Usergruppen akquiriert, hierauf deuten neben Abbildung 1 ebenfalls die http-Dereferrer. Hierbei handelt es sich nahezu ausschließlich um internationale Teilnehmer. 80 Prozent haben den Fragebogen auf Englisch ausgefüllt (Standardsprache). Das Herkunftsland wurde jedoch bewusst nicht als explizites Merkmal mit abgefragt. Abbildung 3 zeigt eine Aufschlüsselung der Teilnehmer nach Branchen.
Other: Software IT services IT Software Development IT Consumer electrical and electronics Music Industry Petrochemicals Consumer Packaged Goods Local Government Energy Management Medical Devices Conglomerate: Chemicals,
autoparts, food, etc HR and Payroll service
Abbildung 3. Teilnehmer-Branchen
Die Teilnehmer wurden gebeten, zunächst Auskunft über die Gesamtheit aller SaaS-Anwendungen zu geben, die in Ihrem Unternehmen im Einsatz sind, bevor gezielte Fragen zu einer SaaS-Anwendung ihrer Wahl gestellt wurden. Abbildung 4 zeigt die verwendeten SaaS-Anwendungen nach Anbieter-Plattformen, welche in der Studie aufgeführt wurden. Bemerkenswert erscheint, dass nur 13 der 32 Befragten SAP On-Demand Lösungen einsetzen. Dies spricht für die breite Streuung der Studie, welche offenbar auch von zahlreichen SaaS-Interessierten im Umfeld der SAP wahrgenommen wurde, welche (noch) nicht notwendigerweise SAP Cloud-Kunden sind. Da bei dieser Frage Mehrfachnennungen möglich waren, lässt sich übrigens sagen, dass etwa die Hälfte der befragten Unternehmen (46%) mehr als eine einzige SaaS-Lösung im Einsatz hat.
65
Abbildung 2. Gultige Teilnahmen proFragebogenabschnitt.
Die uberwiegende Mehrheit der Teilnehmer wurde of-fenbar uber die SAP Usergruppen akquiriert, hier-auf deuten neben Abbildung 1 ebenfalls die http-Dereferrer. Hierbei handelt es sich nahezu ausschließ-lich um internationale Teilnehmer. 80 Prozent habenden Fragebogen auf Englisch ausgefullt (Standard-sprache). Das Herkunftsland wurde jedoch bewusstnicht als explizites Merkmal mit abgefragt. Abbildung3 zeigt eine Aufschlusselung der Teilnehmer nachBranchen.Other: Software; IT services; IT Software Develop-ment; IT; Consumer; electrical and electronics; MusicIndustry; Petrochemicals; Consumer Packaged Goods;Local Government; Energy Management; Medical De-vices; Conglomerate: Chemicals, autoparts, food, etc;HR and Payroll service
Abbildung 2. Gültige Teilnahmen pro Fragebogenabschnitt
Die überwiegende Mehrheit der Teilnehmer wurde offenbar über die SAP Usergruppen akquiriert, hierauf deuten neben Abbildung 1 ebenfalls die http-Dereferrer. Hierbei handelt es sich nahezu ausschließlich um internationale Teilnehmer. 80 Prozent haben den Fragebogen auf Englisch ausgefüllt (Standardsprache). Das Herkunftsland wurde jedoch bewusst nicht als explizites Merkmal mit abgefragt. Abbildung 3 zeigt eine Aufschlüsselung der Teilnehmer nach Branchen.
Other: Software IT services IT Software Development IT Consumer electrical and electronics Music Industry Petrochemicals Consumer Packaged Goods Local Government Energy Management Medical Devices Conglomerate: Chemicals,
autoparts, food, etc HR and Payroll service
Abbildung 3. Teilnehmer-Branchen
Die Teilnehmer wurden gebeten, zunächst Auskunft über die Gesamtheit aller SaaS-Anwendungen zu geben, die in Ihrem Unternehmen im Einsatz sind, bevor gezielte Fragen zu einer SaaS-Anwendung ihrer Wahl gestellt wurden. Abbildung 4 zeigt die verwendeten SaaS-Anwendungen nach Anbieter-Plattformen, welche in der Studie aufgeführt wurden. Bemerkenswert erscheint, dass nur 13 der 32 Befragten SAP On-Demand Lösungen einsetzen. Dies spricht für die breite Streuung der Studie, welche offenbar auch von zahlreichen SaaS-Interessierten im Umfeld der SAP wahrgenommen wurde, welche (noch) nicht notwendigerweise SAP Cloud-Kunden sind. Da bei dieser Frage Mehrfachnennungen möglich waren, lässt sich übrigens sagen, dass etwa die Hälfte der befragten Unternehmen (46%) mehr als eine einzige SaaS-Lösung im Einsatz hat.
65
Abbildung 3. Teilnehmer-Branchen.
Die Teilnehmer wurden gebeten, zunachst Auskunftuber die Gesamtheit aller SaaS-Anwendungen zu ge-ben, die in Ihrem Unternehmen im Einsatz sind, be-vor gezielte Fragen zu einer SaaS-Anwendung ihrerWahl gestellt wurden. Abbildung 4 zeigt die verwen-deten SaaS-Anwendungen nach Anbieter-Plattformen,welche in der Studie aufgefuhrt wurden. Bemerkens-wert erscheint, dass nur 13 der 32 Befragten SAPOn-Demand Losungen einsetzen. Dies spricht fur diebreite Streuung der Studie, welche offenbar auch vonzahlreichen SaaS-Interessierten im Umfeld der SAPwahrgenommen wurde, welche (noch) nicht notwen-digerweise SAP Cloud-Kunden sind. Da bei dieserFrage Mehrfachnennungen moglich waren, lasst sichubrigens sagen, dass etwa die Halfte der befragten Un-ternehmen (46%) mehr als eine einzige SaaS-Losungim Einsatz hat.
Abbildung 4. Verwendete SaaS-Plattformen (Mehrfachnennungen möglich)
Die im Einsatz befindlichen SaaS-Lösungen wurden ebenfalls funktional untergliedert, siehe Abbildung 5. Aufgrund der Stichprobe kann diese Rangreihung (wie alle anderen Merkmale auch) selbstverständlich nur als rein deskriptiv und nicht als repräsentativ im Sinne einer Marktstudie angesehen werden.
Abbildung 5. Verwendete Anwendungstypen (Mehrfachnennungen möglich)
Ziel der Studie ist, verschiedene Aufteilung von Rollen und Verantwortlichkeiten im Bezug auf das Management der SaaS-Anwendung mit bestimmten Erfolgsdimensionen in Zusammenhang zu setzen, um somit Aussagen treffen zu können für welche SaaS-Anwendungen und welchen Umständen welcher Governance-Modus zielführend ist. Vorstudien der Humboldt-Universität legen nahe, dass durchaus große Unterschiede (d.h. statistisch gesehen eine Varianz) in der Governance-Frage existiert, von wem SaaS-Anwendungen gesteuert und gemanagt werden [1, 2]. Diese Vermutung lässt sich durch die vorliegenden Ergebnisse bereits bestätigen.
Abbildung 6 zeigt die Verteilungen einiger ausgewählter Governance-Items aus dem Fragebogen. Demzufolge treffen bei den Befragten offenbar in ca. 2/3 der Fälle IT-Bereiche die Hauptentscheidungen für das SaaS-Anwendungsmanagement (wie z.B. Budgetentscheidungen) und den internen Nutzersupport. In ca. 1/3 der Fälle liegt die Hoheit dagegen eindeutig im Fachbereich. Während die Budgetverantwortung interessanterweise klar geregelt zu sein scheint, kommt es bei Änderungsentscheidungen (Changes) offenbar wesentlich häufiger zu gemischten Formen, welche einen höheren Abstimmungs- und Koordinationsbedarf zwischen Fach- und IT-Bereichen nahelegen (Abbildung 6b).
66
Abbildung 4. Verwendete SaaS-Plattformen (Mehrfachnennungenmoglich).
Die im Einsatz befindlichen SaaS-Losungen wurdenebenfalls funktional untergliedert, siehe Abbildung 5.Aufgrund der Stichprobe kann diese Rangreihung (wiealle anderen Merkmale auch) selbstverstandlich nurals rein deskriptiv und nicht als reprasentativ im Sinneeiner Marktstudie angesehen werden.Ziel der Studie ist, verschiedene Aufteilung vonRollen und Verantwortlichkeiten im Bezug auf dasManagement der SaaS-Anwendung mit bestimmtenErfolgsdimensionen in Zusammenhang zu setzen,um somit Aussagen treffen zu konnen fur welcheSaaS-Anwendungen und welchen Umstanden wel-cher Governance-Modus zielfuhrend ist. Vorstudien
116

Abbildungen 6a/6b/6c: Ausgewählte Governance-Items (unabhängige Variablen)
Im Bezug auf die Erfolgsvariablen wurden die Teilnehmer auf der letzten Seite des Fragebogens gebeten, die jeweilige SaaS-Anwendung mit anderen herkömmlichen Anwendungen in ihrem Unternehmen zu vergleichen.
Abbildungen 7a/7b/7c. Ausgewählte Erfolgsvariablen (abhängig)
67
Abbildung 6. Ausgewahlte Governance-Items (unabhangige Variablen).
Abbildung 4. Verwendete SaaS-Plattformen (Mehrfachnennungen möglich)
Die im Einsatz befindlichen SaaS-Lösungen wurden ebenfalls funktional untergliedert, siehe Abbildung 5. Aufgrund der Stichprobe kann diese Rangreihung (wie alle anderen Merkmale auch) selbstverständlich nur als rein deskriptiv und nicht als repräsentativ im Sinne einer Marktstudie angesehen werden.
Abbildung 5. Verwendete Anwendungstypen (Mehrfachnennungen möglich)
Ziel der Studie ist, verschiedene Aufteilung von Rollen und Verantwortlichkeiten im Bezug auf das Management der SaaS-Anwendung mit bestimmten Erfolgsdimensionen in Zusammenhang zu setzen, um somit Aussagen treffen zu können für welche SaaS-Anwendungen und welchen Umständen welcher Governance-Modus zielführend ist. Vorstudien der Humboldt-Universität legen nahe, dass durchaus große Unterschiede (d.h. statistisch gesehen eine Varianz) in der Governance-Frage existiert, von wem SaaS-Anwendungen gesteuert und gemanagt werden [1, 2]. Diese Vermutung lässt sich durch die vorliegenden Ergebnisse bereits bestätigen.
Abbildung 6 zeigt die Verteilungen einiger ausgewählter Governance-Items aus dem Fragebogen. Demzufolge treffen bei den Befragten offenbar in ca. 2/3 der Fälle IT-Bereiche die Hauptentscheidungen für das SaaS-Anwendungsmanagement (wie z.B. Budgetentscheidungen) und den internen Nutzersupport. In ca. 1/3 der Fälle liegt die Hoheit dagegen eindeutig im Fachbereich. Während die Budgetverantwortung interessanterweise klar geregelt zu sein scheint, kommt es bei Änderungsentscheidungen (Changes) offenbar wesentlich häufiger zu gemischten Formen, welche einen höheren Abstimmungs- und Koordinationsbedarf zwischen Fach- und IT-Bereichen nahelegen (Abbildung 6b).
66
Abbildung 5. Verwendete Anwendungs-typen (Mehrfachnennungen moglich).
der Humboldt-Universitat legen nahe, dass durchausgroße Unterschiede (d.h. statistisch gesehen eine Va-rianz) in der Governance-Frage existiert, von wemSaaS-Anwendungen gesteuert und gemanagt werden[1] [2]. Diese Vermutung lasst sich durch die vorlie-genden Ergebnisse bereits bestatigen.Abbildung 6 zeigt die Verteilungen einiger aus-gewahlter Governance-Items aus dem Fragebogen.Demzufolge treffen bei den Befragten offenbar in ca.2/3 der Falle IT-Bereiche die Hauptentscheidungen furdas SaaS-Anwendungsmanagement (wie z.B. Budge-tentscheidungen) und den internen Nutzersupport. Inca. 1/3 der Falle liegt die Hoheit dagegen eindeutig imFachbereich. Wahrend die Budgetverantwortung inter-essanterweise klar geregelt zu sein scheint, kommt esbei Anderungsentscheidungen (Changes) offenbar we-
sentlich haufiger zu gemischten Formen, welche einenhoheren Abstimmungs- und Koordinationsbedarf zwi-schen Fach- und IT-Bereichen nahelegen (Abbildung6b).
Im Bezug auf die Erfolgsvariablen wurden die Teil-nehmer auf der letzten Seite des Fragebogens ge-beten, die jeweilige SaaS-Anwendung mit anderenherkommlichen Anwendungen in ihrem Unternehmenzu vergleichen.
In Abbildung 7 ist die Verteilung einiger ausgewahlterErfolgsvariablen dargestellt. Interessanterweise lasstsich auch hier eine gewisse Varianz bei den Fra-gen erkennen (was fur eine spatere inferenzstatisti-sche Auswertung von Vorteil sein kann). Beispiels-weise scheint es sowohl Beispiele in der Stichpro-be zu geben, wo die Arbeitsaufteilung von IT undFachbereichen zu vergleichsweise viel, als aber auchzu vergleichsweise wenig Gesamtaufwand im SaaS-Anwendungsmanagement fuhrt. Ebenfalls ist ein posi-tiver Ausschlag zu erkennen, was die wahrgenommeneEffizienz und Zufriedenheit mit der SaaS-Anwendungangeht. Wohlgemerkt kann dieser allerdings auchauf einen positiven Response-Bias der Teilnehmerzuruckzufuhren sein (d.h. zufriedene Anwender neh-men u.U. eher an einer freiwilligen Befragung teil).
117

Abbildungen 6a/6b/6c: Ausgewählte Governance-Items (unabhängige Variablen)
Im Bezug auf die Erfolgsvariablen wurden die Teilnehmer auf der letzten Seite des Fragebogens gebeten, die jeweilige SaaS-Anwendung mit anderen herkömmlichen Anwendungen in ihrem Unternehmen zu vergleichen.
Abbildungen 7a/7b/7c. Ausgewählte Erfolgsvariablen (abhängig)
67
Abbildung 7. Ausgewahlte Erfolgsvariablen (abhangig).
3 Nachste Schritte
Da die Stichprobengroße fur weitergehende inferenz-statistische Analysen als zu klein erscheint, ist ge-plant die erhobenen Daten im nachsten Schritt mit de-nen einer weiteren Befragung zusammen zu fuhren.Dies verlangt zunachst einer umfangreicheren Da-tenbereinigung und -analyse sowie im Nachgang ei-ner fundierten Reflexion der Ergebnisse anhand derwissenschaftlichen Literatur. Erwartet wird, dass so-mit u.a. belastbarere Ergebnisse bezuglich der hypo-thetisierten Zusammenhange zwischen den dargestell-ten Governance- und Erfolgsvariablen erzielt werdenkonnen.
4 Danksagung
Wir danken dem HPI Soc Lab und dem Kooperations-partner SAP, insbesondere Herrn Henning Schmitz,fur den Zugang zu den verschiedenen Kommunikati-onskanalen und die engagierte Unterstutzung bei derDurchfuhrung dieser Studie.
Literatur
[1] T. J. Winkler, C. Goebel, A. Benlian, F. Bidault, andO. Guenther. The impact of software as a service onis authority - a contingency perspective. International
Conference on Information Systems (ICIS 2011) Pro-ceedings, 2011.
[2] T. J. Winkler and O. Guenther. Explaining the gover-nance of software as a service applications - a processview. Multikonferenz der Wirtschaftsinformatik (MKWI2012) Proceedings, 2012.
118

Aktuelle Technische Berichte des Hasso-Plattner-Instituts
Band
ISBN
Titel
Autoren / Redaktion
84
978-3-86956-274-2
Anbieter von Cloud Speicherdiensten im Überblick
Christoph Meinel, Maxim Schnjakin, Tobias Metzke, Markus Freitag
83
978-3-86956-273-5
Proceedings of the 7th Ph.D. Retreat of the HPI Research School on Service-oriented Systems Engineering
Christoph Meinel, Hasso Plattner, Jürgen Döllner, Mathias Weske, Andreas Polze, Robert Hirschfeld, Felix Naumann, Holger Giese, Patrick Baudisch (Hrsg.)
82
978-3-86956-266-7
Extending a Java Virtual Machine to Dynamic Object-oriented Languages
Tobias Pape, Arian Treffer, Robert Hirschfeld
81 978-3-86956-265-0
Babelsberg: Specifying and Solving Constraints on Object Behavior
Tim Felgentreff, Alan Borning, Robert Hirschfeld
80 978-3-86956-264-3
openHPI: The MOOC Offer at Hasso Plattner Institute
Christoph Meinel, Christian Willems
79 978-3-86956-259-9
openHPI: Das MOOC-Angebot des Hasso-Plattner-Instituts
Christoph Meinel, Christian Willems
78 978-3-86956-258-2
Repairing Event Logs Using Stochastic Process Models
Andreas Rogge-Solti, Ronny S. Mans, Wil M. P. van der Aalst, Mathias Weske
77 978-3-86956-257-5
Business Process Architectures with Multiplicities: Transformation and Correctness
Rami-Habib Eid-Sabbagh, Marcin Hewelt, Mathias Weske
76 978-3-86956-256-8
Proceedings of the 6th Ph.D. Retreat of the HPI Research School on Service-oriented Systems Engineering
Hrsg. von den Professoren des HPI
75 978-3-86956-246-9
Modeling and Verifying Dynamic Evolving Service-Oriented Architectures
Holger Giese, Basil Becker
74 978-3-86956-245-2
Modeling and Enacting Complex Data Dependencies in Business Processes
Andreas Meyer, Luise Pufahl, Dirk Fahland, Mathias Weske
73 978-3-86956-241-4
Enriching Raw Events to Enable Process Intelligence
Nico Herzberg, Mathias Weske
72 978-3-86956-232-2
Explorative Authoring of ActiveWeb Content in a Mobile Environment
Conrad Calmez, Hubert Hesse, Benjamin Siegmund, Sebastian Stamm, Astrid Thomschke, Robert Hirschfeld, Dan Ingalls, Jens Lincke
71 978-3-86956-231-5
Vereinfachung der Entwicklung von Geschäftsanwendungen durch Konsolidierung von Programmier- konzepten und -technologien
Lenoi Berov, Johannes Henning, Toni Mattis, Patrick Rein, Robin Schreiber, Eric Seckler, Bastian Steinert, Robert Hirschfeld
70 978-3-86956-230-8
HPI Future SOC Lab - Proceedings 2011 Christoph Meinel, Andreas Polze, Gerhard Oswald, Rolf Strotmann, Ulrich Seibold, Doc D'Errico
69 978-3-86956-229-2
Akzeptanz und Nutzerfreundlichkeit der AusweisApp: Eine qualitative Untersuchung
Susanne Asheuer, Joy Belgassem, Wiete Eichorn, Rio Leipold, Lucas Licht, Christoph Meinel, Anne Schanz, Maxim Schnjakin


Technische Berichte Nr. 85
des Hasso-Plattner-Instituts für Softwaresystemtechnik an der Universität Potsdam
HPI Future SOC Lab: Proceedings 2012Christoph Meinel, Andreas Polze, Gerhard Oswald, Rolf Strotmann, Ulrich Seibold, Bernhard Schulzki (Hrsg.)
ISBN 978-3-86956-276-6ISSN 1613-5652