Proceedings of 2013 IAHR Congress
11
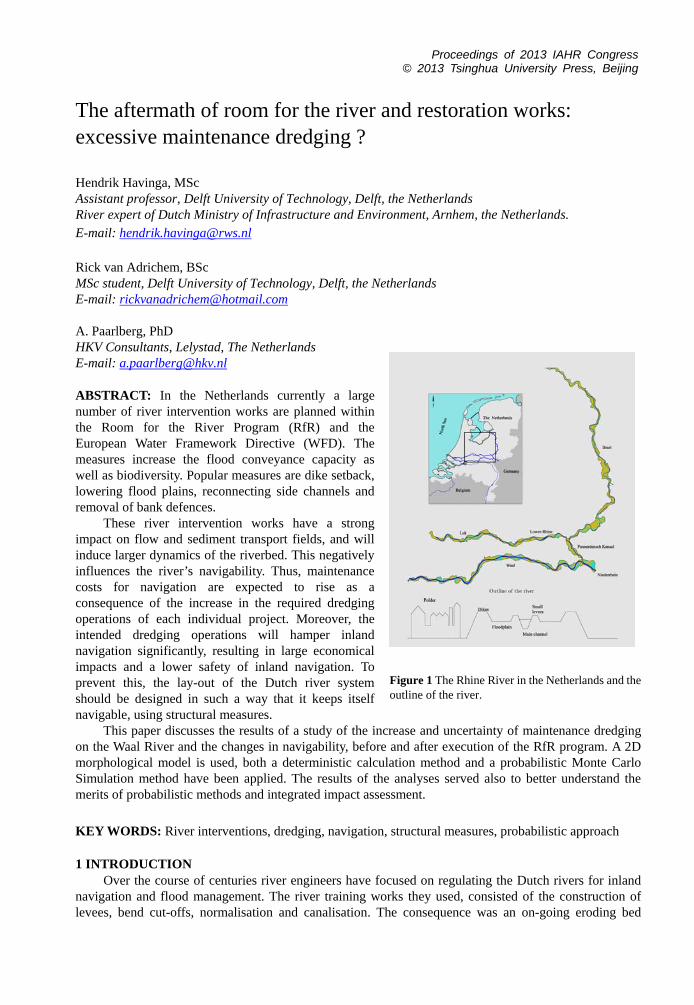
Proceedings of 2013 IAHR Congress © 2013 Tsinghua University Press, Beijing ABSTRACT: In the Netherlands currently a large number of river intervention works are planned within the Room for the River Program (RfR) and the European Water Framework Directive (WFD). The measures increase the flood conveyance capacity as well as biodiversity. Popular measures are dike setback, lowering flood plains, reconnecting side channels and removal of bank defences. These river intervention works have a strong impact on flow and sediment transport fields, and will induce larger dynamics of the riverbed. This negatively influences the river’s navigability. Thus, maintenance costs for navigation are expected to rise as a consequence of the increase in the required dredging operations of each individual project. Moreover, the intended dredging operations will hamper inland navigation significantly, resulting in large economical impacts and a lower safety of inland navigation. To prevent this, the lay-out of the Dutch river system should be designed in such a way that it keeps itself navigable, using structural measures. This paper discusses the results of a study of the increase and uncertainty of maintenance dredging on the Waal River and the changes in navigability, before and after execution of the RfR program. A 2D morphological model is used, both a deterministic calculation method and a probabilistic Monte Carlo Simulation method have been applied. The results of the analyses served also to better understand the merits of probabilistic methods and integrated impact assessment. KEY WORDS: River interventions, dredging, navigation, structural measures, probabilistic approach 1 INTRODUCTION Over the course of centuries river engineers have focused on regulating the Dutch rivers for inland navigation and flood management. The river training works they used, consisted of the construction of levees, bend cut-offs, normalisation and canalisation. The consequence was an on-going eroding bed The aftermath of room for the river and restoration works: excessive maintenance dredging ? Hendrik Havinga, MSc Assistant professor, Delft University of Technology, Delft, the Netherlands River expert of Dutch Ministry of Infrastructure and Environment, Arnhem, the Netherlands. E-mail: [email protected] Rick van Adrichem, BSc MSc student, Delft University of Technology, Delft, the Netherlands E-mail: [email protected] A. Paarlberg, PhD HKV Consultants, Lelystad, The Netherlands E-mail: [email protected] Figure 1 The Rhine River in the Netherlands and the outline of the river.
-
Upload
independent -
Category
Documents
-
view
1 -
download
0
Transcript of Proceedings of 2013 IAHR Congress
Proceedings of 2013 IAHR Congress © 2013 Tsinghua University Press, Beijing
ABSTRACT: In the Netherlands currently a large number of river intervention works are planned within the Room for the River Program (RfR) and the European Water Framework Directive (WFD). The measures increase the flood conveyance capacity as well as biodiversity. Popular measures are dike setback, lowering flood plains, reconnecting side channels and removal of bank defences.
These river intervention works have a strong impact on flow and sediment transport fields, and will induce larger dynamics of the riverbed. This negatively influences the river’s navigability. Thus, maintenance costs for navigation are expected to rise as a consequence of the increase in the required dredging operations of each individual project. Moreover, the intended dredging operations will hamper inland navigation significantly, resulting in large economical impacts and a lower safety of inland navigation. To prevent this, the lay-out of the Dutch river system should be designed in such a way that it keeps itself navigable, using structural measures.
This paper discusses the results of a study of the increase and uncertainty of maintenance dredging on the Waal River and the changes in navigability, before and after execution of the RfR program. A 2D morphological model is used, both a deterministic calculation method and a probabilistic Monte Carlo Simulation method have been applied. The results of the analyses served also to better understand the merits of probabilistic methods and integrated impact assessment. KEY WORDS: River interventions, dredging, navigation, structural measures, probabilistic approach 1 INTRODUCTION
Over the course of centuries river engineers have focused on regulating the Dutch rivers for inland navigation and flood management. The river training works they used, consisted of the construction of levees, bend cut-offs, normalisation and canalisation. The consequence was an on-going eroding bed
The aftermath of room for the river and restoration works: excessive maintenance dredging ?
Hendrik Havinga, MSc Assistant professor, Delft University of Technology, Delft, the Netherlands River expert of Dutch Ministry of Infrastructure and Environment, Arnhem, the Netherlands. E-mail: [email protected] Rick van Adrichem, BSc MSc student, Delft University of Technology, Delft, the Netherlands E-mail: [email protected] A. Paarlberg, PhD HKV Consultants, Lelystad, The Netherlands E-mail: [email protected]
Figure 1 The Rhine River in the Netherlands and the outline of the river.

2
since dikes, levees, groynes and longitudinal dams all form width constrictions, resulting in lower low water levels and lower ground water levels.
The flood events of 1993 and 1995 along the Rhine River initiated large-scale river works in the Netherlands, the Room for the River (RfR) program, to raise the flood protection standards in the rivers. In this program it is tried to increase the discharge capacity of the Dutch rivers without raising the dikes so that the increase of discharge capacity does not lead to an increase of risk of flooding. Instead of raising the dikes, over 30 site-specific measures were selected to lower the flood levels. Besides the RfR program also other large scale projects in the Dutch rivers have started in the last decades to a) restore nature in the floodplains, b) to secure the quality of water bodies (European Water Framework Directive, or WFD), c) to explore strategies to sustainably maintain the enlarged navigation channel (Sustainable Fairway Rhinedelta, SFR).
It is expected that due to the on-going projects, river dynamics are increasing and consequently maintenance dredging will grow too (Van Vuren and Havinga, 2012). All individual measures in the river may induce extra sedimentation or erosion. The resulting shoals and erosion pits will travel downstream and may cause unexpected nautical bottlenecks. As a design rule on the Waal, the total volume of dredging cannot exceed 15,000 m3/year per 15 km for individual projects. This may imply that the total size of all dredging projects together will significantly increase after the projects are implemented. If many dredgers are needed to maintain the navigation channel, this will hinder inland navigation with major economic consequences.
In the design phase of each individual project the amount of dredging has been estimated. However it is important not to just look at the cumulative effect of the individual projects, but also at the combined effect of all projects. Thus far the effects have been investigated within each project area, without thaking into account the mutual impact. Furthermore the dredging effort has been calculated only in a deterministic way. The uncertainty in future river discharges creates uncertainty bands in the development of the riverbed, and thus also results in uncertainty in the derived maintenance dredging. Understanding the potential variance in maintenance dredging can help river managers to better estimate the dredging effort and to study strategies consisting of combinations of structural measures and sediment management.
2 RESEARCH OBJECTIVES
The goals of the study carried out by Van Adrichem (2013) were to determine the increase and uncertainty of maintenance dredging on the Waal, before and after the execution of the RfR program. Deterministic and probabilistic Monte Carlo Simulation methods have been applied, using a 2D morphological model. The results of the analyses also helped to better understand the merits of probabilistic methods and integrated impact assessment. See Van Vuren (2005) for more background.
Calculations to investigate the dredging effort before and after the implementation of the large-scale river works were made with the Delft3D package (Deltares, 2012), (Sloff, et al, 2009). The reference situation in this study is a model schematisation of the river in 2008 before execution of RfR plans and is named T0. The future situation is a model schematisation of the river in 2015, after execution of the RfR program: T1. This schematisation contains, next to the RfR projects, all other relevant updates in schematisation for that year such as some of the WFD- and SFR-plans.
Deterministic calculations of the morphological developments with a representative yearly average discharge, repeated for 20 years, are compared with the results of a probabilistic approach: Monte Carlo Simulations method has been used with generated discharge timeseries, see also (Van Vuren and Havinga, 2012). The probabilistic calculation method is used to include uncertainties in the model response. The input parameter that is varied is the discharge on the upper boundary of the model, with a timeseries span of 20 years. Other model uncertainties are not considered. 3 TYPE OF RIVER INTERVENTIONS
Based on morphological characteristics, the Waal can be subdivided in three parts: the Upper Waal River (W1a), the Midden-Waal (W2 without Sint Andries) and the Lower Waal River (Sint Andries, W3 and W4), see Figure 2.

3
Figure 2 The Waal River
Measures proposed in the RfR scheme are meant to accommodate a larger design flood discharge. It
consists of measures to increase the flood conveyance capacity, such as the implementation of secondary channels, lowering groynes and removing obstacles (see Figure 3). The WFD measures are meant to improve the ecological value of the river systems by increasing river dynamics via reconnecting side channels and removal of bank defences.
Figure 3 Measures proposed in the Room for the River study in the Netherlands (Silva et al. 2001).
Local measures that have large impact on morphology are located (see Figure 2) near Lent (flood channel in the floodplain), Millingerwaard (flood plain excavation), Munnikenland (flood plain excavation and side channel). A general measure with large impact is the groyne lowering in all reaches of the Waal River.
In both programs (RfR and WFD) the river intervention works inevitably influence the flow and sediment transport fields. Depending on the flow stage, a larger part of the discharge will be diverted from the main channel towards the flood plains. Downstream of the river intervention, this discharge will be diverted back into the main channel. This results in larger local gradients in the flow velocity, and subsequently in larger local gradients in sediment transport. Due to these gradients, erosion and accretion waves are initiated and propagate downstream through the river system. The enhanced river bed dynamics are expected to have a negative impact on navigation and to increase maintenance dredging.
The gradients in flow and sediment transport field typically occur at the upstream and downstream end of the river interventions. The variation in the river discharge leads to a continuous adaptation of the river bed. With each new discharge peak, new bottom waves are initiated, which start migrating downstream. These bottom waves vary in amplitude depending on the size of the peak discharge.
River engineers commonly use a variety of tools in river impact assessments to determine the (time varying) morphological responses. Minimizing the morphodynamic response to avoid negative side
Lent
St.-Andries Munnikenland
Millingerwaard
Tiel

4
effects (such as a decrease in available navigation depth an increase in dredging effort), forms an important part of the design process of river interventions. 4 IMPACT OF THE RIVER INTERVENTIONS ON HYDROMORPHOLOGY This chapter discusses the general hydraulic and morphological results from the study. 4.1 Hydrodynamic effects
For low discharges (<1,350 m3/s, Waal River), in both the T0 and T1 situation, all discharge flows entirely in the low water bed that is confined by groynes. At higher discharges the flow field becomes more complex, as groyne fields participate and floodplains will be flooded. As a consequence a large variation in flow patterns along the river exists and the part of the total discharge flowing through the main channel (low water bed) is no longer constant in longitudinal direction. The general effect of the 2015 measures is that less discharge flows between the groyne heads in the T1 situation at low discharges. The effect is the opposite for discharges above bankfull discharge (4,000 m3/s at Lobith, 2,550m3/s on the Waal River), because the RfR measures improve the conveyance in general.
Figure 4 Initial differences in velocities at different discharges between the T1 and T0 situation.
The flow velocities in the river axis (Figure 4) during the lower discharges show little variation due to the standardisation of the navigation channel dimensions. At the higher discharges fluctuations in flow velocity along the river occur, that have an impact on the sediment transport rate. Especially above bankfull discharges (in Figure 4: 3450 m3/s and higher) there are more and larger fluctuations in flow velocity due to side channels, variations in floodplain width and obstacles in the floodplains.
The effect on the flow velocity on locations where the cross section is changed depends on the specific river measure. The flow velocity in the main channel decreases on sections where the groynes are lowered or where discharge is drawn to a side channel, for example at Lent. There are also locations where the cross section of the river is not changed in T1 compared to T0, but where the water levels are lower for some discharges while the same discharge flows through the cross section. The effect of lowered water levels on these locations is that the flow velocity in the main channel increases, this a known backwater effect.
The effect of the lowering of groynes is dominant at the entire Waal for discharges below bankfull (< 3450 m3/s, Waal River). The flow velocity decreases on most locations relative to the reference situation at these lower discharges. The largest effects on the flow velocity for discharge above banlfull discharge, are found next to the side channel at Lent (LE) and at the floodplain measures at Munnikenland (MU). The model predicts up to 20% lower flow velocities on these locations. Other measures on the straight river section of the Midden-Waal also show a significant effect on the flow velocity (e.g. the Afferdensche and Deestsche Waarden, AD).
5
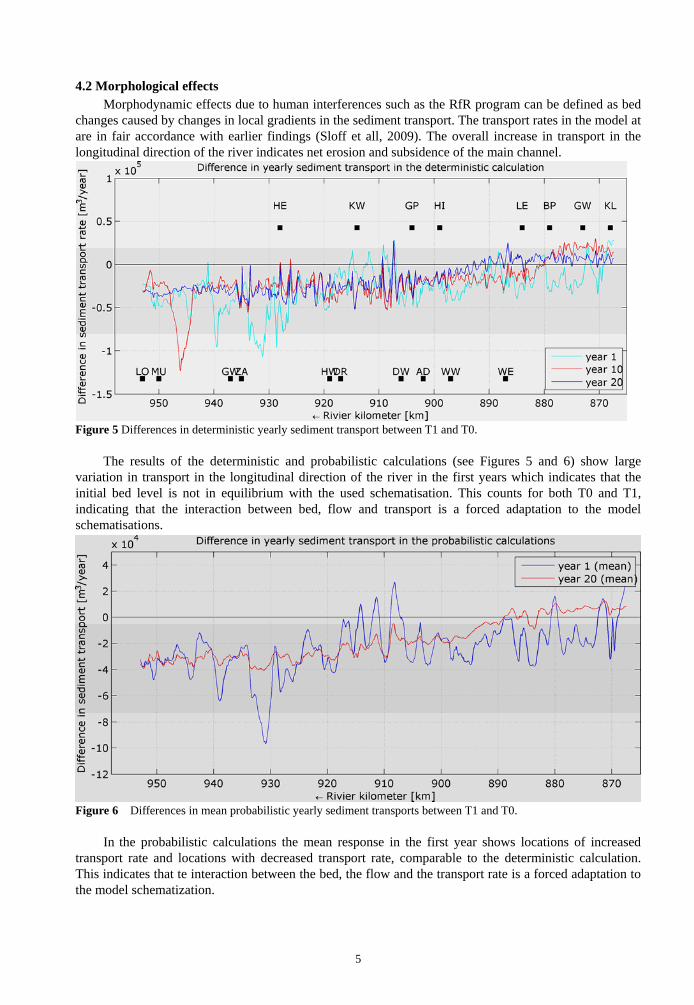
4.2 Morphological effects Morphodynamic effects due to human interferences such as the RfR program can be defined as bed
changes caused by changes in local gradients in the sediment transport. The transport rates in the model at are in fair accordance with earlier findings (Sloff et all, 2009). The overall increase in transport in the longitudinal direction of the river indicates net erosion and subsidence of the main channel.
Figure 5 Differences in deterministic yearly sediment transport between T1 and T0.
The results of the deterministic and probabilistic calculations (see Figures 5 and 6) show large variation in transport in the longitudinal direction of the river in the first years which indicates that the initial bed level is not in equilibrium with the used schematisation. This counts for both T0 and T1, indicating that the interaction between bed, flow and transport is a forced adaptation to the model schematisations.
Figure 6 Differences in mean probabilistic yearly sediment transports between T1 and T0.
In the probabilistic calculations the mean response in the first year shows locations of increased transport rate and locations with decreased transport rate, comparable to the deterministic calculation. This indicates that te interaction between the bed, the flow and the transport rate is a forced adaptation to the model schematization.

6
Figure 7 Yearly sediment transport in some MCS realizations.

7
The mean response of the 20th year of all 100 calculations shows an almost constant positive gradient in transport rate along the river as if the runs move towards equilibrium (Figure 7). The results of the 1st year show considerable variations in the longitudinal direction of the river in mean transport rate at large river measures, such as the lowered transport rate due to lower flow velocities at Lent (km 885): the new schematisation leads to higher flow velocities for most discharge levels due to the better conveyance capacity that was created by removing the bottleneck at Lent. Downstream of Lent, the lowering of groynes has a dominant effect on the transport; at most discharge stages, the depth averaged flow velocity in the main channel is lowered by the increased capacity of the channel, leading to less yearly transport.
The overall transport gradient in the T1 situation becomes less than the gradient in the T0 situation. This indicates that less net erosion takes place: the lower flow velocities in the main channel reduce the large-scale bed degradation on the Waal. In particular upstream of Lent the bed experiences less degradation and the degradation is also tempered downstream of Lent on some notable locations. Although the degradation of the Waal takes place on a much larger timescale than simulated with the model and erosion has not yet stopped in the T1 schematisation after 20 years, the observed tempering of erosion is not a temporary effect. The process of bed degradation on the Waal is not stopped, but the eventual equilibrium water depth on the Waal becomes smaller by the river measures included in the T1 schematisation.
In the probabilistic calculations the sediment transport rate in a year depends on the yearly hydrograph and the initial bed level position in that year (see Figure 7). During low yearly averaged discharges, low transport rates are found and the graphs indicate that the transport rate decreases in the longitudinal direction of the river. During high discharges this effect reverses. In general one could say that the Lower Waal River erodes during high yearly averaged discharges and accretes during low yearly averaged discharges. The Upper Waal River has an eroding character during all discharge stages. The Midden-Waal shows an eroding character only during very high yearly transport rates. 5 RESULTS OF THE STUDY 5.1 Dredging quantities
Historic records of 1900-2009 show dredging on the Waal River up to 1,700,000 m3/year. The average dredged quantity in the period 2005-2009 was 500,000 m3/year. The total expected increase in dredging by the planned measures based upon earlier estimates of the extra dredging (see Van Adrichem 2013) caused by individual measures in T1 is approximately 15 – 25 % (T1-T0). The mean dredging demand in the deterministic approach increases in T1 with about 60,000 m3/year or 15 % (see Figure 8).
Figure 8 Yearly dredged volumes in T1 and T0 and differences, deterministic approach.
8
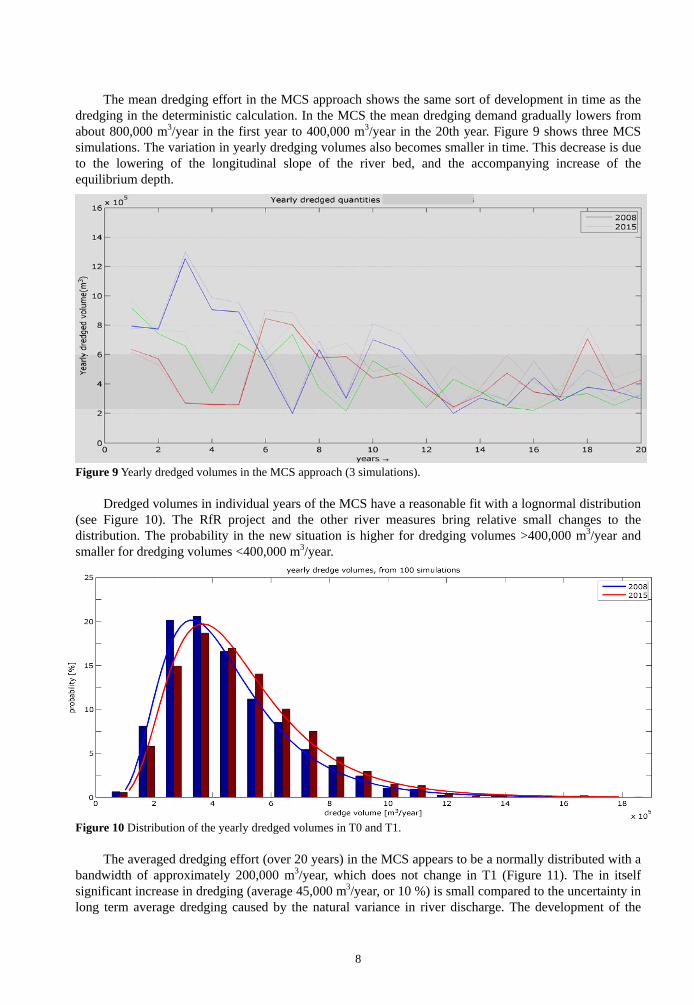
The mean dredging effort in the MCS approach shows the same sort of development in time as the
dredging in the deterministic calculation. In the MCS the mean dredging demand gradually lowers from about 800,000 m3/year in the first year to 400,000 m3/year in the 20th year. Figure 9 shows three MCS simulations. The variation in yearly dredging volumes also becomes smaller in time. This decrease is due to the lowering of the longitudinal slope of the river bed, and the accompanying increase of the equilibrium depth.
Figure 9 Yearly dredged volumes in the MCS approach (3 simulations). Dredged volumes in individual years of the MCS have a reasonable fit with a lognormal distribution
(see Figure 10). The RfR project and the other river measures bring relative small changes to the distribution. The probability in the new situation is higher for dredging volumes >400,000 m3/year and smaller for dredging volumes <400,000 m3/year.
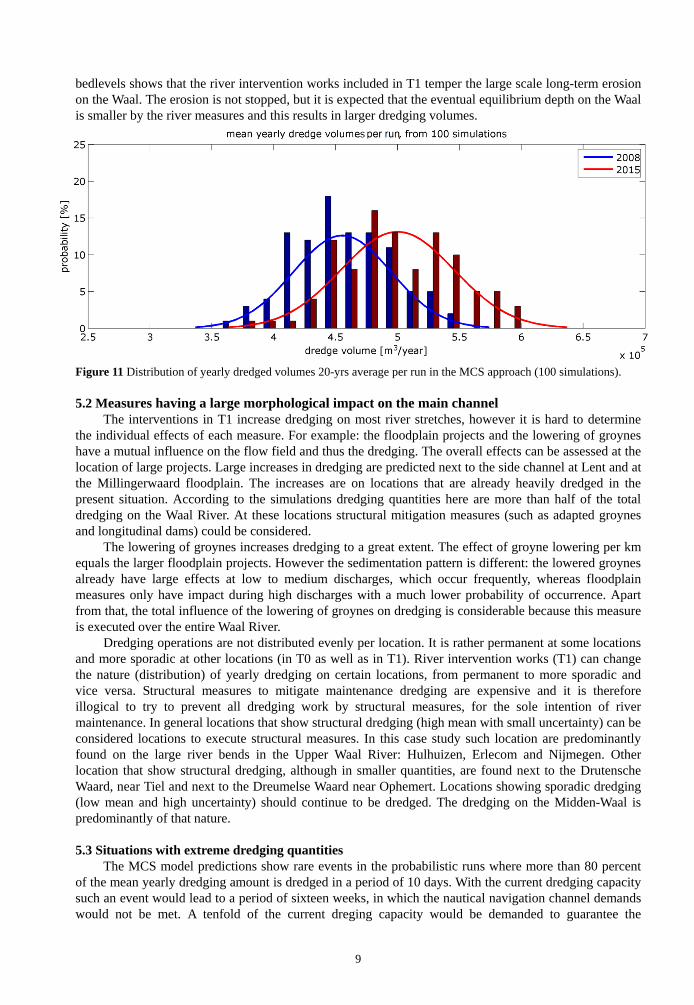
Figure 10 Distribution of the yearly dredged volumes in T0 and T1. The averaged dredging effort (over 20 years) in the MCS appears to be a normally distributed with a
bandwidth of approximately 200,000 m3/year, which does not change in T1 (Figure 11). The in itself significant increase in dredging (average 45,000 m3/year, or 10 %) is small compared to the uncertainty in long term average dredging caused by the natural variance in river discharge. The development of the
9
bedlevels shows that the river intervention works included in T1 temper the large scale long-term erosion on the Waal. The erosion is not stopped, but it is expected that the eventual equilibrium depth on the Waal is smaller by the river measures and this results in larger dredging volumes.
Figure 11 Distribution of yearly dredged volumes 20-yrs average per run in the MCS approach (100 simulations). 5.2 Measures having a large morphological impact on the main channel
The interventions in T1 increase dredging on most river stretches, however it is hard to determine the individual effects of each measure. For example: the floodplain projects and the lowering of groynes have a mutual influence on the flow field and thus the dredging. The overall effects can be assessed at the location of large projects. Large increases in dredging are predicted next to the side channel at Lent and at the Millingerwaard floodplain. The increases are on locations that are already heavily dredged in the present situation. According to the simulations dredging quantities here are more than half of the total dredging on the Waal River. At these locations structural mitigation measures (such as adapted groynes and longitudinal dams) could be considered.
The lowering of groynes increases dredging to a great extent. The effect of groyne lowering per km equals the larger floodplain projects. However the sedimentation pattern is different: the lowered groynes already have large effects at low to medium discharges, which occur frequently, whereas floodplain measures only have impact during high discharges with a much lower probability of occurrence. Apart from that, the total influence of the lowering of groynes on dredging is considerable because this measure is executed over the entire Waal River.
Dredging operations are not distributed evenly per location. It is rather permanent at some locations and more sporadic at other locations (in T0 as well as in T1). River intervention works (T1) can change the nature (distribution) of yearly dredging on certain locations, from permanent to more sporadic and vice versa. Structural measures to mitigate maintenance dredging are expensive and it is therefore illogical to try to prevent all dredging work by structural measures, for the sole intention of river maintenance. In general locations that show structural dredging (high mean with small uncertainty) can be considered locations to execute structural measures. In this case study such location are predominantly found on the large river bends in the Upper Waal River: Hulhuizen, Erlecom and Nijmegen. Other location that show structural dredging, although in smaller quantities, are found next to the Drutensche Waard, near Tiel and next to the Dreumelse Waard near Ophemert. Locations showing sporadic dredging (low mean and high uncertainty) should continue to be dredged. The dredging on the Midden-Waal is predominantly of that nature.
5.3 Situations with extreme dredging quantities
The MCS model predictions show rare events in the probabilistic runs where more than 80 percent of the mean yearly dredging amount is dredged in a period of 10 days. With the current dredging capacity such an event would lead to a period of sixteen weeks, in which the nautical navigation channel demands would not be met. A tenfold of the current dreging capacity would be demanded to guarantee the
10
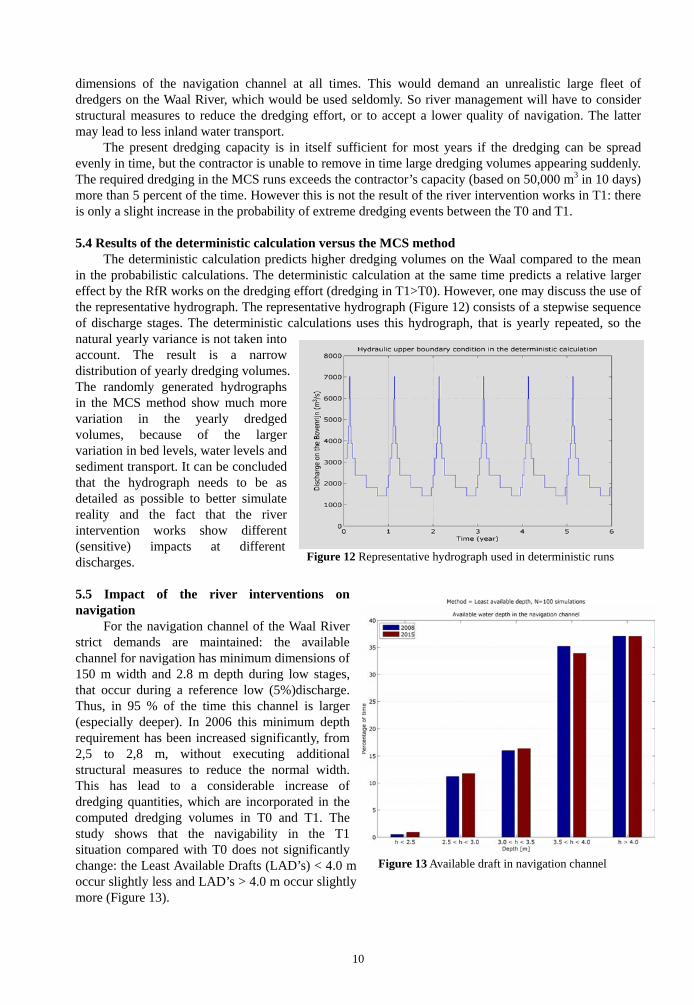
Figure 12 Representative hydrograph used in deterministic runs
Figure 13 Available draft in navigation channel
dimensions of the navigation channel at all times. This would demand an unrealistic large fleet of dredgers on the Waal River, which would be used seldomly. So river management will have to consider structural measures to reduce the dredging effort, or to accept a lower quality of navigation. The latter may lead to less inland water transport.
The present dredging capacity is in itself sufficient for most years if the dredging can be spread evenly in time, but the contractor is unable to remove in time large dredging volumes appearing suddenly. The required dredging in the MCS runs exceeds the contractor’s capacity (based on 50,000 m3 in 10 days) more than 5 percent of the time. However this is not the result of the river intervention works in T1: there is only a slight increase in the probability of extreme dredging events between the T0 and T1.
5.4 Results of the deterministic calculation versus the MCS method
The deterministic calculation predicts higher dredging volumes on the Waal compared to the mean in the probabilistic calculations. The deterministic calculation at the same time predicts a relative larger effect by the RfR works on the dredging effort (dredging in T1>T0). However, one may discuss the use of the representative hydrograph. The representative hydrograph (Figure 12) consists of a stepwise sequence of discharge stages. The deterministic calculations uses this hydrograph, that is yearly repeated, so the natural yearly variance is not taken into account. The result is a narrow distribution of yearly dredging volumes. The randomly generated hydrographs in the MCS method show much more variation in the yearly dredged volumes, because of the larger variation in bed levels, water levels and sediment transport. It can be concluded that the hydrograph needs to be as detailed as possible to better simulate reality and the fact that the river intervention works show different (sensitive) impacts at different discharges.
5.5 Impact of the river interventions on navigation
For the navigation channel of the Waal River strict demands are maintained: the available channel for navigation has minimum dimensions of 150 m width and 2.8 m depth during low stages, that occur during a reference low (5%)discharge. Thus, in 95 % of the time this channel is larger (especially deeper). In 2006 this minimum depth requirement has been increased significantly, from 2,5 to 2,8 m, without executing additional structural measures to reduce the normal width. This has lead to a considerable increase of dredging quantities, which are incorporated in the computed dredging volumes in T0 and T1. The study shows that the navigability in the T1 situation compared with T0 does not significantly change: the Least Available Drafts (LAD’s) < 4.0 m occur slightly less and LAD’s > 4.0 m occur slightly more (Figure 13).

11
The river manager uses a second dredging requirement to ensure a minimum of area around ships to reduce the drag: the width-averaged depth in the navigation channel should be at least 4.0 meters during low discharges. It appears that in order to fullfil this ‘width-averaged depth requirement’ the volumes to be dredged are enormous, see Figure 14. Therefore this width-averaged depth requirement is not met by dredging; instead it is used in the design phase of projects to enforce adjustments of the plans to minimize aggradation. So, for the practice of dredging this demand is less critical than the minimum depth requirement. Nevertheless, though the minimum depth is not significantly changed in T1, the width-averaged depth is lowered significantly in T1 with 0.1 to 0.3 m at various locations, indicating that the drag of the ships will be larger in the future, which will increase fuel consumption. It is possible that in time this will not be accepted and that this reduction of the width-averaged depth eventually will lead to much more dredging or to the execution of structural measures to mitigate the over-all sedimentations of the river interventions in T1.
ACKNOWLEDGEMENTS The study has been largely carried out at HKV consultants by Mr. Rick van Adrichem, BSc, and supported by Dr. Andries Paarlberg of HKV consultants. References Adrichem, R van (2013). Quantification of uncertainty and spatial distribution of the maintenance dredging effort on
the Waal (the merits of stochastic engineering), MsC thesis University of Technology Delft, Delft, The Netherlands Bardoel, J.W.S. (2010). Dredging history of the river Waal and expected future dredging works, MSc Thesis,
University of Technology Delft, Delft, The Netherlands. Deltares (2012). Delft3D-Flow user manual.Version: 3.15.20508, 19 January 2012. Sloff, C.J. Youssef, M. Van Dijk, W. and Spruyt, A. (2009). Voorspelinstrument Duurzame Vaardiepte Rijndelta.
Continued development and application of morphological model DVR Part 1: model improvement.Deltares report 1002069-001-ZWS-0003, Final Version June 29th 2009, Delft.
Sloff, C.J. Paarlberg, A. Spruyt, A. and Youssef, M. (2009).Voorspelinstrument Duurzame Vaardiepte Rijndelta. Continued development and application of morphological model DVR Part 2: model adjustment. Deltares report 1002069-002-ZWS-0005, Version 1.0 June 1st 2009, Delft.
Vuren, S. van and Havinga, H. (2012). Preparing Self Supporting River Systems: how to cope with excessive maintenance dredging? River flow 2012 (Vol. 2 C.4).
Vuren, S. van (2005). Stochastic modelling of river morphodynamics. PhD Thesis, Delft University of Technology, Delft, The Netherlands.
Figure 14 Dredging volume for the width-averaged depth requirement in year 1, averaged over all MCS runs.