
Proceedings August 23, 2014 Dublin, Ireland - ACL Anthology
139
V&L Net 2014 The 3rd Annual Meeting Of The EPSRC Network On Vision & Language and The 1st Technical Meeting of the European Network on Integrating Vision and Language A Workshop of the 25th International Conference on Computational Linguistics (COLING 2014) Proceedings August 23, 2014 Dublin, Ireland
-
Upload
khangminh22 -
Category
Documents
-
view
6 -
download
0
Transcript of Proceedings August 23, 2014 Dublin, Ireland - ACL Anthology

V&L Net 2014
The 3rd Annual Meeting Of The EPSRC Network OnVision & Language
andThe 1st Technical Meeting of the European Network on
Integrating Vision and Language
A Workshop of the 25th International Conference onComputational Linguistics (COLING 2014)
Proceedings
August 23, 2014Dublin, Ireland

ISBN 978-1-873769-28-1
This workshop is partly supported by ICT COST Action IC1307, the European Network on IntegratingVision and Language (iV&L Net): Combining Computer Vision and Language Processing For AdvancedSearch, Retrieval, Annotation and Description of Visual Data, and partly by the EPSRC Network onVision and Language (V&L Net).
ESF provides the COST Office through an EC contract
COST is supported by the EU RTD Framework Programme
ii

Preface
The Workshop on Vision and Language 2014 (VL’14) took place in Dublin on 23rd July 2014, as partof COLING’14. It was the joint 3rd meeting of the EPSRC Network On Vision and Language and 1sttechnical meeting of the new European Network on Integrating Vision and Language which is funded asa European COST Action. The VL workshops have the general aims:
1. to provide a forum for reporting and discussing planned, ongoing and completed research thatinvolves both language and vision; and
2. to enable NLP and computer vision researchers to meet, exchange ideas, expertise and technology,and form new research partnerships.
As funding for the V&L EPSRC Network (EP/H018557) ends and funding for the iV&L Net EuropeanCOST Action (IC1307) starts, the focus of the VL workshops will shift onto integration and jointmodelling of language and vision. iV&L Net will take over the organisation of annual VL workshopsfor the next four years as the flagship workshop of this new COST Action.
The call for papers for VL’14 was issued in May 2014 and elicited a good number of high-quality submissions, each of which was peer-reviewed by three members of the programme committee.The interest in the workshop from leading NLP and computer vision researchers and the quality ofsubmissions was high, so we aimed to be as inclusive as possible within the practical constraints of theworkshop. In the end we accepted 14 submissions as long papers, and eight as short papers.
The resulting workshop programme packed a lot of exciting content into one day. We were delightedto be able to include in the programme a keynote presentation by Alex Jaimes of Yahoo! Inc., aninternationally leading vision researcher. Our technical programme combined seven oral papers, sevenlong poster papers and seven short poster papers. Some thematic clusters emerged: combined text andimage processing (Nguyen et al., Sakaki et al., Jones et al., Zhang et al., HaCohen-Kerner et al.), imagedescription, annotation and labelling (Elliott, Liparas et al., Wang et al., Jokinen and Wilcock), data setcreation (Weiland et al., Le et al., McGuinness et al.), situated dialogue (Summers-Stay et al., Schütte etal.), video analysis (Bhat and Olszewska, Shrestha et al.), aids for visually impaired people (Safi et al.,Belz and Bharath), and visual analysis supported by text/speech features (Anbarjafari and Aabloo). Theprogramme also included a discussion session on future directions for the VL community and workshops,including plans for shared task competitions.
We would like to thank all the people who have contributed to the organisation and deliveryof this workshop: the authors who submitted such high quality papers; the programme committeefor their prompt and effective reviewing; our keynote speaker, Alex Jaimes; the COLING 2014organising committee, especially the workshops chairs, Jennifer Foster, Dan Gildea, and Tim Baldwin;the participants in the workshop; and future readers of these proceedings for your shared interest in thisexciting new area of research.
August 2014 Anja Belz, Marie-Francine Moens and Alan F. Smeaton
iii


Organising Committee
Anja Belz, University of BrightonDarren Cosker, University of BathFrank Keller, University of EdinburghMarie-Francine Moens, University of LeuvenAlan F. Smeaton, Dublin City UniversityWilliam Smith, University of York
Program Committee:
Yannis Aloimonos, University of Maryland, USTamara Berg, Stony Brook, USDesmond Elliot, University of Edinburgh, UKErkut Erdem, Hacettepe University, TurkeySergio Escalera, Autonomous University of Barcelona, SpainClaire Gardent, CNRS/LORIA, FranceJordi Gonzales, Universita Autonoma de Barcelona, SpainLewis Griffin, UCL, UKJulia Hockenmaier, University of Illinois, USJohn Kelleher, Dublin Institute of Technology, IrelandBrian Mac Namee, Dublin Institute of Technology, IrelandDimitrios Makris, Kingston University, UKMargaret Mitchell, University of Aberdeen, UKRay Mooney, University of Texas at Austin, USLucia Specia, University of Sheffield, UKChris Town, University of Cambridge, UKIsabel Trancoso, INESC-ID, PortugalDavid Windridge, University of Surrey, UK
Invited Keynote Speaker:
Alex Jaimes, Yahoo! Inc.
v


Table of Contents
The Effect of Sensor Errors in Situated Human-Computer DialogueNiels Schütte, John Kelleher and Brian Mac Namee . . . . . . . . . . . . . . . . . . . . . . . . . . . . . . . . . . . . . . . . . 1
Joint Navigation in Commander/Robot Teams: Dialog & Task Performance When Vision is Bandwidth-Limited
Douglas Summers-Stay, Taylor Cassidy and Clare Voss . . . . . . . . . . . . . . . . . . . . . . . . . . . . . . . . . . . . . . 9
TUHOI: Trento Universal Human Object Interaction DatasetDieu-Thu Le, Jasper Uijlings and Raffaella Bernardi . . . . . . . . . . . . . . . . . . . . . . . . . . . . . . . . . . . . . . . 17
Concept-oriented labelling of patent images based on Random Forests and proximity-driven generationof synthetic data
Dimitris Liparas, Anastasia Moumtzidou, Stefanos Vrochidis and Ioannis Kompatsiaris . . . . . . . .25
Exploration of functional semantics of prepositions from corpora of descriptions of visual scenesSimon Dobnik and John Kelleher . . . . . . . . . . . . . . . . . . . . . . . . . . . . . . . . . . . . . . . . . . . . . . . . . . . . . . . . . 33
A Poodle or a Dog? Evaluating Automatic Image Annotation Using Human Descriptions at DifferentLevels of Granularity
Josiah Wang, Fei Yan, Ahmet Aker and Robert Gaizauskas . . . . . . . . . . . . . . . . . . . . . . . . . . . . . . . . . 38
Key Event Detection in Video using ASR and Visual DataNiraj Shrestha, Aparna N. Venkitasubramanian and Marie-Francine Moens . . . . . . . . . . . . . . . . . . . 46
Twitter User Gender Inference Using Combined Analysis of Text and Image ProcessingShigeyuki Sakaki, Yasuhide Miura, Xiaojun Ma, Keigo Hattori and Tomoko Ohkuma . . . . . . . . . 54
Semantic and geometric enrichment of 3D geo-spatial models with captioned photos and labelled illus-trations
Chris Jones, Paul Rosin and Jonathan Slade . . . . . . . . . . . . . . . . . . . . . . . . . . . . . . . . . . . . . . . . . . . . . . . 62
Weakly supervised construction of a repository of iconic imagesLydia Weiland, Wolfgang Effelsberg and Simone Paolo Ponzetto . . . . . . . . . . . . . . . . . . . . . . . . . . . . 68
Cross-media Cross-genre Information Ranking based on Multi-media Information NetworksTongtao Zhang, Haibo Li, Hongzhao Huang, Heng Ji, Min-Hsuan Tsai, Shen-Fu Tsai and Thomas
Huang . . . . . . . . . . . . . . . . . . . . . . . . . . . . . . . . . . . . . . . . . . . . . . . . . . . . . . . . . . . . . . . . . . . . . . . . . . . . . . . . . . . . . . 74
Speech-accompanying gestures in Russian: functions and verbal contextYulia Nikolaeva . . . . . . . . . . . . . . . . . . . . . . . . . . . . . . . . . . . . . . . . . . . . . . . . . . . . . . . . . . . . . . . . . . . . . . . . 82
DALES: Automated Tool for Detection, Annotation, Labelling, and Segmentation of Multiple Objects inMulti-Camera Video Streams
Mohammad Bhat and Joanna Isabelle Olszewska . . . . . . . . . . . . . . . . . . . . . . . . . . . . . . . . . . . . . . . . . . 87
A Hybrid Segmentation of Web Pages for Vibro-Tactile Access on Touch-Screen DevicesWaseem SAFI, Fabrice Maurel, Jean-Marc Routoure, Pierre Beust and Gaël Dias . . . . . . . . . . . . . 95
Expression Recognition by Using Facial and Vocal ExpressionsGholamreza Anbarjafari and Alvo Aabloo . . . . . . . . . . . . . . . . . . . . . . . . . . . . . . . . . . . . . . . . . . . . . . . .103
vii

Formulating Queries for Collecting Training Examples in Visual Concept ClassificationKevin McGuinness, Feiyan Hu, Rami Albatal and Alan Smeaton . . . . . . . . . . . . . . . . . . . . . . . . . . . 106
Towards Succinct and Relevant Image DescriptionsDesmond Elliott . . . . . . . . . . . . . . . . . . . . . . . . . . . . . . . . . . . . . . . . . . . . . . . . . . . . . . . . . . . . . . . . . . . . . . . 109
Coloring Objects: Adjective-Noun Visual Semantic CompositionalityDat Tien Nguyen, Angeliki Lazaridou and Raffaella Bernardi . . . . . . . . . . . . . . . . . . . . . . . . . . . . . . 112
Multi-layered Image Representation for Image InterpretationMarina Ivasic-Kos, Miran Pobar and Ivo Ipsic . . . . . . . . . . . . . . . . . . . . . . . . . . . . . . . . . . . . . . . . . . . . 115
The Last 10 Metres: Using Visual Analysis and Verbal Communication in Guiding Visually ImpairedSmartphone Users to Entrances
Anja Belz and Anil Bharath. . . . . . . . . . . . . . . . . . . . . . . . . . . . . . . . . . . . . . . . . . . . . . . . . . . . . . . . . . . . .118
Keyphrase Extraction using Textual and Visual FeaturesYaakov HaCohen-Kerner, Stefanos Vrochidis, Dimitris Liparas, Anastasia Moumtzidou and Ioannis
Kompatsiaris . . . . . . . . . . . . . . . . . . . . . . . . . . . . . . . . . . . . . . . . . . . . . . . . . . . . . . . . . . . . . . . . . . . . . . . . . . . . . . .121
Towards automatic annotation of communicative gesturingKristiina Jokinen and Graham Wilcock . . . . . . . . . . . . . . . . . . . . . . . . . . . . . . . . . . . . . . . . . . . . . . . . . . 124
viii

Conference Program
Saturday, 23 August, 2014
(09.00 - 09.15) Introduction and Welcome to Workshop
(09.15 - 10.30) Interaction
The Effect of Sensor Errors in Situated Human-Computer DialogueNiels Schütte, John Kelleher and Brian Mac Namee
Joint Navigation in Commander/Robot Teams: Dialog & Task Performance WhenVision is Bandwidth-LimitedDouglas Summers-Stay, Taylor Cassidy and Clare Voss
TUHOI: Trento Universal Human Object Interaction DatasetDieu-Thu Le, Jasper Uijlings and Raffaella Bernardi
(10.30 - 11.00) Morning Coffee
(11.00 - 11.40) Invited Keynote Talk - Alex Jaimes, Yahoo ! Inc.
(11.40 - 12.30) Language Descriptors
Concept-oriented labelling of patent images based on Random Forests andproximity-driven generation of synthetic dataDimitris Liparas, Anastasia Moumtzidou, Stefanos Vrochidis and Ioannis Kompat-siaris
Exploration of functional semantics of prepositions from corpora of descriptions ofvisual scenesSimon Dobnik and John Kelleher
ix

Saturday, 23 August, 2014 (continued)
(12.30 - 13.30) Lunch
(13.30 - 14.20) Visual Indexing
A Poodle or a Dog? Evaluating Automatic Image Annotation Using Human Descriptionsat Different Levels of GranularityJosiah Wang, Fei Yan, Ahmet Aker and Robert Gaizauskas
Key Event Detection in Video using ASR and Visual DataNiraj Shrestha, Aparna N. Venkitasubramanian and Marie-Francine Moens
(14.20 - 15.00) Poster Boasters
(15.30 - 17.00) Long Poster Papers (Parallel session)
Twitter User Gender Inference Using Combined Analysis of Text and Image ProcessingShigeyuki Sakaki, Yasuhide Miura, Xiaojun Ma, Keigo Hattori and Tomoko Ohkuma
Semantic and geometric enrichment of 3D geo-spatial models with captioned photos andlabelled illustrationsChris Jones, Paul Rosin and Jonathan Slade
Weakly supervised construction of a repository of iconic imagesLydia Weiland, Wolfgang Effelsberg and Simone Paolo Ponzetto
Cross-media Cross-genre Information Ranking based on Multi-media Information Net-worksTongtao Zhang, Haibo Li, Hongzhao Huang, Heng Ji, Min-Hsuan Tsai, Shen-Fu Tsai andThomas Huang
Speech-accompanying gestures in Russian: functions and verbal contextYulia Nikolaeva
DALES: Automated Tool for Detection, Annotation, Labelling, and Segmentation of Mul-tiple Objects in Multi-Camera Video StreamsMohammad Bhat and Joanna Isabelle Olszewska
A Hybrid Segmentation of Web Pages for Vibro-Tactile Access on Touch-Screen DevicesWaseem SAFI, Fabrice Maurel, Jean-Marc Routoure, Pierre Beust and Gaël Dias
x

Saturday, 23 August, 2014 (continued)
(15.30 - 17.00) Short Poster Papers (Parallel session)
Expression Recognition by Using Facial and Vocal ExpressionsGholamreza Anbarjafari and Alvo Aabloo
Formulating Queries for Collecting Training Examples in Visual Concept ClassificationKevin McGuinness, Feiyan Hu, Rami Albatal and Alan Smeaton
Towards Succinct and Relevant Image DescriptionsDesmond Elliott
Coloring Objects: Adjective-Noun Visual Semantic CompositionalityDat Tien Nguyen, Angeliki Lazaridou and Raffaella Bernardi
Multi-layered Image Representation for Image InterpretationMarina Ivasic-Kos, Miran Pobar and Ivo Ipsic
The Last 10 Metres: Using Visual Analysis and Verbal Communication in Guiding VisuallyImpaired Smartphone Users to EntrancesAnja Belz and Anil Bharath
Keyphrase Extraction using Textual and Visual FeaturesYaakov HaCohen-Kerner, Stefanos Vrochidis, Dimitris Liparas, Anastasia Moumtzidouand Ioannis Kompatsiaris
Towards automatic annotation of communicative gesturingKristiina Jokinen and Graham Wilcock
xi

Saturday, 23 August, 2014 (continued)
(17.00 - 17.30) Discussion and Closing
xii

Proceedings of the 25th International Conference on Computational Linguistics, pages 1–8,Dublin, Ireland, August 23-29 2014.
The Effect of Sensor Errors in Situated Human-Computer Dialogue
Niels SchuetteDublin Institute of Technology
John KelleherDublin Institute of Technology
Brian Mac NameeDublin Institute of Technology
Abstract
Errors in perception are a problem for computer systems that use sensors to perceive the envi-ronment. If a computer system is engaged in dialogue with a human user, these problems inperception lead to problems in the dialogue. We present two experiments, one in which partici-pants interact through dialogue with a robot with perfect perception to fulfil a simple task, and asecond one in which the robot is affected by sensor errors and compare the resulting dialogues todetermine whether the sensor problems have an impact on dialogue success.
1 Introduction
Computer systems that can engage in natural language dialogue with human users are known as dia-logue systems. A special class of dialogue systems are situated dialogue systems, which are dialoguesystems that operate in a spatial context. Situated dialogue systems are an active research topic (e.g.(Kelleher, 2006)). Recently opportunities for more practical applications of situated dialogue systemshave arisen due to advances in the robustness of speech recognition and the increasing proliferation ofmobile computer systems such as mobile phones or augmented reality glasses.
When a dialogue system operates in a situated context, it needs the ability to perceive the environment.Perception, such as computer vision, always has the potential of producing errors, such as failing tonotice an object or misrecognizing an object. We are interested in the effect of perception-based errorson human-computer dialogue. If the human user and the system have shared view, false perception by thesystem will lead to a divergence between the user’s understanding of the environment and the system’sunderstanding. Such misunderstandings are frequent in human-human dialogue and human speakers usedifferent strategies to establish a shared understanding or common ground (Clark and Schaefer, 1989).We investigated this problem in an earlier work based on a corpus of human dialogue (Schuette et al.,2012) and are currently moving toward the same problem in human-computer dialogue.
The problem of misunderstandings in human-computer dialogue has previously mostly been addressedunder the aspect of problems arising from problems in speech recognition or language understanding (e.g.(Aberdeen and Ferro, 2003; Shin et al., 2002; Lopez-Cozar et al., 2010)). The problem of producingreferring expressions when it is not certain that the other participant shares the same perception andunderstanding of the scene has been addressed by (Horacek, 2005). More recently (Liu et al., 2012)performed a similar experiment in the context of human-human interaction. Their work was chieflyconcerned with the generation of referring expressions.
We report on a work in progress in which we investigate the effect of sensor problems on human-computer dialogue using a dialogue system for a simulated robot. We describe two experiments weperformed so far. Both experiments are based on a shared experimental platform. In the first experimentparticipants interact with a simulated robot using a text based dialogue interface to complete a series oftasks. In the second experiment the participants again interact with the robot, except this time errors areintroduced into the robots perception. The goal of the second experiment is to investigate what effect
This work is licenced under a Creative Commons Attribution 4.0 International License. Page numbers and proceedingsfooter are added by the organizers. License details: http://creativecommons.org/licenses/by/4.0/
1

(a) The interaction window.(b) The simulation view.
Figure 1: The user interface.
the presence of sensor errors has on the dialogue and the task performance and compare it to the resultsfrom the first experiment. It should be emphasized that the goal of the experiments is not to evaluate theperformance of the dialogue system, but to investigate the effect of perception errors on the dialogues.
2 Experiment Methodology
The experiments were performed using an experiment system that was developed for this experiment.It consists of a simulated world and a dialogue system. The world contains a number of objects suchas boxes and balls. These object can be manipulated by an abstract simulated robot arm. The dialoguesystem is a frame based dialogue system that uses the Stanford Parser (Klein and Manning, 2003) forparsing. The simulation environment was implement using Microsoft Robotics Studio. The system iscapable of understanding and performing a range of simple to complicated spatial action instructionssuch as “Put the ball behind the red box” or “Pick up the red ball between the green box and the yellowbox”.
The participants interact with the system through the user interface shown in Figure 1. It consists oftwo elements. The simulation window shows a rendering of the simulation world that is updated in realtime. The interaction window provides access to a text based chat interface that the participants use tointeract with the simulated robot. When the participant sends a request to the system, the system analysesthe input and attempts to perform it in the simulation world. If it can not perform the request, it repliesthrough the user interface and explains its problem.
The robot’s perception is provided by a simulated vision system. In general its perception is correct,but sensor errors can be introduced. For example, it can be specified that the robot perceives entireobjects or some of their properties incorrectly.
Each run of the experiment consisted of a sequence of test scenes. Each scene consisted of a startscene and a target scene. The start scene determined how the objects in the simulation world werearranged at the beginning of the test scene. The target scene was presented to the participants as animage in the interaction window. The participants’ task was to interact with the robot to recreate thetarget scene in the simulation world.
After a participant had successfully recreated the target scene, the system automatically advanced tothe next scene. The participants were also offered the option to abandon a scene and go on to the nextone if they thought they would not be able to complete the current scene.
All utterances by the participant and the system are transcribed and annotated with their semantic
2

(a) Scene 1 (b) Target scene 1 (c) Scene 4 (d) Target scene 4
Figure 2: Two scenes from Experiment 1 and their target scenes.
interpretation. The system also logs metrics that are used in the evaluation of dialogue systems to describethe cost of a dialogue, such as the task completion rate, the number of utterances, the completion timeand the number of errors (Walker et al., 1997).
In the following we describe two experiments we performed with this setup so far. In the first exper-iment participants completed a series of tasks. In the second experiment, participants also completed aseries of tasks. In this iteration however, errors were introduced into the system’s perception.
3 Experiment 1
The first experiment uses the basic version of the experiment system. The purpose of the experimentwas to establish how difficult the basic experiment task would be and to create a set of performancemeasurements that could be used to compare this version of the system to later ones.
3.1 Instructions
The participants were provided with an instruction manual that described the experiment, introduced theuser interface and provided example interactions. Participants were encouraged to abandon a scene ifthey felt that they would not be able to complete it. After reading the instructions, the participants wereshown a video recording of some example interactions with the system. This was done to prime theparticipants towards using language and concepts that were covered by the system. No time limit wasset for experiment.
3.2 Test Scenes
The set of test scenes contained 10 scenes in total. Figure 2 shows some of the start scenes together withtheir respective target scenes. Scene 1 (Figure 2a) is an example of a simple scene. Scene 4 (Figure 2c)is an example of a more complex scene.
The scenes were presented in fixed order. The two initial scenes contained simple tasks. Their mainpurpose is to allow the participants to gain practical experience with interacting with the system beforeapproaching the actual test scenes. The remaining scenes were designed to elicit specific referringexpressions. To transform a scene into its target scene, the participants had to move a number objectsfrom their original location to their respective target location as specified in the target scene. To get therobot to move a target to a location, the participants had to specify which target the robot should move(e.g. “Take the red ball”), and specify where to move it (e.g. “Put it behind the green box on the left”).The complexity of the this task depends on the objects contained in the scene and their placement inrelation to each other. We were particularly interested in getting the participants to use specific objectsas landmarks in their referring expressions, and designed the scenes in such a way that participantswere influenced towards specific expressions. This was done with the motive of using landmark objectsas targets for perception errors in the second experiment. For each scene a set of target conditions wasspecified that determined when a scene was complete.
3.3 Participants
In total 11 participants participated in the experiment. Most of them were native English speakers ornon-native speakers who had been speaking English for a number of years. Two of the participants were
3

(a) The start scene. (b) The target scene.(c) The start scene as per-ceived by the robot.
Figure 3: One of the scenes from Experiment 2.
female, the rest were male. The participants were between 20 and 50 years of age. All were collegesciences graduates who worked with computers on a daily basis.
3.4 ResultsIn total 11 participants completed the experiments. This resulted in a total of 110 interactions, twoof which had to be discarded due to recording problems. A summary of the recorded metrics for thisexperiment is given in Table 1. It shows for each scene:
• How many instructions the participants used on average to complete it.
• How long the participants needed to complete each scene on average.
• How many of the instructions the participants produced contained a reference that was either am-biguous (it could not be resolved to a unique referent) or unresolved (no referent that matched thereferring expression was found).
• The final column show how often each scene was abandoned.
For the current investigation the last two columns are of primary interest. Participants had been in-structed to abandon a scene if they thought that they would not be able to complete it. The fact that thisonly occurred three times in 108 interactions indicates that the task was not very difficult and that thedialogue system’s performance was adequate for the task. The percentage of unresolved references inthe second to last column is also interesting because it indicates how often participants made referencesthat the system was not able to resolve. Since there were no errors introduced at this stage, the figurescan be seen as a baseline for the system’s ability to understand referring expressions.
4 Experiment 2
The main purpose of the second experiment was to investigate how the introduction of sensor errorswould influence the interactions and the outcome.
4.1 InstructionsThe participants were provided with an extended version of the instruction manual as well as the intro-duction video from the first experiment. The manual was identical to the manual from Experiment 1except for a small section that was added to explain that errors could occur in some of the scenes. Theparticipants were encouraged to either try to work around the errors or to abandon the scene if the thoughtthey would not be able to finish it. Again, no time limit was set.
4.2 Test ScenesThe set of test scenes was based on the set of test scenes for Experiment 1, except that this time sensorerrors were introduced. We investigated three possible error conditions. In the missing object condition,the perception system did not register an object at all. In the colour misclassification, the system did
4

Scene name Averagenumber ofactions perscene
Averagetime perscene
Percentageof am-biguous orunresolvedreferences
Numberof timesaban-doned
Scene 1 2.9 00:00:56 0 0Scene 2 2.3 00:00:54 0 0Scene 3 8.7 00:01:45 2.1 0Scene 4 5.9 00:01:52 10.8 0Scene 5 2 00:00:28 0 0Scene 6 5.2 00:01:23 5.2 1 (≈ 9%)Scene 7 2.6 00:00:40 0 0Scene 8 5.8 00:01:06 3.1 1 (≈ 9%)Scene 9 5.3 00:01:12 8.4 0Scene 10 6.8 00:01:30 6.7 1 (≈ 9%)Average 5.1 00:01:14 6 0.3
Table 1: Summary of the cost metrics for Phase 1. Few scenes were abandoned. The percentage ofunresolved references forms a baseline for the resolution performance of the system.
Scene name Averagenumber ofactions perscene
Averagetime perscene
Percentageof am-biguous orunresolvedreferences
Number oftimes aban-doned
Scene 1 2.29 00:00:59 2.6 0 (0%)Scene 2 3.29 00:00:56 3.6 2(≈ 11.8%)Scene 3 9.12 00:02:13 9.7 3 (≈ 17.6%)Scene 4 9.88 00:01:58 10.1 5 (≈ 29.4%)Scene 5 10.35 00:01:46 9.7 2 (≈ 11.8%)Scene 6 12.82 00:02:43 7.3 9 (≈ 52.9%)Scene 7 4.82 00:01:08 14.6 2 (≈ 11.8%)Scene 8 3.35 00:00:47 8.8 1 (≈ 5.9%)Scene 9 9.88 00:01:34 9.5 4 (≈ 23.5%)Scene 10 9.59 00:01:47 9.8 5 (≈ 29.4%)Scene 11 10.82 00:02:08 5.4 3 (≈ 17.6%)Scene 12 7 00:01:21 8.4 1 (≈ 5.9%)Scene 13 6.65 00:01:29 8 2 (≈ 11.8%)Scene 14 11.7 00:03:10 8.5 17 (100%)Scene 15 5.18 00:01:02 15.9 1 (≈ 5.9%)Scene 16 4.88 00:01:04 14.5 1 (≈ 5.9%)Scene 17 6.82 00:01:01 1.7 0 (0%)Scene 18 8.65 00:02:00 6.8 1 (≈ 5.9%)Scene 19 9.4 00:01:45 7.8 0 (0%)Scene 20 6 00:01:17 6.9 0 (0%)Average 7.6 00:01:36 8.5 2.95Average (scenesw/o errors)
6.1 00:01:20 4.9 0.5
Average (scenesw/ errors)
8.3 00:01:44 10 4
Table 2: Summary of the cost metrics for Phase 2. Scenes that contained no errors are highlighted ingreen. Compared to Table 1, scenes that contained errors were more often abandoned, and resolutionproblems were more frequent.
5

perceive the affected object but determined its colour incorrectly. A green ball for example, might bemistaken for a red ball. In the type misclassification condition, the system also perceives the object, butdetermines the object’s type incorrectly, for example, a green ball might be mistaken for a green box. Werestricted the errors so that at most one object was affected per scene. This was done to create scenes thatcontained errors, but would still be solvable in most cases without major communication breakdowns.The impact a sensor error has on the interaction greatly depends on which object it affects, the contextthe object appears in, and the role the object plays in the task. For example, if an object is affected thatdoes not need to be moved and that is unlikely to be mentioned as a landmark, it is likely that the errorwill not be noticed by the participant, and have no influence on the dialogue at all. On the other hand, ifan error affects an object that absolutely needs to be moved in order to complete the task in such a waythat it becomes impossible to interact with the object (e.g. because the robot does not see the object atall), it becomes effectively impossible to complete the task. In less severe cases, errors may introduceproblems that can be solved. For example, if the first attempt at a reference fails because a landmarkis not available to the system, the participant may reformulate the expression with a different landmark.This highlights the fact that sensor errors can have different effects depending on the circumstances.
We therefore decided to design each scene and the errors for the second phase manually in order tomake sure that examples for as many problem combinations as possible were presented to the partici-pants. We based the design of the scenes on our experiences from Experiment 1. We selected suitablescenes and introduced errors such that the preferred expressions used in Experiment 1 would be affected.Each new scene created this way together with the original scene formed a corresponding scene pairs.Members of a pair can be compared against each other to assess the impact of errors in Experiment 2.The final set of scenes contained 14 scenes with sensor errors. We added four more scenes without errorsto the test set. Their purpose was to complement the data from the first experiment, and to check if thepresence of errors in other scenes would influence the behaviour of the participants in non-error scenes.We also added the two introductory scenes from the first experiment. They were always presented asthe first scenes. The remaining scenes were presented in randomized order to prevent learning effects.Therefore each participant was presented with a set of 20 scenes. In total there were 22 correspondingscene pairs.
Figure 3 contains an example of a scene from the second experiment that contained a perception error.Figure 3a show the start scene as presented to the participant. Figure 3b shows the target scene that waspresented to the participant. Figure 3c shows the start scene as it was perceived by the robot (it mistakesthe green box for a ball).
Each scene was annotated with a set of target conditions and a set of sensor error specifications.
4.3 Participants17 participants were recruited for the experiment from roughly the same demographic as the first exper-iment. About half of the participants had participated in the first experiment. A space of about 60 dayswas left between the first experiment and the second experiment to minimize any influence between theexperiments.
4.4 ResultsIn total 17 participants completed the experiment. This results in a total of 340 interactions. Two inter-actions were lost, resulting in a set of 338 interactions. The results for this experiment are given in Table2. The highlighted rows (Scene 1,2,17,18,19 and 20) refer to scenes in which no errors were introduced.
As in the first experiment, the two last columns are the most interesting ones. Overall it can beobserved that more scenes were abandoned than in the first experiment. Every scene except for theones without errors was abandoned at least once (Scene 14 was abandoned by all participants. This wasexpected because it was designed to be not completable due to the errors). This indicates that the taskwith the errors was more difficult than the one in the first experiment.
It also appears that unresolved or ambiguous references were more frequent than in the first experi-ment. At the bottom of the table we present overall averages for the different metrics. It appears thatscenes with sensor errors generally show higher values than scenes without.
6

Figure 4: A boxplot comparing the number of actions between scenes from Experiment 1 and 2. Pairedplots with the same colour refer to corresponding scenes (continued in Figure 5).
5 Discussion and Analysis
Overall the results indicate that the introduction of sensor errors increases the difficulty of the task. Theresults show that the participants had to abandon scenes with errors more often than scenes withouterrors. On average they used more actions to complete scenes with errors. A possible explanation canbe found in the higher percentage of unresolved references. Participants attempted to refer to an object,but the system was unable to interpret it as expected due to a sensor error. This forced the participants totry a different expression to progress with the task. It should be noted that the number of unresolved andambiguous references at the present does not account for references that were resolved to an object thatwas not the object intended by the speaker. We may approach this problem at a later stage.
Figure 4 and 5 visualize the distribution of the number of actions for all the corresponding scene pairs.They are numbered 1 to 22. Plots labelled with a correspond to scenes without errors, plots labelled withb to their counterparts with errors. For easier visual comprehension, we coloured pairs alternatingly inblue and white.
In general it can be observed that the median number of actions is generally higher for scenes witherrors than for their non-error counterparts, and that the interquartile range also tends to be higher. Thedistributions appear to be fairly spread out. This suggests that there is considerable variation betweenparticipants. We performed t-tests between corresponding scenes to determine whether the differencesbetween corresponding scenes were significant. The test shows that 12 out of 22 pairs were significantlydifferent with a p-value below 0.05. We will investigate at a later stage how much the strength of thecorrespondence depends on the type of the error that was introduced.
A comparison of the distribution of the completion times was less conclusive. For some correspon-dence pairs, the median completion time is higher for error scenes, for other pairs it is lower. We con-jecture that there is some sort of self-selection mechanism at work where participants who were lessconfident with the task in the first place task abandoned scenes earlier than confident participants whenthey encountered problems, but this will require further investigation.
To summarize: The presence of sensor errors appears to increase the difficulty of the task, althoughthe effect appears to be small in some cases. This was in some way to be expected because the errorswere designed to pose solvable problems and not lead to major communication breakdowns.
6 Future Work
The results from this experiment are still very fresh, and this paper represents the first step in theiranalysis. In the next step we are going to try to identify strategies the participants employed once theyencountered an error and see how well they match up with the strategies we described for the human-human domain (Schuette et al., 2012). We are also interested in finding out how strategies evolved overthe course of the experiment, and in how much variation there is between individual participants.
7
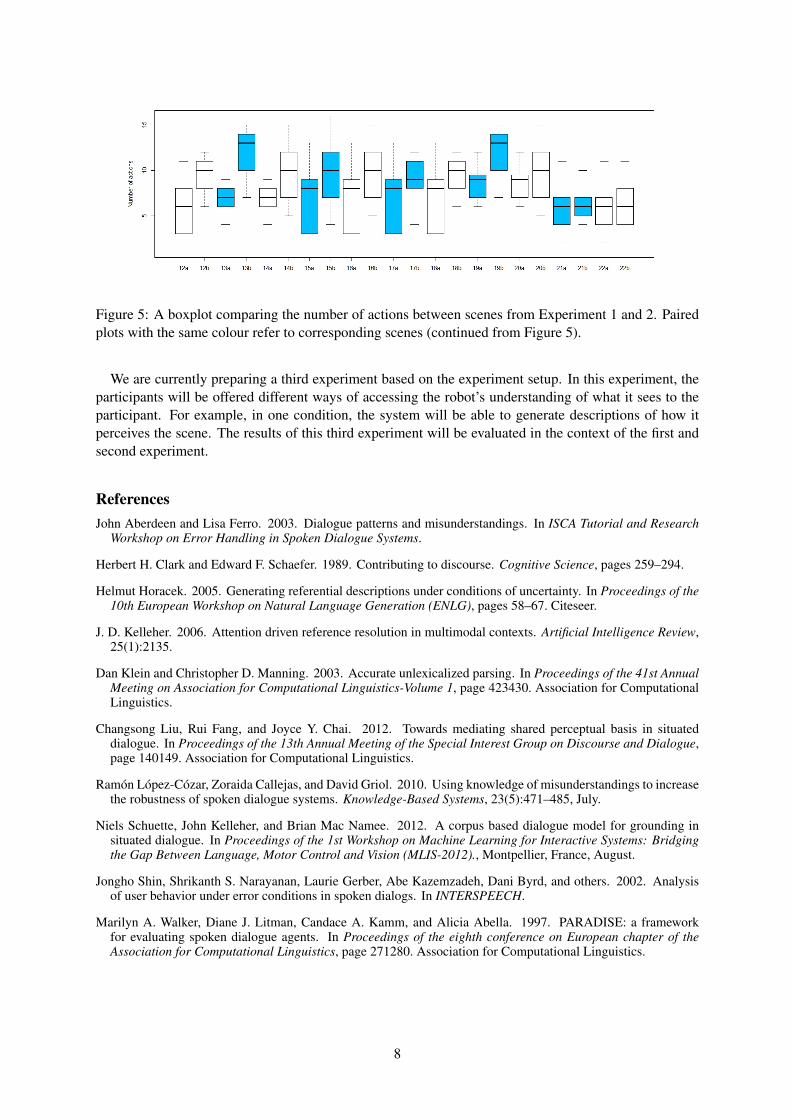
Figure 5: A boxplot comparing the number of actions between scenes from Experiment 1 and 2. Pairedplots with the same colour refer to corresponding scenes (continued from Figure 5).
We are currently preparing a third experiment based on the experiment setup. In this experiment, theparticipants will be offered different ways of accessing the robot’s understanding of what it sees to theparticipant. For example, in one condition, the system will be able to generate descriptions of how itperceives the scene. The results of this third experiment will be evaluated in the context of the first andsecond experiment.
ReferencesJohn Aberdeen and Lisa Ferro. 2003. Dialogue patterns and misunderstandings. In ISCA Tutorial and Research
Workshop on Error Handling in Spoken Dialogue Systems.
Herbert H. Clark and Edward F. Schaefer. 1989. Contributing to discourse. Cognitive Science, pages 259–294.
Helmut Horacek. 2005. Generating referential descriptions under conditions of uncertainty. In Proceedings of the10th European Workshop on Natural Language Generation (ENLG), pages 58–67. Citeseer.
J. D. Kelleher. 2006. Attention driven reference resolution in multimodal contexts. Artificial Intelligence Review,25(1):2135.
Dan Klein and Christopher D. Manning. 2003. Accurate unlexicalized parsing. In Proceedings of the 41st AnnualMeeting on Association for Computational Linguistics-Volume 1, page 423430. Association for ComputationalLinguistics.
Changsong Liu, Rui Fang, and Joyce Y. Chai. 2012. Towards mediating shared perceptual basis in situateddialogue. In Proceedings of the 13th Annual Meeting of the Special Interest Group on Discourse and Dialogue,page 140149. Association for Computational Linguistics.
Ramon Lopez-Cozar, Zoraida Callejas, and David Griol. 2010. Using knowledge of misunderstandings to increasethe robustness of spoken dialogue systems. Knowledge-Based Systems, 23(5):471–485, July.
Niels Schuette, John Kelleher, and Brian Mac Namee. 2012. A corpus based dialogue model for grounding insituated dialogue. In Proceedings of the 1st Workshop on Machine Learning for Interactive Systems: Bridgingthe Gap Between Language, Motor Control and Vision (MLIS-2012)., Montpellier, France, August.
Jongho Shin, Shrikanth S. Narayanan, Laurie Gerber, Abe Kazemzadeh, Dani Byrd, and others. 2002. Analysisof user behavior under error conditions in spoken dialogs. In INTERSPEECH.
Marilyn A. Walker, Diane J. Litman, Candace A. Kamm, and Alicia Abella. 1997. PARADISE: a frameworkfor evaluating spoken dialogue agents. In Proceedings of the eighth conference on European chapter of theAssociation for Computational Linguistics, page 271280. Association for Computational Linguistics.
8

Proceedings of the 25th International Conference on Computational Linguistics, pages 9–16,Dublin, Ireland, August 23-29 2014.
Joint Navigation in Commander/Robot Teams:Dialog & Task Performance When Vision is Bandwidth-Limited
Douglas Summers-StayArmy Research Laboratorydouglas.a.summers-stay.civ
Taylor CassidyIBM Research
Army Research [email protected]
Clare R. VossArmy Research [email protected]
Abstract
The prospect of human commanders teaming with mobile robots “smart enough” to under-take joint exploratory tasks—especially tasks that neither commander nor robot could performalone—requires novel methods of preparing and testing human-robot teams for these venturesprior to real-time operations. In this paper, we report work-in-progress that maintains face valid-ity of selected configurations of resources and people, as would be available in emergency cir-cumstances. More specifically, from an off-site post, we ask human commanders (C) to performan exploratory task in collaboration with a remotely located human robot-navigator (Rn) whocontrols the navigation of, but cannot see the physical robot (R). We impose network bandwidthrestrictions in two mission scenarios comparable to real circumstances by varying the availabil-ity of sensor, image, and video signals to Rn, in effect limiting the human Rn to function as anautomation stand-in. To better understand the capabilities and language required in such con-figurations, we constructed multi-modal corpora of time-synced dialog, video, and LIDAR filesrecorded during task sessions. We can now examine commander/robot dialogs while replayingwhat C and Rn saw, to assess their task performance under these varied conditions.
1 Introduction
Our research addresses a paradoxical situation in developing a robot capable of teaming with humans.To know what capabilities such a robot needs, we seek to determine how a human commander would in-teract — choice of vocabulary and sentence types, expected capabilities and world knowledge, resourcesused to accomplish tasks efficiently, etc. But without such a robot to interact with, we cannot knowhow a commander would behave. The prospect of human commanders teaming with mobile robots thatare “smart enough” to undertake joint exploratory tasks requires novel methods of preparing and testingactual human-robot teams for these ventures, in advance of actual real-time operations. Furthermore,given the need for human/robot teams during emergencies (such as Japan’s tsunami/Fukishima disaster),we are interested in particular in the feasibility of commander/robot shared tasks that include NL com-munication specifically for network contexts when bandwidth is limited by emergencies. Here we ask,how can multimodal data, as collected and processed by robots, and the robots themselves contributereal-time alerts and responses to human commanders over geographically-distributed networks?
The first phase of our approach is to introduce a human stand-in who navigates the robot, posing asan intelligent control system. At this stage, following our prior work (Voss et al., 2014), we seek todetermine how the commander communicates to accomplish different tasks with the robot, while welimit the information made available in passing from the robot’s sensors and camera to the commanderby way of the stand-in. In future phases, we will progressively automate away this actor’s role, replacingthe audio that the stand-in hears with what is “understood” by automatic natural language semanticinterpretation within a dialog manager, and replacing the joystick that it uses to navigate as the robot
This work is licenced under a Creative Commons Attribution 4.0 International License. Page numbers and proceedings footerare added by the organizers. License details: http://creativecommons.org/licenses/by/4.0/
9

with “actions” as automatically generated from micro-controller commands produced by transformationof semantic commands.
In this paper, we report work-in-progress that maintains face validity of selected configurations of re-sources and people, as would be available in emergency circumstances. From an off-site post, we askhuman commanders (C) to perform an exploratory task in collaboration with a remotely located humanrobot-navigator (Rn) who actually controls the navigation of, but cannot see, the physical robot (R). Werestrict the information Rn receives from R by imposing network bandwidth restrictions comparable toreal circumstances which limit what Rn is able to communicate to C. We then examine the comman-der/robot dialogs and task performance under these varied conditions.
To better understand the capabilities and language required in such configurations, we constructedmulti-modal corpora of time-synced dialog, video, and LIDAR files recorded during task sessions. Wecan now examine commander/robot dialogs while replaying what C and Rn saw, to identify the impactof varying the shared visual information on discourse, and to assess task performance under these var-ied conditions. We hypothesized that more explicit, mututally available information (visual or verbal)between participants would yield better understanding with more common ground, leading to more tasksuccess. We also hypothesized that exploration in a more complex physical environment would lead bothto more dialog, as needed in resolving references to more locations, and also then on occasion, to lessoverall task success. We have found in preliminary analyses that, with more explicit visual information,some Cs reduce their level of communication, with fewer requests for images from Rn. In one such case,this led to the Rn getting lost. We also noticed that some Cs increased their level of verbal communica-tion, requesting far more still images from the robot when Rn could not itself see the robot’s images (asopposed to when Rn had access to sent images). Taken together, these observations suggest—contrary toour hypothesis that more information is better, especially in a complex environment—that there may bea “teeter totter” effect in the communication between C and Rn as visual information varies. When Rnhas access to more of the robot’s visual information, C communicates less with Rn, possibly assumingmore shared information than is correct. Whereas when Rn is able to see less, C communicates morewith Rn, possibly compensating for the lack of certainty Rn expresses.
2 Related Work
For human-robot communication in joint exploration tasks, we wish to understand two issues. Thefirst is “scene to text”: when exploring new locations, how do people talk about what they see, andhow does that inform how they want robot team members to communicate about what they “see” whileexploring? The second is “text to scene”: given natural language instructions, how do people move aboutin new locations, and how does that impact their expectations of robot navigation? These issues spanboth generation and understanding of spatial language. There exists a large literature on spatial language,starting several decades ago (Talmy, 1983; Anderson et al., 1991; Gurney et al., 1996; Bloom et al., 1996;Olivier and Gapp, 1998) inter alia. This work yielded linguistic insights into the underlying structure ofspatial expressions, that has led more recently to annotation efforts like SpaceML (Morarescu, 2006) andspatial role labeling (Kordjamshidi et al., 2010). These results, theoretical and computational, have beenincorporated into NLP research, such as spoken dialog systems (Meena et al., 2014).
For “scene to text” processing, starting from a robot’s perception of the scene or environment, ex-ploiting even known dependencies among objects (spatial relations, relative motion, etc.) is a centralproblem in computer vision research. In the current state of robotics, the perceived world (a.k.a. se-mantic perception) derived from data collected by the robot is limited by what is available within itsimmediate sensor and video reach (Hebert et al., 2012). Within computational linguistic research, (Fengand Lapata, 2013) have tackled going from news images to text, leveraging the news story content ascontextual knowledge, and automatically generating captions describing the image content as relevantfor the story. For “text to scene” processing, a robot “understanding” a commander’s language entailsgoing beyond linguistic semantic interpretation down to the the robot controller level, as in, for example,Kress-Gazit et al. (2008). Within computational linguistics, Srihari and Burhans (1994) tackled goingfrom text to images, exploiting the conventions and spatial language in news caption to identify people
10
by their relative positions in accompanying images. More recently Coyne et al. (2011) presented workfor text-to-graphics generation, grounding conceptual knowledge in relational semantic encoding of lex-ical meanings from FrameNet. These one-way, directional approaches provide strong evidence that textand image modalities can each inform the processing of the other, and that, with concurrent audio andvideo streaming data, the alignment of time-stamped files across the two data modalities should alsoyield additional benefits in shared structural analyses and disambiguating references.1
3 Approach
In previous work, we had teams search a series of buildings, where all information from the Rn to C wasstrictly limited to text (Voss et al., 2014). While verbal descriptions of scenery were successfully elicitedduring exploratory missions, the communication was painfully slow and this scenario yielded unrealisticresults from our stand-in: we would not expect a robot to generate the complex verbal descriptions wecollected. Furthermore we also learned that our equipment could be adjusted for transmission of LIDARmap data and video stream from the robot to Rn and then to C. In this second study, we allowed individualmap and image updates to be sent to C, but only on request. This work provides more explicitly sharedknowledge between C and Rn, with its form and quantity more realistically varied and dynamic.
Equipment: We used an iRobot PackBot equipped with a forward-facing Kinect camera and a HokuyoLIDAR sensor.2 We use GPS and inertial sensors for Simultaneous Localization and Mapping (SLAM).Each participant had their own laptop with speakers and separate push-to-talk microphones. For navigat-ing the robot, the Rn pushed a joystick on an X-box controller that was held. Additionally for transmittingvisual information available from the robot during the missions, the Rn pushed separate buttons on thesame controller to transfer image and map data to C, but only at C’s request.
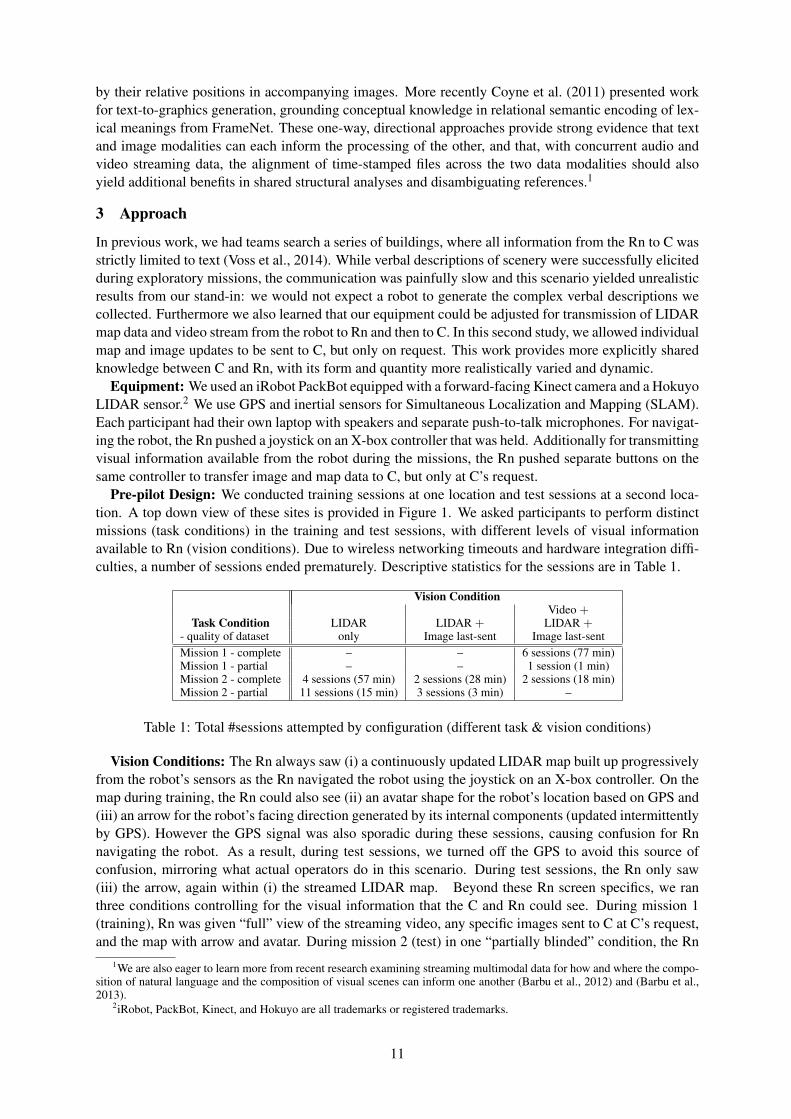
Pre-pilot Design: We conducted training sessions at one location and test sessions at a second loca-tion. A top down view of these sites is provided in Figure 1. We asked participants to perform distinctmissions (task conditions) in the training and test sessions, with different levels of visual informationavailable to Rn (vision conditions). Due to wireless networking timeouts and hardware integration diffi-culties, a number of sessions ended prematurely. Descriptive statistics for the sessions are in Table 1.
Vision ConditionVideo +
Task Condition LIDAR LIDAR + LIDAR +- quality of dataset only Image last-sent Image last-sentMission 1 - complete – – 6 sessions (77 min)Mission 1 - partial – – 1 session (1 min)Mission 2 - complete 4 sessions (57 min) 2 sessions (28 min) 2 sessions (18 min)Mission 2 - partial 11 sessions (15 min) 3 sessions (3 min) –
Table 1: Total #sessions attempted by configuration (different task & vision conditions)
Vision Conditions: The Rn always saw (i) a continuously updated LIDAR map built up progressivelyfrom the robot’s sensors as the Rn navigated the robot using the joystick on an X-box controller. On themap during training, the Rn could also see (ii) an avatar shape for the robot’s location based on GPS and(iii) an arrow for the robot’s facing direction generated by its internal components (updated intermittentlyby GPS). However the GPS signal was also sporadic during these sessions, causing confusion for Rnnavigating the robot. As a result, during test sessions, we turned off the GPS to avoid this source ofconfusion, mirroring what actual operators do in this scenario. During test sessions, the Rn only saw(iii) the arrow, again within (i) the streamed LIDAR map. Beyond these Rn screen specifics, we ranthree conditions controlling for the visual information that the C and Rn could see. During mission 1(training), Rn was given “full” view of the streaming video, any specific images sent to C at C’s request,and the map with arrow and avatar. During mission 2 (test) in one “partially blinded” condition, the Rn
1We are also eager to learn more from recent research examining streaming multimodal data for how and where the compo-sition of natural language and the composition of visual scenes can inform one another (Barbu et al., 2012) and (Barbu et al.,2013).
2iRobot, PackBot, Kinect, and Hokuyo are all trademarks or registered trademarks.
11

Figure 1: On left side: view of Mission 1 courtyard and building, with doorways marked. On right side:view of Mission 2 courtyards and buildings.
saw no video, but could see the specific images he sent to C as well as the map with arrow, and in theother even “more blinded” condition, Rn saw only the map with arrow. By contrast, the C only ever sawwhat the Rn sent (by pushing buttons) as snapshots at C’s request. During all conditions — independentof what was presented to Rn (“full’ view in mission 1, partially blinded or more-blinded in mission 2) —C could always request an updated snapshot image from the video feed or an updated snapshot map fromthe LIDAR feed or both. As a result, Rn’s view was “pushed” and current from the robot’s streamingdata, whereas the C’s view had to be “pulled,” requiring C to ask for more snapshots. Note that in Rn’smore-blinded condition, images were passed to C with Rn’s button push, but Rn could not see the images.
Mission 1: Enter courtyard and building via safe doorways. We hypothesized a robot with the abilityto carry on limited conversation regarding simple navigation and exploration, but without sufficient vi-sion capabilities to analyze more subtle clues about whether a doorway was safe to enter. We designedthe task to simulate a low-bandwidth condition where constant transmission of the map and video infor-mation is impossible. The robot was placed in one of two undisclosed positions outside the courtyardsurrounding a building. All sessions adopted the L+I+V vision condition. The site for this mission was a
Figure 2: Robot-navigator’s screen during Mission 1: upper left is static Image (clip from video, mostrecently sent to Commander), upper right is video window, gray-scale background is LIDAR map
12

single rectangular building enclosed by a single rectangular courtyard. The site for mission 2 was morecomplex, consisting of 5 buildings in a complex series of interconnected courtyards (see Figure 1). Thereare five doorways into the courtyard and two doorways into the building. These doorways are marked assafe or unsafe in a way that C can recognize but Rn cannot (C is given a key to the meaning of objectsplaced just beyond open doorways as symbols). The participants are not informed about doorway loca-tion or safety status. Figure 2 shows Rn’s screen during a mission 1 session. The grey-scale backgroundis an overhead, 2D view of a 3D map being built on the fly by combining various sensor data, whichcontains a white robot avatar and blue arrow indicating its current pose. C’s view is similar, but withoutvideo. Success on this task was gauged by whether the robot stayed safe in gaining entry to the house.
Mission 2: Find and classify all building doorways within a compound.As noted above and shown in Figure 1, the location in this mission had a more complex layout. Therobot’s location within the compound was not disclosed to C nor Rn (no clues were provided), so thatthe C and Rn team would need to work hard to place the robot on the map. The team was tasked withthoroughly exploring the compound to capture images of each building doorway. In the LIDAR-only (L)condition, Rn sees only the grey-scale map, whereas in the LIDAR and image condition (L+I) Rn seesthe most recently sent image as well as the grey-scale map (same screen layout as in Figure 2 but withoutvideo window in upper right). Success on this mission was gauged both by the number of doors (open orclosed) that were identified and photographed and by whether the participants were lost at some stage inthe exploration.
4 Observations and Preliminary Results
We recorded rich, multi-modal datasets including: dialogue between C and Rn, video, LIDAR 3D pointclouds, scene classification output on video frames, and robot pose. The data is used to build up a 3Dmodel of the scene, and automatically align RGB images to the model by mapping pixels to 3D regions.Examples of scene classification performance can be seen in Figure 3. The data for each run consists ofa ROS bag file (Quigley et al., 2009) and two audio files.3
Figure 3: left: view from robot camera. right: automated scene classification. Mix of colors indicatesprobability of belonging to a particular class. Classes found in this scene include sky, foliage, building,grass, concrete, and asphalt. Performance degrades in lighting conditions unattested in training data.
4.1 Results from Session Path AnalysisFigure 4 shows an overhead 2D view of the final 3D map built using the SLAM module. An orangeline depicts the robot’s path from mission start to finish, with ordinal numbers indicating the robot’s highlevel trajectory (the robot traveled from “start” to “1”, then to the location marked by “2”, etc., finallyending on the location marked by “15”). Doorways that were successfully captured in images sent to Care highlighted with a green solid-lined circle, whereas doorways that were passed by are indicated with
3A bag file stores nano-second accuracy timestamped, discrete data messages, such as an individual video frame, the factthat a joystick button was pressed, or the robot’s current velocity.
13

Mission 1 Vision Total # Images # Images Task Success:Sessions Condition # Images sent with sent with Stayed Safe?(duration) sent (any) door safe door Gained Entry?1 (21 min.) L + I + V 0 0 0 S, E2 (5 min.) L + I + V 0 0 0 N, E3 (17 min.) L + I + V 3 3 2 S, E4 (15 min.) L + I + V 8 7 2 S, E5 (13 min.) L + I + V 12 7 4 S, E
Table 2: Mission 1 sessions: These training sessions provided the robot-navigators (Rn) with “full”real-time vision, i.e., their screens displayed all sensed data, as collected by the physical robot (R)
Mission 2 Vision Total Total Total # # deictic # refs Task Success:Sessions Conditions #Images #Maps Im & Map refs to past # Doors id?(duration) (LIDAR) (sent (sent (sent one, by by Got Lost?
(Image) w/o map) w/o img) then other) C, Rn C, Rn Recovered?A (21 min.) L map 27 7 5 13, 2 6, 3 9, n/a , n/aB (20 min.) L map + I 7 9 7 7, 2 7, 2 7, L, R
Table 3: Mission 2 per-session events: request and reference types, task success.
a dotted line. There is a point in the run depicted where Rn states that he is “lost”, which is marked inthe figure by a green dot at step 10.
Figure 4: Robot path during Mission 2 session, doorways marked
4.2 Language Phenomena in DialogsReferring Expressions: There were few named environment features, necessitating the use of referringexpressions. Participants often used pronouns (‘behind it’), deictic expressions (‘that wall’), and bothdefinite and indefinite noun phrase descriptors (‘a wall directly in front of you’). The frequency ofreferring expressions other than proper names highlights the need for a dialog manager to robustly handlehuman-robot dialog in our setting. In six mission 2 dialogs consisting of 6,593 words total, we annotated1,593 referring expressions - 1,213 definite and 380 indefinite. The most common were first and secondperson singular pronouns (287 and 245), definite expressions of the form the x (265) and indefiniteexpressions of the form a(n) x (256). Most references are to things, either in the physical (‘face thedoorway’) or software (‘update your map’) environment, though there are references to events as well(‘do that again’).Lexical Ambiguity: The same objects were sometimes referred to as ‘doors’ or ‘doorways,’ although bya dictionary definition, those refer to somewhat different things. Based on context, the robot would needto be able to understand which sense was intended.
14

Spatial Relations: Since these were navigation and observation tasks, much of the discussion involvedspatial language pertaining to object configurations and robot paths. There were references to distancesand angles, both specific (‘turn 15 degrees to your right’) and vague (‘turn around.’) The robot was askedto ‘follow the wall’, ‘go north’, and to travel ‘around,’ ‘behind,’ and ‘near’ various objects.Clarifications and Suggestions in Dialogs: When uncertain about the meaning of commands, Rn some-times asked for clarification. At other times, Rn reminded C of its capabilities when appropriate: ‘Wouldyou like me to send you an updated map?’
4.3 The Role of Shared Visual Information
Participants were generally able to use both image and map data in conjunction with dialog to gainenough common ground to communicate about the environment and accomplish the tasks at hand. Forexample, after discussing environment features against the backdrop of an updated 2D map, we wereoften surprised at the extent to which C apparently kept track of R’s location using dialog alone withoutfurther map updates, as evidenced by C’s ability to correctly use Rn’s egocentric frame of reference inverbal descriptions (recall that the robot avatar remained static on C’s map between updates). In suchcases C and R took advantage of mutually accessible visual information - their 2D maps were identicalduring discussion. The role of mutually accessible information for achieiving common ground is furthersupported by the fact that C requested significantly more images in the LIDAR-only condition, whenRn could not see those sent images (see Table 3). Although shared visual knowledge proved useful forresolving referring expressions, C and Rn rarely mentioned the media explicitly (’the building’ vs ’thebuilding in the image you sent me’). In this way, the transfer of visual information served to introduceentities into their discourse, but was taken for granted and not called out per se.
5 Ongoing Work
We have found in preliminary analyses that, with more explicit visual information, some Cs reduce theirlevel of communication, with fewer requests for images from Rn. In one such case, this led to the Rngetting lost. We also noticed that some Cs increased their level of verbal communication, requesting farmore still images from the robot when Rn could not itself see the robot’s images (as opposed to whenRn had access to sent images). Taken together, these observations suggest—contrary to our hypothesesthat more information is better, especially in a complex environment—that there may be a “teeter totter”effect in the communication between C and Rn as visual information varies. When Rn “sees as the robot”with access to more transmitted visual information, C communicates less with Rn, possibly assumingmore shared information than is correct. Whereas when Rn “sees” less, C communicates more withRn, possibly compensating for the lack of certainty Rn expresses. We plan to extend our analysis ofhow C and Rn communicate uncertainty, and look at how this topic is addressed in first aid and militarymanuals (US Dept. of the Army, 1993).
We are currently developing a framework to automate many of the tasks currently performed by Rn.Our studies and data collections so far are best understood in the context of the capabilities and limitationsof the overall system we are in the process of building. A crucial gap to address is associating referringexpressions with corresponding concrete spatial structures in the 3D map. Consider one sentence spokenby the commander in one of the dialogues: “When you get to the wall, turn left and drive along the walluntil you reach either a corner or what you believe to be a door.” To interpret this correctly, the robotmust understand an entire set of points as a single object or part of an object, so it can recognize doors,walls, and corners in the combined vision and point-cloud. Moreover, it needs to plan a path that obeysthe constraint ”along the wall” and stops at some point which may be a door or a corner, that has notyet been observed. Thus, objects need to be represented independent of the observed world map.4 Atpresent, scene parsing techniques can analyze images and assign each pixel a probability of belonging toa particular object class (wall, stucco, road, etc.) allowing us to propagate these labels to correspondingpoints in the 3D model of the scene. In the future, we will use the 3D model to resolve visual ambiguitiesand attach labels to particular objects that persist from one video frame to the next.
4Resolving references to unvisited locations is a largely unexplored problem (Williams et al., 2013; Duvallet et al., 2013).
15

Acknowledgements
We thank members of the Asset Control and Behavior Branch at ARL for participation in our study andfor continuing to provide the technical support that makes our work possible. The work of Taylor Cassidywas funded by IBM under the International Technology Alliance in Network & Information Sciences.
ReferencesA. Anderson, M. Bader, E. Bard, E. Boyd, G.M. Doherty, S. Garrod, S. Isard, J. Kowtko, J. McAllister, C. Sotillo,
H.S. Thompson, and R. Weinert. 1991. The HCRC Map Task Corpus. Language and Speech, 34:351–366.
A. Barbu, A. Bridge, D. Coroian, S. J. Dickinson, S. Mussman, S. Narayanaswamy, D.l Salvi, L. Schmidt, J. Shang-guan, J. M. Siskind, J. W. Waggoner, S. Wang, J. Wei, Y. Yin, and Z. Zhang. 2012. Large-scale automaticlabeling of video events with verbs based on event-participant interaction. CoRR, abs/1204.3616.
A. Barbu, S. Narayanaswamy, and J. Siskind. 2013. Saying what you’re looking for: Linguistics meets videosearch. CoRR, abs/1309.5174.
P. Bloom, M. Peterson, L. Madel, and M. F. Garrett, editors. 1996. Language and Space. The MIT Press.
B. Coyne, D. Bauer, and O. Rambow. 2011. Vignet: Grounding language in graphics using frame semantics. InACL Workshop on Relational Models of Semantics (RELMS 2011).
F. Duvallet, T. Kollar, and A. Stentz. 2013. Imitation learning for natural language direction following throughunknown environments. In IEEE Intl. Conference on Robotics and Automation (ICRA), pages 1047–1053.
Y. Feng and M. Lapata. 2013. Automatic caption generation for news images. IEEE Transactions on PatternAnalysis and Machine Intelligence, 35:4:797–812.
J. Gurney, E. Klipple, and C. Voss. 1996. Talking about what we think we see: natural language processing for areal-time virtual environment. IEEE International Joint Symposia on Intelligence and Systems.
M. Hebert, J. A. Bagnell, M. Bajracharya, K. Daniilidis, L. H. Matthies, L. Mianzo, L. Navarro-Serment, J. Shi, andM. Wellfare. 2012. Semantic perception for ground robotics. In R. E. Karlsen; D. W. Gage; C. M. Shoemaker;G. R. Gerhart, editor, SPIE Proceedings Vol. 8387: Unmanned Systems Technology XIV.
P. Kordjamshidi, M. Van Otterlo, and Marie-Francine Moens. 2010. Spatial Role Labeling: Task Definition andAnnotation Scheme. In Proceedings of Language Resources and Evaluation Conference.
H. Kress-Gazit, G. E. Fainekos, and G. J. Pappas. 2008. Translating Structured English to Robot Controllers.Advanced Robotics Special Issue on Selected Papers from IROS, Vol. 22, No. 12:1343–1359.
R. Meena, J. Boye, G. Skantze, and J. Gustafson. 2014. Crowdsourcing street-level geographic information usinga spoken dialogue system. In Proceedings of SIGDIAL. Association for Computational Linguistics.
P. C. Morarescu. 2006. Principles for annotating and reasoning with spatial information. In LREC.
P. Olivier and K-P. Gapp, editors. 1998. Representation and Processing of Spatial Expressions. Lawrence ErlbaumAssociates, Hillsdale, NJ, USA.
M. Quigley, K. Conley, B. Gerkey, J. Faust, T. B. Foote, J. Leibs, R. Wheeler, and A. Y. Ng. 2009. ROS: anopen-source robot operating system. In ICRA Workshop on Open Source Software.
R. K. Srihari and D. T. Burhans. 1994. Visual semantics: Extracting visual information from text accompanyingpictures. In Proc. Of Twelfth National Conference on Artificial Intelligence (AAAI-94), pages 793–798.
L. Talmy. 1983. How Language Structures Space. In Jr. H. L. Pick and L. P. Acredolo, editors, Spatial Orientation:Theory, Research, and Application, pages 225–282. Plenum Press, London.
US Dept. of the Army. 1993. Physical fitness training: Field manual 3-25.26. Washington, D.C.
C.R. Voss, T. Cassidy, and D. Summers-Stay. 2014. Collaborative Exploration in Human-Robot Teams: What’sin Their Corpora of Dialog, Video, & LIDAR Messages? In Proceedings of EACL Dialog in Motion Workshop.
T. E. Williams, R. Cantrell, G. Briggs, P. W. Schermerhorn, and M. Scheutz. 2013. Grounding natural languagereferences to unvisited and hypothetical locations. In AAAI.
16

Proceedings of the 25th International Conference on Computational Linguistics, pages 17–24,Dublin, Ireland, August 23-29 2014.
TUHOI: Trento Universal Human Object Interaction Dataset
Dieu-Thu LeDISI, University of Trento
Povo, 38123, [email protected]
Jasper UijlingsUniversity of Trento, Italy
University of Edinburgh, [email protected]
Raffaella BernardiDISI, University of Trento
Povo, 38123, [email protected]
Abstract
This paper describes the Trento Universal Human Object Interaction dataset, TUHOI, which isdedicated to human object interactions in images.1 Recognizing human actions is an importantyet challenging task. Most available datasets in this field are limited in numbers of actions andobjects. A large dataset with various actions and human object interactions is needed for trainingand evaluating complicated and robust human action recognition systems, especially systemsthat combine knowledge learned from language and vision. We introduce an image collectionwith more than two thousand actions which have been annotated through crowdsourcing. Wereview publicly available datasets, describe the annotation process of our image collection andsome statistics of this dataset. Finally, experimental results on the dataset including human actionrecognition based on objects and an analysis of the relation between human-object positions inimages and prepositions in language are presented.
1 Introduction
Visual action recognition is generally studied on datasets with a limited number of predefined actionsrepresented in many training images or videos (Ikizler et al., 2008; Delaitre et al., 2011; Yao and Li,2010; Yao et al., 2011). Common methods using holistic image or video representation such as Bag-of-Words have achieved successful results in retrieval settings (Ayache and Quenot, 2008). Thoughthese predefined lists of actions are good for many computer vision problems, this cannot work whenone wants to recognize all possible actions. Firstly, the same action can be phrased in several ways.Secondly, the number of actions that such systems would have to recognize in real life data is huge: thenumber of possible interactions with all possible objects is bounded by the cartesian product of numbersof verbs and objects. Therefore, the task of collecting images or videos of each individual action becomesinfeasible with this growing number. By necessity this means that for some actions only few exampleswill be available. In this paper we want to enable studies in the direction of recognizing all possibleactions, for which we provide a new, suitable human-object interaction dataset.
A human action can be defined as a human, object, and the relation between them. Therefore, an actionis naturally recognized through its individual components. Recent advances in computer vision have ledto reasonable accuracy for object and human recognition, which makes recognizing the componentsfeasible. Additionally, language can help determining how components are combined. Furthermore,the relative position between human and object can be used to disambiguate different human actions.Perhaps prepositions in natural language can be linked to this relative position between the object andhuman (e.g., step out of a car). To transfer this knowledge from language to vision, it is important thatthe distribution of the visual actions are sampled similarly as the language data. This requirement isfulfilled when the action frequencies in the dataset mirror the frequencies in which they occur in real life.
To sum up, we aim at building an image dataset which can (1) capture the distribution of humaninteractions with objects in reality (if an action is more common that the other actions, that action isalso observed more frequently in the dataset than the others), (2) provide different ways of describing
1Our dataset is available to download at http://disi.unitn.it/ dle/dataset/TUHOI.htmlThis work is licensed under a Creative Commons Attribution 4.0 International Licence. License details:http://creativecommons.org/licenses/by/4.0/
17

an action for each image (there are many actions that can be phrased in several ways, for example: fix abike or repair a bike), (3) help with identifying different verb meanings (for example, the word ‘riding’has different implications for ‘riding a horse’, ‘riding a car’, and ‘riding a skateboard’).
2 Available image datasets for human action recognitionA common approach to human action recognition is to exploit visual features using bag-of-features orpart-based representation and treat action recognition as a general classification problem (Delaitre et al.,2010; Yao and Li, 2010; Wang et al., ; Laptev, 2005). For common actions, it has been shown thatlearning the joint appearance of the human-object interaction can be beneficial (Sadeghi and Farhadi,2011). Other studies recognize actions by their components such as objects, human poses, scenes (Guptaet al., 2009; Yao et al., 2011): (Yao et al., 2011) jointly models attributes and parts, where attributesare verbs and parts are objects and local body parts. These studies rely on suitable training data fora set of predefined actions: (Gupta et al., 2009) tests on a 6 sport action dataset, (Yao and Li, 2010)attempts to distinguish images where a human plays a musical instrument from images where he/shedoes not, (Delaitre et al., 2010) classifies images to one of the seven every day actions, and (Yao et al.,2011) introduces a dataset containing 40 human actions. Most of these datasets were obtained using websearch results such as Google, Bing, Flickr, etc. The number of images varies from 300 to more than 9Kimages. A comparison of the publicly available datasets with respect to the number of actions and theirrelated objects is given in Table 1.
Dataset #images #objects #actions Examples of actionsIkirler (Ikizler et al., 2008) 467 0 6 running, walking, throwing, crouching and kickingWillow (Delaitre et al., 2011) 968 5 7 interaction with computer, photographing, riding bikeSport dataset (Gupta et al., 2009) 300 4 6 tennis-forehand, tennis-serve, cricket bowlingStanford 40 (Yao et al., 2011) 9532 31 40 ride horse, row boat, ride bike, cut vegetablesPPMI (Yao and Li, 2010) 4800 7 7 play violin, play guitar, play flute, play french hornPASCAL (Everingham et al., 2012) 1221 6 10 jumping, playing instrument, riding horse89 action dataset (Le et al., 2013) 2038 19 89 drive bus, sail boat, ride bike, fix bike, watch TVTUHOI dataset 10805 189 2974 sit on chair, use computer, ride horse, play with dog
Table 1: A comparison of available human action datasets in terms of number of objects and actions
As can be seen in Table 1, the Stanford 40 action dataset contains quite a big number of images with40 different actions. This dataset is good for visually training action recognizers since there are enoughimages collected for each actions divided into training and test sets. There are some dataset in whichhuman action does not involved any object, these actions are for instance running, walking, or actionswhere objects are not specified such as catching, throwing. These types of actions are not the targetdomain of our dataset. We aim at recognizing the human object interactions based on objects. With thesame object, some actions are also more common than other actions: for example, sitting on a chair ismore commonly observed than standing on a chair. We want to capture such information in our datasetwhich can reflect the human action distributions on common objects, aiming to sample human actionsrelated to objects in the visual world. Furthermore, how actions can be phrased in different ways, or howverbs can have different meanings when interacting with different objects should also be considered.Some actions can only be performed on some particular objects and are not applicable to some otherobjects: a person can ride a horse, ride a bike, can feed a horse, but cannot feed a bike. This problemof ambiguity and different word uses have been widely studied in computational linguistics, but havereceived little attention from the computer vision community.
With the aim of creating a dataset that covers these requirements, we collect our dataset starting fromimages where humans and objects co-occur together and define the actions we observe in each imageinstead of collecting images for some predefined human actions. This way of annotating actions inimages is more natural and helps creating a more realistic dataset with various human actions that canoccur in images generally.
Recently, some good works attempted to generate descriptive sentences from images (Farhadi et al.,2010; Kulkarni et al., 2011). In our dataset we focus on human actions, which, if present, are often themain topic of interest within an image. As such, our dataset can be used as an important stepping stone
18

for generating full image descriptions as it allows for more rigorous evaluation than free-form text.
3 TUHOI, the new human action datasetImageNet is a hierarchical image database built upon the WordNet structure. The DET dataset in theImageNet large scale object recognition challenge 20132 contains 200 objects for training and evaluation.With the idea of starting from images with humans and common objects, we chose to use this DET datasetas a starting point to build our human action data.
3.1 The DET dataset: Object categories and labelsThe 200 objects in the DET dataset are general, basic-level categories (e.g., monitor, waffle iron, sofa,spatula, starfish). Each object corresponds to a synset (set of synonymous nouns) in WordNet. TheDET training set consists of single topic images where only the target object is annotated. As such,most images only contain primarily the object of interest and few actions. It is good for learning objectclassifiers but is not suitable for learning action recognition. In contrast, the validation dataset containsvarious images where all object instances are annotated with a bounding box. Many of these imagescontain actions. Therefore we start the annotation from the validation set.
Dataset #images #images #object #instances/object #“person”having “person” instances (min-max-median) instances
Training 395,909 9,877 345,854 438 - 73,799 - 660 18,258Validation 20,121 5,791 55,502 31 - 12,823 - 111 12,823
Table 2: The statistics of the DET dataset
As can be seen in Table 2, there are 15,668 images having human and 31,081 human instances inthese images. We select only images having human since we want to annotate this dataset with humanobject interactions. Objects related to clothes such as bathing cap, miniskirt, tie, etc. are not interestingfor human actions (most of the time, the action associated with these objects is “to wear”). Therefore,we excluded all these objects from the list of 200 objects above, which are: bathing cap, bow tie, bow,brassiere, hat with a wide brim, helmet, maillot, miniskirt, neck brace, sunglasses, tie.
3.2 Human action annotationGoal Our goal is to annotate these selected images containing humans and objects with their interac-tions. Each human action is required to be associated with at least one of the given 200 object categories.We used the Crowdflower, a crowdsourcing service for annotating these images. The Crowdflower anno-tators are required to be English native speakers and they can use any vocabulary to describe the actionsas they wish. Every action is composed of a verb and an object (possibly with a preposition).
Annotation guideline For each image, given all object instances appearing in that image (togetherwith their bounding boxes), the annotator has been be asked to assign all human actions associated toeach of the object instance in the image (where “no action” is also possible). Every human actions needto have as object one of the object instances given in that image. For example, if the image has a bikeand a dog, the annotator will assign every human actions associated to “bike” and “dog”. Every imagehas been annotated by at least 3 annotators, so that each action in the image can be described differentlyby different people. Some examples of annotated images in our dataset are given in Figure 1.
3.3 Results of the annotation and some statisticsIn total, there are 10,805 images, which have been annotated with 58,808 actions, of which 6,826 timesit has been annotated with “no action” (11.6%). On average, there are 4.8 actions annotated for eachimage (excluding “no action”), of which there are 1.97 unique action/image. Some other statistics of thedataset are given in Table 3: The number of unique verbs per object ranges from 1 (starfish, otter) to 158(dog). As dogs occur very often in this image dataset (4,671 times), the number of actions associated toit is also larger than other objects.
2http://www.image-net.org/challenges/LSVRC/2013/
19

Figure 1: Examples of annotated images: Left: (1) play ping-pong, hold racket; (2) use laptop, hold computer mouse; (3)use microphone, play accordion, play guitar, play violin; (4) talk on microphone, sit on sofa, pour pitcher; (5) play trombone;(6) eat/suck popsicle; (7) listen/use/hear stethoscope; (8) ride bicycle, wear backpack; (9) swing/hold racket, hit tennis ball;Right: (1) sit on chair, play violin; (2) wear diaper, sit on chair, squeeze/apply cream; (3) sit on chair, play cello; (4) hold/shakemaraca; (5) ride watercraft, wear swimming trunks; (6) cook/use stove, stir mushroom, hold spatula; (7) drive/row watercraft;(8) sit on chair, pet dog, lay on sofa; (9) click/type on computer keyboard
Number of unique actions (verb + object): 2,974 actionsNumber of unique verbs: 860 verbsVerbs that are used most frequently (verb (#occurrences)): play (13043), hold (7731), ride (4765), sit (3535), sit on (1501)drive (1491), wear (1441), eat (1175), hit (1168), pet (970), use (897), walk (787), stand (756)touch (509), carry (507), blow (384), sail (323), kick (297), lead (290), throw (246), strum (239)stand on (223), run (223)Verbs that are used least frequently (occur only once): dirty, swing over, twist, beats, walks, ay, curlface, shit, sail in, n‘, see by, forge, draw, tag10, sling, rides, walk across, no image available, wavingdrag, award, preform, strumb, died, land, unload, tricks, cooked, time, fasten, fall over, holed, leap over, pull upObjects go with the largest number of verbs (object (#unique verbs)): dog (158), car (80), table (79), watercraft (68)horizontal bar (56), chair (54), cart (52), whale (50), bicycle (48), cattle (42), soccer ball (41), balance beam (38)band aid (38), motorcycle (37), flower pot (35), ladle (35), guitar (35), horse (35), ski (34), bus (34)Objects that go with the least number of verbs (object (#unique verbs)): milk can (5), pitcher (5), scorpion (4), bear (4),pretzel (4), sheep (4), frog (4), mushroom (4), printer (4), pineapple (4), ruler (3), guacamole (3), isopod (3), chime (3),plate (rack (3), strawberry (3), porcupine (3), ant (3), toaster (3), bagel (3), jellyfish (3), dragonfly (2), lion (2), zebra (2),goldfish (2), hamster (2), fig (2), squirrel (2), bee (2), centipede (2), koala (bear (2), snail (2), pomegranate (2), armadillo(2), otter (1), starfish (1)
Table 3: Some statistics of the human action dataset
For some images, the annotators find many different ways to describe the action in the image. In ourdata, a set of images was selected to be annotated by more than three people in order to facilitate sanitychecks. An example of such image which has been annotated by many people is given in Figure 2.The annotators have found many verbs to describe the action: feeding, leading, running with, touching,giving a treat to, etc.
Splitting training and test set For each object in our human action dataset, we split half of the imagesfor training and the other half is used for testing. The splitting process is done such that actions thatoccur in test set also occur in training set to guarantee that the training set contains at least one image foreach action occurring in the test set.
Figure 2: Many different ways to describe an action in an image
Evaluating human action classification in our dataset To evaluate the performance of the humanaction classification on this dataset, we use two different measurements: the accuracy and the traditional
20

precision, recall and F1 score. The accuracy reflects the percentage of predictions that are correct. Wecalculate within how many images, the classifier assigns the correct actions for a given object i:
Accuracyi =number of images that the classifier predicts correctly
total number of images(1)
If the output of the classifier is one of the three annotated actions by human, then the action predictedis considered to be correct. The accuracy of the whole system is the average accuracy over all objects,with n is the total number of objects.
Accuracy =
∑n
i=1Accuracyi
n(2)
This metric gives us the general performance of the system and easy to interpret. However, it giveshigher weights to actions that occur more often in the dataset. For example, if there are many actions“ride bike” occurring in the dataset, the accuracy of the whole system depends mostly on the performanceof the class “ride bike”. For actions that occur more rarely such as “fix bike”, then the accuracy of theclass “fix bike” will have little effect to the accuracy of the whole system.
To better analyze the results of the system and evaluate each action individually, we use the precision,recall and F1 score for each class in the classifier. More specifically, as this classifier is the multi-classclassifier, these metrics are computed using a confusion matrix:
Precisioni =Mii∑jMji
; Recalli =Mii∑jMij
(3)
where Mij is the value of the row i, column j in the confusion matrix. The confusion matrix is orientedsuch that a given row of the matrix corresponds to the value of the “truth”, i.e., correct actions assignedby human, and a given column corresponds to the value of action assigned by the classifier. Finally, theprecision, recall and F1 score of the whole system are calculated as the average score over all actions.
4 Experiments
In this part, we use our newly collected dataset for building a general human action classifier basedon objects. We analyze the relative positions between humans and objects in each image and use thisinformation to help classifying human actions. Finally, we discuss the relations between human-objectpositions with prepositions that are used in language for describing human actions.
4.1 Classifying human actions based on human-object positionsIn this experiment, we used Forest Random classification method to classify an image to an action givenan object. The features used for this classifier are positions of the object and the person appearing in thatimage. We compare this classifier when using position with a classifier using no position information tosee whether position information helps in classifying human actions and in which cases.
Extracting features To extract the features of objects and persons’ positions in the images, we takethe bounding box of the first object instance annotated in that image. There are images with more thanone object instance (for example, there are several ‘bike’ in an image, so we do not know what ‘bike’we are talking about). We use the four coordinates of the bounding boxes of the object and person in theimage as features for the classifier.
Results of the classifier To compare whether position information can help in recognizing actions ornot, we design a naive classifier which learns from the probability of a verb given an object to assign anaction for each image from the training image dataset.
Accuracy Precision Recall F1Without position 74.2% 0.40 0.26 0.29
With position 72.1% 0.65 0.29 0.36
Table 4: Results of the classifier with and without position information
21

Object Without position With position Object Without position With positionbaseball 0.36 0.52 bus 0.57 0.73
face powder 0.33 1 hair spray 0.73 0.74harmonica 0.07 0.97 horizontal bar 0.42 0.45
hotdog 0.29 0.57 motorcycle 0.80 0.82turtle 0.43 0.71 water bottle 0.56 0.65
Table 5: Objects with higher accuracy when using position information
The results of the systems with and without position are report in Table 4. It shows that the accuracy ofthe classifier without position is higher than when including the position (74.2% in compared to 72.1%).However the precision, recall and F1 of the classifier using position are all higher than without position.It’s due to the fact that the classifier without position blindly assigns each image to the most probableaction (i.e., actions that occurs most often with a given object learned from the training set), so it obtainsbetter overall accuracy when testing on all images. However, for other possible actions, this classifieris unable to disambiguate actions and the performance of this classifier on less frequent actions is worstthan when including position information into the classifier. Generally, when taking into account allpossible actions, the position-based classifier has better average precision, recall and F1 score (28.6%without position in compared with 35.8% using position).
To further analyze which objects and actions, the position information helps better, we compare theaccuracy of each individual objects. Table 5 reports main objects that have higher accuracy when usingposition. We want to be able to predict which kind of actions that positions will help in recognizing themthrough the knowledge we learn from language. This prediction will help us to learn how to include theposition information inside our human action recognizer since not all actions can be disambiguated bypositions. We divide the actions into two groups: one group for which we found position informationincrease the classification results. Another group for which we found position information to decreasethe classification results.
4.2 From prepositions in language to relative positions between human and object in imagesIn this section, we want to learn how prepositions in language can be used to determine which positionsare useful in action classification, i.e., if they belong to the first group or the second group in the previousexperiment.
The relative positions between human and object in images are useful in analyzing their interactions.For example, when a person is riding a horse, the person is usually on the top of the horse, and whena person is feeding a horse, then the person is usually standing next to the horse. In spoken English,sometimes prepositions can be used as an indicator to the relations between human and object positions.
We want to exploit the connection between human-object positions in images and prepositions thatlink human, verb and object in language. Intuitively, if an action implies a strong positional relationbetween the human and the object, we expect to find specific, distinguishing prepositions in language.For example, in language you usually say “sit on chair”, where the preposition on suggests a specificspatial relation between the human and the chair. When an action does not imply a strong positionalrelation, such as “play”, we expect no specific prepositions.
Links in language models To test this hypothesis, we use TypeDM (Baroni and Lenci, 2010), a dis-tributional memory that has been built from large scale text corpora. This model contains weighted<word-link-word> tuples extracted from a dependency parse of corpora. The relations between wordsare characterized by their “link”. Some of these links are prepositions that connect verbs and objectstogether. Examples of some tuples with word-link-word and their weights are provided in Figure 3.
Number of links and link entropy We want to determine whether there is any correlation betweenhuman-object relative positions in images and the associated prepositions from language models. To dothis, we record two metrics: the number of links, where we count how many different links that connectverbs and objects in the language model; and the entropy of each action Ai verb-object pair (where thehuman is implicit) is H(Ai) defined by: H(Ai) = −∑
lj∈Li p(lj)× log p(lj)where Li is the set of all links that occur between verb and object of action i; p(lj) is the probability
of the link lj of the action Ai:
22

Figure 3: Examples of word-link-word and their weights in the distributional memory
p(lj) =weight(lj)∑
lk∈Liweight(lk)
(4)
where weight(lj) is the weight given by the TypeDM of link j in action i.Generally, the entropy for each action allows seeing whether a link is predictable for a given pair of
verb-object or not: when a link is predictable, the entropy is expected to be low (contain little infor-mation), which might correspond to the case that the position information will be useful in predictingactions and the other way around.
Number of links EntropyGroup 1 (position helps) 8 1.05Group 2 (position doesn’t help) 15.3 1.36
Table 6: Actions that can be disambiguated by positions (Group 1) vs. actions that cannot be disam-biguated by positions (Group 2) and their links in the language model
Results The result shown in Table 6: for the first group (with position is better), the average numberof links per relation (verb - object) is 8 and the average entropy is 1.05; the average number of linksper relation for the second group is almost twice more, 15.3, and their average entropy is also higher,1.36. It shows that verbs which have many different ways of linking to an object might not have arepresentative relative position between the person and object, hence more difficult to be classified basedon their positions. Verbs that have less links to an object tend to have more fixed relative positionsbetween persons and objects, hence it might be helpful to use position information in classification.
A qualitative analysis We further examine actions where this statement does not apply, i.e., actionswith high number of links and high entropy but belong to group 1 (position information helps) andactions with low number of links and entropy belonging to group 2. For the first case, typical actionswhich have high number of links/entropy are: ride car, ride bus, ride train, pull cart, light lamp. The largenumber of links of these actions seem to come from relations which do not describe the human/objectinteraction itself. For example, the links associated with ‘ride bus’ do not all actually refer to ‘ride abus’ but to ride another object in a position with respect to the bus: ride after bus, ride behind bus,ride before bus. These cause extra links which are not related to the action itself. Similarly, actionspull of/around/behind/below/on cart, there is another object which is moved to a specific position withregards to the cart.
For the second case, examples of typical actions with low links but for which positions informationdoesn’t help are hold harmonica, wear diaper, hold ladle, spread cream, hold racket, apply lipstick.These actions are related to objects, for which their positions depends a lot on the human pose (e.g., holdsomething). These actions in the language model do not contain many links as we expected: the mostpossible link between hold, harmonica is in, which probably means hold harmonica in your hand.
Instead of looking at actions, we look into typical verbs where position information helps in classifyingactions and verbs where position information doesn’t help. For the first group, the most frequent verbsare: chop, cut, drink, feed, lean, sit on, sleep, look at, put on, shake, shoot, wash, catch. For the secondgroup, the most frequent verbs are: clean, cook, lift, punch, sing, spray, spread. It can be observed thatverbs related to some particular poses or relative positions between human and object are better with
23

the position information (chop, drink, sit on, sleep), and verbs related to more various human poses andunspecific are not helped by the position information (cook, sing, spray, clean).
Generally, there is a relation between prepositions in language and the relative positions betweenhuman-object in images. Although this statement does not hold in every cases, for example when theprepositions refer to the positions between another action (e.g., ride) and that object (e.g., after a bike),this can be potentially solved by better NLP parsing and analyses of verb phrases. Furthermore, actionsthat cannot be disambiguated by positions are usually related to different human poses, while actions thathave some particular human poses can be classified using position information.
5 Conclusion
In this paper, we have introduced the Trento Universal Human Object Interaction image dataset, TUHOI.This dataset contains more than two thousand human actions associated with 189 common objects inimages. The main characteristics of this dataset are that it follows the actual human action distributionobserved in images, it captures different ways of describing an action and it enables the study of howverbs are used differently with different objects in images. Additionally, we performed some prelimi-nary experiments in which we show that action recognition can benefit from using position information.Finally, we showed that this position information is related to prepositions that can be extracted from ageneral language model.
ReferencesStephane Ayache and Georges Quenot. 2008. Video Corpus Annotation using Active Learning. In European
Conference on Information Retrieval (ECIR), pages 187–198, Glasgow, Scotland, mar.
Marco Baroni and Alessandro Lenci. 2010. Distributional memory: A general framework for corpus-basedsemantics. Computational Linguistics.
Vincent Delaitre, Ivan Laptev, and Josef Sivic. 2010. Recognizing human actions in still images: a study ofbag-of-features and part-based representations. In BMVC. BMVA Press.
Vincent Delaitre, Josef Sivic, and Ivan Laptev. 2011. Learning person-object interactions for action recognition instill images. In NIPS.
M. Everingham, L. Van Gool, C. K. I. Williams, J. Winn, and A. Zisserman. 2012. The PASCAL Visual ObjectClasses Challenge 2012 (VOC2012) Results.
Ali Farhadi, Mohsen Hejrati, Amin Sadeghi, Peter Young, Cyrus Rashtchian, Julia Hockenmaier, and DavidForsyth. 2010. Every picture tells a story: Generating sentences for images. In ECCV.
Abhinav Gupta, Aniruddha Kembhavi, and Larry S. Davis. 2009. Observing human-object interactions: Usingspatial and functional compatibility for recognition. IEEE Trans. Pattern Anal. Mach. Intell., 31(10), October.
Nazli Ikizler, Ramazan Gokberk Cinbis, Selen Pehlivan, and Pinar Duygulu. 2008. Recognizing actions from stillimages. In ICPR, pages 1–4. IEEE.
Girish Kulkarni, Visruth Premraj, Sagnik Dhar, Siming Li, Yejin Choi, Alexander Berg, and Tamara Berg. 2011.Babytalk: Understanding and generating simple image descriptions. In CVPR.
Ivan Laptev. 2005. On space-time interest points. Int. J. Comput. Vision, 64(2-3):107–123, September.
Dieu Thu Le, Raffaella Bernardi, and Jasper Uijlings. 2013. Exploiting language models to recognize unseenactions. In ICMR.
Amin Sadeghi and Ali Farhadi. 2011. Recognition using visual phrases. In CVPR.
Heng Wang, Alexander Klaser, Cordelia Schmid, and Cheng-Lin Liu. Dense trajectories and motion boundarydescriptors for action recognition.
Bangpeng Yao and Fei-Fei Li. 2010. Grouplet: A structured image representation for recognizing human andobject interactions. In CVPR, pages 9–16.
Bangpeng Yao, Xiaoye Jiang, Aditya Khosla, Andy Lai Lin, Leonidas J. Guibas, and Li Fei-Fei. 2011. Actionrecognition by learning bases of action attributes and parts. In ICCV.
24
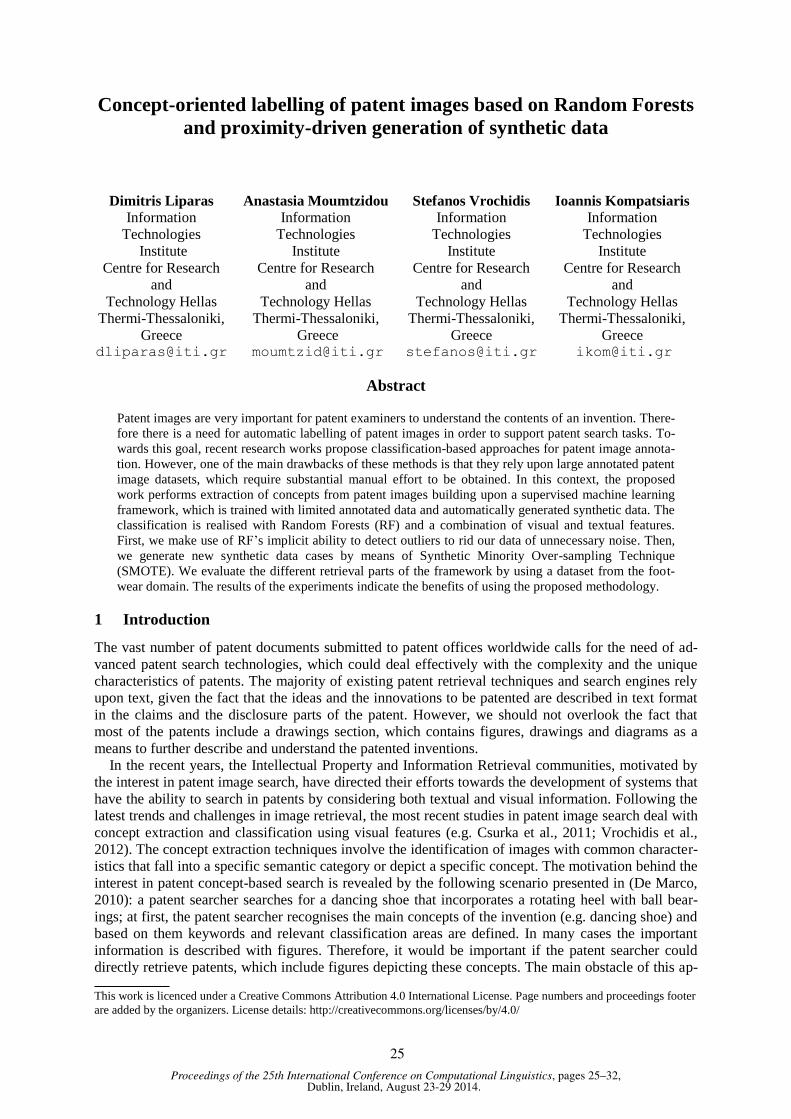
Proceedings of the 25th International Conference on Computational Linguistics, pages 25–32,Dublin, Ireland, August 23-29 2014.
Concept-oriented labelling of patent images based on Random Forests
and proximity-driven generation of synthetic data
Dimitris Liparas
Information
Technologies
Institute
Centre for Research
and
Technology Hellas
Thermi-Thessaloniki,
Greece [email protected]
Anastasia Moumtzidou
Information
Technologies
Institute
Centre for Research
and
Technology Hellas
Thermi-Thessaloniki,
Greece [email protected]
Stefanos Vrochidis
Information
Technologies
Institute
Centre for Research
and
Technology Hellas
Thermi-Thessaloniki,
Greece [email protected]
Ioannis Kompatsiaris
Information
Technologies
Institute
Centre for Research
and
Technology Hellas
Thermi-Thessaloniki,
Greece [email protected]
Abstract
Patent images are very important for patent examiners to understand the contents of an invention. There-
fore there is a need for automatic labelling of patent images in order to support patent search tasks. To-
wards this goal, recent research works propose classification-based approaches for patent image annota-
tion. However, one of the main drawbacks of these methods is that they rely upon large annotated patent
image datasets, which require substantial manual effort to be obtained. In this context, the proposed
work performs extraction of concepts from patent images building upon a supervised machine learning
framework, which is trained with limited annotated data and automatically generated synthetic data. The
classification is realised with Random Forests (RF) and a combination of visual and textual features.
First, we make use of RF’s implicit ability to detect outliers to rid our data of unnecessary noise. Then,
we generate new synthetic data cases by means of Synthetic Minority Over-sampling Technique
(SMOTE). We evaluate the different retrieval parts of the framework by using a dataset from the foot-
wear domain. The results of the experiments indicate the benefits of using the proposed methodology.
1 Introduction
The vast number of patent documents submitted to patent offices worldwide calls for the need of ad-
vanced patent search technologies, which could deal effectively with the complexity and the unique
characteristics of patents. The majority of existing patent retrieval techniques and search engines rely
upon text, given the fact that the ideas and the innovations to be patented are described in text format
in the claims and the disclosure parts of the patent. However, we should not overlook the fact that
most of the patents include a drawings section, which contains figures, drawings and diagrams as a
means to further describe and understand the patented inventions.
In the recent years, the Intellectual Property and Information Retrieval communities, motivated by
the interest in patent image search, have directed their efforts towards the development of systems that
have the ability to search in patents by considering both textual and visual information. Following the
latest trends and challenges in image retrieval, the most recent studies in patent image search deal with
concept extraction and classification using visual features (e.g. Csurka et al., 2011; Vrochidis et al.,
2012). The concept extraction techniques involve the identification of images with common character-
istics that fall into a specific semantic category or depict a specific concept. The motivation behind the
interest in patent concept-based search is revealed by the following scenario presented in (De Marco,
2010): a patent searcher searches for a dancing shoe that incorporates a rotating heel with ball bear-
ings; at first, the patent searcher recognises the main concepts of the invention (e.g. dancing shoe) and
based on them keywords and relevant classification areas are defined. In many cases the important
information is described with figures. Therefore, it would be important if the patent searcher could
directly retrieve patents, which include figures depicting these concepts. The main obstacle of this ap-
This work is licenced under a Creative Commons Attribution 4.0 International License. Page numbers and proceedings footer
are added by the organizers. License details: http://creativecommons.org/licenses/by/4.0/
25

proach is the need for a significant number of annotated images required during the training phase for
developing models for each concept/category, something that is arduous and time-consuming (due to
the specific nature of these images, it is not easy to retrieve training instances from the web).
To deal with the aforementioned restriction, we present an approach for concept extraction from pa-
tent images with the ability to supplement a small manually annotated dataset by means of automatic
synthetic data cases generation. The proposed methodology is based on a supervised machine learning
framework using Random Forests (RF) trained with textual and visual features. RF’s advantage of
handling multiclass classification tasks directly eliminates the need to develop a classification model
for each concept separately. Moreover, its outlier detection technique carries out a suitable pre-
processing of the data. The main contribution and the research objective of this paper is the examina-
tion of concept extraction based on multimodal classification, coupled with RF construction driven by
synthetic data and outlier elimination. While the research works up to date apply Synthetic Minority
Over-sampling Technique (SMOTE) for the purpose of overcoming imbalanced-related problems, the
proposed approach extends the application of SMOTE to the generation of synthetic cases in an al-
ready balanced dataset. To the best of our knowledge, there isn’t any relevant literature concerning the
application of SMOTE to multiclass datasets that are balanced but contain a relatively small amount of
training instances per class (which is the case in this study).
The rest of the paper is organised as follows: In Section 2 we provide the theoretical background of
our study. In Section 3, the related work is presented. The feature extraction process and the architec-
ture of the proposed framework are analysed in Sections 4 and 5, respectively. Section 6 describes the
conducted experiments, as well as the results. Finally, concluding remarks are provided in Section 7.
2 Theoretical background
Random Forests (RF) is an ensemble learning method for classification and regression (Breiman,
2001). Its inherent ability to learn multiclass classification problems (without the need to convert the
multiclass problem into a set of binary classification problems) makes it one of the most attractive ma-
chine learning algorithms. The fundamental idea of the methodology is the construction of a multitude
of decision trees. RF operates on two sources of randomness. Firstly, each decision tree is grown on a
different bootstrap sample drawn randomly from the training data. Secondly, at each node split during
the construction of a decision tree, a random subset of p variables is selected from the original variable
set and the best split based on these p variables is used. For predicting an unknown case, the predic-
tions of the trees constituting the RF are aggregated (majority voting for classification / averaging for
regression). For a RF consisting of N trees, the equation for predicting the class label l of a case y
through majority voting is the following:
( ) (∑ ( )
) (1)
where I the indicator function and hn the nth tree of the RF.
Among other things, RF can provide an internal estimate of its generalisation error. This is achieved
by the out-of-bag (OOB) error estimate. For each tree that is constructed, only 2/3 of the original data
cases are used in that particular bootstrap sample. The rest 1/3 of the instances (OOB data) are classi-
fied by the constructed tree and therefore, used for testing its performance. The OOB error estimate is
the averaged prediction error for each training case y, using only the trees that do not include y in their
bootstrap sample. Moreover, RF has a built-in mechanism for detecting outliers. Within the RF con-
text, cases whose proximities to all other cases in the data are generally small can be considered outli-
ers (Breiman, 2001). When a RF is constructed, all the training cases are put down each tree and their
proximity matrix is computed, based on whether pairs of cases end up in the same terminal node of a
tree. From this proximity matrix, an outlier measure for each case is derived. Cases whose outlier
measure values exceed a specified threshold are detected as outliers. For a more thorough analysis of
the core concepts of RF, see (Breiman, 2001).
Synthetic Minority Over-sampling Technique (SMOTE) is an approach for constructing efficient
classifiers from imbalanced datasets (Chawla et al., 2002). A dataset can be defined as imbalanced if
its classes are not evenly represented. The basic notion of the technique is the synthetic generation of
26

new minority class examples, based on the nearest neighbours of these cases, coupled with the under-
sampling of the majority class cases (Chawla et al., 2002).
3 Related work
Since our proposed framework deals with patent image classification, we report previous work related
to patent image concept extraction and to the classification methodologies involved in this study.
3.1 Patent image search and classification
The first attempts in patent image search were based on the extraction of visual low level features with
a view of retrieving visually similar images based on the query by visual example paradigm. Within
this context, several systems have been developed, including PATSEEK (Tiwari and Bansal, 2004)
and PatMedia image search engine (Vrochidis et al., 2010).
More recently, research in patent image search moved towards concept extraction and classification.
The two main approaches followed for concept generation in multimedia content are: “content-based”
and “text-based”. The content-based analysis uses visual low-level features to represent the multime-
dia content. In such a work (Csurka et al., 2011) the authors extract SIFT-like local orientation histo-
grams and they build visual vocabularies specific to patent images using Gaussian mixture model
(GMM). Then the images are represented by Fisher features and linear classifiers are employed for the
categorisation. On the other hand, text-based representation uses the indexing of media according to
text that can be associated to it, such as titles or descriptions in associated metadata files. Although
text-based representation can be considered as reliable, it depends on the existence and the quality of
the annotations. Finally, other recent works consider both visual and textual information. For example,
in (Vrochidis et al., 2012) the authors propose a supervised machine learning framework to extract
semantic concepts from patent images by combining visual and textual information. Although the
aforementioned studies deal with patent image concept extraction and classification, none of them
considers the use of synthetically generated data to leverage the classification performance.
3.2 Random Forests/SMOTE
Over the years, RF has been successfully applied to a wide range of disciplines. More specifically,
several studies dealing with image classification can be found in the relevant literature (see for exam-
ple (Bosch et al., 2007)). In this domain, a number of modifications of the RF algorithm have been
proposed (Moosmann et al., 2008; Xu et al., 2012). In addition, there has been some research address-
ing the outlier detection mechanism provided by RF (Zhang and Zulkernine, 2006).
Regarding SMOTE, many studies dealing with class imbalance problems have used this method to
overcome such issues. Among others, (Wang, 2008; Gao et al., 2011) can be listed. Moreover, several
improvements of the original algorithm have been introduced (Chawla et al., 2003; Wang et al., 2006).
In general, RF, as many other popular machine learning methods, needs a large amount of training
data, in order to achieve good performance and be able to generalise to new, unknown instances. For
any given classification problem, obtaining large datasets that contain existing training examples is not
always feasible, therefore a need to create new synthetic data arises. Although existing applications of
SMOTE are dealing with balancing imbalanced data (Wang, 2008; Gao et al., 2011), in this work we
use SMOTE with the sole purpose of generating synthetic cases, in order to enrich and improve the
training procedure of RF in a patent image classification framework.
4 Feature extraction from patent images
In this Section we briefly describe the extraction of visual and textual features from the patent images.
4.1 Visual features
The extraction of global concepts requires the employment of global visual features, which can cap-
ture the special characteristics of patent images (i.e. they are mostly black and white and depict tech-
nical drawings). Given the fact that general case image representation features consider colour and
texture, which are absent in most of patent images, it is evident that we need to apply an algorithm that
takes into account the geometry and the pixel distribution of these images. To this end, we employ the
27

Adaptive Hierarchical Density Histograms (AHDH) as visual feature vectors, due to the fact that they
have shown discriminative power between binary complex drawings (Sidiropoulos et al., 2011).
The AHDH feature vector is generated based on the following steps. First, the algorithm involves a
pre-processing phase for noise reduction, coordinate calculation and normalisation. Then, the first ge-
ometric centroid of the image plane is calculated and the image area is split into four regions based on
the position of this centroid. In the following, the feature vector is initialised by estimating the distri-
bution of the black points in each region. This procedure is repeated in a recursive way for a manually
specified number of iterations (e.g. Fig. 1), and after each iteration, the feature vector is updated. This
non-segmentation point-density orientated technique combines high accuracy at low computational
cost as it represents the image with a low dimension feature vector (i.e. around 100 features).
Fig. 1. The image is iteratively split to new regions based on the geometric centroids.
4.2 Textual features
Each figure of the patent document is linked to a description and caption found within the text. In or-
der to exploit these textual descriptions, we apply a bag of words approach to model each figure with a
vector. The bag of words model is a simplifying assumption used in natural language processing and
information retrieval. In this model, a text (such as a sentence or a document) is represented as an un-
ordered collection of words, disregarding grammar and even word order.
To generate such a vector we define a lexicon, which includes the most frequent words of this da-
taset. Then for each figure and based on the associated description we calculate a weight for each word
included in the lexicon. The textual annotations are stemmed using the Porter stemming algorithm and
the frequent stop words (e.g. and, so, etc.) are removed. The weight of each term is calculated with the
well-established metric tf-idf (term frequency multiplied with the inverse document frequency).
5 Proposed methodology framework
The flowchart of the proposed concept extraction and classification framework (training phase) is de-
picted in Fig. 2. Next, the different steps and components of the framework are described in detail.
First, the patent images and the captions associated to them are extracted from the patent and in
the following step the visual and textual features are generated, according to the procedures de-
scribed in Section 4. In this approach we treat each modality’s features independently. Thus, two dif-
ferent feature vectors (one for each modality) are formulated.
In the training phase, the feature vectors from each modality serve as input for the construction of
a RF (section 2), from which we proceed to the detection of possible outliers. The latter is achieved
in the following way: for each RF, the corresponding dataset’s training cases are put down each tree. If
a pair of cases end up in the same terminal node of a tree, their proximity is increased by 1. This is
repeated for every pair of cases and all trees in the RF. In order to obtain the final proximity values we
normalise them (divide them by the number of trees). Thus, if a dataset consists of N cases, a N×N
proximity matrix is derived. From this proximity matrix a measure that indicates the outlierness of
each case is computed. In general, since the RF algorithm is based on randomisation and in order to
obtain robust and reliable estimations about potential outliers, we suggest that the RF construction for
the outlier detection and elimination step is repeated several times for each modality and the resulting
outlier measure values from the constructed RFs are averaged. In this way, the randomisation factor is
minimised and the outliers can be detected with more confidence. We note that we opted to follow this
approach. The cases that are identified as outliers are eliminated from further processing.
28

Fig. 2. Flowchart of proposed patent image classification framework
Next, the over-sampling procedure of SMOTE is employed, in order to artificially generate new
cases and supplement the existing ones. The resulting larger datasets can lead to a better and more ef-
ficient RF training. It is important to note that the classes of the dataset used in this study are balanced
in the first place. Therefore, we apply SMOTE not for balancing the classes of the training data, which
was its main application to date (Section 2), but for introducing new training cases. According to
(Chawla et al., 2002), SMOTE over-samples each case by introducing synthetic examples along the
line segments joining a number (the number depends on the amount of over-sampling required) of that
case’s nearest neighbours. The over-sampling procedure is applied to each modality’s dataset and to
each concept separately. In this way the final datasets are created and correspondingly, the final RFs
for the textual and visual features are constructed.
Finally, for the formulation of the final RF predictions, a late fusion strategy is applied as fol-
lows: from the OOB error estimate (for the entire data set) of each modality’s RF, the corresponding
OOB accuracy values are computed. These values are normalised (by dividing them by their sum) and
serve as weights for the two modalities. During the testing phase, when the RF predicts a case, it out-
puts probability estimates per class for that case. The probability outputs Pt and Pv from the textual and
visual RFs respectively are multiplied by their corresponding modality weights Wt and Wv and
summed, in order to produce the final RF predictions as in the following equation:
(2)
6 Experimental design - Results
6.1 Dataset description – Experimental setup
The dataset1 was manually extracted from around 300 patents. It contains around 1000 patent images
depicting parts of footwear. The feature vectors that were generated (Section 4) for this dataset consist
of 100 visual and 250 textual features. With the help of professional patent searchers we selected the
following 8 concepts for this domain: cleat, ski boot, high heel, lacing closure, heel with spring,
tongue, toe caps and roller skates (Vrochidis et al., 2012). The procedure of associating the patent im-
ages with the figure text descriptions was carried out manually. This was done in order to acquire
quality data and consequently, draw safer conclusions on the concept extraction method. The images
were manually annotated with the support and advice of professional patent searchers.
For our experiments, the dataset was randomly split into training and test sets. We kept 2/3 of the
images for training purposes, whereas the rest (1/3) were used as test set, in order to estimate the clas-
sification scheme’s performance. We note here that because of the fact that RF provides an internal
estimate of its performance on cases that do not participate in its training procedure (the OOB error
estimate), no cross-validation was required. Moreover, since SMOTE is applied during the training
phase, it is important to mention that the test set contains only real (not synthetic) data.
1 Available for download at http://mklab.iti.gr/files/concepts-patent_images.rar
29

Regarding the parameters of the methods involved in the experiments, we selected and applied the
following setting: The number of trees used for the construction of each RF was set based on the OOB
error estimate. After conducting several experiments and gradually increasing the number of trees, we
noticed that the OOB error estimate was stabilised after using 1000 trees and no longer improved.
Hence, the number of trees was set to 1000. Moreover, for each node split during the growing of each
tree, the number of the subset of variables used to determine the best split was set to √ , where k is the
total number of features of the dataset (according to (Breiman, 2001)). Concerning the RF outlier de-
tection and elimination procedure, (Breiman, 2003) states that a case can be considered an outlier if its
outlier measure value is higher than 10. We note that after choosing this configuration, approximately
2% of the textual modality’s cases were detected as outliers and discarded, keeping the rest of the cas-
es for further processing, while for the visual modality no outliers were detected. Finally, the SMOTE
oversampling rate for each concept in both modalities datasets was set to 500%, i.e. for each case 5
new synthetic cases were generated, based on this case’s nearest neighbours.
6.2 Results
In order to evaluate the performance of the proposed methodology, we computed the precision, recall
and F-score measures for each concept, along with their corresponding macro-averaged values. Table
1 summarises the test set results from the application of RF to the initial dataset, without any outlier
deletion and without the use of SMOTE. The results refer to each modality separately, as well as to
their fused (according to the OOB error estimates) output scores (Visual + Textual). Since the F-score
takes into account precision and recall simultaneously, we consider it the most important metric for the
evaluation of the results. Moreover, since we are handling this classification problem in a multiclass
manner, we are more interested in the macro-average value of F-score. The results verify the notion
mentioned in Section 1 that textual data is a very reliable source of information for the patent retrieval,
since the textual modality achieves a macro-averaged F-score value of 73.7%, compared to 67.4% for
the visual modality. However, the late fusion of the outputs of each modality’s RF provides us with
improved results compared to the ones provided by each single modality, as evident from the corre-
sponding macro-averaged F-score value (81.8%). This suggests that the visual and textual modalities
can complement each other in the patent image classification task. If we observe the results for each
concept independently, we notice that the textual features do not outperform the visual ones only for
the “Ski boot”, “High heel” and “Lacing” concepts. On the other hand, the fused results are better than
the corresponding visual and textual results for every concept, with only the exception of “Tongue”,
where the textual features achieve the same performance (89.9% for the F-score).
Concepts Visual Textual Visual + Textual
Prec. Rec. F-score Prec. Rec. F-score Prec. Rec. F-score
Cleat 73.3% 55.9% 63.4% 70.1% 67.8% 68.9% 82.4% 79.6% 80.9%
Ski boot 94.4% 69.4% 80% 74.1% 81.6% 77.6% 76.2% 91.8% 83.2%
High heel 63.6% 83% 71.9% 51.7% 76.2% 61.5% 76.4% 93.2% 83.9%
Lacing 51.5% 71.7% 59.9% 62.8% 47.8% 54.2% 76.3% 63% 69%
Spring 70.5% 73.8% 72.1% 89.6% 61.9% 73.2% 90.6% 69% 78.3%
Tongue 76.6% 46.9% 58.1% 88.2% 91.8% 89.9% 88.2% 91.8% 89.9%
Toe caps 70.6% 55.8% 62.2% 83.8% 72.1% 77.5% 82.9% 79.1% 80.9%
Roller 64.3% 80.6% 71.5% 89.1% 85.1% 87% 90.6% 86.5% 88.5%
Macro-average 70.6% 67.1% 67.4% 76.2% 73% 73.7% 82.9% 81.7% 81.8%
Table 1. Precision, recall and F-score test set results (without outlier deletion and without SMOTE)
In Table 2 we report the test set results from the RF application to the dataset after the deletion of
the detected outliers and the use of SMOTE. While a minor degradation for the F-scores of some of
the concepts for both modalities (compared to the RF application to the original dataset) is obvious, it
seems that in average RF has benefited from the outlier elimination procedure and the generation of
new cases through SMOTE, as the macro-averaged F-scores have been improved (69.5% for the visual
and 75.7% for the textual features). In this case, the visual-based classification performs better than the
textual-based one only for the “High heel” and “Lacing” concepts. The fusion of the modalities out-
30

performs each one of them (84.2%) and moreover, there is a 2.4% improvement compared to the fused
results for the initial dataset. Finally, in Figs. 3 and 4 the first 6 results for the “Ski boot” and
“Tongue” concepts (respectively), using the final dataset, are presented. The precision achieved for
this set of results is 83.3% (5/6) for the “Ski boot” and 100% (6/6) for the “Tongue” concept.
Concepts Visual Textual Visual + Textual
Prec. Rec. F-score Prec. Rec. F-score Prec. Rec. F-score
Cleat 66.1% 66.1% 66.1% 79.2% 71.2% 75% 89.1% 83.1% 85.9%
Ski boot 85.7% 73.5% 79.1% 77.7% 85.7% 81.5% 80.4% 83.7% 81.9%
High heel 68.6% 81.4% 74.4% 76.9% 67.8% 72% 80.6% 84.7% 82.6%
Lacing 50% 76.1% 60.3% 42.4% 60.9% 50% 67.3% 76.1% 71.4%
Spring 68.1% 71.4% 69.7% 73.9% 81% 77.3% 90.2% 88.1% 89.1%
Tongue 78.3% 59.2% 67.4% 86.3% 89.8% 88% 88.2% 91.8% 89.9%
Toe caps 72.2% 60.5% 65.8% 90.6% 67.4% 77.2% 89.7% 81.4% 85.3%
Roller 74.2% 73.1% 73.6% 90% 80.6% 85% 90.5% 85.1% 87.7%
Macro-average 70.4% 70.1% 69.5% 77.1% 75.5% 75.7% 84.5% 84.2% 84.2%
Table 2. Precision, recall and F-score test set results (with outlier deletion and SMOTE)
Fig. 3. Results for the “Ski boot” concept. The green tics indicate the correct results.
Fig. 4. Results for the “Tongue” concept. The green tics indicate the correct results.
7 Conclusions
In this study a concept extraction and multimodal classification framework for patent images trained
with synthetic data, is introduced. The implicit ability of RF to deal effectively with multiclass classi-
fication problems and to perform a suitable filtering of the data, according to how well the dataset’s
instances fit in its construction procedure, coupled with the benefits of using an over-sampling tech-
nique such as SMOTE, provide a final result that leads to enhanced classification performance.
The application of this framework could augment existing (mainly text-based) patent search sys-
tems. Although the framework has been tested with a limited set of concepts, the methodology based
on RF is scalable and the application of SMOTE minimises the need for training data. In addition the
application of the concept extraction methodology to patents that belong to the same IPC (Internation-
al Patent Classification) class and/or groups will allow for targeting only a specific set of concepts
(relevant to the corresponding IPC class). The concept-based retrieval functionality will enable patent
examiners to search in patent figures based on their visual content and therefore speed up and improve
the performance of patent search tasks for patent invalidation and competitive intelligence research.
Our recommendations for future work include the testing of different parameter settings than the
one used in this study and the evaluation of their performance, the expansion of the experiments with a
31

very large set of concepts and finally, the investigation of alternative multimodal fusion approaches,
such as the one presented in (Roller and Schulte im Walde, 2013).
Acknowledgment: This work was supported by MULTISENSOR project (FP7-610411).
Reference
Anna Bosch, Andrew Zisserman, and Xavier Munoz. 2007. Image classification using random forests and ferns.
In ICCV, 1-8.
Leo Breiman. 2001. Random Forests. In Machine Learning, 45(1): 5-32.
Leo Breiman. 2003. Manual – Setting up, using and understanding random forests v4.0.
http://oz.berkeley.edu/users/breiman/ Using_random_forests_v4.0.pdf.
Nitesh V. Chawla, Kevin W. Bowyer, Lawrence O. Hall, and W. Philip Kegelmeyer. 2002. SMOTE: Synthetic
Minority Over-Sampling Technique. Journal of Artificial Intelligence Research, 16: 321-357.
Nitesh V. Chawla, Aleksandar Lazarevic, Lawrence O. Hall, and Kevin W. Bowyer. 2003. SMOTEBoost: Im-
proving prediction of the minority class in boosting. In 7th European Conference on Principles and Practice of
Knowledge Discovery in Databases, 107–119.
Gabriela Csurka, Jean-Michel Renders, and Guillaume Jacquet. 2011. G. XRCE’s Participation at Patent Image
Classification and Image-based Patent Retrieval Tasks of the Clef-IP 2011. In: Proceedings of CLEF 2011,
Amsterdam
Dominic De Marco. 2010. Mechanical Patent Searching: A Moving Target. Patent Information Users Group
(PIUG), Baltimore, USA
Ming Gao, Xia Hong, Sheng Chen, and Chris J. Harris. 2011. A combined SMOTE and PSO based RBF classifi-
er for two-class imbalanced problems. Neurocomputing, 74:3456–3466.
Frank Moosmann, Eric Nowak, and Frederic Jurie. 2008. Randomized clustering forests for image classification.
IEEE Transactions on PAMI, 30(9): 1632-1646.
Stephen Roller and Stephen Schulte im Walde. 2013. A multimodal LDA model integrating textual, cognitive
and visual modalities. In Proceedings of the 2013 Joint Conference on Empirical Methods in Natural Lan-
guage Processing and Computational Natural Language Learning, 1146–1157, Seattle, Washington, USA
Panagiotis Sidiropoulos, Stefanos Vrochidis, and Ioannis Kompatsiaris. 2011. Content-based binary image re-
trieval using the adaptive hierarchical density histogram. Pattern Recognition Journal, 44(4):739–750.
Avinash Tiwari and Veena Bansal. 2004. PATSEEK: Content Based Image Retrieval System for Patent Data-
base. In: Proceedings International Conference on Electronic Business, Beijing, China
Stefanos Vrochidis, Symeon Papadopoulos, Anastasia Moumtzidou, Panagiotis Sidiropoulos, Emanuele Pianta,
and Ioannis Kompatsiaris. 2010. Towards Content-based Patent Image Retrieval; A Framework Perspective.
World Patent Information Journal, 32(2):94-106.
Stefanos Vrochidis, Anastasia Moumtzidou, and Ioannis Kompatsiaris. 2012. Concept-based Patent Image Re-
trieval. World Patent Information Journal, 34(4):292-303.
Juanjuan Wang, Mantao Xu, Hui Wang, and Jiwu Zhang. 2006. Classification of imbalanced data by using the
SMOTE algorithm and locally linear embedding. In 8th
International Conference on Signal Processing, 3:16–
20.
He-Yong Wang. 2008. Combination approach of SMOTE and biased-SVM for imbalanced datasets, Proc. of the
IEEE Int. Joint Conf. on Neural Networks, IJCNN 2008, Hong Kong (PRC), 22-31.
Baoxun Xu, Yunming Ye, and Lei Nie. 2012. An improved random forest classifier for image classification. In
Information and Automation (ICIA), 2012 International Conference on IEEE, 795-800.
Jiong Zhang and Mohammad Zulkernine. 2006. A Hybrid Network Intrusion Detection Technique Using Ran-
dom Forests. In Proceedings of IEEE First International Conference on Availability, Reliability and Security
(ARES’06).
32

Proceedings of the 25th International Conference on Computational Linguistics, pages 33–37,Dublin, Ireland, August 23-29 2014.
Exploration of functional semantics of prepositions from corpora ofdescriptions of visual scenes
Simon Dobnik1 and John D. Kelleher2∗1University of Gothenburg, Centre for Language Technology,
Dept. of Philosophy, Linguistics & Theory of Science, Gothenburg, Sweden2Dublin Institute of Technology, Applied Intelligence Research Centre,
School of Computing, Dublin, [email protected], [email protected]
Abstract
We present a method of extracting functional semantic knowledge from corpora of descriptionsof visual scenes. Such knowledge is required for interpretation and generation of spatial descrip-tions in tasks such as visual search. We identify semantic classes of target and landmark objectsrelated by each preposition by abstracting over WordNet taxonomy. The inclusion of such knowl-edge in visual search should equip robots with a better, more human-like spatial cognition.
1 Introduction
Visual search is an area of growing research importance in mobile robotics; see (Sjoo, 2011; Kunze etal., 2014) among others. Visual search involves directing the visual sensors of a robot with the goalof locating a specific object. Several recent approaches have integrated non-visual (often linguisticallymotivated information) into the visual search process. The intuition behind this is that if the robot knowsthat object X is often located near/on/. . . object Y then in situations where Y is visually salient it may beeasier for the system to search by first locating Y and then use relational information to direct the searchfor X. A key component of these approaches to visual search is the definition of spatial semantics of therelational information. Appropriately modelling these semantics is crucial because fundamentally it isthese models that define the scope of the visual search in relation to Y.
In language spatial relations between objects are often expressed using locative expressions such as“the apple above a bowl”, “the computer is on the shelf” and “the plane is over the house”. In theseexpressions a target object is located relative to a landmark object using a preposition to describe thespatial relation. Crucially, there are differences between prepositions with respect to how their spatialrelations are defined. The semantics of some prepositions can be modelled in terms of geometric prim-itives whereas the semantics of other prepositions are sensitive to the functional relations between thetarget and the landmark (Coventry and Garrod, 2004). Consider the example “Alex is at her desk”. Thisdescription refers to a situation where Alex is not only geometrically proximate to her desk but alsowhere she is sitting down and working. The extra constraints are coming from the functional relationsthat normally exist between an individual and a desk.
Returning to visual search, being able to identify whether a given preposition is primarily geometricof functional is important because this classification informs the design of the spatial semantics for thepreposition and hence the appropriate definition of the search relative to the landmark object. In this paperwe present some ongoing experiments which attempt to develop techniques that can classify prepositionsas geometric or functional.
2 Spatial descriptions
(Coventry and Garrod, 2004) show in the experiments with human observers of images of a man inthe rain holding an umbrella where the umbrella is providing a varying degree of protection from therain that “above” is more sensitive to the geometrical component than “over” and that “over” is more
∗ Both authors are equal contributors.This work is licensed under a Creative Commons Attribution 4.0 International Licence. Page numbers and proceedings footerare added by the organisers. Licence details: http://creativecommons.org/licenses/by/4.0/
33

sensitive to the object function component than “above”. Descriptions of “the umbrella is over a man”were considered acceptable even in cases where the umbrella was held horizontally but was providingprotection from the rain.
Modelling of functional knowledge in the computational models of meaning of spatial prepositions isnot straightforward. Humans (and even expert linguists) do not seem to have clear intuitions what thefunctional component of each preposition sense may be and hence they must be confirmed experimentally(Garrod et al., 1999). This may take significant time for various combinations of prepositions and targetand landmark objects. One needs to develop a complex ontology of object properties and then associatespatial prepositions with rules that pick out certain properties of objects for a particular preposition sense(for examples of such rules see (Garrod et al., 1999, p.170)).
In this paper we describe a method of extraction of these meaning components from a corpus of de-scriptions of visual scenes automatically. Unlike in the psycho-linguistic experiments described abovewe examine general corpora that obtain a wide and unrestricted set of images that humans describedfreely. The purpose of the experiment is to investigate whether functional knowledge can be extractedfrom contextual language use. For example, can we make generalisations about the semantics of thearguments that a particular prepositional sense takes automatically. Furthermore, we are also interestedif the distinctions between geometric and functional sensitivity of prepositions reported experimentallycould be determined this way. This information would allow us to weight the contributions of the ge-ometric and functional knowledge when generating and interpreting spatial descriptions of scenes. Wehypothesise, that if a preposition is sensitive to functional meaning then there will be functional relationsbetween target and landmark objects that it is used with and consequently the preposition will will bemuch more restrictive or specific in the semantic type of targets and landmarks that it requires. Otherprepositions may be more sensitive to the satisfaction of the geometric constraint and hence we expectthat they will co-occur with objects of more general semantic types.
3 Datasets and extraction of spatial descriptions
The goal of this work is to analyse the semantics of linguistic expressions that are used to describe therelative location of objects in visual contexts. We base our analysis on two corpora of image descrip-tions: specifically, the IAPR TC-12 Benchmark corpus (Grubinger et al., 2006)1 which contains 20,000images and multi-sentence descriptions and the 8K ImageFlickr dataset (Rashtchian et al., 2010)2 whichcontains 8108 images. In both corpora the situations and events represented by images are described byseveral sentences which contain spatial descriptions with prepositions: in the first case all sentences areby a single annotator and in the second case each sentence is by a different annotator. The descriptionsare geometrically constrained by the visual context. On the other hand, the describers’ choice of the tar-get and the landmarks objects and the preposition in these descriptions will tell us about their functionalsemantics. The main pre-processing step was to extract parts of spatial expressions used in the imagedescriptions. Once extracted each spatial expression was stored in a type with the following structure:〈preposition, target, landmark〉. To do this extraction we first parsed both corpora of linguistic descrip-tions for dependencies (Marneffe et al., 2006) using Stanford CoreNLP tools3. Then we wrote severalextraction rules that matched dependency parses and extracted all three parts of spatial expressions thatwe are looking for. All words were lemmatized and converted to lower case, compound prepositionssuch as “on the left side of” were rewritten as single words and names, etc. were converted to theirnamed entity categories such as “person”. The extracted patterns from both corpora were combined intoa single dataset from which we can determine their frequency counts.
4 Determining conceptual categories of objects
The intuition behind our experiment is that functionally defined prepositions can be distinguished fromgeometrically defined prepositions by virtue of the fact that the functional relations between the target
1http://imageclef.org/photodata2http://nlp.cs.illinois.edu/HockenmaierGroup/8k-pictures.html3http://nlp.stanford.edu/software/corenlp.shtml
34
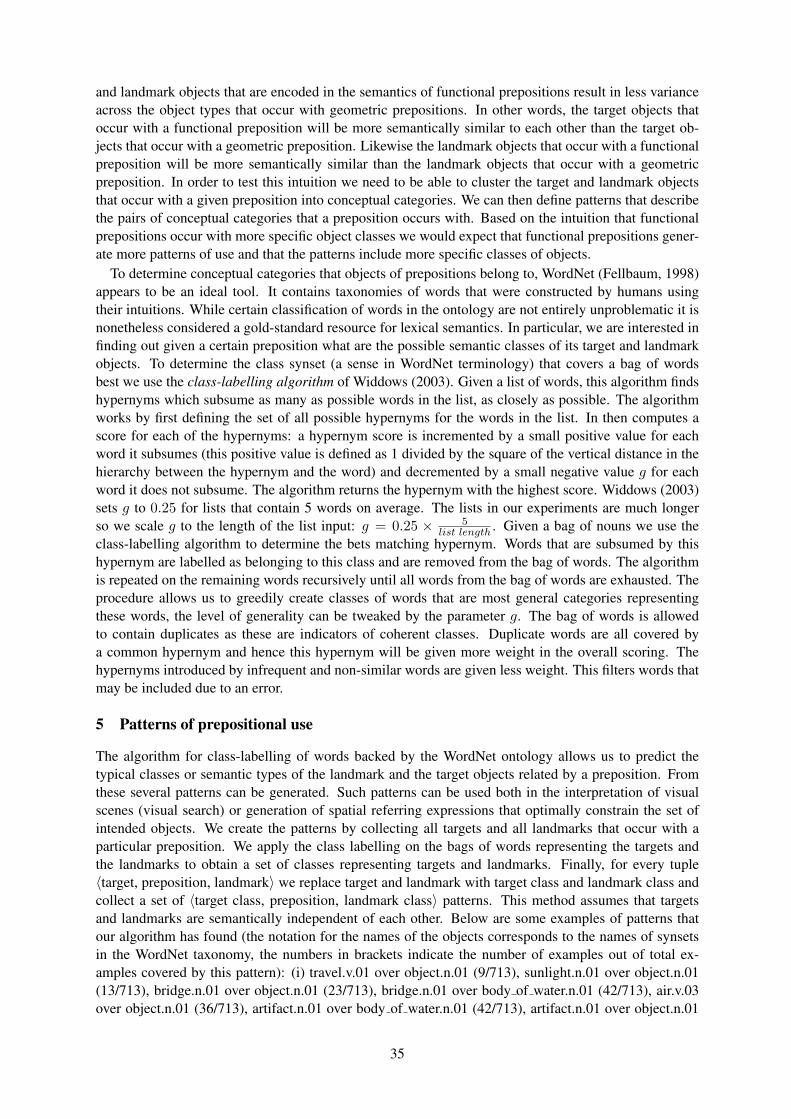
and landmark objects that are encoded in the semantics of functional prepositions result in less varianceacross the object types that occur with geometric prepositions. In other words, the target objects thatoccur with a functional preposition will be more semantically similar to each other than the target ob-jects that occur with a geometric preposition. Likewise the landmark objects that occur with a functionalpreposition will be more semantically similar than the landmark objects that occur with a geometricpreposition. In order to test this intuition we need to be able to cluster the target and landmark objectsthat occur with a given preposition into conceptual categories. We can then define patterns that describethe pairs of conceptual categories that a preposition occurs with. Based on the intuition that functionalprepositions occur with more specific object classes we would expect that functional prepositions gener-ate more patterns of use and that the patterns include more specific classes of objects.
To determine conceptual categories that objects of prepositions belong to, WordNet (Fellbaum, 1998)appears to be an ideal tool. It contains taxonomies of words that were constructed by humans usingtheir intuitions. While certain classification of words in the ontology are not entirely unproblematic it isnonetheless considered a gold-standard resource for lexical semantics. In particular, we are interested infinding out given a certain preposition what are the possible semantic classes of its target and landmarkobjects. To determine the class synset (a sense in WordNet terminology) that covers a bag of wordsbest we use the class-labelling algorithm of Widdows (2003). Given a list of words, this algorithm findshypernyms which subsume as many as possible words in the list, as closely as possible. The algorithmworks by first defining the set of all possible hypernyms for the words in the list. In then computes ascore for each of the hypernyms: a hypernym score is incremented by a small positive value for eachword it subsumes (this positive value is defined as 1 divided by the square of the vertical distance in thehierarchy between the hypernym and the word) and decremented by a small negative value g for eachword it does not subsume. The algorithm returns the hypernym with the highest score. Widdows (2003)sets g to 0.25 for lists that contain 5 words on average. The lists in our experiments are much longerso we scale g to the length of the list input: g = 0.25 × 5
list length . Given a bag of nouns we use theclass-labelling algorithm to determine the bets matching hypernym. Words that are subsumed by thishypernym are labelled as belonging to this class and are removed from the bag of words. The algorithmis repeated on the remaining words recursively until all words from the bag of words are exhausted. Theprocedure allows us to greedily create classes of words that are most general categories representingthese words, the level of generality can be tweaked by the parameter g. The bag of words is allowedto contain duplicates as these are indicators of coherent classes. Duplicate words are all covered bya common hypernym and hence this hypernym will be given more weight in the overall scoring. Thehypernyms introduced by infrequent and non-similar words are given less weight. This filters words thatmay be included due to an error.
5 Patterns of prepositional use
The algorithm for class-labelling of words backed by the WordNet ontology allows us to predict thetypical classes or semantic types of the landmark and the target objects related by a preposition. Fromthese several patterns can be generated. Such patterns can be used both in the interpretation of visualscenes (visual search) or generation of spatial referring expressions that optimally constrain the set ofintended objects. We create the patterns by collecting all targets and all landmarks that occur with aparticular preposition. We apply the class labelling on the bags of words representing the targets andthe landmarks to obtain a set of classes representing targets and landmarks. Finally, for every tuple〈target, preposition, landmark〉 we replace target and landmark with target class and landmark class andcollect a set of 〈target class, preposition, landmark class〉 patterns. This method assumes that targetsand landmarks are semantically independent of each other. Below are some examples of patterns thatour algorithm has found (the notation for the names of the objects corresponds to the names of synsetsin the WordNet taxonomy, the numbers in brackets indicate the number of examples out of total ex-amples covered by this pattern): (i) travel.v.01 over object.n.01 (9/713), sunlight.n.01 over object.n.01(13/713), bridge.n.01 over object.n.01 (23/713), bridge.n.01 over body of water.n.01 (42/713), air.v.03over object.n.01 (36/713), artifact.n.01 over body of water.n.01 (42/713), artifact.n.01 over object.n.01
35

(175/713),. . . (ii) breeze.n.01 above body of water.n.01 (8/183), person.n.01 above artifact.n.01 (9/183),artifact.n.01 above steer.v.01 (14/183), artifact.n.01 above entrance.n.01 (16/183) artifact.n.01 above ar-tifact.n.01 (27/183),. . . (iii) person.n.01 under tree.n.01 (7/213), shirt.n.01 under sweater.n.01 (8/213),person.n.01 under body of water.n.01 (11/213), person.n.01 under artifact.n.01 (13/213) artifact.n.01under artifact.n.01 (16/213), person.n.01 under structure.n.01 (17/213), artifact.n.01 under structure.n.01(21/213),. . . (iv) box.n.05 below window.n.08 (1/14), crown.n.04 below script.n.01 (2/14),. . . 4 Thepatterns show that different prepositions which are seemingly synonyms when considering geometry(“over”/“above” and “below”/“under”) do relate different types of objects and from the labels of thesemantic classes we may speculate what kind of semantic knowledge the relations are sensitive to. Im-portantly, the labels of the classes and different patterns extracted show that there may be several distinctand even unrelated situations that a preposition is referring to. Consider for example, person.n.01 undertree.n.01, shirt.n.01 under sweater.n.01 (8/213), person.n.01 under body of water.n.01 are denoting threedifferent kinds of situations which require distinct and unrelated geometric arrangements. Overall, theresults indicate that the method is able to extract functional knowledge which is a reflection of the wayhumans conceptualise objects and relations between them and which may be useful for improving visualprocessing of scenes.
Another question we set off to answer is whether from the patterns one can determine the functionaland geometric bias of a preposition. As noted previously, our application of the class labelling algorithmis greedy and attempts to cover a large number of words. The more words are generalised over themore generic classes are created. To counter this confounding factor we down-sampled the dataset bycreating, for the results we report here, 50 samples of 20 randomly chosen words. The same procedurefor creating patterns of prepositional use was applied as before. On each sampling iteration we estimatefor each preposition (i) the average depth of the target and landmark hypernyms in the WordNettaxonomy, (ii) the number of patterns created, and (iii) the entropy of the patterns over the examplesin the dataset. Finally, we average all values obtained from iterations and we rank the prepositions by theascending values of the these measures as shown below:
(i) on (3.17), near (3.55), with (3.66), next to (3.83), of (3.95), between (4.17), in front of (4.26), above(4.27), over (4.48), around (4.52), behind (4.65), from (4.74), at (4.89), under (4.93), for (4.97),through (5.27), in (5.45)
(ii) on (10.5), with (11.5), near (12), next to (12.1), between (12.6), of (12.6), above (12.7), around (13),in front of (13.1), over (13.7), from (13.8), behind (13.9), for (14.2), under (14.3), in (14.5), through(15.1), at (15.2)
(iii) on (2.74), next to (3.05), with (3.07), near (3.1), between (3.2), of (3.29), above (3.33), around(3.36), in front of (3.39), over (3.48), from (3.5), behind (3.51), for (3.59), under (3.62), in (3.62),through (3.75), at (3.76)
With small variations all measures (i), (ii) and (iii) rank the prepositions very similarly. Items at thebeginning of the list are used with target and landmark objects that belong to more general classes (i),they are covered by a lower number of preposition patterns (ii), and the entropy of these patterns is low(iii)5. Hence, we expect that items at the top of the lists are less affected by the type of the target andlandmark objects than items at the bottom of the lists. They are the prepositions where the geometriccomponent is stronger to determine the spatial relation. On the other hand, prepositions at the bottomof the list rely more on the functional component of meaning. The results predict the observations fromthe literature. Although, being sometimes quite close “above” precedes “over” in respect to to all threemeasures. “Below” was not processed in this study as there were too few examples but “under” is foundat the tail of the list. The ranking of other prepositions also aligns with our intuitions. For example,“on”, appearing as the head of the list, requires a contact between objects (a geometric notion), whereas“in”, appearing in the tail of the list requires that the target is constrained by the landmark (a functionalnotion).
4There are only 14 examples of “below” in the dataset for which nearly always unique patterns were created.5Entropy balances between the number of classes and the frequency of items in them. Low entropy indicates that there is a
tendency of items clustering in small number of specific classes rather rather than being equally dispersed over classes.
36

6 Conclusions and further work
In the preceding discussion we have demonstrated a method of extracting (i) functional semantic knowl-edge – required for the generation and interpretation of spatial descriptions – from the corpora of de-scriptions referring to visual scenes and (ii) made predictions about the bias of spatial descriptions tofunctional knowledge. We hope that this information can facilitate visual search as it further restricts theset of possible situations and objects involved. We have constructed several patterns of preposition useand have shown that a preposition such as “under” may refer to several distinct situations constrainedby the knowledge of object function and that these situations would require geometric representationsthat are likely to be quite different. This knowledge should allow us to create different routines forvisual search that could be applied over a wide set of domains and would better approximate the wayhumans perceive and reason about space. The applicability of this information for visual search must beproperly evaluated in a visual application. Estimating the functional or geometric bias of prepositionsinforms us for their modelling but more importantly confirms that the patterns extracted here follow theexperimental observations reported in the literature.
In the procedure we have made several design choices: the choice of the corpora and the way thecorpora is processed and information extracted, the algorithm with which words are labelled for semanticclasses and finally the method with which patterns are created. For example, before class labelling wecould use an algorithm that clusters words of similar hypernym depth into discrete classes over whichhypernyms are generalised. This would allow us to distinguish better between different situations thata preposition is referring to. When creating patterns we assume that target and landmark objects areindependent of each other. However, this may not necessarily be the case. For example, the category ofthe target object may constrain the category of the landmark which means that the latter category shouldonly be generalised over landmark words that occur with some target category.
ReferencesKenny R Coventry and Simon C Garrod. 2004. Saying, seeing, and acting: the psychological semantics of spatial
prepositions. Psychology Press, Hove, East Sussex.
Christiane Fellbaum. 1998. WordNet: an electronic lexical database. MIT Press, Cambridge, Mass.
Simon Garrod, Gillian Ferrier, and Siobhan Campbell. 1999. In and on: investigating the functional geometry ofspatial prepositions. Cognition, 72(2):167–189.
Michael Grubinger, Paul D. Clough, Henning Muller, and Thomas Deselaers. 2006. The IAPR benchmark: A newevaluation resource for visual information systems. In Proceedings of OntoImage 2006: Workshop on languageresources for content-based mage retrieval during LREC 2006, Genoa, Italy, 22 May. European LanguageResources Association.
Lars Kunze, Chris Burbridge, and Nick Hawes. 2014. Bootstrapping probabilistic models of qualitative spatialrelations for active visual object search. In AAAI Spring Symposium 2014 on Qualitative Representations forRobots, Stanford University in Palo Alto, California, US, March, 24–26.
Marie-Catherine De Marneffe, Bill MacCartney, and Christopher D. Manning. 2006. Generating typed depen-dency parses from phrase structure parses. In Proceedings of Int’l Conf. on Language Resources and Evaluation(LREC), pages 449–454, Genoa, Italy. European Language Resources Association.
Cyrus Rashtchian, Peter Young, Micah Hodosh, and Julia Hockenmaier. 2010. Collecting image annotationsusing Amazon’s Mechanical Turk. In Proceedings of the NAACL HLT 2010 Workshop on creating speechand language data with Amazon’s Mechanical Turk, Los Angeles, CA, 6 June. North American Chapter of theAssociation for Computational Linguistics (NAACL).
Kristoffer Sjoo. 2011. Functional understanding of space: Representing spatial knowledge using conceptsgrounded in an agent’s purpose. Ph.D. thesis, KTH, Computer Vision and Active Perception (CVAP), Cen-tre for Autonomous Systems (CAS), Stockholm, Sweden.
Dominic Widdows. 2003. Unsupervised methods for developing taxonomies by combining syntactic and statis-tical information. In Proceedings of the 2003 Conference of the North American Chapter of the Associationfor Computational Linguistics on Human Language Technology, volume 1, pages 197–204. Association forComputational Linguistics.
37

Proceedings of the 25th International Conference on Computational Linguistics, pages 38–45,Dublin, Ireland, August 23-29 2014.
A Poodle or a Dog? Evaluating Automatic Image Annotation UsingHuman Descriptions at Different Levels of Granularity
Josiah K. Wang1 Fei Yan2 Ahmet Aker1 Robert Gaizauskas1
1 Department of Computer Science, University of Sheffield, UK2 Centre for Vision, Speech and Signal Processing, University of Surrey, UK
j.k.wang, ahmet.aker, [email protected] [email protected]
Abstract
Different people may describe the same object in different ways, and at varied levels of granular-ity (“poodle”, “dog”, “pet” or “animal”?) In this paper, we propose the idea of ‘granularity-aware’ groupings where semantically related concepts are grouped across different levels ofgranularity to capture the variation in how different people describe the same image content.The idea is demonstrated in the task of automatic image annotation, where these semantic group-ings are used to alter the results of image annotation in a manner that affords different insightsfrom its initial, category-independent rankings. The semantic groupings are also incorporatedduring evaluation against image descriptions written by humans. Our experiments show that se-mantic groupings result in image annotations that are more informative and flexible than withoutgroupings, although being too flexible may result in image annotations that are less informative.
1 Introduction
Describing the content of an image is essential for various tasks such as image indexing and retrieval, andthe organization and browsing of large image collections. Recent years have seen substantial progressin the field of visual object recognition, allowing systems to automatically annotate an image with a listof terms representing concepts depicted in the image. Fueled by advances in recognition algorithms andthe availability of large scale datasets such as ImageNet (Deng et al., 2009), current systems are able torecognize thousands of object categories with reasonable accuracy, for example achieving an error rateof 0.11 in classifying 1, 000 categories in the ImageNet Large Scale Visual Recognition Challenge 2013(ILSVRC13) (Russakovsky et al., 2013).
However, the ILSVRC13 classification challenge assumes each image is annotated with only onecorrect label, although systems are allowed up to five guesses per image to make the correct prediction(or rather, to match the ground truth label). The problem with this is that it becomes difficult to guesswhat the ‘correct’ label is, especially when many other categories can equally be considered correct.For instance, should a system label an image containing an instance of a dog (and possibly some otherobjects like a ball and a couch) as “dog”, “poodle”, “puppy”, “pet”, “domestic dog”, “canine” or even“animal” (in addition to “ball”, “tennis ball”, “toy”, “couch”, “sofa”, etc.)? The problem becomes evenharder when the number of possible ways to refer to the same object instance increases, but the numberof prediction slots to fill remains limited. With so many options from which to choose, how do we knowwhat the ‘correct’ annotation is supposed to be?
In this paper, we take a human-centric view of the problem, motivated by the observation that humansare likely to be the end-users or consumers of such linguistic image annotations. In particular, we investi-gate the effects of grouping semantically related concepts that may refer to the same object instance in animage. Our work is related to the idea of basic-level categories (Biederman, 1995) in Linguistics, wheremost people have a natural preference to classify certain object categories at a particular level of granu-larity, e.g. “bird” instead of “sparrow” or “animal”. However, we argue that what one person considers
This work is licensed under a Creative Commons Attribution 4.0 International Licence. Page numbers and proceedings footer areadded by the organisers. Licence details: http://creativecommons.org/licenses/by/4.0/
38

‘basic-level’ may not necessarily be ‘basic-level’ to another, depending on the person’s knowledge, ex-pertise, interest, or the context of the task at hand. For example, Rorissa (2008) shows that users labelgroups of images and describe individual images differently with regards to the level of abstraction. Thekey idea behind our proposed ‘granularity-aware’ approach is to group semantically related categoriesacross different levels of granularity to account for how different people would describe content in animage differently.
We demonstrate the benefits of the ‘granularity-aware’ approach by producing a re-ranking of visualclassifier outputs for groups of concept nodes, e.g. WordNet synsets. The concept nodes are groupedacross different levels of specificity within a semantic hierarchy (Section 3.1). This models better therichness of the vocabulary and lexical semantic relations in natural language. In this sense these group-ings are used to alter the results of image annotation in a manner that affords different insights fromits initial, category-independent rankings. For example, if the annotation mentions only “dog” but not“poodle”, a system ranking “poodle” at 1 and “dog” at 20 will have a lower overall score than a systemranking “dog” at 1, although both are equally correct. Grouping (“poodle” or “dog”) however will allow afairer evaluation and comparison where both systems are now considered equally good. The ‘granularity-aware’ groupings will also be used in evaluating these re-rankings using textual descriptions written byhumans, rather than a keyword-based gold-standard annotation. The hypothesis is that by modeling thevariation in granularity levels for different concepts, we can gain a more informative insight as to howthe output of image annotation systems can relate to how a person describes what he or she perceives inan image, and consequently produce image annotation systems that are more human-centric.
Overview. The remainder of the paper is organized as follows: Section 2 discusses related work. Sec-tion 3 describes our proposed ‘granularity-aware’ approach to group related concepts across differentlevels of granularity. It also discusses how to apply the idea both in automatic image annotation, byre-ranking noisy visual classifier outputs in a ‘granularity-aware’ manner, and in evaluation of classi-fier outputs against human descriptions of images. The results of the proposed method are reported inSection 4. Finally, Section 5 offers conclusions and proposes possible future work.
2 Related work
Work on automatic image annotation traditionally relies heavily on image datasets annotated with a fixedset of labels as training data. For example, Duygulu et al. (2002) investigated learning from imagesannotated with a set of keywords, posing the problem as a machine translation task between imageregions and textual labels. Gupta and Davis (2008) includes some semantic information by incorporatingprepositions and comparative adjectives, which also requires manual annotation as no such data is readilyavailable. Recent work has moved beyond learning image annotation from constrained text labels tolearning from real world texts, for example from news captions (Feng and Lapata, 2008) and sportsarticles (Socher and Fei-Fei, 2010).
There is also recent interest in treating texts as richer sources of information than just simple bagsof keywords, for example with the use of semantic hierarchies for object recognition (Marszałek andSchmid, 2008; Deng et al., 2012b) and the inclusion of attributes for a richer representation (Lampertet al., 2009; Farhadi et al., 2009). Another line of recent work uses textual descriptions of images forvarious vision tasks, for example for recognizing butterfly species from butterfly descriptions (Wanget al., 2009) and discovering attributes from item descriptions on fashion shopping websites (Berg etal., 2010). There has also been interest in recent years in producing systems that annotate images withfull sentences rather than just a list of terms (Kulkarni et al., 2011; Yang et al., 2011). We considerour work to complement the work of generating full sentences, as it is important to filter and select themost suitable object instances from noisy visual output. The shift from treating texts as mere labels toutilizing them as human-centric, richer forms of annotations is important to gain a better understandingof the processes underlying image and text understanding or interpretation.
Deng et al. (2012b) address the issue of granularity in a large number of object categories by allowingclassifiers to output decisions at the optimum level in terms of being accurate and being informative, forexample outputting “mammal” rather than “animal” while still being correct. Their work differs from
39

ours in that the semantic hierarchy is used from within the visual classifier to make a decision aboutits output, rather than for evaluating existing outputs. More directly related to our work is recent workby Ordonez et al. (2013), which incorporates the notion of basic-level categories by modeling word‘naturalness’ from text corpora on the web. While their focus is on obtaining the most ‘natural’ basic-level categories for different encyclopedic concepts as well as for image annotation, our emphasis is onaccommodating different levels of naturalness, not just a single basic level. We adapt their model directlyto our work, details of which will be discussed in Section 3.1.
3 Granularity-aware approach to image annotation
The proposed ‘granularity-aware’ approach to image annotation consists of several components. We firstdefine semantic groupings of concepts by considering hypernym/hyponym relations in WordNet (Fell-baum, 1998) and also how people describe image content (Section 3.1). The groupings are then used tore-rank the output of a set of category-specific visual classifiers (Section 3.2), and also used to producea grouped ‘gold standard’ from image captions (Section 3.3). The re-ranked output is then evaluatedagainst the ‘gold standard’, and the initial rankings and ‘granularity-aware’ re-rankings are comparedto gain a different insight into the visual classifiers’ performance as human-centric image annotationsystems.
3.1 Semantic grouping across different granularity levels
The goal of semantic grouping is to aggregate related concepts such that all members of the group referto the same instance of an object, even across different specificity levels. In particular, we exploit thehypernym/hyponym hierarchy of WordNet (Fellbaum, 1998) for this task. WordNet is also the naturalchoice as it pairs well with our visual classifiers which are trained on ImageNet (Deng et al., 2009)categories, or synsets.
The WordNet hypernym hierarchy alone is insufficient for semantic grouping as we still need a way todetermine what constitutes a reasonable group, e.g. putting all categories into a single “entity” group istechnically correct but uninformative. For this, we draw inspiration from previous work by Ordonez et al.(2013), where a ‘word naturalness’ measure is proposed to reflect how people typically describe imagecontent. More specifically, we adapt for our purposes their proposed approach of mapping encyclopedicconcepts to basic-level concepts (mapping “Grampus griseus” to the more ‘natural’ “dolphin”). In thisapproach, the task is defined as learning a translation function τ(v, λ) : V 7→W that best maps a node vto a hypernym node w which optimizes a trade-off between the ‘naturalness’ of w (how likely a personis to use w to describe something) and the distance between v and w (to constrain the translation frombeing too general, e.g. “entity”), with the parameter λ controlling this trade-off between naturalness andspecificity. Formally, τ(v, λ) is defined as:
τ(v, λ) = arg maxw ∈Π(v)
[λφ(w)− (1− λ)ψ(w, v) ] (1)
where Π(v) is the set of hypernyms for v (including v), φ(w) is naturalness measure for node w, andψ(w, v) is the number of edges separating nodes w and v in the hypernym structure of WordNet.
For our work, all synsets that map to a common hypernym w are clustered as a single semantic groupGλw:
Gλw = v : ∀v τ(v, λ) = w (2)
In this sense, the parameter λ ∈ [0, 1] essentially also controls the average size of the groups: λ = 0results in no groupings, while λ = 1 results in synsets being grouped with their most ‘natural’ hypernym,giving the largest possible difference in the levels of granularity within each group.
Estimating the naturalness function using Flickr. Ordonez et al. (2013) use n-gram counts of theGoogle IT corpus (Brants and Franz, 2006) as an estimate for term naturalness φ(w). Although large,the corpus might not be optimal as it is a general corpus and may not necessarily mirror how people
40

describe image content. Thus, we explore a different corpus that (i) better reflects how humans describeimage content; (ii) is sufficiently large for a reasonable estimate of φ(w). The Yahoo! Webscope YahooFlickr Creative Commons 100M (YFCC-100M) dataset (Yahoo! Webscope, 2014) fits these criteria with100 million images containing image captions written by users. Hence, we compute term occurrencestatistics from the title, description, and user tags of images from this dataset. Following Ordonez et al.,we measure φ(w) as the maximum log count of term occurrences for all terms appearing in synset w.
Internal nodes. Unlike Ordonez et al. (2013), we do not constrain v to be a leaf node, but insteadalso allow for internal nodes to be translated to one of their hypernyms. We could choose to limitvisual recognition to leaf nodes and estimate the visual content of internal nodes by aggregating theoutputs from all its leaf nodes, as done by Ordonez et al. (2013). However, since the example images inImageNet are obtained for internal nodes pretty much in the same way as leaf nodes (by querying “dog”rather than by combining images from “poodle”, “terrier” and “border collie”) (Deng et al., 2009), thevisual models learnt from images at internal nodes may capture different kinds of patterns than fromtheir hyponyms. For example, a model trained with ImageNet examples of “dog” might capture somehigher-level information that may otherwise not be captured by merely accumulating the outputs of theleaf nodes under it, and vice versa.
3.2 Re-ranking of visual classifier output
The visual classifier used in our experiments (Section 4.2) outputs a Platt-scaled (Platt, 2000) confidencevalue for each synset estimating the probability of the synset being depicted in a given image. Theclassifier outputs are then ranked in descending order of these probability values, and are treated asimage annotation labels.
As mentioned, these rankings do not take into consideration that some of these synsets are semanticallyrelated. Thus, we aggregate classifier outputs within our semantic groupings (Section 3.1), and then re-rank the scores of each grouped classifier. Formally, the new score of a classifier c, ρc(Gλw), for asemantic group Gλw is defined as:
ρc(Gλw) = maxv∈Gλw
pc(v) (3)
where v is a synset from the semantic groupGλw, and pc(v) is the original probability estimate of classifierc for synset v. I.e., the probability of the most probable synset in the group is taken as the probability ofthe group.
To enable comparison of the rankings against a gold standard keyword annotation, a word label isalso generated for each semantic group. We assign as the semantic group’s label `(Gλw) the first term ofsynset w, the common hypernym node to which members of the group best translates. Note that the termmerely acts a label for evaluation purposes and should not be treated as a word in a traditional sense. Wealso merge semantic groups with the same label to account for polysemes/homonyms, again taking themaximum of ρc among the semantic groups as the new score.
The semantic grouping of synsets is performed independently of visual classifier output. As such, weonly need to train each visual classifier once for each synset, without requiring re-training for differentgroupings since we only aggregate the output of the visual classifiers. This allows for more flexibilitysince the output for each semantic group is only aggregated at evaluation time.
3.3 Evaluation using human descriptions
The image dataset used in our experiments (Section 4.1) is annotated with five full-sentence captionsper image but not keyword labels. Although an option would be to obtain keyword annotations viacrowdsourcing, it is time consuming and expensive and also requires validating the annotation quality.Instead, we exploit the existing full-sentence captions from the dataset to automatically generate a goldstandard keyword annotation for evaluating our ranked classifier outputs. The use of such captions isalso in line with our goal of making the evaluation of image annotation systems more human-centric.For each caption, we extract nouns using the open source tool FreeLing (Padro and Stanilovsky, 2012).
41

λ0.0 0.1 0.2 0.3 0.4 0.5 0.6 0.7 0.8 0.9 1.0
Semantic Grouping 0.3450 0.3450 0.3548 0.3735 0.4025 0.4417 0.4562 0.4702 0.4834 0.5059 0.5395Random Grouping 0.3450 0.3450 0.3493 0.3529 0.3585 0.3689 0.3823 0.4067 0.4241 0.4359 0.4467
Number of groups 1294 1294 1237 1105 949 817 693 570 474 419 368
Table 1: Results of re-ranking with semantic groupings. The first two rows show the average NDCGscores for the proposed groupings and the random baseline groupings, for different groupings formed byvarying λ. The bottom row shows the number of semantic groups formed for different values of λ.
For each image, each noun is assigned an individual relevance score, which is the number of captionsthat mentions the noun. This upweights important objects while downweighting less important objects(or errors from the annotator or the parser). The result is a list of nouns that humans use to describeobjects present in the image, each weighted by its relevance score. We assume nouns that appear in thesame WordNet synset (“bicycle” and “bike”) are synonyms and that they refer to the same object instancein the image. Hence, we group them as a single label-group, with the relevance score taken to be themaximum relevance score among the nouns in the group.
Since there are only five captions per image, the proposed approach will result in a sparse set ofkeywords. This mirrors the problem described in Section 1 where systems have to ‘guess’ the so-called‘correct’ labels, thus allowing us to demonstrate the effectiveness of our ‘granularity-aware’ re-rankings.
In order to compare the annotations against the re-rankings, we will need to map the keywords to thesemantic groupings. This is done by matching the nouns to any of the terms in a semantic group, with acorresponding label `(Gλw) for each group (Section 3.2). Nouns assigned the same label are merged, withthe new relevance score being the maximum relevance score among the nouns. If a noun matches morethan one semantic group (polyseme/homonym), we treat all groups as relevant and divide the relevancescore uniformly among the groups. Evaluation is then performed by matching the semantic group labelsagainst the image annotation output.
4 Experimental evaluation
Our proposed method is evaluated on the dataset and categories as will be described in Section 4.1, by re-ranking the output of the visual classifiers in Section 4.2. The effects of semantic groupings are exploredusing different settings of λ (see Section 3.1).
Baseline. To ensure any improvements in scores are not purely as a result of having a shorter list ofconcepts to rank, we compare the results to a set of baseline groupings where synsets are grouped in arandom manner. For a fair comparison the baselines contain the same number of groups and cluster sizedistributions as our semantic groupings.
4.1 Dataset and Object CategoriesThe Flickr8k dataset (Hodosh et al., 2013) is used in our image annotation experiments. The datasetcontains 8,091 images, each annotated with five textual descriptions. To demonstrate the notion of gran-ularity in large-scale object hierarchies, we use as object categories synset nodes from WordNet (Fell-baum, 1998). Ideally, we would like to be able to train visual classifiers for all synset categories inImageNet (Deng et al., 2009). However, we limit the categories to only synsets with terms occurring inthe textual descriptions of the Flickr8k dataset to reduce computational complexity, and regard the useof more categories as future work. This results in a total of 1,372 synsets to be used in our experiments.The synsets include both leaf nodes as well as internal nodes in the WordNet hierarchy.
4.2 Visual classifierDeep learning (LeCun et al., 1989; Hinton and Salakhutdinov, 2006) based approaches have be-come popular in visual recognition following the success of deep convolutional neural networks
42

(CNN) (Krizhevsky et al., 2012) in the ImageNet Large Scale Visual Recognition Challenge 2012(ILSVRC12) (Deng et al., 2012a). Donahue et al. (2013) report that features extracted from the acti-vation of a deep CNN trained in a fully supervised fashion can also be re-purposed to novel generic tasksthat differ significantly from the original task. Inspired by Donahue et al. (2013), we extract such acti-vation as feature for ImageNet images that correspond to the 1,372 synsets, and train binary classifiersto detect the presence of the synsets in the images of Flickr8k. More specifically, we use as our trainingset the 1,571,576 ImageNet images in the 1,372 synsets, where a random sample of 5,000 images servesas negative examples, and as our test set the 8,091 images in Flickr8k. For each image in both sets, weextracted activation of a pre-trained CNN model as its feature. The model is a reference implementationof the structure proposed in Krizhevsky et al. (2012) with minor modifications, and is made publiclyavailable through the Caffe project (Jia, 2013). It is shown in Donahue et al. (2013) that the activationof layer 6 of the CNN performs the best for novel tasks. Our study on a toy example with 10 ImageNetsynsets however suggests that the activation of layer 7 has a small edge. Once the 4,096 dimensionalactivation of layer 7 is extracted for both training and test sets, 1,372 binary classifiers are trained andapplied using LIBSVM (Chang and Lin, 2011), which give probability estimates for the test images. Foreach image, the 1,372 classifiers are then ranked in order of their probability estimates.
4.3 Evaluation measureThe systems are evaluated using the Normalized Discounted Cumulative Gain (NDCG) (Wang et al.,2013) measure. This measure is commonly used in Information Retrieval (IR) to evaluate ranked retrievalresults where each document is assigned a relevance score. This measure favours rankings where themost relevant items are ranked ahead of less relevant items, and does not penalize irrelevant items.
The NDCG at position k, NDCGk, for a set of test images I is defined as:
NDCGk(I) =1|I|
|I|∑i=1
1IDCGk(i)
k∑p=1
2Rp − 1log2(1 + p)
(4)
where Rp is the relevance score of the concept at position p, and IDCGk(i) is the ideal discountedcumulative gain for a perfect ranking algorithm at position k, which normalizes the overall measure tobe between 0.0 to 1.0. This makes the scores comparable across rankings regardless of the number ofsynset groups involved. For each grouping, we report the results of NDCGk for the largest possible k(i.e. the number of synset groups), which gives the overall performance of the rankings.
4.4 ResultsTable 1 shows the results of re-ranking the output of the visual classifiers (Section 4.2), with differentsemantic groupings formed by varying λ. The effects of the proposed groupings is apparent when com-pared to the random baseline groupings. As we increase the value of λ (allowing groups to have a largerrange of granularity), the NDCG scores also consistently increase. However, higher NDCG scores donot necessarily equate to better groupings, as semantic groups with too much flexibility in granularitylevels may end up being less informative, for example by annotating a “being” in an image. The in-formativeness of the groupings is a subjective issue depending on the context, and makes an interestingopen question. To provide insight into the effects of our groupings, Figure 1 shows an example where atlow levels of λ (rigid flexibility), the various dog species are highly ranked but none of them is consid-ered relevant by the evaluation system. However, at λ = 0.5 most dog species are grouped as a “dog”semantic group resulting in a highly relevant prediction, while at the same time allowing the “sidewalk”group to rise higher in the rankings. At higher levels of λ, however, the semantic groupings become lessinformative when superordinate groups like “being”, “artifact” and “equipment” are formed, suggestingthat higher flexibility with granularity levels may not always be more informative.
5 Conclusions and future work
We presented a ‘granularity-aware’ approach to grouping semantically related concepts across differentlevels of granularity, taking into consideration that different people describe the same thing in different
43

dog (5)road (2)
pavement (1)street (1)
λ = 0.0
score: 0.241
beagleboston terrier
corgibassethoundspaniel
border collieterrier
dachshundpup
st bernardbulldog
springer spanielleashkitten
petdog
sheepdogpenguinsidewalk
λ = 0.3
score: 0.480
beagleboston terrier
dogbassethoundspaniel
border collieterrier
dachshundpup
bulldogspringer spaniel
leashkitten
petpenguinsidewalkdoberman
colliecat
λ = 0.5
score: 0.941
doganimalleashkitten
petpenguinsidewalk
catartifactpersonstudent
goatlivestock
rabbitduck
baseballchairchild
frisbeespectator
λ = 0.8
score: 0.943
doganimalleashbeingbird
sidewalkcat
artifactstudentbaseball
chairchild
frisbeeball
slopeequipment
fabricrugseat
support
λ = 1.0
score: 0.944
doganimalleashbeingbird
sidewalkcat
artifactsportchairchild
deviceball
slopeequipment
fabricrugseat
supportstick
Figure 1: Example re-ranking of our visual classifier by semantic groupings, for selected values ofλ. Words directly below the image indicate the ‘gold standard’ nouns extracted automatically from itscorresponding five captions. The number next to each noun indicate its relevance score. For each re-ranking, we show the labels representing the semantic groupings. Italicized labels indicate a match withthe (grouped) ‘gold standard’ nouns (see Section 3.3).
ways, and at varied levels of specificity. To gain insight into the effects of our semantic groupings onhuman-centric applications, the proposed idea was investigated in the context of re-ranking the outputof visual classifiers, and was also incorporated during evaluation against human descriptions. We foundthat although the groupings help provide a more human-centric and flexible image annotation system,too much flexibility may result in an uninformative image annotation system. Future work could include(i) exploring different ways of grouping concepts; (ii) incorporating the output of visual classifiers toimprove both groupings and rankings; (iii) using information from more textual sources to improveimage annotation; (iv) taking the approach further to generate full sentence annotations. We believe thatthese steps are important to bridge the semantic gap between computer vision and natural language.
Acknowledgements
The authors would like to acknowledge funding from the EU CHIST-ERA D2K programme, EPSRCgrant reference: EP/K01904X/1.
ReferencesTamara L. Berg, Alexander C. Berg, and Jonathan Shih. 2010. Automatic attribute discovery and characterization
from noisy web data. In Proceedings of ECCV, volume 1, pages 663–676.
Irving Biederman. 1995. Visual object recognition. In S. F. Kosslyn and D. N. Osherson, editors, An Invitation toCognitive Science, 2nd edition, Volume 2, Visual Cognition, pages 121–165. MIT Press.
Thorsten Brants and Alex Franz. 2006. Web 1T 5-gram Version 1. In Linguistic Data Consortium.
Chih-Chung Chang and Chih-Jen Lin. 2011. LIBSVM: A library for support vector machines. ACM Transactionson Intelligent Systems and Technology, 2(3):1–27. http://www.csie.ntu.edu.tw/˜cjlin/libsvm.
Jia Deng, Wei Dong, Richard Socher, Li-Jia Li, Kai Li, and Li Fei-Fei. 2009. ImageNet: A large-scale hierarchicalimage database. In Proceedings of CVPR.
Jia Deng, Alexander C. Berg, Sanjeev Satheesh, Hao Su, Aditya Khosla, and Li Fei-Fei. 2012a. ImageNet largescale visual recognition challenge (ILSVRC) 2012. http://image-net.org/challenges/LSVRC/2012/.
Jia Deng, Jonathan Krause, Alexander C. Berg, and Li Fei-Fei. 2012b. Hedging your bets: Optimizing accuracy-specificity trade-offs in large scale visual recognition. In Proceedings of CVPR.
Jeff Donahue, Yangqing Jia, Oriol Vinyals, Judy Hoffman, Ning Zhang, Eric Tzeng, and Trevor Darrell. 2013.DeCAF: A deep convolutional activation feature for generic visual recognition. arXiv:1310.1531 [cs.CV].
44

Pinar Duygulu, Kobus Barnard, Nando de Freitas, and David A. Forsyth. 2002. Object recognition as machinetranslation: Learning a lexicon for a fixed image vocabulary. In Proceedings of ECCV, pages 97–112.
Ali Farhadi, Ian Endres, Derek Hoiem, and David A. Forsyth. 2009. Describing objects by their attributes. InProceedings of CVPR.
Christiane Fellbaum, editor. 1998. WordNet: An Electronic Lexical Database. MIT Press, Cambridge, MA.
Yansong Feng and Mirella Lapata. 2008. Automatic image annotation using auxiliary text information. In Pro-ceedings of the 46th Annual Meeting of the Association for Computational Linguistics: Human Language Tech-nologies, pages 272–280. Association for Computational Linguistics.
Abhinav Gupta and Larry S. Davis. 2008. Beyond nouns: Exploiting prepositions and comparative adjectives forlearning visual classifiers. In Proceedings of ECCV, pages 16–29.
Geoffrey E. Hinton and Ruslan R. Salakhutdinov. 2006. Reducing the dimensionality of data with neural networks.Science, 313:504–507.
Micah Hodosh, Peter Young, and Julia Hockenmaier. 2013. Framing image description as a ranking task: Data,models and evaluation metrics. Journal of Artificial Intelligence Research, 47:853–899.
Yangqing Jia. 2013. Caffe: An open source convolutional architecture for fast feature embedding. http://caffe.berkeleyvision.org.
Alex Krizhevsky, Ilya Sutskever, and Geoffrey Hinton. 2012. ImageNet classification with deep convolutionalneural networks. In Advances in Neural Information Processing Systems.
Girish Kulkarni, Visruth Premraj, Sagnik Dhar, Siming Li, Yejin Choi, Alexander C. Berg, and Tamara L. Berg.2011. Baby talk: Understanding and generating simple image descriptions. In Proceedings of CVPR.
Chris H. Lampert, Hannes Nickisch, and Stefan Harmeling. 2009. Learning to detect unseen object classes bybetween-class attribute transfer. In Proceedings of CVPR.
Y. LeCun, B. Boser, J. Denker, D. Henerson, R. Howard, W. Hubbard, and L. Jackel. 1989. Backpropagationapplied to handwritten zip code recognition. Neural Computation, 1(4):541–551.
Marcin Marszałek and Cordelia Schmid. 2008. Constructing category hierarchies for visual recognition. In DavidForsyth, Philip Torr, and Andrew Zisserman, editors, Proceedings of ECCV, volume 5305 of Lecture Notes inComputer Science, pages 479–491. Springer Berlin Heidelberg.
Vicente Ordonez, Jia Deng, Yejin Choi, Alexander C. Berg, and Tamara L. Berg. 2013. From large scale imagecategorization to entry-level categories. In Proceedings of ICCV.
Lluıs Padro and Evgeny Stanilovsky. 2012. Freeling 3.0: Towards wider multilinguality. In Proceedings of theLanguage Resources and Evaluation Conference, LREC ’12, Istanbul, Turkey, May. ELRA.
John C. Platt. 2000. Probabilities for SV machines. Advances in Large-Margin Classifiers, pages 61–74.
Abebe Rorissa. 2008. User-generated descriptions of individual images versus labels of groups of images: Acomparison using basic level theory. Information Processing and Management, 44(5):1741–1753.
Olga Russakovsky, Jia Deng, Jonathan Krause, Alexander C. Berg, and Li Fei-Fei. 2013. ImageNet largescale visual recognition challenge (ILSVRC) 2013. http://image-net.org/challenges/LSVRC/2013/results.php.
Richard Socher and Li Fei-Fei. 2010. Connecting modalities: Semi-supervised segmentation and annotation ofimages using unaligned text corpora. In Proceedings of CVPR, pages 966–973.
Josiah Wang, Katja Markert, and Mark Everingham. 2009. Learning models for object recognition from naturallanguage descriptions. In Proceedings of BMVC.
Yining Wang, Liwei Wang, Yuanzhi Li, Di He, Wei Chen, and Tie-Yan Liu. 2013. A theoretical analysis of NDCGranking measures. In Proceedings of the 26th Annual Conference on Learning Theory (COLT 2013).
Yahoo! Webscope. 2014. Yahoo! Webscope dataset YFCC-100M. http://labs.yahoo.com/Academic_Relations.
Yezhou Yang, Ching Lik Teo, Hal Daume, III, and Yiannis Aloimonos. 2011. Corpus-guided sentence generationof natural images. In Proceedings of EMNLP, pages 444–454.
45

Proceedings of the 25th International Conference on Computational Linguistics, pages 46–53,Dublin, Ireland, August 23-29 2014.
Key Event Detection in Video using ASR and Visual Data
Niraj Shrestha Aparna N. VenkitasubramanianKU Leuven, Belgium
niraj.shrestha, Aparna.NuraniVenkitasubramanian,[email protected]
Marie-Francine Moens
Abstract
Multimedia data grow day by day which makes it necessary to index them automatically and effi-ciently for fast retrieval, and more precisely to automatically index them with key events. In thispaper, we present preliminary work on key event detection in British royal wedding videos usingautomatic speech recognition (ASR) and visual data. The system first automatically acquireskey events of royal weddings from an external corpus such as Wikipedia, and then identifiesthose events in the ASR data. The system also models name and face alignment to identify thepersons involved in the wedding events. We compare the results obtained with the ASR outputwith results obtained with subtitles. The error is only slightly higher when using ASR output inthe detection of key events and their participants in the wedding videos compared to the resultsobtained with subtitles.
1 Introduction
With the increase of multimedia data widely available on the Web and in social media, it becomesnecessary to automatically index the multimedia resources with key events for information search andmining. For instance, it is not possible to manually index all the frames of a video. Automaticallyindexing multimedia data with key events makes the retrieval and mining effective and efficient.
Event detection is an important and current research problem in the field of multimedia informationretrieval. Most of the event detection in video is done by analyzing the visual features using manuallytranscribed data. In this paper, we propose key event detection in British royal wedding videos usingautomatic speech recognition (ASR) data and where possible also to recognize the actors involved in therecognized events using visual and textual data. An event is something that happens at a certain momentin time and at a certain location possibly involving different actors. Events can be quite specific as in thiscase the key events are the typical events that make up a royal wedding scenario. For example, events like’design of cake/dress/bouquet’, ’couple heading to Buckingham palace’, ’appearing on balcony’ etc. arekey events in British royal wedding video. Figure 1 shows an example of a frame containing an event withits actors, together with the associated subtitle and ASR output. While most works in this domain havefocussed on clean textual content such as manual transcripts or subtitles, which are difficult to acquire, weuse the output of an ASR system. While the event detection and name-face alignment problem by itselfis already quite difficult, the nature of the ASR text adds an additional complexity. ASR data is noisyand inaccurate, it does not contain some parts of the actual spoken text, and does not contain sentenceboundaries. Figure 2 illustrates this problem. For the key events, the system first acquires the necessaryknowledge from external corpora - in our case Wikipedia articles associated with royal weddings. Thenthe system identifies the key events in the ASR data. The system also models name and face alignmentto identify the persons involved in the wedding events. We perform named entity recognition in the textassociated with a window of frames to first generate a noisy label for the faces occurring in the framesand this rough alignment is refined using an Expectation-Maximization (EM) algorithm. We comparethe results obtained with the ASR output with results obtained with subtitles. The error is only slightly
This work is licenced under a Creative Commons Attribution 4.0 International License. License details: http://creativecommons.org/licenses/by/4.0/
46

Sub-title: ”Outside, fully 150,000 people with unbounded enthusiasm acclaimed Princess Margaret andher husband when they appeared on the balcony.. . . ”ASR: ”outside only a hundred and 50 people on TV and using it as a . . . ”
Figure 1: An example of a frame containing an event with associated subtitle and ASR output
higher when using ASR output in the detection of key events and their participants in the wedding videoscompared to the results obtained with subtitles. The methodology that we propose can be applied for thedetection of many different types of video events.
2 Related work
Event detection has some relationship with Topic Detection and Tracking (TDT) and with concept de-tection. TDT regards the detection and tracking over time of the main event of a news story and is achallenging problem in the field of text and visual analysis. Although widely studied in text (Allan,2002), (Allan et al., 2005), (Mei and Zhai, 2005), (Wang et al., 2007), (Zhao et al., 2007), topic detectionin video is still not well studied. An event in this context is usually broader in scope than the eventswe want to recognize in wedding videos in this paper. In the multimedia research community, most ofthe works focus on concept detection like in (Liu et al., 2008), (Yang et al., 2007), (Snoek et al., 2006)rather than event detection. A concept detection task is different from event detection as a concept canbe defined as any object or specific configuration of objects. Any frame then can be labelled with someconcept descriptor (e.g., church, cake, etc.). While in an event, there is a start and end time in betweenwhich something happens, and in video, an event is represented by a sequence of frames.
Event detection is a challenging problem which is not well studied. Only few event detection systemsthat process video exist. They recognize events such as goal, run, tackle in a soccer game, or recognizespecific actions in news video (e.g., meeting of two well-known people) or in a surveillance video (e.g.,unusual event). Event detection in video is often related to sports like basketball (Saur et al., 1997),soccer (Yow et al., 1995) and baseball (Kawashima et al., 1998) (Rui et al., 2000). (Wang et al., 2008)developed a model based on a multi-resolution, multi-source and multi-modal bootstrapping frameworkthat exploits knowledge of sub-domains for concept detection in news video. (Adam et al., 2008) de-veloped an algorithm based on multiple local monitors which collect low-level statistics to detect certaintypes of unusual events in surveillance video.
Most of these works rely only on visual analysis (e.g., detection of certain motion patterns) to identifyevents in video and the event detection is performed with a supervised learning method, where a modelis trained on manually annotated examples of known events. In this paper, we propose a novel idea inwhich the system learns events from an external corpus like Wikipedia and identifies those events in theASR or subtitle data of the video. In addition, we identify the persons involved in an event based on theanalysis of visual and textual data.
47

Figure 2: An example showing sub-title vs. ASR data
3 Methodology
The main objective of this work is to identify and index key events in videos using ASR data along withkey actors involved in the event. We start by identifying key events related to a certain domain, usingexternal corpora. In addition, the proposed method involves pre-processing of the textual and visual data.
At 11.30, Elizabeth entered the abbey on her father’s arm, but they did not head straight down the aisleas expected.
Figure 3: Sequence of frames showing the anchor talking about an event of the wedding, but there is novisual appearance of the event.
3.1 Acquiring background knowledgeOur approach for identifying key events in weddings exploits external text corpora. We use two corpora:
1. A genre-specific corpus: a set of pages specific to the topic, for example, from Wikipedia - toidentify events associated with the topic.
48
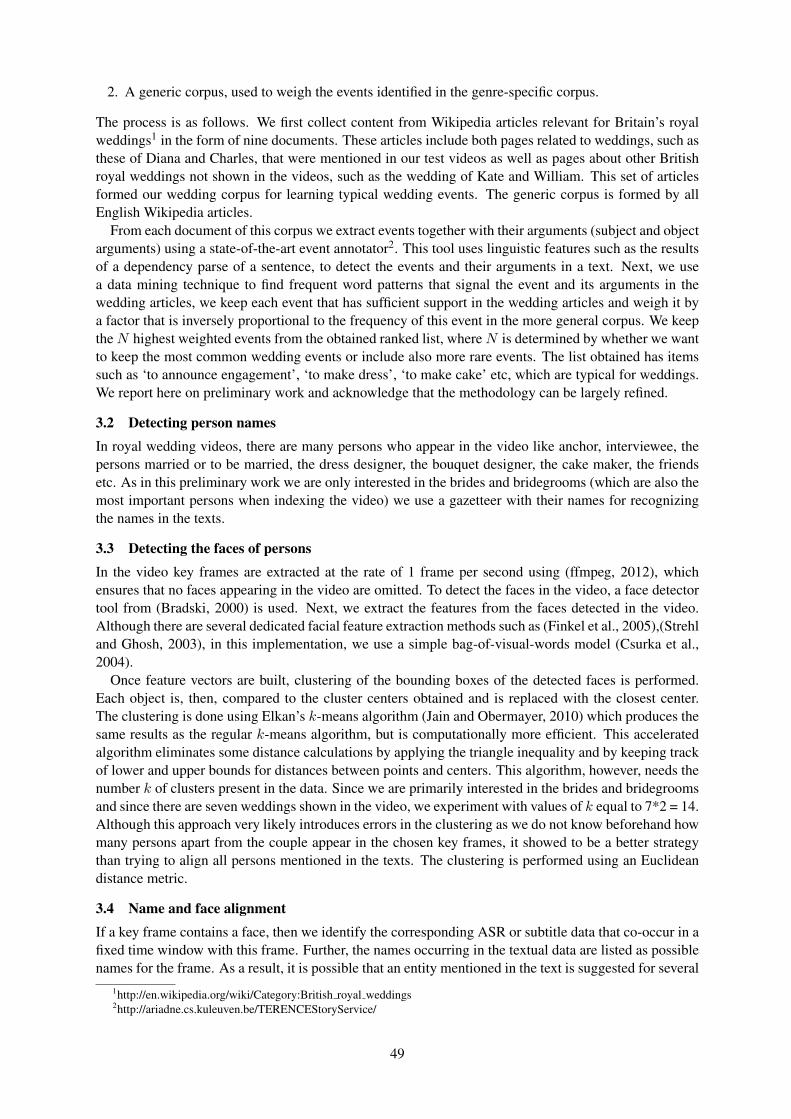
2. A generic corpus, used to weigh the events identified in the genre-specific corpus.
The process is as follows. We first collect content from Wikipedia articles relevant for Britain’s royalweddings1 in the form of nine documents. These articles include both pages related to weddings, such asthese of Diana and Charles, that were mentioned in our test videos as well as pages about other Britishroyal weddings not shown in the videos, such as the wedding of Kate and William. This set of articlesformed our wedding corpus for learning typical wedding events. The generic corpus is formed by allEnglish Wikipedia articles.
From each document of this corpus we extract events together with their arguments (subject and objectarguments) using a state-of-the-art event annotator2. This tool uses linguistic features such as the resultsof a dependency parse of a sentence, to detect the events and their arguments in a text. Next, we usea data mining technique to find frequent word patterns that signal the event and its arguments in thewedding articles, we keep each event that has sufficient support in the wedding articles and weigh it bya factor that is inversely proportional to the frequency of this event in the more general corpus. We keeptheN highest weighted events from the obtained ranked list, whereN is determined by whether we wantto keep the most common wedding events or include also more rare events. The list obtained has itemssuch as ‘to announce engagement’, ‘to make dress’, ‘to make cake’ etc, which are typical for weddings.We report here on preliminary work and acknowledge that the methodology can be largely refined.
3.2 Detecting person namesIn royal wedding videos, there are many persons who appear in the video like anchor, interviewee, thepersons married or to be married, the dress designer, the bouquet designer, the cake maker, the friendsetc. As in this preliminary work we are only interested in the brides and bridegrooms (which are also themost important persons when indexing the video) we use a gazetteer with their names for recognizingthe names in the texts.
3.3 Detecting the faces of personsIn the video key frames are extracted at the rate of 1 frame per second using (ffmpeg, 2012), whichensures that no faces appearing in the video are omitted. To detect the faces in the video, a face detectortool from (Bradski, 2000) is used. Next, we extract the features from the faces detected in the video.Although there are several dedicated facial feature extraction methods such as (Finkel et al., 2005),(Strehland Ghosh, 2003), in this implementation, we use a simple bag-of-visual-words model (Csurka et al.,2004).
Once feature vectors are built, clustering of the bounding boxes of the detected faces is performed.Each object is, then, compared to the cluster centers obtained and is replaced with the closest center.The clustering is done using Elkan’s k-means algorithm (Jain and Obermayer, 2010) which produces thesame results as the regular k-means algorithm, but is computationally more efficient. This acceleratedalgorithm eliminates some distance calculations by applying the triangle inequality and by keeping trackof lower and upper bounds for distances between points and centers. This algorithm, however, needs thenumber k of clusters present in the data. Since we are primarily interested in the brides and bridegroomsand since there are seven weddings shown in the video, we experiment with values of k equal to 7*2 = 14.Although this approach very likely introduces errors in the clustering as we do not know beforehand howmany persons apart from the couple appear in the chosen key frames, it showed to be a better strategythan trying to align all persons mentioned in the texts. The clustering is performed using an Euclideandistance metric.
3.4 Name and face alignmentIf a key frame contains a face, then we identify the corresponding ASR or subtitle data that co-occur in afixed time window with this frame. Further, the names occurring in the textual data are listed as possiblenames for the frame. As a result, it is possible that an entity mentioned in the text is suggested for several
1http://en.wikipedia.org/wiki/Category:British royal weddings2http://ariadne.cs.kuleuven.be/TERENCEStoryService/
49

Table 1: Names and faces alignment results on subtitle vs. ASR data on eventsSubtitle ASR
P R F1 P R F1
Textual 38.095 21.622 27.586 36.585 17.857 24EM 41.304 25.676 31.667 40.426 22.619 29.008
Table 2: WinDiff score on event identification on subtitle vs. ASR data on the union settingSubtitle ASR
11.06 13.80
key frames. However, when there is no corresponding text, or when the text does not contain personentities, no name is suggested for the key frame.
Name and face alignment in royal wedding video is difficult and complicated since the video containsmany other faces of persons mentioned above. Sometimes the anchor or designer talks about the coupleinvolved in the wedding, but there is no appearance of this couple in the corresponding video key frameas shown in figure 3.
We minimize this problem of name and face alignment by using the EM algorithm cited in (Pham etal., 2010). Alignment is the process of mapping the faces in the video to the names mentioned in thetextual data. For each frame, the most probable alignment scheme has to be chosen from all possibleschemes. The EM algorithm has an initialization step followed by the iterative E- and M-steps. TheE-step estimates the likelihood of each alignment scheme for a frame, while the M-step updates theprobability distribution based on the estimated alignments over all key frames of the video.
3.5 Event identification in subtitle and ASR data with person involvement (if any)Once the system has learned the events from the Wikipedia data, it identifies the events from the subtitles.The process is as follow: the system scans each subtitle for the key words from the event list. If the keyword appears in the subtitle data, then it is treated as the occurrence of the event and stores the set offrames that co-occur with that subtitle. The name and face alignment module already might have yieldeda list of names present in this subtitle if there is any person involved. If that is the case, then the namesare assigned to the events identified.
The same process is repeated using ASR data.
4 Experimental setup
In this section, we describe the dataset, experimental setup and the metrics used for evaluation.
4.1 Datasets and ground truth annotationsThe data used in our experiments is the DVD on Britain’s Royal Weddings published by the BBC. Theduration of this video is 116 minutes at a frame rate of 25 frames per second, and the frame resolutionis 720x576 pixels. Frames are extracted at the rate of one frame per second using the ffmpeg tool(ffmpeg, 2012). Faces in the frames are annotated manually using the Picasa tool for building the groundtruth for evaluation. This tool is very handy and user-friendly to tag the faces. We have found thatthere are 69 persons including British wedding couples in the video. The subtitles came along with theDVD which are already split into segments of around 3 seconds. We use the (FBK, 2013) system toobtain the ASR data of the videos. Since the (FBK, 2013) system takes only sound (.mp3 file) as input,we have converted the video into a mp3 file using (ffmpeg, 2012). The obtained ASR data is then inXML format without any sentence boundaries so we have converted the ASR data into segments in therange of three seconds, which is standard when presenting subtitles in video. It is clear that the ASRtranscription contains many words that are incorrectly transcribed. It is also visible that the ASR systemdoes not recognize or misspells many words from the actual speech. As mentioned above, we have built
50

a gazetteer of the couples’ names. A set of events are recognized by our system as being important inthe context of weddings. To evaluate the quality of these events, the events in the video were annotatedby two annotators independently. This annotation includes the actual event, and the start and end timesof the event. These two sets with annotations form the groundtruth. To be able to compare the systemgenerated events with the ground truth events, we adopt a two-step approach. First, we combine thecorresponding ground truth entries from different annotators into one sequence of frames. Suppose oneentry in a ground truth file (GT (a)) by one annotator contains the following start (xa) and end (ya)time range: GT (a) : [xa, ya], and the corresponding entry in the other ground truth file (GT (b)) (by thesecond annotator) contains the following start (xb) and end (yb) time range: GT (b) : [xb, yb]. Mergingof the ground truth event ranges can be done in different ways, but we report here on the union of thetwo ranges.
GT (a) ∪GT (b) = [min(xa, xb),max(ya, yb)] (1)
4.2 Evaluation Metrics
Let FL be the final list of name and face alignment retrieved by our system for all the faces detected inall frames, and GL the complete ground truth list. To evaluate the name and face alignment task, we usestandard precision (P ), recall (R) and F1 scores for evaluation:
P =|FL ∩GL||FL| R =
|FL ∩GL||GL| F1 = 2 · P ·R
P + R
To evaluate correctness of event segment boundaries, precision and recall are too strict since theypenalize boundaries placed very close to the ground truth boundaries. We use the WindowDiff (Pevznerand Hearst, 2002) metric that measures the difference between the ground truth segment GT and thesegment SE found by the machine originally designed for text segmentation. For our scenario, thismetric is defined as follows:
WD(GT, SE) =1
M − kM−k∑i=1
(|b(GTi, GTi+k)− b(SEi, SEi+k)| > 0) (2)
where M = 7102, is the number of frames extracted, k = 1, is the window size and b(i, j) representsthe number of boundaries between frame indices i and j.
5 Results
Figure 4: Events learned from the Wikipedia data and their identification in the subtitles and ASR by thesystem
51

5.1 Evaluation of the extraction of wedding events from WikipediaFigure 4 shows which key events typical for royal weddings the system has learned from Wikipedia dataand how it found these events in the subtitles and the ASR data. It is seen from figure 4 that the systemcould not learn many events that are important to wedding events, but the system recognized the eventsthat it has learned quite accurately in the subtitles and ASR data.
5.2 Evaluation of the event segmentation and recognitionTable 2 shows the results of WinDiff score obtained on subtitles versus ASR data on the union settingdiscussed in 4.1. Though the error rate is more or less the same, it degrades in ASR data which isobviously due to the different ASR errors. The error rate is increased by 2.74% in ASR data using awindow size of 1. Here a window size 1 is equivalent to one second so it corresponds to one frame.In this case the system tries to find the event boundaries in each frame and evaluates these against theground truth event boundaries.
5.3 Evaluation of the name-face alignmentsTable 1 shows the result of the name and face alignment given the detected events. Though the resultis not quite satisfactory even after applying the EM algorithm, there are many bottlenecks that need tobe tackled. Many parts of the video contain interviews. Interviewees and anchors mostly talk about thecouples that are married or are to be married, but the couples are not shown which might cause errors inthe name and face alignment.
6 Conclusion and future work
In this paper, we have presented ongoing research on event detection in video using ASR and visualdata. To some extent the system is able to learn key events from relevant external corpora. The eventidentification process is quite satisfactory as the system learns from external corpora. If the system wouldhave learnt the events from external corpora good enough, it might identify events very well from subtitleor ASR data. We are interested in improving the learning process from external corpora in further work.Finding event boundaries in the frame sequence corresponding to a subtitle or ASR data where the eventis mentioned is still a challenging problem because an event key word might be identified in a subtitlesegment or in a sentence which actually may not correspond to what is shown the aligned frames. Wehave also tried to implement name and face alignment techniques to identify persons involved in theevent. As a further improvement of our system, we need to find how to deal with the many interviews inthis type of videos which might improve the alignment of names and faces.
ReferencesA. Adam, E. Rivlin, I. Shimshoni, and D. Reinitz. 2008. Robust real-time unusual event detection using multiple
fixed-location monitors. Pattern Analysis and Machine Intelligence, IEEE Transactions on, 30(3):555–560,March.
James Allan, Stephen Harding, David Fisher, Alvaro Bolivar, Sergio Guzman-Lara, and Peter Amstutz. 2005.Taking topic detection from evaluation to practice. In Proceedings of the 38th Annual Hawaii InternationalConference on System Sciences (HICSS’05) - Track 4 - Volume 04, HICSS ’05, pages 101.1–, Washington, DC,USA. IEEE Computer Society.
James Allan, editor. 2002. Topic Detection and Tracking: Event-based Information Organization. Kluwer Aca-demic Publishers, Norwell, MA, USA.
G. Bradski. 2000. Opencv face detector tool. Dr. Dobb’s Journal of Software Tools. Available at http://opencv.org/downloads.html.
Gabriella Csurka, Christopher R. Dance, Lixin Fan, Jutta Willamowski, and Cdric Bray. 2004. Visual categoriza-tion with bags of keypoints. In Workshop on Statistical Learning in Computer Vision, ECCV, pages 1–22.
FBK. 2013. FBK ASR transcription. Available at https://hlt-tools.fbk.eu/tosca/publish/ASR/transcribe.
52

ffmpeg. 2012. ffmpeg audio/video tool. Available at http://www.ffmpeg.org.
Jenny Rose Finkel, Trond Grenager, and Christopher D. Manning. 2005. Incorporating non-local information intoinformation extraction systems by Gibbs sampling. In Proceedings of ACL, pages 363–370.
Brijnesh J. Jain and Klaus Obermayer. 2010. Elkan’s k-means algorithm for graphs. In Proceedings of the 9thMexican International Conference on Artificial Intelligence: Conference on Advances in Soft Computing: PartII, MICAI’10, pages 22–32, Berlin, Heidelberg. Springer-Verlag.
Toshio Kawashima, Kouichi Tateyama, Toshimasa Iijima, and Yoshinao Aoki. 1998. Indexing of baseball telecastfor content-based video retrieval. In ICIP (1), pages 871–874.
Ken-Hao Liu, Ming-Fang Weng, Chi-Yao Tseng, Yung-Yu Chuang, and Ming-Syan Chen. 2008. Association andtemporal rule mining for post-filtering of semantic concept detection in video. Trans. Multi., 10(2):240–251,February.
Qiaozhu Mei and ChengXiang Zhai. 2005. Discovering evolutionary theme patterns from text: An exploration oftemporal text mining. In Proceedings of the Eleventh ACM SIGKDD International Conference on KnowledgeDiscovery in Data Mining, KDD ’05, pages 198–207, New York, NY, USA. ACM.
Lev Pevzner and Marti A. Hearst. 2002. A critique and improvement of an evaluation metric for text segmentation.Computational Linguistics, 28(1):19–36.
Phi The Pham, M. F. Moens, and T. Tuytelaars. 2010. Cross-media alignment of names and faces. IEEE Transac-tions on Multimedia, 12(1):13–27, January.
Yong Rui, Anoop Gupta, and Alex Acero. 2000. Automatically extracting highlights for tv baseball programs. InProceedings of the Eighth ACM International Conference on Multimedia, MULTIMEDIA ’00, pages 105–115.
Drew D. Saur, Yap-Peng Tan, Sanjeev R. Kulkarni, and Peter J. Ramadge. 1997. Automated analysis and annota-tion of basketball video. In Storage and Retrieval for Image and Video Databases (SPIE), pages 176–187.
Cees G. M. Snoek, Marcel Worring, Jan C. van Gemert, Jan-Mark Geusebroek, and Arnold W. M. Smeulders.2006. The challenge problem for automated detection of 101 semantic concepts in multimedia. In Proceedingsof the 14th Annual ACM International Conference on Multimedia, MULTIMEDIA ’06, pages 421–430, NewYork, NY, USA.
Alexander Strehl and Joydeep Ghosh. 2003. Cluster ensembles — a knowledge reuse framework for combiningmultiple partitions. J. Mach. Learn. Res., 3:583–617, March.
Xuanhui Wang, ChengXiang Zhai, Xiao Hu, and Richard Sproat. 2007. Mining correlated bursty topic patternsfrom coordinated text streams. In Proceedings of the 13th ACM SIGKDD International Conference on Knowl-edge Discovery and Data Mining, KDD ’07, pages 784–793.
Gang Wang, Tat-Seng Chua, and Ming Zhao. 2008. Exploring knowledge of sub-domain in a multi-resolutionbootstrapping framework for concept detection in news video. In Proceedings of the 16th ACM InternationalConference on Multimedia, MM ’08, pages 249–258, New York, NY, USA. ACM.
Jun Yang, Rong Yan, and Alexander G. Hauptmann. 2007. Cross-domain video concept detection using adaptiveSVMs. In Proceedings of the 15th International Conference on Multimedia, MULTIMEDIA ’07, pages 188–197, New York, NY, USA. ACM.
Dennis Yow, Boon lock Yeo, Minerva Yeung, and Bede Liu. 1995. Analysis and presentation of soccer highlightsfrom digital video. pages 499–503.
Qiankun Zhao, Prasenjit Mitra, and Bi Chen. 2007. Temporal and information flow based event detection fromsocial text streams. In Proceedings of the 22nd National Conference on Artificial Intelligence - Volume 2,AAAI’07, pages 1501–1506.
53
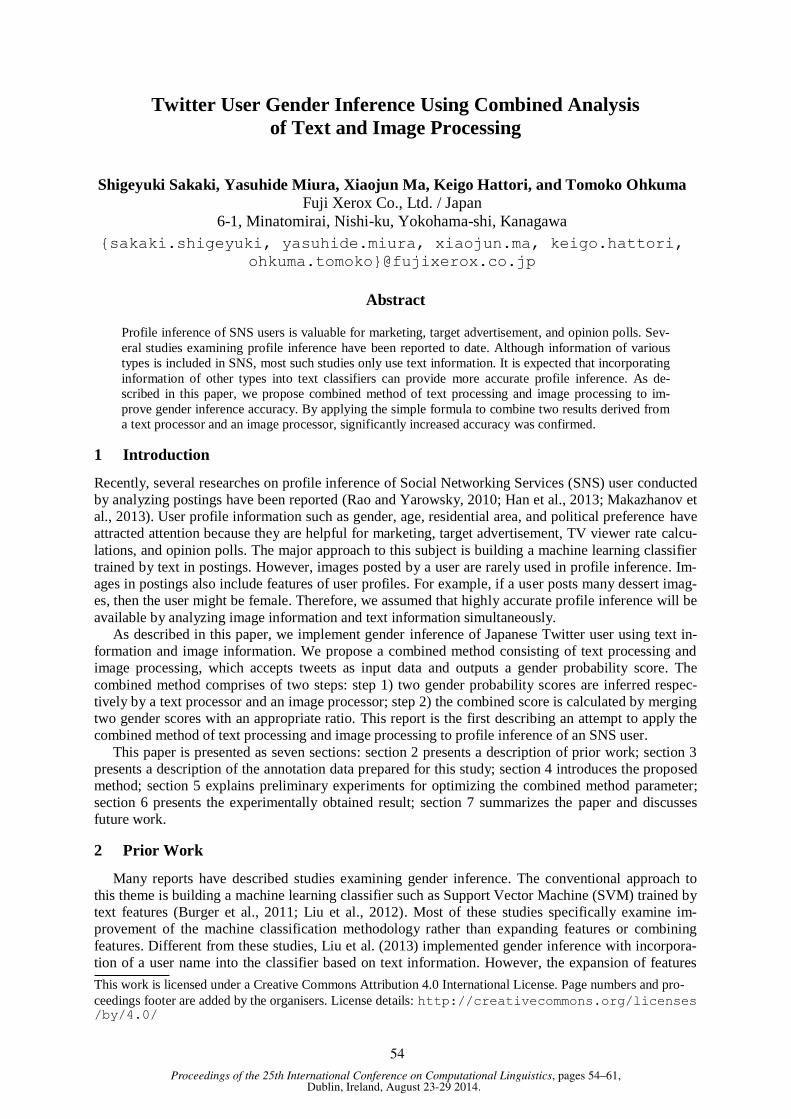
Proceedings of the 25th International Conference on Computational Linguistics, pages 54–61,Dublin, Ireland, August 23-29 2014.
Twitter User Gender Inference Using Combined Analysis
of Text and Image Processing
Shigeyuki Sakaki, Yasuhide Miura, Xiaojun Ma, Keigo Hattori, and Tomoko Ohkuma
Fuji Xerox Co., Ltd. / Japan
6-1, Minatomirai, Nishi-ku, Yokohama-shi, Kanagawa
sakaki.shigeyuki, yasuhide.miura, xiaojun.ma, keigo.hattori,
Abstract
Profile inference of SNS users is valuable for marketing, target advertisement, and opinion polls. Sev-
eral studies examining profile inference have been reported to date. Although information of various
types is included in SNS, most such studies only use text information. It is expected that incorporating
information of other types into text classifiers can provide more accurate profile inference. As de-
scribed in this paper, we propose combined method of text processing and image processing to im-
prove gender inference accuracy. By applying the simple formula to combine two results derived from
a text processor and an image processor, significantly increased accuracy was confirmed.
1 Introduction
Recently, several researches on profile inference of Social Networking Services (SNS) user conducted
by analyzing postings have been reported (Rao and Yarowsky, 2010; Han et al., 2013; Makazhanov et
al., 2013). User profile information such as gender, age, residential area, and political preference have
attracted attention because they are helpful for marketing, target advertisement, TV viewer rate calcu-
lations, and opinion polls. The major approach to this subject is building a machine learning classifier
trained by text in postings. However, images posted by a user are rarely used in profile inference. Im-
ages in postings also include features of user profiles. For example, if a user posts many dessert imag-
es, then the user might be female. Therefore, we assumed that highly accurate profile inference will be
available by analyzing image information and text information simultaneously.
As described in this paper, we implement gender inference of Japanese Twitter user using text in-
formation and image information. We propose a combined method consisting of text processing and
image processing, which accepts tweets as input data and outputs a gender probability score. The
combined method comprises of two steps: step 1) two gender probability scores are inferred respec-
tively by a text processor and an image processor; step 2) the combined score is calculated by merging
two gender scores with an appropriate ratio. This report is the first describing an attempt to apply the
combined method of text processing and image processing to profile inference of an SNS user.
This paper is presented as seven sections: section 2 presents a description of prior work; section 3
presents a description of the annotation data prepared for this study; section 4 introduces the proposed
method; section 5 explains preliminary experiments for optimizing the combined method parameter;
section 6 presents the experimentally obtained result; section 7 summarizes the paper and discusses
future work.
2 Prior Work
Many reports have described studies examining gender inference. The conventional approach to
this theme is building a machine learning classifier such as Support Vector Machine (SVM) trained by
text features (Burger et al., 2011; Liu et al., 2012). Most of these studies specifically examine im-
provement of the machine classification methodology rather than expanding features or combining
features. Different from these studies, Liu et al. (2013) implemented gender inference with incorpora-
tion of a user name into the classifier based on text information. However, the expansion of features
This work is licensed under a Creative Commons Attribution 4.0 International License. Page numbers and pro-
ceedings footer are added by the organisers. License details: http://creativecommons.org/licenses /by/4.0/
54

remains in the text field.
A few reports in the literature describe studies of systems that infer the SNS user gender with in-
formation aside from the text. Ikeda et al. (2013) leverages the accuracy of profile inference based on a
text feature classifier by combining user cluster information. According to their study, the accuracy of
classification that deals only with the user cluster is lower than that of the text classifier. The classifier
using both text and cluster information of a user outperforms their text classifier. This research shows
that information aside from the text is useful to leverage the performance of profile inference based on
text and text information is necessary to achieve high accuracy. However, we introduce image infor-
mation that is not used by Ikeda et al (2013).
Along with text information and cluster information, images are popular informative elements that
are included in SNS postings. An image includes enough information to infer what is printed in itself,
and researches to automatically annotate an image with semantic labels are already known (Zhang et
al., 2012). Automatic image annotation is a machine learning technique that involves a process by
which a computer system automatically assigns semantic labels to a digital image. These studies suc-
ceeded in inferences of various objects, such as person, dog, bicycle, chair etc. We supposed that such
objects in images posted by a user should be useful clues as to a profile inference of a twitter user. As
a matter of fact, gender inference by image information is reported by Ma et al. (2014), which imple-
mented gender inference by processing images in tweets. Their study, which ignored text information,
exhibited accuracy of less than 70%. It was much lower than most gender inference work using text
feature.
From results of these studies, we concluded that gender inference by text and image information
invites further study.
3 Proposed Method
Our proposed method for combining text processing and image processing is presented in Figure 1.
First, data of 200 tweets of a user are separated into text data and image data. Each of separated data is
analyzed using a dedicated processor, a text processor, and an image processor. Both of the processors
Figure 1. Combined method constitution.
text
Gender classifier
Gender probability
score of a user
Image
Combined method
Combined gender probability score of a user
Text Processor Image Processor
Gender probability score of a user
Object Classifiers
Object probability scores
Consolidation of scores
Food-male
classifiers
Food-female
classifiers
Pet-female
classifiers
Toy male
classifiers
Food-male
probability
score of an image
Food-female
probability
score of an image
Toy-male
probability
score of an image
Pet-female
probability
score of an image
200 tweets
posted by a user
55

output a user’s gender probability score, the upper/lower ends of which respectively correspond to
male and female labels. At the end of this process, the combined gender probability score is calculated
using two probability scores. In this section, details of the two processors and the method of combin-
ing their two results are described.
3.1 Text Processing
The text processor is constructed from a text classifier, which accepts text data in tweets and outputs
the gender probability score of a user. We defined the gender classifier in the text processor as an
SVM binary classification of a male and female. The SVM classifier is trained based on unigram Bag-
of-words with a linear kernel. The cost parameter C is set to 1.0. Then LIBSVM (Chang and Lin,
2001) is used as an implementation of SVM. Because words are not divided by spaces in a Japanese
sentence, Kuromoji (Atilika, 2011), a morphological analysis program for Japanese, is used to obtain
unigrams.
To combine two results from the text processor and the image processor, it is necessary to calculate
each result as a probability value. To retrieve probability scores, we used logistic regression. Logistic
function converts a distance from a hyper plane to probability scores of 0.0–1.0. The text classifier is a
male and female binary classification. Therefore, the upper and lower ends of the probability score
respectively correspond to male and female data. If a score is close to 0.0, then the user has high prob-
ability of being male. If it is close to 1.0, then a user is probably female.
3.2 Image Processing
We first tried to infer a Twitter user gender directly by a two-class classifier trained by image feature
vector calculated by all images posted by a user. However, with some preliminary experiments, we
found that this approach does not work well, since the large variation of objects made the classifica-
tion difficult with single classifier setting. We, therefore, used the image processing method described
by Ma et al. (2014) which uses automatic image annotation classifiers (Zhang et al., 2012) to model
human recognition of different gender tendency in images. The method consists of two steps: step 1)
annotating images by an image annotation technique at the image level; step 2) consolidating gender
scores according to annotation results at the user level.
In the first step, the image labels are defined as the combination of the following two information:
the gender tendency in images of a user and the objects that images express. Ma et al. (2014) defined
10 categories of objects in SNS images based on observation on a real dataset. The defined labels are
cartoon/illustration, famous person, food, goods, memo/leaflet, outdoor/nature, person, pet, screen-
shot/capture, and other. They also indicated that gender tendency in images are coherent with user
gender, and set three gender labels, male, female, and unknown, for each object label. As a result, 30
labels constructed from object label and gender label (e.g. “male-person”) are used in this paper,
which is described in section 4.2. Then a bag-of-features (BOF) model (Tsai, 2012; Chatfield et al.,
2011) is applied to accomplish the image annotation task. We used local descriptors of SIFT (Lowe,
1999) and image features are encoded with a k-mean generated codebook with size of 2000. We ap-
plied LLC (Wang et al, 2010) and SPM (Lazebnik et al, 2006) to generating the final presentation of
image features. Then, the 30 SVM classifiers are trained based on the features of training images: each
classifier is trained per image label among one-versus-rest strategy. The SVM classifier annotates im-
ages of a user by computing scores, and logistic function is applied to the outputs of the image classi-
fiers in order to obtain probability scores. Each of 30 probability scores shows how an image is close
to the decision boundary of a particular label.
In the second step, we integrated the 30 scores of labels assigned to images to yield comprehensive
scores which imply a user’s gender. Two methods are suggested for the second step. One is computing
the average of all scores output from each classifier for each of the categories of male and female for a
user. The other is computing the mean value of only the highest scores of every image for each of the
categories of male and female for a user.
3.3 Combined method of Text Processing and Image Processing
To combine two results derived from text processing and image processing, we used the function be-
low. Scoretext and Scoreimage respectively represent gender probability scores derived from the text pro-
56

cessor and the image processor. In the function, is set as a ratio of the text score and an image score
to combine two scores appropriately. We introduced as a reliability ratio parameter of the scores by
the text processor and the scores by the image processor.
1imagetextcombined ScoreScoreScore
4 Data
We prepared user annotation data and image annotation data that we used as training data and evalua-
tion data. User annotation data are input data for the text processor, whereas image annotation data are
for the image processor. As it is required to prepare a huge number of annotated data as a training cor-
pus, the data is annotated by Yahoo Crowd Sourcing (Yahoo! Japan, 2013). Yahoo Crowd Sourcing is
a Japanese crowd sourcing service similar to Amazon Mechanical Turk (Amazon, 2005). Therefore
the annotation process aims to obtain annotation based on human recognition rather than to explore
truth about users and images of twitter.
4.1 User Annotation Data
We first collected Japanese Twitter users according to their streaming tweets. We ignored heavy users
and Twitter bots. A random sampling of tweets revealed that tweets from heavy users include much
information that is not useful for profile inference such as short representations of their actions (e.g.
“Going to bed now” and “Just waking up”). A Twitter bot is also classed as an uninformative user be-
cause it is a program that automatically generates tweets. During data collection, we filtered out those
users by setting conditions shown below in Table 1. Finally, we obtained 3976 Twitter users. We
gathered tweets on each user up to 200. By executing the processes above, we obtained tweet data of
each user corresponding to the user’s own 200 tweets.
To obtain gender annotation for this large dataset, we used Yahoo! Crowd Sourcing. As shown in
Figure 2(a), we set task for every Twitter user: please infer the gender of the user who posted the
tweets in the URL below. In this task, after reading 200 tweets of a user, the gender label of male or
female was asked of every Twitter user. To guarantee quality reliability, annotation tasks for one Twit-
ter user were duplicated 10 times by different workers; then a majority vote of 10 annotations was cal-
culated to obtain a gold label.
As a result of the crowd sourcing tasks, 1733 users were reported as male; 2067 users were reported
as female. There were 176 users whose votes were split equally between male and female. We re-
Table 1. Filtering conditions used to disqualify heavy users and Twitter bots
User Types Definition for N Criteria
Twitter bots Number of tweets posted from Twitter clients on PC/mobile
by a user
N<150
Heavy Number of Friends or followers of a user N>200
Number of Tweets posted in a day by a user N>10
(a) User annotation task (b) Image annotation task
Figure 2. Annotation tasks in crowd sourcing.
http://www.abc.com/defg/index.html
Answer: Male
Female
Question :
Please infer the gender of the user
who posted the tweets in the URL below.
Question 2:
Please choose the word most
suitable to express the objects
included in the image
Answer: Male
Female
Unknown
Question 1:
Please guess the gender of the
user who uploaded the image
Answer: Cartoon/Illustration
Food
Memo/Leaflet
Person
Screenshot/Capture
Famous person
Goods
Outdoor/Nature
Pet
Others
57

moved balanced users from the data. The male and female populations of annotation assumed users
are 45.6% and 54.4% respectively. This gender proportion tendency is consistent with those reported
from an earlier study showing that Twitter participants are 55% female (Heli and Piskorski, 2009;
Burger et al., 2011). Finally, we obtained gender annotation data of 3800 users. We divided these data
equally between training data and evaluation data: 1900 users for training data and 1900 users for
evaluation data.
4.2 Image Annotation Data
We first made a user list including 1523 users. After checking tweets from these users, we extracted
9996 images. Image annotation processes were also executed by Yahoo Crowd Sourcing.
Our image annotation process refers to rules proposed by Ma et al. (2014). As shown in Figure 2(b),
a worker is requested to provide responses of two kinds for every image: Q1. Please guess the gender
of the user who uploaded the image; Q2. Please choose the word most suitable to express the objects
included in the image. The possible responses for Q1 were male, female, and unknown. Those for Q2
were cartoon/illustration, famous person, food, goods, memo/leaflet, outdoor/nature, person, pet,
screenshot/capture, and other. It is sometimes difficult to infer a gender of a user solely based on one
image. Therefore, unknown is set for Q1. From those responses we obtained multiple labels for every
image, such as “male-person”. To avoid influence by poor-quality workers, each image was presented
to 10 different workers. A summation of 10 annotations was executed to obtain gold label data.
5 Preliminary Experiments
5.1 Image Processing
We compared two consolidation methods, computing the average of all scores and computing the av-
erage of the highest scores for 30 object scores. We applied the two method to the training data of the
user annotation data, and tested them on the evaluation data. Results show that the accuracy of former
method is 60.11. That of the latter is 65.42. The reason the latter method is superior to the former one
is probably attributable to noise reduction effects of ignoring low scores.
5.2 Combined method of Text Processing and Image Processing
To estimate the optimal value of , we conducted a preliminary experiment of the combined method
with training data. We first prepared text and image probability scores. The text score is obtained by
executing five-fold cross validation of the text processor for training data. We used the probability
score derived in section 5.1 as the image score. The accuracies were, respectively, 86.23 and 65.42.
Next, the combined formula was applied to these probability scores with moving from 0 to 1. Figure
3 shows the correlation between accuracy and . To obtain the value of the peak, we executed poly-
nomial fitting to a part of the correlation curve where is 0.1–0.4. By differentiating this function, we
calculated the value of the peak as equal to 0.244 indicated by the arrow in Figure 3. The accuracy
reaches 86.73% at the peak, which is 0.50 pt higher than that of the text processor.
Figure 3. Correlation between accuracy and in training data.
(Fitting curve function is 0.95193-0.91292+0.2756+0.8409)
0.85
0.855
0.86
0.865
0.87
0.875
0 0.1 0.2 0.3 0.4 0.5 0.6 0.7 0.8 0.9 1
Acc
ura
cy [
%]
58

6 Experimental Results
6.1 Comparing the Accuracies between Three Methods
We executed an evaluation experiment assessing the three methods: text processing, image processing
with a selected consolidation method, and the combined method with optimized (0.235). Each
method is applied to evaluation data including 1900 gender-annotated data. Table 2 presents precision,
recall, F-measure, and accuracy obtained through the evaluation experiments. The text processing ac-
curacy achieves 84.63%, and image processing accuracy is 64.21%. The combined method achieves
85.11% accuracy, which is 0.48 pt higher than the text processing accuracy.1 We also confirmed that
both the male and female F-measures become higher than text processing. We concluded that signifi-
cantly increased accuracy obtained using the method combining text processing and image processing.
6.2 Discussion
We expected the optimal value of to be large, since the accuracy of the text processor is explicitly
higher than that of the image processor. However, the actual optimal resulted to the rather small val-
ue, 0.244. This small is thought to be caused by a characteristic of the image processor’s gender
scores. Figure 4 (a) and (b) show the distributions of the gender scores derived by the text processor
and the image processor. The horizontal axis corresponds to a gender score of a user, ranging from 0,
highly probable female, to 1, highly probable male. The two distributions are clearly different from
Table 2. Results obtained using text processing, image processing and combined method.
(P, precision; R, recall; F, F-measure; Acc., Accuracy)
Male Female Acc.
P R F P R F
Text processing 84.65 82.39 83.50 84.62 86.64 83.50 84.63
Image processing 64.68 66.56 65.60 72.10 62.11 66.74 64.21
Combined method ( = 0.244) 84.57 83.72 84.16 85.49 86.34 85.91 85.11
(a) The distribution of the text processing scores (b) The distribution of the image processing scores
Figure 4. The distributions of the probability scores.
Figure 5. The distribution of the “male-person” score of training data of user annotation data.
0100200300400500600700800900
1000
0.1 0.2 0.3 0.4 0.5 0.6 0.7 0.8 0.9 1.0
Nu
mb
er o
f u
sers
Probability score
0100200300400500600700800900
1000
0.1 0.2 0.3 0.4 0.5 0.6 0.7 0.8 0.9 1.0
Nu
mb
er o
f u
sers
Probability score
0
1000
2000
3000
4000
5000
6000
7000
0.1 0.2 0.3 0.4 0.5 0.6 0.7 0.8 0.9 1.0
Nu
mb
er o
f la
bel
s
Probability score
1Significance improvement with paired t-test (p=0.09<0.1).
59

each other: the variance of the image scores is much smaller than that of the text. From this character-
istic, the image scores were needed to be amplified in order to reflect them in the final result. In terms
of , this amplification corresponds to a small value.
The reason why the variance of the image scores became small is in its calculation process. In the
image processor, the gender score of a user is calculated as the mean of the highest object scores ex-
tracted from each image. Figure 5 shows a distribution of “male-person” label scores. Though a distri-
bution of each object probability scores centres not at 0.5, highest score selections and the averaging
of them leads to a mid-range value, in this case 0.5.
Our intuition behind the introduction of was to provide a reliability ratio parameter of the text
processor and the image processor. But as a matter of fact, this parameter also worked to calibrate the
scale difference between the two probability scores. From this observation, a function that includes a
reliability parameter and a calibration parameter separately can be considered as an alternative to the
proposed function. Using this kind of function will provide further insights about combining a text
processing and image processing.
7 Conclusion
As described herein, we assembled two results retrieved by text and image processors respectively to
enhance the Twitter user gender inference. Even though the gender inference accuracy already reached
84.63 solely by the text classifier, we succeeded in improving efficiency further by 0.48 pt. Because
the image processing in our method is completely independent from the text processing, this combined
method is applicable to the other gender prediction methods, just like those of Burger and Liu (Burger,
2011; Liu, 2013). Reported studies about SNS user profile inference targeted basic attributes such as
gender, age, career, residential area, etc. More worthwhile attributes for marketing that directly indi-
cate user characteristics are desired to predict, for example, hobbies and lifestyles. Images in tweets
are expected to include clues about these profiles aside from gender. As a subject for future work, we
will apply our combined method to various profile attributes.
As the combined method in this paper is simple linear consolidation and ignores a capability of ana-
lyzing both text and image information at the same time, exploring more suitable combined method is
needed. The simplest way to analyze both text and image information simultaneously is early fusion
that first creates the large multi-model feature vector constructed by both text and image features and
then trains a classifier. Meta classifier which infers final class from the outputs of two modalities is
also considerable method for this subject. Applying more sophisticated combined methods is another
subject for future work.
References
Amazon. 2005. Amazon Mechanical Turk (2005), Available: http://www.mturk/welcom
Atilika. 2011, Kuromoji. Available: http://www.atilika.org
John D. Burger, John Henderson, Gerorge Kim, Guido Zarrella. 2011. Discriminating Gender on
Twitter, In Proc. of the Conference on Empirical Methods in natural Language Processing
Ken Chatfield, Victor Lempitsky, Andrea Vedaldi, Andrew Zisserman. 2011. The devil is in the de-
tails: an evaluation of recent feature encoding methods, In Proc. of British Machine Vision Confer-
ence 2011
Chih-Chung Chang, Chih-Jen Lin, 2001. LIBSVM: a Library for Support Vector Machines. Available:
http://www.csie.ntu.edu.tw/~cjlin/libsvm
Bo Han, Paul Cook, and Timothy Baldwin. 2013. A Stacking-based Approach to Twitter User Geolo-
cation Prediction, In Proc. of the 51st Annual meeting of Association for Computational Linguistics,
pages 7-12
Bill Heli, Mikolaj Jan Piskorski. 2009. New Twitter Research: Men Follow Men and Nobody Tweets,
Harvard Business Review, June 1.
60

Kazushi Ikeda, Gen Hattori, Chihiro Ono, Hideki Asoh, Teruo Higashino. 2013. Twitter User Profil-
ing Based on Text and Community Mining for Market Analysis, Knowledge Based Systems 51,
pages 35-47.
Svetlana Lazebnik, Cordelia Schmid, Jean Ponce, 2006. Beyond bags of features: Spatial Pyramid
Matching for Recognizing Natural Scene Categories, In Proc. of Computer Vision and Pattern
Recognition 2006, page 2169-2178
Wendy Liu, Faiyaz Al Zamal, Derek Ruths. 2012. Using Social Media to Infer Gender Composition of
Commuter Populations, In Proc. of the International Association for the Advancement of Artificial
Intelligence Conference on Weblogs and Social
Wendy Liu, Derek Ruths. 2013. What’s in a Name? Using First Names as Features for Gender Infer-
ence in Twitter, In Symposium on Analyzing Microtext
David G. Lowe. 1999. Object recognition from local scale-invariant features, In Proc. of the Interna-
tional Conference on Computer Vision, pages 1150-1157
Matt Lynley. 2012. Statistics That Reveal Instagram’s Mind-Blowing Success, Available:
http://www.businessinsider.com/statistics-that-reveal-instagrams-mind-blowing-success-2012-4
Xiaojun Ma, Yukihiro Tsuboshita, Noriji Kato. 2014. Gender Estimation for SNS User Profiling Au-
tomatic Image Annotation, In Proc. of the 1st International Workshop on Cross-media Analysis for
Social Multimedia
Aibek Makazhanov, Davood Refiei. 2013. Predicting Political Preference of Twitter Users, In Proc. of
the 2013 IEEE/ACM International Conference on Advances in Social Network and Mining, pages
298-305
Alan Mislove, Sune Lehmann, Yong-Yeol Ahn, Jukka-Pekka onnela, J. Hiels Rosenquist. 2011. Un-
dersanding the Demographics of Twitter Users, In Proc. of 5th International AAAI Conference on
Weblogs and Social Media, pages 554-557
Delip Rao and David Yarowsky. 2010. Detecting Latent User Properties in Social Media, In Proc. of
the Neural Information Processing Systems Foundation workshop on Machine Learning for Social
Networks
Chih-Fong Tsai. 2012. Bag-of-Words Representation in Image Annotation: A Review, International
Scholarly Research Notices Artificial Intelligence, Volume 2012, Article ID 376804, 19 pages
Jinjun Wang, Jinchao Yang, Kai Yu, Fengjun Lv, Thomas Huang, Yihong Gong. 2010. Locality-
constrained linear coding for image classification, In Proc. of Computer Vision and Pattern Recog-
nition 2010, page 626
Yahoo! Japan. 2013. Yahoo Crowd Sourcing. Available: http://crowdsourcing.yahoo.co.jp/
Dengsheng Zhang, Md Monirul Islam, Guojun Lu. 2012. A review on automatic image annotation,
Pattern Recognition 45, pages 346-362
61
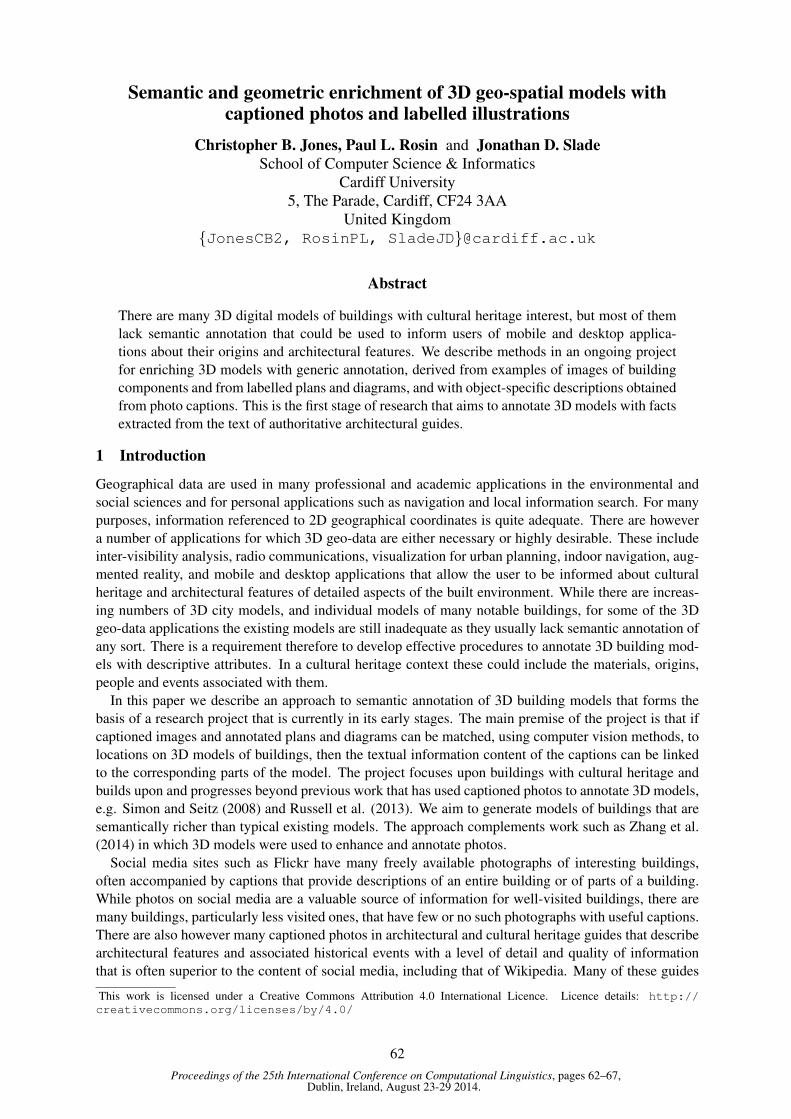
Proceedings of the 25th International Conference on Computational Linguistics, pages 62–67,Dublin, Ireland, August 23-29 2014.
Semantic and geometric enrichment of 3D geo-spatial models withcaptioned photos and labelled illustrations
Christopher B. Jones, Paul L. Rosin and Jonathan D. SladeSchool of Computer Science & Informatics
Cardiff University5, The Parade, Cardiff, CF24 3AA
United KingdomJonesCB2, RosinPL, [email protected]
Abstract
There are many 3D digital models of buildings with cultural heritage interest, but most of themlack semantic annotation that could be used to inform users of mobile and desktop applica-tions about their origins and architectural features. We describe methods in an ongoing projectfor enriching 3D models with generic annotation, derived from examples of images of buildingcomponents and from labelled plans and diagrams, and with object-specific descriptions obtainedfrom photo captions. This is the first stage of research that aims to annotate 3D models with factsextracted from the text of authoritative architectural guides.
1 Introduction
Geographical data are used in many professional and academic applications in the environmental andsocial sciences and for personal applications such as navigation and local information search. For manypurposes, information referenced to 2D geographical coordinates is quite adequate. There are howevera number of applications for which 3D geo-data are either necessary or highly desirable. These includeinter-visibility analysis, radio communications, visualization for urban planning, indoor navigation, aug-mented reality, and mobile and desktop applications that allow the user to be informed about culturalheritage and architectural features of detailed aspects of the built environment. While there are increas-ing numbers of 3D city models, and individual models of many notable buildings, for some of the 3Dgeo-data applications the existing models are still inadequate as they usually lack semantic annotation ofany sort. There is a requirement therefore to develop effective procedures to annotate 3D building mod-els with descriptive attributes. In a cultural heritage context these could include the materials, origins,people and events associated with them.
In this paper we describe an approach to semantic annotation of 3D building models that forms thebasis of a research project that is currently in its early stages. The main premise of the project is that ifcaptioned images and annotated plans and diagrams can be matched, using computer vision methods, tolocations on 3D models of buildings, then the textual information content of the captions can be linkedto the corresponding parts of the model. The project focuses upon buildings with cultural heritage andbuilds upon and progresses beyond previous work that has used captioned photos to annotate 3D models,e.g. Simon and Seitz (2008) and Russell et al. (2013). We aim to generate models of buildings that aresemantically richer than typical existing models. The approach complements work such as Zhang et al.(2014) in which 3D models were used to enhance and annotate photos.
Social media sites such as Flickr have many freely available photographs of interesting buildings,often accompanied by captions that provide descriptions of an entire building or of parts of a building.While photos on social media are a valuable source of information for well-visited buildings, there aremany buildings, particularly less visited ones, that have few or no such photographs with useful captions.There are also however many captioned photos in architectural and cultural heritage guides that describearchitectural features and associated historical events with a level of detail and quality of informationthat is often superior to the content of social media, including that of Wikipedia. Many of these guides
This work is licensed under a Creative Commons Attribution 4.0 International Licence. Licence details: http://creativecommons.org/licenses/by/4.0/
62

contain plans and diagrams of the layout of buildings labelled with the names of rooms and associatedspaces. The combination of captioned images, annotated plans and diagrams that can be found in socialmedia and in authoritative texts provides a rich source of information that can be used to attach semanticattributes to 3D models of buildings as well as to some 2D cartographic data.
The idea of exploiting captioned photos of buildings to support virtual exploration of buildings waspioneered in the Photo Tourism application of Snavely et al (2008) in which SIFT and related methods offeature matching in computer vision were used to match photos of buildings, compute camera parameters(i.e. pose) and to generate point clouds representing the 3D geometry of buildings (referred to as structurefrom motion). This enabled applications in which users could view captioned photos of particular partsof a building. It also provided the possibility of matching a new photo to an existing captioned photoand hence automatically tagging the new photo with tags from the already captioned photo or with tagsthat users manually linked to the 3D geometry. Simon and Seitz (2008) used related methods to annotate3D point clouds with the captions of the Flickr photos. They presented a segmentation procedure thatgrouped photos that contain the same 3D points (derived from the SIFT/structure from motion methods)as well as exploiting the fact that 3D points belonging to the same object could be expected to be clusteredin space.
Finer granularity annotation of parts of buildings was achieved by Russell et al (2013) who linkeditems of text in Wikipedia articles about particular buildings to locations in 3D models. The models werecreated from sets of Flickr images tagged with the respective building name, but annotation of objectswithin the buildings, such as statues and paintings, was obtained using images found on Google Imagesearch, with search terms obtained from extraction of prepositional and noun phrases in the Wikipediaarticles. In Russell et al’s application, the 3D building model is essentially a point cloud with no explicitstructure, and the users’ views of parts of the building consist of the Flickr photos of respective annotatedobjects.
Our work differs from these approaches in that we employ structured 3D building models, as canbe found for example in 3D Warehouse1. We exploit the fact that many of these 3D models includetexture mapped photos that have been registered to the building geometry. This enables the use of imagematching methods to associate captioned photographs with specific parts of the texture mapped images,and hence via the 3D geometry to specific geometric objects on the buildings. The aim is to enrichstructured 3D models both semantically and, where necessary, geometrically, using a combination ofthe texture-mapped imagery, captioned photos, and other annotated resources such as ground plans, thatname the rooms or spaces of a building, and diagrams of the elevation (side view) of a building. In theremainder of the paper we provide a summary of the methods. We conclude with a discussion of thefuture challenges.
2 Methods
2.1 Annotation of 3D models with examples of generic objectsTo support the objective of attaching annotation from captions, or other text, to building componentssuch as rooms, doors, windows, arches, clocks etc, it would be useful for their presence to be recordedexplicitly in the geometric model, which is not the case for many existing building models. The geometricrepresentation of component objects would serve as a digital record of the building structure and assistapplications that guide and inform users of the various aspects of a building. If these objects, suchas doors and windows, are generically labelled it will also assist the process of matching caption textto the parts of the building that they describe. Thus while a caption may describe something in theimage the question is exactly what part of the 3D model is being described. In some cases the captionwill relate to most of the content of the photo image, if for example a particular statue or window hasbeen photographed, but in some cases the described object may occupy just a part of the image. Simonand Seitz (2008) addressed this issue by comparing multiple (hundreds or thousands of) photos with asimilar caption and identifying the region that is common to the majority of the photos, but that approachcannot be used when there are very few photos with useful captions. If the 3D model contains generic
1https://3dwarehouse.sketchup.com/ also known as Trimble 3D Warehouse and Google 3D Warehouse
63

annotation then it will be possible in some cases to infer what geometric object the caption is describing,by matching between the generic descriptor in the model and equivalent terms in the caption.
We will therefore develop automated methods to assist in enhancing the geometric detail in order tosupport semantic annotation. The intention is to use, in the first instance, generic object models to assistin identifying the boundary of prominent building components, such as windows, within the texturemapped imagery or within photos that have been matched to, and hence registered with, the texture maps(see Mayer and Reznik (2006; 2005) for examples of related work in photogrammetry). The vectorisedgeometric representation of these boundaries will then be added to the building model geometry andlabelled with the object category (e.g. “door”) of the corresponding object detector.
Previous work on the detection of objects in images of buildings has mostly used template-basedmethods that require the design of object detectors (e.g. Chen et al (2011)). These methods may notbe suitable for application to texture mapped imagery due to the wide range of appearances of objectssuch as doors and windows as a consequence both of stylistic variation and of variation in the viewpoint,lighting, colour and size. An alternative approach is the bag of visual words BoVW (Sivic and Zisserman,2003) which involves detecting and describing a set of keypoints (or interest points) in the image. Givena training set of images, vector quantization is applied to cluster the extracted feature vectors to form adictionary which captures the most frequently occurring patterns (the visual words). An unseen image isrepresented as a vector of visual word frequencies and image classification is performed by matching thevector to prototypical vectors.
2.2 Exploitation of building plansAs indicated above, annotated plans of buildings, such as may be found in published building guidesand in some web documents about specific buildings, provide a potentially useful further source ofinformation about the nature of rooms and spaces in buildings. When 3D building models lack suchannotation, as is usually the case, it will be possible to match the plans to the ground projection of thebuilding geometry and hence label the corresponding parts of the building.
In various applications of GIS it is common practice to integrate data from multiple sources in order togenerate a representation that retains the best elements of the multiple sources (see Ross et al (2009) foran example that includes 3D data) – in our case we are interested in taking labels of plans in illustratedguides and transferring the labels to the appropriate matching parts of the 3D building. The process re-quires geometric and semantic matching and is referred to as conflation (Samal et al., 2004), though it ismost commonly applied to 2D geographical data. If there is considerable variation in the representationof the same real world objects then it can be helpful to use probabilistic methods such as mutual informa-tion (Walter and Fritsch, 1999) and Bayesian learning methods (Jones et al., 1999) that employ multiplesources of evidence for equivalence. Most conflation methods in GIS operate on vector representations.As plans in guides to buildings are typically purely image based, it may be necessary to vectorize them,for which standard GIS methods are again available, prior to application of conflation procedures. Analternative to conventional GIS methods, many of which require some interactive control, has been de-scribed in Smart et al (2011), who presented matching methods that entailed rasterizing the projection ofpoorly structured building geometry prior to raster based matching with a rasterized digital map.
2.3 Feature matching methods and linking captions to modelsIn computer vision, image feature matching procedures based on SIFT (Scale Invariant Feature Trans-form) are now widely used (Mikolajczyk and Schmid, 2005). In our project these feature matchingmethods will support object detection (as explained above) and enable matching of captioned photos tothe corresponding objects or regions of a building. The first step is to identify distinctive local regions,or keypoints, of an image, and compute descriptors for each keypoint. Matches between correspondingfeatures in different images are established using measures of similarity between the keypoint descrip-tors. However, some of these local matches will often be inconsistent at an object (i.e. more global)level. These are eliminated by applying a RANSAC procedure (Fischler and R. Bolles, 1987) to the setof matching keypoints to robustly generate the fundamental matrix representing the perspective trans-formation between the two images. Those pairs of matching keypoints that are inconsistent with the
64

Figure 1: Flickr photo and accompanying caption of Big Ben
estimated transformation are identified as outliers, and removed.Figure 1 illustrates an image and caption from Flickr of Big Ben which is part of the Houses of
Parliament in London. It is of interest to match this captioned image to the corresponding part of the3D model of the building (illustrated in Figure 2b) for purposes of annotation. Applying the SIFT-basedmatching procedure to compare the Flickr image with the set of texture map images for the 3D model,followed by the RANSAC procedure, results in one of the texture map images containing a strong clusterof matching keypoints for the region around the clock of Big Ben (Figure 2a), i.e. the inlier matchedkeypoint pairs, represented in the figure with red lines. Other, false matching outlier keypoint pairs arehighlighted with dashed cyan lines in Figure 2a. The matched region on the 3D model is highlighted inred in Figure 2b and is based on the convex hull of the matching inlier keypoints. The caption becomeslinked in the first instance to this region. In future work we will use other methods to refine this matchingregion. Initially this could use region growing from the initial set of inlier key points, whereby pixels inthe captioned images adjacent to the inlier key points are transformed to the texture map image using theestimated fundamental matrix, and retained if the (dense) SIFT descriptors of the corresponding pixelsmatch. In subsequent work the intention is to match the caption text to the corresponding genericallylabelled objects on the building model, which in the illustrated example would be the clock and the tower.
2.4 Linking to rich text descriptions
The work described here is a step towards the objective of linking detailed authoritative descriptionsof parts of buildings to the corresponding objects in 3D geometric models. Russell et al (2013) havedemonstrated such linking between parts of Wikipedia articles to 3D models. It is clear however fromtheir examples that their methods are quite selective and can fail to match interesting descriptions to theirrespective building components. Their methods depend upon crowdsourcing of suitably captioned photosthat match with the authoritative text, which in turn restricts the approach to well-photographed placesand objects. While that approach has benefits for popular buildings, the challenge remains to developmore effective methods for detecting references to building components in rich textual descriptions (notjust in social media) and to develop methods for linking them to the geometric model that are not entirelydependent upon multiple tagged photographs.
One approach to reducing the dependancy upon captioned photos is to develop effective methods for
65
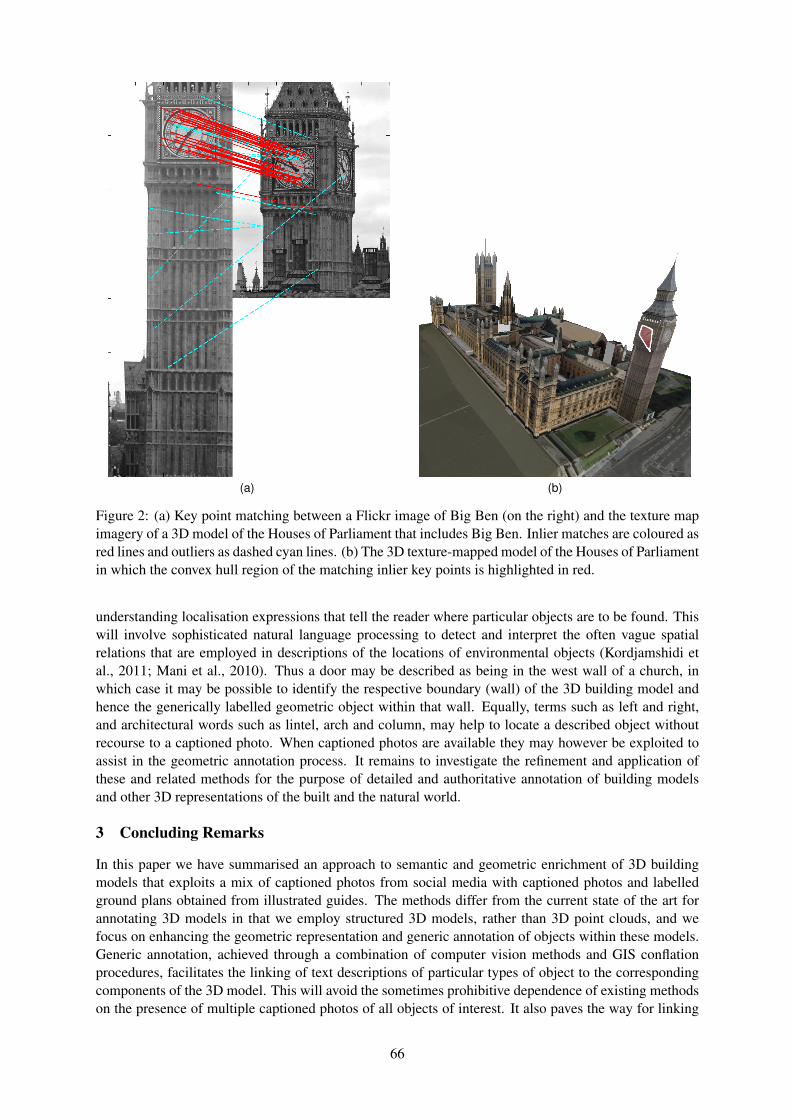
(a) (b)
Figure 2: (a) Key point matching between a Flickr image of Big Ben (on the right) and the texture mapimagery of a 3D model of the Houses of Parliament that includes Big Ben. Inlier matches are coloured asred lines and outliers as dashed cyan lines. (b) The 3D texture-mapped model of the Houses of Parliamentin which the convex hull region of the matching inlier key points is highlighted in red.
understanding localisation expressions that tell the reader where particular objects are to be found. Thiswill involve sophisticated natural language processing to detect and interpret the often vague spatialrelations that are employed in descriptions of the locations of environmental objects (Kordjamshidi etal., 2011; Mani et al., 2010). Thus a door may be described as being in the west wall of a church, inwhich case it may be possible to identify the respective boundary (wall) of the 3D building model andhence the generically labelled geometric object within that wall. Equally, terms such as left and right,and architectural words such as lintel, arch and column, may help to locate a described object withoutrecourse to a captioned photo. When captioned photos are available they may however be exploited toassist in the geometric annotation process. It remains to investigate the refinement and application ofthese and related methods for the purpose of detailed and authoritative annotation of building modelsand other 3D representations of the built and the natural world.
3 Concluding Remarks
In this paper we have summarised an approach to semantic and geometric enrichment of 3D buildingmodels that exploits a mix of captioned photos from social media with captioned photos and labelledground plans obtained from illustrated guides. The methods differ from the current state of the art forannotating 3D models in that we employ structured 3D models, rather than 3D point clouds, and wefocus on enhancing the geometric representation and generic annotation of objects within these models.Generic annotation, achieved through a combination of computer vision methods and GIS conflationprocedures, facilitates the linking of text descriptions of particular types of object to the correspondingcomponents of the 3D model. This will avoid the sometimes prohibitive dependence of existing methodson the presence of multiple captioned photos of all objects of interest. It also paves the way for linking
66

rich textual descriptions in authoritative guides to the corresponding geometric objects.
Acknowledgements
Jonathan Slade is funded by an EPSRC Industrial CASE studentship with Ordnance Survey, GB.
ReferencesZ. Chen, Y. Li, and S. T. Birchfield. 2011. Visual detection of lintel-occluded doors by integrating multiple cues
using data-driven MCMC. Robotics and Autonomous Systems.
M. Fischler and R. R. Bolles. 1987. Random sample consensus: a paradigm for model fitting with applications toimage analysis and automated cartography. In Readings in computer vision: issues, problems, principles, andparadigms,.
C.B. Jones, J.M. Ware, and D.R. Miller. 1999. A probabilistic approach to environmental change detection witharea-class map data. In ISD ’99 International Workshop on Integrated Spatial Databases, Digital Images andGIS, volume 1737 of Lecture Notes in Computer Science, pages 122–136, Berlin. Springer.
P. Kordjamshidi, M. van Otterlo, and M.F. Moens. 2011. Spatial role labeling: Towards extraction of spatialrelations from natural language. ACM Transactions on Speech and Language Processing, 8(3).
I. Mani, C. Doran, D. Harris, et al. 2010. SpatialML: annotation scheme, resources, and evaluation. LanguageResources and Evaluation, 44:263–280.
H. Mayer and S. Reznik. 2005. Building facade interpretation from image sequences. In U Stilla, F Rottensteiner,and S Hinz, editors, International archives of photogrammetry, remote sensing and spatial information sciences,volume XXXVI. Joint workshop of ISPRS and DAGM.
H. Mayer and S. Reznik. 2006. MCMC Linked With Implicit Shape Models and Plane Sweeping for 3D Build-ing Facade Interpretation in Image Sequences. In The International Archives of the Photogrammetry, RemoteSensing and Spatial Information, volume XXXVI. ISPRS Commission III.
K. Mikolajczyk and C. Schmid. 2005. A performance evaluation of local descriptors. IEEE Trans. Pattern Anal.Mach. Intell., 27(10):1615–1630.
L. Ross, J. Bolling, J. Dollner, and B. Kleinschmit. 2009. Enhancing 3d city models with heterogeneous spatialinformation: Towards 3d land information systems. In Lecture Notes in Geoinformation and Cartography,pages 113–133.
B.C. Russell, R. Martin-Brualla, D.J. Butler, S. M. Seitz, and L. Zettlemoyer. 2013. 3d wikipedia: Using onlinetext to automatically label and navigate reconstructed geometry. ACM Transactions on Graphics (SIGGRAPHAsia 2013), 32(6).
A. Samal, S. Sheth, and K. Cueto. 2004. A feature-based approach to conflation of geospatial sources. Interna-tional Journal of Geographical Information Science, 18(5):459–489.
I. Simon and S.M. Seitz. 2008. Scene segmentation using the wisdom of crowds. In European Conference onComputer Vision (ECCV), pages 541–553.
J. Sivic and A. Zisserman. 2003. Video google: A text retrieval approach to object matching in videos. In Int.Conf. Computer Vision, pages 1470–1477.
P.D. Smart, J.A.Quinn, and C.B. Jones. 2011. City model enrichment. ISPRS Journal of Photogrammetry andRemote Sensing, 66(2):223–234.
N. Snavely, S.M. Seitz, and R. Szeliski. 2008. Modeling the world from internet photo collections. Int. J. ofComputer Vision, 80(2):189–210.
V. Walter and D. Fritsch. 1999. Matching spatial data sets: A statistical approach. International Journal ofGeographical Information Science, 13(5):445–473.
C. Zhang, Gao J., Wang O., Georgel P., Yang R., Davis J., Frahm J.M., and Pollefeys M. 2014. Personal pho-tograph enhancement using internet photo collections. IEEE Transactions on Vision and Computer Graphics,20(2):262–75.
67

Proceedings of the 25th International Conference on Computational Linguistics, pages 68–73,Dublin, Ireland, August 23-29 2014.
Weakly supervised construction of a repository of iconic images
Lydia Weiland and Wolfgang Effelsberg and Simone Paolo PonzettoUniversity of Mannheim
Mannheim, Germanylydia,effelsberg,[email protected]
AbstractWe present a first attempt at semi-automatically harvesting a dataset of iconic images, namelyimages that depict objects or scenes, which arouse associations to abstract topics. Our methodstarts with representative topic-evoking images from Wikipedia, which are labeled with relevantconcepts and entities found in their associated captions. These are used to query an online imagerepository (i.e., Flickr), in order to further acquire additional examples of topic-specific iconicrelations. To this end, we leverage a combination of visual similarity measures, image clusteringand matching algorithms to acquire clusters of iconic images that are topically connected to theoriginal seed images, while also allowing for various degrees of diversity. Our first results arepromising in that they indicate the feasibility of the task and that we are able to build a firstversion of our resource with minimal supervision.
1 Introduction
Figurative language and images are a pervasive phenomenon associated with human communication.For instance, images used in news articles (especially on hot and sensitive topics) often make use ofnon-literal visual representations like iconic images, which are aimed at capturing the reader’s attention.For environmental topics, for instance, a windmill in an untouched and bright landscape surrounded bya clear sky is typically associated by humans with environmental friendliness, and accordingly causespositive emotions. In a similar way, images of a polar bear on a drifting ice floe are typically associatedwith the topic of global warming (O’Neill and Smith, 2014).
But while icons represent a pervasive device for visual communication, to date, there exists to the bestof our knowledge no approach aimed at their computational modeling. In order to enable the overarchinggoal of producing such kind of models from real-world data, we focus, in this work, on the preliminarytask of semi-automatically compiling an electronic database of iconic images. These consist, in ourdefinition, of images produced to create privileged associations between a particular visual representationand a referent. Iconic images are highly recognizable for media users and typically induce negative orpositive emotions that have an impact on viewers’ attitudes and actions. In order to model them from acomputational perspective, we initially formulate iconic image acquisition as a clustering task in which,given a set of initial, manually-selected ‘seed’ images – e.g., a photo of a polar bear on a drifting ice floefor the topic of global warming, a smokestack for the topic of pollution, etc. – we use their associatedtextual descriptions in order to collect related images from the Web. We then process these images usingstate-of-the-art image understanding techniques to produce clusters of semantically similar, yet differentimages depicting the same topic in an iconic way.
The acquisition of a database of iconic images represents the first step towards a full-fledged model tocomputationally capture the phenomenon of iconic images in context. Our long-term vision is to coverall three aspects of content (what makes an image iconic?), usage (in which context are iconic imagesused?), and effects (which negative/positive emotions do iconic images evoke on viewers?) of iconicimages. To make this challenging problem feasible, we opt in this preliminary step for an approach thatviews the task of understanding iconic images as the ability to build a dataset for further research.This work is licenced under a Creative Commons Attribution 4.0 International License. Page numbers and proceedings footerare added by the organizers. License details: http://creativecommons.org/licenses/by/4.0/
68

Figure 1: Our framework for the semi-automatic acquisition of iconic images from the Web.
2 Method
Our method for the semi-automatic acquisition of iconic images consists of five phases (Figure 1):
Seed selection. In the first phase of our approach we provide our pipeline with human-selected exam-ples of iconic images that help us bootstrap the image harvesting process. To this end, we initially focuson a wide range of twelve different abstract topics that can be typically represented using iconic images(Table 1). Selecting initial examples describing a visual iconic representation of a topic can be a dauntingtask, due to their volatile and topic-dependent nature. In this work, we explore the use of Web encyclo-pedic resources in order to collect our initial examples. We start with the encyclopedic entries fromNational Geographic Education1, an on-line resource in which human expert editors make explicit useof prototypical images to visually represent encyclopedic entries like “agriculture”, “climate change”,etc.. For instance, the encyclopedic entry for “air pollution” contains images of smokestacks, coolingtowers release steam, and so on (cf. Table 1). We use these (proprietary) images to provide us withhuman-validated examples of iconic images, and use these to identify (freely available) similar imageswithin Wikipedia pages based on a Google image search restricted to Wikipedia – e.g., by searching forsmokestack site:wikipedia.org. We then use Wikipedia to create an initial dataset of iconicvisuals associated with the textual descriptions found in their captions.
Text-based image search. In the next step, we make use of a query-by-text approach in order to collectadditional data and enlarge our dataset with additional images depicting iconic relations. To this end, westart by collecting the entities annotated within the image captions (e.g., “Cumberland Power Plant atCumberland City”), and manually determine their relevance to the associated topic (e.g., smokestacksand air pollution). This is because, to build a good query, we need to provide the search systems witha good lexicalization (i.e., keywords) of the underlying information need (i.e., the topic). Consequently,we extract entities from each caption of our initial set of images and use these to query additional data.For each seed, we generate a query by concatenating the entity labels in the captions and send it toFlickr2. We then filter the data by retaining only photos with title, description, and tags where both, tagsand description (caption and title) contain the query words. This method provides us with around 4000additional images and text pairs.
Image clustering. Text-based image search results can introduce noise in the dataset, e.g., cases of‘semantic mismatch’ where the caption and tags do not appropriately describe the scene found in theimage. In this work, we explore the application of image clustering techniques to cope with this issue.For each topic we start with a set of instances made up of the seed images and the crawled one, andgroup them into clusters based on image similarity measures. Clusters are built by calculating the linearcorrelation – i.e., which we take as a proxy for a similarity measure – from the HSV-histograms of eachimage, and applying the K-Means algorithm. Clustering on the basis of HSV-histograms does not takeinto account the semantic content of images, since images with different meanings can still have thesame HSV-histogram. Nevertheless, this approach makes it possible to spot those outliers in the imagesets that do not relate well to the other images retrieved with the same query.
Image filtering. The next processing step focuses instead on rule-driven filtering to improve the initialclustering-based filtering. We first apply a face detection and HoG (histogram of gradients) descriptor for
1http://education.nationalgeographic.com2http://flickr.com
69

Topic Themes of seed imagesAdaption hummingbird, king snake, koalaAgriculture cattle, ploughing, rice terraces, tropical fruitsAir balloon, sky viewAir Pollution smokestack, Three Mile Island, wildfireBiodiversity Amazonas, blue starfish, cornflowers, fungi, Hopetoun FallsCapital Capitol Hill, Praca Dos Tres, Washington MonumentClimate Mykonos (mild climate), Sonoran Desert, tea plantation (cool climate)Climate Change polar bear, volcano, dry lakeClimate Refugee climate refugees from Indonesia, Haiti, Pakistan, etc.Ecosystem bison, flooded forest, Flynn Reef, harp seal, rainforest, thorn treeGlobal Warming deforestation, flooding, smokestackGreenhouse Effect smokestack, steam engine train (smoke emissions)
Table 1: Overview of our covered topics and the themes associated with their seed images.
detecting people (Viola and Jones, 2001; Dalal and Triggs, 2005)3. Next, we filter our data as follows.If faces or people are recognized in the picture, and the caption is judged to be related to entities of typeperson (e.g., farmers iconically depicting the topic of agriculture), the instance is retained in the dataset.On the other hand, if faces and/or people are recognized, but the caption is not related to entities of typeperson (e.g., a blue linckia, which is a physical object), we filter out the image from the dataset.
Image matching. The filtered clusters we built so far are still problematic in that they do not accountfor diversity – i.e., we do not want as the outcome of our method to end up with clusters made up only ofvarious pictures of the very same object (e.g., the cooling towers of the Three Mile Island power complexfor the topic of air pollution, possibly seen from different perspectives, times of the day, etc.). That is,in our scenario we would like to promote heterogeneous clusters which still retain a high-level semanticmatch with the initial seeds (e.g., smokestacks or cooling towers belonging to different plants). To thisend, we explore in this work an approach that leverages different image matching methods together atthe same time to automatically capture these visual semantic matches.
Initially, for each cluster we select the image that minimizes the sum over all squared distances fromthe other images in the cluster. That is, given a cluster C = c1 . . . cn, we collect the image c =arg minci∈C
∑cj∈C−ci(ci − cj)2. We call this the prototype of the cluster. Several image processing
methods are then used to compare the prototype of each cluster with the original seed images, with theaim to detect high-level content similarity (i.e., distinct, yet similar objects such as the smokestacks ofdifferent plants, etc.) and account for diversity with respect to our initial seeds. The first method is atemplate matching approach, based on minimum and maximum values of gray levels, which, togetherwith their location are used to detect similar textures. The matching method is based on a correlationcoefficient matching (Brunelli, 2009). In parallel, we explore an alternative approach where images andprototypes are compared using SIFT-based features (Lowe, 2004). Finally, we apply a contour matchingmethod: we use a manually chosen threshold of the largest 10% of contours of an image to reduce thenoise from non-characteristic contours like dots, points or other smaller structures. The matching ofcontours is based on rotation invariant moments (Hu, 1962). When a good match is found, boundingboxes are drawn around the contours.
The three methods provide evidence for potential matches between regions of each input prototype andseed pair. Information from each single method is then combined by intersecting their respective outputs:i) the patch, where the template matching is found is compared against the coordinates where relevantSIFT features are detected (SIFT-Template); ii) the template matching patch is tested for intersection withthe bounding boxes of the matched contours (Template-Contour); iii) the bounding boxes of the contours
3We focus on face and people detection since these are both well studied areas in computer vision for which a wide rangeof state-of-the-art methods exist.
70
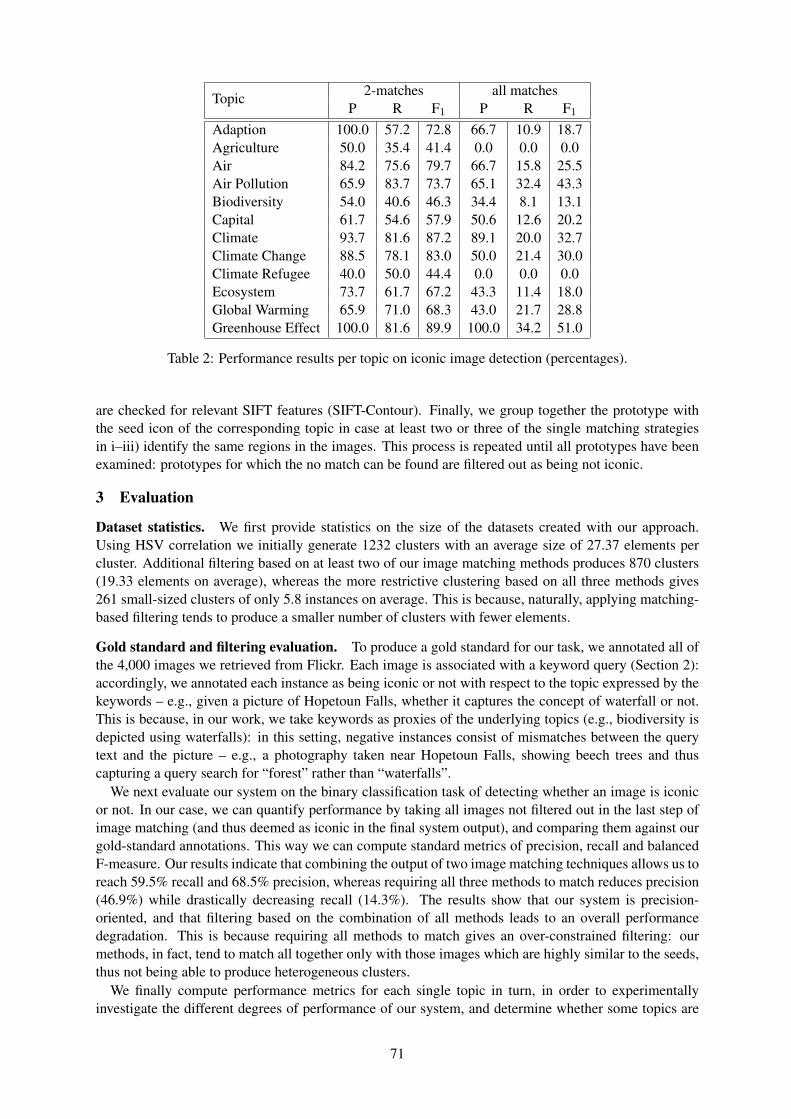
2-matches all matchesTopicP R F1 P R F1
Adaption 100.0 57.2 72.8 66.7 10.9 18.7Agriculture 50.0 35.4 41.4 0.0 0.0 0.0Air 84.2 75.6 79.7 66.7 15.8 25.5Air Pollution 65.9 83.7 73.7 65.1 32.4 43.3Biodiversity 54.0 40.6 46.3 34.4 8.1 13.1Capital 61.7 54.6 57.9 50.6 12.6 20.2Climate 93.7 81.6 87.2 89.1 20.0 32.7Climate Change 88.5 78.1 83.0 50.0 21.4 30.0Climate Refugee 40.0 50.0 44.4 0.0 0.0 0.0Ecosystem 73.7 61.7 67.2 43.3 11.4 18.0Global Warming 65.9 71.0 68.3 43.0 21.7 28.8Greenhouse Effect 100.0 81.6 89.9 100.0 34.2 51.0
Table 2: Performance results per topic on iconic image detection (percentages).
are checked for relevant SIFT features (SIFT-Contour). Finally, we group together the prototype withthe seed icon of the corresponding topic in case at least two or three of the single matching strategiesin i–iii) identify the same regions in the images. This process is repeated until all prototypes have beenexamined: prototypes for which the no match can be found are filtered out as being not iconic.
3 Evaluation
Dataset statistics. We first provide statistics on the size of the datasets created with our approach.Using HSV correlation we initially generate 1232 clusters with an average size of 27.37 elements percluster. Additional filtering based on at least two of our image matching methods produces 870 clusters(19.33 elements on average), whereas the more restrictive clustering based on all three methods gives261 small-sized clusters of only 5.8 instances on average. This is because, naturally, applying matching-based filtering tends to produce a smaller number of clusters with fewer elements.
Gold standard and filtering evaluation. To produce a gold standard for our task, we annotated all ofthe 4,000 images we retrieved from Flickr. Each image is associated with a keyword query (Section 2):accordingly, we annotated each instance as being iconic or not with respect to the topic expressed by thekeywords – e.g., given a picture of Hopetoun Falls, whether it captures the concept of waterfall or not.This is because, in our work, we take keywords as proxies of the underlying topics (e.g., biodiversity isdepicted using waterfalls): in this setting, negative instances consist of mismatches between the querytext and the picture – e.g., a photography taken near Hopetoun Falls, showing beech trees and thuscapturing a query search for “forest” rather than “waterfalls”.
We next evaluate our system on the binary classification task of detecting whether an image is iconicor not. In our case, we can quantify performance by taking all images not filtered out in the last step ofimage matching (and thus deemed as iconic in the final system output), and comparing them against ourgold-standard annotations. This way we can compute standard metrics of precision, recall and balancedF-measure. Our results indicate that combining the output of two image matching techniques allows us toreach 59.5% recall and 68.5% precision, whereas requiring all three methods to match reduces precision(46.9%) while drastically decreasing recall (14.3%). The results show that our system is precision-oriented, and that filtering based on the combination of all methods leads to an overall performancedegradation. This is because requiring all methods to match gives an over-constrained filtering: ourmethods, in fact, tend to match all together only with those images which are highly similar to the seeds,thus not being able to produce heterogeneous clusters.
We finally compute performance metrics for each single topic in turn, in order to experimentallyinvestigate the different degrees of performance of our system, and determine whether some topics are
71

more difficult than others (Table 2). Our results indicate that some topics are indeed more difficult thanothers – e.g., our system exhibits perfect precision on “adaptation” and “greenhouse effect” vs. muchpoorer one on “biodiversity” or “climate refugee”. This is because some topics are bootstrapped fromless heterogeneous, and hence ‘easier’, sets of seed images (e.g., all smokestacks, as in “greenhouseeffect”, are very similar to each other). In general, this seems to point out that one of the key challengesin our scenario is to produce highly precise clusters, while allowing for image diversity as a trade-off.
Error analysis. We finally looked at the output of our system, in order to better understand its per-formance, as well as problems and future challenges. Examples of a few sample clusters are shown inFigure 2. These clusters show that, thanks to our method, we are able to collect quite diverse, yet iconicimages retaining a topical affinity with the original seeds – e.g., the poster on fighting deforestation orthe drawing used to depict air pollution. Due to the noise of our base image processing components, how-ever, we also suffer from wrong matches such as the picture of a mobile phone for the topic of wildfire,where the meaning of a rapidly spreading conflagration is related to air pollution, whereas the mobilephone is not. Based on a random sample of 10% of the output clusters, we manually identified the mainsources of errors as related to: i) false image matching due to problems with contour detection; ii) SIFTperforming best for detecting different images of the same objects, but exhibiting lower performance onthe more complex task of detecting similar objects; iii) we applied our image matching methods usingdefault parameters and thresholds: further improvements could be obtained by in-domain tuning.
4 Conclusions
In this work, we presented some initial steps in developing a methodology to computationally modelthe challenging phenomenon of iconic images. More specifically, we focused on the task of building arepository of iconic images in a minimally supervised way by bootstrapping based on images found onWeb encyclopedic resources.
As future work, we plan to better combine heterogeneous information from text and images, as wellas use deeper representations for both information sources – cf. joint semantic representations such asspecific LDA-based topic models and bags of visual (SIFT) features (Rasiwasia et al., 2010; Feng andLapata, 2010). This, in turn, can be applied to a variety of different tasks such as the automatic se-mantification of captions, query generation and expansion. On the computer vision side, we are insteadparticularly interested in exploring region-growing algorithms to detect textured or homogeneous re-gions, and to allow for a segmentation of textured regions without contours, e.g., a cloudy sky or a viewof a forest landscape.
Downloads The dataset presented in this paper is freely available for research purposes at https://madata.bib.uni-mannheim.de/87/.
ReferencesRoberto Brunelli. 2009. Template Matching Techniques in Computer Vision: Theory and Practice. Wiley Pub-
lishing.Navneet Dalal and Bill Triggs. 2005. Histograms of oriented gradients for human detection. In Proc. of CVPR,
pages 886–893.Yansong Feng and Mirella Lapata. 2010. Topic models for image annotation and text illustration. In Proc. of HLT
’10, pages 831–839.Ming-Kuei Hu. 1962. Visual pattern recognition by moment invariants. IRE Transactions on Information Theory,
8(2):179–187.David G. Lowe. 2004. Distinctive image features from scale-invariant keypoints. International Journal of Com-
puter Vision, 60(2):91–110.S. O’Neill and Nicholas Smith. 2014. Climate change and visual imagery. Wiley Interdisciplinary Reviews:
Climate Change, 5(1):73–87.Nikhil Rasiwasia, Jose Costa Pereira, Emanuele Coviello, Gabriel Doyle, Gert R.G. Lanckriet, Roger Levy, and
Nuno Vasconcelos. 2010. A new approach to cross-modal multimedia retrieval. In Proc. of MM ’10, pages251–260.
Paul Viola and Michael Jones. 2001. Rapid object detection using a boosted cascade of simple features. In Proc.of CVPR, pages 511–518.
72

Figure 2: Sample iconic image clusters. Above a poor cluster on wildfire, below two good clusters onpollution and deforestation.
73

Proceedings of the 25th International Conference on Computational Linguistics, pages 74–81,Dublin, Ireland, August 23-29 2014.
Cross-media Cross-genre Information Ranking Multi-media InformationNetworks
Tongtao ZhangRensselaer Polytechnic Institute
Haibo LiNuance
Hongzhao HuangR.P.I.
Heng JiR.P.I.
Min-Hsuan Tsai
Shen-Fu TsaiUniversity of Illinois at Urbana-Champaign
Thomas Huang
Abstract
Current web technology has brought us a scenario that information about a certain topic is widely dis-persed in data from different domains and data modalities, such as texts and images from news and socialmedia. Automatic extraction of the most informative and important multimedia summary (e.g. a rankedlist of inter-connected texts and images) from massive amounts of cross-media and cross-genre data cansignificantly save users’ time and effort that is consumed in browsing. In this paper, we propose a novelmethod to address this new task based on automatically constructed Multi-media Information Networks(MiNets) by incorporating cross-genre knowledge and inferring implicit similarity across texts and im-ages. The facts from MiNets are exploited in a novel random walk-based algorithm to iteratively propagateranking scores across multiple data modalities. Experimental results demonstrated the effectiveness of ourMiNets-based approach and the power of cross-media cross-genre inference.
1 IntroductionRecent development on web technology – especially on fast connection and large-scale storage systems – hasenabled social and news media to fulfill their jobs more efficiently in time and depth. However, such developmentalso raises some problems such as overwhelming social media information and distracting news media contents.In emergent scenarios such as facing an incoming disaster (e.g., Hurricane Irene in 2011 or Sandy in 2012), tweetsand news are often repeatedly spread and forwarded in certain circles and contents are often overlapped by eachother. However, browsing these messages and pages is almost unpleasant and inefficient. Therefore, an automaticsummarization on piles of tweets and news is always necessary and welcomed, among which ranking is the mostintuitive way to inform the users about the most informative content.
A passive solution is prompting the users to add more key words when typing the search query as most searchengines do. However, without prior knowledge or due to the word limit, it is never trivial for the users to establisha satisfied ranking list for topics which attract more public attention. Recent changes on some Google Search haveintegrated image search and adopted some heterogenous content analysis, nevertheless, the connection betweenimage and the keywords are still arbitrarily determined by the users, thus it is still far from optimal.
Active solutions which attempt to summarize information only focused on single data modalities. For example,Zanzotto et al. (2011) provided a comprehensive comparison about summarization methods for tweets. Zhao et al.(2011) developed a context-sensitive topical PageRank (Brin and Page, 1998) method to extract topical key phrasefrom Twitter as a way to summarize twitter content. As a new prospective, Feng and Lapata (2010) used LDA toannotate images, but this does not firmly integrate the information across different data types. Huang et al. (2012)presented a tweet ranking approach but only focused on single data modality (i.e., text).
Other conventional solutions towards analyzing the relationship or links between the instances have long beenproposed and applied, such as PageRank (Brin and Page, 1998)and VisualRank (Jing and Baluja, 2008). Theformer is excessively used in heterogeneous networks (i.e., webpages and resources) but they are mainly based onlinkage itself. VisualRank, which is based on PageRank, is a content-based linkage method but is confined withhomogeneous networks.
Above all, our goal is to integrate cross-media inference and create the linkage among the information extractedfrom those heterogenous data. Our novel Multi-media Information Networks (MiNets) representation initializesour idea about a basic ontology of the ranking system.
The main contribution of this work is to fill in the domain gaps across different network genres and bridge themin a principled method. In this work, we manage to discover the hidden links or structures between the heteroge-neous networks in different genres. We combine joint inference to resolve information conflicts across multi-genre
This work is licenced under a Creative Commons Attribution 4.0 International License. Page numbers and proceedings footerare added by the organizers. License details: http://creativecommons.org/licenses/by/4.0/
74

networks. We can also effectively measure, share and transfer complementary information and knowledge acrossmulti-genre networks using structured correspondence.
The work is presented in sections as follows. We firstly introduce an overview of our system in Section 2.Detailed approaches in information extraction and constructing meta-information network are then followed inSection 3. Measurement across the multimedia information are proposed in Section 4 and 5. In Section 6 wedemonstrate the results and performance gain.
2 Approach OverviewWithin the context of an event where users generate a vast amount of multi-media messages in forms of tweets andimages, we aim to provide a ranked subset of the most informative ones. Given a set of tweets T = t1, ..., tn,and a set of images P = p1, ..., pm as input, our approach provides ordered lists of the most informative tweetsor images (a.k.a objects) so that the informativeness of an object in position i is higher than or equal to that of anobject in position i + 1. We consider the degree of informativeness of a certain object as the extent to which itprovides valuable information to people who are involved in or tracking the event in question.
During emergent events, there are tight correlations between social media and web documents. Important infor-mation shared in social media tends to be posted in web documents. Therefore we also integrate information in aformal genre such as web documents to enhance the ranking quality of tweets and images. It consists of two mainsub-tasks:
• Multimedia Information Network (MiNet) Construction:Construct MiNet from cross-media and cross-genre information (i.e. tweets, images, sentences of web doc-uments). Given a set of tweets and images on a specific topic as input, the formal genre web documents andimages from the embedded URLs in those tweets are retrieved. Afterwards, a set of sentences and images areextracted from the web documents. Then we exploit advanced text Information Extraction and image ConceptExtraction techniques to extract meta-information and construct the meta-information network. Together withthree sets of heterogeneous input data, MiNet is constructed.
• MiNet-Based Information Ranking: Rank the tweets and images. By extending and adapting Tri-HITS (Huang et al., 2012), we propose EN-Tri-HITs, an random walk-based propagation algorithm whichiteratively propagate ranking scores for sentences, tweets, and images across MiNet to refine the tweet andimage rankings.
3 Meta-information NetworkWhen integrating information from different data modalities, meta-information network plays a pivotal role forrepresenting interesting concepts and relations between them. We automatically construct the initial informa-tion networks using our state-of-the-art information extraction and image concept extraction techniques. A meta-information network is a heterogeneous network including a set of “information graphs” which is formally definedas: G = Gi : Gi = (Vi, Ei), where Vi is the collection of concept nodes, and Ei is the collection of edgeslinking one concept to the other. An example is depicted in Figure 1. The meta-information network containshuman knowledge pertaining to the target domain that could improve the performance of text process and imageanalysis. In this paper, we first construct meta-information networks separately from texts and images, and thenfuse and enrich them through effective cross-media linking methods.
3.1 Information Extraction from TextsExtracting salient types of facts for a meta-information network is challenging. In this paper we tackle this problemfrom two angles to balance the trade-off between quality and granularity/annotation cost. On one hand, to revealdeep semantics in meta-information network, we focus on achieving high-quality extraction for pre-defined fine-grained types such as those in NIST Automatic Content Extraction (ACE) 1. For example, a “Person/Individual”node may include attributes such as “Birth-Place”, and a “Organization/Employee” node may include attributessuch as “City-of-Headquarter”. These two nodes may be connected via a “Employment/End-Position” link.
We apply an Information Extraction (IE) system (Li et al., 2013) to extract entities, relations and events definedin ACE2005. There are 7 types of entities, 18 types of relations and 33 types of events. This system is basedon a joint framework using structured perceptron with efficient beam-search and incorporating diverse lexical,syntactic, semantic and ontological features. We convert the IE output into the graph structured representation ofmeta-information network by mapping each entity as a node, and link entity nodes by semantic relations or eventsthey are involved. For example, the relations between entities are naturally mapped to links in the meta-informationnetwork, such as the “employment” relation between “Bill Read” and “Hurricane Center”. In addition, if an event
1http://www.itl.nist.gov/iad/894.01/tests/ace/
75

flood
Multimedia information Networks
Meta-information Networks
ORG
flooding from Irene
killedone
personPuerto
RicoBill Read
Hurricane Center
said
Employment
Speaker
Agent Subject
Clause Subject
Place
Agent Victim
storm
Wikipedia
Verifiedby wiki
Verifiedby wiki
Verifiedby wiki
Verified Entity Concepts
TweetsSentences of
web documents Images
ContentsStructured information
PER GPEEvent TriggerPredicate Predicate Noun phrase Noun phrase
Example:
SRL
IE concept
type
Conceptfrom image
Concept from image
Figure 1: An example of meta-information network. Sentence: “Bill Read, Hurricane Center director, said thatflooding from Irene killed at least one person in Puerto Rico”
argument is an entity, we also add an “Event Argument” link between the event trigger and the entity, such as thelink between “Irene” and “killed”.
On the other hand, in order to enrich the meta-information network, we extract more coarse-grained salientfact types based on Semantic Role Labeling (SRL) (Pradhan et al., 2008). For example, given the sentence “InNorth Carolina, 10 counties are being evacuated.”, the “evacuation” event is not included in ACE. However, theSRL system can successfully detect the predicate (“evacuated”) and its semantic roles (“10 counties” and “NorthCarolina”). These argument heads and predicates are added into the meta-information network as vertices, andedges are added between each predicate-argument pairs.
We merge entity mentions across tweets and web documents based on a cross-document entity clustering systemdescribed in (Chen and Ji, 2011). Moreover, for the same type of nodes from the SRL system, we also merge themby string matching across documents.
3.2 Concept Extraction from Images
We also developed a concept modeling approach by extending the similar framework in previous work (Tsai et al.,2012), Probabilistic Logical Tree (PLT), to extract semantic concepts from images. PLT integrates the logical andstatistical inferences in a unifying framework where the existing primitive concepts are connected into a potentiallyunlimited vocabulary of high-level concepts by basic logical operations. In contrast, most existing image conceptextraction algorithms either only learn a flat correlative concept structure, or a simple hierarchical structure withoutlogical connections.
With an efficient statistical learning algorithm, the complex concepts in upper level of PLT are modeled uponsome logically connected primitive concepts. This statistical learning approach is very flexible, where each conceptin PLT can be modeled from distinctive feature spaces with the most suitable feature descriptors (e.g., visualfeatures such as color and shape for scenery concepts).
For our case study on “Hurricane Irene” scenario, we apply this algorithm to extract the hierarchical concepttrees with roots “flood” or “storm” from all the images in web documents whose URLs are contained in tweets.
The main problem is the classifications of the concepts such that it may be properly be placed onto an ontology.In order to enrich the hierarchy, we seek to classify these linkages through the use of the semi-structured andstructured data that exists on Wikipedia. We use pattern matching to extract is-a relations from the first paragraphsof Wikipedia articles. For example, starting from our initial concept ”Hurricane Irene”, we can find its is-a relationwith ”Tropical Cyclone”, and then climb up one more level to ”Storm” where we can further mine lower conceptssuch as ”Tornado” and ”Snow Storm”.
76

4 Multi-media Information NetworksA Multimedia Information Network (MINet) is a structured collection made up of a set of multimedia documents(e.g., texts and images) and links between these documents. Each link corresponds to a specific relationshipbetween nodes, such as hyperlinks between web documents or similarity links between tweets. In this paper, weconstruct our MINet based on two forms of contents from different domains: tweets, web documents (plain texts)and images.
4.1 Within-media Linking4.1.1 Text-Text SimilarityTaking web document for example, we construct the meta-information network G = Gi : Gi = (Vi, Ei) for allweb documents D, in which each web document di ∈ D corresponds to Gi. Given the meta-information networkG, we compute the weight of each vertex vj ∈ Vi as weightvj = nf(vj ,d)
AV E(D) ,where nf(vj , d) is the mention number of node vj appearing in a document d and AV E(D) is the average
number of mentions in a document d, which is defined as AV E(D) =∑d∈D concept mentions in d
|D| .
Similarly, we define the weight of each link ek ∈ Ei as weightek = nf(ek,d)AV E(D) , where nf(ek, d) is the mention
number of the node ek in a document d and AV E(D) is the average number of mentions in a document d, whichis defined as AV E(D) =
∑d∈D relation mentions in d
|D| .If two edges share the same type and link nodes corresponding to the same tokens, we consider them as two
mentions involved in a relation. Based on the weight of each concept mention and relation mention, we count theirfrequencies and transform them into vectors. Finally, we compute cosine similarity between every two vectors.
4.1.2 Image-Image SimilarityWe extract Histogram of Oriented Gradients (HOG) features (Dalal and Triggs, 2005) from patches in images andapply Hierarchical Gaussianization (Zhou et al., 2009) to those HOG feature vectors. We learn a Gaussian mixturemodel (GMM) to obtain the statistics of the patches of an image by adapting the distribution of the extracted HOGfeatures from these image patches and each image is represented by a super-vector. Based on the obtained imagerepresentation, the image-image similarity is simply a cosine similarity between two HG super-vectors.
4.2 Cross-media LinkingIn order to obtain cross-media similarity, we propose a method based on transfer learning technique (Qi et al.,2012). Given a set of m points [p1, p2, . . . , pm] in the source (image) domain P , a set of n points [t1, t2, . . . , tn]in the target (text) domain T , and a set of N corresponding pairs C = (pai , tbiNi=1 in these two domains, we aimto find a cross-media similarity function:
G(p, t) = `((Up)T (V t)) = `(pTSt)), (1)
where U and V are the linear embedding of P and T , respectively. S = UTV is the cross-domain similaritymatrix and `(θ) = 1
1+e−θ is the logistic sigmoid function.The key to S in Equation 1 is to solve the optimization problem blow:
minSLs(S) + λLd(S) + γΩ(S), (2)
where Ls(S) =∑
(x,y)∈C log(1 + exp(−pTSt)), and Ω(S) = ‖S‖∗ is the nuclear norm that is the surrogate ofthe matrix rank. Also, we have
Ld(S) =12
∑KP(p, p′)dT (p, p′) +
12
∑KT (t, t′)dP(t, t′),
where K(·, ·) is the similarity matrix among the points in a single domain and d(·, ·) defines the distance betweentwo points due to the transfer.
Taking one step further, we have
Ld(S) = tr(LTQT (S)TKPQP(S)) + tr(LXQP(S)TKTQT (S)),
where LP and LT are the Laplacian matrices for KP and KT , respectively.To solve the optimization problem (2) with nuclear norm regularization we follow the proximal gradient method
(Toh and Yun, 2010) with the following gradients:
5Ls(S) = P (JC H)PT ,5Ld(S) = P ((KPQPLT + LPQTKT ) H)PT (3)
77

JC is an m × n matrix with its (i, j)-th entry 1 if (pi, tj) ∈ C, otherwise 0. H is also an m × n matrix whose(i, j)-th entry where Hij = `′(pT
i Stj).Hence we have
5L(S) = P (G H)TT , (4)
where G = JC + λKPQPLT + λLPQTKT . With the gradient in (4), one can solve the problem (2) using theproximal gradient method.
5 MiNet-Based Information Ranking: EN-Tri-HITs5.1 Initializing Ranking Scores
1 Input: A set of tweets (T ), and images (P ) and web documents (W ) on a given topic.2 Output: Ranking scores (St) for T and (Sp) for P .
1: Use TextRank to compute initial ranking scores S0p for P ,
S0t for T and S0
w for W ;2: Construct multimedia information networks across P , T
and W ;3: k ← 0, diff ← 10e6;4: while k < MaxIteration and diff > MinThreshold do5: Use Eq. (5) (6) and (7) to compute Sk+1
p , Sk+1t and Sk+1
w ;6: Normalize Sk+1
p , Sk+1t and Sk+1
w ;7: diff ← max(
∑(|Sk+1
t − Skt |),
∑(|Sk+1
p − Skp |));
8: k ← k + 19: end while
Algorithm 1: EN-Tri-HITS: Random walk on multimedia information networks
Graph-based ranking algorithms have been widely used to analyze relations between vertices in graphs. Inthis paper, we adapted PageRank (Brin and Page, 1998; Mihalcea and Tarau, 2004; Jing and Baluja, 2008) tocompute initial ranking scores in tweet-only and image-only networks where edges between tweets or images aredetermined by their cosine similarity.
The ranking score is computed as follows:
S(Vi) = (1− d) + d ∗∑
Vj∈In(Vi)
wji∑Vk∈Out(Vj)
wjk
S(Vj),
where Vi is a vertex with S(Vi) as its ranking score; In(Vi) and Out(Vi) are the incoming edge set and outgoingedge set of Vi, respectively; wij is the weight for the edge between two vertices Vi and Vj . An edge links twovertices that represent text units when their cosine similarity of shared content exceeds or equals to a predefinedthreshold δt.
5.2 Random Walk on Multimedia Information NetworksWe introduce a novel algorithm to incorporate both initial ranking scores and global evidence from multimediainformation networks. It propagates ranking scores across MiNets iteratively. Our algorithm is a natural extensionof Tri-HITS (Huang et al., 2012) based on the mutual reinforcement to boost linked objects.
By extending Tri-HITS, we develop enhanced Tri-HITS (EN-Tri-HITs) to handle multimedia information net-works with three types of objects: Tweets (T ), sentences of web documents (W ) and images (P ). EN-Tri-HITsis able to handle more complicated network structure with more links. Given the similarity matrices M tw (be-tween tweets and sentences of web documents), Mwp (between sentences of web documents and images) andM tp
(between tweets and images), and initial ranking scores of S0(p), S0(t) and S0(w), we aim to refine the initialranking scores and obtain the final ranking scores S(w), S(t) and S(p). Starting from images S(p), the updateprocess considers both the initial score S0(p) and the propagation from connected tweets S(t) and web documentsS(w), which can be expressed as:
Sw(pj) =∑i∈W
mwpij S(wi), St(pj) =
∑k∈T
mtpkjS(tk),
S(pj) = (1− λwp − λtp)S0(pj) + λwpSw(pj)∑j Sw(pj)
+ λtpSt(pj)∑j St(pj)
, (5)
78

Set ID Tweets Web Doc Images(Sentences)1 1171 41(1272) 1832 1116 47(1634) 2653 1184 69(1639) 346
All 3471 157(4545) 794
Table 1: Data Statistics: Numbers of each item inthe dataset.
word word word word+IE +SRL +IE+SRL
I+W 0.545 0.539 0.521 0.583I+T 0.422 0.436 0.407 0.489
I+W+T 0.526 0.513 0.492 0.541
Table 2: NDCG@5 of Images. The image rankingbaseline performance is 0.421. I stands for Image;W Web Documents; T Tweets
where λwp, λtp ∈ [0, 1] (λwp + λtp ≤ 1) are the parameters to balance between initial and propagated rankingscores. Similar to Tri-HITS, EN-Tri-HITS normalizes the propagated ranking scores Sw(pi) and St(pi).
Similarly, we define the propagations from images and web documents to tweets as follows:
Sp(tk) =∑i∈P
mptikS(pi), Sw(tk) =
∑j∈W
mwtjkS(wj),
S(tk) = (1− λwt − λpt)S0(tk) + λwtSp(tk)∑k Sp(tk)
+ λptSw(tk)∑k Sw(tk)
, (6)
where Mpt is the transpose of M tp, λpt and λwt are parameters to balance between initial and propagated rankingscores.
Each sentence of web documents S(wj) may be influenced by the propagation from both tweets and images:
St(wi) =∑k∈T
mtwki S(tk), Sp(wi) =
∑i∈P
mpwji S(pj),
S(wi) = (1− λtw − λpw)S0(wi) + λtwSt(wi)∑i St(wi)
+ λpwSp(wi)∑i Sp(wi)
, (7)
where Mpw is the transpose of Mwp, λtw and λpw are parameters to balance between initial and propagatedranking scores.
Algorithm 1 summarizes En-Tri-HITS.
6 Experiments6.1 Data and Scoring MetricCurrently there are no information ranking related benchmark data sets publicly available, therefore we build ourown data set and network ontology.
We crawled 3471 tweets during a three-hour period and extracted key phrases from these tweets, then we usethe key phrases as image search queries. The image search queries are submitted to Bing Image Search API andwe take the top 10 images for each query. We extract a 512-d GIST feature from each image for meta informationtraining. For image similarity metrics, we resize images to a maximum of 240 × 240 and segmented into patcheswith three different sizes (16, 25 and 31) by a 6-pixel step size. A 128-d Histogram of Oriented Gradients (HOG)feature is extracted from each patch and followed by a PCA dimension reduction to 80-d. The size of dimensionof the final feature vector for each image is 42,496.
We create the ground truth based on human assessment of informativeness on a 5-star likert scale, with grade 5as the most informative and 1 as the least informative. Table 1 presents an overview on our data sets. We conduct3-fold cross-validation for our experiments.
To evaluate tweet ranking, we use nDCG as our evaluation metric (Jarvelin and Kekalainen, 2002), whichconsiders both the informativeness and the position of a tweet:
nDCG(Φ, k) =1|Φ|
|Φ|∑i=1
DCGik
IDCGik, DCGik =
k∑j=1
2relij − 1log(1 + j)
,
where Φ is the set of documents in the test set, with each document corresponding to an hour of tweets in our case,relij is the human-annotated label for the tweet j in the document i, and IDCGik is the DCG score of the idealranking. The average nDCG score for the top k tweets is: Avg@k =
∑ki=1 nDCG(Φ, i)/k. To favor diversity of
top ranked tweets, redundant tweets are penalized to lower down the final score.
79

6.2 Impact of Cross-media Inference
Table 2 and Figure 2 present the image ranking results. The results indicate that methods integrating heterogeneousnetworks outperform the baseline of image ranking (0.421). When web documents are aligned with images (row1), the ranking quality improves significantly, proving that web documents can help detect informative images byadding support from text media of formal genre. However, the text media of informal genre, such as tweets, almostcannot help improve the ranking performance.
1 2 3 4 5 6 7 8 9 1 00 . 20 . 30 . 40 . 50 . 60 . 70 . 80 . 91 . 0
NDCG
@N
N
I m a g e + T w e e t + W e b D o c + W e b D o c & T w e e t
Figure 2: NDCG@n score of Images with Various n
word word word word+IE +SRL +IE+SRL
T 0.675 0.691 0.697 0.700T+W 0.766 0.771 0.757 0.809T+I 0.675 0.691 0.667 0.700
T+W+I 0.722 0.771 0.757 0.809
Table 3: NDCG@5 of Tweets
6.3 Impact of Cross-genre Inference
Methods that integrate heterogeneous networks after filtering, outperform the baseline TextRank, as shown inTable 3. When tweets are aligned with web documents, the ranking quality improves significantly, proving thatweb documents can help infer informative tweets by adding support from a formal genre. The fact that tweets withlow initial ranking scores are aligned with web documents helps promote their ranking positions. For example,the ranking of the tweet “Hurricane Irene: City by City Forecasts http://t.co/x1t122A” is improved compared toTextRank, benefitting from the fact that 10 retrieved web documents are about this topic.
6.4 Remaining Error Analysis
Enhanced Tri-HITS shows encouraging improvements in ranking quality with respect to a state-of-the-art modelsuch as TextRank. However, there are still some issues to be addressed for further improvements.
(i) Long tweets preferred. We tracked tweets containing the keywords “Hurricane” and “Irene”. Using such aquery might also return tweets that are not related to the event being followed. This may occur either becausethe terms are ambiguous, or because of spam being injected into trending conversations to make it visible. Forexample, the tweet “Hurricane Kitty: http://t.co/cdIexE3” is an advertisement, which is not topically related toIrene.
(ii) Deep semantic analysis of the content, especially for images. We rely on distinct terms to refer to thesame concept. More extensive semantic analyses of text can help identify those terms, possibly enhancing thepropagation process. For example, we can explore existing text dictionaries such as WordNet (Miller, 1995) tomine synonym/hypernym/hyponym relations, and Brown clusters (Brown et al., 1992) to mine other types ofrelations in order to enrich the concepts extracted from images.
7 Conclusion and Future Work
In this paper, we propose a comprehensive information ranking approach which facilitates measurement on cross-media/cross-genre informativeness based on a novel multi-media information network representation MiNet. Weestablish links via information extraction method from text and images and verification with Wikipedia. In ad-dition, we propose similarity measurement on intra-media and cross-media using transfer learning techniques.We also introduce a novel En-Tri-Hits algorithm to evaluate the ranking scores across MiNet. Experiments havedemonstrated that our cross-media/cross-genre ranking method is able to significantly boost the performance ofmulti-media tweet ranking. In the future, we aim to focus on enhancing the quality of concept extraction byexploiting cross-media inference that goes beyond simple fusion.
Acknowledgement
This work was supported by the U.S. Army Research Laboratory under Cooperative Agreement No. W911NF-09-2-0053 (NS-CTA), U.S. NSF CAREER Award under Grant IIS-0953149, U.S. DARPA Award No. FA8750-13-2-0041 in the ?Deep Exploration and Filtering of Text? (DEFT) Program, IBM Faculty award and RPI facultystart-up grant. The views and conclusions contained in this document are those of the authors and should notbe interpreted as representing the official policies, either expressed or implied, of the U.S. Government. The
80

U.S. Government is authorized to reproduce and distribute reprints for Government purposes notwithstanding anycopyright notation here on.
ReferencesSergey Brin and Lawrence Page. 1998. The anatomy of a large-scale hypertextual web search engine. Computer
Networks, 30(1-7):107–117.
Peter F. Brown, Peter V. deSouza, Robert L. Mercer, Vincent J. Della Pietra, and Jenifer C. Lai. 1992. Class-basedn-gram models of natural language. Computational Linguistics, 18:467–479.
Zheng Chen and Heng Ji. 2011. Collaborative ranking: A case study on entity linking. In Proc. EMNLP2011.
Navneet Dalal and Bill Triggs. 2005. Histograms of oriented gradients for human detection. In In CVPR, pages886–893.
Yansong Feng and Mirella Lapata. 2010. Topic models for image annotation and text illustration. In HumanLanguage Technologies: The 2010 Annual Conference of the North American Chapter of the Association forComputational Linguistics, HLT ’10, pages 831–839, Stroudsburg, PA, USA. Association for ComputationalLinguistics.
Hongzhao Huang, Arkaitz Zubiaga, Heng Ji, Hongbo Deng, Dong Wang, Hieu Le, Tarek Abdelzaher, Jiawei Han,Alice Leung, John Hancock, and Clare Voss. 2012. Tweet ranking based on heterogeneous networks. In Proc.COLING 2012, pages 1239–1256, Mumbai, India. The COLING 2012 Organizing Committee.
Kalervo Jarvelin and Jaana Kekalainen. 2002. Cumulated gain-based evaluation of ir techniques. ACM Trans. Inf.Syst., 20(4):422–446, October.
Yushi Jing and Shumeet Baluja. 2008. Visualrank: Applying pagerank to large-scale image search. IEEE Trans.Pattern Anal. Mach. Intell., 30(11):1877–1890.
Qi Li, Heng Ji, and Liang Huang. 2013. Joint event extraction via structured prediction with global features. InProc. ACL2013, pages 73–82.
R. Mihalcea and P. Tarau. 2004. Textrank: Bringing order into texts. In Proceedings of EMNLP, volume 4.Barcelona: ACL.
George A. Miller. 1995. Wordnet: A lexical database for english. COMMUNICATIONS OF THE ACM, 38:39–41.
Sameer Pradhan, Wayne Ward, and James H. Martin. 2008. Towards robust semantic role labeling. In Computa-tional Linguistics Special Issue on Semantic Role Labeling, volume 34, pages 289–310.
Guo-Jun Qi, Charu C. Aggarwal, and Thomas S. Huang. 2012. Transfer learning of distance metrics by cross-domain metric sampling across heterogeneous spaces. In SDM, pages 528–539.
Kim-Chuan Toh and Sangwoon Yun. 2010. An accelerated proximal gradient algorithm for nuclear norm regular-ized linear least squares problems. Pacific Journal of Optimization.
Shen-Fu Tsai, Henry Hao Tang, Feng Tang, and Thomas S. Huang. 2012. Ontological inference frameworkwith joint ontology construction and learning for image understanding. In IEEE International Conference onMultimedia and Expo (ICME) 2012.
Fabio Massimo Zanzotto, Marco Pennacchiotti, and Kostas Tsioutsiouliklis. 2011. Linguistic redundancy intwitter. In Proceedings of the Conference on Empirical Methods in Natural Language Processing, EMNLP ’11,pages 659–669, Stroudsburg, PA, USA. Association for Computational Linguistics.
Wayne X. Zhao, Jing Jiang, Jing He, Yang Song, Palakorn Achananuparp, Ee P. Lim, and Xiaoming Li. 2011.Topical keyphrase extraction from Twitter. In Proceedings of the 49th Annual Meeting of the Association forComputational Linguistics: Human Language Technologies - Volume 1, HLT ’11, pages 379–388, Stroudsburg,PA, USA. Association for Computational Linguistics.
Xi Zhou, Na Cui, Zhen Li, Feng Liang, and Thomas S. Huang. 2009. Hierarchical gaussianization for imageclassification. In ICCV, pages 1971–1977.
81

Proceedings of the 25th International Conference on Computational Linguistics, pages 82–86,Dublin, Ireland, August 23-29 2014.
Speech-accompanying gestures in Russian:
functions and verbal context1
Yulia Nikolaeva
Moscow State University [email protected]
Abstract
The study of the relationships between speech and gesture promises a lot of insights into
speech production and comprehension processes. In this work we explore syntactic and
semantic characteristics of verbal correlates of speech-accompanying gestures. The results of
the corpora studies show, that we can reveal the statistical probability for certain types of
gestures to appear in given context. For example, semantic correlates of deictic gestures are
mostly noun phrases, and only in few cases these gestures correspond to adverbs, although
they may coincide with any part of a clause. Single beats differ from other gesture types in
their tendency to accompany speech disfluencies, discourse markers, and unimportant parts
of a clause. Looking from the perspective if the meaning of words, accompanied by gestures,
we can see, that new or re-activated referents might be presented with deictic gestures,
uncertainty or direct speech are a domain of beat gestures.
1 Introduction
Gesticulation or speech-accompanying gestures perform the same functions, serve the same goals and
relate to the same information as do the words, as showed in (McNeill, 1992). At the same time the
interplay of speech and gesticulation, especially distribution of pragmatic, semantic and referential
meanings still stays unclear. Maha Salem and her colleagues point out that synchronization of
different modalities for conversational agents or robotic platforms “is either achieved only
approximately or by solely adapting one modality to the other, e.g. by adjusting gesture speed to the
timing of running speech” (Salem et al. 2011). Our work is aimed to describe statistical probability for
different types of gestures to appear in certain verbal contexts. These contexts were described
depending on their morphological and syntactical characteristics, as shown in part 3.1. To achieve this
goal we created two 20-minutes corpora consisting of TV talk-show fragments and retellings of “The
pear stories” (Chafe, 1980).
2 Data analysis
2.1 Corpus description
We formed two different corpora to compare gesture properties in different types of discourse, namely
dialogue and narration. The first one included seven fragments of TV interviews and panel discussion
of some common social issues and was supposed to include various types and styles of conversation.
The aim of this corpus was to register as many examples of gestures with diverse functions in different
contexts, as possible. The second corpus consisted of eight retelling of “The pear stories” made by
university students with very little or no interventions by a listener, thus it was more homogeneous
from the viewpoint of genre, topic and discourse structure, so it allowed comparing gesture features,
concerning global discourse structure. The results show, that most gesture functions are common for
different genres.
This work is licensed under a Creative Commons Attribution 4.0 International Licence. License
details: http://creativecommons.org/licenses/by/4.0/
82

2.2 Transcribing and coding
2.2.1 Gesture types
Coding concentrated on movements of the hands. Gestures were divided into five groups, using
modified D. McNeill’s classification (1992). Besides deictics, we distinguish descriptive, meta-
discursive, beat and rhythmic gestures. Considering the fact that distinctions between iconic and
metaphoric gestures are not always obvious (see e.g. Gullberg, 1995), we reviewed these classes as
descriptive and meta-discursive, relying on the form of the gesture and its relation to speech. Meta-
discursive gestures treat simultaneous words as if from the outside, regarding speech as an object that
can be transferred to an addressee, or manipulated in a different way (e.g. a whole that can be divided
into parts, or a process that can be accelerated or slowed down). Descriptive gestures concern to the
storyline and reflect the content of the illustrated words. Also we distinguish single beats and rhythmic
gestures (named in Ekman, Friesen, 1969). So, the main ground for this classification was the form of
the gesture, also taking into account its meaning and relation to the corresponding words. The future
analysis proved the validity of this division.
2.2.2 Characteristics of speech segments accompanied by gestures
We examined the following types of gesture correlates:
1. full clauses, which can describe the line of the story or else can be
a. meta-discursive (We are talking about…);
b. citations (He asked: “How do you do it?”);
c. repetition of the previous clause;
d. reformulation or elaboration of the previous clause;
e. false-start.
2. noun phrases, divided into groups relying on their accessibility and syntactical role;
3. adverbs, considering their semantics;
4. verbs and verbal phrases, taking into account their syntactical form and meaning
5. discourse markers, also divided into groups, following Schiffrin (1987).
We labeled all the items in the corpora according to this list and compared the probability to be
accompanied of every type of gesture (or to appear without any gesture). For referential gestures we
counted the speech segments with the same meaning, for beats and rhythmics only the temporal
correspondence was possible.
3 Results
The first corpus contains 545 gestures, the second one – 338 gestures. It seems worth to mention, that
proportions of gesture types were similar to those in D. McNeill’s study (1992), taking into account
the difference in classification (Table 1).
Table 1. Frequency of gesture types in three corpora.
The pear stories Talk-shows D. McNeill’s corpus
Deictic 36 11% 45 8% 28 5%
Descriptive (iconic) 193 57% 195 36% 261 44%
Meta-discursive
(metaphoric)
57 17% 87 16% 42 7%
Beat 47 14% 134 25% 268 45%
Rhythmic 3 1% 83 15%
Emblems 2 1% 1 0% - -
Total 338 545 599 100%
83

Table 2. Verbal correlates with each type of gestures.
Noun
phrase
Verb
phrase
Adverb Clause Unfinished
clause
Discourse
markers
Total
Deictic 19% - 12% (5%) - - 9%
Descriptive 33% 48% 40% 35% - 27% 45%
Meta-discursive 19% 11% 10% 16% 32% 24% 16%
Beat 24% 30% 36% - 68% 49% 20%
Rhythmic 5% 11% 2% 44% - - 10%
Total 100% 100% 100% 100% 100% 100% 100%
Table 2 shows comparative frequency of each type of gestures to appear with different syntactic units.
For deictics temporal correlates are shown in brackets.
Table 3. Certain types of clauses with speech-accompanying gestures.
Meta-
discursive
Citation Repetition Reformulation Regulatory
clause
Total for
these
clauses
Deictic 6% 5% - - 1% 4%
Descriptive 14% 17% 13% 21% 6% 18%
Meta-discursive 9% 4% 6% 4% 2% 7%
Beat 6% 16% 25% 4% 10% 11%
Rhythmic 4% 16% - 8% 4% 8%
Table 3 summarizes percentage of some special clauses with gestures.
Analysis of the data in Tables 1-3 is presented below.
3.1 Deictic gestures correlates
Deictic gestures illustrate noun phrases (87%) and adverbs of time and place (13%), although they
may appear in any part of a clause. There was even an example, where the gesture was used without an
explicit verbal correlate (1) (the underlined words are accompanied by the gesture).
(1) Go!
(right palm facing the center, fingers extended toward the listener)
When used with adverbs, deictics can reveal standard metaphors, such as past is behind us
(Lakoff, Johnson, 1980), or appeal to common knowledge in the context of discourse, see (1).
(2) Like now and here.
(right palm up, fingers towards the listener slightly curved)
Deictic gestures often mark the clauses of meta-discursive level, when the speaker points at himself
or at a listener, and also these gestures accompany citations, placing a referent in the space near the
speaker or illustrating adverbs.
3.2 Descriptive gestures correlates
These gestures tend to illustrate verbs and less often can be seen with noun phrases, comparing to
other gesture types. Only descriptive gestures, that have complex form and can carry much
information additional to words, were met with interjections.
When used with clauses, these gestures tend to appear with reformulations, what can be explained
as a speaker’s intention to elaborate and to force her/his idea, so that visual illustration is needed,
whether in order to resolve verbalization problems, the speaker’s rhetoric aim or listener’s demand
(when the last does not completely understand the message).
84

3.3 Meta-discursive gestures correlates
The most often example of this gesture type is palm up opened hand (Müller, 2004). The semantics of
the gesture reveals conduit metaphor (Lakoff, Johnson, 1980), when a speaker passes his words or
ideas to a listener.
Meta-discursive gestures more often refer not to a single word, but to a phrase or a part of a
discourse. Their form is less connected to the meaning of accompanied words, than it is with two
previous types. They are used to emphasize related words and often coincide with prosodic
accentuation.
Meta-discursive gestures tend to appear with more static parts oа a clause, like noun phrases and
discourse markers, and less often are met with verbal phrases and adverbs. It can be explained in
connection with the meaning of the conduit metaphor, which interprets the words said by a speaker
like a material object passed to a listener. Nouns are less easier to be seen as objects than verbs. So,
NPs with meta-discursive gestures serve as topics or themes in the segment of a discourse. When they
emphasize a whole clause, these gestures underline important links in the logic chain composed by the
speaker; usually these statements contain causes, consequences, or concessions, crucial for
understanding of the described facts.
Obviously, these gestures are often used with meta-discursive clauses, describing, for example, the
structure of a narration or intentions of a speaker. Also they tend to accompany literal repetitions of a
previous clause. This shows that meta-discursive gestures are also a rhetoric instrument, used with less
graphic predicates, than descriptive gestures, and with less thought-out statements, than rhythmics.
3.4 Beat and rhythmic gestures correlates
Short simple movements, usually up and down, can have only single words as their correlates, not
phrases or clauses. They are twice more often met with discourse markers, speech disfluencies, and
conjunctions, than other gestures. Also they tend to mark citations and repetitions. We suggest the
hypothesis that beats are oriented at a speaker and their use is motivated by cognitive tasks resolved by
a speaker. Another hypothesis of high beats frequency during the least interesting parts of a discourse
can be that they serve as pause-fillers, showing the listener, that the speech is not finished yet.
Rhythmic gestures label each syllable of a word or each word in a phrase and often cover the whole
clause. They are never met with discourse markers, pauses, or false starts, so we can suppose, that
these gestures tend to mark well-planned parts of a discourse and serve as conscious rhetoric
instrument. They tend to accompany citations, which are important in the discourse or emphasized by
a speaker.
4 Conclusion
Deictic gestures may appear in any part of a clause, even without explicit verbal correlate, but
semantically they correspond to an adverb of time or place or to a noun phrase. Another tendency for
these gestures is to illustrate meta-discursive sentences, describing the actual situation of
communication.
Descriptive gestures can be met with verbs and verbal phrases more often, than other types, and
they are usually used with the reformulations and other important part of the discourse, contributing to
the story-line. They avoid noun phrases and especially discourse markers.
Meta-discursive gestures apparently are used with meta-discursive clauses. Yet they tend to
illustrate unfinished clauses, noun phrases or discourse markers. They are not usual with verb phrases,
citations and reformulations.
Beats are remarkable for their tendency to appear with citations and repetitions, and especially
speech disfluencies and discourse markers.
85

Rhythmic gestures usually accentuate long segments of discourse, at least a clause, and they can
be used to underline citations, which the speaker considers to be important in his speech.
Acknowledgements
The research is supported by Russian Foundation for Basic Research, grant 14-06-00211
“Discourse production: method of observation, experiment and modeling”.
Reference
Chafe, Wallace. 1980. The pear stories: Cognitive, cultural, and linguistic aspects of narrative
production. Norwood, NJ: Ablex.
Chafe, Wallace. 1994. Discourse, consciousness, and time: The flow and displacement of conscious
experience in speaking and writing. Chicago: University of Chicago Press.
Ekman, Paul; Friesen, Wallace 1969. The repertoire of nonverbal behavior. Categories, origins, usage
and encoding. Semiotica, 1(1): 49-98.
Gullberg, Marianne. 1995. Giving language a hand: gesture as a cue based communicative strategy.
Lund University, Dept. of Linguistics, Working Papers, 44: 41-60.
Lakoff, George; Johnson, Mark. 1980. Metaphors We Live by. Chicago: University of Chicago Press.
McNeill, David. (1992). Hand and Mind: What Gestures Reveal About Thought. Chicago: University
of Chicago Press.
Müller, Cornelia. 2004. Forms and uses of the Palm Up Open Hand: A case of a gesture family? In C.
Müller & R. Posner (Eds.), The Semantics and Pragmatics of Everyday Gestures. Berlin: Weidler,
pp. 233-256.
Salem, Maha; Kopp, Stefan; Wachsmuth, Ipke; Joublin, Frank. 2011. A Multimodal Scheduler for
Synchronized Humanoid Robot Gesture and Speech. In: Book of Extended Abstracts of the 9th
International Gesture Workshop, GW2011, pp. 64-67.
Schiffrin, Debora. 1987. Discourse markers. Cambridge: Cambridge University Press.
86

Proceedings of the 25th International Conference on Computational Linguistics, pages 87–94,Dublin, Ireland, August 23-29 2014.
DALES: Automated Tool for Detection, Annotation, Labelling andSegmentation of Multiple Objects in Multi-Camera Video Streams
M. Bhat and J. I. OlszewskaUniversity of Gloucestershire
School of Computing and TechnologyThe Park, Cheltenham, GL50 2RH, UK
Abstract
In this paper, we propose a new software tool called DALES to extract semantic informationfrom multi-view videos based on the analysis of their visual content. Our system is fully auto-matic and is well suited for multi-camera environment. Once the multi-view video sequences areloaded into DALES, our software performs the detection, counting, and segmentation of the vi-sual objects evolving in the provided video streams. Then, these objects of interest are processedin order to be labelled, and the related frames are thus annotated with the corresponding seman-tic content. Moreover, a textual script is automatically generated with the video annotations.DALES system shows excellent performance in terms of accuracy and computational speed andis robustly designed to ensure view synchronization.
1 Introduction
With the increasing use of electronic equipments, storage devices and computational systems for ap-plications such as video surveillance (Kumar et al., 2010) and sport event monitoring (Alsuqayhi andOlszewska, 2013), the development of automated tools to process the resulting big amount of visual datain order to extract meaningful information becomes a necessity.
In particular, the design of multi-view video annotation systems is a challenging, new task. It aimsto process multi-view video streams which consist of video sequences of a dynamic scene capturedsimultaneously by multiple cameras. Such multi-input system is dedicated to automatically analyse thevisual content of the multi-camera records and to generate semantic and visual annotations, in the wayto assist users in the understanding and reasoning about large amount of acquired data.
For this purpose, data should be processed through different, major stages such as object-of-interestdetection and segmentation, frame labelling, and video annotation. In the literature, most of the worksdealing with the analysis of multi-camera video streams are focused on the sole task of tracking multiple,moving objects and use different approaches such as background subtraction (Diaz et al., 2013), Bayesianframework (Hsu et al., 2013), particle filter (Choi and Yoo, 2013), or Cardinalized Probability HypothesisDensity (CPHD) based filter (Lamard et al., 2013). On the other hand, research on video annotation haslead to the development of several efficient systems (Town, 2004; Natarajan and Nevatia, 2005; Bai etal., 2007; Vrusias et al., 2007), but all designed for a single camera video stream input.
In this paper, we describe a full system which takes multi-camera video stream inputs and performs vi-sual data processing to generate multi-view video annotations. Our system has been developed in contextof outdoor video-surveillance and is an automatic Detection, Annotation, LabElling and Segmentation(DALES) software tool. It presents also the advantage to have an entire chain of data processing fromvisual to textual one, reducing thus the semantic gap.
As camera calibration is in general an expensive process (Black et al., 2002) and in real life, surveil-lance application measurements of camera parameters are not readily available (Guler et al., 2003),DALES system does not involve any camera calibration parameters.
This work is licensed under a Creative Commons Attribution 4.0 International Licence. Page numbers and proceedings footerare added by the organisers. Licence details: http://creativecommons.org/licenses/by/4.0/
87

(a) (b)
Figure 1: Overview of the flow of data within DALES software: (a) Context level Data Flow Diagram;(b) Second level Data Flow Diagram.
DALES provides not only the automatic annotation of multi-view video streams, but also performs,in multi-camera environment, tasks such as multiple object-of-interest detection and segmentation, tar-get counting and labelling, and image annotations. Our approach could cope with any dynamic scenerecorded by pan-tilt-zoom (PTZ) static cameras with overlapping color views, unlike systems such as(Kettnaker and Zabih, 1999) based on non-overlapping cameras. The acquired multi-view sequencescould contain complex backgrounds, moving objects or noisy foregrounds, and present illuminationvariations or poor resolution.
Hence, the contribution of this paper is twofold:
• the automated, textual annotation of multi-camera video streams based on visual features;
• the development of a full, automatic system covering all the phases from multiple, visual multi-motion target detection to multi-view video annotation and text-script generation.
The paper is structured as follows. In Section 2, we describe our DALES system for fast, multiplevideo-object detection, segmentation, labeling and effective multi-view video annotation. Our tool hasbeen successfully tested on standard, real-world video-surveillance dataset as reported and discussed inSection 3. Conclusions are presented in Section 4.
2 DALES System
DALES system architecture is presented in Section 2.1, while its two main computational stages, one atthe object-of-interest level, the second one at the frame/video levels are described in Sections 2.2-2.3 andSection 2.4, respectively.
2.1 System ArchitectureDALES software tool has been prototyped according to the Rapid Application Development (RAD)methodology and using object-oriented approach (C++, 2011). The data flow diagrams (DFDs) shownin Figs. 1 (a)-(b) display the flow of data within different stages of the system. DFDs give an accountof the type of data input, the processing involved with these data as well as the final data we get, eachhigher level of DFDs elaborating the system further.
In order to start the computation of multi-view, multiple object-of-interest detection and counting,target segmentation and labelling, multi-stream video annotations and script generation, DALES systemrequires multi-view camera synchronization. This is achieved in the multiple views by checking thecorrespondence of the file names of the files in all the views during the loading phase (Figs. 2(a), 3(a)).
On the other hand, DALES could be used as a viewer of annotated, multi-view videos by loading thegenerated text script (Fig. 2(b)).
88

(a) (b)
Figure 2: The initialisation of DALES software could be done either by providing (a) the video sequencefolder name, in order to use the software to process the multi-view video; or by providing (b) a text scriptwith video annotation, in order to run the software to visualize the frames and corresponding annotations.
2.2 Multiple-Object Detection, Segmentation, and Counting
A number of solutions exists for detecting multiple objects of interest in video scenes (Olszewska andMcCluskey, 2011; Olszewska, 2011; Olszewska, 2012b). In particular, background subtraction has longbeen used in the literature as it provides a useful approach to both detect and segment objects of interest.This method could be computed by difference between two consecutive frames (Archetti et al., 2006),by subtracting the current frame from the background (Toyama et al., 1995; Haritaoglu et al., 2000), orcombining both frame difference and background subtraction techniques (Huang et al., 2007; Yao et al.,2009).
In our scenario, images I(x,y) we consider may be taken from very different cameras, different light-ing, etc. For that, we compute blobs separately in each of the views. The blobs are defined by labeledconnected regions, which are obtained by background subtraction. The latter technique consists in com-puting the difference between the current image intensity I(x,y) and a background model, and afterwards,in extracting the foreground.
To model the background, we adopt the running Gaussian average (RGA) (Wren et al., 1997), charac-terized by the mean µb and the variance σ2
b, rather than, for example, the Gaussian mixture model (GMM)(Stauffer and Grimson, 1999; Friedman and Russell, 1997; Zivkovic and van der Heijden, 2004), sincethe RGA method is much more suitable for real-time tracking.
Next, the foreground is determined by
F(x,y) =
1 if |I(x,y)−µb|> n ·σb, with n ∈ N0,0 otherwise.
(1)
Finally, morphological operations (Haralick, 1988) are applied to the extracted foreground F , in orderto exploit the existing information on the neighboring pixels,
f (x,y) = Morph(F(x,y)). (2)
2.3 Object Labeling
In this work, the detected and segmented object from a frame is automatically labelled by comparingit with a given example object based on the Scale Invariant Feature Transform (SIFT) descriptors (Ol-szewska, 2012a).
89

Algorithm 1 Matching AlgorithmGiven A′ = A,B′ = B,M = ∅,for all ai ∈ A′ do
for all b j ∈ B′ dorepeat
if
dP(ai,b j) = minb∈B′ dP(ai,b)
∧ dP(b j,ai) = mina∈A′ dP(b j,a)
∧ dP(ai,b j) ≤ dH(A,B)∧ dP(b j,ai) ≤ dH(A,B)
then
(ai,b j) ⊂ M
∧ A′ = A\ai∧B′ = B\b j
end ifuntil A′ 6= ∅∨B′ 6= ∅
end forend forreturn M
The main steps of our labelling process are (i) the detection of object’s SIFT features which are robustto rotation, translation, scale changes as well as some viewpoint variations, (ii) their matching by meansof the Embedded Double Matching Algorithm (Algorithm 1) and (iii) the label inheritance. Moreover,our approach does not require any training and thus is online compatible.
The comparison between the query object and the candidate one is performed in the feature space inorder to be more computationally effective and to be more robust towards noise and affine transformation,and is followed by the computation of an associated similarity measure dS(A,B), which is computed asfollows
dS(A,B) =#M
#A+#B2
, (3)
with A and B, the sets of SIFT features of the query and the candidate objects, respectively, and M, theset of the double-matched ones (Alqaisi et al., 2012).
The decision that a candidate object contains similar content to the query one is taken based on the factthat the similarity measure dS(A,B) is above a given threshold. In the case when the similarity measuredS(A,B) is below the given threshold, the candidate is rejected.
Finally, once the decision that a candidate object contains similar content to the query one has beentaken, the label of the candidate object is automatically mapped with the predefined label of the exampleobject.
2.4 Multi-View AnnotationsHence, by using different objects’ examples, all the frames from the video dataset are indexed withthe relevant semantic labels based on their visual content similarity, while the objects of interest areautomatically labeled and localized within these frames (Olszewska, 2012a).
Unlike (Evans et al., 2013), which uses an early fusion, where all the cameras are used to make adecision about detection and tracking of the objects of interest, DALES system performs a late fusion.Indeed, in our system, objects of interest are detected and labelled in individual cameras independently.Next, the results are combined on the majority voting principle based on the semantic consistency of
90

(a) (b)
Figure 3: Snapshots of DALES software windows, in the phase of: (a) loaded multi views; (b) detectedmoving objects.
the labels in sequential frames and across multiple camera views, rather than exploring geometricalcorrespondences of objects as in (Dai and Payandeh, 2013).
3 Experiments and Discussion
To validate the DALES tool, we have applied our system on the standard dataset (PETS, 2001) consistingof video-surveillance dynamic scene recorded by two PTZ cameras. This produces two videos. Eachcontains 2688 frames, whose average resolution is of 576x768 pixels and which were captured in outdoorenvironment. This database owns challenges of multi-view video stream, as well as quantity, pose,motion, size, appearance and scale variations of the objects of interest, i.e. people and cars.
All the experiments have been run on a computer with Intel Core 2 Duo Pentium T9300, 2.5 GHz,2Gb RAM, and using our DALES software implemented with C++ (C++, 2011).
Some examples of the results of our DALES system are presented in Fig. 3(b). These frames presentdifficult situations such as poor foreground/background contrast or light reflection.
To assess the detection accuracy of DALES system, we adopt the standard criteria (Izadi and Saeedi,2008) as follows:
detection rate (DR) =T P
T P+FN, (4)
f alse detection rate (FAR) =FP
FP+T P, (5)
with T P, true positive, FP, false positive, and FN, false negative.
The labelling accuracy of DALES system could be assessed using the following standard criterion:
accuracy =T P+T N
T P+T N +FP+FN, (6)
with T N, true negative.
In Table 1, we have reported the average detection and false alarm rates of our DALES method againstthe rates achieved by (Izadi and Saeedi, 2008), while in Table 2, we have displayed the average accuracyof object-of-interest labelling of our DALES method against the rate obtained by (Athanasiadis et al.,2007).
91

Table 1: Average detection rates of object-of-interests in video frames.
(Izadi and Saeedi, 2008) DALESaverage detection rate (DR) 91.3% 91.6%average false alarm rate (FAR) 9.5% 4.9%
Table 2: Average accuracy of object-of-interest labelling in video frames.
(Athanasiadis et al., 2007) DALESaverage accuracy 85% 95%
From Tables 1-2, we can conclude that our DALES system provides reliable detection and countingof objects of interest in multi-camera environment, and that the multiple-object labelling is very accurateas well, outperforming state-of-the art techniques. DALES total precision to annotate multi-view videosis therefore very high.
For all the dataset, the average computational speed of our DALES software is in the range of fewseconds, whereas the viewer function of DALES software takes only few milliseconds to process. Hence,our developed system could be used in context of online scene analysis.
4 Conclusions
Reliable, multi-view annotation of large amount of real-time visual data, such as surveillance videos orsport event broadcasts, is a challenging topic we have copped with. For this purpose, we have developeda new software tool called DALES which processes, in multi-camera environment, (i) multiple object-of-interest detection and (ii) counting, (iii) target segmentation and (iv) labelling, (v) image annotations,(vi) multi-stream video annotations and script generation. Moreover, our DALES software suits well asa viewer to display a loaded script with the text annotations of the multi-camera video sequence and thecorresponding labelled multi-view images.
Our system shows excellent performance compared to the ones found in the literature, on one hand,for multiple-target detection and segmentation and, on the other hand, for object labeling. Multi-streamannotations with DALES are thus computationally efficient and accurate.
ReferencesT. Alqaisi, D. Gledhill, and J. I. Olszewska. 2012. Embedded double matching of local descriptors for a fast
automatic recognition of real-world objects. In Proceedings of the IEEE International Conference on ImageProcessing (ICIP’12), pages 2385–2388.
A. Alsuqayhi and J. I. Olszewska. 2013. Efficient optical character recognition system for automatic soccerplayer’s identification. In Proceedings of the IAPR International Conference on Computer Analysis of Imagesand Patterns Workshop (CAIP’13), pages 139–150.
F. Archetti, C. Manfredotti, V. Messina, and D. Sorrenti. 2006. Foreground-to-ghost discrimination in single-difference pre-processing. In Proceedings of the International Conference on Advanced Concepts for IntelligentVision Systems, pages 23–30.
T. Athanasiadis, P. Mylonas, Y. Avrithis, and S. Kollias. 2007. Semantic image segmentation and object labeling.IEEE Transactions on Circuits and Systems for Video Technology, 17(3):298–312.
L. Bai, S. Lao, G. J. F. Jones, and A. F. Smeaton. 2007. Video semantic content analysis based on ontology. InProceedings of the IEEE International Machine Vision and Image Processing Conference, pages 117–124.
J. Black, T. Ellis, and P. Rosin. 2002. Multi View Image Surveillance and Tracking. In Proceedings of the IEEEWorkshop on Motion and Video Computing, pages 169–174.
C++. 2011. C++ builder. Available online at: https://downloads.embarcadero.com/free/c builder.
92

J.-W. Choi and J.-H. Yoo. 2013. Real-time multi-person tracking in fixed surveillance camera environment. InProceedings of the IEEE International Conference on Consumer Electronics.
X. Dai and S. Payandeh. 2013. Geometry-based object association and consistent labeling in multi-camera surveil-lance. IEEE Journal on Emerging and Selected Topics in Circuits and Systems, 3(2):175–184.
R. Diaz, S. Hallman, and C. C. Fowlkes. 2013. Detecting dynamic objects with multi-view background subtrac-tion. In Proceedings of the IEEE International Conference on Computer Vision, pages 273–280.
M. Evans, C. J. Osborne, and J. Ferryman. 2013. Multicamera object detection and tracking with object sizeestimation. In Proceedings of the IEEE International Conference on Advanced Video and Signal Based Surveil-lance, pages 177–182.
N. Friedman and S. Russell. 1997. Image segmentation in video sequences: A probabilistic approach. In Pro-ceedings of the 13th Conference on Uncertainty in AI.
S. Guler, J. M. Griffith, and I. A. Pushee. 2003. Tracking and handoff between multiple perspective camera views.In Proceedings of the 32nd IEEE Workshop on Applied Imaginary Pattern Recognition, pages 275–281.
R. M. Haralick. 1988. Mathematical morphology and computer vision. In Proceedings of the IEEE AsilomarConference on Signals, Systems and Computers, volume 1, pages 468–479.
I. Haritaoglu, D. Harwood, and L. Davis. 2000. Real-time surveillance of people and their activities. IEEETransactions on Pattern Analysis and Machine Intelligence, 77(8):809–830.
H.-H. Hsu, W.-M. Yang, and T. K. Shih. 2013. Multicamera object detection and tracking with object sizeestimation. In Proceedings of the IEEE Conference Anthology, pages 1–4.
W. Huang, Z. Liu, and W. Pan. 2007. The precise recognition of moving object in complex background. InProceedings of 3rd IEEE International Conference on Natural Computation, volume 2, pages 246–252.
M. Izadi and P. Saeedi. 2008. Robust region-based background subtraction and shadow removing using colourand gradient information. In Proceedings of the 19th IEEE International Conference on Pattern Recognition,pages 1–5.
V. Kettnaker and R. Zabih. 1999. Bayesian multi-camera surveillance. In Proceedings of the IEEE Conference onComputer Vision and Pattern Recognition, volume 2, pages 1–5.
K. S. Kumar, S. Prasad, P. K. Saroj, and R. C. Tripathi. 2010. Multiple cameras using real-time object tracking forsurveillance and security system. In Proceedings of the IEEE International Conference on Emerging Trends inEngineering and Technology, pages 213–218.
L. Lamard, R. Chapuis, and J.-P. Boyer. 2013. CPHD Filter addressing occlusions with pedestrians and vehiclestracking. In Proceedings of the IEEE International Intelligent Vehicles Symposium, pages 1125–1130.
P. Natarajan and R. Nevatia. 2005. EDF: A framework for semantic annotation of video. In Proceedings of theIEEE International Conference on Computer Vision Workshops, page 1876.
J. I. Olszewska and T. L. McCluskey. 2011. Ontology-coupled active contours for dynamic video scene un-derstanding. In Proceedings of the IEEE International Conference on Intelligent Engineering Systems, pages369–374.
J. I. Olszewska. 2011. Spatio-temporal visual ontology. In Proceedings of the 1st EPSRC Workshop on Visionand Language (VL’2011).
J. I. Olszewska. 2012a. A new approach for automatic object labeling. In Proceedings of the 2nd EPSRCWorkshop on Vision and Language (VL’2012).
J. I. Olszewska. 2012b. Multi-target parametric active contours to support ontological domain representation. InProceedings of the RFIA Conference, pages 779–784.
PETS. 2001. PETS Dataset. Available online at: ftp://ftp.pets.rdg.ac.uk/pub/PETS2001.
C. Stauffer and W. Grimson. 1999. Adaptive background mixture model for real-time tracking. In Proceedings ofthe IEEE Conference on Computer Vision and Pattern Recognition.
C. Town. 2004. Ontology-driven Bayesian networks for dynamic scene understanding. In Proceedings of theIEEE International Conference on Computer Vision and Pattern Recognition Workshops, page 116.
93

K. Toyama, J. Krumm, B. Brumitt, and B. Meyers. 1995. Wallflower: Principles and practice of backgroundmaintenance. In Proceedings of the IEEE International Conference on Computer Vision, volume 1, pages 255–261.
B. Vrusias, D. Makris, J.-P. Renno, N. Newbold, K. Ahmad, and G. Jones. 2007. A framework for ontologyenriched semantic annotation of CCTV video. In Proceedings of the IEEE International Workshop on ImageAnalysis for Multimedia Interactive Services, page 5.
C. R. Wren, A. Azarbayejani, T. Darrell, and A. P. Pentland. 1997. Real-time tracking of the human body. IEEETransactions on Pattern Analysis and Machine Intelligence, 19(7):780–785.
C. Yao, W. Li, and L. Gao. 2009. An efficient moving object detection algorithm using multi-mask. In Proceedingsof 6th IEEE International Conference on Fuzzy Systems and Knowledge Discovery, volume 5, pages 354–358.
Z. Zivkovic and F. van der Heijden. 2004. Recursive unsupervised learning of finite mixture models. IEEETransactions on Pattern Analysis and Machine Intelligence, 26(5):651–656.
94

Proceedings of the 25th International Conference on Computational Linguistics, pages 95–102,Dublin, Ireland, August 23-29 2014.
A Hybrid Segmentation of Web Pages for Vibro-Tactile Access on
Touch-Screen Devices
Waseem Safi1 Fabrice Maurel
1 Jean-Marc Routoure
1, 2 Pierre Beust
1 Gaël Dias
1
1 University of Caen Basse-Normandie - UNICAEN 2 National Superior Engineering School of Caen - ENSICAEN
14032 Caen - France [email protected]
Abstract
Navigating the Web is one of important missions in the field of computer accessibility. Many specialized techniques for Visually Impaired People (VIP) succeed to extract the visual and textual information displayed on digital screens and transform it in a linear way: either through a written format on special Braille devices or a vocal output using text-to-speech syn-thesizers. However, many researches confirm that perception of the layout of web pages en-hances web navigation and memorization. But, most existing screen readers still fail to trans-form the 2-dimension structures of web pages into higher orders. In this paper, we propose a new framework to enhance VIP web accessibility by affording a “first glance” web page overview, and by suggesting a hybrid segmentation algorithm to afford nested and easy navi-gation of web pages. In particular, the web page layout is transformed into a coarse grain structure, which is then converted into vibrating pages using a graphical vibro-tactile lan-guage. First experiments with blind users show interesting issues on touch-screen devices.
1 Introduction
In October 2013, the world health organization estimated that the number of Visually Impaired People (VIP) in the world is 285 million: 39 million of them are blind and 246 million have low vi-sion. In particular, the organization defined four levels of visual functions depending on the interna-tional classification of diseases: normal vision, moderate visual impairment, severe visual impairment and blindness.
VIP depend on screen readers in order to deal with computer operating systems and computational programs. One of most important and desired targets by VIP is navigating the Web, considering the increased importance and expansion of web-based computational programs. Screen readers present some solutions to navigate the textual and graphical contents of web pages, either by transforming a web page into a written Braille, or into a vocal output. In addition to these solutions, some screen readers installed on touch devices transform a web page into a vocal-tactile output.
But, there are some drawbacks for these proposed solutions. On the one hand, Braille techniques are costly and only few number of VIP have learned Braille (in France in 2011, there were about 77,000 visually impaired people and only 15,000 of them had learned Braille). On the other hand, transform-ing the information of a web page into a vocal format might not be suitable in public and noisy envi-ronments. Finally most of Braille solutions are not suitable for mobile devices [Maurel et al, 2012]. In addition to these drawbacks, the most important one is the failure to transform the 2-dimension web page structure. Indeed, as reported by many authors, perceiving the 2D structure of web documents greatly improves navigation efficiency and memorization as it allows high level text reading strategies such as: rapid or cursory reading, finding or locating information, to name but a few [Maurel et al, 2003]. Our work focuses on developing and evaluating a sensory substitution system based on a vibro-tactile solution, which may solve the mentioned drawbacks. In particular, we study how to increase the VIP perception of a 2D web page structure and how to enhance their techniques to navigate the contents of
This work is licensed under a Creative Commons Attribution 4.0 International Licence. License details: http://creativecommons.org/licenses/by/4.0/ 95

web pages on touch-screen devices. The suggested solution is very cheap compared to Braille devices and may be efficient in noisy and public environments compared to vocal-tactile solutions. Our contribution is three-fold: (1) designing a Tactile Vision Sensory System (TVSS) represented by an electronic circuit and an Android program in order to transform light contrasts of touch-screen de-vices into low-frequencies tactile vibrations; (2) designing an algorithm for segmenting web pages in order to support the visually impaired persons by a way which may enhance their ability to navigate the textual and graphical contents of web pages and (3) analyzing the effects of the suggested segmen-tation method on navigation models and tactics of blind persons, and its effect on enhancing their strategies for text reading and looking for textual information.
The paper is organized as follows. First, in section 2, we review most advanced VIP targeted tech-nologies. Then, in section 3, we describe the new proposed framework. In section 4, we view the state of the art for web pages segmentation methods. In the fifth section, our hybrid segmentation method is presented and how this method could be integrated in our framework. In section 6, we enumerate the desired effects of the proposed segmentation method on navigation models and tactics of blind per-sons, and how it may enhance their strategies for text reading and searching of textual information. Finally, in the seventh section, perspectives and conclusions are presented.
2 VIP targeted technologies
Current products for VIP such as screen readers mainly depend on speech synthesis or Braille solu-tions, e.g. ChromeVox [3], Windows-Eyes [4], or JAWS (Job Access With Speech) [5]. Braille displays are complex and expensive electromechanical devices that connect to a computer and display Braille characters. Speech synthesis engines convert texts into artificial speech, where the text is analyzed and transformed into phonemes. These phonemes are then processed using signal processing techniques.
Some screen readers can also support tactile feedback when working on touch-screen devices, such as Mobile Accessibility [6] and Talkback [7] for Android, or VoiceOver [8] for IPad. Many of these products propose shortcuts for blind users to display a menu of HTML elements existing in the web page, for example headers, links and images. But, the main drawback of all these products is the fact that they transfer the information of web pages into a linear way i.e. without any indication of the 2-dimension global structure. Many researches tried to enhance the way by which VIP interact with web pages, such as [Alaeldin et al, 2011], who proposed a tactile web navigator to enable blind people access the Web. This navigator extracts texts from web pages and sends them to a microcontroller responsible of displaying the text in Braille language using an array of solenoids. A tactile web browser for hypertext documents has been proposed by [Rotard et al, 2005]. This browser renders texts and graphics for VIP on a tactile graphics display and supports also a voice output to read textual paragraphs and to provide a vocal feedback. The authors implemented two exploration modes, one for bitmap graphics and another one for scalable vector graphics. A pin matrix device is then used to produce the output signal for blind users. The main drawback of these two proposed systems is that they need specific devices (solenoids and pin matrix), which are expensive and cannot be integrated to handled devices such as PDAs or Tablet PCs. Another interesting model called MAP-RDF (Model of Architecture of Web Pages) has been proposed by [BouIssa et al, 2011]. This model allows representing the structure of a web page and provides blind users with an overview of the web page layout and the document structure semantics. Tactos is a perceptual interaction system, which has been suggested by [Lenay et al, 2003] and consists of three elements: (1) tactile simulators (two Braille cells with 8 pins) represent a tactile feedback system, (2) a graphics tablet with a stylus represents an input device and (3) the computer. More than 30 prototypes of Tactos have been released to serve a lot of users in many domains. Tactos has been successfully used to recognize simple and complex shapes. The device has been also used in geometry teaching domain in an institution for visually impaired and blind children. Tactos also allowed psychology re-searchers to propose and develop new paradigms for studying perceptions and mediated communica-tion of blind persons [Tixier et al, 2013]. However, it shows the same drawback as the previous sys-tems, which are expensive and need specific devices. Moreover, the blind user can only explore the web page with a stylus and both hands are occupied by the system. Moreover, it is unemployable for a large set of environments, for example in public.
96

3 Proposed Framework
The “first glance” can be defined as the ability to understand the document layout and its structural semantics in a blink of an eye [Maurel et al, 2012]. In this work, we aim to increase the ability of visu-ally impaired persons to understand the 2-dimension web page layout in order to enhance their tactics to navigate the Web with a vibro-tactile feedback. The first phase in our model is to extract visual structures in the navigated web page and convert these “visual” blocks into zones (or segments) to facilitate the navigation in later phases. We achieve this phase depending on a hybrid segmentation method. Then the system represents the extracted visual elements as symbols using a graphical language. The third phase is to browse these graphical symbols depending on the size of the used touched-screen device; and in the fourth phase, our system provides a vibro-tactile feedback when the blind user touches the tablet by giving the user a vibro-tactile feed-back by transforming light contrasts of touch-screen devices into low-frequencies tactile vibrations. A tablet (Asus Model TF101 with Android operating system) has being used for our tests. To achieve the desired system, we have designed an electronic circuit, which controls two micro-vibrators placed on two fingers. A Bluetooth connection with an android tablet allows controlling the vibration intensity (i.e. amplitude) of vibrators. An Android dedicated program on the tablet views an image on the screen and detects where the user touches the tablet screen (the viewed image represents the result of web page segmentation). The intensity of the light emitted by the tablet at touched points is then transmitted to the embedded device in order to control the vibration intensity. In this paper, we focus only on the first phase (extracting visual structures in the navigated web page, and convert them into zones), with considering that detailed description of hardware components of the system, and re-sults of pre-tests are described in [Maurel et al, 2012] and [Maurel et al, 2013].
4 Related Works
Segmenting a web page is a fundamental phase for understanding its global structure. Extracting the global structure of web pages is useful in many domains such as information retrieval, data extraction, and similarity of web pages.
Many approaches have been suggested for segmenting web pages, such as: -1) DOM-based segmentation: it depends on analyzing the DOM tree (Document Object Model), and extracting the main structure of web pages depending on HTML tags. An example of this approach is the work of [Sanoja et al, 2013], which determines firstly the layout template of a web page, and then it divides the page into minimum blocks, and finally collects these minimum blocks into content blocks. -2) Vision-based segmentation: this method divides the web page depending on the visual view of web page contents on a web browser. The most famous tool depends on this approach is VIPS (VIsion based Page Segmentation) [Deng et al, 2003]. -3) Image processing based segmentation: this approach captures an image for the visual view of a web page, and then depends on image processing techniques to divide the captured image into sub blocks [Cai et al, 2004] [Cao et al, 2010]. -4) Text-based Segmentation: this approach focuses on extracting only information about texts existed in a web page. After dividing the web page into blocks of texts, it could be possible to find the seman-tic relations between these textual blocks. This method is useful in many information retrieval do-mains such as question answering applications [Foucault e al, 2013]. -5) Fixed-length segmentation: this approach divides the web pages into fixed length blocks (pas-sages), after removing all HTML tags, where each passage contains a fixed number of words [Callan, 1994]. -6) Densitometric analysis based segmentation: this approach depends on methods applied in quantita-tive linguistics, where text-density refers to a measure for identifying important textual segments of a web page [Kohlschütter et al, 2008]. -7) Graph-based segmentation: This approach depends on transforming the visual segments of a web page into graph nodes, then applying many common graph methods on these nodes for combining
97

them into blocks, or for making a clustering for these nodes. Some common works which depend on this approach are [Chakrabarti et al, 2008] [Liu et al, 2011]. -8) and Hybrid-based segmentation: This approach combines many approaches indicated previously.
5 Suggested Hybrid Segmentation Algorithm
Most of segmentation algorithms render firstly the web page using a web browser, and then segments the HTML elements into many blocks depending on the visual layout. The constructed hybrid segmen-tation algorithm has been tested on 154 pages collected manually from many newspaper and e-commerce sites (www.leparisien.fr, www.lefigaro.fr, www.liberation.fr, www.amazon.fr, www.materiel.net), and the results have been integrated with our under-development Android pro-gram. The obtained results are promised because the segmentation algorithm can extract well the web page blocks depending on the visual structure, and the algorithm can also convert correctly these blocks into zones (clustering the blocks). Our algorithm blends three segmentation approaches, DOM-based segmentation, vision-based segmentation, and graph-based segmentation.
Proposed Corpora
To achieve the previous mentioned model, we construct two corpora, one for training, and another for testing. We selected many criteria for crawling web pages, such as, the type of crawled pages (infor-mation web sites, and e-commerce web sites), the size (about 10,000 pages), the language (French), the version of web site (Classic, Mobile), and the technology used to build the crawled web site (framework JavaScript: JQuery, mootools, ... / CMS: Prestashop, Drupal, Joomla...).
5.1 Vision-Based Approach
In this phase, we render the web page using Mozilla FireFox browser, and getting its visual structure by injection Java-script code inside the HTML source code of the rendered web page. The obtained visual structure indicates a global hierarchy of the rendered web page, and assigns a bounding box for each HTML element. Figure 1.a represents a part of a web page, and the result of its vision-based segmentation is presented in figure 1.b.
(a) A part of a web page (b) Vision-based segmentation Figure 1. A part of a web page (leparisien.fr) and its vision-based segmentation
The input of this phase is a web page HTML source code, and its output is injected information about bounding boxes for each HTML element. In next sections, we refer to bounding boxes by blocks (i.e. each bounding box represents an HTML element, and may contain other bounding boxes.).
5.2 DOM-Based Approach
After segmenting a web page depending on its visual structure, we analyze its DOM structure by ap-plying filters and re-organization rules for enhancing results of next phases. Dead-Nodes filter is an example of these filters: it deletes all HTML nodes that do not affect on the appearance, for example nodes with height or width equals to “0px” (zero pixel); or nodes with style properties ("display :
98

none" or "visibility:hidden"). An example of re-organization rules is Paragraph-Reorganization rule, where this rule re-constructs all paragraph child-nodes in one node contains the extracted text; we made this rule after analyzing many DOM structures, and observing that some paragraph nodes con-tain child-nodes which affect negatively on extracting the text, such as <i>, <span>, etc.., and these child-nodes contain important texts. We made many filters and re-organization rules, and integrated them with our framework, and then we tested applying these rules and filters on the vision-based seg-mented web pages (154 pages mentioned previously). As a result of applying the two approaches (vi-sion-based and DOM-based), we succeeded to get the first glance visual structure for many pages.
The result of this phase is a filtered DOM-tree, each of its nodes is visible and contains a bounding box information. Figure 1.b represents a hierarchy of some HTML nodes, the first level contains 3 main blocks (B1, B2, and B3), and each one contains many sub blocks, for example B3 contains B3-1 and B3-2.
To illustrate results of applying previous two mentioned approaches, we represented an obtained fil-tered DOM-tree on the used tablet. Figure 2 views a graphical representation for a page web, since each rectangle represents a block in the analyzed web page. Red rectangles represent images (<img> tags), green rectangles represent links (<a> tags), blue rectangles represent list of items (<ul> or <ol> tags), and finally, black rectangles represent paragraphs (<p> tags).
Figure 2. A graphical representation for a page web (leparisien.fr)
5.3 Graph-Based Approach
After segmenting the web page depending on its visual structures and analyzing its DOM-structure, we apply a new graph-based segmentation algorithm which called “Blocks2Zones Clustering” in order to group many similar blocks together in one zone. Clustering many blocks together is necessary in order to decrease the number of viewed blocks in some interfaces (instead of viewing many blocks, we view one zone represents these blocks and then the user can navigate intra-elements inside the zone by double clicking on the graphical element of the chosen zone.), and to group closed blocks in one zone (here, closeness depends on distances between blocks, this will be described next sections in details). The pseudo-code of the proposed algorithm is:
Blocks2Zones Clustering Algorithm Input (Blocks, ° of desired Zones) Output: Graph of nodes ( Zones) 1- Transform the blocks into a graph (on-Directed graph)
1.1. Blocks odes,
1.2. Make relations between the nodes, and assign weights for these relations.
2- If number of zones >= number of blocks
end the algorithm,
Else
3- Find the node with the smallest size (node A) (Figure 3.a (6 zones), Figure 3.b (5 zones))
4- For node A, find the relation which has the largest weight (node B). (Figure 3.a (6 zones),
Figure 3.b (5 zones))
5- Group the nodes A, and B (A+B). (Figure 3.a (5 zones), Figure 3.b (4 zones))
6- Repeat steps 3-4-5 till number of blocks == number of zones
99
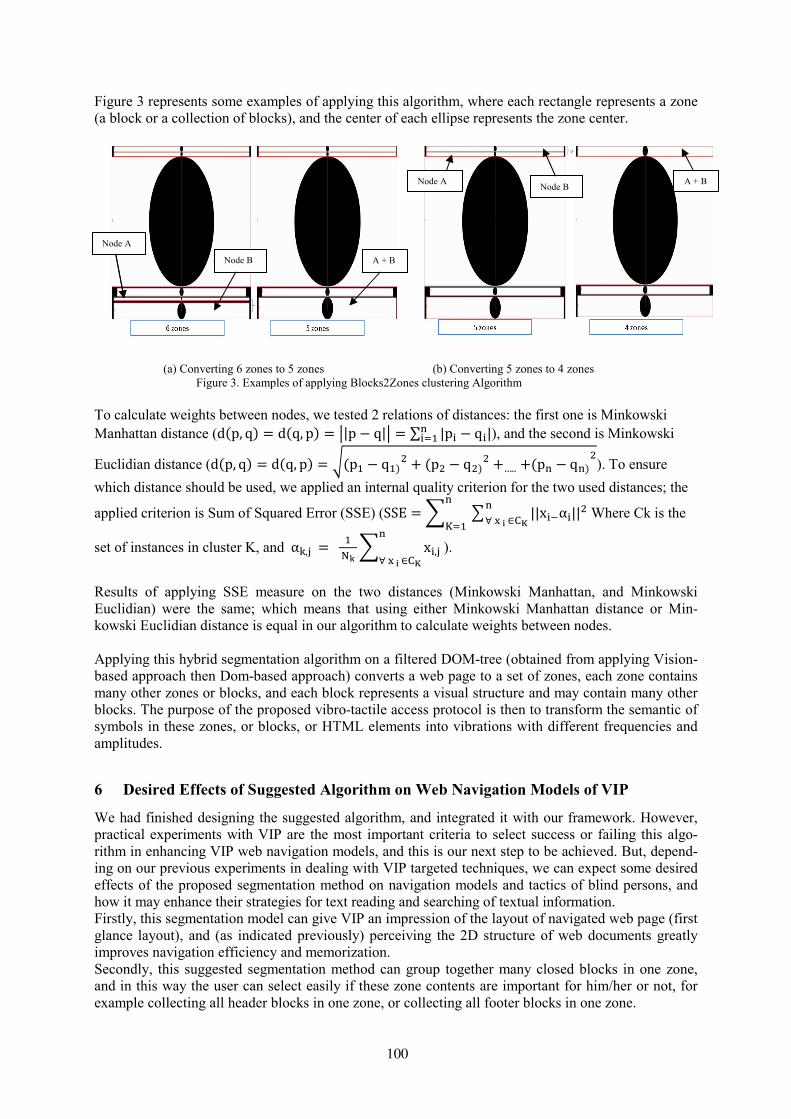
Figure 3 represents some examples of applying this algorithm, where each rectangle represents a zone (a block or a collection of blocks), and the center of each ellipse represents the zone center.
(a) Converting 6 zones to 5 zones (b) Converting 5 zones to 4 zones
Figure 3. Examples of applying Blocks2Zones clustering Algorithm To calculate weights between nodes, we tested 2 relations of distances: the first one is Minkowski Manhattan distance (dp, q = dq, p = |p − q| = ∑ |p − q| ), and the second is Minkowski
Euclidian distance (dp, q = dq, p = p − q + p − q +….. +p − q ). To ensure
which distance should be used, we applied an internal quality criterion for the two used distances; the
applied criterion is Sum of Squared Error (SSE) (SSE = ||xα|| ∀ ∈CK
K
Where Ck is the
set of instances in cluster K, and α$,% = N' x,%
∀ ∈CK).
Results of applying SSE measure on the two distances (Minkowski Manhattan, and Minkowski Euclidian) were the same; which means that using either Minkowski Manhattan distance or Min-kowski Euclidian distance is equal in our algorithm to calculate weights between nodes. Applying this hybrid segmentation algorithm on a filtered DOM-tree (obtained from applying Vision-based approach then Dom-based approach) converts a web page to a set of zones, each zone contains many other zones or blocks, and each block represents a visual structure and may contain many other blocks. The purpose of the proposed vibro-tactile access protocol is then to transform the semantic of symbols in these zones, or blocks, or HTML elements into vibrations with different frequencies and amplitudes.
6 Desired Effects of Suggested Algorithm on Web 4avigation Models of VIP
We had finished designing the suggested algorithm, and integrated it with our framework. However, practical experiments with VIP are the most important criteria to select success or failing this algo-rithm in enhancing VIP web navigation models, and this is our next step to be achieved. But, depend-ing on our previous experiments in dealing with VIP targeted techniques, we can expect some desired effects of the proposed segmentation method on navigation models and tactics of blind persons, and how it may enhance their strategies for text reading and searching of textual information. Firstly, this segmentation model can give VIP an impression of the layout of navigated web page (first glance layout), and (as indicated previously) perceiving the 2D structure of web documents greatly improves navigation efficiency and memorization. Secondly, this suggested segmentation method can group together many closed blocks in one zone, and in this way the user can select easily if these zone contents are important for him/her or not, for example collecting all header blocks in one zone, or collecting all footer blocks in one zone.
Node B A + B
Node A
Node A Node B
A + B
Node A
100

Thirdly, this model can allow high level text reading strategies such as rapid or cursory reading or lo-cating information, this can be achieved by ignoring navigating any zone does not contain textual in-formation. By the way if one zone contains textual information, the user can navigate it and decide if it contains important information for him/her or not.
7 CO4CLUSIO4 A4D PERSPECTIVES
In this paper, we summarized our current work which aims to design an approach for non-visual ac-cess to web pages on touch-screen devices, and we focused on the suggested hybrid segmentation al-gorithm. We expect that integrating this method of segmentation with the designed vibro-tactile proto-col can give VIP an impression of the first glance layout of web pages. In the same way that the environment enables a blind person to move in space with sidewalks and tex-tures which will be explored by his/her white cane, we hope giving the blind user an ability to navigate documents depending on "textual sidewalks" and "graphical paths" which will be discovered by his/her finger. Next steps in this research will be 1) making real experiments to study effects of suggested segmenta-tion algorithm on VIP web navigation models, 2) adding advances techniques in text summarization to facilitate navigating textual information, 3) adding elements to the graphical vibro-tactile language in order to represent more HTML elements such links, buttons, input fields, and other elements, 4) we plan also to add thermic actuators for translating the notion of colors. This may be very useful and hopeful for blind users to transfer information about colors.
8 References
[1] Maurel, F., Dias, G., Routoure, J-M., Vautier, M., Beust, P., Molina, M., Sann, C., « Haptic Per-
ception of Document Structure for Visually Impaired People on Handled Devices », Procedia Compu-ter Science, Volume 14, Pages 319-329, ISSN : 1877-0509, 2012. DOI=http://dx.doi.org/10.1016/j.procs.2012.10.036 [2] Maurel, F., Vigouroux, N., Raynal, M., Oriola, B., « Contribution of the Transmodality Concept to
Improve Web Accessibility ». In Assistive Technology Research Series, Volume 12, 2003, Pages 186-193. International conference; 1st, Smart homes and health telematics; Independent living for persons with disabilities and elderly people. ISSN : 1383-813X. 2003. [3] http://www.chromevox.com/ [Access 24/5/2014] [4] http://www.synapseadaptive.com/gw/wineyes.htm [Access 24/5/2014] [5] http://www.freedomscientific.com/ [Access 24/5/2014] [6]https://play.google.com/store/apps/details?id=es.codefactory.android.app.ma.vocalizerfrfdemo&hl=fr [Access 24/5/2014] [7] https://play.google.com/store/apps/details?id=com.google.android.marvin.talkback&hl=fr [Access 24/5/2014] [8] http://www.apple.com/fr/accessibility/ [Access 24/5/2014] [9] Alaeldin, A., Mustafa , Y., Sharief, B., 2012. « Tactile Webavigator Device for Blind and Visual-
ly Impaired People ». In Proceedings of the 2011 Jordan Conference on Applied Electrical Enginee-ring and Computing Technologies, Jordan, 2011. DOI=http://dx.doi.org/10.1109/AEECT.2011.6132519 [10] Rotard, M., Knödler, S., Ertl, T., « A Tactile Web Browser for the Visually Disabled ». In Procee-dings of the sixteenth ACM Conference on Hypertext and Hypermedia. ACM, New York, NY, USA, 2005, pages 15-22, 2005. DOI= http://dx.doi.org/10.1145/1083356.1083361 [11] BouIssa , Y., Mojahid, M., Oriola, B., Vigouroux, N., « Accessibility for the Blind, an Automated
Audio/Tactile Description of Pictures in Digital Documents ». IEEE International Conference on Ad-vances in Computational Tools for Engineering Applications, 2009, Pages: 591 – 594, 2009. DOI=http://dx.doi.org/10.1109/ACTEA.2009.5227855
101

[12] Lenay, C., Gapenne, O., Hanneton, S., Marque, C., Genouëlle, C., “Sensory Substitution, Limits
and Perspectives». In Touch for Knowing Cognitive psychology of haptic manual perception, Am-sterdam, Pages: 275-292, 2003,
[13] Tixier, M., Lenay, C., Le-Bihan, G., Gapenne, O., Aubert, D., « Designing Interactive Content
with Blind Users for a Perceptual Supplementation System », TEI 2013, 2013, in Proceedings of the 7th International Conference on Tangible, Embedded and Embodied Interaction, Barcelona, Spain, Pages 229-236, 2013. DOI= http://dx.doi.org/10.1145/2460625.2460663
[14] Maurel, F., Safi, W., Beust, P., Routoure, J.M., « avigation aveugle sur dispositifs mobiles :
toucher le Web... pour mieux l'entendre», 16ème Colloque International sur le Document Électronique, CIDE16, Lille, France, Europia productions, 2013. [15] Sanoja, A., Gançarski, S., «Block-o-Matic: a Web Page Segmentation Tool», BDA. Nantes, France. 2013. http://hal.archives-ouvertes.fr/hal-00881693/ [16] Deng, C., Shipeng, Y., Ji-Rong, W., Wei-Ying, M., «VIPS: a Vision-based Page Segmentation
Algorithm», Nov. 1, 2003, Technical Report MSR-TR-2003-79, Microsoft Research. 2003. http://research.microsoft.com/pubs/70027/tr-2003-79.pdf [17] Cai, D., He, X., Ma, W-Y., Wen, J-R., Zhang, H., 2004. « Organizing WWW Images Based on the
Analysis Of Page Layout And Web Link Structure», Microsoft Research Asia, Beijing, China, 2004. http://research.microsoft.com/pubs/69080/25.pdf [18] Cao, J., Mao, B., Luo, J., « A segmentation method for web page analysis using shrinking and
dividing», International Journal of Parallel, Emergent and Distributed Systems - Network and parallel computing, Volume 25 Issue 2, April 2010. Pages: 93-104, 2010. DOI=http://dx.doi.org/10.1080/17445760802429585 [19] Foucault, N., Rosset, S., Adda, G., « Pré-segmentation de pages web et sélection de documents
pertinent en Questions-Réponses», TALN-RÉCITAL 2013. [20] Callan, J.P., 1994. « Passage- level Evidence in Document Retrieval», the Seventeenth Annual International ACM SIGIR Conference on Research and Development in Information Retrieval, Du-blin, Pages: 302-310. Publisher: Springer-Verlag New York, Inc, 1994. http://dl.acm.org/citation.cfm?id=188589 [21] Kohlschütter, C., Nejdl, W., « A Densitometric Approach to Web Page Segmentation», USA, CIKM’08, Proceedings of the 17th ACM conference on Information and knowledge management, 2008. Pages: 1173-1182. DOI: http://dx.doi.org/10.1145/1458082.1458237 [22] Chakrabarti, D., Kumar, R., Punera, K., 2008. «A graph-theoretic approach to webpage segmen-
tation». Proceedings of the 17th international conference on World Wide Web, WWW'08, ACM, USA, 2008. Pages: 377-386. Publisher: ACM New York, NY, USA, 2008. DOI: http://dx.doi.org/10.1145/1367497.1367549 [23] Liu, X., Lin, H., Tian, Y., 2011. “Segmenting Webpage with Gomory-Hu Tree Based Clustering”, Journal of Software, Vol 6, No 12, Pages: 2421-2425. 2011.
102

Proceedings of the 25th International Conference on Computational Linguistics, pages 103–105,Dublin, Ireland, August 23-29 2014.
Expression Recognition by Using Facial And Vocal Expressions
Gholamreza Anbarjafari IMS Lab
Institute of Technology University of Tartu
Tartu, Estonia [email protected]
Alvo Aabloo IMS Lab
Institute of Technology University of Tartu
Tartu, Estonia [email protected]
Abstract
Human behaviour may be monitored by analysing facial expressions and vocal expressions. Hence an automatic technique which combines both these features will give a more accurate overall estimation of expression. In this work we propose a new method which is uses facial and vocal features to estimate the expression of the subject. Facial expressions are analysed
by extracting important facial features and then clustering the movement of these features. In parallel the voice is processed by using considering sudden changes in amplitude and fre-
quency in order to recognize the expression. Finally a weighted sum rule is used to combine the decisions obtained by facial and vocal expression recognition. The proposed technique is
tested on an ongoing set of real data monitored by a psychologist.
1 Introduction
Human-computer interaction has been centre of interest of many researchers for a number of years [1- 3]. In order to facilitate this interaction it is essential for the computer system, for example a robot, to understand the feelings of the user [4, 5]. Recognition of emotions has been mainly achieved by using facial expression recognition [6, 7]. Techniques using k-nearest neighbour [8], hidden Makrov model (HMM) [9], and translation of belief model [10] have been frequently used for implementation of facial expression recognition.
Vocal expression recognition has also been used separately for expression recognition [11, 12]. The combination of both facial and vocal expression is novel and many researchers are investigating an intelligent model for this fusion [13]. One of the main issues with these techniques is the application of HMM as the hidden states are usually unknown and need to be estimated based on assumed probability distributions of the data [14]. In this work we are proposing a new expression recognition tech- nique which is using both facial and vocal expressions in order to estimate the expression of the speaker. The proposed technique is benefiting from the facial and vocal features. The proposed technique is evaluated with many volunteers sitting in front of a camera under controlled illumination reading texts with expressions of happiness, sadness, disgust, surprise, anger, fear, and contempt. The initial experimental results are promising showing that the proposed technique out performs other current techniques.
2 The Proposed Expression Recognition Technique
In the proposed technique two parallel observations are made. Firstly the facial features are detected using the Viola-Jones face detector. The important features are corners of lips, upper and lower part of lips, corners and centre of eyes, nose, nose tip, corners of eyebrows, and chin. Then movements of these facial features will be used in order to recognize each of the seven basic emotions. Fig. 1 is showing the important features on the facial image which are used for expression recognition.
This work is licensed under a Creative Commons Attribution 4.0 International Licence. License details: http://creativecommons.org/licenses/by/4.0/
103

Fig. 1: 20 important facial features which are being used for facial expression recognition.
In addition important features of the voice of the subject are analysed. First the system will be trained by a vocal input with neutral emotion. In order to recognise expression changes in the tone of the voice will be monitored by the sudden changes in amplitude and mid and high frequencies.
The extracted features from face and voice will be combined by using weighted sum in which the weights are being assigned by experts and can be modified. In the early experimental results, the normalize weights were 3/5 and 2/5 for face and voice respectively. More imporvement is expected to achieved if supported vector machine (SVM) is employeed for fusion of the facial and vocal features. The initial experiments conducted on the different volunteers are showing the exact recognition of expressions for sadness, happiness, surprise, and anger. However expressions of contempt and fear are not being recognized properly due to their high misinterpretation with other expressions. The primarly tests are conducted on a small datasets and on the continuation of the work a standard database containing both facial and vocal senarios will be used.
3 Conclusion
In this paper we were proposing a new technique for recognition of expressions by using facial and vocal expression recognition using weighted sum. The proposed technique has been tested on a small set of group of people. The early experimental results show the high potential of the proposal as an accurate expression recognition technique.
Reference [reference stub]
1. Z. Obrenovic and D. Starcevic, "Modeling multimodal human-computer interaction", Computer, 2004, 37(9), 65- 72.
2. S. Benbelkacem, M. Belhocine, N. Zenati-Henda, A. Bellarbi, and M. Tadjine, "Integrating human-computer interaction and business practices for mixed reality systems design: a case study", IET Software, 2014, 8(2), 86-101.
3. A. Kucukyilmaz, T. M. Sezgin, and C. Basdogan, "Intention Recognition for Dynamic Role Exchange in Haptic Collaboration", IEEE Transaction on Haptics, 2013, 6(1), 56-68.
4. Y. Tie and L. Guan, "A Deformable 3-D Facial Expression Model for Dynamic Human Emotional State Recogni- tion", IEEE Transactions on Circuits and Systems for Video Technology, 2013, 23(1), 142-157.
5. M. Pantic and L. J. M. Rothkrantz, "Toward an affect-sensitive multimodal human-computer interaction", Pro- cessing of the IEEE, 2003, 91(9), 1370-1390.
6. M. S. Bartlett, G. Littlewort, M. G. Frank, C. Lainscsek, I. R. Fasel, and J. R. Movellan, "Automatic recognition of facial actions in spontaneous expressions", Journal of Multimedia, 2006, 1(6), 22–35.
7. J. F. Cohn, L. I. Reed, Z. Ambadar, J. Xiao, T. Moriyama, and T. Moriyama, "Automatic analysis and recognition of brow actions and head motion in spontaneous facial behavior", IEEE International Conference on Systems, Man and Cybernetics, 2004, 610–616.
8. M. Yeasin, B. Bullot, and R. Sharma, "From facial expression to level of interest: A spatio-temporal approach", IEEE Coference on Computer Vision and Pattern Recognition, 2004, 922–927.
104

9. I. Cohen, N. Sebe, A. Garg, L. S. Chen, and T. S. Huang, "Facial expression recognition from video sequences: temporal and static modeling", Computer Vision Image Understanding, 2003, 91(1-2), 160–187.
10. Z. Hammal and M. Kunz,"Pain monitoring: A dynamic and context-sensitive system", Pattern Recognition, 2012, 45(4), 1265–1280.
11. T. L. Nwe, S. W. Foo, and L. C. D. Silva, "Speech emotion recognition using hidden markov models", Speech Communication, 2003, 41(4), 603–623.
12. A. Nogueiras, A. Moreno, A. Bonafonte, and J. B. Marino, "Speech emotion recognition using hidden markov models", proceeding of INTER-SPEECH, 2001, 2679–2682.
13. H. Meng and N. Bianchi-Berthouze, "Affective State Level Recognition in Naturalistic Facial and Vocal Expres- sions", IEEE Transaction on Cybernetics, 2014, 44(3), 315-325.
14. F. Eyben, S. Petridis, B. Schuller, G. Tzimiropoulos, and S. Zafeiriou, "Audiovisual classification of vocal out- bursts in human conversation using long-short-term memory networks", International Conference on Acoustics, Speech and Signal Processing, 2011, 5844–5847.
105

Proceedings of the 25th International Conference on Computational Linguistics, pages 106–108,Dublin, Ireland, August 23-29 2014.
Formulating Queries for Collecting Training Examples in Visual ConceptClassification
Rami Albatal, Kevin McGuinness, Feiyan Hu, Alan F. SmeatonInsight Centre for Data Analytics
Dublin City UniversityGlasnevin, Dublin 9, Ireland.
Abstract
Video content can be automatically analysed and indexed using trained classifiers which maplow-level features to semantic concepts. Such classifiers need training data consisting of setsof images which contain such concepts and recently it has been discovered that such trainingdata can be located using text-based search to image databases on the internet. Formulating thetext queries which locate these training images is the challenge we address here. In this paperwe present preliminary results on TRECVid data of concept classification using automaticallycrawled images as training data and we compare the results with those obtained from manuallyannotated training sets.
1 Introduction
Content-based access to video archives is based on learning the presence of semantic concepts in videocontent by mapping low-level features like colour and texture, to high-level concepts. Concept clas-sification is typically based on training classifiers on a set of annotated ground truth images (called atraining set) containing positive and negative example images of a given semantic concept. The man-ual creation of training sets for each concept is a time-consuming and costly task. An alternative is toautomatically gather training examples using available resources on the Internet. Several recent papershave demonstrated the effectiveness of such an approach. (Griffin, 2006) used search engine results togather material for learning the appearance of categories, (Chatfield and Zisserman, 2013) shows thateffective classifiers can be trained on-the-fly at query time using examples collected from Google Imagesearch. The AXES research search engine (McGuinness et al., 2014) uses a combination of pre-trainedclassifiers and on-the-fly classifiers trained using examples from Google Image search. (Kordumova etal., 2014) investigate four practices for collecting training negative and positive examples from sociallytagged videos and images.
The above work exploits the visual content of the collected example images while the question ofhow to formulate a textual query for collecting the data is not yet considered. It is important to notehere that current search engines are not use content-based image classifiers, they are based the text fromthe embedding pages, and that is not always accurate or scalable. This represents a unique relationshipbetween vision (the images used to train a concept classifier) and language (the text used to find thosetraining images). In this work, we initiate a first step to addressing the problem of formulating textqueries that collect positive example images for classifier training. This first step is based on queryingweb resources with single-term queries and comparing the classification results with those from manuallyannotated training sets. The results show the potential of automatic crawling and open the way forenhancing query formulation by adding external lexical or semantic resources.
This work is licensed under a Creative Commons Attribution 4.0 International Licence. Licence details: http://creativecommons.org/licenses/by/4.0/
106
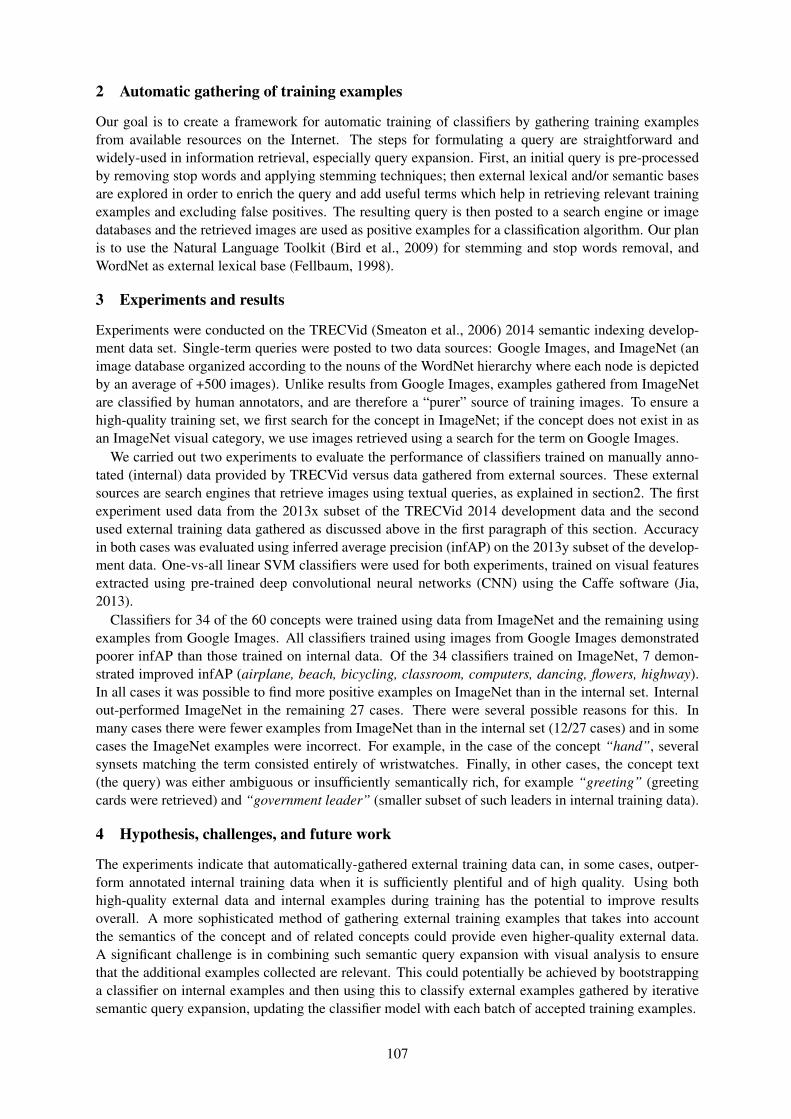
2 Automatic gathering of training examples
Our goal is to create a framework for automatic training of classifiers by gathering training examplesfrom available resources on the Internet. The steps for formulating a query are straightforward andwidely-used in information retrieval, especially query expansion. First, an initial query is pre-processedby removing stop words and applying stemming techniques; then external lexical and/or semantic basesare explored in order to enrich the query and add useful terms which help in retrieving relevant trainingexamples and excluding false positives. The resulting query is then posted to a search engine or imagedatabases and the retrieved images are used as positive examples for a classification algorithm. Our planis to use the Natural Language Toolkit (Bird et al., 2009) for stemming and stop words removal, andWordNet as external lexical base (Fellbaum, 1998).
3 Experiments and results
Experiments were conducted on the TRECVid (Smeaton et al., 2006) 2014 semantic indexing develop-ment data set. Single-term queries were posted to two data sources: Google Images, and ImageNet (animage database organized according to the nouns of the WordNet hierarchy where each node is depictedby an average of +500 images). Unlike results from Google Images, examples gathered from ImageNetare classified by human annotators, and are therefore a “purer” source of training images. To ensure ahigh-quality training set, we first search for the concept in ImageNet; if the concept does not exist in asan ImageNet visual category, we use images retrieved using a search for the term on Google Images.
We carried out two experiments to evaluate the performance of classifiers trained on manually anno-tated (internal) data provided by TRECVid versus data gathered from external sources. These externalsources are search engines that retrieve images using textual queries, as explained in section2. The firstexperiment used data from the 2013x subset of the TRECVid 2014 development data and the secondused external training data gathered as discussed above in the first paragraph of this section. Accuracyin both cases was evaluated using inferred average precision (infAP) on the 2013y subset of the develop-ment data. One-vs-all linear SVM classifiers were used for both experiments, trained on visual featuresextracted using pre-trained deep convolutional neural networks (CNN) using the Caffe software (Jia,2013).
Classifiers for 34 of the 60 concepts were trained using data from ImageNet and the remaining usingexamples from Google Images. All classifiers trained using images from Google Images demonstratedpoorer infAP than those trained on internal data. Of the 34 classifiers trained on ImageNet, 7 demon-strated improved infAP (airplane, beach, bicycling, classroom, computers, dancing, flowers, highway).In all cases it was possible to find more positive examples on ImageNet than in the internal set. Internalout-performed ImageNet in the remaining 27 cases. There were several possible reasons for this. Inmany cases there were fewer examples from ImageNet than in the internal set (12/27 cases) and in somecases the ImageNet examples were incorrect. For example, in the case of the concept “hand”, severalsynsets matching the term consisted entirely of wristwatches. Finally, in other cases, the concept text(the query) was either ambiguous or insufficiently semantically rich, for example “greeting” (greetingcards were retrieved) and “government leader” (smaller subset of such leaders in internal training data).
4 Hypothesis, challenges, and future work
The experiments indicate that automatically-gathered external training data can, in some cases, outper-form annotated internal training data when it is sufficiently plentiful and of high quality. Using bothhigh-quality external data and internal examples during training has the potential to improve resultsoverall. A more sophisticated method of gathering external training examples that takes into accountthe semantics of the concept and of related concepts could provide even higher-quality external data.A significant challenge is in combining such semantic query expansion with visual analysis to ensurethat the additional examples collected are relevant. This could potentially be achieved by bootstrappinga classifier on internal examples and then using this to classify external examples gathered by iterativesemantic query expansion, updating the classifier model with each batch of accepted training examples.
107

ReferencesSteven Bird, Ewan Klein, and Edward Loper. 2009. Natural Language Processing with Python. O’Reilly Media,
Inc., 1st edition.
Ken Chatfield and Andrew Zisserman. 2013. Visor: Towards on-the-fly large-scale object category retrieval. InComputer Vision ACCV 2012, volume 7725 of Lecture Notes in Computer Science, pages 432–446.
Christiane Fellbaum, editor. 1998. WordNet: an electronic lexical database. MIT Press.
Lewis D Griffin. 2006. Optimality of the basic colour categories for classification. Multimedia Tools and Appli-cations, 3.6:71–85.
Yangqing Jia. 2013. Caffe: An open source convolutional architecture for fast feature embedding. http://caffe.berkeleyvision.org/.
S. Kordumova, X. Li, and C. G. M. Snoek. 2014. Best practices for learning video concept detectors from socialmedia examples. Multimedia Tools and Applications, pages 1–25, May.
Kevin McGuinness, Robin Aly, Ken Chatfield, Omkar Parkhi, Relja Arandjelovic, Matthijs Douze, Max Kemman,Martijn Kleppe, Peggy Van Der Kreeft, Kay Macquarrie, et al. 2014. The AXES research video search system.In IEEE International Conference on Acoustics, Speech, and Signal Processing.
Alan F Smeaton, Paul Over, and Wessel Kraaij. 2006. Evaluation campaigns and TRECVid. In Proceedings ofthe 8th ACM international workshop on Multimedia information retrieval, pages 321–330. ACM.
108

Proceedings of the 25th International Conference on Computational Linguistics, pages 109–111,Dublin, Ireland, August 23-29 2014.
Towards Succinct and Relevant Image Descriptions
Desmond ElliottInstitute of Language, Communication, and Computation
School of InformaticsUniversity of [email protected]
What does it mean to produce a good description of an image? Is a description good because itcorrectly identifies all of the objects in the image, because it describes the interesting attributes of theobjects, or because it is short, yet informative? Grice’s Cooperative Principle, stated as “Make yourcontribution such as is required, at the stage at which it occurs, by the accepted purpose or directionof the talk exchange in which you are engaged” (Grice, 1975), alongside other ideas of pragmatics incommunication, have proven useful in thinking about language generation (Hovy, 1987; McKeown etal., 1995). The Cooperative Principle provides one possible framework for thinking about the generationand evaluation of image descriptions.1
The immediate question is whether automatic image description is within the scope of the CooperativePrinciple. Consider the task of searching for images using natural language, where the purpose of theexchange is for the user to quickly and accurately find images that match their information needs. In thisscenario, the user formulates a complete sentence query to express their needs, e.g. A sheepdog chasingsheep in a field, and initiates an exchange with the system in the form of a sequence of one-shot con-versations. In this exchange, both participants can describe images in natural language, and a successfuloutcome relies on each participant succinctly and correctly expressing their beliefs about the images. Itfollows from this that we can think of image description as facilitating communication between peopleand computers, and thus take advantage of the Principle’s maxims of Quantity, Quality, Relevance, andManner in guiding the development and evaluation of automatic image description models.
An overview of the image description literature from the perspective of Grice’s maxims can be foundin Table 1. The most apparent ommission is the lack of research devoted to generating minimally infor-mative descriptions: the maxim of Quantity. Attending to this maxim will become increasingly importantas the quality and coverage of object, attribute, and scene detectors increases. It would be undesirable todevelop models that describe every detected object in an image because that would be likely to violate themaxim of Quantity (Spain and Perona, 2010). Similarly, if it is possible to associate an accurate attributewith each object in the image, it will be important to be sparing in the application of those attributes: isit relevant to describe “furry” sheep when there are no sheared sheep in an image?
How should image description models be evaluated with respect to the maxims of the CooperativePrinciple? So far model evaulation has focused on automatic text-based measures, such as UnigramBLEU and human judgements of semantic correctness (see Hodosh et al. (2013) for discussion of framingimage description as a ranking task, and Elliott and Keller (2014) for a correlation analysis of text-basedmeasures against human judgements). The semantic correctness judgements task typically present avariant of “Rate the relevance of the description for this image”, which only evaluates the description vis-a-vis the maxim of Relevance. One exception is the study of Mitchell et al. (2012), in which judgementsabout the ordering of noun phrases (the maxim of Manner) were also collected. The importance ofbeing able to evaluate according to multiple maxims becomes clearer as computer vision becomes moreaccurate. It seems intuitive that a model that describes and relates every object in the image couldbe characterised as generating Relevant and Quality descriptions, but not necessarily descriptions of
This work is licensed under a Creative Commons Attribution 4.0 International Licence. Licence details: http://creativecommons.org/licenses/by/4.0/
1This discussion primarily applies to image descriptions, and not to image captions. See (Hodosh et al., 2013) and (Panof-sky, 1939) for a discussion of the differences between descriptions and captions.
109
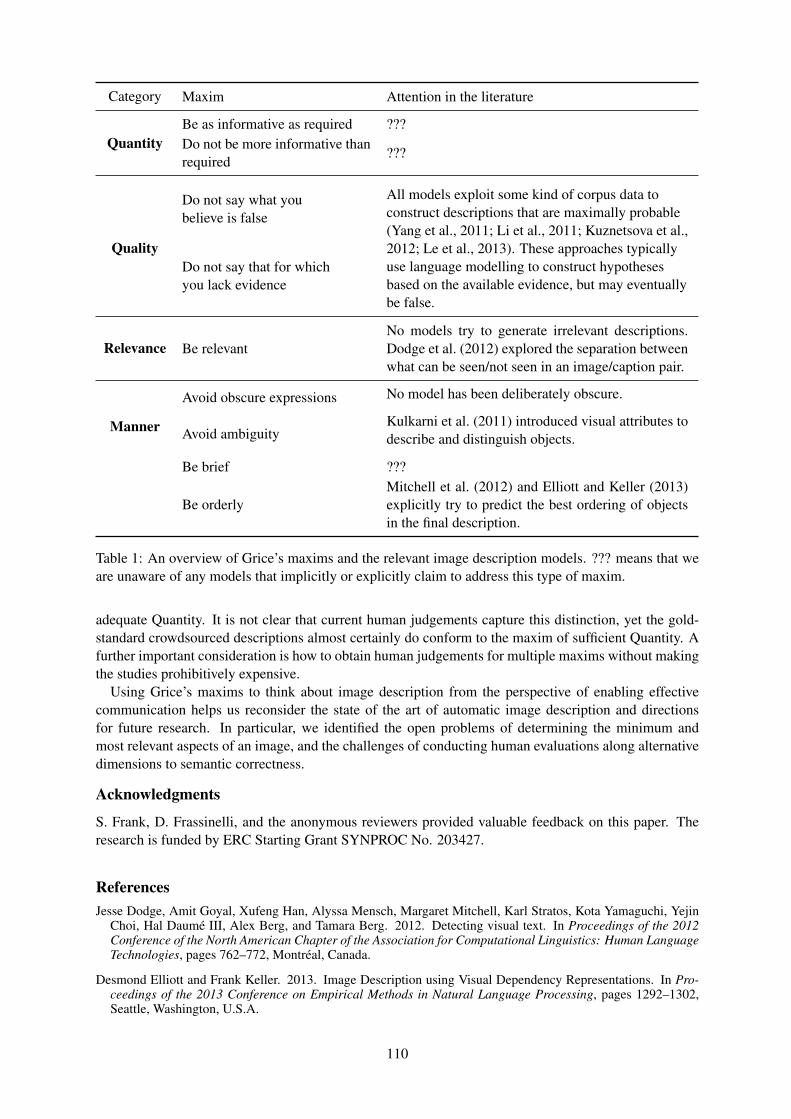
Category Maxim Attention in the literature
QuantityBe as informative as required ???Do not be more informative thanrequired
???
Quality
Do not say what youbelieve is false
All models exploit some kind of corpus data toconstruct descriptions that are maximally probable(Yang et al., 2011; Li et al., 2011; Kuznetsova et al.,2012; Le et al., 2013). These approaches typicallyuse language modelling to construct hypothesesbased on the available evidence, but may eventuallybe false.
Do not say that for whichyou lack evidence
Relevance Be relevantNo models try to generate irrelevant descriptions.Dodge et al. (2012) explored the separation betweenwhat can be seen/not seen in an image/caption pair.
Manner
Avoid obscure expressions No model has been deliberately obscure.
Avoid ambiguityKulkarni et al. (2011) introduced visual attributes todescribe and distinguish objects.
Be brief ???
Be orderlyMitchell et al. (2012) and Elliott and Keller (2013)explicitly try to predict the best ordering of objectsin the final description.
Table 1: An overview of Grice’s maxims and the relevant image description models. ??? means that weare unaware of any models that implicitly or explicitly claim to address this type of maxim.
adequate Quantity. It is not clear that current human judgements capture this distinction, yet the gold-standard crowdsourced descriptions almost certainly do conform to the maxim of sufficient Quantity. Afurther important consideration is how to obtain human judgements for multiple maxims without makingthe studies prohibitively expensive.
Using Grice’s maxims to think about image description from the perspective of enabling effectivecommunication helps us reconsider the state of the art of automatic image description and directionsfor future research. In particular, we identified the open problems of determining the minimum andmost relevant aspects of an image, and the challenges of conducting human evaluations along alternativedimensions to semantic correctness.
Acknowledgments
S. Frank, D. Frassinelli, and the anonymous reviewers provided valuable feedback on this paper. Theresearch is funded by ERC Starting Grant SYNPROC No. 203427.
ReferencesJesse Dodge, Amit Goyal, Xufeng Han, Alyssa Mensch, Margaret Mitchell, Karl Stratos, Kota Yamaguchi, Yejin
Choi, Hal Daume III, Alex Berg, and Tamara Berg. 2012. Detecting visual text. In Proceedings of the 2012Conference of the North American Chapter of the Association for Computational Linguistics: Human LanguageTechnologies, pages 762–772, Montreal, Canada.
Desmond Elliott and Frank Keller. 2013. Image Description using Visual Dependency Representations. In Pro-ceedings of the 2013 Conference on Empirical Methods in Natural Language Processing, pages 1292–1302,Seattle, Washington, U.S.A.
110

Desmond Elliott and Frank Keller. 2014. Comparing Automatic Evaluation Measures for Image Description.In Proceedings of the 52nd Annual Meeting of the Association for Computational Linguistics, pages 452–457,Baltimore, Maryland, U.S.A.
H. Paul Grice. 1975. Logic and Conversation. In P. Cole and J. L. Morgan, editors, Syntax and Semantics 3:Speech Arts, pages 41–58. Academic Press, Inc.
Micah Hodosh, Peter Young, and Julia Hockenmaier. 2013. Framing Image Description as a Ranking Task: Data,Models and Evaluation Metrics. Journal of Artificial Intelligence Research, 47:853–899.
E Hovy. 1987. Generating natural language under pragmatic constraints. Journal of Pragmatics, 11(6):689–719.
Girish Kulkarni, Visruth Premraj, Sagnik Dhar, Siming Li, Yejin Choi, Alexander C. Berg, and Tamara L. Berg.2011. Baby talk: Understanding and generating simple image descriptions. In 2011 IEEE Conference onComputer Vision and Pattern Recognition, pages 1601–1608, Colorado Springs, Colorado, U.S.A.
Polina Kuznetsova, Vicente Ordonez, Alexander C. Berg, Tamara L. Berg, and Yejin Choi. 2012. CollectiveGeneration of Natural Image Descriptions. In Proceedings of the 50th Annual Meeting of the Association forComputational Linguistics, pages 359–368, Jeju Island, South Korea.
Dieu Thu Le, Jasper Uijlings, and Raffaella Bernardi. 2013. Exploiting language models for visual recognition.In Proceedings of the 2013 Conference on Empirical Methods in Natural Language Processing, pages 769–779,Seattle, Washington, U.S.A.
Siming Li, Girish Kulkarni, Tamara L. Berg, Alexander C. Berg, and Yejin Choi. 2011. Composing simple imagedescriptions using web-scale n-grams. In Proceedings of the Fifteenth Conference on Computational NaturalLanguage Learning, pages 220–228, Portland, Oregon, U.S.A.
K McKeown, J Robin, and K Kukich. 1995. Generating concise natural language summaries. InformationProcessing & Management, 31(5):703–733.
Margaret Mitchell, Jesse Dodge, Amit Goyal, Kota Yamaguchi, Karl Stratos, Alyssa Mensch, Alex Berg, TamaraBerg, and Hal Daum. 2012. Midge : Generating Image Descriptions From Computer Vision Detections. InProceedings of the 13th Conference of the European Chapter of the Association for Computational Linguistics,pages 747–756, Avignon, France.
Erwin Panofsky. 1939. Studies in Iconology. Oxford University Press.
Merrielle Spain and Pietro Perona. 2010. Measuring and Predicting Object Importance. International Journal ofComputer Vision, 91(1):59–76.
Yezhou Yang, Ching Lik Teo, Hal Daume III, and Yiannis Aloimonos. 2011. Corpus-Guided Sentence Generationof Natural Images. In Proceedings of the Conference on Empirical Methods in Natural Language Processing,pages 444–454, Edinburgh, Scotland, UK.
111

Proceedings of the 25th International Conference on Computational Linguistics, pages 112–114,Dublin, Ireland, August 23-29 2014.
Coloring Objects: Adjective-Noun Visual Semantic Compositionality
Dat Tien Nguyen(1,2) Angeliki Lazaridou(2) Raffaella Bernardi(2)
(1)EM LCT, (2)University of Trento/ [email protected]
Abstract
This paper reports preliminary experiments aiming at verifying the conjecture that semantic com-positionality is a general process irrespective of the underlying modality. In particular, we modelcompositionality of an attribute with an object in the visual modality as done in the case of an ad-jective with a noun in the linguistic modality. Our experiments show that the concept topologiesin the two modalities share similarities, results that strengthen our conjecture.
1 Language and Vision
Recently, fields like computational linguistics and computer vision have converged to a common way ofcapturing and representing the linguistic and visual information of atomic concepts, through vector spacemodels. At the same time, advances in computational semantics have lead to effective and linguisticallyinspired approaches of extending such methods from single concepts to arbitrary linguistic units (e.g.phrases), through means of vector-based semantic composition (Mitchell and Lapata, 2010).
Compositionality is not to be considered only an important component from a linguistic perspective,but also from a cognitive perspective and there has been efforts to validate it as a general cognitiveprocess. However, in computer vision so far compositionality has received limited attention. Thus, inthis work, we study the phenomenon of visual compositionality and we complement limited previousliterature that has focused on event compositionality (Stottinger et al., 2012) or general image struc-ture (Socher et al., 2011), by studying models of attribute-object semantic composition.
In a nutshell, our work consists of learning vector representations of attribute-object (e.g., “red car”,“cute dog” etc.) and objects (e.g., “car”, “dog”, “truck”, “cat” etc.) and by using those compute therepresentation of new objects having similar attributes (“red truck”, “cute cat” etc.). This question hasboth theoretical and applied impact. The possibility of developing a visual compositional model ofattribute-object, on the one hand, could shed light on the acquisition of such ability in humans; how welearn attribute representation and compose them with different objects is still an open question within thecognitive science community (Mintz and Gleitman, 2002). On the other hand, computer vision systemscould become generative and be able to recognize unseen attribute-object combinations, a componentespecially useful for object recognition and image retrieval.
2 Visual Compositional Model
As our source of inspiration regarding the type of compositionality, we use the Lexical Functional model(LF) (Baroni and Zamparelli, 2010), under which adjectives, in linguistic compositionality, are repre-sented as linear functions (i.e., matrix of weights). Concretely, each adjective function fW
adj is inducedfrom corpus-observed vectors of adjective-noun phrases wi ∈ Wphrase and noun wj ∈ Wnoun, e.g.,〈(wred car, wcar), (wred flag, wflag), . . .〉, by solving the least-squares regression problem:
arg minfW
adj∈Rd×d
||Wphrase − fWadjWnoun||
This work is licensed under a Creative Commons Attribution 4.0 International Licence. License details:http://creativecommons.org/licenses/by/4.0/
112
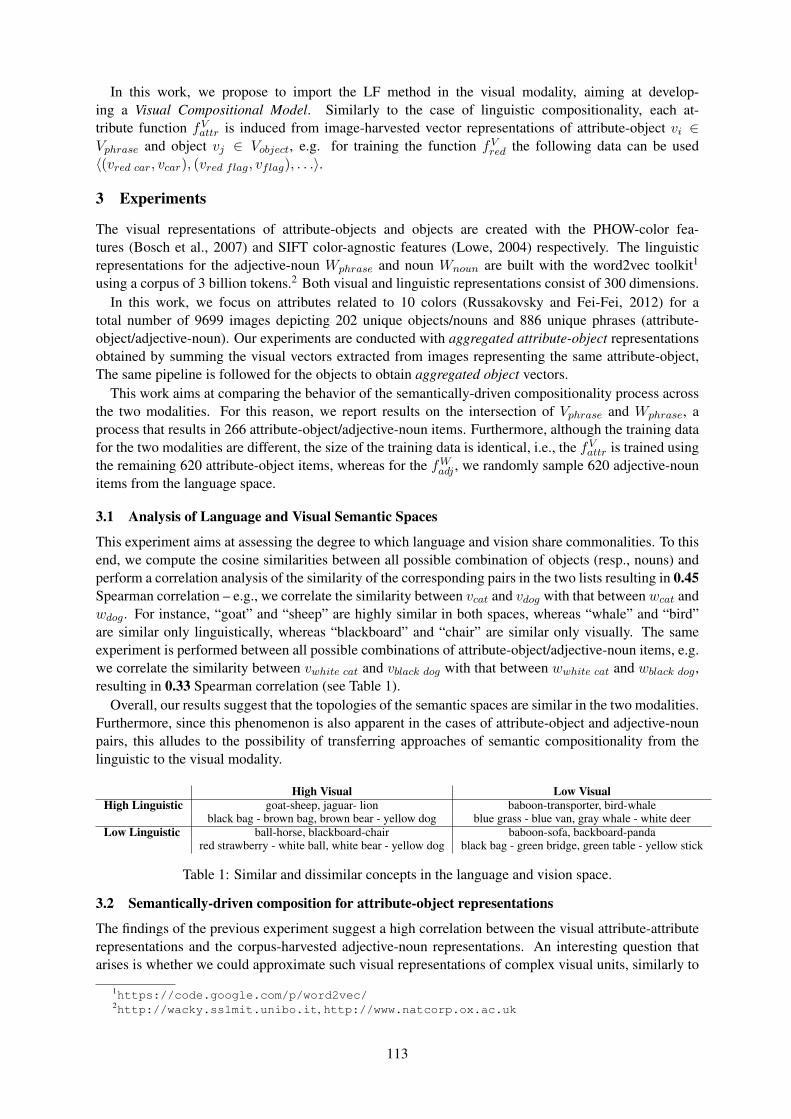
In this work, we propose to import the LF method in the visual modality, aiming at develop-ing a Visual Compositional Model. Similarly to the case of linguistic compositionality, each at-tribute function fV
attr is induced from image-harvested vector representations of attribute-object vi ∈Vphrase and object vj ∈ Vobject, e.g. for training the function fV
red the following data can be used〈(vred car, vcar), (vred flag, vflag), . . .〉.
3 Experiments
The visual representations of attribute-objects and objects are created with the PHOW-color fea-tures (Bosch et al., 2007) and SIFT color-agnostic features (Lowe, 2004) respectively. The linguisticrepresentations for the adjective-noun Wphrase and noun Wnoun are built with the word2vec toolkit1
using a corpus of 3 billion tokens.2 Both visual and linguistic representations consist of 300 dimensions.In this work, we focus on attributes related to 10 colors (Russakovsky and Fei-Fei, 2012) for a
total number of 9699 images depicting 202 unique objects/nouns and 886 unique phrases (attribute-object/adjective-noun). Our experiments are conducted with aggregated attribute-object representationsobtained by summing the visual vectors extracted from images representing the same attribute-object,The same pipeline is followed for the objects to obtain aggregated object vectors.
This work aims at comparing the behavior of the semantically-driven compositionality process acrossthe two modalities. For this reason, we report results on the intersection of Vphrase and Wphrase, aprocess that results in 266 attribute-object/adjective-noun items. Furthermore, although the training datafor the two modalities are different, the size of the training data is identical, i.e., the fV
attr is trained usingthe remaining 620 attribute-object items, whereas for the fW
adj , we randomly sample 620 adjective-nounitems from the language space.
3.1 Analysis of Language and Visual Semantic Spaces
This experiment aims at assessing the degree to which language and vision share commonalities. To thisend, we compute the cosine similarities between all possible combination of objects (resp., nouns) andperform a correlation analysis of the similarity of the corresponding pairs in the two lists resulting in 0.45Spearman correlation – e.g., we correlate the similarity between vcat and vdog with that between wcat andwdog. For instance, “goat” and “sheep” are highly similar in both spaces, whereas “whale” and “bird”are similar only linguistically, whereas “blackboard” and “chair” are similar only visually. The sameexperiment is performed between all possible combinations of attribute-object/adjective-noun items, e.g.we correlate the similarity between vwhite cat and vblack dog with that between wwhite cat and wblack dog,resulting in 0.33 Spearman correlation (see Table 1).
Overall, our results suggest that the topologies of the semantic spaces are similar in the two modalities.Furthermore, since this phenomenon is also apparent in the cases of attribute-object and adjective-nounpairs, this alludes to the possibility of transferring approaches of semantic compositionality from thelinguistic to the visual modality.
High Visual Low VisualHigh Linguistic goat-sheep, jaguar- lion baboon-transporter, bird-whale
black bag - brown bag, brown bear - yellow dog blue grass - blue van, gray whale - white deerLow Linguistic ball-horse, blackboard-chair baboon-sofa, backboard-panda
red strawberry - white ball, white bear - yellow dog black bag - green bridge, green table - yellow stick
Table 1: Similar and dissimilar concepts in the language and vision space.
3.2 Semantically-driven composition for attribute-object representations
The findings of the previous experiment suggest a high correlation between the visual attribute-attributerepresentations and the corpus-harvested adjective-noun representations. An interesting question thatarises is whether we could approximate such visual representations of complex visual units, similarly to
1https://code.google.com/p/word2vec/2http://wacky.sslmit.unibo.it, http://www.natcorp.ox.ac.uk
113

how is done in Computational Linguistics for approximating the text-based representations of adjective-noun phrases. Thus, this experiment is designed in order to assess the validity of the semantically-drivencompositionality approach in the visual domain. Results are reported in Table 2. Since we expect thatthe quality of the aggregated vectors depends on the numbers of available images, we report results forsubsets of the original data set that differ on the number of images per phrase.
By means of the LF composition method sketched in Section 2, we obtain the compositional represen-tations of attribute-object (V comp
phrase) and adjective-noun (W compphrase) items. We then perform the correlation
analyses between the similarities obtained in the composed visual space V compphrase with: 1) the equiva-
lent image-harvested representations Vphrase, 2) the equivalent corpus-derived linguistic representationsWphrase, 3) the equivalent compositionally-derived linguistic representations W comp
phrase.Overall, the correlation between V comp
space and Vspace suggests that the visual compositionality ofattribute-object can account, to some extend, for the visual semantics of the respective image, and itfurther improves with the number of images we consider for obtaining the aggregated vectors of the vi-sual phrases. Finally, as expected, the correlations between V comp
space although lower than the ones reportedin Section 3.1, i.e., 0.22 vs 0.32, are still non negligible.
all phrases > 10 images > 20 images > 30 imagesV comp
phrase - Vphrase 0.24 0.40 0.53 0.58
V compphrase - Wphrase 0.10 0.22 0.19 0.23
V compphrase - W comp
phrase 0.04 0.05 0.18 0.10
Table 2: Spearman correlations between the similarities in the V compphrase and other semantic spaces.
4 Conclusions
In this work, we have experimented with semantically-driven compositionality of attributes with objectsin the visual modality, by adopting an out-of-the-box composition method from the computational se-mantics literature. Our preliminary results have shown that the visual representations of attribute-objectswhen obtained compositionally reflect properties similar not only to the ones found in representationsharvested automatically from images, but also from those extracted from text corpora. These resultsshow that semantic compositionality might be a general process irrespective of the underlying modality.We have just scratched the surface on this topic and in the future we plan to experiment with a largervariety of attributes and use and design alternative visual compositional models.AcknowledgementsThe second and third author acknowledge ERC 2011 Starting Independent Research Grant n. 283554(COMPOSES). We thank the 3 anonymous reviewers for their comments, Marco Baroni and Elia Brunifor their constant and useful feedback.
References[Baroni and Zamparelli2010] Marco Baroni and Roberto Zamparelli. 2010. Nouns are vectors, adjectives are
matrices: Representing adjective-noun constructions in semantic space. In Proceedings of EMNLP, 1183–1193.[Bosch et al.2007] Anna Bosch, Andrew Zisserman, and Xavier Munoz. 2007. Image classification using random
forests and ferns. In Proceedings of ICCV, 1–8.[Lowe2004] David G Lowe. 2004. Distinctive image features from scale-invariant keypoints. International
Journal of Computer Vision, 60:91–110.[Mintz and Gleitman2002] Toben H. Mintz and Lila R. Gleitman. 2002. Adjectives really do modify nouns: the
incremental and restricted nature of early adjective acquisition. Cognition, 84:267–293.[Mitchell and Lapata2010] Jeff Mitchell and Mirella Lapata. 2010. Composition in distributional models of
semantics. Cognitive Science, 34(8):1388–1429.[Russakovsky and Fei-Fei2012] Olga Russakovsky and Li Fei-Fei. 2012. Attribute learning in large-scale datasets.
In Trends and Topics in Computer Vision, 1–14. Springer.[Socher et al.2011] Richard Socher, Cliff C Lin, Chris Manning, and Andrew Y Ng. 2011. Parsing natural scenes
and natural language with recursive neural networks. In Proceedings of ICML, 129–136.[Stottinger et al.2012] J. Stottinger, J.R.R. Uijlings, A.K. Pandey, N. Sebe, and F. Giunchiglia. 2012. (unseen)
event recognition via semantic compositionality. In CVPR.
114

Proceedings of the 25th International Conference on Computational Linguistics, pages 115–117,Dublin, Ireland, August 23-29 2014.
Multi-layered Image Representation for Image Interpretation
Marina Ivasic-Kos, Miran Pobar, Ivo Ipsic Department of Informatics
University of Rijeka
R. Matejcic 2, Rijeka, Croatia
marina, mpobar, [email protected]
Abstract
In order to bridge the semantic gap between the visual context of an image and semantic con-
cepts people would use to interpret it, we propose a multi-layered image representation model
considering different amounts of knowledge needed for the interpretation of the image at each
layer. Interpretation results on different semantic layers of Corel images related to outdoor
scenes are presented and compared. Obtained results show positive correlation of precision and
recall with the abstract level of classes used for image annotation, i.e. more generalized classes
have achieved better results.
1 Introduction
Image captions and surrounding text can facilitate the retrieval of images if they exist, but the vast ma-
jority of images are not annotated with words. A number of methods have been developed in recent
years to automatically annotate images with words that users might intuitively use when searching for
them. This problem is challenging because different people will most likely interpret the same image
with different words on different levels of abstraction. Used words reflect their knowledge about the
context of the image, experience, cultural background, etc.
On the other hand, annotation methods deal with visual features such as color, texture and shape
that can be extracted from raw image data, so the major goal is to bridge the semantic gap between the
available features and the interpretation of the images in the way humans do. The idea is to define an
image representation model that will reflect the semantic levels of words used in image interpretation.
2 Multi-layered Image Representation
Among the oldest models of image interpretation is Shatford’s (1986) model that suggests image
content classification into general, specific and abstract. Eakins and Graham (2000) have defined three
semantic layers of image interpretation considering the context of image search. The first layer corre-
sponds to the presence of certain combinations of low-level features, the second to the types of objects
and the third to descriptions of events, activities, locations or emotions that one can associate with the
image.
We propose an image representation model that follows the simplified hierarchical model of (Hare
et al,. 2006) that captures the layers between the two extremes, the "raw" data of the image and its full
semantics. Such image representation includes the visual content of an image and the concepts used to
interpret it on different layers of image representation, Fig.1. The initial layer of representation of an
image is the layer V0, representing the raw image. The image is usually segmented (layer V1) using
methods for automatic image segmentation or into a grid. The low-level features are then extracted
from the image segments (layer V2).
The next four layers, MI1 to MI4, are related to different levels of semantic interpretation. The se-
mantics includes elementary classes - EC into which image segments are classified, classes that de-
scribe the scene - SC, generalization classes - GC and derived classes – DC, organized in a hierarchy
as shown in Fig 1.
This work is licensed under a Creative Commons Attribution 4.0 International License. Page numbers and proceedings footer
are added by the organizers. License details: http://creativecommons.org/licenses/by/4.0/
115

Fig. 1. Layers of image representation in relation to the knowledge level
Elementary classes correspond to objects that can be recognised in an image, like sky, water and rock
for image in Fig. 1. Scene classes represent the context of the whole image, like seaside, and can be
either directly obtained as a result of global classification of image features or inferred from the ele-
mentary classes. Generalization classes are defined as a generalization of scene classes, like scenery,
natural scene and outdoor scene. Between generalisation classes the aggregation or generalization rela-
tion is defined. Derived classes include abstract concepts that can be associated with an image, like
specific place such as the island of Cres, or emotion e.g. solitude.
The amount of knowledge required for segmentation and extraction of features in layers V1 and V2
is low, while the amount of knowledge required for interpreting the image in the semantic layers MI1
to MI4 increases. Most automatic image annotation methods are generative or discriminative models
(Zhang, et al., 2012) and work with image interpretation at layers MI1 and MI2. For image interpreta-
tion at layers MI3 and MI4 knowledge representation models and a reasoning engine are needed.
3 Experiment
Our goal was to compare image interpretation results on different semantic layers. We have used a
part of the Corel image database related to outdoor scenes. The data set consisted of 500 images seg-
mented with the n-cuts algorithm. For each image segment a 16D feature vector was computed
based on CIE L*a*b* colour model and geometric properties (size, position, height, width and shape
of the area) of image segments (Duygulu et al., 2002). The segments were labeled with one of the 28
keywords related to natural and artificial objects such as 'airplane', 'bird', ‘lion’, ‘train’ etc. and back-
ground objects like 'ground', 'sky', ‘water’ etc. The keywords correspond to the elementary classes.
Some image segments were too small and couldn’t be labeled manually and were excluded from data.
The final data set used for the experiment consists of 3960 segments. The data was divided into
training (3160) and testing (800) subsets by a 10-fold cross validation with 20% of the observations
for the holdout cross-validation.
For image classification into elementary classes Bayesian classifier was used according to the maxi-
mum posterior probability ( ):
(1)
The conditional probability of a feature vector for the given elementary classes
and the prior probability are estimated according to data in the train-
ing set. It is taken into account that the evidence factor is a scale factor that does not influence the
classification results and is not calculated.
116

The results of the image-segments classification are compared with the ground truth and the precision
and recall measures are calculated. The achieved average precision for classification of elementary
classes is 32.6% and average recall is 27.5%.
To predict concepts on layers MI2 and higher we have used the knowledge representation scheme
based on fuzzy Petri nets with an integrated fuzzy inference engine (Ribaric and Pavesic, 2009). The
fuzzy knowledge base contains the following main components: fuzzy spatial and co-occurrence rela-
tionships between elementary classes, fuzzy aggregation relationships between elementary classes and
scene classes, and fuzzy generalization relationships between scene classes and generalization classes.
The knowledge chunks considering spatial and co-occurrence relationships as well as aggregation rela-
tionships are computed from the training set. The training set is also used to estimated the truth of
these relationships. The hierarchical and generalization relationships are defined according to expert
knowledge and so is their truth. There were 15 scene classes defined in the knowledge base such as
Scene Lion, Scene Shuttle and Seaside and 13 generalization classes on different levels of abstraction,
such as Wild Cats, Wildlife, Natural Scene, and Man-Made Objects.
The obtained results show positive correlation of precision and recall with the abstract level of se-
mantic concepts used for image interpretation. For scene classes achieved results are little bit higher
than for elementary classes, with precision of 37% and 31% for recall. For generalised classes the ob-
tained results are significantly better, with precision of 52% and recall of 42%.
In Table 1, some positive examples of a multilayered image interpretation following the proposed
model are shown.
Image example:
Multi-layered
image
interpretation
MI1 ‘shuttle' 'train', 'tracks ', 'sky' - 'grass', 'tiger' 'water', 'sand', 'sky’, 'road'
MI2 'Scene Shuttle', 'Scene Train', 'Scene Tiger', 'Seaside',
MI3 'Vehicle', 'Man-Made
Object', 'Outdoor’
'Vehicle', 'Man-Made
Object', 'Outdoor’
'Wildcat', 'Wildlife', 'Natural
Scenes', 'Outdoor Scene'
'Natural Scenes', 'Outdoor
Scene'
MI4 ‘Space’ ‘Transport’ - ‘Vacation’
Table 1. Examples of multilayered image interpretation
4 Conclusion
The suggested model of image representation corresponds to the interpretation of images that are in-
herent to humans. It involves image interpretation at different semantic levels. For each semantic level
we tested interpretation accuracy on outdoor scenes and positive correlations of precision and recall
with respect to the abstract level of semantic concepts were obtained.
Reference
P. Duygulu, K. Barnard, J. F. G. de Freitas, and D. A. Forsyth. 2002. Object recognition as machine
translation: Learning a lexicon for a fixed image vocabulary, ECCV 2002, UK, pp. 97–112.
J. Eakins and M. Graham. 2000. Content-based image retrieval. Technical Report JTAP-039, JISC,
Institute for Image Data Research, University of Northumbria, Newcastle.
J. S. Hare, P. H. Lewis, P. G. B. Enser and C. J. Sandom. 2006. Mind the Gap: Another look at the
problem of the semantic gap in image retrieval. Multimedia Content Analysis, Management and
Retrieval, USA.
S. Ribaric and N. Pavesic. 2009. Inference Procedures for Fuzzy Knowledge Representation Scheme,
Applied Artificial Intelligence, vol. 23, 2009, pp. 16-43.
D. Zhang, M. M. Islam and G. Lu. 2012. A review on automatic image annotation techniques. Pattern
Recognition, 45(1), 346-362.
117

Proceedings of the 25th International Conference on Computational Linguistics, pages 118–120,Dublin, Ireland, August 23-29 2014.
The Last 10 Metres: Using Visual Analysis and Verbal Communication inGuiding Visually Impaired Smartphone Users to Entrances
Anja BelzComputing, Engineering and Maths
University of BrightonLewes Road, Brighton BN2 4GJ, [email protected]
Anil BharathDepartment of BioengineeringImperial College London
Prince Consort Road, London SW7 2BP, [email protected]
1 IntroductionBlindness and partial sight are increasing, due to changing demographics and greater incidence of dis-eases such as diabetes, at vast financial and human cost (WHO, 2013). Organisations for the visuallyimpaired stress the importance of independent living, of which safe and independent travel is an integralpart. While existing smartphone facilities such as Apple’s Siri are encouraging, the supporting localisa-tion services are not sufficiently accurate or precise to enable navigation between e.g. a bus stop or taxirank and the entrance to a public space such as a hospital, supermarket or train station.
In this paper, we report plans and progress to date of research addressing ‘the problem of the Last 10Metres.’ We are developing methods for safely guiding users not just to the general vicinity of a targetdestination (as done by GPS-based services), but right up to the main entrance of the target destination,by a combination of semantically and visually enriched maps, visual analysis, and language generation.
2 OverviewThe core task is to help users navigate approach paths to building entrances. Navigation guidance isdelivered via a smartphone app with voice and haptic output. The app uses detailed, semantically taggedmaps in which public buildings (museums, schools, hospitals, etc.) and the pavements, landmarks andother visual cues found in the approaches to their entrances (See Figure 2) are annotated. The maps differfrom existing resources in that they have (i) more detailed information on pedestrian-relevant features,including obstructions and hazards, and (ii) computational descriptions of ‘visual paths,’ i.e. informationabout approach paths to entrances including image sequencess taken along the path (visual cues).
The navigation app provides guidance from the point where a GPS-based system drops the user: the-oretically within 10m of a destination building, but in reality, anything up to a few hundred metres awayfrom the actual building entrance. Our research is focused on developing a novel pedestrian guidance sys-tem that uses semantically and visually enriched maps, visual cues from user-generated live-feed video,and verbal and haptic communication to guide visually impaired pedestrians during the last few metresto the entrance of their destination, dropping them not just somewhere near, say, the British Museum, butmore precisely and much more challengingly, right in front of the museum’s main entrance.
3 Usage ScenarioThe user employs their usual GPS-based app to get near a target destination, then our Last 10m app takesover: (1) User requests guidance to an entrance to their target building; (2) System retrieves relevantlocal map from server; (3) System converts guidance request to a specific target entrance T annotatedon map; (4) Given location of T on map, system determines location U of user on map; (5) Systemcomputes approach path P from U to T ; (6) System starts guiding user along P ; at the same timesystem carries out continuous monitoring of user behaviour and surroundings, interacting with user asnecessary: (a) System monitors that user stays on track; (b) System monitors path ahead to identify anyobstacles; (c) System issues warnings and update information as necessary, and deals with user requests,e.g. information about an object detected by the user, location updates or output modality changes.
This work is licensed under a Creative Commons Attribution 4.0 International Licence. Page numbers and proceedings footerare added by the organisers. Licence details: http://creativecommons.org/licenses/by/4.0/
118

Figure 1: Illustration of the navigational context that we are addressing.
4 Key Challenges4.1 Mapping ChallengesSemantically enriched local maps: Using OpenStreetMap,1 which already includes many different kindsof relevant ‘urban’ tags such as ‘tree’, ‘bus stop’, ‘post box’, ‘traffic signals’, etc., as a starting point,we are investigating ways of involving some of the 1.5 million volunteer mappers to create a new OSMlayer of highly fine-grained local information and snapshots of visual cues.
Computing path from U to T: Adapting methods developed for similar purposes (Zeng et al., 2008),compute geometric paths from U to T ; if necessary recompute these paths on the fly on the basis ofobstacles that have been detected (see below).
4.2 Vision ChallengesLocating user on map based on visual cues: The task is to locate the user precisely on the map (withina given radius determined on the basis of GPS output) by identifying landmarks and visual cues in user-generated live feed and matching these to the tags and images in the semantically enriched local maps.In a pilot study (Rivera-Rubio et al., 2013), conducted within indoor, but highly ambiguous corridors, wehave found that with relatively modest processes, paths can be distinguished with reasonable certaintyusing visual cues alone. In more extensive tests, verified with surveying equipment (Rivera-Rubio et al.,2014), we found that user location on a path can be inferred from hand-held and wearable cameras.
Continuous route monitoring: (a) monitoring of path ahead to identify obstacles and other dangerusing computer vision techniques and map information, (b) monitoring actual path against target path,updating target path and adapting instructions to user as necessary. Monitoring is based on local maps, vi-sual information obtained on the fly (Davison et al., 2007; Alcantarilla et al., 2010; Pradeep and Medioni,2010) from smartphone camera live feeds, as well as information from inertial sensors, etc.
4.3 Communication ChallengesWhile ‘smart canes’ are promising technological improvements for visually impaired (VI) navigation,our research has shown that the VI community sharply divides into white cane users and guide dogowners, with the latter category in particular objecting to the use of a white cane. For this reason weare focusing on smartphone apps delivering verbal and haptic output (which is suitable for both types ofusers). We view the main communication challenges to be the following.
Interaction Management: Managing (a) the interaction between user and system, including allowinguser interrupts and system alerts, and (b) any resulting changes to system behaviour. This includesallowing the user to input navigation and configuration options for the route before or during the journey.
Communicating navigation guidance: In the absence of interrupts from the continuous route moni-toring processes described above, the system communicates route guidance along the target path to theuser. We will carry out detailed requirements analyses to determine what kind of instructions and what
1http://www.openstreetmap.org
119

level of detail are most useful. While the assumption is that most instructions are best communicated viabrief spoken outputs, a core question is what part of the guidance can be delivered by haptic output, e.g.different types/locations of vibration indicating different direction/speed of movement.
Communicating warnings: The properties required of warnings differ from navigation guidance, inthat the nature of the danger and the required user reaction need to be conveyed as quickly and as effi-ciently as possible, with information ordered in terms of urgency. It is likely that a larger proportion ofwarnings (than of navigation instructions) are best conveyed by haptic and simple audio output.
Communicating uncertainty: If the system detects a hazard in the path ahead, identification of thetype of hazard and appropriate user action will come with a confidence measure < 1. The degree ofuncertainty in what the system has identified must be conveyed to the user. E.g. if a postbox is tagged inthe map, and the continuous monitoring component has detected an object ahead that it has recognisedwith high confidence as a postbox, then it may be enough to simply steer the user around it. However, ifthe system detects an obstruction at head height which is not annotated in the map and which it classifieswith similar confidence levels as several things, then this uncertainty has to be expressed in the verbaloutput, and the user may have to further investigate.
Communicating varying levels of detail: Similarly, when describing a hazard or verbalising routeguidance, not all the detail about objects and routes available to the system needs to be conveyed to theuser in every situation. For this purpose the system design incorporates a content selection component(CSC) which decides the appropriate level of detail given the context.
A suitable way to generate verbal output in line with the above communication requirements is proba-bilistic natural language generation (NLG) technology (Belz, 2008) which offers the possibility of auto-matically training the verbal output generator to adapt to different user requirements and usage contexts.
5 Current WorkWe are currently in the early stages of developing the various components of the Last 10m system. Wehave carried out preliminary experiments in indoors path recognition identification (Rivera-Rubio et al.,2013; 2014), and conducted initial consultation sessions with VI people. The next step is to designWizard-of-Oz experiments in order to obtain sizeable corpora of example instructions (produced byhumans playing the role of the system) appropriate in a variety of contexts which is then used both fortraining NLG components and for other aspects of system design. At the same time we are improvingthe path computation algorithms (which provide important input to the CSC), using, for the time being,a small number of semantically and visually enriched local maps of entrances at our universities.
ReferencesP. F. Alcantarilla, L. M. Bergasa, and F. Dellaert. 2010. Visual odometry priors for robust EKF-SLAM. In
Proceedings of the 2010 IEEE International Conference on Robotics and Automation, pages 3501–3506.
A. Belz. 2008. Automatic generation of weather forecast texts using comprehensive probabilistic generation-spacemodels. Natural Language Engineering, 14(4):431–455.
A. Davison, I. D. Reid, N. D. Molton, and O. Stasse. 2007. MonoSLAM: Real-time single camera SLAM. IEEETransactions on Pattern Analysis and Machine Intelligence, 29(6):1052–1067.
V. Pradeep and G. Medioni. 2010. Robot vision for the visually impaired. In Proceedings of the 2010 ComputerVision and Pattern Recognition Workshop (CVPR), pages 15–22.
J. Rivera-Rubio, S. Idrees, I. Alexiou, L. Hadjilucas, and A.A. Bharath. 2013. Mobile visual assistive apps:Benchmarks of vision algorithm performance. In New Trends in Image Analysis and Processing (ICIAP 2013),volume 8158 of Lecture Notes in Computer Science, pages 30–40.
J. Rivera-Rubio, I. Alexiou, A.A. Bharath, R. Secoli, Dickens, and E. Lupu. 2014. Associating locations fromwearable cameras. In Proceedings of the 25th British Machine Vision Conference. To Appear.
WHO. 2013. Visual impairment and blindness. Fact Sheet No. 282, World Health Organization.
Q. Zeng, C. L. Teo, B. Rebsamen, and E. Burdet. 2008. Collaborative path planning for a robotic wheelchair.Disability and Rehabilitation Assistive Technology, 3(6):315–324.
120

Proceedings of the 25th International Conference on Computational Linguistics, pages 121–123,Dublin, Ireland, August 23-29 2014.
Keyphrase Extraction using Textual and Visual Features*
* This work is licensed under a Creative Commons Attribution 4.0 International Licence. License de-
tails: http://creativecommons.org/licenses/by/4.0/
Yaakov HaCohen-Kerner1, Stefanos Vrochidis
2, Dimitris Liparas
2, Anastasia Moumtzidou
2,
Ioannis Kompatsiaris2
1 Dept. of Computer Science, Jerusalem College of Technology – Lev Academic Center,
21 Havaad Haleumi St., P.O.B. 16031, 9116001 Jerusalem, Israel, [email protected] 2 Information Techologies Institute, Centre for Research and Technology Hellas, Thermi-
Thessaloniki, Greece, stefanos, dliparas, moumtzid, [email protected]
Abstract
Many current documents include multimedia consisting of text, images and embedded videos. This pa-
per presents a general method that uses Random Forests to automatically extract keyphrases that can be
used as very short summaries and to help in retrieval, classification and clustering processes.
1 Introduction
A keyphrase is an important concept, presented either as a single word (unigram), e.g.: 'extraction',
'keyphrase' or as a collocation, i.e., a meaningful group of two or more words, e.g.: 'keyphrase extrac-
tion'. Keyphrases can be regarded as very short summaries and can be used for representing documents
in retrieval, classification and clustering problems.
Nowadays, many documents (e.g. web pages, articles) include multimedia consisting of text, imag-
es and embedded videos. In this case, the keyphrase extraction process should not be limited to the
textual data but also consider the audiovisual data.
In this context, this paper proposes a novel framework for automatic keyphrase extraction from
documents containing text and images based on supervised learning and textual and visual features.
2 Baseline Methods for Keyphrase Extraction
In this section, we introduce the baseline methods we use for keyphrase extraction using textual and
visual information.
2.1 Textual Keyprhase Extraction
In all methods, words and terms that have a grammatical role for the language are excluded from the
key words list according to Fox's stop list. This stop list contains 421 high frequency stop list words
(e.g.: we, this, and, when, in, usually, also, near).
(1) Term Frequency (TF): This method rates a term according to the number of its occurrences in
the text. Only the N terms with the highest TF in the document are selected.
(2) Term length (TL): TL rates a term according to the number of the words included in the term.
(3) First N Terms (FN): Only the first N terms in the document are selected. The assumption is that
the most important keyphrases are found at the beginning of the document because people tend to
place important information at the beginning. This method is based on the baseline summariza-
tion method which chooses the first N sentences. This simple method provides a relatively strong
baseline for the performance of any text-summarization method.
(4) Last N Terms (LN): Only the last N terms in the document are selected. The assumption is that
the most important keyphrases are found at the end of the document because people tend to place
their important keyphrases in their conclusions which are usually placed near to the end.
121

(5) At the Beginning of its Paragraph (PB): This method rates a term according to its relative posi-
tion in its paragraph. The assumption is that the most important keyphrases are likely to be found
close to the beginning of their paragraphs.
(6) At the End of its Paragraph (PE): This method rates a term according to its relative position in
its paragraph. The assumption is that the most important keyphrases are likely to be found close
to end of their paragraphs.
(7) Resemblance to Title (RT): This method rates a term according to the resemblance of its sen-
tence to the title of the article. Sentences that resemble the title will be granted a higher score.
(8) Maximal Section Headline Importance (MSHI): This method rates a term according to its most
important presence in a section or headline of the article. It is a known that some parts of papers
are more important from the viewpoint of presence of keyphrases. Such parts can be headlines
and sections as: abstract, introduction and conclusions.
(9) Accumulative Section Headline Importance (ASHI): This method is very similar to the previ-
ous one. However, it rates a term according to all its presences in important sections or headlines
of the article.
(10) Negative Brackets (NBR): Phrases found in brackets are not likely to be keyphrases. Therefore,
they are defined as negative phrases, and will grant negative scores.
These methods were applied to extract and learn keyphrases from scientific articles (HaCohen-
Kerner et al., 2005).
2.2 Visual Keyprhase Extraction
On the other hand, visual keyphrase extraction is performed for a pre-defined set of keyphrases (e.g.
demonstration, moving car, etc.). The predefined keyphrases are selected in order to be relevant to the
domain of interest. In the following, low level visual features (SIFT, SURF) are extracted (Markato-
poulou, et al., 2013). We apply supervised machine learning using Random Forests (RF) (Breiman,
2001) to detect the presence of each concept in an image. RF have been successfully applied to several
image classification problems (e.g. (Bosch et al., 2007; Xu et al., 2012)). Moreover, an important mo-
tivation for using RF was the application of late fusion based on the RF operational capabilities, which
is discussed below.
In the training phase, the feature vectors from each low level feature vector are used as input for the
construction of a single RF. The training set can be constructed either manually or automatically. In
the automatic case, we submit a text query to a general purpose web search engine (e.g. Google, Bing)
to retrieve relevant images, while irrelevant images can be selected randomly from the web. From the
RFs that are constructed (one for each descriptor), we compute the weights for each modality in the
following way. From the out-of-bag (OOB) error estimate of each modality’s RF, the corresponding
OOB accuracy values are computed. These values are computed for each concept separately. Then the
values are normalized and serve as weights for the different modalities. Finally, each image is repre-
sented with a vector that includes the scores for each predefined visual keyphrase.
It should be noted that the visual concept/keyphrase detectors perform decently for specific visual
concepts (e.g. news studio: 0,5 MEIAP (Mean Extended Inferred Average Precision)), while for some
others (e.g. bridge: 0,02MEIAP) the performance is very low (Markatopoulou, et al., 2013). Therefore,
the representation is based on visual concepts for which the trained models can perform decently.
3 The Proposed Supervised Extraction Model
Our model, in general, is composed of the following steps:
For each document:
(1) Extract all possible n-grams (n=1, 2, 3) that do not contain stop-list words.
(2) Transform these n-grams into lower case.
(3) Apply all baseline textual extraction methods on these n-grams.
(4) Apply variable selection using Random Forests on all textual features (the results of the textual
baseline methods) in order to find the best combination of the textual features (Genuer, et al.
2010).
122
(5) Extract visual keyphrases for each image and calculate the average score for each visual
keyphrase to represent the document.
(6) Apply variable selection using Random Forests on all visual features in order to find the best per-
forming visual features (Genuer, et al. 2010).
(7) After the feature selection two fusion techniques are investigated:
a. Early fusion: Concatenation of the textual and visual vectors in a single vector. In the case
of unsupervised tasks (e.g. retrieval, clustering) the L1 distances between these vectors are
considered to compute similarity measures. In supervised tasks (e.g. classification) we train
a RF with the concatenated vector using as training set manually annotated documents.
b. Weighted late fusion: In the case of unsupervised tasks similarity scores are computed in-
dependently for each modality and the results are fused. In order to calculate the weights a
regression model based on Support Vector Machines is applied. In the case of supervised
tasks we train two RF (i.e. one for each modality) using a manually constructed training set
and finally we apply weighted late fusion based on the OOB error estimate using the ap-
proach mentioned in chapter 2.
4 Conclusions and Future Work
The proposed approach is work in progress so specific results are not yet available. However, initial
results using weighted late fusion (based on OOB estimate) of textual features and visual low level
features for a representative (i.e. histograms and not concepts) have shown that the results are im-
proved when compared to the ones generated with using only textual features. The next steps of this
work include application of the proposed method to retrieval, clustering and classification problems of
web pages and news articles, which include multimodal information such as text and images.
Future directions for research are: (1) Developing additional baseline methods for keyphrase ex-
traction, (2) Applying other ML methods in order to find the most effective combination between
these baseline methods, (3) Conducting more experiments using additional documents from additional
domains (5) Development of Methodology for predefined visual concept selection, and (6) Applying
ML to extract keyphrases using both textual and low level visual features.
Concerning research on additional domains, there are many potential research directions. For in-
stance the following research questions can be addressed: (1) Which baseline extraction methods are
good for which domains? (2) Which are the specific reasons for methods to perform better or worse on
different domains? (3) Which are the guidelines to choose the correct methods for a certain domain?
(4) Can the appropriateness of a method for a domain be estimated automatically?
Acknowledgment: This work is supported by MULTISENSOR project (FP7-610411) partially funded
by the European Commission. The authors would like to acknowledge networking support by the
COST Action IC1307: The European Network on Integrating Vision and Language (iV&L Net) and
the COST Action IC1002: MUMIA.
References
1. Anna Bosch., Andrew Zisserman, and Xavier Munoz. 2007. Image classification using random forests and
ferns. In ICCV, pp. 1-8.
2. Leo Breiman. 2001. Random Forests. In Machine Learning, 45(1): 5-32.
3. Christopher Fox. 1990. A Stop List for General Text. ACM-SIGIR Forum, 24, pp. 19–35.
4. Yaakov HaCohen-Kerner, Zuriel Gross, and Asaf Masa. 2005. Automatic extraction and learning of
keyphrases from scientific articles. In Computational Linguistics and Intelligent Text Processing, pp. 657-
669, Springer Berlin Heidelberg.
5. Fotini Markatopoulou, Anastasia Moumtzidou, Christos Tzelepis, Kostas Avgerinakis, Nikolaos Gkalelis,
Stefanos Vrochidis, Vasileios Mezaris, and Ioannis Kompatsiaris. 2013. “ITI-CERTH participation to
TRECVID 2013,” in TRECVID 2013 Workshop, Gaithersburg, MD, USA.
6. Baoxun Xu, Yunming Ye, and Lei Nie. 2012. An improved random forest classifier for image classification.
In, International Conference on Information and Automation (ICIA), pp. 795-800, IEEE.
7. Robin Genuera, Jean-Michel Poggi, and Christine Tuleau-Malot. 2010. Variable Selection using Random
Forests, In Pattern Recognition Letters 31(14):2225-2236.
123

Proceedings of the 25th International Conference on Computational Linguistics, pages 124–125,Dublin, Ireland, August 23-29 2014.
Towards automatic annotation of communicative gesturing
Kristiina JokinenUniversity of Tartu
Graham WilcockUniversity of Helsinki
Abstract
We report on-going work on automatic annotation of head and hand gestures in videos of conversational inter-action. The Anvil annotation tool was extended by two plugins for automatic face and hand tracking. The resultsof automatic annotation are compared with the human annotations on the same data.
1 Introduction
Hand and head movements are important in human communication as they not only accompanyspeech to emphasize the message, but also coordinate and control the interaction. However, videoanalysis of human behaviour is a slow and resource-consuming procedure even by trained annotatorsusing tools such as Anvil (Kipp 2001). There is an urgent need for more advanced tools to speed upthe process by performing higher-level annotation functions automatically.
We use two Anvil plugins, a face tracker (Jongejan 2012) and a hand tracker (Saatmann 2014), thatautomatically create annotations for head and hand movements. Objects are recognized based on visu-al features such as colour and texture, and Haar-liked digital image features, using OpenCV frame-work. Motion trajectories are estimated by calculating the mean velocity and acceleration during thetime span of a set of frames (we experimented with 7 frames as more than 10 makes the algorithm in-sensitive for quick, short movements). Movement annotations with respect to velocity and accelerationare marked on the appropriate Anvil track, to indicate the movement and its start and stop. The inter-face has controls for minimum saturation threshold and for how many frames to skip (Figure 1).
Figure 1 Anvil interface of the new hand tracker plugin.
2 Comparison of human and automatic annotations
Compared with human annotation the trackers are good at detecting some movements but prone tomis-detecting other movements. Problems occurred e.g. when the hue of the hands was similar to thebackground colour, or if the direction of the movement is reversed quickly, so that the time span is notlong enough to detect velocity up to the thresholds (short head movements). Acceleration annotationdid not recognize movements if they start and stop slowly. Changing the detection threshold can im-prove results, but is a trade-off as it prevents small movements being detected. However, the pluginswill be of great help in multimodal analysis. Using the plugins reduces the time spent on annotatingthese movements, which in turn results annotations in increased productivity.This work is licensed under a Creative Commons Attribution 4.0 International Licence. Page numbers and proceedings footerare added by the organisers. Licence details: http://creativecommons.org/licenses/by/4.0/
124

Here we present a more detailed analysis of the human and automatic annotations with reference toface tracking. The annotated hand and head movements are listed in Table 1. From the collected datawe used four sample videos, each about six minutes long, altogether 45 303 frames. Table 2 shows thenumber of elements automatically recognized using velocity and acceleration, with precision scores,i.e. manually annotated gestures correctly recognized by the automatic annotation.
Head movements Hand movementsNod down Backward Waggle Both
Nod up Forward Shake SingleTurn sideways Tilt Other Complex
OtherTable 1. Annotation features for head and hand movements.
Gesture Manual annotation Velocity AccelerationNodDown 149 110 (74%) 108 (72%)
NodUp 42 15 (36%) 27 (64%)TurnSide 40 29 (73%) 27 (68%)
HeadBackward 27 18 (67%) 14 (52%)HeadForward 21 17 (81%) 18 (86%)
Tilt 57 35 (61%) 29 (51%)Waggle 12 11 (92%) 8 (67%)
HeadOther 3 2 (67%) 1 (33%)Total 351 237 (73%) 232 (66%)
Table 2. Manual and automatic head movement annotations for 4 videos.Precision: Velocity 73%, Acceleration 66%
Figure 2 shows two examples of the annotation results on the Anvil annotation board, one where theface tracker recognized head movements appropriately, and one where the face tracker “invented”movements which the human annotator does not recognize as communicative gestures.
Figure 2. Face tracker detecting manual annotation categories (left) and inventing face movements (right).
3 Future work
Following the work outlined in Jokinen and Scherer (2012), we will compare the top-down linguistic-pragmatic analysis of movements with the bottom-up signal-level observations. We will also use amachine-learning approach to analyse if there are any systematics with the problematic cases. We mayalso explore if a recognized movement can be automatically interpreted with respect to communicativeintentions. In human-robot interaction, the automatic gesture recognition model can be used to studythe robot’s understanding of the situation and of human control gestures, cf. Han et al. (2012).
ReferencesHan, J., Campbell, N., Jokinen, K. and Wilcock, G. (2012). Investigating the use of non-verbal cues in human-
robot interaction with a Nao robot, in Proceedings of 3rd IEEE International Conference on Cognitive Info-communications (CogInfoCom 2012), Kosice, 679-683.
Jokinen, K. and Scherer S. (2012). Embodied Communicative Activity in Cooperative Conversational Interac-tions - studies in Visual Interaction Management. Acta Polytechnica Hungarica. 9(1), pp. 19-40.
Jongejan, B. (2012) Automatic annotation of face velocity and acceleration in Anvil. Proceedings of the Lan-guage Resources and Evaluation Conference (LREC-2012). Istanbul, Turkey.
Kipp, M. (2001). Anvil – A generic annotation tool for multimodal dialogue. Proceedings of the Seventh Euro-pean Conference on Speech Communication and Technology, pp. 1367-1370.
Saatmann, P. (2014). Experiments With Hand-tracking Algorithm in Video Conversations. Proceedings of the5th Nordic Symposium on Multimodal Communication.
125

Author Index
Aabloo, Alvo, 103Aker, Ahmet, 38Albatal, Rami, 106Anbarjafari, Gholamreza, 103
Belz, Anja, 118Bernardi, Raffaella, 17, 112Beust, Pierre, 95Bharath, Anil, 118Bhat, Mohammad, 87
Cassidy, Taylor, 9
Dias, Gaël, 95Dobnik, Simon, 33
Effelsberg, Wolfgang, 68Elliott, Desmond, 109
Gaizauskas, Robert, 38
HaCohen-Kerner, Yaakov, 121Hattori, Keigo, 54Hu, Feiyan, 106Huang, Hongzhao, 74Huang, Thomas, 74
Ipsic, Ivo, 115Ivasic-Kos, Marina, 115
Ji, Heng, 74Jokinen, Kristiina, 124Jones, Chris, 62
Kelleher, John, 1, 33Kompatsiaris, Ioannis, 25, 121
Lazaridou, Angeliki, 112Le, Dieu-Thu, 17Li, Haibo, 74Liparas, Dimitris, 25, 121
Ma, Xiaojun, 54Mac Namee, Brian, 1Maurel, Fabrice, 95McGuinness, Kevin, 106Miura, Yasuhide, 54
Moens, Marie-Francine, 46Moumtzidou, Anastasia, 25, 121
Nikolaeva, Yulia, 82
Ohkuma, Tomoko, 54Olszewska, Joanna Isabelle, 87
Pobar, Miran, 115Ponzetto, Simone Paolo, 68
Rosin, Paul, 62Routoure, Jean-Marc, 95
SAFI, Waseem, 95Sakaki, Shigeyuki, 54Schütte, Niels, 1Shrestha, Niraj, 46Slade, Jonathan, 62Smeaton, Alan, 106Summers-Stay, Douglas, 9
Tien Nguyen, Dat, 112Tsai, Min-Hsuan, 74Tsai, Shen-Fu, 74
Uijlings, Jasper, 17
Venkitasubramanian, Aparna N., 46Voss, Clare, 9Vrochidis, Stefanos, 25, 121
Wang, Josiah, 38Weiland, Lydia, 68Wilcock, Graham, 124
Yan, Fei, 38
Zhang, Tongtao, 74
127