Probability distributions in library and information science: A historical and practitioner...
18
Probability Distributions in Library and Information Science: A Historical and Practitioner Viewpoint Stephen J. Bensman LSU Libraries, Louisiana State University, Baton Rouge, LA 70803. E-mail: [email protected] This paper has a dual character dictated by its twofold purpose. First, it is a speculative historiographic essay containing an attempt to fix the present position of li- brary and information science within the context of the probabilistic revolution that has been encompassing all of science. Second, it comprises a guide to practitioners engaged in statistical research in library and information science. There are pointed out the problems of utilizing statistical methods in library and information science because of the highly and positively skewed distribu- tions that dominate this discipline. Biostatistics are in- dicated as the source of solutions for these problems, and the solutions are then traced back to the British biometric revolution of 1865–1950, during the course of which modern inferential statistics were created. The thesis is presented that science has been undergoing a probabilistic revolution for over 200 years, and it is stated that this revolution is now coming to library and information science, as general stochastic models re- place specific, empirical informetric laws. An account is given of the historical development of the counting dis- tributions and laws of error applicable in statistical re- search in library and information science, and it is stressed that these distributions and laws are not spe- cific to library and information science but are inherent in all biological and social phenomena. Urquhart’s Law is used to give a practical demonstration of the distribu- tions. The difficulties of precisely fitting data to theoret- ical probability models in library and information science because of the inherent fuzziness of the sets are dis- cussed, and the paper concludes with the description of a simple technique for identifying and dealing with the skewed distributions in library and information science. Throughout the paper, emphasis is placed on the rele- vance of research in library and information science to social problems, both past and present. Introduction This paper has a dual character dictated by its twofold purpose. First, it is a speculative historiographic essay, in which I attempt to describe the present state of library and information science in terms of the overall development of science. To do this, I connect the history of library and information science with the history of probability and statistics. Second, the paper is intended to serve as a prac- tical guide to persons doing statistical research in library and information science. Thus, the components comprising the duality of this paper are closely interconnected. I came to this topic as a result of recently completed research (Bensman, 1996; Bensman & Wilder, 1998) on the market for scientific information. In this research, I wanted to solve what seemed a simple problem: What role does scientific value play in the price libraries pay for scientific journals? To solve this problem, I had to use parametric statistical techniques such as correlation and regression, and these techniques immediately confronted me with what seemed to be an extremely difficult problem. These tech- niques are based on the assumption of the normal distribu- tion, whereas library and information science data do not conform to the normal distribution but are dominated by horrendously skewed distributions. I realized that there is a need to connect the information science laws with the probability distributions, on which statistics are based, in some easily understandable manner, as an aid to persons conducting statistical investigations of the problems afflict- ing libraries. This need is becoming especially pressing, as computers are not only making much more data available but also making simpler highly sophisticated statistical anal- yses through spreadsheets and software such as SAS. To obtain help in this matter, I contacted the LSU De- partment of Experimental Statistics, which assigned me as an adviser an ecologist named Jay Geaghan. Jay suggested that I read a manual entitled Some Methods for the Statis- tical Analysis of Samples of Benthic Invertebrates (Elliott, 1977). It was an eye-opener in two respects. First, the manual introduced me to the system of probability distri- butions, with which biologists model patterns in nature, showing how to test for them and transform them for standard parametric statistical operations. Second, it pointed out that the key model for the skewed distributions domi- nating biological phenomena is the negative binomial dis- tribution. This jarred a memory of Price (1976) describing the negative binomial distribution as the model for the double-edged Matthew Effect, which Robert K. Merton and © 2000 John Wiley & Sons, Inc. JOURNAL OF THE AMERICAN SOCIETY FOR INFORMATION SCIENCE. 51(9):816 – 833, 2000
-
Upload
independent -
Category
Documents
-
view
2 -
download
0
Transcript of Probability distributions in library and information science: A historical and practitioner...

Probability Distributions in Library and InformationScience: A Historical and Practitioner Viewpoint
Stephen J. BensmanLSU Libraries, Louisiana State University, Baton Rouge, LA 70803. E-mail: [email protected]
This paper has a dual character dictated by its twofoldpurpose. First, it is a speculative historiographic essaycontaining an attempt to fix the present position of li-brary and information science within the context of theprobabilistic revolution that has been encompassing allof science. Second, it comprises a guide to practitionersengaged in statistical research in library and informationscience. There are pointed out the problems of utilizingstatistical methods in library and information sciencebecause of the highly and positively skewed distribu-tions that dominate this discipline. Biostatistics are in-dicated as the source of solutions for these problems,and the solutions are then traced back to the Britishbiometric revolution of 1865–1950, during the course ofwhich modern inferential statistics were created. Thethesis is presented that science has been undergoing aprobabilistic revolution for over 200 years, and it isstated that this revolution is now coming to library andinformation science, as general stochastic models re-place specific, empirical informetric laws. An account isgiven of the historical development of the counting dis-tributions and laws of error applicable in statistical re-search in library and information science, and it isstressed that these distributions and laws are not spe-cific to library and information science but are inherentin all biological and social phenomena. Urquhart’s Law isused to give a practical demonstration of the distribu-tions. The difficulties of precisely fitting data to theoret-ical probability models in library and information sciencebecause of the inherent fuzziness of the sets are dis-cussed, and the paper concludes with the description ofa simple technique for identifying and dealing with theskewed distributions in library and information science.Throughout the paper, emphasis is placed on the rele-vance of research in library and information science tosocial problems, both past and present.
Introduction
This paper has a dual character dictated by its twofoldpurpose. First, it is a speculative historiographic essay, inwhich I attempt to describe the present state of library andinformation science in terms of the overall development ofscience. To do this, I connect the history of library and
information science with the history of probability andstatistics. Second, the paper is intended to serve as a prac-tical guide to persons doing statistical research in libraryand information science. Thus, the components comprisingthe duality of this paper are closely interconnected.
I came to this topic as a result of recently completedresearch (Bensman, 1996; Bensman & Wilder, 1998) on themarket for scientific information. In this research, I wantedto solve what seemed a simple problem: What role doesscientific value play in the price libraries pay for scientificjournals? To solve this problem, I had to use parametricstatistical techniques such as correlation and regression, andthese techniques immediately confronted me with whatseemed to be an extremely difficult problem. These tech-niques are based on the assumption of the normal distribu-tion, whereas library and information science data do notconform to the normal distribution but are dominated byhorrendously skewed distributions. I realized that there is aneed to connect the information science laws with theprobability distributions, on which statistics are based, insome easily understandable manner, as an aid to personsconducting statistical investigations of the problems afflict-ing libraries. This need is becoming especially pressing, ascomputers are not only making much more data availablebut also making simpler highly sophisticated statistical anal-yses through spreadsheets and software such as SAS.
To obtain help in this matter, I contacted the LSU De-partment of Experimental Statistics, which assigned me asan adviser an ecologist named Jay Geaghan. Jay suggestedthat I read a manual entitledSome Methods for the Statis-tical Analysis of Samples of Benthic Invertebrates(Elliott,1977). It was an eye-opener in two respects. First, themanual introduced me to the system of probability distri-butions, with which biologists model patterns in nature,showing how to test for them and transform them forstandard parametric statistical operations. Second, it pointedout that the key model for the skewed distributions domi-nating biological phenomena is the negative binomial dis-tribution. This jarred a memory of Price (1976) describingthe negative binomial distribution as the model for thedouble-edged Matthew Effect, which Robert K. Merton and© 2000 John Wiley & Sons, Inc.
JOURNAL OF THE AMERICAN SOCIETY FOR INFORMATION SCIENCE. 51(9):816–833, 2000

his students, Jonathan and Stephen Cole and Harriet Zuck-erman, had placed at the basis of the social stratification ofscience. In my previous writings (Bensman, 1982, 1985), Ihad posited the double-edged Matthew Effect as underlyingthe skewed patterns of library use.
The research on the scientific information market neces-sitated solving many complex statistical problems. In seek-ing the solutions for these problems, I noticed a dual pattern.First, most of these problems had already been solved inbiostatistics. Second, most of the works presenting thesesolutions were British. The Elliott manual, for example, waspublished by the British Freshwater Biological Association,and based on samples of benthic invertebrates in the EnglishLake District. It also dawned on me that bibliometrics as adiscipline had also risen to a great extent in Britain. Beinga historian by training, my interest was naturally piqued,and I decided to write a book that would not only present ahistory of this development but would also be an aid topersons doing statistical research in library and informationscience. Such an approach seemed particularly beneficial,because, like myself, many persons in the library fieldunderstand things better in terms of their historical devel-opment than mathematically.
The Probability Distributions Affecting Libraryand Information Science
In the analysis of the production, dissemination, use, andevaluation of human knowledge, we are basically dealingwith three discrete or counting distributions and two con-tinuous laws of error. The counting distributions are thefollowing: (1) the binomial, which models uniformity andwhose characteristic is that the variance is less than themean; (2) the Poisson, which models randomness andwhose characteristic is that variance equals the mean; and(3) the negative binomial, which models concentration andwhose characteristic is that the variance is greater than themean. I hasten to add that the negative binomial is only themost useful of a series of contagious distributions, and,depending on the circumstances, it can change into the betabinomial, Poisson, or logarithmic series.
To help explain the idea of a law of error, I will presentto you my concept of a statistical model. A statistical modelis a mental construct of reality that is logically designed totest a hypothesis. It is centered on a hypothetical point, fromwhich deviations are measured according to a law of error.Depending on the size of the deviation from the hypothet-ical point on which the model is centered, one accepts orrejects the hypothesis being tested. In statistical textbooks,the law of error is the normal distribution, and the hypo-thetical center is the arithmetic mean, from which deviationsare measured in standard numbers. Historically, the normaldistribution was derived as an approximation to the bino-mial. However, because of the multiplicative character ofmany phenomena in the biological, social, and informationsciences, the law of error in these disciplines is in numerouscases the lognormal distribution, and the hypothetical center
is the geometric mean, from which deviations are measuredin logarithmic units. The negative binomial can be trans-formed into an approximation of the lognormal distribution.
Library and Information Science within theContext of the Historical Relationship ofProbability and Statistics to Science as a Whole
The history of probability and statistics is too complex tobe adequately summarized in a paper such as this. There-fore, I will restrict myself to reviewing the theses of two keybooks on this subject. Together, these books validate theview presented in a two-volume collection of essays pub-lished by MIT Press and entitledThe Probabilistic Revolu-tion (1987): that since 1800, the world has been experienc-ing a scientific revolution, in which the mathematical theoryof probability has been adopted in discipline after disci-pline. This probabilistic revolution is coming to library andinformation science, as specific, empirical, bibliometriclaws are being replaced by general stochastic models. Ofprimary importance in this transition has been the seminalwork on bibliometric distributions by Bertram C. Brookesand Abraham Bookstein.
For his part, Brookes (1977, 1979, 1984) concentrated onBradford’s Law of Scattering, which he explored theoreti-cally as a very mixed Poisson model. Coming to regardBradford’s Law as a new calculus for the social sciences, hefound it almost identical mathematically to other empiricalbibliometric laws, suspecting of these laws that “beneaththeir confusions there lurks a simple distribution whichembraces them all but which remains to be identified”(Brookes, 1984, p. 39). He reduced these various laws to asingle law, which he modeled two ways as “the InverseSquare Law of frequencies” and “the Log Law of ranks.”The main features of Brookes’ hypothesis of a single dis-tribution arising from a mixed Poisson process were en-dorsed by Bookstein. In his work, Bookstein (1990, 1995,1997) posited through mathematical analysis that the vari-ous bibliometric laws together with Pareto’s law on incomeare variants of a single distribution, in spite of markeddifferences in their appearance. Seeking a way to deal withthese distributions, Bookstein (1997) came to the followingconclusion:
I have argued. . .that one important mechanism for surviv-ing in an ambiguous world is to create functional forms thatare not too seriously affected by imperfect conceptualiza-tion. In this article I pushed this notion further, and lookedat suitable random components for the underlying stableexpectations. The family of compound Poisson distributionsseems uniquely able to provide this service. (p. 10).
The first book to be reviewed isContributions to theHistory of Statisticsby Westergaard (1968). In this work,Westergaard writes that the history of modern statistics hasbeen marked by two lines of evolution, which surprisinglyhave had little to do with each other. The first was “Political
JOURNAL OF THE AMERICAN SOCIETY FOR INFORMATION SCIENCE—July 2000 817
Arithmetic,” which originated in London in 1662 with thepublication by John Graunt of a remarkable book,Naturaland Political Observations upon the Bills of Mortality.Thiswas the first attempt to interpret mass biological and socialbehavior from numerical data. “Political Arithmetic” wasfirst concerned with questions of mortality and other prob-lems of vital statistics but later turned to economic statistics.Gradually the expression “Political Arithmetic” was re-placed by the word “statistics,” a term earlier employed forthe description of states. Independently from “PoliticalArithmetic,” there evolved what Westergaard calls the “Cal-culus of Probabilities,” which was developed by mathema-ticians in investigations of a purely abstract character. Ac-cording to Westergaard’s interpretation, the history of mod-ern statistics has been a struggle to merge “PoliticalArithmetic” with the “Calculus of Probability,” so thatproper inferences could be drawn from the collection ofnumbers. A similar struggle is taking place today in libraryand information science, as librarians conduct exercises in“Library Arithmetic” on the massive amounts of data theycollect to solve their problems, whereas information scien-tists play complex mathematical games without any regardto the abilities of librarians or the basic statistical problems,which they need to solve.
The thesis of the other book to be discussed—The His-tory of Statistics: The Measurement of Uncertainty before1900by Stigler (1986)—is complementary to that of West-ergaard in that he, too, traces the development and spread ofstatistical ideas. However, his treatment is much different.Whereas Westergaard concentrates on the history of thecollection of data of interest to Political Arithmetic like statecensuses, dealing minimally with the Calculus of Probabil-ity, Stigler emphasizes the role of statistics in the assess-ment and description of uncertainty, accuracy, and variabil-ity, by focusing on the introduction and development ofexplicitly probability-based statistics in the two centuriesfrom 1700 to 1900. According to Stigler, during this period,statistics in his sense underwent what might be described asa simultaneous horizontal and vertical evolution. It washorizontal in that, prior to 1827, probability-based statisticsoriginated in astronomy and geodesy, spreading after thatdate to psychology, biology, and to the social sciences. Itwas vertical in that the understanding of the role of proba-bility advanced, as the analogy of games of chance gaveway to probability models for measurements, leading finallyto the introduction of inverse probability and the beginningsof statistical inference.
Such a perspective makes most interesting Stigler’s dis-cussion of the derivation of the normal distribution from thebinomial in astronomy and geodesy during the eighteenthcentury. This process culminated at the beginning of thenineteenth century, when Pierre Simon Laplace and CarlFriedrich Gauss simultaneously combined all the elementsof the normal distribution in what Stigler terms “the Gauss-Laplace Synthesis.” This synthesis included, among others,the following elements: (a) Jacob Bernoulli’s Law of LargeNumbers, by which, as the number of observations in-
creases, the relative number of successes must be within anarbitrarily small (but fixed) interval around the theoreticalprobability with a probability that tends to one; (b) AbrahamDe Moivre’s derivation of the normal probability or bell-shaped curve as an approximation to the probability forsums of binomially distributed quantities lying between twovalues; (c) Thomas Simpson’s justification of the advantageof taking the arithmetic mean of several observations inastronomy over that of a single, well-taken observation; and(d) Adrien Legendre’s development of the least squaresmethod for minimizing error. From Stigler’s treatment, thenormal distribution clearly emerges as what it actually is:the law of error in point estimation in astronomical andgeodetic observations.
With this interpretation in mind, it is important to statethe three principles that Pearson (1956b, p. 108) emphasizedas connoted by the normal curve of errors: (1) an indefinitenumber of “contributory” causes; (2) each contributorycause is in itself equally likely to give rise to deviation ofthe same magnitude in excess and defect; and (3) the con-tributory causes are independent. Under these conditions,there arises the bell-shaped curve, where the mean equalsthe mode and the observations are symmetrically distributedon both sides of this point.
The Normal Paradigm
We now come to what I will term the “normal para-digm,” i.e., the idea that phenomena in nature and society,if sorted into homogeneous sets, are distributed according tothe same law of error as observations in astronomy andgeodesy. From personal experience, I can testify that thisparadigm still has a powerful hold on the minds of people,at least in Baton Rouge, Louisiana. I am not alone in thisobservation. Already in 1916, Pearson (1956c), who demol-ished the normal paradigm in a series of brilliant papers inthe 1890s, wrote in exasperation that “to attempt to describefrequency by the Gaussian curve is hopelessly inadequate”and “It is strange how long it takes to uproot a prejudice ofthat character!” (p. 555).
The main culprit in the rise of the normal paradigm wasthe Belgian scientist, Adolphe Quetelet. In the period 1823–1832, Quetelet’s main project was the establishment of anastronomical observatory in Brussels. As part of thisproject, he visited Paris, where he came into contact withLaplace. This contact aroused in Quetelet the keen interestin statistical research, based on the theory of probabilities,that became the focus of all his scientific work.
One of Quetelet’s main contributions was to extend theuse of probability from celestial to terrestrial phenomena,and he is best known for the application of probability instudies of the physical and social attributes of human be-ings. Quetelet’s studies of these attributes were dominatedby his concept of the “average man” or the “hommemoyen.” The basis of this concept was his belief that allnaturally occurring distributions of properly collected andsorted data follow a normal curve. He applied this theory
818 JOURNAL OF THE AMERICAN SOCIETY FOR INFORMATION SCIENCE—July 2000

whether he was dealing with the chest sizes of Scottishsoldiers or the penchant of humans to commit crimes. Thisthinking dominated Quetelet’s approach to the definition ofsets. His reasoning in this matter is summed up by Stigler(1986):
What was true of astronomical observations would also betrue of heights of men, of birth ratios, and of crime rates.Now, if homogeneity implied that observations would fol-low the normal law, then why not use this device fordiscerning homogeneity? Simply examine the distributionof a group of measurements. If they fail to exhibit this form,then this is surely evidence of lack of homogeneity—or atleast evidence that the primary inhomogeneities are not inthe nature of a large number of accidental (independent,random, of comparable force and size) causes. If they doexhibit this normal form, then this is prima facie evidencethat the group is homogeneous and susceptible to statisticalanalysis as a group, without distinguishing the members ofthe group by identifying labels. (p. 205)
Quetelet used this type of reasoning in analysis of theheights of 100,000 French conscripts, coming to the con-clusion of large-scale draft evasion because of the excess ofmen in the shortest class exempt from service. In anotherstudy of the heights of French conscripts—this time fromthe Department of Doubs in eastern France in the period1851–1860—Adolphe Bertillon applied the same type oflogic. Finding that the heights did not exhibit the usualsymmetrical shape but rather had two modal values, Bertil-lon hypothesized that the population of Doubs consisted oftwo human types, one short and one tall. His theory seemedconfirmed when his colleague Lagneau subsequently foundthat the inhabitants of Doubs were primarily of two differentraces, the Celts and the Burgundians. Bertillon’s investiga-tions bore an uncanny resemblance to the later work byWeldon that led Pearson to challenge the normal paradigm.
Quetelet’s theories were subjected to severe criticism.One of the most devastating came from Bertrand; andHogben, in his critique of statistical theory, lovingly quotesin full Bertrand’s attack in a translation that captures all itsVoltairean glory. By his transfer of the normal distributionfrom astronomy to the study of humans, Quetelet shifted thearithmetic mean from an actual point like a star or a cometin the sky to a hypothetical point in a set of humans, towhich no human in the set may actually conform. Thisopened him—and, indeed, all modern inferential statis-tics—to charges of Platonism, which Bertrand made againsthim in the following passages of an analysis of one ofQuetelet’s findings that the average height of a set of 20,000soldiers was 1 m 75:
M. Quetelet. . .would have us accept a precise definition ofthe word Man, independently of human beings whose par-ticularity can be considered accidental. . . . Ourinequalitiesof height are, in his eyes, the result of inept measurementstaken by Nature on an immutable model in whom alone shereveals her secrets. 1 m 75 is thenormal height. A little
more makes no less a man, but the surplus or deficit in eachindividual is nature’s error, and thus monstrous. . . . (Hog-ben, pp. 172–173)
After a short disquisition in solid geometry on the rela-tionship of the volume and surface of spheres to their radius,Bertrand drove the dagger home, stating:
Men’s shapes unfortunately can vary, and M. Quetelet prof-its therefrom. By combining the mean weight of 20,000conscripts with their mean height, we should produce anabsurdly fat man and, whatever Reynolds might have said,a poor model for an artist. . . . (Hogben, pp. 173–174)
Another flaw in Quetelet’s thinking is that there is noinextricable link of the homogeneity of sets with the normaldistribution, and, as we shall see, homogeneity lies at thebasis of quite a different probability distribution. In hisclassic treatise on probability, Keynes (1921) noted that,because of Quetelet’s work, the “suspicion of quackery” hadnot yet disappeared from the study of probability and that“There is still about it for scientists a smack of astrology, ofalchemy” (p. 335).
The British Biometric Revolution
The normal paradigm was demolished in the Britishbiometric revolution. This revolution lasted roughly from1865 to 1950, and it led to the creation of modern inferentialstatistics. The most important figures of the early phase ofthe revolution were Francis Galton, Karl Pearson, W.F.R.Weldon, George Yule, and William Gosset or “Student,”whereas the most important persons of the latter phase wereRonald Fisher, Pearson’s son Egon, Jerzy Neyman, andMaurice Kendall. University College, London, was the ep-icenter of the British biometric revolution, which enteredthe United States through the work of Snedecor at IowaState University, a major agricultural research center.Fisher, Kendall, and Neyman visited Iowa State. One of theprimary vehicles for the transmission of British statisticalmethods into the United States was Snedecor’s textbookStatistical Methods, which went through eight editions from1937 to 1989. A major reason for the broad influence of thisbook was that it made statistical methods accessible topersons with little mathematical training. The early edi-tions’ full title was Statistical Methods Applied to Experi-ments in Biology and Agriculture.The latter editions werecoauthored by Cochran, who came to Iowa State in 1938from the Rothamsted Experimental Station, the site of Fish-er’s major work, where agricultural research had been inprogress since 1843. As the dates of these editions show, weare still very close historically to the British biometricrevolution in terms of the diffusion of ideas. The work of thecreators of the British biometric revolution was prolific andwide-ranging, and cannot be summarized in a paper of thisnature. Here, I will focus only on the work of the men of itsfirst phase on probability distributions.
JOURNAL OF THE AMERICAN SOCIETY FOR INFORMATION SCIENCE—July 2000 819
Destruction of the Normal Paradigm
The British biometric revolution began with an attemptto place Darwin’s theory of evolution on firm mathematicalbases. It was begun by Galton, whose first cousin wasCharles Darwin. The dominant theme in Galton’s workfrom 1865 on was the study of heredity, and his work in thisfield was distinguished by its statistical nature. As a statis-tician, he was a direct descendant of Quetelet. In his book,Hereditary Genius, first published in 1869, Galton (1978)paid tribute to Quetelet after stating, “The method I shallemploy for discovering all this, is an application of the verycurious theoretical law of ‘deviation from an average’” (p.26). Galton devoted the appendix of this book to a demon-stration of Quetelet’s method in astronomy. The worshipfulattitude Galton displayed toward the normal distribution isshown by the following oft quoted passage from his 1889work, Natural Inheritance:
I know of scarcely anything so apt to impress the imagina-tion as the wonderful form of cosmic order expressed by the“Law of Frequency of Error.” The law would have beenpersonified by the Greeks and deified, if they had known ofit. It reigns with serenity and in complete self-effacementamidst the wildest confusion. The huger the mob, and thegreater the apparent anarchy the more perfect is its sway. Itis the supreme law of Unreason. Whenever a large sampleof chaotic elements are taken in hand and marshalled inorder of their magnitude, an unsuspected and most beautifulform of regularity proves to have been latent all along.(Galton, 1889, p. 66)
Despite his veneration of the normal distribution, evenGalton noticed that it did not correspond to much of reality,particularly in biological and social phenomena. Because ofhis weakness in mathematics, he enlisted the aid of a Cam-bridge mathematician named McAlister to help solve thisproblem. In 1879, Galton presented a paper along with amemoir by McAlister (1879) that worked out the mathe-matics of his insight. In his paper, Galton (1879) stated thathis purpose was “to show that an assumption which lies atthe basis of the well-known law of ‘Frequency ofError’. . .is incorrect in many groups of vital and socialphenomena. . .” (pp. 365–366). He then defined the assump-tion in the following terms:
The assumption to which I refer is that errors in excess or indeficiency of the truth are equally possible; or conversely,that if two fallible measurements have been made of thesame object, their arithmetical mean is more likely to be thetrue measurement than any other quantity that can benamed. (p. 366)
Galton then referred to the work in sense perception byFechner, who had developed a law, whose simplest form is:sensation5 log stimulus. According to Galton, in suchcases, the geometric mean, rather than the arithmetic mean,is the better measure, and he then stated:
The same condition of the geometric mean appears to char-acterise the majority of the influences, which, combinedwith those of purely vital phenomena, give rise to the eventswith which sociology deals. It is difficult to find termssufficiently general to apply to the varied topics of sociol-ogy, but there are two categories of causes, which are ofcommon occurrence. The one is that of ordinary increase,exemplified by the growth of population, where an alreadylarge nation tends to become larger than a small one undersimilar circumstances, or when capital employed in a busi-ness increases in proportion to its size. The other category isthat of surrounding influences, or “milieux”. . .such as aperiod of plenty in which a larger field or a larger businessyields a greater excess over its mean yield than a smallerone. Most of the causes of those differences with whichsociology [is] concerned may be classified under one or theother of these two categories. . . . In short, sociological phe-nomena, like vital phenomena are, as a general rule, subjectto the condition of the geometric mean. (pp. 366–367)
Galton then went on to warn that the ordinary law of thefrequency of error, based on the arithmetic mean, could leadto absurdity, when applied to wide deviations, stating thatstatisticians must confine its application within a narrowrange of deviations. McAlister’s memoir, entitled “The Lawof the Geometric Mean,” was a working out of the mathe-matics of the lognormal distribution.
Although Galton never understood the importance of hisbreakthrough and made only sporadic use of the lognormalin his own work, the true significance of this distribution forthe biological, social, and, in particular, information sci-ences can be seen in the following two analyses. The firstwas done by Keynes in his treatise on probability. Com-menting upon McAlister’s work, Keynes (1921) wrote:
[McAlister’s] investigation depends upon the obvious factthat, if the geometric mean of the observations yields themost probable value of the quantity, the arithmetic mean ofthe logarithms of the observations must yield the mostprobable value of the logarithm of the quantity. Hence, if wesuppose that the logarithms of the observations obey thenormal law of error (which leads to their arithmetic mean asthe most probable value of the logarithms of the quantity),we can by substitution find a law of error for the observa-tions themselves which must lead to the geometric mean ofthem as the most probable value of the quantity itself. (pp.198–199)
Shortly thereafter, Keynes came to the conclusion:
. . .the main advantage of. . .Sir Donald McAlister’s law oferror. . .lies in the possibility of adapting without muchtrouble to unsymmetrical phenomena numerous expressionswhich have been already calculated for the normal law oferror and the normal curve of frequency. (p. 200)
The other analysis pertains specifically to informationscience. It was done by Shockley (1957), a co-winner of the1956 Nobel Prize in physics for his role in the creation ofthe transistor. Shockley studied the publication rates of
820 JOURNAL OF THE AMERICAN SOCIETY FOR INFORMATION SCIENCE—July 2000
scientists at Los Alamos Scientific Laboratory and otherplaces. He found highly skewed distributions with someindividuals publishing at a rate of at least 50 times greaterthan others did. As a result of this, Shockley decided that itwas more appropriate to consider not simply the rate ofpublication but its logarithm, which appeared to have anormal—or, better, lognormal—distribution over the pop-ulation of typical research laboratories.
The problem, which led to the collapse of the normalparadigm, has been described by E. Pearson (1970, pp.328–330), Karl’s son, as that of “the double humpedcurve.” It arose in Galton’s studies of heredity. Galton(1978, pp. xvii–xix) himself succinctly defined the problemin the preface of the 1892 edition of his book,HereditaryGenius, in terms of the concepts of “variations” and“sports.” During the course of his work, Galton developedthe idea of “regression to the mean,” which he defined in the1892 preface in the following manner:
It has been shown inNatural Inheritancethat the distribu-tion of faculties in a population cannot possibly remainconstant, if,on the average, the children resemble theirparents. If they did so, the giants (in any mental or physicalparticular) would become more gigantic, and the dwarfsmore dwarfish, in each successive generation. The counter-acting tendency is what I called “regression.” Thefilialcentre is not the same as theparentalcentre, but it is nearerto mediocrity; it regresses towards the racialcentre.(Gal-ton, 1978, p. xvii)
Galton viewed “variations” as variance in characteristicsthat occur around this racial center in accordance with thenormal law of error without shifting this center. The casewas much different with “sports.” Here, according to Gal-ton, a new characteristic appears in a particular individual,causing him to differ distinctly from his parents and fromothers of his race. In this scheme, “sports” are different from“variations,” because, when transmitted to descendants,they establish a new racial center, towards which regressionmust be measured, thereby marking a new stage in evolu-tion.
The concept of a “sport” lay at the basis of the problemof “the double humped curve,” which Weldon handed Pear-son, leading to the overthrow of the normal paradigm. Aprofessor of zoology at University College, London, Wel-don became convinced that the problem of animal evolutionwas essentially a statistical problem. Because of Galton’sinfluence, he worked under the assumption that measure-ments of the physical characteristics in animal populationswould be normally distributed within a homogeneous race.Weldon had success with this theory in his early work, butthen he obtained an asymmetrical result that did not fit thenormal curve in measuring the frontal breadth of a sampleof crabs from the Bay of Naples. Weldon (1893, p. 324)hypothesized that the asymmetrical distribution he had ob-tained arose from the presence, in the sample measured, oftwo races of individuals clustered symmetrically about sep-
arate mean magnitudes. He excitedly wrote to Galton:“Therefore, either Naples is the meeting point of two dis-tinct races of crabs, or a ‘sport’ is in the process of estab-lishment” (E. Pearson, 1970, p. 328n). The solution of theproblem required the dissection of a frequency distributioninto two normal components. Lacking the necessary math-ematical skills, Weldon turned for help to Pearson, whotaught applied mathematics at University College.
The problem posed by Weldon led to a series of statis-tical memoirs by Pearson entitled “Contributions to theMathematical Theory of Evolution,” the first two of whichwere published in thePhilosophical Transactions of theRoyal Society of Londonduring 1894–1895. Pearson(1956a, pp. 1–40) analyzed Weldon’s problem in the firststatistical memoir. As set forth by E. Pearson (1970, p. 329),there were three obvious alternatives to the solution of theproblem of the “double humped curve:” (a) the discrepancybetween theory and observation was no more than might beexpected to arise in random sampling; (b) the data areheterogeneous, composed of two or more normal distribu-tions; and (c) the data are homogeneous, but there is realasymmetry in the distribution of the variable measured.Acceptance of alternative (c) meant rejection of the normalparadigm, and this is precisely what Pearson (1956a) did ina dazzling display of mathematical prowess, coming to thefollowing conclusion: “Professor Weldon’s material isho-mogeneous, and the asymmetry of the ‘forehead’ curvepoints to real differentiation in that organ, and not to themixture of two families having been dredged up” (p. 29).
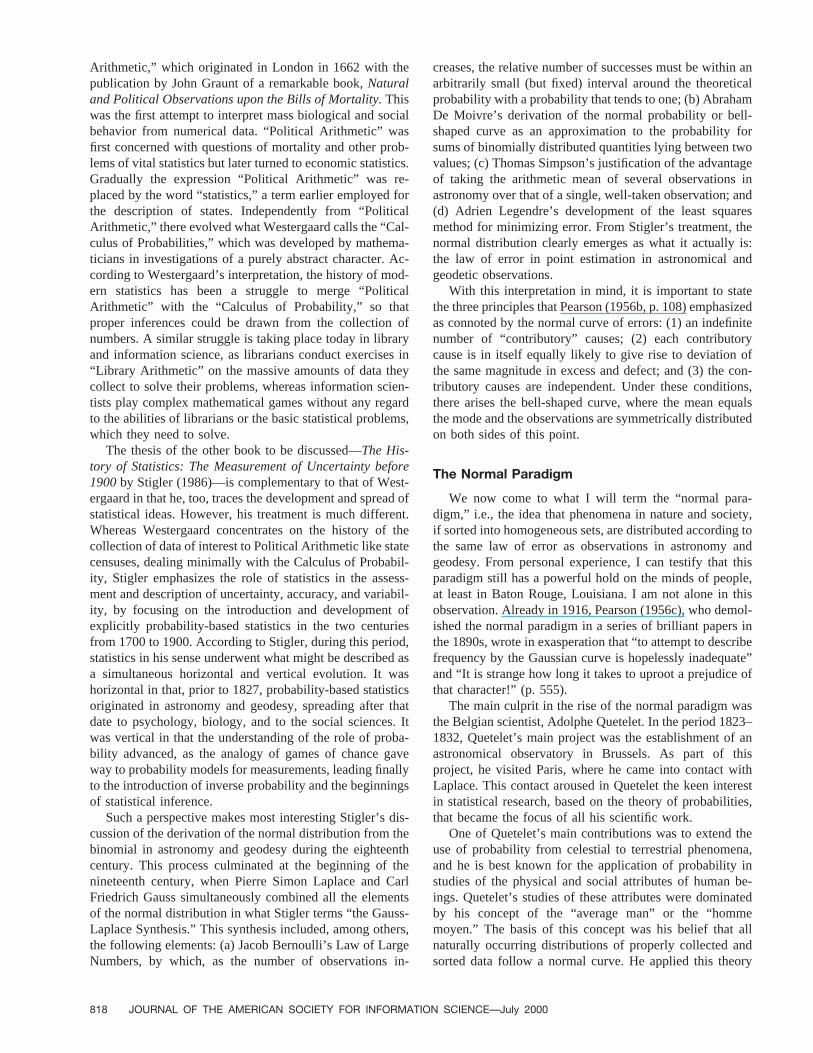
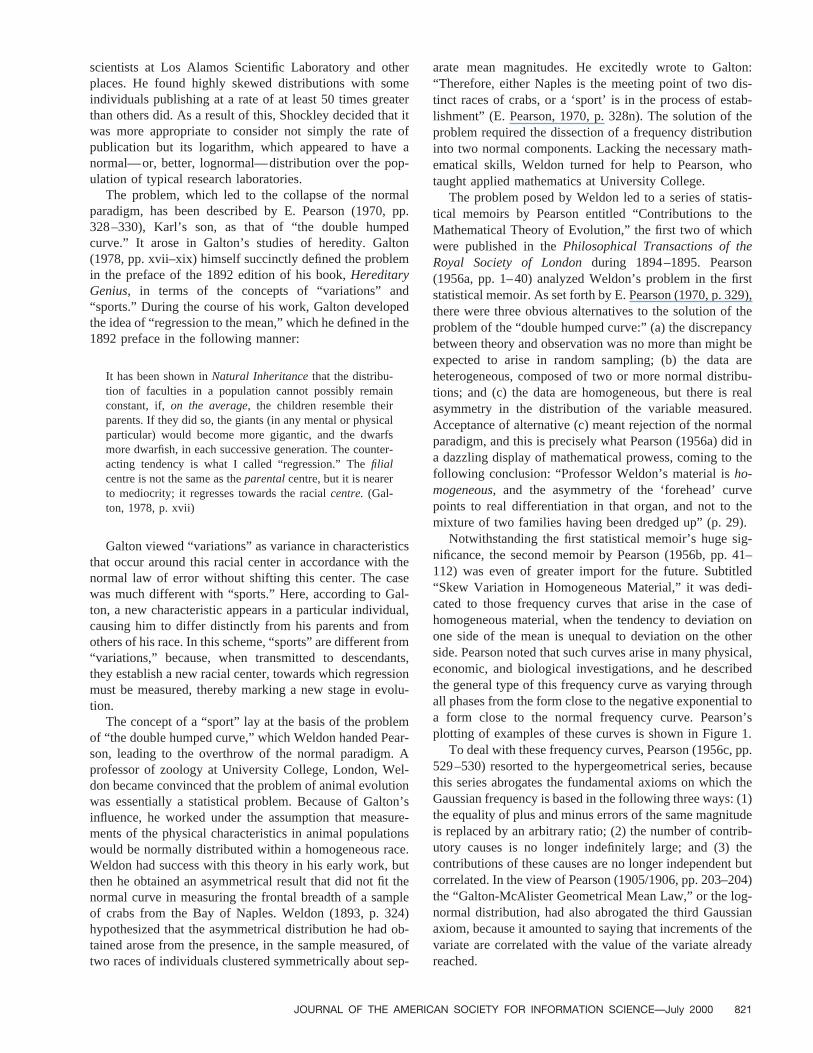
Notwithstanding the first statistical memoir’s huge sig-nificance, the second memoir by Pearson (1956b, pp. 41–112) was even of greater import for the future. Subtitled“Skew Variation in Homogeneous Material,” it was dedi-cated to those frequency curves that arise in the case ofhomogeneous material, when the tendency to deviation onone side of the mean is unequal to deviation on the otherside. Pearson noted that such curves arise in many physical,economic, and biological investigations, and he describedthe general type of this frequency curve as varying throughall phases from the form close to the negative exponential toa form close to the normal frequency curve. Pearson’splotting of examples of these curves is shown in Figure 1.
To deal with these frequency curves, Pearson (1956c, pp.529–530) resorted to the hypergeometrical series, becausethis series abrogates the fundamental axioms on which theGaussian frequency is based in the following three ways: (1)the equality of plus and minus errors of the same magnitudeis replaced by an arbitrary ratio; (2) the number of contrib-utory causes is no longer indefinitely large; and (3) thecontributions of these causes are no longer independent butcorrelated. In the view of Pearson (1905/1906, pp. 203–204)the “Galton-McAlister Geometrical Mean Law,” or the log-normal distribution, had also abrogated the third Gaussianaxiom, because it amounted to saying that increments of thevariate are correlated with the value of the variate alreadyreached.
JOURNAL OF THE AMERICAN SOCIETY FOR INFORMATION SCIENCE—July 2000 821

FIG
.1.
Pea
rson
’sex
ampl
esof
asym
met
rical
freq
uenc
ycu
rves
occu
rrin
gin
prac
tical
stat
istic
s.
822 JOURNAL OF THE AMERICAN SOCIETY FOR INFORMATION SCIENCE—July 2000

On the basis of the hypergeometrical series, Pearsonconstructed in his second statistical memoir a system of fivefrequency curves, which are given below together with theirmodern description and Pearson’s characterization of them(Pearson, 1956b, p. 58):
Type I (asymmetric beta)—Limited range in both direction,and skewness;
Type II (symmetric beta)—Limited range and symmetry;Type III (gamma or chi-square)—Limited range in one
direction only and skewness;Type IV (a family of asymmetric curves)—Unlimited range
in both directions and skewness; andType V (the normal)—Unlimited range in both directions
and symmetry.
As E. Pearson (1970, pp. 329–330) noted, his father’sderivation of the normal distribution off the hypergeometri-cal series was revolutionary, because it broke with the200-year-old tradition of deriving the normal curve as anapproximation to the binomial. The final 30 pages of thesecond statistical memoir were devoted to demonstratingthe superiority of this system of curves over the normaldistribution in the description of reality, using examples thatranged from barometric pressures, to the heights of St.Louis schoolgirls, to statistics on pauperism. Ultimately,Pearson expanded his system of frequency curves to 12, andhe pointed out that “the Gaussian is a mere point in aninfinite range of symmetrical frequency curves, and a singlepoint in a doubly infinite series of general frequency distri-butions” (Pearson, 1956c, p. 550).
As a further development of his work during this period,Pearson (1956d, pp. 339–357) developed his chi-squaregoodness-of-fit test, which determines how well the ob-served frequencies of an actual distribution match the ex-pected frequencies calculated from a theoretical distribu-tion. He used this test to demonstrate again the superiorityof his skewed distributions over the normal distribution,declaring that, “if the earlier writers on probability had notproceeded so entirely from the mathematical standpoint, buthad endeavored first to classify experience in deviationsfrom the average, and then to obtain some measure of theactual goodness-of-fit provided by the normal curve, thatcurve would never have obtained its present position in thetheory of errors” (p. 355).
In an evaluation of Pearson’s system of frequencycurves, Neyman (1939) stated that their importance is “be-cause of the empirical fact that, it is but rarely that we findin practice an empirical distribution, which could not besatisfactorily fitted by any such curves” (p. 55). Neymansaw as one of the main tasks explaining and mathematicallydescribing the “machinery” producing empirical distribu-tions of a given kind.
Together, the Galton-McAlister papers on the lognormaldistribution and the Pearson paper on skew variation inhomogeneous material can be regarded as the foundingdocuments for the application of statistical methods in li-
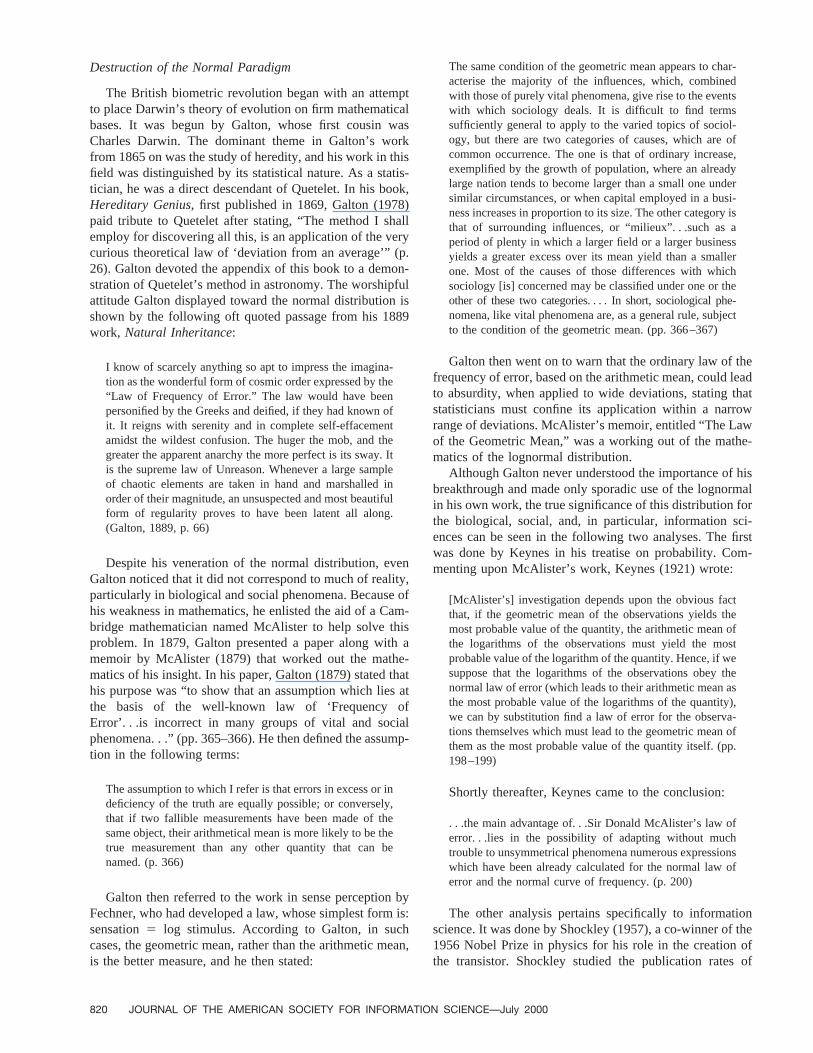
brary and information science. The first provided the law oferror, whereas the second laid the bases for the actual typesof distributions with which this discipline has to deal. Ofparticular importance in the latter sense is Pearson’s TypeIII, the gamma or chi-square distribution. In his secondmemoir, Pearson (1956b, pp. 72–73) called special attentionto it, pointing out how this distribution in its malleabilitycorresponds to the types of frequency curves found inreality, ranging from close to the negative exponential toclose to the normal frequency curve. He graphed sevensubtypes of the gamma distribution, and these subtypes areshown in Figure 2.
I can personally testify to the accuracy of Pearson’sobservations on the relative infrequency of the normal dis-tribution and as to how well the gamma distribution de-scribes those often found in reality. For the research onscientific journals, I ran dozens of datasets on such measuresas total citations to journals and academic departments,journal impact factors, faculty ratings of journals, libraryuse of journals, library holdings of journals, prices of jour-nals, etc. Invariably, I obtained a distribution that corre-sponded to three of Pearson’s subtypes of the gamma dis-tribution, in that it was unimodal with the mode at the lowerend of the distribution as well as highly and positivelyskewed to the right. When I showed my statistical advisercomputer runs of faculty ratings and prices of journals inseveral subjects, he just shook his head and commented thatall the data seemed to conform to the same distribution. Theonly time I did not obtain such a distribution was when Iwas selected by the National Research Council to test thedatabase it had constructed during its 1993 assessment ofthe quality of U.S. research-doctorate programs. In runningthe distributions of the peer ratings of chemistry depart-ments on the basis of a questionnaire designed in 1964 andused in that year, 1969, 1981, and 1993, I obtained for allyears a symmetrical binomial approximating the normaldistribution. This was such an unusual event that I suspectedsystematic instrument error. With such a distribution, thereis a 50/50 chance of being on either side of the mean, but 11chemistry programs had always been in the top 15 in peerratings of such programs since 1924, in spite of the ever-increasing number of these programs being evaluated.Moreover, the intercorrelations of the 1964, 1969, 1981, and1993 ratings ranged from 0.78 to 0.93. Cal Tech, MIT, andthe other nine programs were pasted like barnacles on theextreme right side of the distributions and were not shiftingback and forth across the mean as would be expected underthe conditions of random observational error. I could onlycome to the conclusion that the 1964 questionnaire wasseverely flawed. As a historical aside, it is interesting to notethat Galton had as a student and profoundly influencedJames McKeen Cattell, the psychologist who constructedthe first rankings of U.S. universities and academic depart-ments in the sciences on the basis of peer ratings at theopening of the twentieth century.
JOURNAL OF THE AMERICAN SOCIETY FOR INFORMATION SCIENCE—July 2000 823

FIG
2.P
ears
on’s
seve
nex
ampl
esof
Typ
eIII
gam
ma
dist
ribut
ions
.
824 JOURNAL OF THE AMERICAN SOCIETY FOR INFORMATION SCIENCE—July 2000

The Eugenics Connection
At this point, it is important to emphasize that there is anextremely dark and dangerous side to the subject underdiscussion. The development of modern inferential statisticswas closely intertwined with the creation of eugenics. Gal-ton was the creator of eugenics, which he defined in his1883 book,Inquiries into the Human Faculty and Its De-velopment, in the following manner:
[Eugenic questions are] questions bearing on what is termedin Greek,eugenes, namely, good in stock, hereditarily en-dowed with noble qualities. This, and the allied words,eugeneia, etc., are equally applicable to men, brutes, andplants. We greatly want a brief word to express the scienceof improving stock, which is by no means confined toquestions of judicious mating, but which, especially in thecase of man, takes cognisance of all influences that tend inhowever remote a degree to give to the more suitable racesor strains of blood a better chance of prevailing speedilyover the less suitable than they otherwise would have had.(Galton, 1883, pp. 24n–25n)
In 1904, he founded a research fellowship in nationaleugenics at the University of London, which was to developin a few years into the Galton Laboratory of NationalEugenics, with Karl Pearson as its first director. Pearsonwas succeeded by Fisher. In 1911, the Galton Laboratory ofNational Eugenics was merged with the Biometric Labora-tory founded by Pearson in 1895 to form the first academicdepartment of statistics, that of University College, London,and Pearson was its first professor. MacKenzie (1981) de-votes his book,Statistics in Britain, 1865–1930: The SocialConstruction of Scientific Knowledge, to the close connec-tion of the development of modern statistics with eugenics,and he sums up the relationship thus:
One specific set of social purposes was common to the workof Galton, Karl Pearson, and R.A. Fisher. All were eu-genists. They claimed that the most important human char-acteristics, such as mental ability, were inherited from onegeneration to the next. People’s ancestry, rather than theirenvironment was crucial to determining their characteris-tics. The only secure long-term way to improve society,they argued, was to improve the characteristics of the indi-viduals in it, and the best way to do this was to ensure thatthose in the present generation with good characteristics(the ‘fit’) had more children than those with bad character-istics (the ‘unfit’). (p. 11)
As MacKenzie points out, the work of these men ineugenics contributed to a body of notorious and controver-sial ideas, laying the bases for debates about race, class, andIQ. Eugenics were discredited by the virulent form theytook in the racial policies of Nazi Germany, and this badodor informed the ferocity of the assault on the logicalstructure of statistics after World War II by the biologistHogben, who described Galton as “the father of the politicalcult variously namedeugenicsor Rassenhygiene” (p. 106),
referred to “Galton’s racialist creed” (p. 325), and decried“K. Pearson’s flair for ancestor worship” (p. 176).
The dangers inherent in this situation for library andinformation science can be seen in the strange career ofShockley following his paper described here on the produc-tivity of individual scientists. Lotka’s Inverse Square Lawof Scientific Productivity stands in apparent contradiction tothe usual way intelligence is measured through the Stan-ford-Binet and other such tests. In their textbook, Brownand Herrnstein (1975, pp. 506–510), two Harvard psychol-ogists, state that the scores of these tests result in the normaldistribution, making the following observation: “If a testyields scores that do not match a normal distribution, it isoften possible to whip them into the right shape by asuitable transformation” (p. 510). This fact underlies thetitle of the highly controversial book,The Bell Curve:Intelligence and Class Structure in American Life, by Her-rnstein and Murray, whose conclusions and policy prescrip-tions caused Fraser (1995) to declare that “Not since theeugenics craze of the 1920s has this line of thought occu-pied a serious place on the national agenda” (p. 3). In hisrediscovery of Lotka’s Law in the lognormal form, Shock-ley (1957) hypothesized that the rise of this distribution wasthe manifestation of some fundamental mental attributebased on a factorial process, which enabled some individ-uals to be much more highly productive, and that the greatvariation in rate of production from one individual to an-other could be explained on the basis of simplified modelsof the mental processes concerned. From here he went on todevelop his theory of “dysgenics,” using data from the U.S.Army’s pre-induction IQ tests to prove that African Amer-icans were inherently less intelligent than Caucasians.Among his more controversial actions was to propose thatindividuals with IQs below 100 be paid to undergo volun-tary sterilization, and he raised eyebrows by openly andrepeatedly donating to a so-called Nobel sperm bank de-signed to pass on the genes of geniuses. Shockley died,regarding his work on race as more important than his rolein the discovery of the transistor.
Development of a New Stochastic Model
Before one can understand the next development in theBritish biometric revolution of vast import for library andinformation science, it is necessary to have some knowledgeof the Poisson distribution. Basically, the Poisson distribu-tion arises as a result of random occurrences over time andspace. In hisIntroduction to Mathematical Sociology,Coleman (1964, p. 291) states that the advantage of thePoisson process for the social sciences is that, unlike thebinomial process, which is based on discrete “trials,” thePoisson process occurs continuously over time and, there-fore, is suitable for the naturally occurring events studied inthe social sciences, where controlled experiments are oftennot possible. This distribution was first derived by SimeonPoisson as a limit to the binomial in a study published in1837 on French judicial decisions. However, the first person
JOURNAL OF THE AMERICAN SOCIETY FOR INFORMATION SCIENCE—July 2000 825

to grasp the statistical significance of the Poisson formulawas von Bortkiewicz, who in 1898 published a small pam-phlet entitledDas Gesetz von kleinen Zahlen, containing theclassic illustration of the Poisson distribution in an analysisof the rate at which soldiers were kicked to death by horsesin 14 Prussian army corps in the period 1875–1894. Theliteral translation of the title is “The Law of Small Num-bers,” but Crathorne (1928) suggests as better translations“The Law of the Probability of Rare Events” or “The Lawof Large Numbers in the Case of Small Frequencies” (p.173). An English translation of the key parts of von Bort-kiewicz’s pamphlet with modern mathematical notation isgiven by Winsor (1947).
The Poisson distribution has one parameter, which isestimated off the mean (m) and also equals the variance (s2).The basic equation for the Poisson is:
P~x! 5 e2z~zx/x! !
where x is the number of successes,z is the parameterestimated, ande 5 2.71828 and is the base of naturallogarithms. As Poisson did, modern textbooks derive thePoisson as a limit of the binomial, and Snedecor and Coch-ran (1989, pp. 30–31, 110–113, 117–119, 130–133) illus-trate the basic logic behind this method. Given a two-classpopulation of successes and failures, wherep is the proba-bility of success and is obtained by dividing the number ofsuccesses by the total number of trials orn, the populationmean (m) equalsp. Hence, in repeated trials taking randombinomial samples of any sizen, m 5 np. Using a samplesize of eight, Snedecor and Cochran show how the Poissonarises from the binomial. Whenp 5 0.5, the probabilitydistribution of success is symmetrical with the mode at foursuccesses, approximating the normal, but whenp 5 0.2, theprobability distribution becomes positively skewed with themode at one success and a concomitant decrease in theprobability of the higher numbers of successes. Snedecorand Cochran then show that the binomial tends toward thenormal for any fixed value ofp as n increases, with therequiredn being smallest atp 5 0.5, but this approximationto the normal fails atp , 0.5, when the meanm 5 np fallsbelow 15, even ifn is large. The binomial distribution thenremains positively skewed, and we are dealing with rareevents, requiring the Poisson distribution.
It is often easier to explain what a phenomenon is bydemonstrating what it is not, and I propose to do this withthe Poisson distribution, using Urquhart’s Law as an exam-ple. Although relatively unknown, Urquhart’s Law is one ofthe most important library and information science laws.Briefly stated, it posits that the supralibrary use of scientificjournals is the same as their intralibrary use, concentratingin the same fashion on the same titles. By supralibrary use,I mean use outside the collections of individual libraries,such as through interlibrary loan or centralized documentdelivery, whereas intralibrary use refers to the use of mate-rials held in the collections of individual libraries by the
patrons of these libraries. Urquhart’s Law is the library usecounterpart to the citation-based Law of Concentration pos-ited by Garfield (1971, 1972, p. 476). Taken together, thesetwo laws dictate that significant science tends to concentratewithin a relatively few journals. Urquhart’s Law lies at thebasis of the operations of the British Library DocumentSupply Centre, and failure to understand the implications ofthis law has led to efforts at interlibrary cooperation in theU.S. resulting in what may be considered expensive failures.
Urquhart’s Law was formulated by Donald J. Urquhartas a result of study of the use of scientific journals con-ducted in 1956 at the Science Museum Library (SML) in theSouth Kensington section of London in preparation for hisestablishment in Boston Spa, Yorkshire, of the NationalLending Library for Science and Technology, which ulti-mately became the present-day British Library DocumentSupply Centre. This was the first major study of library use,and Urquhart’s work preceded the use study done at theUniversity of Chicago by Fussler and Simon (1969), as wellas the formulation by Trueswell (1969) of his 80/20 Rule oflibrary use. The fact that Urquhart studied journal use at theScience Museum Library is of historical significance, forthis was the library once headed by Samuel C. Bradford.Bradford (1934) formulated his Law of Scattering at thislibrary, which he turned into Britain’s central interlibraryloan library for scientific journals.
Urquhart (1958; Urquhart & Bunn, 1959) analyzed53,216 “external loans” or loans made in 1956 by the SMLto outside organizations. These loans came from 5632 titlesout of an estimated 18,000 titles held by the SML, of which9120 were current, with the remainder being noncurrent. Ofthe serials titles used, 2769 were noncurrent. Urquhartfound that around 1250 titles—or less than 10% of thetitles—were enough to satisfy 80% of the external demand.Moreover, Urquhart compared the external use of the serialsat the SML with the holdings of these titles by major U.K.libraries as listed in theBritish Union List of Periodicals.Hefound a direct correlation of the external use of the titles atthe SML with the number of their holdings in U.K. libraries(i.e., the more heavily a serial was borrowed on interlibraryloan, the more widely it was held). As a result, Urquhart(1958) came to the following conclusion:
External organizations will naturally borrow from the Sci-ence Museum Library scientific literature which they do nothold themselves, or which they cannot obtain from somemore accessible collection. Thus, the external loan demandon the library is, in general, only a residual demand. . . .Nevertheless, possibly because so many external organiza-tions (some 1200) use the Science Museum Library, itappears. . .that the use of the copies of a serial in the libraryis a rough indicator of its total use in the United Kingdom.(p. 290)
Many years later, Urquhart (1981) formulated his law inthe following manner:
The fact that the heaviest inter-library demand is for peri-odicals, which are held by a number of libraries is of major
826 JOURNAL OF THE AMERICAN SOCIETY FOR INFORMATION SCIENCE—July 2000

importance in designing inter-library services. To draw at-tention to this relationship I have called it “Urquhart’s law.”It means, for instance, that the periodicals in the Boston Spacollection which are rarely used are unlikely to be used toany appreciable extent in a British university. There may besome exceptions to this deduction. . . .Nevertheless, the lawis very important in considering the need for a central loancollection. (p. 85)
Up to now, we have been dealing with a brilliant piece ofLibrary Arithmetic. However, Urquhart made an attempt totake the matter one step further and base his findings on aprobability model. By doing this, he became one of the firstpersons to try to apply probability to library use. In thepapers presenting these findings, Urquhart (1958, p. 291;Urquhart & Bunn, 1959, p. 21) assumes that the externalloans at the SML were random, adopting the Poisson modelto construct hypothetical distributions of journal use thatwould result from this model without actually fitting thePoisson to the SML data. Here, Urquhart is on more shakyground, as he manifests ignorance about the working of thisdistribution. This is seen in his book,The Principles ofLibrarianship, in which Urquhart (1981) calls upon librar-ians to have an understanding of the Poisson distributionand makes the following statement: “Poisson was studyingthe number of grooms kicked to death by horses in thePrussian army” (p. 76). Urquhart thus attributes to Poissonthe analysis done by von Bortkewicz on Prussian soldiersbeing kicked to death by horses long after Poisson himselfwas dead. The fact that the same journals dominate bothsupralibrary and intralibrary use defies the concept of ran-domness even from the linguistic point of view, much lessthe statistical.
From the tables and data presented by Urquhart in hispapers, I was able to reconstruct a fair approximation of thetotal distribution of the 1956 external loans at the SML.With 18,000 titles and 53,216 loans, the mean external loansper title was 2.96. Using an antique method to derive thestandard deviation off tabular data, I estimated the variance
of the distribution at 138.1—needless to say, significantlyhigher than the mean of 2.96. I then fitted the Poissondistribution to Urquhart’s data, using Pearson’s chi-squaregoodness-of-fit test. The results are presented in Table 1. Indoing so, I made an interesting discovery. Urquhart’s majorfinding of 1250 titles accounting for 80% of the externaluses was a probablistic impossibility by his own theoreticalmodel. Urquhart’s high-use class ranges from ten externalloans to 382 external loans. However, the denominator ofthe Poisson equation—based on the factorials of the numberof successes—rises exponentially faster than the numeratorof the equation—based on the mean to the power of thenumber of successes, quickly crushing out the probability ofany observation varying too far above the mean. At a meanof 2.96, the Poisson probability of ten external loans was0.00073, and the total probability of all the titles, whichaccounted for ten external loans or above, was 0.001. Thegoodness-of-fit test resulted in a chi-square of 235,362.9,and a chi-square at anything above 16.75 meant rejection ofthe Poisson at the 0.005 level.
The reasons for the failure of Urquhart’s data to fit thePoisson can be located in two requirements emphasized byThorndike (1926) in a study of the applicability of thisdistribution to practical problems. According to Thorndike,the successful utilization of the Poisson requires that theoccurrences constituting the sample under study be theresult of “uniform” and “independent” trials. He then clar-ified these terms in the following manner:
The term ‘uniform’ applies, of course, not to the results ofthe trials (or samples) but to the essential conditions underwhich they are obtained, and ‘independent’ is used with themeaning that the result of one trial (or sample) does notaffect the occurrence of the event in any other trial (orsample). (p. 607)
With this statement, Thorndike puts his finger on thetwo stochastic processes—“inhomogeneity” and “conta-
TABLE 1. Chi-square test of the goodness-of-fit of the Poisson distribution to the external loans attributable to the titles held at the Science MuseumLibrary in 1956.a
Number ofexternalloans
Observednumber of
titles inclass
Estimatednumber ofexternalloans per
class
Estimatedpercent of
totalexternalloans per
class
Poissonprobabilityper class
Expectednumber of
titles inclass Chi-square
0 12,368 0 0.0 0.052 936.1 139,615.81 2,190 2,190 4.1 0.154 2,767.4 120.52 791 1,582 3.0 0.227 4,090.9 2,661.83 403 1,209 2.3 0.224 4,031.5 3,265.84 283 1,132 2.1 0.166 2,979.7 2,440.65–9 714 5,355 10.1 0.176 3,176.7 1,909.210–382 1,251 41,748 78.5 0.001 17.8 85,349.3
Totals 18,000 53,216 100.0 1.000 18,000.0 235,362.9
a Poisson distribution rejected at 0.005 level at any chi-square above 16.75. Mean5 2.96 external loans per title. Variance estimated to be 138.1.
JOURNAL OF THE AMERICAN SOCIETY FOR INFORMATION SCIENCE—July 2000 827

gion”—by which a Poisson process results in the negativebinomial distribution. As a matter of fact, so closely relatedis the Poisson distribution to the negative binomial thatStigler (1982) points out that, although the Poisson distri-bution appears in Poisson’s 1837 study of French judicialdecisions as the limit to the binomial, he actually derived hisdistribution directly as an approximation to thenegativebinomial cumulative distribution.
With respect to the first process, it is especially importantfor the observations in the set under study to be homoge-neous in terms of an equal propensity to produce occur-rences, if the distribution is to fit the Poisson. Under theconditions of high homogeneity, events occur randomlyover the observations in the set, and this results in theobservations clustering tightly around the mean. Von Bort-kiewicz was aware of the need for homogeneity, causinghim to exclude from his set four Prussian army corpsorganizationally different from the other ten. The need forhomogeneity makes the test for the Poisson a good methodin industrial inspection to determine whether manufacturingprocesses are creating products within required specifica-tions. Inhomogeneity results in what is technically known as“over-dispersion.” Using the example of a set of truckdrivers, whose mean accident rate is one accident every 3years, Borel (1943/1962, pp. 44–46), the noted Frenchexpert on the Poisson distribution, explains in the mannerbelow how over-dispersion arises, when the truck driversdiffer in their probability of having an accident:
In the language of the calculus of probabilities, we sum upthis increase of the proportion of cases where the number ofaccidents is 0, 2, 3, and the inevitably correlative decreaseof cases where the number of accidents is equal to unity,which is the mean, by saying that the observeddispersionisgreater than the normal dispersion. It is a general law of thecalculus of probabilities that, in this case, the materialobserved is not homogeneous: the probabilities are notequal for all individuals, but above the average for some andtherefore below the average for others. (p. 46)
Scientific journals are notoriously inhomogeneous insize, quality, and social influence. The difference in qualityand social influence is a function of the fact that scientifictalent is not randomly or uniformly distributed but concen-trated in a relatively few persons. As Bensman and Wilder(1998) have proven with the help of the National ResearchCouncil database, the better scientists tend to concentrate ata few traditionally prestigious institutions and publish in acertain set of journals, of which those published by U.S.associations form an essential part. The resulting inhomo-geneity of scientific journals manifests itself in faculty rat-ings, citation patterns, as well as in both intralibrary andsupralibrary use.
Inspection of the table fitting the Poisson distribution toUrquhart’s data reveals extreme inhomogeneity and over-dispersion, whose key points are highlighted by where thechi-squares are the greatest. For example, whereas the ex-
pected number of titles in the zero class is 936.1, theobserved number is 12,368; whereas the expected numberof titles in the high-loan class is 17.8, the observed numberis 1,251; and there is a corresponding overprediction by thePoisson of the number of titles in the three classes—2 , 3 ,and 4 external loans—surrounding the mean of 2.96 suchloans. Here we see at work the double-edged MatthewEffect and the zero-sum game underlying the scientificinformation system.
The classic model of the effect of inhomogeneity in aPoisson process is the gamma Poisson version of the neg-ative binomial distribution, and the construction of thismodel was made possible by the almost simultaneous break-throughs by Pearson and von Bortkewicz. Pearson (1905/1906, pp. 208–210, 1915/1917, 1956c, p. 554) himselfbecame intrigued with the potential of the negative binomialof the form (p 2 q)2n, wherep 2 q 5 1. His interest wasshared by other participants in the British biometric revo-lution. For example, Pearson (1915/1917) reported:
Thus, if two or more of Poisson’s series be combined termby termfrom the first, then the compound will always be anegative binomial. This theorem was first pointed out to meby ‘Student’ and suggested by him as a possible explanationof negative binomials occurring in material which theoret-ically should obey the Law of Small Numbers, e.g. ‘Stu-dent’s’ own Haemacytometer counts. Of course, the nega-tive binomial may quite conceivably arise from othersources than heterogeneity. . . . (pp. 139–140)
The above passage outlines in an unclear fashion theessential elements of the inhomogeneity model, whose pre-cise mathematical development was accomplished by Pear-son’s prote´ge, George Yule, in collaboration with the epi-demiologist, Major Greenwood.
The utility of the negative binomial was first brought tothe attention of statisticians by Yule (1910) in a paper readbefore the Royal Statistical Society in December 1909. Inthis paper, Yule dealt with distributions that arise when thecausal effects act cumulatively on homogeneous popula-tions. For such distributions, he derived a law by which theprobabilities were calculated by the successive terms of thebinomial expansion ofpr (1 2 q)2r, and he was able to fitthis distribution to two sets of data on diseases and one ondivorces that were not amenable at all to fitting by anordinary binomial series. This paper was particularly nota-ble, because in it Yule derived from this negative binomialseries a formula for the Type III gamma distribution, whichPearson had originally calculated on the basis of the normalbinomial expansion of (p 1 q)r.
As described by Greenwood (Newbold, 1927, pp. 536–537), it was the needs of the Royal Flying Corps duringWorld War I that led Greenwood and Yule to construct thegamma Poisson version of the negative binomial distribu-tion. At that time, the question arose as to whether to allowa pilot who had suffered a small accident to fly again. Theproblem emerged whether it would be possible to distin-
828 JOURNAL OF THE AMERICAN SOCIETY FOR INFORMATION SCIENCE—July 2000

guish by analysis of frequency distributions of accidentsbetween three possibilities: (1) that accidents are accidentsin the sense of being “simple” chance events; (2) that thedistribution of first accidents is that of “simple” chanceevents; and (3) that the distribution whether of first orsubsequent accidents differs in a specific way from the“simple” chance scheme. As no hypothesis could be testedfrom Flying Corps data because of the question of unequalexposure to risk, Greenwood and Yule confined their inves-tigation to the statistics of trivial accidents among femaleworkers in munitions factories.
In solving this problem, Greenwood and Yule (1920)based themselves upon the Poisson, taking advantage of thefollowing characteristic of this distribution that makes itparticularly applicable to time and space problems: the sumof a set of numbers, each following a separate Poisson series(about different means), is itself a Poisson series. As aresult, time and space units can be split into smaller ones,cells can be divided, periods of exposure can be changed, orthe records of separate individuals can be summed intorecords of groups; and each of the single sets as well as thesum of the whole will yield a Poisson series. The solution,for which Greenwood and Yule opted was based on twoassumptions: (1) each individual worker had a differentmean rate of accidents that was constant throughout theperiod, thus forming her own Poisson series; and (2) themean accident rates of the workers were distributed over thepopulation according to a theoretical curve. For the latter,Greenwood and Yule considered the normal curve of errorbut rejected it as not being positively skewed enough. Not-ing that the choice of skew curves was arbitrary, theyselected Pearson’s Type III gamma distribution, but in theform derived by Yule off the negative binomial series.Greenwood and Yule found that their gamma Poissonmodel gave reasonable fits to observed accident rates intests of fourteen sets of data on female munitions workers.In a paper read before the Royal Statistical Society, New-bold (1927) extended and confirmed the work of Green-wood and Yule, and together these papers established theconcept of “accident proneness,” with the gamma distribu-tion serving as its mathematical description.
As a demonstration of the continuous spread of proba-bilistic methods to other disciplines, two other papers,which were presented to the Royal Statistical Society on thegamma Poisson distribution, should be mentioned at thispoint. In 1957, Ehrenberg (1959) read a paper that extendedits use to marketing as the model for consumer buying, withthe purchases of individual buyers following the Poissondistribution in time and the average purchasing rates of thedifferent consumers being proportional to the Pearson TypeIII distribution. Twenty-five years later, Burrell and Cane(1982) presented a paper that used this distribution as thebasis for the construction of a stochastic model for thecirculation of library books, with each book circulatingrandomly at a given mean rate and the distribution of themean rate of use over the book collection in the gamma
form. Burrell and Cane found that the gamma Poissonmodel approximated Trueswell’s 80/20 Rule under certainconditions.
In the light of the work of Ehrenberg, Burrell, and Cane,the potential of the gamma Poisson model became evident,when a Baton Rouge river boat recently admitted that 80%of its revenues comes from 20% of its customers. SinceBernoulli’s Law of Large Numbers dictates that the percent-age of loss on the amount wagered must ultimately equal thepercentage of the riverboat’s gross profit with a certainty ofone on the condition of a sufficient number of trials, theadmission appears to justify the characterization of theState’s gambling revenues by a conservative Louisiana leg-islator as “a tax on stupidity,” the gamma distribution en-suring that the tax is a steeply progressive one.
The other reason Urquhart’s data fail to fit the Poissonmay be traced to Thorndike’s requirement that the trials be“independent” in the sense that “the result of one trial (orsample) does not affect the occurrence of the event in anyother trial (or sample).” In my opinion, this condition doesnot hold for most phenomena in library and informationscience. In particular, it does not hold for library usesbecause of the following factor. When library materials areborrowed, the patrons borrowing them form opinions; andthese opinions are communicated to other patrons, raisingand lowering the probabilities of the materials being bor-rowed again. The process of one trial affecting the outcomeof another trial is encompassed in the concept of “conta-gion.” At this point, I must admit that I am somewhatconfused about the logical implementation of contagionbecause of these reasons: (1) it is sometimes impossible todistinguish the effect of contagion from that of inhomoge-neity; and (2) the process of contagion in library and infor-mation science is counteracted by the growing obsolescenceof literature as it ages, especially in the sciences.
The first problem was posed by Feller (1943) in hisclassic conundrum about “true contagion” and “apparentcontagion.” Feller noted that this conundrum first arose inthe paper by Greenwood and Yule (1920), in which theydeveloped the gamma Poisson version of the negative bi-nomial. Feller considered this version a case of “apparentcontagion,” because it was based on the inhomogeneity ofthe observations in the set, and not upon one trial affectinganother. However, in this paper Greenwood and Yule (1920,pp. 258–264) also experimented with a model involving“the assumption that the happening of the event not onlyimproves the prospects of the successful candidates butmilitates against the chances of those who had hithertofailed” (p. 264). They developed a mathematical solutionfor this problem, but by their own admission their solutionwas not in a form very suitable for computation. Describingthis model as “true contagion,” Feller ascribed the complex-ity of their formulas to the very general nature of theirscheme. He then pointed out that on the basis of a specialmodel of true contagion, which turned out to be the simplestcase of the more generalized Greenwood and Yule scheme,
JOURNAL OF THE AMERICAN SOCIETY FOR INFORMATION SCIENCE—July 2000 829

George Po´lya was led to exactly the same distribution thatGreenwood and Yule had constructed on the basis of inho-mogeneity. The contagion model used by Po´lya was an urnmodel with balls of two different colors, where the drawingof a ball of one color is followed by the replacement of thisball along with more balls of the same color, thereby in-creasing the probability of drawing this color, and decreas-ing the probability of drawing the other color. As a result ofFeller’s finding, if one encounters the negative binomial,one does not know from which process it arose—whetherinhomogeneity or contagion—and there is a good possibil-ity in library and information science that it could havearisen by both stochastic processes operating simulta-neously and interactively.
The difficulties such a situation can cause for the mod-eling of library use emerges as soon as one approaches theproblem of the obsolescence of literature over time. This isevident in the studies of monograph use described below,and the factors taken into account in these studies are alsooperative in the use of journal backfiles. Basing himself oninhomogeneity in his studies of monograph use, Burrell(1985, 1986, 1987) built into his gamma Poisson model anaging factor, by which the desirability of the monographsmeasured by the gamma distribution decays exponentiallyat the same rate for all monographs, leading to stabledistributions over time and a growing zero class as othermonographs merge with those already there because of theirinitial zero desirability. Moreover, in their study of mono-graph use, Fussler and Simon (1969, pp. 5–7, 142–143,187–188) assumed that, within a specified period of time,the use of a particular book was entirely a random process,independent from its use in a previous time period anddependent only upon the underlying probability estimatedby observing the use of a group of books with commoncharacteristics. Fussler and Simon tested for “contagion,”(i.e., whether the use of a book in one year substantiallyraises the probability that it will be used in the next year),leading to a group of books showing progressively greateruses over the years. Their assumption of independence ofuse from one time period to another seemed to be supportedby the data, but they admit that their test was made imper-fect by the overall decrease in the use of books. Fussler andSimon also appear to negate their own conclusion with thestatement that “a not unexpected though crucial finding wasthat past use over a sufficiently long period is an excellentand by far the best predictor of future use” (p. 143). As asign of the possible operation of both inhomogeneity andcontagion, Fussler and Simon noted that “the observeddistributions do not resemble the Poisson closely but have amuch higher variance” (p.187).
All this leaves me scratching my head as to the influenceof contagion. Is use of library materials over time in relationto each other determined solely by their initial desirability?Or does contagion act by slowing the inevitable obsoles-cence of some materials as against others? Or is there a timedefinition problem, and some materials would show first
increasing use because of contagion and then decreasing usebecause of obsolescence slowed by contagion? Then, too,what creates desirability in the first place—inhomogeneitiesin quality, as judged independently by individuals, or someform of social communication?
Although contagion must play some sort of role, theproblem of obsolescence does seem simpler to handle log-ically the way Burrell did i.e., on the basis of inhomogeneitywithout taking into account the influence of contagion.Moreover, this approach can be integrated with the transi-tion from the negative binomial to the Poisson through theviews of Borel (1950/1963, pp. 61–66) on entropy. Entropyis a measure of the amount of disorder or randomness in asystem, and Borel equated it with homogeneity. In his view,inhomogeneity represents the opposite or order. Accordingto Borel, order is less probable than disorder, as it requireswork or energy for its creation, and he declared that “vitalphenomena usually consist in the creation of states notconsidered probable” (p. 64). From this standpoint, he de-fined the guiding principle of entropy in the followingmanner: “The principle of entropy. . . states that a closedsystem—i.e., one that does not receive any energy from anexternal source—will necessarily evolve by passing fromless probable states toward more probable ones” (p. 61).Analyzing this principle on the cosmic scale and rephrasingit in terms of inhomogeneity vs. homogeneity, Borel con-cluded that “the universe is steadily evolving from theheterogeneous toward the homogeneous, i.e., from a rela-tively ordered state toward a state that is more and moredisordered. . .” (p. 66).
An application of Borel’s views on entropy to Burrell’sgamma Poisson model leads to the hypothesis that, as thedesirability of a set of library materials decreases with ageand the set receives less and less outside energy, its useshould decline, with an ever diminishing mean and thecollapse of the variance toward this mean. When the vari-ance equals the mean, the materials could be considered ina state of equilibrium marked by rare and random events. Itshould then be feasible to shift these materials to some formof remote storage.
Final Considerations and a PractitionerRecommendation
I will not discuss in this paper the debates provoked bythe introduction of the negative binomial into library andinformation science. This topic is thoroughly covered inBensman and Wilder (1998, pp. 161–171). Here I only wantto emphasize three general conclusions, at which I arrivedas a result of research on the scientific information marketand testing the National Research Council database.
First, the skewed distributions found in library and in-formation science and described by empirical informetriclaws are not unusual. The discovery of these laws was onlya part of a broad process of uncovering the skewed distri-butions underlying phenomena in many other disciplines
830 JOURNAL OF THE AMERICAN SOCIETY FOR INFORMATION SCIENCE—July 2000

that took place after Pearson’s devastating assault on thenormal paradigm. As a matter of fact, the discovery of theseskewed distributions was taking place even before Pearson.For example, the doctrine of Karl Marx with its concentra-tion of the means of production and impoverishment of themasses can be considered in many respects as the drawingof wrong conclusions from a correct observation that thestochastic processes operative in the negative binomial areoperative in human society. In the paper in which he derivedthe first informetric law—the Inverse Square Law of Sci-entific Productivity— Lotka (1926) was well aware that hehad found nothing unusual. Thus, he wrote:
Frequency distributions of the general type (1) have a widerange of applicability to a variety of phenomena, and themere form of such a distribution throws little or no light onthe underlying physical relations. (p. 323)
To back up these statements, Lotka cited the work ofCorrado Gini on the inequality of income within a popula-tion and John Christopher Willis on the distribution ofspecies. Perhaps the distinguishing feature of frequencydistributions within library and information science is thefuzzy nature of the sets, within which they arise. Thisfuzziness is a function of the way disciplines overlap andshare the same literature. From this perspective, the twomost important informetric laws, which set apart library andinformation science from other disciplines, are Bradford’sLaw of Scattering and Garfield’s Law of Concentration.
Second, the working out of the probability distributionsand stochastic processes underlying library and informationscience is primarily the accomplishment of the British andthose working in the British tradition. Therefore, it is to thescientific history of Britain, to which one must turn in orderto gain an insight into the nature of these distributions. Asfurther proof of the need to study British work, it should benoted that Garfield derived his Law of Concentration, whichunderlies the operations of the Institute for Scientific Infor-mation, off Bradford’s Law of Scattering by transposing thelatter from the level of a single discipline to that of scienceas a whole. This need holds true for the introduction of thenegative binomial into library and information science,which was primarily the work of Burrell at the University ofManchester as well as of Tague and Ravichandra Rao at theUniversity of Western Ontario. The debate over the negativebinomial in library and information science was a Britishand Canadian one, in which the Americans were for themost part silent. I came to the negative binomial through anobservation by Price, who was born in London and receivedhis doctorates at the University of London and Cambridgethough he taught at Yale, that it was the model for the socialstratification of science posited by Robert Merton. As aresult of this, the Bensman and Wilder (1998) paper can beregarded as an attempt to merge library and informationscience with the American sociology of Robert Merton andthe British biometrics of Karl Pearson.
And, finally, as a result of my reading about probabilitydistributions and working with them, I have come to adopt
what Sarndal (1977) has described as the “agnosticism” ofthe modern statistician in such matters. In a telling passage,Sarndal wrote:
At the end of the nineteenth century a rapid developmentoccurred. The illusion of the normal law as a universal lawof errors was shattered. Instead, there emerged conceptionsof data distributions that have the characteristics of agnos-ticism still prevailing today, as shown in our reluctance, oreven inability, to state that given data are distributed ac-cording to a normal law, or any other narrowly specified lawfor that matter. If we do adopt a certain distributional law asa working model, we usually acknowledge the fact that thismay be just an adequate approximation. Or, as in modernstudies of robustness, we may assume only that the truedistribution is a member of some family of distributions, orwe take yet a further step and assume a nonparametricmodel. (p. 420)
My statistical adviser at the LSU Department of Exper-imental Statistics put the case more succinctly: “We have inour computer lab thirty computers, each named after adifferent distribution, and, if we ever get the money to buythirty more computers, I am sure that we will have noproblem in coming up with another thirty distributions, afterwhich to name the new ones.”
I was led to the agnostic view by the realization that thereare two major difficulties in fitting library and informationscience data to precise theoretical distributions. First, subtlechanges in conditions can lead to shifts in the underlyingstochastic processes being modeled. Second, the numberswe obtain are a function of the logical structure of our sets,and because of their inherent fuzziness, library and infor-mation science sets are full of contaminants resulting inoutliers that distort the mathematical parameters of anytheoretical model. Moreover, much of what I read on prob-ability distributions appeared to deal with mathematicalrefinements that would be overwhelmed by the faults inher-ent in library and information science data.
Because of my conversion to agnosticism, I came to theconclusion that all that is necessary for practical statisticalresearch in library and information science is to follow thesesimple procedures: (1) utilize the index of dispersion testthat determines whether you are dealing with the Poisson bycomparing the variance to the mean (Elliott, 1977, pp.40–44, 73–75); (2) if the variance is found significantlygreater than the mean—and it almost invariably is—assumethat you are dealing with the negative binomial or a distri-bution closely akin to it; (3) perform the appropriate loga-rithmic transformations of your data to approximate thecorrect law of error; and (4) proceed to analyze the ques-tions that really interest you.
References
Bensman, S.J. (1982). Bibliometric laws and library use as social phenom-ena. Library Research, 4, 279–312.
JOURNAL OF THE AMERICAN SOCIETY FOR INFORMATION SCIENCE—July 2000 831

Bensman, S.J. (1985). Journal collection management as a cumulativeadvantage process. College & Research Libraries, 46, 13–29.
Bensman, S.J. (1996). The structure of the library market for scientificjournals: The case of chemistry. Library Resources & Technical Ser-vices, 40, 145–170.
Bensman, S.J., & Wilder, S.J. (1998). Scientific and technical serialsholdings optimization in an inefficient market: A LSU Serial RedesignProject exercise. Library Resources & Technical Services, 42, 147–242.
Bookstein, A. (1990). Informetric distributions, Part I: Unified overview;Part II: Resilience to ambiguity. Journal of the American Society forInformation Science, 41, 368–386.
Bookstein, A. (1995). Ambiguity in measurement of social science phe-nomena. In M.E.D. Koenig & A. Bookstein (Eds.), Fifth InternationalConference of the International Society for Scientometrics and Infor-metrics (pp.73–82). Medford, NJ: Learned Information.
Bookstein, A. (1997). Informetric distributions, Part III: Ambiguity andrandomness. Journal of the American Society for Information Science,48, 2–10.
Borel, E. (1962). Probabilities and life (translated by M. Baudin). NewYork: Dover Publications (originally published in 1943).
Borel, E. (1963). Probability and certainty (translated by D. Scott). NewYork: Walker (originally published in 1950).
Bradford, S.C. (1934). Sources of information on specific subjects. Engi-neering, 137, 85–86.
Brookes, B.C. (1977). Theory of the Bradford Law. Journal of Documen-tation, 33, 180–209.
Brookes, B.C. (1979). The Bradford Law: A new calculus for the socialsciences? Journal of the American Society for Information Science, 30,233–234.
Brookes, B.C. (1984). Ranking techniques and the empirical log law.Information Processing & Management, 20, 37–46.
Brown, R., & Herrnstein, R.J. (1975). Psychology. Boston: Little, Brown.Burrell, Q.L. (1985). A note on ageing in a library circulation model.
Journal of Documentation, 41, 100–115.Burrell, Q.L. (1986). A second note on ageing in a library circulation
model: The correlation structure. Journal of Documentation, 42, 114–118.
Burrell, Q.L. (1987). A third note on ageing in a library circulation model:Applications to future use and relegation. Journal of Documentation, 43,24–45.
Burrell, Q.L., & and Cane, V.R. (1982). The analysis of library data.Journal of the Royal Statistical Society, Series A (General), 145, 439–471.
Coleman, J.S. (1964). Introduction to mathematical sociology. Glencoe:The Free Press.
Crathorne, A.R. (1928). The Law of Small Numbers. American Mathe-matical Monthly, 35, 169–175.
Ehrenberg, A.S.C. (1959). The pattern of consumer purchases. AppliedStatistics, 3, 26–41.
Elliott, J.M. (1977). Some methods for the statistical analysis of samples ofbenthic invertebrates (2nd ed.). Freshwater Biological Association sci-entific publication, no. 25. Ambleside, England: Freshwater BiologicalAssociation.
Feller, W. (1943). On a general class of “contagious” distributions. Annalsof Mathematical Statistics, 14, 389–400.
Fraser, S. (Ed.) (1995). The bell curve wars: Race, intelligence, and thefuture of America. New York: BasicBooks.
Fussler, H.H., & Simon, J.L. (1969). Patterns in the use of books in largeresearch libraries. Chicago: University of Chicago Press.
Galton, F. (1879). The geometric mean in vital and social statistics.Proceedings of the Royal Society, 29, 365–367.
Galton, F. (1883). Inquiries into human faculty and its development. NewYork: Macmillan.
Galton, F. (1889). Natural inheritance. London: Macmillan.
Galton, F. (1978). Hereditary genius: An inquiry into its laws and conse-quences. London: J. Friedman.
Garfield, E. (1971). The mystery of the transposed journal lists—whereinBradford’s Law of Scattering is generalized according to Garfield’s Lawof Concentration. Current Contents, 3(33), 5–6.
Garfield, E. (1972). Citation analysis as a tool in journal evaluation.Science, 178, 471–479.
Greenwood, M., & Yule, G.U. (1920). An inquiry into the nature offrequency distributions representative of multiple happenings with par-ticular reference to the occurrence of multiple attacks of disease or ofrelated accidents. Journal of the Royal Statistical Society, 83, 255–279.
Herrnstein, R.J., & Murray, C. (1994). The bell curve: Intelligence andclass structure in American life. New York: Free Press.
Hogben, L. Statistical theory: The relationship of probability, credibilityand error. New York: W.W. Norton.
Keynes, J.M. (1921). A treatise on probability. London: Macmillan.Lotka, A.J. (1926). The frequency distribution of scientific productivity.
Journal of the Washington Academy of Sciences, 16, 317–323.MacKenzie, D.A. (1981). Statistics in Britain, 1865–1930: The social
construction of scientific knowledge. Edinburgh: Edinburgh UniversityPress.
McAlister, D. (1879). The Law of the Geometric Mean. Proceedings of theRoyal Society, 29, 367–376.
Newbold, E.M. (1927). Practical applications of the statistics of repeatedevents particularly to industrial accidents. Journal of the Royal StatisticalSociety, 90, 487–547.
Neyman, J. (1939). On a new class of “contagious” distributions, applica-ble in entomology and bacteriology. Annals of Mathematical Statistics,10, 35–57.
Pearson, E.S. (1970). Some incidents in the early history of biometry andstatistics. In E.S. Pearson & M. Kendall (Eds.), Studies in the history ofstatistics and probability (Vol. 1, pp. 323–338). London: C. Griffin.
Pearson, K. (1905/1906). “Das Fehlergesetz und seine Verallgemeinerun-gen”: A rejoinder. Biometrika, 4, 169–212.
Pearson, K. (1915/1917). On certain types of compound frequency distri-butions in which the components can be individually described bybinomial series. Biometrika, 11, 139–144.
Pearson, K. (1956a). Contributions to the mathematical theory of evolu-tion. In Karl Pearson’s early statistical papers (pp.1–40). Cambridge:Cambridge University Press.
Pearson, K. (1956b). Contributions to the mathematical theory of evolutionII: Skew variation in homogeneous material. In Karl Pearson’s earlystatistical papers(pp. 41–112). Cambridge: Cambridge University Press.
Pearson, K. (1956c). Mathematical contributions to the theory of evolutionXIX: Second supplement to a memoir on skew variation. In KarlPearson’s early statistical papers (pp. 529–557). Cambridge: CambridgeUniversity Press.
Pearson, K. (1956d). On the criterion that a given system of deviationsfrom the probable in the case of a correlated system of variables is suchthat it can be reasonably supposed to have arisen from random sampling.In Karl Pearson’s early statistical papers (pp. 339–357). Cambridge:Cambridge University Press.
Price, D.J.d.S. (1976). A general theory of bibliometric and other cumu-lative advantage processes. Journal of the American Society for Infor-mation Science, 27, 292–306.
The Probabilistic revolution (1987). Cambridge, MA: MIT Press.Sarndal, C.-E. (1977). The hypothesis of elementary errors and the Scan-
dinavian school in statistical theory. In M. Kendall & R.L. Plackett(Eds.), Studies in the history of statistics and probability (Vol. 2, pp.419–435). New York: Macmillan.
Shockley, W. (1957). On the statistics of individual variations of produc-tivity in research laboratories. Proceedings of the Institute of RadioEngineers, 45, 279–290.
Snedecor, G.W., & Cochran, W.G. (1989). Statistical methods (8th ed.).Ames: Iowa State University Press.
832 JOURNAL OF THE AMERICAN SOCIETY FOR INFORMATION SCIENCE—July 2000

Stigler, S.M. (1982). Poisson on the Poisson distribution. Statistics &Probability Letters, 1, 32–35.
Stigler, S.M. (1986). The history of statistics: The measurement of uncer-tainty before 1900. Cambridge, MA: The Belknap Press of HarvardUniversity Press.
Thorndike, F. (1926). Applications of Poisson’s probability summation.Bell Technical Journal, 5, 604–624.
Trueswell, R.L. (1969). Some behavioral patterns of library users: The80/20 Rule. Wilson Library Bulletin, 43, 458–461.
Urquhart, D.J. (1959). The use of scientific periodicals. In Proceedings ofthe International Conference on Scientific Information, Washington,D.C., November 16–21, 1958 (Vol. 1, pp. 287–300). Washington, D.C.:National Academy of Sciences, National Research Council.
Urquhart, D.J. (1981). The principles of librarianship. Metuchen, NJ:Scarecrow Press.
Urquhart, D.J., & Bunn, R.M. (1959). A national loan policy for scientificserials. Journal of Documentation, 15, 21–37.
Weldon, W. F. R. (1893). On certain correlated variations inCarcinusmoenas.Proceedings of the Royal Society of London, 54, 318–329.
Westergaard, H. (1968). Contributions to the history of statistics. NewYork: Agathon Press.
Winsor, C.P. (1947). Das Gesetz der kleinen Zahlen. Human Biology, 19,154–161.
Yule, G.U. (1910). On the distribution of deaths with age when the causesof death act cumulatively, and similar frequency distributions. Journal ofthe Royal Statistical Society, 73 (New Series), 26–38.
JOURNAL OF THE AMERICAN SOCIETY FOR INFORMATION SCIENCE—July 2000 833