Private Student Loan Asset Backed Securities - Digital ...
70
Private Student Loan Asset Backed Securities: A Default Curve Analysis The Honors Program Senior Capstone Project Student’s Name: Nicholas Gentile Faculty Sponsor: Dr. Peter Nigro April 2013
-
Upload
khangminh22 -
Category
Documents
-
view
0 -
download
0
Transcript of Private Student Loan Asset Backed Securities - Digital ...

Private Student Loan Asset Backed Securities:
A Default Curve Analysis
The Honors Program
Senior Capstone Project
Student’s Name: Nicholas Gentile
Faculty Sponsor: Dr. Peter Nigro
April 2013
Private Student Loan Asset Backed Securities: A Default Curve Analysis
Senior Capstone Project for Nicholas Gentile________________________________________
2
Table of Contents
Abstract ......................................................................................................................................................... 3
Section I: Introduction .................................................................................................................................. 4
Section II: Literature Review ........................................................................................................................ 9
Origins and Development of Student Lending.......................................................................................... 9
Development of the Private Market ........................................................................................................ 14
FFEL Loan Characteristics ..................................................................................................................... 19
Private Loan Characteristics ................................................................................................................... 22
Major Players in the Private Loan Market .............................................................................................. 27
Section III: Data .......................................................................................................................................... 39
Section IV: Empirical Results ..................................................................................................................... 44
Univariate Tests ...................................................................................................................................... 44
Multivariate Models ................................................................................................................................ 59
Section V: Econometric Challenges and Methods ...................................................................................... 64
Section VI: Conclusion ............................................................................................................................... 65
Appendices .................................................................................................................................................. 66
Appendix I: Descriptive Statistics ........................................................................................................... 66
References ................................................................................................................................................... 67
Private Student Loan Asset Backed Securities: A Default Curve Analysis
Senior Capstone Project for Nicholas Gentile________________________________________
3
Abstract Business and mainstream media devote significant attention to the student lending industry and
its possible threat to the economy. While the private loan component of student lending may not
be largest part of this one trillion dollar industry, it is likely to be the space where evidence
supporting the media’s concerns are found. This paper examines the variation in cumulative
default rates for private student loan asset backed securities issued between 2001 and 2007,
revealing the dynamics of these opaque financial instruments. The study analyzes internal pool
data and external economic data, uncovering the primary factors that shape the respective
cumulative default curves for each trust. The data reveals that the cumulative default curves are
influenced by both underwriting procedures of the originator and the timeframe that the trust
enters its repayment period. This paper provides detailed industry research and pool-level trust
analysis which enhances the understanding of a little-understood area of the capital markets.

Private Student Loan Asset Backed Securities: A Default Curve Analysis
Senior Capstone Project for Nicholas Gentile________________________________________
4
Section I: Introduction In 2010, total outstanding student loan debt surpassed total credit card debt for the first time. At
that time, federal student loans represented $665 billion of the total (80%) with private student
loans comprising the remainder (20%). In May 2012 the “student loan debt clock” surpassed $1
trillion in total loans. Figure 1 shows steady student loan growth over the last decade. . These
figures, however, do not include capitalized interest for federal education loans which could add
6 to 7 percent to the total amount (FinAid 2012) The rise in outstanding student debt, combined
with rising default rates (13.4% within 3 years of graduation, lifetime projected at 23% for loans
originated in 2013), is leading to speculation over the stability of the student lending market
(Kansas City Federal Reserve 2012, Bloomberg 2012).
The student lending industry is very intricate. The combination of federal and private loan
varieties creates a complex system which involves academic institutions, guarantee agencies,
investors, borrowers and their families. Figure 2 provides for a representation of these
Figure 1: Outstanding Student Loan Debt (2003-2012)

Private Student Loan Asset Backed Securities: A Default Curve Analysis
Senior Capstone Project for Nicholas Gentile________________________________________
5
relationships. The diagram demonstrates the complexity of the student lending process, both due
to the number of parties involved, as well as the various transfers of funds.
The federal loan program is the most widely used tool to finance higher education, making up
over two-thirds of all post-secondary aid (College Board 2011). For the 2010-2011 academic
year, federal guaranteed loans comprised 93% of the $112 billion in originated student loans.
While the federal loan market is much larger than the private market, the latter represents an
important part of higher education funding, which in the words of the Consumer Financial
Protection Bureau (2012), “does not appear to be well understood by the public”.
Over the past few years, policy makers, government agencies and the media are increasingly
worried that student loans represent the next financial bubble. In 2011, Moody’s Analytics
reported that, “Fears of a bubble in educational spending are not without merit” (Kingkade 2011).
In 2012, Forbes put out an article with the title, “Student Loan Bubble Sets up to be Subprime
Figure 2: Student Lending Process

Private Student Loan Asset Backed Securities: A Default Curve Analysis
Senior Capstone Project for Nicholas Gentile________________________________________
6
Disaster Part Deux” (Bonner 2012). More recently, Time Magazine asked, “Student Loan Debt
Crisis: How’d We Get Here and What Happens Next?” (While 2013). The general tone of
public opinion appears to center around the belief that the student lending market poses the risks
and poses a huge threat to the economy
Over the past two decades, securitization emerged as a popular method of financing student
loans, serving as both an attractive investment for yield-seeking investors, and providing funding
for additional student lending for both federal and private institutions. Securitization pools
individual loans into securities that are backed by the future cash flows that borrowers make in
repayment (Lee & Egan 2009). Figure 3 shows the growth in the securitized student loan market
both in terms of annual issuance and loans outstanding. As of the fourth quarter of 2012, there
were $232 billion in student loan asset backed securities (SLABs) outstanding, down from a
peak of $242 billion the year before (SIFMA 2012). Additionally, in 2012, $26 billion of new
SLABs were issued.
Figure 3: SLAB Issuance & Total Outstanding (1990-2012)

Private Student Loan Asset Backed Securities: A Default Curve Analysis
Senior Capstone Project for Nicholas Gentile________________________________________
7
Securitized pools are constructed from loans originated by the issuer, purchased from other
originators by the issuer, or a combination of the two. Student loan securitizations can also be
characterized by the type of loan; either federal or private. SLABs can contain one or both types
of student loans. Federal loans are guaranteed by the state entity which originated the loan,
which is then reinsured by the federal government. This guarantee does not guarantee the timely
payment of principal and interest on the SLAB, but rather on the underlying loan itself. In the
event of default, the loan holder (in the case of a securitization, the trustee) can submit a claim to
the guarantee agency, which submits a claim to the reinsurance provider, the U.S. Department of
Education (Lee & Egan 2009). This means that, implicitly, federal loans are backed by the full
faith and credit of the United States.
Until 2008, the private lending market created its own version of a guarantee agency. The main
player was The Education Resources Institute (TERI), a non-profit formed by a collection of
Massachusetts schools. Working with First Marblehead bank, at its peak, TERI guaranteed over
$16 billion in private student loans. Following its bankruptcy in 2008, private originators/issuers
were left to either use other third-party guarantors, or simply issue the SLABs without any
guarantee (CFPB 2012). Individuals and institutions that fear student lending becoming the next
financial bubble should focus their concerns on the unguaranteed private loans that comprise a
major portion of some SLABs, rather than those backed mainly by government guaranteed loans.
Fitch Ratings echoed this sentiment in a recent report on the student lending market,
“Fitch believes that the recent increase in past-due and defaulted student loans presents a risk to investors in private student loan ABS, but not those in ABS trusts backed by FFELP [federal] loans. While FFELP loans are largely protected from these trends [underemployment and unemployment], private student loan trusts, especially those that were structured aggressively and with less stringent credit standards before the recession, are expected to
Private Student Loan Asset Backed Securities: A Default Curve Analysis
Senior Capstone Project for Nicholas Gentile________________________________________
8
continue experiencing high defaults and ratings pressure” (Business Insider 2012)
Further parallels exist between the subprime crisis and the student lending industry. Two of the
main causal factors of the subprime crisis were predatory lending and predatory borrowing.
David Musto (2008), a finance professor at Wharton, identifies predatory lending as making a
loan that reduces the expected welfare of the borrower by having an expectation that the loan
will end in default. A more controversial discussion centers on the concept of predatory
borrowing: the idea that individuals take out loans with at least some knowledge that they will be
unable to maintain the debt.
This paper attempts to identify a significant difference in the default curves for private student
loans issued pre-crisis (2007-2008), and, if a difference is found, to explain the variation with
causal factors. While the private market is comparatively small, only 20% of outstanding loans
and 7% of new issuances, the general lack of oversight, regulation, and awareness makes it an
important research opportunity. In addition to the scarcity of research on the topic, the private
student lending market carries risks that are alleged to be a threat to the financial system of the
United States.
The remainder of the paper is organized as follows. Section II reviews the literature related to
student lending. Emphasis is placed on the development of the market from the mid-1960s to
today in an effort to show what developments led to the current situation. Additionally, the
federal loan market is discussed in order to highlight similarities and differences with the private
loan market. While the literature specifically focused on the private student loan industry is
limited at best, it is featured in detail, along with an overview of the major players in the space.
Section III describes the data used in the paper. Section IV provides empirical results. Section V
Private Student Loan Asset Backed Securities: A Default Curve Analysis
Senior Capstone Project for Nicholas Gentile________________________________________
9
discusses the various econometric challenges faced in this study and the methods used in light of
those challenges. Lastly, Section IV provides a conclusion and discussion of areas of further
research.
By conducting this research, this report sheds light on an opaque, yet potentially ominous, part of
the American financial system. By addressing the CFPB’s (2012) claim that private student
lending is “not well understood by the public,” this study reveals the dynamics of the market that
are driving what many fear, is a ticking time-bomb.
Section II: Literature Review
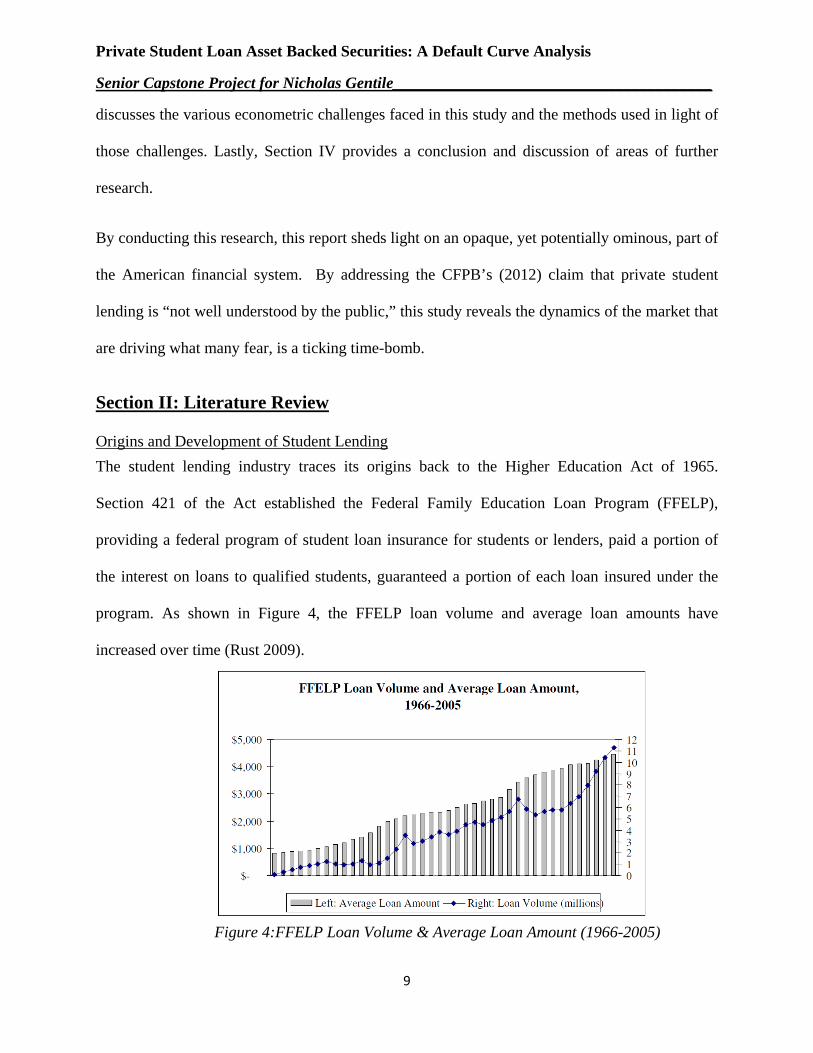
Origins and Development of Student Lending The student lending industry traces its origins back to the Higher Education Act of 1965.
Section 421 of the Act established the Federal Family Education Loan Program (FFELP),
providing a federal program of student loan insurance for students or lenders, paid a portion of
the interest on loans to qualified students, guaranteed a portion of each loan insured under the
program. As shown in Figure 4, the FFELP loan volume and average loan amounts have
increased over time (Rust 2009).
Figure 4:FFELP Loan Volume & Average Loan Amount (1966-2005)

Private Student Loan Asset Backed Securities: A Default Curve Analysis
Senior Capstone Project for Nicholas Gentile________________________________________
10
The Act put forth ideas for “default reduction activities,” including a program of partial loan
cancellation to reward disadvantaged borrowers for good repayment behavior, establishing a
financial and debt management counseling program, establishing a program of placing high-risk
borrowers in jobs, and developing public service announcements that would detail the
consequences of student loan default (P.L. 89-329 1965). There is little evidence that these plans
were ever developed after the adoption of the Act.
Following the Higher Education Act, student loans were more or less treated like any other form
of debt. The 1978 Bankruptcy Reform Act amended the U.S. Bankruptcy Code to exclude
educational loans made, insured, or guaranteed by a federal government program, ending
borrowers’ ability to discharge any federal loan in bankruptcy court. Congressional rationale for
this decision was driven largely by anecdotal evidence that students were filing for bankruptcy
immediately upon graduating in order to avoid repayment. A 1976 New York Times article
documents that approximately 12,000 former students filed bankruptcy claims on $21 million in
federal loans between 1974 and 1976 compared to only 9,000 bankruptcies occurred on just $17
million in loans in the previous 15 years. The lack of stigma felt by those recent graduates filing
for bankruptcy was exemplified by one student saying, “I do have a sense of responsibility, but
this bankruptcy thing doesn’t bother me. They were institutions who lost, not people.” At this
time, federal defaults represented 18%, or $2.2 billion of the $13 billion in outstanding loans. A
2012 New York Times article highlighted that there were now 5.9 million borrowers in default
on $76 billion in outstanding loans (Lewin 2012). In 1984, the Bankruptcy Amendments and
Federal Judgeship Act extended the bankruptcy exclusion from federal to all private student
loans. Upon signing the bill, President Ronald Reagan cited the provision in the law that
Private Student Loan Asset Backed Securities: A Default Curve Analysis
Senior Capstone Project for Nicholas Gentile________________________________________
11
preventing debts incurred as a result of drunk driving from being discharged in bankruptcy, yet
made no mention of its impact on college students.
As the federal loan industry developed and grew, budgeting and accounting for student lending
programs became more problematic. Under the guarantee model, the U.S. government records
no direct up-front costs. Economists worried that the federal government was making long term
financial commitments without accounting for eventual costs. In 1990, President George H.W.
Bush signed the Federal Credit Reform Act. This law required the U.S. government to begin a
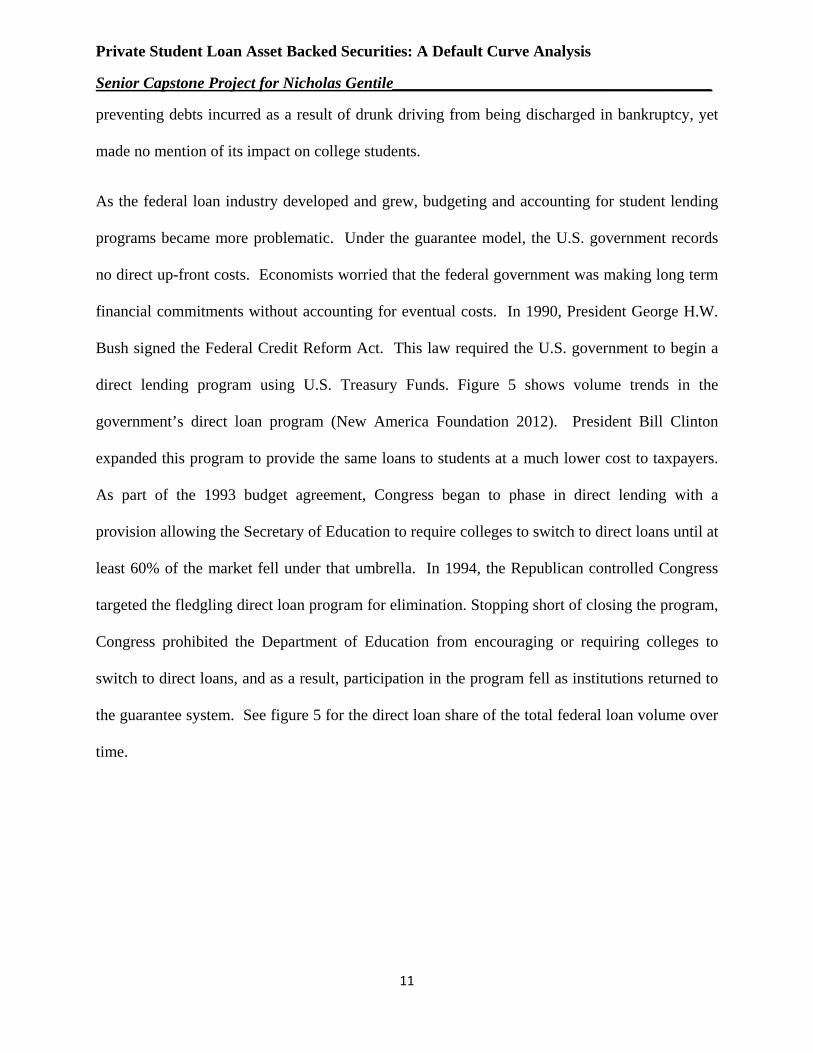
direct lending program using U.S. Treasury Funds. Figure 5 shows volume trends in the
government’s direct loan program (New America Foundation 2012). President Bill Clinton
expanded this program to provide the same loans to students at a much lower cost to taxpayers.
As part of the 1993 budget agreement, Congress began to phase in direct lending with a
provision allowing the Secretary of Education to require colleges to switch to direct loans until at
least 60% of the market fell under that umbrella. In 1994, the Republican controlled Congress
targeted the fledgling direct loan program for elimination. Stopping short of closing the program,
Congress prohibited the Department of Education from encouraging or requiring colleges to
switch to direct loans, and as a result, participation in the program fell as institutions returned to
the guarantee system. See figure 5 for the direct loan share of the total federal loan volume over
time.

Private Student Loan Asset Backed Securities: A Default Curve Analysis
Senior Capstone Project for Nicholas Gentile________________________________________
12
Figure 6 shows the relationship between FFELP and Direct Loans over the past two decades.
Following the decision to phase out the Direct Loan program, the FFELP program continued to
grow as the main financing vehicle for government-related student loans. By 2007, new
origination volume in the Direct loan program reached its lowest point since its creation.
Figure 5: FFELP vs. Direct Loan Volume (1993-2012)
Figure 5: Direct Loan Share of Federal Volume

Private Student Loan Asset Backed Securities: A Default Curve Analysis
Senior Capstone Project for Nicholas Gentile________________________________________
13
The trend towards FFEL guarantees reversed with the onset of the financial crisis in late 2007
and 2008. The fluctuations in the credit markets threatened the ability of private lenders to
originate loans under the FFELP banner, and several banks closed their student lending
businesses. Colleges began switching back to the Direct Loan program as FFELP guarantees on
privately originated loans became more difficult to obtain. In May 2008, Congress passed
Ensuring Continued Access to Student Loans Act to maintain student borrowers’ access to
capital. The Act provided the Department of Education with the ability to purchase or enter into
forward contracts to purchase FFELP guaranteed loans from the private lenders that originated
them (Sampson 2008). This meant that the federal government was purchasing loans it
guaranteed in order to maintain liquidity in the student lending market. This turned the FFELP
into a quasi-Direct Loan program, and as a result, made it redundant.
In 2010, President Obama signed legislation that revamped the federal student lending program.
The new law ended the FFEL program by eliminating the subsidies paid to banks to act as
intermediaries for student lending. This change was projected to save the federal government
$68 billion over the next decade (Baker & Herszenhorn 2008). Since then, all new loans have
been made under the Direct Loan program.
Concurrently, President Obama ended the FFEL program and announced reforms on existing
debt. For example, he implemented the income-based repayment plan, in which their annual
repayments are limited to 10% of their annual income above a basic living allowance (150% of
the poverty threshold, currently $16,500). This change is expected to affect over 1.2 million
borrowers. Another provision of the President’s reforms include forgiving remaining loan
balances after 20 years, or 10 years if the student elects to become a public service worker.
Private Student Loan Asset Backed Securities: A Default Curve Analysis
Senior Capstone Project for Nicholas Gentile________________________________________
14
Luckily for SLABs investors, these provisions only apply to loans originated after 2014, which
would be fully covered by the Direct Loan Program.
Currently, two pieces of legislation are under debate in Congress that could affect the student
lending market. First, the “Fairness for Struggling Students Act,” introduced by Senator Dick
Durbin, seeks to repeal the amendment to the bankruptcy code that excludes private student
loans from being discharged in bankruptcy. The bill includes a provision that allows borrowers
who maintained a good faith payment history for a period of years to discharge their debt.
Second, the “Know Before you Owe Act,” also sponsored by Senator Durbin, would require
schools to advise students of the risks associated with student debt before they sign on to private
student loans. It also requires the school to confirm and approve the necessary loan amount
before origination (2013).
Development of the Private Market Although private lenders have been involved with student financing since the implementation of
the 1965 Higher Education Act and the FFELP, their prominence can be attributed to a few key
events over time. As loan volume grew from 1966 to 1971, private lenders aggregated large
portfolios of student loans, and due to the extended repayment nature of the product, they began
to run out of new capital to continue lending. As a result, Congress created SLM in the 1972
Amendment to the Higher Education Act. First, in 1972, is the establishment of the Student
Loan Marketing Association (SLMA), or Sallie Mae (hereafter referred to as SLM), established a
vibrant secondary market and warehouse facility for student loans (U.S. Treasury 2006).
In addition to serving as a liquidity provider for the FFELP, the Omnibus Budget Reconciliation
Act of 1981 granted SLM the authority to include non-federally insured loans in its purchase and

Private Student Loan Asset Backed Securities: A Default Curve Analysis
Senior Capstone Project for Nicholas Gentile________________________________________
15
warehousing programs (General Accounting Office 1984). This provision allowed SLM to
generate the liquidity necessary for private lenders to originate loans for those borrowers who
possessed credit profiles that did not qualify for a federal guarantee.
In 1992 the Securities and Exchange Commission (hereafter SEC) provided further stimulus to
the private lending market by allowing the non-mortgage ABS to gain a foothold in the capital
markets by facilitating registered offerings of ABS. Under the 1992 amendments, offerings of
investment grade ABS could be shelf-eligible (SEC 2011). Rule 415 of the SEC authorizes
companies to file a single prospectus, from which they are able to issue additional offerings in
the future without having to re-file. This allowed private institutions easy access to the capital
markets in order to raise additional funds for loan origination.
Securitization of student loans was one of the major factors leading to to the privatization of
SLM. In 1995, SLM completed its first ABS transaction, (Sallie Mae Student Loan Trust 1995-1)
raising $1 billion in the sale of floating rate student-loan backed securities. SLM, surprised at the
relative ease of accessing the capital markets and of the successful securitization of loans,
accelerated its desire to become a private entity. In 1997, SLM shareholders voted to reorganize
the company, rolling off any remaining GSE debt and replacing it with private debt, which SLM
did with much success by issuing $120 billion in ABS during the transition phase. The
privatization also allowed SLM more freedom to serve the non-guaranteed student loan market
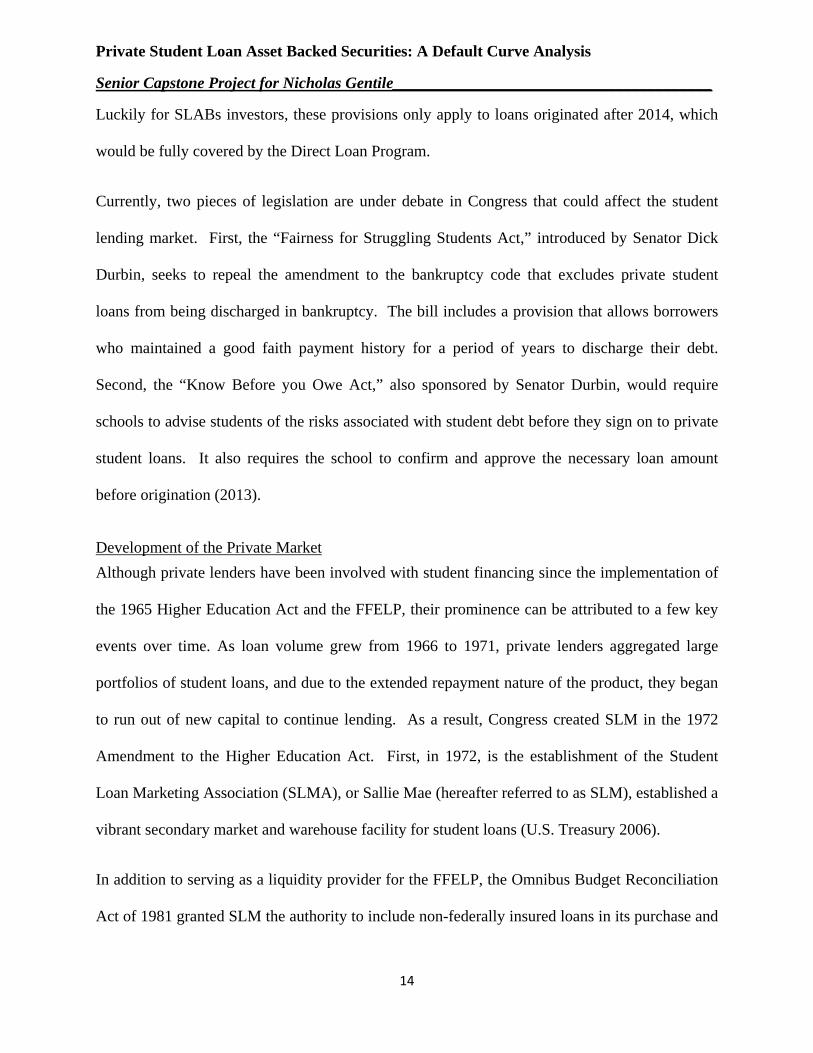
(U.S. Treasury 2006). Figure 6 shows the trends in SLM’s methods for student financing from
its inception to 2004. The focus on securitization can clearly be seen beginning in 1995-1996,
followed by a rapid growth in securitized loans while on-balance sheet loan amounts remained
Private Student Loan Asset Backed Securities: A Default Curve Analysis
Senior Capstone Project for Nicholas Gentile________________________________________
16
stagnant. Figure 7 shows how the growth in securitized lending was mirrored by the growth
SLM’s private loan portfolio.
Figure 6: SLM Financing Methods Figure 7: SLM Private Loan Growth
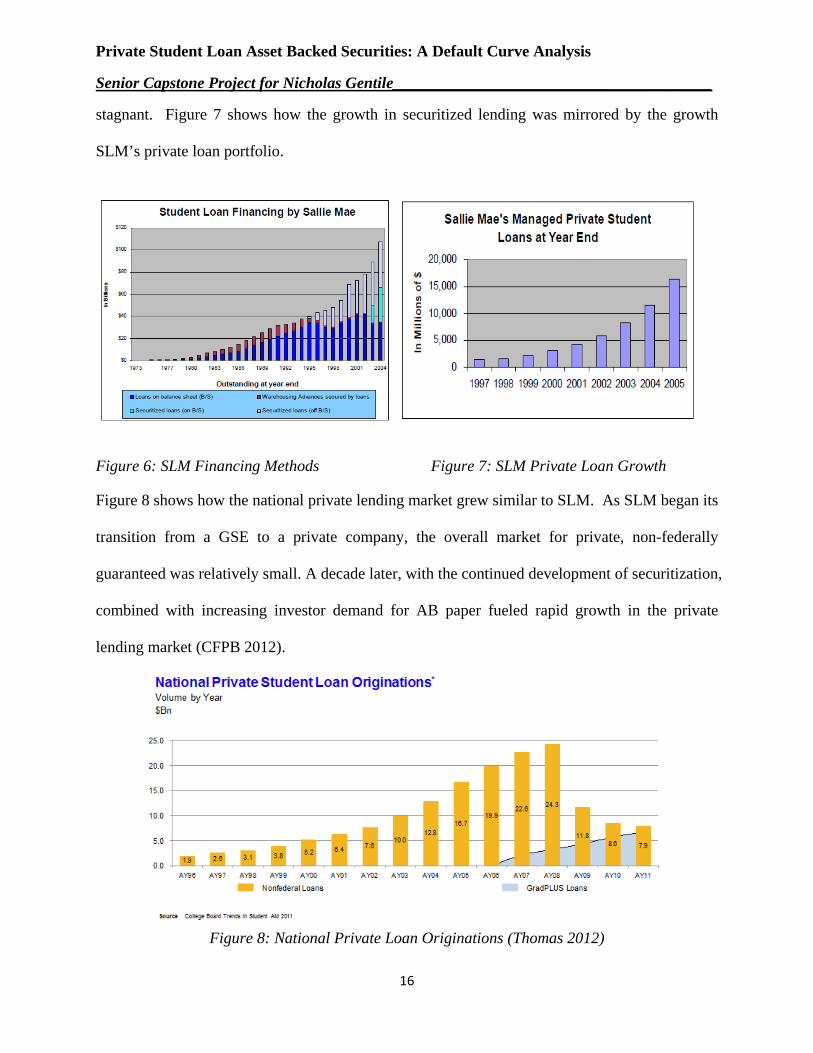
Figure 8 shows how the national private lending market grew similar to SLM. As SLM began its
transition from a GSE to a private company, the overall market for private, non-federally
guaranteed was relatively small. A decade later, with the continued development of securitization,
combined with increasing investor demand for AB paper fueled rapid growth in the private
lending market (CFPB 2012).
Figure 8: National Private Loan Originations (Thomas 2012)
Private Student Loan Asset Backed Securities: A Default Curve Analysis
Senior Capstone Project for Nicholas Gentile________________________________________
17
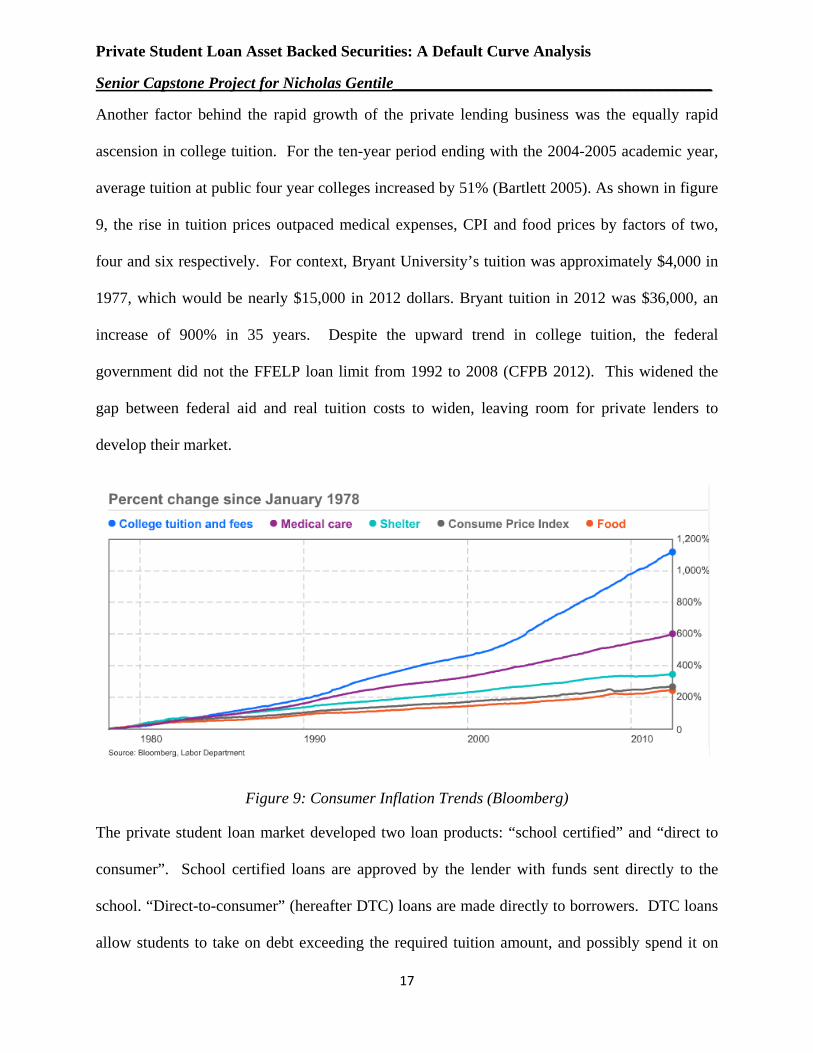
Another factor behind the rapid growth of the private lending business was the equally rapid
ascension in college tuition. For the ten-year period ending with the 2004-2005 academic year,
average tuition at public four year colleges increased by 51% (Bartlett 2005). As shown in figure
9, the rise in tuition prices outpaced medical expenses, CPI and food prices by factors of two,
four and six respectively. For context, Bryant University’s tuition was approximately $4,000 in
1977, which would be nearly $15,000 in 2012 dollars. Bryant tuition in 2012 was $36,000, an
increase of 900% in 35 years. Despite the upward trend in college tuition, the federal
government did not the FFELP loan limit from 1992 to 2008 (CFPB 2012). This widened the
gap between federal aid and real tuition costs to widen, leaving room for private lenders to
develop their market.
Figure 9: Consumer Inflation Trends (Bloomberg)
The private student loan market developed two loan products: “school certified” and “direct to
consumer”. School certified loans are approved by the lender with funds sent directly to the
school. “Direct-to-consumer” (hereafter DTC) loans are made directly to borrowers. DTC loans
allow students to take on debt exceeding the required tuition amount, and possibly spend it on
Private Student Loan Asset Backed Securities: A Default Curve Analysis
Senior Capstone Project for Nicholas Gentile________________________________________
18
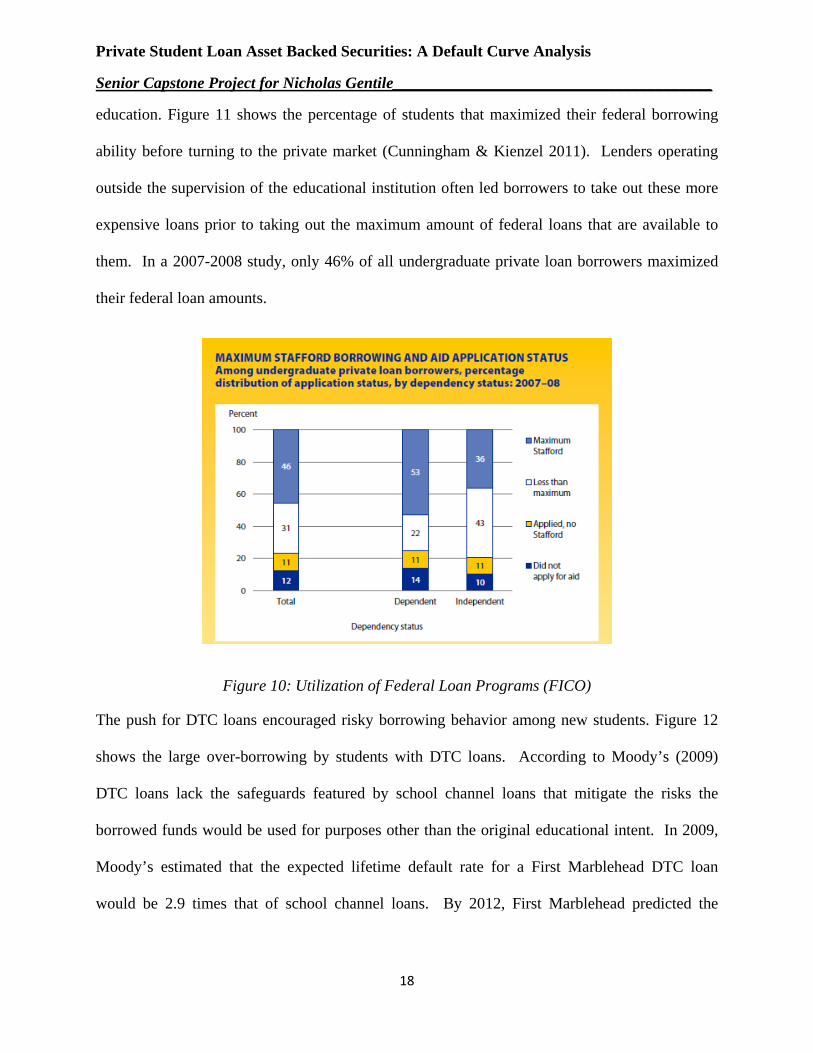
education. Figure 11 shows the percentage of students that maximized their federal borrowing
ability before turning to the private market (Cunningham & Kienzel 2011). Lenders operating
outside the supervision of the educational institution often led borrowers to take out these more
expensive loans prior to taking out the maximum amount of federal loans that are available to
them. In a 2007-2008 study, only 46% of all undergraduate private loan borrowers maximized
their federal loan amounts.
Figure 10: Utilization of Federal Loan Programs (FICO)
The push for DTC loans encouraged risky borrowing behavior among new students. Figure 12
shows the large over-borrowing by students with DTC loans. According to Moody’s (2009)
DTC loans lack the safeguards featured by school channel loans that mitigate the risks the
borrowed funds would be used for purposes other than the original educational intent. In 2009,
Moody’s estimated that the expected lifetime default rate for a First Marblehead DTC loan
would be 2.9 times that of school channel loans. By 2012, First Marblehead predicted the
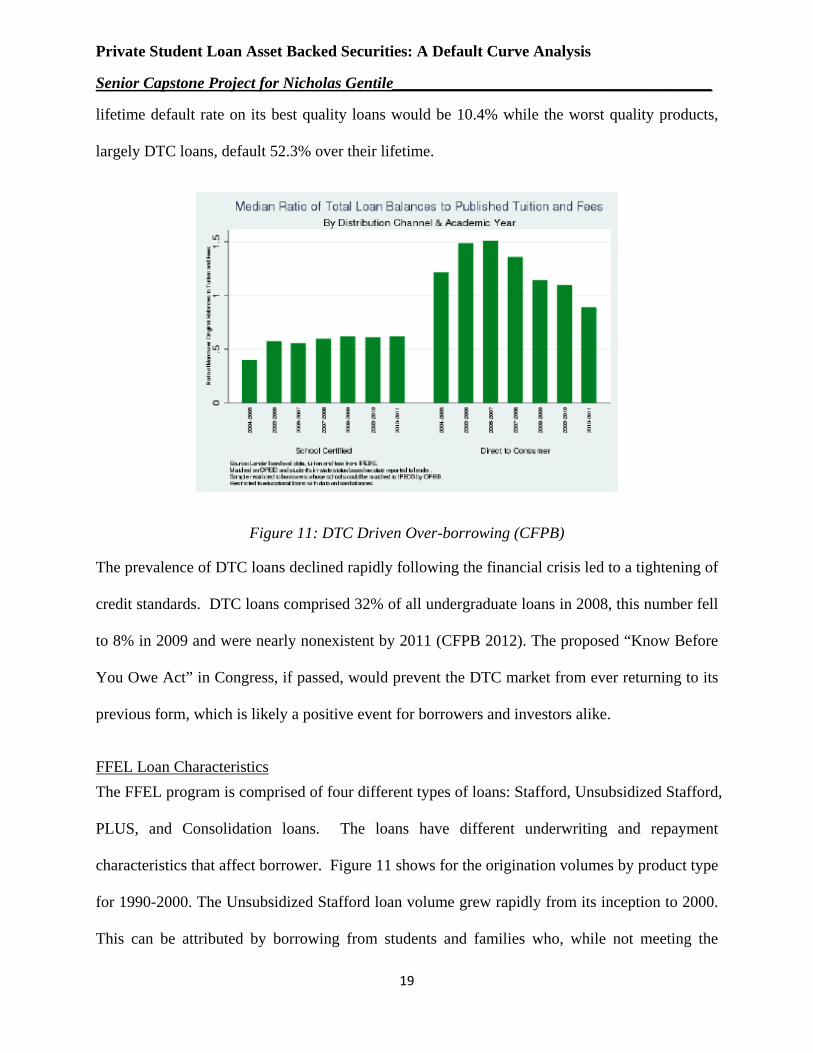
Private Student Loan Asset Backed Securities: A Default Curve Analysis
Senior Capstone Project for Nicholas Gentile________________________________________
19
lifetime default rate on its best quality loans would be 10.4% while the worst quality products,
largely DTC loans, default 52.3% over their lifetime.
Figure 11: DTC Driven Over-borrowing (CFPB)
The prevalence of DTC loans declined rapidly following the financial crisis led to a tightening of
credit standards. DTC loans comprised 32% of all undergraduate loans in 2008, this number fell
to 8% in 2009 and were nearly nonexistent by 2011 (CFPB 2012). The proposed “Know Before
You Owe Act” in Congress, if passed, would prevent the DTC market from ever returning to its
previous form, which is likely a positive event for borrowers and investors alike.
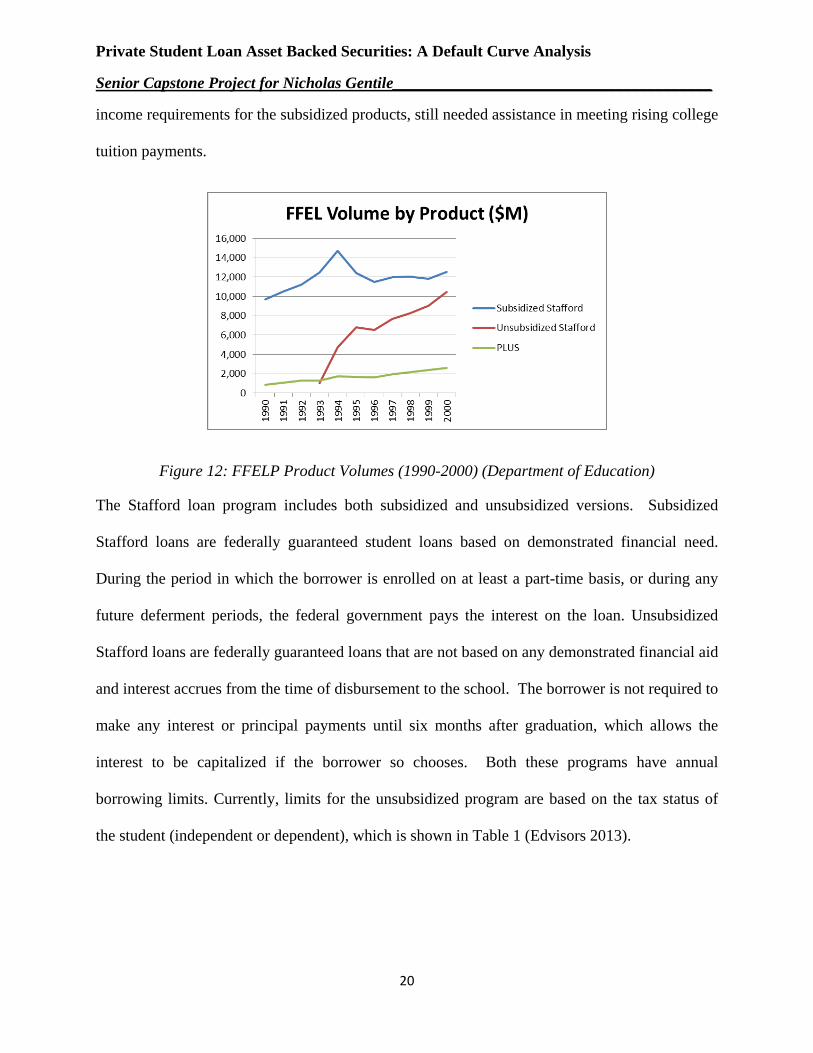
FFEL Loan Characteristics The FFEL program is comprised of four different types of loans: Stafford, Unsubsidized Stafford,
PLUS, and Consolidation loans. The loans have different underwriting and repayment
characteristics that affect borrower. Figure 11 shows for the origination volumes by product type
for 1990-2000. The Unsubsidized Stafford loan volume grew rapidly from its inception to 2000.
This can be attributed by borrowing from students and families who, while not meeting the
Private Student Loan Asset Backed Securities: A Default Curve Analysis
Senior Capstone Project for Nicholas Gentile________________________________________
20
income requirements for the subsidized products, still needed assistance in meeting rising college
tuition payments.
Figure 12: FFELP Product Volumes (1990-2000) (Department of Education)
The Stafford loan program includes both subsidized and unsubsidized versions. Subsidized
Stafford loans are federally guaranteed student loans based on demonstrated financial need.
During the period in which the borrower is enrolled on at least a part-time basis, or during any
future deferment periods, the federal government pays the interest on the loan. Unsubsidized
Stafford loans are federally guaranteed loans that are not based on any demonstrated financial aid
and interest accrues from the time of disbursement to the school. The borrower is not required to
make any interest or principal payments until six months after graduation, which allows the
interest to be capitalized if the borrower so chooses. Both these programs have annual
borrowing limits. Currently, limits for the unsubsidized program are based on the tax status of
the student (independent or dependent), which is shown in Table 1 (Edvisors 2013).

Private Student Loan Asset Backed Securities: A Default Curve Analysis
Senior Capstone Project for Nicholas Gentile________________________________________
21
Year SubsidizedUnsubsidized (dependent)
Unsubsidized (independent)
Freshman $3,500 $2,000 $6,000Sophmore $4,500 $2,000 $6,000Junior $5,500 $2,000 $7,000Senior $5,500 $2,000 $7,000
Table 1: FFELP Loan Limits
Prior to 1992 the FFEL program was known as the Guaranteed Student Loan (GSL) Program and
also covered the Supplementary Loans for Students (SLS) Program. Figure 14 shows how the
interest rates on these loans have changed over time. During the 1981-1992 time period interest
rates on SLS loans were changed annually with various limits (7-9%, 12%, and 14%.) From
1988 to 1992, SLS loans carried a fixed rate of 8% which rose to 10% four years after
origination. In 1987, variable rate loans were introduced (Finaid 2013).
Figure 13: Stafford Loan Rate History
The FFELP loan provides borrowers options when encountering difficulty in meeting their
repayment requirements. First, the FFELP allows for deferment which releases the borrower
Private Student Loan Asset Backed Securities: A Default Curve Analysis
Senior Capstone Project for Nicholas Gentile________________________________________
22
from the requirement of paying the principal on their loan. During this period, the federal
government continues to make payments on subsidized Stafford loans. For unsubsidized loans,
however, the interest accrues, leaving the borrower with the option of either paying the interest,
or allowing capitalizing it. The time limits for the deferrment option vary with the borrower’s
situation The borrower may defer payments indefinitely so long as they are enrolled in school at
least half time, pursuing a graduate fellowship, in military service, or in rehabilitation training.
If the borrower recently returned from active duty, they may defer for up to 13 months, while
borrowers either unemployed or enduring economic hardship, the deferrment may last 36 months.
Deferrments are not guaranteed and requests must be approved by the original lender (ISAC
2010). Second, the FFELP may suspend payments, known as forebearance. Forbearance terms
are vaguer than those of deferrment with the length of time, and even the ability to do enter
forbearance entirely up to the discretion of the lender based on borrower circumstances.
Forbearance is granted in one year increments, with no limit on the number of times the request
filed or granted. Federal regulations require that the lender certify the reason for the borrower’s
request and use forbearance as a tool to return delinquent loans to current status or avoid default.
Forebearance only applies if the lender believes that the borrower fully intends to eventually
repay the loan (McGarvey & Nelson 2008). Some causes that would justify forbearance include
unforeseen severe health or personal problems, inability to pay within the original window, and
having monthly payments exceeding 20% of the borrower’s income (Michon 2013).
Private Loan Characteristics The private student loan market is much more diverse than the federal market. Loan terms,
interest rates, willingness to offer repayment and modification options vary by lender. Private
lenders generally lack the default avoidance and risk mitigation tools provided by federal loan

Private Student Loan Asset Backed Securities: A Default Curve Analysis
Senior Capstone Project for Nicholas Gentile________________________________________
23
programs (CFPB 2012). The only common option with federal loans is short-term forbearance,
which lacks any identifiable guidelines. Additionally, private lenders do not offer income-based
repayment options or loan forgiveness. Some lenders have indicated a willingness to develop
rehabilitation programs that “would satisfy accounting rules and prudential regulators” (Touhey
et. al. 2012).
The CFPB Student Loan Ombudsman’s first annual report in 2012 raises many concerns
regarding the servicing of private student loans, specifically with borrower requests to enter into
repayment options and loan modification plans that were allegedly offered in the original loan
terms. The CFPB attributes these difficulties loan servicing rights that are bought and sold by
different financial institutions. The report notes that borrowers note difficulty in enrolling into
alternative repayment options that were advertised prior to origination. A common theme in
borrower complaints is that they were unable to receive clear information regarding their
repayment options, and even those who were able to get in contact with their servicer were
generally unsuccessful in obtaining a modification. The CFPB report also uncovered lenders
charging a monthly fee to borrowers in forebearance (Kamenshine 2012). It is difficult to
understand why a servicer would charge an additional fee to someone who was already unable to
meet their payment requirements.
A 2012 TransUnion report sheds light on repayment modification. The report found that 51% of
student loans were in deferment or forbearance, up from 44% in 2011. While these figures may
seem high, it is important to note that they include those borrowers utilizing the in-school
deferrement option. Those borrowers have postponed payment on a total of $338 billion in
outstanding student loans, marking a 70% increase from the prior year. Breaking down the
Private Student Loan Asset Backed Securities: A Default Curve Analysis
Senior Capstone Project for Nicholas Gentile________________________________________
24
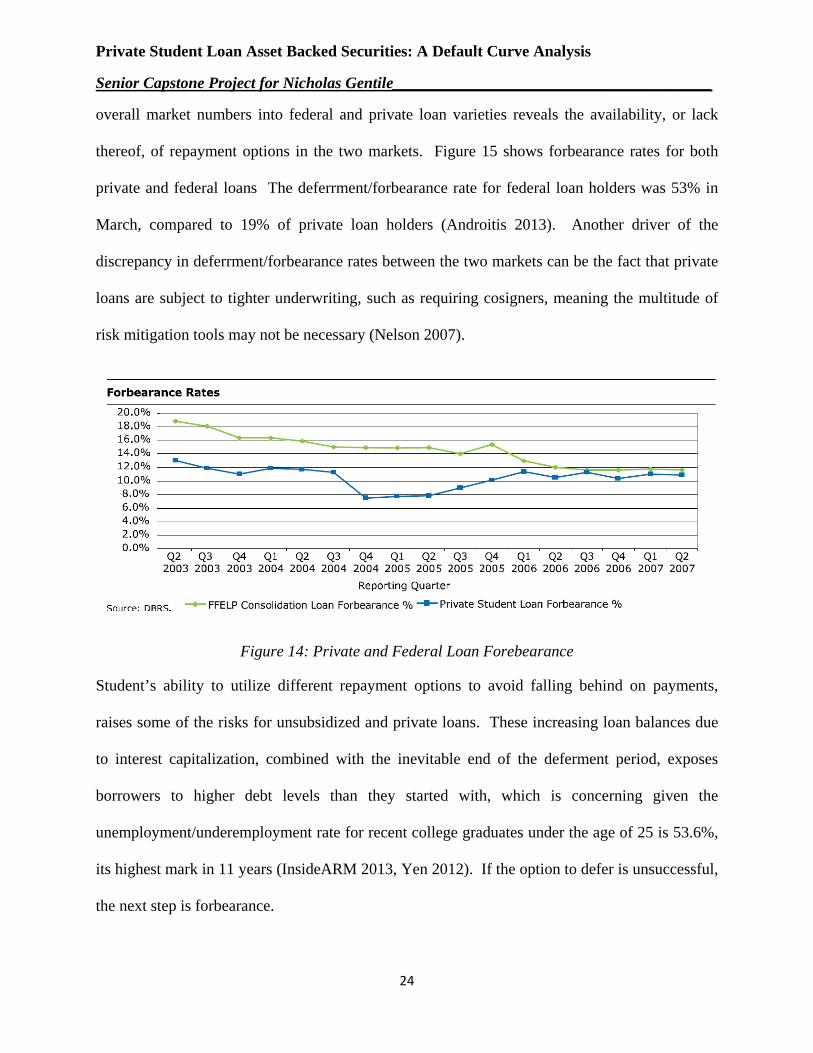
overall market numbers into federal and private loan varieties reveals the availability, or lack
thereof, of repayment options in the two markets. Figure 15 shows forbearance rates for both
private and federal loans The deferrment/forbearance rate for federal loan holders was 53% in
March, compared to 19% of private loan holders (Androitis 2013). Another driver of the
discrepancy in deferrment/forbearance rates between the two markets can be the fact that private
loans are subject to tighter underwriting, such as requiring cosigners, meaning the multitude of
risk mitigation tools may not be necessary (Nelson 2007).
Figure 14: Private and Federal Loan Forebearance
Student’s ability to utilize different repayment options to avoid falling behind on payments,
raises some of the risks for unsubsidized and private loans. These increasing loan balances due
to interest capitalization, combined with the inevitable end of the deferment period, exposes
borrowers to higher debt levels than they started with, which is concerning given the
unemployment/underemployment rate for recent college graduates under the age of 25 is 53.6%,
its highest mark in 11 years (InsideARM 2013, Yen 2012). If the option to defer is unsuccessful,
the next step is forbearance.
Private Student Loan Asset Backed Securities: A Default Curve Analysis
Senior Capstone Project for Nicholas Gentile________________________________________
25
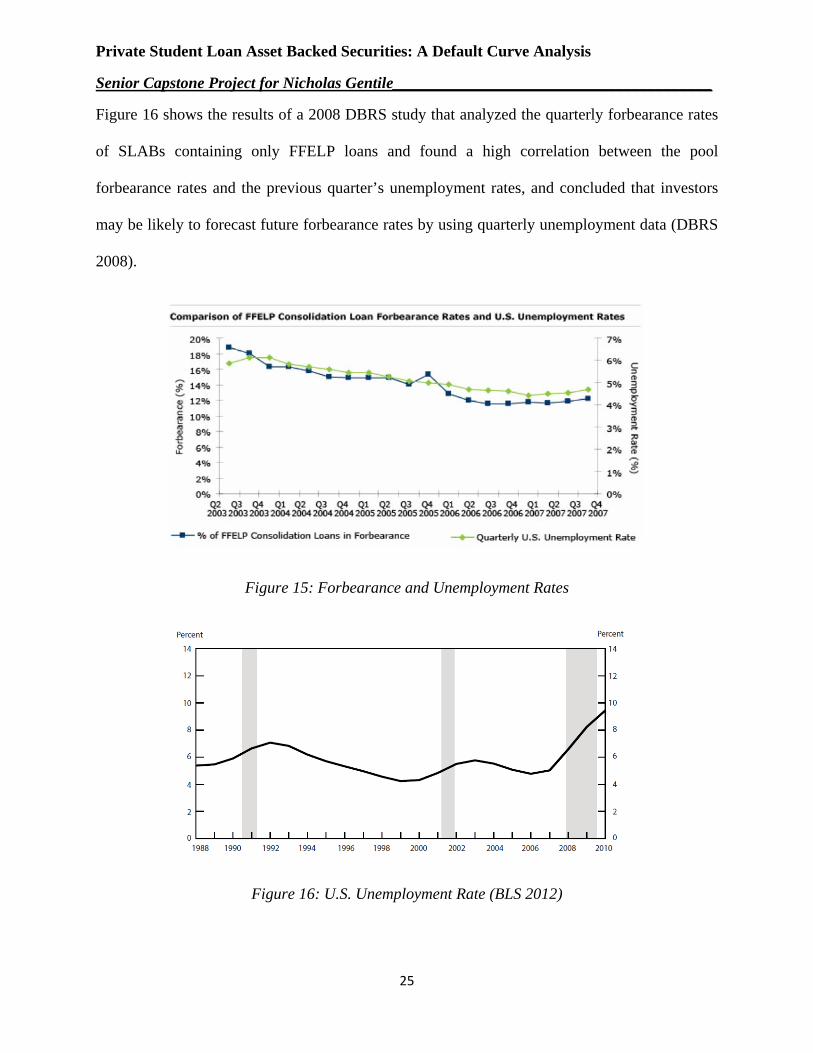
Figure 16 shows the results of a 2008 DBRS study that analyzed the quarterly forbearance rates
of SLABs containing only FFELP loans and found a high correlation between the pool
forbearance rates and the previous quarter’s unemployment rates, and concluded that investors
may be likely to forecast future forbearance rates by using quarterly unemployment data (DBRS
2008).
Figure 15: Forbearance and Unemployment Rates
Figure 16: U.S. Unemployment Rate (BLS 2012)

Private Student Loan Asset Backed Securities: A Default Curve Analysis
Senior Capstone Project for Nicholas Gentile________________________________________
26
Although figure 17 shows the total unemployment rate for the United States, it is difficult to find
an accurate depicting the unemployment rate for new college graduates. The Bureau of Labor
Statistics reports that college graduates have the lowest unemployment rates in their age group,
this is due to the fact that the BLS does not take underemployment into account. The difference
between those who graduated college and those who only graduated high school is that
underemployment for a high school graduate would likely only apply to part-time employment; a
full-time job as a janitor, for example, would be considered in-line with expectations. A recent
college graduate resorting to the janitorial trade does not constitute full employment.
After college borrowers attempt deferment or forbearance options, the next status a student loan
status is delinquency which begins the first day after a missed payment. The Institute for Higher
Education Policy (2011) examined delinquency trends for the 2005 student cohort and found that
26% of borrowers were delinquent at some point during their repayment experience. Of that
number, 21% fell into delinquency after using the default avoidance tools of deferment and
forbearance (Cunningham & Kienzel 2011). A 2013 FICO report found that the student loan
delinquency rate from 2010-2012 was 15.1%, up from 12.4% between 2005-2007 (Hamilton).
As shown in Figure 18, these findings explain how delinquency rates on student loans have
surpassed any other form of consumer debt. (Evans 2012).

Private Student Loan Asset Backed Securities: A Default Curve Analysis
Senior Capstone Project for Nicholas Gentile________________________________________
27
Figure 17: Loan Delinquency
Understanding while student loan defaults are at the center of much of the concern regarding the
industry, it is important to understand the story behind delinquency rates as it provides a more
accurate depiction of how many borrowers are having difficulty meeting their repayment
requirements. With the default avoidance tools and the extended delinquency window on federal
loans (270 days vs. 120 days for private loans), the current default picture is not an entirely
accurate representation, nor does it fully take into account future defaults once delinquent loans
run out of options (KC Fed 2012). Even the delinquency rate itself does not provide a true
understanding of the problems in the market. When calculating the delinquency rate, the
delinquency total only includes those borrowers who are behind on their payments while not in a
default avoidance program, while the total loans outstanding value includes those borrowers.
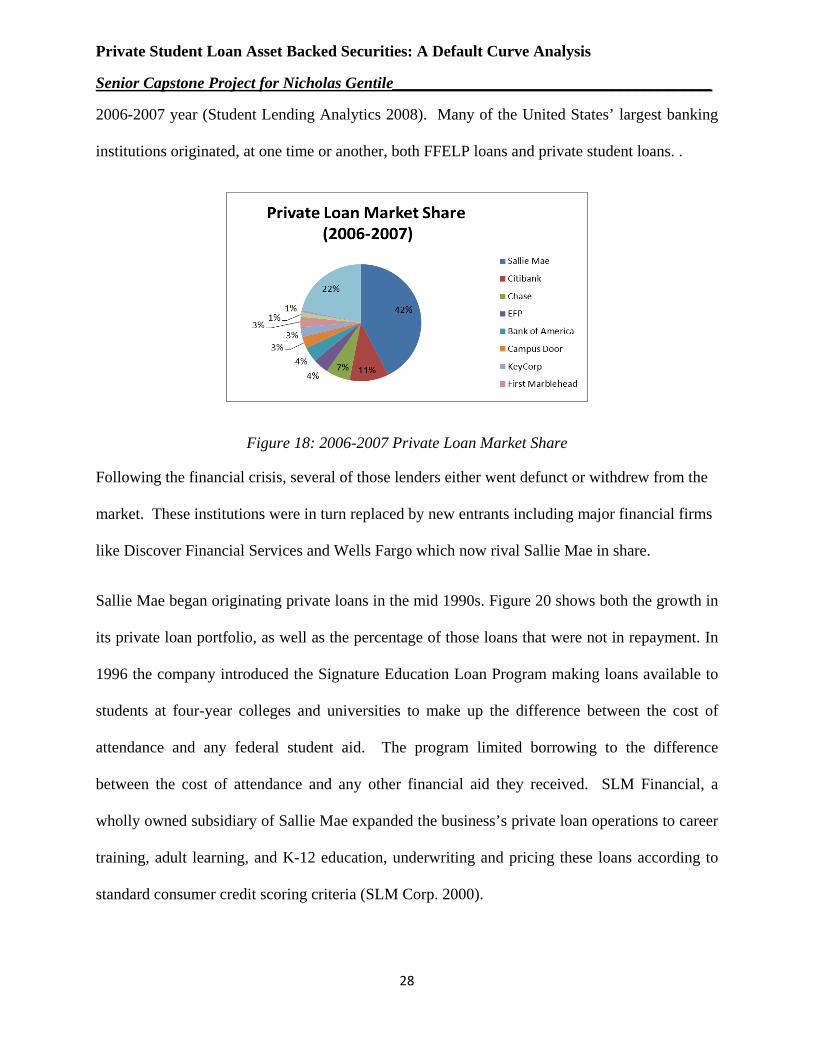
Major Players in the Private Loan Market Sallie Mae is the largest non-government originator of student loans, but it is not the only
corporation operating in the space. Figure 19 shows private lending market composition for the
Private Student Loan Asset Backed Securities: A Default Curve Analysis
Senior Capstone Project for Nicholas Gentile________________________________________
28
2006-2007 year (Student Lending Analytics 2008). Many of the United States’ largest banking
institutions originated, at one time or another, both FFELP loans and private student loans. .
Figure 18: 2006-2007 Private Loan Market Share
Following the financial crisis, several of those lenders either went defunct or withdrew from the
market. These institutions were in turn replaced by new entrants including major financial firms
like Discover Financial Services and Wells Fargo which now rival Sallie Mae in share.
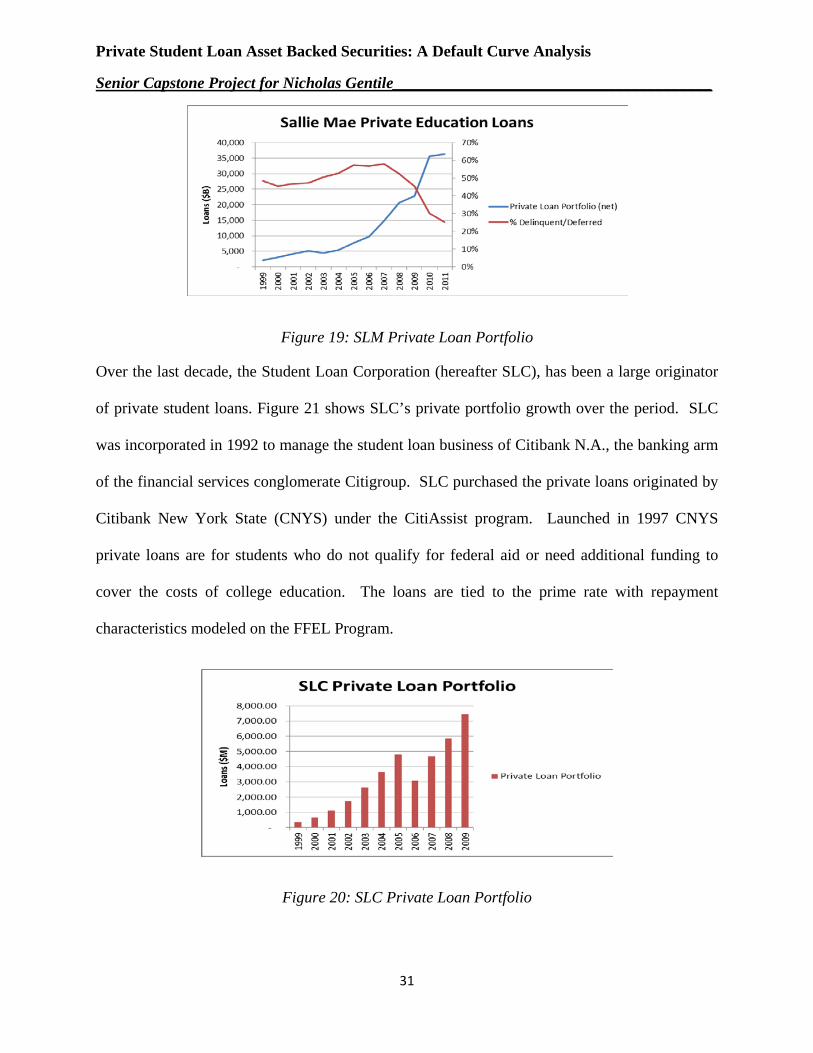
Sallie Mae began originating private loans in the mid 1990s. Figure 20 shows both the growth in
its private loan portfolio, as well as the percentage of those loans that were not in repayment. In
1996 the company introduced the Signature Education Loan Program making loans available to
students at four-year colleges and universities to make up the difference between the cost of
attendance and any federal student aid. The program limited borrowing to the difference
between the cost of attendance and any other financial aid they received. SLM Financial, a
wholly owned subsidiary of Sallie Mae expanded the business’s private loan operations to career
training, adult learning, and K-12 education, underwriting and pricing these loans according to
standard consumer credit scoring criteria (SLM Corp. 2000).

Private Student Loan Asset Backed Securities: A Default Curve Analysis
Senior Capstone Project for Nicholas Gentile________________________________________
29
By 2005, SLM expanded its private lending business through focusing on its direct-to-consumer
Tuition Answer program that made loans outside of the traditional financial aid process. The
Tuition Answer program, started in 2004, utilized direct mail campaigns and web-based
advertising to target students and parents. Under this program, borrowers could take out a loan
for between $1,500 and $40,000 for “college-related expenses” without requiring any school
certification. At this point, only 50% of SLM’s private education loans had co-signers, seemingly
a dangerous level for the lender, but the increasd risk was reflected in increasing interest income
as private loans averaged a 4.62% interest margin versus 1.39% for FFELP loans.
By their 2007, SLM began to witness flaws with its focus on the alternative lending products, yet
the profitability of the division was still the main story. The year’s annual report includes the
following:
We expect to continue to focus on generally higher-margin Private Education Loans, originated both through our school channel and our direct-to-consumer channel, with particular attention to upholding our more stringent underwriting standards. In January 2008, we notified some of our school customers whosse students have non-traditional loans that we were curtailing certain highdefault rate lending programs and reviewing the pricing of others. Actual credit performance at these programs was materially below our original expectations.
Despite SLM’s acknowledgement of the products’ risk, the share of private loans made to those
borrowers with a co-signer only increased from 50% in 2005 to 52% in 2007. The private
lending business continued to be quite profitable for the company, as the 5.15% net interest
margin on those loans generated 36% of the core interest income for the year, despite the fact
that they only represented 17% of the managed loan portfolio.
In 2008, SLM realized the serious problem posed by its activities in the private lending market.
In the beginning of the year, the company announced the end of its non-traiditional lending

Private Student Loan Asset Backed Securities: A Default Curve Analysis
Senior Capstone Project for Nicholas Gentile________________________________________
30
practice and revised the structure, pricing, underwriting, servicing, collecting, and funding of
Private Education Loans. The percentage of private loans with a cosigner increased dramatically
over the course of the year, from 52% the year before to 74%; reflecting SLM’s discovery that
having a cosigner decreases default rates by 50%. Private loans were still very profitable for the
company with a 5.09% net interest margincompared to 83 basis points for FFELP loans.
In 2011, SLM further revised its lending procedures for the private market. The company
reported that 62% of the private portfolio loans were cosigned and 91% of loans originated in
2011 were cosigned. The company did report that previous loan loss provisions for loans that
defaulted between 2008 and 2011 were not meeting its post-default projections. SLM makes an
estimated charge-off for each loan once they become 212 days past due. The company also
reported that in 2011, $7.2 billion in loans were currently in interest-only programs, representing
24% of all loans in repayment.
In its 2012 full-year earnings release, SLM reported that its fourth quarter profit fell as it
increased loan loss provisions as a result of the continued, if not increased, inability of student
borrowers to repay their debt. The company reported an increase in loan loss provisions of 16%
over the prior year as it witnessed its net charge off rate rise from 3.52% to 4.19% (Associated
Press 2013). Please see figure 18 for SLM’s net private loan portfolio and associated repayment
behavior over time.
Private Student Loan Asset Backed Securities: A Default Curve Analysis
Senior Capstone Project for Nicholas Gentile________________________________________
31
Figure 19: SLM Private Loan Portfolio
Over the last decade, the Student Loan Corporation (hereafter SLC), has been a large originator
of private student loans. Figure 21 shows SLC’s private portfolio growth over the period. SLC
was incorporated in 1992 to manage the student loan business of Citibank N.A., the banking arm
of the financial services conglomerate Citigroup. SLC purchased the private loans originated by
Citibank New York State (CNYS) under the CitiAssist program. Launched in 1997 CNYS
private loans are for students who do not qualify for federal aid or need additional funding to
cover the costs of college education. The loans are tied to the prime rate with repayment
characteristics modeled on the FFEL Program.
Figure 20: SLC Private Loan Portfolio
Private Student Loan Asset Backed Securities: A Default Curve Analysis
Senior Capstone Project for Nicholas Gentile________________________________________
32
For much of the 2000s, CitiAssist loans were generally originated in a conservative manner.
Primarily school-channel based, the lending amounts revolved around certification from the
school’s financial aid advisor. During the financial crisis, SLC reported minimal credit
deterioration to its private loan portfolio, citing only slight rises in delinquency and forbearance
rates. The crisis, however, did force the company to cease private consolidation loan operations
in October of 2008.
In 2009, SLC revised its private loan servicing procedures. The company outlined changes
involving borrowers with payment difficulties facing stricter performance criteria to be granted
forbearance or deferment. The company noted expected these changes would materially increase
losses from private loans. Similarly to Sallie Mae, SLC began an interest-only repayment option
which was utilized by 19% of private loan borrowers.
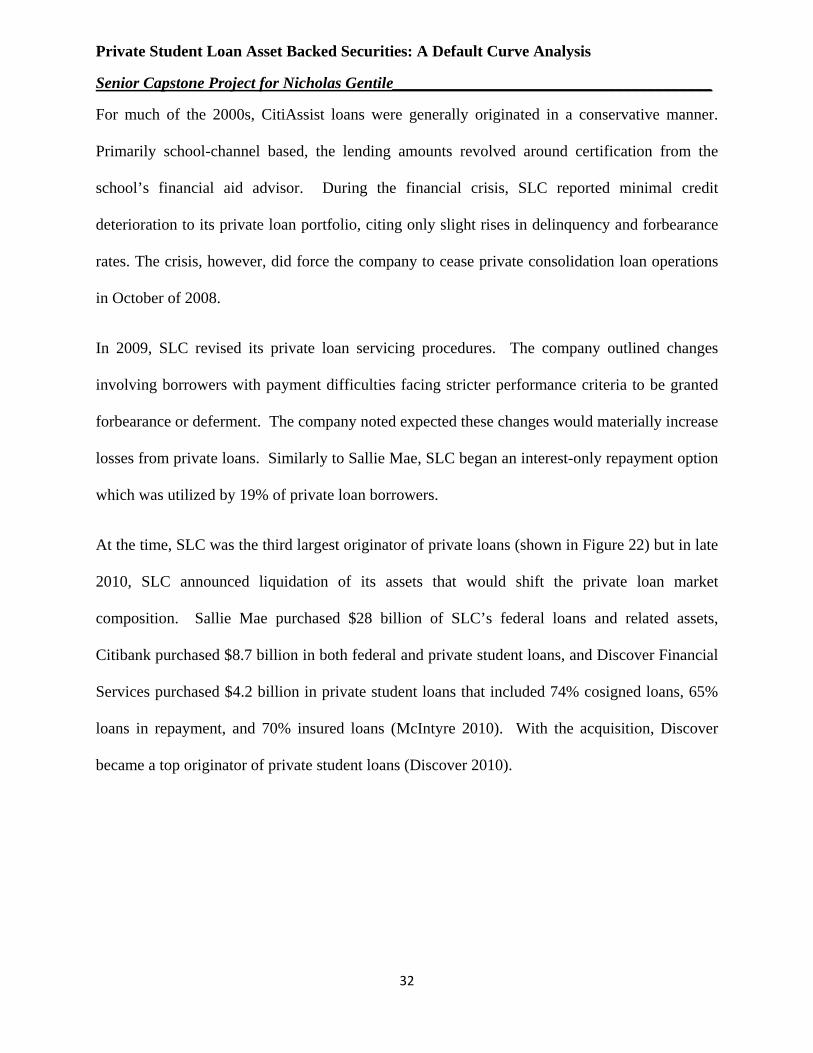
At the time, SLC was the third largest originator of private loans (shown in Figure 22) but in late
2010, SLC announced liquidation of its assets that would shift the private loan market
composition. Sallie Mae purchased $28 billion of SLC’s federal loans and related assets,
Citibank purchased $8.7 billion in both federal and private student loans, and Discover Financial
Services purchased $4.2 billion in private student loans that included 74% cosigned loans, 65%
loans in repayment, and 70% insured loans (McIntyre 2010). With the acquisition, Discover
became a top originator of private student loans (Discover 2010).
Private Student Loan Asset Backed Securities: A Default Curve Analysis
Senior Capstone Project for Nicholas Gentile________________________________________
33
Figure 21: 2009 Private Loan Market Shares
Discover was a relatively late entrant to the private lending market, beginning their program in
2007. The goal of the program was to establish variable rate Certified Private Loans for families
and students with zero origination and prepayment fees with spreads ranging from 50 – 625 basis
points based on credit criteria (Methodist University).
Discover encouraged reponsible borrowering by requiring school certification and directly
disbusing loans to the institution. The loans featured various timely repayment and education
incentives including a cash reward at graduation equal to 2% of the outstanding loan balance.
In 2010, Discover announced that it was selling any federally guaranteed loans it held in its
portfolio in order to focus on the newly acquired assets from SLC which quadrupled the size of
its private loan holdings, as shown in Figure 23. In 2011, Discover purchased an additional $2.5
billion in private loans from Citibank despite the the possibility of repealing the private student
loan exclusion from bankruptcy They claim this is not a material concern, however, since their
underwriting practices and percentage of loans with cosigners mitigates any risk to the business

Private Student Loan Asset Backed Securities: A Default Curve Analysis
Senior Capstone Project for Nicholas Gentile________________________________________
34
Figure 22: Discover Private Loan Portfolio
KeyCorp is yet another player in the private loan space. Figure 24 shows their student lending
portfolio for the period they were involved in the business. KeyCorp makes very little mention of
its student lending business in its annual reports, aside from providing the total amount of
education loans it services or administers.
Figure 23:KeyCorp Student Loan Portfolio (Barclays)
KeyCorp prospectuses for its securitized loan trusts offer the most insight into it student lending
business. In the mid-1990s, KeyCorp purchased student loans originated by The Access Group,
a nonprofit entity that was a leader in providing loans for law students. Access Group was

Private Student Loan Asset Backed Securities: A Default Curve Analysis
Senior Capstone Project for Nicholas Gentile________________________________________
35
founded in 1983 to provide both federal and private student loans. In 1993, they created a spinoff,
Law Access Inc., to handle the private loans that expanded beyond loans to law students.
KeyCorp purchased the Access Group loans, insured them against default with TERI, and
packaged them into securities for sale. TERI guaranteed the total principal amount in the event
of a borrower default (no payment for 120 days), a borrower bankruptcy, the death of the
borrower, or the total and permanent disability of the borrower. All of the private loans in the
1996 securitization were insured.
By 2000, KeyCorp securitizations began to include a substantial amount of unguaranteed private
loans (31.69% of total private), driven mainly by the Key Alternative Loan Program. The
Alternative Loan Program was introduced in 1995 as another tool for students to use to finance
their education with similar terms as the other private loans originated by the Access Group and
guaranteed by TERI. The prospectus does not mention the reason for KeyCorp not choosing to
insure these loans against default.
KeyCorp issued its last securitization in 2006 in a trust featuring a group of private loans that
were nearly all unguaranteed (98.98%). The unguaranteed private loans included loans from the
Key Alternative Loan Program, Campus Door Loans, Key CareerLoans, Private Graduate Loans,
and Achiever Loans (K-12). The financial crisis led KeyCorp to announce it would limit new
education loans to government backed programs, thereby eliminating itself from the private
lending market. KeyCorp attributed this plan to management’s decision to “deemphasize their
out-of-footprint businesses.” Shortly after announcing the switch to an entirely federally-backed
education lending model in September of 2009, KeyCorp announced that it was discontinuing
education lending.

Private Student Loan Asset Backed Securities: A Default Curve Analysis
Senior Capstone Project for Nicholas Gentile________________________________________
36
The biggest player in the private lending market was First Marblehead (hereafter FMD). FMD’s
main business objective, prior to its restructuring in late 2009-2010, was to provide services for
private education lending in the United States. FMD did not originate, guarantee, or service
loans, but rather collected fees from processing and securitizing third party loans. In addition to
the securitization process, FMD also assisted lenders with underwriting, documentation and
disbursement, and customer support. Figure 25 provides information on FMD’s private lender
clients’ two major business lines: “make and sell” and “make and hold.” The former grouping
referred to those lenders that securitized and sold its originated student loans and the latter
referring to those institutions which retained the loans on their balance sheets.
Figure 24: FMD Client Business Lines
The shift towards the securitization model shown in Figure 25 was greatly beneficial to FMD
(representing 78% of revenue for FY 2007). This focus on securitization reflected a key
provision in the First Marblehead approach, which reads: “Using our services, our clients can
offer student borrowers access to customized, competitive student loan products while enhancing
their fees but minimizing their resource commitment and exposure to credit risk.” For FMD’s
Private Student Loan Asset Backed Securities: A Default Curve Analysis
Senior Capstone Project for Nicholas Gentile________________________________________
37
clients, securitization offered the opportunity to increase loan volume and fees, without keeping
any “skin-in-the-game” as far as risk retention goes.
FMD’s role in the securitization process was to establish the bankruptcy remote special purpose
entities that would house the purchased (which in some cases were sourced, processed, and
underwritten by FMD) and assist with the bond issues. In return, FMD earned advisory and
administrative fees, as well as a residual interest payment from the securitization. By 2004,
FMD structured and facilitated 22 private student loan securitizations. And this number rose to
36 securitizations by 2007. In 2006 alone, the trusts that FMD created and advised would have
been, combined, the fourth largest issuer of SLABs.
In addition to its securitization business, FMD’s strategic alliance with TERI allowed it to
become such an integral part of the private student lending market. In 2001, FMD entered into a
relationship with TERI with the goal of enhancing the company’s risk management and loan
processing abilities. The alliance was a partial acquisition of TERI, resulting in FMD purchasing
its historical database and loan processing operations, along with 161 TERI employees in
exchange for $7.9 million in promissory notes, $1 million in cash, and a 25% share on all future
TERI-guaranteed FMD-facilitated securitizations.
The TERI-FMD alliance resulted in the creation of a master servicing agreement in which TERI
sub-contracted FMD to provide origination, pre-claims, claims, and default management services
for TERI’s client lenders. In addition to the servicing agreement, the entities also entered into a
master guaranty agreement in which TERI possessed the right of first refusal to guarantee
FMD’s clients’ current and future loan programs. FMD also agreed to create a market for its
clients to sell TERI-guaranteed loans through FMD-facilitated securitizations. Under this
Private Student Loan Asset Backed Securities: A Default Curve Analysis
Senior Capstone Project for Nicholas Gentile________________________________________
38
agreement, FMD was required, to the best of its abilities, to generate securitizations of TERI-
guaranteed loans twice per year.
Shortly after FMD filed its 2007 10-k report, business deteriorated due to the credit market issues
that developed in the latter half of 2007 and into 2008, FMD was unable to issue any new
securitizations. This issue was made worse in April 2008 when TERI filed for voluntary
bankruptcy, citing liquidity problems caused by credit market volatility and increased borrower
defaults/delinquencies (Business Wire 2008). The TERI bankruptcy became a bigger issue for
FMD than the constricted debt markets. FMD generated much of their business from TERI-
sourced client relationships. As a result of the bankruptcy filing, three major lenders (Bank of
America, Royal Bank of Scotland, and J.P. Morgan Chase) terminated their relationships with
FMD. These three lenders generated 56% of FMD’s loans available for securitization in 2008.
As a result of being shut out of the securitization market, FMD resorted to changing its entire
business model during 2009 and 2010. FMD began to focus more on fee-for-service offerings
like portfolio management and asset servicing. The company also introduced “Monogram,” a
program that incorporates refinements to the company’s origination process. As of 2010, FMD
began originating loans under the Monogram program in agreement with SunTrust Bank. FMD
designed the Monogram focus to distance the company from the capital markets and make it less
dependent on the securitization market. Without TERI, FMD has used the Monogram program
to fund various credit enhancement efforts on the portfolios. As of its 2012 10-k, FMD had
gotten its Monogram program fully functional; originating its own education loans through its
banking subsidiary, Union Federal Bank.
Private Student Loan Asset Backed Securities: A Default Curve Analysis
Senior Capstone Project for Nicholas Gentile________________________________________
39
The successes and failures of the institutions involved in the private loan market revolve heavily
on the practice of securitization. First Marblehead evidenced how the securitization process,
when functioning as intended, can be a great boon to business, but in the event the system breaks
down, it can cripple a business’s lending operation.
Section III: Data The data includes student loan trusts originated between 2001 and 2007 packaged by KeyCorp
and Sallie Mae. Table 2 provides complete trust names and identifiers. The Sallie Mae Trusts are
comprised of private student loans, while the KeyCorp securitizations contain both federal and
private loans. The KeyCorp securitizations are tranched into several groups of public and private
loans, however, we focus on the Group II of each trust which contain only private loans. In total,
the sixteen private loan trusts represent a total principal amount of $20.885 billion, representing
approximately 25% of the private loan market for the period. The monthly trust performance
data start from origination through August 2012. The data includes 428 individual records of
cumulative defaults for the respective trusts.
Private Student Loan Asset Backed Securities: A Default Curve Analysis
Senior Capstone Project for Nicholas Gentile________________________________________
40
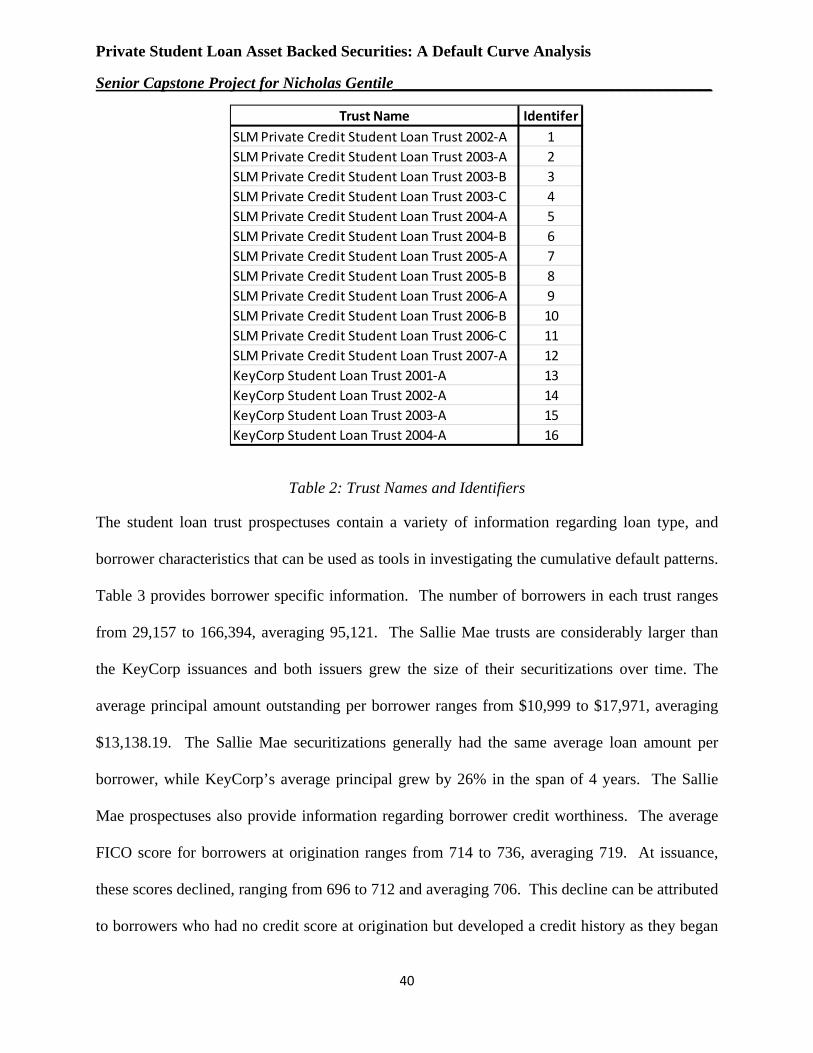
Trust Name IdentiferSLM Private Credit Student Loan Trust 2002-A 1SLM Private Credit Student Loan Trust 2003-A 2SLM Private Credit Student Loan Trust 2003-B 3SLM Private Credit Student Loan Trust 2003-C 4SLM Private Credit Student Loan Trust 2004-A 5SLM Private Credit Student Loan Trust 2004-B 6SLM Private Credit Student Loan Trust 2005-A 7SLM Private Credit Student Loan Trust 2005-B 8SLM Private Credit Student Loan Trust 2006-A 9SLM Private Credit Student Loan Trust 2006-B 10SLM Private Credit Student Loan Trust 2006-C 11SLM Private Credit Student Loan Trust 2007-A 12KeyCorp Student Loan Trust 2001-A 13KeyCorp Student Loan Trust 2002-A 14KeyCorp Student Loan Trust 2003-A 15KeyCorp Student Loan Trust 2004-A 16
Table 2: Trust Names and Identifiers
The student loan trust prospectuses contain a variety of information regarding loan type, and
borrower characteristics that can be used as tools in investigating the cumulative default patterns.
Table 3 provides borrower specific information. The number of borrowers in each trust ranges
from 29,157 to 166,394, averaging 95,121. The Sallie Mae trusts are considerably larger than
the KeyCorp issuances and both issuers grew the size of their securitizations over time. The
average principal amount outstanding per borrower ranges from $10,999 to $17,971, averaging
$13,138.19. The Sallie Mae securitizations generally had the same average loan amount per
borrower, while KeyCorp’s average principal grew by 26% in the span of 4 years. The Sallie
Mae prospectuses also provide information regarding borrower credit worthiness. The average
FICO score for borrowers at origination ranges from 714 to 736, averaging 719. At issuance,
these scores declined, ranging from 696 to 712 and averaging 706. This decline can be attributed
to borrowers who had no credit score at origination but developed a credit history as they began

Private Student Loan Asset Backed Securities: A Default Curve Analysis
Senior Capstone Project for Nicholas Gentile________________________________________
41
repayment. Loans were also made to borrowers with sub-prime credit or nonexistent credit
scores. At origination, these loans made up 0.7% to 38.7% of the total principal, averaging
13.4%. These percentages generally declined over the period as the issuers began to require
more co-signers to mitigate credit risks. At issuance, the share of sub-prime or no credit history
borrowers ranges from 6.9% to 13%. These values are more representative of the overall credit-
worthiness of the pool as most borrowers have developed a credit history by that point.
Identifer Borrowers
Av. Prin Outstanding
per Borrower
Origination FICO
% Prin w/ Origination
FICO sub-630 or non-existant
Cut-Off FICO
% Prin w/ Cut-Off FICO sub-
630 or non-existant
1 48,548 14,220$ 718 14.90% 703 13.00%2 77,197 13,021$ 715 33.40% 710 10.10%3 103,358 12,068$ 719 24.60% 712 6.92%4 91,587 13,648$ 736 16.20% 712 9.70%5 104,834 11,944$ 716 38.70% 696 10.10%6 109,001 11,767$ 720 8.00% 703 8.80%7 132,087 11,394$ 717 5.40% 701 9.80%8 128,332 11,690$ 721 2.90% 710 8.70%9 165,026 12,121$ 719 1.90% 707 9.60%10 166,394 12,016$ 718 11.10% 708 7.20%11 98,962 10,999$ 714 3.50% 700 12.20%12 153,654 13,020$ 718 0.70% 710 7.80%13 29,157 14,250$ . . . .14 41,174 15,151$ . . . .15 33,575 16,542$ . . . .16 39,057 17,971$ . . . .
Table 3: Borrower Characteristics
Table 4 provides loan status as a share of total trust principal. The prospectuses break down the
loans into five main groups: in-school, grace, deferment, forbearance, and repayment. The loan
status mix is fairly different between issuers. Sallie Mae securitizations feature anywhere from
44.5% to 85.4% of in-school loans, averaging 60.18%. On the other hand, in-school loans for

Private Student Loan Asset Backed Securities: A Default Curve Analysis
Senior Capstone Project for Nicholas Gentile________________________________________
42
KeyCorp issuances range from 4.09% to 21.25%, averaging 10.37%. This difference means that
the repayment performance of a majority of Sallie Mae loans was unknown at the time of
issuance as borrowers had yet to enter the repayment period, while a vast majority of KeyCorp
loans were already out of school and facing repayment. The trusts also featured varying amounts
of loans in the grace period (6 months following graduation). The Sallie Mae issuances range
from 7.3% to 44.1% of principal in the grace status, averaging 15.4%. KeyCorp issued trusts
with considerably more loans in the grace period, ranging from 33.89% to 48.91% and averaging
43.85%. This difference means that, at issuance, a large portion of KeyCorp borrowers were
fresh out of school and nearing the repayment period.
Identifer In School Grace Deferred Forbearance Repayment
1 16.60% 44.10% 1.60% 2.70% 35.00%2 47.40% 7.30% 0.10% 4.60% 40.60%3 61.30% 7.30% 0.00% 2.40% 29.00%4 51.40% 23.00% 0.10% 4.20% 21.30%5 44.50% 13.50% 2.30% 9.10% 30.60%6 85.40% 7.70% 1.00% 1.20% 4.70%7 71.40% 12.30% 1.30% 1.70% 13.30%8 68.20% 19.80% 1.10% 1.70% 9.20%9 77.60% 8.40% 1.00% 2.20% 10.80%
10 65.90% 13.60% 0.80% 3.20% 16.50%11 61.40% 19.90% 1.30% 3.50% 13.90%12 71.10% 8.00% 1.10% 2.40% 17.40%13 4.09% 48.91% 2.69% 6.47% 37.84%14 7.51% 33.89% 19.33% 3.44% 35.83%15 8.63% 46.75% 14.59% 0.40% 29.63%16 21.25% 44.26% 12.08% 0.20% 22.21%
Table 4: Loan Status as a Percent of Total Principal
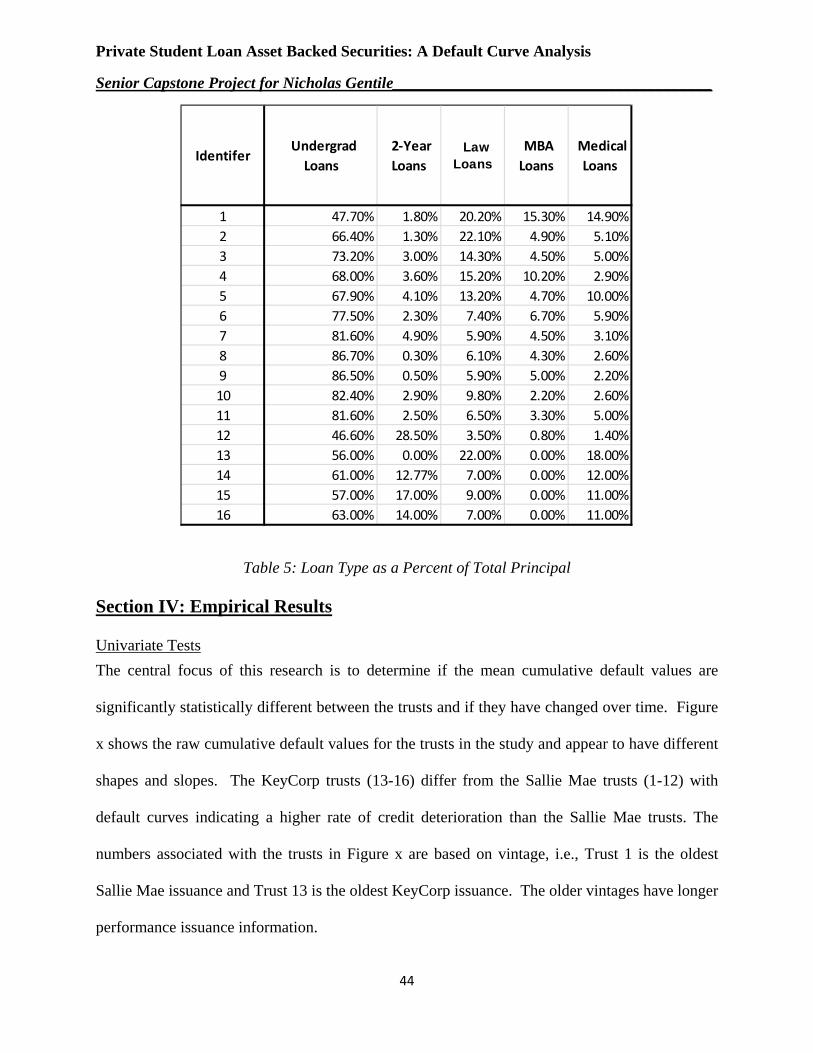
Table 5 provides percentages of principal by loan type. The prospectuses break down loan type
into five main groups: four-year undergrad and liberal arts graduate loans, 2-year undergraduate
loans, law school loans, MBA loans, and medical school loans. The first group comprises
Private Student Loan Asset Backed Securities: A Default Curve Analysis
Senior Capstone Project for Nicholas Gentile________________________________________
43
majority of the principal in the trusts, ranging from 46.6% to 86.7% and averaging 69.1% across
the issuers. Two-year loans, regarded as the riskiest student product, ranges from 0% to 28.5%
and averages 6.1%. Sallie Mae kept their 2-year loans to a minimum for most of the period
(averaging 2.47% for trusts 1-11), but this value jumped to 28.5% for trust 12, a noticeable
increase in risk profile for the entire trust. KeyCorp, while featuring high percentages (averaging
10.94%), kept their loan profile fairly consistent. Law loans, while initially a sizeable portion of
the trusts, fell out of favor as the years went on, ranging from 3.5% of total principal to 22.1%,
averaging 11%. The same story is true for Sallie Mae regarding MBA and medical loans. The
share of MBA loans ranges from 0.8% (KeyCorp didn’t issue this type of loan) to 15.3%,
averaging 4.2%. Medical loans make up between 1.4% and 18% of the trusts, averaging 7%.
For Sallie Mae, these loans became a marginal product in the later securitizations, while
KeyCorp medical loans averaged 13% of the total trust principal over the period.
Private Student Loan Asset Backed Securities: A Default Curve Analysis
Senior Capstone Project for Nicholas Gentile________________________________________
44
Identifer Undergrad
Loans 2-Year Loans
Law Loans
MBA Loans
Medical Loans
1 47.70% 1.80% 20.20% 15.30% 14.90%2 66.40% 1.30% 22.10% 4.90% 5.10%3 73.20% 3.00% 14.30% 4.50% 5.00%4 68.00% 3.60% 15.20% 10.20% 2.90%5 67.90% 4.10% 13.20% 4.70% 10.00%6 77.50% 2.30% 7.40% 6.70% 5.90%7 81.60% 4.90% 5.90% 4.50% 3.10%8 86.70% 0.30% 6.10% 4.30% 2.60%9 86.50% 0.50% 5.90% 5.00% 2.20%10 82.40% 2.90% 9.80% 2.20% 2.60%11 81.60% 2.50% 6.50% 3.30% 5.00%12 46.60% 28.50% 3.50% 0.80% 1.40%13 56.00% 0.00% 22.00% 0.00% 18.00%14 61.00% 12.77% 7.00% 0.00% 12.00%15 57.00% 17.00% 9.00% 0.00% 11.00%16 63.00% 14.00% 7.00% 0.00% 11.00%
Table 5: Loan Type as a Percent of Total Principal
Section IV: Empirical Results
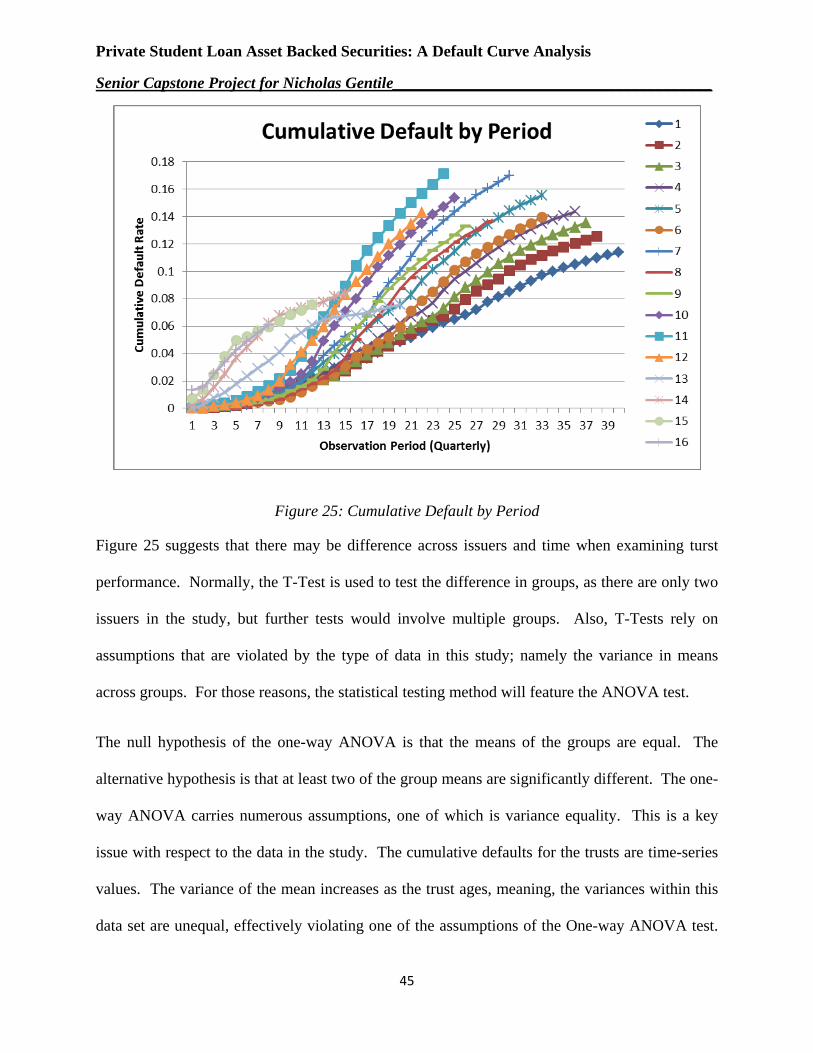
Univariate Tests The central focus of this research is to determine if the mean cumulative default values are
significantly statistically different between the trusts and if they have changed over time. Figure
x shows the raw cumulative default values for the trusts in the study and appear to have different
shapes and slopes. The KeyCorp trusts (13-16) differ from the Sallie Mae trusts (1-12) with
default curves indicating a higher rate of credit deterioration than the Sallie Mae trusts. The
numbers associated with the trusts in Figure x are based on vintage, i.e., Trust 1 is the oldest
Sallie Mae issuance and Trust 13 is the oldest KeyCorp issuance. The older vintages have longer
performance issuance information.
Private Student Loan Asset Backed Securities: A Default Curve Analysis
Senior Capstone Project for Nicholas Gentile________________________________________
45
Figure 25: Cumulative Default by Period
Figure 25 suggests that there may be difference across issuers and time when examining turst
performance. Normally, the T-Test is used to test the difference in groups, as there are only two
issuers in the study, but further tests would involve multiple groups. Also, T-Tests rely on
assumptions that are violated by the type of data in this study; namely the variance in means
across groups. For those reasons, the statistical testing method will feature the ANOVA test.
The null hypothesis of the one-way ANOVA is that the means of the groups are equal. The
alternative hypothesis is that at least two of the group means are significantly different. The one-
way ANOVA carries numerous assumptions, one of which is variance equality. This is a key
issue with respect to the data in the study. The cumulative defaults for the trusts are time-series
values. The variance of the mean increases as the trust ages, meaning, the variances within this
data set are unequal, effectively violating one of the assumptions of the One-way ANOVA test.

Private Student Loan Asset Backed Securities: A Default Curve Analysis
Senior Capstone Project for Nicholas Gentile________________________________________
46
The unequal variance issue is exacerbated by the unequal sample sizes of the trusts. As some
trusts were naturally originated at an earlier date than others, they have more record periods. The
combination of these two factors would leave any One-way ANOVA result suspect at best, as the
p-values would be too conservative or liberal for any conclusion to be reached with confidence.
Fortunately, the One-way ANOVA is robust with respect to the homogeneity of variance
assumption. If a statistical test is robust, it means that the output is minimally affected by a
violation of that assumption. The prerequisite for the ANOVA “robustness” is that the group
sizes need to be more or less equal (Northern Arizona University). The record periods for the
trusts range from a high of 40 to a low of 8. In order to get the One-way ANOVA to work, the
sample size of the largest group must be no more than 1 ½ times that of the smallest group. As
such, only 12 records were included from 15 of the trusts, with the last trust providing 8. The
study now is testing whether or not the cumulative default rates on the trusts were statistically
different within the first 2-3 years following origination.
Figure 26 shows the difference in cumulative default rates by issuer which appear vastly
different. Statistically, the difference in mean default rates, by seasoning, for the issuers
generated an F-statistic of 156.85, which at 187 degrees of freedom, resulted in a probability > F
of 0.000 meaning that the null hypothesis of mean equality can be rejected. Thus, the KeyCorp
trusts do perform worse than their Sallie Mae counterparts.

Private Student Loan Asset Backed Securities: A Default Curve Analysis
Senior Capstone Project for Nicholas Gentile________________________________________
47
Figure 256: Cumulative Default by Issuer
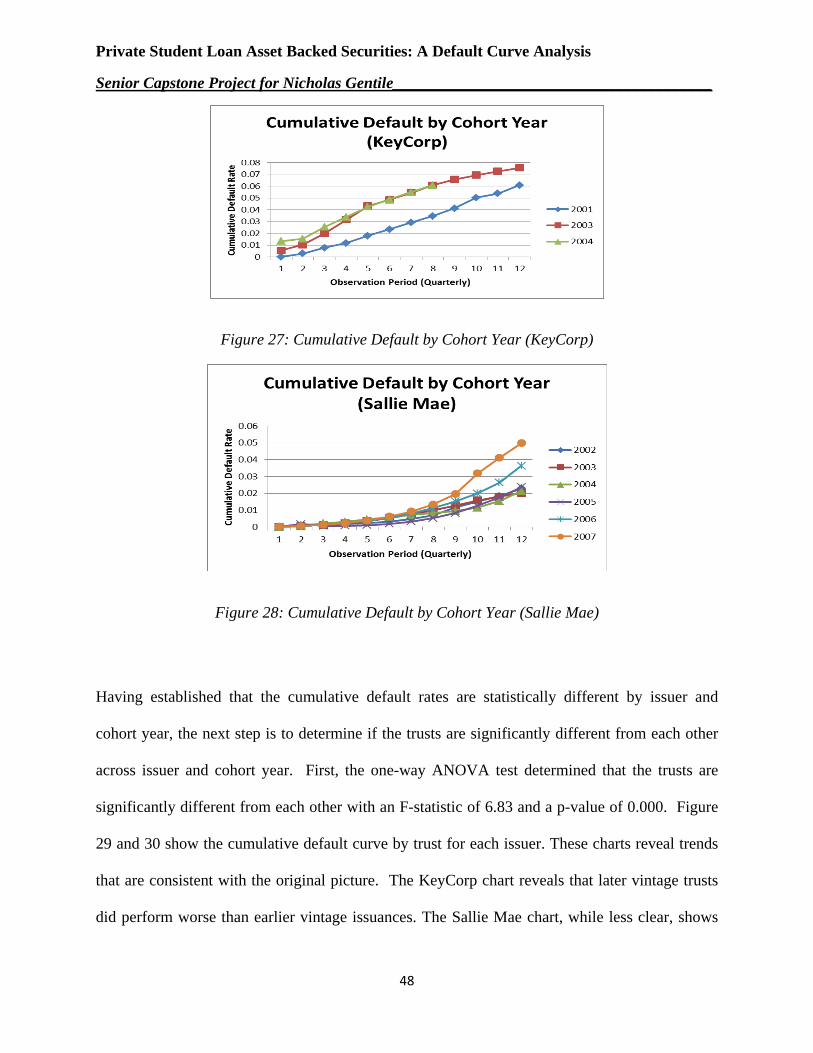
Given the significant differences in default curves, the next question is to find if the results are
impacted by cohort year. The cohort years were constructed as dummy variables for analysis,
and the univariate tests reveal some years were significant while others were not. All cohort
years for each issuer are shown in figures 27 and 28 below for comparison purposes. Both
figures reveal the trend indicated by the original depiction, that is, trusts issued later on in the
observation period performed worse than their peers. This is evidence that the trusts were either
constructed differently as the years went on, or they were exposed to different repayment
environments early in their lifecycle.
Private Student Loan Asset Backed Securities: A Default Curve Analysis
Senior Capstone Project for Nicholas Gentile________________________________________
48
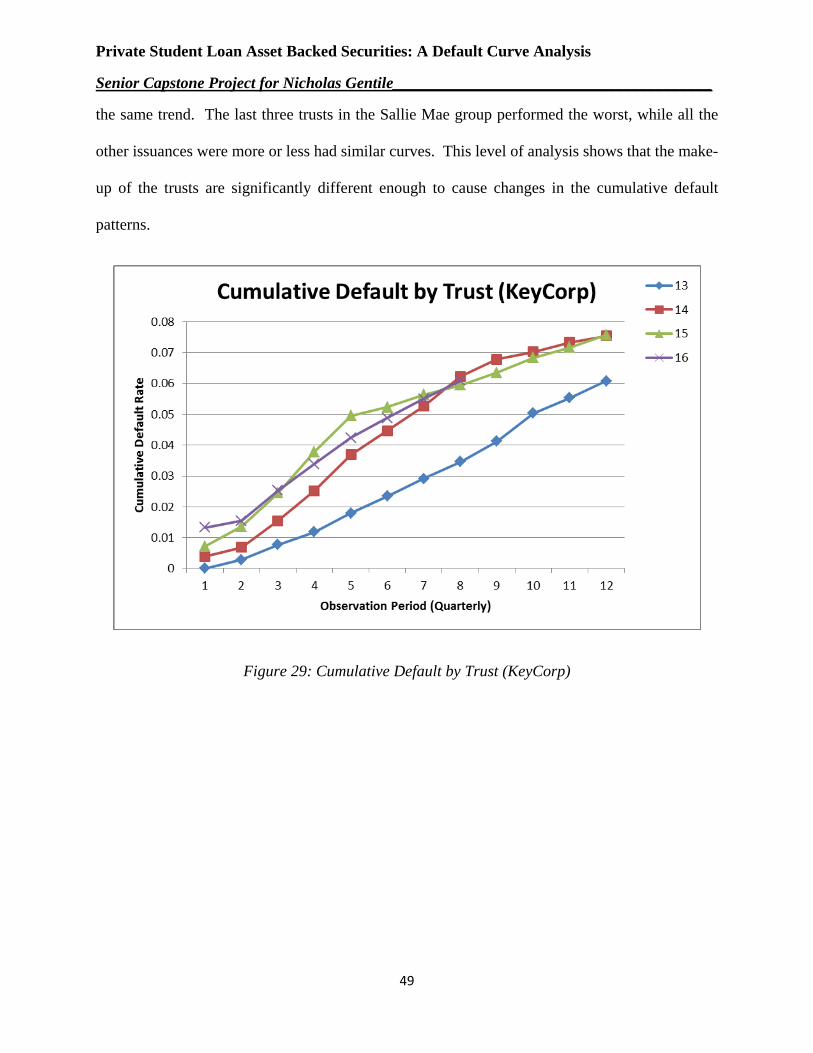
Figure 27: Cumulative Default by Cohort Year (KeyCorp)
Figure 28: Cumulative Default by Cohort Year (Sallie Mae)
Having established that the cumulative default rates are statistically different by issuer and
cohort year, the next step is to determine if the trusts are significantly different from each other
across issuer and cohort year. First, the one-way ANOVA test determined that the trusts are
significantly different from each other with an F-statistic of 6.83 and a p-value of 0.000. Figure
29 and 30 show the cumulative default curve by trust for each issuer. These charts reveal trends
that are consistent with the original picture. The KeyCorp chart reveals that later vintage trusts
did perform worse than earlier vintage issuances. The Sallie Mae chart, while less clear, shows
Private Student Loan Asset Backed Securities: A Default Curve Analysis
Senior Capstone Project for Nicholas Gentile________________________________________
49
the same trend. The last three trusts in the Sallie Mae group performed the worst, while all the
other issuances were more or less had similar curves. This level of analysis shows that the make-
up of the trusts are significantly different enough to cause changes in the cumulative default
patterns.
Figure 29: Cumulative Default by Trust (KeyCorp)
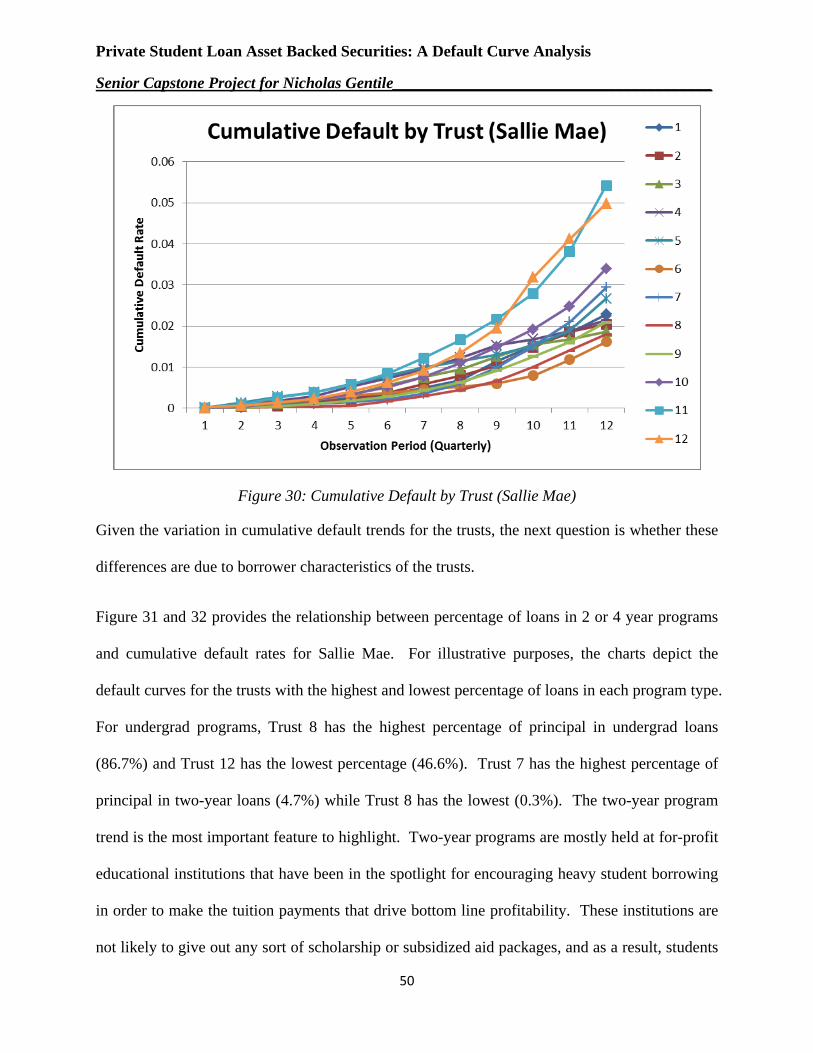
Private Student Loan Asset Backed Securities: A Default Curve Analysis
Senior Capstone Project for Nicholas Gentile________________________________________
50
Figure 30: Cumulative Default by Trust (Sallie Mae)
Given the variation in cumulative default trends for the trusts, the next question is whether these
differences are due to borrower characteristics of the trusts.
Figure 31 and 32 provides the relationship between percentage of loans in 2 or 4 year programs
and cumulative default rates for Sallie Mae. For illustrative purposes, the charts depict the
default curves for the trusts with the highest and lowest percentage of loans in each program type.
For undergrad programs, Trust 8 has the highest percentage of principal in undergrad loans
(86.7%) and Trust 12 has the lowest percentage (46.6%). Trust 7 has the highest percentage of
principal in two-year loans (4.7%) while Trust 8 has the lowest (0.3%). The two-year program
trend is the most important feature to highlight. Two-year programs are mostly held at for-profit
educational institutions that have been in the spotlight for encouraging heavy student borrowing
in order to make the tuition payments that drive bottom line profitability. These institutions are
not likely to give out any sort of scholarship or subsidized aid packages, and as a result, students
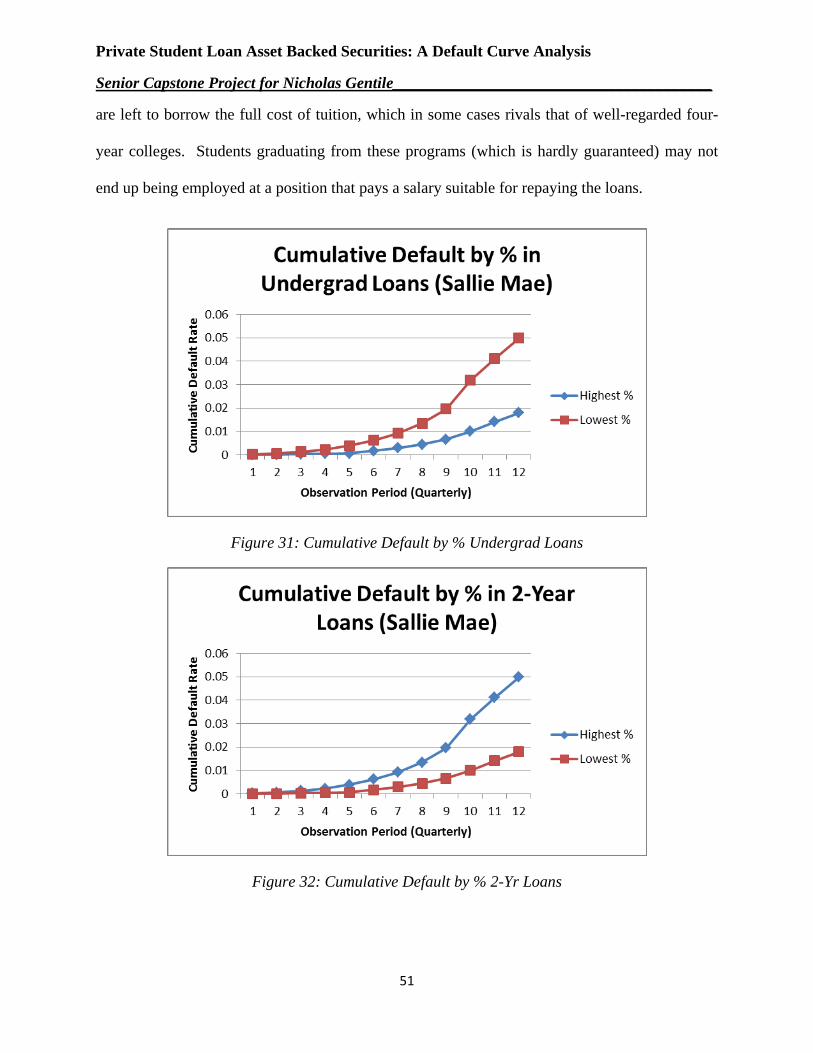
Private Student Loan Asset Backed Securities: A Default Curve Analysis
Senior Capstone Project for Nicholas Gentile________________________________________
51
are left to borrow the full cost of tuition, which in some cases rivals that of well-regarded four-
year colleges. Students graduating from these programs (which is hardly guaranteed) may not
end up being employed at a position that pays a salary suitable for repaying the loans.
Figure 31: Cumulative Default by % Undergrad Loans
Figure 32: Cumulative Default by % 2-Yr Loans
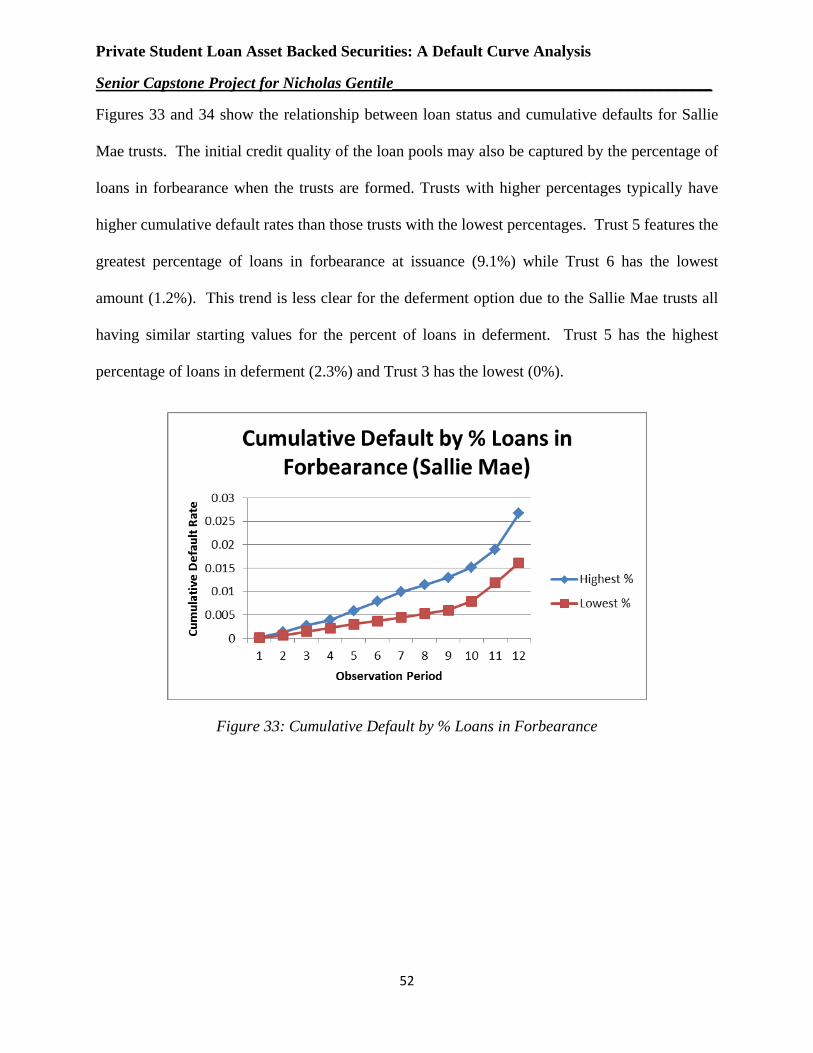
Private Student Loan Asset Backed Securities: A Default Curve Analysis
Senior Capstone Project for Nicholas Gentile________________________________________
52
Figures 33 and 34 show the relationship between loan status and cumulative defaults for Sallie
Mae trusts. The initial credit quality of the loan pools may also be captured by the percentage of
loans in forbearance when the trusts are formed. Trusts with higher percentages typically have
higher cumulative default rates than those trusts with the lowest percentages. Trust 5 features the
greatest percentage of loans in forbearance at issuance (9.1%) while Trust 6 has the lowest
amount (1.2%). This trend is less clear for the deferment option due to the Sallie Mae trusts all
having similar starting values for the percent of loans in deferment. Trust 5 has the highest
percentage of loans in deferment (2.3%) and Trust 3 has the lowest (0%).
Figure 33: Cumulative Default by % Loans in Forbearance
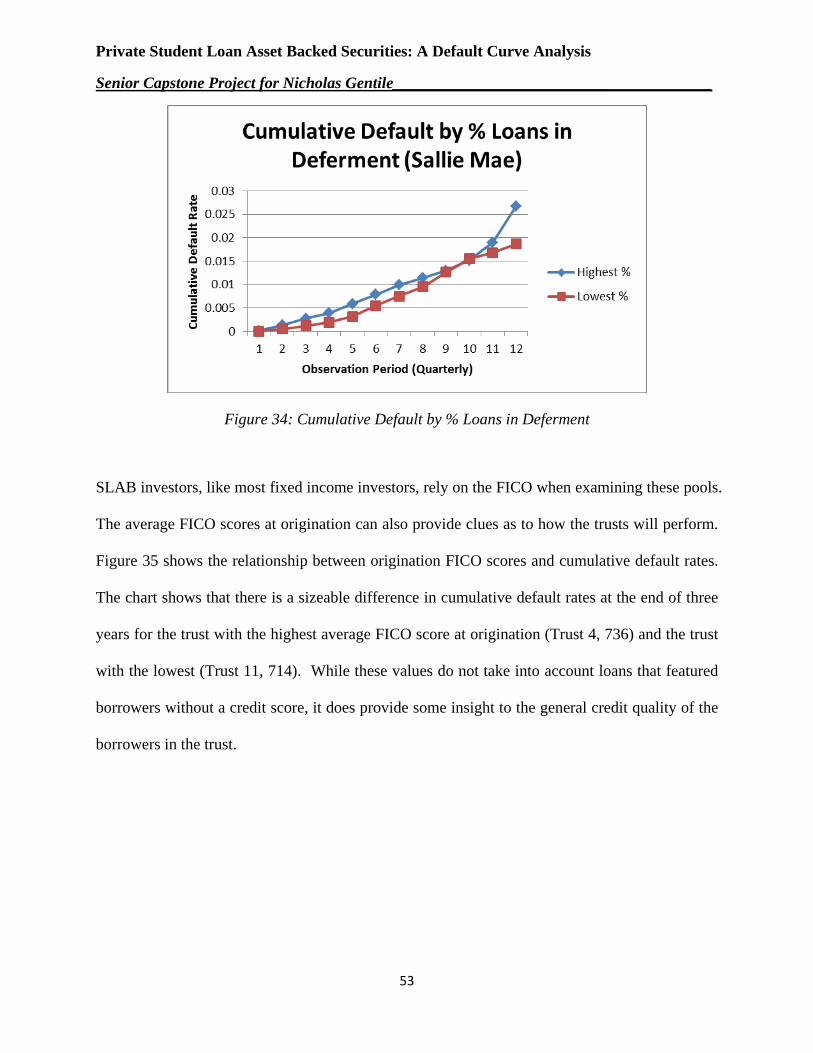
Private Student Loan Asset Backed Securities: A Default Curve Analysis
Senior Capstone Project for Nicholas Gentile________________________________________
53
Figure 34: Cumulative Default by % Loans in Deferment
SLAB investors, like most fixed income investors, rely on the FICO when examining these pools.
The average FICO scores at origination can also provide clues as to how the trusts will perform.
Figure 35 shows the relationship between origination FICO scores and cumulative default rates.
The chart shows that there is a sizeable difference in cumulative default rates at the end of three
years for the trust with the highest average FICO score at origination (Trust 4, 736) and the trust
with the lowest (Trust 11, 714). While these values do not take into account loans that featured
borrowers without a credit score, it does provide some insight to the general credit quality of the
borrowers in the trust.

Private Student Loan Asset Backed Securities: A Default Curve Analysis
Senior Capstone Project for Nicholas Gentile________________________________________
54
Figure 35: Cumulative Default by Origination FICO
While a trust’s default behavior is caused by varying internal aspects due to underwriting, these
factors cannot entirely explain the performance history. External economic conditions may also
impact borrower repayment. The internal trust dynamics influence how each issue performs in
the external environment. Table 6 provides the minimums and maximums for selected
economic variables which varied dramatically over the performance horizon. For example, the
range of GDP growth over the period exceeds 15%. The 90-day treasury bill, an integral factor
for floating rate products like student loans, fell from a high of 5% to essentially zero in
approximately a year. The unemployment rate, normally 5-6% in normal economic conditions,
jumped to nearly 10% during the recession. This unemployment number does not account for
unemployment, which is an important issue relating to new college graduates and debt
repayment.
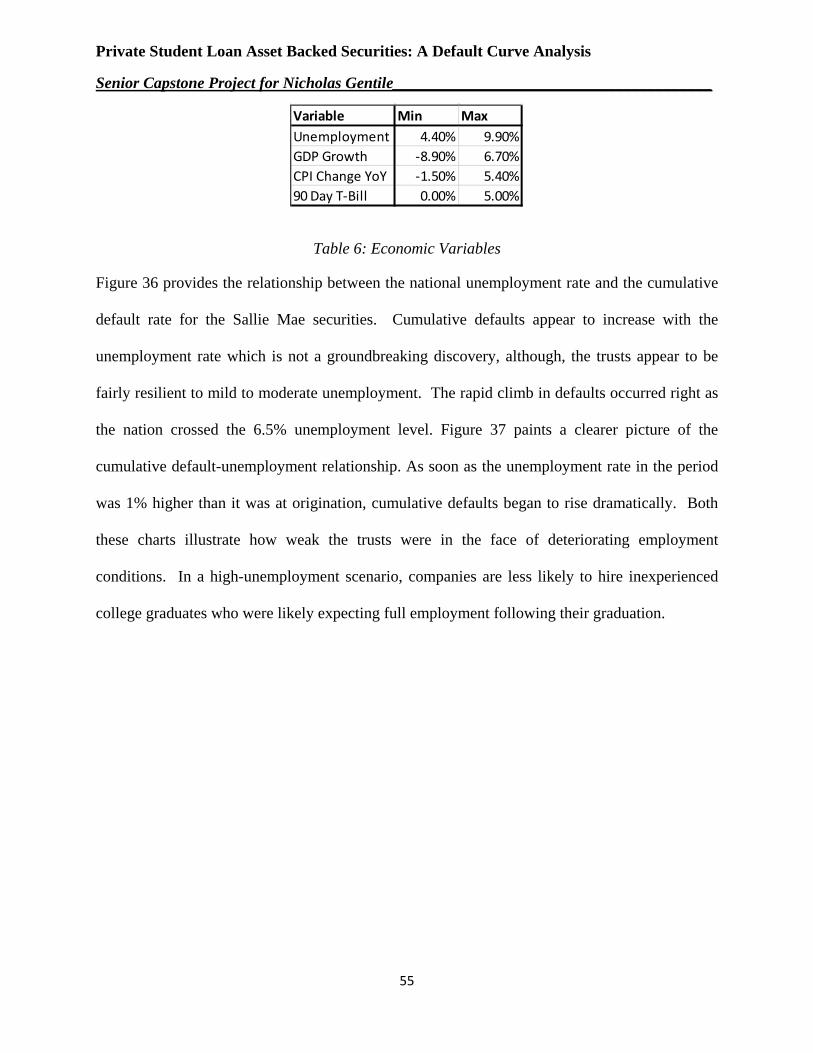
Private Student Loan Asset Backed Securities: A Default Curve Analysis
Senior Capstone Project for Nicholas Gentile________________________________________
55
Variable Min MaxUnemployment 4.40% 9.90%GDP Growth -8.90% 6.70%CPI Change YoY -1.50% 5.40%90 Day T-Bill 0.00% 5.00%
Table 6: Economic Variables
Figure 36 provides the relationship between the national unemployment rate and the cumulative
default rate for the Sallie Mae securities. Cumulative defaults appear to increase with the
unemployment rate which is not a groundbreaking discovery, although, the trusts appear to be
fairly resilient to mild to moderate unemployment. The rapid climb in defaults occurred right as
the nation crossed the 6.5% unemployment level. Figure 37 paints a clearer picture of the
cumulative default-unemployment relationship. As soon as the unemployment rate in the period
was 1% higher than it was at origination, cumulative defaults began to rise dramatically. Both
these charts illustrate how weak the trusts were in the face of deteriorating employment
conditions. In a high-unemployment scenario, companies are less likely to hire inexperienced
college graduates who were likely expecting full employment following their graduation.
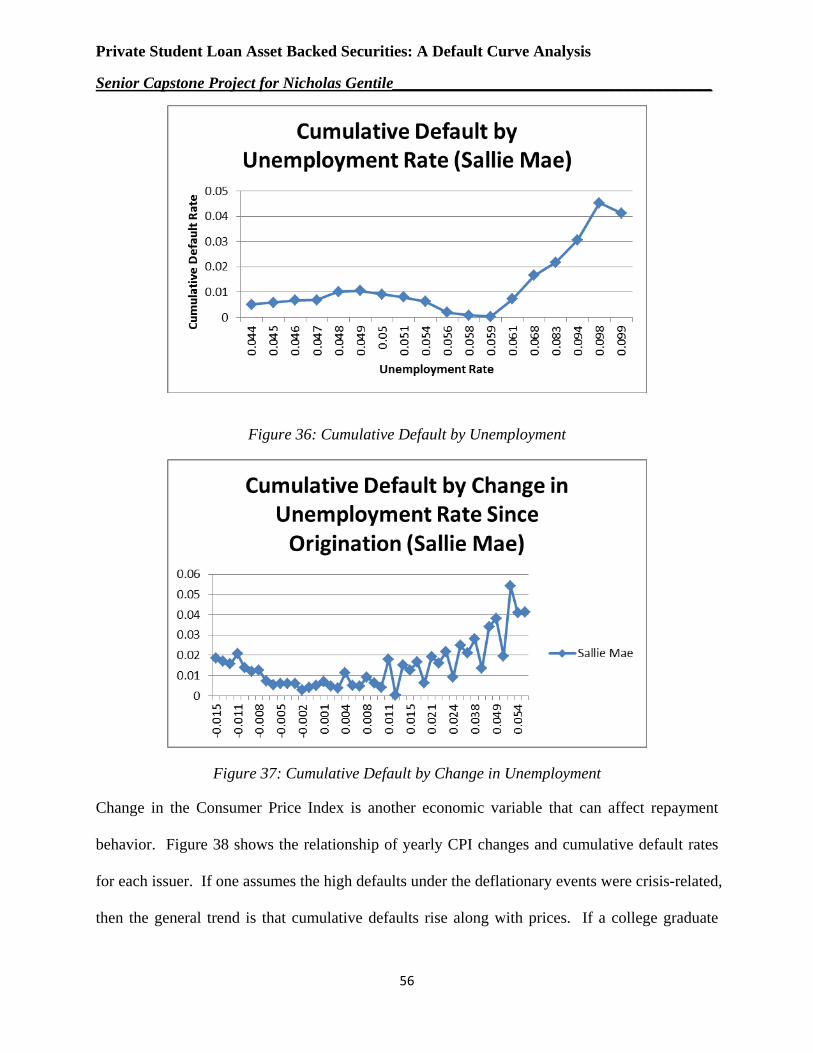
Private Student Loan Asset Backed Securities: A Default Curve Analysis
Senior Capstone Project for Nicholas Gentile________________________________________
56
Figure 36: Cumulative Default by Unemployment
Figure 37: Cumulative Default by Change in Unemployment
Change in the Consumer Price Index is another economic variable that can affect repayment
behavior. Figure 38 shows the relationship of yearly CPI changes and cumulative default rates
for each issuer. If one assumes the high defaults under the deflationary events were crisis-related,
then the general trend is that cumulative defaults rise along with prices. If a college graduate

Private Student Loan Asset Backed Securities: A Default Curve Analysis
Senior Capstone Project for Nicholas Gentile________________________________________
57
was living on a tight budget, then any gradual change upwards in prices, not accompanied by an
increase in wages, would increase the likelihood that their income would become insufficient for
repayment purposes.
Figure 38: Cumulative Default by CPI Change
One last economic variable that could affect repayment behavior is the prevailing interest rate
environment. As many of the loans within the trust were priced on a variable rate basis, as the
benchmark rate (trusts featured 90-Day T-bill, Prime Rate, 3 Mo. LIBOR) changed, so would the
repayment amount that each borrower owed. One of the common basis rates for these trusts is
the 90-Day Treasury Bill. Figure 39 shows the 90-day T-Bill rate for 2001-2012. Over the
observation period, this rate changed dramatically, and repayment behavior depends both on
what point of the curve the trust was originated and the subsequent trend. Figure 40 provides the
relationship between defaults and 90-day rate for each period. Figure 41 illustrates how defaults
behaved relative to changes in the floating rate from the time of origination. In Figure 40, the
KeyCorp trusts show the strong positive relationship between the prevailing rate and cumulative
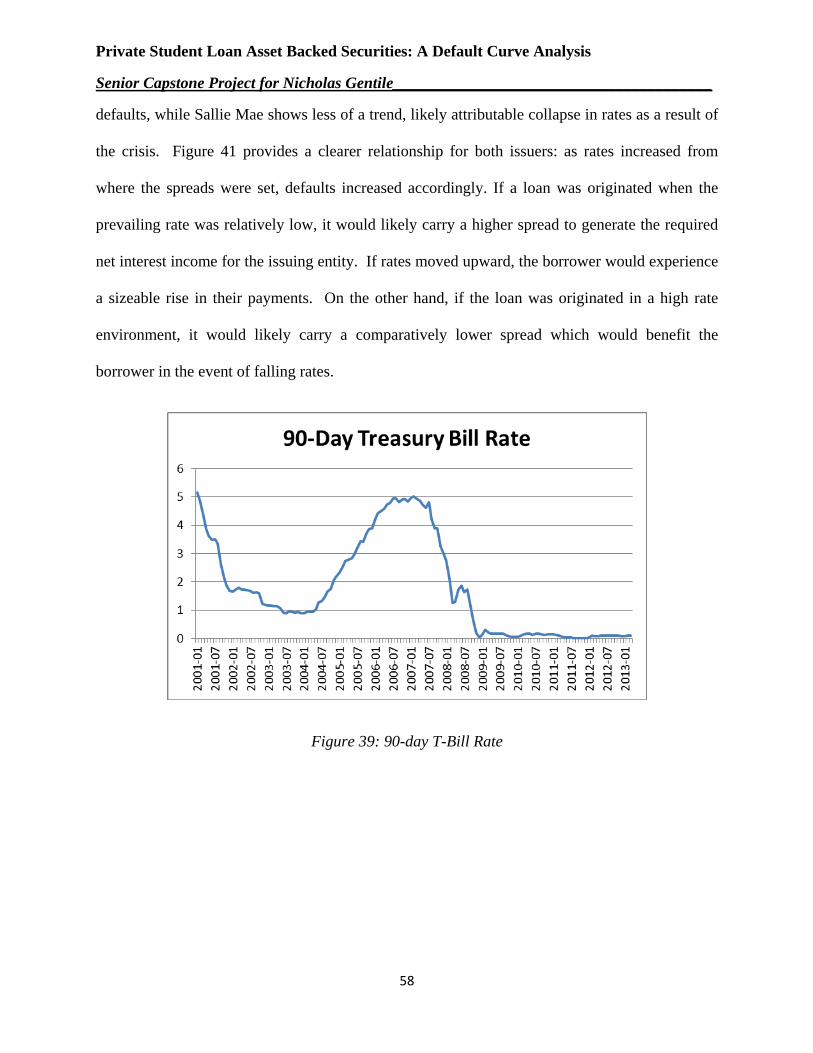
Private Student Loan Asset Backed Securities: A Default Curve Analysis
Senior Capstone Project for Nicholas Gentile________________________________________
58
defaults, while Sallie Mae shows less of a trend, likely attributable collapse in rates as a result of
the crisis. Figure 41 provides a clearer relationship for both issuers: as rates increased from
where the spreads were set, defaults increased accordingly. If a loan was originated when the
prevailing rate was relatively low, it would likely carry a higher spread to generate the required
net interest income for the issuing entity. If rates moved upward, the borrower would experience
a sizeable rise in their payments. On the other hand, if the loan was originated in a high rate
environment, it would likely carry a comparatively lower spread which would benefit the
borrower in the event of falling rates.
Figure 39: 90-day T-Bill Rate

Private Student Loan Asset Backed Securities: A Default Curve Analysis
Senior Capstone Project for Nicholas Gentile________________________________________
59
Figure 40: Cumulative Default by 90-day T-Bill
Figure 41: Cumulative Default by Change in T-Bill Since Origination
Multivariate Models Given the trends evident in the univariate tests, we now move towards constructing the
multivariate model that best explains the trust cumulative defaults. Our hypothesis is that the
defaults are driven by several factors: issuer, cohort year, macroeconomic variables and
underwriting/borrower characteristic variables. We progressively built the model; running it as

Private Student Loan Asset Backed Securities: A Default Curve Analysis
Senior Capstone Project for Nicholas Gentile________________________________________
60
we added a new grouping of variables. This approach allowed for a clearer understanding of
how each grouping of variables affected their defaults.
To start, the initial model consists of the issuer dummy variable (key) and the cohort variables.
The earliest cohort, 2001, was omitted. Table 7 provides the results for this model run. The
included variables were all significant at the 95% confidence level with logical coefficient
directions. The model indicates that there is a significant difference between issuers, with
KeyCorp trusts performing worse than their Sallie Mae counterparts. For the cohort variables,
the deterioration in performance relative to the omitted cohort generally increases with the newer
trusts. The model is consistent with the hypothesis and has an R2 value of 0.5052.
Robustcum_def Coef. Std. Err. z P>|z| [95% Conf. Interval]Issuerkey 0.03571 0.002142 16.68 0 .0315131 .0399076Cohort Year2002 0.015192 0.002142 7.09 0 .0109951 .01938952003 0.016932 0.001797 9.42 0 .013409 .02045462004 0.013687 0.002811 4.87 0 .0081781 .01919632005 0.014039 0.002354 5.96 0 .0094251 .01865292006 0.018664 0.003232 5.78 0 .0123297 .02499772007 0.022757 0.002142 10.63 0 .0185592 .0269537Constantconstant 0.007762 0.002142 -3.62 0 .0119595 -.0035651
Table 7: Model Run #1
Given the impact of the issuer and cohort variables, the next step is to add in some economic
variables that we believe should impact defaults given the results of the univariate tests. In
addition to those variables, we also included the seasoning variable (obs) to control for the
natural increase in cumulative defaults over time. Table 8 provides the results for this model run.
The model has an R2 value of 0.8543. The added variables are significant at the 95% level and
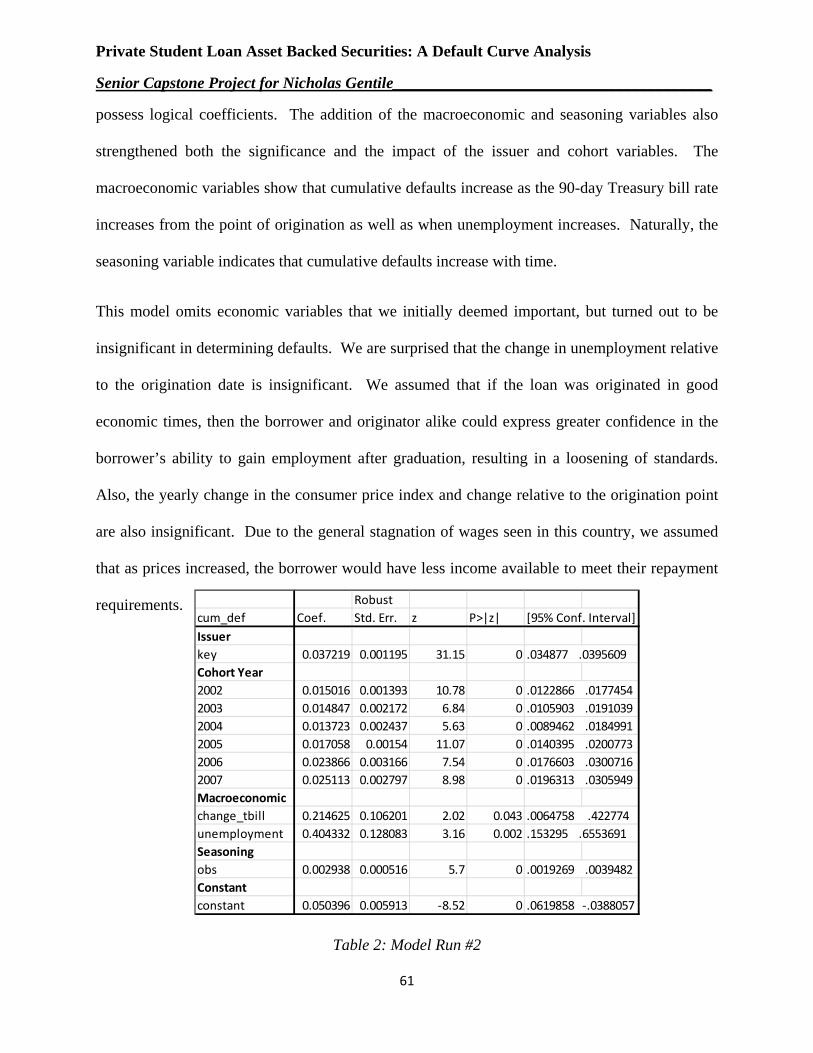
Private Student Loan Asset Backed Securities: A Default Curve Analysis
Senior Capstone Project for Nicholas Gentile________________________________________
61
possess logical coefficients. The addition of the macroeconomic and seasoning variables also
strengthened both the significance and the impact of the issuer and cohort variables. The
macroeconomic variables show that cumulative defaults increase as the 90-day Treasury bill rate
increases from the point of origination as well as when unemployment increases. Naturally, the
seasoning variable indicates that cumulative defaults increase with time.
This model omits economic variables that we initially deemed important, but turned out to be
insignificant in determining defaults. We are surprised that the change in unemployment relative
to the origination date is insignificant. We assumed that if the loan was originated in good
economic times, then the borrower and originator alike could express greater confidence in the
borrower’s ability to gain employment after graduation, resulting in a loosening of standards.
Also, the yearly change in the consumer price index and change relative to the origination point
are also insignificant. Due to the general stagnation of wages seen in this country, we assumed
that as prices increased, the borrower would have less income available to meet their repayment
requirements.
Table 2: Model Run #2
Robustcum_def Coef. Std. Err. z P>|z| [95% Conf. Interval]Issuerkey 0.037219 0.001195 31.15 0 .034877 .0395609Cohort Year2002 0.015016 0.001393 10.78 0 .0122866 .01774542003 0.014847 0.002172 6.84 0 .0105903 .01910392004 0.013723 0.002437 5.63 0 .0089462 .01849912005 0.017058 0.00154 11.07 0 .0140395 .02007732006 0.023866 0.003166 7.54 0 .0176603 .03007162007 0.025113 0.002797 8.98 0 .0196313 .0305949Macroeconomicchange_tbill 0.214625 0.106201 2.02 0.043 .0064758 .422774unemployment 0.404332 0.128083 3.16 0.002 .153295 .6553691Seasoningobs 0.002938 0.000516 5.7 0 .0019269 .0039482Constantconstant 0.050396 0.005913 -8.52 0 .0619858 -.0388057

Private Student Loan Asset Backed Securities: A Default Curve Analysis
Senior Capstone Project for Nicholas Gentile________________________________________
62
Given the results of the previous model runs, the next and final step is to include the
underwriting/borrower characteristic variables. Table 8 provides the results of this model run
which generates an R2 of 0.8635. The significant variables included ones relating to the status of
the loans, the degree program associated with the loans, and the weighted average rate of the
loans. The results for the forbearance variable indicate the trusts perform worse as the
percentage of loans in forbearance increases. The variable controlling for loans made for two-
year programs tells the same story. The variable controlling for loans made to borrowers in four
year undergrad programs or liberal arts graduate programs is also consistent with our prior
reasoning. These loans made to more conventional students are safer than those made to
students in what can be considered alternative two year programs. One variable with a surprising,
yet significant, coefficient is the one controlling for the percentage of loans in deferment. The
model indicates that as the percentage of these loans increases, cumulative defaults decrease. It
is possible that the lenders’ default-avoidance programs are more effective for those borrowers in
deferment than those in forbearance. Lastly, as one can assume, as the weighted average rate of
the trust’s borrowers increases, defaults increase accordingly. The inclusion of the borrower
characteristic/underwriting variables impacted both the significance and coefficients of the
variables from the prior model runs. The change in Treasury bill variable is now significant only
at the 90% level. Also, the cohort variables’ significance and magnitude is also modified by the
inclusion of these new variables. This could mean that the borrower characteristic/underwriting
variables play a larger role in cumulative defaults than the cohort years. Also, the cohort year
variables may previously have been including a general decrease in credit quality throughout the
industry during the previous model runs.
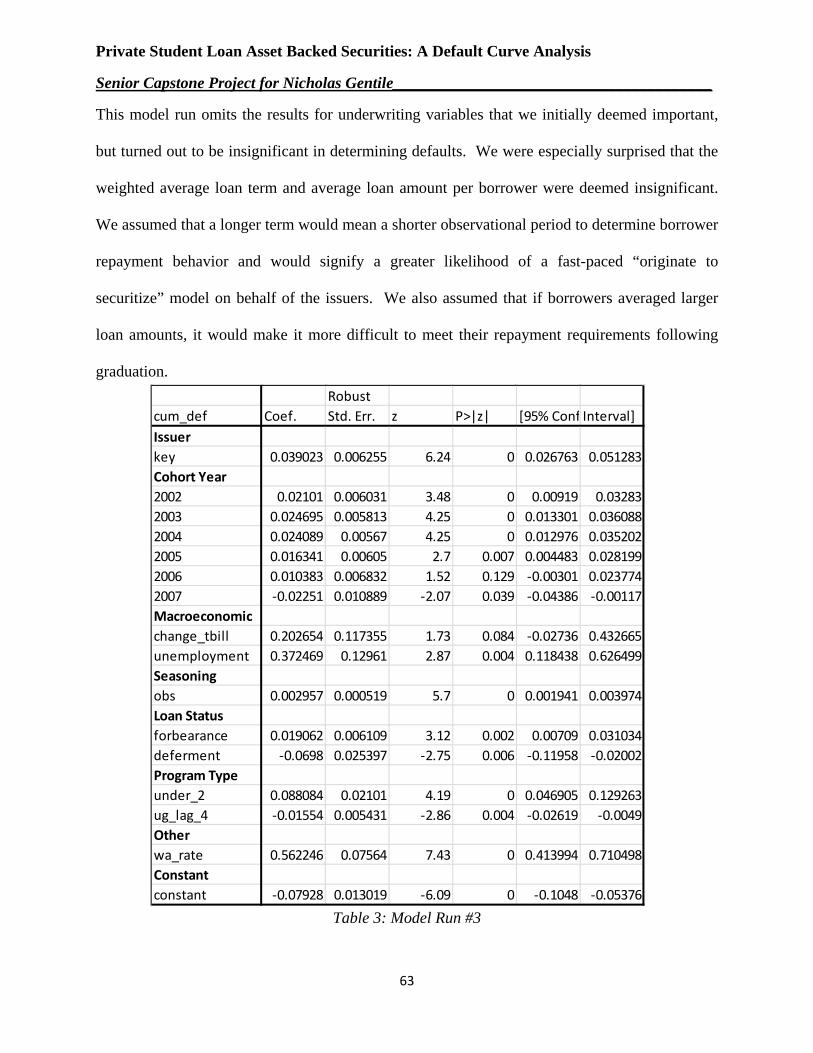
Private Student Loan Asset Backed Securities: A Default Curve Analysis
Senior Capstone Project for Nicholas Gentile________________________________________
63
This model run omits the results for underwriting variables that we initially deemed important,
but turned out to be insignificant in determining defaults. We were especially surprised that the
weighted average loan term and average loan amount per borrower were deemed insignificant.
We assumed that a longer term would mean a shorter observational period to determine borrower
repayment behavior and would signify a greater likelihood of a fast-paced “originate to
securitize” model on behalf of the issuers. We also assumed that if borrowers averaged larger
loan amounts, it would make it more difficult to meet their repayment requirements following
graduation.
Table 3: Model Run #3
Robustcum_def Coef. Std. Err. z P>|z| [95% Conf Interval]Issuerkey 0.039023 0.006255 6.24 0 0.026763 0.051283Cohort Year2002 0.02101 0.006031 3.48 0 0.00919 0.032832003 0.024695 0.005813 4.25 0 0.013301 0.0360882004 0.024089 0.00567 4.25 0 0.012976 0.0352022005 0.016341 0.00605 2.7 0.007 0.004483 0.0281992006 0.010383 0.006832 1.52 0.129 -0.00301 0.0237742007 -0.02251 0.010889 -2.07 0.039 -0.04386 -0.00117Macroeconomicchange_tbill 0.202654 0.117355 1.73 0.084 -0.02736 0.432665unemployment 0.372469 0.12961 2.87 0.004 0.118438 0.626499Seasoningobs 0.002957 0.000519 5.7 0 0.001941 0.003974Loan Statusforbearance 0.019062 0.006109 3.12 0.002 0.00709 0.031034deferment -0.0698 0.025397 -2.75 0.006 -0.11958 -0.02002Program Typeunder_2 0.088084 0.02101 4.19 0 0.046905 0.129263ug_lag_4 -0.01554 0.005431 -2.86 0.004 -0.02619 -0.0049Otherwa_rate 0.562246 0.07564 7.43 0 0.413994 0.710498Constantconstant -0.07928 0.013019 -6.09 0 -0.1048 -0.05376

Private Student Loan Asset Backed Securities: A Default Curve Analysis
Senior Capstone Project for Nicholas Gentile________________________________________
64
Section V: Econometric Challenges and Methods Given the formatting and type of data in this study, several econometric challenges were
presented. The cumulative nature of the default value meant that the results are autocorrelated
and heteroskedastic. Autocorrelation means that the error term of one observation is influenced
by the error term of the prior observation. The data presented heteroskedasticity in that the
variances from the mean are not equal across trusts. Given the data set, we were left to find a
statistical method that would remain robust in the face of these challenges. The following details
the methodology used in this study as it relates to Stata, our statistical analysis software.
Stata must first be commanded to recognize the data in its panel format. To do so, the command
tsset is used and the variable obs is given as the time variable and id is given as the grouping
variable. Stata can now utilize its commands for panel data. To perform the model runs, the
regression format xtreg is used, which is the regression equation for panel data. The xtreg
program can perform fixed effects and random effects regression, given that we have time
variate and time invariate factors; we use the random effects option. We then utilize program
options to modify the xtreg equation to address the heteroskedasticity and autocorrelation issues.
The cluster() option generates standard errors that are robust in the face of heteroskedasticity and
autocorrelation. The cluster identifier is the id variable which controls for the autocorrelation of
the cumulative default value within each trust. Modifying the xtreg equation allowed us to
obtain Rogers standard errors. These standard errors are based on the work of Froot (1983) and
Rogers (1993) that shows the assumption of independently distributed residuals can be relaxed in
the event of autocorrelation within “clusters” (Hocehle)
Private Student Loan Asset Backed Securities: A Default Curve Analysis
Senior Capstone Project for Nicholas Gentile________________________________________
65
Section VI: Conclusion Results from this study indicate that the cumulative default curves for private SLABs are not a
result of a single determining factor; rather, its shape is determined by how the trust was
constructed and where it was originated on the economic cycle. The empirical results show that
a variety of underwriting variables are significant in determining the cumulative default level of
the trust. External economic conditions also impact defaults to a degree likely determined by the
underlying credit quality of the assets. By controlling for this array of factors, the final
multivariate model supports our initial hypothesis that latter vintage trusts performed worse
relative to their earlier counterparts due to a deterioration in underwriting standards.
This theory fits in with the overall mentality of capital markets during the time period leading up
to the financial crisis. The private student lending industry exhibited similar behavior to that of
other asset backed security spaces. While not as systemically crippling as the sub-prime
mortgage industry, poor quality SLABs were issued en masse in order to generate fee income
that drove the profitability of the issuers to the detriment of not only the investor, but of the
borrowers who found themselves in over their heads following graduation.
The results of this study could be expanded further by investigating the loan level data of the
studied pools. While a general understanding of the industry dynamics was gleamed from the
selected pool level data, individual loan information could depict a more accurate picture of
default drivers. For instance, we were surprised that the average loan outstanding per borrower
did not adversely impact defaults, but it could be that larger loans were made to theoretically
safer borrowers like medical students. These questions and more could be answered in a survival
analysis of individual private student loans.

Private Student Loan Asset Backed Securities: A Default Curve Analysis
Senior Capstone Project for Nicholas Gentile________________________________________
66
Appendices
Appendix I: Descriptive Statistics Variable Obs Mean Std. Dev. Min Max Descriptioncum_def 188 0.016 0.019 0.000 0.076 Cumulative Default Ratetbill 188 0.027 0.017 0.000 0.050 90-Day T-Bill Ratechange_tbill 188 0.003 0.023 -0.050 0.040 Change in T-Bill Since Originationunemployment 188 0.054 0.011 0.044 0.099 Unemployment Ratechange_u 188 0.001 0.013 -0.015 0.055 Change in Unemployment Since Originationgdp 188 0.019 0.027 -0.089 0.067 Real GDP Growthcpi_yoy 188 0.029 0.013 -0.015 0.054 CPI Change YoYobs 188 6.415 3.444 1.000 12.000 Seasoningt_bill_ 188 0.128 0.136 0.001 0.512 % Priced off T-Billfixed_ 144 0.001 0.002 0.000 0.008 % Priced w/ Fixed Rateprime_ 188 0.724 0.348 0.007 0.999 % Priced off Prime Rateno_of_borrowrs 188 156,251 236,729 29,157 104,834 Number of Borrowersav_out_per_brwr 188 13,138.19$ 1,797.74$ 10,999.00$ 17,971.00$ Average Prin. Per Borrowerno_of_loans 188 127,578 51,210 46,368 216,631 Number of Loanswa_rem_term 188 202.936 14.341 177 232 Remaing Term (m)wa_rate 188 0.067 0.022 0.042 0.108 Quoted Ratewa_t_spread 176 0.031 0.002 0.027 0.033 T-bill Spreadwa_p_spread 176 0.014 0.006 0.004 0.026 Prime Spreadwa_f_spread 132 0.088 0.020 0.060 0.109 Fixed Rateorig_fico 144 719.25 5.421 714 736 FICO at Originationorig_fico_sub_630 144 0.134 0.122 0.007 0.387 Sub-Prime or N/A at Originationcutoff_fico 144 706 5.051 696 712 FICO at Cut-offcutoff_fico_sub_630 144 0.095 0.017 0.069 0.130 Sub-Prime or N/A at Cut-offdeterioration 144 -0.018 0.007 -0.033 -0.007 FICO Changein_school 188 0.483 0.266 0.041 0.854 % In Schoolgrace 188 0.220 0.151 0.073 0.489 % in Gracedeferment 188 0.036 0.057 0.000 0.193 % in Defermentforbearance 188 0.031 0.022 0.002 0.091 % in Forberancerepayment 188 0.230 0.111 0.047 0.406 % in Repaymentpost_crisis 188 0.303 0.461 0 1 Dummy Variable (2007+)key 188 0.234 0.425 0 1 Dummy Variable (KeyCorp)ug_lag_4 188 0.691 0.128 0.466 0.867 % Undergrad Loansunder_2 188 0.061 0.076 0.000 0.285 % 2-Yr Loanslaw 188 0.110 0.060 0.035 0.221 % Law Loansmba 188 0.042 0.040 0.000 0.153 % MBA Loansmed 188 0.070 0.050 0.014 0.180 % Medical Loansyear 188 2004.064 1.621 2001 2007 Trust Year
Private Student Loan Asset Backed Securities: A Default Curve Analysis
Senior Capstone Project for Nicholas Gentile________________________________________
67
References Androitis, Anna Maria. "More Students Delay Repaying Loans." Market Watch. The Wall Street
Journal, 30 Jan. 2013. Web.
"As Student Loan Debt Surpasses $1 Trillion, Senators Introduce Legislation to Address Crisis." Press Releases. Sen. Dick Durbin, 23 Jan. 2013. Web.
Associated Press. "Sallie Mae Issues Weak Forecast as Profit Falls on Bad Loans." Moneynews. N.p., 25 Jan. 2013. Web.
Baker, Peter, and David M. Herszenhorn. "Obama Signs Overhaul of Student Loan Program." The New York Times. The New York Times, 31 Mar. 2010. Web.
Bartlett, Beth. Student Loan ABS 101. Rep. Nomura Fixed Income Research, 26 Jan. 2005. Web.
Bonner, Bill. "Student Loan Bubble Sets Up To Be Subprime Disaster Part Deux." Forbes. Forbes Magazine, 04 June 2012. Web.
Business Wire. "The Education Resources Institute (TERI) Files for Chapter 11 Bankruptcy Protection." Reuters, 7 Apr. 2008. Web.
Citibank N.A. Annual & Quarterly Reports, Investor Presentations. N.d.
College Board. Trends in Student Aid - 2011. Rep. N.p., 15 June 2011. Web.
Consumer Financial Protection Bureau. Private Student Loans. Rep. N.p., 29 Aug. 2012. Web.
Cunningham, Alisa F., and Gregory S. Kienzel, Ph.D. Delinquency: The Untold Story of Student Loan Borrowing. Rep. Institute for Higher Education Policy, Mar. 2011. Web.
"Deferment of Stafford Loans." Illinois Student Assistance Commission, 2013. Web.
Discover Corp. Annual & Quarterly Reports, Investor Presentations. N.d.
Edmiston, Kelly D., Lara Brooks, and Steven Shepelwich. Student Loans: Overview and Issues. Rep. Kansas City: Federal Reserve Bank of Kansas City, 2012. Web.
"Ensuring That Student Loans Are Affordable." Press Releases. The White House, n.d. Web.
Evans, Kelly. "Student-Loan Delinquencies Now Surpass Credit Cards." CNBC.com. NBC, 27 Nov. 2012. Web.
"FinAid | Loans | Student Loan Debt Clock." FinAid | Loans | Student Loan Debt Clock. FinAid, n.d. Web. 21 Apr. 2013.
First Marblehead Corp. Annual & Quarterly Reports, Investor Presentations. N.d.
Hamilton, Walter. "Student-loan Delinquency Rate Hits Danger Zone, Report Says." Los Angeles Times. Los Angeles Times, 30 Jan. 2013. Web.
Private Student Loan Asset Backed Securities: A Default Curve Analysis
Senior Capstone Project for Nicholas Gentile________________________________________
68
Hechinger, John, and Janet Lorin. "Student-Loan Default Rates Rise as Federal Scrutiny Grows." Bloomberg. N.p., 28 Sept. 2012. Web.
"Historical Interest Rates." FinAid | Loans | Historical Interest Rates. FinAid, 2013. Web.
Hoechle, David. "Robust Standard Errors for Panel Regressions with Cross-Sectional Dependence." The Stata Journal, n.d. Web.
Kamenshine, Wendy. "FY2012 Annual Report to the Director." Consumer Financial Protection Bureau, 15 Nov. 2012. Web.
KeyCorp. Annual & Quarterly Reports, Investor Presentations. N.d.
Kingkade, Tyler. "Moody's Analytics Warns Student Loans May Be The Next Financial Bubble To Burst." The Huffington Post. TheHuffingtonPost.com, 09 Aug. 2011. Web.
Lee, Stephanie, and Max Egan. Student Loans and Student Loan Asset-Backed Securities: A Primer. Rep. NERA Economic Consulting, 10 June 2009. Web.
Lewin, Tamar. "Education Department Report Shows More Borrowers Defaulting on Student Loans." The New York Times. The New York Times, 29 Sept. 2012. Web.
"Many Students Avoiding Payment of Loans by Filing for Bankruptcy." New York Times. New York Times, 21 Nov. 1976. Web.
McGarvey, Sharon, CFA, CPA, and Michael Nelson. "Correlation of FFELP Forbearance Rates and U.S. Unemployment Rat." U.S. Structured Finance Newsletter (10 Mar. 2008): n. pag. DBRS, 10 Mar. 2008. Web.
McIntyre, Douglas. "Student Loan Corporation to Be Sold in Complex Transaction." DailyFinance.com. N.p., 17 Sept. 2010. Web.
Methodist University. "Discover Student Loans - General Information." N.p., n.d. Web.
Michon, Kathleen, J.D. "Student Loans: Cancellation, Deferment, and Forbearance." Nolo.com. NOLO, n.d. Web.
Moody's Analytics. "Direct-to-Consumer Loans: Higher Risk." Moody's Global Credit Research, 2009. Web.
"More Than 25% Of Student Loans Are Already Delinquent..." Business Insider. N.p., 25 Mar. 2012. Web.
"More Than Half of Student Loans in Deferment: TransUnion." InsideARM. N.p., 31 Jan. 2013. Web.
Musto, David K. "Victimizing the Borrowers: Predatory Lending's Role in the Subprime Mortgage Crisis." Knowledge @ Wharton. University of Pennsylvania, 20 Feb. 2008. Web.

Private Student Loan Asset Backed Securities: A Default Curve Analysis
Senior Capstone Project for Nicholas Gentile________________________________________
69
Nelson, Michael. Correlation of FFELP Forbearance Rates and U.S. Unemployment Rate. Rep. DBRS, 10 Mar. 2008. Web.
New America Foundation. "Federal Student Loan Programs - History." Background & Analysis. N.p., 28 Mar. 2012. Web.
Northern Arizona University. "Understanding One Way ANOVA." Northern Arizona University, n.d. Web.
"Private Student Loan Market Share Analysis." 'Student Lending Analytics Blog' N.p., Aug. 2008. Web.
Reagan, Ronald. "Statement on Signing the Bankruptcy Amendments and Federal Judgeship Act of 1984." Statement on Signing the Bankruptcy Amendments and Federal Judgeship Act of 1984. University of Texas, 10 July 1984. Web.
Reagan, Ronald. "Statement on Signing the Bankruptcy Amendments and Federal Judgeship Act of 1984." University of Texas, 10 July 1984. Web. 21 Apr. 2013.
Rush, Adam. Young Minds, Big Debts: Student Loans at North Carolina's HBCUs. Rep. North Carolina Institute for Minority Economic Development, 19 June 2009. Web.
Sampson, Vincent. "The Ensuring Continued Access to Student Loans Act of 2008." IFAP - Dear Colleague Letter. Institution for Financial Aid Professionals, 19 June 2008. Web.
SIFMA. "ABS Outstanding 2012." SIFMA, 2 Oct. 2012. Web.
SLC Corp. Annual & Quarterly Reports, Investor Presentations. N.d.
SLM Copr. Annual & Quarterly Reports, Investor Presentations. N.d.
"Statement on Signing the Bankruptcy Amendments and Federal Judgeship Act of 1984." N.p., n.d. Web. 21 Apr. 2013.
Thomas, Barbara. Private Student Loan Issuance in 2011. Rep. National Council of Higher Education Resources, May 2012. Web.
Touhey, Martin, Richard Altham, Nick Tilston, and Larry Bonifant. Private Student Loans. Rep. PricewaterhouseCoopers LLP, July 2012. Web.
United States. Cong. Higher Education Act of 1965. 89th Cong. Cong. Bill. N.p., 27 Jan. 1999. Web.
United States. Department of Education. 2012 Budget Request. N.p., 14 Feb. 2011. Web.
United States. Department of the Treasury. Lessons Learned from the Privatization of Sallie Mae. Department of the Treasury, Mar. 206. Web.
United States. General Accounting Office. Secondary Market Activities of the Student Loan Marking Association. General Accounting Office, 18 May 1984. Web.
Private Student Loan Asset Backed Securities: A Default Curve Analysis
Senior Capstone Project for Nicholas Gentile________________________________________
70
United States. Securities and Exchange Commission. Corporate Finance Division. Rule 415. Securities and Exchange Commission, n.d. Web.
United States. Securities and Exchange Commission. Re-proposal of Shelf Eligibility Conditions for Asset-Backed Securities and Other Additional Requests for Comment. By Elizabeth M. Murphy. Securities and Exchange Commission, 26 July 2011. Web.
"What's the Difference between Subsidized and Unsubsidized Loans?" Stafford Loan. Edvisors, 2013. Web.
While, Martha C. "Student Loan Debt Crisis: How’d We Get Here and What Happens Next?" Time. Time Magazine, 4 Feb. 2013. Web.
Woo, Jennie H. The Expansion of Private Loans in Postsecondary Education. Rep. Ed. Thomas Weko. National Center for Education Statistics, Oct. 2011. Web.
Yen, Hope. "Half of New Grads Are Jobless or Underemployed." Msnbc.com. NBC, 24 Apr. 2012. Web.