Principles of Sustainability Daniel M. Kammen - California ...
35
Renewable and Appropriate Energy Laboratory - rael.berkeley.edu Principles of Sustainability Daniel M. Kammen Co-Director, Berkeley Institute of the Environment Energy and Resources Group & Goldman School of Public Policy Department of Nuclear Engineering University of California, Berkeley Materials online at: http://rael.berkeley.edu Joint Forum on Bioenergy Sustainability and Lifecycle Analysis Sacramento Convention Center, May 28, 2008
-
Upload
khangminh22 -
Category
Documents
-
view
0 -
download
0
Transcript of Principles of Sustainability Daniel M. Kammen - California ...
Renewable and Appropriate Energy Laboratory - rael.berkeley.edu
Principles of Sustainability
Daniel M. Kammen
Co-Director, Berkeley Institute of the EnvironmentEnergy and Resources Group & Goldman School of Public Policy
Department of Nuclear EngineeringUniversity of California, Berkeley
Materials online at: http://rael.berkeley.edu
Joint Forum on Bioenergy Sustainability and Lifecycle AnalysisSacramento Convention Center, May 28, 2008
Renewable and Appropriate Energy Laboratory - rael.berkeley.edu22
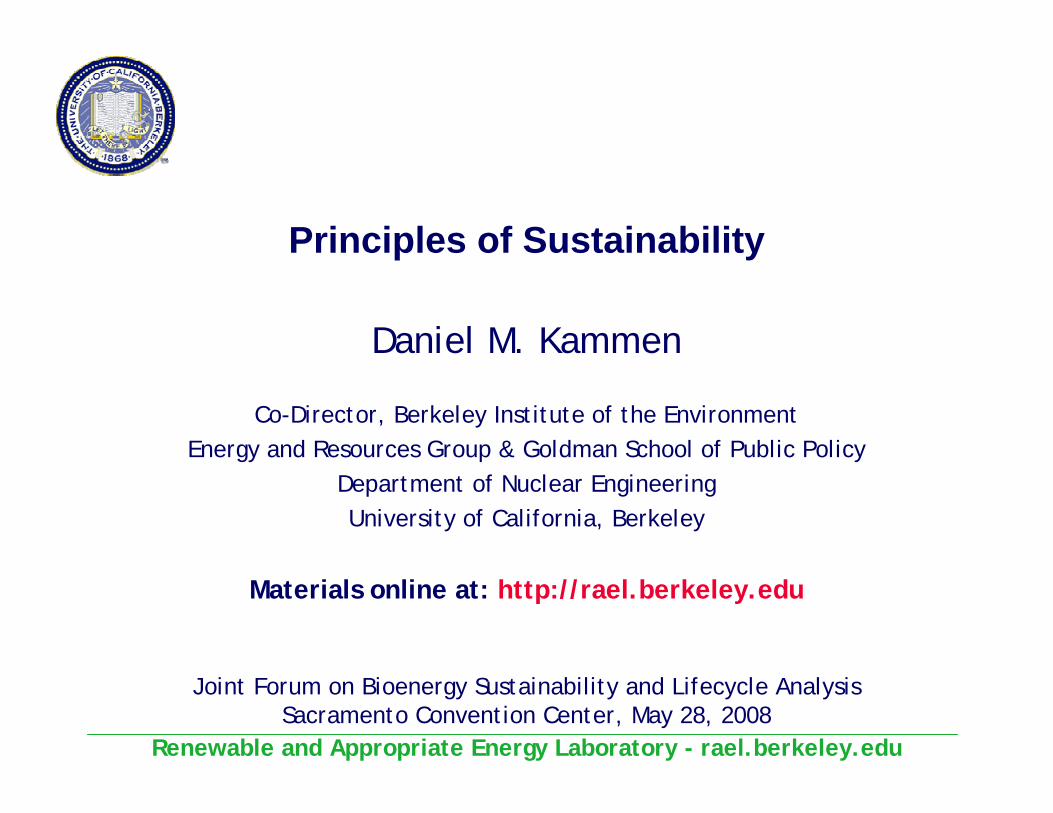
UC Berkeley: Collaborations:
Naïm Dargouth (food/fuels, Africa) UC Davis
Kevin Fingerman (water) Purdue University
Andy Jones (LCFS) USP (Brazil)
Derek Lemoine (PHEVs) ICIPE (Kenya)
Michael O’Hare (LCFS)
Richard Plevin (LCFS)
Deepak Rajgopal (multipurpose crops, India)
Sabrina Spatari (methods)
Margaret Torn (biogeochemistry) Alex Farrell
Sustainable Fuel LCA Research Team
Renewable and Appropriate Energy Laboratory - rael.berkeley.edu
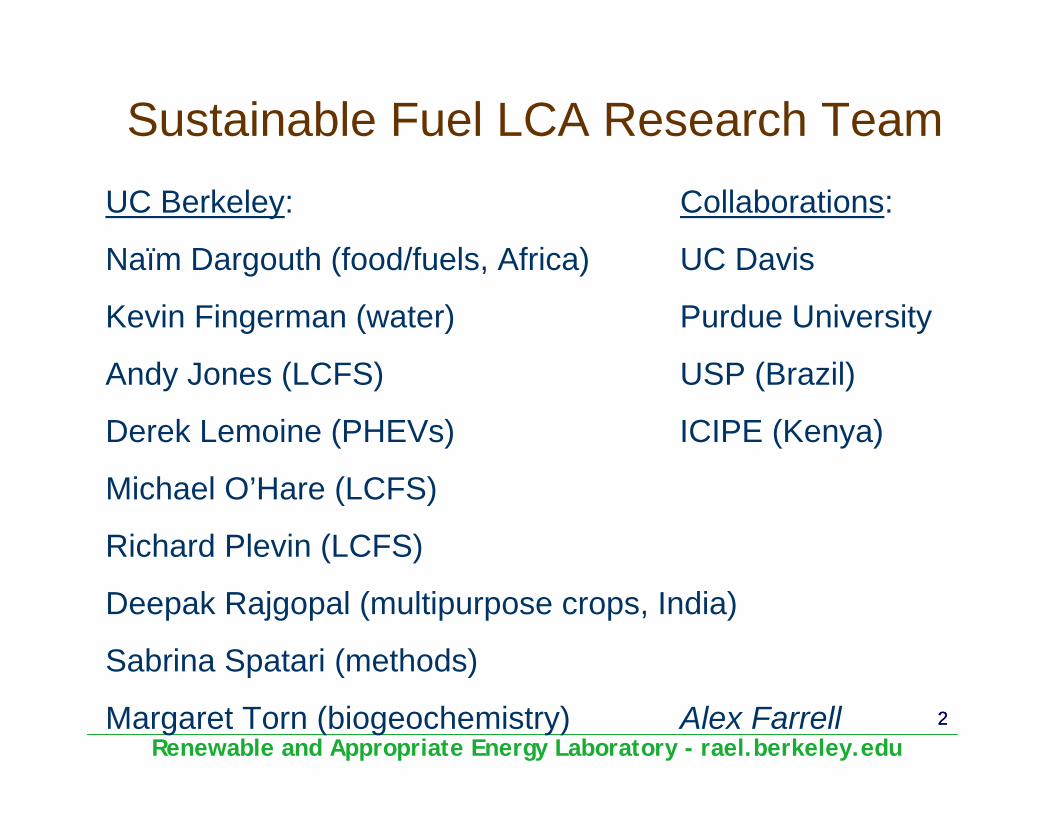
High & low carbon pathways
0
2
4
6
8
10
12
14
16
2000 2010 2020 2040 2050
Glo
bal C
arbo
n Em
issi
ons,
GT
2030
WRE 450 (IPCC)
WRE 550 (IPCC)
WRE 1000 (IPCC)
Theoretical carbon emissions profiles published in IPCC 3rd
Assessment Report
Theoretical carbon emissions profiles published in IPCC 3rd
Assessment Report
2002 IEA reported fossil emissions plus correction for unsustainable biomass & deforestation.
2002 IEA reported fossil emissions plus correction for unsustainable biomass & deforestation.
>900 ppm TrajectoryEnergy by 2050:• Coal over 2x, no Carbon
Capture & Storage (CCS), some coal to liquids.
• Oil up 50%• Gas over 2x• Biofuels make up 10% of
vehicle fuel mix.• Electricity 1/3 of final energy.• Modest increase in nuclear.• Renewables provide 1/3 of
electricity generation.• Vehicle efficiency up 50%.
<550 ppm TrajectoryEnergy by 2050:• Coal up 50%, but half of
power stations use CCS.• Oil down 10-15%.• Gas nearly 2-3x (note: adds
volatility)• Green Hydrogen in use• Strong shift to electricity as
final energy (~50% final energy).
• Large increase in nuclear.• Renewables provide half of
electricity generation.• Vehicle efficiency up 100%• Sustainable biomass
practices
WRE1000 - we start planning nowWRE 550 - we start acting nowWRE 450 - we started to act in 2000, or …
Renewable and Appropriate Energy Laboratory - rael.berkeley.edu
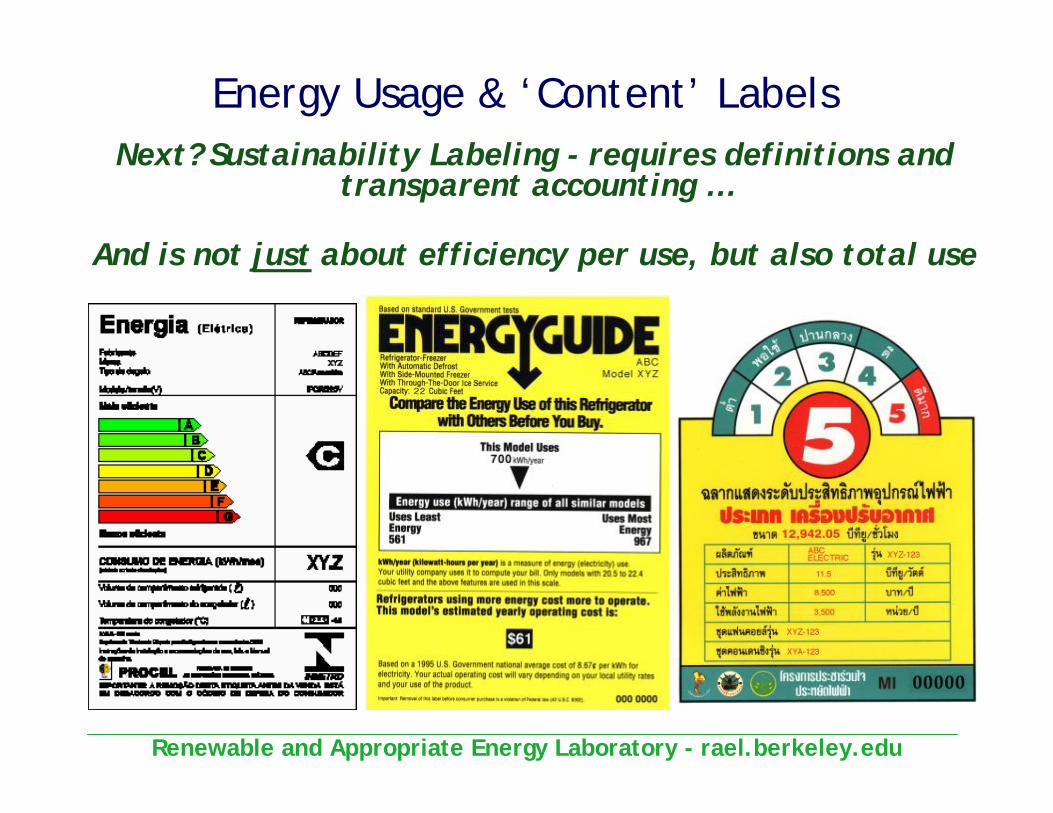
Energy Usage & ‘Content’ LabelsNext? Sustainability Labeling - requires definitions and
transparent accounting …
And is not just about efficiency per use, but also total use
Renewable and Appropriate Energy Laboratory - rael.berkeley.edu5
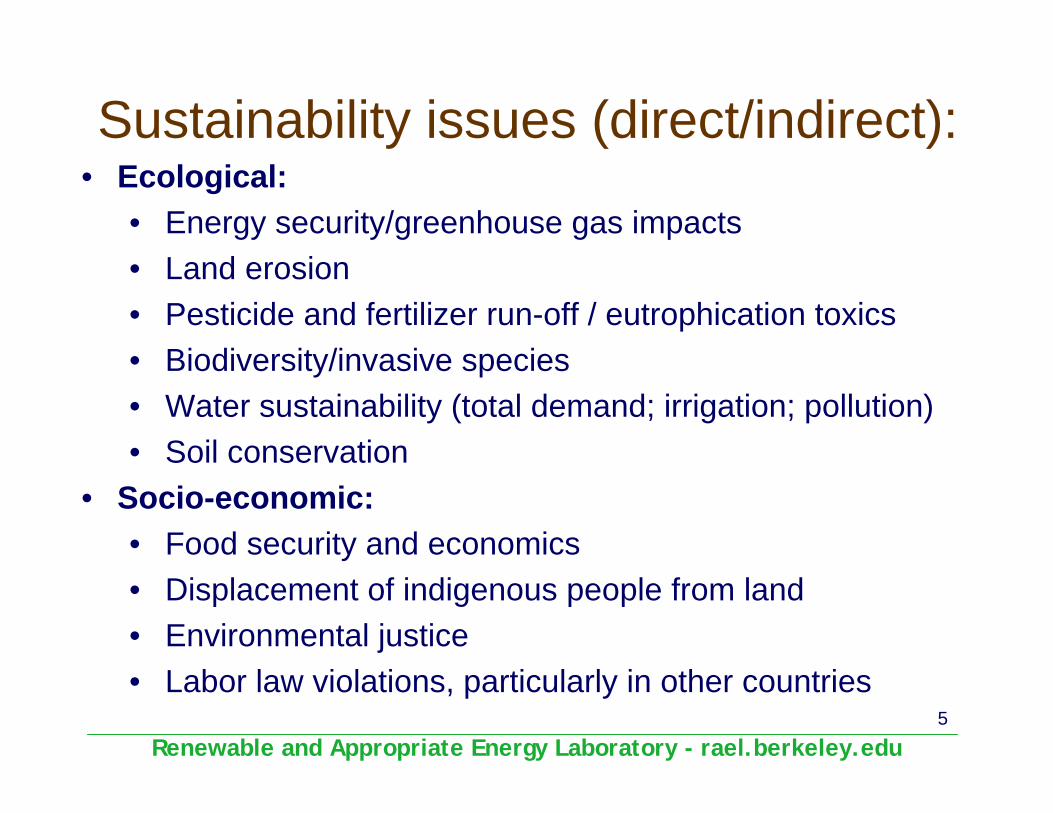
Sustainability issues (direct/indirect):• Ecological:
• Energy security/greenhouse gas impacts• Land erosion• Pesticide and fertilizer run-off / eutrophication toxics• Biodiversity/invasive species• Water sustainability (total demand; irrigation; pollution)• Soil conservation
• Socio-economic:• Food security and economics• Displacement of indigenous people from land• Environmental justice• Labor law violations, particularly in other countries
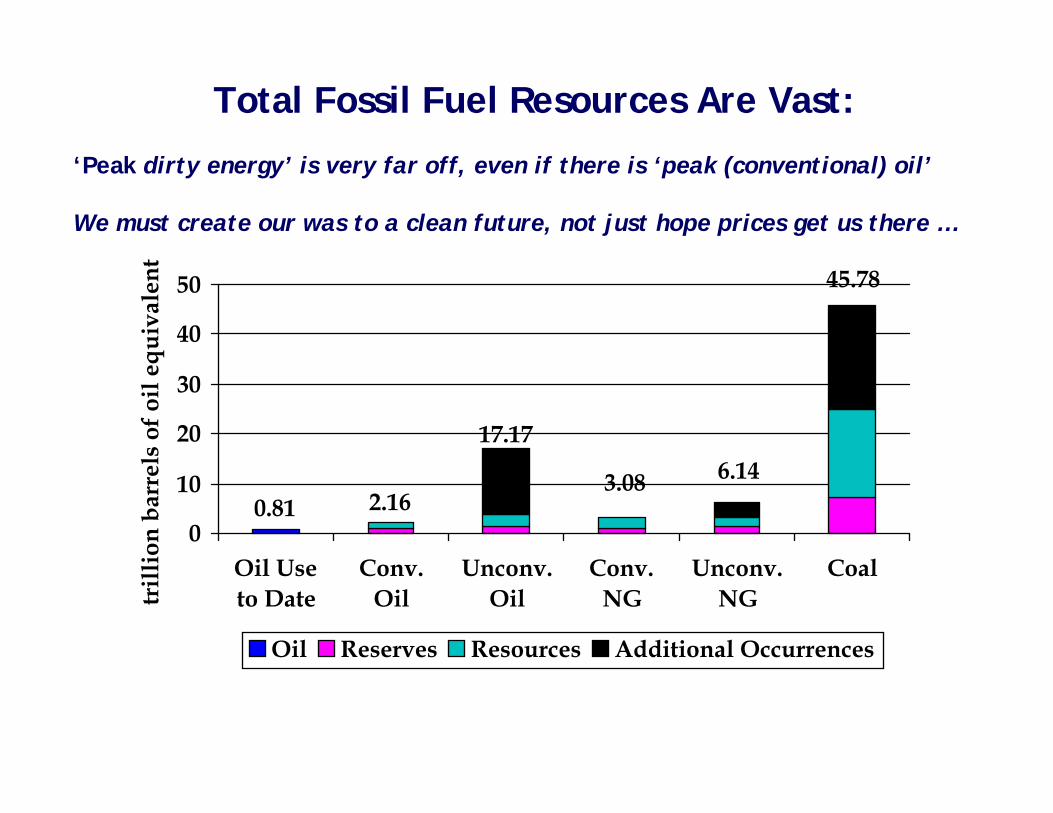
Total Fossil Fuel Resources Are Vast:
‘Peak dirty energy’ is very far off, even if there is ‘peak (conventional) oil’
We must create our was to a clean future, not just hope prices get us there …
0.810
10
20
30
40
50
Oil Useto Date
Conv.Oil
Unconv.Oil
Conv.NG
Unconv.NG
Coal
trill
ion
barr
els
of o
il eq
uiva
lent
Oil Reserves Resources Additional Occurrences
2.16
17.17
45.78
6.143.08
Renewable and Appropriate Energy Laboratory - rael.berkeley.edu
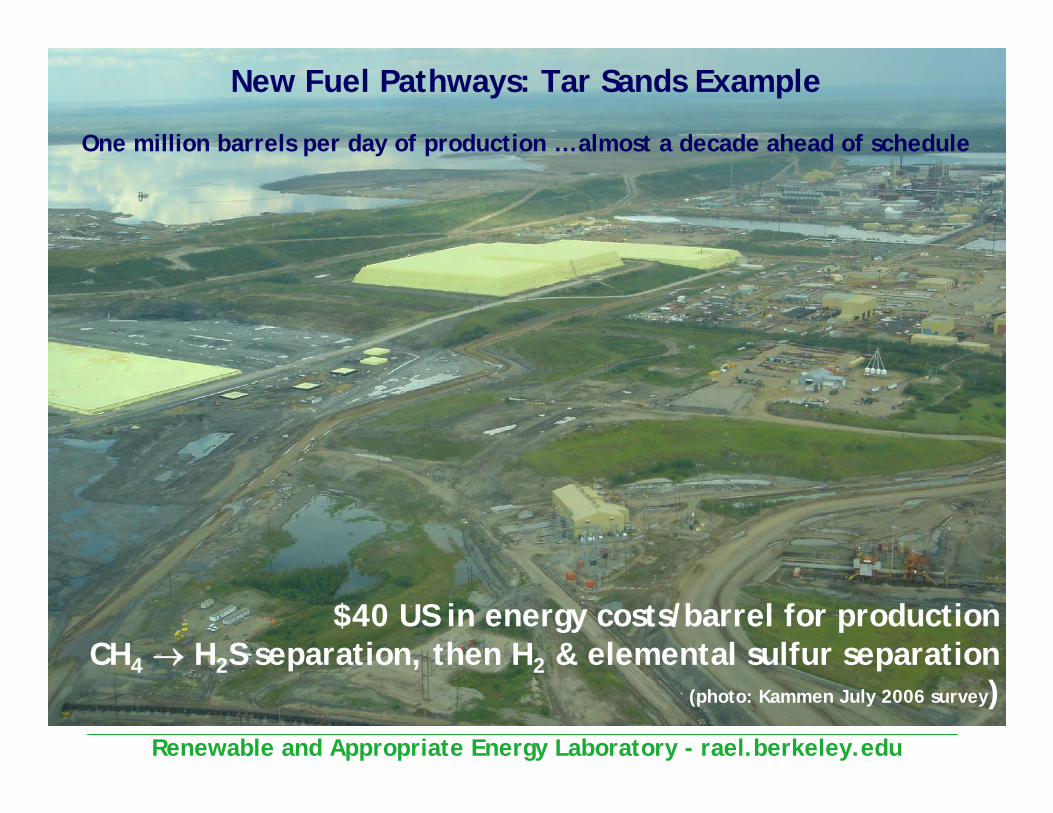
$40 US in energy costs/barrel for productionCH4 → H2S separation, then H2 & elemental sulfur separation
(photo: Kammen July 2006 survey)
New Fuel Pathways: Tar Sands Example
One million barrels per day of production … almost a decade ahead of schedule
Renewable and Appropriate Energy Laboratory - rael.berkeley.edu
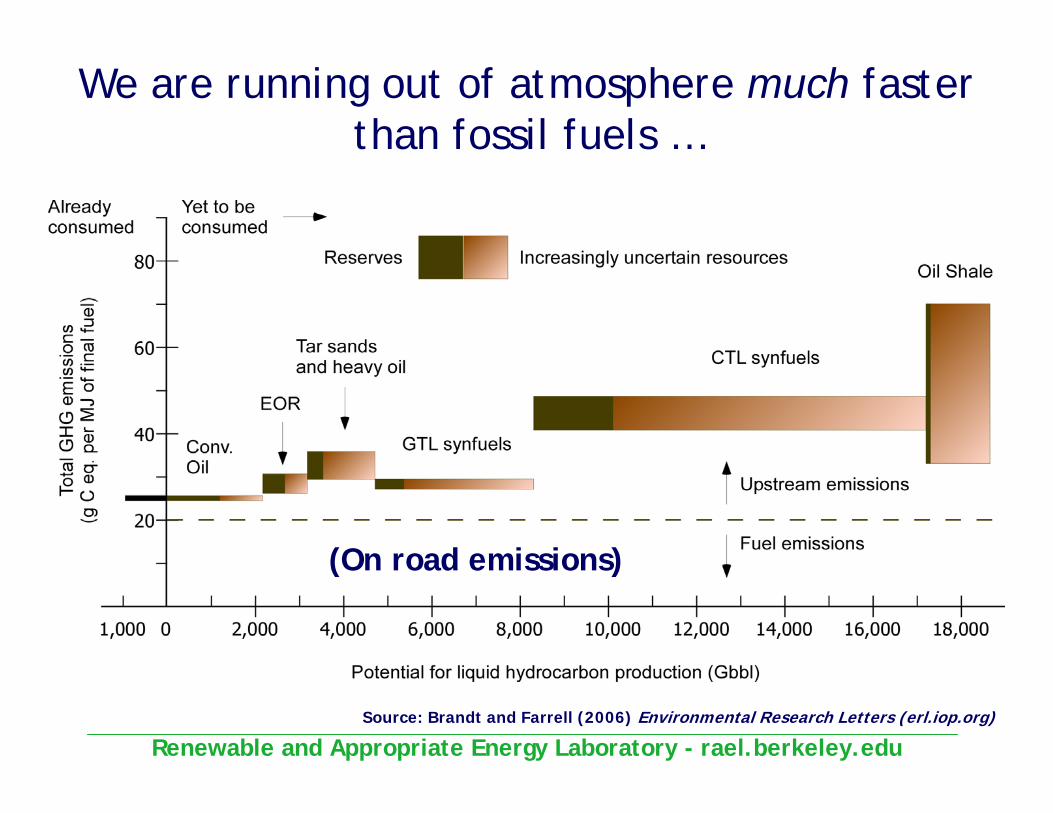
We are running out of atmosphere much faster than fossil fuels …
Source: Brandt and Farrell (2006) Environmental Research Letters (erl.iop.org)
(On road emissions)
Energy Biosciences Institute
University of California, BerkeleyLawrence Berkeley National Laboratory
University of Illinois at Urbana-Champaign
A $500 million biofuel development grant from BPDM Kammen, primary author & Executive Committee
Renewable and Appropriate Energy Laboratory - rael.berkeley.edu
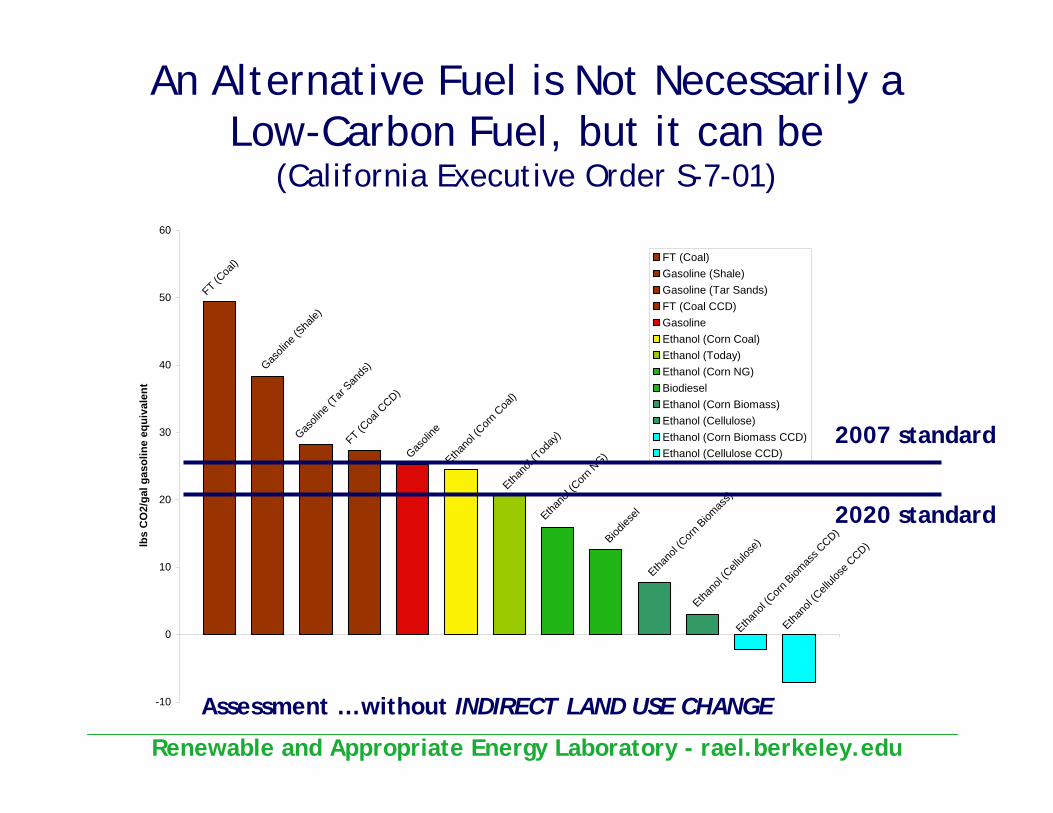
An Alternative Fuel is Not Necessarily a Low-Carbon Fuel, but it can be
(California Executive Order S-7-01)
FT (Coa
l)
Gasoli
ne (S
hale)
Gasoli
ne (T
ar San
ds)
FT (Coa
l CCD)
Gasoli
neEtha
nol (C
orn C
oal)
Ethano
l (Tod
ay)
Ethano
l (Corn
NG)
Biodies
elEtha
nol (C
orn Biom
ass)
Ethano
l (Cell
ulose
)
Ethano
l (Corn
Biomas
s CCD)
Ethano
l (Cell
ulose
CCD)
-10
0
10
20
30
40
50
60
1
lbs
CO
2/ga
l gas
olin
e eq
uiva
lent
FT (Coal)Gasoline (Shale)Gasoline (Tar Sands)FT (Coal CCD)GasolineEthanol (Corn Coal)Ethanol (Today)Ethanol (Corn NG)BiodieselEthanol (Corn Biomass)Ethanol (Cellulose)Ethanol (Corn Biomass CCD)Ethanol (Cellulose CCD)
2007 standard
2020 standard
Assessment … without INDIRECT LAND USE CHANGE
Renewable and Appropriate Energy Laboratory - rael.berkeley.edu
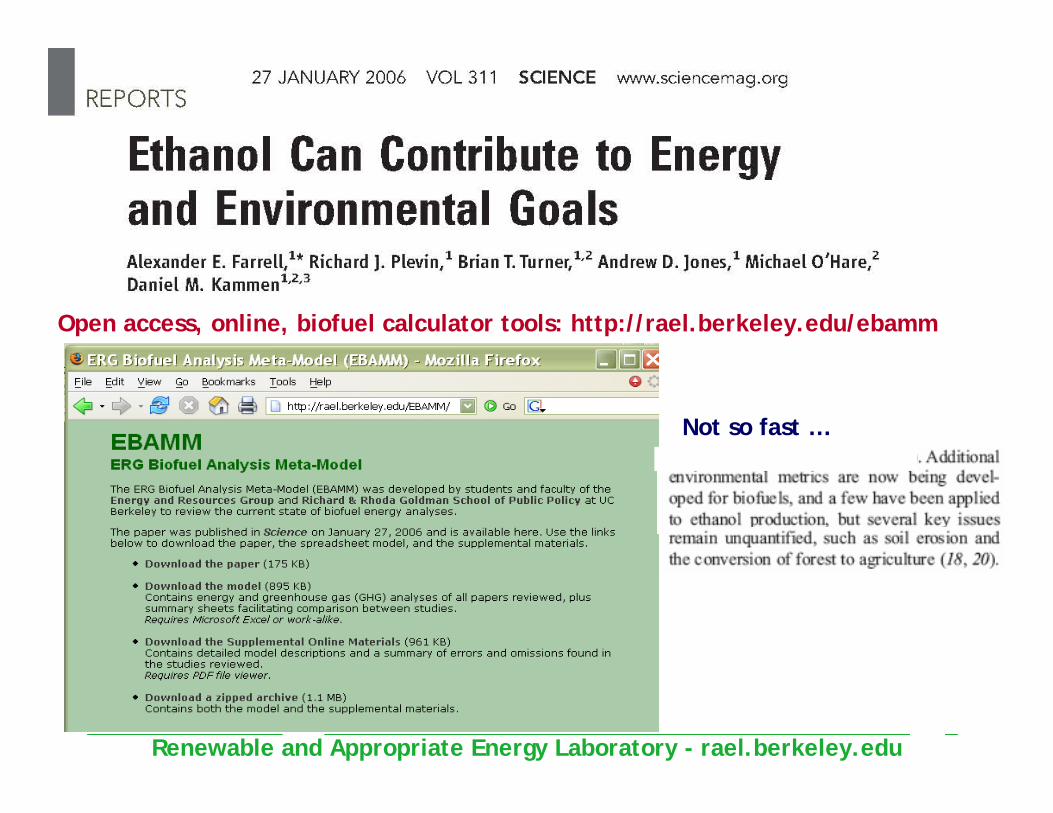
Open access, online, biofuel calculator tools: http://rael.berkeley.edu/ebamm
Not so fast …
Renewable and Appropriate Energy Laboratory - rael.berkeley.edu
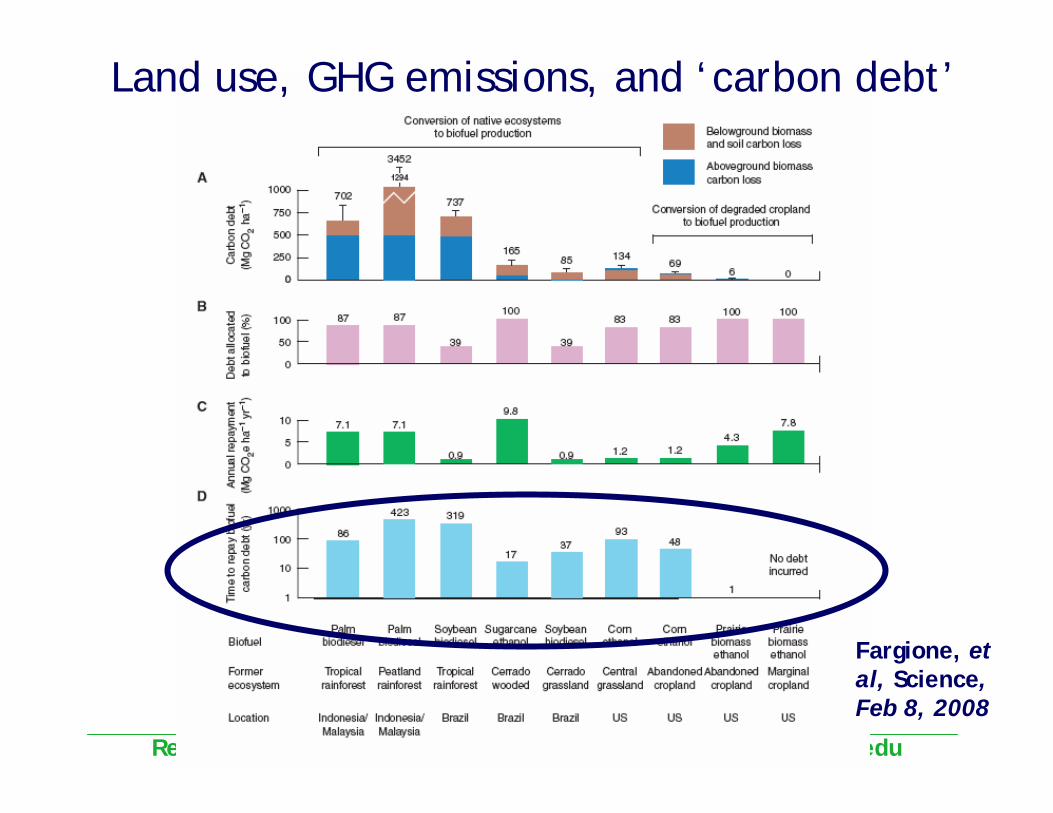
Land use, GHG emissions, and ‘carbon debt’
Fargione, et al, Science, Feb 8, 2008
Renewable and Appropriate Energy Laboratory - rael.berkeley.edu
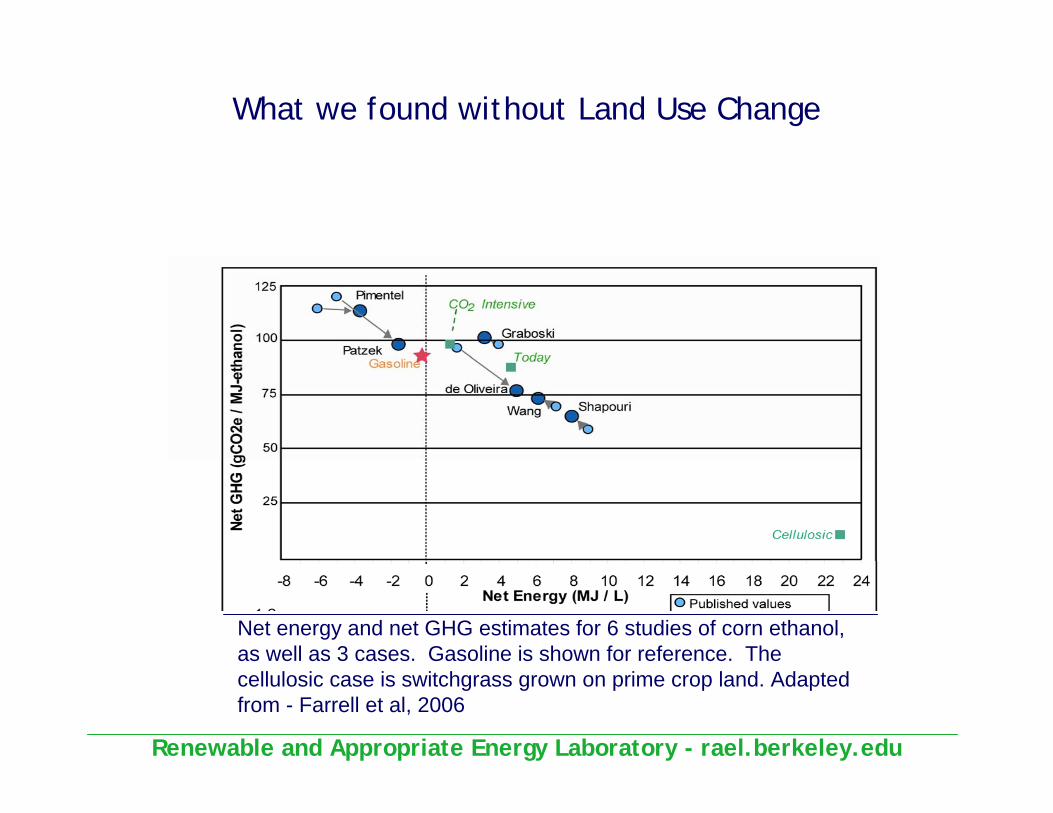
Net energy and net GHG estimates for 6 studies of corn ethanol, as well as 3 cases. Gasoline is shown for reference. The cellulosic case is switchgrass grown on prime crop land. Adaptedfrom - Farrell et al, 2006
What we found without Land Use Change
Renewable and Appropriate Energy Laboratory - rael.berkeley.edu
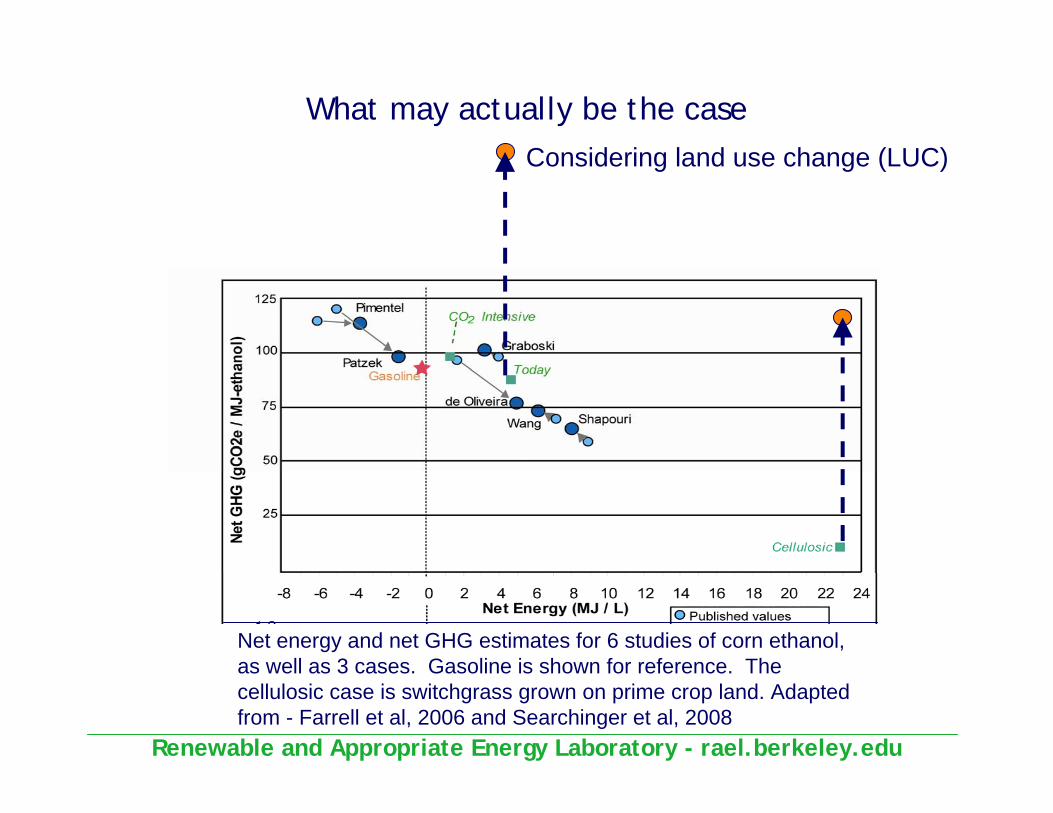
Considering land use change (LUC)
Net energy and net GHG estimates for 6 studies of corn ethanol, as well as 3 cases. Gasoline is shown for reference. The cellulosic case is switchgrass grown on prime crop land. Adaptedfrom - Farrell et al, 2006 and Searchinger et al, 2008
What may actually be the case
Renewable and Appropriate Energy Laboratory - rael.berkeley.edu
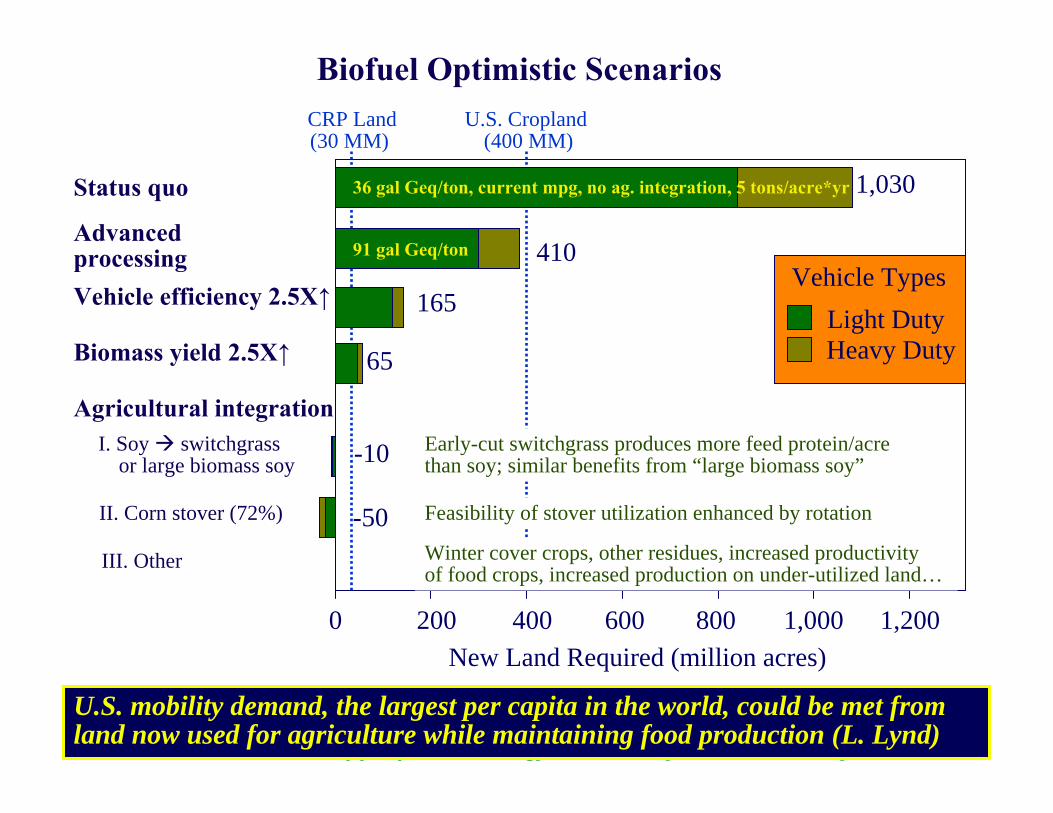
Biofuel Optimistic Scenarios
1,200600200 400 800 1,0000New Land Required (million acres)
CRP Land (30 MM)
Light DutyHeavy Duty
U.S. Cropland (400 MM)
II. Corn stover (72%) -50 Feasibility of stover utilization enhanced by rotation
I. Soy switchgrass or large biomass soy -10
Agricultural integrationEarly-cut switchgrass produces more feed protein/acrethan soy; similar benefits from “large biomass soy”
Vehicle efficiency 2.5X↑ 165
Advanced processing 41091 gal Geq/ton
1,030Status quo 36 gal Geq/ton, current mpg, no ag. integration, 5 tons/acre*yr
Biomass yield 2.5X↑ 65
III. Other Winter cover crops, other residues, increased productivityof food crops, increased production on under-utilized land…
U.S. mobility demand, the largest per capita in the world, could be met from land now used for agriculture while maintaining food production (L. Lynd)
Vehicle Types
Renewable and Appropriate Energy Laboratory - rael.berkeley.edu
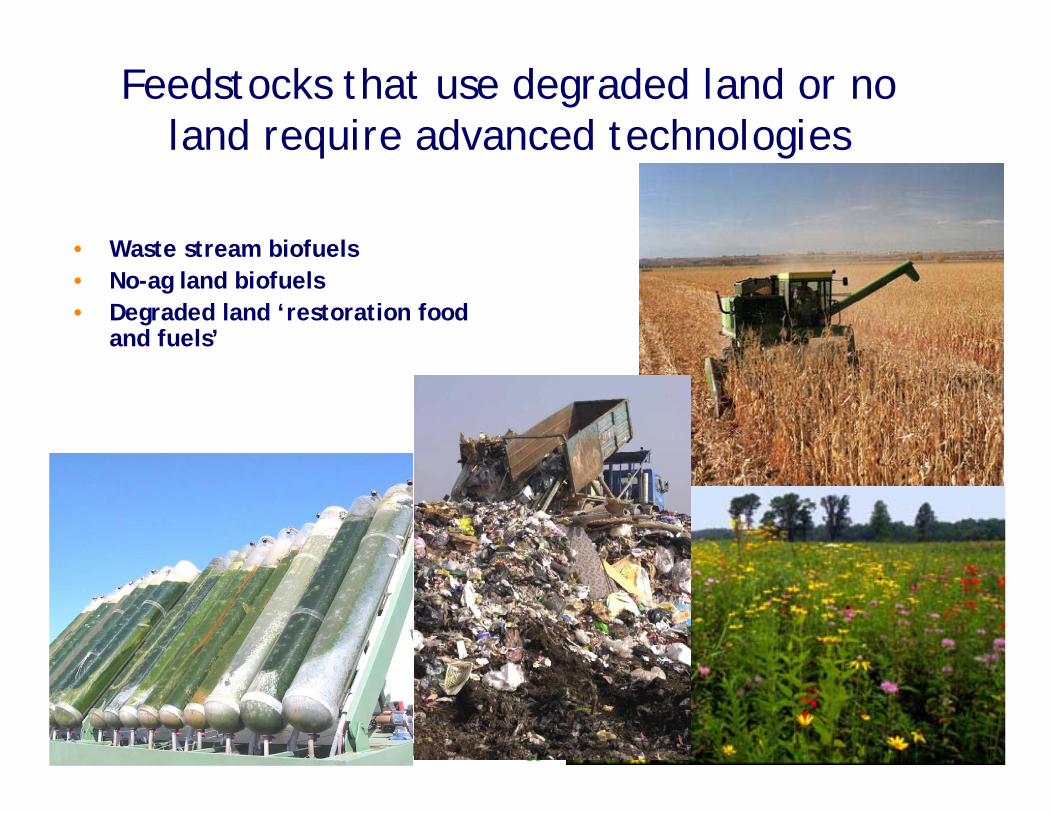
Feedstocks that use degraded land or no land require advanced technologies
• Waste stream biofuels• No-ag land biofuels• Degraded land ‘restoration food
and fuels’
QuickTime™ and a decompressor
are needed to see this picture.
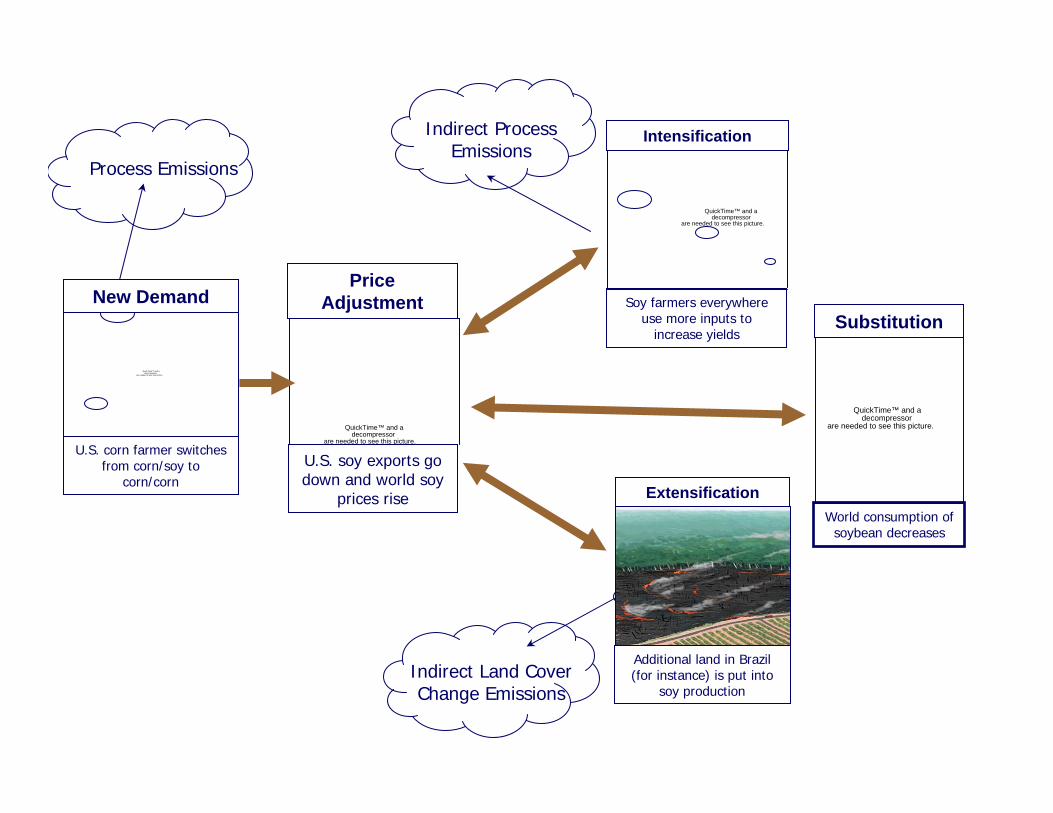
U.S. soy exports go down and world soy
prices rise
Price Adjustment
Process Emissions
Indirect Process Emissions
Indirect Land Cover Change Emissions
Soy farmers everywhere use more inputs to
increase yields
QuickTime™ and a decompressor
are needed to see this picture.
Intensification
World consumption of soybean decreases
QuickTime™ and a decompressor
are needed to see this picture.
Substitution
Additional land in Brazil (for instance) is put into
soy production
Extensification
U.S. corn farmer switches from corn/soy to
corn/corn
QuickTime™ and a decompressor
are needed to see this picture.
New Demand
Renewable and Appropriate Energy Laboratory - rael.berkeley.edu
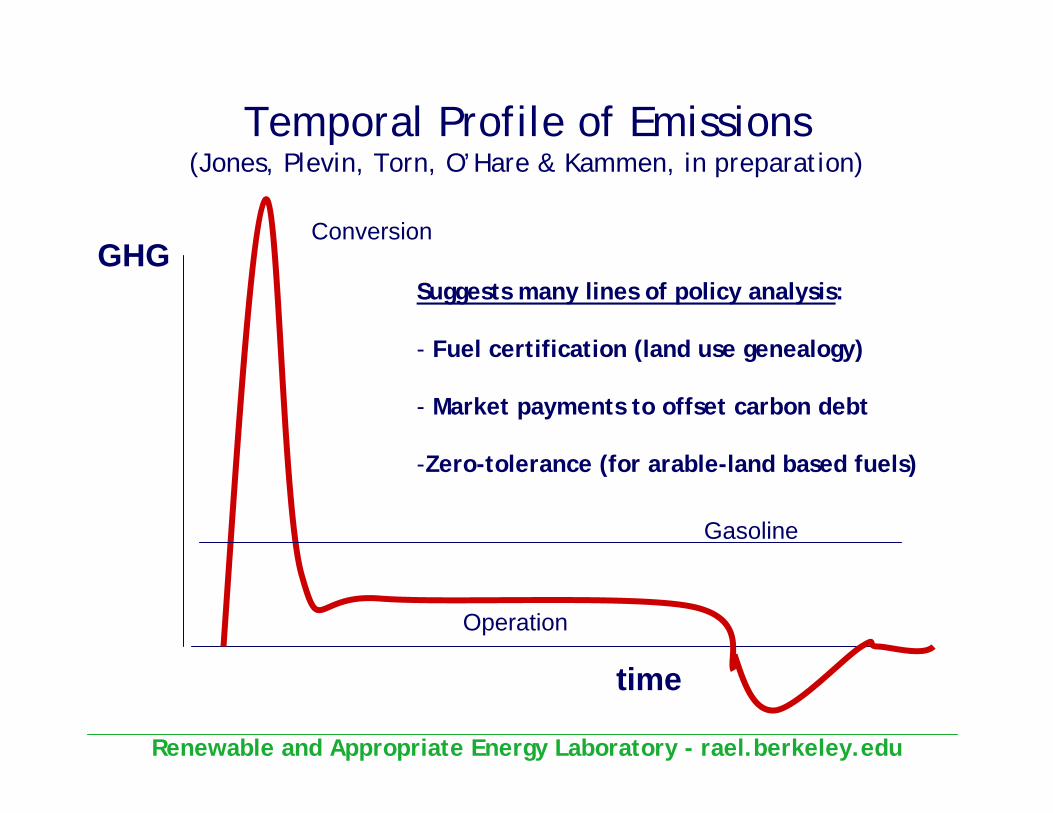
Temporal Profile of Emissions(Jones, Plevin, Torn, O’Hare & Kammen, in preparation)
time
GHGConversion
Operation
Gasoline
Suggests many lines of policy analysis:
- Fuel certification (land use genealogy)
- Market payments to offset carbon debt
-Zero-tolerance (for arable-land based fuels)
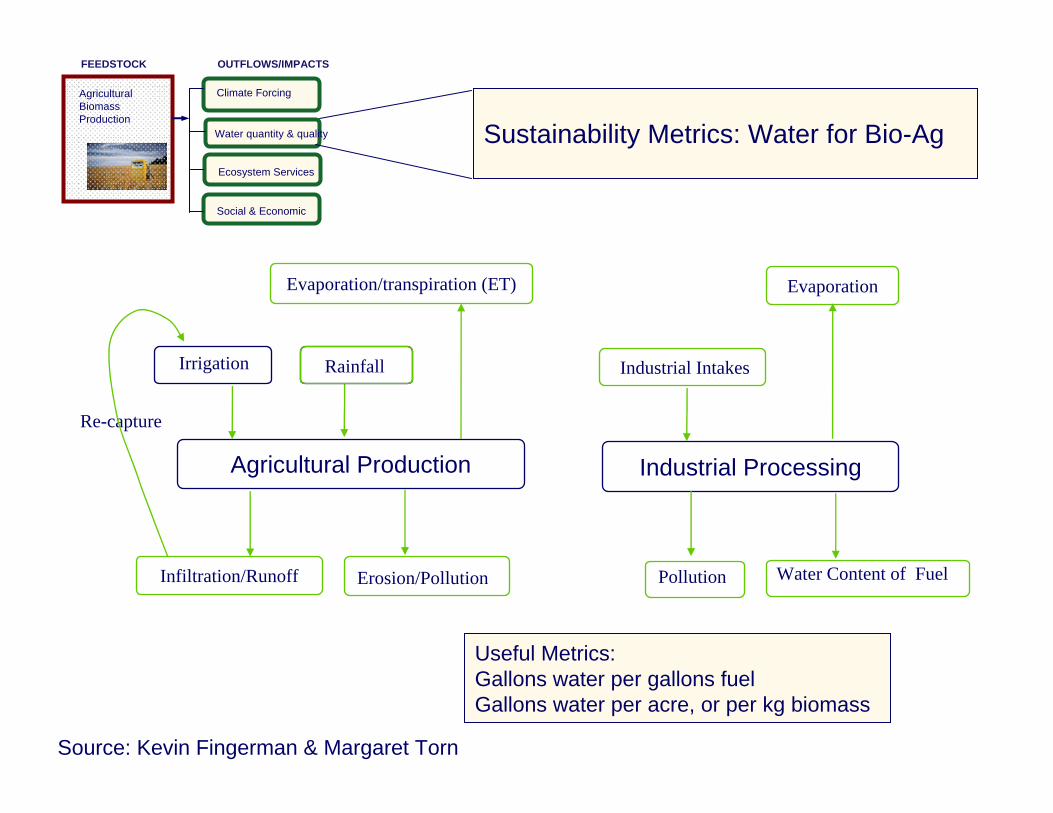
Infiltration/Runoff
Evaporation/transpiration (ET)
Agricultural Production
RainfallIrrigation
Re-capture
Erosion/Pollution Pollution
Industrial Processing
Evaporation
Industrial Intakes
Water Content of Fuel
Sustainability Metrics: Water for Bio-Ag
OUTFLOWS/IMPACTS
Water quantity & quality
Social & Economic
Ecosystem Services
Climate ForcingAgriculturalBiomass Production
FEEDSTOCK
Source: Kevin Fingerman & Margaret Torn
Useful Metrics:Gallons water per gallons fuelGallons water per acre, or per kg biomass
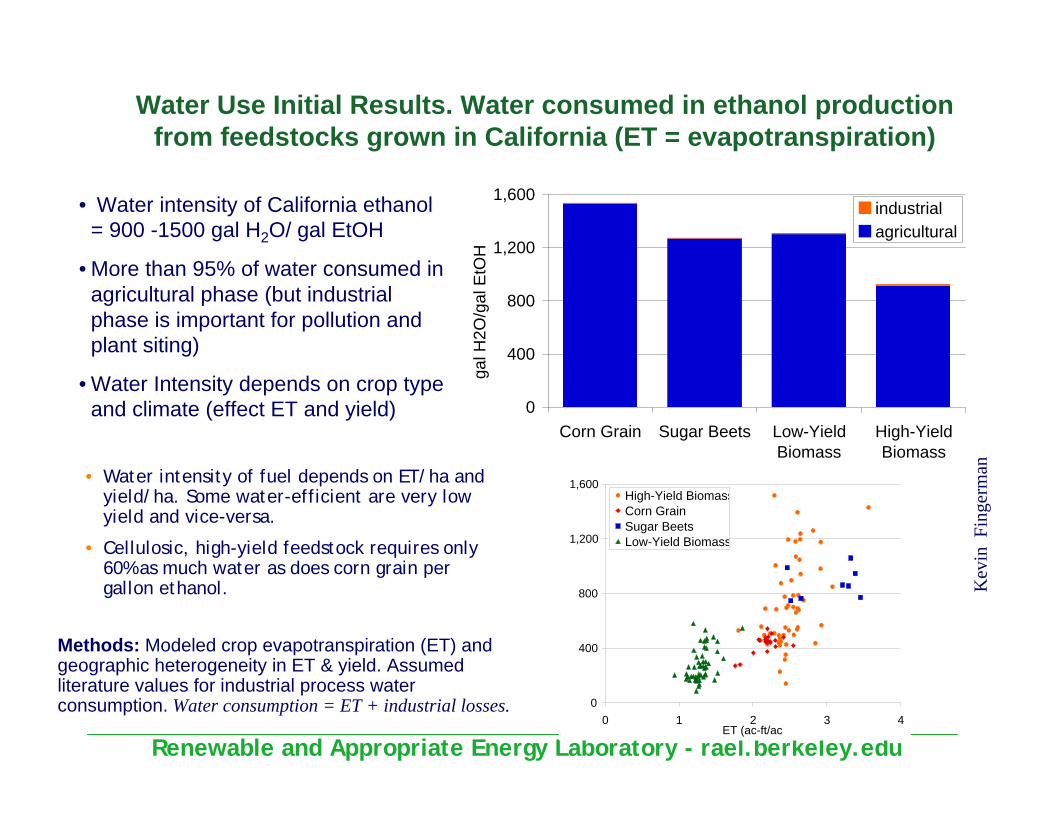
Renewable and Appropriate Energy Laboratory - rael.berkeley.edu
0
400
800
1,200
1,600
Corn Grain Sugar Beets Low-YieldBiomass
High-YieldBiomass
gal H
2O/g
al E
tOH
industrialagricultural
Water Use Initial Results. Water consumed in ethanol production from feedstocks grown in California (ET = evapotranspiration)
• Water intensity of California ethanol = 900 -1500 gal H2O/ gal EtOH
• More than 95% of water consumed in agricultural phase (but industrial phase is important for pollution and plant siting)
• Water Intensity depends on crop type and climate (effect ET and yield)
Methods: Modeled crop evapotranspiration (ET) and geographic heterogeneity in ET & yield. Assumed literature values for industrial process water consumption. Water consumption = ET + industrial losses.
Kev
in F
inge
rman
0
400
800
1,200
1,600
0 1 2 3 4ET (ac-ft/ac)
High-Yield BiomassCorn GrainSugar BeetsLow-Yield Biomass
• Water intensity of fuel depends on ET/ha and yield/ha. Some water-efficient are very low yield and vice-versa.
• Cellulosic, high-yield feedstock requires only 60% as much water as does corn grain per gallon ethanol.
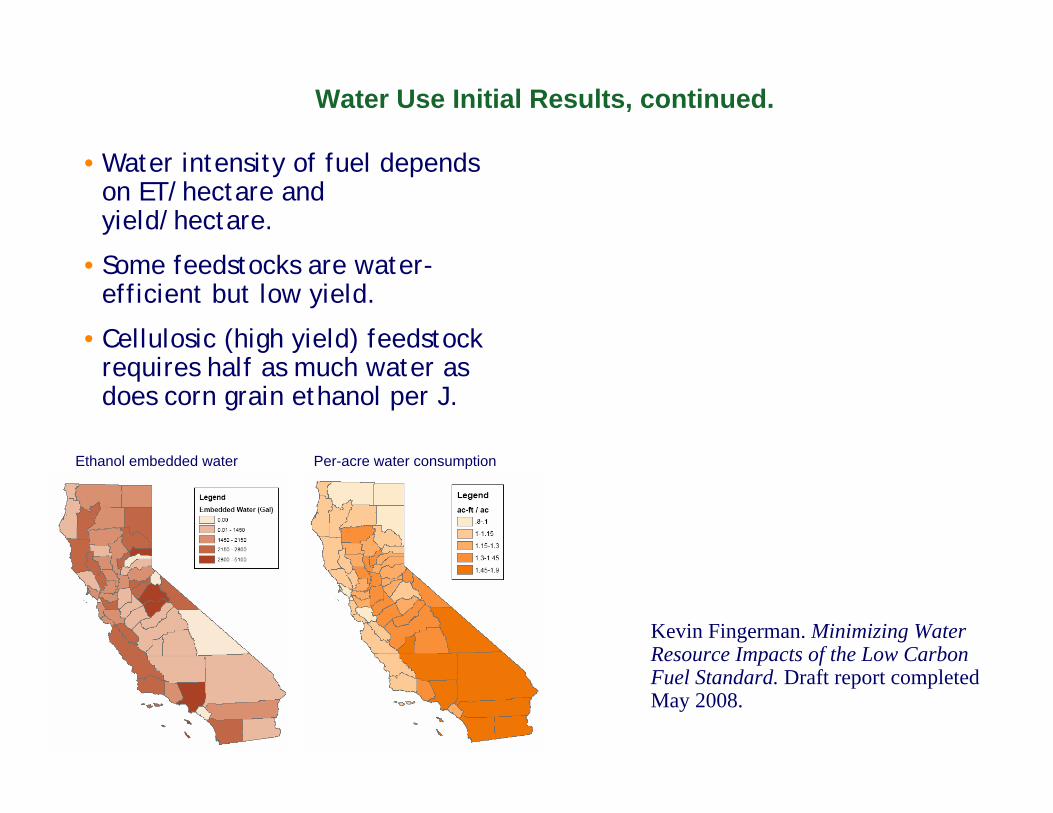
Ethanol embedded water Per-acre water consumption
•Water intensity of fuel depends on ET/hectare and yield/hectare.
• Some feedstocks are water-efficient but low yield.
•Cellulosic (high yield) feedstock requires half as much water as does corn grain ethanol per J.
Kevin Fingerman. Minimizing Water Resource Impacts of the Low Carbon Fuel Standard. Draft report completed May 2008.
Water Use Initial Results, continued.
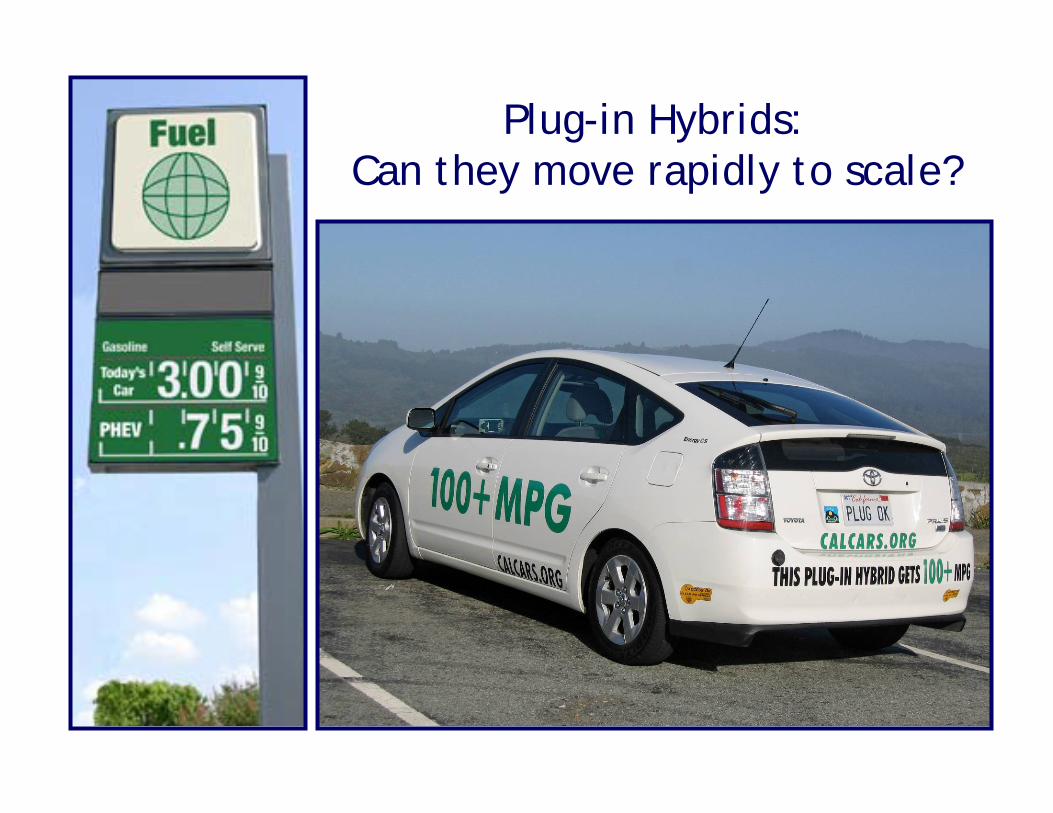
Plug-in Hybrids: Can they move rapidly to scale?
Renewable and Appropriate Energy Laboratory - rael.berkeley.edu
d) Twice per day PHEV SUV charging
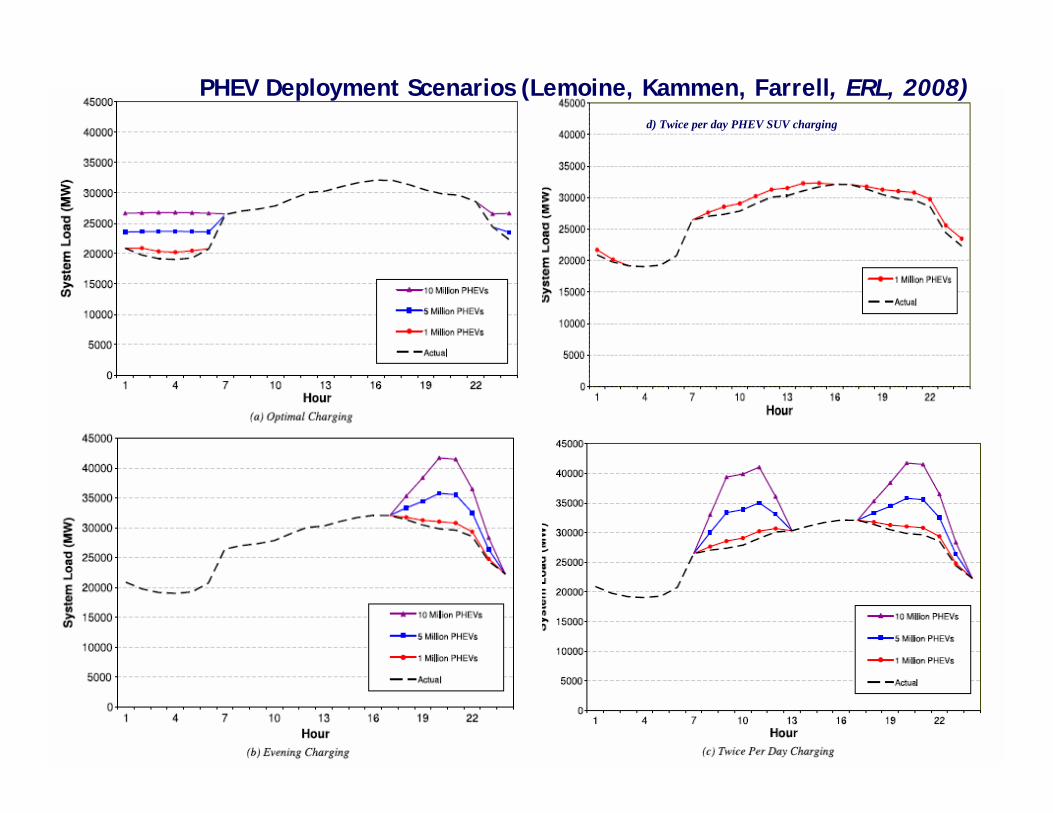
PHEV Deployment Scenarios (Lemoine, Kammen, Farrell, ERL, 2008)
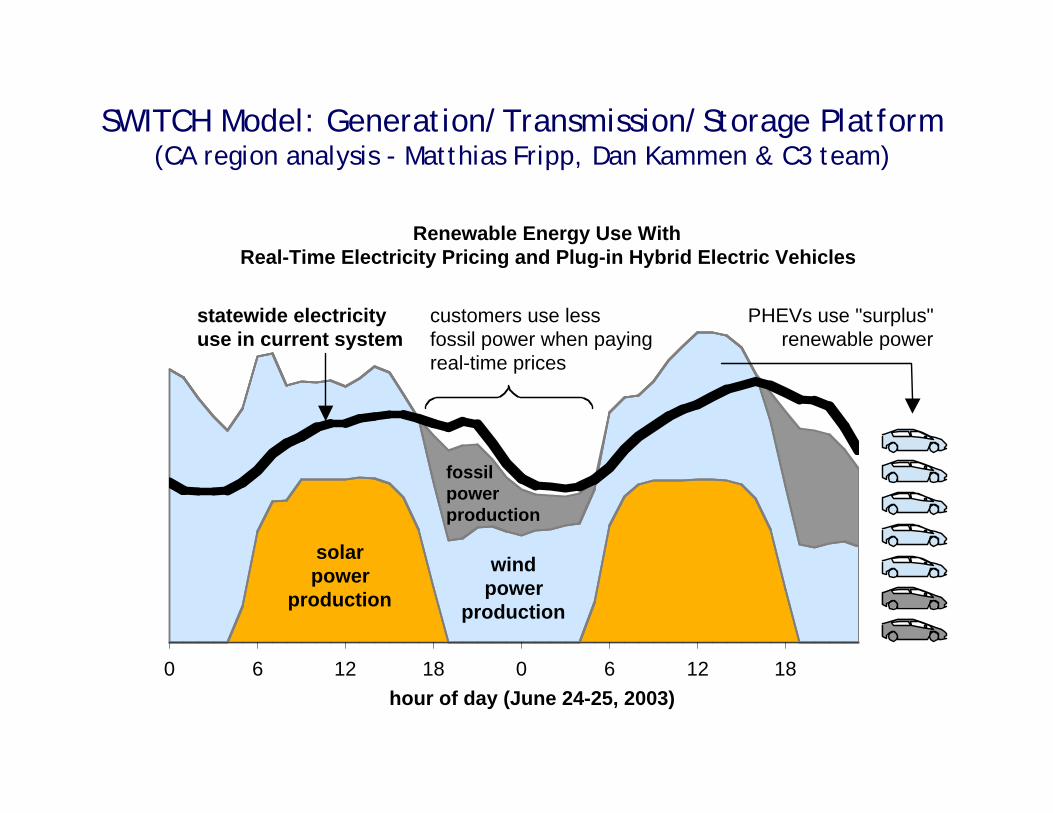
SWITCH Model: Generation/Transmission/Storage Platform (CA region analysis - Matthias Fripp, Dan Kammen & C3 team)
Renewable Energy Use With Real-Time Electricity Pricing and Plug-in Hybrid Electric Vehicles
0 6 12 18 0 6 12 18hour of day (June 24-25, 2003)
PHEVs use "surplus"renewable power
customers use less fossil power when paying real-time prices
fossil power production
solarpower
production
statewide electricity use in current system
windpower
production
Renewable and Appropriate Energy Laboratory - rael.berkeley.edu
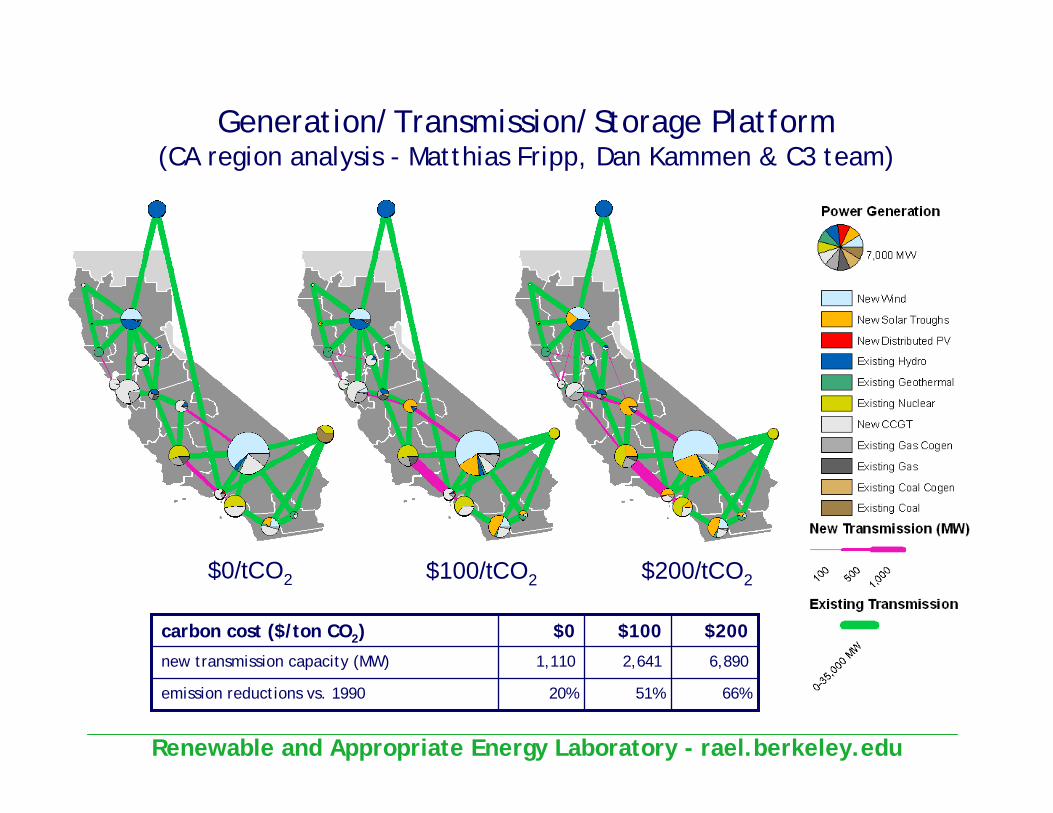
Generation/Transmission/Storage Platform(CA region analysis - Matthias Fripp, Dan Kammen & C3 team)
66%51%20%emission reductions vs. 1990
6,8902,6411,110new transmission capacity (MW)
$200$100$0carbon cost ($/ton CO2)
$200/tCO2$100/tCO2$0/tCO2
Kammen laboratory: http://rael.berkeley.edu/ebamm - version 2
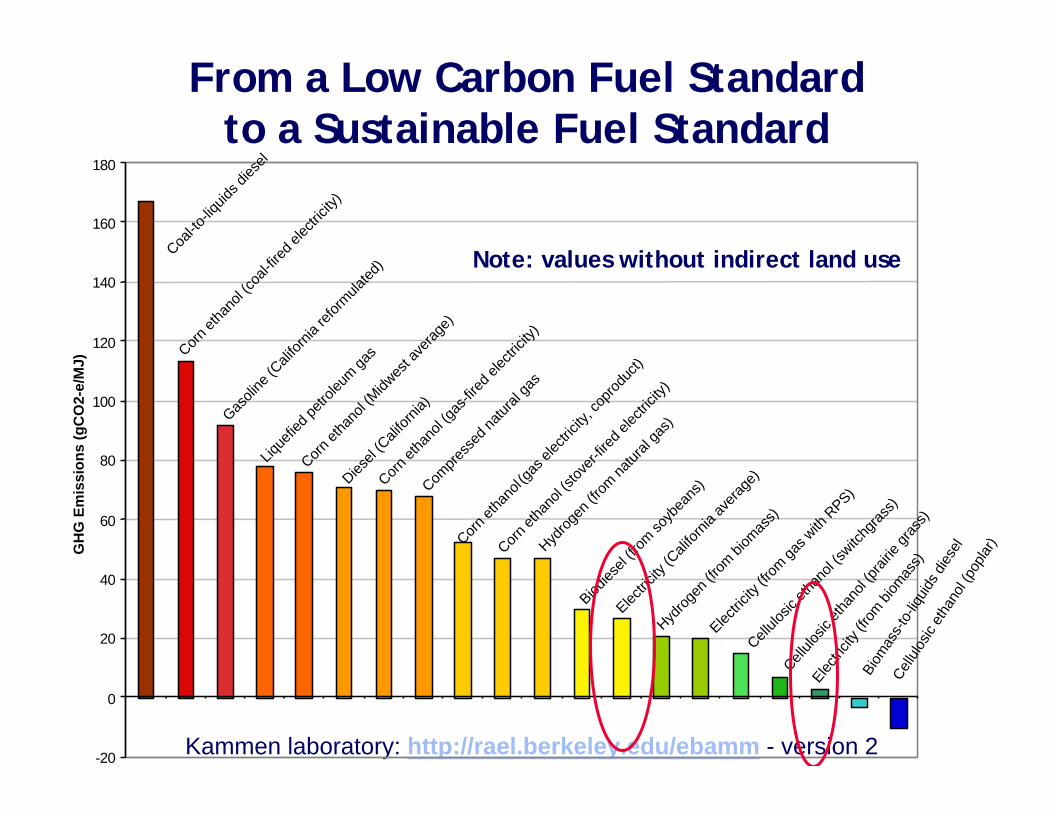
From a Low Carbon Fuel Standard to a Sustainable Fuel Standard
Note: values without indirect land useCell
ulosic
etha
nol (s
witchg
rass)
Hydrog
en (fr
om bi
omas
s)
Electric
ity (C
alifor
nia av
erage
)
Electric
ity (fr
om ga
s with
RPS)
Hydrog
en (fr
om na
tural
gas)
Diesel
(Cali
fornia
)
Corn et
hano
l (gas
-fired
elec
tricity
)
Lique
fied p
etrole
um ga
s
Corn et
hano
l (Midw
est a
verag
e)
Corn et
hano
l (coa
l-fired
elec
tricity
)
Gasoli
ne (C
alifor
nia re
formula
ted)
Biom
ass-
to-liq
uids d
iesel
Cellu
losic
etha
nol (
popla
r)
Coal-to
-liquid
s dies
el
Corn et
hano
l (gas
elec
tricity
, cop
roduc
t)
Corn et
hano
l (stov
er-fire
d elec
tricity
)
Compre
ssed
natur
al ga
s
Biodies
el (fro
m soyb
eans
)
Cellulo
sic et
hano
l (prai
rie gr
ass)
Electric
ity (f
rom bi
omas
s)
-20
0
20
40
60
80
100
120
140
160
180
GH
G E
mis
sion
s (g
CO
2-e/
MJ)
Renewable and Appropriate Energy Laboratory - rael.berkeley.edu
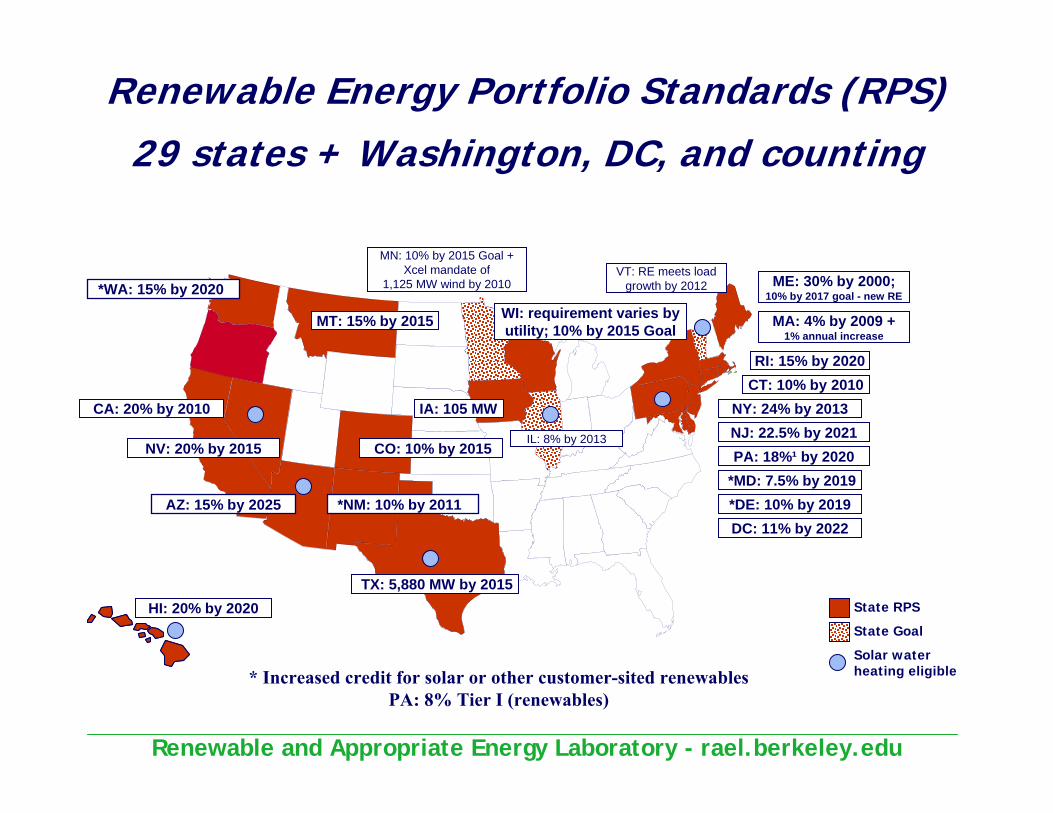
Renewable Energy Portfolio Standards (RPS)29 states + Washington, DC, and counting
State Goal
PA: 18%¹ by 2020NJ: 22.5% by 2021
CT: 10% by 2010
MA: 4% by 2009 + 1% annual increase
WI: requirement varies by utility; 10% by 2015 Goal
IA: 105 MW
MN: 10% by 2015 Goal +Xcel mandate of
1,125 MW wind by 2010
TX: 5,880 MW by 2015
*NM: 10% by 2011AZ: 15% by 2025
CA: 20% by 2010
NV: 20% by 2015
ME: 30% by 2000;10% by 2017 goal - new RE
State RPS
*MD: 7.5% by 2019
* Increased credit for solar or other customer-sited renewablesPA: 8% Tier I (renewables)
HI: 20% by 2020
RI: 15% by 2020
CO: 10% by 2015
DC: 11% by 2022
NY: 24% by 2013
MT: 15% by 2015
*DE: 10% by 2019
IL: 8% by 2013
VT: RE meets load growth by 2012
Solar water heating eligible
*WA: 15% by 2020
Renewable and Appropriate Energy Laboratory - rael.berkeley.edu
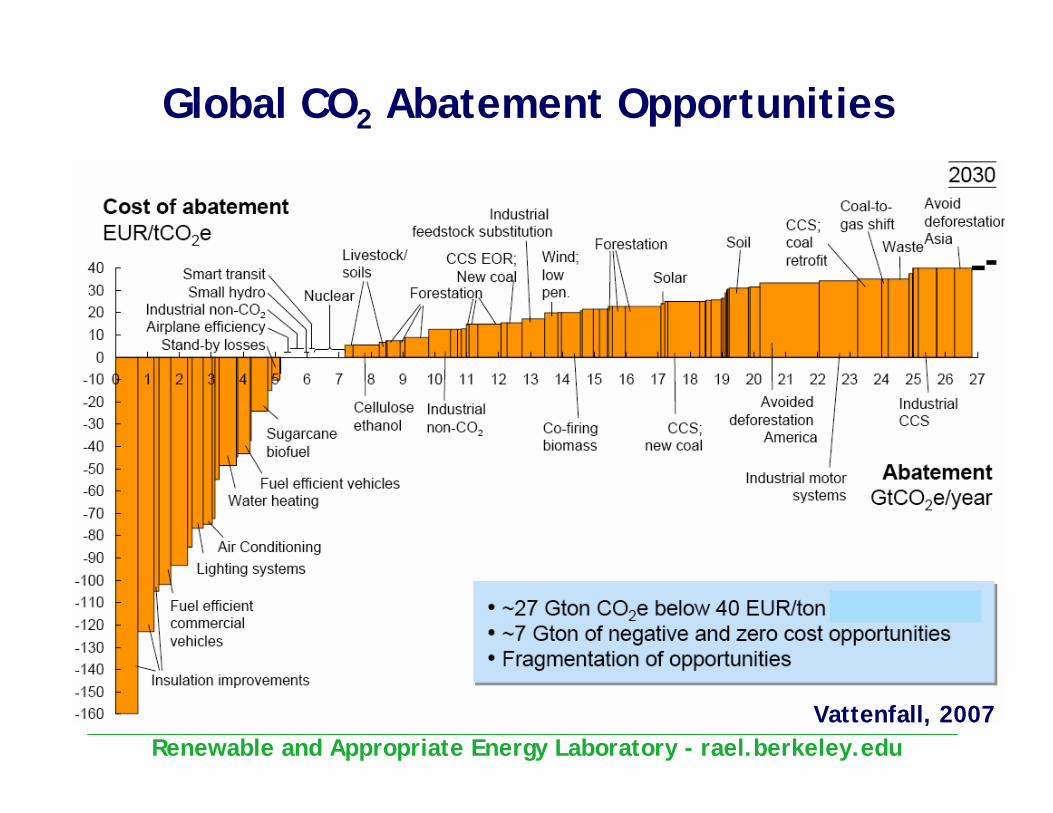
Global CO2 Abatement Opportunities
Vattenfall, 2007
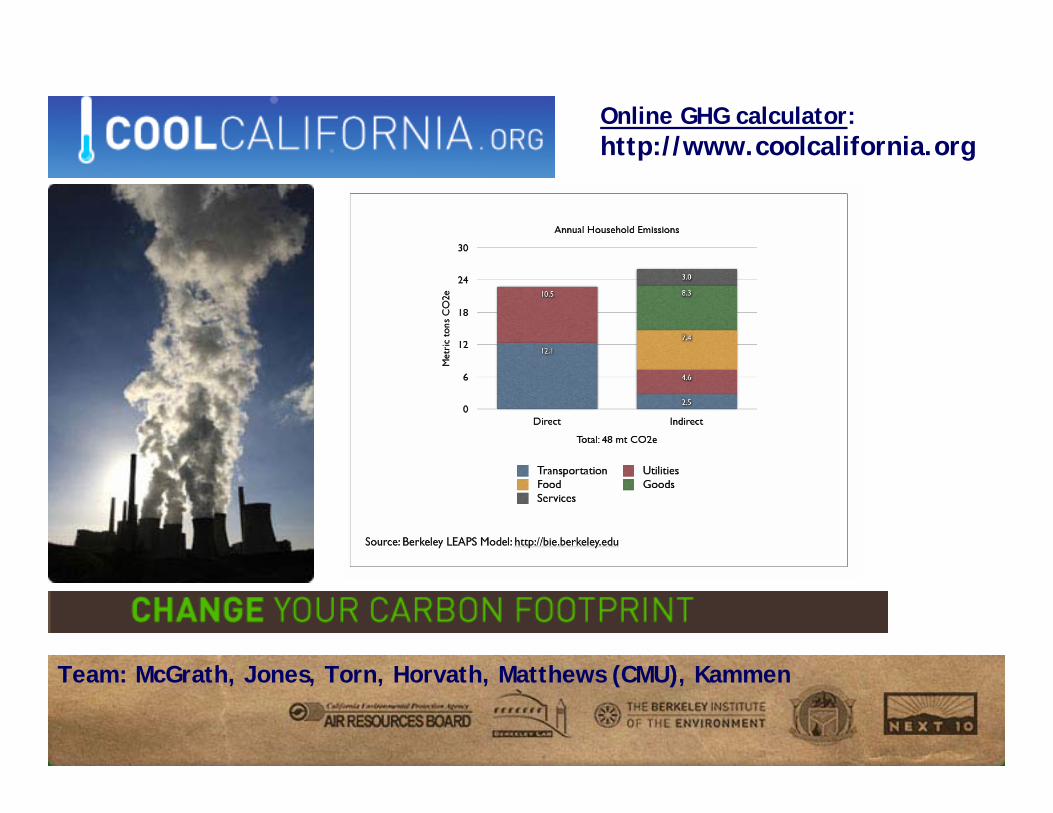
Online GHG calculator:http://www.coolcalifornia.org
Team: McGrath, Jones, Torn, Horvath, Matthews (CMU), Kammen
Renewable and Appropriate Energy Laboratory - rael.berkeley.edu
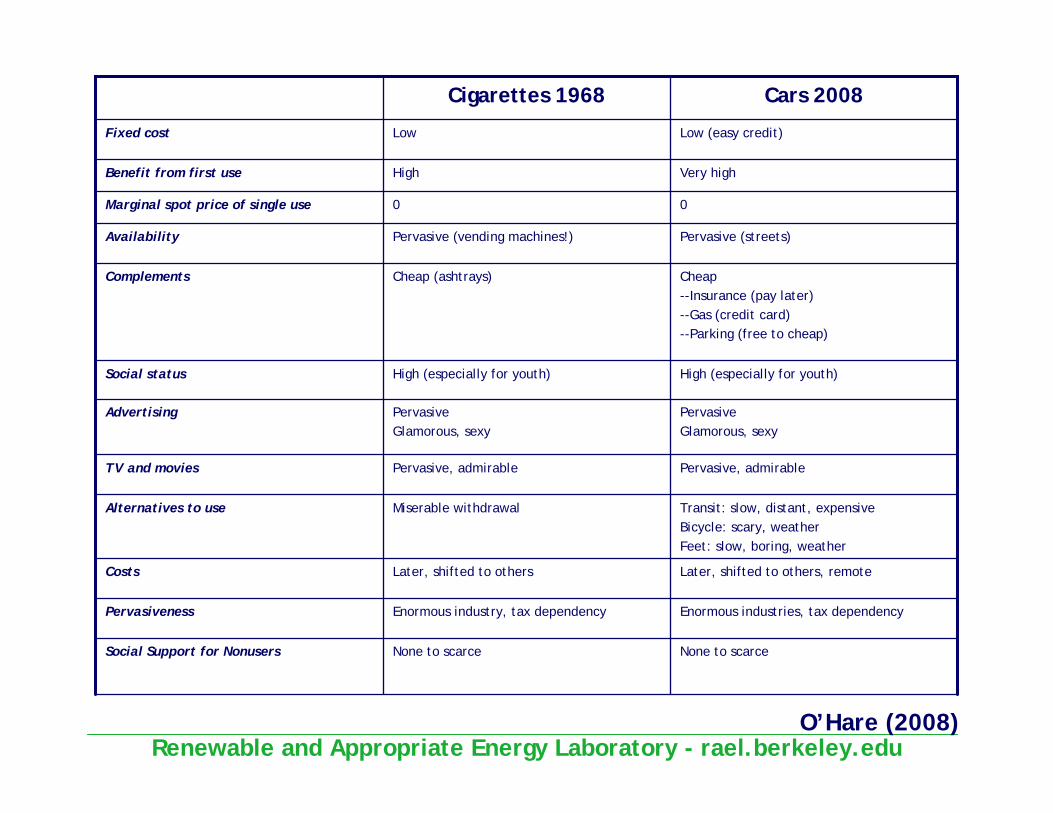
None to scarceNone to scarceSocial Support for Nonusers
Enormous industries, tax dependencyEnormous industry, tax dependencyPervasiveness
Later, shifted to others, remoteLater, shifted to othersCosts
Transit: slow, distant, expensiveBicycle: scary, weatherFeet: slow, boring, weather
Miserable withdrawalAlternatives to use
Pervasive, admirablePervasive, admirableTV and movies
PervasiveGlamorous, sexy
PervasiveGlamorous, sexy
Advertising
High (especially for youth)High (especially for youth)Social status
Cheap--Insurance (pay later)--Gas (credit card)--Parking (free to cheap)
Cheap (ashtrays)Complements
Pervasive (streets)Pervasive (vending machines!)Availability
00Marginal spot price of single use
Very highHighBenefit from first use
Low (easy credit)LowFixed cost
Cars 2008Cigarettes 1968
O’Hare (2008)
Renewable and Appropriate Energy Laboratory - rael.berkeley.edu
Extra
Renewable and Appropriate Energy Laboratory - rael.berkeley.edu
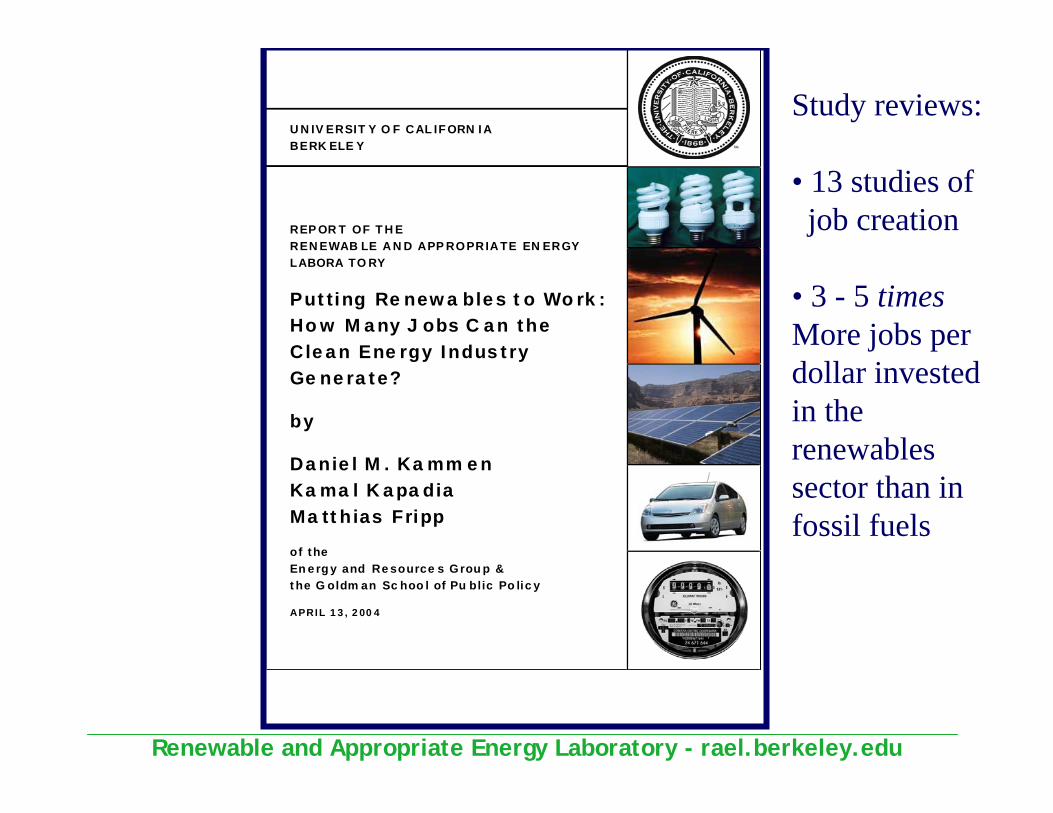
UNIVERSITY O F CALIFORN IABERKELE Y
REPORT OF THERENEWAB LE AND APPROPRIATE ENERGYLABORA TORY
Putting Renewa bles to Work:How Many J obs C an theClean Energy IndustryGenerate?
by
Daniel M. KammenKamal KapadiaMatthias Fripp
of theEnergy and Resources Group &the Goldman School of Pu blic Policy
APRIL 13, 2004
Study reviews:
• 13 studies of job creation
• 3 - 5 timesMore jobs per dollar invested in the renewables sector than in fossil fuels
Renewable and Appropriate Energy Laboratory - rael.berkeley.edu
-10%
0%
10%
20%
30%
40%
50%
1990 1995 2000 2005 2010 2015 2020
CEC Data
Business as UsualAB 32 Scenario
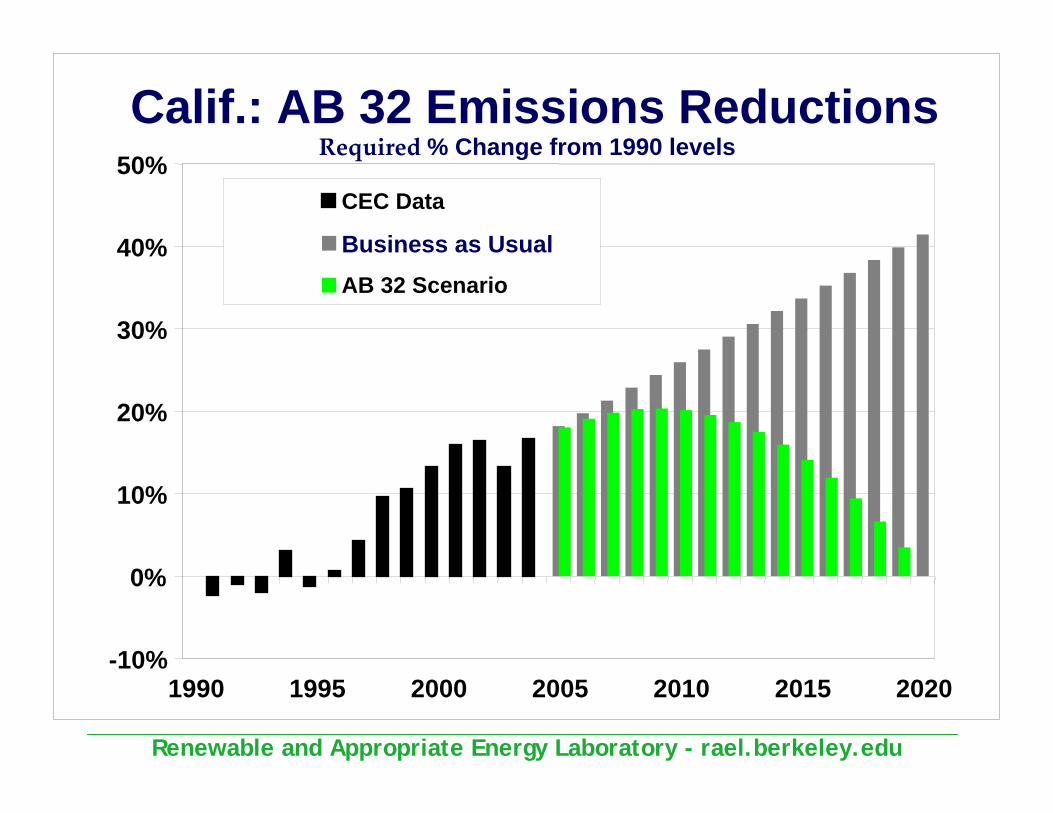
Required % Change from 1990 levelsCalif.: AB 32 Emissions Reductions
Renewable and Appropriate Energy Laboratory - rael.berkeley.edu
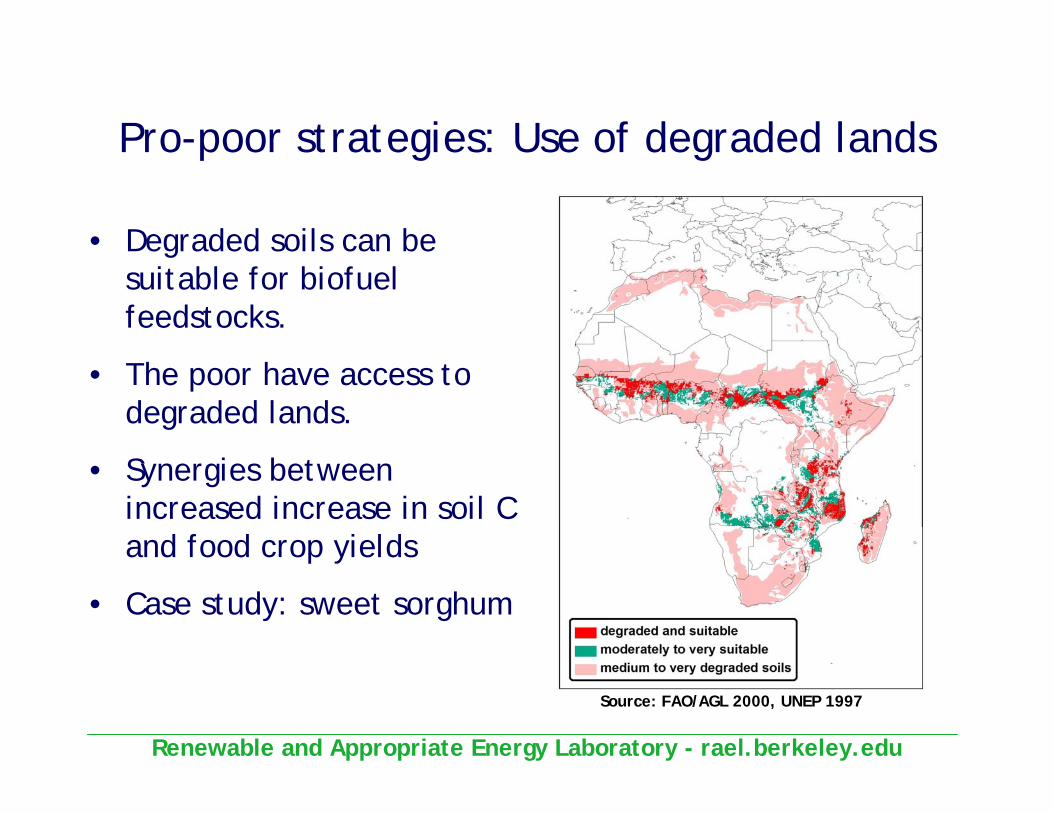
Pro-poor strategies: Use of degraded lands
• Degraded soils can be suitable for biofuel feedstocks.
• The poor have access to degraded lands.
• Synergies between increased increase in soil C and food crop yields
• Case study: sweet sorghum
Source: FAO/AGL 2000, UNEP 1997
Renewable and Appropriate Energy Laboratory - rael.berkeley.edu
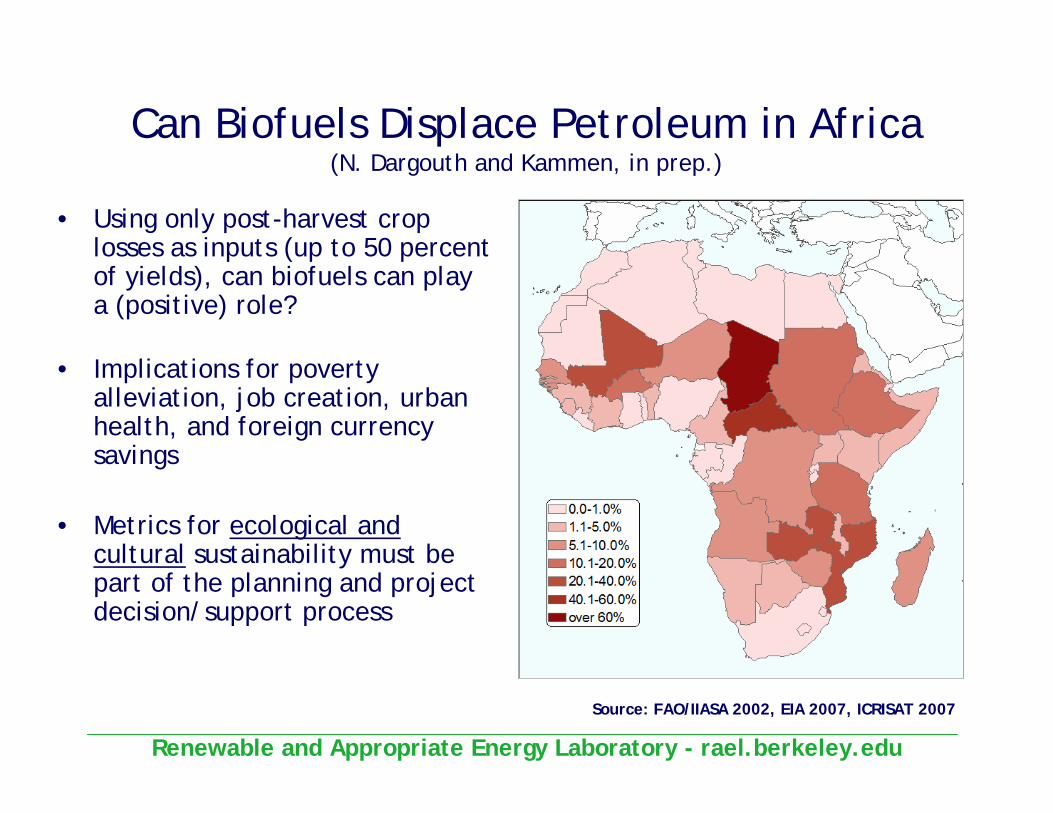
Can Biofuels Displace Petroleum in Africa (N. Dargouth and Kammen, in prep.)
• Using only post-harvest crop losses as inputs (up to 50 percent of yields), can biofuels can play a (positive) role?
• Implications for poverty alleviation, job creation, urban health, and foreign currency savings
• Metrics for ecological and cultural sustainability must be part of the planning and project decision/support process
Source: FAO/IIASA 2002, EIA 2007, ICRISAT 2007