johnson_2010.pdf - Daniel Ezra Johnson
234
PUBLICATION OF THE AMERICAN DIALECT SOCIETY University of California, Davis Duke University PUBLICATION OF THE AMERICAN DIALECT SOCIETY Editor: ROBERTBAYLEY, University of California, Davis ManagingEditor: CHARLESE. CARSON, Duke University Number 95 Copyright 2010 American Dialect Society ISBN: 978-0-8223-6748-2 Library ofCongressCatanging—in-PublicationData British Library Catanguing—in-PublicationDataavailable
-
Upload
khangminh22 -
Category
Documents
-
view
2 -
download
0
Transcript of johnson_2010.pdf - Daniel Ezra Johnson

PUBLICATION OF THE AMERICAN DIALECT SOCIETY
University of California, Davis Duke University
PUBLICATION OF THE AMERICAN DIALECT SOCIETY
Editor: ROBERTBAYLEY,University of California, DavisManagingEditor: CHARLESE. CARSON,Duke University
Number 95Copyright 2010
American Dialect Society
ISBN: 978-0-8223-6748-2
Library of CongressCatanging—in-PublicationData
British Library Catanguing—in-PublicationData available

CONTENTS
Foreword, by William Labov
Acknowledgments
. VowelMergers1.1. Types of Merger: Approximation, Transfer, Expansion
1.2. Principles of Merger: Garde and Herzog
1.3. SelectedStudiesof Low BackMerger in the United States1.4. A Comprehensive Look at Merger: Labov, Ash, and Boberg
(2006)
1.5. The Study of Merger on Three Levels
.The Low Vowels of New England: History and Development
2.1. The History of the Low Vowelsand the Settlementof (Southeastern) New England
2.2. TheLinguistic Atlas of NewEngland and Other Studies
2.3. More Recent Studies
2.4. The Hanley Recordings: Voices from LANE
2.5. Evolution of the Low Vowels of (Southeastern)
New England2.6. The Pilot Study: Locating the Dialect Boundary
.The School Study
3.1. Dif■culty of Second Dialect Acquisition
3.2. The Instrument
3.3. The Sample
3.4. Accuracy
3.5. Factors Affecting Vowel Inventory: LOT and THOUGHT3.6. Factors Affecting Vowel Inventory: PALM3.7. Conclusions from the School Survey
.The Geographic Study
4.1. Resultsof Auditory Analysis
4.2. More Evidencefrom Three Formerly MAIN Communities4.3. Acoustic Analysis of Principal Low Vowel Systems
4.4. The Interaction of Rhoticity and Low Vowel Systems
4.5. Discussion of the Geographic Study: Introducing theMigration Hypothesis
vii
Xi
\qum
wQ
3
13
13273335
3941
43434648
4952
91
9597
103106
142
143

Vi PADS95: LOWVOWELSOFSOUTHEASTERNNEWENGLAND
5. The Family Study
5.1. The Families of Attleboro and South Attleboro,Massachusetts
5.2. The Families of Seekonk, Massachusetts
5.3. The Family Study and the School Survey: Seekonkand South Attleboro
5.4. The Families of Cumberland, Rhode Island
5.5. The Families of Warwick, Rhode Island
5.6. lndiVidual Change5.7. Dialect Change5.8. Community Change:Developing the Migration
Hypothesis5.9. Testing the Migration Hypothesis
5.1o. Other Hypotheses
5.1 1. Summary of the Family Study, Etc.
6. Conclusions and Extensions
Notes
References
Index
149
153155
173177179190
192
193195202205
209
213
223
231

FOREWORD
WILLIAM LABOV,University of Pennsylvania
Readers: This is an extraordinary work that you are about to plunge into.Daniel EzraJohnson has ■xed his eye on one of the central problems of lin-
guistic changeand variation: how doesit come about that phonemesmergeand collapse,so that speakerscan no longer tell the difference between cotand caught, collar and caller, odd ability and audihility? This low back mergeris the major factor that differentiates American dialects and determinesthe future course of sound change. Many scholars have made the low back
merger their central topic, but no one has delineated the events more pre-cisely than Johnson has. He has not only studied change in progress, butcaptured the crucial events almost at the moment they occurred.
Johnson’s study is a model of research design and execution. In
chapter 3, he ■rst develops an instrument for the school survey,rapidlycharting the number of distinctions perceived among the low back vow-els. He also includes the important question as to whether father andbotherrhyme, a point badly neglected in the Atlas of North American English.Throughout this study, we have data on whether /ah/ differs from /o/ (PALMfrom LOT) aswell aswhether /o/ differs from /oh/ (LOTfrom THOUGHT).The
school surveygatherscrucial information on the stateof the low backvow-els in a number of communities, including South Attleboro and Seekonk,
two communities near the border between the eastern Massachusetts area,
where /o/ and /oh/ are merged, and the Rhode Island area,where /o/ and/ah/ are merged. In these two places,we observea distinct shift toward the
merger of all /o/ and /oh/ (see,for example, ■gs.3.10—3.12).Johnson alsogenerates a wealth of data that bear crucially on the influence of the com-munity on in-migrant children, and the relative influence of the mother’s
versus the father’s linguistic system on that of the child.
The reader can have considerable con■dencein Johnson’s multivari-ate analyses, since they use mixed models regression, in which the effects
of random variables (like individual subjects)are separatedfrom the ■xedeffects (like gender, age, or community). It is worth noting that Johnsonis the author of a statistical package in R—Rbrul—which foregrounds thiscapacity along with other advantages over other Varbrul programs (see
vii

viii PADS95: LOW VOWELSOF SOUTHEASTERNNEw ENGLAND
http://www.danielezrajohnson.com/rbrul.html andJohnson’s 2009 article
on the subject).In chapter 4, Johnson sets out to trace the geographic boundary
between the areaswhere the LOTand THOUGHTclassesare merged andwhere they are not. He delineates this boundary through short sociolinguis-tic interviews with 67 seniors and 113 young adults. The end result is theelegant maps in ■gure 4.3 for the seniors and ■gure 4.4 for the youngerspeakers. But surprisingly enough, given the general tendency of mergersto expand, there are very few differences between the two ■gures. Over
two or three adult generations, the line between merged and unmerged
systemshasremained remarkably stable.There is, however,plenty of roomfor Johnson to examine with ■ne-grained acoustic tools the various typesof systemsinvolved in the transition areas. The ■gures in this chapter use adazzling array of graphic techniques to display thesesystems,ranging fromthe three-way system of an 81-year-old man (■g. 4.10) to the complete col-lapse of the three phonemes in the vowel system of a 19-year-old girl (■gs.
4.2 1 and 4.22).If Johnson had stopped at this point, we would have had a view of lin-
guistic stability, with a surprisingly small tendency for the low back mergerto expand. Fortunately for us, he decided to go further and designed thefamily study of chapter 5. This involved sociolinguistic interviews with 47families, recording spontaneous speech and various techniques with mini-
mal pairs. In the crucial transitional town of Seekonk, 14 families with atotal of 34 children were interviewed. The results show an explosion ofmerger among children, which appears as they leave the influence of their
parents in favor of their peer groups, sometimes as early as 4 or 5 years of
age. Figures 5.2 for Attleboro and 5.3 for Seekonk display this develop-
ment with remarkable clarity: one can see immediately how the youngestchildren copy the systemof their parents while school-agechildren followthe pattern of their peers.
Some of the most impressive aspects of this work follow, asJohnsontakes up several ways of accounting for this sudden development of the
merger. Can the outbreak of merger among local children be the result of
in-migration from merged areas?Johnson useshis considerable expertisein the analysis of census data to weigh the evidence for and against this
hypothesis.1would urge the reader to follow his argument through to theend, before settling on one interpretation or the other.
But the evidence provided by the school survey has enabled Yang (2009)
to develop a model that predicts the percentage of in-migrating childrenrequired to produce such a change—in the neighborhood of 20%, and

Foreword ix
not signi■cantlydifferent from the percentage of children in the Seekonkelementary school who marked all 7 word pairs as the same: 19%.
My appreciation of the main line of researchshould not tempt readersto jump directly to chapter 3. Johnson’s opening chapters provide a mas-terful review of the history of the vowel systems, the relation of settlementhistory to the vowel systemsof the area, and the evidence for mergers and
distinctions in earlier times. This includes an acoustic analysisof ten min-utes of the speech of the upper classBostonian, Henry Wadsworth Longfel-low Dana, born in 1881. The result is a clear three-way distinction of thethree low back vowels—/o/ in LOT, /ah/ in PALM,and /oh/ in THOUGHT—asystem that survives only among the oldest speakers of Johnson’s studies.
For those of uswho are not great scholars,Johnson’schapters 1 and 2 pro-vide a short course in the history of the subject that will saveus many trips
to the library.


ACKNOWLEDGMENTS
This study is dedicated to my parents, Nicholas Johnson (3-D) and Susan
BienenJohnson (MAIN).This study is a revised version of my 2007 University of Pennsylvania
Ph.D. dissertation. While at Penn, 1wassupported by a William Penn Fel-lowship and a National ScienceFoundation Graduate Fellowship.
1would like to thank my teacher and dissertation supervisor,WilliamLabov, and the members of my dissertation committee, Gillian Sankoff andMark Liberman. Also at Penn: Aaron Dinkin, Keelan Evanini, Amy Forsyth,Damien Hall, Ron Kim, Tom McFadden, and Sandhya Sundaresan.
If not for Arvilla Payne (1976), Ruth Herold (1990), and the creatorsof The Atlas ofNon‘h American English (Labov, Ash, and Boberg 2006), this
study could hardly have been written. More indirect inspiration waspro-vided by Malkiel (1984) and Zelinsky (1973).
Thanks to Miles Hanley for making his eponymous recordings and toJudith Grayof the American Folklife Center (Library of Congress)for help-ing me gain accessto them. Carol Faber,]ohn Blodgett, and www.fact■nder
.org did the same with U.S. Census data. The libraries at MIT and BostonUniversity, aswell as the JSTOR service, were invaluable to a study carried
out away from its home university.Chapter 3 would not have been possible without school administrators
Raleigh Buchanan,June Gilch, and Robert Weintraub, the principals andteachers of Attleboro and Seekonk, and my friends Rachel Mazor, EmilyTuckman, Sarah Westley, and Michael Williams.
Chapter 4 was made possible by dozens of senior center directors and
many others, especially George Yelle (Norton Historical Society). Thank
you to all the senior citizens and young adults who gave their time and tothe parents and children who welcomed me into their homes to researchchapter 5.
Thanks are due to all the businesses providing electricity and wirelessInternet accessduring the composition and revision of this study. And toLaTeX, Stickies, and R.
Thank you to my editors, Robert Bayley and Charles Carson, for alltheir patient assistance and for enabling me to realize the long-term dream
Xi

xii PADS95: LOW VOWELSOF SOUTHEASTERNNEw ENGLAND
of being published in this series.Thanks also to two anonymous reviewersfor their lengthy and constructive remarks.
Finally, thank you somuch to my family, friends, and everyoneelsewhohelped me with this work, and enhanced my life while it was being written.
In particular, thanks to Maryam Bakht, Liz Coppock, Nanna Haug Hilton,
Uri Horesh,Jason Horger,]en Nycz,]oanie Sanchez,and Laura Whitton.

ῐ ῑ ει ηᾱ οι υι ῠ ῡ
1. VOWEL MERGERS
THISSTUDYOFDIALECTgeography, acquisition, stability, and change examines
the low vowels of southeastern New England (Massachusetts and Rhode Island).
Because these vowels—represented by Wells’s (1982) PALM,1LOT, and THOUGHT2
lexical sets—have undergone several mergers, a review of the nature, causes, and
mechanisms of vowel merger is in order.
Historical linguistics texts (Hock 1986; Campbell 2004) treat vowel merg-ers along with mergers of consonantsor tones,without emphasizing the variousmechanisms by which similar vowel phonemes can fall together asthe same sound,
usually creating homonymy betweenpairs of previously distinct words.Among modern languages,vowel-rich English and German, aswell asFrench
and Yiddish (and their dialects), have provided many examples of this phenom-
enon, the examination of which has led scholars to develop principles and mecha-nisms of vowel merger.
One reasonwhy phonemes should not merge is functional: the homonymycreated by merger may make comprehension more dif■cult, hindering communi-cation. On the other hand, the relative easeof pronouncing a language with fewerspeech sounds could be a functional argument in favor of merger.
But there is little clear evidence that such functional factors are at play. In the
history of Greek, there hasbeen a tremendous amount of vowel merger and lossof lexical contrast. Through fronting, raising, unrounding, and the loss of glidesand length distinctions, nine phonemes ofAncient Greek—I /i/, [/i:/, 81/e:/, 11/£:/,
6c/a:/,01/oi/, w /yi/, 17/y/, D/y:/—all eventuallymerged asModern Greek/i/, in “themost spectacular example” of multiple merger into a single target (Labov 1994,
229). The high front monophthong /i/ is a point of stability,according to Labov’s(1994) principles of vowel shifting.
In other cases,multiple vowel merger can occur as one process. When theClassical Latin system of distinctive vowel length collapsed in the transition toVulgar Latin, regular mergerstook place in all varieties,though their number andlocation differed by area, as shown in table 1.1, derived from R. Hall (1950) and
Leonard (1978).Though the details of these mergers are different, they were all caused by
there being, after the loss of Classical Latin’s distinctive vowel length, simply too
many vowels in too small a phonetic space for them all to remain distinct. Think-ing about vowels in terms of their potential crowding in a kind of space—related
to the physical spaceavailablefor the tongue’s movementsin the mouth—is dueto the work of Martinet (1955).

table 1.1
Classical Latin French, Spanish, etc. Romanian Sicilian Sardinian
10 distinct 7 distinct 6 distinct 5 distinct 5 distinct vowels vowels vowels vowels vowels
2 PADS 952 LOW VOWELS OF SOUTHEASTERN NEW ENGLAND
TABLE 1.1Vulgar Latin Mergers Following Loss of Classical Latin Vowel Length
ClassicalLatin French, Spanish, etc. Romanian Sicilian Sardinian
i: 1 i i i
i e e i i
e: e e i e
e a e
a a
a: a
o o
o: o o u o
u o u u u
u: u u u u10 distinct 7 distinct 6 distinct 5 distinct 5 distinct
vowels vowels vowels vowels vowels
For Martinet, many vowel shifts are a way of avoiding merger; those
mergers that do occur are exceptional (Labov 1994, 266). However, another
fundamental principle for Martinet is the pressureto achievesymmetry inphonological (sub)systems. Vowel merger can create a more symmetrical
system and relieve articulatory crowding at the same time.
1.1. TYPES OF MERGER: APPROXIMATION,TRANSFER, EXPANSION
Most of the vowel mergers mentioned above are of the type known asMERGERBY APPROXIMATION(Trudgill and Foxcroft 1978). These are regu-lar sound changesthat occur below the level of consciousawareness.They
are lexically abrupt—affecting all relevant words at the same time—andphonetically gradual. For Guy (1990), these are “spontaneous” and “inter-nally induced” changes that stem from language-internal pressures.
In merger by approximation, two vowelscan move toward each other,ending up merged in an intermediate position, or one can movewhile theother remains in place, like Greek /i/, resulting in a merger with the qualityof the stationary vowel (Labov 1994, 32 1).
Another mechanism is MERGERBY TRANSFER(Trudgill and Foxcroft
1978). Here, the primary cause is external—dialect contact—and thechange occurs above the level of consciousness (Labov 1994, 321). It is atype of borrowing (Guy 1990). The merger diffuses gradually through the

Vowel Mergers 3
relevant part of the lexicon but is phonetically abrupt: no intermediate
formsareobserved.3A third mechanism of merger was proposed in Herold (1990). As it is
the most relevant for this study, it will be described in detail. Herold dis-covered a previously unknown area of low back merger (between LOT andTHOUGHT) in northeast Pennsylvania and convincingly attributed its origin
to a period of heavyforeign immigration.Foreignerswho cameto work in the local anthracite coal-mining indus-
try failed to acquire the low back distinction from the native population,who were in a minority. And the immigrants’ numbers were so great that
not only their children but the natives’ children adopted it.This happened—apparently independently—in most of the anthracite
mining towns, one of which Herold studied in depth: Tamaqua, Pennsyl-vania, population 8,000. Of the 30 natives she interviewed (10 analyzedacoustically), Herold found that speakers aged 74 and older maintainedthe low back distinction, while those 64 and younger had lost it. Mergerthus began community-wide around 1920 and was “completed” (but seebelow) in just ten years.4
Herold developed a theory of individual development to accompanythis community-level observation of rapid change. In interaction with
merged speakers,thosewith the distinction stop relying on it to distinguishwords, since the usual phonetic cues are absent, or even reversed, in the
speech of their interlocutors. And before long, they also stop producing
the distinction.5The phonetic range of the younger Tamaqua speakers’ merged pho-
neme was very wide. Acoustically, it covered the combined ranges of bothoriginal phonemes. This would not have happened with merger by approxi-mation nor merger by transfer.
Herold coined the term MERGERBY EXPANSIONto describe the change
in Tamaqua.Unlike merger by transfer, it is a changefrom below and lexi-callyabrupt. Unlike merger by approximation, it isphonetically abrupt too.Since people who did not speak the local variety natively were crucial in thegenesis of the change, it belongs under “imposition” in the typology of Guy
(1990).Figure 1.1 displays the vowels of a Tamaqua father (b. 1907) and son
(b. 1942) who display the distinct and merged patterns, respectively. The
LOT and THOUGHTclouds were not far separated before the change. After-ward, they are completely intermingled.
In asense,the merger was“completed within asinglegeneration” (Her-old 1997, 185). However, this “completion” left the community divided,not uni■ed. Although the circumstances triggering merger fell into place

figure 1.1
F1 (
Hz)
F2 (Hz) F2 (Hz)
400
900
500
1600
600
700
800
1400 1200 1000 800 600 1600 1400 1200 1000 800 600
lotthought
Father, age 81 (b. 1907), distinct Son, age 46 (b. 1942), merged
4 PADS 952 LOW VOWELS OF SOUTHEASTERN NEW ENGLAND
FIGURE1.1LOT and THOUGHT Plots of a Father and Son from Tamaqua, Pennsylvania
(after Herold 1990, 88—89)
Father, age 81 (b. 1907), distinct Son, age 46 (b. 1942), merged
' I ' I ' I ' I ' ' I ' I ' I ' I '
400— V — — —D I:IV I:I V VV
500_ I:I V _ _V I:I VD
v _V V VV
lg %A V V VN600— g V —
%v —V V VE
V V D I:IVV I:IVL: D D D V W VS? I:I E| D D
700—Q!
_ — I:I —El
DD V V ”WBI?
E'EIEIV800— g I:I LOTD —
E E. V THOUGHT
V | |900 . I . I . I . I . . I . I . I . I .1600 1400 1200 1000 800 600 1600 1400 1200 1000 800 600
F2 (Hz) F2 (Hz)
around 1920, the merger did not affect adults who had already acquiredthe distinction. Nor have older adults been much affected by subsequent
contact with younger speakers, such as the 4o—plusyears the distinct father
haspresumablyspent talking to his merged son.Herold refers to “speakers” or “people,” but by stipulating that it is
children who carry out merger by expansion, we explain why the samephonological merger sometimes spreads readily, and sometimes not atall. Children who have initially acquired a vowel distinction are capableof abandoning it upon exposure to (enough) merged speakers, but adults
in the samesituation will likely retain their distinct patterns for the rest oftheir lives.
1.2. PRINCIPLES OF MERGER: GARDE AND HERZOG
One of the best-known statements about mergers is called Garde’s Prin-ciple: “mergers are irreversible by linguistic means” (Labov’s [1994, 31 1]interpretation of Garde’s [1961, 38—39] statement, “si deux mots ont étérendus identiques par un changement phonétique quelconque, ils ne peu—vent jamais devenir différents par voie phonétique”). If homonymy between
a pair of words is irreversible, then a merger of word classes must be too,
leading Labov to state that “once two word classeshave merged, they cannot

Vowel Mergers 5
be distinguished by any linguistic process” (Labov 1994, 144). This meansthat once a speech community has completely merged two historically dis-
tinct word classes,the usual subconsciousprocessesof sound change can-not separatethem later.
If two close word classesare thought to be merged but are actually not,their later separation is no threat to Garde’sPrinciple. The reversalof sev-eral casesof falsely believed merger is discussed in Herold (1990, chap. 4)and Labov (1994, chap. 10; see also Maguire 2008).
It is also possible for a true merger to be reversed, but not “by linguisticmeans.” For example, if a speech community were drastically disrupted by
large-scaleimmigration or invasion, the result could certainly be a varietythat distinguished two phonemes that the original variety did not.
Changes from above, toward prestigious norms, can be a less dramatic
type of externally motivated merger reversal:“Si l’on rencontre desexcep-tions a cette irreversibilite, ce ne peut etre que dans le cas de la forte influ-
ence d’une langue litteraire sur un parler” (‘If we ■nd exceptions to this
irreversibility, it can only be in the caseof the strong influence of a literarylanguage on a variety’; Garde 1961, 39). By saying that vowel mergers can-not be reversed “par voie phonetique” (‘just anywhere’), Garde meant that
Neogrammarian sound change—internal, from below—cannot reversethem, because a type of change that is blind to everything but phonetics
cannot affect a pair of homonyms differently. Indeed, the rare instancesofmerger reversal are usually attributable to factors other than sound changein the strict sense.6
A recent investigation in Charleston, South Carolina (Baranowski2007), has revealed the reversal of a conditioned merger, where two ormore vowels have fallen together, but only in certain phonetic environ-ments.7 ln Charleston, the NEAR and SQUAREvowels were pronouncedalike by older speakers, but were distinguished again starting around the
time of World War 11.Since the logic of Garde’s Principle applies equallyto conditioned mergers, Baranowski notes that Charleston “appears to be acounterexample” (1 20). Rejecting the idea that the sub-classeswere neverfully merged, Baranowksi points to the in-migration of many people bear-ing the distinction. However, the merger seems to have begun to reversing
a decade or more before many of these migrants arrived.Garde’s Principle leads to Herzog’s Principle: “mergers expand at the
expenseof distinctions” (Labov 1994, 313). This formulation implies that amerger WILLexpand geographically at the expenseof an adjacent distinc-tion, although Herzog (summarizing Garde) and Garde himself saythat
areas of merger can only expand and will never contract.8 Therefore, con-tact between a distinct community and an adjacent merged one is predicted

6 PADS95: LOWVOWELSOFSOUTHEASTERNNEw ENGLAND
to have little or no effect on the merged community, but there may be
an effect in the other direction, whereby the merger spreads. If this hap-
pens iteratively, all along the length of the isogloss, the area of merger willexpand.
There is some disagreement about when mergers should be expected
to spreadin this contagiousmanner. For Herzog (1965, 211), “the most sig-ni■cant linguistic factor to limit [the] diffusion [of a change] is the nature
of the phonological systemwith which it comes into contact. If changesemanating from opposite directions are structurally compatible they mayoverlap.” Herzog’s prime example of such overlapping mergers is in Yid-dish, where the loss of vowel length in the Northeastern dialect—/i = i:/,
/u = u:/—convergeswith the fronting and unrounding of high back vowelsin the Central dialect—/u = i/, /u: = i:/ (Herzog 1965, 167, 197). Each pro-cesscausedmerger in its own area, and they overlapped in the intermedi-ateNorth Central zone,where only one vowel remains of the original four:/i/. Apparently, these two changes were “structurally compatible,” althoughthis concept is only vaguely de■ned. The New England low vowel mergersdiscussed in this study may be less compatible with each other.
For Garde, there is less expectation that the isoglosses of mergers willspread and overlap. As opposed to the isoglosses of nonphonemic changes,
which “passentn’importe 011”(62), Garde ■nds that structural isoglossestend to form bundles:
sur chaque frontiére linguistique importante paraissent courir des isoglosses dis-
tinctives de sens contraire, c-a-d. que la limite d’un groupe d’homonymies réalisées
d’un coté de la frontiére correspond a la limite d’un autre groupe d’homonymies
réalisées de l’autre coté. [‘along every important linguistic boundary, there seem to
run distinctive isoglosses with opposite orientations, that is to say, the limit of one
group of mergers that occurred on one side of the boundary corresponds to the
limit of another group of mergers on the other side’; Garde 1961, 58]
To explain why these changes coming from opposite directions tend toface off along the same boundary, Garde (1961, 62) invokes “resistancea l’homonymie, autrement dit le besoin de clarte” (‘resistance to merger,
otherwise known as the need for clarity’). If this functional explanationis correct, it makes caseslike North Central Yiddish—where overlapping
mergers have caused extensive homonymy—the exception, not the norm.Garde notes that the most innovative Slavic languages in terms of seg-
mental phonology are the most conservativeprosodically, and vice versa.But it is not structural incompatibility in Herzog’s sense that prevents, for
example, the merger of /i/ and /y/ (found in South Slavic) from coincid-ing with the loss of distinctive lexical stress and/ or intonation (found else-

Vowel Mergers 7
where). After all, many world languages have neither that particular vocalic
distinction nor that prosodic one. For Garde (1961,55—56),varietiesare in“equilibrium”; eachcan undergo different mergers aslong asthe resultingamount of homonymy is not too great.9
Garde and Herzog both emphasizegeographic diffusion. They usuallyassume that an isogloss found in a certain place spread there from some-where else. This may be justified, especially when there is evidence for thespread, although other isoglosses may develop in situ, at the edges of areassharing parallel internal developments.
Whether a merger affects a place by internal, structurally motivatedevolution, by spreading from an adjacent place (contagious diffusion,
Hagerstrand 1953), or by the longer-distance influence of somepopulouscenter (hierarchical diffusion), we can still askwhy it occurs there whenit does—sometimesfairly suddenly and under conditions similar to thoseassociated with vowel system stability in previous generations. What looklike stable boundaries between speech communities can collapse; individu-als with distinct parents and older siblings can grow up merged.
1.3. SELECTED STUDIES OF LOW BACK MERGER
IN THE UNITED STATES
Early dialectological work along the US. Eastern Seaboard found the
merger of LOTand THOUGHTin two areas,EasternNew England and West-ern Pennsylvania (Kurath and McDavid 1961). These areas are structurally
different: EasternNewEngland hasa distinct PALMvowel,whereasin West-ern Pennsylvania all three classesare merged.10
A national survey of long-distance telephone operators conducted byLabov in 1966 con■rmed the merger in Eastern New England and foundthe Western Pennsylvania merger to extend further east in Pennsylvania
and westward into Ohio. A vast third area of merger wasrevealed in the
western United States,including the Great Plains but excluding SanFran-cisco and Los Angeles (Labov 1991; Labov, Ash, and Boberg 2006).11
Many local studies have since reported the expansion of the Western
area of merger. Terrell (1976) interviewed more than 100 children and
teenagersin Orange County, California, and found that none of the whitenatives, and few of the nonnatives, had a full LOT ~ THOUGHT contrast.12
Many who had moved from areas of distinction had acquired the merger,“most in less than two years” (Terrell 1976, 355). One boy had moved from
New Jersey at age ten, and three years later was “completely indistinguish-able from native Californians by his speech” (354).
8 PADS95: LOWVOWELSOFSOUTHEASTERNNEw ENGLAND
Minnesota was on the eastern edge of the Western merged area, and
Allen (1976, 24; quoted in Wells 1982,475) reported a “steadilyincreasingproportion” of university students with the merger there. In Kansas City,right on the telephone survey’s merger boundary, Lusk (1976; cited inMajors 2005, 165) reported older speakers as distinct and most younger
ones as merged. Gordon (2006) ■nds the merger in progress amongyounger speakers in most parts of Missouri. Only the eastern part of the
state, around St. Louis, retains the distinction. As reported in Labov, Ash,
and Boberg (2006, chap. 19.5), St. Louis participates to some extent in theNorthern Cities Shift, a rotation of several vowels that developed in thetwentieth century in a very similar form from New York State to Wisconsin(see Labov, Ash, and Boberg 2006, chap. 14). In the Northern Cities Shift,
TRAPis raised in every allophonic environment, and LOTmovesforward,sometimesasfar as [2e].This precludes the low back merger, even thoughTHOUGHTcan be unrounded and not fully back.
In Oklahoma, also on the eastern edge of the Western merged area,Bailey et al. (199 3) show that the low back merger has diffused hierarchi-cally. For speakers born before 1945, substantial merger is mainly restricted
to the largest cities, Oklahoma City and Tulsa.Among younger speakers,itis found in most parts of the state.
Other studies documenting the merger on the West Coast are Metcalf
(1972) in Southern California and Mills (1980) in the Paci■cNorthwest.Those ■nding its advancement elsewhere include Bailey, Wikle, and Sand
(1991) and Bernstein (1993) in Texas, Fridland (1998) in Memphis, Ten-
nessee, and Baranowski (2007) in Charleston, South Carolina, cities far
from the three core merged areas.Other referencesare given in the reviewof low back merger in Thomas (2001, 26—27).
Baranowski (2007) ■nds that in Charleston, men and women of all
social classesare progressing toward merger in parallel. Typical phoneticchanges from below are led by women and originate in the interior socio-
economic classes(Labov 2001). If mergers in progressescapesuchgenderand class differentiation, it may signal that these phonological restructur-ings occur evenfurther below the level of consciousawarenessthan changessuch asvowel raising, fronting, and soon.
The aboveinstancesof merger involve the unrounding of THOUGHT,so that the merged vowel is approximately [a].13 Irons (2007) deals with
a different phonetic situation, in Kentucky.As will be seenin the next sec-tion, the low back merger is now found throughout West Virginia, so the
further spread of the merger into northeastern Kentucky, asdocumentedby Irons (2007), is relatively unsurprising. However, in southeastern Ken-tucky, THOUGHT is traditionally pronounced [03] or even [ao], with a

Vowel Mergers 9
back upglide. It is often only the presence of the glide that distinguishes
THOUGHT from LOT, as the vowel nuclei are identical. Irons (2007) shows
that younger speakers are losing the glide and merging the two vowels. He
argues that this is not a further expansion of the Western Pennsylvania/
West Virginia merger. Most of the areas where glide loss was found havelow population densities and are far from major transportation routes; for
merger to appear there is not expected under contagious or hierarchicaldiffusion accounts.14
1.4. A COMPREHENSIVE LOOK AT MERGER:LABOV, ASH, AND BOBERG (2006)
Labov, Ash, and Boberg’s (2006) Atlas ofNorz‘h American English consider-ably advanced our understanding of the geographic distribution of the lowback merger and its dynamics in the United States.15Based on telephoneinterviews with 762 speakers, it retraces the three main areas of merger:Eastern New England, Western Pennsylvania (including West Virginia and
parts of Kentucky), and the West, where it is still in progress (59).
The merger is most advancedbefore /n/ (Don ~Dawn),intermediate inhot ~ caught and dollar ~ caller, and least advanced before /k/ (sock~ talk). Afair number of speakers, particularly in the South, were merged only before/n/. However, these speakers were not clustered in any way that would sug-gest that the merger expands SPATIALLYon an environment-by—environ—
ment basis.Of Labov, Ash, and Boberg’s major dialect areas, the South and Mid-
land are outside the isogloss of regular low back merger, but it is in progressin both areas, although sometimes only as a change from “different” to“close,” not “same.” In the Mid-Atlantic and Inland North, which have raised
THOUGHTand fronted LOT,respectively,maintenance of the distinction iswidespread, with no movement toward the merger in apparent time.
In most cases, production—whether the analyst judged the LOT and
THOUGHT vowels in a pair to be the same—agreed with “perception”—whether the subject judged the words in question to sound the same (or torhyme). Where merger wasthe norm, an equal number of speakersdevi-ated from it in production as in perception. But in the transitional andmainly distinct dialect areas, it was three times as common for perception
to lead production: that is, for speakers to judge a pair the same while pro-nouncing it differently (Labov, Ash, and Boberg 2006, 62).
The merger is particularly active in the Midland, where the cities ofIndianapolis, Indiana, and Columbus, Ohio, were examined in detail. Only
10 PADS 952 LOW VOWELS OF SOUTHEASTERN NEW ENGLAND
three speakers there, all over age 40, were fully distinct, and one teenager
was fully merged; 30 others showed intermediate patterns (note similar■ndings for Cincinnati, Ohio, in Boberg and Strassel 1995).
In both Indianapolis and Columbus, Don ~Dawn favored the mergerand sock~ talk the distinction. There was no overall difference between
men and women, and perception led production four to one among asym-metrical subjects (Labov, Ash, and Boberg 2006, 64).
Labov, Ash, and Boberg adopt Herold’s functional explanation of the
merger (see §1.1), although these Midland communities are not adopt-ing the merger in the sudden and total fashion that Herold observed inTamaqua, Pennsylvania. lnstead, age groups are heterogeneous, and transi-
tional patterns last for decades.Assuming that mergers do not retreat, Labov, Ash, and Boberg’s ■nd-
ings also contradict previous research in several places. Providence, Rhode
Island, is fully distinct according to their data,whereasKurath and McDa-vid (1961) had found the merger for all of Rhode Island. This case willbe discussed extensively in chapter 2. Labov, Ash, and Boberg also ■ndthe distinction in two areas where the 1966 telephone survey had found
the merger: (1) central Pennsylvaniaand northern Ohio and (2) southernMinnesota, eastern South Dakota, and eastern Nebraska.16
To summarize, in the dialect areas where the low back merger wasalready characteristic, it has continued toward completion, and in the caseof Western Pennsylvania, it has expanded into an adjacent part of the Mid-land. However, its expansion across dialect boundaries is not usual, with
areas like the Upper Midwest, central Pennsylvania, and Rhode Islandremaining distinct, at least until very recently.17
In the Midland and the South, the merger is a newer phenomenon. It
appears to be developing in parallel across the entire area, replacing moreheterogeneous patterns. In the South, it is less advanced, but progressing
more quickly than in any other region (Labov, Ash, and Boberg 2006, 59).As in the Midland, the Southern merger is not spreading from any particu-
lar point(s) of origin, but is appearing roughly simultaneously in several
states.In much of the South, the merger can only proceed by displacing a
systemwith a back upgliding THOUGHT.In the past, this variety of THOUGHTmight have been pointed out asa structural factor giving the South resis-tance to the low back merger, just asthe raised THOUGHTis believed to be inthe Mid-Atlantic area (and the fronted LOT in the Inland North).
Since chapter 5 will show that communities on the edge of the Mid-18Atlantic area —with raised, ingliding THOUGHT—can yield to the low

Vowel Mergers 11
back merger within a decade,we may wonder whether the Mid-Atlanticand Inland North low vowel patterns really provide protection against
the merger, any more than the traditional Southern pattern seemsto bedoing.
This review of merger givesrise to two general questions. First, when
canwe expect a merger (or other change) to diffuse from one dialect areato another?The amount and typeof contact,whether it isprimarily betweenadults (as Labov 2007 suggests) or also involves the migration of children,and the structural compatibility between the dialects are all relevant here.
We must also askwhether a change really has diffused from place A to place
B, or whether it simply developed in A at an earlier time and in B, perhapsfor similar reasons, at a later time.
Second, what causes the dialects within a dialect area to undergo the
samechanges (including mergers)?Although this has received lessatten-tion than diffusion, it is an equally important question. lnternal phono-logical evolution—transmission and incrementation, in the terms of Labov(2007, 347)—is “the primary source of [linguistic] diversity,” althoughwhen dialects evolve in parallel, no divergence need result.
The Stammbaum (‘family tree’) model of linguistic diversi■cation
assumesthat populations of speakersinherit and passdown the majorityof their language faithfully. When innovations occur, divergence arisesbetween dialects if they are no longer in contact. Within each population,innovations diffuse more or less completely. Bloomfield’s density principleis a re■nement of this: “When any innovation in the way of speaking spreads
over a district, the limit of this spread is sure to be along some lines of weak-
ness in the network of oral communication” (1933, 476).This diffusionist model is challenged by the Midland and Southern low
back mergers, and more impressivelyby the Northern Cities Shift (Labov,Ash, and Boberg 2006, chap. 14.2) and the Southern Shift (chap. 18.3).Whether or not the boundaries of these large areas are “lines of weaknessin the network of oral communication”—they are probably not19—the
practically simultaneous and nearly identical development of these com-plex shifts, throughout dialect areashundreds of miles wide, practicallyrules out an explanation whereby these innovations diffuse; they must be
internal processes.But if they are, is their incrementation mainly social orstructural? That is, do children learn the direction and speed of changes
from observing older members of their communities—the “inherited agevectors” of Labov (2007, 346)—or is linguistic change more deterministicthan that?

1 2 PADS 952 LOW VOWELS OF SOUTHEASTERN NEW ENGLAND
1.5. THE STUDY OF MERGER ON THREE LEVELS
This study has three main parts. The school survey (chap. 3) will examineconstraints on individuals acquiring the low vowels, asrevealed by their eval-uation of minimal pairs on a questionnaire. The geographic study (chap.4) will locate and describe the boundary between dialects with different
patterns of merger. And the family study (chap. 5) will explore the processof merger as it affects speech communities where the low back merger is
recent or ongoing.
When Kerswill (1996, 200) ranks phenomena in a “dif■culty hierar-chy” with respect to their ease of acquisition—■nding that mergers aremuch easier to acquire than distinctions—the focus is on the individual
level. Chapter 3 supports this conclusion, fleshing it out with the details ofparental and peer influences.
Herzog’sPrinciple that “mergersexpand at the expenseof distinctions”is a generalization on the dialect level. Chapter 4 does not ■nd widespreadexpansion, but a long period of stability followed by expansion in some
areas.Connecting these two is an account of merger at the speech commu-
nity level. Chapter 5 will describe sudden merger by expansion among chil-
dren in severalspeechcommunities and offer a demographic explanationfor why and when the mergers took place.
First, chapter 2 givesbackground on the study area and the results ofprevious researchon the low vowelsin England and New England.

2. THE LOW VOWELS
OF NEW ENGLAND: HISTORY AND
DEVELOPMENT
FOLLOWINGZELINSKY’S(1973) DOCTRINEof First Effective Settlement,1
section 2.1 focuseson the earliestperiod of NewEngland history, includingthe origins of the English settlersand what can be concluded about the lowvowels in that period.
Section 2.2 reviews the contributions of the Linguistic Atlas of NewEngland (LANE 1939—43) and related studies. The best-known publicationderived from LANE’s data, Kurath and McDavid’s (1 961) The Pronunciation
of English in the Atlantic States,tended to oversimplify matters, and rather
infamously placed the low back merger in Rhode Island and eastern Con-necticut. The reasonsfor this error, and the literature correcting it, will bereviewed.
Section 2.3 reviewsthe ■ndingsof Labov,Ash, and Boberg (2006) andtheir relationship to earlier results.Section 2.4 is an auditory and acousticanalysisof the early “Hanley recordings” (S. Hall et al. 2002) from south-easternNew England.
Together, these sources suggest a certain interpretation of the histori-cal development of the low vowels in New England, given in section 2.5.
By 1900, two dialect areashad mainly solidi■ed in southeastern NewEngland, with the two largest cities, Boston and Providence, on either side
of the divide. Section 2.6 describes the pilot study carried out to locate theboundary between these two dialects.
2.1. THE HISTORY OF THE LOW VOWELS AND
THE SETTLEMENT OF (SOUTHEASTERN)
NEW ENGLAND
Settlement history is clearly relevant to the linguistic geography of a ter-ritory if there are retentions, current features whose distribution can becorrelated with settlers’ origins. For example, many believe that EasternNew England speech is nonrhotic because its settlers mainly came fromsoutheastern England, a region that led in the loss of postvocalic /r/. The
settlers of Appalachia, on the other hand, mainly came from places that
13

14 PADS 95' LOW VOWELS OF SOUTHEASTERN NEW ENGLAND
were likely rhotic then (northern England) or are still rhotic today (Scot-
land, Northern Ireland).2However, some view the history of American English more in terms
of divergence than retention. According to Dillard (1995, 6), most emi-grants spoke a standardized form of English, and any differences that did
get imported were “very strikingly leveled” by the eighteenth century, whenBritish travelers noted “how the Americans spoke English of amazing uni-formity.”
But even if most regional differences developed later on American
soil, it is still important to trace settlement patterns. Placeswith a commonsettlement history share a linguistic starting point: the output of the sameleveling. They may also share lasting cultural ties. Innovations are morelikely to havedeveloped in parallel within suchsettlement areas,or at leastto have diffused within them.
It is not fully known where in England the ■rst settlers of New England
came from. “In Bradford’s ‘History of Plymouth Plantation’, where he gives
a detailed list of the passengers of the Mayflower, there is not one refer-
enceto the family origin or home parish of anyone of the Pilgrims” (Banks
1930, 12). Historians have reconstructed the origins of some, though notall, of the settlers.
Information on seventeenth-century English regional dialects—assum-
ing they were spokenby at leastsomeof the settlers—islessavailable.Whatis known does not appear to shed much light on the low back vowels. The
mergers that arose appear to be indigenous American developments.Better recorded are the patterns in which the land of southeastern New
England wastaken up in the seventeenthand early eighteenth centuries,
aspeople fanned out from the early coastalsettlementsand founded newones in the interior. New towns split off from older ones, and larger townsdivided as they grew. At the same time, there was continued immigration
from England, aswell asmobility within and between the colonies.
2.1.1. THE ORIGINS OF THE FIRST ENGLISH SETTLERS.The original NewEngland colonies, illustrated in ■gure 2.1, were Plymouth (1620), New
Hampshire (1623), MassachusettsBay (1628), Saybrook (1635), Connecti-cut (1636), Rhode Island (1636), and New Haven (1638). We will be con-cerned mainly with Plymouth, MassachusettsBay,and Rhode Island.3 Ofthese, Massachusetts Bay grew the largest and contributed to the settlementof the other two colonies.
2.1.1.1. Plymouth Colony.The original Pilgrims, or Separatists, were a con-gregation from Scrooby, Nottinghamshire. Most were originally from that

figure 2.1
connecticut(1636)
newnetherland
new hampshire(1623)
massachusetts bay(1628)
rhode island(1636)
plymouth (1620)
connecticut(1636)
newhaven(1638)
(conn.)
Hud
son
R.
ATLANTICOCEAN
Conn
ectic
utt R
.
saybrook(1635)
newnetherland
Portsmouth
Salem
Boston
Plymouth
ProvidenceHartford
NewHaven
NewAmsterdam
0 50 mi
0 50 km
Low Vowels of New England 15
FIGURE 2.1The New England Colonies
3.§ ':N3f,
.S ( NEW HAMPSHIRE ‘
a“?-" (162) P,-‘l 3Portsmouth
Salem
MASSACHUSETTS BAY
W(1628) Boston'gfx
4: . .g ‘. ,x"_§ """""""""" .' T‘Z‘LX" Plymoutl:»m NEW {'1 Prcividence ' PLYMOUTH
HAVEN ,' . Hartford '1 ' (1620) 4(1638) i CONNECTICUT :' ‘b ‘
", y,
_..C(«1636)5 g] A‘ ‘ '1’ .-
,i oéf:?3'1,‘;“.“
0xx “1 11H‘
Vi
a“a
<%>
|
ii1'iili|igr”I
s. A-
NEW%
“V.“ El RHODEISLANDNETHERLANW
SAYBROOK(1636)
" ~1( (1635)New_/Amsterdam1
/ 7.” \ ATLANTIC
’ ,7 / (C0NN.) OCEANn
N 0 50 min‘ l—l—l
J 0 50km
county or adjacent South Yorkshire (Richards 2004, 42). After spending
12 years in the Netherlands, they sailed to found Plymouth in 1620. How-
ever, the Separatists congregation comprised only about 40 of the 102 pas-sengers aboard the May■ower;most of the others whose origins are known
came from London, Essex, and Norfolk (Banks 1930).4
Nearly half the May■owerpassengers died during the ■rst winter, but
the next 10yearssawseveralhundred more settlerscome to Plymouth. By1630 an effective settlement had been made, and the colony expanded
along the shore and into the interior. The settlerswere a mix of Pilgrimsfrom the East Midlands, Londoners, and people from the eastern counties.
The easterncomponent wasenhanced over the next decades,asPlymouthattracted immigration from the new MassachusettsBaycolony to the north(Kurath et a1.1939, 68). In 1691, Plymouth was absorbed politically byMassachusetts.

16 PADS95: LOWVOWELSOFSOUTHEASTERNNEWENGLAND
2.1.1.2. MassachusettsBay Colony.Although several settlements preceded it,the founding of Boston in 1630 began a wave of emigration so signi■cant
that it has come to be called “The Great Migration.” Some 21,000Englishsettlers,mainly Puritans, cameto MassachusettsBaybefore the outbreak ofthe English Civil War in 1640.
Fischer (1989) argues that emigration from “EastAnglia” (see11.4)
was the dominant element in the settlement of Massachusetts Bay, effect-
ing a cultural transplant crucial for the history of New England (and otherAmerican regions settled from there). But for some historians, “massesofevidence do not fit” Fischer’s thesis (V. Anderson 1991, 235), which “has tobe quali■ed in so many ways that its meaning becomes tenuous” (D. Hall
1990,659)Fischer (1989, 33) describes60% of the Great Migration settlers as
coming from a nine-county area in the east of England, but Banks (1930,14) suggests a more even distribution: Norfolk, Suffolk, and Essex, 2 1.5%;
London, MiddleseX, Sussex, and Kent, 20%; other counties surrounding
London, 11%; Cornwall, Devon, Dorset, and Somerset, 16%; Midlands
counties, 9%; and 22.5% from other parts of England, or elsewhere.The distribution of settlers’ origins may have been somewhat different,
as Banks was able to trace only 2,646 Great Migration settlers. Emigrantsfrom London and/ or lower-class backgrounds would have been harder totrace than most provincials. Another under-recorded group was womenand children, who “came from the East of England in larger proportions
than men,” writes Fischer (1991, 266), tenaciouslydefending the thesisofan eastern migration.
A more recent project is compiling “comprehensive genealogical andbiographical accounts of every person who settled in New England between1620 and 1643” (R. Anderson 1993), but it is designed for studying indi-
viduals. It would be a major undertaking to tabulate this data by Englishcounty of origin and New England point of destination.
But it is clear that the regional origins of groups of settlers were cor-related with their destinations in Massachusetts Bay. In a 27-town sample,
Fischer (1991, 270) concedesthere wasgreatvariation in the proportion of
easternEnglish origins, from lessthan 15% in Gloucester and Weymouthto over 70% in Dedham, Hingham, and Watertown.
Settlers with origins in the South and West of England, too, were rarein some places (less than 15% in Boston, Charlestown, and Roxbury) and
a majority in others (more than 60% in Dorchester, Gloucester,and Wey-mouth). And the estimatedproportion from London, though never high,reached 20% in Boston and Cambridge, compared with none in Glouces-
ter and Hingham.

Low Vowels of New England 17
The average for the 27 towns is 55% from the East, 27% from the South
and West,and 9% from London. Evenwith Fischer’slikely Easternbias,heacknowledges the regional diversity of Massachusetts Bay settlement.
Assuming that the settlers from different areas spoke differently—
which isvery likely evenif they did not speakbroad regional dialects—theremust have been a great deal of dialect leveling early in the history of Massa-chusetts. Any differences between nearby towns like Boston, Dedham, and
Dorchester have not survived. There seemsto have been leveling withineach colony, or at least within the major areas of each colony.
2.1.1.3 RhodeIsland Colony.The settlers of Rhode Island were a more diverse
group, both becausethe colony wasan amalgamationof severalsettlementsand becausethe liberal policies of the Rhode Island government attracted
a wider spectrum of people than were tolerated in Plymouth, let alone inMassachusetts Bay.
After RogerWilliams wasbanishedfrom Massachusettsfor his religiousviews, he founded Providence in 1636 at the head of Narragansett Bay.
“A haven for thosepersecutedelsewherefor their conscientiousbeliefs,” itgrew slowly, with settlers from Massachusetts, Plymouth, Connecticut, and
directly from England (McLoughlin 1978, 3—17).
In 1638, Anne Hutchinson and a group of allies were banished fromBoston, and they began a settlement later called Portsmouth on the north-
ern end of Aquidneck (or Rhode) Island. The next year, part of this groupmoved to the other end of the island and founded Newport. These settle-
ments grew faster than Providence, though not as quickly as those in Mas-
sachusettsBay (McLoughlin 1978, 18—25).From the start, there was a rivalry with Massachusetts Bay and a border
dispute that wasnot fully settled until 1862.At the height of it, the Provi-dence and Rhode Island settlementsunited, beginning in 1647. (Duringthis early period, the eastern shore of Narragansett Bay was disputed, butof■cially it was Plymouth Colony territory.)
Though it already had a population of Catholics and Jews, RhodeIsland’s diversity increased with the arrival of the Quakers in the 1650s. This
likely brought to Rhode Island somevarieties of speechfrom the North ofEngland, a region poorly represented in Plymouth and MassachusettsBay.However, the Rhode Island Quakers arrived after an effective settlement
was already made.Once the ■rst effective settlements were made and leveled varieties
establishedin each colony, the regional origins of any new English settlersbecame lessimportant. The colonial dialects would have developed fairly

18 PADS95: Low VOWELSOFSOUTHEASTERNNEw ENGLAND
independently, especially as the colonies were rather isolated from eachother throughout the seventeenth century.
As their populations increased, through immigration and naturalgrowth, the colonies expanded geographically, and it is to these internalsettlement patterns that we now turn.
2.1.2. THESETTLEMENTPATTERNSOFSOUTHEASTERNNEwENGLAND.WhileKurath (1928) believed that American regional dialect differences corre-sponded to and derived from British ones,when it cameto delineating thedialect areaswithin NewEngland, Kurath et al. (1939) referred to internalsettlement patterns, not patterns of British origin. Likewise, Bloch (1935)reconstructed the original rhoticity status of 11 New England settlement
areas,but did not attempt to link this to settlers’ origins or to earlier Britishdialects,citing a lack of information about both.
Kurath et al. (1939) divide New England into major eastern and west-
ern areas.Within southeastern New England, they reconstruct the mainthrusts of internal settlement asfollows (Plate 1, following p. 240):
(1) from Plymouth: north and south along the coast, then westward into the inte-rior; (2) from Massachusetts Bay: westward into most of the present state of Mas-sachusetts (and northeast Connecticut); (3) from Rhode Island: westward into theinterior of the present state, and eastward into original Plymouth territory.
A more detailed description of the settlement patterns involves anunderstanding of the political boundaries in the region during the colonialperiod. Where boundaries were disputed, a more complex pattern of settle-
ment resulted.The boundary between Plymouth Colony and Massachusetts Bay, a
diagonal line running southwestfrom the ocean to the Rhode Island bor-der (see■gure 21), wasestablishedin 1640.The line is now the boundarybetween Massachusetts’sNorfolk County and Plymouth and Bristol coun-ties.
Rhode Island’s northern boundary was long disputed but never moved
signi■cantly.On the other hand, it easternboundary—in conflict ■rstwithPlymouth, then with Massachusetts—has undergone signi■cant changes
(see■gure 22).In 1746, King George II awardedRhode Island the town of Cumber-
land in the northeast corner of the state, and the towns of Bristol, Warren,
Tiverton, and Little Compton on the eastern shore of Narragansett Bay.These places had been settled under the auspices of Plymouth, though notall their settlers had come from there.
In 1862, a smaller adjustment occurred, when Massachusettsreceivedthe northern end of Tiverton in exchangefor the western half of Seekonk,

figure 2.2
massachusetts bay
rhodeisland
plymouth
BostonHull
Weymouth Scituate
Marshfield
DuxburyBridgewater
Plymouth
MiddleboroughTaunton
Eastham
YarmouthBarnstable
Sandwich
Falmouth
Little Compton
Rochester
Dartmouth
Providence
Rehoboth
Freetown
Swansea
Portsmouth
Bristol
Woonsocket
E. Providence
Pawtucket
Warwick
Cranston
Newport
0 25 mi
0 25 km
Low Vowels of New England 19
FIGURE 2.2Disputed Border between Plymouth and Rhode Island Colonies
Bostona
-Hull
25 mi
MASSACHUSETTS BAY 0 25 kmIWeymouth Scituate
Marsh■eld.
_Dquury ‘
BrldgewaterWoonsocket .
PlymouthTaunton
Pawtucket. Rehoboth Middleborough
. Eastham
E. Providence Freetown PLYMOUTHProvidence I
Cranston.Sw sea .
. IWarwick Rochester .
Sandwmh.
Yarmouth
BarnstableRHODE
13%Dartmouth
ISLAND LB FalmouthFor 0
. fLittle Compton &(5Q
(IQ
which became East Providence, Rhode Island. The city of Pawtucket, Massa-
chusetts, was also transferred, becoming the east side of Pawtucket, Rhode
Island.
Since it is along the modern Massachusetts—RhodeIsland boundarythat this study was conducted, it is important to understand how the three
settlement currents cametogether near the borders of their respectiveter-ritories.
Table 2.1 shows the “family tree” of the study area of chapter 4. There
are 40 communities: 29 in present-day Massachusetts, 11 in Rhode Island.
In the leftmost columns the original townsare in bold, townsthat split fromthem are in normal type, and further divisions are in italic and small type.The dates in the center columns show that some “daughter” places weresettled much earlier than they were incorporated, sometimesjust asearly
as their parent towns.The rightmost column gives information on the origins of the ■rst
settlers of each place. We see that two early Plymouth Colony settlementsthat produced many daughter towns in the study area did not have pre-dominantly Plymouth settlers.Taunton wassettled by a group mainly fromDevon and Somerset in southwest England. Rehoboth, the parent town ofAttleboro and Seekonk (a focus of chapter 5), was settled from several Mas-

table 2.1
Colony & Town/City Code Incorp. Settled Settled Frommassachusetts bay Mendon ME 1667 1660 Mass. (Braintree, Weymouth) Bellingham (part) BH 1719 1713 Uxbridge UB 1727 1662 Blackstone BS 1845 1662 Millville MV 1916 1662 Wrentham WR 1673 1669 Mass. (Dedham) Bellingham (part) BH 1719 1713 Foxborough (part) FB 1778 1704 Mass. (Dorchester) Franklin FK 1778 1660 Mass. (Dedham) Plainville PV 1905 1661 Douglas DO 1775 1721 Mass. (Sherborn, Natick)plymouth (mass. bay after 1691) Taunton TA 1639 1638 Eng. (Taunton) via Ply. & Mass. Norton NT 1711 1669 Taunton North Precinct Mansfield MF 1775 1659 Dighton DI 1712 1678 Taunton South Purchase Berkley BK 1735 1638 Rehoboth RE 1645 1644 Mass. (Weymouth etc.), Ply. Swansea SW 1667 1667 Warren WA 1717 1676 Barrington BA 1770 1676 Somerset SO 1790 1677 Attleboro AB 1694 1662 Rehoboth North Purchase Cumberland CL 1747 1662 Woonsocket (part) WS 1867 1695 N. Attleborough NA 1887 1669 Seekonk SK 1812 1644 Pawtucket (part) PT 1828 1644 E. Providence EP 1862 1644 Dartmouth DM 1664 1650 Plymouth, R.I. Little Compton LC 1682 1675 Tiverton TI 1694 ? Westport WP 1787 1670 Plymouth, R.I. (Portsmouth) New Bedford NB 1787 1640 Fairhaven FH 1812 1670 Acushnet AC 1860 1659 Middleborough 1669 1660 Plymouth Lakeville LV 1853 1717 Freetown FT 1683 1659 Plymouth (Scituate, Marshfield) Fall River FR 1803 1670providence (rhode island after 1647) (Gloucester) 1713 1706 Providence Burrillville BV 1806 1706 (Smithfield) 1731 1636 Providence N. Smithfield NS 1871 1672 Woonsocket (part) WS 1871 1695 (Lincoln) 1871 1650 Central Falls CF 1895 ? (N. Providence) 1765 1636 Providence Pawtucket PT 1874 1655
2O PADS 952 LOW VOWELS OF SOUTHEASTERN NEW ENGLAND
TABLE2.1Settlement History of the Study Area of 40 Cities and Towns
Colony Ca”Town/City Code Incorp.
MASSACHUSETTSBAYMendon ME 1667
Bellingham (part) BH 1719Uan'dge UB 1727Blackstone BS 1845
A■dv■k ATV 1916Wrenthaxn WR 1673
Bellingham (part) BH 1719Foxborough (part) FB 1778Franklin FR 1778Plainville PV 1905
Douglas DO 1775
PLYMOUTH(MASS.BAYafter 1691)Taunton TA 1639
Norton NT 1711Mans■eld MF 1775
Dighton D1 1712Berkley BK 1735
Rehoboth RE 1645
Swansea SW 1667Warren WA 1717
Barrington BA 1770Somerset SO 1790
Attleboro AB 1694
Cumberland CL 1747Woonsocket (part) WS 1867
N. Attleborough NA 1887Seekonk SK 1812
Pawtucket (part) PT 1828E. Providence EP 1862
Dartmouth DM 1664
Little Compton LC 1682Tiverton Tl 1694
Westport WP 1787New Bedford NB 1787
Falrha-oen FH 1812Acushnet AC 1860
Middleborough 1669
Lake■He LV 1853Freetown FT 1683
Fall River FR 1803
PROVIDENCE(RHODEISLANDafter 1647)(Gloucester) 1713
Burrillville BV 1806
(Smithfield) 1731N. Smith■eld NS 1871Woonsocket (part) WS 1871(Lincoln) 1871
Central Falls CF 1895
(N. Providence ) 1765Pawtucket PT 1874
Settled
16601713166216621662166917131704166016611721
1638166916591678163816441667167616761677166216621695166916441644164416501675
P16701640167016591660171716591670
170617061636167216951650
P16361655
Settled From
Mass. (Braintree, Weymouth)
Mass. (Dedham)
Mass. (Dorchester)Mass. (Dedham)
Mass. (Sherborn, Natick)
Eng. (Taunton) Via Ply. & Mass.Taunton North Precinct
Taunton South Purchase
Mass. (Weymouth etc.), Ply.
Rehoboth North Purchase
Plymouth, R.l.
Plymouth, R.l. (Portsmouth)
Plymouth
Plymouth (Scituate, Marsh■eld)
Providence
Providence
Providence
Low Vowels of New England 21
sachusetts and Plymouth towns, but largely from Weymouth, which had ahigh proportion of WestCountry settlers.
For the most part, later-incorporated towns drew their population fromtheir parent towns. Taunton grew and spawned Norton, Dighton, and Berk-ley; Swansea, Attleboro, and (later) Seekonk were set off from Rehoboth.5
Uxbridge, Blackstone, and Millville, however, were not secondary settle-
ments; they were settled around the sametime asthe rest of Mendon.If linguistic divisions closely corresponded to settlement patterns, we
would expect a clear boundary to follow the northern border of RhodeIsland, where communities derived from Providence (Burrillville, NorthSmith■eld) abut ones detached from Mendon in Massachusetts Bay(Uxbridge, Blackstone, Millville).
Wemight alsoseea difference between the Wrentham daughter townsderived originally from Dedham, a strongly east-of-England settlement, andthose derived from Taunton, Rehoboth, and Dorchester, which had moreWest Country settlers. This would be a line between Wrentham and Plain-ville on the west, Foxborough and Mans■eld on the east.
Linguistic boundaries might be more unclear along the eastern shoreof Narragansett Bay, where communities like Dartmouth (Kilpatrick 1937,49) and Westport (Kurath et al. 1939, 179) had a mixed Plymouth andRhode Island settlement history. In Somerset, Swansea, and Seekonk, the
majority of the settlers were probably from Rehoboth, but some wouldhave come from Rhode Island. Kilpatrick (1937, 49) even suggests that the
EastBaydeveloped a culture distinct from the rest of individualistic RhodeIsland, due to the “stabilizing influences of communitarian Plymout
Little Compton, Tiverton, Warren, Barrington, and Cumberland also
likely had some original Rhode Island settlement, aswell asbeing part ofthat state for the last 250+ years. If Cumberland were still like its parenttown of Attleboro, this would truly be a testament to the doctrine of FirstEffective Settlement. (But aswe will see, it is not.)
Chapter 4 will show that current linguistic boundaries match these pre-dictions in the north, where a phonological boundary runs along the settle-
ment (and state) line. In the east, the line runs further into Massachusettsthan expected. And instead of always dividing settlement subareas, it cutsthrough two of them (Dartmouth and Rehoboth).
2.1.3. THELOWVOWELSOFENGLISHIN THESEVENTEENTHCENTURY.Set-tlers’ origins and settlement history could have relevance for any dialectfeature. This study focuses on the low vowels, so we examine their status atthe time of settlement, starting with the developing standard variety. Evenif some emigrants used broad English regional dialects, they might have

22 PADS 952 LOW VOWELS OF SOUTHEASTERN NEW ENGLAND
spoken more standardly in the dialect contact situation they now found
themselvesin. Others, due to their geographical or socialorigins, probablyspoke this developing standard natively.
2.1.3.1. Low Vowelsin theDevelopmentof British Standard English: E.]. Dobson.
The low vowels were undergoing substantial change in England duringthe seventeenth century; they had not arrived at the con■guration PALM[0:], LOT [D], THOUGHT [3:] found in present-day southern British English,
including Received Pronunciation (RP) (Wells 1982, 119). What followsrecapitulates the most important changes described in Dobson (1957).
Many words in our PALM, LOT, and THOUGHT sets had the Middle
English vowels a, 6, and au, respectively, but the correspondence is notalways one-to-one. Middle English a was always [a], but in the seventeenth
century it underwent a split. In most environments (TRAP)it stayedshort,but in syllables closed by /r/ (START) or one of the front voiceless fricatives/f/, /s/, or /6/ (BATH), it lengthened.
“Pre-R Lengthening” was widespread, but only some dialect areas,including southern England and Eastern New England, underwent the“TRAP-BATHSplit” (Wells 1982, 199—206).As with nonrhoticity, EasternNew England’s similarity to the British standard can be attributed to settle-
ment history and/ or to later contact.
Severalother phonetic environments also causeda to lengthen. Theword father lengthened in almost all dialects of English. In lengtheningrather, Eastern New England again tends to agree with the mother country.
In RP, lengthened a ended up backed to [or] while unlengthened a
was fronted to [LB]. Although their earlier phonetics are much debated,
the most important thing is the length difference. In anygiven dialect, thewords that have lengthened a form part of our PALMclass (see chap. 1, n.1).6 This includes many foreign borrowings with [a] in the original lan-
guage (e.g., Ohama) (see Boberg 1997).The changes undergone by a in the seventeenth century were paral-
leled by 6, pronounced [3] in Middle English. In most environments (LOT),
6 remained short, but it lengthened before tautosyllabic /r/ (NORTH) and
before /f/, /s/,and /G/ (CLOTH).The lengthening of 6 before /r/ happenedalmost everywhere.Before the fricatives, the “LOT-CLOTHSplit” would sur-vive in America but eventually die out in England (Wells 1982, 204). In
southern England, the CLOTH~ THOUGHTmerger was either never com-plete (Dobson 1957), or it reversedthrough dialect contact (Wells 1982).The two word classesare largely in complementary distribution (exceptionslike sauceare rare), perhaps easing a reversal. Other words with 6 length-ened, such as broad, and in some dialects, on and/ or gone. Lengthening

Low Vowels of New England 23
before /13/hasbeen almost universal in American dialects;before /9/ it hasbeen very irregular.
Words with unlengthened 6 form our LOTword class.In most Eng-lish dialects, including RP, LOT lowered but remained rounded: [D]. But anunrounded [(1] also developed in the South of England.7
Words with lengthened 6 form part of our THOUGHTclass.8The rest of
this classderivesfrom au, a diphthong that arosein early Middle Englishfrom a before /g/, /h/, or /w/ (e.g., law, taught, claw) or from French au and
a0 (e.g., laud, fawn). Circa 1400, au developed from a in syllables closed by
/l/ (e.g.,palm, half) or /X/ (e.g., thought)and in French borrowings before/m/ or /n/ (e.g., dance,lawn) (Dobson 1957, 553—56).
As Standard British English developed, all these subclasseshad [au] inthe ■fteenth century, backing to [ou] in the sixteenth century, and [Du] in
the seventeenth century (Dobson 1957, 783). That evolution was a deadend, but over the same period, a competing development was a monoph-
thongization that resulted in aumerging with lengthened 6 (NORTH,CLOTH,broad, etc.). Dobson places this monophthong at [3:] in the seventeenth
century, which would make the same realization, as found today in RP, con-servative. Others suggest [or] for lengthened 6 (from [a] for unlengthened
6), with au monophthongizing to [or]. Any backing and rounding wouldhave occurred only later, perhaps in parallel with the backing of PALMfrom[a:] to [or].
In syllables closed by /m/ (palm), /f/ (half), /v/ (halve), and /nC/ (dance),
au also monophthongized, but wound up further front—call it [a:]—fallingin with lengthened a (START, BATH, father, etc.), and completing our PALM
class.
This alternate monophthongization from au to [a:] made lengtheneda, previously a mere allophone, into a separate phoneme, with contrastslike aunt~ ant, palm~Pam (Dobson 1957, 536). The number of minimalpairs remained small if postvocalic /r/ wasretained, but its loss created ahuge number like cart~ cat.
Outside Eastern New England, American English presents a puzzle:words like danceand half do not have the expected PALMvowel. For dance,this may derive from an early variant with a, not au (Dobson 1957, 555).The case of half is more problematic: the change of a to au before /l/ longpredated American settlement, so half and calf should have developed like
palm and calm.Why American dialects escapedthis regular development“has not been satisfactorily explained” (Wells 1982, 143).
Tables2.2—2.6summarizethe developmentsfrom Middle English intothe modern period, where the results are given for RP,Eastern New England(e.g., Boston), and Western New England (e.g., New Haven). The develop-

table 2.2
[a] [ ] [au] trap lot thought bath cloth palm father broad half start north dance
table 2.3
(bath) (bath) lot (thought) (thought) (palm) (cloth) (cloth) (palm) trap (half ) (half ) (half ) (dance) (dance) (dance) (dance) (father) (father) (broad) (broad) start north
table 2.4
trap bath lot thought palm cloth broad half dance father start north
table 2.5
[ ] [ ] [ ] trap palm thought (bath) (bath) broad (half ) (half ) lot
[ ] father cloth
dance
start north
24 PADS 95' LOW VOWELS OF SOUTHEASTERN NEW ENGLAND
TABLE2.2Pronunciation of Low Vowel Word Classes:
Late Middle English (Fifteenth Century)
a 0 au[21] [3] [an]
TRAP LOT THOUGHT
BATH CLOTH PALMfather broad halfSTART NORTH dance
TABLE2.3Pronunciation of Low Vowel Word Classes:
Developing Standard British English (Sixteenth—Seventeenth Century)
[86]~ [21] [at] [3]~ [D] [3:] [a11]~[DU]
(BATH) (BATH) LOT (THOUGHT) (THOUGHT)
(PALM) (CLOTH) (CLOTH) (PALM)
TRAP (half) (half) (half)(dance) (dance) (dance) (dance)
(father) (father) (broad) (broad)
START NORTH
TABLE2.4Pronunciation of Low Vowel Word Classes:
Standard British English (Modern RP)
[26] [0:] [D] [3:]TRAP BATH LOT THOUGHT
PALM CLOTH broad
halfdance
fatherSTART NORTH
TABLE2.5Pronunciation of Low Vowel Word Classes:
Eastern New England (Modern Boston)
[8?] [at] [DI]TRAP PALM THOUGHT
(BATH) (BATH) broad
(half) (half) LOT
[629]father CLOTHSTART NORTHdance

table 2.6
[ ] [ ] [ ] trap lot thought bath palm broad half father cloth
[ ] [ ] [ ] dance start north
Low Vowels of New England 25
TABLE2.6
Pronunciation of Low Vowel Word Classes:
Western New England (Modern New Haven)
[as] [a] [:39]TRAP LOT THOUGHTBATH PALM broad
half father CLOTH
[e9] [01] [:31]dance START NORTH
ments are shown for eight of Wells’s (1982) lexical sets: TRAP, BATH, PALM,
START, LOT, CLOTH, THOUGHT, and NORTH, and for father, half, dance, and
broad, which show different origins and/ or evolutions.
Dobson (1957) never mentions any merger involving unlengthened6, which fell from [3] to [D] and/ or [a] while [3:] was developing from au.
But becauseof their phonetic closeness,the LOT~ THOUGHTmerger wasat least conceivable in the seventeenth century. On the other hand, the
new PALMclass, being [a:], was not close enough phonetically to LOT for a
merger to be plausible.Another factor inhibiting any merger in the seventeenthcentury was
the alternate pronunciations thesevowelsretained in the speechof olderor more conservative speakers. For PALM words like palm itself, this was [3:]
or [nu]; for the BATH and START subsets, it was [a]. For LOT, the conserva-tive pronunciation was [3]; and for THOUGHT, it was [Du]. These sounds are
phonetically very far apart, even more so than the innovative pronuncia-tions.
Since Dobson (1957) is based on the testimony of contemporaryorthoepists, phoneticians, and spelling reformers, one would expect somemention of a merger among these word classesif there had been any suchtrend. However, Dobson’s focus was on the development of the Londonstandard; he did not take into account purely regional developments.
2.1.3.2. Low Vowelsin English RegionalDialects:joseph Wright. Using TheEng—lish Dialect Grammar (Wright 1905), we can see the phonetic developments
of the low vowel word classesin nineteenth-century English regional dia-lects. Following Garde, any merger that existed at the time of Americansettlement would still be observable.
WestSomersetis one of the only locations showing awholesalelength-ening of Middle English 6 to [3:] (with conversion of Wright’s phoneticalphabet to IPA) in, for example, stop, cot, and ■ock as well as in, for exam-

table 2.7
Late ME Source RP NE Norfolk E Suffolk Dorset W Somersetstart a + rhalf au + flot o + tcloth o + thought o + xtalk au + klaw auVowels – 3 3 3 3 2
26 PADS95: Low VOWELSOFSOUTHEASTERNNEw ENGLAND
ple, broth and lost (Wright 1905, 73—74). In this same dialect, the usual
THOUGHT class appears either as [3:] in, for example, thought and talk, or as[CI] in, for example, brought, saw. The same [CI] is found in, for example,
path, hard, and half.
So there are two low vowels where the standard has three, but differ-
ences of phonemic incidence, like saw appearing as a PALMword, makes
it slightly misleading to call the situation in West Somerset—wheremanyof the settlers of Taunton in Plymouth Colony originated (§2.1.2)—a
LOT~ THOUGHTmerger.In the adjacent West Country county of Dorset—whence came many of
the settlers of Dorchester in Massachusetts Bay—we ■nd three low vowels.
Despite much lengthening, a LOTcategory still exists.And though wordslike talk have joined the PALM class, a distinct THOUGHT class remains, for
example, thought itself.Between West Somerset and Dorset, both inventory and incidence are
different. Differences in incidence alone might lead to merger in a situa-tion of dialect contact, although here the most confusion is between PALMand THOUGHT (which never merge in American dialects without LOT aswell).
The records for northeast Norfolk and east Suffolk, in East Anglia,
show similar developments to RP. They both have three low vowel catego-ries, although the incidence of THOUGHTis not always standard. Table 2.7summarizes the evidence of these dialects and the standard for the most
common sources of the modern low vowels. Since eastern and southwest-
ern emigrants were the most numerous settlers of early New England and
an early standard was probably also spoken, the table should give some ideaof the components of the dialect mixture.
TABLE 2.7
Evolution Of Low Vowel Word Classes in West Country
and East Anglian Dialects (from Wright 1905)
Late ME Source RP NE Norfolk E Su■olk Dorset WSomerset
START a + r [0:] [0:] [0:] [01:] [01:]
HALF au +f [0:] [0:] [0:] [01:] [01:]
LOT 5 + t [D] [D] [D] [D] [3:]
CLOTH 5 + 6 [D] [D] [D] [3:] [3:]
THOUGHT 5 + x [3:] [3:] ~ [Au] [0:] ~ [Au] [3:] [3:]
TALK au + k [3:] [3:] [3:] [01:] [3:]
LAW au [3:] [3:] [3:] ~ [01:] [01:] [01:]
Vowels — 3 3 3 3 2

Low Vowels of New England 27
Except for the development in, for example, saw, the two-vowel pattern
in WestSomersetis quite similar to EasternNew England’s. However,eventhough Taunton, Massachusetts, was settled largely from Somerset, it seemsunlikely that this regional dialect wasresponsible for the much larger areaof low back merger in Eastern New England.
Contact between dialects, rather than any single one, may have contrib-uted to the low back merger. For instance, the CLOTHset was likely merged
with THOUGHTin the WestCountry dialects,while in the EastAnglian vari-eties it may never have split from LOT.The mixture of thesesystemscouldhave caused confusion and abandonment of the LOT ~ THOUGHT distinc-tion, although aswe shall see, this merger was not complete until some 250
years after settlement.Based on a 1930s dialect survey, Kurath and Lowman (1970, 25—26)
reported the LOT ~ THOUGHTmerger acrossthe entire southwest of England
as “an unrounded low vowel [D~ a], varying in length.... In this dialect
area hawk rimes with lockand boughtwith lot.”9
But Wright, ageneration earlier,had not encountered this largemergedarea—West Somerset was exceptional—nor did the Survey of English Dia—lects (Orton et al. 1962—71) a generation later. Leaving aside the CLOTH
set,Wright and Orton et al. consistentlydistinguish THOUGHTfrom LOTbylength, if not by vowel quality aswell. Nor doesWakelin (1988) questionthe length distinction.
Especiallyconsidering Kurath’s handling of the samealleged mergerin Rhode Island (§2.2), we can tentatively overrule his analysishere andsuppose that English dialect speakers generally distinguished LOT and
THOUGHT in the early twentieth century—and thus, by Garde’s Principle,
did soin previous centuries aswell.As far as the Western New England or “General American” merger
of PALMand LOT is concerned, we have no report of it in England at anyperiod, so it seems even safer to sayit did not form part of the repertoire(s)of the ■rst emigrants to New England.
2.2. THE LINGUISTIC ATLAS OF NEWENGLANDAND OTHER STUDIES
2.2.1.EARLYEVIDENCE.Three typesof early NewEngland evidencewill notbe reviewed here: nonstandard spellings in of■cial records (Orbeck 1927);observations made by travelers, whose description of sounds is often hard
to interpret; and manuals of correct spelling and/ or pronunciation, whosedegree of independence from an English standard is unknown.

28 PADS95: Low VOWELSOFSOUTHEASTERNNEw ENGLAND
But the spelling reformer Michael Barton, born 1798 in DutchessCounty, New York, is too relevant to overlook. As noted in Labov (1994,317, n. 8), Barton “criticizes [English orthoepist] Walker ‘in making the
777sound of 0 in not, and a in far to be different, suggesting that the “General
American” merger of PALMand LOTcould be heard just outside of (west-ern) New England, in the early nineteenth century.10
Somewhat earlier, the extensive descriptions made by Noah Webster(b. 1758 in Hartford, Conn.) reflected a robust three-way distinction. Itspersistence can be seen from the self-reports of two later linguists. CharlesGrandgent, born in 1861 and whose dialect “was formed in Boston andCambridge,” uses three different symbols for the low vowels in a transcrip-
tion of his own speech (1891, 199).William Moulton, born in Providencein 1914, describeshis PALMand LOTas “two low central vowels that areidentical in quality and differ only in quantity,” while his THOUGHTis dis-
tinct from both (1990, 126).
2.2.2. LINGUISTICATLASOFNEWENGLAND(LANE).In the early 1930s,theLinguistic Atlas of New England (LANE 1939—43) interviewed 413 people,
including 11 in the studyarea,most of them born between 1850 and 1875.Nine ■eld-workers,eachworking in a different area,manually recorded thephonetic forms of 814 words and phrases from each informant.
Kurath et al. (1939, 8—13)make a primary division between Easternand Western New England. Within Eastern New England, Rhode Islandis part of the Narragansett Bay Area, while the towns to the north fall into
the WorcesterArea (e.g.,Mendon) or the BostonArea (e.g.,Foxborough).Due to its mixed vocabulary, Bristol County, Massachusetts—which coversmuch of the study area—is placed in both the Narragansett Bay Area and
the Plymouth Area.Regarding the low back vowels, Kurath et al. (1939, 3) make a surpris-
ing statement:
The rounded vowel [D] Of Eastern New England is losing ground. [It] has been
extensively replaced by an unrounded variety in the Eastern Margin and in such
cities as Providence.. ..
As a result Of this trend, some Easterners now have distinct
phonemes in rod, crop and in a■‘, law, salt.
This must be seriously doubted. The low back merger is intact today in the
northern part of the Eastern Margin (central Massachusetts,western NewHampshire), while further south it was likely never present. Rachel Harris,
a purportedly unreliable ■eld-worker, investigated all the LANE communi-ties in eastern Connecticut and Rhode Island, and all but one in Bristol
County, Massachusetts (Kurath et al. 1939, 41). The isogloss drawn for [D]

Low Vowels of New England 29
in rod (chart 8) follows the ■eld-worker boundary. Harris worked in onecommunity in the western area, Hebron, Connecticut, and her LANE tran-script shows [0] in rod there too.
Harris came from Haverhill, in Essex County, Massachusetts, and she
had the low back merger in her own speech (McDavid 1981, 23). She mayhave had dif■culty hearing the distinction in Rhode Island. Shewasgiventhe worst rating for “freedom from systematization according to the phone-mic system of the ■eld worker’s own speech” (Kurath et al. 1939, 53).
2.2.3. “THE SPEECHOF RHODEISLAND”: RACHELKILPATRICKNEE HARRIS.The controversy over Harris and the low vowels of Providence has beendiscussed in the literature (see §2.2.6), but the doctoral dissertation she
wrote under her married name (Kilpatrick 1937) has received little atten-tion. It discussesthe stressedvowelsand diphthongs of Rhode Island andadjacent parts of Connecticut and Massachusetts—that is, in her own LANErecords.
Her phonemic approach was innovative for American dialectology
of the day—neither Kurath et al. (1939) nor LANE has anything like hermap 29, which displayed whether speakers have “the same phoneme in
lot and law”—but Kilpatrick’s interpretation of her own records is untrust-worthy. She reports the low back merger for most Rhode Islanders, eventhough her data sometimesshowsthe distinction quite clearly.
For example, speaker 104.2 from East Providence has [a] in crop, fox,
frog, john, and rods, while cloth, loft, long, loss, jaundice, launch, and laundry
occur with [D] (Kilpatrick 1937, maps 30—36).This is a perfectly ordinary
“General American” distinction between LOTand CLOTH= THOUGHT.Yetsomehow,this speakeris saidto havethe samephoneme in lot and law.
2.2.4. “SHORT0 IN THE SPEECHOF NEWENGLAND”:MARGARETCHASE.Inanother little-known thesis based on LANE data, Chase (1935) analyzedthe low vowels in about half of New England.11 Despite its title, “The Deriva-tives of Middle English Short 0 in the Speech of New England,” it deals withall three word classes.
Along the coast from southern Maine to Essex County, Massachusetts,
Chase ■nds a clear two-vowel system, PALM ¢ LOT = THOUGHT. This pattern
will be called Eastern New England (ENE). In western Connecticut and
western Vermont, an equally clear conclusion is reached: a two-vowel sys-tem where PALM= LOT96THOUGHT.This pattern will be called Mid-Atlan-tic/ Inland North (MAIN).
In the Connecticut Valley (west-central Massachusetts and north-central Connecticut), the THOUGHT class has [3] and the LOT class has

30 PADS 952 LOW VOWELS OF SOUTHEASTERN NEW ENGLAND
[a], while the PALM class “is recorded more frequently with [a] than with
[a] ’7 (Chase 1935, 61). This probably means that some speakershavethe MAIN pattern with PALM= LOT,but most retain a three-waydistinc-tion, PALM96LOT 96THOUGHT (abbreviated 3-D). In eastern Massachusetts(around Boston and Plymouth), Chase also ■nds a mixture of systems.The PALMphoneme is distinct for everyone, but some distinguish LOT and
THOUGHT (3-D) while others do not (ENE).
Chase(1935, 18) seesthe 3-Dpattern asinnovative, the result of dialectcontact, but Garde’s Principle requires that it be the most conservative sys-tem. This would squarewith section 2.1.3,where we sawthat seventeenth-century settlers of New England would likely have had a version of the 3-D
system.
2.2.5. THEPRONUNCIATIONOFENGLISHIN THEATLANTICSTATES.Kurathand McDavid (1961) also derived their New England data from LANE.Kurath and McDavid’s text usuallyagreeswith Chase(1935), but their indi-vidual speakers’ synopses do not alwaysagree with their text.
2.2.5.1. Kurath and MeDavz'd’s(I9 61) Text.According to the text, all of east-
ern New England, including Rhode Island and eastern Connecticut, hasthe ENE pattern of low vowelsin cultivated speech (and map 15 showsitfor all social classes):
E[arly] M[oder]n E[nglish] /aer/appears as the free vowel /a/ and this /a/ occursalso to some extent in laugh, hath, glass, can’t, aunt, and occasionally in dance, France.
EMnE short /0/ and /au/ are completely merged in a free vowel /D/. [8]
In most of western New England the MAIN pattern is indicated:
[EMnE] /au/ becomes/:)/ /o/ splits into /01/and /:)/,and this /:)/,asin cough,frost,dog,long,ismergedwith the /:)/derivedfrom EMnE /au/.
. . .Earlier /aer/becomes/or/,the vowel being subsumed under the /o/ from earlier /O/. [8]
Kurath and McDavid’s text do not mention any 3-D patterns near Bos-
ton, but they agree with Chasethat they exist in the Lower ConnecticutValley and the New Haven area, where:
Cultured speakersin urban areasusuallyhavetwounrounded lowvowels,afree low-front to low-central vowel /a/, as in car, barn, father, palm, half, aunt, and a checked
low-central to low-backvowel /o/, asin crop,rod,john, college somespeakershave[a] rather consistently, some ■uctuate between [a] and [01], Others have predomi-
nantly [o]. [14]

Low Vowels of New England 31
2.2.5.2. Kurath andMeDavz'd’s(I 961) SpeakerSynopses.In the speakersynop-ses,Kurath and McDavid transcribe seven potential PALMwords, three LOTwords, and four THOUGHTwords, for 17 cultured speakersin NewEngland(31—47). For PALM, these are aunt, barn, father, garden, glass, half, and palm;
for LOT, college, crop, and john; for THOUGHT, daughter, frost, law, and water.
Each speaker’s vowels are sorted into two or three phonemic categories,but the data often supports a distinction where the editors show a merger.Only three speakers are explicitly presented as 3-D, but six more may wellhave been.
For the part of western New England where the text described the MAIN
system, only the speaker from Litchfield, Connecticut, shows that patternclearly. For the Burlington, Vermont, speaker, PALM has long [0'], LOT has
plain [o], and THOUGHThas [3] or [3V]. This suggests a 3-D system, though
not as clear as the one indicated as such in Pittsfield, Massachusetts.
In the areawhere the text identi■ed variation betweenMAIN and 3-D,the speaker from Northampton, Massachusetts, is shown with a clear 3-D
system. But the Deerfield, Massachusetts, and New Haven, Connecticut,
speakers are likely 3-D too, with [a'] or [a>'] for PALM, [a] or [n] for LOT,
and [3] or [3'] for THOUGHT.The 3-D pattern is also suggestedin Spring-■eld, Massachusetts, and Middletown, Connecticut, with PALM and LOT dif-
fering by length.In eastern New England, the transcriptions from Nobleboro, Maine,
Portland, Maine, Concord, New Hampshire, and Billerica, Massachusetts,
support the text’s diagnosis of ENE. But the speaker from Boston is shown
with a clear 3-Dpattern, and the datafrom Plymouth alsosuggests3-D: [a']for PALM,[D] for LOT,and [3] or [3V]for THOUGHT.12
The three remaining synopses are of speakers transcribed by Harris, inProvidence, Rhode Island, Newport, Rhode Island, and New London, Con-
necticut. They usually have [a] for PALM, and a range of phones from [If]
to [3V] for LOT and THOUGHT, but without a consistent difference between
those two classes.The synopses show that in most parts of New England,13 at least some
speakershad PALM¢ LOT¢ THOUGHT.These three-way distinct speakers
were not all elderly, either. Several were in their 40s, having been bornaround 1890. Where this 3-D pattern was found in western New England,
LOTwascloser to PALM,sometimesdistinguished only by length. In easternNew England, LOT was closer to THOUGHT.
These 3-D patterns may be the late stagesof two mergers by approxima-
tion, one of which wasbringing the PALM~ LOTmerger (and MAIN system)
to western New England, the other bringing the LOT~ THOUGHTmerger(and ENE system) to eastern New England.

32 PADS95: Low VOWELSOFSOUTHEASTERNNEw ENGLAND
2.2.6. RESOLVINGTHEPROVIDENCEGONTROVERSY:WILLIAMMOULTONANDRAVENI. McDAVID,JR. Moulton’s (1990) self-report showed the 3-D systemcould be acquired in Providence, Rhode Island, by someone born as late
as 1914. His is the western type of 3-D, where PALMis longer than LOT, and
THOUGHTclearly further back and rounded.
Moulton (1968) discussesthe error in LANE and Kurath and McDavid(1961) in which Providence wassaid to have the LOT~ THOUGHTmerger.Calling the LANE ■eld-workers “hopelessly and humanly incompetent attranscribing phonetically the low and low back vowels they heard fromtheir informants,” Moulton (1968, 464) arguesthat linguists should leavethe recording to their audio equipment, and ask subjects which soundsrhyme.
This is unfair: the low vowels were admittedly challenging (Chase 1935,4), but most LANE ■eld-workers seem to have handled them adequately.Even Harris was not “hopeless,” but she was the only ■eld-worker with the
LOT ~THOUGHT merger herself. And listening to audio recordings (see
§2.4) of two LANE informants from Providence,McDavid (1981) con■rmsthat they did have a LOT ~ THOUGHTdistinction.
McDavid then reviews the LANE data for informant 80.4 and showsthat Harris actually did transcribe LOT and THOUGHT differently. Despite
a wide range of symbols for both phonemes, LOT was most often [D], and
THOUGHT [3]. The words in Kurath and McDavid’s (1961) synopsis were anunlucky sample that did not reflect the usual distinction. McDavid (1981,23—26) concludes that “Harris’s phonetics were tolerably minute [her]
LANE transcriptions come off very well.” Harris wasthus sometimesableto hear and transcribe a distinction that she could not consciously recog-nize. For like Kurath and McDavid (1961), Harris considered all four ofLANE ’s Providence speakers to have the LOT ~ THOUGHT merger (Kilpat—
rick 1937).14McDavid (1981, 26) asks,‘Why should Providence retain a contrast
that has been lost in Boston?” He cites Rhode Island’s history of “individu-alism and dissent,” its local pride “contribut[ing] to the preservation ofspeechways distinct from those of Boston.”
But the LOT ~THOUGHT distinction has been preserved throughoutthe Mid-Atlantic and Inland North; Providence simply happens to be atthe edge of this region. And without understanding why eastern Massa-chusetts underwent the merger, we cannot saywhy—or, really, if—Rhodelsland resisted it. Furthermore, if we focus on PALM ~ LOT, it is Boston that
retained a distinction which Providence lost; would a similar cultural expla-nation then make sense?

Low Vowels of New England 33
Both McDavid (1981, 26) and Herold (1990, 108—9)■nd it surpris-ing that phonemic differences should exist between nearby communitiesin modern times in the United States. We may have to concede that easyintercommunication between places—“the present-day influences of easytravel, radios, and talking-pictures” (Chase 19:),5, 3)—does not necessarilylevel dialect differences between them.
2.3. MORE RECENT STUDIES
2.3.1.DICTIONARYOFAMERICANREGIONALENGLISH(DAREI 985—).Carver(1987) draws lexical dialect boundaries within New England based onDARE data, collected 1965—70from speakers born around 1900. Map 2.4showsRhode Island to have fewer characteristically New England wordsthan Massachusetts. A heavy line runs east-west along the state boundary,separating informants in Douglas and Uxbridge, Massachusetts, from onein Burrillville, Rhode Island. A lighter north-south line through BristolCounty divides New Bedford, Massachusetts, from Little Compton, Rhode
Island. Together, thesefollow the samedialect boundary aswill be seeninchapter 4.
An auditory analysisof “Arthur the Rat” passagesread by DARE infor-mants (American Languages 2009) revealed three possible 3-D patternsin our eastern area, one in Mendon (b. 1894, female) and two in Douglas
(b. 1889, male; b. 1892, female) along with severalclear ENE patterns: inBoston (b. 1892, female; b. 1899, male), New Bedford (b. 1886, male),
Plymouth (b. 1891, female), and Uxbridge (b. 1895,male).In the western area, there were clear 3-D patterns in Bristol, Rhode
Island (b. 1884, female), and Little Compton, Rhode Island (b. 1884,female; b. 1910, female), as well as MAIN patterns in Hope, Rhode Island
(b. 1904, male) and Westerly, Rhode Island (b. 1897, male). The DARE
recordings deserve further analysis, but these ■ndings are in line with the
earlier Hanley recordings, discussedin section 2.4, aswell asthe oldest liv-ing speakersdescribed in chapter 4.
2.3.2. CHARLESBOBERG.In the LANE and DARE era, the 3-D system had
not fully yielded to MAIN in western New England. Much more recent-ly, drawing on the 1992—99Telsur telephone interviews that are also thesource material for Labov, Ash, and Boberg (2006), Boberg (2001) shows
the MAIN systemprevailing in Connecticut. Spring■eld, Massachusetts,had been MAIN, but phonetic approximation may signal the onset of three-
way merger there.

34 PADS 95' LOW VOWELS OF SOUTHEASTERN NEW ENGLAND
The LOT ~ THOUGHT merger has more thoroughly affected westernVermont, with sevenspeakersshowing a clear merger and only one elderlyspeaker maintaining the distinction. In Wetmore (195g, 18), by contrast,the low back distinction is reported throughout western Vermont.
It is not explicitly stated whether the merger there involves the PALMclassaswell. One would expect so, if it evolved from a MAIN system,inwhich PALM and LOT were already merged. Burlington’s system is said toresemble the Canadian ones to the north, which are 3-M. And Rutland’smerged vowel is [0], not [D], making merger with PALM likely there too.
2.3.3. THE ATLAS OFNORTH AMERICANENGLISH.Labov, Ash, and Boberg(2006, chap. 16.4) make it more clear that the 3-M system has developed in
Burlington and Rutland. PALMis fronted by at least 100 HZ before /r/, butother PALMwords have the same vowel as LOT;father rhymes with bother.If
EasternNewEngland’s LOT~ THOUGHTmerger spreadto westernVermont(Boberg 2001), the PALM~ LOT distinction did not.
Labov,Ash, and Boberg (2006) identify clear MAIN systemsin Spring-■eld, Massachusetts (along with one 3-M speaker), across Connecticut,
and from six speakersin Providence, Rhode Island. Acoustic analysiswasconducted on three of these—the oldest born around 1g40—and noPALM~ LOT distinction was found, although the Telsur methodology might
not have identi■ed such a distinction if it was based only on length; indeed,
“the PALM-classwasnot the focus of direct elicitation” (230).In eastern Massachusetts (Boston, Worcester), New Hampshire,
and Maine, the PALM~ LOT distinction is clear (map 16.5), and the
LOT~ THOUGHTmerger mainly so (map 16.3). Of the 2g informants, 22showa total low back merger, while the others’ were incomplete in eitherperception or production. Given the antiquity of the low back merger inthis region, it is likely that these informants exhibit it stably in ordinaryspeech.
To summarize, we have evidence that a three-way—distinctlow vowel pat-
tern (3-D) once existed in most parts of New England, including easternMassachusettsand Rhode Island. In the twentieth century, the typical systembecameENE in eastern Massachusetts(with the LOT~ THOUGHTmerger)and MAIN in Rhode Island (with the PALM~ LOT merger). A phonologicalboundary developed from a phonetic difference, as the next section will
help show.
Low Vowels of New England 35
2.4. THE HANLEY RECORDINGS:VOICES FROM LANE
From 1932 through 1934, Miles Hanley and colleagues revisited abouthalf of the LANE informants interviewed several years previously, aswell assome others.15 For each speaker, they recorded one or more 10-minute alu-minum discs, using a recording apparatus that ■t—barely—in the back of acar (S. Hall et al. 2002). Although the discs contain a lot of noise, strainedconversation, and silence, most are adequate for auditory, and some for
acoustic,analysis.16
2.4.1. MAINE. As noted in section 2.2.5.2, Maine and New Hampshire
are the only New England stateswith no evidence of a three-way-distinct(3-D) low vowel system in Kurath and McDavid (1961), which is curi-
ous given their generally conservative dialects. An auditory investigationof two Hanley recordings from Maine supports the ENE con■guration:
PALM¢ LOT= THOUGHT.No Hanley recording existsof the two cultured Maine speakerswhose
synopses appear in Kurath and McDavid (1961). But for LANE informant356 from Biddeford, Maine (born c. 1855), the auditory impression is
similar to Kurath and McDavid’s synopsisfrom Portland. The PALMpho-neme is roughly [a], while LOT and THOUGHT words both occur with a back
rounded vowel close to [3].
For informant 352.1 from York, Maine (b. 1890), PALM appears as[a], while the low back vowels vary over a larger phonetic range centeredaround [D]. For example, morning was as front as [a], while the vowel of
long was close to [3]. Within each word class, there were large differences
in vowel quality and duration, depending on phonological context. Thespeaker produced eight examples of LOTand THOUGHTin the environmentbefore word-■nal /t/: lot and three tokens of not for LOT; bought, caught, and
two tokens of thoughtfor THOUGHT.With, for example, lot rounded andcaught fronted, these produced the auditory impression of merger.
Instrumental measurement revealed overlapping formant ranges. For
LOT,F1 ranged from 766 to 860 Hz (mean 816 Hz); THOUGHTwasbetween756 and 821Hz (mean 783 Hz). For F2,LOTwasbetween 1163and 1318Hz(mean 1249 Hz), while THOUGHTranged from 1167 to 1268 HZ (mean1218 HZ). Although both formants differed in the direction expected ifthere were a LOT~ THOUGHTdistinction, the differences in meansare only
31 and 33HZ and are not statistically signi■cant according to one-tailedt-tests (p(F1) = .14; p(F2) = .24). Merger is likely, though more tokensmight havebeen able to con■rm avestigial distinction.17

figure 2.3
F1 (
Hz)
F2 (Hz)
900
500
1600
600
700
800
1400 1200 1000
thoughtlotpalm
36 PADS95: LOWVOWELSOFSOUTHEASTERNNEw ENGLAND
2.4.2. CAMBRIDGEANDPLYMOUTH,MASSACHUSETTS.If Henry WadsworthLongfellow Dana of Cambridge, Massachusetts, had been in LANE, hewould have been a “cultured informant.” Born in 1881 and educated atHarvard, he was descended on his father’s side from early settlers of Cam-
bridge; his maternal grandfather wasthe poet Longfellow. Although onlyten minutes long, his recording suggests that the Boston upper class re-tained a clear 3-D pattern at this time.
Dana’s PALM was a long, low, unrounded vowel varying from front[a:] to central [0:]. His LOT was shorter, usually a lightly rounded, back
[D], sometimes an unrounded, central [0]. THOUGHT words had a raised,
rounded back [3 ~ 3:].
An acousticanalysiscon■rmsthat there are three distinct word classes.In fact, as ■gure 2.3 shows, there is hardly any overlap in formant values
among the three word classes (with 7 tokens of PALM, 11 of LOT, and 13 of
THOUGHT).Dana’s categoriesare so distinct that evenwithout measuringrounding or length, we can seethat he hasa 3-D system.The PALMclassissigni■cantly fronter than the LOT class.The mean F2 value for PALMis 1401
FIGURE2.3Henry Wadsworth Longfellow Dana (b. 188 1, Cambridge, Mass):
Token, Means, and :1 Standard Deviations
500 | | |
600 — —
_ A A _
q: 700 —A
—
E v '3HLLI — El n —
800— A V THOUGHTEl |:I LOT
_ED A PALM
AEl
900— D —
|I
|I
|I
1600 1400 1200 1000

Low Vowels of New England 37
HZ (standard deviation 67), and for LOT, it is 1192 HZ (s.d. 44). A t-testshowsthat the F2 difference of 209 HZ is statisticallysigni■cant (p < 0.001).The THOUGHTclassis signi■cantly higher than the LOT class.The mean F1value for THOUGHTis 612 Hz (s.d. 54), and for LOT it is 788 Hz (s.d. 81).
This F1 difference of 176 Hz is also statistically signi■cant (p < 0.001).Although the categories are roughly equally spaced in F1 and F2,
Dana’s usually rounded LOT sounds closer to THOUGHT—with which it
would soon merge in the Boston area—than to his long, sometimesquitefronted PALM.
Another Hanley recording, speaker 112.2 from Plymouth, Massachu-setts (born c. 1890), de■nitely had a distinct PALM,while LOTand THOUGHT
were quite closetogether.18PALMwasdistinguished by length and fronting,[gr]; LOT varied between [a] and [1)]; while THOUGHT sounded higher and
backer on the whole, often rounded and sometimes offgliding, [no]. Com-
paring F1 before ■nal /t/, using sevenLOTtokens (mean 726 HZ, s.d.= 52)and ■ve THOUGHTtokens (mean 677 HZ, s.d. = 26), gives a small, margin-
ally signi■cantdifference of 49 Hz (19= 0.03).
2.4.3. PROVIDENCE,RHODEISLAND. For informant 80.4 from Providence(born c. 1890), LANE, Kurath and McDavid (1961), and even the ■eld-worker Harris (Kilpatrick) herself reported the low back merger, but Mc-David (1981) reviewed the case and found evidence for a distinction, in his
own auditory impressions aswell as in Harris’s full transcriptions.My own auditory analysis ■nds that the speaker’s THOUGHTis not even
close to the other low vowels, being realized as a fully rounded [3]. The
question instead becomes whether PALM and LOT are distinct. The LOTword class occupies a wide phonetic range, from a front-central [g] to afar-back, lightly rounded [n] reminiscent of RP. The PALM class has a long
vowel that takes up an even wider range, from a rather front [a:] to a far-back, unrounded [0:]. Because of these overlapping ranges, instead of
formant measurements, the apparent difference in duration was pursuedinstrumentally.
From the 20-minute recording, 14 PALMand 19 LOTwords, reasonablybalanced prosodically and phonetically, were selected. The length of the
fully voiced portion of the vowelswasmeasured. The LOTtokens had anmean duration of 136 ms (s.d. = 50), while the PALMtokens had a meanof 191 ms (s.d. = 48). A t—testshows that this large difference, illustrated in■gure 2.4, is signi■cant (p = .003).
Providence informant 80.4’s speech does not give the impression that
any of the low vowels are nearing the point of merger. lndeed, neither doesthe self-description of Moulton (1990), born a quarter-century later.

figure 2.4
Duration (ms)100 150 200 250
palm
lot
300
possible copies modern2
gospelhop(scotch)
not3drop
hobby gothic
contentsupon
typographynotmodern
on2
lots
onnot2
largely
artstarted2
marks
mark
(hop)scotch
Renaissance
partsdepartment
marginal
compartmentart2
datafather
can’tstarted
possible copies modern2
gospelhop(scotch)
not3drop
hobby gothic
contentsupon
typographynotmodern
on2
lots
onnot2
largely
artstarted2
marks
mark
(hop)scotch
Renaissance
partsdepartment
marginal
compartmentart2
datafather
can’tstarted
38 PADS95: Low VOWELSOFSOUTHEASTERNNEw ENGLAND
FIGURE2.4Duration of LOT and PALMfor LANE Informant 80.4
(Providence, R.I., b. 1890)
I I | I | I I I
data depar ment largely marks5
_ _ _ _ _ __fa_the_r_
_ _margin' 1
____________________________
palrts
E cap ’t art2 started? mark.1
started com artment art Renaissance
possible lcopiesu on modern? on?
s_ _ _
11953 content typography_ _ _ _ _ _ _ _ _ _ _ _
pg________
(hop)gcotch
,4 hop (s(l:otch) drop not not?
gospel hobby go hic modern lots
I | I | I | I | I |
100 150 200 250 300Duration (ms)
2.4.4. OTHEREASTERNMASSACHUSETTS.This section will discuss the statusOf LOTand THOUGHTbased on an auditory review Of the Hanley recordingsfrom those parts Of eastern Massachusetts where they are merged today.
Besides H. W. L. Dana (Cambridge, b. 1881), discussed in section 2.4.2,
a clear low back distinction (3-D) wasObservedfrom the linguist CharlesGrandgent (Cambridge, b. 1862), con■rming his self-report (see §2.2.1);LANE informant 114, born c. 1860, from Rochester; LANE informant
152.1, born c. 1862, from Weston; and a non-LANE speaker, born c. 1864,
from Worcester.These four places have no geographical or historical connection. In
fact, for each place where the distinction wasfound, the merger wasalsoObservednearby. Across the river from Cambridge, even the OldestBos-ton speaker (150.2, born c. 1848) showed a possible merger, and several
younger Bostonians, born from 1858 on, were de■nitely merged (ENE pat-tern).
Directly eastOfRochester,in Marion, the merger washeard from infor-mant 210.1 (b. 1853). East Of Worcester, Shrewsbury speaker 204.1 (born
c. 1854) wasmerged. And in Weston, informant 152.2 (born c. 1873) wasalso judged merged (the distinct Weston speaker was 12 years Older).
On Martha’s Vineyard, a linguistically conservative island (Labov 1963)
where, for example, the loss Of postvocalic /r/ had made no headway, twoLANE informants—122.1 from West Tisbury (born c. 1873) and 123.1from Edgartown (born c. 1857)—had a clear low back merger.
We see that in eastern Massachusetts, speakers born in the period
1850—75can exhibit either 3-D or ENE low vowel systems.Thereafter, pri-marily the ENE pattern is found. Sincewe ■nd 3-D in and near Boston atthe same time as, or even later than, clear instances Of ENE on usually con-servative Martha’s Vineyard (and Cape Cod), the change does not appearto have diffused hierarchically from Boston, as might have been expected.

Low Vowels of New England 39
Rather, the LOT ~ THOUGHTmerger developed simultaneously, if irreg-ularly, across the eastern Massachusetts Bay and Plymouth settlement areas.It did not develop in Rhode Island, even in areas which are much closer toand more accessible from Boston than, for example, Martha’s Vineyard,
where it did occur.
2.5. EVOLUTION OF THE LOW VOWELSOF (SOUTHEASTERN) NEW ENGLAND
In most parts of New England, we have seen evidence that the original sys-tem of low vowels was 3-D: PALM¢ LOT ¢ THOUGHT.This ■tswell with what
we know of English English in the seventeenthcentury,when sucha systemhad only recently developed from earlier patterns.
The New England 3-D systemswe have heard can be divided into twotypes. In the eastern one, PALM is a distinct, fairly front vowel; LOT and
THOUGHT are back and closer to each other, distinguished by some com-bination of length, height, and/ or rounding. In the western 3-D system,including Rhode Island (paceLANE and Kurath and McDavid 1961),PALMand LOTare central, unrounded and distinguished chiefly by length, whileTHOUGHTis a quite distinct rounded back vowel.
Although all three word classesdiffer between eastern and western3-D systems, we can make a connection to seventeenth-century English
(§2.1.3) by suggesting that the ■rst dialects to coalescein MassachusettsBay and Plymouth had a more conservative back rounded LOT,not far pho-
netically from the new monophthongal THOUGHT.ln Rhode Island—andwestern New England proper—a dialect formed with a more innovativeLOT, unrounded and more central, which became the short counterpartof PALM.
It is not clear how this proposed difference in LOTmight relate to theregional (and social) origins of the ■rst effective settlers.While many set-tlers’ origins are known—the eastern and southwestern English countiesprovided the majority—little is known for certain about the dialects theyspoke or what their versions of standard English might have been like.
Still, we can distinguish between two scenarios: retention and diver-
gent leveling.A retention theory holds that important linguistic differencesresulted from differences in backgrounds—regional, social, or simply tem-poral—between the settlers of eastern and western New England. Reten-tion is the avowed perspective of Bloch (193 5) in his reconstruction ofearly New England rhoticity patterns, even though he does not “attempt to
go back beyond the colonial stage” (180) to account for the origin of thedifferences.19

4O PADS 952 LOW VOWELS OF SOUTHEASTERN NEW ENGLAND
For the low vowels, the regional-retention approach does not apply
straightforwardly. SouthwesternEnglish dialectsfeature fronted unroundedLOT, but Eastern Massachusetts, with its back rounded LOT, actually seems
to have had more settlement from the Southwest than other colonial areas.However, the even higher level of East Anglian (and other eastern) settle-
ment could have been what contributed a conservative LOT to the EasternMassachusetts mix.
A divergent leveling theory suggests that dialect differences betweenthe settlers of the two areas were less important. Indeed, on such a view,
within-colony variation probably exceeded between-colony variation. Butfor whatever reasons—perhaps including chance—the leveling processesin each area had different outcomes, which were then carried throughout
eachcolonyasit developedandexpanded?0If Fischer (1989, 270) wascorrect to saythat “Connecticut and Rhode
Island were broadly similar (not identical) to the [Massachusetts] Bay Col-
ony in the English origins of their founders,” divergent leveling is one wayto account for the dialect differences that developed. But whether these
differences originated in England (retention) or shortly after settlement(divergent leveling), in each area a different merger eventually took place,
reducing the inventory of low vowelsfrom three to two. In the east,LOTmerged with THOUGHT,creating the ENE pattern asearly asthe mid-nine-teenth century in Eastern Massachusetts,and maybe even earlier in NewHampshire and Maine. In the west,PALMmerged with LOTsomewhatlater,creating the MAIN pattern.21
I suggestthat the communities in each area were affected by one ofthese two mergers for internal (structural) reasons, not because of diffu-
sion. For one thing, the geographic pattern of LOT~ THOUGHTmerger inthe Hanley recordings does not show a spread from Boston?2
Chapter 4 will show the line between MAIN and ENE patterns basically
following the settlement boundary between Rhode Island and Massachu-
settsBay/Plymouth. But a few townsare on the “wrong side” of the line, asif they shifted allegiancefrom one areato the other after settlement.
As long as both dialects were 3-D—phonetically different, but phono-
logically identical—such shifts would be unproblematic; they would notinvolve the reversal of any merger. But after LOT merged with either PALM
or THOUGHT,the resulting MAIN and ENE areas would have been divided
by a much more impervious linguistic boundary. Given Herzog’s Principle,
any influence across the line could only lead to three-way merger, never to
a shift in the boundary.

Low Vowels of New England 41
2.6. THE PILOT STUDY: LOCATING THE DIALECTBOUNDARY
An earlier pilot study set out to determine the location of the boundary be-
tween the MAIN and ENE patterns, by concentrating on LOTand THOUGHT.The ■rstphase,conducted in 2002 with the assistanceof Joanie Sanchez,askedlocal people in public libraries—often the librarians themselves—toread ■ve minimal pairs of the type cot~ caught. We judged whether eachpair sounded the same or different, and the same question was put to theinformants.
The low back merger wasidenti■ed in the following southeasternMas-sachusetts communities: Bellingham (1 subject), Dartmouth (1), Middle-
borough (2), New Bedford (1 ), North Attleborough (1 ), Plymouth (2),Raynham (1), Taunton (2), and Wareham (2). In these places, vowel pro-ductions were almost universally judged merged; most subjects’ percep-tions agreed.23
In northeastern Rhode Island—Providence (4 subjects), Pawtucket (1 ),Cumberland (1), and Woonsocket (1)—the low back distinction was uni-
versal,with not a singlejudgment of “same” in perception or production.This is similar to Labov, Ash, and Boberg’s (2006) ■nding that the low back
distinction wascategorical in Providence,while in the merged areasof NewEngland, there was some variation in perception or production for somespeakers.
Across the Massachusetts state line to the north, Blackstone (1) agreedwith Rhode Island, as did Fall River (1), Somerset (2), and Rehoboth (2),
across the line to the east.Both Attleboro and Westport, Massachusetts, had one speaker with a
clear merger and one with a clear distinction?4 ln Attleboro, this differ-
ence had a potential geographic correlate: a 30-year-old woman from SouthAttleboro, a neighborhood adjacent to Rhode Island, showed the distinc-
tion; a 50-year-oldman from the other side of the city showedthe merger.The possibility of a linguistic boundary cutting through a municipality
was an exciting one, and the second phase of the pilot study—carried outin 2004—pursued it. However, the resultswere not consistentwith a strictgeographical division. Distinct, intermediate,25 and merged responses wereobtained in both “regular” Attleboro and South Attleboro.
The pilot study suggested that speakers’ low vowels are generally pre-dictable from geography but that there may be other factors influencingthem aswell. Chapter 3 will address questions on the individual level, withdata from a survey of schoolchildren in Attleboro and other communities.
3. THE SCHOOL SURVEY
DIALECTGEOGRAPHYTELLSUSthat where a person growsup is an impor-
tant factor determining the way he or she speaks asan adult. But the impor-
tance of other factors, such as parental in■uence, has also long been rec-ognized.
By choosing informants from established local families, projects likeLANE made the dialectal influences of parents and peers overlap asmuch
as possible, reducing the need to ask which is more important. But thatquestion gains relevance to the extent that today’s young parents are moremobile and more children are growing up with peers whose dialects differfrom their mothers’ and fathers’.
Becausethe “independent variables” potentially influencing the lowvowel system of a speaker tend to be correlated—for example, a person’smother and father often come from the same place—only a large sample
can determine their relative signi■cance. This was achieved by means of the
school survey,a written questionnaire administered to over 2,000 youngpeople with the help of teachersin severalsitesin New England and NewYork.
The questionnaire was a simple instrument that directly asked students
to decide whether seven LOT ~ THOUGHT minimal pairs sounded “same”
or “different” (§3.2). Two items probed the statusof PALM~ LOTby askingwhether pairs of words rhymed. The survey also gathered basic demographicinformation about each student, aswell as a history of schools attended.
The survey responses were analyzed using mixed-effects logistic regres-sion, treating Item and Subject asrandom effects and variables like parents’
origin and previous and current peers’ dialect as■xedeffects.The analysisdetermined the size and signi■cance of these effects.
3.1. DIFFICULTY OF SECOND DIALECT ACQUISITION
The “irreversibility of merger” (Labov 1994,chap. 11) is a principle usuallystated at the level of the speech community or higher, but such a conse-quence would be unlikely if individuals could unmerge word classes eas-ily. On the other hand, the rapid spread of various mergers, such as theAmerican low back merger (Labov, Ash, and Boberg 2006, §g.1), strongly
suggests that individuals can learn them.
43

44 PADS 95' LOW VOWELS OF SOUTHEASTERN NEW ENGLAND
On the dif■culty hierarchy of Kerswill (1996, 200), learning new oppo-sitions is labeled “most difficult” and can only happen from age 3 to 13.1
Mergers, conversely, can be acquired throughout the lifespan. However,
not many studies have speci■cally addressed how hard it is to learn voweldistinctions or how easyit is to merge.
Chambers (1992) studied six children who had moved from Canadato England around two years before. Two, aged 7 and 11 on arrival, hadacquired the low back distinction well, pronouncing at least 8 of 10 word
pairs differently. None of the others, who moved between ages10 and 14,pronounced more than one pair differently.
Sankoff (2004) followed a speaker from Yorkshire, in the North ofEngland, who had no distinction between FOOTand STRUTat age 7. Hemoved to Oxford (in the South) at age 16 and had learned to separate the
classesfairly well by age28.Payne (1976, 1980) studied the acquisition of several linguistic vari-
ablesby children who had moved to King of Prussia,Pennsylvania,a Phil-adelphia suburb. One of these tasks was similar to unmerging a mergedvowel; two involved learning a certain subtype of merger.
Payne’s out-of-state children essentially failed to learn the Philadelphia-
area “short-a pattern,” a complex split between lax [2e] and tense [fez ~ is].
This split is partially phonologically predictable (tense before front voice-less fricatives), but also has lexical exceptions (lax before /d/, but tense in
mad, bad,glad)?
Of 34 out-of-state children, only one (3%) completely acquired the
Philadelphia short-a pattern, although six others (18%) had substantial
success.By contrast, among the children of local parents, 34 of 36 (94%)learned the complete pattern (Payne 1976, 209). This complex phonologi-cal pattern seemsto require learning at avery early age, from parental input.
As Payne(1980, 174) puts it, “unlessa child’s parents are locally born andraised, the possibility of his acquiring the short-a pattern is extremely slight
even if he were to be born and raised in King of Prussia.”By contrast, thesimpler phonetic variables were more readily acquired from peers.
The other two phonological variables did not show the same degree
of dif■culty of acquisition. These are conditioned mergers in PhiladelphiaEnglish: the raising of, for example, moreto mergewith Moore,and the back-ing of, for example, merryto merge with Murray. The out-of-statechildrendid better at learning these mergers than they did at learning the short-a
pattern.Payne’s overall conclusion is that phonological features of a second dia-
lect are harder to acquire than phonetic ones, but this should be amended

The School Survey 45
to state that certain phonological features—namely, mergers—are easy toacquire, perhaps almost as easyas phonetic features.
With the school survey, there was little opportunity to test the dif■-
culty of unmerging LOTand THOUGHT,becausethe studentswith mergedparents almost never had distinct peers. Students with distinct parents andmerged peers were more common, so it was possible to examine the con-straints on the merger’s acquisition.3
While certainly learnable, mergers do not simply spread like wild■re;subjects differ in their degree of acquisition. The literature can oversimplifythis and also overstate the primacy of peer over parental in■uence: “young
children, almost universally,pick up their accentsfrom their peers”; “kidsget their accents from their peers” (Barbara Partee and Susan Ervin-Tripp;quoted in O’Brien 1992, 1). The survey results, like Payne’s, are much
more nuanced.
The school surveydata doesnot contain information on peer networks
or other measures of popularity, on social class, or on other potentiallyrelevant variables. Knowing about these would have reduced the leftovervariation assigned to the Subject random effect and possibly sharpened theestimation of other effects.
The survey returned many intermediate responses (e.g., cot~ caught is
marked “same,” but tack~ talk is “different”). This could reflect merger inproduction in one phonological environment but not another, as in the
Midland (Labov,Ash, and Boberg 2006, 64), but that is not the only pos-sibility.
First, some students, even if fully merged or fully distinct, might be
uncomfortable marking each item the sameway.Like on a history quiz,they might doubt that all the “correct answers”would be the same.
Intermediate responses could also reflect the tendency for perception
to lead production, signaling incipient merger in the community (Labov
1994, 319), and perhaps in the individual aswell. On the other hand, such
responses could also convey the tension between an individual’s merged
production patterns, which do match his/ her peer group, and underlyingdistinct representations learned earlier from parents. In other cases,inter-mediate responses might accurately represent the production patterns of
children whoselow back vowelsare actually partially merged and partiallydistinct, on a phonological or lexical basis.
With all these possible sources of intermediacy, there were still regular
patterns in the Item random effect. If achild marked 2 of 7 LOT~ THOUGHTminimal pairs “different,” it wasnot random which pairs those would be,
evenif it wasunclear just what sucha responsemeant.

46 PADS95: LOWVOWELSOFSOUTHEASTERNNEw ENGLAND
While the school surveydata doesnot have asclear an interpretation
as production data from an interview, it has been collected from manymore people than most sociolinguistic studiesreach. Even if somesubjects’
responses are almost worthless, the very large total number of subjects
allows us to ask,and to some extent answerquantitatively, questions thathave so far been approached only qualitatively, if at all.
3.2. THE INSTRUMENT
The survey instrument is shown in ■gure 3.1. It asked for each student’s
name, gender, age, current and previous schools, parents’ origins, and
other demographic information. As the surveyitems were completed in aclassroomsetting, studentsand teacherswere discouragedfrom pronounc-ing the key words out loud and influencing one another. Each item con-sistedof two short sentencesto be read silently,eachusing one of the wordsfrom a target pair. Students circled “same” or “different” to indicate howthe target pair sounded to them.
The ■rst two items were designed to eliminate subjects who were likely
to give inaccurate answerson the other items. Since barnand bornare pro-nounced differently in the easternUnited States,anyonewho marked thepair “same” would be unlikely to accurately recognize more subtle differ-
ences in sound. Only 2% of subjects actually “failed” this item.The second item was the opposite case:pauseand paws are pronounced
identically in all dialects of North American English, so subjects who saidthey sounded “different” would be likely, probably under the influence of
spelling, to misidentify other identically pronounced pairs. Thirteen per-cent of subjects, many younger children, were eliminated by this item.
The next pair contrasted the singing term la for PALM with law for
THOUGHT. These should sound different unless they are both mergedwith LOT. The three-way-merged pattern is expected to occur among someyoung people, especially in situations of contact between the two two-way
mergers. But perhaps becauseof the marginal statusof la asa word, thispair wasactually marked “different” evenby somespeakerswith the three-
way merger. The next seven items all inquired about LOT ~ THOUGHTpairs.Alphabetically, these were: collar ~ caller, cot ~ caught, Don ~ Dawn, Moll ~ mall,
Otto ~ auto, tock ~ talk, and tot ~ taught.
The items cot~ caught and tot~ taught turned out to be the best pre-dictors of the remaining items, though they were not consistentlymarked
more “same” or “different” overall.
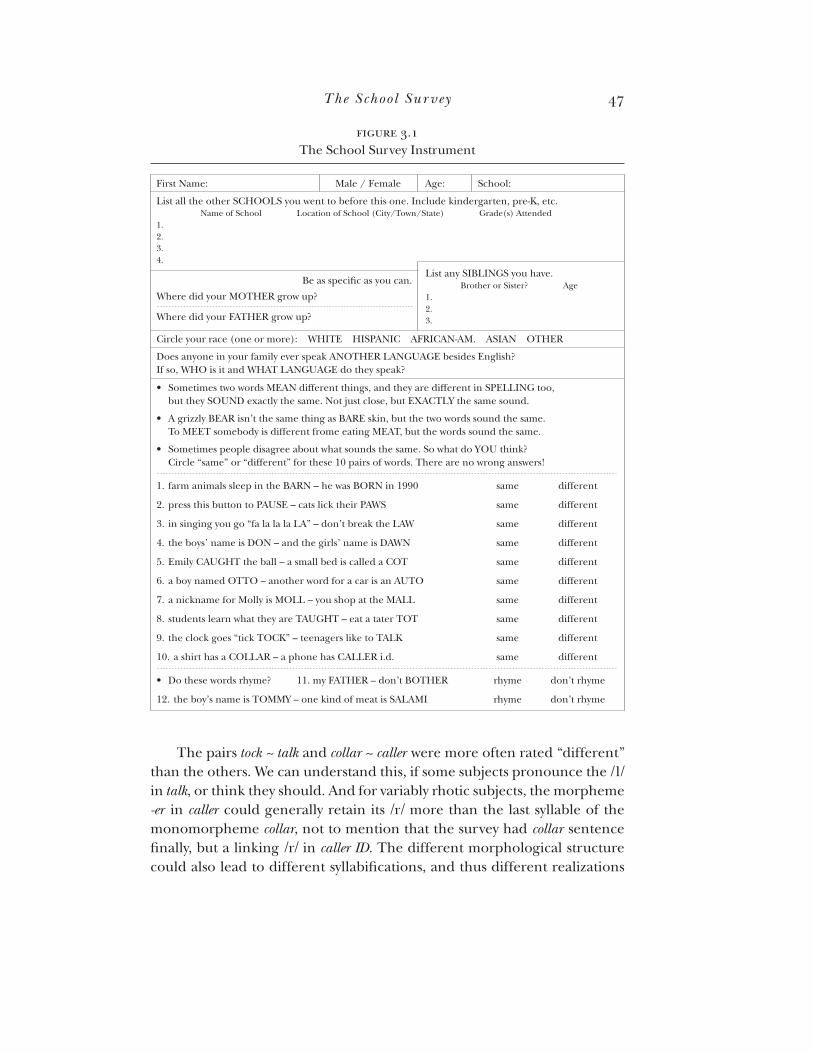
figure 3.1
First Name: School:Age:Male / Female
List all the other SCHOOLS you went to before this one. Include kindergarten, pre-K, etc. Name of School Location of School (City/Town/State) Grade(s) Attended1.2.3.4.
List any SIBLINGS you have. Brother or Sister? Age1.2.3.
Where did your MOTHER grow up?
Where did your FATHER grow up?
Be as specific as you can.
Circle your race (one or more): WHITE HISPANIC AFRICAN-AM. ASIAN OTHER
Does anyone in your family ever speak ANOTHER LANGUAGE besides English?If so, WHO is it and WHAT LANGUAGE do they speak?
The School Survey 47
FIGURE3.1The School Survey Instrument
First Name:| Male / Female | Age: School:
List all the other SCHOOLS you went to before this one. Include kindergarten, pre—K, etc.Name of School Location of School (City/Town/State) Grade(s) Attended
1.
2.3.
4.
,List any SIBLINGS you have.
Be as spec1■c as you can‘ Brother or Sister? Age
Where did your MOTHER grow up? 1.2.
Where did your FATHER grow up? 3‘
Circle your race (one or more): WHITE HISPANIC AFRICAN—AM. ASIAN OTHER
Does anyone in your family ever speak ANOTHER LANGUAGE besides English?If so, WHO is it and WHAT LANGUAGE do they speak?
' Sometimes two words MEAN different things, and they are different in SPELLING too,
but they SOUND exactly the same. Notjust close, but EXACTLY the same sound.
' A grizzly BEAR isn’t the same thing as BARE skin, but the two words sound the same.To MEET somebody is different frome eating MEAT, but the words sound the same.
' Sometimes people disagree about what sounds the same. So what do YOU think?Circle “same” or “different” for these 10 pairs of words. There are no wrong answers!
l. farm animals sleep in the BARN —he was BORN in 1990 same different
2. press this button to PAUSE —cats lick their PAWS same different
3. in singing you go “fa la la la LA” —don’t break the LAW same different
4. the boys’ name is DON —and the girls’ name is DAWN same different
5. Emily CAUGHT the ball —a small bed is called a COT same different
6. a boy named OTTO —another word for a car is an AUTO same different
7. a nickname for Molly is MOLL —you shop at the MALL same different
8. students learn what they are TAUGHT —eat a tater TOT same different
9. the clock goes “tick TOCK” —teenagers like to TALK same different
10. a shirt has a COLLAR —a phone has CALLER i.d. same different
' Do these words rhyme? 11. my FATHER —don’t BOTHER rhyme don’t rhyme
12. the boy’s name is TOMMY —one kind of meat is SALAMI rhyme don’t rhyme
The pairs lock~ talk and collar~ callerwere more often rated “different”than the others. We can understand this, if some subjects pronounce the /l/
in talk, or think they should. And for variably rhotic subjects, the morpheme
—erin caller could generally retain its /r/ more than the last syllable of the
monomorpheme collar,not to mention that the surveyhad collarsentence■nally,but a linking /r/ in callerID. The different morphological structurecould also lead to different syllabi■cations, and thus different realizations

48 PADS 952 LOW VOWELS OF SOUTHEASTERN NEW ENGLAND
of /l/ in the two words, which could differentiate them by itself or by affect-ing the stressed vowels.
However, it is less clear why subjects rated Moll ~ mall and Otto ~ auto“same”more often than the other pairs, other than a possibleeffect of ini-tial position in auto.
The survey then asked if father~ bother and salami ~ Tommyrhymed.4
Though intended to probe the samePALM~ LOTcontrast, these rhymingquestions were answered differently by 27% of subjects, more disagreementthan was found for most “same/different” pairs—though even the mostconcordant pair of pairs, cot~ caught and tot ~ taught, were marked differ-
ently by 17% of subjects.The survey was administered by obtaining the permission of school
administrators in some places, individual teachers and parents in others.The teachers who oversaw the completion of the questionnaires instructedthe students that participation wasvoluntary. By every indication, the greatmajority of studentsin each classdid complete the form.
3.3. THE SAMPLE
After eliminating surveys that said barn~ born sounded the same orpause~paws sounded different, aswell as obviously joking responses (e.g.,
father from “North Pole”), a total of 1,562 surveysremained, from fourprincipal communities, asshown on ■gure 3.2.
The largest source, with 1,013 surveys, was Attleboro, Massachusetts,
a city of 43,000 (2005 Census estimate). The pilot study had placed Attle-
boro—35 miles southwestof Boston, 12 miles northeast of Providence—onthe boundary between MAIN and ENE low vowel systems and even identi-
■eda possibledifference between South Attleboro and the rest of the city.To ■nd out how children reflected that difference, the survey was adminis-tered to the fourth, eighth, and twelfth grades. These are the highest gradelevels of Attleboro’s ■veelementary schools, three middle schools, and onehigh school, respectively.
South Attleboro children were found to no longer maintain the lowback distinction, so the survey was extended to an adjacent town where itmight still be more intact. ln Seekonk, Massachusetts—a town of 14,000located just 5 miles east of Providence and, like South Attleboro, sharing aborder with Rhode Island—208 of the fourth, eighth, and twelfth graderscompleted the survey.
In the ENE area of low back merger, Brookline, Massachusetts, (pop.55,000), an inner suburb of Boston, provided 227 responses from twelfth
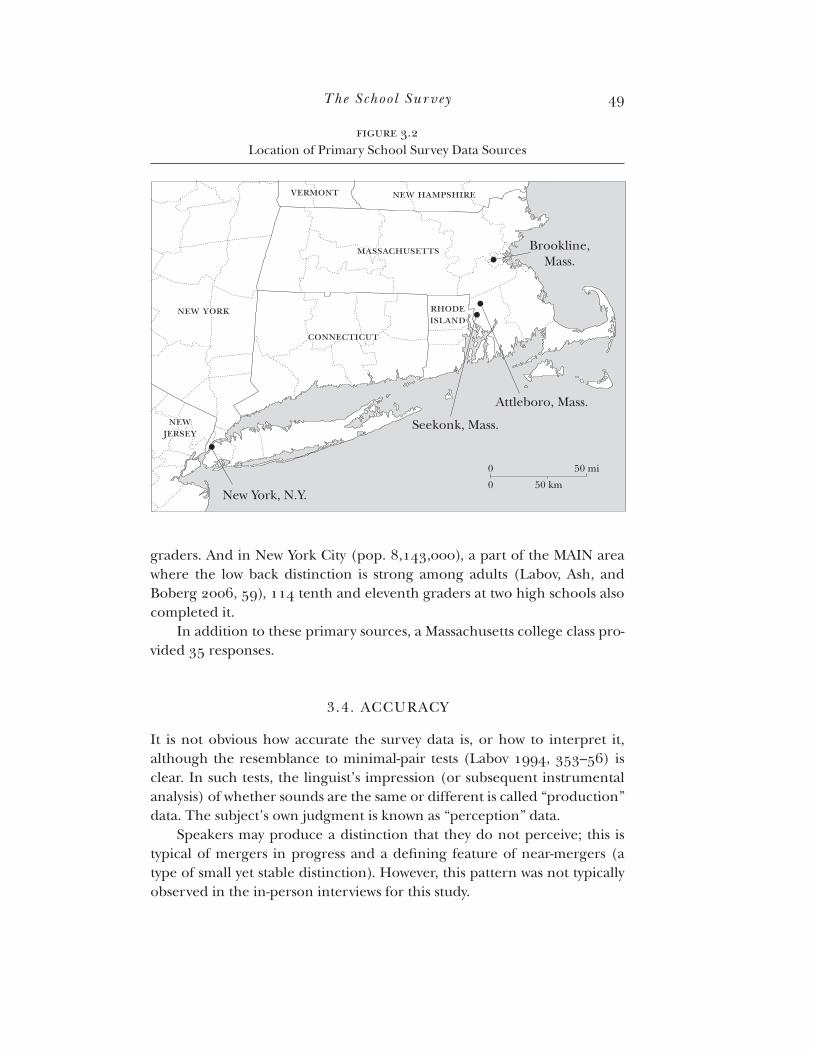
figure 3.2
new york
massachusetts
connecticut
new hampshire
newjersey
vermont
Seekonk, Mass.
New York, N.Y.
Attleboro, Mass.
Brookline,Mass.
0 50 mi
0 50 km
new york
massachusetts
connecticut
new hampshire
newjersey
vermont
rhodeisland
The School Survey 49
FIGURE3.2Location of Primary School Survey Data Sources
Attleboro, Mass.
Seekonk, Mass.
50 mi [o0 50km
graders. And in New York City (pop. 8,143,000), a part of the MAIN areawhere the low back distinction is strong among adults (Labov, Ash, and
Boberg 2006, 59), 114 tenth and eleventh gradersat two high schoolsalsocompleted it.
In addition to these primary sources, a Massachusetts college classpro-vided 35 responses.
3.4. ACCURACY
It is not obvious how accurate the survey data is, or how to interpret it,although the resemblance to minimal-pair tests (Labov 1994, 353—56)isclear. In such tests, the linguist’s impression (or subsequent instrumental
analysis)of whether soundsare the sameor different is called “production”data. The subject’s own judgment is known as “perception” data.
Speakers may produce a distinction that they do not perceive; this is
typical of mergers in progress and a de■ning feature of near-mergers (atype of small yet stable distinction). However, this pattern was not typically
observedin the in-person interviews for this study.

figure 3.3
Prod
uctio
n Ju
dged
“D
iffer
ent”
(%
)
School Survey Pairs Marked “Different”
100
01020304050
70
90
60
80
5 71 320 4 6
Age 9–18Age 22–65
5O PADS 952 LOW VOWELS OF SOUTHEASTERN NEW ENGLAND
Speakers can also produce near-identical forms in a minimal-pair test,
yet claim they are different. This was occasionally observed in in-personinterviews, most often from young children. Such a discrepant pattern sug-geststhe subjectmakesno distinction in natural speech(Herold 1990, 17),but with only the written response, it cannot be identi■ed.
Speakerscan alsoperform differently on minimal pair teststhan theydo in natural speech, by using a “borrowed prestige pronunciation” (Labov,
Yaeger,and Steiner 1972, 232) or shifting toward an incoming norm (Labov
1994>355).Conflict betweenthe dialect of current peersand that acquired earlier
from parents may account for many of the caseswhere perception does notmatch production. The influence of orthography will usuallyfavor the per-ception of distinctions rather than mergers. And asnoted, students treatingthe survey like a school quiz might have been less invariant (more ran-dom?) in their responses than ones accurately following their productionintuitions.
Fortunately, 31 survey subjects were interviewed in person, where someof the same minimal pairs were tested. This makes it possible to comparetheir production of the low back vowels to the judgments indicated on the
form. Figure 3.3 givesthe result.
3.4.1. ADULTS’ACCURACY.We look ■rst at the nine adult speakers:threemothers from the family study,and siXof my own friends and family. Sevenof the nine are 100% distinct in production and marked 7 of 7 pairs “dif-ferent” on the survey. One is 100% merged in production and marked 7 of
FIGURE3.3The Low Back Vowels: Survey Responses versus Speech Production
0 Age 9—18
sum 0 Age22—65 ‘3 9 WZ 90-- aE 80--H a
E 60"E 50-—$5040--3, 9 <9g 30" a g, au -- o iE 20
o i 9E 10" 0 9 <>9 : :0 —000000 0 CG ' 'D‘ 0 1 2 3 4 5 6 7
School Survey Pairs Marked “Different”

The School Survey 51
7 pairs “same.” These eight adults have completely retained the pattern of
where they grew up, even though at least four of them havehad extensivecontact with the opposite pattern, through residence and/ or marriage, for
over 20 years.The other adult, a mother from Wooster, Ohio, was intermediate on
both tasks. Reading the word pairs embedded in sentences, her vowels
were distinct or very close; but when presented with the bare words outof context, she pronounced them identically. Averaging these judgments,she was 35% distinct in production. On the survey, she marked 2 of 7 pairs
“different,” or 29%. Her intermediacy is not surprising asshegrew up onthe northern edge of the Midland, where similar behavior is widespread(Labov, Ash, and Boberg 2006, 62—64).
For adults, then, survey performance seems to accurately reflect lin-
guistic productions.
3.4.2. CHILDREN’SACCURACY.The 22 children in this comparison—14 fromSeekonk, six from Attleboro, and two from Brookline—behaved differently
from the adults. They were more variable in production and, at the sametime, less accurate in reflecting their production patterns on the survey.
Eight children were 100% merged in production. On average, these
children marked 0.6 of 7 items “different” on the survey:■vescored a 0,one scored a 1, and two scored a 2. Five children were 100% distinct in
production, and they marked 6.0 items “different” on average. One childscored a 3—our best example of merger perception leading production
(Labov,Ash, and Boberg 2006, 62)—one a 6, and three a fully distinct 7.Sowhile mostwereaccurate,someof the children who were categorical
in production werevariable on the survey.Children who were intermediatein production were, so to speak, even more intermediate on the survey. A
group of four, rated between 8% and 15% distinct in production, averaged
2.5 out of 7 on the survey (36% “different”), while another group of four,rated between 17% and 35% distinct in production, averaged 4.0 (57%
“different”). Assuming a merger in progress, these children’s productions
are leading their perceptions. One Seekonk 10-year-oldwasrated aslow as8% distinct in production, but still marked 6 of 7 pairs “different” on the
survey.Only one child was more consistent on the survey than in production,
while 13 were less consistent on the survey—that is, closer to the midpoint
of 3.5. The more intermediate children were in production, the more their
surveyscorestended to deviatefrom their production levels.Some children who are categorical in production sometimes allow
various other factors to supersede that grammar in making choices on

β N σ
β
52 PADS95: LOWVOWELSOFSOUTHEASTERNNEw ENGLAND
the school survey, but these other factors seem to have more in■uence onspeakerswho are intermediate or “unsure” in production.
Bresnan (2007) found that for sentences strongly predicted to appearin one of two possible syntactic constructions, subjects had strong prefer-
ences in the same direction. However, for sentences with weaker predictions,
subjectstended to haveno preferences,rather than simplyweakerones.Intasks where subjects consciously reflect on their choice of linguistic forms,
they maynot discriminate very sensitively,tending rather toward categoriesof 0%, 50%, and 100% (equivalent to “no,” “I don’t know,” and “yes”). Intasks measuring subjects’ actual linguistic performance with respect to the
same choices, a much ■ner, gradient pattern is observed.A more generous interpretation of the school survey suggeststhat when
its measurements departed from subjects’ productions, this did not alwaysmake them less worthwhile. lmagine two children growing up in Boston,
where the low back merger is the norm; one of them has local parentswhile the other’s are from New York. Both children may be indistinguish-ably merged in everyday speech, but the child with the distinct family, wholikely acquired the distinction himself in infancy, may well have performeddifferently on the survey, perhaps by marking just one or two (more) items“different. ’7
3.5. FACTORS AFFECTING VOWEL INVENTORY:LOT AND THOUGHT
3.5.1. MIXED-EFFECTSLOGISTICREGRESSION.The factors influencing sub-jects’ responses to the LOT ~ THOUGHT items were assessedwith mixed-effects logistic regression, implemented using the lmer( ) function (from the
lme4 package) in the statistical softwareenvironment R (Bates,Maechler,and Dai 2008; Baayen, Davidson, and Bates 2008). lmer() uses the Laplace
approximation to maximize the likelihood of models ■tting the probabilityp of a binary response with an equation of the following form:
logit(p)=ln(p/(1 —p))=X■+Zb,b~N(0,a?)
The log-odds of the response depends on both ■xed effects and ran-dom effects. The ■xed effects ([3) are the traditional independent variables,
factors whose levels are ■xed and repeatable. A good example of a ■xed
effect is gender,which hasa small number of levels,eachof which could besampled again, in repeating or extending an experiment.
The random effects (b) are factors whose levels are not necessarilyrepeatable. A typical random effect is that of Subject, where each partici-
The School Survey 53
pant constitutes a unique level sampled from a larger population. Eachsubject’s effect is assumed to be drawn from a normal distribution with a
mean of zero; the larger the effect, the larger the standard deviation.In modeling a ■xedfactor, we estimatethe effect of each speci■clevel
on the response.For a random factor, we are more interested in estimatingthe overall amount of variation. However, the model still gives estimates ofthe effects of each individual level of a random factor (called best linearunbiased predictors, or BLUPs).
Although the samesevenLOT~ THOUGHTitemswere answeredby eachsubject, ltem wasalso treated asa random effect, allowing inference to bemade about other potential word pairs.
The chief advantage of treating Subject as random is that individual
subject effects can be modeled at the sametime asbetween-subject■xedeffects.The method providesmore accuratesizeand signi■canceestimatesfor the ■xed effects of most interest—parents’ and peers’ backgrounds—than if the data’s by-subject grouping were most ignored (Johnson 2009).
Regression coef■cients will be expressed as log-odds differences
between factor levels.As the natural logarithm of an odds ratio, a givenchange in log-odds doesnot correspond to any ■xed increaseor decreasein probability. A log-odds increase of +1 multiplies the odds by 6+1,approxi-mately 2.7. If the odds were already 2:1 in favor of the response “different,”they would now be 5.421 in favor; the probability would increase from 0.67
to 0.84. But if the odds in favor of “different” had been 1021(probability0.91), they would now be 2721(probability 0.96).
In terms of survey scores out of seven items, a change from 3 of 7 to 4of 7 would correspond to +0.58 in log-odds, while a change from 3 of 7 to6 of 7 would be +2.08.
Each subcommunity (for example, the Attleboro twelfth grade) was ini-
tially analyzedin aseparateregression,in order not to assumethat the samefactors signi■cantly affect low vowel inventory everywhere (§3.5.3—10). A
combined analysiswasthen performed, including interactions betweenthemost important factors (§3.5. 11—12).
3.5.2 MASSACHUSETTSSTATECOLLEGE(M815). With only 35 responses,the data set from “Massachusetts State College” is small enough to discussdirectly, without regression. Figure 3.4 shows the pattern of subject scores.The distribution has a mean of 1.29 and is highly skewed: 49% of subjectsscored a fully merged 0 of 7; only 12% scored above the midpoint. Thiscampus—located in the ENE dialect area, with most of its students fromthere—is a mainly merged environment.

figure 3.4
54 PADS 95' LOW VOWELS OF SOUTHEASTERN NEW ENGLAND
FIGURE3.4Number of Subjects by Number of Items Marked “Different”:
Massachusetts State College
A20 i
m 497 Mean‘7? O 1.295 15--5~334: __m510 23%9.4O
B 5.."E 9% 9%
2 3% 3% 3% 3%
0 I I I IO 1 2 3 4 5 6 7
Number of Items Marked “Different”
The three highest-scoring students grew up in areas with the low back
distinction and had parents from there too, though they have lived inmerged surroundings for several years: one from New Jersey, who moved
three yearsago,scoreda 7; one from NewYork State,who moved ■veyearsago, scored a 6; one from western Massachusetts, who moved four years
ago, scored a 5.Two other students also grew up in distinct areas, but had low scores.
One was from Somerset, Massachusetts; his mother from (merged) Pitts-
burgh, Pennsylvania,likely hasmuch to do with his low scoreof 2.The otherlived as a child in (distinct) northern Illinois. She attended high school in
a merged part of Massachusetts, where her parents were also from. Shescored a 0.
Setting aside a student who grew up in a part of central Massachusettswhere the dialect boundary has not been established (an “unresolved ori-
gin”), 29 remain with origins in merged areas.Their scoreswere distributed
asfollows: 15 with O;eight with 1; two with 2; three with 3; and one with 4.Neither parental origin nor gender distinguished the higher-scoring
students in this subgroup. But we note that the items collar~ caller andtack ~ talk were marked “different” 16 times between them, while the other
■veitems were marked “different” only nine times (see §3.2 ). By taking into
account subjects’ origins, looking to their parents’ origins in some cases,and being aware of these item effects, the M815 responses can be quitesatisfactorily explained.5
3.5.3. BROOKLINE,MASSACHUSETTS,TWELFTHGRADERS(BR12). The datafrom Brookline, Massachusetts, consists of 227 responses from twelfth grad-

figure 3.5
The School Survey 55
ers. Figure 3.5 showsBR12 with a similar distribution of subject scorestoMS15. Almost half (42%) are fully merged, with a steep decline, and fairlyfew (18%) are on the distinct side of the midpoint; the mean score was
1.72.The regression models for BR12 considered the following ■xed fac-
tors, listed with the baseline level italicized:6 Gender (male, female); Origin
(Brookline, distinct, merged, other); Mother (distinct, merged, other); and
Father (distinct, merged, other).
The Origin factor represents where the subject spent their earliestchildhood, based on the information given for preschool, kindergarten,and elementary school. The Mother and Father factors are basedon wherethe subject’s parents were reported to have grown up.
Only placeswhoselow backvowelstatuswasknown with somecertaintywere treated as “merged” or “distinct”; when in doubt, the assignation wasalways to “other. ’7So Maine, New Hampshire, most of eastern Massachusetts
(following chap. 4), western Pennsylvania,Hazleton, Pennsylvania(follow-ing Herold 1990), Canada,and Scotland were coded “merged.” The Mid-Atlantic (part of southeastern Massachusetts, Rhode Island, Connecticut,
metropolitan New York City and Long Island, New Jersey, southeasternPennsylvania, Delaware, and Maryland) and Inland North (upstate New
York, northern Ohio, Michigan, northern Indiana, northern Illinois, and
eastern Wisconsin), as well as England, South Africa, and Australia, were all
coded “distinct.”When we compare a regression model with the ■xed factors of Gender,
Origin, Mother, and Father (and the random factors of Subject and Item)
FIGURE3.5Number of Subjectsby Number of Items Marked “Different”:
Brookline Twelfth Graders
120 'I: Mean
$100 49% 1‘72ll
5m 80 --‘5~93
O
“6 40--E 12% 11%g 20 " 4% o o :2o 4%
Z0
O l 2 3 4 5 6 7
Number of Items Marked “Different”

χ
κ
56 PADS95: LOWVOWELSOFSOUTHEASTERNNEw ENGLAND
to the samemodel without Gender, we ■nd that Gender is not signi■cantby a likelihood-ratio x2 test: p = .28.7 Nor is Gender signi■cant if it is added
as the only ■xed factor (19= .49); we will therefore drop Gender.
The other three factors are all signi■cantif they are added alone (Ori-gin: p = .0004; Mother: 19= .0006; Father: 1)= .005), but if each is droppedin turn from the full model, Father does not show signi■cance (Origin:
1)= .005; Mother: 19= .02; Father: 1)= .22).This chapter will demonstrate that mothers and fathers each have an
independent effect on their children. But becausethe mother’s effect isgreater, and because both parents often come from the same place—the
agreement between the two factors asmeasured by Cohen’s K is 0.445—sta—tistical signi■cance is not always achieved for both parents.
Another consequence of this correlation is that the coef■cients forMother and Father are less reliable. If we only included Mother, then thateffect would certainly be larger, but also less comparable to other mod-
elswhere both parents reach signi■cance.For comparability’s sake,wewilldiscussthe model with both Mother and Father (and Origin). For similarreasons of comparability, we will always compare models including both
Subject and Item random effects, even though ltem did not reach signi■-cance with one or two of the smaller data sets (Subject always did).
We can measure the contribution of the ■xedbetween-subjectfactorsby observing how adding them decreases the size of the Subject randomeffect, which accounts for residual between-subject variation. For the BR1 2null model with no ■xed effects, the Subject effect’s standard deviation is
2.129. Adding Origin, it drops to 2.034; with Mother, it drops to 1.973; andwith Father, it drops to 1.953.
Only 16% of the between-subject variance (the square of the standarddeviation) is accounted for by adding all three ■xed factors. This means thatthere is still substantial unexplained individual variation within each cell orcombination of ■xed effects. For example, the 22 natives of Brookline withboth parents from distinct dialect areas still spanned the full range of scoresfrom 0 to 7.
Table 3.1 gives the regression results, with the levels of each factorordered from highest coef■cient estimate (favoring “different”) to lowest(favoring “same”). Highlighted levels are signi■cantly (p< .05) differentfrom the baseline, according to a Wald Z—test.
Compared to the 138 students native to Brookline, the g with distinct
Origin weremuch more distinct on the survey(+1.911log-odds).The high-est scores in this group were from those who had moved more recently, but
one student who had moved from near Philadelphia before ■fth grade—that is, seven years previously—still scored a 5.

table 3.1
Factor Subjects Coefficient Wald p-ValueOrigin distinct 9 +1.911 .01 other 32 +1.177 .01 merged 48 +0.974 .01 Brookline 138 0.000 —Mother other 115 +0.175 .68 distinct 57 0.000 — merged 55 –1.084 .03Father distinct 65 0.000 — other 117 –0.222 .59 merged 45 –0.892 .09Item collar ~ caller 227 +0.424 tock ~ talk 227 +0.398 Moll ~ mall 227 +0.173 Otto ~ auto 227 +0.147 Don ~ Dawn 227 +0.069 tot ~ taught 227 –0.145 cot ~ caught 227 –0.312Subject maximum 1 +4.062 > +1 std. dev. 30 > +1.953 < –1 std. dev. 2 > –1.953 minimum 1 –2.533
Intercept: –1.941; log-lik.: –706; d.f.: 10; subject std. dev. (null): 2.129.
The School Survey 57
TABLE 3. 1Model without Interactions for Brookline Twelfth Graders
Factor Subjects Coe■■cz'entWaldp—ValueOrigin
distinct 9 +1911 .01
other 32 +1.177 .01
merged 48 +0974 .01Brookline 138 0.000 —
Mother
other 115 +0175 .68
distinct 57 0.000 —merged 55 —1.084 .03
Father
distinct 65 0.000 —other 117 —0.222 .59merged 45 —0.892 .09
Item
collar ~ caller 227 +0.424
tock~ talk 227 +0.398
Moll ~ mall 227 +0.17?)
Otto ~ auto 227 +0.147
Don ~Dawn 227 +0.069
tot ~ taught 227 —0.145
cot~ caught 227 —0.312Subject
maximum 1 +4062
> +1 std. dev. 30 > +1953
< —1std. dev. 2 > —1.953minimum 1 —2.533
Intercept: —1.941; log-lik.: —706; d.f.: 10; subject std. dev. (null): 2.129.
Subjects whose Origin was “other” (+1.177) or merged (+0974)
were more similar to the Brookline natives,but still signi■cantlymore dis-tinct. It makes sensefor the miscellaneous “other” group to be interme-diate, but there is no obvious reason why subjects who had moved frommerged places, mainly other towns near Boston, would be lessmerged than
Brookline natives.Under Mother, the “merged” level is signi■cantlylower (—1.084)than
the baseline of “distinct.” Controlling for subjects’ own backgrounds, there
remains a difference in their LOT~ THOUGHTresponseprobability associ-ated with their mother’s dialect. The modeled effect of a merged father(—0.892) is slightly smaller and does not reach signi■cance.

table 3.2
Distinct Mother Merged MotherDistinct Father 2.00 (N = 22) 0.20 (N = 10)Merged Father 0.50 (N = 8) 0.71 (N = 17)
figure 3.6
58 PADS95: LOWVOWELSOFSOUTHEASTERNNEw ENGLAND
Table 3.2 illustrates the parental effects using mean scores for a subsetof Brookline natives. Each parent has an effect, but they do not combine
linearly; if either parent is merged, the other seemsto havelesseffect. Thispoint will be taken up in section 3.5.1 2.
The magnitude of the Item effect for BR12 wassmaller than the ■xedeffects. As in MS15, the items collar ~ caller (+0424) and tack~ talk (+0.3g8)
were most often marked “different.” Cot ~ caught (—0.312) was most oftenmarked “same,” with t0t ~ taught (—0.145) following behind it. The sevenitems ranged from 18% to 30% “different” (25% overall).
Table 3.1 also indicates the span of the Subject effect, with standard
deviation 1.953: the largest positive effect (+4.062) was for a Brooklinenative with parents from easternMassachusetts,who neverthelessscored a5, while the largest negative effect (—2.533) was for a student with parentsfrom New York and New Jersey, who herself lived in Buffalo until fourthgrade, yet scored a O.
3.5.4. ATTLEBORO,MASSACHUSETTS,TWELFTHGRADERS(AB12).Attleboro’s281 twelfth graders marked 27% of items “different” for a mean score of
1.92, slightly higher than Brookline’s 1.72. Comparing ■gure 3.6 with ■g-
ure 3.5 showsthat AB12 hasfewer fully merged subjects(28%) than BR12
TABLE3.2Mean 0—7Scores for Native Brookline Twelfth Graders by Parents’ Origin
DistinctMother MergedMotherDistinct Father 2.00 (N: 22) 0.20 (N: 10)
Merged Father 0.50 (N: 8) 0.71 (N: 17)
FIGURE3.6
Number of Subjectsby Number of Items Marked “Different”:Attleboro Twelfth Graders
A120 :,_4 Mean
£100 1‘92H
5 28%E 80.8 21%g” 60 -- --------19%(I)
“6 40-- --------12%L1
'820 --
8% 6%g 3% 2%z
0O 1 2 3 4 5 6 7
Number of Items Marked “Different”

table 3.3
Factor Subjects Coefficient Wald p-ValueOrigin distinct 24 +1.241 .0002 South Attleboro 61 +0.433 .07 rest of Attleboro 125 0.000 — other 44 –0.004 .99 merged 27 –0.249 .45Mother distinct 52 0.000 — other 142 –0.655 .009 merged 87 –0.931 .0008Father distinct 51 0.000 — other 139 –0.294 .59 merged 91 –0.601 .04Item collar ~ caller 281 +0.242 tock ~ talk 281 +0.148 cot ~ caught 281 +0.052 Moll ~ mall 281 +0.040 tot ~ taught 281 +0.028 Don ~ Dawn 281 –0.082 Otto ~ auto 281 –0.144Subject maximum 1 +2.373 > +1 std. dev. 31 > +1.110 < –1 std. dev. 9 < –1.110 minimum 1 –1.526
Intercept: –0.489; log-lik.: –1039; d.f.: 11; subject std. dev. (null): 1.318.
The School Survey 59
and more intermediate ones, with a more gradual decline from mergedtoward distinct. The difference between the BR12 and AB1 2 distributions
is signi■cantevenby the fairly conservativeMann-Whitney test (p = .03).The AB1 2 distribution is closer to what would happen if subjects actu-
ally treated each item asan independent probabilistic choice. So the model■ts better, and we see in table 3.3 that the Subject random effect is smallerthan for BR12 even before we add the ■xed effects (1.318) and shrinks
more when we add them (1.1 10, or 29% reduction in variance). However,
the AB1 2 data still shows much individual variation.
Again, Gender is not a signi■cant predictor (12:54), while Origin(1)= .002) and Mother (19= .004) clearly are. The Father effect is smaller
TABLE 3.3Model without Interactions for Attleboro Twelfth Graders
Factor Subjects Coe■■cz'entWaldp—ValueOrigin
distinct 24 +1241 .0002
South Attleboro 61 +0433 .07
rest ofAttleboro 125 0.000 —other 44 —0.004 .99
merged 27 —0.249 .45Mother
distinct 52 0.000 —other 142 —0.655 .009
merged 87 —0.931 .0008Father
distinct 51 0.000 —other 139 —0.294 .59merged 91 —0.601 .04
Item
collar ~ caller 281 +0.242
tock~ talk 281 +0.148
cot~ caught 281 +0.052Moll ~ mall 281 +0.040
tot ~ taught 281 +0.028
Don ~Dawn 281 —0.082
Otto ~ auto 281 —0.144
Subject
maximum 1 +2.373
>+1 std. dev. 31 >+1.110
< —1std. dev. 9 < —1.110minimum 1 —1.526
Intercept: —0.489; log-11k: —1039; d.f.: 11; subject std. dev. (null): 1.318.

table 3.4
Distinct Mother Merged MotherDistinct Father 3.54 (N = 13) 1.75 (N = 4)Merged Father 2.25 (N = 12) 1.43 (N = 40)
6O PADS 952 LOW VOWELS OF SOUTHEASTERN NEW ENGLAND
than that of Mother, in the same direction, and likely real but not indepen-dently statistically signi■cant (p = .14).
Compared with the baseline of subjects from the rest of the city, thoseAttleboro natives who had grown up in South Attleboro, as identi■ed byelementary and middle school attendance, were only slightly more distinct(+0.433, n.s.). Thus, these twelfth graders only displayed a vestige of the
linguistic difference betweenthe two sectionsof the city that existsfor olderspeakers.
Movers to Attleboro from a distinct city or town were more likely torespond “different” (+1.241); those with merged or other origins were notsigni■cantlydifferent from the baseline.
The AB12 Mother effect is clear: compared to subjects with distinctmothers, those with “other” (—o.655) or merged mothers (—o.g31) marked
more items “same.” The difference between distinct and merged mothers isalmost the same as in BR1 2 (—1.084).While the Father effect did not reach
signi■canceasawhole, the difference betweenmerged and distinct fathersis estimated at —o.601, not far from BRi 2’s —o.892.
Like table 3.2 for BR12, table 3.4 for AB12 suggests that fathers andmothers have a parallel effect and that the mothers’ effect is greater. Again,
if one parent is merged, the statusof the other makeslessdifference.It is remarkable that parental patterns this clear can be observed in
high school seniors, who have had peer influences for 12 or more years.Even the powerful adolescent peer group (Eckert 1989) does not com-pletely overwhelm earlier influences on vowel inventory. An anonymousreviewerwonders if the details of phonetic realization are more completelysubject to peer influence, while matters of phonological inventory, aswell
as morphosyntactic and lexical variables, may be affected by a wider rangeof factors.
As far asItem effects are concerned, collar ~ caller (+0242) and tock~ talk(+0.148) are once again the most often “different, ’7 though to less of adegree. Otto ~ auto is now the pair most often marked “same” (—o.144).
The Subject effect has a much narrower span, ranging from +2.373for a boy who had just moved from Norway—where British English is often
TABLE3.4Mean 0—7Scores for Native Attleboro Twelfth Graders by Parents’ Origin
DistinctMother MergedMotherDistinct Father 3.54 (N: 13) 1.75 (N: 4)
Merged Father 2.25 (N: 12) 1.43 (N: 40)

×
figure 3.7
The School Survey 61
taught—and scored a 7, much higher than most subjects with “other” Ori-
gin and parents, to —1.526 for a subject from South Attleboro with Rhode
Island parents, who nevertheless scored a fully merged 0 (scores from 3 to
5 were typical for students with similar backgrounds).
3.5.5. ATTLEBORO,MASSACHUSETTS,EIGHTHGRADERS(AB8). Attleboro’s402 eighth graders took the survey in their last year of middle school, ofwhich the city has three. One of them, Coelho, is located in South Attle-
boro. The distribution of responses is shown in ■gure 3.7. The mean scoreis only 1.31, with almost half the subjects responding as fully merged and
very few at the distinct end of the spectrum. Attleboro eighth graders are,on the whole, slightly more merged than their twelfth-grade counterparts; aMann-Whitney testgives11)= 6 X 10‘6 asthe chance thesetwo setsof subject
scores are drawn from equally merged populations.
Once again, the predictors Origin (1)= .0002) and Mother (19= .0007)clearly reach the signi■cancethreshold, while Father does not (19= .11),and Gender clearly does not (19= .58). The coef■cient estimates for ABS,
given in table 3.5, are very similar to those for AB12. So is the behavior ofthe Subject random effect, which has a standard deviation of 1.369 withoutthe ■xed effects and 1.194 with them (24% reduction in variance).
Nativesof South Attleboro, nearly all of whom were attending CoelhoMiddle School there, were not signi■cantly more distinct (+0.090, n.s.)
than the baselinegroup from the rest of the city. This showsthe continuedfading awayof the Attleboro / SouthAttleboro distinction. The effect of hav-ing moved from a distinct community is still strong (+1.914).
FIGURE3.7Number of Subjectsby Number of Items Marked “Different”:
Attleb0r0 Eighth Graders
A200 iN 44% Mean
3 1.31n 160-5
3 120-E}
5
go80--19% 17%
a 11%4U
E 40- ---------6%5 2% 1% 07Z
00
0 l 2 3 4 5 6 7
Number of Items Marked “Different”

table 3.5
Factor Subjects Coefficient Wald p-ValueOrigin distinct 15 +1.914 1 × 10⁻⁶
merged 33 +0.153 .63 South Attleboro 58 +0.090 .72 rest of Attleboro 208 0.000 — other 88 –0.012 .96Mother distinct 66 0.000 — other 232 –0.826 .0006 merged 104 –1.075 .0002Father distinct 71 0.000 — other 236 –0.176 .47 merged 95 –0.600 .04Item tock ~ talk 402 +0.713 collar ~ caller 402 +0.581 Moll ~ mall 402 +0.490 tot ~ taught 402 –0.009 cot ~ caught 402 –0.189 Don ~ Dawn 402 –0.232 Otto ~ auto 402 –0.232Subject maximum 1 +2.804 > +1 std. dev. 38 > +1.194 < –1 std. dev. 1 < –1.194 minimum 1 –1.208
Intercept: –1.081; log-lik.: –1213; d.f.: 11; subject std. dev. (null): 1.369.
62 PADS95: LOWVOWELSOFSOUTHEASTERNNEw ENGLAND
TABLE 3. 5Model without Interactions for Attleboro Eighth Graders
Factor Subjects Coef■cient Waldp—ValueOrigin
distinct 15 +1.914 1 x 10‘6
merged 33 +0153 .63
South Attleboro 58 +0090 .72
rest of Attleboro 208 0.000 —other 88 —0.012 .96
Mother
distinct 66 0.000 —other 232 —0.826 .0006
merged 104 —1.075 .0002Father
distinct 71 0.000 —other 236 —0.176 .47merged 95 —0.600 .04
Item
tock~ talk 402 +0.713
collar ~ caller 402 +0.581Moll ~ mall 402 +0.490
tot ~ taught 402 —0.009
cot~ caught 402 —0.189Don ~Dawn 402 —0.232
Otto ~ auto 402 —0.232
Subjectmaximum 1 +2804
> +1 Std. deV. 38 > +1.194
< —1Std. deV. 1 < —1.194minimum 1 —1.208
Intercept: —1.081; log-lik.: —1213; d.f.: 11; subject Std. deV. (null): 1369.
Children of mothers with an unknown dialect background (“other,”
—o.826),and children of known merged mothers (—1.075) were moremerged than children of distinct mothers. On top of this, a merged-fathereffect does Showup, but it is smaller (—0.600). The cross-tabulation in table3.6 con■rms this pattern of parental in■uence.
Each cell of table 3.6 has a lower mean score than the correspondingcell of table 3.4. In part, this is due to ABi 2’sSouthAttleboro subjectsscor-ing higher than ABS’S: 2.34 versus 1.44. But ABi 2 subjects of every origin
scoredhigher than their ABS counterparts. This suggeststhat in the ABi 2milieu, some merged-background students had learned something of thedistinction from the minority of distinct students.

table 3.6
Distinct Mother Merged MotherDistinct Father 2.58 (N = 24) 0.83 (N = 6)Merged Father 1.67 (N = 6) 0.70 (N = 37)
figure 3.8
The School Survey 63
TABLE3.6
Mean 0—7Scores for Native Attleboro Eighth Graders by Parents’ Origin
DistinctMother MergedMotherDistinct Father 2.58 (N = 24) 0.83 (N: 6)
Merged Father 1.67 (N = 6) 0.70 (N: 37)
A similar pattern of Item effectsappears,though with a greater magni-tude than in AB1 2 and BR1 2: tack~ talk is at +0.71 3, collar ~ caller at +0.58 1,and Moll ~ mall at +0490, favoring “different,” with Don ~Dawn and
Otto~ auto favoring “same” at —o.232. While it makes sensethat youngerchildren might have been more affected by the shortcomings of the vari-
ous items, the regularity of these effects is surprising. For example, of thesubjects who marked just one item “different,” 74% (56/ 76) chose one ofthe three favoring items.
The ABS subject effects pattern similarly as in AB12. While the mostfrequent subjectadjustment is asmall negativeone (for subjectswho scored
a 0 when predicted to score near 1), the larger individual adjustments arepositive, in the direction of the distinction. This makes sensefor a subcom-
munity that overall is one of the most merged we haveseen.
3.5.6. ATTLEBORO,MASSACHUSETTS,FOURTH GRADERS(AB4). The 330
responses from Attleboro fourth graders came from the city’s ■ve elemen-
tary schools. Figure 3.8 shows that AB4 responded similarly to ABS. The
mean is slightly higher (1.55 for AB4, 1.31 for ABS), but the difference isnot signi■cant (Mann-Whitney, p = .08).
FIGURE3.8
Number of Subjectsby Number of Items Marked “Different”:Attleboro Fourth Graders
160 i8$ 39% 1$6535“
ll
: 120
5.0.)
5° 80 --m: 19%t... 15%S 12%
,3 40' 8%
g 4%2% 1%
Z 0R
O l 2 3 4 5 6 7
Number of Items Marked “Different”

table 3.7
Factor Subjects Coefficient Wald p-ValueOrigin distinct 13 +1.347 .006 other 141 +0.353 .11 merged 32 +0.016 .96 rest of Attleboro 112 0.000 — South Attleboro 32 –0.629 .11Mother distinct 55 0.000 — other 205 –0.007 .98 merged 70 –0.464 .19Father distinct 53 0.000 — merged 65 –0.016 .97 other 212 –0.017 .95Item collar ~ caller 330 +0.195 tot ~ taught 330 +0.098 Don ~ Dawn 330 +0.098 cot ~ caught 330 +0.087 Moll ~ mall 330 +0.065 tock ~ talk 330 +0.021 Otto ~ auto 330 –0.194Subject maximum 1 +3.031 > +1 std. dev. 41 > +1.361 < –1 std. dev. 1 < –1.361 minimum 1 –1.586
Intercept: –1.765; log-lik.: –1111; d.f.: 11; subject std. dev. (null): 1.411.
64 PADS95: LOWVOWELSOFSOUTHEASTERNNEw ENGLAND
After dropping Gender (19= .76) from the model, testing the otherthree ■xed factors shows that the Origin variable is signi■cant (p = .006),but the Mother (19= .26) and Father (1)= .99) variables are not. The stan-dard deviation of the Subject effect is 1.41 1 without ■xed factors, decreas-
ing to 1.367 with Origin included and to 1.361 with Mother and Fatherincluded (only a 7% reduction in variance).Table 3.7 showsthe model.
Subjectswho came to Attleboro before or during elementary schoolfrom a distinct community were more likely to be distinct (+1
.347, p = .006),
but those who moved from a merged community were no more likely to bemerged (+0.01 6, n.s.). In a reversal, subjects with South Attleboro origins (as
TABLE 3.7
Model without Interactions for Attleboro Fourth Graders
Factor Subjects Coef■cient Waldp—ValueOrigin
distinct 13 +1347 .006other 141 +0353 .11
merged 32 +0016 .96
rest of Attleboro 112 0.000 —South Attleboro 32 —0.629 .11
Mother
distinct 55 0.000 —other 205 —0.007 .98
merged 70 —0.464 .19Father
distinct 53 0.000 —merged 65 —0.016 .97
other 212 —0.017 .95Item
collar ~ caller 330 +0.195
tot ~ taught 330 +0.098
Don ~Dawn 330 +0.098
cot~ caught 330 +0.087Moll ~ mall 330 +0.065
tock~ talk 330 +0.021
Otto ~ auto 330 —0.194Subject
maximum 1 +3031
> +1 Std. dev. 41 > +1361
< —1std. dev. 1 < —1.361minimum 1 —1.586
Intercept: —1.765; log-11k: —1111; d.f.: 11; subject std. dev. (null): 1.411.

table 3.8
Distinct Mother Merged MotherDistinct Father 1.83 (N = 12) 0.00 (N = 3)Merged Father 0.40 (N = 4) 0.88 (N = 16)
table 3.9
Community N Mean Subject s.d. Subject s.d. % Reduction Item s.d. (total) (residual) in VarianceBR12 227 1.72 2.129 1.953 16% 0.292AB12 281 1.92 1.318 1.110 29% 0.163AB8 402 1.31 1.369 1.194 24% 0.402AB4 330 1.55 1.411 1.361 7% 0.149
The School Survey 65
measured by elementary school attendance) were marginally more merged
(—0.629,p = .11) than nativesof the rest of the city.The biggestdifferenceabout the AB4 model is the absence of signi■cant parent effects, althoughmerged mothers do show a weak, nonsigni■cant effect (—0.464, p = .19)in the expected direction. Table 3.8 suggests the usual parent effects maybe operating among Attleboro natives, but that they are smaller in size (cf.
table 3.4 for ABi 2 and table 3.6 for AB8).If anything, one might have expected to see larger parent effects
among these fourth-grade students, who have had peers for fewer years and
who aremore dependent on their parents than eighth and certainly twelfthgraders.One possibleexplanation is that younger children arelessaccurateon the survey,and subtle effects are lost in the noise. However, this wouldlikely result in a much larger residual Subject effect, something that is notseenfor AB4. The ltem effectsfor A134are noticeably smaller than for AB8,which is also surprising as one might expect younger children to be morelikely to be influenced by orthography. Rather, they seem to be treating the
seven items more equally than any other group.
3.5.7. SUMMARYOFBROOKLINEANDATTLEBORORESULTS.Table 3.9 summa-rizesthe regressionmodelsfor Brookline and Attleboro. BR12 hasthe mostintersubject variation; and even after adding the ■xed effects of Origin,Mother, and Father, it has the most subject variation left over. With A1312and AB8, the ■xed effects make the most impact on the model, leaving the
smallestamount of unexplained subjectvariation. The ■xed effects makelittle improvement to the AB4 model.
TABLE3.8
Mean 0—7Scores for Native Attleboro Fourth Graders by Parents’ Origin
DistinctMother MergedMotherDistinct Father 1.83 (N: 12) 0.00 (N: 3)
Merged Father 0.40 (N: 4) 0.88 (N: 16)
TABLE3.9Summary of Models for Brookline and Attleboro
Community N Mean Subjects.d. Subjects.d. % Reduction Item s.d.
(total) (residual) in VarianceBR12 227 1.72 2.129 1.953 16% 0.292
AB12 281 1.92 1.318 1.110 29% 0.163
ABS 402 1.31 1.369 1.194 24% 0.402
AB4 330 1.55 1.411 1.361 7% 0.149

table 3.10
Community Distinct Merged Merged Most Often Origin Mother Father “Different”BR12 +1.911 –1.084 –0.892 collar ~ callerAB12 +1.241 –0.931 –0.601 collar ~ callerAB8 +1.914 –1.075 –0.600 tock ~ talkAB4 +1.347 –0.464 –0.016 collar ~ caller
66 PADS95: Low VOWELSOFSOUTHEASTERNNEw ENGLAND
AB4 and AB1 2 have the least Item variation, ABS the most. Table 310shows that in three of the four communities, collar ~ callerwas the item most
often marked “different,” and it was in second place in ABS. In the threeAttleboro communities, Otto ~ auto was the item most often marked “same,”
while in BR1 2 it was in the middle of the pack.
Subjects who had moved to the mainly merged environments ofBrookline or Attleboro from a distinct dialect area always marked moreitems “different” than their peers, receiving a coef■cient ranging between
+1 and +2 log-odds.The number of distinct in-moverswassmall,which mayexplain the variability in thesecoef■cients.
The effect of a merged mother was consistently close to —1,and that of
a merged father between —O.6and —O.g,except in the AB4 data where the
parental effectswere much smaller and not statisticallysigni■cant.The eighth—and twelfth-grade subjects showed the influence of both
peers and parents, an important result, though we do not know if theirspeech would also reflect both influences.
3.5.8. NEw YORKCITY HIGH SCHOOLSTUDENTS(NY11). Unlike the above
communities, which were mainly merged, the averageresponsefrom 114New York City high school students—103 eleventh graders at BrooklynTech High School and 11 tenth graders at aJewish private school in Man-
hattan—was69% “different, ’7with a mean scoreof 4.81.The scoredistribution for NY11 is shownin ■gure 3.9. It looks roughly
like the mirror image of ■gure 3.5 for BR12. The New York distributionfalls rapidly from its peak on the right—36% fully distinct—levelsoff some-what, and then there is a small second peak at the left end of the spectrum,
as 9% of subjects gave a fully merged response.As before, there was no detectable effect of Gender on the responses
(19= .82). And, unfortunately, there were no in-moversfrom merged areas,so it wasnot possible to evaluatewhether they were acquiring the distinc-tion in New York.
TABLE 3.10Summary Of Principal Effects for Brookline and Attleboro
Community Distinct Merged Merged Most Often
Origin Mother Father “Di■erent”BR12 +1.911 —1.084 —0.892 collar ~ caller
AB12 +1241 —0.931 —0.601 collar ~ caller
AB8 +1.914 —1.075 —0.600 tock~ talkAB4 +1347 —0.464 —0.016 collar ~ caller

table 3.11
Distinct Mother “Other” MotherDistinct Father 6.42 (N = 12) 6.11 (N = 9)“Other” Father 2.33 (N = 3) 4.54 (N = 90)
figure 3.9
The School Survey 67
FIGURE3.9Number of Subject by Number of Items Marked “Different”:
New York City Tenth and Eleventh Graders
A 50 i: Mean
"* 4.81 36%
H 405
‘330
a.)5’:3
(/1 20 157“a 0 12%b 9% 10% 10%
g10-- 1% 1%:3
Z0
O l 2 3 4 5 6 7
Number of Items Marked “Different”
Dividing students’ origins into three categories showed that the 35 sub-jects from Queens were marginally more merged (—1.281, p = .04) than the48 from Brooklyn; the remaining 3 1 were intermediate.8
There were no merged fathers and only one merged mother, so these
variableswere coded asdistinct versus“other.” Almost all distinct parentswere from New York City; almost all “other” parents were from foreigncountries.
Mother was not signi■cant (p = .87), but Father was: compared tosubjects with distinct fathers, those with “other” fathers were much moremerged (—2.734,p = .003). The greater importance of fathers (also seen intable 3.1 1) may relate to NY1 1’s subjects’ being two-thirds male (see sec-tion 3.5.13 for further discussion).
With its large positive intercept (+4.520), the regression model given intable 3.12 predicts that subjects with distinct parents will almost alwaysmark
LOT ~ THOUGHTitems “different.” Indeed, 11 subjects in this cell scored aperfect 7, while 1 scoreda 0.
TABLE 3.1 1Mean 0—7 Scores for Native New York City Tenth and Eleventh Graders
by Parents’ Origin
Distinct Mother “Other” Mother
Distinct Father 6.42 (N = 12) 6.11 (N: 9)“Other” Father 2.33 (N = 3) 4.54 (N: 90)

table 3.12
Factor Subjects Coefficient Wald p-ValueOrigin Brooklyn 48 0.000 — other 31 –0.392 .54 Queens 35 –1.281 .04Mother distinct 15 0.000 — other 99 –0.169 .87Father distinct 21 0.000 — other 93 –2.734 .003Item cot ~ caught 114 +1.002 tot ~ taught 114 +0.307 tock ~ talk 114 +0.099 collar ~ caller 114 –0.101 Don ~ Dawn 114 –0.481 Otto ~ auto 114 –0.603 Moll ~ mall 114 –1.422Subject maximum 1 +2.657 > +1 std. dev. 6 > +2.350 < –1 std. dev. 15 < –2.350 minimum 1 –6.171
Intercept: +4.520; log-lik.: –369; d.f.: 7; subject std. dev. (null): 2.561.
68 PADS95: LOWVOWELSOFSOUTHEASTERNNEw ENGLAND
TABLE 3. 12Model without Interactions for New York City Tenth and Eleventh Graders
Factor Subjects Coef■cient Waldp—ValueOrigin
Brooklyn 48 0.000 —other 31 —0.392 .54
Queens 35 —1.281 .04Mother
distinct 15 0.000 —other 99 —0.169 .87
Father
distinct 21 0.000 —other 93 —2.734 .003
Item
cot~ caught 114 +1.002tot ~ taught 114 +0.307
tock~ talk 114 +0.099
collar ~ caller 114 —0.101Don ~Dawn 114 —0.481
Otto ~ auto 114 —0.603
Moll ~ mall 114 —1.422
Subject
maximum 1 +2657
> +1 Std. dev. 6 > +2.350
< —1Std. dev. 15 < —2.350
minimum 1 —6.171
Intercept: +4.520; log-lik.: —369; d.f.: 7; subject Std. dev. (null): 2.561.
This one surprisingly merged subject was assigned the very large Sub-ject effect of —6.171. Smaller, but Still large subject effects were commonin this model (Std. dev. 2.350). In the group of students with “other” (for-
eign) parents, there is agreat deal of variation. Evenamong thosewho havealways lived in New York, many do not seem to have acquired the low back
distinction. Whether they can be said to be leading a merger is another
matter.The Item effects are also the largest thus far, perhaps no coincidence
as English was often not the native language, and they appear in a verydifferent order. The “canonical” pairs cot~ caught (H.002) and tot ~ taught
(+0307) were preferably marked “different” in New York City; they hadfavored “same” in Brookline and were neutral in Attleboro.
Otto ~auto (—0.603) favored “same” in New York, like in Attleboro.
Moll ~ mall (—1.422), which tended to favor “different” elsewhere, greatly
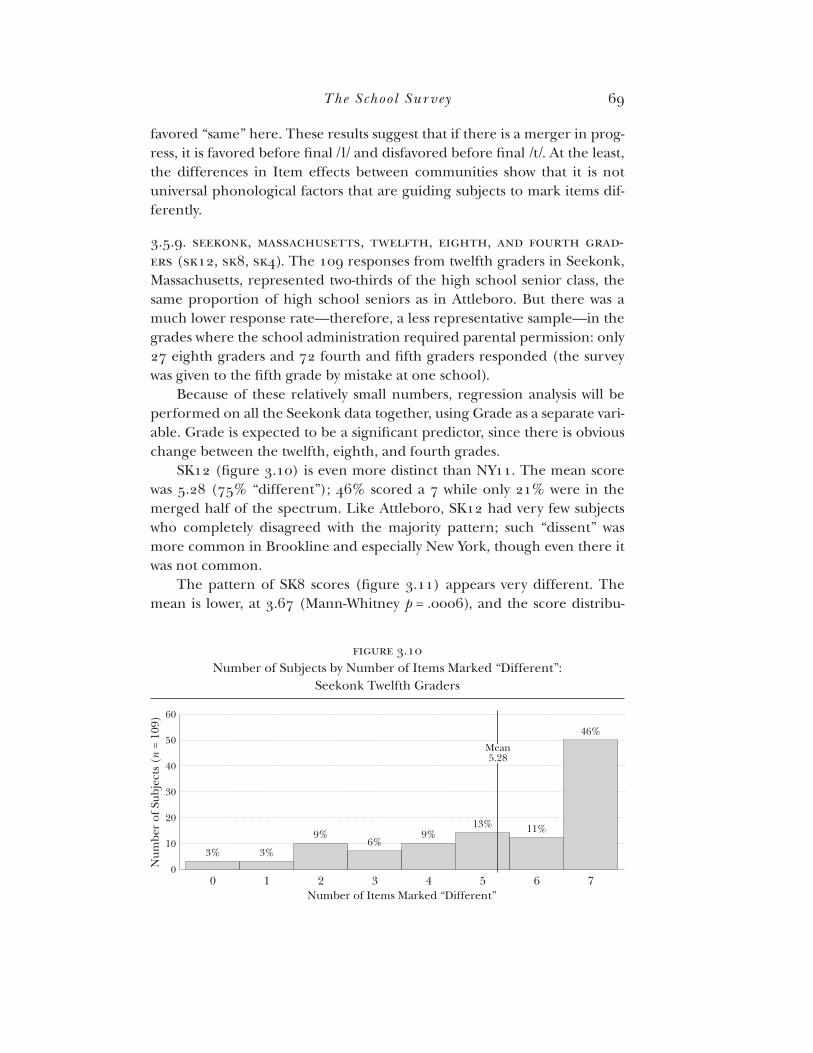
figure 3.10
The School Survey 69
favored “same” here. These results suggest that if there is a merger in prog-ress, it is favored before ■nal /l/ and disfavored before ■nal /t/. At the least,the differences in Item effects between communities show that it is notuniversal phonological factors that are guiding subjects to mark items dif-ferently.
3.5.9. SEEKONK,MASSACHUSETTS,TWELFTH,EIGHTH,ANDFOURTHGRAD-ERS (SK12, SK8, SK4). The 109 responses from twelfth graders in Seekonk,
Massachusetts,represented two-thirds of the high school senior class,the
sameproportion of high school seniors as in Attleboro. But there was amuch lower response rate—therefore, a less representative sample—in the
gradeswhere the school administration required parental permission: only27 eighth graders and 72 fourth and ■fth graders responded (the surveywas given to the ■fth grade by mistake at one school).
Becauseof these relatively small numbers, regression analysiswill beperformed on all the Seekonk data together, using Grade asa separate vari-able. Grade is expected to be a signi■cant predictor, since there is obviouschange between the twelfth, eighth, and fourth grades.
SK12 (■gure 3.10) is even more distinct than NY11. The mean scorewas 5.28 (75% “different”); 46% scored a 7 while only 21% were in themerged half of the spectrum. Like Attleboro, 8K12 had very few subjectswho completely disagreed with the majority pattern; such “dissent” wasmore common in Brookline and especially New York, though even there it
wasnot common.The pattern of 8K8 scores (■gure 3.1 1) appears very different. The
mean is lower, at 3.67 (Mann-Whitney p = .0006), and the score distribu-
FIGURE3.10Number of Subjectsby Number of Items Marked “Different”:
Seekonk Twelfth Graders
A 60§
546%
H0
Mean5 5.28m 40‘63:g 30(I)0.4
S 20 13% 11%g 9% 9% 0E 10 607
5 3% 3%l—l—Z
0O l 2 3 4 5 6 7
Number of Items Marked “Different”
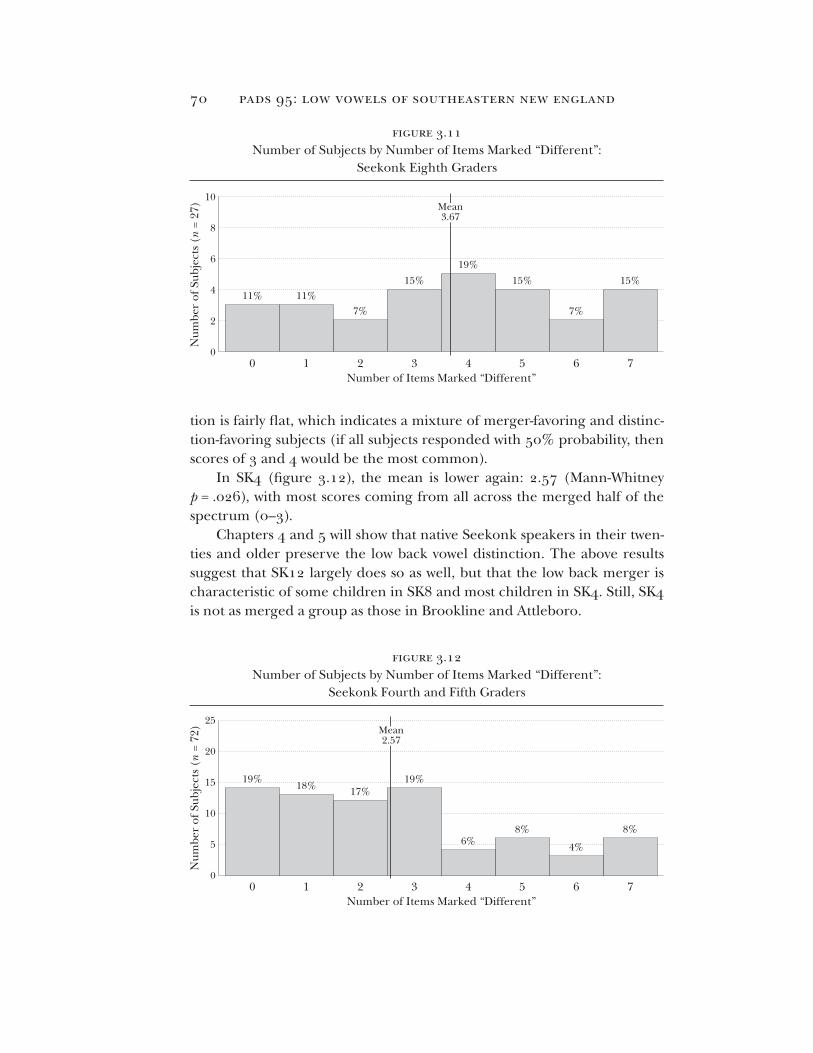
figure 3.11
figure 3.12
7O PADS 952 LOW VOWELS OF SOUTHEASTERN NEW ENGLAND
FIGURE3.11Number of Subjectsby Number of Items Marked “Different”:
Seekonk Eighth Graders
10 i{3 Mean67 3.67
5 8
55%,6 19%m5 15% 15% 15%“a 4 11% 11%E
2__7% 7%
E5
Z0
O 1 2 3 4 5 6 7
Number of Items Marked “Different”
tion is fairly ■at, which indicates a mixture of merger-favoring and distinc-tion-favoring subjects (if all subjects responded with 50% probability, then
scores of 3 and 4 would be the most common).In 8K4 (■gure 3.12), the mean is lower again: 2.57 (Mann-Whitney
p = .026), with most scorescoming from all acrossthe merged half of thespectrum (0—3).
Chapters 4 and 5 will show that native Seekonk speakers in their twen-ties and older preserve the low back vowel distinction. The above resultssuggest that SK12 largely does so as well, but that the low back merger ischaracteristic of some children in SKS and most children in 8K4. Still, 8K4
is not asmerged a group asthose in Brookline and Attleboro.
FIGURE3.12Number of Subjectsby Number of Items Marked “Different”:
Seekonk Fourth and Fifth Graders
25 .a
Melan
1] 2.57
520
U 15...........19% 19%E: 18% 17%m555 10--O
E 8% 8%
"E 5 ---------5%--------- 4502
0O 1 2 3 4 5 6 7
Number of Items Marked “Different”
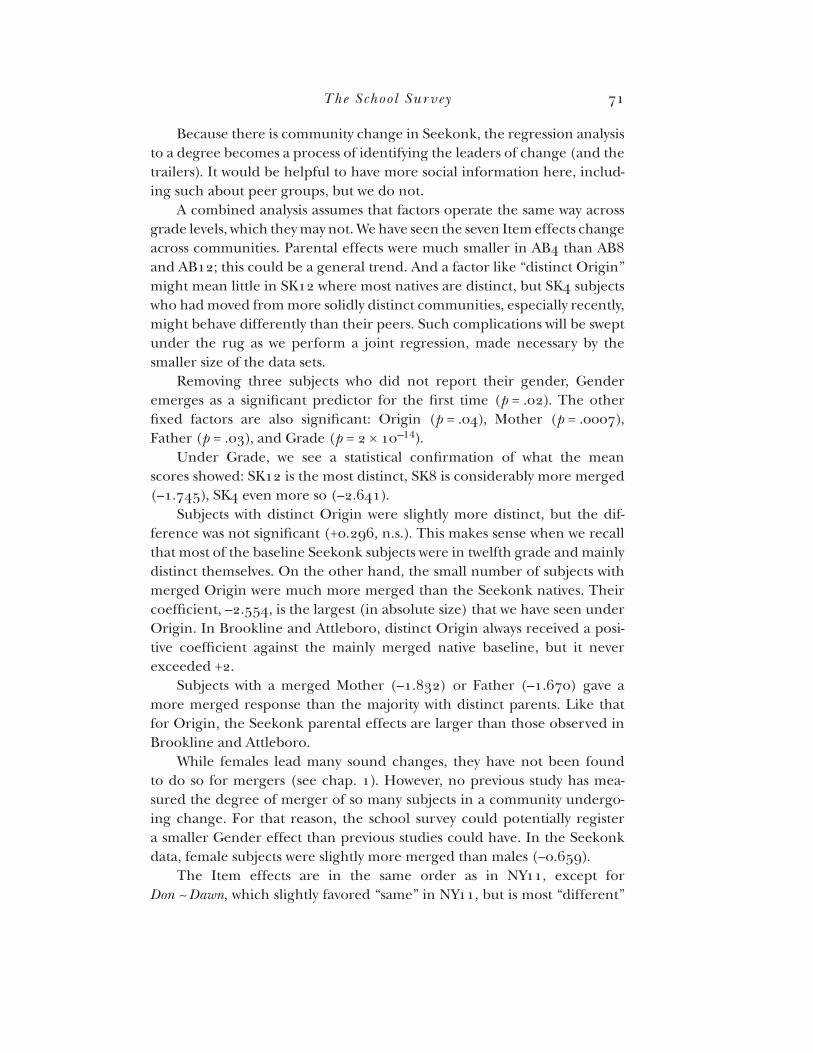
×
The School Survey 71
Becausethere is community changein Seekonk,the regressionanalysisto a degree becomes a process of identifying the leaders of change (and the
trailers). It would be helpful to havemore social information here, includ-ing such about peer groups, but we do not.
A combined analysis assumes that factors operate the same way acrossgrade levels, which they may not. We have seen the seven ltem effects change
across communities. Parental effects were much smaller in A134than ABS
and AB12; this could be a general trend. And afactor like “distinct Origin”might mean little in SK12 where most nativesare distinct, but SK4subjectswho had movedfrom more solidly distinct communities, especiallyrecently,might behave differently than their peers. Such complications will be sweptunder the rug as we perform a joint regression, made necessary by thesmaller size of the data sets.
Removing three subjects who did not report their gender, Genderemerges as a signi■cant predictor for the ■rst time (p = .02). The other■xed factors are also signi■cant: Origin (1)= .04), Mother (19= .0007),
Father (1)= .03), and Grade (19= 2 x 10—14).Under Grade, we see a statistical con■rmation of what the mean
scores showed: SK12 is the most distinct, SKS is considerably more merged(—1.745), SK4 even more so (—2.641).
Subjects with distinct Origin were slightly more distinct, but the dif-ference was not signi■cant (+0296, n.s.). This makes sensewhen we recall
that most of the baselineSeekonksubjectswere in twelfth grade and mainlydistinct themselves. On the other hand, the small number of subjects withmerged Origin were much more merged than the Seekonk natives. Theircoef■cient, —2.554, is the largest (in absolute size) that we have seen under
Origin. In Brookline and Attleboro, distinct Origin alwaysreceived a posi-tive coef■cient against the mainly merged native baseline, but it neverexceeded +2.
Subjectswith a merged Mother (—1.832)or Father (—1.670)gave amore merged response than the majority with distinct parents. Like thatfor Origin, the Seekonk parental effects are larger than those observed inBrookline and Attleboro.
While females lead many sound changes, they have not been found
to do so for mergers (see chap. 1). However, no previous study has mea-sured the degree of merger of so many subjects in a community undergo-ing change. For that reason, the school survey could potentially register
a smaller Gender effect than previous studies could have. In the Seekonkdata, female subjects were slightly more merged than males (—0.659).
The ltem effects are in the same order as in NY1 1, except for
Don ~Dawn,which slightly favored “same” in NY11, but is most “different”

72 PADS95: LOWVOWELSOFSOUTHEASTERNNEw ENGLAND
(+0470) in Seekonk. Don ~Dawn is tied for second-most “different” Itemin SK12 and 8K8 and is the most “different” in 8K4. This suggests thatDon ~Dawn behaves conservatively with respect to the merger in progress,a pattern that might arise if some subjects know older people named Donand/ or Dawn, and attend to or remember the realizations of those names
more carefully than common nouns or other words.The “canonical” pairs cot~caught (+0406) and tot~taught (+0375)
also favor “different,” while Otto~ auto (—0.634)and Moll ~ mall (—0.665)favor “same.” The magnitude of the effects is not as large as NY11, buttheir position appears to be a signature of mainly distinct places, just ashaving collar~ callerand took~ talkmost “different” wasahallmark of mainlymerged places.
The total between-subject variation washigh (s.d. = 234 3) which makes
sense, since the Seekonk data was a mixture of heterogeneous grade levels.Controlling for grade, the Subject effect fell to 1.943 (a 31% decrease in
variance).Taking that asa baseline,adding the other ■xedfactors reducedit to 1.617 (also a 31% decrease). Comparing table 3.13 to table 3.9, we
seethat the Seekonk subjects,with their merger in progress,were a fairlydiverse group, but that the ■xed effects also made a large difference in
predicting their scores.For all four ■xed factors—Origin, Mother, Father, and Gender—the
effect sizeswere larger than in Attleboro and Brookline. To explain this, wemight note that in Seekonk the merger is in progress and suggest that while
it is ongoing, subjectsare naturally more different from one another andperhapsmore differentiated according to relevant factors.
This may well be true for Gender, but for Origin and the parental fac-
tors there is another explanation, which hinges on Seekonkbeing a mainlydistinct community while Attleboro and Brookline are mainly merged.
Recall that either parent’s low back vowel statusmatters more if the otherparent is distinct and less if the other parent is merged; this follows from itbeing easier to acquire the merger than the distinction. By the same token,
one’s parentswill make more of a difference if one’speersare distinct, andformer peers (the Origin factor) will be more important if current peersare distinct.
3.5.10. COMPARISONACROSSCOMMUNITIES.ln sections3.53—3.59 separatemixed-effect logistic regressionswere performed for each subcommunity’s
surveydata. These treated Subject and Item asrandom effects and evalu-ated the ■xed effects of Origin, Mother, Father, and Gender. The Origin
effect, reflecting differences between in-movers and subjectsnative to theplace in question, was the strongest. The other widely important factors

table 3.13
Factor Subjects Coefficient Wald p-ValueGrade 12th 106 0.000 — 8th 27 –1.745 3 × 10⁵
4th (and 5th) 72 –2.641 5 × 10–15
Origin distinct 71 +0.296 .35 other 33 +0.182 .70 Seekonk 94 0.000 — merged 7 –2.554 .02Mother distinct 131 0.000 — other 52 –1.017 .01 merged 22 –1.832 .0004Father other 56 +0.027 .95 distinct 137 0.000 — merged 12 –1.670 .01Gender male 89 0.000 — female 116 –0.659 .02Item Don ~ Dawn 205 +0.470 tot ~ taught 205 +0.406 cot ~ caught 205 +0.375 tock ~ talk 205 –0.057 collar ~ caller 205 –0.331 Otto ~ auto 205 –0.634 Moll ~ mall 205 –0.665Subject maximum 1 +3.104 > +1 std. dev. 13 > +1.617 < –1 std. dev. 22 < –1.617 minimum 1 –2.924
Intercept: +2.724; log-lik.: –707; d.f.: 13; subject std. dev. (null): 2.343.
The School Survey 73
TABLE 3. 13Model Without Interactions for Seekonk, Massachusetts
Factor Subjects Coe■■cz'entWaldp—Value
Grade
12th 106 0.000 —8th 27 —1.745 3 x 10⁵
4th (and 5th) 72 —2641 5 x 10‘15
Origin
distinct 71 +0296 .35
other 33 +0182 .70Seekonk 94 0.000 —merged 7 —2554 .02
Mother
distinct 131 0.000 —other 52 —1.017 .01
merged 22 —1.832 .0004Father
other 56 +0027 .95
distinct 137 0.000 —merged 12 —1.670 .01
Gender
male 89 0.000 —female 116 —0.659 .02
Item
Don ~Dawn 205 +0.470
tot ~ taught 205 +0.406
cot~ caught 205 +0.375tock~ talk 205 —0.057
collar ~ caller 205 —0.331
Otto ~ auto 205 —0.634
Moll ~ mall 205 —0.665
Subjectmaximum 1 +3.104
>+1 std. deV. 13 >+1.617
< —1std. deV. 22 < —1.617minimum 1 —2924
Intercept: +2724; log-lik.: —707;d.f.: 13; subject std. deV. (null): 2.343.
were those of Mother’s and Father’s origins. But these parental in■uences
were unexpectedly smaller for the youngest subjects, A134and SK4.9
Table 3.14 displaysa selection of the aboveeffects, intended to ShOWtrends and patterns acrosscommunities. As above, statistically signi■cant

table 3.14
BR12 AB12 AB8 AB4 NY11 SK12 SK8 SK4N 227 281 402 330 114 106 27 72Mean 1.72 1.92 1.31 1.55 4.81 5.28 3.67 2.57
Distinct origin +1.911 +1.241 +1.914 +1.347
0.000 +0.296 (vs. native) (Brooklyn)Merged origin +0.974 –0.249 +0.153 +0.016 –1.281 –2.554 (vs. native) (Queens)
Merged mother –1.084 –0.931 –1.075 –0.464 –0.169 –1.832 (vs. distinct) (“other”) Merged father –0.892 –0.601 –0.600 –0.016 –2.734 –1.670 (vs. distinct) (“other”)
Female gender –0.351 –0.115 –0.096 +0.061 –0.126 –0.659 (vs. male)
Most “different” collar ~ collar ~ tock ~ collar ~ cot ~ Don ~ item caller caller talk caller caught DawnMost “same” cot ~ Otto ~ Otto ~ Otto ~ Moll ~ Moll ~ item caught auto auto auto mall mall
74 PADS 952 LOW VOWELS OF SOUTHEASTERN NEW ENGLAND
TABLE3.14Selected Effects (in Log-Odds) Compared across Communities
3312 A312 A88 A84 NYII SK12SK8SK4N 227 281 402 330 114 1062772Mean 1.72 1.92 1.31 1.55 4.81 5.283.672.57
Dlsnmorlgm +1.911+1.241+1.914+1347 0’00” +0296(vs. natlve) (Brooklyn)
Mergedoflgm +0.974—0.249+0.153+0.016 ‘1'281 —2.554(vs. natlve) (Queens)
MergedTnf’ther—1.084—0.931—1.075—0.464‘0'169 4.832(vs. dlstlnct) (“other”)
Mergedfather —0.892—0.601—0.600—0.016‘2'734 —1.670(vs. dlstlnct) (“other”)
Femalegender—0.351—0.115—0.096+0.061 —0.126 —0.659(vs. male)
Most “different” collar ~ collar ~ tock ~ collar ~ cot ~ Don ~item caller caller talk caller caught Dawn
Most “same” cot ~ Otto ~ Otto ~ Otto ~ Moll ~ Moll ~item caught auto auto auto mall mall
(19< .05) ■xed effects are highlighted. Note that real effects close to zero
may not be “significant,” and even real effects far from zero may not be“signi■cant” if insuf■cient data support them.
The positive effect of distinct origin is clear in Brookline and Attle-
boro, and the negative effect of merged origin is even larger in Seekonk.There were no in-movers from merged areas into New York, so the effect ofQueens versus Brooklyn origin is shown instead.
Brookline behaves as though it is more merged than the known-merged places people move from, which is unexplained. There is no signi■-
cant effect of merged origin in Attleboro or of distinct origin in Seekonk(again, New York lacked data). This makes sense, if Attleboro is considered
a merged community itself (other than the diminishingly “independent”South Attleboro), so subjectswho moved from neighboring places,mainlycloser to Boston, would encounter a similar peer environment on arrivalin Attleboro.
A parallel explanation would cover SK12,which makesup more thanhalf of the Seekonkdata set. Seekonk twelfth graders are essentiallya dis-tinct community, and children moving into it from other distinct communi-ties would not be expected to show any greater degree of distinction. On

The School Survey 75
the other hand, for Seekonk fourth graders, many of whom are merged,
we observe a modest coef■cient of +0.591 for distinct origin. This does notreach signi■cance,though it presumablywould with more data.
The Origin effect stands in for early community and peer influencesand seems to be fairly well behaved. Many subjects reflected these earlyinfluences despite many years in the survey community. Others partially
accommodated to the local norm, and others fully. On average,there is aneffect of about +1.5 log-odds on the response of a distinct-origin personwho has spent several years in a mainly merged school system.
The reverse question, of whether subjects who start their lives merged
canlearn the distinction under peer influence, cannot be addressedequallywell with this data. Compared to 61 distinct-origin subjects in Attleboro
and Brookline, there were no merged-origin subjectsin NewYork and only
seven who moved to Seekonk. Of these seven subjects, three were twelfth
graders,and therefore had mainly distinct peers.After living in Seekonkforbetween 2 and 10 years, they scored 0, 2, and 2 on the survey. The sample
is small, but we seewhy the merged-origin coef■cient is large; these subjects
showlittle evidenceof learning the distinction, sothey stand out. Certainlynot all, but many, of the distinct movers to Attleboro and Brookline learned
the merger better than these merged movers to Seekonk learned the dis-tinction.
The effects of merged (vs. distinct) parents are quite constant fromcommunity to community. The Father effect is usually somewhat smallerthan the Mother effect. In Seekonk, where many peers would have the
distinction, the parental effects are larger. As noted, this is becausethe
merger is easier to learn than the distinction. Merged peers in placeslikeBrookline and Attleboro do a better job at undoing the “inherited” differ-
encesbetweenchildren than distinct peers do in placeslike Seekonk.The effect of female gender is not signi■cant in Brookline, Attleboro,
and NewYork, although wenote that it isnegative (favoring merger) in fourof ■vedata sets.In Seekonk, females do signi■cantlyfavor the merger in
progress,although the effect is small. If this is surprising, it is only becausesuch an effect may not have been noticeable previously.
The ltem effect clearly behaves differently across communities. In
the mainly merged communities of Brookline and Attleboro, collar~ callerwas most “different,” except in ABS, where it was runner-up to tock ~ talk.
On the other hand, in the mainly distinct communities of New York andSeekonk, the pairs cot~ caught and tot ~ taught favored “different,” edged
out by Don ~Dawn in Seekonkasit underwent the merger.The items that favored “same” were cot~ caught(and tot~ taught) in
Brookline, but consistently Otto ~ auto in Attleboro. The pair Otto ~ auto was

κ
κ
76 PADS95: LOWVOWELSOFSOUTHEASTERNNEw ENGLAND
marked “same” second most often in New York and Seekonk, too, but there
Moll ~ mall favored “same” even more.It would be interesting to dissect these patterns further to discover
whether they havemore to do with the different items being better or worsetools for investigating subjects’ (more consistent) phonologies or whetherthe Item effects actually reflect phonological conditioning of the low backvowels, perhaps especially when they are merging.
$5.11. A COMBINEDMODEL.As long as we account for the different pat-terns of Item effects, a combined regression analysis of all communities’data allows a more precise estimation of the ■xed effects. We create a newvariable, Current Peers, which takes the value “distinct” for the New York
and Seekonkhigh school students,“other” for Seekonk’sfourth and eighthgraders, and “merged” for the Attleboro, Brookline, and MassachusettsState College subjects.
Under the Origin variable, nativesof Brookline and Attleboro are nowbeing coded as“merged,” except for twelfth gradersfrom South Attleboro,who are “other.” Seekonk natives in fourth and eighth grades are also“other,” while those in twelfth grade are “distinct. ’7Native New Yorkers are“distinct,” except those from Queens, who are coded here as “other. ’7
The data remains unbalanced; becauseof where the surveywasadmin-istered, most subjects have merged current peers. And most movers have
gone from distinct to merged areas, rather than the other way; this seemstobe a real demographic pattern in the region.
Table 3.15 showsthe results of a mixed-effects regression performed
on these 1,597 subjects. Because of the larger number of subjects, alleffects are signi■cant at a much higher level than before. Compared toeach “distinct” level, each “merged” level hasa clear negativeeffect on theresponse—favoring“same”—while the “other” level hasthe expected inter-mediateeffect.10
The largest difference between “distinct” and “merged” (—1.952 log-odds) is for Current Peers, which reflects the community where the subject
now attends school. This is followed by Origin (—1.562), where a subjectlived in earlier years. The effect of Mother (—0.970) is smaller than eitherof these, and that of Father (—0.576) is the smallest of the four.
Of course, these four variables are not independent. The substantialcorrelation between Mother and Father (Cohen’s K = 0.529) arises becausepeople are more likely to marry people from nearby communities. The
even higher correlation between Origin and Current Peers (K: 0.652)
exists because most children have not moved between dialect areas (if atall), so their earlier peersmatch their current onesfrom the point of viewof the low back vowels.
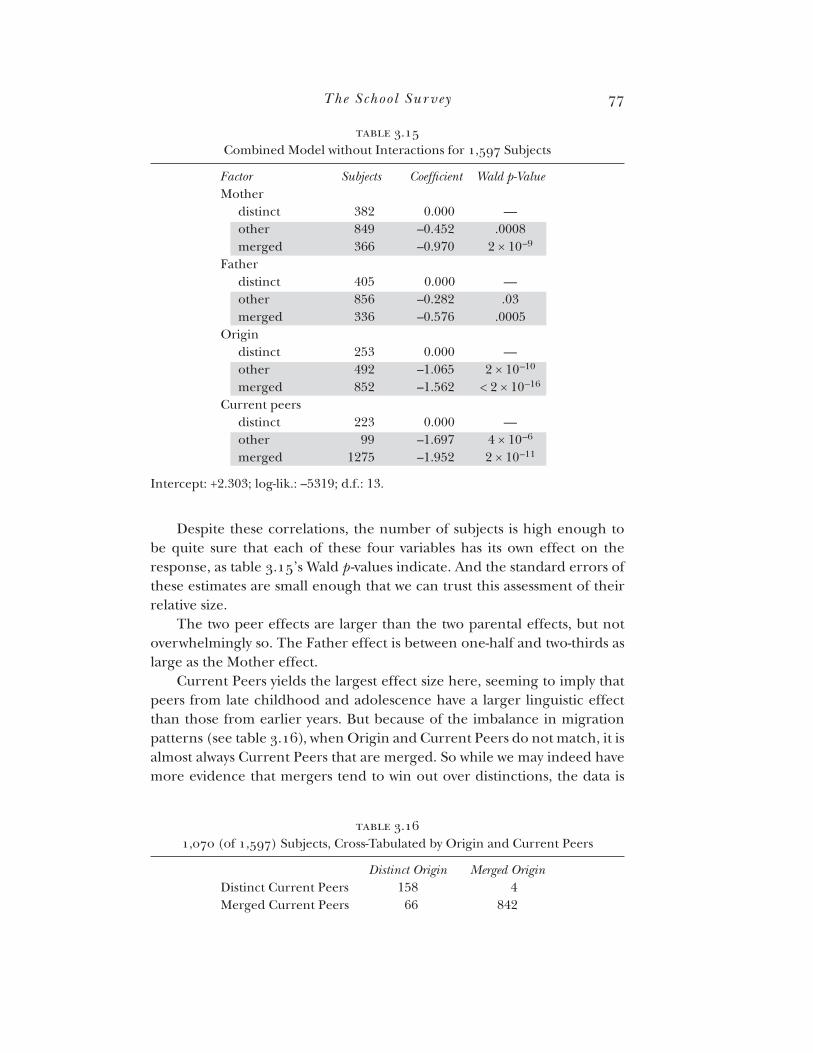
table 3.16
Distinct Origin Merged OriginDistinct Current Peers 158 4Merged Current Peers 66 842
table 3.15
Factor Subjects Coefficient Wald p-ValueMother distinct 382 0.000 — other 849 –0.452 .0008 merged 366 –0.970 2 × 10⁻⁹
Father distinct 405 0.000 — other 856 –0.282 .03 merged 336 –0.576 .0005Origin distinct 253 0.000 — other 492 –1.065 2 × 10⁻¹⁰
merged 852 –1.562 < 2 × 10–16
Current peers distinct 223 0.000 — other 99 –1.697 4 × 10⁻⁶
merged 1275 –1.952 2 × 10–11
Intercept: +2.303; log-lik.: –5319; d.f.: 13.
The School Survey 77
TABLE3. 15Combined Model without Interactions for 1,597 Subjects
Factor Subjects Coef■cient Waldp—ValueMother
distinct 382 0.000 —other 849 —0.452 .0008
merged 366 —0.970 2 X 10‘9
Father
distinct 405 0.000 —other 856 —0.282 .03
merged 336 —0.576 .0005Origin
distinct 253 0.000 —other 492 —l.065 2 X 10‘10
merged 852 —l.562 < 2 X 10‘16
Current peersdistinct 223 0.000 —other 99 —l.697 4 x 10‘6
merged 1275 —l.952 2 X 10‘11
Intercept: +2.303; log-lik.: —5319; d.f.: 13.
Despite these correlations, the number of subjectsis high enough tobe quite sure that each of these four variables has its own effect on the
response, as table 3.15’s Wald p-values indicate. And the standard errors ofthese estimates are small enough that we can trust this assessmentof theirrelative size.
The two peer effects are larger than the two parental effects, but notoverwhelmingly so. The Father effect is between one-half and two-thirds aslarge asthe Mother effect.
Current Peersyields the largest effect sizehere, seeming to imply that
peers from late childhood and adolescencehave a larger linguistic effectthan those from earlier years.But becauseof the imbalance in migrationpatterns (see table 3.16), when Origin and Current Peers do not match, it isalmost alwaysCurrent Peers that are merged. So while we may indeed have
more evidence that mergers tend to win out over distinctions, the data is
TABLE3.16
1,070 (of 1,597) Subjects, Cross-Tabulated by Origin and Current Peers
Distinct Origin MergedOriginDistinct Current Peers 158 4
Merged Current Peers 66 842

table 3.17
Factor Subjects Coefficient Wald p-ValueMother distinct 382 0.000 — merged 366 –2.552 1 × 10⁻⁵
Father distinct 405 0.000 — merged 336 –2.326 .0004Origin distinct 253 0.000 — merged 852 –4.205 4 × 10⁻⁵
Current Peers distinct 223 0.000 — merged 1275 –1.708 2 × 10⁻⁶
Mother & Father merged 206 +0.945 .02Mother & Origin merged 266 +1.063 .07Father & Origin merged 253 +1.645 .02Origin & Current Peers merged 842 +1.965 .06
Intercept: +2.708; log-lik.: –5299; d.f.: 29.
78 PADS95: LOWVOWELSOFSOUTHEASTERNNEw ENGLAND
not balanced enough to assessthe relative importance of early versus late
peer in■uence.
3.5.12. INTERACTIONBETWEENFACTORS.None of the above models con-tained interaction terms; they assumed that effects such as Mother andFather combine linearly. But cross-tabulations like table 3.4 suggest thatthese factors interact; for example, the effect of Father is more pronouncedwhen Mother is distinct. A model with interactions would have a positiveinteraction term for merged Mother—merged Father, mitigating the com-bined effect of the negative coef■cients for each parent.
Interactions were found between Mother and Father (1)= .02), Motherand Origin (1)= .04), Father and Origin (1)= .006), and Origin and Current
Peers (19= .01). Table 3.17 shows the most important coef■cients from amodel including these interactions, using the same data as section 3.5.1 1.
The “main effect” terms have larger magnitudes in table 3.17 than intable 3.15. They now represent the effect size when the other factors are“distinct.” In that case, the Origin effect (—4.205) is the largest, followed by
TABLE3.17Excerpt from Model with Interactions for 1,597 Subjects
Factor Subjects Coef■cient Waldp—ValueMother
distinct 382 0.000 —merged 366 —2.552 l X 10‘5
Father
distinct 405 0.000 —merged 336 —2.326 .0004
Origin
distinct 253 0.000 —merged 852 —4.205 4 X 10‘5
Current Peers
distinct 223 0.000 —merged 1275 —l.708 2 X 10‘6
Mother 8c Father
merged 206 +0945 .02Mother 8c Origin
merged 266 +1063 .07Father 8c Origin
merged 253 +1645 .02Origin 8c Current Peers
merged 842 +1.965 .06
Intercept: +2.708; log-lik.: —5299; d.f.: 29.

table 3.18
Mother/Father/ Predicted Mean Predicted Mean Observed No. of Origin/Current w/o Subject Effect w/Subject Effect Mean Subjects DDDD 6.02 6.14 6.12 73 DDDM 4.66 4.79 4.69 16 DDMM 2.06 2.14 2.16 68 DMMM 1.44 1.45 1.50 34 MMMM 1.00 0.94 0.98 155 MDMM 0.88 0.71 0.69 29
The School Survey 79
roughly equal parental effects (Mother: —2.552, Father: —2.326),with Cur-
rent Peerssmallest (—1.708).The positive interaction terms reflect the fact that the merger can be
learned more easily than the distinction, so any merger-favoring factorsdecrease the importance of the other factors. Having two merged parentsmakesa child more merged than having one, but not twice asmuch. Con-versely, two distinct parents impart the distinction much better than onedoes.
In the caseof Current Peers, we see an interaction term (+1 .965) largeenough to cancel out the main-effect term (—1.708).This suggests that dis-tinct current peers have no strong effect on subjects who had merged peersearlier in childhood; however, this result is based on a small number of sub-
jects. Many more subjects moved in the other direction, and we can seethat
merged current peersde■nitelydo havea medium-sizedeffect on subjectswhose original peers were distinct.
Table 3.18 assessesthe predictions made by two models. Both includethe ■xed factors—of which the most common combinations not involv-
ing “other” are shown—and their interactions, aswell asItem effects.Onemodel has a random Subject effect, the other does not. The models’ pre-dictions are compared with the actual mean scorefor the group. Even themodel without Subject effects does a goodjob ofpredicting the mean scoresof the different groups.
When Mother is distinct, we see a Father effect in the expected direc-tion (compare rows DDMM and DMMM). When Mother is merged, Father
appears to have a reverse effect (MMMM vs. MDMM), as a distinct father
leads to an even more merged response.Section 3.5.1:),will explore thisfurther, concluding that for boys, having a distinct father makes them moredistinct, but suggestingthat a distinct father may actually make girls moremerged.
TABLE3.18Models’ Predictions versus Observed Means for Common Factor Combinations
Mother/Father/ Predicted Mean Predicted Mean Observed N0. of
Origin/Current w/o SubjectE■ect w/SubjectE■ect Mean SubjectsDDDD 6.02 6.14 6.12 73
DDDM 4.66 4.79 4.69 16
DDMM 2.06 2.14 2.16 68
DMMM 1.44 1.45 1.50 34
MMMM 1.00 0.94 0.98 155
MDMM 0.88 0.71 0.69 29

80 PADS 952 LOW VOWELS OF SOUTHEASTERN NEW ENGLAND
The model with individual Subject effects naturally has better predic-tions for group means, but also deals explicitly with the data’s overdisper-
sion, meaning that subjectsare more different from one another than theywould be under a simpler model’s assumptions.
To illustrate this, consider the group of 155 subjects with “merged” forall four factors, whose observed mean score is 0.98 out of 7. Assuming there
were no Subjectand Item effects,sucha mean scorewould correspond to aresponse probability of 0.98/7 = 0.14.
Now, if each subject answered each item randomly with a 14% chance
of answering “different” each time, the distribution of the resulting scoreswould be 35% 0s,40% 1s,19% 2s,and 6% 3sor higher. But the actual dis-tribution of subject scores for the MMMM group is much more dispersed:
54%Os,16%1s,15%2s,and 15%3sor higher.No singlepattern of Item effectscould causethis overdispersion;strong
ltem effects could push subject scores toward the midpoint, but not lead to
more US.The ltem effects here are not very strong; including them gives apredicted distribution of 34% 0s,40% 1s,20% 2s,and 6% 3sor higher.
Chance would cause subject scores to vary even if there were no under-
lying difference in subjects’tendencies.However,the models in this chapteremploy explicit Subject effects to capture residual between-subjectdiffer-
ences, which have always risen above the level of chance. Here, the Subject
effect is estimated to have standard deviation 1.479. lncluding it widensthe predicted scoredistribution to 49% 0s,24% 1s,13% 2s,and 14% 3sorhigher—quite closeto the observeddistribution.
3.5.13. INTERACTIONBETWEENPARENTALEFFECTSANDSUBjECTs’GENDER.Since both parents have independent but interacting effects on a subject’s
response, it seemed worthwhile to investigate whether children’s genderaffects the relative influence of the two parents. Recall also that in NY1 1,which was 67% male, only a Father effect was detected, while in other sub-
communities ranging from 42% to 57% male, the Mother effect appeared
to be stronger.Although mothers are generally the primary caretakers,it is plausible
that sonsidentify more with their fathers and absorbmore linguistic in■u-
ence from them, although some previous work has suggested that youngchildren of both gendershew closelyto their mothers’ speechwhen acquir-ing their dialects (Foulkes, Docherty, and Watt 1999; Smith, Durham, and
Fortune 2007).
To investigatethis issue,separatemodelswere■tfor males’andfemales’data, comparing the effects of distinct parents between the 408 male and
424 female subjects with merged Origin and Current Peers.11

table 3.19
Group Males Females Coeff. Mean N Coeff. Mean NBoth parents distinct +1.232 1.87 30 +1.382 2.39 38Only mother distinct +0.025 0.94 17 +0.978 1.94 16Only father distinct +0.611 1.31 13 –2.210 0.19 16Both parents merged 0.000 0.89 71 0.000 1.07 83
The School Survey 81
Table 3.19 displays regression coef■cients and mean scores for the fourcombinations of known-merged and known-distinct parents. These sub-jects all have merged peers, so merged parents were the baseline to test theeffects of distinct parents against.
Subjectswere more distinct when the same-sexparent was distinct;malesshoweda fairly small effect for distinct Father (+0.611), and females
a moderate one for distinct Mother (+o.978). Having two distinct parentsmade the effect greater for both males (+1232) and females (+1.382). Butwhen just the opposite-sex parent was distinct, this had no effect on males(+o.o25) and in fact had a large negative one on females (—2.210).
In this data, sons are more influenced by their fathers. Whether the
mother is merged or distinct, the statusof the father hasa noticeable effect
on male subjects.But the statusof the mother is only relevant if the fatheris distinct; if a boy’s father and peers are merged, having a distinct mother
hasno apparent impact.In a parallel result, daughters are substantially influenced by their
mothers regardlessof their fathers’ status.When mothers are distinct, thefather’s influence is small, but in the expected direction. However, whenmothers are merged, the father’s influence appears to reverse. The 16 girls
with merged mothers and peers but distinct fathers have a mean score ofonly 0.19 out of 7, the lowestscoreof any subgroup we haveexamined.
It isplausible that girls in this situation might react againsttheir fathers.More than their peers with a fully merged background (mean 1.07), they
might recognize the distinction on the surveyand be con■dent that they donot talk that way or do not want to. This would imply a negative evaluation
of the lowbackdistinction.12While remaining somewhatskeptical of the result in this one cell, we
can conclude that when parents differ from peers, parents’ influence isclearlyvisible in children’s responses.And when mothers and fathers differfrom each other, we can see that both boys and girls are more influencedtoward their same-sexparent than their opposite-sex parent.
TABLE3.19Excerpt of Parental Effects for 832 Subjects with Merged Peers
Group Males FemalesCoe■. Mean N Coe■. Mean N
Both parents distinct +1232 1.87 30 +1.382 2.39 38
Only mother distinct +0.025 0.94 17 +0.978 1.94 16
Only father distinct +0.611 1.31 13 —2210 0.19 16
Both parents merged 0.000 0.89 71 0.000 1.07 83

82 PADS95: LOWVOWELSOFSOUTHEASTERNNEw ENGLAND
3.5.14. EFFECTSOFAGEANDTIMEONACQUIRINGTHELOWBACKMERGER.Payne (1980, 175) found that “age of arrival [in King of Prussia] had thestrongesteffect on the successof acquisition” of Philadelphia phonetic vari-ables, along with years since arrival.13 On the other hand, acquisition of aphonological variable, short a, “does not appear to be influenced by the ageat which the child moved” (Payne 1976, 210).
While few survey subjects had moved from a merged to a distinctcommunity, their results support Payne’s contention that acquisition of adistinction from peers is dif■cult (see §3.1). For example, the mainly dis-tinct Seekonk twelfth grade (mean score 5.28) had three subjects who hadmoved from merged communities, and the highest score among them wasonly 2.
We will now examine how age of arrival and years since arrival affectacquisition of the merger among the larger group of subjects with distinct
Origin and merged Current Peers.The data wasrestricted to the 33 sub-jects with at least one known distinct parent and without a known merged
parent. lf subjects encountered the merger for the ■rst time when theymoved—24 of them to Attleboro, 6 to Brookline, and 3 to MassachusettsState College—this would presumably maximize any effects of age of arrivaland years since arrival. And in theory, a regression analysis can tease apartthese two potential effects.
There are several reasons to expect children who move to a mergedcommunity at an earlier age to acquire the merger better. They spend fewer
yearswith the old dialect and more yearslearning the new one. And theywere younger when they moved and so better able to make the change, fol-
lowing critical—periodarguments.14The results of a regression treating the Age Moved and the Years Since
Moving as linear predictors, performed with random effects for Subjectand ltem15—show that Age Moved is signi■cantly related to the response,in the expected direction: +0.2 13 (p = .001).
The earliest any child moved was age 6. Compared to someone of that
age, this model estimates that a child moving at age 7 would favor the dis-tinction slightly more, by +0.213 log-odds, and a child moving at age 16
would favor it substantially more, by +2.13 log-odds. We can conclude thatthe ability to learn the merger declines with age—or else, it declines with
more exposure to the original distinct dialect; these two could hardly bedisentangled.
With Age Moved controlled, there is no signi■canteffect of YearsSinceMoving (p = .99). The number of years in the merged community seemsnot to matter; only the age of arrival does.Movers must relatively quicklylearn the merger to the extent they ever will.

figure 3.13
Age
Mov
ed to
Mer
ged
Com
mun
ity
School Survey Pairs Marked “Different”
18
6
8
10
12
14
16
51 320 4 6 7
One parent distinct Both parents distinct
The School Survey 83
FIGURE 3. 13Items Marked “Different” versus Age Moved from Distinct to Merged Community
€18 5 a ' a 'Q ' E E
5 9 ' a 9E 16 O
/
¢g = s.U E.8
14 g . O a
w 9E 12 9 5E o 9 9’8 10-- o a on.g " OP
2 8 * a 9a.) E .bl.) E
.<1 6O
/‘
: : :
0 1 2 3 4 5 6 7School Survey Pairs Marked “Different”
0 One parent distinct 0 Both parents distinct
But even early-moving subjects have not acquired the merger com-pletely. Of the 10 subjects who moved between the ages of 6 and 9, there
was only one score of 0, compared with ■ve scores of 4; the mean was 2.80.The lack of total learning is not surprising. When these subjects moved,after all, their distinct families came with them.
On average, late-moving subjects retained the distinction more; for 13subjectswho moved between 14 and 18, the mean scorewas5.15. Buckingthis trend, one 17-year-old girl scored a 2 only a few months after movingfrom Rochester, New York, to Brookline; her father’s origin was unknown,
however, and he could have been merged.Figure 3.13 plots the 0—7scores for these 33 movers against Age Moved,
showing afair amount of individual variation on either side of a trend line.Subjects with two known distinct parents—shown with solid circles—were
only slightly more distinct than the others.
3.6. FACTORS AFFECTING VOWEL INVENTORY: PALM
In most dialectsof present-dayAmerican English, the PALMand LOTclassesare identical: father rhymes with bother,and balm and bombare homophones.
A phonemic difference whereby PALMhas greater length, as in Moulton(1990), is no longer supported by data collected from young speakers.
As a result, in most areaswhere LOTand THOUGHTare merged, allthree word classesare now united as PALM= LOT= THOUGHT(3-M). This

84 PADS95: Low VOWELSOFSOUTHEASTERNNEw ENGLAND
three-waymerger hasoccurred in western Pennsylvaniaand adjacent areas(Kurath and McDavid 1961, 7), in Canada (Boberg 2006), and wherever
THOUGHT falls in with an already-merged PALM = LOT, as in the West, and
increasingly in the Midland and South (Labov, Ash, and Boberg 2006,
§g.1).In Eastern New England, PALMhas typically remained distinct from the
combined LOT = THOUGHT (ENE). But in New York, Seekonk, and South
Attleboro, we expect PALMand LOT to be merged, whether a subject has a
more traditional two-phoneme low vowel system,PALM= LOT96THOUGHT(MAIN), or an innovative one-phoneme system,PALM= LOT= THOUGHT(s-M).
Although anyone so close to the boundary is familiar with the dialecton the other side, we do not expect younger Seekonk speakers to be able
to replicate the ENE pattern by separating the LOTwords from PALM= LOT,merging them with THOUGHT,and leaving PALMby itself.
At least some Brookline and Massachusetts State College subjects areexpected to retain a distinct PALM.But we do not expect in-movers to the
area to acquire it. On the contrary, in-moverswith the MAIN systemmaythreaten the ENE system, such that the 3-M system arises. And the samething could be happening in Attleboro, except that near the dialect bound-
ary,migration is not evennecessaryfor dialect contact.The data on PALMcome from three questions. The ■rst was a minimal
pair asking about la versus law. The answer “same” suggests the 3-M system,
asboth ENE and MAIN would usually pronounce this pair differently. How-
ever,the singing term la doesnot behaveasan ordinary English word, sothe answer “different” does not rule out the three-way merger.
Subjects also answered two questions on whether PALM~ LOTword pairs
rhymed. The pair father~ botherwasusedin all communities. Osama~ commawas used in Attleboro and New York, but was abandoned when subjects
said they were unfamiliar with the name Osama(the name Obamahadunfortunately not yet become familiar). In the other communities, the pairsalami ~ Tommywas used instead. The concept of rhyme is thought to befamiliar even to the youngest children surveyed. Nevertheless, a higher
error rate wasexpected than for the LOT~ THOUGHTminimal pairs.
3.6.1. THESTATUSOFPALMWHERELOTANDTHOUGHTAREHISTORICALLYDISTINCT. In New York, 93% of 110 subjects16 said father~ botherrhymed;89% rhymed Osama~ comma.This establishes the PALM~ LOTmerger, which
should make la ~ lawjust like a LOT~ THOUGHTpair.

The School Survey 85
But while the LOT~ THOUGHTpairs were marked “different” 68% ofthe time, la ~ law was 93% “different.” Even among the six subjects with
clear evidence of three-waymerger—marking all 7 LOT~ THOUGHTpairs“same” and saying both PALM~ LOT pairs rhymed—four marked la ~ law“different.” La, we must conclude, does not always behave like a member
of the PALMclass.Like in NY1 1, in 8K1 2 the PALM~ LOT pairs were overwhelmingly said
to rhyme: 91 % for father ~ bother,90% for salami ~ Tommy.And again, almost
all the 109 subjects (95%) marked la ~ law “different.” While la ~ law wasmarked “different” more than LOT ~ THOUGHT (75%), the two variables
were correlated, as expected: the point-biserial correlation coef■cient
rpb= +0.35 in NY1 1, +0.25 in SK12.
The younger Seekonk subjects (27 in 8K8, 70 in 8K4) marked fewerLOT ~ THOUGHT pairs “different”: 52% in 8K8, 37% in 8K4. They werealso less “different” on la ~ law: 78% in 8K8, 71% in 8K4. And the twovariableswere more correlated: +0.44 in 8K8, +0.45 in 8K4. Again, there
was an asymmetry: of the 120 Seekonk subjects who were mainly distinct
on LOT ~ THOUGHT (with a score of 4 of 7 or higher), 97.5% marked
la ~ law “different”; but of the 20 subjectswho scored a fully merged 0 onLOT ~ THOUGHT,only 50% marked la ~ law “same.”
This data can be accounted for by saying that roughly half of New Yorkand Seekonk subjects mark la ~ law “different” regardless of their low vowel
system for ordinary words. For the rest, la ~ law reflects the merged or dis-
tinct statusof PALM= LOTversusTHOUGHT,just like cot~ caught.The split inthe treatment of la ~ law is constant acrossthe Seekonkagelevels.
What is not constant is how subjects responded to the rhyming ques-tions. Younger Seekonk subjects were more likely to sayfather ~ botherand
salami~ Tommydid not rhyme. The 10% rate of “nonrhyming” in SK12becomes15% in 8K8, and 26% in 8K4.
Wewant to know if the increasednonrhyming reflects the developmentof an actual PALM~ LOTdistinction, or just a decreasein the ability to iden-tify and judge rhymes. We know the LOT ~ THOUGHT merger is affectingSeekonk; could younger subjects be adopting ENE’s PALM~ LOT distinction
aswell?
It is unlikely that they are,asthere is no signi■cantcorrelation betweenLOT ~ THOUGHTscores and PALM~ LOT nonrhyming. In the small 8K8 data
set, r= —0.14 (n.s.). In 8K4, r= +0.003. We conclude that the increased
nonrhyming by younger Seekonk subjectsis unrelated to the progress oflinguistic change. Younger children are simply worse at judging rhymesthan minimal pairs.

ϕ
86 PADS95: Low VOWELSOFSOUTHEASTERNNEw ENGLAND
SW62 THE STATUS OF PALM WHERE LOT AND THOUGHT ARE MAINLY
MERGED.
3.6.2.1. MassachusettsStateCollege.Recall from section 3.5.2 that 29 of theMassachusetts State College students had origins in Eastern New England;
15 of them scored a fully merged 0 of 7 on LOT~ THOUGHT,the restbetween 1 and 4. Ten of the 15 (67%) who scored 0 marked la ~ law “dif-ferent” and saidfather ~ botherand salami ~ Tommy“don’t rhyme.” This is thefull ENE pattern—PALM ¢ LOT = THOUGHT.None had a clear 3—Msystem—
PALM= LOT= THOUGHT—withla ~ law “same” and both PALM~ LOTitemsrhyming.
Of the 14 who scored higher than 0, seven (50%) had the ENE combina-
tion of la ~ law “different” and PALM~ LOTnonrhyming. The difference inproportion is not statistically signi■cant, but it may mean that subjects whohave trouble accessing their linguistic competence on the LOT ~ THOUGHTitems also struggle with the rhyming questions.
Five of the 2g “native” subjects said that both PALM~ LOTpairs rhymed.
No information gathered on the survey, such asparental backgrounds, pre-dicts who had this minority response. It may reflect change toward the 3-M
system, but not necessarily. The correlation between the two PALM~ LOTitems, father ~ botherand salami ~ Tommy,is not ashigh asmight be expected
(cl)= 0.49), suggestingthat chance plays a role in how the rhyming items
are answered.
3.6.2.2. Brookline, Massachusetts.In the 225-subject BR12 data set, there
was a 77% rate of PALM~LOTrhyming (MS15 had a 37% rate overall).La ~ law was only 61 % “different” in BR1 2, the lowest rate observed so far
(cf. 91% in MS15). Together, this might suggesta considerable amountof three-way merger in Brookline. However, only 16% of subjects rhymedboth PALM ~ LOT pairs, marked la ~ law “same,” and scored 0 out of 7 on
LOT ~ THOUGHT,thus indicating a sure 3—Msystem.But this is more than the 4% of BR12 subjects who showed the full
local ENE pattern (cf. 29% of MS15). lndeed, almost as many (3%) had afull MAIN pattern, scoring 7 of 7 “different” on LOT~ THOUGHT,marking
la ~ law “different” and rhyming PALM~ LOT.Only 23% of BR1 2 subjects, then, could be unambiguously classi■ed as
either 3—M,ENE, or MAIN based on the survey (many more would probably
have shown one of these patterns more clearly in speechproduction). Ineach of these three groups, most subjects had never lived anywhere otherthan Brookline. We can thus examine whether their parents’ origins help
explain their systems.

The School Survey 87
All four Brookline natives with the full MAIN system have both parentsfrom those dialect areasor the South. This makessense:most BR12 peersdo not have the MAIN system, so any subjects having it must have learnedit from their families.
Of the seven natives with the local ENE system, most have at least onelocal parent. However, one young man has both parents from Long Island(MAIN). He must have acquired not only the LOT~ THOUGHTmerger, butalso the PALM~ LOT contrast, from ENE peers.
But such an acquisition, while possible, is not easy.Of six in—moverstoBrookline from the MAIN area, none consistently contrasted PALM~ LOT.Of the 138 Brookline natives, there were 22 with both parents from theMid-Atlantic or Inland North. Only one had acquired the ENE system, twohad retained the full MAIN systemsof their parents, and 13 were interme-diate in one wayor another. The other six subjectswere fully 3-M.
This three-way—mergedpattern is probably the natural result of a colli-sion between MAIN parental input and ENE peer input. Leaving phonetic
detailsaside,both of thesedialectshavetwo lowvowelcategories.The learn-ing task is to transfer the LOT word class from being merged with PALM,tobeing merged with THOUGHT;this would involve a dif■cult unmerging. Itmakes sense that a “compromise” three-way merger usually arises instead,especially aschildren continue to speak with their MAIN families even after
they acquire ENE peers.Though children with MAIN parents maybe the originators of the 3-M
pattern, if enough children in a community like Brookline become three-way merged, this pattern will tend to spread to the children of local parentswith the ENE system.
Just 14 of the 138 native Brookline subjects had both parents from
easternMassachusetts.17Three of them had the full ENE pattern, like their
parents probably do; one had the full 3-M pattern. As usual, most wereintermediate in someway,on the surveyif not in “real life.”
The BR1 2 natives were in their last year of high school, but their dia-
lects must havelargely been formed in one of the town’s eight elementaryschools,which students attend from kindergarten to eighth grade. Differ-
ences between the alumni of these schools give us further reason to believethat the 3-M pattern originates with children with MAIN/ ENE contact intheir backgrounds and spreads from them to other children.
Of those who came to Brookline High from Driscoll, Lawrence, and
Runkle schools, 54% had at least one parent from the MAIN area; 19%had both parents from there. For Baker, Heath, and Lincoln schools, only
30% had one MAIN parent; 10% had two. It is perhaps no surprise by nowthat the Brookline natives with one or both MAIN parents marked more

88 PADS95: Low VOWELSOFSOUTHEASTERNNEw ENGLAND
LOT ~ THOUGHT items “different” (1.60 vs. 1.13) and were more likely to
saythe PALM~ LOT items rhymed (85% vs. 76%). But we are also interested
in the in■uence of thesechildren on their peerswho haveno MAIN familybackground.
First, we note a mild difference for LOT ~ THOUGHT; the 30 such sub-
jects from the low-MAIN—influenceschoolsscored 1.03,while the 18 fromthe high-MAIN schools scored 1.33. This difference is in the expected
direction if the MAIN-background children are influencing the others, butis not signi■cant by the Mann-Whitney test (p = .37).
For PALM~ LOT, the difference is more clear. Of the 30 subjects fromlow-MAIN schools, whose mainly ENE systems we hypothesize would be
more intact, six rhymed neither father ~ bothernor salami ~ Tommy,and 10others saidone item did not rhyme. Bycontrast,all 18 high-MAIN—influencesubjectsrhymed at leastone item, and 14 rhymed both. The 89% rhymingrate of these peers is as high as the group with MAIN family backgroundsthemselves, while the low-MAIN group’s 63% rate is signi■cantly lower, by
the Mann-Whitney test (p = .02).The effect of dialect contact is symmetrical: a child with the MAIN pat-
tern tends to lose his LOT~ THOUGHTdistinction upon contact with theENE pattern, and a child with ENE tends to lose her PALM~ LOTdistinction
on contact with MAIN. Both can emergewith the 3-M pattern.Note that the differences between K—8schools are still visible in twelfth
grade,and this isnot becauseBrookline High School studentssimply retaintheir peer groups from elementary school. As chapter 5 will further demon-
strate,vowel inventories aremore malleable in elementary school than they
are in high school. Children may exhibit linguistic patterns years before
they make overt social use of them in preadolescence (Eckert 2008) andadolescence(Eckert 1989).
3.6.2.3. Attleboro, Massachusetts.Comments made in Attleboro about thedif■culty of the rhyming item Osama~ commaled to its being changed toTommy~salami in most other communities. And, as table 3.20 shows,theperformance of this item was de■nitely unacceptable, especially amongyounger subjects. There should be a positive correlation between the two
PALM~ LOTpairs, as there is in MS15 and to a lesser extent BR12, butOsama~ commais at best uncorrelated with father ~ botherin Attleboro. And
contrary to the natural direction of change, it rhymes lessaswe go fromAB12 to ABS to A134.In A134, it seems to have been answered almost ran-domly, unless subjects actually had the “history quiz” tendency to mark it
differently from father ~ bother.

table 3.21
Grade ENE 3-M MAIN Intermediate NABS12 8% 7% 5% 80% 61ABS8 2% 15% 2% 82% 55ABS4 6% 28% 0% 66% 32
table 3.20
Community Percentage “Rhyme” ϕ Correlation N father ~ bother salami ~ TommyMS15 40% 34% +0.52 35BR12 78% 76% +0.18 225 father ~ bother Osama ~ commaAB12 68% 72% +0.0005 278AB8 78% 66% –0.08 385AB4 72% 46% –0.15 317
The School Survey 89
TABLE 3.20“Rhyming” Percentages and Correlations among PALM ~ LOT Items
Community Percentage“Rhyme” (b Correlation Nfather ~ bother salami ~ Tommy
M815 40% 34% +0.52 35BR12 78% 76% +0.18 225
father~ bother Osama~ commaAB12 68% 72% +0.0005 278AB8 78% 66% —0.08 385AB4 72% 46% —0.15 317
We will ignore Osama~commaand assessthe status of PALMusingfather ~ botherand la ~ law. Unlike the decreased rhyming of Osama~ comma,which would contravene Garde’s Principle if it were real, the observed
changein la ~ law—marked“same"by22%ofABi 2,35%ofAB8,and48%of AB4—may re■ect substantial progress of the three-way merger. Recallsection 3.6.1’5 estimate that roughly half of subjects with the PALM~ LOT
merger will still mark la ~ law“different. ’7Attleboro lies on the dialect boundary, but the total subject pool
includes those who moved there from different communities on either sideof the boundary line. Even among native subjects, many have parents fromwell inside the ENE or MAIN dialect area.
And then there is South Attleboro, where adults exhibit the MAIN pat-tern, but children are now almost as merged on LOT ~ THOUGHT as their
peers in the rest of the city (see §3.5.4). Table 3.21 shows the number ofnative South Attleboro subjects showing one of the major low vowel pat-terns, against the backdrop of most subjects’ being intermediate.18
Some twelfth graders from South Attleboro have either the formerlylocal MAIN pattern (usually accompanied by MAIN parents), the “inter-loper” ENE pattern (usually with ENE parents), or the “compromise” 3-M
pattern. The eighth grade shows an increase in 3-M at the expense of the
TABLE3.21Low Vowel Systems of South Attleboro Natives
Grade ENE 3—M MAIN Intermediate N
ABSl2 8% 7% 5% 80% 61
ABS8 2% 15% 2% 82% 55
ABS4 6% 28% 0% 66% 32

table 3.22
Grade ENE 3-M MAIN Intermediate NABS12 9% 7% 5% 84% 123ABS8 6% 19.5% 0.5% 75% 201ABS4 3% 27% 0% 80% 104
90 PADS 952 LOW VOWELS OF SOUTHEASTERN NEW ENGLAND
other two patterns. The fourth-grade cohort has no examples of MAIN,
two of ENE (with parents from there), and a still higher rate of 3-M (withparents from all areas).
On the other side of the historical dialect boundary, table 3.22 shows
that there is also progress toward a three-way-mergedsystemin “regularAttleboro.” Presumably because the peer group is more thoroughly merged
on LOT ~ THOUGHT,the MAIN pattern is virtually absent, even though there
are many subjectshere with parents from the MAIN region. The completeENE system is present at a low level, among subjects with ENE parentage.
But the most common complete system is becoming 3-M. And, as inBrookline and South Attleboro, this pattern is not limited to subjects whohave experienced obvious conflict in their low vowel history, between par-ents and peers,or with their mother and father from different places.Sev-eral of the 3-M subjects have parents from Attleboro.
It does not seem likely that the apparent-time increase in the three-way
merger is a form of age-grading (Labov 1994, 83—84).There is no reasonto think that fourth graders have not yet acquired all the vowel contrasts oftheir dialects. But is it possible that we are looking at error on the survey,rather than a real increase in PALM~ LOT merging?
Simply circling “same” or “rhyme” for each item, down the left-handcolumn (see ■gure 3.1), would have resulted in a 3-M response; but anysuch surveys were eliminated by barn ~ horn.And we saw how the youngestAttleboro subjects dealt with Osama~ comma;they answered it close to ran-domly. But the other PALM~ LOT rhyming item was different.
For father~ bother,68% of AB12 said they rhymed, which increased to78% for ABS. The fact that it drops back to 72% for A134probably reflects
some of the confusion that younger subjects have shown with the rhym-ing items. So rather than being the cause of the 3-M patterns, young sub-jects’ errors on father ~ bother,if not in other places, have probably led to anunderstatement of the amount of three-way merger in the community.
As chapter 4 will demonstrate, the native South Attleboro system wasonce MAIN, while that of “regular Attleboro” was ENE. The school surveysuggests that for fourth and eighth graders, if not as completely for twelfth
TABLE3.2 2Low Vowel Systems Of “Regular Attleboro” Natives
Grade ENE 3—M MAIN Intermediate N
AB812 9% 7% 5% 84% 123
ABSS 6% 19.5% 0.5% 75% 201
ABS4 3% 27% 0% 80% 104

The School Survey 91
graders, LOT and THOUGHThave largely merged in South Attleboro. Mean-while, PALMand LOT are doing the same in the rest of the city.
A plausible trigger for suchmergers is schoolchildren coming togetherfrom diverse family dialect backgrounds. Of native South Attleboro sub-jects, 30% had at least one parent from ENE, while 24% of “regular Attle-boro” nativeshad at leastone parent from MAIN. The ■gurefor Attleborois fairly constant, while the proportion of ENE parents in South Attleboro
seemsto be decreasing.Theseissueswill be pursued further in chapter 5.
3.7. CONCLUSIONS FROM THE SCHOOL SURVEY
The school survey was an unsophisticated questionnaire that simply asked
how a dozen pairs of words sounded. There wasa large amount of varia-tion in the responses. But administering the survey to a large number ofsubjects yielded quantitative results regarding the factors in■uencing lowvowel inventories. Mixed-model logistic regression distinguished between
by—subjectvariation, by—itemvariation, and between-subjectvariation.Subject variation was substantial everywhere, meaning that subjects’
scores for the seven LOT ~ THOUGHT pairs could never be predicted with
great accuracy,let alone their responsesto individual items. Somesubjectvariation would correspond regularly to factors that were not asked about onthe survey,while somewould reflect more idiosyncratic sourcesof error.
Among the seven items asking, from a phonological point of view, “Do
you distinguish LOT and THOUGHT?”there was no single pattern favor-ing and disfavoring the merger. For example, collar~ callerwasmost oftenmarked “different” only where the merger wasthe norm, while Moll ~ mall
wasmost often marked “same”where the distinction waspredominant. It
wasnot clear what production patterns went along with the many interme-diate responses.
The most ubiquitous between-subject effect was that of Origin. Subjectswho had moved to a community from a different dialect area were alwaysdifferent from the natives. However, their responses were also usually distin-guishable from what they would have been if they had never moved.
The age at which a subject moved from a LOT ~ THOUGHT-distinguish-
ing dialect area to a merged one had a small effect; thosewho moved at ayounger age ended up more merged, on average. How long ago they hadmoved was statistically unimportant to their response. The conclusion isthat people learn a merger relatively quickly after being exposed to it.
The origins of subjects’ mothers and fathers were also signi■cant pre-dictors of their response.This wasthe caseeven for high school students

2 × 1 × × ×
g2 PADS95: Low VOWELSOFSOUTHEASTERNNEw ENGLAND
who had lived in one place all their lives. If their initial parental input—sup-plemented by ongoing parental and other family relationships—was differ-
ent from their peer group’s, there wasalmost alwaysa signi■canteffect ontheir survey responses. For fourth-grade students, parental effects provedweaker, possibly as a consequence of overall worse performance on the sur-vey, but certainly an area for future investigation.
The influence of peers does not override subjects’ earliest-acquiredvowel systems. In merged communities, children with distinct parents doacquire the merger, but not as fully as those with merged parents. Somechildren do acquire it completely, others hardly at all.
So among native Brookline twelfth graders, the most commonLOT ~ THOUGHTscore was 0 of 7 “different,” regardless of parental origin.But while only 6% (of 17) with merged parents scored above the midpoint,
23% (of 22) with distinct parents did so,including two 7s.For native Attleboro twelfth graders, only 8% (of 40) with merged par-
ents scored above the midpoint, the highest being a 5. But 46% (of 13)with distinct parents scored5, 6, or 7.
The factors promoting merger—a merged mother, father, or peers—interact negatively; their effects are not fully cumulative. Having merged
parents restricts the apparent effect of peers, and vice versa. This follows
from two points: adistinction isharder to learn than amerger,and learning
a merger hasan endpoint, after which a speakeris fully merged. Any merg-ing in■uence reduces the effective influence that can subsequently occurin the same direction.
As a consequence of the greater dif■culty of learning the distinction,
we seelarger parental effects among native Seekonk twelfth graders. Of the
37 with distinct parents, 62% marked 7 of 7 “different”; only 8% scoredbelow the midpoint. But for siXsubjectseachwith a single merged parent,the score distribution was 2 x 1, 2 X 2, 1 x 4, 1 x 7.
The dataon PALMwasof inferior quantity and quality—relying on rhym-ing pairs (paceLabov 1994,354)—but it alsoreflected multiple influences,partial accommodation, and the greater easeof merging over unmerging.
Gender played a small role when the LOT ~ THOUGHT merger was in
progressin Seekonk;femalesfavored it. Perhapsmore interestingly, genderinteracted with the parental effects when peers were merged. Boys weremore influenced toward their fathers, girls more toward their mothers—
unlessgirls actually distanced themselvesfrom their fathers.Administered across three grade levels, the survey in Seekonk docu-
mented the rapid advancement of the LOT~ THOUGHTmerger. In SouthAttleboro, the same change had largely already happened, and it could be
incipient in NewYork aswell. In all thesecases,the changewould be from

The School Survey 93
the MAIN (PALM= LOT 96THOUGHT) to the 3-M (PALM= LOT = THOUGHT)low vowel system. This latter system, with only one nonfront lowmonophthong, was also observed to be on the rise in the former ENE
(PALM96LOT= THOUGHT)territory of “regular Attleboro” and Brookline.The surveydata showsthere are no absoluterules regarding the acqui-
sition (or nonacquisition) of mergers. Even quali■ed statements such asthe following may be too strong:
A person seven or under will almost certainly acquire a new dialect perfectly, and a
person 14 or over almost certainly will nOt. In between those ages, people will vary.[Chambers 1992, 689]
Chambersis referring to children who move,but the surveyshowsthat evenchildren who have never moved give different responses based on wheretheir parents grew up.
The relationship between subjects’ survey judgments and their speechproductions is not yet fully understood. But if the perceptual survey datareflects one facet of linguistic competence, then we must acknowledge that
competence is affected regularly and sensitively by both recent and distantin■uences in people’s lives.
And a complete phonological theory may need to allow for multiple,coexisting representations. Some people are best understood as simplymerged or distinct with respect to a vowel contrast, while others may need
to be recognized asbeing both merged and distinct.

4. THE GEOGRAPHIC STUDY
THEGEOGRAPHICSTUDYwas inspired by observations reviewed in chapter
2: the dialects spoken in Boston, Massachusetts, and Providence, Rhode
Island, differ notably, despite the cities’ being less than 50 miles apart (see■gure 4.1). The territory in between the two state capitals has not beenextensively studied since the 1930s, and the results reported in that eraproved inaccurate.
This chapter explores the low vowels of this intermediate area.Although there are no physical obstacles to communication or migrationin this part of New England, a sharp dialect boundary was still found, espe-cially for speakersborn early in the twentieth century. By then, an originalthree-vowel system (3-D) had been largely succeeded by two different two-vowel systems (MAIN and ENE). This two-vowel phase shows the clearestgeographical boundary, a phenomenon that emerged centuries after itsseedswere planted in the original patterns of settlement. Recently, both ofthe two-vowel systemsare tending to collapse into a systemwith a single lowvowel (3-M).
For most of the twentieth century, though, Boston speakers have shown
an ENE pattern, where PALM, in low central-to-front position, is distinct
from a low back, variably rounded, sometimesingliding LOT= THOUGHT.Meanwhile, Providence speakersshowthe MAIN pattern where a low cen-tral PALM= LOTis clearly distinct from a raisedback THOUGHT.1
Both dialects have reduced the original inventory from three vowels totwo, but by merging the word classesin different ways.The vowels’ phoneticrealizations (see table 4.1) are also staggered, so that tokens from any classcould be misidenti■ed by speakers of the other dialect, or at least perceived
asforeign.MAIN listeners report hearing ENE’s [a] in PALM as very fronted, but
have no other category to put it in. But they tend to hear ENE’s [D] in LOTas [3] (their own THOUGHT) and the [D] in THOUGHT as [0] (their own
PALM= LOT) (Moulton 1990, 129). ENE listeners report analogousmisun-derstandings.
Other speakersare more accurate.An 82-year-oldman from Millville,Massachusetts, said, “I’m gonna tell you where the boundaries are. The
boundaries are between Millville and Uxbridge! In Uxbridge, J—o—h-n,they’ll sayJ[D]n. Down here, it’sJ[a]n.]ust in seven miles.” This man clearlybelieved that a sharp linguistic boundary existed between adjacent towns.
95

table 4.1
Example word father bother daughter
Word class palm lot thought
Providence [ ] [ ]
Boston [a] [ ]
96 PADS95: Low VOWELSOFSOUTHEASTERNNEw ENGLAND
TABLE4.1The Low Vowel Systemsof Providence (MAIN) and Boston (ENE)
Example word father bother daughter
Word class PALM LOT THOUGHT
Providence [(1] l [3]
Boston [a] l [D]
If, instead, a transition zone existed between fully distinct and fully merged
areas,any combination of the following could occur in that zone:
1. the distinction is maintained irregularly (merger by transfer/ lexical diffusion);
2. the distinction is maintained regularly in some phonological contexts, but
not others;
3. the phonetic distance between the vowels decreasesgradually acrossthe zone;4. the boundaries for production and perception are both sharp, but do not
match;
5. individuals employ the distinction in some speech styles but not in others;6. individuals are fully distinct or merged, but there is variation between them
(by age, class, gender, and/or other factors).
Section 2.5 argued that the LOT~ THOUGHTmerger did not begin inBoston and spreadwave-likeor hierarchically to the smaller communitiesof EasternNew England? Given its wide distribution in American English,the PALM~ LOT merger is even less likely to have originated in Providence.
If the two mergers were spreading like waves toward each other, there
might be an areain betweenthat neither had reached,an areaof three-waydistinction. On the other hand, if the waves had already met and crossed,
there would be an intermediate zone where the three-way—mergedsystemprevailed.
This chapter will showthat neither type of transition zone now exists.The ENE two-vowel system ends where the MAIN two-vowel system begins.And the boundary between them is close to an early settlement boundary.This, along with the historical data presented in chapter 2, points to inter-nal change as the cause of both areas’ mergers.
Indeed, the geographic diffusion of change may occur less frequentlythan is often assumed (see Andersen 1988). When a change spreads across
a dialect boundary to an areawhich would probably not have undergoneit otherwise, a diffusion account is certainly motivated. But if a town wassettled at the sametime, and by similar people, asa nearbycity—or evenbypeople from that city—their dialects’ persistent similarity can derive from
parallel reactions to the sameinherited structural pressures,rather thanparallel inundation by the samewavesof external influence.3

figure 4.1
new york
massachusetts
connecticut
new hampshire
newjersey
vermont
Providence, R.I.
New York, N.Y.
Plymouth,Mass.
Boston, Mass.
0 50 mi
0 50 km
new york
massachusetts
connecticut
new hampshire
newjersey
vermont
rhodeisland
The Geographic Study 97
This chapter analyzesspeechfrom interviews conducted in 2005 with
some 200 senior citizens and young adults in a 4o—community study area.Section 4.2 gives the results of an impressionistic analysis of the interviews.
Section 4.3 discussesfurther interviews in communities found to haveundergone change. Section 4.4 presents acoustic analysesof selected speak-
ers exemplifying the principal systems.Section 4.5 dealswith the possibleinteraction between low vowel change and the reintroduction of postvo-calic /r/; and section 4.6 is a general discussion of results and conclusions.
4.1. RESULTS OF AUDITORY ANALYSIS
In an area spanning the linguistic boundary, 40 cities and towns wereinvestigated: 29 in Massachusetts and 11 in Rhode Island. This study area,including small towns, suburbs, and medium-sized cities, is shaded on ■g-
ure 4.1, and shown with community names and abbreviations on ■gure 4.2(the abbreviations also appear on table 2.1).
In each place, data was collected from at least one senior citizen and
two young adults who had lived there since an early age. The seniors werecontacted with the help of local senior centers, and interviewed there or at
FIGURE 4.1Southern New England: Key Cities and Study Area
Boston, Mass.
Plymouth,Mass.
Providence, RI.
50 mi
0 50 km

figure 4.2
Central Falls
Attleboro
Burrillville
DouglasUxbridge
Mendon
Mill
ville Black-
stone Bel
lingh
am
Franklin
FoxboroughWrentham
Plainville
North
AttleboroughNorthSmithfield
Woon-socket Cumber-
land
Central Falls
Pawtucket
Seek
onk
Mansfield
Norton
E. P
rovi
denc
e
Swansea
Taunton
Barring-ton
Rehoboth Dighton Berkley
mf
Tiverton
LittleCompton
Westport
Fall River
Dartmouth
Lakeville
Freetown
Fair-haven
Acushnet
New Bedford
Warren Som
erse
t
Providence
Boston(20 mi)
0 10 mi
0 10 km
massachusetts
doub
me
bs
bh fk
wrfb
na
pv
ababs
nt
ta
lv
ftftw
bk
fr
ti
lc
wp
dmnb
ac
fh
sw so
wa
ba
bv ns
cf
clwsmv
pt sk re
ep
di
doub
me
bs
bh fk
wrfb
na
pv
ababs
nt
ta
lv
ftftw
bk
fr
ti
lc
wp
dmnb
ac
fh
sw so
wa
ba
bv ns
cf
clwsmv
pt sk re
ep
di
rhodeisland
massachusetts
conn
ecti
cut
98 PADS95: LOWVOWELSOFSOUTHEASTERNNEw ENGLAND
FIGURE4.2The Study Area: 40 Communities
(29 in Massachusetts, 11 in Rhode Island)
D
Be
ingh
am
CO
NN
EC
TIC
UT
a ._I: Westport
I: 5.Dartmouth
their homes. The young adults were almost all interviewed at their work-places. Most were found in retail and service establishments; others weremunicipal employees.
The ■nal sample consisted of 67 seniors aged from 58 to 97 (most intheir 70s and 80s) and 113 young adults aged from 15 to 33. Along with
providing spontaneousspeech,intervieweesread ten cards,with sentencepairs containing over 100 low vowel tokens. Each reading card had a mini-mal pair to be repeated and judged “same” or “different.” For example:
After the fourth operation on his heart, Don started walking farther andjog—
ging more. He’s a lot calmer now.

The Geographic Study 99
Donna named her daughter Dawn to honor her father’s aunt, whose death she
was mourning.
This “covert” side Of the card yielded tokens Of Don and Dawn withoutundue attention being called to those two words. The “overt” side was morelike a traditional minimal pair:
Don started walking farther
named her daughter Dawn
For this sode Of the card, after the repetition, speakers were asked, “DO
those two names sound the same or different to you?”Each card also had other low vowel words (e.g., heart); some Of these
could be paired with words on other cards (e.g., hot). Altogether some 30tokens of PALM,50 of LOT, and 30 of THOUGHTwere elicited this way.
The overt minimal pairs were: Don ~Dawn, cot~ caught,knotty ~ naughty,and collar ~ caller for LOT~ THOUGHT; balm ~ bomb and lager~ logger for
PALM ~ LOT; ah ~ aw, Pa’s ~ pause, and Ra ~ raw for PALM ~THOUGHT.4
From auditory impressions Of these pairs and Of spontaneous speech,each speaker was classi■ed as either 3-D (three low vowels: PALM96LOT 96THOUGHT), ENE (two vowels: PALM¢ LOT = THOUGHT), MAIN (two vow-els: PALM= LOT 96THOUGHT), 3-M (one vowel: PALM= LOT = THOUGHT), orunclear.
Despite a bias toward labeling a speaker “unclear” if there was anydoubt, there were relatively few such cases.Minimal-pair perceptions arenot dealt with here; however, they usually agreed well with productions.
4.1.1. SENIORCITIZENS.For the 67 seniors, ■gure 4.3 shows a sharp picture:58 Of them (87%) exhibit one Of the two-vowel systems;six (9%) retain the
three-vowelsystem;and three (4%) haveunclear patterns.
4.1.1.1. Two—VowelSystems.The 26 right-pointing triangles in ■gure 4.3,each standing for a MAIN speaker,are found in all but one Of the RhodeIsland communities and extend into Massachusetts in two areas. The 32left-pointing triangles showthe extent Ofthe ENE system.
The location Of the MAIN-ENE boundary reflects the settlement his-
tory outlined in section 2.1. Most Of Massachusetts(formerly Massachu-setts Bay and Plymouth colonies) merged LOT and THOUGHT;Rhode Islandmerged PALMand LOT.
Perhapsthrough maritime contacts,the mixed-settlement townson theeast shore Of Narragansett Bay came to resemble Rhode Island settlements
more than the Plymouth Colony towns they sprang from politically. If this

figure 4.3
massachusetts
doub
me
bs
bh fk
wrfb
na
pv
ababs
nt
ta
lv
ftftw
bk
fr
ti
lc
wp
dmnb
ac
fh
sw so
waba
bv ns
cf
clwsmv
pt sk re
ep
di
doub
me
bs
bh fk
wrfb
na
pv
ababs
nt
ta
lv
ftftw
bk
fr
ti
lc
wp
dmnb
ac
fh
sw so
waba
bv ns
cf
clwsmv
pt sk re
ep
di
rhodeisland
massachusetts
conn
ecti
cut
palm ≠ lot ≠ thought (3-D)palm = lot ≠ thought (MAIN)palm ≠ lot = thought (ENE)Unclear
0 10 mi
0 10 km
IOO PADS 952 LOW VOWELS OF SOUTHEASTERN NEW ENGLAND
FIGURE4.3Low Vowel System of 67 Senior Citizens
CO
NN
EC
TIC
UT
* PALM¢ LOT ¢ THOUGHT (3—D)
> PALM= LOT ¢ THOUGHT (MAIN)4 PALM¢ LOT = THOUGHT (ENE)? Unclear
LC 0 10mi0 10km
happened to Fall River, which grew into an industrial city, then Fall Rivercould have brought its own influence to bear on towns nearby.
A similar fate befell the Massachusetts towns just north across the stateline from Woonsocket, Rhode Island. Their seventeenth-century Massachu-
setts settlement history would predict ENE systems,but MAIN patterns arefound instead. This may be due to contact between those towns (Blackstone,
MillVille, South Bellingham) and the city of Woonsocket,which becameamajor industrial center in the early nineteenth century, and/ or to the out-migration from that city that later turned those townsinto suburbsof it.
In three places, the boundary cuts through a city or town. Seniors from
the north part of Bellingham, central Attleboro, and EastFreetown wereall ENE. But in South Bellingham, South Attleboro, and Assonet (the west-

The Geographic Study 101
ern part of Freetown), MAIN patterns were found. The MAIN sectionsofthese municipalities still have distinct identities, and even more so whenthese seniors were growing up. Students from South Bellingham attended
high school in Woonsocket;somefrom Assonetwent to high school in FallRiver.
South Attleboro is geographically and economically close to Pawtucket,
Rhode Island, but one high school hasservedthe whole of Attleboro sincethe nineteenth century. The boundary within Attleboro implies that con-tact at high-school age does not suf■ce to level a vowel system difference(chapter 3 reached this conclusion as well, though it also found this par-ticular difference within Attleboro to have collapsed).
4.1.1.2. OtherSystems.Six seniorsgaveevidenceof the 3-Dpattern, asfoundin many earlier records. While their LOTwassometimesshorter, in termsof quality it overlapped considerably with PALMand THOUGHT.Two of thesix were older male “Yankees” (of English descent), from relatively remoteplaces: Assonet, Massachusetts (age 90), and Little Compton, Rhode Island(age 88). The other 3-D seniors were from lessremote places, and two evenhad immigrant parents, which would be expected to disfavor such a con-servative pattern.
Three seniors had unclear systems, and all were from North Attlebor—
ough, Massachusetts.The unique statusof this town ismysterious,especially
as it separatedfrom Attleboro only in 1887. Perhaps its location on themain road between Providence and Boston led to more contact from both
directions, keeping its dialect intermediate, with LOT~ THOUGHTjudged“probably distinct” and PALM~ LOT “possibly distinct.”
None of the senior citizenshad a systemwith only one low vowel pho-neme. The three-way merger (3-M) was found only among the young adultspeakers.
4.1.2. YOUNGADULTS.The more complex pattern of 113 young adults isshown in ■gure 4.4. Eighty-seven speakers (77%) are either MAIN or ENE,and the boundary between those patterns has changed little, despite therebeing substantial interaction across that boundary for most of its length.
No young adults retained the 3-D system, but 6 (5%) were clearly 3-M.
Twenty speakers’systems(18%) were intermediate or could not be deter-mined from the data collected. Table 4.2 summarizes the low vowel systemsof the 180 seniors and young adults.
In the communities where the seniors had MAIN systems,48 of 62
young adults (77%) did too. Five were ENE, one was 3-M, and eight wereunclear. In the old ENE territory, 32 of 47 (68%) retained that system. One
was MAIN, four were 3-M, and ten were unclear. And in formerly unclear
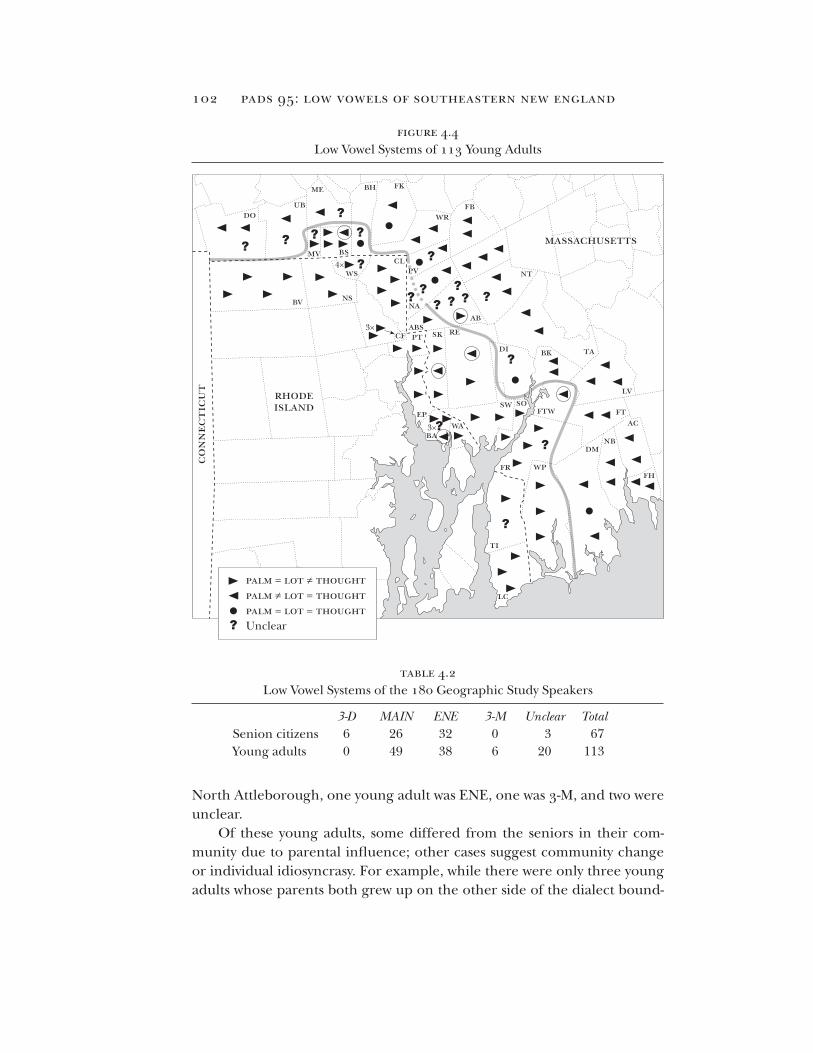
figure 4.4
table 4.2
3-D MAIN ENE 3-M Unclear TotalSenion citizens 6 26 32 0 3 67Young adults 0 49 38 6 20 113
massachusetts
doub
me
bs
bh fk
wrfb
na
pv
ababs
nt
ta
lv
ftftw
bk
fr
ti
lc
wp
dmnb
ac
fh
sw so
waba
bv ns
cf
clwsmv
pt sk re
ep
di
doub
me
bs
bh fk
wrfb
na
pv
ababs
nt
ta
lv
ftftw
bk
fr
ti
lc
wp
dmnb
ac
fh
sw so
waba
bv ns
cf
clws
mv
pt sk re
ep
di
rhodeisland
massachusetts
conn
ecti
cut
4×
3×
3×
palm = lot ≠ thoughtpalm ≠ lot = thoughtpalm = lot = thoughtUnclear
PADS 952 LOW VOWELS OF SOUTHEASTERN NEW ENGLAND
FIGURE4.4Low Vowel Systemsof 113 Young Adults
CO
NN
EC
TIC
UT
PALM = LOT 7":THOUGHT
PALM = LOT = THOUGHT
P‘ PALM 7":LOT = THOUGHT
O
? Unclear
TABLE4.2Low VowelSystemsof the 180GeographicStudySpeakers
3—D MAIN ENE 3—M Unclear Total
Senion citizens 6 26 32 0 3 67
Young adults 0 49 38 6 20 113
North Attleborough, one young adult was ENE, one was 3-M, and two wereunclear.
Of these young adults, some differed from the seniors in their com-munity due to parental in■uence; other casessuggest community change
or individual idiosyncrasy.For example,while there were only three youngadults whose parents both grew up on the other side of the dialect bound-

The Geographic Study 103
ary from themselves, all three patterned with their ENE parents, not their
MAIN peers.And of those with one parent from each side of the bound-ary, 33% (3 of g) were 3-M, compared to only 3% (3 of 100) of the rest(Fisher’sExactTest,119= .007).
Among the seniors, there were three whose parents did not match their
peers, and at least four whose parents did not match each other; but in allthose casesthe subject acquired the peers’ two-vowel system. This suggeststhat the ENE and MAIN systems were more robust then, and that a dif-ferent dynamic is now at work whereby unclear and 3-M patterns replace
them. Note that 86% of the 76 young adults aged20 and older had a clearENE or MAIN pattern, but only 59% of the 37 teenagers did (Fisher’s ExactTest, 19= .004).
The interviews of young adults in South Bellingham (3-M, unclear)and Assonet (ENE) suggested those places were no longer true MAIN sub-
areas (Barrington, R.I., was another such case). To ■nd out if and when
these changesoccurred, more interviews were conducted in the formerlysplit municipalities.
4.2. MORE EVIDENCE FROM THREE FORMERLY “MAIN”COMMUNITIES
While one gaugeof avowelsystem’srobustnessin a community ishow read-ily it is acquired by children who inherited other systemsfrom their parentsor earlier peers, the best way to date a change is by looking at speakers
whoseparents havethe old local pattern.Seniorsof this type in two Massachusettssub-communities,South Bel-
lingham (ages 70 and 58) and Assonet (age 85), showed clear MAIN pat-terns, while young adults there were different: unclear in South Bellingham(age 18) and ENE in Assonet (age 20). The latter represents a more unex-pected change, as it involves an unmerger aswell as a merger.
In South Attleboro, a 26-year-old woman and a 62-year-old man wereboth MAIN, but the man’s son, an 18-year-old from chapter 5’s family study
(and with a MAIN mother), was3-M, aswere manyyounger children.Using a revised set of methods for eliciting tokens of the vowels of inter-
est, including “semantic differential” questions like ‘What’s the differencebetween a spa and a salon?” a further investigation was carried out in thesethree places. The goal was to seewhen, and how quickly, low vowel patternschanged there.
In South Attleboro, two 20-year-olds still exhibited a clear MAIN sys-tem. One had two MAIN parents, from Seekonk and Pawtucket. The other

104 PADS 952 LOW VOWELS OF SOUTHEASTERN NEW ENGLAND
moved from Panama at age 9 and is a good barometer of the peer grouppattern since she had no English exposure from parents.
The difference between these 20-year-olds and the 18-year-old points
to a fairly sudden change. To extrapolate, children born in 1985 orbefore to MAIN (or foreign) parents acquired the MAIN low vowel systemcharacteristic of adjacent Rhode Island: PALM= LOT96THOUGHT.Thoseborn in 1987 or later learned a three-way-merged (3-M) system, where
PALM= LOT = THOUGHT.5 The reasons for this merger will be discussedstarting in section 4.5.
In South Bellingham, a 46-year-oldand a 41-year-old,both with localparents, displayed the same clear MAIN pattern as the seniors previously
noted. The son of the 41-year-oldwas20, and both noted afeeling of isola-tion from the rest of their town and a closer connection with Woonsocket,
Rhode Island (MAIN).6 However, the son showed a 3-M system in spontane-
ous speech,along with inconsistent behavior on minimal pairs. A 15-year-old with MAIN parents (NewYork and Rhode Island) wasclearly 3-M.
We can conclude that South Bellinghamites born up to 1965 have aMAIN system,assumingtheir parents do too. Sometime after that, but nolater than 1985, PALM= LOT and THOUGHT merged, resulting in the 3-M
pattern.It is tempting to link this merger to a demographic shift. Since the
195os,Bellingham’s population expanded,with manypeople arriving fromGreater Boston. Ties between South Bellingham and North Bellinghamstrengthened, while those with Woonsocket diminished.
In Assonet, the original study found a 90-year-old man with a 3-D sys-tem, while his 85-year-old wife was MAIN. However, a 20-year-old man had
an ENE system, despite MAIN parents. Was this an idiosyncrasy, or a surpris-ing community change, involving the unmerging of PALMand LOT and the
merging of LOTand THOUGHT?The follow-up study found three women, aged 74, 53, and 50, with the
MAIN pattern. The 74-year-old, like the older subjects, had gone to gradeschool locally, but the other two were exposed to ENE influence through-
out their schooling. Before 195o, Assonet children attended local schools
through 8th grade; if they went to high school, it wasin Fall River (MAIN).And since 1950, they have gone to elementary school together with anequal number from East Freetown (ENE). Since 1959, they have gone tomiddle and high schoolwith children from the town of Lakeville (ENE).
A 31-year-oldwoman seemedto have an ENE systemin spontaneousspeech, but on minimal pairs she was MAIN, like her parents (from Som-
erset and Fall River). Her 28-year-oldbrother had a clear ENE pattern inboth styles. This means the 20-year-old was no exception; Assonet changed

The Geographic Study 105
from MAIN to ENE. However, this shift to ENE was apparently short-lived:
three young women born around 1988, all with local or MAIN parents,were fairly clear examplesof the 3-M pattern (which wasalsofound in theyoungestSouth Attleboro and South Bellingham subjects).
To recap, Assonet speakers born between 1920 and 1955 acquired
the MAIN pattern. This includes the ■rst students to attend school withENE children. After a gap in our data, those born between 1975 and 1985
showedthe ENE pattern, evenif they had MAIN parents. This implies thatthey reversed their parents’ merger of PALM~ LOTand acquired their peers’
merger of LOT ~ THOUGHT.The conditions for such a presumably rare event may well have been in
place. These children attended an elementary school where just as many(from East Freetown) had the ENE system.And in middle and high school,
they would havemet evenmore ENE children (from Lakeville). Also, sub-stantial direct immigration from the Boston area began to affect Assonetduring this period.
Each of these three formerly MAIN subcommunities has, over thedecades, turned away from a declining, adjacent MAIN city to the south:
Pawtucketfor SouthAttleboro, Woonsocketfor South Bellingham, and FallRiver for Assonet. And in all three—though only quite recently in Assonet—
there hasbeen signi■cantimmigration from the Greater Boston area.The level of commuting to the city of Boston, some 40 miles away,has
actually been steady in South Attleboro (from 4.2% of workers in 1990 to3.9% in 2000) and South Bellingham (5.3% to 5.2%). But it hasincreased,starting from a lower level, in Freetown (2.1% to 3.6%); data at the sub-
community level (Assonet) was not available (Census Bureau 1994, 2004).
Over the sameperiod, there hasbeen a decline in commuting to theadjacent MAIN cities: from South Attleboro to Pawtucket (from 7.2% ofworkers in 1990 to 5.0% in 2000), South Bellingham to Woonsocket (9.9%
to 3.6%),and Freetownto Fall River (14.5%to 12.2%).More peopleinSouth Bellingham now commute all the wayto Boston than work in the citynext door; the same is almost true in South Attleboro.
In Freetown, a much higher proportion, though a declining one, con-tinues to commute to Fall River. Economic ties are stronger there, despitethe “disintegration” of Fall River alluded to by several Assonet subjects.Regardless of such adult connections, young people in Assonet have moved
awayfrom Fall River and MAIN, linguistically.
Chapter 5 will deal with young people merging PALM= LOT andTHOUGHT in other formerly MAIN communities. In the old ENE area, too,
the PALM96LOT = THOUGHT distinction seems to be weakening, with the
same outcome: 3-M.

table 4.3
Ages 24–33 Ages 20–23 Ages 15–19 (ENE) 15 9 8 (unclear) 1 5 4
0 1 3
106 PADS 952 LOW VOWELS OF SOUTHEASTERN NEW ENGLAND
TABLE4.3Decreasing Stability of the ENE System:
Behavior of PALM~ LOT 2 THOUGHTversus Age
Ages24—33 Ages20—23 Ages15—19PALMatLOT 2 THOUGHT (ENE) 15 9 8
PALMé LOT 2 THOUGHT (unclear) l 5 4
PALM2 LOT 2 THOUGHT (3-M) O l 3
Section 4.1.2 noted that teenagerswere lesslikely than older youngadults to preserve the MAIN and ENE systems.Within the historically ENE
area, table 4.3 divides the 46 young adults with a clear LOT ~ THOUGHT
merger, according to the status of PALM.We see that the younger subjectshave more 3-M systems and more unclear ones (whether due to missing
data or actual closeor inconsistent minimal-pair productions).In the historically MAIN area,apart from the abovethree subcommu—
nities, the geographic study does not show the PALM= LOT ¢ THOUGHTdis-tinction to be as endangered as the PALM¢ LOT = THOUGHT contrast is inthe ENE area. But chapter 5 shows that change was imminent in some ofthose towns aswell.
When the changesin SouthAttleboro, South Bellingham, and Assonet
are seen as part of that larger context, it becomes less attractive to explain
their timing by referring to local demographic events.
4.3. ACOUSTIC ANALYSIS OF PRINCIPALLOW VOWEL SYSTEMS
Instead of a comprehensive acoustic analysis of all the geographic studysubjects, four seniors and three young adults were analyzed, illustrating the
most common low vowel systems.Most were from the “focus area,” the cen-tral part of the study area. Two were from South Attleboro (MAIN), twofrom North Attleborough (ENE and 3-M), and one from Norton (ENE).
A speaker from PlainVille was possibly 3-D; one from Somerset,outsidethe focus area, was more clearly 3-D. These seven speakers, whose parents
camefrom the sameside of the dialect boundary asthey did (or elsefromabroad), are compared in table 4.4.
The acoustic analyses con■rm the basic systems, while also revealing
complexities not detectable by ear. These include differences between“overt” (minimal pair) and “covert” (sentence-embedded) reading pronun-ciations, aswell as the possibility of regular small distinctions between twoword classesthat completely overlap in phonetic space.

table 4.4
Speaker Community Age Sex Mother from Father fromABS62M S. Attleboro, Mass. 62 M Pawtucket, R.I. Pawtucket, R.I.NT86F Norton, Mass. 86 F Norton Milton, Mass.PV81M Plainville, Mass. 81 M Poland PolandSO85F Somerset, Mass. 85 F Fall River, Mass. Swansea, Mass.
ABS26F S. Attleboro, Mass. 26 F Pawtucket, R.I. PortugalNA30M N. Attleborough, Mass. 30 M Plainville N. AttleboroughNA19F N. Attleborough, Mass. 19 F N. Attleborough N. Attleborough
Speaker r-ful saw a Broad a lot ~ palm ~ lot palm ~ System thought thoughtABS62M some — Y D S D? MAINNT86F no Y Y Sa D D ENEPV81M no Y N D? D? D 3-D?SO85F no N Y Da D D 3-D
ABS26F some Y N D S D MAINNA30M no Y N S? D D ENENA19F some N N S S S? 3-M
a. Only Don ~ Dawn behaved deviantly.
The Geographic Study 107
TABLE 4.4Summary of Background and Linguistic Behavior Based on Auditory Impressions
of Seven “Typical” Speakers to Be Analyzed Acoustically
Speaker Community Age Sex M otherfrom FatherfromABS62M S. Attleboro, Mass. 62 M Pawtucket, RI. Pawtucket, RI.
NT86F Norton, Mass. 86 F Norton Milton, Mass.
PV81M Plainville, Mass. 81 M Poland Poland
S085F Somerset, Mass. 85 F Fall River, Mass. Swansea, Mass.
ABS26F S. Attleboro, Mass. 26 F Pawtucket, RI. Portugal
NA3OM N. Attleborough, Mass. 30 M Plainville N. Attleborough
NA19F N. Attleborough, Mass. 19 F N. Attleborough N. Attleborough
Speaker r—ful saw[J] a Broad a LOT ~ PALM ~ LOT PALM ~ System
THOUGHT THOUGHTABS62M some — Y D S D? MAIN
NT86F no Y Y S21 D ENEPV81M no Y N D? D? D 3-D?S085F no N Y D21 D D 3-D
ABS26F some Y N D S D MAIN
NA3OM no Y N S? D D ENENA19F some N N S S S? 3-M
a. Only Don~Dawn behaveddeviantly.
4.3.1. PROCEDURESFOR ACOUSTICANALYSIS.Speakers’ low vowels wereanalyzed in Praat using methods adapted from Labov, Ash, and Boberg(2006, chap. 5). For each stressed vowel of interest, a single measurementpoint waschosenby a combination of severalcriteria. Ideally, the perceivednucleus would coincide with: (1) an F1 maximum or steady state; (2) an F2minimum (or maximum) or Steady State; (3) an F3 minimum, maximum,
or steady state; and/ or (4) an intensity maximum.
Bearing in mind these criteria in descending order of importance, theearliest qualifying point was selected (assuming it sounded and looked freeof the influence of surrounding consonants). Many of the low vowels in thestudy area are ingliding toward similar central targets. So if we have ENE[koet] (cot, caught) versus [kaet] (cart), the later in the vowels we measure,the more obscured the phonemic difference will be.
Following Baranowski (2007), ■ve formants were estimated by linearpredictive coding (LPC). Occasionally, when a false formant appeared atthe nucleus, four formants were used instead. For men, their maximum was
set to 5000 HZ; for women and children, 5500 Hz.

108 PADS 952 LOW VOWELS OF SOUTHEASTERN NEW ENGLAND
Most often, the F1 and F2 tracks were strong and reasonably steady,andselection of a measurement point wasnot dif■cult. But it was noted that the
consonants surrounding the measured vowel had a profound influence onthe position and shapeof the formant tracks.
Phonetic environment affects vowel quality asperceived by the ear, butits influence on formant measurements is even greater. This ensures thatdiverse tokens of any word class plotted based on acoustic measurementswill alwaysform a cloud rather than a tight cluster.
Many factors (e.g., pitch and stress) affect formant values, especially
the phonological context the vowel is in. But not all allophonic effectsarepredictable coarticulations; some are part of “dialect competence.” For
example, American English dialects differ in the effects of the followingenvironment on short a. Such effects should be attended to, not factored
out.
4.3.1.1. TheAcousticAnalysis of Ruth Herold. The dif■culties associated withdetermining phonemic low vowel systemsby acoustic analysis are well illus-trated by reviewing Herold (1990, 60—91). Herold’s auditory impressionstold her that the oldest speakers in Tamaqua, Pennsylvania, had MAIN pat-terns, while those under 70 years of age were 3-M, pointing to fairly suddencommunity change. Herold (1990, 60—73) measured tokens of PALM= LOTand THOUGHTfrom the spontaneous speech of ten speakers. Herold elimi-
nated all tokens before /l/, which haveparticularly low F2. SinceTHOUGHTis more common before /l/, not excluding such tokens could produce aspurious distinction.
For the three speakers identi■ed by ear as distinct, there was no prob-lem; unpaired t-tests reported highly signi■cant differences in both F1 andF2. But several of those judged by ear as completely merged also showed
signi■cantdifferences in one or both formants (74).In a multivariate analysis performed so that “the effects of phonetic
conditioning were factored out” (78), although one speaker’s differences
became less signi■cant, two others’ were unchanged; for two speakers,accounting for environment made the acoustic word class distinction—again, unsupported by auditory impressions—appear more signi■cant.
A multivariate approach can make such “false positives” less likely.BecauseTHOUGHTalmost never occurs before /p/ in a word, the high F2observed for LOTbefore /p/ would skew LOT’soverall mean in a simplet-test, suggesting a distinction; a multivariate regression could avoid this
trap.Herold (1990, 80—82)notes another casewhere many monosyllabic
THOUGHT words followed by /l/ were used (all, ball, call, each several times),

The Geographic Study 109
but the only examples of LOT plus /l/ were collie and volleyball. Here, if aregression factored out consonantal environment but ignored the poten-tial effect of syllabicstructure, it could lead to a falsereport of aword classdistinction.
Herold resolves the issue by siding with her auditory judgments overthese acoustic/ statistical results. For the acoustic analysis in this study,
deliberately paired tokens were measured, so that the paired t-test is anappropriate and effective statistical method.
4.3.1.2. PhonemicAnalysis byPairedAcousticMeasurements.The measurementof some vowelsfrom spontaneous speech is important, if only to ensurethat they are being pronounced the sameasin more formal methods, butusing paired tokens from read sentences and minimal pairs makes it easier
to assessphonemic differences.From the ten cards read by each speaker were extracted 21 minimal
pairs (and other multiples) involving PALM, LOT, and THOUGHT, given in
table 4.5. The measured vowels for each speaker were plotted using an Rroutine that also calculated the mean F1 and F2 distances between any twoword classesand their statistical signi■cance according to paired t-tests.
A minor advantageof this method is that it eliminates the assumptionthat the vowelmeasurementsarenormally distributed, allowing its usewith-out necessarilyhavingvowelsin a full range of phonetic environments. Thedifferences between pairs are now assumed to have a normal distribution,
a reasonableassumption if the vowelsare merged—the mean differencewould be zero—and not unreasonable if the vowels are distinct.
The major advantageof the paired method is that phonetic condition-ing is directly factored out, as long asminimal or near-minimal pairs areused. Comparing cot only with caught, collar only with caller, and so forth,
leads to a better evaluation of mergers and distinctions, although not allpairs were perfectly matched prosodically (a narrow cot vs. caught the hall)
or contextually (heart vs. hot might be a problem for rhotic dialects; eventhough most of the speakers selected were nonrhotic, the postvocalic /r/
could still have an effect: see Labov, Yaeger, and Steiner 1972, 229—34).
Another advantageis that since the samewords are analyzedfor eachspeaker, between-speaker comparisons can be made more precisely. Data
from multiple speakerscanalsocastlight on the behavior of words.If caughtwere centralized versus cot in several people’s speech, we might consider it
a result of the different prosody of the carrier sentences, or a word-level
difference, rather than a sign of merger, aswe might in a single individual.Having a predetermined setof words alsoeliminates any unconsciousbiasthat may affect the analystashe or shechooseswhich tokens to measure.

table 4.5
palm lot thoughtlot ~ thought collar caller cot caught Don Dawn John Shawn knotty naughty Molly mall sod sawed stocking stalkpalm ~ lot balm bomb calmer comma card cod darkness doctors harder hotter heart hot lager loggerpalm ~ thought ah aw Pa’s pause Ra rawMultiple aunt on gone Bach, bark bock balk ah’s, r’s Oz aw’s
note: Words set in bold were repeated as “overt” minimum pairs; others were read only in a “covert” sentential context.
1 10 PADS 95' LOW VOWELS OF SOUTHEASTERN NEW ENGLAND
TABLE4.5Principal Paired Words from Geographic Study Reading Cards
PALM LOT THOUGHTLOT ~ THOUGHT collar caller
cot caughtDon Dawn
John Shawnknotty naughty
Molly mall
sod sawed
stocking stalk
PALM ~ LOT balm bomb
calmer commacard cod
darkness doctors
harder hotterheart hot
lager logger
PALM~ THOUGHT ah awPa’s pauseRa raw
Multiple aunt on goneBach, bark bock balk
ah’s, r’s Oz aw’s
NOTE: Words set in bold were repeated as “overt” minimum pairs; others were read
only in a “covert” sentential context.
A disadvantage to the method is that it cannot easily be applied tospontaneous speech, which we are fundamentally most interested in. Butcompared to an unpaired t—test,the paired t-test reduces the chance of aphonetic imbalance leading to a spurious distinction. And it increasesthechance that a small, systematic word classdistinction will be detected.
If there is a consistent difference between minimal pairs, but one that issmall compared to the phonetic range of each word class—that is, the twovowel clouds overlap substantially—an unpaired t—testwould probably notdetect a signi■cant difference, but a paired test might.7
It may be unusual for two phonemes to overlap so thoroughly. Even
situations of near-merger,where small formant differences are preserved,
are not alwayscharacterized by extreme overlap. In Tillingham, Essex(England), some speakershave /ai/ and /0i/ asclose as 100 HZ in F1 andlittle more in F2, but with hardly any overlap between classes(Labov 1994,

The Geographic Study 111
382). The word classesof MEATand MATEin vernacular BelfastEnglish dooverlap, even while MEAT-wordsare transferring into a third category of
MEET(Labov 1994, 384—87;data from Harris 1985).And the caseof NewYork City source~sauce(Labov,Yaeger,and Steiner 1972, 229—34)showsconsiderable, stable acoustic overlap, not merger, even with a fully vocal-
ized /r/ in source.Aside from near-mergers—a relatively stable, if rare, property of speech
communities—two circumstances in an individual’s life could result incloselyapproximated vowels.
If a speaker learned a vowel distinction as a child but has since aban-
doned it becauseof relocation or communal change,an acousticallysmallvestige of it might remain. This could either be ampli■ed or further sup-pressed when greater attention is paid to speech.8
Or consider a speaker who was originally merged, but recently has been
in contact with the distinction. Distinctions are rarely acquired in full, evenby young learners (chap. 3), but microdistinctions between word classes
could develop through subconsciousaccommodation. Exactlywhat is pre-dicted to be learned is different under traditional and word-basedphono-logical theories.
Nycz (2005) showed that a New York City speaker produced a smaller
low back distinction while performing a taskwith a merged partner. Nycz(2010) further explores the accommodation betweenmerged and distinctspeakersthat occursin both directions—experimentally and in real time—and its theoretical implications.
4.3.2. ACOUSTICANALYSISOFSENIORCITIZENS.Four senior citizens wereanalyzed; three from the focus area (AB, NT, PV) and one from further
south (SO); see ■gure 4.5.ABS62M, a 62-year-oldman from South Attleboro, is a good example
of the MAIN system, PALM = LOT ¢ THOUGHT. NT86F, an 86-year-old womanfrom Norton, exempli■es the ENE system, PALM¢ LOT = THOUGHT. How-
ever,ABS62M and NT86F were not selectedbecausetheywere particularlygood examples. Most of the senior citizens had low vowels similar to one ofthese two subjects.
PVS1M, an 81-year—oldman from Plainville, had more unusual low vow-els. He has, or perhaps had, a three-waydistinction (3-D), PALM96LOT96THOUGHT. But acoustic analysis does not straightforwardly con■rm this.S08 5F, an 85-year-old woman from Somerset, 15 miles southeast, exempli-
■edthe 3-Dpattern more convincingly.

× ×
figure 4.5
rhodeislandrhodeisland
mass.
naab
abs
nt
ftw
bk
sw so
waba
ns
cf
clws
pt sk re
ep
di
na
pv
ababs
nt
ftw
bk
sw so
waba
ns
cf
clws
pt sk re
ep
di
rhodeislandrhodeisland
mass.
naab
abs
nt
ftw
bk
sw so
waba
ns
cf
clws
pt sk re
ep
di
na
pv
ababs
nt
ftw
bk
sw so
waba
ns
cf
clws
pt sk re
ep
di
PV81M
NT86F
SO85F
ABS62M
NA30M
NA19F
ABS26F3×
3×
Senior Citizens Young Adults
PV81M
NT86F
SO85F
ABS62M
NA30M
NA19F
ABS26F
palm ≠ lot ≠ thought palm = lot ≠ thought palm ≠ lot = thoughtpalm = lot = thought Unclear
1 1 2 PADS 952 LOW VOWELS OF SOUTHEASTERN NEW ENGLAND
FIGURE 4.5The Focus Area: Four Seniors and Three Young Adults Acoustically Analyzed
Senior Citizens
EVSI'M
* PALM 7":LOT 7":THOUGHT > PALM = LOT 7":THOUGHT ‘ PALM 7":LOT = THOUGHT
. PALM = LOT = THOUGHT ? Unclear
4.3.2.1. A TypicalMAIN System.Plots ofABS62M’s paired tokens of PALM,LOT,and THOUGHTare shownin ■gure4.6, which highlights the relationship ofLOT and THOUGHT,and in ■gure 4.7, which focuses on PALM~ LOT.
Figure 4.6 shows THOUGHTmuch higher and backer than LOT. While
THOUGHTis tightly clustered, we seephonetic conditioning for LOT; tokensof the same word are usually close together.
The solid lines connect the 4 overt pairs—Don ~Dawn, cot~ caught,knotty ~ naughty, collar~ caller—which were all judged “different” by bothspeaker and analyst. The mean difference, subtracting THOUGHTfrom LOT,is 269 Hz for F1, 430 Hz for F2. This will be reported giving the speaker,style, and number of pairs:
ALOT —THOUGHT (ABS62M, O, 4) = +269, +430.
The dashed lines connect the 6 covert pairs, which are the same words
as above read in sentential context, plus sod~sawed and stocking~stalks.
Note that the mean difference is slightly smaller for the covert pairs, forboth formants:
ALOT —THOUGHT (ABS62M, C, 6) = +240, +407.
Performing a paired t-test on the ten pairs gives an unsurprising result.The p-value is 1 X 10—6for F1 and 1 X 10—7for F2. These word classesareclearly not merged. A 95% con■denceinterval for the difference in meanscan be incorporated into the shorthand thus:

××
figure 4.6
F1 (
Hz)
F2 (Hz)
400
900
500
600
700
800
1400 1200 1000 800 600
Don
Dawn
naughtysawed
naughty
caughtstalks
callercaught
callerDawn
lot
thought
palm
Don
collar
collar
knotty
knotty
stockingcot
sod
cot
palmlotthought
Overt Pairs
Covert Pairs
The Geographic Study 113
FIGURE4.6AB862M: Paired Tokens of LOT ~ THOUGHT
400 - -THOUGHT
500 - -
:7 600— —EI; - A PALM
El LOT
700 —V THOUGHT
Overt Pairs_
I—v
Covert Pairs
800— D___V
900 | . | . | . I .1400 1200 1000 800 600
F2(Hz)
ALOT —THOUGHT (AB862M, CO, 10) = +252 i49 (p = 1x 10‘6), +417 i64
(p:1x10—7)For AB862M, the true LOT~ THOUGHTdifference almost certainly fallswithin these ranges.
The zoomed-in view of ■gure 4.7 allows a better comparison of the
PALMand LOTclasses,which overlap almost completely. The ellipses enclose90% of the tokens of each class.
Only one overt pair, balm~ b0mb,differs moderately (+58, —152).Thedifference is not like in ENE, where PALM is fronter than LOT. Here balm is
somewhatbacker than b0mb,but the tokens soundedvery similar and werejudged “same” by both speaker and analyst.
7The six covert pairs were also judged “same,’ and the paired t—testsyield the following:
APALM —LOT (AB62M, C, 6) = —51i41 (p = .02), —2oi6o (p = .43)
The F1 result is signi■cant: for 5 of 6 pairs, PALMis consistently slightlyhigher than LOT.

figure 4.7
F1 (
Hz)
F2 (Hz)
900
600
700
800
14001500 1200 1000
650
550
750
850
1300 1100 900
lot
palm
card
comma
bombcalmer
heartbalm
balm
logger
lager
bomb
hotter
harder
hotcod
palmlotthought
Overt Pairs
Covert Pairs
1 14 PADS 95' LOW VOWELS OF SOUTHEASTERN NEW ENGLAND
FIGURE4.7AB862M: Paired Tokens of PALM ~ LOT
550 I ' I ' I
600 — —
LOT
650 '
comma/z’ PALM
A700 — card
D—
>1 A
E x\
I—I ‘\
Ln750_A PALMEl LOT
D V THOUGHT
800 _ Overt Pairs
El
Covert Pairs850 - A- - - - ‘El
900 | I | I |
1500 1400 1300 1200 1100 1000 900
F2 (Hz)
Three of these pairs involve PALMfollowed by /r/, and seeing as thisspeaker variably pronounced postvocalic /r/, the phonetic in■uence of that
consonant could be at work. But signi■cantly, there is no following /r/ inbalm and calmer,which are still higher than their pairs, bomband c0mma.
The PALMand LOTword classes,as a whole, occupy the same phonetic
space. They also sounded identical to both speaker and listener, soAB862Mwill be categorized as MAIN, or PALM = LOT ¢ THOUGHT. However, the pos-
sibility that PALMmay neverthelessbe somewhatraisedwith respect to LOTis worth bearing in mind when analyzing the vowelsof other MAIN speak-
ers.
4.3.2.2. A TypicalENE System.NT86F’s LOTand THOUGHTare displayedin■gure 4.8. Figure 4.9 showshow PALMis related to the other two classes.The clouds for LOT and THOUGHToverlap almost completely; the t-test for
covert pairs suggestsmerger:
ALOT —THOUGHT(NT86F,C, 7) = —20i58 (p = .43), +39i1 17 (p = .45)
The difference betweenword classesis small,but more importantly, it is
very variable. For both F1 and F2,four pairs differed in one direction while

figure 4.8
F1 (
Hz)
F2 (Hz)
900
600
700
800
140015001700 1600 1200 1000
650
550
750
850
1300 1100 900 800950
lot
thought
sodDon
knotty naughty
Don2
Dawn2
Molly
mall
cot
caughtnaughty
knottycaught
cot
callercollarstocking
stalks
sawed
Don
DawnDawn
caller
collar caller2
collar2cot2
caught2
palmlotthought
Overt Pairs
Covert Pairs
The Geographic Study 115
FIGURE4.8NT86F: Paired Tokens of LOT ~ THOUGHT
550 I I I . I . IEl THOUGHT
V600 - -
V
650 —
\Dawn
_
DawnCEI mught?
700 —I]:
15131125
llar caller? —ElD
Aon D
an?collarQIIE [Vmall
Nliar
UE sawed stocking C0 MollV
750 _
El:ycaller Y
_,_IL“
Vklnotty
:aughimugI’jhty
Dawn?
800
caughtAA PALM
_
Acot
El LOT
A A A AAA
D%
knottyHnaughty V THOUGHT
850 ' & AOvert Pairs
l/
HAAAA Don?
.900 _ A A A
LOT Covert Pairs
EI-- ——'V
950 Al I I I I I I I1700 1600 1500 1400 1300 1200 1100 1000 900 800
F2(Hz)
three went the other way.With so much variation, mean differences of —20
or +39 HZ could easilyariseby chance.A result like this is a strong indica-tion of merger, but not a foolproof one. The con■denceintervals for eachformant include zero (hence the result is “nonsigni■cant”), but they also
are consistentwith there being an underlying difference in anydirection.In responding to the overt pairs, NT86F said most of the key words
twice. This highlighted an interesting discrepancy between Don ~Dawn,which she pronounced differently each time (including the covert context),
and the other three LOT~ THOUGHTpairs,which shepronounced alike, inher judgment and mine. We cannot be sure if Don ~Dawn is a lexical orphonological exception. Of all the pairs, it was the most likely to behaveidiosyncratically—in both directions. This could happen if people tend to
pronounce personal names in a way that is influenced by acquaintanceswho bear those names. As long asDon ~Dawn is omitted, the overt pairs do
not showa signi■cantdifference:
ALOT—THOUGHT (NT86F, O, 5) = +6i27 (p = .56), +53i85 (p: .16)
In going from covert to overt pairs, NT86F moved in the direction ofthe typical (positive) distinction. Four of ■ve overt pairs show THOUGHT
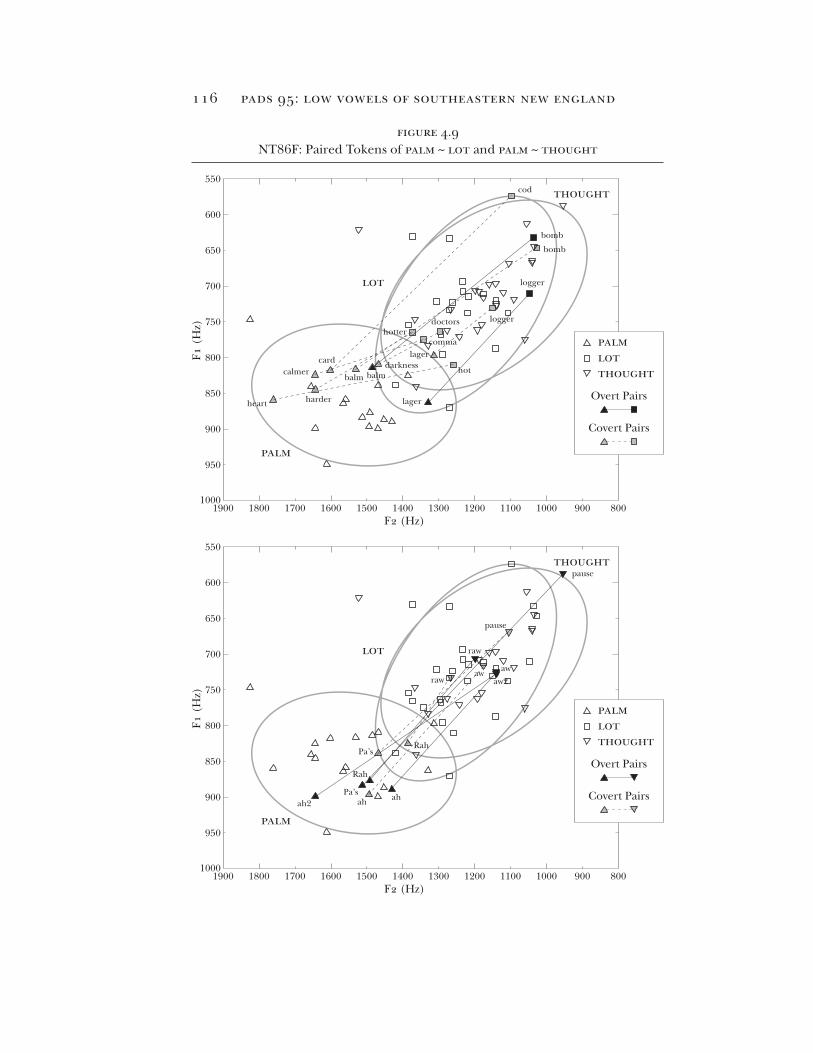
figure 4.9
F1 (
Hz)
F2 (Hz)
900
600
550
700
800
950
650
750
850
140015001700 1600 1200 10001000
1300 1100 900 8001900 1800
F1 (
Hz)
F2 (Hz)
900
600
550
700
800
950
650
750
850
140015001700 1600 1200 10001000
1300 1100 900 8001900 1800
thought
balm
lot
palm
thought
ah2
lot
palm
aw2
ah
aw
ah
aw
Pa’s
Pa’s
Rah
Rah
raw
pause
raw
pause
darknessbalm
cardcalmer
harderheart lager
bomb
cod
bomb
logger
logger
hot
lager
doctors
commahotter
palmlotthought
Overt Pairs
Covert Pairs
palmlotthought
Overt Pairs
Covert Pairs
1 16 PADS 95' LOW VOWELS OF SOUTHEASTERN NEW ENGLAND
FIGURE 4.9NT86F: Paired Tokens of PALM ~ LOT and PALM ~ THOUGHT
550 . . . . I .J3“”1 THOUGHT
/ V600 — /’/ _
,’ VVEl / bomb
650 '[m bomb —
x v
700 —LOT logger
_
<7750- A / —m 1’ hotter
v x // , 7 ’ A PALMI-t ’ s. ’ r,
L:800- / 45’ lagerAt' L TC3215]; :' ’/ ’ darkness‘ _ - —El
D O
calmer A'/ I , balm balm
‘ , -A—' ' V THOUGHT
,: , - , —‘ ’ ‘ A El v.850 '
hem A———’ ‘harder & lagerOvert Palrs
AA U 4—-AA
.900— A AA Covert Palrs
A———-EIPALM
950- ZS _
I I I I000 | I I I I I1900 1800 1700 1600 1500 1400 1300 1200 1100 1000 900 800
F2 (Hz)
550 . . . . I .El THOUGHT
pause600 - -
650 - -
700 - -
A 750- A —g
V A PALMH[-Y-I800 - El LOT
V THOUGHT
850 ' A Overt Pairs
A—V900 — Covert Pairs
A ———vPALM
950 - A _
000 | I | I | I | I | I1900 1800 1700 1600 1500 1400 1300 1200 1100 1000 900 800
F2(Hz)

The Geographic Study 117
backer than LOT, by 46 to 120 Hz. This is reminiscent of how ABS62M
pronounced most PALMwords slightly higher than the corresponding LOTwords, within a context of complete overlap. For NT86F, LOTand THOUGHTcompletely overlap,but on a “microscopic” phonetic level, the two maynotbe identical. In terms of gross production and perception, however, the LOTand THOUGHTword classesare merged for NT86F, except for Don ~Dawn
(and perhapsfor other words not investigated).Figure 4.9 shows that the PALMclass is distinct from the merged
LOT = THOUGHT class. The difference is not extreme, and there is a small
amount of overlap. But it is phonetically dissimilar tokens that overlap;potentially contrasting ones show a clear difference.
The top panel of ■gure 4.9 displays PALM~ LOT pairs, judged “differ-ent” by speaker and analyst. There is a distinction in both formants for
the covert pairs. There are only two overt pairs, resulting in nonsignificantp-values,but the differences are aslarge or larger:
APALM—LOT(NT86F, C, 7) =+101 i71 (X7: .02), +346i144 (P: .001)
APALM—LOT(NT86F, O, 2) = +168i184 (X7: .06), +366i1061 (P: .15)
The only overlap between theseword classesinvolvesPALMtokens that arefar back for PALM—lagerand balm—andtokens of LOTthat are low andfront for LOT—hot, hotter, comma. Each of these words is far apart from its
pair, as loggerand bombare among the furthest back in the LOT class, andheart, harder, and calmer are some of the frontest PALM words.
The bottom panel of ■gure 4.9 shows PALM~ THOUGHT pairs, which
were impressionistically judged “different.” The picture is similar, whichmakes sense if LOT and THOUGHTare merged:
APALM —THOUGHT (NT86F, C, 3) = +148 i1 18 (lb: .03), +267 i321 (P: .07)
APALM—THOUGHT (NT86F, O, 4) =+201 i102 (lb: .01), +411 i223 (lb: .01)
These pairs were already distinct (covert), but moved apart under con-scious focus (overt). With PALM¢ LOT = THOUGHT,NT86F has the ENE lowvowel system. Her almost total nonrhoticity and use of broad a—twice inhalf—completes her Eastern New England sound, though variable nonrho-
ticity and somebroad a were alsofound in the MAIN speakerABSS2M.
4.3.2.3. A Possible3—DPattern. PV81M was one of six speakers who seemed tohave a three-way low vowel distinction (3-D). The auditory impression wasthat PALMwassometimesquite fronted (like ENE), that LOTspannedawiderange—sometimesfront and unrounded (like MAIN), sometimesback androunded (like ENE)—and that THOUGHT was sometimes very high and
back (like MAIN).
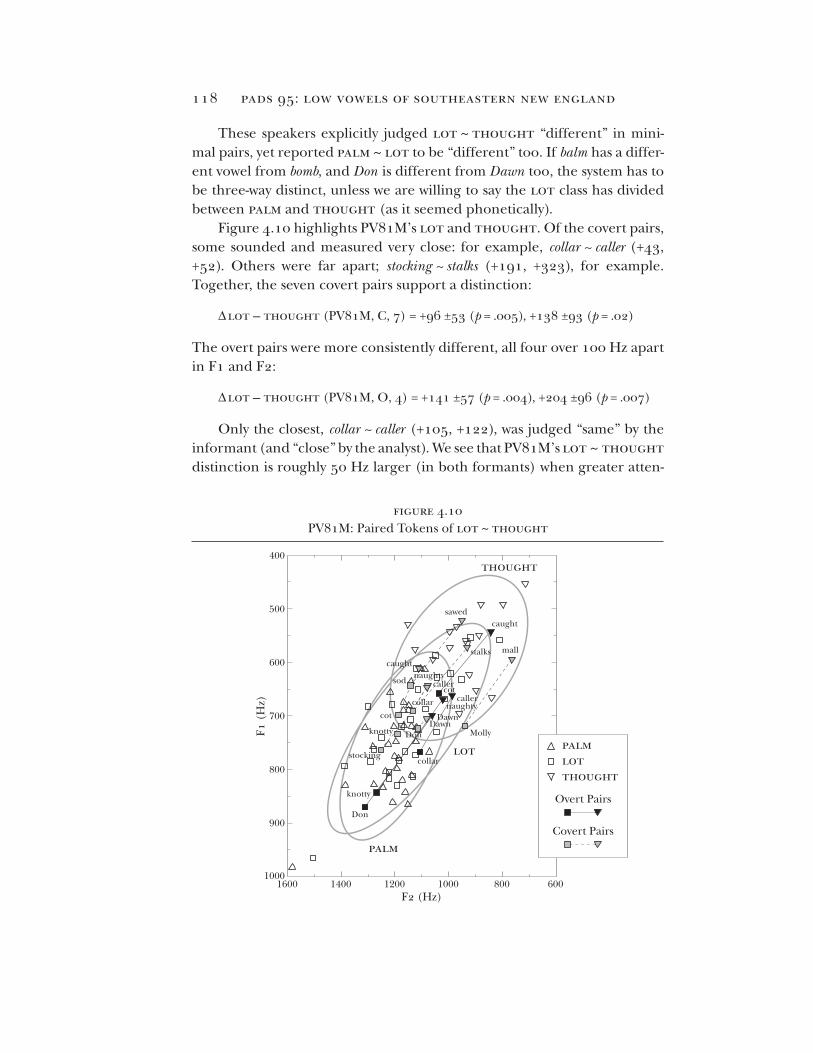
figure 4.10
F1 (
Hz)
F2 (Hz)
500
700
14001600 1200
600
400
800
900
1000 800 6001000
thought
lot
palm
Don
knotty
stocking
knotty
cot
collar
Don
DawnDawn
mall
Molly
collar
sod
caught
cot
caught
callernaughty
stalks
sawed
naughtycaller
palmlotthought
Overt Pairs
Covert Pairs
1 1 E; ]?[&I)S {)ESZIJ()\A] \f()\AlI§IJS ()P‘ S()[l17I{]Z[&S'F]ZI{PJ PJ]Z\A] IZDJ(}IJ[&PJI)
These speakers explicitly judged LOT ~ THOUGHT “different” in mini-
mal pairs,yet reported PALM~ LOTto be “different” too. If balmhasa differ-ent vowel from bomb,and Don is different from Dawn too, the system has tobe three-way distinct, unless we are willing to say the LOT class has dividedbetween PALMand THOUGHT (as it seemed phonetically).
Figure 4.10 highlights PV81M’sLOTand THOUGHT.Of the covertpairs,some sounded and measured very close: for example, c0llar~ caller (+43,+52). Others were far apart; stocking~ stalks (+191, +323), for example.Together, the seven covert pairs support a distinction:
ALOT —THOUGHT (PV81M, C, 7) = +96 +53 (1%):.005), +138 +93 (1%):.02)
The overt pairs were more consistently different, all four over 100 HZ apartin F1 and F2:
ALOT —THOUGHT (PV81M, O, 4) 2 +141 +57 (19: .004), +204 +96 (1%):.007)
Only the closest, collar ~ caller (+105, +122), wasjudged “same” by theinformant (and “close” by the analyst). We seethat PVS1M’s LOT ~ THOUGHTdistinction is roughly 50 HZ larger (in both formants) when greater atten-
FIGURE 4.10PV8 1M: Paired Tokens 0f LOT ~ THOUGHT
400 . I . I . I . ITHOUGHT
V7
500 - -
600 - -
Ti?
5 700— _HLnA PALM
El LOT800 - V THOUGHT
Overt Pairs
H900— ,Covert Pairs
PALM D' ' ' VE
ZS
1000 . I . I . I . I .1600 1400 1200 1000 800 600
F2(Hz)

The Geographic Study 119
tion is paid to it, a greater shift than ABS62M made. Also note that evenABS62M’s closest pairs were further apart than PV81M’s most distinctpairs.
Things become more complicated with PALM.Based on his covertPALM~ LOTpairs, shownin ■gure4.11 (top), one would think PV81M hadmerged the two classes.Each of the seven pairs is close together. Other than
cardbeing 104 HZ front of cod,none of the formant differences exceeds41 Hz, and the differences go in all directions. The paired t—testindicates
merger:
APALM—LOT (PV81M, C, 7) = +9 +21 (p=.31), +17 +42 (lb: .37)
Acoustically, the PALM~ LOT difference is inconsistent, and muchsmaller than the contextual effects separating, for example, lager and loggerfrom calmer and comma.But PV81M’s covert PALMand LOT did not sound
as close together as the F1/ F2 measurements suggest, nor did many exam-ples observed in his spontaneous speech. Some of PV81M’s LOT tokens
sounded noticeably rounded—unlike those of MAIN speakers—whilehisPALM tokens never did. Table 4.6 contrasts the nonsigni■cant measuredformant differences with the auditory impressions gained after repeatedlistening.
Considering the small formant differences, it is likely that the per-ceptual difference between the pairs derivesfrom other acoustic proper-ties, including rounding, a property noted in most of the LOTwords here,although it is dif■cult to measure (Johnson 2000) and even to accurately
hear (Ladefoged 1960).Recall that ABS62M showeda 50-HZF1 differencebetween most PALM and LOT pairs; however, those pairs sounded identical,
evenon repeatedlistening. For PVS1M,while the formant valueswere evencloser, a subtle difference was audible in some cases.
When PV81M repeated some of the PALM~ LOTpairs in the “overt”condition, the difference increased dramatically, as seen in ■gure 4.11(bottom). For two examples of balm ~ bomband lager~ logger,LOT is nowhigher and/ or backer than PALM, not just rounder.
Eventhe closestof thesefour pairs, balm2~ bomb2,is still fairly far apartin F2 (+5, +153); the most different one, lager2 ~ logger2,is very distinct in
F1 and F2 (+220, +376). Becauseof this variation, the combined result isnot quite statistically signi■cant:
APALM~ LOT (PV81M, O, 4) = +122 i141(1b = .07), +195 i193 (X7: .05)
The greater distinctions made by PV81M in the overt contexts mayinvolve a conscious effort to distinguish the pairs, but this is probably only

figure 4.11
F1 (
Hz)
F2 (Hz)
500
700
14001600 1200
600
400
800
900
1000 800 6001000
F1 (
Hz)
F2 (Hz)
500
700
14001600 1200
600
400
800
900
1000 800 6001000
thought
lot
palm
logger
thought
lot
palm
logger2
lager
card coddoctor
darkness
heart
hot
bomb
balm
harderhottercomma
calmer
lager2
logger
lager
balm
bomb
bomb2balm2
palmlotthought
Covert Pairs
palmlotthought
Overt Pairs
120 PADS 952 LOW VOWELS OF SOUTHEASTERN NEW ENGLAND
PV81M: Paired Tokens 0f PALM ~ LOTFIGURE4.11
400 . . . . ITHOUGHT
500— V V —V VV
_V V VEI
_Vloggerv
€
600—MS? v _lageru D UV
'cardA—-—g§
%V V ':7 doctorn E]
VI hear El
v 700— ,' . WEE V —I-I darkness A
L“_ I:IA hoAbalrEl
éEI[an Ill—HA LOT A PALM
800—El hELeZBAhgder I:I LOT
comma
A A [F V THOUGHT
_
EéilmeA
.III
A A Covert Palrs
A—- - - El900 -
— PALM -El
1000 . | . | . | . |
1600 1400 1200 1000 800 600
F2 (Hz)
400 ' I ' I ' I ' ITHOUGHT
500— V V —
600 - -
if
5 700— _HLn
_ A PALM
800_I3 I: LOT
V THOUGHT
_ Overt Pairs
H900 -
- PALM _El
A1000 . I . I . I . I
1600 1400 1200 1000 800 600
F2(Hz)

table 4.6
Pair ∆F1 ∆F2 Impression (live) Impression (repeated)balm ~ bomb 15 –21 ?? samecard ~ cod 6 104 quite differentcalmer ~ comma 16 22 differentdarkness ~ doctor 39 10 differentheart ~ hot –29 –8 sameharder ~ hotter –7 –31 different?lager ~ logger 25 41 different same?
The Geographic Study 121
TABLE4.6
PV8 1M: Acoustic Differences and Auditory Impressions
of Covert PALM~ LOT Pairs
PALM-LOT Pair AF} AFZ Impression (live) Impression (repeated)
balm ~ bomb 15 —21 P? samecard~ cod 6 104 quite differentcalmer~ comma 16 22 different
darkness~ doctor 39 10 differentheart ~ hot —29 —8 same
harder ~ hotter —7 —31 different?
lager~ logger 25 41 different same?
possible because he possessesan underlying knowledge of the difference
between the three word classes.ABS62M and NT86F did separate theirmerged vowels slightly in the overt context, but never judged them distinct,
asPV81M did.Especiallyin the overt PALM~ LOTcontext, PV81M’s LOTentered the
acoustic territory of THOUGHT.But in the overt LOT~ THOUGHT context,for example, someLOT’swerevery PALM-like.
Figure 4.12 summarizesthe overt and covert tokens of the three wordclasses, with means and whiskers (which extend to :1 standard deviation
from the mean for each formant). The thicker, bolder symbols representthe overt minimal pair context.
The pattern from the covert pairs is PALM= LOT96THOUGHT(MAIN); tokens from spontaneous speech (not shown) look similar. But
under overt focus, the mean of LOTmoves into the middle, suggesting
PALM96LOT96THOUGHT(3-D).As the token clouds and whiskersshow,LOTnow extends across a wide, overlapping area, rather than haVing its ownintermediate quality.
One possibility is that the PALM~ LOT distinction is not natural, or notnative, to PV81M’Sphonology, but that he consciously imitates it, beingfamiliar with the ENE systemfrom his summersin Maine or from contactsmuch closer by.
I would argue instead that PALMand LOTare underlyingly distinct forPV81M. However, he does not typically distinguish them with signi■cantF1/ F2 differences, but with other cues, such asrounding. He seems to par-tially suppressthe distinction in lessself-consciouscontexts;this maybe dueto contact with MAIN speakers—forexample, his wife from Rhode Island.When attention is called to the distinction, he recalls and reproduces itaccurately.

figure 4.12
F1 (
Hz)
F2 (Hz)
500
700
1400 1200
600
800
550
750
650
850
9001000 800 6001500 1300 1100 900 700
450
palmlotthought
Overt Means
Covert Means
1 22 PADS 952 LOW VOWELS OF SOUTHEASTERN NEW ENGLAND
FIGURE4.1 2PV8 1M: Means of PALM, LOT, and THOUGHT
450
500 — —
550 -
600 - —
Q 650 -
EI; 700_ ' A PALM
/\ |:| LOT750 ' — V THOUGHT
Overt Means
+++Covert Means
850- 1%41}4?.
900 | I | I | I | I1500 1400 1300 1200 1100 1000 900 800 700 600
F2(Hz)
Other seniors exhibited the 3-D pattern more clearly than PV81M, yetthe phonetic impression of their vowels was similar to his. This makes it
more likely that he is 3-D aswell.
4.3.2.4. A Probable3—DPattern. SOS5F produced a clearer 3-D pattern,although her low vowel behavior—especially regarding LOT—was still notentirely straightforward. For LOT~THOUGHTpairs (■gure 4.13), SOS5Fmade a sizabledistinction when the pairswere covert, especiallyin F2. Sheshowed an even larger difference in both formants when the pairs wereovert:
ALOT —THOUGHT (SO85F, C, 8) = +85 i75 (j? = .03), +295 i164 (p = .004)
ALOT —THOUGHT(SO85F, O, 7) 2 +140 i73 (p = .004), +389 i146 (p = .0007)
The pair Don ~Dawn again behaved exceptionally; it sounded “close”
to both speaker and analyst. Acoustically, it was only close (+38, —61) onone occasion (the speaker repeated many pairs). All the other pairs werejudged “different”; indeed, some measured extremely far apart.
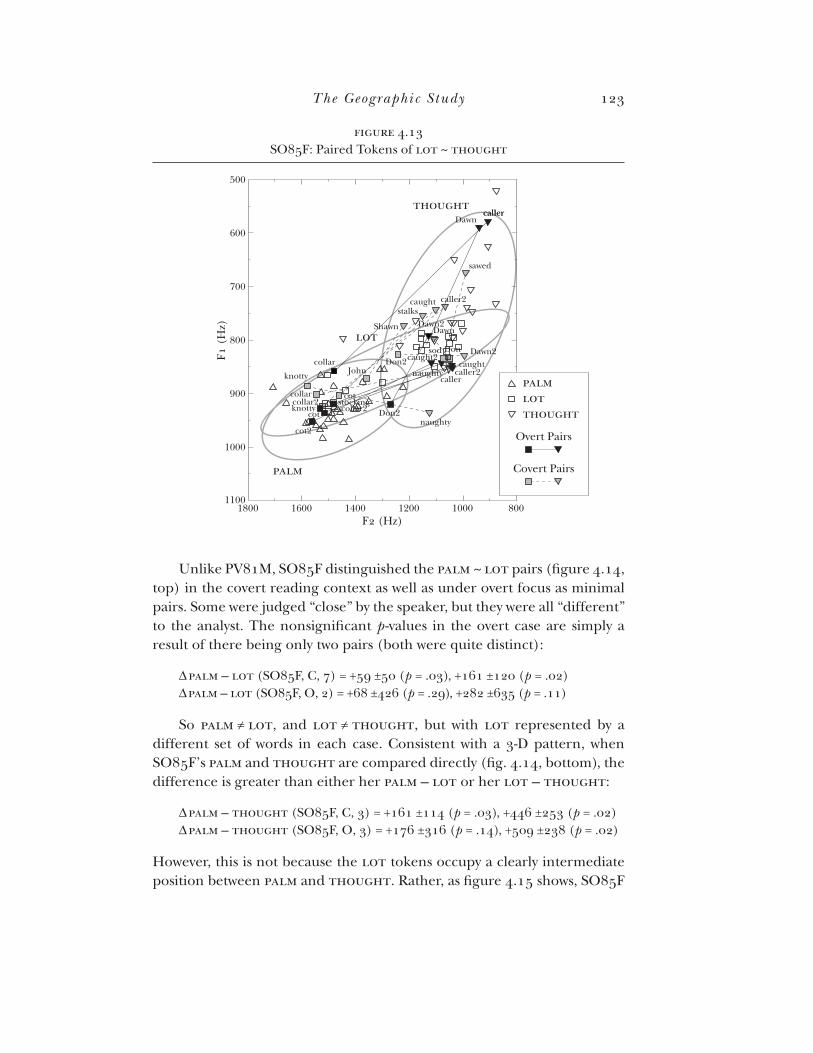
figure 4.13
F1 (
Hz)
F2 (Hz)
600
800
16001800 1400
700
500
900
1000
1200 1000 8001100
callercallerDawn
sawed
caller2caughtstalks
Shawn
Don2John
collar
knotty
collar
Dawn2
Dawn2Dawn
sod
naughtyDon2
cot2
caller2caller
caught2caught
naughty
Don
cotstockingcollar2
collar2knotty
cot
thought
palm
lot
palmlotthought
Overt Pairs
Covert Pairs
The Geographic Study 123
FIGURE4.13SO85F: Paired Tokens of LOT~ THOUGHT
500 I I I I IV
' THOUGHT -callerDawn
600 - _
700 - _
V
’35
800 - _I;
0? Dawn?
A PALM
900_ I:I LOTC V THOUGHT
_ ’A naughtyCOQ
A A Overt Pairs1000 - I V
_PALM Covert Pairs
D - - - V
1100 . I . I . I . I . I1800 1600 1400 1200 1000 800
F2 (Hz)
Unlike PV81M,SOS5Fdistinguished the PALM~ LOTpairs (■gure414,top) in the covert reading context aswell as under overt focus as minimalpairs. Some were judged “close” by the speaker, but they were all “different”
to the analyst.The nonsignificant p-valuesin the overt caseare simply aresult of there being only two pairs (both were quite distinct):
APALM —LOT (SO85F, C, 7) = +59 i50 (p = .03), +161 i120 (p = .02)
APALM—LOT(SO85F, O, 2) = +68 i426 (p = .29), +282 i635 (p = .11)
So PALM¢ LOT, and LOT ¢ THOUGHT, but with LOT represented by adifferent set of words in each case.Consistent with a 3-D pattern, whenSOS5F’s PALMand THOUGHTare compared directly (fig. 4.14, bottom), thedifference is greater than either her PALM—LOT or her LOT—THOUGHT:
APALM —THOUGHT (SO85F, C, 3) 2 +161 i1 14 (p = .03), +446 i253 (p = .02)
APALM —THOUGHT (SO85F, O, 3) 2 +176 i316 (p = .14), +509 i238 (p = .02)
However, this is not because the LOT tokens occupy a clearly intermediate
position betweenPALMand THOUGHT.Rather,as■gure4.15 shows,SOS5F

figure 4.14
F1 (
Hz)
F2 (Hz)
600
800
16001800 1400
700
500
900
1000
1200 1000 8001100
F1 (
Hz)
F2 (Hz)
600
800
16001800 1400
700
500
900
1000
1200 1000 8001100
thought
palm
lot
thought
palm
lot
logger
cod logger
bombbomb
hot2card
harder
heart2heart
hotter
hot
calmer
lagerbalm
balm
comma
lager
pauseraw
bomb
aw
raw
pauseaw
RahPa’s
Pa’sah
ah
Rah
palmlotthought
Overt Pairs
Covert Pairs
palmlotthought
Overt Pairs
Covert Pairs
1 24 PADS 952 LOW VOWELS OF SOUTHEASTERN NEW ENGLAND
FIGURE4.14SO85F: Paired tokens of PALM~ LOT and PALM~ THOUGHT
500
600
700
900
1000
11001800
500
600
700
F1(
Hz)
00 8
900
1000
11001800
F1(
Hz)
00 8
A PALM
El LOT
V THOUGHT
Overt Pairs
A—ICovert Pairs
A - - - El
I800
A PALM
El LOT
V THOUGHT
Overt Pairs
A—VCovert Pairs
A - - - V
I800

figure 4.15
F1 (
Hz)
F2 (Hz)
700
16001800 1400
600
550
800
900
750
650
850
950
1200 1000 8001700 1500 1300 1100 9001000
palmlotthought
Overt Means
Covert Means
The Geographic Study 125
FIGURE4.15SO85F: Means Of PALM, LOT, and THOUGHT
550 I I I I I
600 - -
650- -
700 - —
ZS IHXLDJ
D LCYF
‘7 'TI{()IJ(}IIT
850-
900— Overt Means
+++Covert Means
141+1000 . I . I . I . I . |
1800 1700 1600 1500 1400 1300 1200 1100 1000 900 800
F2(Hz)
950-
seems to have a split LOT. Both covert and overt means indicate a 3-D sys-tem, but few tokens of LOT are near its mean. About half are clustered
near the mean of PALM,and half near the mean of THOUGHT.lmportantly,
LOT never achieves the extreme values of the frontest PALMor the highest
THOUGHT.But, at least in terms of F1 and F2, LOT certainly overlaps withtypical realizations of both PALMand THOUGHT.
In table 4.7, 33 tokens of LOTwere sorted into columns by phoneticrealization and into rows by following segment type. The tokens of LOT
were divided into three groups (indicated by the diagonal dotted lines in■gure 4.15). The 14 PALM-like tokens are those where F1 + F2/2 > 1580
(the mean of PALMwas1674 by this measure); the 15THOUGHT-liketokens
are those where F1 + F2/2 < 1415 (cf. 1285 for the mean of THOUGHT).Only four tokens fell between 1415 and 1585, even though the mean of
LOT,1507,wasin this range.We seethat the phonetics of SOS5F’SLOTis fairly predictable by the
nature of the following consonant. With one exception, words where LOT
was followed by an underlyingly voiceless stop were realized fairly low and/
or front—more like PALM.All words where a voiced stop followed were real-

table 4.7
Following Segment F1 + F2/2 (Hz) > 1580 (≃ palm) 1580–1415 < 1415 (≃ thought)Voiceless Stop cot (COOa) hot (CCb) hotter (C) knotty (CO) stocking (C) bock (O)
Voiced Stop cod (C) sod (C) logger (CO)
Fricative bothers (C) Oz (OOOa)
Nasal comma (C) bomb (CO) John (C) con (CCb) Don (COb) Don (COb)
Lateral collar (COCOb) doll (C)
note: Bold tokens are close to paired word.a. SO85F repeated this minimal pair in judging it.b. SO85F read the card containing this word twice.
126 PADS95: Low VOWELSOFSOUTHEASTERNNEw ENGLAND
TABLE4.7S085F: Realization of LOT by Following Segment
Following Segment F1 + F2/2 (Hz)
> 1580 (2 PALM) 1580—1415 < 1415 (2 THOUGHT)Voiceless Stop cot (COOa)
hot (CCb)
hotter (C)
knotty (CO)
stocking (C) bock (O)
Voiced Stop cod (C)sod (C)
logger (CO)
Fricative bothers (C) Oz (OOOa)
Nasal comma (C) bomb (CO)
John (C) con (cob)
Don (cob) Don (cob)
Lateral collar (COCOb) doll (C)
NOTE:Bold tokens are close to paired word.
a. S085F repeated this minimal pair in judging it.b. S085F read the card containing this word twice.
ized rather high and/ or back—more like THOUGHT.Most prenasal tokens
were like THOUGHT,while the small prelateral group was split, with four
examples Of a front vowel before intervocalic /l/ in collar and a far-backtoken before ■nal /1/ in doll.
This phonetic conditioning causessome LOTwords (bolded in table4.7) tO end up close tO their paired words, while Others end up very differ-
ent. For example, hot is very close tO the PALMword hean‘ (—22,—83),and
sodis quite close tOthe THOUGHTword sawed(+160, +83). But becauseOfthe same phonetic effects, cot is PALM-like and very far from caught (+161,
+359),while coolis THOUGHT-likeand far from card(—54,—356).However, even the PALM-like LOTS are nOt identical tO the actual PALMS,
and the THOUGHT-like LOTSare different from the real THOUGHTS.Thetoken clouds overlap substantially, but when appropriate pairs could be
compared, differenceswere audible if nOt acousticallydemonstrable.TO describe the low vowel system Of SOS5F, we could saythat there is a
three-way distinction, and that one Of the categories, LOT, has a wide rangewhich overlaps considerably with the Other categories, PALMand THOUGHT.This would predict the minimal pair contrasts that we (mostly) ■nd, but itwould nOt explain the bimodal distribution Of LOT in phonetic space.

The Geographic Study 127
Another view is that SO85F has only two lowvowels, PALMand THOUGHT.Instead of LOThaving merged with one or the other of them, asin most dia-lectsnearby,perhapsit hassplit betweenthem, on mainly phonetic grounds.This would explain the phonetic dispersion of the LOT group, but it would
not predict contrasts to be maintained between PALM-like LOT words and
PALMor betweenTHOUGHT-likeLOTwords and THOUGHT.Yetthere is someacoustic evidence for the ■rst type of contrast (hot ~ heari), and convincingevidence for the second (sod~ sawed).
Or we could imagine a distinct LOTclasswhich alternatesbetween thephonetic positions of PALMand THOUGHT.Herold (1990, 186—200)dis-
cussesthis possibility regarding the Belfast data of Harris (1985), who sug-gests that word classeswhich partially overlap can remain distinct. Heroldwonders if even complete phonetic overlap might not necessarily equate
to merger:
word-class identity may be maintained by patterns Of alternation within a phonetic
continuum.. .
and variably neutralized distinctions acquired, as long as each Of the
phoneme-classes involved has a different probability of being realized with aspeci■c phonetic value. [1990, 206—7]
But with SOS5F, individual words are quite consistent in their phoneticrealizations, making it unclear how they could be acquired as members of
an alternating class. With more data, we might notice that individual LOTwords did alternate between PALM-like and THOUGHT-like realizations. Evenif not, it seems the PALM-like LOT words are not learned as tokens of PALMand the THOUGHT-like LOTwords are not real THOUGHTs.Small but reliablephonetic contrasts are maintained, establishing an unusual bimodal LOTclass,and with it the 3-D system.
4.3.2. 5. Summary of Senior Citizens.Figure 4.16 displays the tokens, means,and standard deviation whiskersfor the four senior citizen speakers.The■gure uses one set of axes for the two male speakers and another for thefemales, whose axes are shifted and expanded—that is, the plot is shrunk—
by 20%.Though it is not possible to compare speakers precisely without nor-
malizing, A13862M clearlyhasthe greatestdistancebetweenphonemes.His
THOUGHTis high and ingliding, typical of Mid-Atlantic speech.lts nucleusis far removed from his merged, overlapping PALM= LOT.
There is less distance between NT86F’s PALM and her merged
LOT = THOUGHT, but the difference is still substantial. The PALM vowel is in
a further front position than for any other speaker.The 3-D speakers, PVS1M and SOS5F, have three vowels in roughly the
samephonetic spaceasthe others’ two.The PALMisnot particularly fronted,

figure 4.16
F1 (
Hz)
F2 (Hz)
400
900
500
600
700
800
1400 1200 1000 800 600F1
(H
z)F2 (Hz)
500
1000
600
1800
700
800
900
1600 1400 1200 1000
F1 (
Hz)
F2 (Hz)
400
900
500
600
700
800
1400 1200 1000 800 600
F1 (
Hz)
F2 (Hz)
500
1000
600
1600
700
800
900
1400 1200 1000 800
ABS62M NT86F
PV81M SO85F
palm lot thoughtOvert Means Covert Means
128 PADS95: Low VOWELSOFSOUTHEASTERNNEw ENGLAND
FIGURE4.16
Senior Systems:ABS62M (MAIN), NT86F (ENE),
PV81M (possible 3-D), and SO85F (probable 3-D)
ABS62M NT86F
400 I I | I | . | 500 . . I . I .
500—
v
— 600— —
A600 - — A
700 — _N N
I—I I—I
L“700— — L“800— —
800 — — 900 — —
900 | I | I | I | I 1000 I | I | I | I |
1400 1200 1000 800 600 1800 1600 1400 1200 1000
F2 (Hz) F2 (Hz)
PV8 1M 508517400 . . I . I . 500 - I I I I
500 — — 600 — —
A600 - — A
700 — _N N
I—I I—I
L“700— — L“800— —
800 — — 900 — g ; —
900 | I | I | I | I 1000 | I | I | I | I1400 1200 1000 800 600 1600 1400 1200 1000 800
F2 (Hz) F2 (Hz)
A PALM El LOT V THOUGHT
+ + -+- Overt Means ■- 4:]- ?- Covert Means
nor is THOUGHTvery high. For PV81M, all word classesshift betweencon-texts, but the most notable movement is of LOT.
In general, pairs had greater acousticdifferences in the overt context.This maybeunsurprising if the twoword classesinvolved areclearlydistinct.But even when they are essentially merged, aswith NT86F’S LOT ~ THOUGHT,they may still be treated differently on a “micro” level.

×
The Geographic Study 129
4.3.3. ACOUSTICANALYSISOFYOUNGADULTS.Many young adults in the focus
area had “unclear” low vowel systems.Those selected with “traditional” two-vowel systemswere still less clear-cut than their senior counterparts.
ABSz■F, a 26-year-old woman from South Attleboro, was still clearly
MAIN. A 30-year-old man from North Attleborough, NAgOM, wasjudged
impressionistically as clearly ENE, but acoustic analysisshowed extensiveoverlap of PALMand LOT = THOUGHT.While his formant differences weresigni■cant, he probably represents phonetic progress toward 3-M.
NA19F,a 19-year-oldwoman from North Attleborough, had the three-way merger unambiguously. Her low vowels made a very different auditoryimpression than NAgOM’s, reinforced by her pronouncing and perceiving
all the minimal pairs sheread as“same.”
4.3.3.1. The MAIN System,Preserved.ABS26F is 36 years younger thanAB862M and also from South Attleboro. Her MAIN low vowel system is not
as extreme asABS■zM’s, but it is essentially congruent.For the overt LOT~ THOUGHTpairs—all of which wereauditorily judged
“different”—she approaches ABSS2M’s size of distinction; her covert pairs
are closer but still de■nitely distinct:
ALOT —THOUGHT(ABS26F, O, 5) = +281 i224 (p = .03), +335 i183 (p = .006)
ALOT —THOUGHT(ABS26F, C, 8) 2 +162 igo (p = .004), +278 156 (p = 8 x 10—6)
Figure 4.17 shows that AB26F’s highest tokens of LOT (e.g., sod) acousti-
callyoverlap her lowesttokens of THOUGHT(e.g.,stalks).However,eventheclosest minimal pairs, such as the two examples of knotty ~ naughty, differ by
a comfortable margin of 100 Hz in F1 and 150 HZ in F2. ABS26F’sovertinstances of Don ~Dawn are very widely separated, approximately 450 HZ
apart in both formants; these proper names are again behaving exception-
ally.The PALM~ LOT pairs of ABSz■F (see ■gure 4.18) illustrate merger
well. The covert pairs exhibited moderate (100—200 Hz) PALM~ LOT differ-
ences, but without any common trend:
APALM —LOT (ABS26F, C, 7) = —25i89 (p = .52), +22 i9?) (p = .58)
APALM —LOT (ABS26F, O, 1) = +9, —43
The acoustic data support ABSz■F having a MAIN system, PALM= LOT 96THOUGHT. As she read the cards, she reacted to her own accent, in anamused and slightly troubled way. It was especially her high back THOUGHTsthat struck her, and some “correction” of THOUGHTmay account for itswide phonetic range on ■gure 4.17 (compare ABSS2M’s tight cluster on■gure 4.6). But her correction of THOUGHTdoes not go so far as to confuseit with PALM= LOT.

figure 4.17
figure 4.18
F1 (
Hz)
F2 (Hz)
750
800
850
900
950
1700 1300
1000
1050
1100
10001400 11001500 12001150
palm
card
lot
cod
hotterlager
logger
doctorsheart
comma
balm
darkness
bomb
hotlogger
lagercalmer
harder
palmlotthought
Overt Pairs
Covert Pairs
F1 (
Hz)
F2 (Hz)
600
800
16001800 1400
700
500
900
1000
1200 1000 800
1100
Dawn2 thought
lotpalm
sawed
caughtDawnDawn
caught
Shawn
callercaller
mall
Don
Don
Molly
naughty
naughty
John knotty
collarknotty
Don2 collarcot
stockingcot
sod stalkspalmlotthought
Overt Pairs
Covert Pairs
130
FIGURE4.17
PADS 952 LOW VOWELS OF SOUTHEASTERN NEW ENGLAND
ABS26F: Paired Tokens of LOT ~ THOUGHT
I I I I I I I
500 - Dawn? THOUGHT -
600 _sawed
_
_caught
700 — —
if _ _5
800 — _I;
_A PALMEl LOT
900— V THOUGHT
' Overt Pairs
1000 —Covert Pairs
_ D - - - V
1100 — —
I | I | I | I | I1800 1600 1400 1200 1000 800
F2 (HZ)
FIGURE4.1 8
ABS26F: Paired Tokens of PALM~ LOT
750 I . I
V%
V800 — —
card V Ag
darkness A E5850 - ‘\ -
II \‘ D\
y,’ El \\ A900 - , ‘\ A _I
I El El \:I‘ ,' El
%alm\\
E I El / ‘v 950 - E‘ V / c mma “A 'T I bomb I DLn :1 I VAIA
—4:1logger/E] COd A PALM
1000 _heart£.lJ—'hot N12■erEl LOT
doctorsEI E] calmer
lagerAAEI A V THOUGHTLOT // [I hotterI , .1050— A ’I A,‘ Overt Palrs
1’,
Ogger I
1100 _I" Covert Pairs
El ,’ PALM A ___{IA harder
11 50 | I | I |I
1700 1500 1400 1300 1200 1100 1000
F2(Hz)

figure 4.19
F1 (
Hz)
F2 (Hz)
700
500
600
110012001400 1300 900
550
650
1000 800
thought
lotpalm
sawedstocking
cot
caughtDawn
Don
naughtyknotty
knotty
naughty
cotcaught
cot2
caught2
Dawn
Don
Molly
mallcaller2
colar2
caller
colar
colarcaller
palmlotthought
Overt Pairs Covert Pairs
The Geographic Study 131
4.3.3.2. TheENE System,Threatened?NAgoM was considered from auditoryimpressions to be a perfectly good example of the ENE system survivingclose to the linguistic boundary. However, acoustic analysis reveals that his
pattern, PALM 96LOT = THOUGHT, is not as robustly maintained as it was for
NT86F. Figure 4.19 showsthe complete overlap of the LOTand THOUGHTword classes.Neither the seven covert pairs nor the six overt pairs reflected
a signi■cant distinction (although the small shift between the two styleswasin the direction of the usual distinction):
ALOT —THOUGHT (NAgOM, C, 7) = —16i24 (p = .15), —4i67 (p = .90)ALOT —THOUGHT (NAgOM, O, 6) = +16 igo (p = .23), +23 i57(1'b = .36)
Of the overt pairs, only the second repetition of cat~ caught (+69, +107)sounded different to the analyst. The subject also heard collar ~ caller and
Don ~Dawn as different—“the 0, as opposed to the a”—but their acoustic
measurementswerevery close.Recall that for NT86F, whose LOTand THOUGHTwere also merged,
PALMwas a very distinct vowel. Although there was some overlap at the
extremes, the average PALM~ LOT pair differed by more than 100 Hz in
FIGURE4.1 9NAgOM: Paired Tokens of LOT~ THOUGHT
A PALM_ _Overt Pairs Covert Pairs
El LOT500 H n---v .V THOUGHT
550 -THOUGHT V _
,sawecl
stocklng W _V Don Dawn
A “~:‘~\ Evv Molly
1x “x? V/ J:A
C0El21% ‘ |:| , , xN El \\ |:|
, , , ,a600 _
‘\ ,’ colar caught? 26_
I; \\A
[I]Cgi■l■er§
\mall
\v’ Dawn caller
A AVcaught caller
A A naughty
naughty ’ I Ecaug
, ’ cot650- A
knotzk.—knotty
AA
cot2 LOT
PALM
700 . I . I .1400 1300 1200 1100 1000 900 800
F2(Hz)

×
132 PADS95: Low VOWELSOFSOUTHEASTERNNEw ENGLAND
F1 and more than 300 HZ in F2, producing a clearly audible distinction.For NA3OM, the auditory impression wasof a more moderate distinctionbetween PALM and LOT = THOUGHT, and the acoustic difference is smaller
than NT86F’s,with substantialoverlap.The top panel of ■gure 4.2Oplots ■vePALM~ LOTpairs, four covert
and one overt (NA3OM pronounced /l/ in balm, disqualifying that pair).There is a consistent F2 difference of 150—200 Hz, except for one pair,
calmer~comma,where it is only 61 HZ. The F1 difference is smaller, lessconsistent, and not statistically signi■cant:
APALM—LOT(NA3OM,C,4) = +21 +59 (p = .34),+141 +85 (p = .02)APALM —LOT (NA3OM, O, 1) = +8, +185
The bottom panel of ■gure 4.2O plots three PALM~ THOUGHTpairs inboth covert and overt conditions. We observe a regular difference in bothformants, but greater in F2:
APALM —THOUGHT (NA3OM, C, 3) = +67 i33 (p = .02), +173 i249 (p = .10)APALM —THOUGHT (NA3OM, O, 3) = +70 i108 (p = .1 1), +198 i333 (p = .13)
The covert and overt pronunciation of each pair is almost identical;the differences between pairs can be considered phonetic-environmenteffects.The word-classdifferences for PALM~ THOUGHTare slightly largerthan those for PALM~ LOT,which may alsobe a phonetic effect. It is likelythat the morpheme-f1nal PALM words (e.g., ah, Pa ’s) used in the comparison
with THOUGHTare lower and fronter than the PALM’s(e.g., calmer)used inthe comparison with LOT.
If the PALM~ LOT and PALM~THOUGHT pairs are combined in onetest,we seethat NA3OMhasonly half NT86F’s distancebetweenPALMandLOT = THOUGHT,but a distinction certainly still exists:
APALM, LOT —THOUGHT (NA3OM, CO, 11) = +46 i26 (p = .003), +169 +55
(i9=5><10—5)
Compared with the seniors, the two young adults above have phoneti-
cally weaker distinctions in their low vowels.The MAIN distinction, with ahigh back THOUGHT, was dramatic for the older generation (ABS62M) and
is still fairly robust (ABS26F). The ENE distinction, with a low front PALM,
was robust (NT86F) and is now somewhat less healthy, but in no obviousdanger (NA3OM).
4.3.3.3. “I Want to SayIt Dz'■erently,but I Can’t”: The 3—MPattern 0fNAI9F.Another North Attleborough native, eleven years younger than NA3OM,had a very different low vowel system. NA1 9F did not have time to read

figure 4.20
F1 (
Hz)
F2 (Hz)
700
500
600
110012001400 1300 900
550
650
1000 800
F1 (
Hz)
F2 (Hz)
700
500
600
110012001400 1300 900
550
650
1000 800
thought
logger
lotpalm
logger
lager
lagercomma
calmerheart
hotdoctors
darkness
thought
lotpalm
pause
awaw
Rah
raw
ah
ahPa’s
Pa’s
Rah
rawpause
palmlotthought
Overt Pairs Covert Pairs
palmlotthought
Overt Pairs Covert Pairs
The Geographic Study 133
FIGURE4.20NAgoM: Paired Tokens of PALM~ LOT and PALM~ THOUGHT
A PALMOvert Pairs Covert Pairs
El LOT500 H A- - - - {I |
V THOUGHT
550 -THOUGHT
V _
darkness If V
A‘ _ g »
5' vv V___________ doctors V Ivhot
1
A‘ ‘Er ,EI ogger
V D“7}: ,IE'5
600 — I, ’ El 1,E’ logger
_
,k/ A AV ’/,
heart A calmer Ah x: ’ /
E lager‘E
650 - comma _A A E
ElAA
El LOTPALM
700 . I . I .1400 1300 1200 1100 1000 900 800
F2(Hz)
A PALM. .
El LOTOvert Pa1rs Covert Pa1rs
500 H A- - - - V |V THOUGHT
550 _THOUGHT
pause _raw
V
AIf
Vpause El
E El
v 600 —V
E El —I—I aw aw[-Y-I ,V’
650 - -
LOT
PALM
700 . I . I .1400 1300 1200 1100 1000 900 800

1 34 PADS 95' LOW VOWELS OF SOUTHEASTERN NEW ENGLAND
every card, but read enough pairs to suggest she distinguishes neither
LOT ~ THOUGHT nor PALM~ LOT. Supplemented by unpaired readingtokens and some from spontaneous speech, her data mostly pointed to athree-way-merged(3-M) system.Someof her tokens, including those of aband aw, were harder to interpret.
Except for one case of Don ~Dawn, the pairs were judged “same” bythe analyst; all were “same” for the speaker. NA19F was aware that others
distinguish LOT~ THOUGHT.When a Rhode Island customer demonstratedthe distinction, NA19F (a tanning salon employee) found it amusing andimitated it. But asshe heard herself reading the cards and pronouncing the
pairs virtually the same,NA19F became almost wistful about her mergedstatus. She remarked in mock-complaint, “It’s like, I want to say it differ-
ently, but I can’t!”Acoustically, the three word classesalmost completely overlapped, each
having a wide range. For the LOT~ THOUGHT pairs, most differed in the
usual direction of distinction, but others differed in the opposite direction(■gure4.21, top left). There wasno signi■cantoverall difference in F1 orF2, even when covert and overt pairs were combined together:
ALOT —THOUGHT (NA19F, C, 5): +13 i102 (p = .75), +48 i227 (p = .60)
ALOT —THOUGHT (NA19F, O, 4) = +56 i152 (p = .33), +41 i155 (p = .47)
ALOT —THOUGHT (NA19F, CO, 9) = +32 i663 (p = .30), +44 i1 10 (p = .38)
The only PALM~ LOT pairs were balm ~ bomband lager~ logger.NA19Fproduced one covert and one overt example of each, plus another overtbalm ~ b0mb.As with LOT ~ THOUGHT, some pairs were close, while othersdiffered by up to 200 HZ, but the differences went in either direction (■g.
4.2 1, top right). There was no consistent PALM~ LOT difference:
APALM —LOT (NA19F, C, 2) = —23i133 (p = .28), —9i260 (p = .75)
APALM —LOT (NA19F, O, 3) = —69i326 (p = .46), —9i252 (p = .89)
APALM —LOT (NA19F, CO, 5) = —50i120 (p = .31), —9+91 (p = .80)
If PALM= LOT and LOT = THOUGHTfor NA19F, one would not expect
a difference between PALM~ THOUGHTpairs. But in fact, the pair ab ~ aw(“doctors ask you to say ah” vs. “aw, how cutel”) was pronounced some-what differently, three times over.The one covert and two overt instancesof ab ~ awdiffered in the samedirection and to a similar extent (■g.42 1,bottom left). Together they yield a signi■cant t—testresult:
APALM —THOUGHT (NA19F, CO, 3) = +92 i21 (p = .003), +202 i88 (p = .01)
The bottom right panel of ■gure 4.21 showsthe meansof the pairedtokens from the other three panels. Each symbol contains a smaller symbol
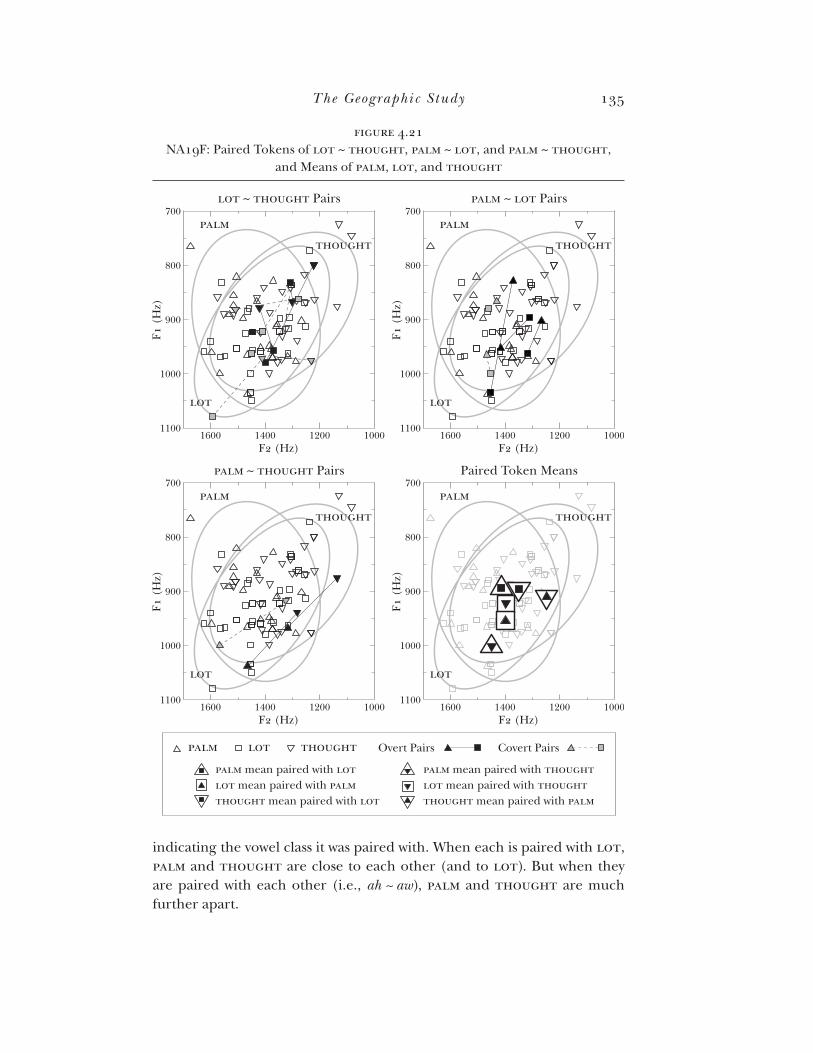
figure 4.21
F1 (
Hz)
F2 (Hz)
700
1100
800
900
1000
1600 1400 1200 1000
F1 (
Hz)
F2 (Hz)
700
1100
800
900
1000
1600 1400 1200 1000
F1 (
Hz)
F2 (Hz)
700
1100
800
900
1000
1600 1400 1200 1000
F1 (
Hz)
F2 (Hz)
700
1100
800
900
1000
1600 1400 1200 1000
lot ~ thought Pairs palm ~ lot Pairs
palm ~ thought Pairs Paired Token Means
palm lot thought Overt Pairs Covert Pairs
palm mean paired with lotlot mean paired with palmthought mean paired with lot
palm mean paired with thoughtlot mean paired with thoughtthought mean paired with palm
thought
lot
palm
thought
lot
palm
thought
lot
palm
thought
lot
palm
The Geographic Study 135
FIGURE4.2 1NA1 9F: Paired Tokens of LOT ~ THOUGHT, PALM ~ LOT, and PALM ~ THOUGHT,
and Means of PALM, LOT, and THOUGHT
LOT ~ THOUGHT Pairs PALM ~ LOT Pairs
700 I . I . I . 700 I . I . I .PALM V PALM V
_ V _ _ V _A ElTHOUGHT A ElTHOUGHT
800 — — 800 — —
El
v A ' '
e as» v e vE
900 — -E
900 — —I—I I—I
Ln Ln
mm 5'53 ”Ann '3'g
1000— A I — 1000— —
- LOT - - LOT -I:I' I:
1100 | . | . | . 1100 I . I . I .1600 1400 1200 1000 1600 1400 1200 1000
F2 (Hz) F2 (Hz)
PALM ~ THOUGHT Pairs Paired Token Means
700 I . I . I . 700 I . I . I .PALM V PALM
_ V _ _ _A ElTHOUGHT THOUGHT
800 — — 800 — —
if ifE
900 -E
900 - -
H H WLu Ln
1000 — 1000—&
—
- - LOT -
1100 | I | I | I | I | I | I
1600 1400 1200 1000 1600 1400 1200 1000
F2 (Hz) F2 (Hz)
A PALM El LOT V THOUGHT Overt Pairs A—I Covert Pairs A - - - -III
A PALM mean paired with LOT A PALM mean paired with THOUGHTEl LOT mean paired with PALM E LOT mean paired with THOUGHTW THOUGHTmeanpaired with LOT V THOUGHTmeanpaired with PALM
indicating the vowel classit was paired with. When each is paired with LOT,PALMand THOUGHTare close to each other (and to LOT). But when they
are paired with each other (i.e., ah ~ aw), PALM and THOUGHT are much
further apart.

136 PADS95: Low VOWELSOFSOUTHEASTERNNEw ENGLAND
One potential explanation for this discrepancyis that ahand awarenotordinary words (see the discussion of la in chapter 3). And indeed, there
were other young speakers who had a three-way merger in every other
respect, except for ah and aw being different. However, those speakers’productions of ah and aw sounded (and were judged) different; NA19F’ssounded very close and were judged the same.
To determine whether or not NA1 9F is three-way-merged with ordinary
words, 30 low vowel tokenswere measuredfrom spontaneousspeech—7ofPALM, 10 of LOT, and 13 of THOUGHT (■g. 4.22, top left). NA19F also pro-duced 45 unpaired reading card tokens,consistingof 13 examplesof PALM,17 of LOT,and 15 of THOUGHT(after eliminating one token of Dawnmadein imitation of a Rhode Island accent).
Like the paired tokens, the spontaneous and unpaired tokens of thelow vowel classesoverlap greatly. The spontaneous speech means of PALM(849, 1420), LOT (901, 1393), and THOUGHT(892, 1329) are close.Theclassesare not signi■cantly different, by unpaired t-tests.
The unpaired reading tokens have similar means: 904, 1459 for PALM;
923, 1436,for LOT;and 877, 1362 for THOUGHT.This time, when THOUGHTis compared by t—testwith the other two classes (or with PALMalone), the
100-Hzdifference in F2 is signi■cant (p = .04).If we combine the spontaneous and unpaired reading tokens (■gure
4.2 2, bottom left), the statistical signi■cance of these fairly small differencesincreases. The combined PALMmean is 884, 1445; LOT is 915, 1420; and
THOUGHTis 884, 1346.Wehavea 74-HzF2 difference for LOT~ THOUGHT(p = .04) and a 99-Hz F2 difference for PALM~ THOUGHT(p = .0006). LikeHerold (§4.3.1.1), we seem to have found acoustic differences betweenword classesthat impressionistically sounded merged.
If NA19F really produces small word-classdistinctions, unconsciously,within a cloud of largely overlapping tokens, it might be her everyday
exposure to dialectswith the relevant distinctions that makesthis possible.Before concluding this, however,we will seeif what seemto be word-classdifferences are really phonetic conditioning effectsin disguise.
F2 is lowered by a following /l/; before /l/, THOUGHTis simply morecommon than LOT. On the 1995 General Service List of 2,284 commonwords (Bauman and Culligan 1995), the 13 words with THOUGHTplus /l/have a mean Brown Corpus frequency of 561. The 12 words with LOT plus
/l/ haveameanfrequency of 116.Also, all but one of theseLOTwords—andnone of the THOUGHT words—have the clearer intervocalic /l/, which low-
ersF2 lessthan the darker coda /l/.Therefore, a naive acoustic analysis of spontaneous speech can falsely
show a low back distinction. The 75-word sample of unpaired reading and

×
figure 4.22
1700 1550 1400 1250 1100
1100
1000
900
850
800
750
700 NA19F
F2 (Hertz)
F1 (H
ertz
)
ah
oh
ah
oh
ah
oh
ah
oh
ah
oh
ah
oh
ah
oh
ah
oh
ah
oh
ah
oh
ah
oh
ah
oh
ah
oh
ah
oh
ah
oh
ah
oh
ah
oh
ah
oh
ah
oh
ah
oh
ah
oh
ah
oh
ah
oh
ah
oh
ah
oh
ah
oh
ah
oh
ah
oh
ah
oh
ah
oh
ah
oh
ah
oh
ah
oh
ah
oh
ah
oh
ah
oh
ah
oh
ah
oh
ah
oh
ah
oh
ah
oh
ah
oh
ah
oh
ah
oh
ah
oh
ah
oh
ah
oh
ah
oh
ah
oh
ah
oh
ah
oh
ah
oh
ah
oh
ah
oh
ah
oh
ah
oh
ah
oh
ah
oh
ah
oh
ah
oh
ah
oh
ah
oh
ah
oh
ah
oh
ah
oh
ah
oh
ah
oh
ah
oh
ah
oh
ah
oh
ah
oh
ah
oh
ah
oh
ah
oh
ah
oh
ah
oh
ah
oh
ah
oh
ah
ohooooooooooooooooooooooooooooooooooooooooooooooooooooooooooooooooooooooooooooooooooo
1700 1550 1400 1250 1100
1100
1000
900
850
800
750
700 NA19F
F2 (Hertz)
F1 (H
ertz
)
ahoh
ahoh
ahoh
ahoh
ahoh
ahoh
ahoh
ahoh
ahoh
ahoh
ahoh
ahoh
ahoh
ahoh
ahoh
ahoh
ahoh
ahoh
ahoh
ahoh
ahoh
ahoh
ahoh
ahoh
ahoh
ahoh
ahoh
ahoh
ahoh
ahoh
ahoh
ahoh
ahoh
ahoh
ahoh
ahoh
ahoh
ahoh
ahoh
ahoh
ahoh
ahoh
ahoh
ahoh
ahoh
ahoh
ahoh
ahoh
ahoh
ahoh
ahoh
ahoh
ahoh
ahoh
ahoh
ahoh
ahoh
ahoh
ahoh
ahoh
ahoh
ahoh
ahoh
ahoh
ahoh
ahoh
ahoh
ahoh
ahoh
ahoh
ahoh
ahoh
ahoh
ahoh
ahoh
ahoh
ahoh
ahoh
ahoh
ooooooooooooooooooooooooooooooooooooooooooooooooooooooooooooooooooooooooooooooooooo
1700 1550 1400 1250 1100
1100
1000
900
850
800
750
700 NA19F
F2 (Hertz)
F1 (H
ertz
)
ah ohah ohah ohah ohah ohah ohah ohah ohah ohah ohah ohah ohah ohah ohah ohah ohah ohah ohah ohah ohah ohah ohah ohah ohah ohah ohah ohah ohah ohah ohah ohah ohah ohah ohah ohah ohah ohah ohah ohah ohah ohah ohah ohah ohah ohah ohah ohah ohah ohah ohah ohah ohah ohah ohah ohah ohah ohah ohah ohah ohah ohah ohah ohah ohah ohah ohah ohah ohah ohah ohah ohah ohah ohah ohah ohah ohah ohah ohah ohooooooooooooooooooooooooooooooooooooooooooooooooooooooooooooooooooooooooooooooooooo
1700 1550 1400 1250 1100
1100
1000
900
850
800
750
700 NA19F
F2 (Hertz)
F1 (H
ertz
)
daughter
daughter
paws
pauseharder
doctors
starting
started
called
walking
walking
Dawn3
Boston
boughtbought
Boston2
bought2
The Geographic Study 137
FIGURE4.22NA19F: Means of PALM,LOT, and THOUGHTfrom Spontaneous Speech Tokens,
Unpaired Reading Tokens, and Both Combined
c> NA19F c> NA19Fo oIx Ix
o 0Lo — Lo —Ix Ix
o oo — c> _co oo
o 0Lo — Lo —
N Nt o “: Oa) o — a) o —I 03 I 0)
E_
E_
o oO
_O
_o o
o oo _ c> _‘—
I I I I I I I I I I I I I I‘—
I I I I I I I I I I I I I I
1700 1550 1400 1250 1100 1700 1550 1400 1250 1100
F2 (Hertz) F2 (Hertz)
c> NA19F c> NA19F[C3 2 Walmllg
V8
_8 _started t
DaWH3v'\ '\ A 5.1: A ‘
g-
g- l’ ‘iBostoncalled
o 0Lo — Lo
N Nt o t Oa) o — a) o —I 03 I O)
E—
E_
o oo _ c> _o 0
El 38
_ n 8_‘—
I I I I I I I I I I I I I I‘—
I I I I I I I I I I I I I I
1700 1550 1400 1250 1100 1700 1550 1400 1250 1100
F2 (Hertz) F2 (Hertz)
spontaneous tokens has four examples of THOUGHT plus /l/ (ball, called,fall X 2) and two of LOT plus /l/ (college,doll). Removing just these six words
cuts the F2 difference betweenPALMand THOUGHTfrom 99 to 76 HZ; thep-valuerisesfrom .006 to .03. The LOT~ THOUGHTdifference drops from74 to 64 HZ; the p-value goes from .04 to .06.

138 PADS95: Low VOWELSOFSOUTHEASTERNNEw ENGLAND
Another environment that lowers F2 is a preceding /w/. Two tokens ofwalking bear this out; they measured among the furthest back of all these
tokens, although they did not sound it. With thesewords removed—there
were no PALMor LOTwords with a preceding /w/—the PALM~ THOUGHTdifference dropped to 61 Hz (19= .08), the LOT~ THOUGHTdifference to49 Hz (19= .15).
Just by removing two of the most likely sources of bias—only 8 words
out of 75—the effect whereby THOUGHTappeared to be further back thanthe other word classestaken separately is reduced by one-third in size and
no longer reachesthe usual threshold for statisticalsigni■cance.The comparison of tokens from conversation is adequate to broadly
delineate vowel classesas clearly distinct or possibly merged. But it can-not decide whether or not a speakermaintains a small, regular differencebetween two classesthat almost completely overlap.
Measuring many tokens will not necessarilyhelp the matter, becauseword classesdo not appear with the same frequency in the same phoneticenvironments. A method where tokens are paired—or at least collected incoherent phonetic groups—seems essential.
NA19F was less consistent than some subjects (cf. PV81M in ■g. 4.1 1,top) when pronouncing similar words from the same class or from classes
believed merged. For example, her F2 in startedwas 1625 Hz; in startingit
was1296Hz, a difference of 329 Hz.NA1 9F also showed phonetic conditioning. For example, F2 was low in
two tokens of Boston (1 171, 1370) and three of bought (1262, 1304, 1383),
in keeping with their labial onsets. Similar tokens with coronal onsets,daughter (1552, 1575) and doctors (1563), had much higher F2 measure-ments. These words are labeled on ■gure 4.22 (bottom right).
Neither variability on individual words nor allophonic effects leaddirectly to aword classdifference. Yet,evenafter removing the tokenswithfollowing /l/ or preceding /w/, a statisticallysigni■cantdifference of around50 Hz in F2 remains between the combined PALM= LOT and THOUGHT.
Evenif suchdifferences are not due to chance,they are not necessarilyreal phonemic (word-class) differences either. They may be statistical regu-larities deriving from the different frequencies of various phonetic environ-
ments within the vocabulary of each class.Table 4.8 shows all 109 of NA19F’s measured tokens, divided into four
equal groups according to F2. At ■rst glance, the table suggestsa word-classdifference: THOUGHT has lower F2. But the table also reveals how imbal-
anced some important phonetic environments are. For example, 13% ofTHOUGHT tokens (5/40) are before /l/, compared to 7% of LOT tokens(3/41) and 0% of PALM tokens (0/28). A preceding labial consonant—

table 4.8
1675–1470 1469–1380 1379–1310 1309–1070palm ah ah ah2 are balm balm balm2 car calmer aunt card calming far farther lager lager1 lager3 farther lager lager2 harder market father’s heart part smartie starting started
lot bothers bomb college doctors bomb bomb2 con dodge common clock doll Donna contact’s hot Foxboro honor cot logs lot John cot Don not Don Don4 Don2 Roxy jogging possibly Roxy2 logger logger sod shot lot (short)stop Molly mom not popular popular
thought daughter caught caught daughter bought bought Shaw’s Shawn bought2 aw aw lawn dog aw2 Dawn4 Dawn Dawn talk Dawn2 talks talk2 mall fall fall ball cost called cost Boston2 Boston boss toss pause paws off2 off walking sawed saw walking
note: Italics indicate spontaneous speech; bold, overt; all others, covert.
The Geographic Study
TABLE4.8
NA1 9F: Low Vowels by Word Class and F2
139
1675—1470
PALM ah
arecar
cardfarther
farther
harderheart
smartte
started
LOT bothersdoctorsdodgeDonna
honor
John
notRoxy
RoxyZ
shot(short) stop
THOUGHT daughterdaughter
Shaw’s
talks
0172
sawed
1469—1380ah
balmcalmercalming
lagerlager
market
bombbomb
commoncontact ’5
cotcot
Don
jogginglogger
lot
Molly
momnot
popular
caught
boughtShawn
lawn
Dawn4
COSt
COSt
pause
1379—1310ah2
balm
auntfar
lagerllager?
father’spart
starting
bomb?clock
hot
logs
Don4
logger
popular
awdog
Dawn
talk
talk2fall
Boston2
boss
OffS21W
1309—1070
balm?
lager3
college
condoll
Foxboro
lot
Don
D0112possibly
sod
caughtbought
boughtZ
awaw2
Dawn
Dawn?mall
fallballcalled
Boston
toss
pawswalking
walking
NOTE: Italics indicate spontaneous speech; bold, overt; all others, covert.

140 PADS 952 LOW VOWELS OF SOUTHEASTERN NEW ENGLAND
/b/, /p/, /m/, or /w/—accounts for 30% of THOUGHT (12/40), 22% 0f LOT(9/41), and 18% of PALM(5/28).
To choose an environment where F2 might be higher than average,only 10% of THOUGHTtokens (4/40) occurred before an intervocalic con-sonant, compared to 29% of LOTtokens (12/41) and 29% of PALMtokens(8/ 28).
While more data would be needed to conclusively establish correla-tions like these, unpaired tokens can clearly carry the baggage of the allo-
phonic environments they occur in. Differences in thesedistributions canbe misconstrued as word-class differences. This can be avoided with mul-
tiple regressionor using paired tokens.So, while NA1 9F is effectively three-way merged (3-M), a fuller analysis
of her speech could show she produces very small word-class differences
within one overlapping range. Suchmicrodifferences could be called vesti-gial if they are retained from parental or early childhood exposure. If theyhave arisen from accommodation to recent interlocutors, they could becalled nascent. If one of these is the case, then as with ah ~ aw, NA19F can“say it differently” better than she thinks.
4.3.3.4. SummaryonoungAdults. Figure 4.2 3 compares the means and stan-dard deviations of the low vowels of the young adults, ABS26F, NA30M, and
NA19F. South Attleboro is only ■vemiles from North Attleborough alongRoute 1, but we observe great diversity among these speakers’ systems.
The females’ vowels are on axes intermediate in scale between the onesused for the male and female seniors in ■gure 4.16. This slightly under-
stateshow much PALM= LOTand THOUGHTare closerfor ABS26Fthan forABS■2M. Their MAIN systemsare still very similar.
Comparing NA30M on ■gure4.23 with NT86F on ■gure4.16, we seethat PALMappears to be roughly twice as close to LOT = THOUGHTfor the
younger speaker. This is despite a more zoomed-in scale on the youngerspeaker’s plot. NA30M has an unusually compact vowel space, in termsof Hertz. Impressionistically and acoustically,his ENE pattern was clear,though moderate.
NA1 gF’s low vowel pattern is quite different from either MAIN or ENE.We have called it 3-M; although, as discussed in section 4.3.3.3, all pos-sibility of word-classdifferences cannot be ruled out. Comparing speak-ers is risky without normalization, but NA19F’s merged low vowel(s) seemto occupy less space than the systemswith distinctions. This matched theimpression of a moderate phonetic range, without the extremes of ENE
PALMor MAIN THOUGHT.
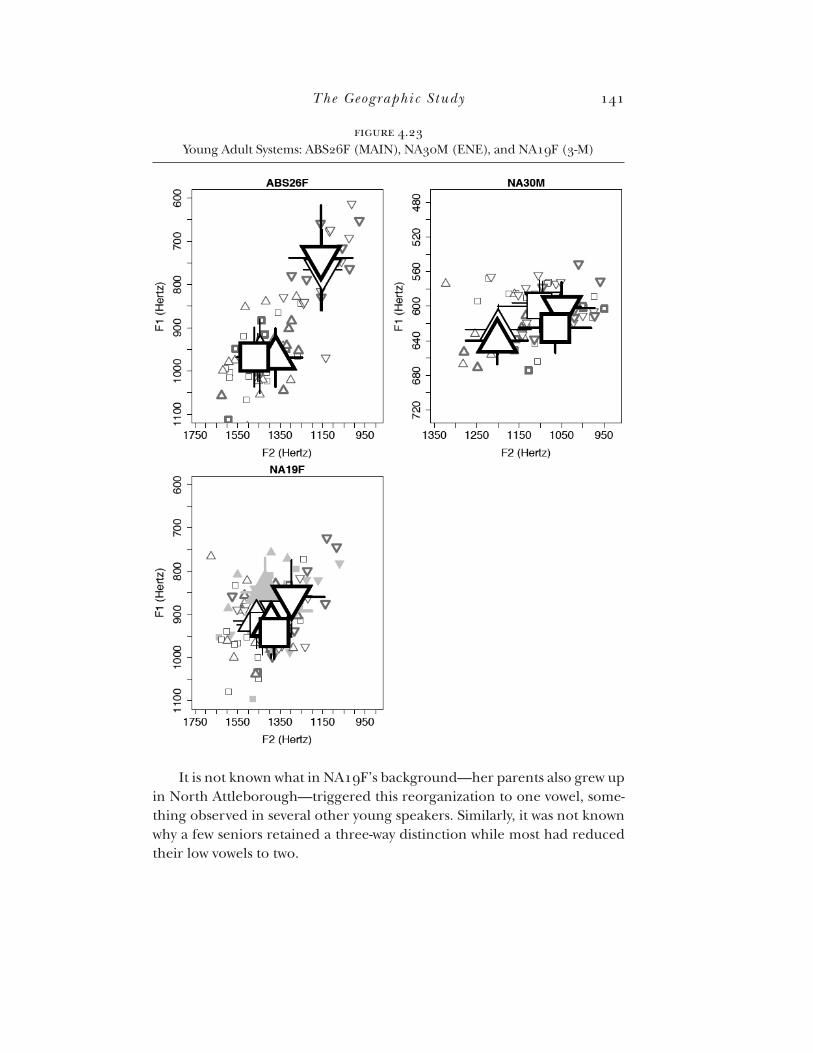
figure 4.23
The Geographic Study 141
FIGURE4.2gYoung Adult Systems:ABS26F (MAIN), NAgoM (ENE), and NA1 9F (3-M)
ABSZGF NA30M80
070
0I
I
ll
lI
F1
(Her
tz)
720
680
640
600
560
520
F1
(Her
tz)
l
900
I
I
1000 I
lI
I
1100
DIIIIIIIIIIIIIIIIII I II I I I I I
1750 1550 1350 1150 950 1350 1250 1150 1050F2(Hertz) F2(Hert2)NA19F
I
950
700
600
II
800
I
F1
(Her
tz)
l
1000
900
1100 I
I I I I I I I I I I I I I I I I I I
1750 1550 1350 1150 950
F2 (Hertz)
It is not known what in NA1 gF’s background—her parents also grew upin North Attleborough—triggered this reorganization to one vowel, some-thing observed in several other young speakers. Similarly, it was not known
why a few seniorsretained a three-waydistinction while most had reducedtheir low vowels to two.
table 4.9
Low Vowel System 3-D MAIN ENE 3-M Unclear totala
Senior Citizens mostly r -less 5 19 18 0 0 42 somewhat r -less 1 6 14 0 0 21Young Adults mostly r -less 0 7 6 1 0 14 somewhat r -less 0 31 19 3 7 60 completely r -ful 0 10 12 2 13 37
a. Four seniors and two young adults were accidentally left out of this analysis.
142 PADS 952 LOW VOWELS OF SOUTHEASTERN NEW ENGLAND
4.4. THE INTERACTION OF RHOTICITYAND LOW VOWEL SYSTEMS
Besides her three-way-merged vowels, NA1 9F differed from the other speak-
ers analyzed by usually pronouncing postvocalic /r/, especially in the read-ing tasks. Kurath and McDavid (1961) connect these phenomena, saying adistinction between PALMand LOT is not found in rhotic areas:
The free low vowel /a ~ 0/ occurs only in areasin which post-vocalic/r/ is not pre-served as such, that is, in Eastern New England, Metropolitan New York [and the
South] dialects that preserve post-vocalic /r/ lack the free /a ~ 0/ as a feature Of
their vowel system. [5, 113]
Because PALM occurs very frequently before underlying coda /r/ and
LOTnever does, the two vowels would nearly be in complementary distribu-tion in a rhotic dialect. This could lead to a reanalysis where PALMmergeswith LOT (3-D to MAIN) or with LOT = THOUGHT (ENE to 3-M).
But does the geographic study show a correlation between rhoticity andthe lack of a distinct PALM?Table 4.9 cross-tabulates speakers’ low vowel pat-
77 “terns with a three-level rhoticity rating: “mostly r—less, somewhat r—less,”
and “completely r—ful.”No senior citizenswere completely /r/-ful, while only
one in eight young adultswasmostly /r/-less.The six speakers with a likely three-way-merged system are not notice-
ably skewed toward rhoticity. One, a 16-year-old from Dartmouth, Massa-chusetts, was even rated mostly /r/-less.9 And 13 ENE speakers maintain aclear PALM~ LOT distinction despite being completely /r/-ful.
This suggeststhat Kurath and McDavid’s (1961) correlation betweennonrhoticity and an independent PALMis a typological generalization
TABLE4.9Cross-Tabulationof 174 Low VowelSystemsby Degreeof Rhoticity
Low VowelSystem3—D MAIN ENE 3—M Unclear TOTALa
Senior Citizens
mostly r—less 5 19 18 O O 42somewhat r—less 1 6 14 O O 21
YoungAdultsmostly r—less O 7 6 1 O 14somewhat r—less O 31 19 3 7 6Ocompletely r—ful 0 10 12 2 13 37
a. Four seniorsand twoyoung adultswere accidentallyleft out of this analysis.

The Geographic Study 14:),
rather than a statement about structural incompatibility. If it is the latter,then those 13 speakers have an unstable combination, and the ENE lowvowel pattern will eventually collapse if postvocalic /r/ is fully reintroduced
to the area.
4.5. DISCUSSION OF THE GEOGRAPHIC STUDY:INTRODUCING THE MIGRATION HYPOTHESIS
The three original lowvowelsof southeasternNewEngland underwent oneround of mergers when LOT either remained rounded, lengthened, and fell
in with THOUGHT(in most of eastern Massachusetts) or unrounded, length-ened, and fell in with PALM (in Rhode Island and some adjacent parts of
Massachusetts).In the ■rstarea,merger waslargely complete by 1900. Inthe second, some speakers remained three-way distinct for another fewdecades.
After decades where complementary two-vowel systemsfaced off across
a sharp dialect boundary, a second round of mergers is affecting youngpeople today. It may eventually dissolve the boundary that crystallized mostprominently during the two-vowelstage.
Section 2.6 proposed that the ■rst round of mergers had internal
causes, for two reasons. First, the nineteenth-century data of chapter 2 did
not show the mergers occupying less territory then, as a wave model would
expect. For example, Martha’s Vineyard had two ENE speakers (with the
LOT~ THOUGHTmerger), while at leasttwo of their Boston-areacontempo-raries were still 3-D.
Second,the early twentieth-century data in this chapter showsa sharpboundary between the ENE and MAIN two-vowel systems.There is neither
a 3-M area of overlap (affected by both mergers) nor a 3-D area of “under-
lap” (untouched by either merger). There were 3-Dseniorsand 3-Myoungadults, but in both casesthey were geographically scattered.
Moreover, the linguistic areasmore or lesscorrespond to the seven-teenth-century settlement areas:most of (eastern) MassachusettsBay andPlymouth colonies developed the ENE pattern; Rhode Island became
MAIN. All three colonieswere likely seededwith a phonologically identicalthree-vowel system. But starting with some phonetic difference(s) betweenthem,10 each area’s communities evolved, in parallel, in opposite direc-tions, eventually undergoing one or the other merger.
It is possible that social, migratory, and economic networks amongcommunities helped spreadthe relevant changes.But sincethesenetworkstended to coalesce within the original settlement areas, it is usually impos-sible to tell.

144 PADS 95' LOW VOWELS OF SOUTHEASTERN NEW ENGLAND
The geographic study subjectslived no more than ten miles from thedialect boundary; most lived much closer.Still, very few (7%) of the seniorcitizens’ parents had come from the other side of that boundary. Most oftheir parents (63%) had grown up on the sameside of the line, with a sub-stantial minority (30%) coming from foreign countries. Thirteen percentof the seniors were still living in the same city or town where they, and bothof their parents, grew up.
For the young adults, an equally small proportion (8%) of their parents
came from the other dialect area. The great majority of young adults’ par-ents (78%) came from the same side of the dialect boundary asthe subjects
themselves.Foreign-born parents were now half ascommon (14%). Nine-teen percent of young adults lived in the same city or town where they, andboth of their parents, grew up.
The nature of this rootedness is slightly different from that found inPennsylvaniaby Herold (1990, 168—69),who noted in a telephone sur-vey that “more than 60% of the participants had two locally born parents;almost 87% had at least one locally born parent,” and in the ■eld that
“almost every person I encountered wasa native of the town in which wemet.” In this geographic study,quite a few parents had relocated somedis-tance within the ENE or MAIN areas,just not usually across the boundarybetween the two.
Because interdialect migration does not appear to be increasing, it ishard to seehow it could be responsible for the general weakening and spo-radic collapse of the ENE and MAIN systemsamong the young adults—the
secondround of mergers.However, nonmigratory contact between adult speakers seems even
less likely to be responsible for community change, despite the probableincrease in such contacts, for example, in the workplace. People from FallRiver, for example, tend not to migrate across the boundary, but many ofthem cross it daily to reach jobs in places as close as Dartmouth or as far
away as Boston.For one thing, the vowel systems of most adults are relatively immune
to change.11 But even if adults did substantially accommodate, it would notlead to dialect change of the rapid type observed in the geographic study(and in the family study of chapter 5), unless parents abandoned a distinc-
tion quickly and thoroughly enough that their children did not acquire it.Otherwise, any merger would only occur by gradual approximation.
Parental change may have some limited effect on the initial input tochildren, but parents have a greater effect if they migrate to another dialect
area while they have young children (or before they are born). The ■rst
dialect thesechildren are exposedto—that of their family—will differ from

The Geographic Study 145
the one they are exposed to from around the age of four—that of their
peers.If a single child joins apeer group with a different vowelsystem,we can
ask to what extent the individual will adapt to the group and what factors
promote or prevent this adaptation (see chap. 3). But the peer group—andthe larger community—is unlikely to change unless joined by a critical massof speakers who differ from the locals.
Migration is one of the most likely sources of child-to-child dialectcontact. Except for some preschools, after-school activities, and visits with
cousins, most children interviewed had little contact with children in other
communities, evenadjacentones.This makesthe mechanism of anyconta-gious diffusion unclear.12
But, even if a general increase in interdialect migration is questionable,in the particular, formerly MAIN places where PALM2 LOT and THOUGHT
are merging—South Attleboro and South Bellingham (§4.2); Seekonk,Cumberland, and Warwick, Rhode Island (chap. 5)—we may proposethat the merger is triggered by people migrating from the ENE side of theboundary.
Over the last few decades, as real estate prices closer to Boston have
risen, people havemoved further from the city and its older suburbs.And,perhaps for the ■rst time, this migration is passing beyond the old dialectboundary, reaching places such as the ones just mentioned. This demo-
graphic argument will be consideredusing U.S. Censusdata in §5.g.2.1.The second round of mergers also includes the merger, observed
sporadically among the younger geographic study subjects, of PALM and
LOT 2 THOUGHT in the ENE territory. The evidence of migration fromMAIN to ENE—with its source not just in Rhode Island but in westernMassachusetts, Connecticut, New York, Newjersey, and elsewhere—will be
treated in section 5.9.2.2.For theseargumentsto be most compelling, they require not only a suf-
■cient current level of migration, but a level that has recently been on the
increase.For if migration has been constant for decades,we are left withthe question of why these mergers are happening now.13
If the second round of mergers is not caused byjuvenile dialect contact
asthe result of migration, what elsecould account for it? The internal pres-sure that may have existed in the old 3-D days to simplify a crowded three-vowel system is not likely to apply to the ENE and MAIN systems. Somediscussion of other possibilities is found in section 5.10.
Although the geographic study areawasfairly large, it did not extend
very far on either side of the original dialect boundary. So, a changeobserved in the study area could be happening over a wider area, or it

146 PADS95: Low VOWELSOFSOUTHEASTERNNEw ENGLAND
could just be happening near the dialect boundary. But even in the latter
case, the change would not necessarily be happening because of the prox-imity of speakersof the other dialect. This is becausea moving boundarycan be of (at least) three types: change spreads from place A to adjacent
place B (contagious or relocation diffusion); change spreadsfrom C to A,then later from C to B (hierarchical or relocation diffusion); or changedevelops internally in A before it develops in B (no diffusion).
We could better classify the newer round of mergers by looking atplaces far from the dialect boundary, ones that receive little in-migration
from other dialect areas.If children are merging cotand caughtnot onlyin South Attleboro, but also in rural southwestern Rhode Island, or if they
are rhyming father and bothernot only in Dighton, Massachusetts,but alsoin small towns in Maine, then we will know these mergers are not (always)caused by migration across a dialect boundary. This might lead us to adopt
a language-internal explanation, or even an account involving the massmedia.
Focusing on a densely populated area along a dialect boundary, thegeographic study has shown how 35o-year—oldphonetic patterns developed
in parallel into two internally uniform phonological dialect areas.Oncemanifested, theseremained stablefor severalgenerations despite being inclose contact. This argues for the reality and autonomy of dialect areas and
againstthe view that changeprimarily proceedsby diffusion.This study had neither the time depth nor the spatial width to fully test
Herzog’s Principle and its prediction of merger expansion.However,it diddemonstrate that dialects can be in close contact for some time without thespread of mergers.14
The study also revealed one casewhere a distinction expanded alongwith a merger: in Assonet, the community pattern evolved over the twenti-
eth century from 3-D to MAIN to ENE to 3-M.The stepfrom MAIN to ENEinvolved unmerging LOT from PALMand merging it with THOUGHT.Thisoccurred several decades after Assonet children began to attend schoolwith a large number of ENE speakers from East Freetown and Lakeville.
This chapter has looked at the phonological patterns among three lowvowel word classes, PALM, LOT, and THOUGHT. If low vowel systems had nomeaningful correlations with other phonological and lexical differences
between dialects, then this study would have little relevance beyond thesubfield of vowelmergers.
And indeed, not every linguistic (let alone cultural) phenomenon per-sists and simpli■es in the same way these vowel systemshave. Lexical inno-vations must spread quickly through contact, while patterns of vowel chainshift may be even more structurally predestined than mergers. However,

The Geographic Study 147
assuming the low vowel systemsfound in the dialects of the geographicstudy area meaningfully relate to the rest of their phonologies, the prin-ciples sketched here Will be seen to bear more generally on the processesunderlying dialect stability and change.

5. THE FAMILY STUDY
THEFAMILY STUDYfocused on merger at the level of the speech com-
munity, as opposed to the dialect (chap. 4) or individual (chap. 3). Speechcommunities are more socially real than dialect areas—at least, their mem-bers are more closely interconnected—and linguistically more consistent
than idiolects (Weinreich, Labov, and Herzog 1968, 188). Here, a speechcommunity is equivalent to a city or town, or subdivision thereof.
The study area’s speech communities differ from some urban ones in
that many adultswork outside their boundaries. But this doesnot affect thechildren growing up there. Especiallyfor younger children, almostall peersare residents of the samecity or town, whose boundaries (as is typical inNew England) almost always coincide with those of the school system.
Traditional dialect geography, in Europe (Pop 1950) and New England
(Kurath et al. 1939), took the town or village as the sampling unit thatcombined to form dialect areas.Townsin New England are no longer self-suf■ciententities; many now function assuburbs.But the resultsof chapter
4 suggestthat the town is still avalid unit of linguistic patterning.Inspired byHerold (1990), the family studyfocusedon the short period
over which a speech community’s children can stop acquiring a vowel dis-tinction: that is, learn a merger. In Tamaqua, Pennsylvania, Herold found
this period of change to be asshort asten years.In South Attleboro, Mas-sachusetts, section 4.2 found merger overtaking the community in just two
or three years.The geographic study found substantial stability over 50—60years; many
young adults had the same patterns as senior citizens in the same commu-nity. Individuals sometimes differed, often by following parents rather than
peers. But South Attleboro, South Bellingham, and Assonet, Massachusetts,
showed community change between seniors and young adults.1The fam-ily studywasconducted (in 2005—6)where this kind of changewasfoundamong younger children.
Figure 5.1 shows the family study communities, using the young adults’
map as a background. The family study mostly took place within the ter-ritory of right-pointing triangles—the “Mid-Atlantic” (MAIN)—where, atleast in the past, PALM= LOT¢ THOUGHT.The term “distinction” refers tothis two-vowelpattern; “merger” refers to PALM= LOT= THOUGHT(3-M).
The ■rstfamily study community wasAttleboro, Massachusetts,wherethe geographic study adults were divided between MAIN in South Attle-
149

figure 5.1
150 PADS 952 LOW VOWELS OF SOUTHEASTERN NEW ENGLAND
FIGURE5.1Locations of 47 Families Interviewed
Massaclmwtts
Rhocle Island >CL
bCumberland RI (5) —1—0
bAttleboroMA (13)SouthAttleboroMA (10) “
,_,
' ‘ >1 > >
SeekonkMA(14) I \{4
Warwick RI (5)
boro and ENE in the rest of the city. In South Attleboro, ten families wereinterviewed, with 18 children ranging in age from 5 to 19. In the rest of
Attleboro, there were 13 families, with 26 children ranging from 3 to 18.2The initial intent was to observe younger children from the two sec-
tions before they cametogether in high school, comparing them with highschoolers who were mixed. However, in line with section 4.2, we will see
in section 5.1 that South Attleboro children did not retain their parents’distinction. In other words, community change had already occurred; it wastoo late in South Attleboro to observe contact between children with differ-
ent low vowel systems.The focus was shifted south and west, to towns where some children
were distinct. Unlike Attleboro, these places had no geographic divide, butthere was a temporal one.
Perhaps the most interesting community was Seekonk, Massachusetts,where 14 families were interviewed, including 34 children, ages 3—17.Sec-
tion 5.2 showsabreak betweenchildren over 10,who maintained their par-ents’ low back distinction (MAIN), and those under 10, who were merged
(3-M). Although section 5.2.3 discusses a family with a distinct 3-year-old
son, this is an exception that proves the rule, since he did not have a peer
group yet.3
The Family Study 151
The geographic study’syoung adults were too old to have shown this
PALM= LOT~ THOUGHTmerger, but the school survey did show clear evi-dence of the same change between the twelfth grade (largely distinct),
eighth grade (mixed), and fourth grade (more merged than distinct).The ■ve families interviewed in Cumberland, Rhode Island, with 13
children between 5 and 16, were similar in that within families older chil-dren were distinct and younger ones merged. But unlike in Seekonk, nooverall age cutoff could be drawn in Cumberland; for example, there was adistinct ■ve-year-old, but a merged eleven-year-old (in different families).4
The nearby ENE area where LOT and THOUGHT are merged—leavingaside that PALMis traditionally distinct there—is a potential source of thischange, if it is diffusion. We can distinguish contagious diffusion (“the
merger is spreadingfrom town to town”), hierarchical diffusion (“the in■u-
ence of Boston and/ or its speech is growing wider and wider”), and reloca-tion diffusion (“people from Greater Boston are moving further and fur-ther out from the city”).
Non-diffusionist accounts of the change include internal/ structural
explanations, aswell as those pointing to the influence of the mass media
or of a growing national standard.To help decide between these,an ideal test sitewould havebeen deep
in the interior of the MAIN dialect area (see §5.10). The ■nal family study
community,Warwick, RhodeIsland,wasin fact only slightly further from theoriginal MAIN/ ENE boundary, lying to the south of Providence (Seekonkis east of Providence, Cumberland north).
Five families were interviewed in Warwick, with 12 children, ages 4 to
15.Four of the families had Rhode Island parents; the other setwere fromMaine and Texas,so their children presented an interesting example ofthe acquisition from peers of local norms, including the low back voweldistinction.
But the distinction, while stronger, was not universally maintained bythe children in Warwick either. It appeared asthough Warwick might bejust■ve or ten years behind Seekonk and Cumberland in progressing toward
the low backmerger.BecauseWarwick is suchalocally rooted Rhode Islandcommunity, if the merger is indeed taking hold there, it would probablyindicate the recessive status of the distinction everywhere in the vicinity.
The family study communities are pro■led in table 5.1. In each com-munity, parents and children were interviewed talking about their livesandbackgrounds to obtain spontaneous speech, and with formal methods toobtain a concentration of the vowels of interest.
A smaller set of reading cards was used than in the geographic study,with simpler vocabulary targeted at young children. In (South) Attle-

table 5.1
Community Families Children Recruited lot ~ thought lot ~ thought via in Adults in ChildrenAttleboro 13 26 PTA merged mergedS. Attleboro 10 18 PTA distinct mergedSeekonk 14 34 survey distinct under 10 mergedCumberland 5 13 network distinct younger mergedWarwick 5 12 PTA distinct incipient merger?
152 PADS95: Low VOWELSOFSOUTHEASTERNNEw ENGLAND
TABLE 5.1Summary Of Families in the Study
Community Families Children Recruited LOT~ THOUGHT LOT~ THOUGHT
mo in Adults in ChildrenAttleboro l?) 26 PTA merged merged
S. Attleboro 10 18 PTA distinct merged
Seekonk 14 34 survey distinct under 10 merged
Cumberland 5 13 network distinct younger merged
Warwick 5 12 PTA distinct incipient merger?
boro and Cumberland, ■ve cards contrasted cot ~ caught, Don ~Dawn,
knotty ~ naughty, tot ~ taught, and Otto ~ auto. The last Of these proved dif-■cult for some children and was replaced in Seekonk and Warwick by
nod ~ gnawed and took~ talk.
The “covert” reading Of the key words embedded in sentenceswasjudged “same” or “different” by the analyst. Both analyst and subject gavetheir impressions Of the “overt” repetition, when the minimal pairs werepresented out Of context on the back Of the card.
Subjects tOOyoung tO read these cards were given a series Of picture■ashcards. Each Of these had a photograph or drawing Of a common Object,such as a ball, a doll, pasta with sauce, and so on.
Basedon auditory impressions, almost all Of the adults and most Ofthe children in the family study were easy tO label as either “merged” or“distinct” with respect tO the low back vowels. Of 86 parents, 75 (87%)
were judged clearly merged or distinct, and 8 (9%) were judged probablymerged or distinct. Only 3 (3%) parents were more profoundly unclear.
Among children, only 65 Of 107 (61%) were con■dently labeledmerged or distinct, with 40 (37%) labeled probably merged or distinct.
Only 2 (2%) seemedtruly unclear.Some “probably merged” children pronounced most LOTand THOUGHT
words alike, with a low unrounded vowel, but then one or two Of their
THOUGHTwords would be more back and raised. Other children soundedmerged in their spontaneous speech, but in reading—especially in overtminimal pairs—they showedevidenceOfthe distinction.
This difference between styles was never extreme, nor very consistent,but it does differ from the “perception leading production” reported for
mergers in progress (Herold 1990, 94—99). Instead, spontaneous speech
more closelymatchesthe peer group (or incoming norm), while more con-scious productions (and judgments) reflect the dialect learned from par-ents (or Older norm).

figure 5.2
The Family Study 153
5.1. THE FAMILIES OF ATTLEBOROAND SOUTH ATTLEBORO, MASSACHUSETTS
The 44 children of the 23 Attleboro and South Attleboro families are shown
on ■gure5.2. In this ■gure (and subsequentones),eachvertical line repre-sentsone family, with the children arranged by agealong that line. Boysarerepresented by squares, girls by circles.
Children with a clear low back merger have black symbols; those with aprobable merger have symbols that are black with a white center. Childrenwith a clear low back distinction have white symbols; those with a probabledistinction are white with a black center. (Any more unclear caseswill becolored grey, although there are no such children on ■gure 5.2.)
The families are divided between South Attleboro, on the right, and
the rest of Attleboro, on the left. And each group is divided according tothe low back vowel status of the childrens’ parents.
The left side of the ■gure is like a control group, asAttleboro has hadthe low back merger for a century. There, when both parents were merged,all ■ve children (100%) were “de■nitely merged.” When only one parent
was merged, six children (50%) were de■nitely merged and siX probablymerged. When both parents were distinct, three children (33%) were de■-nitely merged, ■ve probably merged, and one was judged “probably dis-tinct.”
This was Nora Lucas, age 6 (all names are pseudonyms). Her parents
grew up in NewYork State;both had clear low back distinctions. The Lucasfamily lived in easternConnecticut, alsoin the MAIN areaof low back dis-
FIGURE 5.2The Children ofAttleboro and South Attleboro, Massachusetts
Dlsfnd
.IO".
213“
.'U.I. I
H
Mo
:2 --I : HIM
?
llllllll

154 PADS 95' LOW VOWELS OF SOUTHEASTERN NEW ENGLAND
tinction, before moving to Attleboro. Nora had spentpreschool and half ofkindergarten in Connecticut and wasin the middle of ■rstgrade in Attle-boro when interviewed. Though she now exhibits a probable distinction,she is young enough that we might expect her to eventually acquire the
merged pattern of her current peers.MissyLucas,age4, had not attended school in Connecticut. Shewasin
her ■rst year of preschool in Attleboro. Judged “probably merged,” she is
more like the other Attleboro children than her sister. Since the sisters hadthe same distinct parental exposure, it is likely Nora’s longer exposure tothe distinction from peers that hasled to her currently anomalousstatus.
As well as serving as a control group, the Attleboro families show amerger in progress between LOT = THOUGHTand PALM.Although LOT and
THOUGHT, not PALM, were the principal focus of the formal methods, we
can still identify three Attleboro families—shown at the left in ■gure 5.2—where the parents had the ENE pattern: a merger of LOT~ THOUGHTand
a distinct PALM.Their 5 children all had the LOT ~ THOUGHTmerger. For a 10-year-old
and a (unrelated) 7-year-old, PALMwas possibly distinct. For the 7-year-old’s9-year-old sister, PALM was possibly merged with LOT = THOUGHT (3-M);the same was true for sisters, ages 8 and 5, in another family. Even for thepossible 3-M speakers, some tokens of LOT = THOUGHT retained a lightlyrounded, back quality not shared by PALM, suggesting an underlying dis-tinction may still exist.
Recall thatNT86F, the ENE senior citizen analyzed acoustically (§4.3.2.2),
had awide phonetic distinction betweenPALMand LOT= THOUGHT,averag-ing over 300 Hz in F2. For NAgoM, the ENE young adult (§4.3.3.2), F2 wassome 150 Hz greater in PALMthan in LOT = THOUGHT.
Judging by ear, the younger children in Attleboro are continu-ing this merger by approximation between the word classesPALMandLOT = THOUGHT,a progression also visible on the school survey (§3.6.2.3).
If the classesare not now merged, they are so close that many tokens wouldbe needed for an accurate analysis.
Moving to the right sideof ■gure5.2, recall from section4.2 that SouthAttleboro adults 20 and older have the low back distinction (MAIN). Butthere has been rapid and dramatic change; of the 18 children, 11 were de■-
nitely merged (3-M) and six probably were. The merger wasfound eveninthe children whoseparentswere both distinct (just two families here, this isthe most common South Attleboro family type and the most important fortracking the appearance of merger).
The exception to merger was Caleb Hayas, age 6. Caleb’s mother wasfrom Rhode Island and had a strong distinction. His father had come from
The Family Study 155
South America in his 20s,and his nonnative low vowelsdid not follow anyclear pattern. Caleb’s spontaneous speech was “de■nitely distinct”; in iden-
tifying the ■ashcardshe was“probably distinct. ’7Two other children interviewed in Caleb Hayas’s ■rst-grade classwere
“de■nitely merged” and “probably merged,” making it unlikely that CalebHayas has a distinct peer group. Rather, Caleb may still be dominated bythe linguistic in■uence of his mother, despite being old enough to have
peers. While no information was gathered on his integration with peers atschool, Caleb, an only child, appeared somewhat socially awkward and/ orimmature. His parents also spoke of him having had a delay in learning tospeak. He may be a late bloomer as far as adopting the linguistic patternsof his peers.
5.2. THE FAMILIES OF SEEKONK, MASSACHUSETTS
The 34 children from the 14 families interviewed in Seekonk are shown on■gure 5.3. The ■vefamilies on the left each had one parent with the lowback merger (or in one case,an unclear pattern). The nine families on theright eachhad two clearly distinct parents (many from Seekonkthemselves,most others from Rhode Island).
In the ■vefamilies with amerged parent, all 12 children are either de■-nitely or probably merged. This suggests that these children’s peer groupsdo not maintain the low back distinction uniformly or strongly enough toreverse parental influence (§5.5 will show that this can happen).
In the nine families with distinct parents, the children pattern by age.Of the 11children in ■fth grade or higher (aged 10 or older), eight are def-initely distinct and two probably distinct, with just one de■nitely merged.5
The siX fourth graders are evenly split, with three de■nitely merged, twoprobably distinct, and one de■nitely distinct. And of the six children inthird grade or lower (aged 9 or younger), three are de■nitely mergedand two probably merged, with only one 3-year-old probably distinct (see§5.2.2.4).
The young children of Seekonk, a group of whom enter (pre)schooland form peer groups every year, adopted the merger around 2000, whenthe current fourth grade was in preschool.6 Figure 5.3 shows neither boys
nor girls in the lead in adopting the merger. Of known factors, age alonepredicts vowel system (within the group of nine families with distinct par-ents). This is especially noteworthy for those families with children bothabove and below the crucial age.

figure 5.3
156 PADS95: Low VOWELSOFSOUTHEASTERNNEw ENGLAND
FIGURE5.3The Children Of Seekonk, Massachusetts
A A A M M
|
II
N
:— |=- le.
9‘ | PM._._,__._._._.,_a-
‘10- ■
4.:MOI-11nd mm
Flaw Famm
Disild
Disid?
DO
I■E
IEIC
I
Three families show that ongoing linguistic change can separate sib-lings: Koslowski, O’Connor, and Ventura. For the Koslowskis, the break
is between their distinct eighth-grade daughter, April, and their merged
fourth-grade daughter, Sharon. For the O’Connors, eighth-grade son Dan-iel is distinct, and 2nd-gradedaughter Alison ismerged. Lessclearly,for theVenturas, fourth-grade son Jacob is probably distinct, and 1st—gradedaugh-terJessica is probably merged.
The younger, merged siblings illustrate how children’s peers can over-throw the patterns they learned from their parents and from their older
siblings, their “■rst peer group” (Payne 1976, 268). But the fact that sib-lings can radically differ in their low vowel systems should not imply thatthey never influence each other. Apart from Sharon Koslowski and Jacob
Ventura, the Seekonk fourth graders do pattern with their siblings. The
two with younger siblings are merged, like those siblings.And the two witholder siblings are, like those siblings, distinct.
5.2.1. THE KOSLOWSKIFAMILY. Tom (PT42M) and Lonnie (PT43F)
Koslowskihaverobust low back distinctions. Their older daughters,Amber(SKi 6F) and April (SKigF), have distinctions that are much lessextreme.Their youngest daughter, Sharon (SKogF), has a total merger of PALM= LOTand THOUGHT.
5.2.1.1. Tomand Lonnie Koslowskz'.Like many adults in Seekonk, Massachu-
setts,Tom Koslowski (a driver) and Lonnie Koslowski (a travel agent) grewup in adjacent Pawtucket, Rhode Island. And like the geographic studysubjects from that city, they both maintain a robust distinction between

×
××
The Family Study 157
PALM= LOT and THOUGHT.As seen in ■gures 5.4 and 5.5, the token cloudsfor the two categories are small and well separated.
Paired t—tests(see §4.3.1.2) give low p-values for Tom, indicating a suredistinction:
ALOT—THOUGHT(PT42M, C, 6) 2 +199:65 (j) = .0006),+374 :151 (p = .002)ALOT—THOUGHT(PT42M, O, 6) = +188 :20 (p = 3 x 10⁶), +336 :90 (j) = .0002)
The average difference in F1 is almost 200 Hz, and in F2 it is around 350Hz. The difference between styles is small and does not show the usual
trend, whereby overt pairs are further apart. All pairs werejudged “differ-ent” by the analyst, aswell as by Tom himself.
Lonnie’s pairs also sounded different to analyst and subject, and mea-sured far apart:
ALOT —THOUGHT(PT43F, C, 6) 2 +285 :53 (p = 4 x 10⁵) +430 i194 (j) = .003)
ALOT —THOUGHT(PT43F, O, 6) 2 +350 i141 (j) = .002), +490 :78 (j) = 2 x 10⁵)
This distinction, of 300 Hz in F1 and 450 HZ in F2, is even larger in rawacoustic terms than that of ABS62M (§4.3.2.1). Lonnie’s overt pairs areslightly further apart than her covert pairs, with one exception. The overtrepetition of naughtysounded “corrected,” and indeed it measuredcloserto the LOT tokens than to the other examples of THOUGHT.
5.2.1.2. Amberand April Koslowskz'.Amber Koslowski (SK16F) had alwayslived in Seekonk and was an eleventh grader at Seekonk High School wheninterviewed. Her low back vowels sounded distinct, but close. Acoustic mea-
surement (■gure 5.6) shows some overlap between LOT and THOUGHT,but
within each pair, the THOUGHTword is usually fronter and lower than thecorresponding LOTword:
ALOT —THOUGHT (SK16F, C, 6) = +1 10 :1 14 (p = .06), +66 :12?) (j) = .23)
ALOT—THOUGHT (SK16F, O, 6) = +147 i139 (p = .05), +216 :154 (p = .02)
Only one covert pair was robustly distinct: Don ~Dawn (+310, +303),exceptional again. Two other covert pairs had a 100+ Hz difference inF1, and two more had a 50+ HZ difference in F1. The sixth covert pair,
tot ~ taught, was pronounced more or less identically: —11, +35.Of the overt pairs, though, only one was truly close: again tot ~ taught
(+58, +41—so still in the “right direction”). The next-closest overt pair,tack~ talk, was nearly 100 Hz apart in F1 and F2. The other four overt pairshad a 100+ Hz difference in one or both formants.
Because of the covert-pair results, we might doubt the pervasiveness ofAmber’s distinction. However, in her spontaneous speech she exhibited the
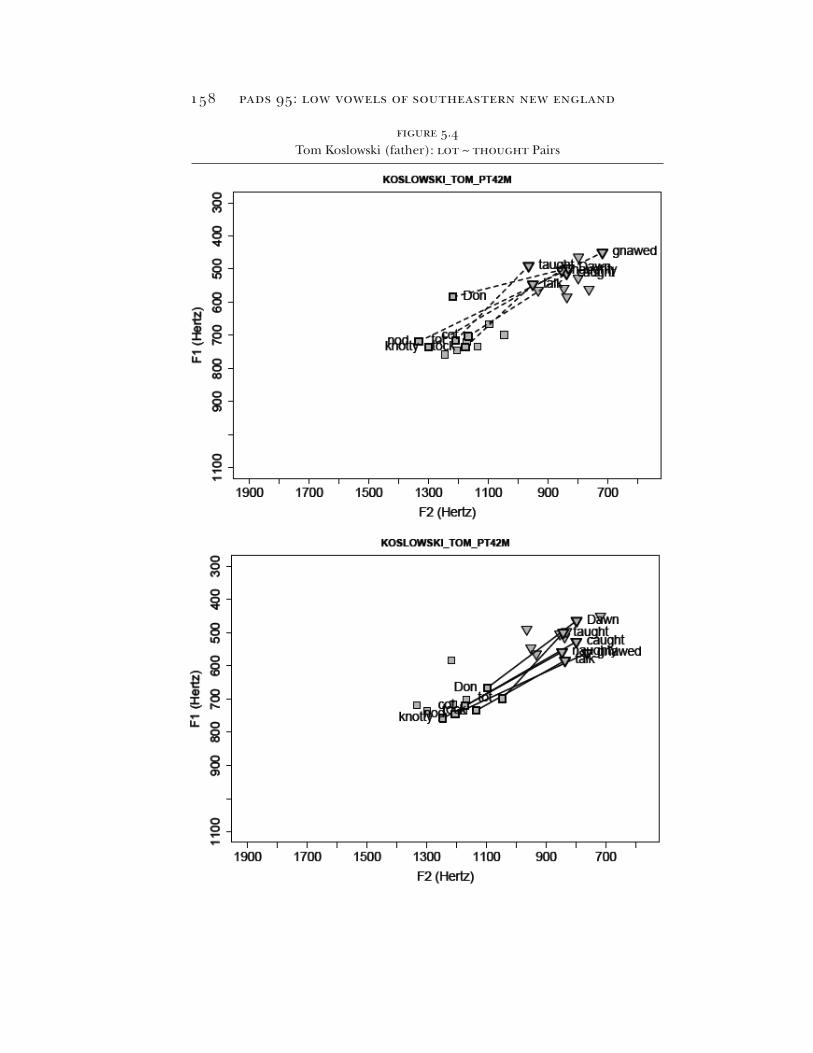
figure 5.4
158 PADS 952 LOW VOWELS OF SOUTHEASTERN NEW ENGLAND
FIGURE5.4Tom Koslowski (father): LOT ~ THOUGHTPairs
F1(
Her
tz)
900
800
700
600
500
400
300
1100
F1(
Her
tz)
900
800
700
600
500
400
300
1100
KOSLOWSKI_TOM_PT42M
I l I I I I I l I I I I
1500 13001900 1700 1100 WU 700
F2 (Hertz)
KOSLOWSKLTOM_PTQM
I I I I I I I I I I I I I I1900 1700 1500 1300 1100 900 700
F2(Hertz)
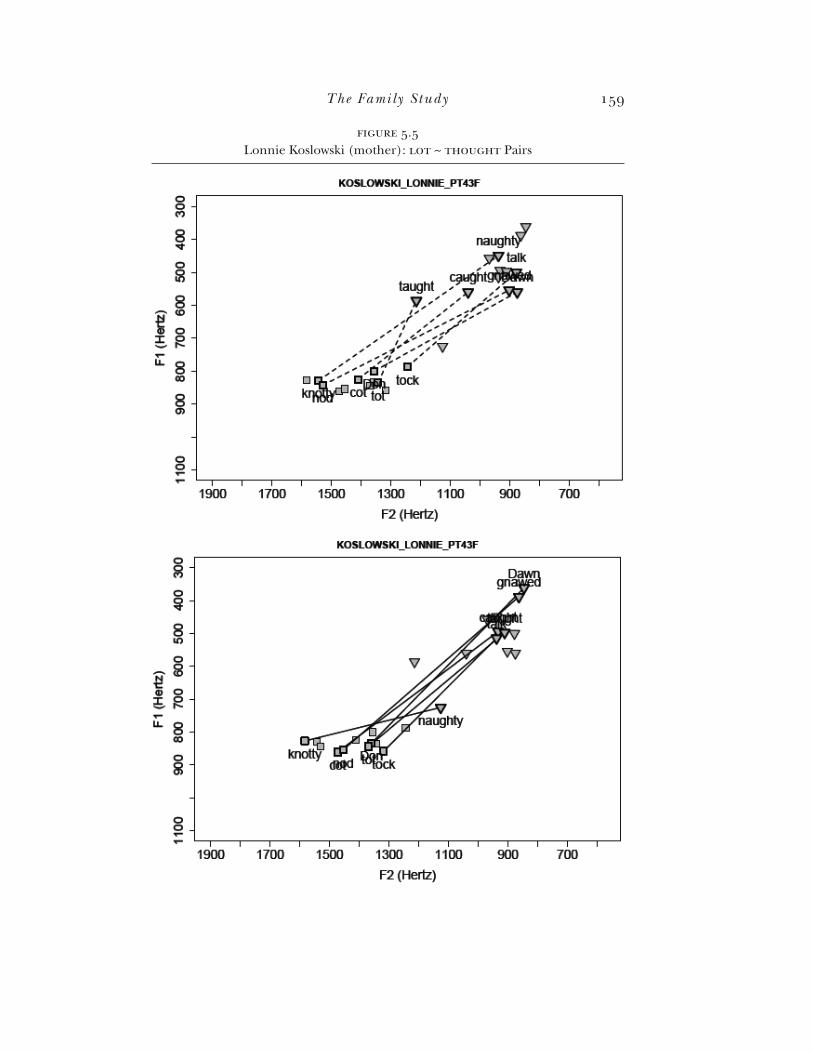
figure 5.5
The Family Study
FIGURE5.5Lmn■eKo■ow■d(nnnhe■:L0r~THOUGHTPa■s
159
F1
(Her
tz)
900
8(1)
700
6C!)
500
4CD
300
F1 (
Hen
z)90
08(
1)70
060
050
040
030
011
0011
00KOSLOWSKLLOIIEJ’HJF
| | I I II
1300 1100 900| I II
1700 15001900 700
F2 (Hertz)
KOSLOWSKI_L0“_PT43F
I I I I I I I I I I I I1900 1700 1500 1300 1100 900 700

figure 5.6
160 PADS 952 LOW VOWELS OF SOUTHEASTERN NEW ENGLAND
FIGURE5.6
Amber Koslowski (oldest sister): LOT ~ THOUGHTPairs
F1(
Her
tz)
900
800
701)
600
500
400
300
F1(
Her
tz)
900
800
7CD
Gm
500
400
SC
!)11
0011
00
KOSLOWSKLABEILS K16F
V Dawnng■■■m 57
‘V
ma? ‘7’D I
,V V
rm1:!
El Dalcot
I l l l l l I I I I I
1900 1700 1500 1300 1100 900 700
F2 (Hertz)
KOSLOWSKLAIBEILSM 6F
I I I I I I I I I I I I I
1900 1700 1500 1300 1100 900 700
F2 (Hertz)

The Family Study 161
sameclose-but-distinctbehavior. She also showedno hesitation in judgingall the minimal pairs to be different.
Note also that if we boost the sample size by combining covert and
overt tokens,we obtain a t—testresult indicative of a modestly sized,but sig-ni■cant, distinction in both F1 and F2:
ALOT—THOUGHT (SK16F, CO, 12) 2 +128 :74 (p = .003), +141 :95 (j) = .008)
April Koslowski (SK13F) had alsoalwayslived in Seekonk.When inter-viewed, she was in eighth grade at Seekonk Middle School, where she
had marked 6 of 7 LOT~ THOUGHTpairs “different” on the school survey.Unlike her parents, but like her older sister, April did not produce large
phonetic differences betweenLOTand THOUGHTwords.However,shegavethe impression of a clear distinction and identi■ed every pair as different.
In ■gure 5.7, her tokens of LOT and THOUGHTform two adjacentclouds, which only overlap slightly. Her overt token of nod does appear inthe middle of the cloud of THOUGHT tokens, but its pair, gnawed, is also an
outlier, measuring higher than all other tokens of THOUGHT.The paired t—testssupport a moderate distinction. For covert pairs, it is
larger in F2 (unlike Amber’s). For the overt pairs, it is consistent, though
not large, in both formants:
ALOT—THOUGHT (SK13F, C, 6) 2 +107 :137 (p = .10), +212 :137 (j) = .01)
ALOT —THOUGHT (SK13F, O, 6) 2 +168 :47 (j) = .0003), +138 :64 (j) = .003)
The closest pair April produced was the covert cot~ caught: +40, +83. Amber
had produced four pairs that were closer than that (measuring along theF1/F2 diagonal).
The Koslowski teenagers have a much closer acoustic distinction than
their parents. This doesnot directly imply change in Seekonk,since theirparents are from Pawtucket. But section 5.2.2 will show that the O’Connor
parents, from Seekonk,alsohaveawide distinction.Amber and April Koslowski’s distinctions are functional, audible,
and phonologically intact. But phonetically, they are narrow—especially
Amber’s. And while a distinction this closemight be able to maintain itself
over time, it would not be too surprising if it were to collapse.
5.2.1.3. SharonKoslowskz'.For Sharon Koslowski (SKogF), this collapse hasoccurred. Sharon was a fourth grader at North Elementary, who marked 6
of 7 pairs “same” on the school survey.She declared all the reading cardpairs “same.” And they sounded the same, except the covert nod ~ gnawed.
Figure 5.8 plots Sharon’s low back vowels.Their combined phonetic
areaisvery similar to that of her older sisters.There are considerableacous-

figure 5.7
162 PADS 952 LOW VOWELS OF SOUTHEASTERN NEW ENGLAND
FIGURE5.7April Koslowski (middle sister): LOT ~ THOUGHTPairs
F1
(Her
tz)
900
BN
700
6a)
500
400
300
F1
(H61
2)
900
SW
700
6(1)
500
400
300
1100
1100
K05 LOWSIO_APRI._SK13F
ll
ll
l
V
Waughtyviz/IV
Vwan? Dew"
“W“?,Dtgtr’n' E.
1900I I I I l Il
1300 1100 900 700
F2 (Hertz)
II
1700 1500
KOSLOWSKI_APR1_SK13F
gnawed
W4": "5' that
[lot
took
:1
1900I I l I I I
1300 1100 900 700
F2 (Hertz)
I I I
1700 1500

fi gure 5.8
1900 1700 1500 1300 1100 900 700
1100
900
800
700
600
500
400
300
KOSLOWSKI_SHARON_SK09F
F2 (Hertz)
F1 (
Hert
z)
cot
Don
knotty
nod
tock
tot
caught
Dawn
naughty
gnawed
talktaught
1900 1700 1500 1300 1100 900 700
1100
900
800
700
600
500
400
300
KOSLOWSKI_SHARON_SK09F
F2 (Hertz)
F1
(H
ert
z)
cot
Don
knotty
nod
tocktot
caught
Dawnnaughty
gnawedtalktaught
The Family Study
FIGURE5.8
Sharon Koslowski (youngest sister): LOT ~ THOUGHTPairs
163
F1(
Her
tz)
900
800
700
600
500
400
300
F1(
Her
tz)
900
800
700
600
500
400
300
1100
1100
KOS LOWSKI_SHARON_SK09F
”Ed Dawn
@13st D
v zI
cgn’ghtEl ,V D
V\naugh‘ty\
■ ht%
knotty 100k
V
ElI I I I I I I I I I I I I I
1900 1700 1500 1300 1100 900 700
F2(Hertz)
KOSLOWSKI_SHARON_SK09F
Dornodnaughty D
DawnV/vl:r
tot IOU
Vwugmgnt‘aEd
El 0311110111
knottyI I I I I I I I I I I I I I
1900 1700 1500 1300 1100 900 700
F2(Hertz)

table 5.2
Speaker Covert Pairs (F1, F2) Mean lot Mean thought lot – thoughtTom, 42 699, 1234 500, 860 +199, +374Lonnie, 43 820, 1405 535, 975 +285, +430Amber, 16 919, 1627 809, 1561 +110, +66April, 13 891, 1480 784, 1268 +107, +212Sharon, 9 871, 1454 817, 1411 +54, +43
Speaker Overt Pairs (F1, F2) Mean lot Mean thought lot – thoughtTom, 42 720, 1150 532, 815 +188, +336Lonnie, 43 846, 1426 496, 936 +350, +490Amber, 16 922, 1601 775, 1385 +147, +216April, 13 864, 1363 696, 1225 +168, +138Sharon, 9 838, 1377 844, 1426 –6, –49
164 PADS95: Low VOWELSOFSOUTHEASTERNNEw ENGLAND
TABLE 5.2The Koslowski Family: Summary of Reading Card Productions
Speaker CovertPairs (F1,F2)Mean LOT Mean THOUGHT ALOT —THOUGHT
Tom, 42 699, 1234 500, 860 +199, +374
Lonnie, 43 820, 1405 535, 975 +285, +430
Amber, 16 919, 1627 809, 1561 +110, +66
April, 13 891, 1480 784, 1268 +107, +212
Sharon, 9 871, 1454 817, 1411 +54, +43
Speaker OvertPairs (F1, F2)Mean LOT Mean THOUGHT ALOT —THOUGHT
Tom, 42 720, 1150 532, 815 +188, +336
Lonnie, 43 846, 1426 496, 936 +350, +490
Amber, 16 922, 1601 775, 1385 +147, +216
April, 13 864, 1363 696, 1225 +168, +138
Sharon, 9 838, 1377 844, 1426 —6,—49
tic differences between most pairs. But there is no regularity to the direc-
tion Of thesedifferences. For example, the overt token Of knottyis 361 HZhigher in F1 than naughty;but the overt nod is 212 Hz lower in F1 thangnawed.The paired t-tests return nonsigni■cant results in all respects:
ALOT —THOUGHT (SKogF, C, 6) = +54 :109 (j) = .26), +43 :138 (j) = .46)
ALOT —THOUGHT (SKogF, O, 6) = —6:20?) (j) = .95), —49:92 (j) = .23)
When Sharonwasaskedif shecould saythe words differently, shepro-duced an accurate imitation Of a distinct pattern. She knows which wordsbelong in which class,perhaps dating from their initial acquisition from herdistinct family. But she normally ignores or suppresses this knowledge. This
makesher an excellent example Ofmerger by expansion. The merger hasliterally taken place within a generation: only four years separate April and
Sharon (neither Ofwhom wasvery interested in the linguistic differencerevealed between them).
Table 5.2 summarizes the Koslowskis’ performances on the readingcard LOT ~ THOUGHTpairs. Highlighted ■gures represent signi■cant differ-
ences(p < .05) on the paired t-test.
5.2.2. THE O’CONNORFAMILY.Jeff (SK37M) and Rochelle (SK37F)O’Connor were clearly distinct. Their children are Daniel (SK14M), with
the distinction, Alison (SKOSF),with a full merger, and Casey(SKogM),Of pre-preschool age. Casey may grow up to be merged, but he currently

××
×
The Family Study 165
exhibits the distinction, reflecting the predominant in■uence of parents
on children his age.
5.2.2.1 .fe■and RochelleO’Connor.While Tom and Lonnie Koslowski moved
from Pawtucket to Seekonk in adulthood, Jeff and Rochelle O’Connor
grew up Seekonk and attended Seekonk High School. Jeff is a correctional
of■cer,while Rochelle stayshome taking careof Caseyand an infant. Theirrobust low back distinctions (■gs. 5.9 and 5.10) are similar to those of theKoslowski parents’.
Jeff’s tokens of LOT and THOUGHTform tight clouds that are well sepa-rated. He judged all six pairs to be “different,” and the paired t—testscon-■rm a de■nite low back distinction:
ALOT—THOUGHT(SK37M,C,6) =+129:60 (j)= .003),+385:79 (j)=6 x 10—5)ALOT—THOUGHT(SK37M,O, 6) 2+154:97 (p= .01),+392:83 (j)=7 x 10—5)
There is only a very small, non-signi■cantincreasein separation for Jeff ’sovert pairs.
Rochelle O’Connor produced an even greater distinction than her
husband, just asLonnie Koslowskihad. Rochelle alsojudged all six pairsdifferent. While Rochelle O’Connor’s THOUGHTwas not as high and back(in absolute acoustic terms) asLonnie Koslowski’s, her LOTwas fronter andlower, so the overall size of the distinction was comparable:
ALOT —THOUGHT (SK37F, C, 5) 2 +337 :190 (j) = .008), +495 :21 1 (j) = .003)
ALOT—THOUGHT (SK37F, O, 6) 2 +308 :1 16 (p = .001), +435 :94 (j) = 8 x 10—5)
Rochelle is slightly less distinct on the overt pairs, suggesting some correc-tion (an extreme distinction can be stigmatized). But even her closest pair,
the overt took~ talk, was far apart (+167, +381); her covert nod ~ gnaweddif-
fered immensely (+571, +761).Although their older children would show approximation of the low
vowels and their younger children merger, the Koslowski and O’Connor
parents show no sign of either.
5.2.2.2. Daniel Peterson.Daniel Peterson (SK14M) is the oldest child ofRochelle O’Connor by her ■rst husband, who was from Wisconsin andFlorida, hence probably distinct and, phonologically at least, like the par-ents Daniel has lived with since age 4. An eighth grader at Seekonk MiddleSchool, Daniel marked all seven LOT ~ THOUGHT items “different” on the
survey.In the interview, he produced a much narrower distinction than his
parents, but still a clear and consistent one (■g. 5.11). He judged all six

figure 5.9
166 PADS95: LOWVOWELSOFSOUTHEASTERNNEw ENGLAND
FIGURE5.9Jeff O’Connor (father): LOT ~ THOUGHTPairs
0_CONNOR_JEFF_SK37M8
_('0
°_
caught9 ,v V«3‘ x’t’a’m‘Wo x’ V;
E 8 _ -——:”{;5:'55:’f: JV'3" I!” "" ughty
ag- manW‘- U
88
_0
§_‘- I I I I I I I I I I I I I
1900 1700 1500 1300 1100 900 700F2(Hertz)
0_CONNOR_JEFF_SK37Ho
—
8O8 _
8_If)
0
18'5 §'E o8 _
8_0:
§_
1900 1700 1500 1300 1100 900 700F2(Hertz)

figure 5.10
The Family Study 167
FIGURE5.10RocheHeCYC0nn0r(nxnhe■:L0r~TH0UGHTPa■s
F1
(Her
tz)
900
800
700
600
500
400
300
F1(
Hem
)90
080
070
060
050
040
030
011
0011
000_COMOR_ROCI’E LLE_SK37F
’ I
I ’ iI ’ II’ /
I’r’ ’ VI I f ’I
4'0” :’
Ir’l’lnl
pt 9%I
r108‘! Ba]
nil ,r’ :1nod D
knottyl l l I l l l l l l l l l l
1900 1700 1500 1300 1100 900 700
F2(Hertz)
o_comon_Rocr£ LLE_SK37F
l l l l l l l l l l 1 l l l
1900 1700 1500 1300 1100 900 700
F2(Hertz)

figure 5.11
168 PADS 952 LOW VOWELS OF SOUTHEASTERN NEW ENGLAND
Daniel Peterson (oldest brother): LOT ~ THOUGHTPairs
FIGURE 5.1 1
F1(
He■
■
900
800
700
600
500
400
300
F1(
Hen
z)90
080
070
060
050
040
030
011
0011
00
0_CONNOR_DANIEL_SK14”
I I I I I I I I I I I I I
1900 1700 1500 1300 1100 900 700
F2 (Hertz)
0_CONNOR_DAIIEL_SK‘I4M
I I | | | I I I | | | I |
1900 1700 1500 1300 1100 900 700
F2(fk■h0

×
The Family Study 169
pairs “different.” Only one pair measured close: the covert tot ~ taught (+47,
+13). Paired t-tests are signi■cant, rejecting the hypothesis of merger. Theyalso show the overt pairs further apart than the covert ones:
ALOT—THOUGHT (SK14M, C, 5) = +68 :54 (p = .03), +175 i135 (j) = .03)
ALOT—THOUGHT(SK14M,O, 6) =+83 :13 (j): 2 x 10—5),+267:68 (1): .0002)
Daniel’s LOT is in the same absolute position as his stepfather’s. Daniel’s
THOUGHTis higher and backer than LOT,in the samedirection ashis step-father’s, but only half as far apart.
There has been much phonetic approximation in Seekonk between
Jeff and Rochelle’sgeneration and Daniel’s. But Daniel’s lowvowelsare stillconsistently distinct in perception and production; they are not acousticallyclose either in reading or spontaneous speech.
Daniel differs from April Koslowski, his classmate, in being higher and
backer—more like their parents’ generation—in both LOTand THOUGHT.Daniel’s distinction is also less in F1 and more in F2 than April’s. But theoverall size of their moderate distinctions is similar.
5.2.2.3. Alison O’Connor.Daniel’s half-sister Alison O’Connor (SKOSF),asecond grader at North Elementary when interviewed, produced vowelssimilar to Sharon Koslowski’s: merged in low-central position.
Alison was given both the picture flashcards and the reading cards. Sheread well, but hesitated on some of the key words in context (covert pairs).
When this happened—or when Alison said catchedfor caughton a picturecard—her mother would model the word, and Alison would repeat it. Her
repetitions of her mother’s pronunciation were quite faithful, including ahigh back THOUGHT.But when Alison then produced the samewords onher own (overt pairs), this phonetic quality disappeared; the pairs sounded
more or lessthe same.Alison did not expressstrong opinions regardingwhether pairs were same or different.
Excluding those words repeated after her mother, Alison O’Connor’svowels (■g. 5.12) resemble Sharon Koslowski’s,in their random appear-ance.The furthest-apart pairs differ in the opposite direction from a MAINpattern: covert knotty is 303 HZ higher than naughty, overt Don is 587 HZhigher than Dawn (while these pairs do sound “backwards,” the auditoryeffect is not that extreme). The nonsignificant t-tests indicate merger:
ALOT —THOUGHT (SK08F, C, 3) = —116 i452 (j) = .39), +28 :588 (j) = .86)
ALOT —THOUGHT (SK08F, O, 5) = —114 i337 (j) = .40), —9i208 (j) = .91)
Sharon Koslowski, age 9, could imitate the low back distinction onrequest; Alison O’Connor, age 8, produced it when repeating her mother’s

figure 5.12
17o PADS95: Low VOWELSOFSOUTHEASTERNNEw ENGLAND
FIGURE5.12Alison O’Connor (middle Sister): LOT ~ THOUGHTPairs
O_CONNOR_ALISON_SKDGF
O
3
8'n I:O
8 El8 knotty
E“ aO I
:5 8 '..t V : talkDon
v Luv/'30 El n—EL'v ’5"§ .3 tockvRV
V V D Elnaugn
E]O
8P I I I I I I I I I I I I I I
1WD 1700 1500 1300 1100 900 700
F2 (Hertz)
0_CONNOR_ALISON_SKDBF
O
3
8 DonInD
8
A.3g El0
5 8E Val
E!
O E! El
8 act,. I: V■htyD
0 Dawn8 knotty
‘- I I I I I I I I I I I I I I
1900 1700 1500 1300 1100 900 700
F2 (Hertz)

×
×
The Family Study 171
words. In more natural speech,both exempli■ed merger by expansion, in
contrast to the distinction shownby their parents and teenagesiblings.
5.2.2.4. CaseyO’Connor.Three-year—oldCaseyO’Connor (SKogM) was taken
care of by his mother at home; he did not yet attend any preschool and had
no signi■cant contact with other children his age. He was given the picture
cards to identify, and some of the resulting tokens, along with somefrom
spontaneousspeech (bolded), are plotted in ■gure5.13.Other than Bob2, which is very high, box, which is fairly high, and all,
which is fairly low, the LOTand THOUGHTclouds are widely separated. With-
out minimal pairs, a paired t—testcannot be run, but an unpaired t—testindicates a signi■cantdistinction in F1 and F2.
The mean value of F1 is 1273 Hz for all 12 LOT tokens and 818 Hz forall 15 THOUGHTtokens, a difference of 455 HZ, with a p-value of g X 10—8.
For F2, the mean is 1793 Hz for LOT and 1319 Hz for THOUGHT,a differ-
ence of 474 HZ, with a p—valueof 2 X 10—7.(If unpaired t-tests are run on‘7—10‘8 range.)Rochelle O’Connor’s data, the p-values are in the same 10
Casey’s distinction sounded wide; indeed, it is the widest measured in
raw acousticterms, though his smallvocal tract is partly responsiblefor thelarge frequency range. By the age of 3, Caseyhas acquired the distinctionof his parents (and brother), dispelling any potential suggestion that 8-year-old Alison (or 9-year-old Sharon Koslowski) is simply too young to havemastered the low vowel distinction.
Assuming the conversion of successivegrades of Seekonk children tothe merger is permanent, we will expect CaseyO’Connor to abandon hisdistinction when he acquirespeers in preschool and kindergarten, like hissisterAlison presumablydid before him.
This conversion will probably happen quickly, judging by the Ven-
tura family. The Ventura parents are clearly distinct, their 10-year-old
son probably distinct, and their 7-year-old daughter probably merged; all
this is expected given their ages.But their 4-year-oldson Eddie wasde■-nitely merged, even though he wasstill home with his mother (like CaseyO’Connor). Eddie hardly had a full peer group, but he did have a few “littlefriends.” Not much peer contact with the merger seemsto have been neces-sary for Eddie to adopt it. Having a merged older sister may have helped.
5.2.3. SUMMARYOFSEEKONKFAMILIES.Table 5.3 summarizesthe vowelmea-surementsfor the O’Connor family. Children of distinct parents in Seekonkshow change, with older children distinct (though not asmuch astheir par-ents), fourth graders divided, and younger schoolchildren merged.

figure 5.13
table 5.3
Speaker Covert Pairs (F1, F2) Mean lot Mean thought lot – thoughtJeff, 37 689, 1323 560, 938 +129, +385Rochelle, 37 985, 1582 648, 1087 +337, +495Daniel, 14 711, 1322 643, 1147 +68, +175Alison, 8 874, 1425 990, 1397 –116, +28Casey,a 3 1273, 1793 818, 1319 +455, +474
Speaker Overt Pairs (F1, F2) Mean lot Mean thought lot – thoughtJeff, 37 710, 1303 556, 911 +154, +392Rochelle, 37 964, 1476 656, 1041 +308, +435Daniel, 14 729, 1304 646, 1037 +83, +267Alison, 8 909, 1462 1023, 1471 –114, –9
a. For Casey, data are from picture cards and spontaneous speech.
172
FIGURE5.1?)
PADS 952 LOW VOWELS OF SOUTHEASTERN NEW ENGLAND
CaseyO’Connor (youngest brother): Tokens of LOT and THOUGHT
F1(
Her
tz)
O_CONNOR_CASEV_SK03M
1000
1100
1200
1300
1400
dogV
walkd 2g Vstrawberries ball2
V V ballcoffee
talksv038
v V
talkd(1881153? °9S
d7 V
talkV
Elbox
all
Eld■,
smklng[I
hot H frogfrog
ElI El09
hockgBob
2200 2000 1800 1600 1400 1200 1000
F2 (Hertz)
TABLE 5.?)
The O’Connor Family: Summary of Reading Card Productions
Speaker
Jeff, 37
Rochelle, 37Daniel, 14
Alison, 8
CaseyfI 3
Speaker
Jeff, 37
Rochelle, 37Daniel, 14
Alison, 8
Mean LOT
689, 1323
985, 1582711, 1322874, 14251273, 1793
Mean LOT
710, 1303
964, 1476
729, 1304
909, 1462
CovertPairs (F1,F2)Mean THOUGHT
560, 938
648, 1087
643, 1147
990, 1397
818, 1319
Overt Pairs (F1,F2)Mean THOUGHT
556, 911
656, 1041
646, 1037
1023, 1471
A LOT —THOUGHT
+129, +385+337, +495
+68, +175
—116,+28+455, +474
A LOT —THOUGHT+154, +392
+308, +435
+83, +267
—114,—9
a. For Casey,data are from picture cards and spontaneous speech.

The Family Study 173
Previously, Seekonk children “agreed to disagree” with respect to the
low back vowels.Most now in ■fth grade or higher have maintained thesystem they inherited from their parents. Those who had the merger keptit, and almost all those who had the distinction kept it.
More recently in Seekonk,inherited distinctions havenot survived theformation of the peer group and the transition to school. Half the fourth
graders, and everyoneyounger (while still old enough to havepeers), haslost the distinction and learned the merger from their peers. AdjacentSouth Attleboro underwent the same change about ten years earlier.
In both places the change appears to have occurred in just a few years.Revisiting the school survey reveals some more variation on either side of
the critical agerange. In general, the school surveyand family studyconcurasto the dynamicsof the recent mergers.
5.3. THE FAMILY STUDY AND THE SCHOOL SURVEY:SEEKONK AND SOUTH ATTLEBORO
Extrapolating from the family study, we would expect the Seekonk twelfth
graders and eighth graders to maintain inherited distinctions, but for thefourth and ■fth graders to be partially merged. The school survey does
reflect this change, though more gradually and with earlier evidence of
merger. The differences between methods are hard to interpret: whilemany children behaved inconsistently between pairs on the survey, not
many clearly did so in the interviews.Figure 5.14 givesthe distribution of school surveyresponsesfor those
Seekonk natives with de■nitely distinct parents who were not also inter-viewed in the family study. For the 37 twelfth graders—at 17 or 18, wellabove the agewhere any merger was observed in the families—92 % marked
more pairs “different” than “same” (62% marked all 7 pairs “different”).
The most merged responses,obtained from only 3% of students,still had 2of 7 pairs marked “different. ’7
For the eighth grade, the family studyhad found four distinct childrenand one with the merger. On the school survey, the ■ve students ranged
from fully distinct to fully merged, with two (40%) marking more pairs“different” than “same.”This suggestsmore merger in perception (schoolsurvey) than production (family study), but the numbers are too small forsigni■cance.
For the fourth and ■fth grade, the family study had found a roughly
even split: ■ve children distinct, three merged. On the school survey, the
13 students spanned the range, but only 15% marked more pairs “differ-

figure 5.14
1 74 PADS 95' LOW VOWELS OF SOUTHEASTERN NEW ENGLAND
FIGURE5.14SeekonkSchoolSurvey:Number of SubjectsversusItemsMarked “Different”
Mean Subjects Pa rents Seekonk6.19 37 Distinct 12th
25 62%
Mean Subjects Parents Seekonk3.2 S Distinct 8th
3.5
3 ,2.5
21.5
20% 20% 20% 20% 20%
Mean Subjects Parents Seekonk2.38 13 Distinct 4th & 5th
4.5 1 31%
ent” than “same.” The difference could be due to sampling error (19= .06,
Fisher’s Exact Test), but more likely, we see perception leading productionhere. (When we compare the same children on both tasks, as in §3.4.2, wesee production can lead perception, aswell asVice versa.)

The Family Study 175
The children of de■nitely distinct parents are losing ground linguisti-cally, but this group is not steadily declining as a proportion of Seekonknatives. They comprise 67% of the 55 twelfth grade natives, 47% of the
15 eighth graders,and 64% of the 25 fourth/ ■fth graders. (Unlike above,these ■gures include children also interviewed in the family study.)
And the proportion of nativeswith one or both parentswith a de■nitemerger—the pattern now being adopted by the rest—is neither large norgrowing. It went from 11% (twelfth grade) to 13% (eighth grade) to 12%
(fourth/ ■fth grade). But we have yet to consider other elements of the pop-ulation, such as in-movers (nonnatives) from distinct and merged areas.
We turn to South Attleboro, where the geographic and family studies
indicated arapid merger someten yearsbefore the one in Seekonk.SeveralSouth Attleboro natives 20 and older—with distinct parents—were distinct,
while an 18-year-old,a 9-year-old,and a 6-year-oldwere merged. The oldestsubject with the merger entered preschool around 1990.
But the school survey reached more subjects, and it shows that not all
South Attleboro teenagerswith an inherited distinction have lost it. Based
on this data (■g. 5.15), the lag between merger in South Attleboro and
merger in Seekonklooks more like ■veyearsthan ten.The native South Attleboro twelfth graders form a fairly flat distribu-
tion with one response at each extreme. Most students were intermediate;
■veof ten (50%) marked more pairs “different” than “same.”This result issimilar to the Seekonk eighth grade.
The SouthAttleboro eighth graders’ distribution is more merged; onlythree of the 11 (27%) marked more pairs “different” than “same.” The
most distinct responsewasone scoreof 6 “different.” The result resemblesthe Seekonk fourth / ■fth grades.
None of the ■veSouth Attleboro fourth graders marked more pairs“different” than “same.” Their distribution spans the merged half of the
spectrum.Despite high responseratesfrom Attleboro schools,the abovedistinct-
parent totals are small. In part, this is becausesomestudentswrote “Attle-boro” under parental origin, when they probably meant South Attleboro.“Attleboro” parents had to be coded as “unknown.”
But even if we call all “Attleboro” parents distinct, the proportion ofSouth Attleboro natives with distinct parents is still much smaller than in
Seekonk,where close to two-thirds have families that preserve the distinc-tion. In South Attleboro, the inflated ■gure would be only 36% (22/61)for twelfth grade, 33% (19/58) for eighth grade, and 38% (12/32) forfourth grade.

figure 5.15
176 PADS95: LOWVOWELSOFSOUTHEASTERNNEw ENGLAND
FIGURE5.15Attleboro School Survey:Number of SubjectsversusItems Marked “Different”
Mean Subjects Parents South Attleboro3.7 10 Dlstlnct 12th
7
6
54
3
2
1
00 1 2 3 4 5 6 7
Mean Subjects Parents South Attleboro2.36 11 Distlnct 8th
76
54
3
21
o0 1 2 3 4 5 6 7
Mean Subjects Parents South Attleboro1.4 5 Distinct 4th
3
2.540%
2
1.520%
1
0.5
00% 0% 0% 0%
0 1 2 3 4 S 6 7
And the proportion of SouthAttleboro nativeswith a merged parent ismuch higher than Seekonk’sapproximate 12% level: 39% (twelfth grade),26% (eighth grade), and 19% (fourth grade). Given this, perhaps it is notsurprising that the merger affected South Attleboro ■rst.

The Family Study 177
This reasoning (see §5.8 and subsequent) suggests that changing com-munity demographics trigger merger, asmore children with merged family
backgrounds enter the mix combining to form eachpeer group asit beginsschool. Under this account, merger doesnot spreadfrom place to place in
a direct sense,nor is it passeddown from older to younger children.Rather, merger by expansion would be the “natural” result of certain
combinations of demographic and linguistic circumstances.]ust asHerold(1990) found the low back merger wherever a large number of Europeanimmigrants had settled in northeast Pennsylvania, it may be that whenever
a certain percentage of Eastern New England families move to adjacent
towns in the Mid-Atlantic territory, the low back distinction will be lostthere.7
5.4. THE FAMILIES OF CUMBERLAND, RHODE ISLAND
Cumberland, Rhode Island (2005 est. pop. 34,000), lies directly west ofSouth Attleboro. The southern corner of the town abuts Pawtucket; the
northwestern end touches Woonsocket.Northeast Cumberland is less densely populated and more affluent.
One family there wasreferred by a SouthAttleboro mother, whosechildrenhad gone to the same preschool, For Pete’s Sake, as one of theirs. Four
more families were recommended by the ■rst one.The ■ve Cumberland families were a homogeneous group. They all
lived in the same part of town, and 12 of their 13 children attend (orattended) the K—5Community School. All ten parents had the distinction,
being either from Rhode Island or another MAIN state.Their children’s low back vowels did not pattern neatly by age, how-
ever. Unlike in Seekonk, there was no one age above which Cumberlandchildren were distinct and below it merged. But ■gure 5.16 does show atrend toward merger, including within families.
The Champagne family had daughters in second grade and kinder-
garten; both were clearly distinct. In the Gill family, a boy in the samekin-dergarten was probably merged, while a sixth-grade girl was de■nitely dis-
tinct, and a third-grade boy probably distinct. The Graham family wasquitelike the Gills: a ■fth-grade boy was probably distinct, and a third-grade girl
de■nitely so,while a girl in preschool wasprobably merged. The Springerfamily showedthe sameprogression, but shifted in time: a distinct twelfth-grade boy, a probably distinct seventh-grade boy, and a fourth-grade boywho was merged in production and on minimal pairs, though he judged
most pairs “different. ’7The Olafson family had a sixth-grade daughter and a

figure 5.16
178 PADS95: LOWVOWELSOFSOUTHEASTERNNEw ENGLAND
FIGURE5.16The Children of Cumberland
l l l I IW GI am Sunny! (Jason D
g-" [Bust-w
g-o:
D WEE
■::
“Merged”
‘5 :2 '"' I Heard
3;: OFeM
mmm— BM“
fourth-grade son, both de■nitely merged. The daughter attended a privategirls’ school in Providence, while the son had always gone to CommunitySchool in Cumberland.
Cumberland’s trend toward merger is clear, but not orderly. Commu-nity School has two merged fourth graders (Springer, Olafson), but also
two distinct third graders (Gill, Graham), a second grader (Champagne),and a kindergartner (Champagne). Other factors in addition to age andparental vowel systems must determine whether a child grows up merged
or distinct here.Within each age cohort at Community School, we could imagine two
separate peer groups, correlated with low back vowel status aswell as otherpersonal characteristics. But this would not explain why we never see a dis-
tinct child with a merged older sibling.The spread of this linguistic change through a school community more
likely happensunconsciously,without piggybacking on a social difference.Presumably, the merger would at ■rst be limited to a few in-movers frommerged areas, or natives with merged parents. Such children would likelybe outsiders to the dominant or popular network. Later, when the mergerbecomes the majority pattern, the only children with the distinction mightbe ones with unusually strong ties to older siblings or other older locals.
If the spread of merger depended on its gaining a positive social evalu-
ation, it is unlikely that we would have seen it take over one elementaryschool in South Attleboro, three in Seekonk, and, probably soon, one inCumberland, with such speed and regularity.

figure 5.17
The Family Study 179
5.5. THE FAMILIES OF WARWICK, RHODE ISLAND
The previous sections have shown that the low back merger is affectingchildren in several communities where the geographic study’s young adults
gave no hint of merger. A ■nal community, Warwick, Rhode Island, was
expected to retain the MAIN distinction more tenaciously,becauseof itslocation and its population being in large part Rhode Island natives.
Warwick is a blue-collar suburb of 87,000 (2005 est. pop.), located ■vemiles south of Providence, on the other side of the city from Cumberland,Seekonk, and Attleboro. According to the 2000 Census, 76% of the popula-tion of Warwick was born in Rhode Island (compared to 69% of Cumber-
land, around 60% of Seekonk,and around 40% of South Attleboro). FiveWarwick families were recruited to participate through school principalsand parent/ teacher associations (one was through a personal connection).
Four of the families had Rhode Island parents with the low back distinction.The Patrick family had merged parents from out of state.8
5.5.1. NATIVERHODEISLANDFAMILIES.Children of distinct parents in War-wick did retain the distinction more than in South Attleboro, Seekonk, and
Cumberland. Still, there were possiblesignsof an incipient merger.In the Bloomberg and Barlow families, as seen on ■gure 5.17, the
four children—aged 8 to 14—were de■nitely distinct. Of the two Mahoneydaughters, Celeste—age 4 and in preschool—was clearly distinct. She maybe equivalent to CaseyO’Connor. But Hope Mahoney—age7 and in ■rstgrade—displayed an unclear pattern.
FIGURE 5.1 7
The Children of Warwick
l l | l |my natal money Fm Pan:
DDS":
._ Elna-w
._::
ElUndea'
._E V— “W0
Q-
(1— O IMetued
[0— OF
mmm— ”mgm UMBIe
|
1 80 PADS 952 LOW VOWELS OF SOUTHEASTERN NEW ENGLAND
In spontaneous speech, and in naming the picture cards, Hope pro-duced sometokensof THOUGHThigh and back (like a distinct speaker)andsome front and unrounded (like a merged speaker). She pronounced mostreading card pairs the same (or very close) when embedded in sentences,but sheclearly distinguished them when they were overt minimal pairs.
For several speakers, more informal stylesyielded pronunciations asso-ciated with current peers,while more self-consciousstylesreflected earlier-acquired norms. ln Hope Mahoney’s case, the earlier norm is her distinctparents’. The peers could be her Warwick friends or her merged cousinRobin, with whom she was playing before her interview.
Seven-year—oldRobin had lived in Warwick for two years,but sheorigi-nally lived in Coventry and went to day care in West Greenwich (smaller,inland Rhode Island towns). Robin was de■nitely merged in spontaneousspeech and probably merged on the picture cards.
Hope Mahoney might have displayed a more consistently distinct pat-tern had she not been interviewed during a visit from Robin, with whomshe spends time about twice a week. That is, Hope may be showing short-
term accommodation toward the merger. But Robin’s merger is itself sig-ni■cant, sinceshehasalwayslived in central Rhode Island and her parentsare distinct. Rhode Island, where the distinction was all but universal 15
years earlier, may be succumbing to merger.The Francesefamily may also show a trend toward merger. Mark, a
third grader, displayed a clear distinction in spontaneous speech; of thereading cards, most pairs sounded different. Greg, a ■rst grader, did notproduce much spontaneous speech. Like Hope Mahoney, he produced anunclear, mixed-sounding pattern in naming the picture cards. He couldimitate his brother’s distinction, but this skill—shared by Sharon Koslowskiand Alison O’Connor—says little about natural production patterns.
5.5.2. THE PATRICKFAMILY.In Seekonk, children with one or both parentsmerged were probably or de■nitely merged themselves. In the Patrick fam-
ily of Warwick, both parents exhibited the merger—at leastat ■rstglance—yet their three children had acquired the distinction, to varying degrees.
This shows that a distinction can be learned from peers even thoughthe corresponding merger was learned from parents. That the distinction is
more entrenched in Warwick must be related to the Patricks’ greater abilityin acquiring it. Besides the issue of change in progress, it is likely that chil-dren of merged parents form an even smaller minority of the school popu-lation in Warwick than in Seekonk. Merged children in Warwick would
havefewer peers like themselves;this presumablypromotes their learningof the distinction.

The Family Study 181
5.5.2.1. Mike Patrick.Mike Patrick (ME48M), a 48-year-oldattorney, grewup in southern Maine, an ENE region. In keeping with this, his PALMwasclearly further front than anyof his LOTor THOUGHTtokens.His spontane-ous LOT~ THOUGHTsounded merged, and all but one of the reading pairssounded the same. Cot ~ caught sounded different to both of us; Mike alsojudged nod ~ gnawed and toch~ talk “different.”
Figure 5.18 shows that Mike’s tokens of LOT and THOUGHTform a sin-gle small cloud in mid-back position, a distribution highly suggestive of thelow back merger. However, when we compare the word classeswith paired
t-tests, this diagnosis becomes much less certain:
ALOT —THOUGHT (ME48M, C, 6) = +50 :37 (j) = .02), +30 :64 (j) = .28)
ALOT—THOUGHT(ME48M,0,6) =+12:25 (j)= .27),+72:72 (j) = .05)ALOT—THOUGHT (ME48M, CO, 12) = +31 :22 (j): .001), +51 :42 (j) = .02)
The Patricks went to college in Providence, then lived in Washington,
D.C., for 12 years before returning to Rhode Island. After 30 years in theMAIN area, then, Mike Patrick appears to have learned a small, almost sub-liminal low back distinction (Mike’s father, from Connecticut, would also
haveexposedhim to it).His formants differed by 20 HZ or more in the “correct” direction 9 of
12 times for F1 and 1o of 12 times for F2, which is unlikely to have occurred
by chance.Mike Patrick doesnot haveatrue merger; his LOTand THOUGHTare not identical.
However, his word classesoverlap almost completely in acoustic space.Mike’s LOTranged from 584 to 746 in F1, from 1020 to 1180 in F2. His
THOUGHTranged from 570 to 697 in F1, from 921 to 1180 in F2. Besidesbeing practically coextensive, these between-pair ranges are larger thanthe averagewithin-pair difference of +31, +51. It seemslikely that anyonelistening to these vowels—for example, Mike’s children—would interpretthem asmerged.
Figure 5.18 helps showwhy Mike Patrick’s distinction is likely nonfunc-tional. His knottyis lower and fronter than his naughty,and similarly, Donislower and fronter than Dawn. However, the overlap is such that naughty isactually lower and fronter than Don.
Hearers can adjust for the acoustic effects of phonetic environment,
so partial overlap between distinct classes is unproblematic. However, itis unlikely that a learner could acquire separate LOT and THOUGHTwordclassesfrom a pattern with near-total overlap, such as Mike’s.
Mike Patrick’s low vowels still look and sound ENE, in their general
positions and their allophonic conditioning. But atop this ENE patternhe has superimposed a small but consistent distinction between LOTand

figure 5.18
182 PADS 952 LOW VOWELS OF SOUTHEASTERN NEW ENGLAND
FIGURE5.18
Mike Patrick (father): LOT ~ THOUGHTPairs
F1(
Her
tz)
850
800
750
700
650
600
550
500
F1
(Her
tz)
850
800
750
700
650
600
550
500
PATRICK_MI(E_M E48“
I I l I I I I I I I I II
1400 1300 1200 1100 1000 900 800F2(Henz)
PATRICK_MI(E_HE48M
1400 1300 1200 1100 1000 900 800F2(Hettz)

The Family Study 183
THOUGHT. How common this process is, how it operates, and what it saysabout phonological representations, remain interesting questions.
5.5.2.2. Clara Patrick. Forty-eight—year old Clara Patrick (TX48F), who
worked for a nonpro■t agency,had learned English upon moving to ElPaso, Texas, from Mexico at age 4. She had a light Spanish accent and dis-played a clear low back merger (■g. 5.19). Shejudged the minimal pairs tobe the same, except one which she called “different” and which soundedclose to the analyst.
Clara’s formants differed by at least 20 Hz in the “correct” direction 6
of 12 times for F1 and 5 of 12 times for F2, a chance-levelperformance.One pair differed widely in the right direction—overt tock589 HZ fronter
than talk—but another was reversed—overt knotty 253 Hz backer thannaughty. The impression of a phonetically wide LOT = THOUGHT class withlittle internal structure was reinforced when the covert and overt tokens
of some words were realized quite differently. The nonsigni■cant pairedt-testsdiagnosemerger:
ALOT —THOUGHT (TX48F, C, 6) = +53 :93 (j) = .21), +134 i253 (j) = .24)ALOT —THOUGHT (TX48F, O, 6) = +13 :49 (j) = .53), —47:1 19 (j) = .36)
ALOT —THOUGHT (TX48F, CO, 12) = +33 :45 (j) = .14), +44 :129 (p = .47)
When the Patrick children were acquiring English, their father’s tiny,regular LOT~ THOUGHTdistinction—assuminghe evenhad it then—wouldhave been lost within allophonic conditioning. Their merged mother wascertainly no model for a word-classdifference, either. Whatever they haveof the distinction, they must have learned from their largely-distinct peers.
5.5.2.3. fuan Patrick. Like his brothers, 15-year-oldjuan Patrick (WW15M)
had gone to preschool in Providence before public school in Warwick,where he wasaninth-grade classmateof the de■nitelydistinct oldestBarlowchild. Juan’s spontaneous speech was judged “very distinct.” His readingcard pairs sounded different, other than the common outlier, Don ~Dawn.
Figure 5.20 does not showJuan’s distinction to be as large acoustically
asit sounded impressionistically,but the existenceof a distinction is clear.The THOUGHTclassforms a fairly tight cloud, with the exception of the twotokens of naughty,which are much lower and fronter, although they remaindistinct from kn0tty. The LOT class ranges very widely, though for the most
part each word is consistent between its covert and overt contexts. Andalthough Don was produced close to the THOUGHTcloud, it is actually keptdistinct from Dawn.

figure 5.19
184 PADS95: LOWVOWELSOFSOUTHEASTERNNEw ENGLAND
FIGURE5.19Clara Patrick (mother): LOT ~ THOUGHTPairs
PATRICK_CLARA_~TX48F
Dawn
§ — vII
s - "o ,’
I,
8 — ,'A
N I
E ’ 1:10 8
_nwugmught gnawedV
3::r~ n-■L-yunv g1“- a ------------------’—---r -\
--------- v---
§ ■yn‘é’gelg;
motV
§_
Dbn
§ — 1:16'00 I 1500 I 14'00 I 13'00 I 12'00 I 11'00 I 1600
F2(Hertz)
PATRICK_CLARA_~1X4BF
§ - v
8_
E F caught
2:..3
‘ El V VIL
g_
U
naughty limnyummdMught
§
Don
I I I I I I I I I I I I I
1600 1500 1400 1300 1200 1100 1000F2(Hertz)

figure 5.20
The Family Study
FIGURE5.20Juan Patrick (oldest brother): LOT ~ THOUGHTPairs
185
F1
(Her
tz)
1000
950
900
850
800
F1
(Het
tz)
1000
950
900
850
800
750
700
750
700
PATRICK_JUAN_WW15M
taught Dawn
7 soughtI.Don
It
Il
I [xv
: u’ 6W. ’ , - —:7 VV
I,,,,, ,rtalka ' — "
_,
v """"""D _
I _______:IV5 V
naughty—‘ tockaat I” IIInq! I:I
'. cot ElI
Dknotty V
ElE!
I I I I I I I I I I I I I I
1700 1600 1500 1400 1300 1200 1100
F2 (Heitz)
PATRICK_JUAN_WW15M
V
I:
El
I I I I I I I I I I I I I I
1700 1600 1500 1400 1300 1200 1100

186 PADS95: LOWVOWELSOFSOUTHEASTERNNEw ENGLAND
Paired t—testsstrongly indicated the distinction for the covert pairs. Forthe overt pairs a more consistent difference, rather than a larger one, made
the verdict even more conclusive:
ALOT —THOUGHT (WW15M, C, 6) = +84 :49 (j) = .007), +150 :164 (j) = .07)
ALOT —THOUGHT (WW15M, O, 6) = +97 :48 (j) = .004), +146 :78 (j) = .005)
There is no doubt that Juan Patrick has acquired the low back distinctionfrom his peers. His productions are somewhatreminiscent of his father’s,in that each word class occupies a wide, overlapping range. However, evenhis closest pair is a healthy 93 Hz apart in F2.
5.5.2.4. Roben‘oPatrick. Twelve-year-old Roberto Patrick—a seventh-grade
classmateof the de■nitelydistinct middle Barlow child—presented a morecomplicated situation with respect to the low back vowels. ln spontaneousspeech, Roberto gave the impression of being distinct, though not de■-nitely. His behavior with the reading cards gave a different impression.
While all pairs were judged “same” by the subject, Don ~Dawn onlysounded close in the covert context, while nod ~ gnawed sounded different
on both repetitions. The other four pairs all showed a new pattern: differ-
ent in the covert context, but as overt pairs, the same.Acoustic measurement (■g. 5.2 1) shows that in the overt context,
Roberto usually produces a higher, backer LOT, leading to smaller within-pair differences. But even the pairs that sounded identical to the ear mostlystill show a small difference in the “right direction”:
ALOT—THOUGHT (WW12M, C, 6) = +1 10 :69 (p = .009), +141 :160 (j) = .07)
ALOT—THOUGHT (WW12M, O, 6) = +74 :88 (j) = .08), +105 :121 (j) = .07)
Several children in other communities have shown a smaller distinction
in more spontaneousstylesthan on overt minimal pairs. That is, they natu-rally produced a pattern closer to that of their peers, who are likely merged,but when confronted with explicit judgments, they revealed knowledge ofthe original distinct pattern acquired from their parents.
On most pairs, Roberto does the opposite. He has a mainly distinct peergroup, which possibly goes hand in hand with a greater distinction in morespontaneous styles. On minimal pairs—and in judgments—he reflects themerged system inherited from his parents in early childhood.
5.5.2.5. Pac0 Patrick. Eleven-year—oldPaco Patrick was two years behindRoberto in school, and his low back vowels were noticeably more merged.
ln spontaneous speech, he sounded probably merged. The reading pairs
tot ~ taught and tock~ talk sounded the same, in both contexts. Nod ~ gnawed

figure 5.21
The Family Study
FIGURE5.2 1Roberto Patrick (middle brother): LOT ~ THOUGHTPairs
F1(
Her
tz)
1W1
F1(
Her
tz)
“DO I
PATRICK_ROBERTO_WW12I90
0l
1100 l
1200
Dawn V
V\naughty \
WI ‘1:thIII B gnaw/
,’ [CV VWD, 1”,”Id‘éut
knotty n,:_D—’—-V
Ina-f?" tot talktock ,’
I I | | I I I | | I
180017001600150014001300120011001000 900F2(Hertz)
PATRICK_ROBERTO__WW12M
800
l
900
l
1100 l
1200 I
Dawn
V
nmE
caV
'I■llbht
'3 wedD E]
coMgc
El
El
nod
I I I I I I I l I I
180017001600150014001300120011001000 900F2(Hertz)

figure 5.22
188 PADS95: LOWVOWELSOFSOUTHEASTERNNEw ENGLAND
FIGURE5.2 2Paco Patrick (youngest brother): LOT ~ THOUGHTPairs
PATRKZK_PACO_WW11M
Dawn
' V V
s; \ V[s _ \Don
‘ D9111911211
A§ ‘ talkV v”?
a - Va xx;3: o ,Y’ htV
_ Ig
g; 3,
w
_
I’, 1’ to D
8_
hvo- I” I’D
_I, n,
o / knotty
."2- n'- nod
1800 1700 1600 1500 1400 1300 1200 1100 1000 900
F2 (Hertz)
PATRICK_PACO__WW11II
na h- V
ug tycaught
O
_E
8_
Aco
g_
V
5 oE 8
89 ' g wed
_ El nod
a- .3180017001600150014001300120011001000 900
F2(Hertz)

table 5.4
Speaker Covert Pairs (F1, F2) Mean lot Mean thought lot – thoughtMike, 48 683, 1102 633, 1072 +50, +30Clara, 48 793, 1328 740, 1194 +53, +134Juan, 15 825, 1438 741, 1288 +84, +150Roberto, 12 983, 1428 873, 1287 +110, +141Paco, 11 973, 1312 870, 1231 +103, +81
Speaker Overt Pairs (F1, F2) Mean lot Mean thought lot – thoughtMike, 48 656, 1090 644, 1018 +12, +72Clara, 48 805, 1164 792, 1211 +13, –47Juan, 15 872, 1333 775, 1187 +97, +146Roberto, 12 948, 1310 874, 1205 +74, +105Paco, 11 937, 1219 851, 1197 +86, +22
The Family Study 189
sounded further apart (covert), then closer together (overt), like Roberto’spairs had, but the other three pairs went the other way: closer in context,
more different as minimal pairs.Like his brother Roberto, Paco clearly distinguishes some pairs while
others are close together or “reversed.” Acoustic measurement (■g. 5.22)shows them on average to be closer together in the overt condition, where
Paco declared most of them “basically the same”:
ALOT—THOUGHT (WW1 1M, C, 6) = +103 i127 (j) = .09), +81 i214 (j) = .38)
ALOT—THOUGHT (WW11M, O, 6) = +86 :157 (p = .22), +22 :132 (1)=68)
Becauseof the inconsistency,none of theseformant differences is statisti-cally signi■cant.
The oldest Patrick brother is the most distinct, the youngest the mostmerged. This makes sense if the distinction is learned gradually from peers:the older brothers have had longer to shift away from the parents’ merged
pattern. Also, if the distinction isweakeningin Warwick, the younger broth-ers’ peer groups may be less robustly distinct models.
Table5.4 showsaverageformant valuesand LOT~ THOUGHTdifferencesfor Mike, Clara, and Juan Patrick, based on covert and overt reading pairs.Roberto and Paco’s reading card performances were less representative oftheir spontaneous speech, but they have nevertheless been included.
TABLE5.4The Patrick Family: Summary of Reading Card Productions
Speaker CovertPairs (F1,F2)Mean LOT Mean THOUGHT A LOT —THOUGHT
Mike, 48 683, 1102 633, 1072 +50, +30
Clara, 48 793, 1328 740, 1194 +53, +134
Juan, 15 825, 1438 741, 1288 +84, +150
Roberto, 12 983, 1428 873, 1287 +110, +141
Paco, 11 973, 1312 870, 1231 +103, +81
Speaker Overt Pairs (F1,F2)Mean LOT Mean THOUGHT A LOT —THOUGHT
Mike, 48 656, 1090 644, 1018 +12, +72
Clara, 48 805, 1164 792, 1211 +13, —47
Juan, 15 872, 1333 775, 1187 +97, +146
Roberto, 12 948, 1310 874, 1205 +74, +105
Paco, 11 937, 1219 851, 1197 +86, +22

190 PADS 952 LOW VOWELS OF SOUTHEASTERN NEW ENGLAND
5.6. INDIVIDUAL CHANGE
Observing the children of the family studyhasled to the following general-izations regarding the trends and possibilities in individuals’ phonologicaldevelopment. These have been observed regarding the low back vowels,but presumably would also apply more generally.
5.6.1. INITIAL ACQUISITIONFROMPARENTSAND REORGANIZATIONWITHPEERS.The youngest children interviewed—who were 3—had alreadyacquired the low back vowel systems of their parents, merged or distinct.
Children probably learn these systemswith their initial phonologies; theright methodology might reveal them at an even younger age.
As soon aschildren have same-agepeers—as opposed to siblings—theyreorganize their low back vowel systems, if necessary. When the family pat-
tern is distinct and the peer group is merged, this can happen very quickly.Several children between the ages of 4 and 6 exhibited the merger quiteclearly, despite having parents and sometimes siblings with the distinction.
The Patrick family showsthe distinction canalsobe learned from peers,but not as quickly as the merger. Twelve-year—oldRoberto Patrick still had
an incomplete distinction, whereasthe oldest child not to have learned apeer merger was 6-year-old Caleb Hayas.
To learn a distinction from peers seems to require quite a homoge-neously distinct peer group, just as a child needs two distinct parents to sol-idly acquire it from them.9 In the Seekonk interviews, no child with a fam-
ily-inherited merger produced the distinction in speech,probably becausethey had some merged peers providing continuity with the home pattern(the school survey is more equivocal; see §5.g.1.3). But in Warwick, with ahigher proportion of distinct peers, the Patrick brothers did showgradualacquisition of the distinction.
Several geographic study seniors had fully acquired the pattern of wherethey lived, despite parents from other dialect areas. An 87-year-old manfrom Mendon, Massachusetts, with parents from England, had fully merged
LOTand THOUGHT.A 63-year-oldwoman from Attleboro, with parentsfromNew York City and Connecticut, merged LOT and THOUGHT and—unless
her parental input was3-D—alsofully separatedPALMand LOT.However, people do not always learn even a merger from their peers.
A 22-year-old Seekonk woman in the geographic study maintained an ENE
pattern; her parents were from nearer to Boston. Section 5.2 tells us that
the MAIN pattern—with its PALM~ LOTmerger—wasdominant where andwhen she grew up.

The Family Study 191
5.6.2. CHANGEIN VOWELSYSTEMSIN LATERLIFE: PHONOLOGICAL.After thechildhood reorganization, a person’s vowel inventory is very unlikely tochange, regardless of exposure to other systems.Several pieces of evidence
support this view.The sharp age cutoff found in Seekonk implies that distinct children
with a distinct peer group do not abandon the distinction because of con-tact with merged younger speakers, including their own siblings. This
echoesHerold (1990), who found that older distinct speakersdid not pick
up their neighbors’ and children’s merger, even after decades of contact(see §1.1).
When they encounter merged peers, children (e.g., Eddie Ventura,§5.2.2.4) can be quick to abandon a distinction they acquired only from
parents and older siblings. But they are slow (e.g., Nora Lucas, §5.1) toabandon a distinction reinforced by their own earlier peers. As children getolder, their susceptibility to merger declines, approaching zero for adults.
Fourteen parents were interviewed who grew up in the MAIN areaand now live in Attleboro; all were still rated “de■nitely distinct” on
LOT~ THOUGHT.Ten parents in South Attleboro and Seekonkgrew up inENE territory; sevenwere still “de■nitely merged,” one “probably merged,”
one “unclear.” On the whole, low vowel systems remain stable after child-hood (see also §3.4.1 and §4.5).
The one father from Attleboro who was “unclear” was, in fact, married
to a Rhode Islander. But the great majority of “mixed” married couples had
not noticeably influenced each other’s low vowels (again, see §4.5).
5.6.3. CHANGEIN VOWELSYSTEMSIN LATERLIFE: PHONETIC.Even if vowel
inventories appear stable—for originally distinct speakers,minimal pairs
are still “different” and a phonetic difference is still clearly audible; fororiginally merged speakers,pairs are still “same”and no distinction is audi-ble—some phonetic change might occur when speakers are exposed to adifferent system from the one they grew up with.
The Seekonk teenagers (§5.2.1.2, §5.2.2.2) now show much narrowerLOT ~ THOUGHT distinctions than their parents do. Assuming they started
out like CaseyO’Connor (§5.2.2.4), the narrowing might have been causedby contact with merged peers or younger siblings. We can always imaginethat a currently distinct speaker might have been more distinct originally.
But it is rarely feasible to test this by comparing movers to people who neverleft their original dialect areas, let alone by carrying out longitudinal stud-ies with the same speakers before and after moving.
With originally merged speakersliving in distinct areas,simple acousticmeasurement can reveal whether or not any separation has occurred. Even

192 PADS95: Low VOWELSOFSOUTHEASTERNNEw ENGLAND
a small statisticallysigni■cantdifference between LOTand THOUGHTmustindicate the effect of exposure to that distinction.
Mike Patrick (§5.5.2.1) showed that a long period of immersion in adistinct environment, even starting in adulthood, can result in the forma-tion (or re-formation) of a small distinction. But this learned distinctiondid not resemble a native one. Mike’s LOTand THOUGHTformed one acous-tic group, and the differences between pairs—e.g., knotty and naughty werefurther front than Don and Dawn—were larger than the word-class differ-
enceswithin pairs. His vowelsalso lacked the difference in rounding thatnative MAIN speakers have.
Mike Patrick could hear his distinction—better than I could—in somepairs, but those he identi■ed as“different” were no further apart in F1 orF2 than the ones he called “same.” There was also no clear effect of word
frequency.For example, the wordsDonand Dawnmust beheard more oftenthan nod and gnawed,yet a similar-sized acoustic separation had occurredfor both pairs.
The mover parents identi■ed in §5.6.2 might display a similar “micro-distinction” if they were analyzed acoustically. South Attleboro and Seekonk
parents who had grown up in the ENE area would be like Mike Patrick,potentially separating LOTand THOUGHT.Attleboro parents who had grown
up in the MAIN areamight be learning to separatePALMand LOT.If adults slightly separate originally merged word classes,given enough
exposure to a distinction, it is very likely that originally distinct vowels will
move closer together, given long-term exposure to a merger (an approxi-
mation that would be undetectable without data from comparable non-movers or a longitudinal study). In both cases, adults’ malleability is lessthan children’s. Adults may accommodate phonetically but probably neverreorganize their vowel systemsto an extent we would call phonological.
5.7. DIALECT CHANGE
Chapter 4’s geographic study discovered that the dialect boundary separat-ing ENE and MAIN low vowel systems did not change very much over the
course of the twentieth century. In most places,senior citizens and youngadults had the samephonological pattern.
However, some younger speakers in the ENE area had collapsed PALMand LOT = THOUGHT, resulting in three-way merger. On the MAIN side ofthe line, the merger of PALM2 LOTand THOUGHTwas seen in South Belling-ham and Assonet, Massachusetts, and was underway in Barrington, Rhode
Island, resulting in the 3-M pattern there too.

The Family Study 193
The family studyfound three-way—mergedchildren in the main part ofAttleboro, Massachusetts, where adults are ENE, and a more abrupt and
dramatic shift in South Attleboro, where adults are MAIN: around 1990,South Attleboro children who had inherited the low back distinction began
to lose it when they entered school. Around 2000, the same thing hap-pened in Seekonk, Massachusetts. These changes did not spread to olderchildren or to adults. There are thus 3-M children whose older siblings and
parents are MAIN (but very young children still match their parents).In nearby Cumberland, Rhode Island, the same change appears less
regular. It hasbeen in progressfor someyears (an 11-year-oldis merged),but is not complete (a 5-year-old is distinct).
In Warwick, Rhode Island, south of Providence, the low back merger
may be incipient. Two of eight children there with distinct parents hadunclear patterns. If the merger is spreading to Warwick, its location makes
a delay compared to the other communities understandable.In that case,we would have an apparent slow spread of merger from
South Attleboro to Seekonk and Cumberland—which border long-merged
areas—to Warwick, which is not that close to any ENE community. The sta-
tus of young people in Providence is important, but unknown.The farther we ■nd the merger from the edgeof the ENE area,the less
easily we can attribute the change to contact with the merged area acrossthe line. Contagious diffusion from one community to the next might have
explained the merger in South Attleboro (if not the decadesof stabilitypreceding it). However, it cannot account for it in central Rhode Island,where Robin Mahoney lived until recently. The merger is spreading fasterthan that model predicts.
Besides the high school students from Queens (§3.5.8), a fourth-gradeclass in Jersey City, NewJersey (not discussed above), gave survey responsesfairly indicative of the low back merger. And the girlfriend of one geographicstudy young adult was fully merged despite having grown up in Manhattan
with NewYork City parents.Basedon theseanecdotal observations,the lowback distinction may be quite widely endangered in the Mid-Atlantic.
5.8. COMMUNITY CHANGE: DEVELOPING
THE MIGRATION HYPOTHESIS
In Seekonk,our best example of community change,children with distinctparents had been entering school and maintaining their distinctions for
most of a century. Then, over just a few years, a change occurred. Such
children now merge PALM= LOTand THOUGHTon entering school. Demo-

194 PADS 95' LOW VOWELS OF SOUTHEASTERN NEW ENGLAND
graphic factors might have caused this change in the following threestages.10
In the ■rst stage, there are not many merged parents in the community,
so the proportion of children entering the peer group with an inherited
merger is less than a certain threshold X. This small number of mergedchildren will learn the distinction from their peers. The majority of distinctchildren will be mainly unaffected by the merged minority. This describesSeekonk some years ago, and Warwick today. It also describes the (merged)
Canadian children who moved to England in Chambers (1992). Com-pletely surrounded by the distinction, children will acquire it, assumingthey are young enough. Chambers’s data suggests the age of 10 or 11 as acut-off, but above we have seen both exceptionally late learners and earlynonlearners.
In the second stage, more merged parents have moved in. The propor-tion of natively merged children entering the peer group is now greaterthan X, but lower than another threshold, Y. Those children will encounter
enough merged peers that they remain merged. But they are not numer-ous enough to stop natively distinct children from remaining distinct. Thiscorresponds to the “agree to disagree” pattern of Seekonk family study chil-dren over 10. Those with a merged parent were merged, those with distinct
parentswere distinct.In the third stage,the proportion of natively merged children exceeds
Y. While distinct children may not be in a minority, they have enough con-tact with merged peers that they lose their inherited distinction. Needless
to say,children with an inherited merger retain it. South Attleboro reachedthe third stage around 1990, Seekonk around 2000. We can also sup-pose that Tamaqua, Pennsylvania, did around 1920, when the children of
merged foreign coal miners overwhelmed the distinction preservedamongthe children of native Americans. No part of southeastern New England hasexperienced a demographic “catastrophe” like the mining areas of north-
eastPennsylvania(Herold 1990). Here, the children of foreign immigrants,while much fewer, have mostly learned the local vowel systemsaccurately.
The more relevant demographic shift is native English-speakingmigra-tion from the ENE area, closer to Boston, into the MAIN area. While this
flow is too small to cause the kind of population growth that accompanied
merger in Roswell,Georgia (B.Anderson 2005), it could havebeen enoughto cause communities to pass through the three stages outlined above,eventually merging PALM2 LOT and THOUGHT.Conversely, migration from
MAIN to ENE could be leading PALMand LOT= THOUGHTto merge in theENE territory.11

The Family Study 195
Indeed, many interviewees pointed out that their communities hadchanged in recent years,with the construction of new neighborhoods andhousing subdivisions. The families occupying this new housing were oftendescribed as having moved from closer to Boston, as real-estate prices rosein suburbs closer to the city.
None of the family study children had both parents from Greater Bos-ton, but about 10% of the young adults in the geographic study did. Most ofthese moves (e.g., to Foxborough or Taunton) did not take them out of the
ENE dialect area. Only when parents moved across the historical boundary
into MAIN territory (e.g., to Blackstone or Seekonk) could the migrationpotentially trigger community change in the low vowels.
If the migration hypothesisis correct, it could explain why the mergeroccurred when it did in the communities where it hasrecently been found.The location of, for example, South Attleboro is a constant; it has alwaysbeen next to, and shared a high school with, Attleboro. The level of migra-
tion from Greater Boston, on the other hand, has not been constant.12
When the senior citizens of the geographic study were growing up, Bos-
ton was a rather far-off place. That people from Greater Boston are nowsettling 50 miles from the city—and sometimes still commuting to it—does
reflect real-estatenecessity,but alsothat suchdistancesare not asdaunting
as before. The study area is evolving from a set of relatively self-suf■cientcities and towns into a network of far-flung suburbs, where people’s homes,
workplaces, and leisure activities are no longer typically con■ned to onecommunity.
5.9. TESTING THE MIGRATION HYPOTHESIS
5.9.1. MIGRATIONDATA FROMTHE SCHOOLSURVEY.The large number of
responses to the demographic questions on the school survey, maximized
here by including children who failed the linguistic testcriteria—e.g., mark-ing pause~paws “different”—allows us to examine demographic trends
over a period of eight years. The migration hypothesis developed in sec-tion 5.8 refers to the composition of children’s ■rst peer groups as they
enter school. However, in Seekonk and South Attleboro, parents have sev-eral options for preschool and kindergarten. Only starting in ■rst grade do
the children living in a certain section of town form a cohort that remainsrelatively stable thereafter.
This section will examine the composition of several of these cohorts ofclassmates since ■rst grade, ignoring later arrivals on the assumption that
they would havehad little (or at least less)linguistic influence. Wehaveno

table 5.5
Distinct Parents (MAIN) C. Other Merged Parent(s) (ENE/#-M)Grade N A. Distinct (Pre-)K B. Other (Pre-)K D. Other (Pre-)K E. Merged (Pre-)K
SK12 84 20% 6.31 48% 6.05 14% 5.25 18% 3.73 — —SK8 20 15% 5.33 50% 3.56 15% 3.33 15% 2.67 5% 4.00a
SK4/5 48 29% 3.08 36% 2.33 12% 2.00 21% 1.00 2% 0.00a
ABS12 66 2% —b 16% 3.45 34% 3.25 48% 1.41 — —ABS8 66 — — 26% 2.43 36% 1.90 38% 0.62 — —ABS4 65 — — 18% 2.11 42% 0.80 34% 1.29 6% 1.33
a. Group with one student.b. Group with one student who marked pause ~ paws “different”; score not counted.
196 PADS95: LOWVOWELSOFSOUTHEASTERNNEw ENGLAND
data from children who were part of the founding group but have moved
away since.For each community and current grade level, we will seehow many stu-
dents remaining from that original ■rst-gradecohort had two distinct par-ents and how many had a merged parent. We will also note how many stu-dents had prekindergarten or kindergarten peers from distinct or mergedcommunities.
To completely support the migration hypothesis,the datawould showeach Seekonk grade to have more of the distinct groups, and/ or fewer of
the merged groups, than the corresponding grade in SouthAttleboro. lde-ally, there should also be a trend over time toward merger in both places.
This would point toward South Attleboro having been in a similar demo-graphic and linguistic position ■veto ten yearsagoasSeekonkisnow.Table5.5 presents the percentage of each subgroup for each cohort, also givingthe mean school survey score for each.
5.9.1.1. Migration into Seekonk.There were 84 current twelfth graders whohad been ■rst-grade contemporaries in Seekonk. For 68% of them, both
parents came from a probably or de■nitely distinct place, while for 18%,
at least one parent was de■nitely merged, a ■gure which included parentslisted as from “Attleboro,” even though some of them would have been
from South Attleboro and therefore distinct (only 2% had a parent fromGreater Boston). Twenty percent of the cohort had distinct parents and hadalso gone to prekindergarten or kindergarten in Rhode Island, where theylikely heard a more robust distinction. None had merged parents aswell asmerged kindergarten or prekindergarten exposure.
TABLE5.5Seekonk and South Attleboro: Proportions and Mean Survey Scores
Distinct Parents (ZVIAIN) C. Other MergedParent(s) (ENE/#—M)Grade N A.Distinct (Pm-)K B. Other (Pm-)K D. Other (Pm-)K E. Merged (Pm-)K
SK12 84 20% 6.31 48% 6.05 14% 5.25 18% 3.73 — —SK8 20 15% 5.33 50% 3.56 15% 3.33 15% 2.67 5% 4.0021
SK4/5 48 29% 3.08 36% 2.33 12% 2.00 21% 1.00 2% 0.0021
ABSl2 66 2% —b 16% 3.45 34% 3.25 48% 1.41 — —ABS8 66 — — 26% 2.43 36% 1.90 38% 0.62 — —ABS4 65 — — 18% 2.11 42% 0.80 34% 1.29 6% 1.33
a. Group with one student.
b. Group with one studentwho marked pause~paws“different”; scorenot counted.

The Family Study 197
There were 20 Seekonkeighth graderswho remained from their ■rst-grade peer group: 65% had two distinct parents, while 20% had a merged
parent (10% had a parent from Greater Boston). Fifteen percent had dis-tinct parents and went to prekindergarten in Rhode Island, while 5% (one
child) had a merged parent and went to prekindergarten in South Attle—boro, which was mainly merged by then.
There were 48 Seekonkfourth and ■fth graders remaining from their■rst-grade cohort: 65% had distinct parents, while 23% had a merged
parent (8% had a parent from Greater Boston). Twenty-nine percent haddistinct parents and had also gone to prekindergarten or kindergarten inRhode Island, while 2% (one child) had a merged parent and had gone topreschool in merged Pittsburgh, moving to Seekonk at age 5.
The founding composition of these three Seekonk peer groups seemsto havebeen very similar. There is only a small increasein merged parent-age,from 18% (SKi 2) to 20% (SK8) to 23% (SK4/5). A similar calculationin section 5.3, considering only students with de■nitely merged parents,also showedno real increase.The percentagewith a personal—kindergar-ten or prekindergarten—merged background is very low. And there hasbeen no decreaseover time in the proportion with parental or personaldistinct backgrounds.
But over the sameeight years,the cohorts’ linguistic pro■lesshift frommainly distinct to fairly merged, with mean survey scores of 5.56 (SK12),
3.68 (SK8), and 2.22 (SK4/5). (Unlike the demographic percentages,these means exclude students who failed the barn~ born or pause~pawscriteria.)
5.9.1.2. Migration into South Attlebom. Under the migration hypothesis, weexpect South Attleboro—which underwent merger earlier—to have moremerged children than Seekonk’s approximate 20%. We also expect anincreasing trend.
Of the 66 twelfth graders who were once part of a ■rst-grade cohort inSouth Attleboro, 18% had two distinct parents, a much lower level than in
Seekonk.Only 2% (one child) had alsogone to prekindergarten and kin-dergarten in Rhode Island. Forty-eight percent of the group had a merged
parent (36% had one from Greater Boston). These levels of merged in-migration are more than twice as high as in any Seekonk grade, despite
having excluded parents listed asfrom “Attleboro,” sincemanywould reallyhave been from South Attleboro and distinct. None of these children had
themselvesattended prekindergarten or kindergarten in a merged com-munity, other than Attleboro.

198 PADS95: LOWVOWELSOFSOUTHEASTERNNEw ENGLAND
Of the 66 South Attleboro eighth graders, 26% had two distinct par-ents, and 38% had a merged parent (21 % had one from Greater Boston).None in this grade said they attended prekindergarten or kindergartenoutside of Attleboro.
Of the 65 South Attleboro fourth graders, 18% had two distinct par-ents, all were South Attleboro natives, and 40% had a merged parent (23%
had one from Greater Boston). Six percent had also moved from mergedcommunities; they had gone to kindergarten in North Attleborough, Fox-borough, Brockton, and Lynn, Massachusetts.
These numbers show no clear trends over time in South Attleboro. Allthree cohorts have approximately 40% with a merged parent, comparedwith 20% in Seekonk. Much, but not all, of the difference is due to parentsfrom Greater Boston, who are far more common in South Attleboro than
in Seekonk.
The proportion of SouthAttleboro children with two distinct parents isonly about 20%, compared to 65% in Seekonk. And while a decent numberof Seekonk ■rst graders came from kindergartens or preschools in RhodeIsland, this was not true in South Attleboro. While Seekonk showed major
changeover the eight years,just the tail end of merger is reflected in SouthAttleboro’s survey scores: 2.43 (ABSi 2), 1.55 (ABSS), 1.24 (ABS4).
5.9.1.3. Discussion of SchoolSurveyMigration Data. In one sense, the demo-graphic information from the school surveys supports the migration hypoth-esis.It shows a substantial difference between Seekonk and South Attleboroin the composition of children’s peer groups; for example, two-thirds ofchildren in Seekonk had two distinct parents—and therefore started off lifewith the distinction—versus only one-■fth of children in South Attleboro.As we know, the communities differ linguistically in the same direction:children in Seekonk retained the distinction for ■ve to ten years longer.
However, the fact that no trends were seen over time within each com-
munity is problematic in severalrespects.South Attleboro’s high propor-tion of children with merged backgrounds—a majority if Attleboro parentshad been included—makes the merger there very understandable. How-
ever, most children only a few years older than ABS1 2 were distinct, and it
seems unlikely that any substantial demographic shift could have occurred
so quickly.While we may wonder why the merger did not happen sooner in South
Attleboro, it may be even more puzzling that it has occurred in Seekonk,given the children’s continued heavily distinct backgrounds there. Accord-
ing to the schoolsurvey,the merger had startedbySKSandwaswell advancedby SK4/ 5. The family study found a sharper shift centered on fourth grade.

figure 5.23
The Family Study 199
But the demographic data shows only a slight increase in the 20% or so of
merged-background children. While this low level might be suf■cient totrigger merger—it would be, according to the model of Yang (2009)—thevirtually flat trend does not help us understand why the change happenedwhen it did.
The mean survey scores on table 5.5 quite closely reflect students’parental and personal backgrounds, aswell as their community and grade.
Figure 5.23 is a graphical representation of the samedata.For the survey’sperception/ evaluation data, the parental effect is very clear for all grades,
except possiblyA1384.The patterns of scoresare gradual and intermediate,though, rather than reflecting the three discrete stagesof merger proposedin section 5.8 based on the production data.
5..9.2 MIGRATION AND JOURNEY-TO-WORK DATA FROM THE CENSUS
5.9.2.1. ENE Migration into MAIN Communities: Seekonkand South Attleboro.
Censusdatagivesan independent estimateof migration. For both 1990 and2000 (Census Bureau 1995, 2003), we can count the people who moved toSeekonk and Attleboro in the previous ■veyears from clearly merged areasof Massachusetts, New Hampshire, and Maine.13
Of Seekonk’s1990 population of 12,252,4.8% had moved since 1985from the abovemerged areas;4.0% if we exclude Attleboro asnot whollymerged. Ten years later, 3.1% of 12,674 moved from the merged areasbetween 1995 and 2000; excluding Attleboro, it was 2.0%. The census
FIGURE5.23Seekonk and South Attleboro: Proportions and Survey Scores
Mea
nS
urve
yS
oon

200 PADS 952 LOW VOWELS OF SOUTHEASTERN NEW ENGLAND
numbers are understandably lower than the school survey’s because the
census includes less-mobile older speakers and the survey counted studentswho moved any number of years ago, not just in the previous ■ve.
In Attleboro, 10.8% of the 1990 population of 35,056 had movedfrom
one of the merged areas above. Between 1995 and 2000, the rate was 9.4%
of 39,1 26. Because census migration ■leshave the city or town asthe small-
est unit of geography, South Attleboro’s levels can only be estimated, at6%, using the school survey’s ■nding that merged in-migration into SouthAttleboro was at roughly two-thirds the citywide rate.
Though not as clearly as in section 5.9.1, we do ■nd more mergedmigration into (South) Attleboro than into Seekonk, as predicted by the
migration hypothesis. However, the trends over time show a decreaseinmerged in-migration, rather than the predicted increase.
The census numbers derive from the whole population, so they includethe mobility (or lack thereof) of sectors that are not relevant for chil-
dren’s learning, such assenior citizens.Also, many families who moved in1995—2000 would either not have children yet or they would be youngerthan those whose merger we aim to explain. Nevertheless,the downwardtrends—especiallythe one in Seekonk—arenot encouraging for the migra-tion hypothesis.
5.9.2.2. MAIN Migration into ENE Communities:Dartmouth and Berkley.Hav-ing inconclusively explored whether ENE migration triggered the PALM2LOT~ THOUGHTmerger on the edge of MAIN territory, we will now seeifMAIN migration might be suf■cient to explain the PALM~ LOT = THOUGHT
merger observedsporadically in ENE territory.In Dartmouth, Massachusetts, most geographic study subjects were ENE,
but the youngest—a 16-year-old boy—was 3-M. He had one MAIN (FallRiver) and one ENE (Dartmouth) parent, which could by itself account for
his three-waymerger; still, it raised the question of whether natively MAINpeers are a major factor in this community.
Out of a 1990 population of 25,904, 989 (3.8%) had moved fromRhode Island, Connecticut, New York, New Jersey, or the MAIN parts of
Massachusettssince 1985.Between1995and 2000, 2,066of 29,296 (7.1%)did the same. Much of the increase came from Fall River, which provided athird of the migration in the ■rstperiod and half in the second.
Thesenumbers arebroadly similar to thosefor ENE migration to MAINcommunities (§5.9.2.1). So, if migration plays a role in merger there, the
samemaywell be the casehere. Dartmouth is a somewhatunusual commu-nity, with many summer homesaswell asa large University of Massachusettscampus, which may contribute to the high levels.

table 5.6
Community Populationa Moved from ENE b Moved from MAIN c
1990 2000 1985–90 1995–2000 1985–90 1995–2000Seekonk 12,252 12,674 4.0% 2.0% 14.0% 10.9%Attleboro 35,056 39,126 10.8% 9.4% 7.1% 7.0%Berkley 3,840 5,300 23.3% 16.6% 6.7% 5.4%Dartmouth 25,904 29,296 19.6% 14.1% 3.8% 7.1%
a. Population 5 years old and over in census year.b. Moved from Maine, New Hampshire, eastern Massachusetts (not Attleboro, Berkley, Dart-
mouth, North Attleborough, or [part-]MAIN communities).c. Moved from Connecticut, Rhode Island, New Jersey, New York, western Massachusetts,
MAIN communities in eastern Massachusetts (not Seekonk).
The Family Study 201
A community where not very much cross-dialect migration was antici-pated was rural Berkley, Massachusetts, one of the smallest towns in the
study area. However, the numbers are not inconsequential at all: between1985 and 1990, 258 of 3,840 (6.7%) moved to Berkley from the MAIN
areasnoted; between 1995 and 2000, it was 286 of 5,300 (5.4%). As inDartmouth, much of the migration was from nearby Fall River, and again it
was a rising proportion: half of the 1985—90movers, three-quarters of the
1995—2000movers.We know from the discussion of South Attleboro and Seekonk that
overall migration rates in the mid-single digits can correspond to substan-tial proportions of the relevant populations of parents and children. Ingeneral, though, much more work needs to be done to test the migration
hypothesis:dating the merger(s) in various communities, gathering appro-priate demographic information, and relating the two.
Table 5.6 summarizes the census migration data. In Seekonk, MAIN
migration is higher than ENE; the reverse is true in Attleboro (thoughSouth Attleboro is likely more balanced), while ENE predominates overMAIN in Berkley and Dartmouth.
5.9.2.3. journeys to Work: Commuting betweenDialect Areas. While this study
generally takes the position that workers (16 and over) would experiencefew changes to their own linguistic patterns by interacting with coworkersin other dialect areas—and that any such changes would have little chanceof percolating down to the young children leading the vowel mergers—it is still interesting to observe a difference between South Attleboro andSeekonk in terms of commuting patterns (see also §4.2).
TABLE5.6Migration from ENE and MAIN Dialect Areas into Seekonk, Attleboro, Berkley,
and Dartmouth, Massachusetts
Community Populationa Movedfrom ENEb Movedfrom [VIAIN CI 990 2000 1985—90 1995—2000 1985—90 1995—2000
Seekonk 12,252 12,674 4.0% 2.0% 14.0% 10.9%
Attleboro 35,056 39,126 10.8% 9.4% 7.1% 7.0%
Berkley 3,840 5,300 23.3% 16.6% 6.7% 5.4%
Dartmouth 25,904 29,296 19.6% 14.1% 3.8% 7.1%
a. Population 5 years old and over in census year.b. Moved from Maine, New Hampshire, eastern Massachusetts (not Attleboro, Berkley, Dart-
mouth, North Attleborough, or [part-]MAIN communities).
c. Moved from Connecticut, Rhode Island, New Jersey, New York, western Massachusetts,
MAIN communities in eastern Massachusetts (not Seekonk).

table 5.7
Community Workers 16 Worked in Other Worked Out or Older Mass. County (ENE) of Mass. (MAIN) 1990 2000 1985–90 1995–2000 1985–90 1995–2000Seekonk 6,784 6,814 7.0% 10.5% 51.3% 49.0%S. Attleboro 3,559 4,071 25.2% 27.4% 26.9% 21.3%Berkley 2,145 3,106 33.2% 36.0% 3.7% 7.2%Dartmouth 12,535 14,100 11.7% 12.8% 5.0% 5.7%
202 PADS 952 LOW VOWELS OF SOUTHEASTERN NEW ENGLAND
TABLE 5.7
Workers in Seekonk, South Attleboro, Berkley, and Dartmouth,
Massachusetts, Who Commute to ENE and MAIN Dialect Areas
Community WarkersI6 Warkedin Other WarkedOut
01"Older Mass. County (ENE) ofMass. (ZVIAIN)I 990 2000 1985—90 1995—2000 1985—90 1995—2000
Seekonk 6,784 6,814 7.0% 10.5% 51.3% 49.0%
S.Attleboro 3,559 4,071 25.2% 27.4% 26.9% 21.3%
Berkley 2,145 3,106 33.2% 36.0% 3.7% 7.2%
Dartmouth 12,535 14,100 11.7% 12.8% 5.0% 5.7%
Here, Census Bureau (2004) tract 6311 is taken as South Attleboro,
workplacesout-of—stateare taken asMAIN, and workplacesin Massachusettsbut outside Bristol County are taken asENE.Theseleaveout the majority ofworkers who work locally or elsewherein Bristol County,which aswe knowis split betweenENE and MAIN.
Seekonk stands out in table 5.7 by having much more commuting toMAIN territory than to ENE. SouthAttleboro isbalancedbetweencommut-ing in both directions, while Dartmouth and especially Berkley have moretoward the ENE territory.
Between 1990 and 2000, Dartmouth and especially Berkley showedincreases in commuting in both directions, which probably corresponds
to them becoming more like “bedroom communities” in general. In SouthAttleboro and Seekonk, which touch Rhode Island, fewer people workedin that state, and more commuted toward Boston. In fact, more than the
migration trends, this journey-to—worktrend is in line with the linguisticchanges observed.
5.10. OTHER HYPOTHESES
The migration hypothesis was intentionally stated as restrictive, almostmechanical: that after an initial period of parental dominance, childrenre-form their dialects exclusively on the model of their ■rst peer groups,and if this means contact with enough natively merged children, nativelydistinct children will become merged (at least in production).
Demographic data from the school survey and US. Census■nds anassociation between migration and merger, but in Seekonk, where the
merger is well documented and dated, there does not seemto have been
a contemporaneous increase in merged in-migration. This makes at least
some modi■cation to the original migration hypothesis necessary.

The Family Study 203
One plausible revision would saythat while a child’s ■rstpeer group isforming, he or she—and by extension the group—is susceptible to influ-
ence from older children, whether it be peers, siblings, other relatives, orless-close contacts.14 Seekonk teenagers had fairly close distinctions; when
younger children heard them, it could have contributed to merger. How-
ever,far closerdistinctions (near mergers) canbe transmitted from genera-tion to generation without their loss.
Or possibly for the peer group to have a certain proportion of childrenwith merged parents is a necessary precondition for the merger, but notsuf■cient to trigger it. Natively merged children could have more or lessin■uence depending on many factors, including social class,or maybe ananalogous set of categories that are more meaningful for children.
Information on class was not systematically gathered in this study,but we can speculate that the children of families from Greater Boston—
especially those who live in new homes in expensivesubdivisions—mighthavehigh prestige.A few such children, who “happen to” havethe merger,might have more influence on their distinct peers than a larger number of
mergedchildrenfrom closerby.15The original migration hypothesisassumedthat the linguistic consen-
sus arrived at by a peer group is essentially predictable from the mix of dif-ferent backgrounds of the children who come together to form the group,just as Trudgill (2004) argues for the “inevitability” of features of colonial
dialects,given their input mixes.But if social classand individual factors like popularity and personality
play an important role, then merger may not be predictable at all.16However, the appearance of merger roughly simultaneously in the three
Seekonk elementary schools suggested that larger-scale factors, like demo-graphics, were indeed primary. Especially because Seekonk is such a long
town from north to south—eight miles separate North and Martin schools,with Aitken in the middle—it seemed unlikely that the merger was spread-ing between schools. A common cause was thus sought in demographics.
Another “global” external causewould be if the merger in the MAINterritory was a conscious reaction against the lower-class, urban, and/ or“Rhode Island” signi■cance of a wide phonetic distinction, or against a stig-matized raised THOUGHTvowel, in particular. In the ENE area, the stigmamight apply to the distinct, fronted PALM.Now, if adolescents were leadingthe mergers, these attitudinal factors could very plausibly be relevant, but it
seems much less likely that 4- to 6-year-olds are aware of them.
The same thing imperils a contagious diffusion account (changespreads between communities). Young children have few peers in other

204 PADS 952 LOW VOWELS OF SOUTHEASTERN NEW ENGLAND
communities, though some do have relatives.And if adults mediated thecontact, the change should show up in the adults, too, which it does not.
South Attleboro, Seekonk, South Bellingham, and Assonet, Massachu-
setts, have all undergone the merger, and Barrington and Cumberland,Rhode Island, have begun to merge. Pawtucket and Warwick, Rhode Island,
may not be far behind. In the rest of the study area,young children weresimply not interviewed, so the merger may well be underway in other his-
torically MAIN communities.However, following section 4.5, events outside the study area—far from
the MAIN-ENE boundary—could affect the interpretation of eventsinsideit. Suppose children are also merging PALM= LOT and THOUGHT further
south and west,where in-migration from low-backmerged areasis rare—for example, in rural Washington County,Rhode Island (1995—2000migra-tion from ENE: 1.5%; from 3-M: 1.0%) or in urban Hudson County, NewJersey (migration from ENE: 0.3%; from 3-M: 0.7%). Linking the mergerto migration would be untenable there; an alternate account of its originwould be needed.
Nor could migration be responsible for the merger of PALM and
LOT= THOUGHT,if it is occurring in remote parts of ENE where migrationfrom MAIN areas is low, such as Washington County, Maine (199 5—2000migration from MAIN: 2.3%), or Coos County, New Hampshire (migrationfrom MAIN: 1.7%). And the necessity of an alternative explanation therewould cast doubt on the migration hypothesis even in places where it madesuper■cial sense, such as along the dialect boundary.
If many three-way-mergedspeakerswerefound in placeslike the above,external accounts appealing to dialect contact would not work. But to clas-
sifyamerger asalanguage-internal change—apartfrom being rather vagueabout its mechanism—is strange when it is a sudden event, rather than, say,the end-product of decades of gradual approximation.
Other external factors could be considered, including the influenceof the massmedia. The media is generally regarded to play a very minorrole, if any, in linguistic change (Chambers 1998). But even if watchingtelevision can be ignored as a passive activity, more interactive media-basedmerged exposure does reach young children.
During one child’s interview in Warwick, a sibling was playing an edu-cational computer game. A song played, its lyrics appeared on the screen,and the child was supposed to ■nd the words that rhymed. The game hadapparently been programmed by merged speakers, since the child wasmeant to select clockand chalk,among other LOT~ THOUGHTpairs. Suchexperiencescould at leastacceleratetendencies toward merger that derivefrom real personal contacts.

The Family Study 205
5.11. SUMMARY OF THE FAMILY STUDY, ETC.
Section 1.5 introduced three “levels” on which to understand merger,in southeastern New England or more generally. The dialect level wasexplored in the geographic study (chap. 4), the individual level with theschool survey (chap. 3). The family study aimed to understand merger atthe community level. Why doesa community merge two vowel classesthatit once distinguished? And why does such merger occur when it does, oftensuddenly?
Some sudden merger was observed in the geographic study and morein the family study,where 47 families with 103 children were interviewed inAttleboro, South Attleboro, and Seekonk, Massachusetts, and Cumberland
and Warwick, Rhode Island.
Attleboro children (§5.1) inherited the LOT ~ THOUGHT merger, and
somewerenow merging PALMwith LOT= THOUGHT.SouthAttleboro adultsdistinguish PALM= LOT from THOUGHT, so the three-way merger amongchildren there was an unexpected development, dating to around 1990.
In Seekonk (§5.2), children of distinct parents were divided. Those over
10 kept the MAIN distinction betweenPALM= LOTand THOUGHT.Youngerchildren lost it around the year 2000. Parents and older siblings were seento maintain the distinction even while younger siblings were merged. But a3-year-old,too young for peers, reproduced his parents’ distinction. Com-pared to the productions of Seekonk children in interviews, the percep-tions recorded on the school survey (§5.3) showed more variability and
evidenceof earlier merger.In Cumberland (§5.4), where adults are also distinct, the same trend
from distinct to merged wasobservedwithin families, but it wasnot possibleto draw a chronological line between the two groups of children, asit was inSouth Attleboro and Seekonk.
Warwick (§5.5) was chosen to see if children further inside the MAIN
territory were resisting the merger better. On the whole, they were, butsigns of incipient merger were present. One family had parents frommerged areas but children who were acquiring the distinction. Acoustic
analysisrevealedthat the father had learned something of it, too.On the individual level (§5.6), children initially acquire their par-
ents’ systems but readily change when they form peer groups. As children
age, their systems become more ■xed. Teenagers and adults are probably
not capable of truly changing their vowel inventories, but some phonetic
changesde■nitelyoccur, evenin the direction of forming new distinctions.Small shifts toward a merger may be more likely to occur, but unless speak-
ers are tracked over time, they are less likely to be detected than small shiftstoward a distinction.

206 PADS95: LOWVOWELSOFSOUTHEASTERNNEw ENGLAND
On the dialect level (§5.7), three-way merger appears to be spreading
from the MAIN-ENE boundary to communities further inside the MAINarea. However, the speed of the apparent spread makes contagious diffu-
sion a questionable explanation. There is actually no clear evidence thatthe merger is not developing far from the historical boundary, aswell asnear it.
On the community level, section 5.8 developed the migration hypoth-
esisfor how a merger takes hold in a distinct place. Based on Herold’saccount of merger by expansion, it focuses on the proportion of a commu-nity’s children with merged backgrounds: with merged parent(s) or whothemselves moved from a merged area. As that proportion rises, natively
distinct children should go from imparting the distinction, tojust maintain-ing it, to suddenly losing it.
Under a radical version of the migration hypothesis, merger does notspread from place to place, nor from younger to older children, nor vice
versa. Demographic changes in the peer group lead to sudden merger, and
the processmay be quite different from whateverusually causesincremen-tation (Labov2007).17
In section 5.9.1, demographic data from the school survey was used toevaluate the backgrounds of children in South Attleboro and Seekonk, the
two communities where suddenmerger wasmost clear.The higher propor-tion of merged backgrounds and lower proportion of distinct backgroundsin South Attleboro would have been suf■cient to explain the differencebetween the communities, had Seekonk not become merged only ■ve toten years later. However, because Seekonk’s population did not becomemuch more merged (or less distinct), the merger that occurred during
the study period may not be attributable to migration. Also, South Attle-boro’s merged-migration rates seemtoo high and too stable to have beenat Seekonk-like levels just a few years earlier. The difference between the
two communities was clearly seen, but not the expected trends within eachplace.
Census data (§5.9.2) con■rmed that there was more ENE migrationinto South Attleboro than Seekonk, considering their entire populationsrather than just schoolchildren and their parents. However, both placesshowed a decrease between 1985—1990 and 1995—2000. Assuming the
migration hypothesisis still tenable, the censusdata alsoshowedthere maybe enough migration from MAIN areasto be responsiblefor merger in theENE territory.
Other hypotheses (§5.1o) seemed less promising, except for the idea
of incorporating social factors. In the end, community merger simply may

The Family Study 207
not be fully predictable. Better understanding the geography of the recent
mergers might challenge any migration account, if merger were found farfrom the dialect boundary, where migration from the other side of it islow.
So far, the facts of change and their implications are more interestingand conVincing than the hypotheses offered to explain them. Further prog-
ressmight come from studying more children, in more places,in greaterdepth. Still, the family study has taught us much about when children’svowel systems develop and redevelop—and when they do not. It has alsotaken the ■rst steps toward explaining where, when, and why communitieschange.

6. CONCLUSIONS
AND EXTENSIONS
This chapter will highlight the most important or surprising ■ndings of thestudy and discuss questions for future research. Some points are worded
more strongly than in the main text.From chapter 1, on vowel merger:
1. When will a merger (or other linguistic change) spread across a dialectboundary, and when will it stop along the boundary, indeed becoming part
of it?
.When contact is not the reason for change, how do children implement
changes in parallel throughout dialect areas?
From chapter 2, on the history of the New England low vowels:
1. All parts of New England originally had the same phonological low vowel
system, where PALM, LOT, and THOUGHT represented three distinct pho-
nemes.
.Two settlement regions came to differ in their phonetics. In Eastern New
England, LOT and THOUGHT were closer, and 250 years later, they merged.
In western New England (and Rhode Island), LOT and PALMwere closer;they also eventually merged. Within each region, these mergers happened
by parallel internal change, not by diffusion.
From chapter 3, the school survey:
1. Children’s judgments of how word pairs sound, or should sound, are sensi-tively affected by both recent and distant exposure to merged and/ or dis-
tinct patterns.
.Peers have the largest effect, but parents have a lasting effect as well, one
that is still clearly visible in responses from 17-year-old high school seniors.
.When parents differ, children resemble their same-sex parent more than
their opposite-sex parent.
.Most children who move to merged areas show acquisition of the merger,but they also still show the effect of having had distinct peers early in life.
.Factors favoring merger are not additive; they interact to reduce each oth-
er’s effects.
.Children younger than high school age respond more accurately to mini-
mal pairs (“same” or “different”) than to near-minimal pairs (“rhyme” or“don’t rhyme”).
209

210 PADS 952 LOW VOWELS OF SOUTHEASTERN NEW ENGLAND
.Younger children generally learn new patterns better, but there are no abso-
lute rules for acquisition under various conditions of exposure.
.Cot ~ caught and tot ~ taught were among the pairs most often judged “differ-
ent” in distinct areas and among the most often judged “same” in merged
areas. Other pairs regularly went the other way.
.A large sample allowed consistent, intricate patterns to emerge from crude,
noisy data.
From Chapter 4, the geographic study:
1. Nearly all the senior citizens clearly had one of two systems:
PALM¢ LOT 2 THOUGHT (ENE) or PALM2 LOT ¢ THOUGHT (MAIN). A few
showed the older three-way distinction (3-D).
.Surrounded by new patterns, people can retain childhood systems for manydecades.
.A sharp geographic boundary was found between ENE and MAIN. It gener-ally matched known settlement patterns, from a time when these systems
did not eXist yet.
One exception to the match is where a city (Woonsocket, RI.) likely in■u-
enced its hinterland (Blackstone, Millville, and South Bellingham, Mass.).
This in■uence would have begun in the nineteenth century, when both
sides were still 3-D, so the boundary could have shifted without the reversal
of any merger.The twentieth-century ENE/ MAIN boundary could not shift without a
merger being reversed, which was observed, temporarily, in only one place
(Assonet,Mass.) under unusual demographic conditions. Normally, anychange would result in three-way merger (3-M).
Most young adults were still ENE or MAIN. Some, especially teenagers, wereunclear or transitional. A few clearly had the new 3-M pattern.
From Chapter5, the family study:
1. Both South Attleboro and Seekonk underwent merger to 3-M quite sud-
denly. In Seekonk, it occurred 5—10years later. It occurred around the sametime in Seekonk’s three elementary schools, which are far apart.
.In two Seekonk families, older children had a distinction like their parents’
(though phonetically closer), while a younger child had a total merger. Thisshows that merger can be acquired from peers and that it does not easily
pass from younger to older children.
.In one of these families, a three-year-old had a clear distinction, like his
parents and 14-year-old brother; his 8-year-old sister was merged.
In other families, children as young as 4 and 5 had a clear merger, unlike
their parents.

Conclusions and Extensions 211
5. Children speak like their parents until they develop a peer group, at whichpoint they can learn a new merger very quickly. A Warwick, Rhode Island,
family showed that children can also learn a distinction from their peers,but it takes much longer.
6. After age 5 or 6, the underlying phonological vowel system is unlikely to
change, although phonetic adjustment can occur. Accommodation toward
merger is harder to detect: a Warwick father from Maine still distinguished
PALMand LOT—but was it less than he used to? However, his 30 years in theMAIN dialect area had led to a tiny, regular LOT ~ THOUGHT distinction, al-
beit one which was acoustically smaller than the allophonic variation within
each class.
7. Many speakers exhibited a difference, although never a dramatic one, be-
tween their productions in spontaneous speech and in reading andjudging
minimal pairs. Their speech was closer to that of their current peers; their
more self-conscious behavior reverted toward their earlier peers’ or parents’
patterns.8. The migration hypothesis sought to explain the mergers in the formerly
MAIN communities of South Attleboro and Seekonk, and the difference in
their timing. Herold (1990) proposed that contact with merged speakers
causes others to abandon their distinctions. Perhaps a substantial number
of ENE speakers arrived ■rst in South Attleboro, then later in Seekonk. The
young children of merged parents, as they formed peer groups with distinct
local children, would be responsible for the others’ merging.
9. Analysisof demographic data from the school surveyand the US. Censuspartially supported the migration hypothesis. By all measures, South Attle-
boro had more ENE in-migration than Seekonk. But the predicted rising
trends over time were not seen.
The low vowel mergers of southeastern New England do not necessarilybehave like the same mergers in other places, let alone like other changes.
Do other linguistic featuresshowa similarly abrupt transition from parentalto peer influence? And do they also show the subtle persistence of earlierpatterns?
A better interpretation of the changes observed in this boundary zonewould require collecting data further away from it. For example, if the
PALM= LOT ~ THOUGHT distinction is breaking down in the Mid-Atlanticgenerally, any local explanation (like the migration hypothesis) will fallshort. Also, a historical and geographic study of the earlier PALM~ LOT
merger would likely reveal enlightening parallels to the changesongoingtoday.
As well as hypothesizing about externally caused change, this volumeemphasized the primacy of internally caused dialect evolution. With a tip of

2 1 2 PADS 952 LOW VOWELS OF SOUTHEASTERN NEW ENGLAND
the hat to the Calvinists of early New England, predestination is hardly too
strong aword to usefor the bestexamplesof dialectsevolving in parallel.Accounts of languagechangethat emphasizeindividual children’s mis-
understandings or errors cannot easilybe reconciledWith the evidence of par-allel innovation, ranging from the relatively far-■ung LOT ~ THOUGHTmerg-
er on nineteenth-century Martha’s Vineyard to the PALM= LOT~ THOUGHTmerger happening simultaneouslyacrosstwenty-■rst—centurySeekonk.
Except perhaps on the school survey, we have seen little evidence of in-dividual agency, or even freedom to deviate from the patterns prescribed bybackground and environment. Children change language—and languagechanges—in regular, if not yet fully predictable, ways.1

NOTES
10.
CHAPTER 1
In this study, the word class PALM is understood to include PALM, START, and
sometimes BATH, as these lexical sets are de■ned in Wells (1982). See section
2.1.3 for the historical evolution of these vowels.The THOUGHT word class includes Wells’s lexical sets THOUGHT and CLOTH,and sometimes NORTH.In Boston, an example of transfer is the merger of BATH-words with the TRAP
set. So [ask] could be replaced by [aesk], without intermediate stages, while
[haf] and [kant] may remain unaffected.
In some nonmining communities in Herold’s study, speakers born after 1960
were found to be merged, even though there was no heavy foreign immigration
to those places. Herold proposes that recent migrants from the mining towns
brought the merger with them. This study will conclude that it is the children
of migrants—foreign or domestic—who are the most in■uential in fostering
change.
We should distinguish between merger by expansion and the idea that mergeris triggered by misunderstandings and other communicative dif■culties. While
the latter hypothesis is logical and appealing, Herold (1990) does not test itdirectly, and it is not clear if children actually experience such dif■culties.
Even under social pressure, a clean re-separation of merged word classes is
unlikely; hypercorrection often occurs. See DeCamp (1958) for an example inOld English dialect geography.
The confounding in some American dialects among, for example, Mary, marry,and merry is another conditioned merger, one that has not been reported to
reverse.Though not technically a merger reversal, if the Southern British English split
between FOOT and STRUT is “gradually spreading northwards” (Trudgill 1986,
29), this would contravene Herzog’s Principle, unless “extralinguistic factors”
are involved (Herzog 1965, 211).Speakers’ perception of difference may block the spread of change from a per-
ceived foreign variety, regardless of any true incompatibility. Boberg (2000)considers this in accounting for the nonin■uence of Detroit speech on the
adjacent Canadian city of Windsor, though ultimately relying most on a version
of structural incompatibility.References to “the low back merger” or “the merger of LOT and THOUGHT”
should be understood to include PALM as well, unless in reference to Eastern
New England. In this volume, the term “low vowel” excludes the lexical set
TRAP.
213

214
11.
12.
13.
14.
15.
16.
17.
18.
19.
PADS 952 LOW VOWELS OF SOUTHEASTERN NEW ENGLAND
The survey elicited the low back vowels in the surnames Hock and Hawk. Later
work would show that the environment before /k/ disfavors the merger (Labov,
Ash, and Boberg 2006, 65).
All the black informants retained the distinction. Fridland (2004) reports
a similar racial difference in Memphis, Tennessee. In general, the speakers
reviewed in this section were white.
On the otherhand,the earliermergersinEasternNewEngland (LOT = THOUGHT)
and in Canada and Western Pennsylvania (PALM= LOT = THOUGHT) resulted in
merged vowels that are noticeably rounded.Merger via the loss of the THOUGHT upglide has been reported more widely
in the South. Feagin (1993) found it among middle-class younger speakersin Anniston, Alabama. The merger has also been observed in Roswell, Geor-
gia, where B. Anderson (2005) attributed it to heavyin—migrationfrom otherdialect areas. But in Grif■n, Georgia, McNair (2005) found glide loss without
merger among younger speakers.Across Canada, the low back merger is essentially complete. Why Canadian
English developedthis wayis beyond the scopeof this study.Labov, Ash, and Boberg’s (2006) larger sample may be more trustworthy than
the smaller selection of telephone operators. For central Pennsylvania, another
set of telephone interviews conducted by Herold in 198 7—88showed solidi■ca-tion and eastward spread of the merger as far as the Susquehanna River (Labov
1991, 32), and yet Labov, Ash, and Boberg report the distinction in Harris-
burg. The differences partly lie in the treatment of places with mixed patterns.
Some studies include these in their isoglosses of merger, while Labov, Ash, and
Boberg tend to exclude them.
The merger’s de■nite presence in Vermont (§2.3.2) and its possible appear-ance in western Massachusetts may be true expansions from Eastern New
England (see chap. 2). The Western Pennsylvania merger also spread to Erie,which had been a Northern city on phonological as well as lexical grounds
(Evanini 2009).
If we use the criterion of split short-a (divided into two discontiguous pho-netic groups, tense and lax, mainly according to the following environment) to
delimit the Mid-Atlantic dialect area, it does not extend northeast much past
New York City. Using the raised THOUGHT criterion, instead, the Mid-Atlantic
extends into southern New England, including the area studied here.
“The tight bundle ofisoglosses that de■nes the southern limit ofthe N [orthern]
C[ities] S[hift] coincides with the North/Midland settlement line, and cuts
across high concentrations of population density and high levels of commu-
nication” (Labov 2003, 15). If we accept that “when two groups are in con-tinuous communication, linguistic convergence is expected and any degree of
divergence requires an explanation” (Labov 2002), then we are led toward astructural incompatibility account (Labov 2003). However, the more nuanced
perspective of Labov (2007) would not expect diffusion of the NCS, a complexstructural shift.

10.
Notes 215
CHAPTER 2
Zelinsky’s Doctrine of First Effective Settlement states that “whenever an empty
territory undergoes settlement, or an earlier population is dislodged by invad-
ers, the speci■c characteristics of the ■rst group able to effect a viable, self-
perpetuating society are of crucial signi■cance for the later social and cultural
geography of the area, no matter how tiny the initial band of settlers.... In
terms of lasting impact, activities of a few hundred, or even a few score, initial
colonizers can mean much more for the cultural geography of a place than the
contributions of tens of thousands of new immigrants a few generations later”
(1973, 13—14).Mufwene’s (1995) Founder Principle is similar.In a more widely accepted view, however, the loss of /r/ in England happened
only later, the earliest American settlers were therefore rhotic, and non-rho-
ticity arose through contact between coastal areas and the prestige variety of
England (see Downes 1998).
Although Connecticut would undergo quite parallel low vowel developmentsto Rhode Island, the linguistic evolutions of the two colonies (one rhotic, onenot) are assumed here to have been essentially independent.
Richards’s (2004, 56) contention that East Anglians were the largest groupaboard the May■owerechoes Fischer’s (1989) exaggerated claims for the pre-eminence of East Anglia in the settlement of Massachusetts Bay. “East Anglia”
refers most precisely to the counties of Norfolk and Suffolk. More loosely, the
term may encompass parts of Cambridgeshire, EsseX, Huntingdonshire, and
Lincolnshire (Banks 1930, 14; V.Anderson 1991, 232). But Fischer (1989)applies it to a much larger eastern region that would have been much morediverse linguistically.
The original Rehoboth settlement was in modern East Providence, not in the
rural town now bearing the name Rehoboth. Usually, the most central and
populous place retained the older name.This classi■cation makes sense for New England, where BATH words caucuswith TRAP or with START = PALM. It breaks down in the Mid-Atlantic, where
BATHcan be a separatetensed/raisedvowelclass.Wakelin (1988, 616) calls unrounded LOT “characteristically South-Western,”
but its appearance in Irish and Caribbean varieties (Wells 1982, 419, 576)—
not to mention most American ones—may show its wider prevalence in Early
Modern English. In other words, in some varieties it may have followed the
path [3] —>[D] —>[o] —>[0].
Due to subsequent mergers, the NORTH words will generally be omitted from
discussion of the THOUGHT-class.This wording may be an editorial ■ourish on Kurath’s part. It is unlikely that
the ■eldworker Lowman asked subjects whether pairs of words rhymed; he wasfollowing Linguistic Atlas of New England protocol.
Franklin Roosevelt, though, born in Dutchess County, New York, 50 years after
Barton, maintains a clear distinction between PALM and LOT.

216
11.
12.
13.
14.
15.
16.
17.
18.
19.
20.
21.
PADS 952 LOW VOWELS OF SOUTHEASTERN NEW ENGLAND
The better-known Wetmore (1959) treats a few New England areas, with simi-
lar results to Chase (1935).Since these northeastern areas are generally conservative, retaining older Mas-
sachusetts words and sounds (Kurath et al. 1939, 2), it is surprising that the
LOT ~ THOUGHT merger is more complete there than in Eastern Massachusetts.
A reviewer points out that in the later-settled areas of interior Northern New
England, dialect mixture might have led to merger, but section 2.4.1 ■nds evi-
dence of merger even in Biddeford and York, Maine, coastal settlements dating
from the 1630s.
Kurath and McDavid (1961) also ■nd 3-D systems—but with PALMfurther back
than LOT—in the Mid-Atlantic (including New York City and Baltimore) and in
the South.Kurath and LANE headquarters were at Brown University in Providence. It is
surprising that no one was familiar enough with the local dialect to prevent this
editorial error, which extended to the whole area covered by Harris.
The main set of Hanley recordings is housed in the American Folklife Center
of the Library of Congress, where it is known as the American Dialect Society
Collection.Some Hanley recordings are very entertaining: one elderly Rhode Islander
plays the ■ddle and shares his misgivings about Rachel Harris’s new husband!This study will judge whether vowel classes are merged or distinct using sepa-
rate (univariate) t-tests for F1 and F2. For a multivariate statistical approach,which considers the values of multiple formants at the same time, see Nycz
(2010).
This was the Plymouth speaker for whom Kurath and McDavid’s (1961) texthad described an ENE pattern (§2.2.5.1), but whose synopsis suggested 3-D(§2.2.5.2).Bloch argues convincingly from LANE evidence that Massachusetts Bay’s settlers
must have been mainly /r/-less, Plymouth’s mainly /r/-ful, and Rhode Island’s
more evenly divided. Later, Plymouth and Rhode Island became largely /r/-less
under Massachusetts’s in■uence.
Another hypothesis invokes contact between Eastern New England and
England, as has also been done to account for its nonrhoticity and broad a
(BATHwords pronounced with the PALMvowel). Suppose that unrounded LOTwas quite widespread in seventeenth-century England and that it spread to all
the colonies, but then the English standard reversed course and rounded LOT
again. Perhaps only Eastern New England joined in that later (eighteenth-cen-
tury?) development. For this account to work, we would have to explain why
LOT did not re-round in Rhode Island, even though nonrhoticity did appearthere (and to some extent, broad a).
One could even propose that these two mergers were caused by the same pho-
nological change in both areas: the lengthening of LOT. In America, LOT is alonger vowel than in England, but only because it has merged with a long class,
PALM or THOUGHT. The old, short, checked LOT class is no more (unless 3-D
varieties remain somewhere). Perhaps all short vowels lengthened (or length

22.
23.
24.
25.
Notes 217
distinctions were lost) in America, which would explain, up to a point, why
the LOT class has undergone merger almost everywhere in America but almost
nowhere else, except Scotland.
The PALM ~ LOT merger is not con■ned to western New England, but has
affected most of the United States and Canada (Labov, Ash, and Boberg 2006).
A larger studywould be necessaryto identify its chronology and cause(s).In Taunton, a third subject gave a largely-distinct response. In New Bedford, asecond speaker had an intermediate pattern. In Bellingham, a second subject
wasmerged on the other four items, but pronounced andjudged Don~Dawn“different,” a pattern later found elsewhere.
In later work, only the distinction would be found in Westport. Pilot studyinformants were only asked if they were “from” the community in question.
Some may have participated even though they did not grow up there from anearly age.The proper name pair Don ~Dawn was the most likely to diverge from a sub-
ject’s other responses, in both directions. There were also examples of produc-
tion disagreeing with perception in both directions.
CHAPTER 3
This age of 13 seems to refer back to the age at interview of one child in Cham-
bers (1992); he was actually only 11 when he moved.Learning to distinguish the arbitrary LOT and THOUGHT classes may be morearduous than learning the partially predictable Philadelphia short-a pattern,
but it is also simpler and does not involve unlearning any preexisting pattern.
The limited data on PALM and LOT did shed some light on the dif■culty of
acquisition of a distinction.
The secondPALM~ LOTitem, originally Osama~ comma,waschanged becausemany children did not know the name Osama.
The regression models below use item effects that are constant across subjects.
Actually, some subjects—e.g., nonrhotic ones, faced with collar ~ caller ID—arelikelier to make such “mistakes” than others, but this type of interaction was not
modeled.
In any regression with categorical predictors, a set of contrasts is used to com-pare the effects of the different factor levels. Here, baseline-treatment contrasts
are used. For example, the baseline level for Mother is “distinct,” so distinct
mothers receive a coef■cient of zero, while all other types of mother are evalu-
ated in comparison to that group.For information on the challenges regarding mixed model hypothesis testing,
see Pinheiro and Bates (2000) and the listserv R—sig—mixed-models (https://
stat.ethz.ch / mailman / listinfo / r-sig-mixed-models).
“Brooklynese” is a stereotype of the New York dialect, although Labov (2001,
226—27) has suggested that the accent of Brooklyn is no different from thatof comparable speakers anywhere else in the metropolitan area. We now

218 PADS95: Low VOWELSOFSOUTHEASTERNNEw ENGLAND
10.
11.
12.
13.
14.
15.
16.
17.
18.
have some evidence that Brooklyn is retaining the traditional New York City
LOT ~ THOUGHTdistinction more tenaciously than Queens. But remember that
the NY1 1 students are not a good sample of the larger community (unlike
those in Brookline and Attleboro). In particular, they had a disproportionately
large level of foreign parentage, even by New York City standards: 74% hadboth parents from a foreign country.
This was demonstrated in section 3.5.6 for AB4. An analysis of SK4 yielded
coef■cients of —1.178 for a merged Mother and —0.703 for a merged Father.
These coef■cients are noticeably smaller than the corresponding —1.736 and
—1.993for 8K1 2.Along with a Subject effect, three separate sets of Item effects were estimated,
based on the different Item patterns observed in the community analyses. The
diVision was based on Current Peers: mainly distinct (NY1 1, SKI 2), merger in
progress (SK8, SK4), and mainly merged (AB, BR, MS).
It was not possible to explore the effect of merged parents among the 155 sub-jects with distinct Origin and Current Peers, because only 9 of them de■nitelyhad a merged parent.
Both ENE and MAIN speakers can make fun of the other pattern. As a child in
Providence, Moulton (1990, 130) found it “incredible that people [in Bos-ton] could pronounce collar and caller both as /‘kn:la/ where we distinguished
them as /‘kola/ vs. /‘k:):la/.” However, the “New York” (Mid-Atlantic) realizationof THOUGHT as [09] is an even more prevalent stereotype; Saturday Night Live’s
“Coffee Talk” sketches are an example. While stigmatizing raised THOUGHT is
not the same as stigmatizing the LOT ~ THOUGHT distinction itself, either atti-
tude could favor the merger.LabOV (2001, 430) reanalyzed Payne’s data with multiple regression, conclud-ing that “the number of times that the speaker was mentioned by peers” was
more important than age of arrival or years since arriVing.
Section 3.4 noted that some adults can live in low-back-merged communitiesfor decades without acquiring the merger, although mergers have elsewhere
(Kerswill 1996) been shown to be learnable throughout the lifespan.The movers’ Item effects resemble the ones from mainly distinct Seekonk and
New York. Moll ~ mall (—0.823) and Otto ~ auto (—0.717) are in the lead asthese
subjects learn the merger; cot~ caught (+0624) trails.Due to missing data, subject totals in this section do not always exactly match
previous sections.Only 16% of natives had either parent from Brookline;just 2% had both. This
re■ects a high level of migration into Brookline, combined with an exodus of
locals.
To be classed asMAIN, a subject had to mark all 7 LOT ~ THOUGHTpairs “differ-ent,” la ~ law “same,” and say that father ~ bother “rhyme.” For ENE and 3-M, all 7
LOT ~ THOUGHT pairs had to be marked “same.” ENE subjects marked la ~ law
“different” and said father ~ bother “don’t rhyme”; 3-M subjects marked la ~ law
“same” and said father ~ bother “rhyme.” Most responses did not fall into any
of these three strict groups. As discussed in section 3.4, intermediacy on the

10.
Notes 219
survey could reflect actual intermediacy in production, a mismatch between
perception and production (possibly related to competing life influences), ora kind of error whereby the subject could or did not fully access his or her lin-
guistic competence in completing the survey.
CHAPTER 4
The Boston stereotype p[a:]k the c[a:]r2'n H[a:]v[9]d Y[a:]d focuses notjust on /r/-
lessness, but on PALM’s front quality. Conversely, raised THOUGHT leads Provi-
dence speakers to be mistaken for New Yorkers when they travel.
Awave account also does not explain why the LOT ~ THOUGHT merger reached
Maine and New Hampshire, but not Rhode Island, which is much closer to
Boston. A gravity model (Trudgill 1974) would also predict the spread of the
merger to Providence.If language changes faster in larger communities—perhaps driven by the diver-
sity or simply the quantity of interactions—we would eXpect purely internal
developments to form geographical patterns mimicking those of a gravity
model.The PALM ~ LOT pairs were problematic, as balm is increasingly pronounced with
/l/, lager is often in the TRAP or FACE class, and logger is sometimes a THOUGHTword. Two supplementary cards read balk, back, Bach, bark and r’s, ah’s, Oz,
aw’s.
The school survey shows that at least in perception, some South Attleboro 17-and 18-year-olds retain their parents’ distinction, while many are intermediate.
See sections 3.5.4 and 5.3.At this time, South Bellingham public school students joined the rest of Bel-
lingham in junior high school. Older generations went to a South Bellingham
school until 8th grade, then optionally to Woonsocket for high school—they
never mixed in school with children from the rest of Bellingham.
Even when F1 and F2 mostly or completely overlap, speakers might use other
acoustic properties not measured in this study (such as duration, glide target,
or spectral slope) to distinguish two vowel classes. The methods used here
might erroneously label them merged.
Another result of long-term contact with a merger is the “Bill Peters effect,”
named for an elderly central Pennsylvanian with a wide LOT ~ THOUGHT dis-
tinction in spontaneous speech, but who produced only a very small difference
when reading minimal pairs, a difference he could not hear (Labov, Yaeger,
and Steiner 1972, 235—36).This is one of the speakers whose 3-M pattern can be understood as a reac-tion to “competing” parental two-vowel systems; his mother is from Fall River
(MAIN), his father from Dartmouth (ENE).Chapter 2 suggested that LOT was, from an early period, closer to THOUGHT in
the area that would become ENE and closer to PALM in what became MAIN.

220
11.
12.
13.
14.
PADS 952 LOW VOWELS OF SOUTHEASTERN NEW ENGLAND
Those seniors excluded from section 4.1.1, because they had not lived mostof their lives in the same community, almost always retained the low vowel pat-
tern of their early childhood homes. A 73-year-old man in Fairhaven, Massa-chusetts, who moved from Warwick, Rhode Island, at age 7, was pure MAIN
in his spontaneous speech and on reading passages,even after 67 years in theENE environment. (On minimal pairs, he did separate PALM ~ LOT, but did
not merge LOT ~ THOUGHT.) Two other examples of adult nonaccommodation
were a 76-year-old husband from Millville, Massachusetts, and his 78-year-old
wife from adjacent UXbridge, Massachusetts—5 5 years of marriage had had noobvious effects on their low vowel systems.Aside from one anomalous minimal-pairjudgment each, UB78F had the ENE pattern, MV76M the MAIN pattern.
A reviewer points out that summer camps may be a major locus of dialect con-
tact. But overnight camp, where nonlocal contact is more likely, is for children
older than the youngest age seen to merge in this chapter.
Yang (2009) argues that a suf■cient level of merged input, even if it is constantrather than increasing, will eventually lead to community-wide merger.The MAIN and ENE systems had undergone complementary mergers already;
only 3-M could easily emerge from their subsequent contact. But if the only dif-
ference between two systems is a single merger, then that merger may spread
more readily.
CHAPTER 5
Barrington, Rhode Island, also showed change, perhaps due to its many tran-
sient and nonnative residents. These factors were especially salient in Bar-
rington, where young natives also eXplicity disclaimed having a Rhode Island
accent.Most of the Attleboro and South Attleboro families were recruited to partici-
pate at parent/ teacher meetings, possibly skewing the sample toward a higher
socioeconomic bracket. Usually both parents were present for the interviews,
but if not, the absent parent was asked to complete the school survey question-
naire.
In Seekonk, when parents gave permission for their children to be in the school
survey, a minority indicated that they were interested in participating further.
Only half of these families agreed to be interviewed. Again, this is far from arandom sample, and likely skewed higher, socioeconomically, than Seekonk as
a whole.
This is despite the fact that the Cumberland sample was more homogeneous
than Seekonk’s. Recruited through a chain of friends, the families lived in the
same neighborhood and many of the children had gone to the same schools.
There was no obvious reason why 13-year-old Mara Parente was ahead of her
peers and her 10-year-old brother in adopting the merger. In fact, her best
friend and cousins were Rhode Islanders, hence likely distinct. But Mara was
10.
11.
12.
13.
14.
Notes 221
fully merged in production and marked all LOT ~ THOUGHT pairs “same” on
the survey.The Seekonk families are annotated on ■gure 5.3 according to the K—5ele-
mentary school their children attended: North, near Attleboro; Aitken, in cen-tral Seekonk; or Martin, in South Seekonk. But elementary school has no clear
effect; the merger seemingly happened across Seekonk at the same time.
Phonetic approximation seems to have preceded merger by at least a few years,
as seen in Amber and April Koslowski and Daniel Peterson. Of course, their
approximated distinctions could have resulted from contact with their youngersiblings’ mergers. But if not, what caused the phonetic approximation? Contact
with other merged speakers? Social factors (e.g., stigmatization of the distinc-
tion or of raised THOUGHT)?Internal factors?
Acoustic analysis (§5.5.2. 1) revealed that the father in this family, Mike Patrick,had developed a “microdistinction” that was practically inaudible. From the
point of view of linguistically in■uencing his children, he would have acted asmerged.
Children with one merged parent and one distinct parent usually presented asmerged. However, they were not as merged as those with two merged parents,
as noted in both interview productions (§5.1) and survey perceptions (chap.
3).Accounts involving contagious or hierarchical diffusion were largely dismissed
in section 4. 5, because it seemed clear that young children—the apparent lead-
ers of merger—have few personal contacts outside their home communities
and thus could hardly participate in these contact-driven processes. Even if
they did take part, we might wonder why the mergers occurred when they did.
After all, South Attleboro has always been located right next to Attleboro; why
did the low back merger suddenly appear in South Attleboro in 1990, rather
than in 1960 or 2020?This migratory mechanismwould be a typeof relocation diffusion, but becausechildren learning their ■rst dialect are the source of change, the process also
involves transmission (Labov 2007). The term transfusion may therefore be
apt.However, migration from near Boston to southeastern New England is not at
all new. Early twentieth-century town records show quite a lot of it, and in the
geographic study, several seniors had a parent who had moved from Greater
Boston, although none had both parents from there. And going back much
further, some communities in the northern part of the study area were ■rst
settled as offshoots of Boston-area towns (see §2.1.2).While not all of these migrants will have grown up in the states they moved
from—they might have moved several times—a fair number will have done so,and in any case the error should be balanced between the two target communi-
ties.
Many of the preschools in the study area accepted children as young as 3, and
some had their own kindergartens, besides prekindergarten. Since the “grades”

222
15.
16.
17.
PADS 952 LOW VOWELS OF SOUTHEASTERN NEW ENGLAND
are less segregated in preschools, they would seem a likely place for children of
different ages to in■uence each other.
In King of Prussia, Pennsylvania, some 45% of the population was nonlocal
and higher status, yet Payne (1976) found it was the migrants who (variably)accommodated, while the local dialect remained intact. About a third ofPayne’s
out-of-state families came from merged areas. Roughly 15% of the popula-tion would thus have been merged, but no spread of merger to the locals was
reported, although admittedly, Paynedoesnot discussthe low backvowels.Demographics could be irrelevant, if prestigious individuals play a major role.
Perhaps the merger would not have occurred in one or both of the communi-
ties, or the chronology could have reversed, if local factors, whose nature has
hardly been probed, were not as they were.
What looks like contagious diffusion is not necessarily contagious diffusion.As a spatial example, if we map the spread of Prohibition across the United
States, we see cases where one state outlawed alcohol shortly before a neigh-
boring one. But since the temperance movement had a long history within
each state,sayingProhibition diffused from stateto statewould be wrong. Asa temporal example, imagine a city with a rising Hispanic population, where
the oldest group of Anglo children knowsno Spanish,a middle group knowssome Spanish, and the youngest group can converse fluently in Spanish. We
would not say that younger Anglo children are incrementally building on the
Spanish competence of their older siblings and friends. Rather, each cohort is
independent and learns Spanish according to the amount of exposure it has to
Spanish-speaking children. (The second example is analogous to the migration
hypothesis.)
CHAPTER 6
Andersen (1988) came to my attention after this study was completed. Explain-
ing the developments found in “open” (often central) versus “closed” (often
peripheral) dialects, his article discusses many matters in similar terms to thisstudy: “There are cases in which the geographical spread of a linguistic inno-
vation is best understood not asdiffused, but asresulting from independent,internally motivated developments in structurally similar dialects” (76), devel-
opments which “may appear to spread merely because they arise in different
places at different times” (54). Andersen also deals with external change andthe differences between the types carried out by adults and children. The latter
occurs when “learners of a language have to infer their individual grammarsfrom speech data manifesting heterogeneous norms of usage which are not
ascribed distinct values by the community” (47). If the heterogeneity is causedby intermarriage across a boundary, Andersen expects the boundary to gradu-
ally shift. The present study concludes that with more migration, changes like
mergers may also “appear to spread,” though they are really caused indepen-
dently in each place, by contact among children from different backgrounds.

REFERENCES
Allen, Harold B. 1976. TheLinguistic Atlas of the UpperMidwest. Vol. 3. Minneapolis:
Univ. of Minnesota Press.
American Languages. 2009. “American Languages:Our Nation’s Many Voices.”Univ. of Wisconsin Digital Collections. http://digital.library.wisc.edu/ 17 11.dl/
AmerLangs.Andersen, Henning. 1988. “Center and Periphery: Adoption, Diffusion, and
Spread.” In Historical Dialectology:Regional and Social, ed. jacek Fisiak, 39—83.
Berlin: Mouton de Gruyter.Anderson, Bridget. 2005. “The 0/3 Merger in Suburban Atlanta as a Case of Phono-
logical Leveling.” Paper presented at the 34th annual conference on New WaysofAnalyzing Variation (NWAV 34), New York, Oct. 20—23.
Anderson, Robert Charles. 1993. “The Great Migration Study Project.” William and
Mary Quarterly, 3rd series, 50: 591—93.Anderson, Virginia Dejohn. 1991. “The Origins of New England Culture.” l/Villiam
and Mary Quarterly, 3rd series, 48: 231—37.Baayen, R. H., D.]. Davidson, and D. M. Bates. 2008. “Mixed-Effects Modeling with
Crossed Random Effects for Subjects and Items.” journal of Memory and Lan—
guage59: 890—412-Bailey, Guy, Thomas Wikle, and Lori Sand. 1991. “The Focus of Linguistic Innova-
tion in Texas.” English l/Vorld—l/Vide12: 195—214.Bailey, Guy, Tom Wikle,]an Tillery, and Lori Sand. 1993. “Some Patterns of Linguis-
tic Diffusion.” Language Variation and Change5: 359—90.Banks, Charles Edward. 1930. The Planters of the Commonwealth:A Study of theEmi—
grants and Emigration in Colonial Times.Boston: Houghton Mif■in.
Baranowski, Maciej. 2007. Phonological Variation and Changein theDialect of Charles—
ton, South Carolina. Publication of the American Dialect Society 92. Durham,
NC: Duke Univ. Press.Bates, Douglas, Martin Maechler, and Bin Dai. 2008. “lmer: Linear Mixed-Effects
Models Using S4 Classes.” R software package. Version 0.999375—27. http://cran.r-project.org/web/packages/lme4/indeX.html.
Bauman, John, and Brent Culligan. 1995. “General Service List.” http://www
.jbauman.com/gsl.html.Bernstein, Cynthia. 1993. “Measuring Social Causes of Phonological Variation in
Texas.” American Speech68: 227—40.Bloch, Bernard. 1935. “The Treatment of Middle English Final and Preconsonantal
R in the Present-Day Speech of New England.” Ph.D. diss., Brown Univ.
Bloom■eld, Leonard. 1933. Language. New York: Holt.
Boberg, Charles. 1997. “Variation and Change in the Nativization of Foreign (a) inEnglish.” Ph.D. diss., Univ. of Pennsylvania.
223

224 PADS 952 LOW VOWELS OF SOUTHEASTERN NEW ENGLAND
. 2000. “Geolinguistic Diffusion and the U.S.-CanadaBorder.” LanguageVari—ation and Change12: 1—24.
. 2001. “The Phonological Statusof WesternNew England.” AmericanSpeech76: 3—29.
.2006. “Sex, Gender and the Phonetics of Canadian English.” Paper present-
ed at the 35th annual conference on New Ways of Analyzing Variation (NWAV
35), Columbus, Ohio, Nov. 9—12.
Boberg, Charles, and Stephanie M. Strassel. 1995. “Phonological Change in Cincin-
nati.” In “Proceedings of the 19th Annual Penn Linguistics Colloquium,” ed.Rajesh Bhatt, Susan Garrett, Chung-Hye Han, and Roumyana Izvorski. Univer—
sity of Pennsylvania WorkingPapersin Linguistics 2.2.Bresnan, Joan. 2007. “Is Syntactic Competence Probabilistic? Evidence from
English Dative Constructions.” Plenary address at the 33rd annual meeting ofthe Berkeley Linguistics Society, Berkeley, Calif., Feb. 9—11.
Campbell, Lyle. 2004. Historical Linguistics:An Introduction.2nd ed. Cambridge,Mass.: MIT Press.
Carver, Craig M. 1987. American Regional Dialects: A Word Geography.Ann Arbor:
Univ. of Michigan Press.Census Bureau. 1994. “Census 1990 Special Tabulation: Census Tract of Work by
Census Tract of Residence (STP 154).” http://mcdc2.missouri.edu/cgi-bin/
ueXploreP/pub/data/stp 154.
. 1995. 1990 CensusofPopulation and Housing: County—to—CountyMigration Flow
Files.Specialproject 312. CD.Washington, DC: US. Dept. of Commerce.
. 2003. Census2000 MigrationData. DVD. Washington, DC: US. Dept. ofCommerce.
. 2004. “Census 2000 Special Tabulation: Census Tract of Work by Census
Tract of Residence (STP 64).” http://www.fhwa.dot.gov/ctpp/tract.htm.
Chambers,J.K. 1992. “Dialect Acquisition.” Language68: 673—705.
.1998. “Myth 15: TV Makes People Sound the Same.” In Language Myths, ed.
Laurie Bauer and Peter Trudgill, 123—31. London: Penguin.Chase, Margaret Taft. 193 5. “The Derivatives of Middle English Short 0 in the
Speech of New England.” Master’s thesis, Brown Univ.
DARE.Dictionaryof AmericanRegionalEnglish.1985—.Ed. Frederic G. CassidyandJoan Houston Hall. 4 vols.to date.Cambridge,Mass.:Belknap Pressof HarvardUniv. Press.
DeCamp, David. 1958. “The Genesis of the Old English Dialects: A New Hypoth-
esis.” Language 34: 232—44.Dillard, J. L. 1995. “American English in the English Diaspora.” In New Approaches
to AmericanEnglish,ed. Zoltan Kovecses,3—18.Budapest:Dept. of AmericanStudies, Eotvos Lorand Univ.
Dobson, E.J. 1957. English Pronunciation, 1500—1700. 2 vols. Oxford: Clarendon.
Downes, William. 1998. Language and Society.2nd ed. Cambridge: Cambridge Univ.
Press.

References 225
Eckert, Penelope. 1989. jocks and Burnouts: Social Categoriesand Identity in theHigh
School.New York: Teachers College Press.
——. 2008. “Where Do Ethnolects Stop?” International journal of Bilingualism 12:
25—42.Evanini, Keelan. 2009. “The Permeability of Dialect Boundaries: A CaseStudy of the
Region Surrounding Erie, Pennsylvania.” Ph.D. diss., Univ. of Pennsylvania.
Feagin, Crawford. 1993. “Low Back Vowels in Alabama: Yet Another Merger.” Poster
presented at the 22nd annual conference on New Ways of Analyzing Variation
in English (NWAVE 22), Ottawa, Oct. 14—17.Fischer, David Hackett. 1989. Albion’s Seed:Four British Folkwaysin America.New York:
Oxford Univ. Press.
——. 1991. “Albion and the Critics: Further Evidence and Re■ection.” l/Villiam
andMary Quarterly,3rd series,48: 260—308.Foulkes, Paul, Gerry Docherty, and Dominic Watt. 1999. “Tracking the Emergence
of Sociophonetic Variation.” In ICPhS 99: Proceedingsof the 14th International
CongressofPhoneticSciences,SanFrancisco,I—7August1999, 1625—28.Berkeley:Univ. of California.
Fridland, Valerie. 1998. “The Southern Vowel Shift: Linguistic and Social Factors.”Ph.D. diss., Michigan State Univ.
——. 2004. “The Spread of the cot/caught Merger in the Speech of Memphians:
An Ethnolinguistic Marker?” Paper presented at the 3rd conference on Lan-
guage Variety in the South (LAVIS III), Tuscaloosa, Ala., Apr. 15—17.
Garde, Paul. 1961. “Ré■ections sur les differences phonétiques entre les langues
slaves.” Word 17: 34—62.
Gordon, Matthew]. 2006. “Tracking the Low Back Merger in Missouri.” In Language
Variationand Changein theAmericanMidland: A NewLookat “Heartland”English,ed. Thomas E. Murray and Beth Lee Simon, 57—68.Philadelphia: Benjamins.
Grandgent, C. H. 1891. “English Sentences in American Mouths.” Dialect Notes 1:198—204.
Guy, Gregory R. 1990. “The Sociolinguistic Types of Language Change.” Diachronica
7: 47—67-Hagerstrand, Torsten. 1953. Innovationsfo'rloppet ur korologisk synpunkt. Lund:
Gleerupska univ.-bokhandeln. Trans. Allan Pred as InnovationDi■usionas aSpatial Process.Chicago: Univ. of Chicago Press, 1967.
Hall, David D. 1990. Rev. of Albion’s Seed:Four British Folkwaysin America, by David
Hackett Fischer.NewEnglandQuarterly63: 657—61.Hall, Robert A., Jr. 1950. “The Reconstruction of Proto-Romance.” Language 26:
6—27.Hall, Stephanie A., Rachel I. Howard, Francesca McLean, John Vallier, and Ross
Gersten, comps. 2002. American Dialect Society Collection (AFC 1984/01 1),Archive of Folk Culture, American Folklife Center, Library of Congress, Wash-
ington, D.C. Revisedby Marcia K Segal,2004.Encoded byjudy Ng, 2006.Harris,]ohn. 1985. PhonologicalVariation and Change:Studiesin Hiberno—English.Cam-
bridge: Cambridge Univ. Press.

226 PADS95: LOWVOWELSOFSOUTHEASTERNNEw ENGLAND
Herold, Ruth. 1990. “Mechanisms of Merger: The Implementation and Distribu-
tion of the Low Back Merger in Eastern Pennsylvania.” Ph.D. diss., Univ. of
Pennsylvania.
. 1997. “Solving the Actuation Problem: Merger and Immigration in Eastern
Pennsylvania.”LanguageVariationand Change9: 165—89.Herzog, Marvin I. 1965. The Yiddish Language in Northern Poland: Its Geographyand
History. Special issue, International journal of American Linguistics 3 1.2.Hock, Hans Heinrich. 1986. Principles of Historical Linguistics. Trends in Linguistics:
Studies and Monographs 34. Berlin: Mouton de Gruyter.
Irons, Terry Lynn. 2007. “On the Status of Low Back Vowels in Kentucky English:
More Evidence of Merger.” Language Variation and Change19: 137—80.
Johnson, Daniel Ezra. 2000. “The Acoustic Correlates of Lip Rounding.” Unpub-
lished MS.
. 2009. “Getting Off the GoldVarb Standard: Introducing Rbrul for Mixed-
Effects Variable Rule Analysis.” Language and Linguistics Compass3: 359—83.Kerswill, Paul. 1996. “Children, Adolescents, and Language Change.” Language
Variation and Change8: 177—202.Kilpatrick, Rachel S. H. 1937. “The Speech of Rhode Island: The Stressed Vowels
and Diphthongs.” Ph.D. diss.,Brown Univ.Kurath, Hans. 1928. “The Origin of the Dialectal Differences in Spoken American
English.” Modern Philology 25: 385—95.Kurath, Hans, Marcus L. Hansen, Bernard Bloch, and Julia Bloch. 1939. Handbook
oftheLinguisticGeographyofNewEngland.Providence,RI: Brown Univ.Kurath, Hans, and Guy S. Lowman, Jr. 1970. The Dialectal Structure of Southern
England: PhonologicalEvidence.Publication of the American Dialect Society 54.University: Univ. of Alabama Press.
Kurath, Hans, and Raven I. McDavid, Jr. 1961. The Pronunciation of English in the
Atlantic States:Basedupon the Collectionsof theLinguistic Atlas of theEastern United
States.Ann Arbor: Univ. of Michigan Press.Labov, William. 1963. “The Social Motivation of a Sound Change.” Word 19: 273—
309.
. 1991. “The Three Dialects of English.” In New Ways of Analyzing SoundChange, ed. Penelope Eckert, 1—44. San Diego, Calif.: Academic Press.
. 1994. Principles of Linguistic Change.Vol. 1, Internal Factors.Oxford: Black-
well.
. 2001. Principles of Linguistic Change.Vol. 2, SocialFactors.Oxford: Blackwell.
2002. “Driving Forces in Linguistic Change.” In Proceedingsof the
2002 International Conference on Korean Linguistics. Seoul: Seoul Na-tional Univ. Available at http://www.ling.upenn.edu/~wlabov/Papers/
DFLC.htm.
. 2003. “Pursuing the CascadeModel.” In SocialDialectology:In Honour ofPe—ter Trudgill, ed. David Britain and Jenny Cheshire, 9—22. Philadelphia: Benja-
mins.
. 2007. “Transmission and Diffusion.” Language 83: 344—87.

References 227
Labov, William, Sharon Ash, and Charles Boberg. 2006. The Atlas of North American
English: Phonetics,Phonologyand Sound Change.Berlin: Mouton de Gruyter.Labov, William, Malcah Yaeger, and Richard Steiner. 1972. A Quantitative Study of
SoundChangein Progress.Philadelphia: US. Regional Survey.Ladefoged, Peter. 1960. “The Value of Phonetic Statements.”Language36: 387—
96.
LANE. Linguistic Atlas ofNewEngland. 1939—43.Director, Hans Kurath. 3 vols. Provi-dence, R.I.: Brown Univ.
Leonard, Clifford S.,Jr. 1978. Review of Proto—Romanceand Sicilian, by Michael L.Mazzola. Language 54: 180—86.
Lusk, Melanie. 1976. “Phonological Variation in Kansas City: A Sociolinguistic Anal-ysis of Three-Generation Families.” Ph.D. diss., Univ. of Kansas.
Maguire, Warren. 2008. “What Is a Merger, and Can It Be Reversed? The Origin,
Status and Reversal of the ‘NURSE—NORTHMerger’ in Tyneside English.” Ph.D.diss., Newcastle Univ.
Majors, Tivoli. 2005. “Low Back Vowel Merger in Missouri Speech: Acoustic Descrip-
tion and Explanation.” American Speech80: 165—79.Malkiel, Yakov. 1984. “Revisionist Dialectology and Mainstream Linguistics.” Lan—
guagein Society13: 29—66.
Martinet, Andre. 1955. Economiedeschangementsphonétiques:Traité dephonologiedia—
chronique.Berne: Franke.McDavid, Raven I.,]r. 1981. “Low-Back Vowels in Providence: A Note in Structural
Dialectology.” journal ofEnglish Linguistics 15: 21—29.McLoughlin, William G. 1978. RhodeIsland: A Bicentennial History. New York: Nor-
ton.
McNair, Elizabeth DuPree. 2005. Mill Villagersand Farmers:Dialect and Economicsin aSmall Southern Town. Publication of the American Dialect Society 90. Durham,
NC: Duke University Press.Metcalf, Allan A. 1972. “Directions of Change in Southern California English.”jour—
nal ofEnglishLinguistics6: 28—34.Mills, Carl. 1980. “The Sociolinguisticsof the /0/ ~ /:)/ Merger in Paci■cNorthwest
English: A SubjectiveReactionTest.”ResearchonLanguageandSocialInteraction13: 345—88.
Moulton, William G. 1968. “Structural Dialectology.” Language44: 451—66.
. 1990. “Some Vowel Systems in American English.” In Studiesin thePronun—
ciationofEnglish:A CommemorativeVolumein Honour ofA. C. Gimson,ed. SusanRamsaran, 119—36.New York: Routledge.
Mufwene, Salikoko S. 1995. “The Founder Principle in Creole Genesis.” Diachronica
13: 83—134.Nycz, Jennifer. 2005. “The Dynamics of Near Merger in Accommodation.” In
Proceedingsof ConSOLE XIII, ed. Sylvia Blaho, Luis Vicente, and Erik Schoor—lemmer, 273—85. Leiden, Netherlands: Dept. of General Linguistics, Univ.
Leiden. Available athttp: // www.hum2 .leidenuniv.nl/ pdf/ lucl/ sole / console 13/
console 13-nycz.pdf.

228 PADS95: LOWVOWELSOFSOUTHEASTERNNEw ENGLAND
. 2010. “Mergers and Acquisition: Linguistic and Social Factors Underlying
Herzog’sPrinciple.” Ph.D. diss.,NewYork Univ.O’Brien, Meredith. 1992. “Linguists Criticize Accent Position.” Spring■eld (Mass)
Union—News,]uly10: 1.Orbeck, Anders. 192 7. Early NewEngland Pronunciation asRe■ectedin SomeSeventeenth
Century TownRecordsofEasternMassachusetts.Ann Arbor, Mich.: Wahr.
Orton, Harold, et al., eds. 1962—71.SurveyofEnglish Dialects.B: TheBasicMaterial. 4vols.,eachof?) parts. Leeds:Arnold.
Payne, Arvilla C. 1976. “The Acquisition of the Phonological System of a SecondDialect.” Ph.D. diss., Univ. of Pennsylvania.
.1980. “Factors Controlling the Acquisition of the Philadelphia Dialect by
Out-of-State Children.” In Locating Language in Time and Space,ed. William
Labov, 143—78.NewYork:Academic Press.Pinheiro,]osé C., and DouglasM. Bates.2000. Mixed—E■ectsModelsin SandS—PLUS.
New York: Springer.
Pop, Sever. 1950. La dialectologie:Apercu historiqueet methodesd’enqueteslinguistiques. 2vols. Louvain, Belgium: Chez l’Auteur.
Richards, Eric. 2004. Britannia’s Children: Emigration from England, Scotland, Wales
and Ireland since1600. London: Hambledon and London.Sankoff, Gillian. 2004. “Adolescents, Young Adults, and the Critical Period: Two
Case Studies from ‘Seven Up.’” In Sociolinguistic Variation: Critical Reflections,ed.
Carmen Fought, 121—39.Oxford: Oxford Univ. Press.Smith,]ennifer, Mercedes Durham, and Liane Fortune. 2007. “‘Mam, My Trousers
Is Fa’in Doonl’: Community, Caregiver, and Child in the Acquisition of Varia-
tion in a Scottish Dialect.” Language Variation and Change19: 63—99.Terrell, Tracy D. 1976. “Some Theoretical Considerations on the Merger of the Low
Vowel Phonemes in American English.” In Proceedingsof theSecondAnnual Meet—
ing of theBerkeleyLinguistics Society,February 14—16,I 976, ed. Henry Thompson,Kenneth Whistler, Vicki Edge,]eri]aeger, RonyaJavkin, Miriam Petruck, Chris-
topher Smeall, and Robert D. van Valin, 350—59.Berkeley: Berkeley LinguisticsSoc., Univ. of California.
Thomas, Erik R. 2001. An Acoustic Analysis of VowelVariation in New World English.Publication of the American Dialect Society 85. Durham, N.C.: Duke Univ.
Press.Trudgill, Peter. 1974. “Linguistic Change and Diffusion: Description and Explana-
tion in Sociolinguistic Dialect Geography.”Languagein Society3: 215—46.
.1986. Dialects in Contact.Oxford: Blackwell.
. 2004.New—DialectFormation:TheInevitahilityof ColonialEnglishes.Edinburgh:Edinburgh Univ. Press.
Trudgill, Peter, and Tina Foxcroft. 1978. “On the Sociolinguistics of Vocalic Merg-
ers: Transfer and Approximation in East Anglia.” In Sociolinguistic Patterns in
British English, ed. Peter Trudgill, 69—79.London: Arnold.

References 229
Wakelin, Martyn F. 1988. “The Phonology of South-Western English, 1500—1700.”
In Historical Dialectology:Regional and Social, ed. Jacek Fisiak, 609—44. Berlin:
Mouton de Gruyter.Weinreich, Uriel, William Labov, and Marvin I. Herzog. 1968. “Empirical Founda-
tions for a Theory of Language Change.” In Directionsfor Historical Linguistics:A Symposium,ed. W. P. Lehmann and Yakov Malkiel, 97—195.Austin: Univ. of
Texas Press.
Wells,]. C. 1982.AccentsofEnglish.3 vols.Cambridge: Cambridge Univ. Press.Wetmore, Thomas H. 1959. TheLow—Centraland Low—BackVowelsin theEnglish of the
EasternUnitedStates.Publication of the American Dialect Society32. University:University of Alabama Press.
Wright, Joseph. 1905. TheEnglish Dialect Grammar: Comprising theDialects ofEngland,
of theShetland and OrkneyIslands, and of ThoseParts of Scotland,Ireland and Wales
WhereEnglish Is Habitually Spoken.Oxford: Frowde.Yang, Charles. 2009. “Selectionist Forces in Language Change.” Paper presented at
the 33rd Penn Linguistics Colloquium, Philadelphia, Mar. 27—29.Zelinsky, Wilbur. 197g. The Cultural Geographyof the United States.Englewood Cliffs,
NJ; Prentice-Hall.


![Ezra Pound e il "canto" del 1815 napoleonico [Ezra Pound and the Napoleonic 1815 Canto]](https://static.fdokumen.com/doc/165x107/631afa4a80cc3e9440059dad/ezra-pound-e-il-canto-del-1815-napoleonico-ezra-pound-and-the-napoleonic-1815.jpg)