Principles for Effective Portfolio Construction - J.P. Morgan ...
24
PORTFOLIO INSIGHTS PRINCIPLES FOR EFFECTIVE PORTFOLIO CONSTRUCTION A DISCIPLINED APPROACH TO BUILDING STRONGER PORTFOLIOS 2021
-
Upload
khangminh22 -
Category
Documents
-
view
9 -
download
0
Transcript of Principles for Effective Portfolio Construction - J.P. Morgan ...

PORTFOLIO INSIGHTS
PRINCIPLES FOR EFFECTIVE
PORTFOLIO CONSTRUCTION
A DISCIPLINED APPROACH TO BUILDING STRONGER PORTFOLIOS
2021

AS WE’VE TRANSITIONED INTO A NEW MARKET CYCLE, IT HAS NEVER
BEEN MORE IMPORTANT TO BUILD PORTFOLIOS THAT HAVE GREATER
POTENTIAL TO CAPTURE OPPORTUNITIES, WEATHER DOWNTURNS AND
ACHIEVE LONG-TERM GOALS. THIS BOOKLET PROVIDES THE
ESSENTIALS OF PORTFOLIO CONSTRUCTION; WITHIN IT YOU WILL
DISCOVER KEY STRATEGIES AND A SYSTEMATIC FRAMEWORK TO BUILD
PORTFOLIOS THAT HELP SOLVE INVESTOR NEEDS.
LET’S SOLVE IT.

PRINCIPLESFOR EFFECTIVE PORTFOLIOCONSTRUCTION
START WITH AN ASSET ALLOCATION PLAN1
DIVERSIFY TO SMOOTH OUT THE RIDE2
REBALANCE TO STAY THE COURSE3
USE THE 4 Ps FRAMEWORK TO SELECT INVESTMENTS4
CHOOSING THE APPROPRIATE INVESTMENT IS KEY5
LOOK BEYOND TOTAL RETURNS6
PUT IT ALL TOGETHER7

4 DISCIPLINED APPROACH TO BUILDING STRONGER PORTFOLIOS
PRINCIPLES FOR EFFECTIVE PORTFOLIO CONSTRUCTION
START WITH AN ASSET ALLOCATION PLAN1
Begin at the end—What’s the goal?
A portfolio should be a reflection of each investor’s unique goals.
• What are they trying to accomplish?• When will they need the money?• How much risk are they willing to take to achieve their objectives?
Asset allocation has historically been the primary driver of a portfolio’s performance and risk. Answering these questions will determine how to properly allocate across asset classes and help investors achieve their goals.

Building a strategic asset allocation model
What is your risk tolerance level?
When will you need the money?What are your goals?
STRATEGIC ASSET ALLOCATION MODELS*
EQUITY / FIXED INCOMEBUYING HOME
COLLEGE RETIREMENT
20-80 50-50 80-20
RETURN 5.74% 7.53% 9.15%
RISK 4.43% 7.91% 11.67%
LOW HIGH
*10-year historical results as of 12/31/2020. Source: Bloomberg Barclays, Merrill Lynch, Morgan Stanley, MSCI, Russell, J.P. Morgan Asset Management Multi-Asset Solutions. U.S. large cap: Russell1000 Growth Index® & Russell 1000 Value Index®; U.S. mid/small cap: Russell 2500 Index®; U.S. REITs: Morgan Stanley REIT Index; developed markets equity: MSCI® EAFE Index; emerging marketsequity: MSCI Emerging Markets IndexSM; U.S. investment grade: Bloomberg Barclays U.S. Aggregate Index; U.S. high yield: Bloomberg Barclays U.S. Corporate High Yield 2% Issuer Capped BondIndex; emerging markets debt: J.P. Morgan EMBI Global Index. The model performance shown is hypothetical and for illustrative purposes only and does not represent theperformance of a specific investment product. The performance presented does not reflect the deduction of expenses associated with a fund, such as investment management fees and fundexpenses, including sales charges if applicable. Past performance is no guarantee of future results. For illustrative purposes only.
5 DISCIPLINED APPROACH TO BUILDING STRONGER PORTFOLIOS
Diversification does not guarantee investment returns and does not eliminate the risk of loss. Diversification among investment options and asset classes may help to reduce overall volatility.
6 DISCIPLINED APPROACH TO BUILDING STRONGER PORTFOLIOS
PRINCIPLES FOR EFFECTIVE PORTFOLIO CONSTRUCTION
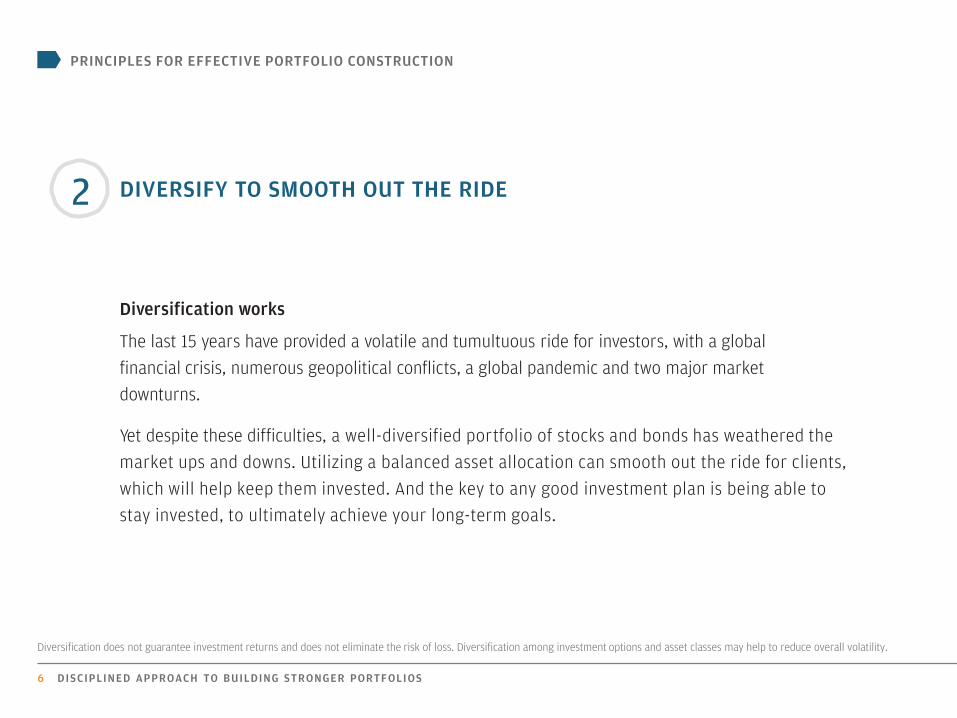
Diversification works
The last 15 years have provided a volatile and tumultuous ride for investors, with a global financial crisis, numerous geopolitical conflicts, a global pandemic and two major marketdownturns.
Yet despite these difficulties, a well-diversified portfolio of stocks and bonds has weathered the market ups and downs. Utilizing a balanced asset allocation can smooth out the ride for clients, which will help keep them invested. And the key to any good investment plan is being able to stay invested, to ultimately achieve your long-term goals.
DIVERSIFY TO SMOOTH OUT THE RIDE2

The power of diversification
Source: Barclays, Bloomberg, FactSet, MSCI, NAREIT, Russell, Standard & Poor’s, J.P. Morgan Asset Management. Large cap: S&P 500, Small cap: Russell 2000, EM Equity: MSCI EME, DM Equity: MSCI EAFE, Comdty: Bloomberg Commodity Index, High Yield: Bloomberg Barclays Global HY Index, Fixed Income: Bloomberg Barclays US Aggregate, REITs: NAREIT Equity REIT Index, Cash: Bloomberg Barclays 1-3m Treasury. The “Asset Allocation” portfolio assumes the following weights: 25% in the S&P 500, 10% in the Russell 2000, 15% in the MSCI EAFE, 5% in the MSCI EME, 25% in the Bloomberg Barclays US Aggregate, 5% in the Bloomberg Barclays 1-3m Treasury, 5% in the Bloomberg Barclays Global High Yield Index, 5% in the Bloomberg Commodity Index and 5% in the NAREIT Equity REIT Index. Balanced portfolio assumes annual rebalancing. Annualized (Ann.) return and volatility (Vol.) represents period from 12/31/05 to 12/31/20. Please see disclosure page at end for index definitions. All data represents total return for stated period. The “Asset Allocation” portfolio is for illustrative purposes only. Past performance is not indicative of future returns. Guide to the Markets – U.S. Data are as of December 31, 2020.
7 DISCIPLINED APPROACH TO BUILDING STRONGER PORTFOLIOS
2006 2007 2008 2009 2010 2011 2012 2013 2014 2015 2016 2017 2018 2019 2020 Ann. Vol.
REITs EM Equity
Fixed Income
EM Equity REITs REITs REITs Small
Cap REITs REITs Small Cap
EM Equity Cash Large
CapSmall Cap
Large Cap
EM Equity
35.1% 39.8% 5.2% 79.0% 27.9% 8.3% 19.7% 38.8% 28.0% 2.8% 21.3% 37.8% 1.8% 31.5% 20.0% 9.8% 23.3%
EM Equity Comdty. Cash High
YieldSmall Cap
Fixed Income
High Yield
Large Cap
Large Cap
Large Cap
High Yield
DM Equity
Fixed Income REITs EM
EquitySmall Cap REITs
32.6% 16.2% 1.8% 59.4% 26.9% 7.8% 19.6% 32.4% 13.7% 1.4% 14.3% 25.6% 0.0% 28.7% 18.7% 8.9% 23.1%
DM Equity
DM Equity
Asset Alloc.
DM Equity
EM Equity
High Yield
EM Equity
DM Equity
Fixed Income
Fixed Income
Large Cap
Large Cap REITs Small
CapLarge Cap
High Yield
Small Cap
26.9% 11.6% -25.4% 32.5% 19.2% 3.1% 18.6% 23.3% 6.0% 0.5% 12.0% 21.8% -4.0% 25.5% 18.4% 7.5% 22.6%
Small Cap
Asset Alloc.
High Yield REITs Comdty. Large
CapDM
EquityAsset Alloc.
Asset Alloc. Cash Comdty. Small
CapHigh Yield
DM Equity
Asset Alloc. REITs DM
Equity18.4% 7.1% -26.9% 28.0% 16.8% 2.1% 17.9% 14.9% 5.2% 0.0% 11.8% 14.6% -4.1% 22.7% 10.6% 7.1% 19.1%
Large Cap
Fixed Income
Small Cap
Small Cap
Large Cap Cash Small
CapHigh Yield
Small Cap
DM Equity
EM Equity
Asset Alloc.
Large Cap
Asset Alloc.
DM Equity
EM Equity Comdty.
15.8% 7.0% -33.8% 27.2% 15.1% 0.1% 16.3% 7.3% 4.9% -0.4% 11.6% 14.6% -4.4% 19.5% 8.3% 6.9% 18.8%
Asset Alloc.
Large Cap Comdty. Large
CapHigh Yield
Asset Alloc.
Large Cap REITs Cash Asset
Alloc. REITs High Yield
Asset Alloc.
EM Equity
Fixed Income
Asset Alloc.
Large Cap
15.3% 5.5% -35.6% 26.5% 14.8% -0.7% 16.0% 2.9% 0.0% -2.0% 8.6% 10.4% -5.8% 18.9% 7.5% 6.7% 16.7%
High Yield Cash Large
CapAsset Alloc.
Asset Alloc.
Small Cap
Asset Alloc. Cash High
YieldHigh Yield
Asset Alloc. REITs Small
CapHigh Yield
High Yield
DM Equity
High Yield
13.7% 4.8% -37.0% 25.0% 13.3% -4.2% 12.2% 0.0% 0.0% -2.7% 8.3% 8.7% -11.0% 12.6% 7.0% 5.0% 12.2%
Cash High Yield REITs Comdty. DM
EquityDM
EquityFixed
IncomeFixed
IncomeEM
EquitySmall Cap
Fixed Income
Fixed Income Comdty. Fixed
Income Cash Fixed Income
Asset Alloc.
4.8% 3.2% -37.7% 18.9% 8.2% -11.7% 4.2% -2.0% -1.8% -4.4% 2.6% 3.5% -11.2% 8.7% 0.5% 4.5% 11.8%
Fixed Income
Small Cap
DM Equity
Fixed Income
Fixed Income Comdty. Cash EM
EquityDM
EquityEM
EquityDM
Equity Comdty. DM Equity Comdty. Comdty. Cash Fixed
Income4.3% -1.6% -43.1% 5.9% 6.5% -13.3% 0.1% -2.3% -4.5% -14.6% 1.5% 1.7% -13.4% 7.7% -3.1% 1.2% 3.2%
Comdty. REITs EM Equity Cash Cash EM
Equity Comdty. Comdty. Comdty. Comdty. Cash Cash EM Equity Cash REITs Comdty. Cash
2.1% -15.7% -53.2% 0.1% 0.1% -18.2% -1.1% -9.5% -17.0% -24.7% 0.3% 0.8% -14.2% 2.2% -5.1% -4.0% 0.8%
2006 - 2020

8 DISCIPLINED APPROACH TO BUILDING STRONGER PORTFOLIOS
PRINCIPLES FOR EFFECTIVE PORTFOLIO CONSTRUCTION
REBALANCE TO STAY THE COURSE
Stay on course; don’t “set it and forget it”
As markets shift, so do portfolio allocations. Without rebalancing, investors can gradually become overexposed to unwanted risks. In this simple illustration, over just the 1st quarter 2020, the 60%equity and 40% fixed income portfolio left untouched drifted to become a 51% equity and 49% fixedincome portfolio.
Create a rebalancing policy
Some portfolios are rebalanced according to a set schedule, others after major market moves and stillothers when assets stray from original targets. What’s most important is creating a formal rebalancingpolicy and following it faithfully.
3

51% Equity
Rebalancing to stay the course
60% Equity
40% Bond 49%
Bond
JANUARY 1st, 2020
MARCH 20th, 2020
Rebalancing on schedule to help maintain strategic allocation
The 60-40 portfolio has drifted 9% in just one quarter
KEY TAKEAWAYS24% of investors’ managing portfolios didn’t rebalance at all during the COVID-19 volatility1
Now is a good time to rebalance back to your strategic asset allocation and consider:
Maintain portfolio protection – consider lower beta equities or equity alternatives
Capitalize on the volatility – consider asset classes that may be undervalued like value and international equities
Source: J.P. Morgan Asset Management. Stocks measured by MSCI ACWI, bonds measured by Bloomberg Barclays U.S. Aggregate Bond Index. Indices are used for illustrative purposes only, are unmanaged, include the reinvestment of dividends, and do not reflect the impact of management or performance fees. Indices do not represent actual individual accounts. One cannot invest directly in an index. Past performance is no guarantee of future results. 1 BlackRock Investments, LLC, May 2020.
9 DISCIPLINED APPROACH TO BUILDING STRONGER PORTFOLIOS

10 DISCIPLINED APPROACH TO BUILDING STRONGER PORTFOLIOS
PRINCIPLES FOR EFFECTIVE PORTFOLIO CONSTRUCTION
USE THE 4 Ps FRAMEWORK TO SELECT INVESTMENTS
There are many factors to consider
A framework for selecting investments based on the four Ps can help you better understand what you own and what you should expect:
1. People—Who’s managing the strategy? What are their experiences and capabilities?
2. Philosophy—What is the strategy trying to achieve? For example, is it seeking long-term growth? Current income? A combination of both?
3. Process—How does the strategy pursue its objectives and invest shareholder money?
4. Performance—When would this strategy likely underperform/outperform? How much risk was taken relative to returns?
4

The four Ps framework to select investments
What is the process for identifying and selecting investments for your portfolios?
How long has the current team been in place?
What is the team’s experience?
What are the team’s capabilities and resources?
PEOPLE
Who manages the strategy?
PHILOSOPHY
What does the strategy seek to do?
How clearly is the investment philosophyconveyed?Is this a benchmark-aware or -agnosticapproach?
What are the core investment beliefs?
Is the track record lined to the team and process?
What are the key return/risk drivers?
When would this strategy likely under/outperform?
PERFORMANCE
What are the appropriate ways to evaluate performance?
PROCESS
What is the strategy’s investment style?
What are the portfolio characteristics?
What is the risk management approach?
How does the team invest to meet its objective?
M A N AG E RS E L E C T I O N
For illustrative purposes only.
11 DISCIPLINED APPROACH TO BUILDING STRONGER PORTFOLIOS

12 DISCIPLINED APPROACH TO BUILDING STRONGER PORTFOLIOS
PRINCIPLES FOR EFFECTIVE PORTFOLIO CONSTRUCTION
Big gaps between top and bottom performers
Given the wide array of approaches available, mutual funds and ETFs in the same category may deliver vastly different results. This chart shows average annual returns for the top performers, bottom performers and largest market cap-weighted passive option within each investment category.
In the large growth category, for example, the gap between the top and bottom performers was asizable 4.36% difference in annual return. Compounded over time, this can have a big impact on aportfolio’s dollar value and a client’s ability to achieve their goals.
5 CHOOSING THE APPROPRIATE INVESTMENT IS KEY

Source: Morningstar as of 12/31/2020. *Represents average annual portfolio return dispersion between the 10th and 90th percentile over a 15-year period for each Morningstar category including mutual funds and ETFs. The ETFs listed above are the largest by AUM within their category. World Allocation not shown as it does not currently have any prevalent ETFs with significant AUM. ETF shares are bought and sold throughout the day on an exchange at market price (not NAV) through a brokerage account, and are not individually redeemed from the fund. ETFs and Mutual Funds are different investment vehicles. ETFs are funds that trade like other publicly traded securities. Similar to shares of an index mutual fund, each ETF share represents an ownership interest in an underlying portfolio of securities and other instruments typically intended to track a market index. Unlike shares of a mutual fund, shares of an ETF may bought and sold intraday. This information is shown for illustrative purposes only, does not reflect actual investment results, is not a guarantee of future results and it not a recommendation. The performance quoted is past performance and is not a guarantee of future results. Mutual funds are subject to certain market risks. Investment returns and principal value of an investment will fluctuate so that an investor's shares, when redeemed, may be worth more or less than original cost. Current performance may be higher or lower than the performance data shown.
There can be a huge separation between top and bottom performers
15-year portfolio return dispersion*
5.56%
9.07%
6.28% 6.25%
3.40%
4.72%3.93%
8.65%
13.43%
9.84%9.32%
6.41%
8.52%8.90%
1%
3%
5%
7%
9%
11%
13%
Large Value Large Growth Mid-Cap Blend Small-Cap Blend Foreign LargeBlend
EmergingMarkets
Options-based
♦ 10th percentile
90th percentile
Market cap-weighted ETF
13 DISCIPLINED APPROACH TO BUILDING STRONGER PORTFOLIOS

14 DISCIPLINED APPROACH TO BUILDING STRONGER PORTFOLIOS
PRINCIPLES FOR EFFECTIVE PORTFOLIO CONSTRUCTION
LOOK BEYOND TOTAL RETURNS
Dig deeper into performance
Of the four Ps, investors tend to focus most closely on performance. But evaluating performance involves much more than simply looking at recent returns. Other factors to consider include consistency, risk and performance relative to benchmarks and peers.
This page summarizes the ABC’s of investment selection, a simple framework that can be used to gain adeeper understanding of performance. Along with guidance from a financial professional, they canhelp investors assess investments, compare similar strategies and make informed decisions.
6

This information is shown for illustrative purposes only, does not reflect actual investment results, is not a guarantee of future results and is not a recommendation.
The ABC’s of investment selection
B C
BATTING AVERAGEMeasures the manager’s ability to meet or beat the benchmark consistently
CONSISTENCY
CAPTURE RATIOSPercentage of the benchmark’s return that was “captured” in rising and falling markets
RISK
Clients
A
ALPHA/EXCESSReflects a fund’s total return above or below a benchmark
RETURN
NET EXPENSE RATIOCost of ownership for a Mutual Fund or ETF
COST
B
C
A Investment delivers positive excess returns above the benchmark
Investment has a batting average of 50% or great
Investment has a positive spread between up/down capture ratio
15 DISCIPLINED APPROACH TO BUILDING STRONGER PORTFOLIOS

16 DISCIPLINED APPROACH TO BUILDING STRONGER PORTFOLIOS
PRINCIPLES FOR EFFECTIVE PORTFOLIO CONSTRUCTION
PUT IT ALL TOGETHER
The whole is greater than the sum of its parts
Portfolio construction and investment selection is an ongoing process. To build a portfolio that can withstand market ups and downs, all six components in the process must work together to achieve the desired result. Investors should also understand how these six components inform the overall process and the essential roles they play in building stronger portfolios.
7
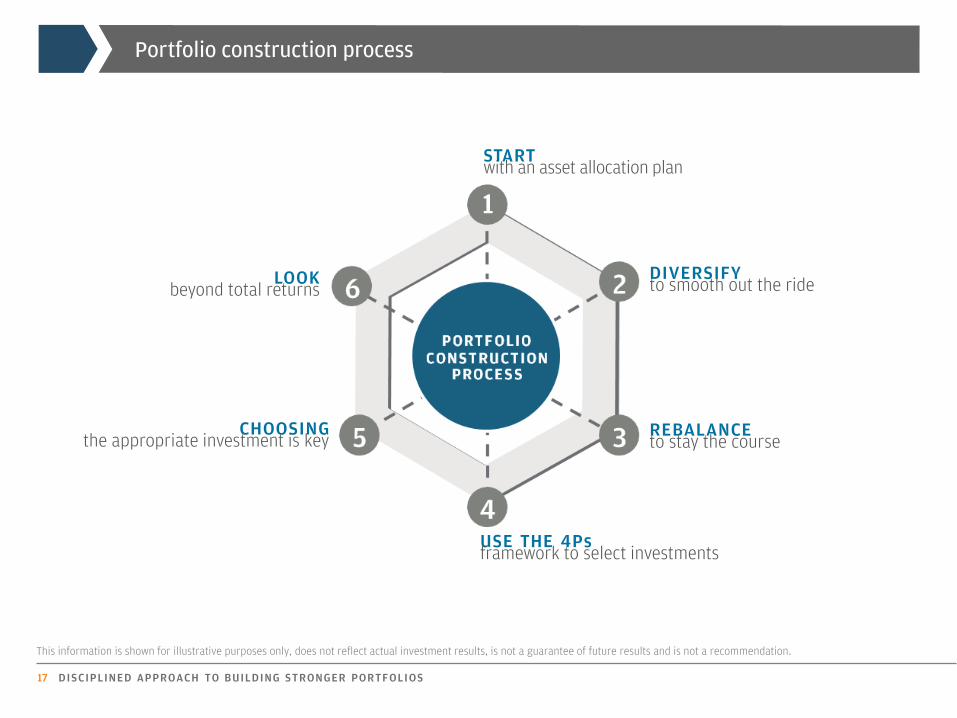
Portfolio construction process
STARTwith an asset allocation plan
DIVERSIFYto smooth out the ride
REBALANCEto stay the course
USE THE 4Psframework to select investments
CHOOSINGthe appropriate investment is key
LOOKbeyond total returns
This information is shown for illustrative purposes only, does not reflect actual investment results, is not a guarantee of future results and is not a recommendation.
17 DISCIPLINED APPROACH TO BUILDING STRONGER PORTFOLIOS

J.P. Morgan Multi-Asset Solutions Model PortfoliosJ.P. Morgan Multi-Asset Solutions Model PortfoliosJ.P. Morgan Model Portfolios are designed to help investors make thoughtful, well-informed decisions in creating multi-asset portfolios. They are based upon our Multi-Asset Solutions research team’s asset allocation views, which are the product of a rigorous and disciplined process that integrates:
Qualitative insights that encompass macro-thematic insights, business cycle views, non-systematic inputs and market dislocations
Quantitative analysis that considers market inefficiencies, intra- and cross-asset class risk-return models, relative value, market directional strategies and systematic factor analysis
Strategy Summits and ongoing dialogue in which research and investor teams debate, challenge and develop the firm’s asset allocation views
These views are translated into two series of risk-based model portfolios, one version focusing on traditional asset classes and another that includes alternative strategies. Further they range from conservative to aggressive allocations (see following pages for model portfolio allocation details).
The J.P. Morgan Multi-Asset Solutions Model Portfolios are updated on a quarterly basis and are rebalanced on a monthly basis. Each portfolio is constructed using a blend of the underlying asset class indices shown in the table on the right for performance. Additionally Indices or ETFs may be used for portfolio-level data.
Asset Class Underlying Asset Class Indices
Equi
ties
U.S. Large Cap Growth Russell 1000 Growth
U.S. Large Cap Value Russell 1000 Value
U.S. Mid/Small Cap Russell 2500
US REITs MSCI US REIT
Developed Mkts Equity MSCI EAFE
Emerging Market Equity MSCI EM
Fixe
dIn
com
e
U.S. Investment Grade Bloomberg Barclays US Aggregate Bond
U.S. High Yield Bloomberg Barclays US Corp High Yield 2% Issuer Cap
Emerging Markets Debt JPM EMBI Global Diversified
Muni Investment Grade Bloomberg Barclays Municipal
Muni High Yield Bloomberg Barclays High Yield Muni
TIPS Bloomberg Barclays US Treasury US TIPS
Cash USTREAS T-Bill Auction Ave 3 Mon
Alte
rnat
ive Equity Alternatives HFRX Equity Hedge Index
Fixed Income Alternative Barclays US Aggregate Bond
Core Diversifiers HFRX Global Hedge Fund Index
Methodology
18 DISCIPLINED APPROACH TO BUILDING STRONGER PORTFOLIOS
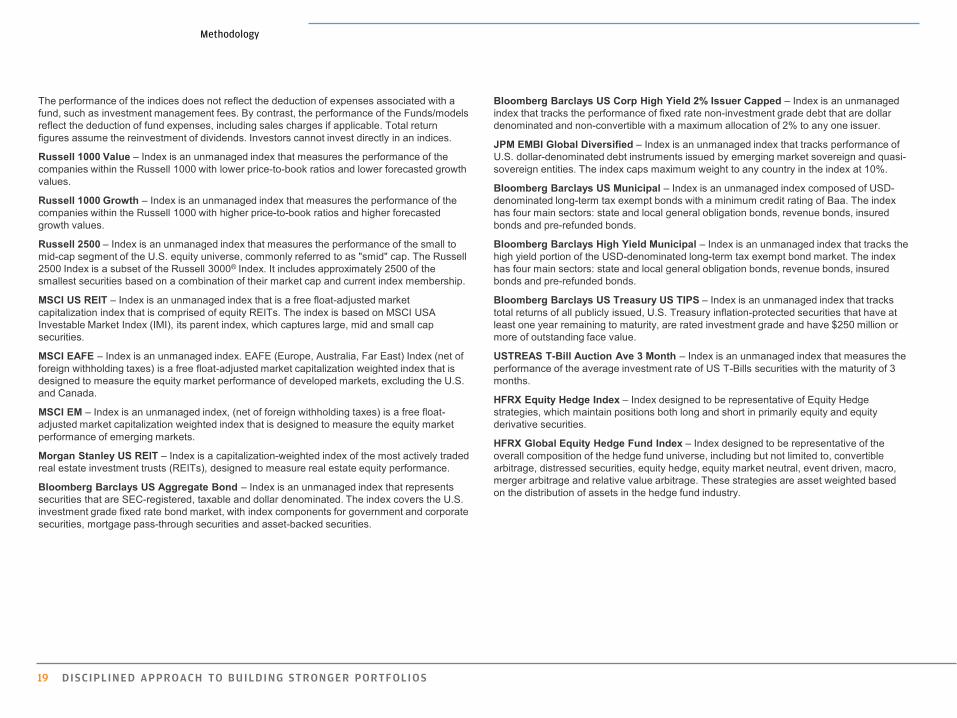
Underlying asset class indicesBloomberg Barclays US Corp High Yield 2% Issuer Capped – Index is an unmanaged index that tracks the performance of fixed rate non-investment grade debt that are dollar denominated and non-convertible with a maximum allocation of 2% to any one issuer.
JPM EMBI Global Diversified – Index is an unmanaged index that tracks performance of U.S. dollar-denominated debt instruments issued by emerging market sovereign and quasi-sovereign entities. The index caps maximum weight to any country in the index at 10%.
Bloomberg Barclays US Municipal – Index is an unmanaged index composed of USD-denominated long-term tax exempt bonds with a minimum credit rating of Baa. The index has four main sectors: state and local general obligation bonds, revenue bonds, insured bonds and pre-refunded bonds.
Bloomberg Barclays High Yield Municipal – Index is an unmanaged index that tracks the high yield portion of the USD-denominated long-term tax exempt bond market. The index has four main sectors: state and local general obligation bonds, revenue bonds, insured bonds and pre-refunded bonds.
Bloomberg Barclays US Treasury US TIPS – Index is an unmanaged index that tracks total returns of all publicly issued, U.S. Treasury inflation-protected securities that have at least one year remaining to maturity, are rated investment grade and have $250 million or more of outstanding face value.
USTREAS T-Bill Auction Ave 3 Month – Index is an unmanaged index that measures the performance of the average investment rate of US T-Bills securities with the maturity of 3 months.
HFRX Equity Hedge Index – Index designed to be representative of Equity Hedge strategies, which maintain positions both long and short in primarily equity and equity derivative securities.
HFRX Global Equity Hedge Fund Index – Index designed to be representative of the overall composition of the hedge fund universe, including but not limited to, convertible arbitrage, distressed securities, equity hedge, equity market neutral, event driven, macro, merger arbitrage and relative value arbitrage. These strategies are asset weighted based on the distribution of assets in the hedge fund industry.
The performance of the indices does not reflect the deduction of expenses associated with a fund, such as investment management fees. By contrast, the performance of the Funds/models reflect the deduction of fund expenses, including sales charges if applicable. Total return figures assume the reinvestment of dividends. Investors cannot invest directly in an indices.
Russell 1000 Value – Index is an unmanaged index that measures the performance of the companies within the Russell 1000 with lower price-to-book ratios and lower forecasted growth values.
Russell 1000 Growth – Index is an unmanaged index that measures the performance of the companies within the Russell 1000 with higher price-to-book ratios and higher forecasted growth values.
Russell 2500 – Index is an unmanaged index that measures the performance of the small to mid-cap segment of the U.S. equity universe, commonly referred to as "smid" cap. The Russell 2500 Index is a subset of the Russell 3000® Index. It includes approximately 2500 of the smallest securities based on a combination of their market cap and current index membership.
MSCI US REIT – Index is an unmanaged index that is a free float-adjusted market capitalization index that is comprised of equity REITs. The index is based on MSCI USA Investable Market Index (IMI), its parent index, which captures large, mid and small cap securities.
MSCI EAFE – Index is an unmanaged index. EAFE (Europe, Australia, Far East) Index (net of foreign withholding taxes) is a free float-adjusted market capitalization weighted index that is designed to measure the equity market performance of developed markets, excluding the U.S. and Canada.
MSCI EM – Index is an unmanaged index, (net of foreign withholding taxes) is a free float-adjusted market capitalization weighted index that is designed to measure the equity market performance of emerging markets.
Morgan Stanley US REIT – Index is a capitalization-weighted index of the most actively traded real estate investment trusts (REITs), designed to measure real estate equity performance.
Bloomberg Barclays US Aggregate Bond – Index is an unmanaged index that represents securities that are SEC-registered, taxable and dollar denominated. The index covers the U.S. investment grade fixed rate bond market, with index components for government and corporate securities, mortgage pass-through securities and asset-backed securities.
Methodology
19 DISCIPLINED APPROACH TO BUILDING STRONGER PORTFOLIOS

*Allocation changes are expressed in percentage point terms and reflect a change in view since the prior Strategy Summit. Percents may not sum to 100% due to rounding. † Strategic allocations shown in the left column for each model portfolio do not include this quarter’s tactical shifts. The current allocation for a given model would equal the sum of the strategic allocation plus the tactical shift. Source: J.P. Morgan Asset Management Multi-Asset Solutions; assessments are made using data and information up to March 2021. For illustration purposes only. Allocation percentages are subject to market and economic conditions and may be changed without notice. Diversification does not guarantee investment returns and does not eliminate the risk of loss. Diversification among investment options and asset classes may help to reduce overall volatility.
Methodology
20 DISCIPLINED APPROACH TO BUILDING STRONGER PORTFOLIOS

21 DISCIPLINED APPROACH TO BUILDING STRONGER PORTFOLIOS
NNOOTTEESS

NNOOTTEESS
22 DISCIPLINED APPROACH TO BUILDING STRONGER PORTFOLIOS

FOR MORE INFORMATION ABOUT THE PORTFOLIO INSIGHTS PROGRAM,
PLEASE VISIT: jpmorganfunds.com/insights

This document is a general communication being provided for informational purposes only. It is educational in nature and not designed to be a recommendation for any specificinvestment product, strategy, plan feature or other purposes. By receiving this communication you agree with the intended purpose described above. Any examples used inthis material are generic, hypothetical and for illustration purposes only. None of J.P. Morgan Asset Management, its affiliates or representatives is suggesting that the recipientor any other person take a specific course of action or any action at all. Communications such as this are not impartial and are provided in connection with the advertising andmarketing of products and services. Prior to making any investment or financial decisions, an investor should seek individualized advice from personal financial, legal, taxand other financial professionals that take into account all of the particular facts and circumstances of an investor’s own situation.
This material has been prepared for informational and educational purposes only. It is not intended to provide, and should not be relied upon for, investment, accounting, legal or tax advice.
Opinions and estimates offered constitute our judgment and are subject to change without notice, as are statements of financial market trends, which are based on current marketconditions. We believe the information provided here is reliable, but do not warrant its accuracy or completeness. References to future returns are not promises or even estimates ofactual returns a client portfolio may achieve.
JPMorgan Distribution Services, Inc., member FINRA.
J.P. Morgan Asset Management is the marketing name for the asset management business of JPMorgan Chase & Co., and its affiliates worldwide.
If you are a person with a disability and need additional support in viewing the material, please call us at 1-800-343-1113 for assistance.
Copyright 2021 JPMorgan Chase & Co. All rights reserved.PI-PRINCIPLES_2021 | 0903c02a81c2593b