Altered Chemokine Receptor Expression in Papillary Thyroid Cancer
Principal Component Analysis of the Cytokine andChemokine Response to Human Traumatic Brain InjuryAdel Helmy1*, Chrystalina A. Antoniades2, Mathew R. Guilfoyle1, Keri L. H. Carpenter1,3,
Peter J. Hutchinson1,3
1 Division of Neurosurgery, Department of Clinical Neurosciences, University of Cambridge, Addenbrooke’s Hospital, Cambridge, United Kingdom, 2 Nuffield Department
of Clinical Neurosciences, Department of Clinical Neurology, John Radcliffe Hospital, University of Oxford, United Kingdom, 3 Wolfson Brain Imaging Centre, Department
of Clinical Neurosciences, University of Cambridge, Addenbrooke’s Hospital, Cambridge, United Kingdom
Abstract
There is a growing realisation that neuro-inflammation plays a fundamental role in the pathology of Traumatic Brain Injury(TBI). This has led to the search for biomarkers that reflect these underlying inflammatory processes using techniques suchas cerebral microdialysis. The interpretation of such biomarker data has been limited by the statistical methods used. Whenanalysing data of this sort the multiple putative interactions between mediators need to be considered as well as the timingof production and high degree of statistical co-variance in levels of these mediators. Here we present a cytokine andchemokine dataset from human brain following human traumatic brain injury and use principal component analysis andpartial least squares discriminant analysis to demonstrate the pattern of production following TBI, distinct phases of thehumoral inflammatory response and the differing patterns of response in brain and in peripheral blood. This technique hasthe added advantage of making no assumptions about the Relative Recovery (RR) of microdialysis derived parameters.Taken together these techniques can be used in complex microdialysis datasets to summarise the data succinctly andgenerate hypotheses for future study.
Citation: Helmy A, Antoniades CA, Guilfoyle MR, Carpenter KLH, Hutchinson PJ (2012) Principal Component Analysis of the Cytokine and Chemokine Response toHuman Traumatic Brain Injury. PLoS ONE 7(6): e39677. doi:10.1371/journal.pone.0039677
Editor: Tsuneya Ikezu, Boston University School of Medicine, United States of America
Received February 14, 2012; Accepted May 26, 2012; Published June 22, 2012
Copyright: � 2012 Helmy et al. This is an open-access article distributed under the terms of the Creative Commons Attribution License, which permitsunrestricted use, distribution, and reproduction in any medium, provided the original author and source are credited.
Funding: AH is supported by a joint Medical Research Council/Royal College of Surgeons of England Clinical Research Training Fellowship and a Raymond andBeverly Sackler Fellowship. MRG is supported by the Royal College of Surgeons of England and a Raymond and Beverly Sackler Fellowship. KLHC is supported bythe National Institute of Health Research Biomedical Research Centre, Cambridge and by the Medical Research Council (Acute Brain Injury Programme Grant).PJAH is supported by the Academy of Medical Sciences/Health Foundation Senior Surgical Scientist Fellowship. Study support was provided by the MedicalResearch Council (Grant numbers G9439390 ID 65883 and G0600986 ID 79068). CAA is funded by the National Institute of Health Research (NIHR) OxfordBiomedical Research Centre and by the Thames Valley Dementia and Neurodegenerative Disease Research Network (DeNDRoN). The funders had no role in studydesign, data collection and analysis, decision to publish, or preparation of the manuscript.
Competing Interests: The authors have declared that no competing interests exist.
* E-mail: [email protected]
Introduction
Traumatic Brain Injury (TBI) is a multifaceted pathology
including diverse mechanisms such as excitotoxicity, free radical
formation, disrupted metabolism and brain swelling [1]. A range
of cytokines and chemokines have been implicated in these
pathophysiological consequences of TBI [2,3]. Cytokines are
paracrine and autocrine mediators of inflammation produced by
a number of central nervous system cell types, including
neurones, astrocytes and microglia and can be measured in a
range of biological fluids including blood, cerebrospinal fluid and
microdialysate [4]. Disentangling the roles and inter-relationships
between these mediators is a key goal in developing a
mechanistic understanding of neuronal loss following TBI as
well as identifying novel therapeutic targets [5]. However, there
are a number of practical difficulties in interpreting human
cytokine data due to the large number of inter-related variables,
variations in monitoring period in relation to time of injury and
missing data points [6]. Many authors have attempted to use
univariate correlations between a given mediator and a clinical
outcome to draw inferences regarding the biological action of a
cytokine, often pigeon-holing a cytokine as ‘beneficial’ or
‘damaging’ [7,8,9,10,11,12,13,14,15,16,17,18]. This approach
may be flawed for several reasons both in this context and
within the wider TBI biomarker literature. Firstly, as there is a
common trigger to cytokine production, namely TBI, the change
in concentration of these mediators will likely correlate with each
other and with the severity of injury irrespective of their ultimate
biological action. Secondly, it is clear that cytokines that are
directly antagonistic to one another at the same receptor (such as
IL1b and IL1ra) are both produced in response to TBI in
concert and may therefore correlate positively with each other
[19]. Thirdly, the actions of a given cytokine are dependent on
the time period and context in which it is produced [3,20].
There is therefore a need for multivariate statistical techniques
that incorporate the putative statistical interactions between
cytokines in order to interpret and analyse cytokine data of this
type. Multivariate regression is a ubiquitous technique within the
biological literature, however it is limited by the need for large
numbers of subjects in relation to the number of variables
measured to prevent overfitting. In addition, without interpola-
tion techniques, multivariate regression cannot compensate for
missing data points potentially requiring observations to be
discarded from the model. In contrast, multivariate projection
methods such as principal component analysis (PCA), partial
PLoS ONE | www.plosone.org 1 June 2012 | Volume 7 | Issue 6 | e39677
least squares discriminant analysis (PLS-DA) and their various
derivatives provide a powerful method for exploring complex
datasets with multiple variables and missing data points with
relatively small numbers of observations [21,22,23].
We have previously described the measurement of 42 cytokines
in brain extracellular fluid in 12 patients with severe TBI for 5
days at 6 hourly time points as well as in concurrent blood samples
[6]. We demonstrated a stereotyped sequence of cytokine
production within the brain following injury as well as significantly
higher concentrations of some cytokines in brain compared with
blood. We have investigated this dataset using multivariate
projection methods in order to explore the underlying structure
within the cerebral cytokine response. Firstly, we have sought to
identify the clusters of cytokines that discriminate between patients
as a focus for future studies into neuroinflammation following TBI.
Secondly, we have explored the change in this pattern over time.
Thirdly, we have sought to identify the differences between the
innate inflammatory response within brain extracellular space
compared with that in peripheral blood following trauma.
Materials and Methods
In total, twelve patients with diffuse severe traumatic brain
injury defined as a post-resuscitation Glasgow Coma Score#8, a
consistent mechanism of injury and consistent neuroimaging were
monitored with cerebral microdialysis, arterial and jugular venous
plasma sampling for a total of five days.
Ethics StatementThe study protocol was reviewed and approved by the
Cambridgeshire Local Research Ethics Committee (2). Written
informed assent was taken from the next of kin of all patients in
line with our locally agreed protocols with Cambridgeshire Local
Research Ethics Committee (2).
MicrodialysisCMA71(CMA Microdialysis AB, Solna, Sweden) high molec-
ular weight cut-off microdialysis catheters (nominal cut-off
100 kDa) were perfused with 3.5% Human Albumin Solution
made up in CMA CNS perfusion fluid) (Pharmacy Manufacturing
Unit, Ipswich Hospital NHS Trust, UK), at a rate of 0.3 ml/
minute, using CMA 106 (CMA Microdialysis AB, Solna, Sweden)
microinfusion pumps. Samples were pooled in six hour time
epochs before analysis. All catheters were placed through cranial
access devices (Technicam, Newton Abbot, UK), into areas of
brain that were consistent with diffuse injury on neuroimaging. At
timepoints during which microdialysis was stopped for clinical
indications (e.g. during MR imaging), these timepoints were noted
as ‘missing’.
Plasma SamplingWhole blood samples were taken from each patient twice daily
into EDTA vials from an arterial line in the radial artery. Samples
were centrifuged at 5000 rpm at 4uC for 15 minutes and the
resulting supernatant aliquoted and stored at 280uC until assayed.
The timing of plasma samples was also related to the time of injury
as for microdialysate.
Cytokine AnalysisThe samples were analysed in duplicate using the MilliplexTM
Multi-Analyte Profiling Human Cytokine/Chemokine 42 analyte
premixed kit (Millipore Corp, Missouri, USA) on the Luminex 200
system (Luminex Corporation, Austin, TX, USA) running
STarstation software(Applied Cytometry Systems, Sheffield,
UK). Table 1 lists the cytokines and chemokines assayed. Cytokine
standards were run on each plate and used to determine an eight-
point five-parameter logistic standard curve. Plasma and mico-
dialysate samples were assayed on separate plates with appropriate
standards and background wells.
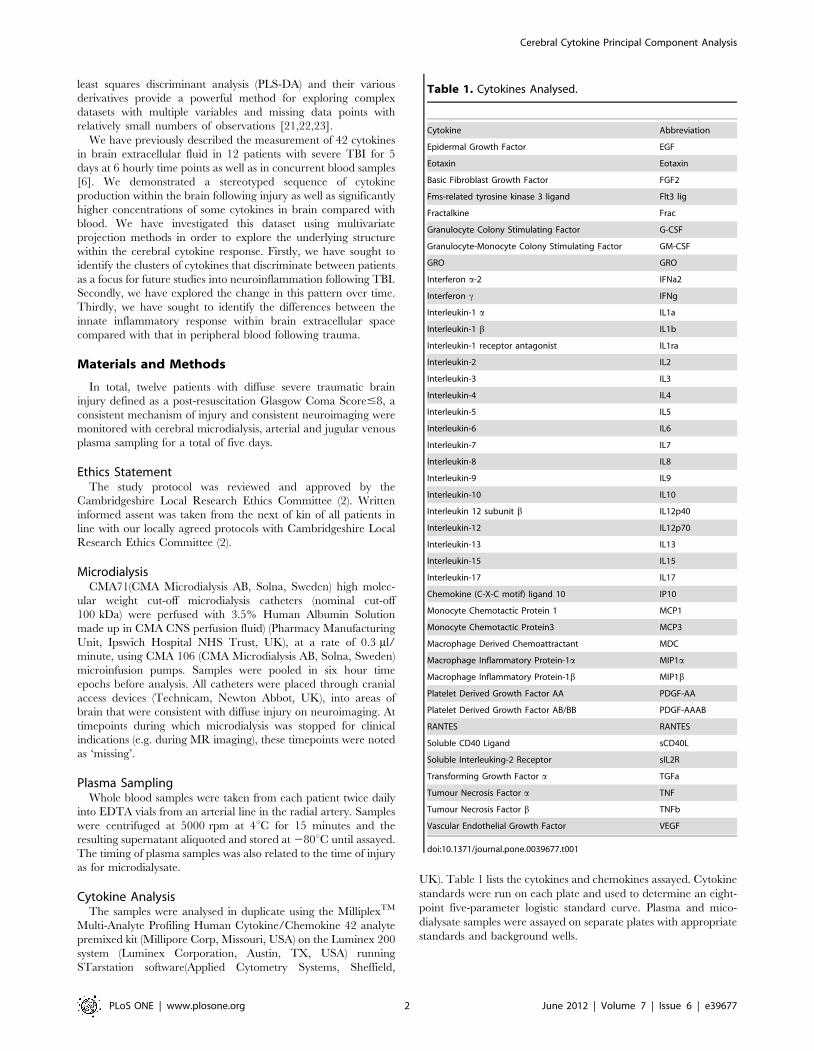
Table 1. Cytokines Analysed.
Cytokine Abbreviation
Epidermal Growth Factor EGF
Eotaxin Eotaxin
Basic Fibroblast Growth Factor FGF2
Fms-related tyrosine kinase 3 ligand Flt3 lig
Fractalkine Frac
Granulocyte Colony Stimulating Factor G-CSF
Granulocyte-Monocyte Colony Stimulating Factor GM-CSF
GRO GRO
Interferon a-2 IFNa2
Interferon c IFNg
Interleukin-1 a IL1a
Interleukin-1 b IL1b
Interleukin-1 receptor antagonist IL1ra
Interleukin-2 IL2
Interleukin-3 IL3
Interleukin-4 IL4
Interleukin-5 IL5
Interleukin-6 IL6
Interleukin-7 IL7
Interleukin-8 IL8
Interleukin-9 IL9
Interleukin-10 IL10
Interleukin 12 subunit b IL12p40
Interleukin-12 IL12p70
Interleukin-13 IL13
Interleukin-15 IL15
Interleukin-17 IL17
Chemokine (C-X-C motif) ligand 10 IP10
Monocyte Chemotactic Protein 1 MCP1
Monocyte Chemotactic Protein3 MCP3
Macrophage Derived Chemoattractant MDC
Macrophage Inflammatory Protein-1a MIP1a
Macrophage Inflammatory Protein-1b MIP1b
Platelet Derived Growth Factor AA PDGF-AA
Platelet Derived Growth Factor AB/BB PDGF-AAAB
RANTES RANTES
Soluble CD40 Ligand sCD40L
Soluble Interleuking-2 Receptor sIL2R
Transforming Growth Factor a TGFa
Tumour Necrosis Factor a TNF
Tumour Necrosis Factor b TNFb
Vascular Endothelial Growth Factor VEGF
doi:10.1371/journal.pone.0039677.t001
Cerebral Cytokine Principal Component Analysis
PLoS ONE | www.plosone.org 2 June 2012 | Volume 7 | Issue 6 | e39677
Multivariate Statistical AnalysisStatistical analysis was performed using multivariate techniques,
specifically principal component analysis (PCA), followed by
partial least squares discriminant analysis (PLS – DA). SIMCA –
P+ version 12 (Umetrics, Umea, Sweden) was used to identify
principal components which accounted for the majority of the
variation within the dataset. PCA is an unsupervised method and a
data reduction technique that allows the major sources of variation
in a multi-dimensional dataset to be analysed without introducing
inherent bias. PLS – DA is a regression extension of the principal
component analysis that uses class information to maximize the
separation between various groups of observations. To estimate
the number of PCA and PLS-DA components, cross-validation
was used [21]. Data for each cytokine was mean centred and
variance scaled to unit variance. SIMCA-P+ uses NIPALS (non-
linear iterative partial least squares) algorithm to calculate the first
few principal components and inherently compensates for missing
data values. This has been suggested as a more accurate, though
computationally more complex method for deriving eigenvalues
[24]. Cross validation was carried out by dividing the data into
seven parts and comparing models with each of the seven parts left
in or out in turn. Predicted Residual Sum of Squares are
calculated for the whole dataset and scaled to provide the Q2
statistic.
Cerebral cytokine data was pooled into 48 hour and 72 hour
bins, following the time of injury, in order to ease the
interpretation of the numerous time points and minimise missing
data values. The 48 hour bins are 1(0–48 hours), 2 (48–96 hours),
3 (96–144 hours), 4 (144–192 hours) and 72 hour bins are 1 (0–72
hours), 2 (72–144 hours. For transparency we have included the
PCA and temporally defined PLS-DA analyses for both 48 hour
and 72 hour time bins. The monitoring period for each patient in
relation to injury varies, therefore data is not available for every
patient for every time point.
The analysis was performed in two stages. Firstly a PCA analysis
was performed to examine any intrinsic variation in the cytokine
data set and whether any clustering was presented at this stage.
Removal of outliers made no difference in the model and outliers
are included in all models presented. Secondly, PLS – DA was
performed using the cytokine data, to demonstrate the separation
of the time points and also identify the cytokines responsible for
any of the clustering/separation present.
Cerebral cytokine data was also compared to concurrent plasma
samples using the both PCA and PLS-DA methodology. In this
case, we have not sought to make a comparison across time, so
individual observations (‘microdialysis’ vs ‘plasma’) have been
entered into the model directly. In this case, our aim was to define
a subset of neurotropic cytokines.
Results
Six models were derived in total: the number of principal
components derived, and the variation explained by these
components for each of the models is summarised in Table 2.
R2 describes the goodness of fit fraction of the sum of squares of all
the variables explained by a principal component and Q2
describes the goodness of prediction of the fraction of the total
variation of the variables that can be predicted by a principal
component using cross-validation methods.
Each of the figures 1, 2, 3, 4, 5, 6 relates to one of the six models
in Table 2 and is made up of two parts which are closely related.
Part ‘a’ of each figure shows the scores plot obtained using
SIMCA-P+. The scores plot shows the scores for each observation
on Principal Component (PC)1 and PC2. Strictly speaking the
SIMCA algorithm provides an estimate of the PC, which is more
correctly referred to on the figures as t [1]/t [2] on the scores plots
and p [1]/p [2] on the loading plots. PC is used within the text for
ease of reference although we accept that they are not identical to
principal components. The ellipse on the plot (Hotelling ellipse) is
the 95% confidence interval for the model, hence plots of this type
are sometimes referred to as Hotelling plots. Part ‘b’ in each of the
figures shows the corresponding loading plot. The loading plot
illustrates the relative contribution of each of the cytokines
(referred to as the ‘loading’) to the two principal components. It
is a linear contribution of each of these loadings that determines
the score for each observation in the scores plot.
The scores plot is used to determine if there is clustering of
observations, which would suggest a common underlying multi-
variate signal (or in this case pattern of cytokines) exists for that
particular cluster of observations. Observations on the scores plot
that lie within the Hotelling ellipse are within the 95% confidence
interval for the model and are therefore well modelled in statistical
terms. In order to interpret the cytokines responsible for a given
multivariate signal reference is made to the loading plot. Cytokines
with a larger loading on a PC in a particular direction contribute
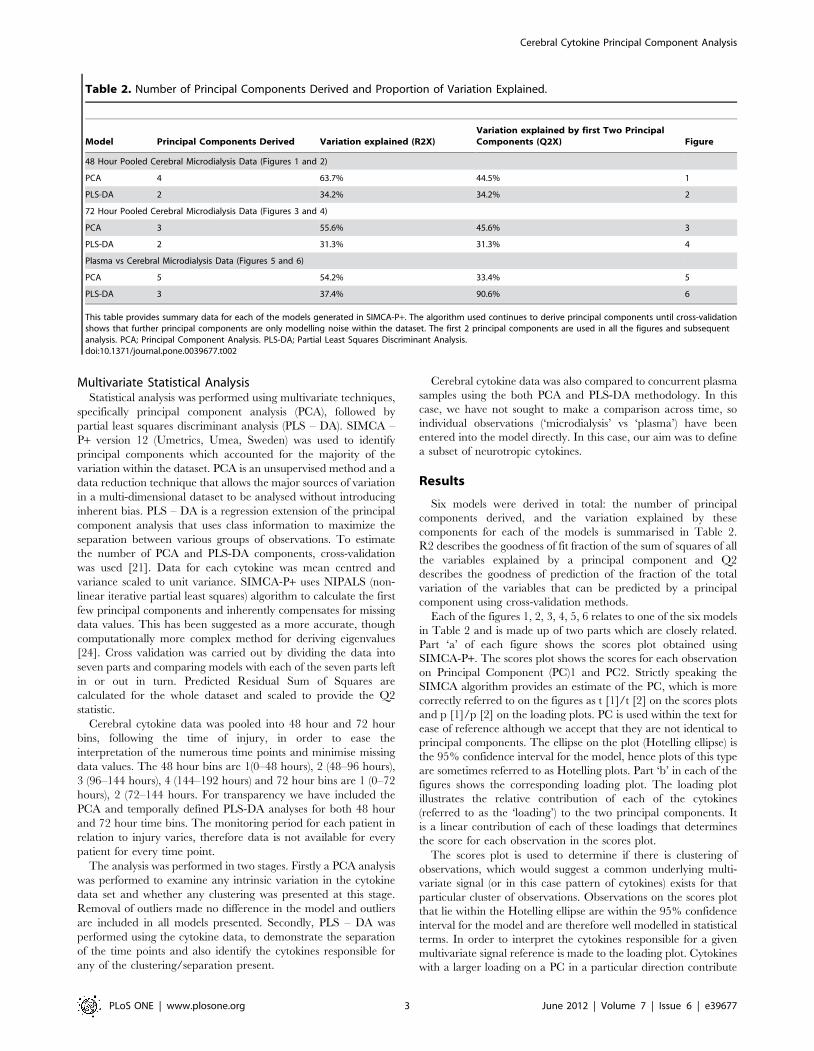
Table 2. Number of Principal Components Derived and Proportion of Variation Explained.
Model Principal Components Derived Variation explained (R2X)Variation explained by first Two PrincipalComponents (Q2X) Figure
48 Hour Pooled Cerebral Microdialysis Data (Figures 1 and 2)
PCA 4 63.7% 44.5% 1
PLS-DA 2 34.2% 34.2% 2
72 Hour Pooled Cerebral Microdialysis Data (Figures 3 and 4)
PCA 3 55.6% 45.6% 3
PLS-DA 2 31.3% 31.3% 4
Plasma vs Cerebral Microdialysis Data (Figures 5 and 6)
PCA 5 54.2% 33.4% 5
PLS-DA 3 37.4% 90.6% 6
This table provides summary data for each of the models generated in SIMCA-P+. The algorithm used continues to derive principal components until cross-validationshows that further principal components are only modelling noise within the dataset. The first 2 principal components are used in all the figures and subsequentanalysis. PCA; Principal Component Analysis. PLS-DA; Partial Least Squares Discriminant Analysis.doi:10.1371/journal.pone.0039677.t002
Cerebral Cytokine Principal Component Analysis
PLoS ONE | www.plosone.org 3 June 2012 | Volume 7 | Issue 6 | e39677
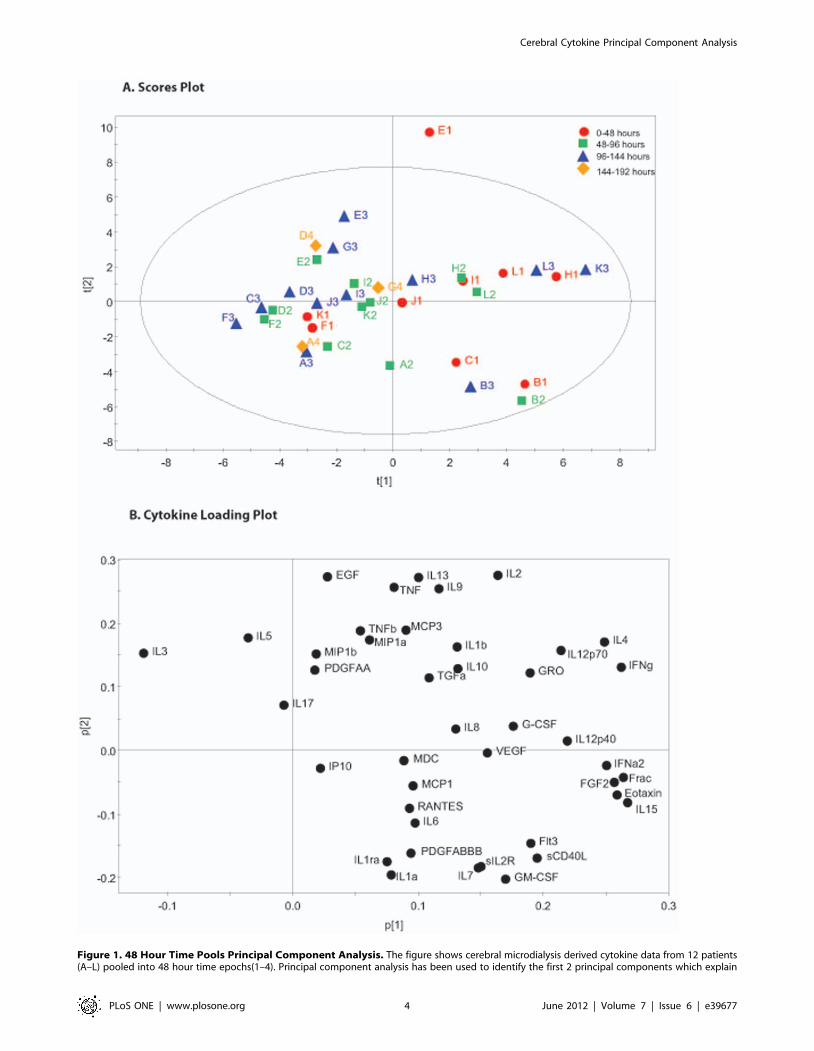
Figure 1. 48 Hour Time Pools Principal Component Analysis. The figure shows cerebral microdialysis derived cytokine data from 12 patients(A–L) pooled into 48 hour time epochs(1–4). Principal component analysis has been used to identify the first 2 principal components which explain
Cerebral Cytokine Principal Component Analysis
PLoS ONE | www.plosone.org 4 June 2012 | Volume 7 | Issue 6 | e39677
more heavily to the multivariate signal in that direction and
therefore make a greater contribution to observations with high
scores on that PC. Moreover, cytokines which cluster on the
loading plot have a high degree of co-variance when the sources of
variation in the model are considered.
Principal Component Analysis and PLS – DA of PooledMicrodialysate Data
The 48 hour microdialysate pooled data for each patient is
plotted individually in figure 1. The model generated four
principle components that explain 63.7% of the variation within
the dataset. The first two principal components are presented and
together explain 44.5% of the variation within the dataset. All data
points, other than E1 fall within the 0.95 Hotelling ellipse. The
corresponding loading plot (Figure 1b) demonstrates distinct
clusters of cytokines. PLS-DA of the same data using the time
point as the supervising variable (Figure 2a) demonstrates that
there is a consistent shift across time in the pattern of cytokine
expression following TBI. The corresponding PLS-DA plot
(Figure 2b) illustrates the cytokine loadings responsible for this
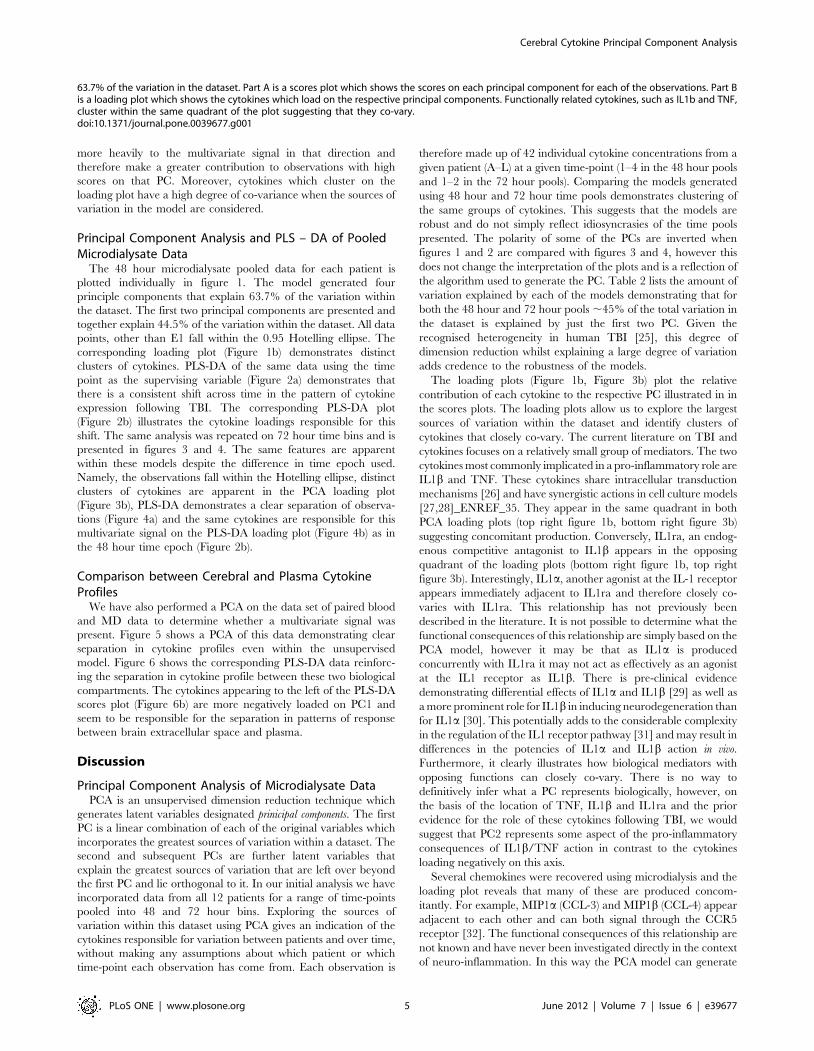
shift. The same analysis was repeated on 72 hour time bins and is
presented in figures 3 and 4. The same features are apparent
within these models despite the difference in time epoch used.
Namely, the observations fall within the Hotelling ellipse, distinct
clusters of cytokines are apparent in the PCA loading plot
(Figure 3b), PLS-DA demonstrates a clear separation of observa-
tions (Figure 4a) and the same cytokines are responsible for this
multivariate signal on the PLS-DA loading plot (Figure 4b) as in
the 48 hour time epoch (Figure 2b).
Comparison between Cerebral and Plasma CytokineProfiles
We have also performed a PCA on the data set of paired blood
and MD data to determine whether a multivariate signal was
present. Figure 5 shows a PCA of this data demonstrating clear
separation in cytokine profiles even within the unsupervised
model. Figure 6 shows the corresponding PLS-DA data reinforc-
ing the separation in cytokine profile between these two biological
compartments. The cytokines appearing to the left of the PLS-DA
scores plot (Figure 6b) are more negatively loaded on PC1 and
seem to be responsible for the separation in patterns of response
between brain extracellular space and plasma.
Discussion
Principal Component Analysis of Microdialysate DataPCA is an unsupervised dimension reduction technique which
generates latent variables designated prinicipal components. The first
PC is a linear combination of each of the original variables which
incorporates the greatest sources of variation within a dataset. The
second and subsequent PCs are further latent variables that
explain the greatest sources of variation that are left over beyond
the first PC and lie orthogonal to it. In our initial analysis we have
incorporated data from all 12 patients for a range of time-points
pooled into 48 and 72 hour bins. Exploring the sources of
variation within this dataset using PCA gives an indication of the
cytokines responsible for variation between patients and over time,
without making any assumptions about which patient or which
time-point each observation has come from. Each observation is
therefore made up of 42 individual cytokine concentrations from a
given patient (A–L) at a given time-point (1–4 in the 48 hour pools
and 1–2 in the 72 hour pools). Comparing the models generated
using 48 hour and 72 hour time pools demonstrates clustering of
the same groups of cytokines. This suggests that the models are
robust and do not simply reflect idiosyncrasies of the time pools
presented. The polarity of some of the PCs are inverted when
figures 1 and 2 are compared with figures 3 and 4, however this
does not change the interpretation of the plots and is a reflection of
the algorithm used to generate the PC. Table 2 lists the amount of
variation explained by each of the models demonstrating that for
both the 48 hour and 72 hour pools ,45% of the total variation in
the dataset is explained by just the first two PC. Given the
recognised heterogeneity in human TBI [25], this degree of
dimension reduction whilst explaining a large degree of variation
adds credence to the robustness of the models.
The loading plots (Figure 1b, Figure 3b) plot the relative
contribution of each cytokine to the respective PC illustrated in in
the scores plots. The loading plots allow us to explore the largest
sources of variation within the dataset and identify clusters of
cytokines that closely co-vary. The current literature on TBI and
cytokines focuses on a relatively small group of mediators. The two
cytokines most commonly implicated in a pro-inflammatory role are
IL1b and TNF. These cytokines share intracellular transduction
mechanisms [26] and have synergistic actions in cell culture models
[27,28]_ENREF_35. They appear in the same quadrant in both
PCA loading plots (top right figure 1b, bottom right figure 3b)
suggesting concomitant production. Conversely, IL1ra, an endog-
enous competitive antagonist to IL1b appears in the opposing
quadrant of the loading plots (bottom right figure 1b, top right
figure 3b). Interestingly, IL1a, another agonist at the IL-1 receptor
appears immediately adjacent to IL1ra and therefore closely co-
varies with IL1ra. This relationship has not previously been
described in the literature. It is not possible to determine what the
functional consequences of this relationship are simply based on the
PCA model, however it may be that as IL1a is produced
concurrently with IL1ra it may not act as effectively as an agonist
at the IL1 receptor as IL1b. There is pre-clinical evidence
demonstrating differential effects of IL1a and IL1b [29] as well as
a more prominent role for IL1b in inducing neurodegeneration than
for IL1a [30]. This potentially adds to the considerable complexity
in the regulation of the IL1 receptor pathway [31] and may result in
differences in the potencies of IL1a and IL1b action in vivo.
Furthermore, it clearly illustrates how biological mediators with
opposing functions can closely co-vary. There is no way to
definitively infer what a PC represents biologically, however, on
the basis of the location of TNF, IL1b and IL1ra and the prior
evidence for the role of these cytokines following TBI, we would
suggest that PC2 represents some aspect of the pro-inflammatory
consequences of IL1b/TNF action in contrast to the cytokines
loading negatively on this axis.
Several chemokines were recovered using microdialysis and the
loading plot reveals that many of these are produced concom-
itantly. For example, MIP1a (CCL-3) and MIP1b (CCL-4) appear
adjacent to each other and can both signal through the CCR5
receptor [32]. The functional consequences of this relationship are
not known and have never been investigated directly in the context
of neuro-inflammation. In this way the PCA model can generate
63.7% of the variation in the dataset. Part A is a scores plot which shows the scores on each principal component for each of the observations. Part Bis a loading plot which shows the cytokines which load on the respective principal components. Functionally related cytokines, such as IL1b and TNF,cluster within the same quadrant of the plot suggesting that they co-vary.doi:10.1371/journal.pone.0039677.g001
Cerebral Cytokine Principal Component Analysis
PLoS ONE | www.plosone.org 5 June 2012 | Volume 7 | Issue 6 | e39677

Cerebral Cytokine Principal Component Analysis
PLoS ONE | www.plosone.org 6 June 2012 | Volume 7 | Issue 6 | e39677

hypotheses relating to specific mediators that are produced in
concert in vivo.
The relationship between humoral and cellular inflammation
has been explored extensively in the peripheral immune system.
There is increasing interest in the role of microglia following TBI
and their ability to carry out a functional switch between a pro-
inflammatory and a reparative role. The nomenclature used by
different authors varies, however IFNc is thought to promote a
pro-inflammatory phenotype (classical-activation/Th1 type re-
sponse/M1 subtype) while IL-4 promotes an anti-inflammatory
response (regulatory/Th2 type response/M2 subtype). IL4 and
IFNc, appear immediately adjacent to each other on the far right
of the loading plot. Furthermore, both IL10 and IL12 have been
implicated in phenotypic plasticity of macrophages and they also
appear within in the same region of the loading plot [33,34].
Partial Least Squares Discriminant Analysis Using PooledTimepoints
As well as looking for sources of variation in the dataset as a
whole, multivariate projection techniques can also look for sources
of variation between pre-specified observations. These so-called
supervised techniques include PLS-DA. In this case, we have
chosen to define ‘time following injury’ as the supervising variable.
This allows an identification of the underlying patterns of cytokine
that are responsible for changes in time in this patient group. The
degree of variation explained by the models necessarily drops to
around 1/3 of the total variation (Table 2) as the PCs now
maximise variation specifically within in the time domain.
Figure 2a demonstrates that there is separation of the time
points on the scores plot with observations at the first time point
clustering towards the top left quadrant and observations from the
third time point clustering towards the lower right quadrant.
Figure 4a shows even clearer separation of the two time points,
although the polarity of the PC is inverted. This pattern is not
replicated for every patient (e.g. patient K moves from top right
quadrant towards the bottom left quadrant in figure 3a and from
top right quadrant to bottom left quadrant in figure 4a) however
the observations fall within the Hotelling 95% significance ellipse,
again suggesting that the PLS-DA model is an accurate
representation of the underlying dataset. It is not clear what is
responsible for this difference but no inference can be made solely
on the results from a single patient.
Inspection of the loading plots for the PLS-DA (figures 2b and
4b) reveal the cytokines that are responsible for the changing
pattern of response over time. As the loading of a cytokine on a
given PC is linearly related to the score that observation receives in
the scores plot, we can infer that the cluster of cytokines in the
quadrant of the loading plot adjacent to the first time point (e.g.
IL6, GRO, G-CSF, IP10) are produced earlier following injury in
relation to cytokines appearing in the opposite quadrant (e.g IL10,
MCP3, IL17). These models therefore suggest that there are
distinct temporal phases to the innate inflammatory response to
brain trauma. An important caveat to the interpretation of the
cytokines responsible for ‘early’ vs ‘late’ patterns, is that
microdialysis monitoring in patients is not available immediately
at the time of injury. In practice, a minimum of 24 hours elapses
before a patient is resuscitated, transferred to neurocritical care
and monitoring is instituted. For this reason, cytokines that are
known to be produced and released within the first 24 hours
following injury are likely to be under-represented within this
model as their levels are already likely to have peaked and may
have returned to baseline levels at the time of monitoring. We
would therefore expect that cytokines that peak at 24–48 or 24–72
hours are most likely to load highly for the early time points. From
an analysis of the time at which each cytokine has its highest (peak)
value following TBI [6], this would appear to be the case for IL6,
G-CSF and IP10. Similarly IL10 appears to have its highest values
at day 5–6 and appears in the later time points. Both, IL10 and
IL17 have both been implicated in the interaction between cells of
the macrophage lineage and regulatory T-cell responses [33,35].
This temporal shift may therefore represent a shift from innate to
adaptive immunity in the cerebral cytokine profile following TBI.
Comparison between Microdialysate and PlasmaPatterns of Cytokine Production
We have also explored the relationship between the systemic
inflammatory response, as gauged within plasma, and the cerebral
inflammatory response to trauma. In order to make this
comparison we have used temporally paired serum and micro-
dialysate samples assayed using the same technique for the same
substances. Figure 5a shows the hotelling plot and loading plot for
the entire dataset. It is immediately apparent that even in an
unsupervised model, there is a clear separation between observa-
tions made in the two compartments. We have also carried out a
PLS-DA on this dataset using the biological source of the sample
(microdialysate vs plasma) as the supervising variable (Figure 6).
The close concordance between the loading plots in the PCA and
PLS-DA models suggests a robust differentiation between the two
compartments.
The individual mediators involved in inflammation are ubiqui-
tous and implicated in several contexts and pathologies. Identify-
ing tissue specific variations provides an insight into the subtleties
of the inflammatory response in TBI. Almost all the microdialysate
observations load negatively on PC1 in contrast to the plasma
samples (Figure 6). The cytokines loading most heavily in this
direction are the chemokines MCP-1, MCP-3, MIP1a, MIP1b,
IP-10 and the cytokines IL-6 and IL-8. Several recent studies have
highlighted the importance of MCP-1 (CCL-2) in the pathogenesis
of TBI in animal models [36,37]. It has also been shown to
modulate cytokine production in a mouse culture model [38]. This
comparative neural tropism of this group of chemokines suggests
that, in response to TBI, they are playing a more pronounced role
centrally rather than systemically. This is not to say that the other
mediators are unimportant in TBI, however the patterns of
expression are more equally distributed between the central and
peripheral compartments. The same caveats regarding monitoring
period also apply in this context i.e. cytokines and chemokines that
may show differences between the two biological compartments in
the first 24 hours following injury will not be identified in this
analysis.
Figure 2. 48 Hour Time Pools Partial Least Squares Discriminant Analysis. The figure shows the same cerebral microdialysis derivedcytokine data as in figure 1, from 12 patients (A–L) pooled into 48 hour time epochs (Red 0–48 hours, Green 48–96 hours, Blue 96–144 hours, Yellow144–192 hours). Partial Least Squares Discriminant Analysis is a regression extension of Principal Component Analysis in which the model identifiesthe greatest sources of variation between pre-specified groups of observations. In this case the supervising variable is time. There is a clear shift in thepattern of observations in the scores plot (part A) over time from the 0–48 hour epoch (red) to the 48–96 hour time epoch (green) to the later timepoints (blue and yellow). The loading plot (part B) illustrates the cytokines that are responsible for the pattern apparent in part a.doi:10.1371/journal.pone.0039677.g002
Cerebral Cytokine Principal Component Analysis
PLoS ONE | www.plosone.org 7 June 2012 | Volume 7 | Issue 6 | e39677
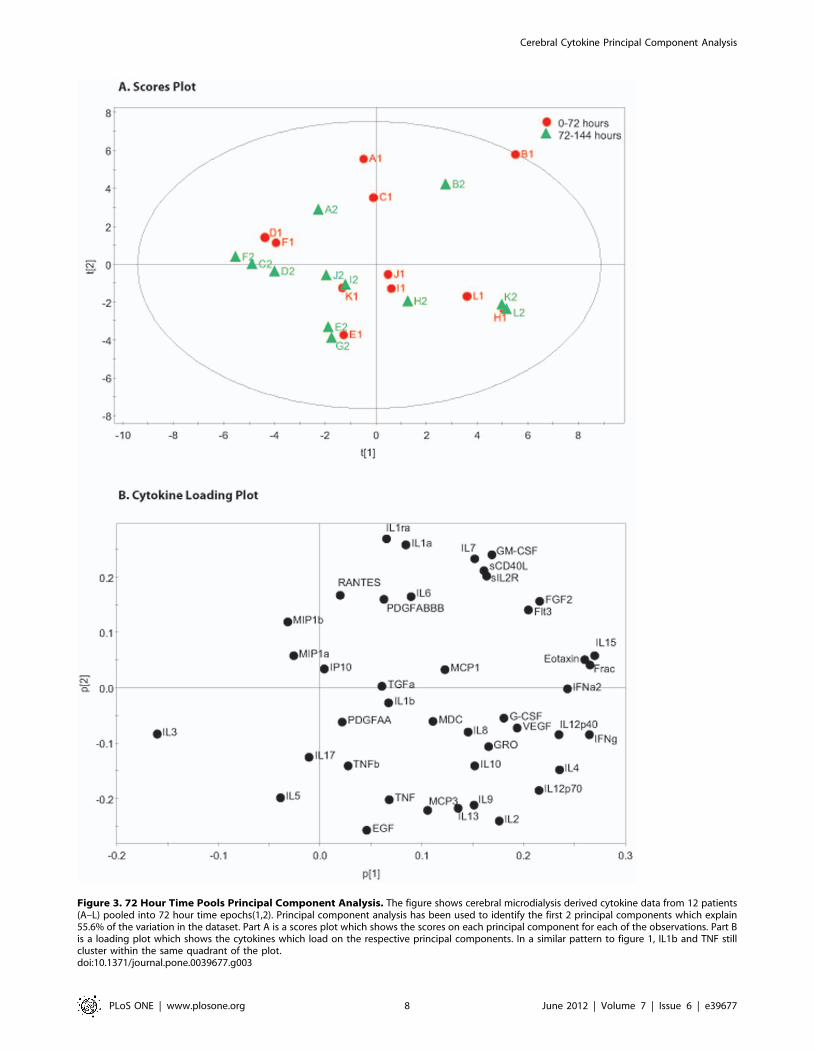
Figure 3. 72 Hour Time Pools Principal Component Analysis. The figure shows cerebral microdialysis derived cytokine data from 12 patients(A–L) pooled into 72 hour time epochs(1,2). Principal component analysis has been used to identify the first 2 principal components which explain55.6% of the variation in the dataset. Part A is a scores plot which shows the scores on each principal component for each of the observations. Part Bis a loading plot which shows the cytokines which load on the respective principal components. In a similar pattern to figure 1, IL1b and TNF stillcluster within the same quadrant of the plot.doi:10.1371/journal.pone.0039677.g003
Cerebral Cytokine Principal Component Analysis
PLoS ONE | www.plosone.org 8 June 2012 | Volume 7 | Issue 6 | e39677
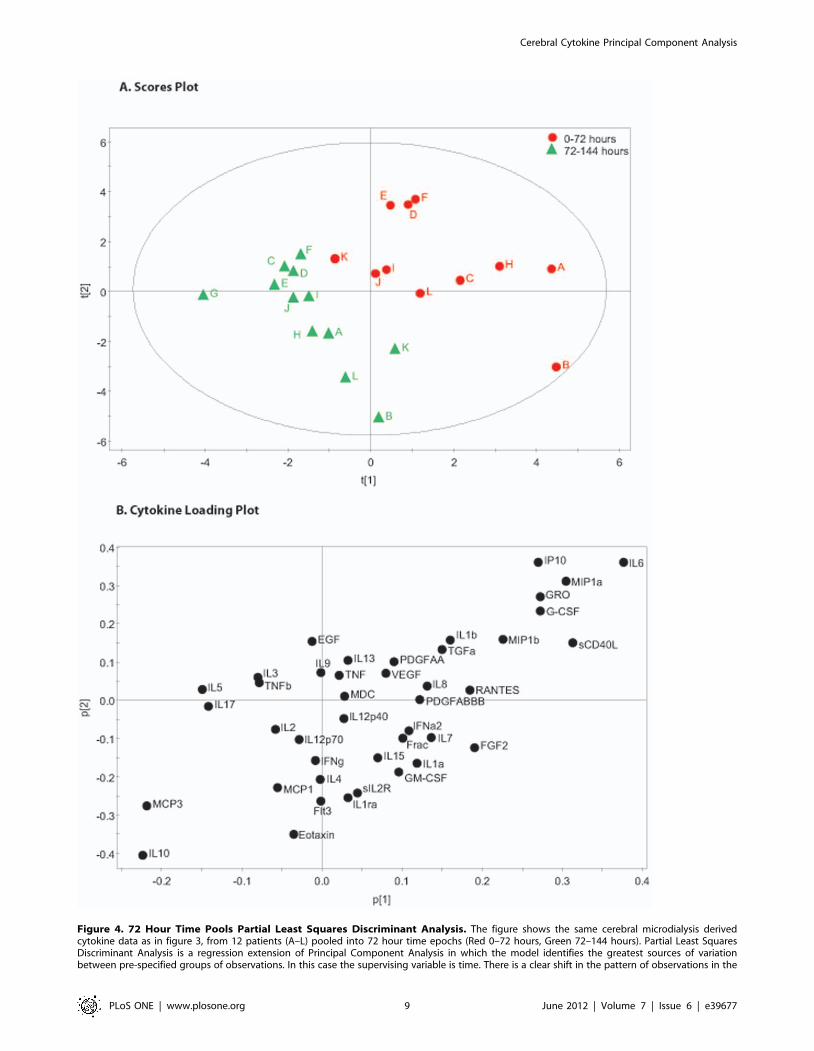
Figure 4. 72 Hour Time Pools Partial Least Squares Discriminant Analysis. The figure shows the same cerebral microdialysis derivedcytokine data as in figure 3, from 12 patients (A–L) pooled into 72 hour time epochs (Red 0–72 hours, Green 72–144 hours). Partial Least SquaresDiscriminant Analysis is a regression extension of Principal Component Analysis in which the model identifies the greatest sources of variationbetween pre-specified groups of observations. In this case the supervising variable is time. There is a clear shift in the pattern of observations in the
Cerebral Cytokine Principal Component Analysis
PLoS ONE | www.plosone.org 9 June 2012 | Volume 7 | Issue 6 | e39677
Advantages of Multivariate Projection MethodsThere is a growing recognition that humoral mediators of
innate inflammation (i.e. cytokines and chemokines) play a
mechanistic role in the pathophysiological processes in a range
of neurological disorders including HIV encephalitis [39],
ischaemic stroke [40] as well as in TBI [3]. Microdialysis is
unique in its ability to sample the extracellular fraction of soluble
mediators, providing a direct and temporally distinct proxy for the
biology of the brain extracellular space [41]. However, biomarker
studies of this type are intrinsically limited in their interpretation
by the fact that each of the measured variables is likely to show
multi-collinearity with other related variables. Studies which
sample only a few or even single cytokines within a biological
compartment and attempt a univariate correlation with clinical
parameters or with other biomarkers may be confounded by a
range of other factors such as severity of injury or other
unmeasured biomarkers [5,42]. This can lead to erroneous
conclusions about the role of cytokines as beneficial or harmful
based on these simplistic correlations. As our understanding of
innate inflammation following TBI has developed, it has become
apparent that a given cytokine may play a dual role, damaging or
reparative, depending on the context in which it is expressed either
in terms of timescale or the co-existent cytokine milieu
[3,5,43,44,45]. The complexity and subtleties of these interactions
are difficult to model mathematically, however, without taking
these putative interactions into account an understanding of
cytokine biology will continue to elude us. Multivariate regression
has been used extensively in the TBI literature to relate a range of
variables to clinical outcome following TBI including clinical
parameters (such as age, GCS, pupillary function) [46,47,48],
microdialysate parameters (L/P ratio) [49] and serum parameters
(Hb, PT) [50]. This statistical method requires large numbers of
observations as the number of variables increases and often take
measures at single timepoints (e.g. admission serum parameters)
[50] or take a mean of the measured variable (e.g. L/P ratio over
monitoring period) [49] to reduce the number of variables
incorporated to a manageable number [51]. This has the potential
to discard potentially useful temporal information. Cytokine data,
in particular, is characterised by marked rises in concentration that
are short lived. If the concentration of a cytokine is averaged over
the entire monitoring period (equivalent to the area under the
time-concentration curve if sampling time points are evenly
spaced), the mean may be heavily influenced by the length of the
monitoring period at which baseline levels are measured [5].
In order to address some of these issues we have utilised well
characterised multivariate projection techniques, one of a range of
chemometric methods [52], to explore the sources of variation
within a complex human cytokine dataset. The greatest advantage
of the approach presented here is that no prior assumptions are
made as to which cytokines or mediators are of ‘importance’. The
option to carry out multiple t-tests comparing a subset cytokines
which are already well characterised, as in several of the studies
referenced above, incorporates inherent bias into any analysis and
perpetuates this bias in the literature as a whole. While it is
impossible to draw any direct inference with regards to the
biological function of a given mediator based on the analyses
presented here, this does not detract from the ability to generate
hypotheses and identify previously unrecognised relationships.
The same statistical methodology may have additional utility in
the analysis of data from alternative analytical techniques in TBI
such as proteomics [53].
LimitationsMicrodialysis is intrinsically a focal monitor and the question
arises as to whether the volume of brain sampled by the catheter is
truly representative of the brain as a whole, particularly in view of
the heterogeneity of TBI such that the volume sampled may be
more or less injured compared with other brain areas. There is
some evidence that the inflammatory response is distributed within
both hemispheres, even in focal injuries [54], and patients within
this study were prospectively selected on the basis of diffuse brain
injuries. Another issue that has drawn attention within the
microdialysis literature is that of relative recovery (RR), i.e. the
proportion of a substance within the extracellular space that
crosses the microdialysis membrane and can be recovered in the
microdialysis fluid [55]. We have previously demonstrated that
RR varies between cytokines depending on their physico-chemical
properties such as pI and molecular weight [56]. For this reason
the relative concentrations of mediators assayed within the
microdialysis fluid may not reflect the absolute concentrations
within the brain extracellular space. However, the multivariate
projection methods employed compensate for both differences in
RR and for variations in the underlying degree of injury sampled
by the catheter, by normalising the data. In this way the model
identifies patterns of response between mediators unrelated to
the absolute concentration of any given mediator in any given
catheter. This is one of the key advantages of these techniques in
analysing microdialysis data. This normalisation also allows for a
direct comparison in the patterns of expression between the
responses in plasma and brain extracellular space irrespective of
absolute values. While an estimate of RR is not required to carry
out these analyses, comparisons between patients still require the
RR to be consistent between catheters and patients. The factors
affecting RR have been reviewed extensively in the literature
[55,56]. Mediators that have a high random variation in RR are
less likely to be contribute to variation in supervised models, such
as the PLS-DA, and will therefore have a diminished loading on a
given PC.
A further criticism of microdialysis for assessing the inflamma-
tory response to trauma is the suggestion that insertion of the
catheter, in itself, triggers an injurious response that is superim-
posed on the response to the initial trauma. The existing cerebral
microdialysis literature provides evidence against this [5]. Firstly,
cytokines that are shown in animal models to be produced early
(e.g. IL1b, TNF) following injury are not sampled in patients in
which monitoring commences later following injury [6]. If the
cytokine response was in response to catheter insertion, there
would be a consistent temporal response irrespective of the time of
catheter insertion to time of injury. Secondly, there are pathology
specific differences in production of cytokines when conditions
such as subarachnoid haemorrhage [57] and tumour [58] patients
are compared with those following TBI [6]. Thirdly, there appears
to be a stereotyped sequence of cytokine production when the time
lag between the time of injury and the ‘peak’ cytokine
concentration is observed [6]. This is reinforced in this study in
Figures 2 and 4. The pattern of cytokine response is apparent
despite the variation between patients in the time frame over
which monitoring occurs. The clustering of time points occurs
when the time following injury is used rather than time from
scores plot (part A) over time from the early time points (red) to the later time points (green). The loading plot (part B) illustrates the cytokines thatare responsible for the pattern apparent in part a.doi:10.1371/journal.pone.0039677.g004
Cerebral Cytokine Principal Component Analysis
PLoS ONE | www.plosone.org 10 June 2012 | Volume 7 | Issue 6 | e39677
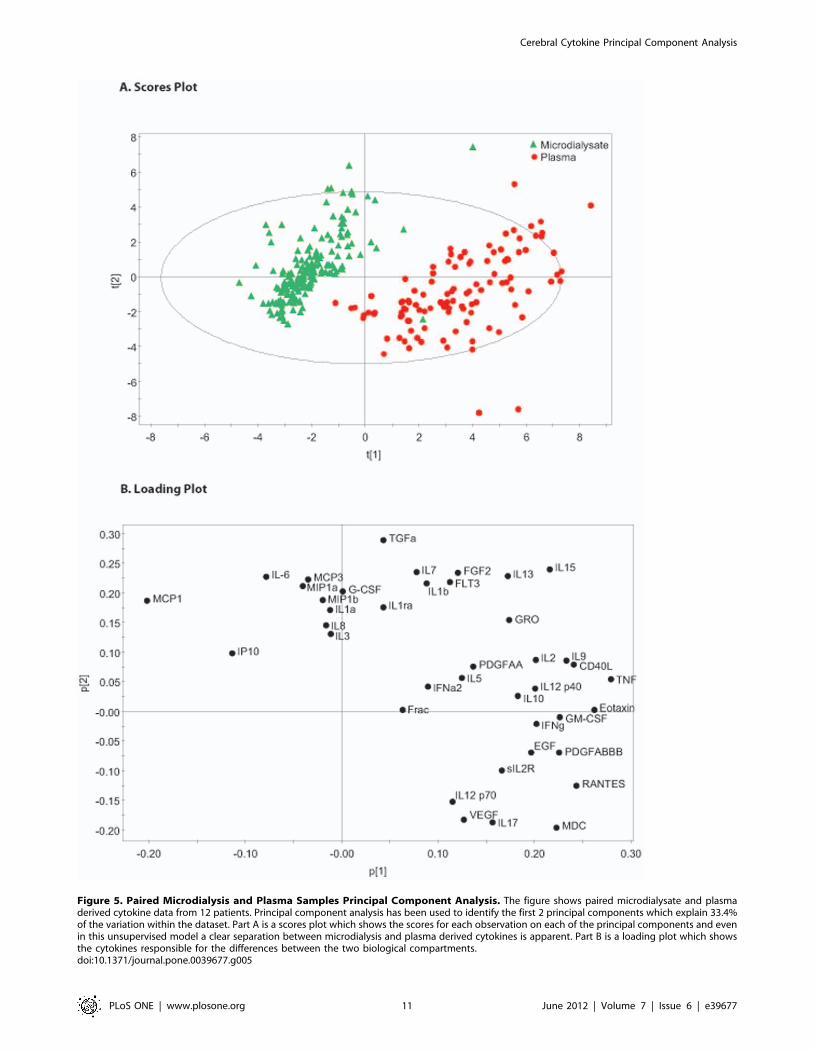
Figure 5. Paired Microdialysis and Plasma Samples Principal Component Analysis. The figure shows paired microdialysate and plasmaderived cytokine data from 12 patients. Principal component analysis has been used to identify the first 2 principal components which explain 33.4%of the variation within the dataset. Part A is a scores plot which shows the scores for each observation on each of the principal components and evenin this unsupervised model a clear separation between microdialysis and plasma derived cytokines is apparent. Part B is a loading plot which showsthe cytokines responsible for the differences between the two biological compartments.doi:10.1371/journal.pone.0039677.g005
Cerebral Cytokine Principal Component Analysis
PLoS ONE | www.plosone.org 11 June 2012 | Volume 7 | Issue 6 | e39677
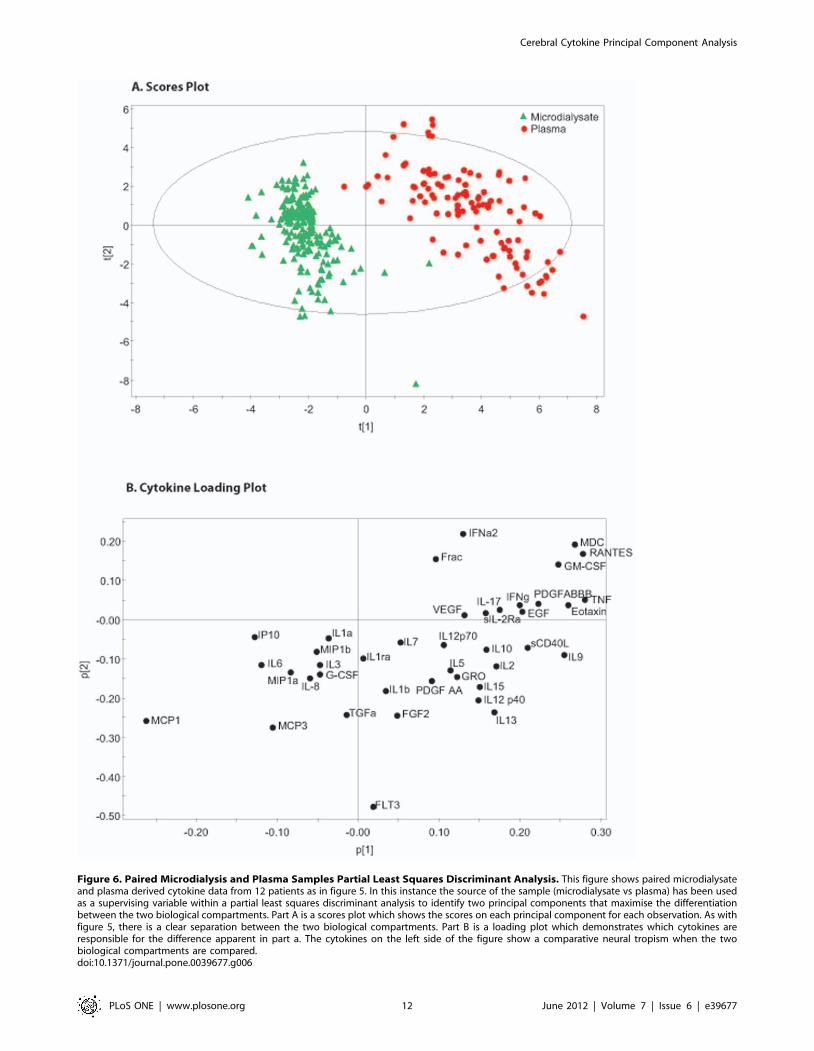
Figure 6. Paired Microdialysis and Plasma Samples Partial Least Squares Discriminant Analysis. This figure shows paired microdialysateand plasma derived cytokine data from 12 patients as in figure 5. In this instance the source of the sample (microdialysate vs plasma) has been usedas a supervising variable within a partial least squares discriminant analysis to identify two principal components that maximise the differentiationbetween the two biological compartments. Part A is a scores plot which shows the scores on each principal component for each observation. As withfigure 5, there is a clear separation between the two biological compartments. Part B is a loading plot which demonstrates which cytokines areresponsible for the difference apparent in part a. The cytokines on the left side of the figure show a comparative neural tropism when the twobiological compartments are compared.doi:10.1371/journal.pone.0039677.g006
Cerebral Cytokine Principal Component Analysis
PLoS ONE | www.plosone.org 12 June 2012 | Volume 7 | Issue 6 | e39677
monitoring. It can be seen in this figure that some patients did not
have any samples in the first 48 hours, however their pattern of
cytokine production remains consistent with patients that did have
early monitoring. It should be pointed out that the issue of ‘trauma
artefact’ is a contentious one in the microdialysis literature [59]
and some authors have suggested discarding the initial samples
(e.g. the first 24 hours [60]) following catheter insertion despite the
points made above.
In the analysis of cerebral cytokines we have chosen to pool our
data into 48 and 72 hour blocks. There is a balance to be struck
between smoothing out random variations at a given time-point
and maintaining an appropriate degree of temporal resolution.
Taking a mean over a period of time also helps to minimise
missing data points and adds a degree of clarity to the scores plots
in figures 1, 2, 3, 4. We accept that this is entirely subjective and is
in the authors’ opinion the time frame which provides the clearest
representation of the data.
All the models presented are derived from the same cohort of 12
patients. There is a risk that the models presented are an
idiosyncrasy of the particular dataset used to generate them. In
statistical terms this is referred to as ‘over-fitting’. Cross-validation
is used to provide an estimate of the predictive ability of the model
however ultimately the most stringent test would be to collect data
from a further cohort of patients and plot them on the same PCs to
provide an empirical validation.
One issue that we have not been able to address is the reasons
for any variation in cytokine pattern seen between patients. It
would be tempting to pick out other clinical factors such as GCS
or an outcome measure such as Glasgow Outcome Score (GOS)
and attempt a PLS-DA. However, in a small cohort of patients
such as this, we do not feel this would be scientifically justifiable.
These analyses will require larger patient numbers in order to
utilise multivariate techniques to analyse clinical parameters such
as these. Ultimately, the most useful application of PLS-DA may
be in interventional studies in which patient populations that are
subjected to differing treatment paradigms can be compared in
terms of their biological response. This may provide a more
sensitive chemical surrogate for treatment efficacy than conven-
tional outcome measures such as GOS.
Microdialysis has been evaluated extensively as a monitor for
cerebral metabolism following TBI [49,61] however our under-
standing of the biology of cytokines and chemokines in this context
is not at a stage where we can promote its use as a clinical tool.
Furthermore, the time and cost of recovering these samples,
laboratory analysis and statistical testing does not lend itself to ‘on-
line’ clinical decision making.
ConclusionIn this study we have utilised multivariate projection techniques
to reveal how inflammatory mediators demonstrate a distinct
pattern of response to TBI in humans. Firstly, we have shown that
several mediators show close co-variance (e.g. IL1a and IL1ra)
indicating that they are produced in concert as a result of injury.
Secondly, we have identified cytokines and chemokines that are
produced at defined time points (e.g. IL6 at 24–48 hours, IL-10 at
96–144 hours) and discriminate between different temporal phases
of the inflammatory response. Lastly, we have demonstrated that
there are tissue specific variations (brain vs blood) in the patterns of
mediators that are produced as a result of TBI.
In an observational study such as this no inference can be made
as to the specific functions attributable to a given cluster of
mediators, however by empirically determining the patterns of
response the interactions of specific mediators can be explored
further in animal and cell culture models. In particular, these
techniques compensate for the inherent difficulties related to
analysing multiple closely related mediators related to multi-
collinearity, missing data points, mediators produced at different
absolute concentration ranges and data from small numbers of
patients. We envisage that this method can be extended into
randomised studies in which cytokine data can be compared
between patients receiving specific interventions.
Acknowledgments
CAA has been trained in the use of SIMCA-P+ by Umetrics, AB however
she derives no financial inducement from Umetrics, AB.
Author Contributions
Conceived and designed the experiments: AH PJH. Performed the
experiments: AH. Analyzed the data: AH CAA MRG. Contributed
reagents/materials/analysis tools: AH CAA MRG. Wrote the paper: AH.
Reviewed manuscript: KLHC PJH. Provided statistical advice: CAA.
References
1. Andriessen TM, Jacobs B, Vos PE (2010) Clinical characteristics and
pathophysiological mechanisms of focal and diffuse traumatic brain injury.
J Cell Mol Med 14: 2381–2392.
2. Schmidt OI, Heyde CE, Ertel W, Stahel PF (2005) Closed head injury–an
inflammatory disease? Brain Res Brain Res Rev 48: 388–399.
3. Morganti-Kossmann MC, Satgunaseelan L, Bye N, Kossmann T (2007)
Modulation of immune response by head injury. Injury 38: 1392–1400.
4. Loane DJ, Byrnes KR (2010) Role of microglia in neurotrauma. Neurother-
apeutics 7: 366–377.
5. Helmy A, Simoni MG, Guilfoyle MR, Carpenter KL, Hutchinson PJ (2011)
Cytokines and innate inflammation in the pathogenesis of human traumatic
brain injury. Prog Neurobiol.
6. Helmy A, Carpenter KL, Menon DK, Pickard JD, Hutchinson PJ (2011) The
cytokine response to human traumatic brain injury: temporal profiles and
evidence for cerebral parenchymal production. J Cereb Blood Flow Metab 31:
658–670.
7. Stein DM, Kufera JA, Lindell A, Murdock KR, Menaker J, et al. (2011)
Association of CSF biomarkers and secondary insults following severe traumatic
brain injury. Neurocrit Care 14: 200–207.
8. Stein DM, Lindell A, Murdock KR, Kufera JA, Menaker J, et al. (2011)
Relationship of serum and cerebrospinal fluid biomarkers with intracranial
hypertension and cerebral hypoperfusion after severe traumatic brain injury.
J Trauma 70: 1096–1103.
9. Hergenroeder GW, Moore AN, McCoy JP Jr, Samsel L, Ward NH 3rd, et al.
(2010) Serum IL-6: a candidate biomarker for intracranial pressure elevation
following isolated traumatic brain injury. J Neuroinflammation 7: 19.
10. Hayakata T, Shiozaki T, Tasaki O, Ikegawa H, Inoue Y, et al. (2004) Changesin CSF S100B and cytokine concentrations in early-phase severe traumatic brain
injury. Shock 22: 102–107.
11. Shiozaki T, Hayakata T, Tasaki O, Hosotubo H, Fuijita K, et al. (2005)
Cerebrospinal fluid concentrations of anti-inflammatory mediators in early-phase severe traumatic brain injury. Shock 23: 406–410.
12. Kirchhoff C, Buhmann S, Bogner V, Stegmaier J, Leidel BA, et al. (2008)
Cerebrospinal IL-10 concentration is elevated in non-survivors as compared to
survivors after severe traumatic brain injury. Eur J Med Res 13: 464–468.
13. Pleines UE, Morganti-Kossmann MC, Rancan M, Joller H, Trentz O, et al.(2001) S-100 beta reflects the extent of injury and outcome, whereas neuronal
specific enolase is a better indicator of neuroinflammation in patients with severe
traumatic brain injury. J Neurotrauma 18: 491–498.
14. Pleines UE, Stover JF, Kossmann T, Trentz O, Morganti-Kossmann MC (1998)Soluble ICAM-1 in CSF coincides with the extent of cerebral damage in patients
with severe traumatic brain injury. J Neurotrauma 15: 399–409.
15. Singhal A, Baker AJ, Hare GM, Reinders FX, Schlichter LC, et al. (2002)
Association between cerebrospinal fluid interleukin-6 concentrations and
outcome after severe human traumatic brain injury. J Neurotrauma 19: 929–937.
16. Chiaretti A, Antonelli A, Mastrangelo A, Pezzotti P, Tortorolo L, et al. (2008)
Interleukin-6 and nerve growth factor upregulation correlates with improved
outcome in children with severe traumatic brain injury. J Neurotrauma 25: 225–234.
17. Chiaretti A, Barone G, Riccardi R, Antonelli A, Pezzotti P, et al. (2009) NGF,
DCX, and NSE upregulation correlates with severity and outcome of head
trauma in children. Neurology 72: 609–616.
Cerebral Cytokine Principal Component Analysis
PLoS ONE | www.plosone.org 13 June 2012 | Volume 7 | Issue 6 | e39677
18. Hillman J, Aneman O, Persson M, Andersson C, Dabrosin C, et al. (2007)
Variations in the response of interleukins in neurosurgical intensive care patientsmonitored using intracerebral microdialysis. J Neurosurg 106: 820–825.
19. Hutchinson PJ, O’Connell MT, Rothwell NJ, Hopkins SJ, Nortje J, et al. (2007)
Inflammation in human brain injury: intracerebral concentrations of IL-1alpha,IL-1beta, and their endogenous inhibitor IL-1ra. J Neurotrauma 24: 1545–1557.
20. Pinteaux E, Trotter P, Simi A (2009) Cell-specific and concentration-dependent
actions of interleukin-1 in acute brain inflammation. Cytokine 45: 1–7.
21. Eriksson L, Antti H, Gottfries J, Holmes E, Johansson E, et al. (2004) Using
chemometrics for navigating in the large data sets of genomics, proteomics, andmetabonomics (gpm). Anal Bioanal Chem 380: 419–429.
22. Eriksson L JE, Kettaneh-Wold N, Wold S (2001) Multi- and megavariate data
analysis–principles and applications.: Umetrics AB.
23. Eriksson L, Johansson E, Kettaneh-Wold N, Trygg J, Wikstrom J, et al. (2006)
Multi- and megavariate data analysis, Part II, Advanced applications and
method extensions, second revised and enlarged edition. Umetrics AB.
24. Boulesteix AL, Strimmer K (2007) Partial least squares: a versatile tool for the
analysis of high-dimensional genomic data. Brief Bioinform 8: 32–44.
25. Saatman KE, Duhaime AC, Bullock R, Maas AI, Valadka A, et al. (2008)Classification of traumatic brain injury for targeted therapies. J Neurotrauma 25:
719–738.
26. Medzhitov R (2001) Toll-like receptors and innate immunity. Nat Rev Immunol
1: 135–145.
27. Chao CC, Hu S, Ehrlich L, Peterson PK (1995) Interleukin-1 and tumornecrosis factor-alpha synergistically mediate neurotoxicity: involvement of nitric
oxide and of N-methyl-D-aspartate receptors. Brain Behav Immun 9: 355–365.
28. Downen M, Amaral TD, Hua LL, Zhao ML, Lee SC (1999) Neuronal death incytokine-activated primary human brain cell culture: role of tumor necrosis
factor-alpha. Glia 28: 114–127.
29. Andre R, Pinteaux E, Kimber I, Rothwell NJ (2005) Differential actions of IL-1
alpha and IL-1 beta in glial cells share common IL-1 signalling pathways.
Neuroreport 16: 153–157.
30. Patel HC, Bouamra O, Woodford M, King AT, Yates DW, et al. (2005) Trends
in head injury outcome from 1989 to 2003 and the effect of neurosurgical care:an observational study. Lancet 366: 1538–1544.
31. Simi A, Tsakiri N, Wang P, Rothwell NJ (2007) Interleukin-1 and inflammatory
neurodegeneration. Biochem Soc Trans 35: 1122–1126.
32. Deshmane SL, Kremlev S, Amini S, Sawaya BE (2009) Monocyte chemoat-
tractant protein-1 (MCP-1): an overview. J Interferon Cytokine Res 29: 313–
326.
33. Mosser DM, Edwards JP (2008) Exploring the full spectrum of macrophage
activation. Nat Rev Immunol 8: 958–969.
34. Murray PJ, Wynn TA (2011) Obstacles and opportunities for understandingmacrophage polarization. J Leukoc Biol 89: 557–563.
35. Dong C (2008) TH17 cells in development: an updated view of their molecularidentity and genetic programming. Nat Rev Immunol 8: 337–348.
36. Semple BD, Bye N, Ziebell JM, Morganti-Kossmann MC (2010) Deficiency of
the chemokine receptor CXCR2 attenuates neutrophil infiltration and corticaldamage following closed head injury. Neurobiol Dis 40: 394–403.
37. Semple BD, Bye N, Rancan M, Ziebell JM, Morganti-Kossmann MC (2010)
Role of CCL2 (MCP-1) in traumatic brain injury (TBI): evidence from severeTBI patients and CCL22/2 mice. J Cereb Blood Flow Metab 30: 769–782.
38. Semple BD, Frugier T, Morganti-Kossmann MC (2010) CCL2 modulatescytokine production in cultured mouse astrocytes. J Neuroinflammation 7: 67.
39. Yao H, Bethel-Brown C, Li CZ, Buch SJ (2010) HIV neuropathogenesis: a tight
rope walk of innate immunity. J Neuroimmune Pharmacol 5: 489–495.
40. Ceulemans AG, Zgavc T, Kooijman R, Hachimi-Idrissi S, Sarre S, et al. (2010)
The dual role of the neuroinflammatory response after ischemic stroke:
modulatory effects of hypothermia. J Neuroinflammation 7: 74.
41. Helmy A, Carpenter KL, Hutchinson PJ (2007) Microdialysis in the human
brain and its potential role in the development and clinical assessment of drugs.Curr Med Chem 14: 1525–1537.
42. Helmy A, Timofeev I, Palmer CR, Gore A, Menon DK, et al. (2010)
Hierarchical log linear analysis of admission blood parameters and clinicaloutcome following traumatic brain injury. Acta Neurochir (Wien) 152: 953–957.
43. Shohami E, Ginis I, Hallenbeck JM (1999) Dual role of tumor necrosis factor
alpha in brain injury. Cytokine Growth Factor Rev 10: 119–130.44. Popovich PG, Longbrake EE (2008) Can the immune system be harnessed to
repair the CNS? Nat Rev Neurosci 9: 481–493.45. Swartz KR, Liu F, Sewell D, Schochet T, Campbell I, et al. (2001) Interleukin-6
promotes post-traumatic healing in the central nervous system. Brain Res 896:
86–95.46. Marmarou A, Lu J, Butcher I, McHugh GS, Murray GD, et al. (2007)
Prognostic value of the Glasgow Coma Scale and pupil reactivity in traumaticbrain injury assessed pre-hospital and on enrollment: an IMPACT analysis.
J Neurotrauma 24: 270–280.47. Mushkudiani NA, Engel DC, Steyerberg EW, Butcher I, Lu J, et al. (2007)
Prognostic value of demographic characteristics in traumatic brain injury: results
from the IMPACT study. J Neurotrauma 24: 259–269.48. Murray GD, Butcher I, McHugh GS, Lu J, Mushkudiani NA, et al. (2007)
Multivariable prognostic analysis in traumatic brain injury: results from theIMPACT study. J Neurotrauma 24: 329–337.
49. Timofeev I, Carpenter KL, Nortje J, Al-Rawi PG, O’Connell MT, et al. (2011)
Cerebral extracellular chemistry and outcome following traumatic brain injury:a microdialysis study of 223 patients. Brain 134: 484–494.
50. Van Beek JG, Mushkudiani NA, Steyerberg EW, Butcher I, McHugh GS, et al.(2007) Prognostic value of admission laboratory parameters in traumatic brain
injury: results from the IMPACT study. J Neurotrauma 24: 315–328.51. Ramon J, Fierens D, Guiza F, Meyfroidt G, Blockeel H, et al. (2007) Mining
data from intensive care patients. Advanced Engineering Informatics 21: 243–
256.52. Gasteiger J (2006) Chemoinformatics: a new field with a long tradition. Anal
Bioanal Chem 384: 57–64.53. Hanrieder J, Wetterhall M, Enblad P, Hillered L, Bergquist J (2009) Temporally
resolved differential proteomic analysis of human ventricular CSF for
monitoring traumatic brain injury biomarker candidates. J Neurosci Methods177: 469–478.
54. Frugier T, Morganti-Kossmann MC, O’Reilly D, McLean CA (2010) In situdetection of inflammatory mediators in post mortem human brain tissue after
traumatic injury. J Neurotrauma 27: 497–507.55. Dahlin AP, Wetterhall M, Caldwell KD, Larsson A, Bergquist J, et al. (2010)
Methodological aspects on microdialysis protein sampling and quantification in
biological fluids: an in vitro study on human ventricular CSF. Anal Chem 82:4376–4385.
56. Helmy A, Carpenter KL, Skepper JN, Kirkpatrick PJ, Pickard JD, et al. (2009)Microdialysis of cytokines: methodological considerations, scanning electron
microscopy, and determination of relative recovery. J Neurotrauma 26: 549–
561.57. Mellergard P, Aneman O, Sjogren F, Saberg C, Hillman J (2011) Differences in
cerebral extracellular response of interleukin-1beta, interleukin-6, and interleu-kin-10 after subarachnoid hemorrhage or severe head trauma in humans.
Neurosurgery 68: 12–19; discussion 19.58. Marcus HJ, Carpenter KL, Price SJ, Hutchinson PJ (2010) In vivo assessment of
high-grade glioma biochemistry using microdialysis: a study of energy-related
molecules, growth factors and cytokines. J Neurooncol 97: 11–23.59. Stenken JA, Church MK, Gill CA, Clough GF (2010) How minimally invasive is
microdialysis sampling? A cautionary note for cytokine collection in human skinand other clinical studies. AAPS J 12: 73–78.
60. Mellergard P, Aneman O, Sjogren F, Pettersson P, Hillman J (2008) Changes in
extracellular concentrations of some cytokines, chemokines, and neurotrophicfactors after insertion of intracerebral microdialysis catheters in neurosurgical
patients. Neurosurgery 62: 151–157; discussion 157–158.61. Bellander BM, Cantais E, Enblad P, Hutchinson P, Nordstrom CH, et al. (2004)
Consensus meeting on microdialysis in neurointensive care. Intensive Care Med
30: 2166–2169.
Cerebral Cytokine Principal Component Analysis
PLoS ONE | www.plosone.org 14 June 2012 | Volume 7 | Issue 6 | e39677
Copyright © 2022 FDOKUMEN