Primate Densities in the Atlantic Forest of~Southeast Brazil: The Role of Habitat Quality and...
19
Chapter 16 Primate Densities in the Atlantic Forest of Southeast Brazil: The Role of Habitat Quality and Anthropogenic Disturbance Naiara Pinto, Jesse Lasky, Rafael Bueno, Timothy H. Keitt, and Mauro Galetti 16.1 Introduction 16.1.1 Goals Studies of variation in abundance within a species’ geographic range provide the connection between the disciplines of ecology and biogeography. Empirical stud- ies of various taxonomic groups show that density of a given species is unevenly distributed in space, with few “hotspots” and many “coldspots”, where abun- dance is orders of magnitude lower (Brown et al. 1995). The typical explanation for this pattern is spatial variation in habitat suitability. In other words, varia- tion in density is generated by how closely sites correspond to a species’ niche (Brown et al. 1995). Like many ecological patterns, the correspondence between primate density and habitat suitability can be investigated at several spatial scales (Wiens 1989; Levin 1992). For example, coarse-scale studies comparing densities of howler monkeys (Alouatta spp.) across the Neotropics have shown that howler density is largely a function of primary productivity (Peres 1997). Fine-scale stud- ies comparing neighboring forest fragments have also reported variation in howler density, but in this case the pattern is frequently attributed to anthropogenic pressure (Hirsh et al. 1994; Cullen et al. 2001; Chiarello 2003; Martins 2005). In general, human impact on other primates can be direct via hunting, or indi- rect through habitat disturbance and fragmentation. However, some species thrive in disturbed habitats (Chiarello 1993, 2003; Rylands et al. 1993; Strier et al. 2000). This fact complicates the task of predicting changes in primate density across a gradient in land use. In the present chapter, we investigate the synergistic effects of environmental and anthropogenic factors on the density of five primate genera that inhabit the Atlantic forest of southeast Brazil. Our goal is not to produce distribution maps, but rather to: (i) synthesize available census information for the region; (ii) compare the genera’s responses to anthropogenic impact; and (iii) map areas of high N. Pinto (B) Jet Propulsion Laboratory, 4800 Oak grove ms 300–325 Pasadena, CA, 91105 e-mail: [email protected] P.A. Garber et al. (eds.), South American Primates, Developments in Primatology: Progress and Prospects, DOI 10.1007/978-0-387-78705-3 16, C Springer Science+Business Media, LLC 2009 413
Transcript of Primate Densities in the Atlantic Forest of~Southeast Brazil: The Role of Habitat Quality and...
Chapter 16Primate Densities in the Atlantic Forestof Southeast Brazil: The Role of Habitat Qualityand Anthropogenic Disturbance
Naiara Pinto, Jesse Lasky, Rafael Bueno, Timothy H. Keitt, and Mauro Galetti
16.1 Introduction
16.1.1 Goals
Studies of variation in abundance within a species’ geographic range provide theconnection between the disciplines of ecology and biogeography. Empirical stud-ies of various taxonomic groups show that density of a given species is unevenlydistributed in space, with few “hotspots” and many “coldspots”, where abun-dance is orders of magnitude lower (Brown et al. 1995). The typical explanationfor this pattern is spatial variation in habitat suitability. In other words, varia-tion in density is generated by how closely sites correspond to a species’ niche(Brown et al. 1995). Like many ecological patterns, the correspondence betweenprimate density and habitat suitability can be investigated at several spatial scales(Wiens 1989; Levin 1992). For example, coarse-scale studies comparing densitiesof howler monkeys (Alouatta spp.) across the Neotropics have shown that howlerdensity is largely a function of primary productivity (Peres 1997). Fine-scale stud-ies comparing neighboring forest fragments have also reported variation in howlerdensity, but in this case the pattern is frequently attributed to anthropogenic pressure(Hirsh et al. 1994; Cullen et al. 2001; Chiarello 2003; Martins 2005).
In general, human impact on other primates can be direct via hunting, or indi-rect through habitat disturbance and fragmentation. However, some species thrivein disturbed habitats (Chiarello 1993, 2003; Rylands et al. 1993; Strier et al. 2000).This fact complicates the task of predicting changes in primate density across agradient in land use. In the present chapter, we investigate the synergistic effects ofenvironmental and anthropogenic factors on the density of five primate genera thatinhabit the Atlantic forest of southeast Brazil. Our goal is not to produce distributionmaps, but rather to: (i) synthesize available census information for the region; (ii)compare the genera’s responses to anthropogenic impact; and (iii) map areas of high
N. Pinto (B)Jet Propulsion Laboratory, 4800 Oak grove ms 300–325 Pasadena, CA, 91105e-mail: [email protected]
P.A. Garber et al. (eds.), South American Primates, Developments in Primatology:Progress and Prospects, DOI 10.1007/978-0-387-78705-3 16,C© Springer Science+Business Media, LLC 2009
413
414 N. Pinto et al.
predicted densities based on available data. In this section, we introduce the readerto the Brazilian Atlantic forest, present the dataset used in the study, and describethe analytical tools used to study the determinants of primate density.
16.1.2 The Primates at the Brazilian Atlantic Forest
Studies in the Brazilian Atlantic forest provide an ideal opportunity to understandthe interaction of anthropogenic factors and habitat quality on primate densities.This ecosystem is a biodiversity hotspot that occupies less than 8% of its originalextent (Hirota 2003). Current studies estimate that 40% of the tree and shrub speciesin this ecosystem are endemic, as well as 22% of their bird and mammal species(Brooks et al. 2000) – and many new species are still being discovered in the regionevery year (Alves et al. 2006; Donha and Eliasaro 2006; Pontes et al. 2006). Due toits extensive elevational and latitudinal ranges, the Atlantic forest is recognized asa domain that includes several vegetation types (Oliveira-Filho and Fontes 2000).Exploitation of Atlantic forest species did not start recently, as it has been suggestedthat hunting and forest clearing were already widespread when the first Portuguesearrived in 1500 (Dean 1996). However, the anthropogenic pressure was intensifiedwith the Portuguese colonization, expansion of the agricultural frontier (Dean 1996;Camara 2003), and later establishment of Brazilian industrial centers in the area,which currently has a population of more than 130 million people (IBGE 2000). Asa result of the intense land use in eastern Brazil, the distribution of forest remnants isvery distinct from the fishbone pattern observed in the Brazilian Amazon, in whichvast forest tracts are interrupted by a network of roads and pipelines. Rather, theAtlantic forest landscape is now an archipelago with small forest fragments embed-ded in a human-dominated matrix containing pastures, plantations, cities, and roads.
Twenty-three primate species are known to live in the Brazilian Atlantic forest,twenty of which are endemic to this ecosystem (Hirsh et al. 2006). According tothe most recent IUCN Mammal Red List (IUCN 2006), three species are vulner-able, four are endangered, and nine are critically endangered (Table 16.1). Whilesome primate populations in the Brazilian Amazon may be sustained via source-sinkdynamics (Michalski and Peres 2005), these dynamics have never been documentedfor the Atlantic forest and are unlikely to be operating due to inter-fragment isola-tion and inhospitality of the matrix. Also, few fragments are large enough to sustainviable primate populations (Chiarello and Melo 2001; Bernardo and Galetti 2004;see also Marsden et al. 2005 for birds), and the extent to which existing conservationunits are protecting primate populations against poaching remains unknown.
16.1.3 Census Data for Primate Species in the BrazilianAtlantic Forest
Data on primate abundance were compiled from a variety of sources including grad-uate theses, primary-literature publications, and grey-literature reports. In all cases,
16 Primate Densities in the Atlantic Forest of Southeast Brazil 415
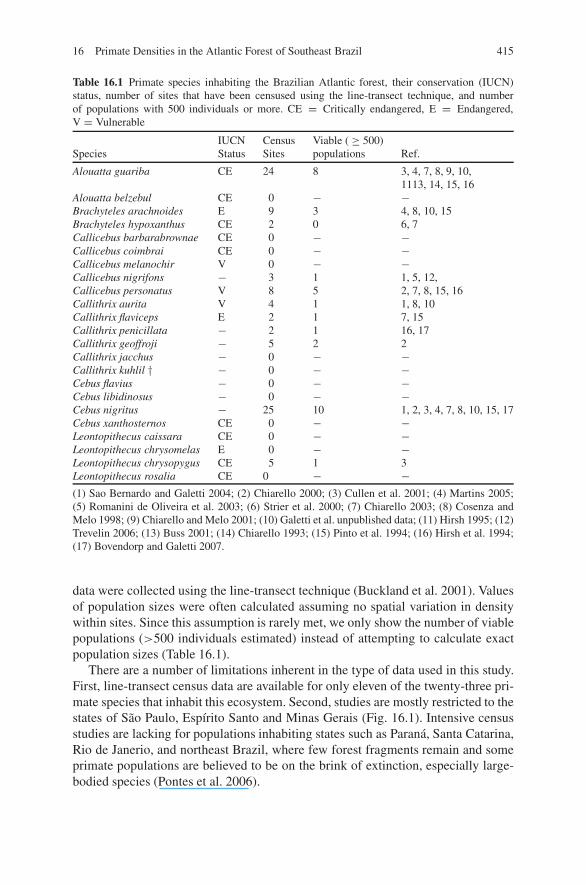
Table 16.1 Primate species inhabiting the Brazilian Atlantic forest, their conservation (IUCN)status, number of sites that have been censused using the line-transect technique, and numberof populations with 500 individuals or more. CE = Critically endangered, E = Endangered,V = Vulnerable
IUCN Census Viable ( ≥ 500)Species Status Sites populations Ref.
Alouatta guariba CE 24 8 3, 4, 7, 8, 9, 10,1113, 14, 15, 16
Alouatta belzebul CE 0 − −Brachyteles arachnoides E 9 3 4, 8, 10, 15Brachyteles hypoxanthus CE 2 0 6, 7Callicebus barbarabrownae CE 0 − −Callicebus coimbrai CE 0 − −Callicebus melanochir V 0 − −Callicebus nigrifons − 3 1 1, 5, 12,Callicebus personatus V 8 5 2, 7, 8, 15, 16Callithrix aurita V 4 1 1, 8, 10Callithrix flaviceps E 2 1 7, 15Callithrix penicillata − 2 1 16, 17Callithrix geoffroji − 5 2 2Callithrix jacchus − 0 − −Callithrix kuhlil † − 0 − −Cebus flavius − 0 − −Cebus libidinosus − 0 − −Cebus nigritus − 25 10 1, 2, 3, 4, 7, 8, 10, 15, 17Cebus xanthosternos CE 0 − −Leontopithecus caissara CE 0 − −Leontopithecus chrysomelas E 0 − −Leontopithecus chrysopygus CE 5 1 3Leontopithecus rosalia CE 0 − −(1) Sao Bernardo and Galetti 2004; (2) Chiarello 2000; (3) Cullen et al. 2001; (4) Martins 2005;(5) Romanini de Oliveira et al. 2003; (6) Strier et al. 2000; (7) Chiarello 2003; (8) Cosenza andMelo 1998; (9) Chiarello and Melo 2001; (10) Galetti et al. unpublished data; (11) Hirsh 1995; (12)Trevelin 2006; (13) Buss 2001; (14) Chiarello 1993; (15) Pinto et al. 1994; (16) Hirsh et al. 1994;(17) Bovendorp and Galetti 2007.
data were collected using the line-transect technique (Buckland et al. 2001). Valuesof population sizes were often calculated assuming no spatial variation in densitywithin sites. Since this assumption is rarely met, we only show the number of viablepopulations (>500 individuals estimated) instead of attempting to calculate exactpopulation sizes (Table 16.1).
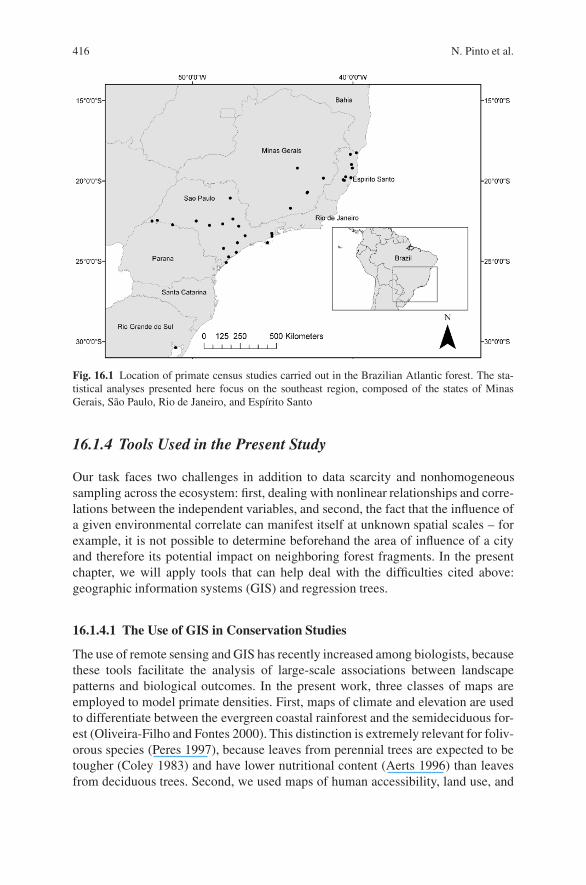
There are a number of limitations inherent in the type of data used in this study.First, line-transect census data are available for only eleven of the twenty-three pri-mate species that inhabit this ecosystem. Second, studies are mostly restricted to thestates of Sao Paulo, Espırito Santo and Minas Gerais (Fig. 16.1). Intensive censusstudies are lacking for populations inhabiting states such as Parana, Santa Catarina,Rio de Janerio, and northeast Brazil, where few forest fragments remain and someprimate populations are believed to be on the brink of extinction, especially large-bodied species (Pontes et al. 2006).
416 N. Pinto et al.
Fig. 16.1 Location of primate census studies carried out in the Brazilian Atlantic forest. The sta-tistical analyses presented here focus on the southeast region, composed of the states of MinasGerais, Sao Paulo, Rio de Janeiro, and Espırito Santo
16.1.4 Tools Used in the Present Study
Our task faces two challenges in addition to data scarcity and nonhomogeneoussampling across the ecosystem: first, dealing with nonlinear relationships and corre-lations between the independent variables, and second, the fact that the influence ofa given environmental correlate can manifest itself at unknown spatial scales – forexample, it is not possible to determine beforehand the area of influence of a cityand therefore its potential impact on neighboring forest fragments. In the presentchapter, we will apply tools that can help deal with the difficulties cited above:geographic information systems (GIS) and regression trees.
16.1.4.1 The Use of GIS in Conservation Studies
The use of remote sensing and GIS has recently increased among biologists, becausethese tools facilitate the analysis of large-scale associations between landscapepatterns and biological outcomes. In the present work, three classes of maps areemployed to model primate densities. First, maps of climate and elevation are usedto differentiate between the evergreen coastal rainforest and the semideciduous for-est (Oliveira-Filho and Fontes 2000). This distinction is extremely relevant for foliv-orous species (Peres 1997), because leaves from perennial trees are expected to betougher (Coley 1983) and have lower nutritional content (Aerts 1996) than leavesfrom deciduous trees. Second, we used maps of human accessibility, land use, and
16 Primate Densities in the Atlantic Forest of Southeast Brazil 417
social indicators, which can potentially serve as surrogates of anthropogenic dis-turbance and hunting pressure (Siren et al. 2006; Brashares et al. 2001; Lauranceet al. 2005). Third, we used maps of fragment size. Note that climate and elevationmaps reflect local habitat quality, whereas the other maps are based on informationfrom the neighboring municipalities and road network that surround study sites.
16.1.4.2 Regression Trees
The statistical analysis of the relationship between environmental factors and popu-lation sizes is complicated by the existence of interactions (often nonlinear) amongenvironmental predictors. For example, forest type is known to correlate with tem-perature, precipitation and elevation (Oliveira-Filho and Fontes 2000). Moreover,the exact shape of these relationships is unknown. Thus, we decided to use a datamining approach that enables us to look for environmental determinants of primatedensity while accommodating for nonlinear interactions between predictors andwhich does not require the specification of the relationship between the responseand the predictors. Here, we will use Random Forest, a tree regression method(Breiman 2001; Liaw and Wiener 2002). This method recently started being appliedin several areas of biology involving data mining, such as bioinformatics (Panget al. 2006) and niche modeling (Garzon et al. 2006; Prasad et al. 2006). Thealgorithm works by iteratively splitting the group of data points. Each tree noderepresents a splitting rule (e.g., “elevation > 1500 m”), and nodes are followed bytwo branches representing the newly separated data points. More specifically, thesplits are performed using the predictor variables to partition the response variableinto two groups, so as to maximize the between-groups sum of squares. The outputtree contains a series of branches representing the optimized sequence of splittingrules. Random Forest grows hundreds of trees, each one using a subset of the inde-pendent variables. The resulting trees are then averaged to obtain the final model,a procedure that reduces overfitting (Breiman 2001). As in other niche model andclassification tools, data points are partitioned into a training set, used to constructthe model, and a testing set, used to access model accuracy. For a very accessiblereview of regression tree methods, see Berk (2006).
16.2 Methods
16.2.1 Study Area
The study areas comprise four Brazilian states: Sao Paulo, Rio de Janeiro, MinasGerais and Espırito Santo (Fig. 16.1). The region spans the two main Atlantic forestdomains: the Atlantic rainforest and the Atlantic semideciduous forest. The for-mer comprises areas up to 300 km inland that have high annual precipitation due tooceanic winds and mountain ranges, whereas the latter includes plateau areas withhigher elevation and lower annual precipitation. For a detailed description of theforest types, see Oliveira-Filho and Fontes (2000).

418 N. Pinto et al.
16.2.2 Target Genera
We focus on five genera: (1) Brachyteles (muriqui), the largest species at 12 kg, afrugivore-folivore (Milton 1984; Strier 1991) that is distributed along the Braziliansouthern states of Sao Paulo, Rio de Janeiro, Espırito Santo, and Minas Gerais,and the states of Parana and Bahia; (2) Alouatta (howler monkey), a folivore(Glander 1978; Mendes 1989; Peres 1997) weighing 6.4 kg, distributed in the Brazil-ian south and all the way to the northeast along the coast; (3) Cebus (capuchinmonkey), an insectivore-frugivore (Fragaszy et al. 2004) weighing 2.5 kg inhab-iting the entire country except the extreme south; (4) Callicebus (titi monkey),a folivore-frugivore (Price and Piedade 2001) weighing 1.35 kg and inhabitingthe Brazilian southeast, northeast and Amazon; and (5) Callithrix (marmoset),the smallest species at 0.30 kg. Neotropical marmosets feed on a large range ofplant materials, including gums, fruits, and seeds, as well as animal preys (Cor-rea et al. 2000). They are distributed along the Brazilian southeast, northeast andAmazon.
16.2.3 Compilation of Census Data
We compiled a list of census studies carried out between the years of 1993 and2005 (Fig. 16.1; Table 16.1). In order to make the data comparable, we selectedstudies that used the line-transect technique (Buckland et al. 2001). This methodbasically consists of establishing transects distributed randomly or stratified accord-ing to habitat type and counting the number of individuals encountered. Informationon straight-line distance to observed individuals is used to calculate the effectivestrip width (ESW) and estimate local density. Line-transect is considered one of themost precise census techniques and due to its simplicity and cost-effectiveness, ithas been applied to census a broad range of animal and plant populations (Bucklandet al. 2001). A total of 17 census studies using line-transect technique were found,and 16 were carried out within the Brazilian southeast. Out of those 16 studies,four were excluded: one study reported large within-site variation but did not pro-vide separate density values for those sites (Hirsh et al. 1994); a second study wasperformed in a field site for which more recent information was available (Pintoet al. 1993); a third dataset (Chiarello 1993) reported extremely high density val-ues for Alouatta in an urban park in Sao Paulo State. Preliminary models usingthis data point predict that all urban centers will have the highest howler densi-ties. Although it is our intention to predict the impact of urbanization on primatedensities, we believe that the conditions leading to the density value observed byChiarello (1993) are probably tied to historical factors and latent variables thatwe are presently unable to measure. Last, we excluded data from Anchieta Island(Bovendorp and Galetti 2007) because this island has been a target of “repopu-lation” initiatives and several vertebrate species have been recently introduced inthe area.
16 Primate Densities in the Atlantic Forest of Southeast Brazil 419
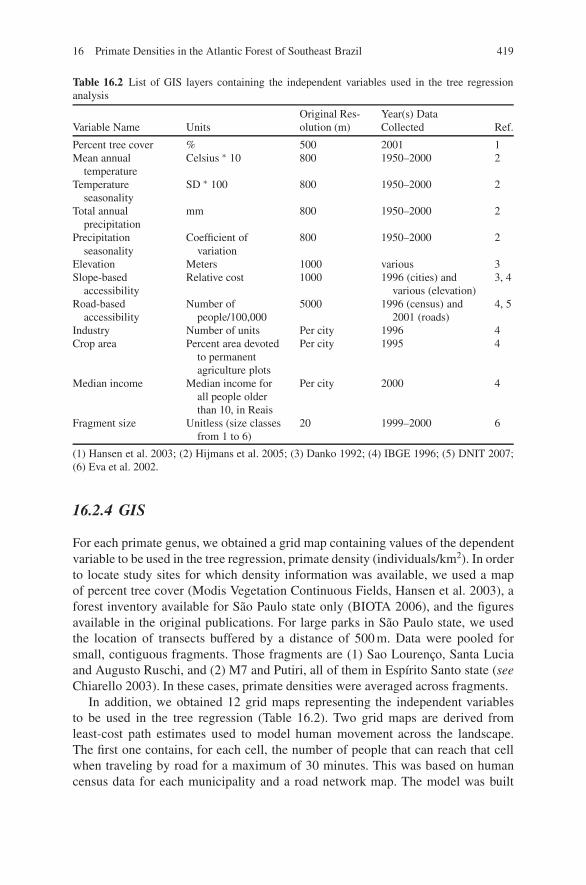
Table 16.2 List of GIS layers containing the independent variables used in the tree regressionanalysis
Variable Name UnitsOriginal Res-olution (m)
Year(s) DataCollected Ref.
Percent tree cover % 500 2001 1Mean annual
temperatureCelsius ∗ 10 800 1950–2000 2
Temperatureseasonality
SD ∗ 100 800 1950–2000 2
Total annualprecipitation
mm 800 1950–2000 2
Precipitationseasonality
Coefficient ofvariation
800 1950–2000 2
Elevation Meters 1000 various 3Slope-based
accessibilityRelative cost 1000 1996 (cities) and
various (elevation)3, 4
Road-basedaccessibility
Number ofpeople/100,000
5000 1996 (census) and2001 (roads)
4, 5
Industry Number of units Per city 1996 4Crop area Percent area devoted
to permanentagriculture plots
Per city 1995 4
Median income Median income forall people olderthan 10, in Reais
Per city 2000 4
Fragment size Unitless (size classesfrom 1 to 6)
20 1999–2000 6
(1) Hansen et al. 2003; (2) Hijmans et al. 2005; (3) Danko 1992; (4) IBGE 1996; (5) DNIT 2007;(6) Eva et al. 2002.
16.2.4 GIS
For each primate genus, we obtained a grid map containing values of the dependentvariable to be used in the tree regression, primate density (individuals/km2). In orderto locate study sites for which density information was available, we used a mapof percent tree cover (Modis Vegetation Continuous Fields, Hansen et al. 2003), aforest inventory available for Sao Paulo state only (BIOTA 2006), and the figuresavailable in the original publications. For large parks in Sao Paulo state, we usedthe location of transects buffered by a distance of 500 m. Data were pooled forsmall, contiguous fragments. Those fragments are (1) Sao Lourenco, Santa Luciaand Augusto Ruschi, and (2) M7 and Putiri, all of them in Espırito Santo state (seeChiarello 2003). In these cases, primate densities were averaged across fragments.
In addition, we obtained 12 grid maps representing the independent variablesto be used in the tree regression (Table 16.2). Two grid maps are derived fromleast-cost path estimates used to model human movement across the landscape.The first one contains, for each cell, the number of people that can reach that cellwhen traveling by road for a maximum of 30 minutes. This was based on humancensus data for each municipality and a road network map. The model was built
420 N. Pinto et al.
using the module Network Analyst within ArcGIS (ESRI, California). We assumedpeople departed city centroids and traveled along federal and state highways at aspeed of 100 km/h. Since location of city streets and dirt roads was not available, itwas assumed individuals leaving highways would travel to their final destinationsalong a straight line, at 50 km/h. A second grid map represents human accessibil-ity, assuming people are moving by foot. The map contains the relative cost toreach each cell from the nearest city, assuming that cost is a function of distanceand slope.
Although urban centers are obviously served by a large concentration of roads,some agricultural areas are also located near highways. In order to distinguishbetween these two land use types, we produced maps containing values of areadevoted to agriculture, as well as degree of industrialization. In addition, a mapof median income for each municipality (IBGE 1996) was produced in an attemptto obtain a surrogate for anthropogenic disturbance and/or hunting pressure. Last,forest fragments were mapped using a global land cover database (Eva et al. 2002).After excluding areas classified as “mosaic agriculture/degraded forest”, the areafor each fragment was calculated. We then assigned each cell with a value repre-senting the size, in hectares, of the fragment where the cell is located. Six classeswere used: (1) < 100; (2) > 100 and < 316; (3) >316 and < 1000; (4) >1000and < 3162; (5) > 3162 and < 159,000; (6) > 159,000. All maps were re-scaled to 500-m resolution. All GIS analyses were performed using ArcGIS 9.2(ESRI, California). Map layers can be made available upon request to the firstauthor.
16.2.5 Random Forest
The parameters used in the Random Forest run were: 3 independent variables(Table 16.2) could be used at each split; sampling was stratified, in such a waythat all study areas were used to grow each tree; 500 trees were grown. After themodel was run, we estimated the importance of all independent variables. RandomForest has two measures of variable importance: (i) mean percent increment insquare error, calculated as the average increase in prediction error that results fromshuffling the values of the predictor variable; (ii) percent increase in node impu-rity, the within-node variation (residual sum of squares) obtained after reshufflingvalues of the predictor variable (Breiman 2001; Prasad et al. 2006). Also, partialplots were constructed to study the relationship between the four most importantenvironmental correlate and primate density. These plots are built by computingthe relationship between the target predictor and the response averaged over thejoint values of the other variables (Berk 2006). Last, the models were used with theentire range of values in the Brazilian southeast in order to predict density valuesfor this region. All statistical analyses were performed in R (R Development CoreTeam 2007).
16 Primate Densities in the Atlantic Forest of Southeast Brazil 421
16.3 Results
16.3.1 General Aspects
When analyzing data for individual genera, we found no significant relationshipbetween sampling effort (number of kilometers sampled) and density for Alouatta(p = 0.76), Brachyteles (p = 0.47), Callicebus (p = 0.59), Cebus (p = 0.08)or Callithrix (p = 0.85). For all genera, most sites were “coldspots” with lowerdensities and few sites were “hotspots.” Within-genus variation in density reachedthree orders of magnitude for some genera: for Alouatta, density (individuals/km2)ranges from 0.29 to 176.80 (mean ± SD: 23 ± 38, N = 20). For Brachyteles, densityranged from 0.42 to 35.11 (9.63 ± 11.6, N = 10). Density values for the genusCebus ranged from 0.90 to 49.88 (16.63 ± 15.25, N = 23). For Callithrix, densityranged from 1.83 to 110.3 (22.1 ± 29.4, N = 10). Last, density for Callicebusranged from 3.5 to 157 (24 ± 45.34, N = 9). When comparing among all fivegenera, we did not observe any significant difference in mean density (Kruskal-Wallis rank-sum test, p = 0.09).
16.3.2 Determinants of Primate Density
A tree regression analysis using Random Forest was performed to study the effectof 12 variables (Table 16.2) on primate density. For all genera, the model was ableto explain more than 90% of the variability in the training set (see Section 16.1.4.2).The output models produced by Random Forest were applied to the entire Braziliansoutheast region (Fig. 16.2a–e). For all genera, the five most important predictors ofprimate density included precipitation and temperature, although genera respondeddifferently to these climatic variables (Table 16.3). The five genera also displayeddifferent responses to land use. For example, an increase in the area devoted toagriculture had a positive impact on the densities of Callicebus spp., but a negativeimpact on Alouatta spp.; also Cebus spp. displayed higher densities in the vicinity ofindustrialized cities (Table 16.3). In most cases, partial plots revealed a monotonicincrease or decrease in primate density (shown as “+” or “−” on Table 16.3), butsometimes densities peaked at intermediate conditions (in this case, actual valuesare shown on Table 16.3). For example, density for Callithrix spp. was highest atintermediate values of median income and temperature (Table 16.3).
16.4 Discussion
16.4.1 Predicted Primate Density Hotspots
The analyses carried out in the present work enable us to tease apart the effects ofanthropogenic impact and forest type on densities of primate species inhabiting ahighly disturbed ecosystem. For all species, densities decreased with fragment size,
422 N. Pinto et al.
although this variable was not always an important predictor of primate density(Table 16.3). Accessibility by road was not an important predictor of density for anyof the target genera (Table 16.3). Accessibility by foot was modeled as a functionof slope (see Methods) and had a positive impact on Cebus spp., Callithrix spp. andBrachyteles spp. (Table 16.3), that is, areas considered accessible had higher pri-mate densities. This variable is thus probably serving a substitute for slope. Overall,results suggest that patterns of land use and social indicators from municipalitieswhere fragments are located provide better estimates of anthropogenic impact thanmodels of human movement.
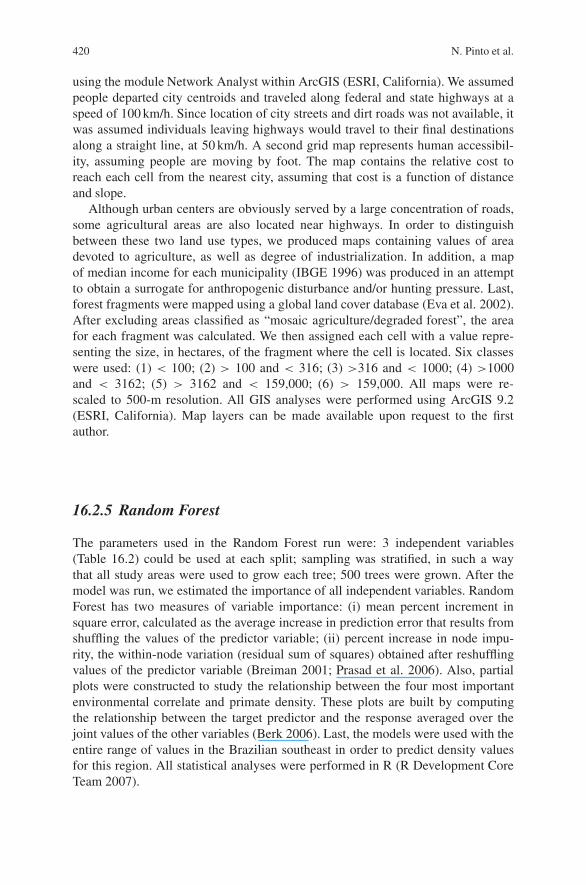
For all genera, areas with non-zero predicted density extended beyond the dis-tribution of the species used to train the model (Fig. 16.2a–e). This was expected
(a)
∗
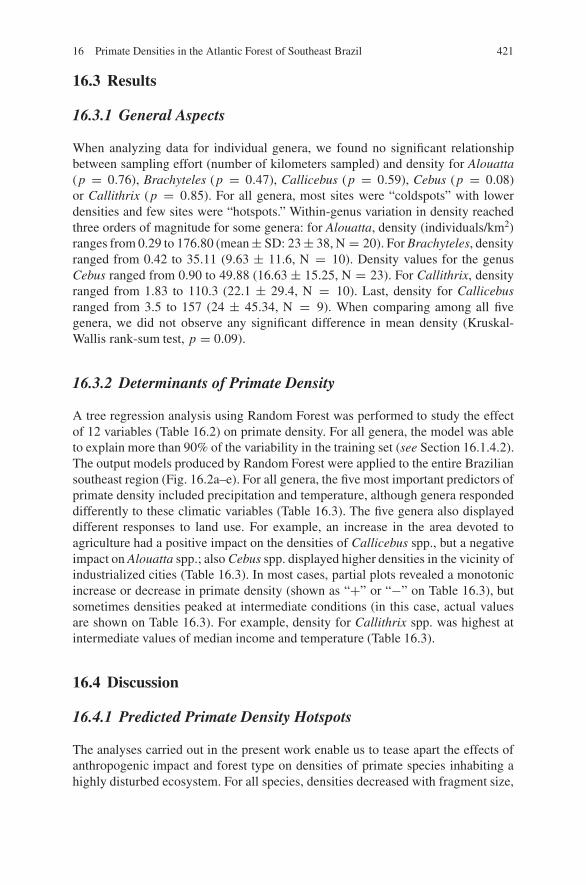
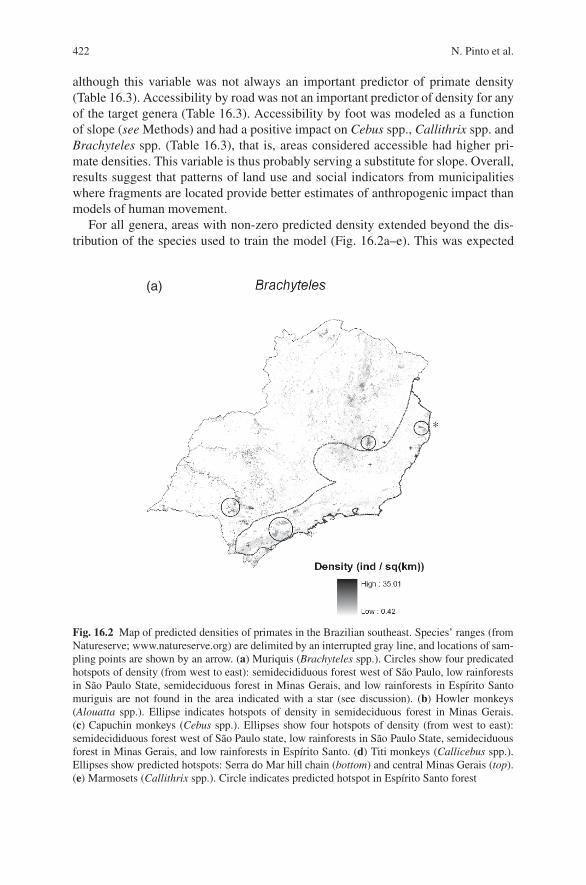
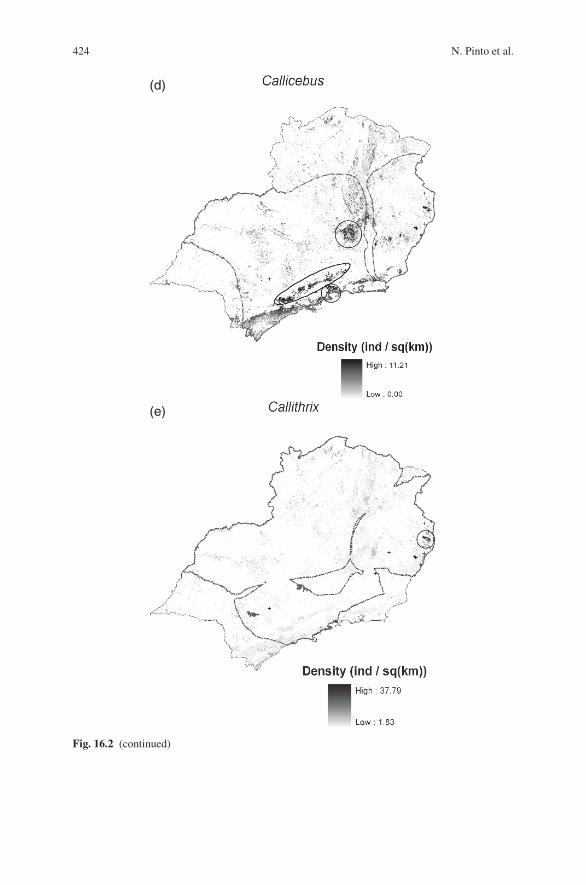
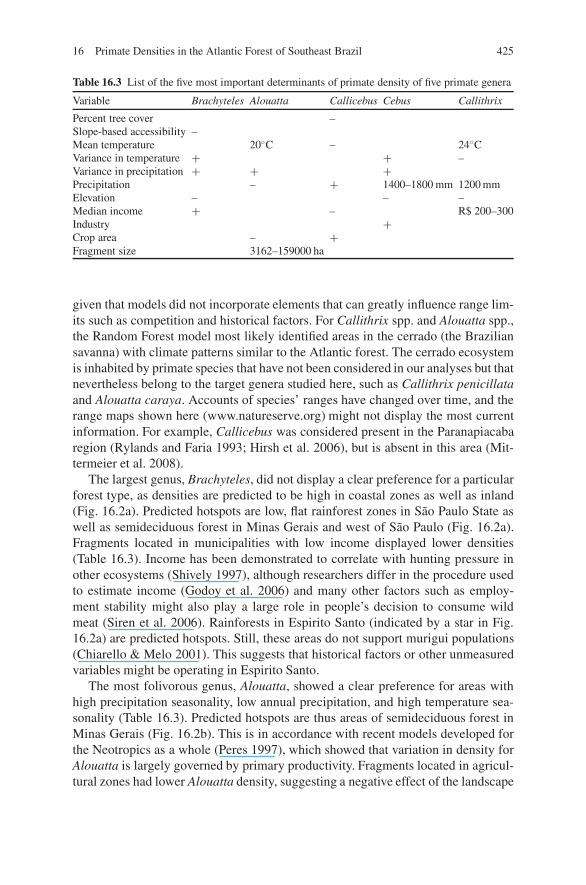
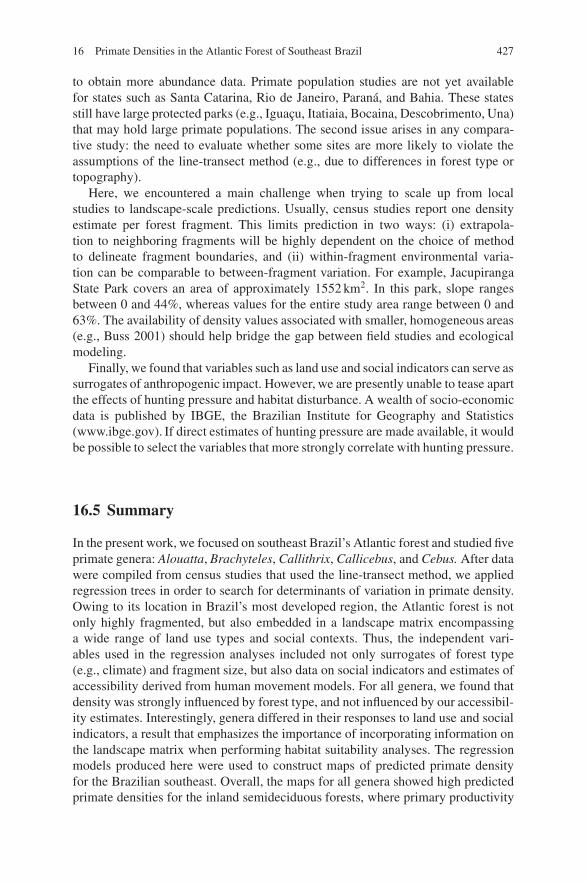
Fig. 16.2 Map of predicted densities of primates in the Brazilian southeast. Species’ ranges (fromNatureserve; www.natureserve.org) are delimited by an interrupted gray line, and locations of sam-pling points are shown by an arrow. (a) Muriquis (Brachyteles spp.). Circles show four predicatedhotspots of density (from west to east): semidecididuous forest west of Sao Paulo, low rainforestsin Sao Paulo State, semideciduous forest in Minas Gerais, and low rainforests in Espırito Santomuriguis are not found in the area indicated with a star (see discussion). (b) Howler monkeys(Alouatta spp.). Ellipse indicates hotspots of density in semideciduous forest in Minas Gerais.(c) Capuchin monkeys (Cebus spp.). Ellipses show four hotspots of density (from west to east):semidecididuous forest west of Sao Paulo state, low rainforests in Sao Paulo State, semideciduousforest in Minas Gerais, and low rainforests in Espırito Santo. (d) Titi monkeys (Callicebus spp.).Ellipses show predicted hotspots: Serra do Mar hill chain (bottom) and central Minas Gerais (top).(e) Marmosets (Callithrix spp.). Circle indicates predicted hotspot in Espırito Santo forest

16 Primate Densities in the Atlantic Forest of Southeast Brazil 423
(b)
(c)
Fig. 16.2 (continued)
424 N. Pinto et al.
(d)
(e)
Fig. 16.2 (continued)
16 Primate Densities in the Atlantic Forest of Southeast Brazil 425
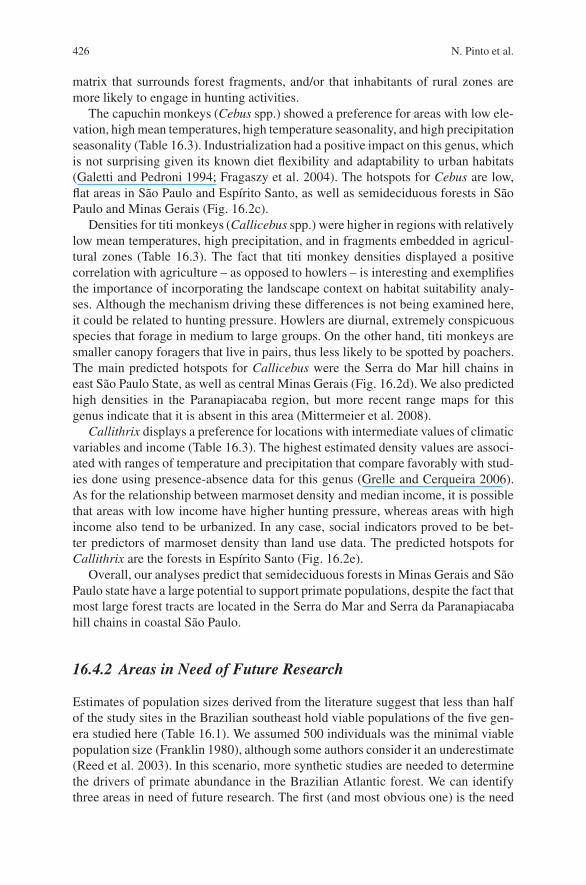
Table 16.3 List of the five most important determinants of primate density of five primate genera
Variable Brachyteles Alouatta Callicebus Cebus Callithrix
Percent tree cover –Slope-based accessibility –Mean temperature 20◦C – 24◦CVariance in temperature + + –Variance in precipitation + + +Precipitation – + 1400–1800 mm 1200 mmElevation – – –Median income + – R$ 200–300Industry +Crop area – +Fragment size 3162–159000 ha
given that models did not incorporate elements that can greatly influence range lim-its such as competition and historical factors. For Callithrix spp. and Alouatta spp.,the Random Forest model most likely identified areas in the cerrado (the Braziliansavanna) with climate patterns similar to the Atlantic forest. The cerrado ecosystemis inhabited by primate species that have not been considered in our analyses but thatnevertheless belong to the target genera studied here, such as Callithrix penicillataand Alouatta caraya. Accounts of species’ ranges have changed over time, and therange maps shown here (www.natureserve.org) might not display the most currentinformation. For example, Callicebus was considered present in the Paranapiacabaregion (Rylands and Faria 1993; Hirsh et al. 2006), but is absent in this area (Mit-termeier et al. 2008).
The largest genus, Brachyteles, did not display a clear preference for a particularforest type, as densities are predicted to be high in coastal zones as well as inland(Fig. 16.2a). Predicted hotspots are low, flat rainforest zones in Sao Paulo State aswell as semideciduous forest in Minas Gerais and west of Sao Paulo (Fig. 16.2a).Fragments located in municipalities with low income displayed lower densities(Table 16.3). Income has been demonstrated to correlate with hunting pressure inother ecosystems (Shively 1997), although researchers differ in the procedure usedto estimate income (Godoy et al. 2006) and many other factors such as employ-ment stability might also play a large role in people’s decision to consume wildmeat (Siren et al. 2006). Rainforests in Espirito Santo (indicated by a star in Fig.16.2a) are predicted hotspots. Still, these areas do not support murigui populations(Chiarello & Melo 2001). This suggests that historical factors or other unmeasuredvariables might be operating in Espirito Santo.
The most folivorous genus, Alouatta, showed a clear preference for areas withhigh precipitation seasonality, low annual precipitation, and high temperature sea-sonality (Table 16.3). Predicted hotspots are thus areas of semideciduous forest inMinas Gerais (Fig. 16.2b). This is in accordance with recent models developed forthe Neotropics as a whole (Peres 1997), which showed that variation in density forAlouatta is largely governed by primary productivity. Fragments located in agricul-tural zones had lower Alouatta density, suggesting a negative effect of the landscape
426 N. Pinto et al.
matrix that surrounds forest fragments, and/or that inhabitants of rural zones aremore likely to engage in hunting activities.
The capuchin monkeys (Cebus spp.) showed a preference for areas with low ele-vation, high mean temperatures, high temperature seasonality, and high precipitationseasonality (Table 16.3). Industrialization had a positive impact on this genus, whichis not surprising given its known diet flexibility and adaptability to urban habitats(Galetti and Pedroni 1994; Fragaszy et al. 2004). The hotspots for Cebus are low,flat areas in Sao Paulo and Espırito Santo, as well as semideciduous forests in SaoPaulo and Minas Gerais (Fig. 16.2c).
Densities for titi monkeys (Callicebus spp.) were higher in regions with relativelylow mean temperatures, high precipitation, and in fragments embedded in agricul-tural zones (Table 16.3). The fact that titi monkey densities displayed a positivecorrelation with agriculture – as opposed to howlers – is interesting and exemplifiesthe importance of incorporating the landscape context on habitat suitability analy-ses. Although the mechanism driving these differences is not being examined here,it could be related to hunting pressure. Howlers are diurnal, extremely conspicuousspecies that forage in medium to large groups. On the other hand, titi monkeys aresmaller canopy foragers that live in pairs, thus less likely to be spotted by poachers.The main predicted hotspots for Callicebus were the Serra do Mar hill chains ineast Sao Paulo State, as well as central Minas Gerais (Fig. 16.2d). We also predictedhigh densities in the Paranapiacaba region, but more recent range maps for thisgenus indicate that it is absent in this area (Mittermeier et al. 2008).
Callithrix displays a preference for locations with intermediate values of climaticvariables and income (Table 16.3). The highest estimated density values are associ-ated with ranges of temperature and precipitation that compare favorably with stud-ies done using presence-absence data for this genus (Grelle and Cerqueira 2006).As for the relationship between marmoset density and median income, it is possiblethat areas with low income have higher hunting pressure, whereas areas with highincome also tend to be urbanized. In any case, social indicators proved to be bet-ter predictors of marmoset density than land use data. The predicted hotspots forCallithrix are the forests in Espırito Santo (Fig. 16.2e).
Overall, our analyses predict that semideciduous forests in Minas Gerais and SaoPaulo state have a large potential to support primate populations, despite the fact thatmost large forest tracts are located in the Serra do Mar and Serra da Paranapiacabahill chains in coastal Sao Paulo.
16.4.2 Areas in Need of Future Research
Estimates of population sizes derived from the literature suggest that less than halfof the study sites in the Brazilian southeast hold viable populations of the five gen-era studied here (Table 16.1). We assumed 500 individuals was the minimal viablepopulation size (Franklin 1980), although some authors consider it an underestimate(Reed et al. 2003). In this scenario, more synthetic studies are needed to determinethe drivers of primate abundance in the Brazilian Atlantic forest. We can identifythree areas in need of future research. The first (and most obvious one) is the need
16 Primate Densities in the Atlantic Forest of Southeast Brazil 427
to obtain more abundance data. Primate population studies are not yet availablefor states such as Santa Catarina, Rio de Janeiro, Parana, and Bahia. These statesstill have large protected parks (e.g., Iguacu, Itatiaia, Bocaina, Descobrimento, Una)that may hold large primate populations. The second issue arises in any compara-tive study: the need to evaluate whether some sites are more likely to violate theassumptions of the line-transect method (e.g., due to differences in forest type ortopography).
Here, we encountered a main challenge when trying to scale up from localstudies to landscape-scale predictions. Usually, census studies report one densityestimate per forest fragment. This limits prediction in two ways: (i) extrapola-tion to neighboring fragments will be highly dependent on the choice of methodto delineate fragment boundaries, and (ii) within-fragment environmental varia-tion can be comparable to between-fragment variation. For example, JacupirangaState Park covers an area of approximately 1552 km2. In this park, slope rangesbetween 0 and 44%, whereas values for the entire study area range between 0 and63%. The availability of density values associated with smaller, homogeneous areas(e.g., Buss 2001) should help bridge the gap between field studies and ecologicalmodeling.
Finally, we found that variables such as land use and social indicators can serve assurrogates of anthropogenic impact. However, we are presently unable to tease apartthe effects of hunting pressure and habitat disturbance. A wealth of socio-economicdata is published by IBGE, the Brazilian Institute for Geography and Statistics(www.ibge.gov). If direct estimates of hunting pressure are made available, it wouldbe possible to select the variables that more strongly correlate with hunting pressure.
16.5 Summary
In the present work, we focused on southeast Brazil’s Atlantic forest and studied fiveprimate genera: Alouatta, Brachyteles, Callithrix, Callicebus, and Cebus. After datawere compiled from census studies that used the line-transect method, we appliedregression trees in order to search for determinants of variation in primate density.Owing to its location in Brazil’s most developed region, the Atlantic forest is notonly highly fragmented, but also embedded in a landscape matrix encompassinga wide range of land use types and social contexts. Thus, the independent vari-ables used in the regression analyses included not only surrogates of forest type(e.g., climate) and fragment size, but also data on social indicators and estimates ofaccessibility derived from human movement models. For all genera, we found thatdensity was strongly influenced by forest type, and not influenced by our accessibil-ity estimates. Interestingly, genera differed in their responses to land use and socialindicators, a result that emphasizes the importance of incorporating information onthe landscape matrix when performing habitat suitability analyses. The regressionmodels produced here were used to construct maps of predicted primate densityfor the Brazilian southeast. Overall, the maps for all genera showed high predictedprimate densities for the inland semideciduous forests, where primary productivity
428 N. Pinto et al.
is expected to be higher. Finally, we suggest that more synthetic work is needed inour study area, and list a few topics in need of research.
Acknowledgments The program BIOTA FAPESP (2001/14463-5) funded the Laboratorio deBiologia da Conservacao (through a grant for MG) and the census in the protected areas in SaoPaulo State. MG receives a research fellowship from CNPq. The Teresa Lozano Long Institute ofLatin American Studies (LILAS) at Austin, TX for promoting the exchange program between MGand THK. Dr. C. Joly and F. Kronka kindly provided the digital map of vegetation types for SaoPaulo State. S.K. Gobbo, R.M. Marques, C. Steffler, P. Rubim, and R. Nobre provided unpublisheddata from their study areas.
References
Aerts, R. 1996. Nutrient resorption from senescing leaves of perennials: are these general patterns?Journal of Ecology 84, 597–608.
Alves, A.C.R., Ribeiro L.F., Haddad C.F.B., and dos Reis, S.F. 2006. Two new species of Brachy-cephalus (Anura: Brachycephalidae) from the Atlantic forest in Parana state, southern Brazil.Herpetologica 62, 221–233.
Berk, R. A. 2006. An introduction to ensemble methods. Sociological Methods and Research 34,263–295.
Bernardo C.S., and Galetti, M. 2004. Densidade e tamanho populacional de primatas em um frag-mento florestal no sudeste do Brasil. Revista Brasileira de Zoologia 21, 827–832.
BIOTA 2006. Atlas Sinbiota: http://sinbiota.cria.org.br/index.Bovendorp, R.S., and Galetti, M. 2007. Density and population size of mammals introduced on a
land-bridge island in southeastern Brazil. Biological Invasions 9, 353–357.Brashares, J.S., Arcese, P., and Sam, M.K. 2001. Human demography and reserve size pre-
dict wildlife extinction in West Africa. Proceedings of the Royal Society of London SeriesB-Biological Sciences 268, 2473–2478.
Breiman, L. 2001. Random Forests. Machine Learning 45, 5–32.Brooks, T.M., Mittermeier, R.A., Mittermeier, C.G., da Fonseca, G.A.B, Rylands, A.B., Konstant,
W.R., Flick, P., Pilgrim, J., Oldfield, S., Magin, G., and Hilton-Taylor, C. 2000. Habitat lossand extinction in the hotspots of biodiversity. Conservation Biology 16, 909–923.
Brown, J.H., Mehlman, D.W., and Stevens, G.C. 1995. Spatial variation in abundance. Ecology 76,2028–2043.
Buckland, S.T., Anderson, D.R., Burnham, K.P., Laake, J.L., Borchers, D.L. and Thomas, L. 2001.Introduction to Distance Sampling, Oxford University Press, Oxford.
Buss, G. 2001. Estudo da densidade populacional do bugio-ruivo Alouatta guariba clamitans(Cabrera, 1940) (Platyrrhini, Atelidae) nas formacoes florestais do morro do campista, ParqueEstadual de Itapua, Viamao, RS. Master Thesis. Universidade Federal do Rio Grande do Sul,Brazil.
Camara, I.G. 2003. Brief history of conservation in the Atlantic forest. In: I. Gusmao-Camara andC. Galindo-Leal (Eds.), The Atlantic Forest of South America. Biodiversity Status, Threats, andOutlook. Island Press, Washington, pp. 31–42.
Chiarello, A.G. 1993. Home range of the brown howler monkey, Alouatta fusca, in a forest frag-ment in southeastern Brazil. Folia Primatologica 60, 173–175.
Chiarello, A.G. 2000. Density and population size of mammals in remnants of Brazilian AtlanticForest. Conservation Biology 14, 1469–1657.
Chiarello, A.G. 2003. Primates of the Brazilian Atlantic forest: the influence of forest fragmen-tation on survival. In: L.K. Marsh (Ed.), Primates in Fragments. Ecology and Conservation.Kluwer Academic, New York, pp. 99–121.
16 Primate Densities in the Atlantic Forest of Southeast Brazil 429
Chiarello, A.G., and Melo, F.R. 2001. Primate population densities and sizes in Atlantic forestremnants of northern Espırito Santo, Brazil. International Journal of Primatology 22, 379–395.
Coley, P.D. 1983. Herbovory and defense characteristics of tree species in a lowland tropical forest.Ecological Monographs 53, 209–233.
Correa, H.K.M., Coutinho, P.E.G., and Ferrari, S.F. 2000. Between-year differences in the feedingecology of highland marmosets (Callithrix aurita and Callithrix flaviceps) in south-easternBrazil. Journal of Zoology 252, 421–427.
Cosenza, B.A.P, and Melo, F. 1998. Primates of the Serra do Brigadeiro State Park, Minas Gerais,Brazil. Neotropical Primates 6, 18–20.
Cullen Jr., L., Bodmer, R.E., and Valladares-Padua, C.V. 2001. Ecological consequences of huntingin Atlantic forest patches, Sao Paulo, Brazil. Oryx 35, 137–144.
Danko, D.M. 1992. Digital chart of the world. GeoInfo Systems 29–36.Dean, W. 1996. A Ferro e Fogo: A Historia e a Devastacao da Mata Atlantica Brasileira. Com-
panhia das Letras, Sao Paulo.DNIT 2007. Atlas das estradas do Brasil. www.dnit.brDonha, C.G., and Eliasaro, S. 2006. Two new species of Parmotrema (Parmeliaceae, lichenized
ascomycota) from Brazil. Mycotaxon 95, 241–245.Eva, H.D., Miranda, E.E., Bella, C.M., Gond, V., Huber, O., Sgrenzaroli, M., Jones, S., Coutinho,
A., Dorado, A., Guimaraes, M., Elvidge, C., Achard, F., Belward, A.S., Bartholome, E.,Baraldi, A., Grandi,G., Vogt, P., Fritz, S., and Hartley, A. 2002. A vegetation map of SouthAmerica. EUR 20159, European Commission, Joint Research Centre.
Fragaszy, D.M., Visalberghi, E., and Fedigan, L.M. 2004. Behavioral ecology: how to capuchinsmake a living? In: D.M. Fragaszy, E. Visalberghi, L.M Fedigan (Eds.), The Complete Capuchin:the Biology of the Genus Cebus. Cambridge University Press, Cambridge, UK, pp. 36–54.
Franklin, I.R. 1980. Evolutionary change in small populations. In: M.E. Soule and B.A. Wilcox(Eds.), Conservation Biology: an Evolutionary-Ecological Perspective. Sinauer, Sunderland,MA, pp. 135–150.
Galetti, M., and Pedroni, F. 1994. Diet of capuchin monkeys (Cebus apella) in a semideciduousforest in South-east Brazil. Journal of Tropical Ecology 10, 27–39.
Garzon, M.B., Blazek, R., Neteler, M., Sanchez de Dios, R., Ollero, H.S., and Furlanello, C. 2006.Predicting habitat suitability with machine learning models: the potential area of Pinus sil-vestris L. in the Iberian peninsula. Ecological Modeling 197, 383–393.
Glander, K.E. 1978. Howler monkey feeding behavior and plant secondary compounds: a study ofstrategies. In: G.C. Montgomery (Ed.), The Ecology of Arboreal Folivores. Smithsonian Press,Washington, pp. 561–574.
Godoy, R., Wilkie, D.S., Reyes-Garcia, V., Leonard, W.R., Huanca, T., McDade, T., Valdez, V.,and Tanner, S. 2006. Human body-mass index (weight in kg/stature in m(2)) as a useful proxyto assess the relation between income and wildlife consumption in poor rural societies. Biodi-versity and Conservation 15, 4495–4506.
Grelle, C.E., and Cerqueira, R. 2006. Determinantes da distribuicao geografica de Callithrix flavi-ceps (Thomas) (Primates, Callitrichidae). Revista Brasileira de Zoologia 23, 414–420.
Hansen, M.R., DeFries, R., Townshend, J. R., Carroll, M., Dimiceli, C., and Sohlberg, R. 2003.Vegetation Continuous Fields, MOD44B, 2001 percent tree cover, collection 3. University ofMaryland, College Park, Maryland.
Hijmans, R.J., Cameron, S.E., Parra, J.L., Jones, P.G., and Jarvis, A. 2005. Very high resolutioninterpolated climate surfaces for global land areas. International Journal of Climatology 25,1965–1978.
Hirota, M.M. 2003. Monitoring the Brazilian Atlantic forest cover. . In: I. Gusmao-Camara and C.Galindo-Leal (Eds.), The Atlantic Forest of South America. Biodiversity Status, Threats, andOutlook. Island Press, Washington, pp. 60–65.
Hirsh, A. 1995. Censo de Alouatta fusca Geoffroy, 1812 (Platyrrhini, Atelidae) e qualidade dohabitat em dois remanescentes de Mata Atlantica em Minas Gerais. Master Thesis. Universi-dade Federal de Minas Gerais.
430 N. Pinto et al.
Hirsh, A., Dias, L.G., Martins, L.O., Resende, N.A.T. and Landau, E.C. 2006. Database of Georef-erenced Occurrence Localities of Neotropical Primates. Department of Zoology, UFMG, BeloHorizonte. http://www.icb.ufmg.br/zoo/primatas/home bdgeoprim.htm
Hirsh, A., Subira R., and Landau, E.C. 1994. Levantamento de primatas e zoneamento das matasda regiao do Parque Estadual do Ibitipoca, Minas Gerais, Brasil. Neotropical Primates 2, 4–6.
IBGE 1996, 2000. Instituto Brasileiro de Geografia e Estatistica. www.ibge.gov.brIUCN 2006. Red List of Threatened Species. http://www.iucn.org/themes/ssc/redlist.htmLaurance, W.F., Croes, B.M., Tchignoumba, L., Lahm, S.A., Alonso, A., Lee, M.E., Campbell, P.,
and Ondzeano, C. 2005. Impacts of roads and hunting on central African rainforest mammals.Conservation Biology 20, 1251–1261.
Levin, SA 1992. The problem of pattern and scale in ecology. Ecology 73, 1943–1967.Liaw, A., and Wiener, M. 2002. Classification and regression by random Forest. R News 2, 18–22.Marsden, S.J., Whiffin, M., Galetti, M. and Fielding, A.H. 2005. How well will Brazil’s system
of atlantic forest reserves maintain viable bird populations? Biodiversity and Conservation 14,2835–2853.
Martins, M.M. 2005. Density of primates in four semideciduous forest fragments of Sao Paulo,Brazil. Biodiversity and Conservation 14, 2321–2329.
Mendes, S.L. 1989. Estudo ecologico de Alouatta fusca (Primates: Cebidae) na Estacao EcologicaCaratinga. Revista Nordestina de Biologia 6, 71–104.
Milton, K. 1984. Habitat, diet, and activity patterns of free-ranging woolly spider mon-keys (Brachyteles arachnoides E. Geoffroy 1806). International Journal of Primatology 5,491–514.
Michalski, F., and Peres, C.A., 2005. Anthropogenic determinants of primate and carnivore localextinctions in a fragmented forest landscape in southern Amazonia. Biological Conservation124, 383–396.
Mittermeier R., Coimbra-Filho, A.F., Kierulff, M.C.M., Rylands, A.B., Pissinatti, A, and Almeida,L.M. 2008. Monkeys of the Atlantic Forest of Eastern Brazil. Pocket Identification Guide.Conservation International, Brazil.
Oliveira-Filho, A.T., and Fontes, M.A.L. 2000. Patterns of floristic differentiation among Atlanticforests in southeastern Brazil and the influence of climate. Biotropica 32, 793–810.
Pang, H., Lin, A., Holford, M., Enerson, B.E., Lu, B., Lawton, M.P., Floyd, E., and Zhao, H.2006. Pathway analysis using random forests classification and regression. Bioinformatics 22,2028–2036.
Peres, C.A. 1997. Effects of habitat quality and hunting pressure on arboreal folivore densities inNeotropical forests: a case study of howler monkeys (Alouatta spp.). Folia Primatologica 68,199–222.
Pinto, L.P.S., Costa, C.M.R., Strier, K.B., and Fonseca, G.A.B. 1993. Habitat, density, and groupsize of primates in a Brazilian tropical forest. Folia Primatologica 61, 135–143.
Pontes, A.R.M., Malta, A., and Asfora, P.H. 2006. A new species of capuchin monkey, Cebus(Cebidae, Primates): found at the very brink of extinction in the Pernambuco endemis centre.Zootaxa 1200, 1–12.
Prasad, A.M., Iverson, L.R. and Liaw, A. 2006. Newer classification and regression tree techniques:bagging and random forests for ecological prediction. Ecosystems 9, 181–199.
Price E.C., and Piedade H.M. 2001. Diet of northern masked titi monkeys (Callicebus personatus).Folia Primatologica 72, 335–338.
R Development Core Team 2007. R: a language and environment for statistical computing.http://www.R-project.org
Reed, D.H., O’Grady, J.J., Brook, B.W., Ballou, J.D., and Frankham, R. 2003. Empirical estimatesof minimum viable population sizes for vertebrates and factors influencing those estimates.Biological Conservation 113, 23–34.
Romanini de Oliveira, R.C., Coelho, A.S. and Melo, F.R. 2003. Estimativa de densidade e tamanhopopulacional de saua (Callicebus nigrifons) em um fragmento de mata em regeneracao, Vicosa,Minas Gerais. Neotropical Primates 11, 91–94.

16 Primate Densities in the Atlantic Forest of Southeast Brazil 431
Rylands, A.B., and Faria, D.S. 1993. Habitats, feeding ecology, and home range size in the genusCallithrix. In: A.B. Rylands (Ed.), Marmosets and Tamarins: Systematics, Behavior, and Ecol-ogy. Oxford University Press, Oxford, UK, pp. 262–272.
Rylands, A.B., Coimbra-Filho, A.F., and Mittermeier R.A. 1993. Systematics, geographic dis-tribution, and some notes on the conservation status of the Callitrichidae. In: A.B. Rylands(Ed.), Marmosets and Tamarins: Systematics, Behavior, and Ecology. Oxford University Press,Oxford, UK, pp. 11–77.
Shively, G.E. 1997. Poverty, technology, and wildlife hunting in Palawan. Environmental Conser-vation 24, 57–63.
Siren, A.H., Cardenas, J.C., and Machoa, J.D. 2006. The relationship between income and huntingin tropical forests: an economic experiment in the field. Ecology and Society 11, 44.
Strier, K.B. 1991. Diet in a group of woolly spider monkeys, or muriquis (Brachyteles arachnoides)American Journal of Primatology 23, 113–126.
Strier, K.B. 2000. Population viabilities and conservation implications for muriquis (Brachytelesarachnoides) in Brazil’s Atlantic forest. Biotropica 32, 903–913.
Trevelin, L.C. 2006. Aspectos da ecologia do saua (Callicebus nigrifons) no Parque Estadualda Cantareira, SP. Master Thesis. Universidade Estadual Paulista Julio de Mesquita Filho(UNESP).
Wiens, J. A. 1989. Spatial scaling in ecology. Functional Ecology 3, 385–397
All in-text references underlined in blue are linked to publications on ResearchGate, letting you access and read them immediately.