Nutritional contributions of insects to primate diets: implications for primate evolution
Upload
khangminh22Category
view
0download
0
PR
IMA
TE
REPO
RT
PR
IMA
TE
REPO
RT
73July 2006
Old female at the
Rome Zoological Garden
Macaca assamensis

Contents
Genetic Characterization and Phylogenetic Relationships between theAteles Species (Atelidae, Primates) by Means of DNA MicrosatelliteMarkers and Craniometric Data
Ruiz-García M, Parra A, Romero-Aleán N, Escobar-Armel P and
Shostell JM . . . . . . . . . . . . . . . . . . . . . . . . . . . . . . . . . . . . . 3
Social Relationships in a Free-Ranging Group of Bonnet Macaques inTamil Nadu, India.
Mehu M, Huynen M-C and Agoramoorthy G . . . . . . . . . . . . . . . . . . . 49
Applied Primatology in Zoos: History and Prospects in the Field of WildlifeConservation, Public Awareness and Animal Welfare
Gippoliti S . . . . . . . . . . . . . . . . . . . . . . . . . . . . . . . . . . . . . 57
Primate Report 73, July 2006 1
Contents

GENETIC CHARACTERIZATION AND PHYLOGENETIC RELATIONSHIPSBETWEEN THE ATELES SPECIES (ATELIDAE, PRIMATES) BY MEANS OFDNA MICROSATELLITE MARKERS AND CRANIOMETRIC DATA
Ruiz-García M, Parra A, Romero-Aleán N, Escobar-Armel P and Shostell
JM
Key words: DNA Microsatellites, cranial traits, Ateles, mutation models, effectivenumbers, Latin America
AbstractA genetic characterization and some phylogenetic conclusions were obtained by ana-lyzing six DNA microsatellite markers in seven different Ateles taxa. Additionally,38 skull measurements were applied on several of these Colombian Ateles taxa. Themain results obtained were as follows. 1-Two A. fusciceps robustus populations, onefrom the Chocó (Colombian Pacific Coast) and other from the northern Atlantic areaof Colombia, were clearly differentiated by means of the DNA microsatellites. 2-Thetaxa, which presented the highest and the lowest average number of alleles, werethe northern Atlantic A. fusciceps robustus population and A. geoffroyi. Otherwise,A. chamek presented the highest average genetic diversity (heterozygosity), mean-while A. hybridus showed the lowest one. 3-Three taxa samples were not in Hardy-Weinberg equilibrium, A. fusciceps robustus, A. belzebuth and A. chamek. 4-Themarkers AP68, AP74 and D5S117 show a considerably heterogeneity among theAteles taxa analyzed. However, the values of GST and RST obtained for Ateles weremuch lower than those recorded for other Neotropical Primates, such as Alouatta
and Cebus. 5-Only the A. fusciceps robustus population from Chocó showed evidenceof a recent bottleneck. 6-The coalescence methods estimated the lowest effectivenumbers for A. hybridus and A. geoffroyi, which coincides with the Ateles taxa in themost dangerous situation. 7-Generally speaking, the mutation model in the micro-satellites analyzed was uni-step. The unique marker showing a significant multi-step mutation model was AP74 for A. fusciceps robustus, A. belzebuth and A. hybri-
dus. 8-The mutation rates per generation were different for all the microsatellitesemployed. 9-No species or sex associations were displayed by the constructedphenograms using 38 craniometric variables. 10-The variables mainly influenced bysize were maximum frontal and minimum frontal width followed by basal height,bigonion width, auricular height and maximum transversal braincase width. The in-fluence of cranial shape was very dispersed among all the analyzed variables.
IntroductionThe spider monkeys of the Ateles genus are among the largest primates in the
Neotropics along with Alouatta, Lagothrix and Brachyteles (STRIER, 1992). Unfor-tunately, endemic Ateles populations are currently being threatened by a number ofevents. For example, they are intensively hunted for food by indigenous people of di-
Primate Report 73, July 2006 3
M. Ruiz-García et al.: Microsatellite DNA and craniometric data in Ateles

verse countries in Central and South America. Additionally, the traditional demandfor spider monkeys as attractive animals in zoos and as pets has led to the develop-ment of an intense commercial traffic (legal and illegal) of this genus. As large pri-mates, Ateles species have low reproductive rates and therefore, even a low huntingpressure could extirpate extensive populations of spider monkeys throughout theirdistribution range (COLLINS, 1999). KONSTANT et al. (1985) and ROSENBER-GER and STRIER (1989) revealed that Ateles are extremely environmentally sensi-tive and are the first primates to disappear after small environmental changes areintroduced in rain forests. Normally, these primates live in undisturbed areaswithin primary rain forests and are mainly arboreal. Furthermore, Ateles is prima-rily frugivorous and feeds largely on the mature, soft parts of a wide variety of fruitsthat provide more energy than leaves. VAN ROOSMALEN (1980) estimated that82.9 to 90 % of the Ateles diet is composed of fruit. This diet requires Ateles to haveextensive territories because the territories must encompass the non-uniform distri-butions of fruit. This is remarkable different from Alouatta that can in live in smallpatchy forests. High sensitivity to environmental change, low reproductive rate andlarge territories help to explain why many Ateles taxa are now seriously threatenedand therefore need to be targeted for conservation. The Ateles taxa reported as eitherendangered, critically endangered or vulnerable are A. geoffreyi azuerensis, A. g.
frontatus, A. g. grisescens, A. g. panamensis, A. g. vellerosus, A. g. yucatensis, A. fus-
ciceps fusciceps, A. f. robustus, A. belzebuth belzebuth, A. hybridus and A. margina-
tus following the IUCN Mance-Lande categories (RYLANDS et al., 1997). After Bra-
chyteles and Leontopithecus, Ateles is considered the most endangered genus of theNew World Primates (MITTERMEIER et al., 1989). Effective conservation propos-als for any taxa should include information about gene diversity levels, genetic het-erogeneity, existence of recent historical bottlenecks, and the identity and quantityof the sub-taxa or evolutionary units that exist in the natural environment.
Unfortunately, there is disagreement in the literature over the systematics ofAteles, making it difficult to construct and present an effective conservation proposalfor this taxon. The most commonly used classificatory scheme recognizes 4 differentspecies (A. geoffroyi from Central America with 9 subspecies, A. belzebuth with threegeographical discontinuous subspecies, A. fusciceps in the Pacific coast of Colombiaand Ecuador with two subspecies and A. paniscus with two discontinuous subspe-cies) for a total of 16 taxa (KELLOG and GOLDMAN, 1944). More recently, other au-thors have used the same scheme (KONSTANT et al., 1985). Differences betweenspecies and subspecies of this classification were based almost entirely upon pelagecharacteristics. Conversely, other authors such as HERSHKOVITZ (1972) or HER-NÁNDEZ-CAMACHO and COOPER (1976) supported a second classificationscheme and have considered all Ateles to belong to one, wide-ranging variable poly-typic species, A. paniscus, using heterochromatism as the main parameter responsi-ble for the different coat color patterns observed at this genus. Nevertheless, otherauthors (SHEDD and MACEDONIA, 1991; JACOBS et al., 1995) have not sup-ported the use of metachromatism to infer phylogenetic relationships among diverseNeotropical Primate taxa because the genetic and developmental systems that un-derlie the phenotypic expression of pelage traits may be different across primatespecies. Furthermore, pelage characteristics are not only variable within popula-tions, but they may intergrade where population distributions overlap. For example,
4 Primate Report 73, July 2006
M. Ruiz-García et al.: Microsatellite DNA and craniometric data in Ateles

intergradation occurs among A. geoffroyi and A. fusciceps robustus and A. g. grises-
cens at the interface of Colombia and Panamá (KELLOG and GOLDMAN, 1944).ROSSAN and BAERG (1977) located sympatric populations of A. geoffroyi and A.
fusciceps in eastern Panamá, where both populations had hybridized to some extentalong a contact zone. In addition, an Ateles specimen collected inside the territory ofA. fusciceps robustus, (Catival, San Jorge river in Colombia) had a strong admixtureof light-colored hairs on the back, similar to the A. hybridus phenotype (HERNÁN-DEZ-CAMACHO and COOPER, 1976). Similarly, ELLIOT (1913) identified speci-mens with pelage characteristics of A. belzebuth belzebuth in the territory of A. p.
chamek (Chamicuros in the Huallaga River in Perú). The authors of the current pa-per add further support with their observations of hybrids between A. p. chamek andA. b. belzebuth at the Loreto region in the Peruvian Amazon. In a third classificatoryscheme based on cytogenetic analyses, diverse authors (GARCÍA et al., 1975; KUN-KEL et al., 1980 and MEDEIROS et al., 1997) postulated that differences in the mor-phological chromosome pairs 5, 6 and 7 did not support the Ateles taxonomy pro-posed by KELLOG and GOLDMAN (1944). PIECZARKA et al. (1989) determinedthat A. paniscus possessed 32 chromosomes, while all the other Ateles taxa had 34chromosomes, suggesting the first as a separate species from the others. On theother hand, GROVES (2001) stated that there were seven different species of Ateles,including A. paniscus, A. belzebuth, A. chamek, A. hybridus, A. marginatus, A. fus-
ciceps (with two subspecies) and A. geoffroyi (with 5 susbspecies). FROEHLICH etal., (1991) used a fourth classificatory scheme based on discriminant analysis of cra-nial and dental morphologies. These authors classified Ateles in three different spe-cies, A. paniscus, A. belzebuth (which included A. chamek and A. marginatus), and A.
geoffroyi (which included A. fusciceps and A. hybridus).Given the establishment and use of multiple classification schemes it is impera-
tive to determine the research criteria that provide accurate information about theevolutionary units within the Ateles genus in their natural environment. Only re-cently have some molecular approaches been carried that have focused on the mito-chondrial DNA control region, the cytochrome c oxidase subunit II gene and the nu-clear Aldolase A intron V gene (COLLINS, 1999; COLLINS and DUBACH, 2000 a,b,2001). These studies determined that although variation in nuclear genes is lessthan in mitochondrial genes (at least in the genes they studied) the constructedphylogenies via these two types of DNA are primarily similar. These authors sug-gested the need for additional studies that included more variable nuclear DNA totest their preliminary findings. Therefore, we used 6 hyper-polymorphic STRPs(Short Tandem Repeat Polymorphisms) to analyze the genetics and evolutionaryphylogenetics aspects of some Ateles populations. These kinds of markers are com-posed of short repetitive elements, one to six nucleotide base pairs in length. Theyare also randomly distributed, highly polymorphic, and are frequently inside theeukaryotic genomes. An additional and positive property of these markers is thesmall DNA quantity needed to carry out these molecular analyses (via PCR). Thesmall sample size allows the investigator to use non-invasive procedures to samplewild animals and successfully examine population biology dynamics through the useof molecular genetic techniques (BRUFORD and WAYNE, 1993) as well as to estab-lish gene linkage maps. It is important to determine phylogenetic relationshipsamong diverse Ateles taxa with this proposed marker type in order to verify the
Primate Report 73, July 2006 5
M. Ruiz-García et al.: Microsatellite DNA and craniometric data in Ateles

schemes proposed with other molecular markers. It is also of interest to compare theresults obtained with DNA microsatellites with classical biometric studies. There-fore, the objectives of this study are to use nuclear DNA microsatellites and cranio-metrical biometric distances to determine Ateles systematics.
Material and Methods
A total of 181 blood, drops of blood and hair samples were collected and analyzedfrom 7 different Ateles taxa for six microsatellite markers (AP6, AP40, AP68, AP74,D5S117 and D8S165). The taxa analyzed were as follows: A. belzebuth belzebuth (n =22; Colombia and Perú), A. fusciceps robustus (n = 65; Colombia), A. chamek (n = 40;Perú and Bolivia), A. paniscus paniscus (n = 2; Brazil), A. fusciceps fusciceps (n = 2;Ecuador), A. hybridus (n = 36; Colombia and Venezuela) and A. geoffroyi vellerosus
(n = 14; Guatemala) (Table 1).
Table 1: Geographic origin, sample sizes and sources of the seven Ateles taxa ana-lyzed in the current work. Also the type of biological material analyzed is indicated.
Species N Origin Geographic origin
of the samples
Source
Ateles belzebuth
belzebuth
22 Colombia
Perú
La Macarena (Meta) (teeth)
Villavicencio (Meta) (hairs)
Caquetá Amacayacu (Amazonas)
(hairs and bones)
Loreto (Peruvian Amazon) (hairs)
M. Ruiz-García
Ateles fusciceps
robustus
65 Colombia Turbo(Antioquia) (teeth and bones)
Colosó (Sucre) (teeth and hairs)
Barranquilla (Atlántico) (hairs blood
and teeth)
Alto Sinú (Córdoba) (hairs)
Darién (Chocó) (blood)
Parque Nacional los Katíos(Chocó)
(teeth)
Rio Sucio(Chocó) (blood)
M. Ruiz-García
Ateles fusciceps
fusciceps2 Ecuador Ecuadorian Chocó (hairs)
A. Castellanos
L. Albuja
Ateles hybridus 36 Colombia
Venezuela
Pto. Wilches (Santander) (blood)
Pto. Rico (Bolivar) (blood)
Morales (Bolivar) (teeth)
Catatumbo (Norte de Santander)
(hairs)
Maracaibo (hairs)
M. Ruiz-García
J. Villavicencio
A.E. Bracho
6 Primate Report 73, July 2006
M. Ruiz-García et al.: Microsatellite DNA and craniometric data in Ateles

Species N Origin Geographic origin
of the samples
Source
Ateles chamek 40 Perú
Bolivia
Loreto (Peruvian Amazon) (blood,
teeth, hairs)
Noel Kempf National Park (hairs)
M. Ruiz-García
Ateles paniscus
paniscus
2Brasil Manaos (Brazilian Amazon) (hairs) M. Ruiz-García
Ateles geoffroyi
vellerosus
14 Guate-
malaPetén (hairs) Connie Stelle
One of the molecular markers used in the current study, AP6 did not completelyamplify in Ateles and it was therefore not used in the population genetic analyses.The PCR characteristics of the STRPs were as follows. The final PCR volume reac-tion, for DNA extracted from blood by means of the phenol-chloroform procedure was
25 �l, with 3 �l of MgCl2 3 �M, 2.5 �l of Buffer 10x, 1 �l of dNTPs 1�M, 1 �l of of each
primer (forward and reverse; 4 pmol), 13.5 �l of H2O, 2 �l of DNA, and 1 Taq Poly-
merase unit per reaction (1 �l). For the PCR reactions with DNA extracted from
hairs and blood drops by means of the Chelex resine, the overall volume was 50 �l,
with 20 �l of DNA and twofold amounts of MgCl2, Buffer, dNTPs, primers and TaqPolymerase. The PCR reactions were carried out in a Geneamp PCR System 9600Perkin Elmer thermocycler. The temperatures used were as follows: 95
oC for 5 min-
utes, 30 cycles of 1 minute at 95oC, 1 minute at the most accurate annealing temper-
ature (57oC for AP40, 50
oC for AP68 and 52 °C for the remaining markers), one min-
ute at 72oC, and 5 minutes at 72
oC. The amplification products were kept at 4
oC un-
til used. The PCR amplification products were run in denaturant 6 % polyacrilamidegels within a Hoefer SQ3 sequencer vertical chamber. Gels migrated for 2-3 hoursdepending on marker sizes, and were then stained with AgNO3 (silver nitrate).
Every sixth line in the gel contained molecular markers (�174 cut with Hind III andHinf I).
Population Genetics Analyses
Several population genetics statistics were estimated through the microsatellitegenotypes obtained. The mean number of alleles per locus and the expected hetero-zygosity (H) (NEI, 1973) were calculated for the Ateles species studied and statisti-cally analyzed with a student t test. The expected heterozygosity values were arc-sign transformed prior to stastical analysis (ARCHIE, 1985).
The Hardy-Weinberg equilibrium (H-W E) and the genotypic disequilibrium forthe Ateles species studied were estimated using several different strategies. TheWEIR and COCKERHAM (1984)´s F (W-C F) and the ROBERTSON and HILL(1984)´s f (R-H f) statistics were used to calculate the degree of excess or deficit, ofhomo- and heterozygous within each one of the populations considered. To measurethe exact probabilities of these statistics, the Markov chain method, with a 10,000dememorization number, 200 batches and 10,000 iterations per batch, was used, fol-lowing the Genepop v. 3.1 program (RAYMOND and ROUSSET, 1995). The H-W Ewas simultaneously analyzed by locus and species using Fisher´s method (RAY-
Primate Report 73, July 2006 7
M. Ruiz-García et al.: Microsatellite DNA and craniometric data in Ateles

MOND and ROUSSET, 1995). The gametic disequilibrium among loci-pairs wasstudied by means of the Markov chains and the Fisher´s procedures with the sameparameters as those used for the H-W E.
The genetic heterogeneity among the Ateles species was studied globally for eachmarker and for species pairs. The first strategy used the mean gene frequencies ofthe 5 microsatellites studied, exact tests with Markov chains, 10,000 dememori-zations parameters, 200 batches, and 10,000 iterations per batch. The second strat-egy used the Wright F-statistics (WRIGHT, 1951) with the MICHALAKIS andEXCOFFIER (1996)´s procedure. The standard deviations of the F-statistics werecalculated using a jackknifing over loci and the 95 and 99 % confidence intervalswere measured by means of bootstrapping over loci. Two procedures were used tomeasure the significance of Fst. The first one used 10,000 randomizations of overallalleles sampled and assumed random mating within species by means of the G test(GOUDET et al., 1996). The second procedure used 10,000 randomizations of geno-types among species and did not assume random mating within species by means ofthe log-likelihood G test (GOUDET et al., 1996). The significance of Fis and Fit wasalso found by using 10,000 randomizations of alleles within samples and in the over-all sample. Additionally, the gene diversity analysis of NEI (1973) was estimated tomeasure the gene heterogeneity between the Ateles species analyzed. These analy-ses are useful to determine which STRPs more clearly discriminate among the spe-cies of Ateles studied and to determine the degree of gene variability within each spe-cies studied relative to the whole genus. Possible theoretical gene flow estimatesamong the Ateles species studied were measured using the private allele model(SLATKIN, 1985; BARTON and SLATKIN, 1986).
Another population genetics analysis was focused on the detection of recent bot-tleneck events using the most recently derived theory generated by CORNUET andLUIKART (1996), and LUIKART et al. (1998). The species, which experienced a re-cent bottleneck, simultaneously decreases the allele number and the expected levelsof heterozygosity. Nevertheless, the allele number (ko) is reduced faster than the ex-pected heterozygosity. Therefore, the value of the expected heterozygosity calcu-lated through the allele number (Heq) is lower than the obtained expected heterozy-gosity (He). For neutral markers, in a population in gene mutation drift equilibrium,there is an equal probability that a given locus has a slight excess or deficit of hetero-zygosity in regard to the heterozygosity calculated from the number of alleles. Incontrast, in a bottlenecked population, a large fraction of the loci analyzed will ex-hibit a significant excess of the expected heterozygosity. To measure this probabil-ity, four diverse procedures were used as follows: sign test, standardized differencetest, Wilcoxon´s signed rank test and graphical descriptor of the shape of the allelefrequency distribution. A population, which did not suffer a recent bottleneck event,will yield a L-shape distribution (such as expected in a stable population in muta-tion-gene drift equilibrium), whereas a recently bottlenecked population will show amode-shift distribution. The Wilcoxon´s signed rank test probably has its greatestpower when the number of loci analyzed is low, such as in the current case. TheBOTTLENECK program was used to test for historical bottlenecks.
A first approximation to estimate historical effective numbers was accomplished
using a maximum likelihood estimate of � (= 4Ne�) following the original formula-tion of GRIFFITHS and TAVARÉ (1994). Ne is the historical effective number of the
8 Primate Report 73, July 2006
M. Ruiz-García et al.: Microsatellite DNA and craniometric data in Ateles

species studied and � is the mutation rate per generation. If the value of � is known,Ne can be calculated, which will indicate historical patterns of reproduction and pop-ulation size of Ateles species populations. The mutation rates within dinucleotiderepetitions vary among species. For example, the mutation rates for humans, pigs,and rats were estimated to be around 5.6 x 10
-4(WEBER and WONG, 1993), 7 x 10
-5
(ELLENGREN, 1995), and 1.5 x 10⁻⁴
(SERIKAWA, 1992), respectively. Thus, to ob-tain a wide range of feasibly effective numbers in the Ateles species analyzed, themutation rates used in this study ranged from 5.6 x 10
-4to 7 x 10
-5. For a given value
of �, the likelihood of observing k alleles in a size sample of n is L(k, n / �) = Sk
n qk
/ [�
(1 + �) (2 + �) …..(n-1 + �), where Sk
n is a function of k and n (EWENS, 1979). The
maximum estimate of � is derived by using the expression � = k / [(1/�) + (1/(1+�)) +
(1/(2 + �)) + ….. + (1/(n-1 + �))] and setting L to zero (k, n / �). A general Monte Carloprocedure introduced by GRIFFITHS and TAVARÉ (1994) offered approximate
probabilities of the different � values of the functions obtained. The historical effec-tive numbers were calculated from the approximated function with the highest prob-abilities.
The maximum likelihood procedure with a Markov chain recursion method(NIELSEN, 1997) was used to calculate the second historical effective number for
each one of the Ateles species studied. Probable � values were calculated using
NIELSEN’s (1997) model based on the equation L(�) = P(� / �), where � is a vector. Aone step determination mutation model that was typical of microsatellites was alsoadopted (NIELSEN, 1997). Mathematical expressions by OHTA and KIMURA(1973) and WEHRHAHN (1975) were used to calculate the probability that an allelechosen at random was m repetitions higher than other allele chosen at random. Therecursivity of the coalescence theory was applied to obtain the likelihood functions of
� for samples of a determined size. The coalescence time between two alleles was ex-ponentially distributed with a mean equal to 1 and the conditional number of muta-
tions in each lineage followed a Poisson distribution with a mean of �t/2. It is feasibleto calculate the probabilities of observing an allele sample that was determined byrecursion in the previous generations and by considering the allele genealogies ofthe sample and a sum of all the previous possible states. This calculation is com-pleted by conditioning the last event through mutation or coalescence and by using asymmetric random walk of k-allele states that reflect barrier types. The probability
q (�) of the sample is determined by the addition of all the previous possible statesmultiplied by the transition probability of these states relative to the current state.
With the chosen mutation model (uni-step), this probability is � (�) = (�/(n + q - 1))
� ��i + 1/(n) 1/2 q (� + i - j) + (n - 1)/(n + � -1) � (nj - 1)/(n - 1) q (� - j), where ei is an
unity vector which adds values equals to 1 to the entry of i in �. This recursive proce-dure is determined with: 1) the probability that the last event before the present mo-ment is a mutation and that a mutational or a coalescence event has occurred previ-
ously (q/(n + � - 1), 2) the probability that a coalescence event happened after a previ-ous mutation or coalescence has already occurred, 3) the probability that a mutation
occurs in an i allele, given that a mutation occurred ((n-1)/(n+�-1), of (ni-1)/(n -1), and4) the probability that two alleles belonging to the j state will be coalescent, given acoalescence event has occurred ((nj - 1)/ (n -1)). When a mutation event has occurredin the i state, there is a 0.50 probability that the i state will change to a j state.
Primate Report 73, July 2006 9
M. Ruiz-García et al.: Microsatellite DNA and craniometric data in Ateles

The GRIFFITHS and TAVARÉ (1994)´s procedure was applied to evaluate thelikelihood functions based on the expression recursion which led to the calculation of
q (�) with a Monte Carlo method. The MISAT program (NIELSEN, 1997) was used
to estimate the likelihood surfaces for �. The 5 % confidence interval was calculatedby multiplying the log likelihood of the maximum likelihood value by two. A grid size
of 40 with a previous � calculation and method of the moments (�0) in a mutation
one-step model with 1,000,000 Markov chains was used. The � value with the least
negative log likelihood is the estimate of the � maximum likelihood. From this value,Ne was calculated for each Ateles species studied. In addition, the largest possiblemulti-step mutation percentages (ranging from 0 to 0.5) were calculated through the
maximum likelihood of � by means of 3,000,000 Markov chains. We analyzed the dif-ferent mutation rates possible that affected each one of the microsatellites for each
Ateles species studied. We tested the hypothesis �1 = �2 = � (the values of � for two dif-ferent microsatellites) using a likelihood ratio test with the expression -2 log
[L1(�)L2(�)]/[L(�1,�2)], following �2
with one degree of freedom. A probability lower
than = 0.05 indicates that both microsatellites have different mutation rates. Like-wise, we measured if the multi-step mutation models’ estimates were significant im-provements over the uni-step mutation models within each Ateles species. The likeli-
hood ratio of -2 log [L(�, p = 0)/L(�, p)] was applied to the maximum likelihood ob-
tained multi-step p percentage. Large samples have a value of �2
with one degree of
freedom with the null hypothesis p = 0. A probability lower than = 0.05 indicatesthat the multi-step mutation percentage is significantly different from the uni-stepmutation model and this last model is then rejected.
Craneometric Analyses
For the craniometrical data, 38 quantitative cranial traits were measured on 27mature adult Ateles skulls representing all the taxa of this genus living in Colombia(Appendix 1). The distribution of skulls included: one A. geoffroyi, 3 A. hybridus, 8 A.
belzebuth, 13 A. fusciceps robustus and 2 Ateles sp. In the first analysis carried out,the craniometric distances were obtained without using any type of standardizationor transformation to determine the simultaneous impact of size and shape amongthe individuals analyzed. Different distance matrices (correlation, variance-cova-riance, and Manhattan distances; SNEATH and SOKAL, 1973; MARCUS, 1990)were calculated among the individuals analyzed. Each one of these procedures hasdifferent mathematical properties, which must be evaluated in order to determinethe effects on the obtained results. The UPGMA algorithm was applied to each one ofthe matrices in order to construct a phenogram which showed the relationshipsamong the skulls analyzed. The cophenetic correlation coefficient was calculated foreach one of these trees. A strict consensus tree was used to analyze the degree of sim-ilarity among these diverse phenograms (ROHLF, 1982). Only the clusters presentin all trees were included in this technique. A graphic matrix ("Minimum Spanningtree") was calculated among the individuals studied (GOWER and ROSS, 1969;ROHLF, 1970) in order to determine their phenotypic relationships. A ComponentPrincipal Analysis (PCA) of the standardized data was carried out to establish therelationships among the individuals and the influence of size and shape. Therefore,the same weight was given to all of the morphometric variables. A high and positivecorrelation of all variables with the first component usually denotes differences of
10 Primate Report 73, July 2006
M. Ruiz-García et al.: Microsatellite DNA and craniometric data in Ateles

size among the individuals. Otherwise, the following components mainly describethe shape of the individuals. The connections between the second and third compo-nents were analyzed to determine the relationships among individuals that were ex-clusively based on shape.
Results
Private alleles and allele sets shared by several Ateles species
AP68: This marker globally showed six alleles for Ateles (Table 2). The popula-tion which presented a major quantity of alleles (5) was A. fusciceps robustus locatedin Antioquia, Sucre, Córdoba and Atlántico. An allele of 166 bp was only found in thetwo populations of A. fusciceps and an allele of 168 bp was only discovered in A.
belzebuth belzebuth and in A. hybridus. It is also interesting to note that at this mar-ker a 178 bp allele was presented in only one of the two A. fusciceps populations and
in the sample of A. geoffroyi vellerosus.
Table 2: Alleles found in 8 Ateles populations. The alleles are indicate in base pairs(bp). * Private allele (= alleles found in one only population).
Markers
AP68 AP74 AP40 D5S117 D8S165
Ateles
belzebuth
belzebuth
168, 174, 176
(3 alleles)
130, 132, 136*,
142*, 158, 162,
166
(7 alleles)
176
(1 allele)
145, 147, 149,
153, 155, 157
(6 alleles)
145, 147, 149,
155
(4 alleles)
Ateles
fusciceps
robustus
– Chocó
166, 174, 176
(3 alleles)
150, 152, 154,
156, 158, 160,
162, 164*, 168
(9 alleles)
176
(1 allele)
145, 146, 147,
149
(4 alleles)
143, 145, 147,
151, 155, 157,
159
(7 alleles)
Ateles
fusciceps
robustus
– Antioquia,
Atlántico,
Sucre,
Córdoba
166, 172, 174,
176, 178
(5 alleles)
130, 132,134*,
138, 144, 148,
152, 154, 156,
158, 160, 162,
166, 168, 170*
(15 alleles)
176
(1 allele)
145, 147, 149,
150, 155, 157
(6 alleles)
141, 143, 145,
147, 149, 151,
152*, 153, 155,
157*
(10 alleles)
Ateles
fusciceps
fusciceps
174
(1 allele)
156, 158
(2 alleles)
176
(1 allele)
149, 155
(2 alleles)----
Ateles
hybridus
168, 172, 174,
176
(4 alleles)
130, 132, 148
(3 alleles)
176
(1 allele)
146, 147, 152*,
153, 157, 161*
(6 alleles)
143, 145, 147,
148*, 151, 153
(6 alleles)
Primate Report 73, July 2006 11
M. Ruiz-García et al.: Microsatellite DNA and craniometric data in Ateles

Markers
AP68 AP74 AP40 D5S117 D8S165
Ateles
chamek
172, 174, 176
(3 alleles)
130, 132, 144,
146*, 150, 152
(6 alleles)
174*, 176
(2 alleles)
141*, 143*, 146,
148*, 149,
150,153
(7 alleles)
137*, 139*, 141,
142*, 143, 145,
147, 149, 151
(9 alleles)
Ateles
paniscus
paniscus
176
(1 allele)
154, 160
(2 alleles)
176
(1 allele)
140*
(1 allele)
----
Ateles
geoffroyi
vellerosus
176, 174, 178
(3 alleles)
150, 154, 156,
158, 160, 162
(6 alleles)
176
(1 allele)
149, 151*, 153,
157
(4 alleles)
143, 147, 149,
151
(4 alleles)
AP74: This marker presented the highest number of alleles for the microsa-tellites analyzed in Ateles (20 alleles) and the A. fusciceps population displayed thehighest number of alleles (15). Several private alleles were detected such as a 164 bpallele in one of the A. f. robustus populations (Chocó), a 168 bp allele in both A. f.
robustus populations, and a 170 bp in the second A. f. robustus population. Addition-ally, two private alleles were located in A. b. belzebuth (136 and 142 bp), while an-other private allele (146 bp) was only located in A. chamek. It should be noted thatseveral Ateles taxa had relatively small-sized alleles compared with the majority ofthe alleles determined at this marker. This occurred for example in A. hybridus, A. b.
belzebuth, A. chamek and the second population of A. f. robustus with 130 and 132 bpalleles. All the other Ateles taxa presented alleles that were larger than 150 bp (A.
paniscus paniscus, A. f. fusciceps, A. geoffroyi and the first population of A. f. robus-
tus (Chocó)). A. hybridus only presented the smallest alleles, whereas A. b. belze-
buth, A. chamek and the second population of A. f. robustus simultaneously presen-ted small and large sized alleles. The characteristic of allele size is fundamentallyimportant to understand the biogeographic evolution of Ateles, as we will commenton in the discussion.
AP40: This marker was practically monomorphic and was therefore not useful inthe determination of genetic structure within Ateles species or for the determinationof possible dispersion routes. All species yielded an allele of 176 bp, with the excep-tion of A. chamek, where one individual presented a 174 bp allele. Therefore, thismicrosatellite does not have any power to discriminate among Ateles species. Previ-ously, RUIZ-GARCÍA et al. (2004) demonstrated a constrictive mutation or naturalselection event on this marker.
D5S117: This marker yielded 15 alleles for Ateles. A. chamek was the taxa thathad the largest quantity of different alleles at this marker (7). Several private alleleswere discovered: A. hybridus presented two (152 and 161 bp), A. chamek showedthree (141, 143 and 148 bp), A. geoffroyi had one (151 bp), and A. p. paniscus had one(140 bp).
D8S165: This marker also showed 15 alleles for Ateles. Again the first A. f.
robustus population presented the highest number of different alleles (10). At thispopulation, one private allele was determined (152 bp). Both A. f. robustus popula-
12 Primate Report 73, July 2006
M. Ruiz-García et al.: Microsatellite DNA and craniometric data in Ateles

tions also included a common private allele of 157 bp. A. hybridus also presented anexclusive allele of 148 bp, whereas A. chamek showed three private alleles of 137,139 and 142 bp. It is remarkably to note that the smallest size alleles determinedwere in the sample of this last species and that this species presented the secondhighest number of alleles at this locus after A. f. robustus.
Average number of alleles per locus and expected heterozygosity
With the exception of A. fusciceps fusciceps and A. p. paniscus (n = 2), the highestaverage allele number per locus occurred in the northern Atlantic A. f. robustus pop-ulation (nA = 7.4 ± 5.31) (Table 3), followed by A. chamek (nA = 5.4 ± 2.88). A. geoffroyi
had the lowest nA value (3.6 ± 1.81). However, there was no significant difference be-tween these extreme values (t = 1.354, 8 df, P = 0.40). The highest and lowest ex-pected heterozygosity levels (h) occurred in A. chamek (h = 0.752 ± 0.193) (Table 3)and A. hybridus (h = 0.519 ± 0.369) respectively. There was no significant differencebetween values (t = 1.185, 8 df, P = 0.51).
Table 3: Average number of alleles per locus and mean expected heterozygosity foreach Ateles taxa studied.
Species Average number of
alleles per locus (nA)
Mean Expected
heterozygosity (h)
Ateles belzebuth belzebuth 4.2 ± 2.38 0.565 ± 0.387
Ateles fusciceps robustus (total) 8.2 ± 6.09 0.601 ± 0.358
Ateles fusciceps robustus (Chocó) 4.8 ± 3.19 0.548 ± 0.294
Ateles fusciceps robustus
(Antioquia, Bolívar, Sucre, Atlántico
and Córdoba)
7.4 ± 5.31 0.661 ± 0.276
Ateles hybridus 4.0 ± 2.12 0.519 ± 0.369
Ateles chamek 5.4 ± 2.88 0.752 ± 0.193
Ateles geoffroyi vellorosus 3.6 ± 1.81 0.569 ± 0.360
Hardy-Weinberg equilibrium (H-W E)
There was homozygous excess in three species (A. fusciceps robustus, �2= infinity
8 df, P < 0.00000; A. belzebuth belzebuth, �2
= 18.7, 8 df, P = 0.0167; and A. chamek,
�2= infinity, 8 df, P < 0.00000) (Table 4). For the first species, the markers showing
homozygous excess were AP74, D5S117 and D8S165. However, if the two A. fusci-
ceps robustus populations studied were analyzed separately, the first population(Chocó) was at H-W E at all of the markers studied separately or grouped together
(�2
= 12.7, 8 df, P = 0.1223). In contrast, all of the markers that were analyzed in thesecond population (Antioquia, Sucre, Córdoba and Atlántico) significantly deviated
from H-W E (�2
= infinite, 8 df, P < 0.000000). Knowledge of this result is critical inorder to understand some of the evolutionary events within A. f. robustus, as we willlater discuss. The markers AP74 and D8S165 in A. b. belzebuth, and all four poly-
Primate Report 73, July 2006 13
M. Ruiz-García et al.: Microsatellite DNA and craniometric data in Ateles

morphic markers in A. chamek showed significant homozygous excess. On the otherhand, A. hybridus and A. geoffroyi did not have any microsatellites with significantdeviations from H-W E. However, when the results were analyzed by locus taken si-multaneously, none were in H-W E. This provides evidence of reproductive isolationamong these populations. Similarly, there was no evidence of H-W E when all loci
and all species were analyzed together (�2
= infinity, 8 df, P < 0.00000). Neither sig-nificant cases of gametic disequilibrium among microsatellite pairs were discoveredwithin each species studied nor significant cases of gametic disequilibrium for eachmicrosatellite pair across all species studied taken together were detected with theFisher´s method.
Table 4: Deviations from Hardy-Weinberg equilibrium for all Atetes taxa studiedwith exact tests. Fis-W & C = Fis with the WEIR and COCKERHAM (1984) proce-dure. Fis – R & H = Fis with the ROBERTSON and HILL (1984) procedure. * Signifi-cant probabilities at p < 0.05. In all cases, the significant values were by homozygousgenotype excess.
Species Marker Hardy-Weinberg Equilibrium Test
Probality value Fis-W & C Fis- R & H
A. fusciceps
robustus
AP 68
AP 74
AP 40
D5S117
D8S165
0.266 ± 0.0025
0.000 ± 0.0000*
--
0.000 ± 0.0000*
0.014 ± 0.0013*
-0.036
0.384
--
0.302
0.149
0.092
0.181
--
0.385
0.120
All markers taken together (Fisher’s method): �2= 8; df= 8; P= 0.000001*
Ateles b.
belzebuth
AP 68
AP 74
AP 40
D5S117
D8S165
0.0588 ± /
0.0387 ± 0.002*
--
0.8130 ± 0.0021
0.0476 ± /*
0.652
0.411
--
0.125
0.583
0.558
0.286
--
0.107
0.516
All markers taken together (Fisher’s method): �2= 18.7; df= 8 ; P= 0.0167*
Ateles hybridus AP 68
AP 74
AP 40
D5S117
D8S165
1 ± /
0.5954 ± /
--
0.7256 ± 0.0023
0.2739 ± 0.0033
0.066
0.136
--
-0.179
-0.070
0.050
0.096
--
-0.143
-0.055
All markers taken together (Fisher’s method): �2= 4.3; df= 8 ; P= 0.8321
Ateles chamek AP 68
AP 74
AP 40
D5S117
D8S165
0.0085 ± /*
0.0182 ± 0.001*
--
0.0000 ± 0.000*
0.0006 ± 0.000*
0.461
0.444
--
0.673
0.596
0.579
0.430
--
0.755
0.606
All markers taken together (Fisher’s method): �2= 8; df= 8 ; P= High. Sign.*
14 Primate Report 73, July 2006
M. Ruiz-García et al.: Microsatellite DNA and craniometric data in Ateles
Species Marker Hardy-Weinberg Equilibrium Test
Probality value Fis-W & C Fis- R & H
Ateles geoffroyi
vellerosus
AP 68
AP 74
AP 40
D5S117
D8S165
0.1715 ± /
0.0996 ± 0.0017
--
0.4667 ± /
--
0.355
0.029
--
0.273
--
0.220
0.011
--
0.250
--
All markers taken together (Fisher’s method): �2= 9.7; df= 6 ; P= 0.1396
All locus, all populations (Fisher’s method): �2= 8; df= 32 ; P= High. Sign.**
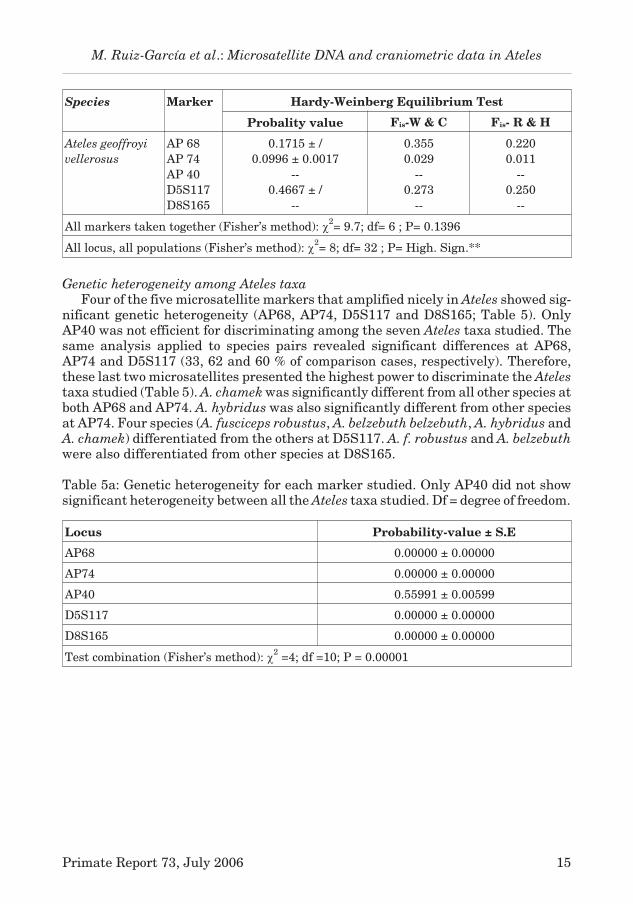
Genetic heterogeneity among Ateles taxa
Four of the five microsatellite markers that amplified nicely in Ateles showed sig-nificant genetic heterogeneity (AP68, AP74, D5S117 and D8S165; Table 5). OnlyAP40 was not efficient for discriminating among the seven Ateles taxa studied. Thesame analysis applied to species pairs revealed significant differences at AP68,AP74 and D5S117 (33, 62 and 60 % of comparison cases, respectively). Therefore,these last two microsatellites presented the highest power to discriminate the Ateles
taxa studied (Table 5). A. chamek was significantly different from all other species atboth AP68 and AP74. A. hybridus was also significantly different from other speciesat AP74. Four species (A. fusciceps robustus, A. belzebuth belzebuth, A. hybridus andA. chamek) differentiated from the others at D5S117. A. f. robustus and A. belzebuth
were also differentiated from other species at D8S165.
Table 5a: Genetic heterogeneity for each marker studied. Only AP40 did not showsignificant heterogeneity between all the Ateles taxa studied. Df = degree of freedom.
Locus Probability-value ± S.E
AP68 0.00000 ± 0.00000
AP74 0.00000 ± 0.00000
AP40 0.55991 ± 0.00599
D5S117 0.00000 ± 0.00000
D8S165 0.00000 ± 0.00000
Test combination (Fisher’s method): �2
=4; df =10; P = 0.00001
Primate Report 73, July 2006 15
M. Ruiz-García et al.: Microsatellite DNA and craniometric data in Ateles

Table 5b: Genetic heterogeneity among Ateles species pairs for each one of the mark-ers studied. A, S ,B, C, At = Population of Ateles fusciceps robustus from Antioquia,Sucre, Bolivar, Córdoba and Atlántico Departments of Colombia. *Significant hete-rogeneity (P < 0.05).
Ateles
fusciceps
robustus
Chocó
Ateles
fusciceps
robustus
A,S,B,C,At
Ateles
belzebuth
belzebuth
Ateles
hybridus
Ateles
chamek
Ateles
geoffroyi
vellerosus
Ateles
paniscus
paniscus
Ateles
fusciceps
fusciceps
Ateles fusciceps robustus Chocó
AP68
AP74
AP40
D5S117
D8S165
---
---
---
---
---
0.00172*
0.00000*
---
0.01870*
0.01855*
0.00692*
0.00002*
---
0.01906*
0.06948
0.00722*
0.00000*
---
0.00014*
0.00397*
0.00093*
0.01837*
0.22208
0.00005*
0.01934*
0.02152*
0.12310
---
0.00015*
0.01666*
---
0.39938
---
0.00308*
---
0.32293
0.54870
---
0.05860
---
Ateles fusciceps robustus A, S, B, C, AT
AP68
AP74
AP40
D5S117
D8S165
---
---
---
---
---
---
---
---
---
---
0.19828
0.19294
---
0.00163*
0.82151
0.26439
0.41610
---
0.00000*
0.10517
0.00001*
0.00064*
0.05698
0.00000*
0.00000*
0.12044
0.00001*
---
0.00002*
0.00302*
---
0.13475
---
0.00042*
---
0.16180
0.10838
---
0.21391
---
Ateles belzebuth belzebuth
AP68
AP74
AP40
D5S117
D8S165
---
---
---
---
---
---
---
---
---
---
---
---
---
---
---
0.83458
0.00480*
---
0.04576*
0.00547*
0.00013*
0.03268*
0.28500
0.00027*
0.01424*
0.00426*
0.00029*
---
0.16029
0.01168*
---
0.10454
---
0.01302*
---
0.05300
0.18252
---
1.00000
---
Ateles hybridus
AP68
AP74
AP40
D5S117
D8S165
---
---
---
---
---
---
---
---
---
---
---
---
---
---
---
---
---
---
---
---
0.00096*
0.00002*
0.28552
0.00000*
0.10717
0.02041*
0.00000*
---
0.10356
0.09352
---
0.00595*
---
0.01970*
---
0.19422
0.00596*
---
0.03229*
---
Ateles chamek
AP68
AP74
AP40
D5S117
D8S165
---
---
---
---
---
---
---
---
---
---
---
---
---
---
---
---
---
---
---
---
---
---
---
---
---
0.04814*
0.00017*
---
0.00570*
0.26708
---
0.09781
---
0.01150*
---
1.00000
0.10084
---
0.19456
---
Ateles geoffroyi vellerosus
AP68
AP74
AP40
D5S117
D8S165
---
---
---
---
---
---
---
---
---
---
---
---
---
---
---
---
---
---
---
---
---
---
---
---
---
---
---
---
---
---
---
1.00000
---
0.14249
---
0.56507
0.59867
1.00000
0.57123
---
16 Primate Report 73, July 2006
M. Ruiz-García et al.: Microsatellite DNA and craniometric data in Ateles

Ateles
fusciceps
robustus
Chocó
Ateles
fusciceps
robustus
A,S,B,C,At
Ateles
belzebuth
belzebuth
Ateles
hybridus
Ateles
chamek
Ateles
geoffroyi
vellerosus
Ateles
paniscus
paniscus
Ateles
fusciceps
fusciceps
Ateles paniscus paniscus
AP68
AP74
AP40
D5S117
D8S165
---
---
---
---
---
---
---
---
---
---
---
---
---
---
---
---
---
---
---
---
---
---
---
---
---
---
---
---
---
---
---
---
---
---
---
---
---
---
0.33275
---
Ateles fusciceps fusciceps
AP68
AP74
AP40
D5S117
D8S165
---
---
---
---
---
---
---
---
---
---
---
---
---
---
---
---
---
---
---
---
---
---
---
---
---
---
---
---
---
---
---
---
---
---
---
---
---
---
---
---
Table 5c: Genetic heterogeneity per species pairs for all the DNA microsatellitesstudied simultaneosly. *Significant probabilities at P < 0.05. **Significant probabil-ities with a multiple Bonferroni test (P < 0.002381). Probability values obtained af-ter 10.000 permutations.
Species Ateles
fusciceps
robustus
Ateles
belzebuth
belzebuth
Ateles
hybridus
Ateles
chamek
Ateles
geoffroyi
vellerosus
Ateles
paniscus
paniscus
Ateles
fusciceps
fusciceps
Ateles
fusciceps
robustus
--- 0.02850* 0.00010** 0.00010** 1.00000 0.84730 0.76700
Ateles
belzebuth
belzebuth
--- --- 1.00000 1.00000 1.00000 0.36570 0.44000
Ateles
hybridus--- --- --- 1.00000 0.99900 0.36320 0.13210
Ateles
chamek--- --- --- --- 0.74050 0.40310 0.03460*
Ateles
geoffroyi
vellerosus
--- --- --- --- --- 0.59940 0.00010**
Ateles
paniscus
paniscus
--- --- --- --- --- --- 0.00010**
Ateles
fusciceps
fusciceps
--- --- --- --- --- --- ---
Primate Report 73, July 2006 17
M. Ruiz-García et al.: Microsatellite DNA and craniometric data in Ateles

Other results were collected upon analysis of the two A. f. robustus populationsseparately. For example, at AP68 the first A. f. robustus population significantly dif-fered from the second population as well as the remaining Ateles taxa with the ex-ception of A. f. fusciceps.
In contrast, the second A. f. robustus population did not significantly differ fromA. belzebuth belzebuth, A. hybridus and A. geoffroyi. Both A. f. robustus populations,also significantly differed at AP74. The first populations was also significantly dif-ferent from A. b. belzebuth, A. hybridus and A. chamek but not from A. f. fusciceps
nor A. geoffroyi. Again, in contrast, the second A. f. robustus population did not differfrom A. b. belzebuth or A. hybridus, did it did differ from A. geoffroyi. At D5S117,both A. f. robustus populations significantly differed. Also, both populations weresignificantly different from the remaining Ateles taxa studied with the exception ofA. f. fusciceps. Both A. f. robustus populations significantly diverged at D8S165. Thefirst population diverged from A. hybridus, A. chamek and A. geoffroyi, while the sec-ond one did not differentiate from A. hybridus. Therefore, globally, both A. f. robus-
tus populations were dramatically different from each other with the first differenti-ated from A. b. belzebuth and A. hybridus, whereas the second one was compara-tively similar with these taxa. The relationships of A. geoffroyi with the two A. f. ro-
bustus populations were variable depending on the markers used. When the theoret-ical gene flow was measured among all the Ateles taxa via the private allele methodof BARTON and SLATKIN (1986), the value was considerably small (Nm = 0.688),which supports that these Ateles taxa are globally isolated reproductive units.
The expected gene diversity at the global genus (Ht = 0.675) was slightly lowerthan the same value obtained for other Neotropical primates such as Alouatta andLagothrix (Table 6 and 7). The average gene diversity within each Ateles taxa stud-ied was only slightly lower than the previous statistic (Hs = 0.604), which revealedthat each Ateles taxa on average has a relatively high level of total gene diversity atthe global genus. Although the genetic heterogeneity was significant (Gst = 0.105-0.123, depending on the method of calculation), it was relatively lower than that ob-tained in other Neotropical primate genera. The global F-statistics jackknifing over
loci values (Fit = 0.318 � 0.04, Fis = 0.256 � 0.039) showed a significant homozygousexcess at the global level of genus as well as within the species studied. Meanwhile,the significant but relatively small Fst value (0.084), indicates that the microsatellitedivergence within the Ateles genus is limited because the divergence time amongspecies is small (recent speciation) or some kind of constrictive natural selection isacting upon all or a fraction of the microsatellites studied. The significant homozy-gous excess supports that the major parts of the populations studied are reproduc-tively isolated from each other. Furthermore, the Wahlund effect may have helpedproduced homozygous excess inside some taxa in agreement with H-W analyses. All
individual values of Fis were significant for a Bonferroni adjusted level of ’ =0.00143 with the exception of AP68 and AP40. Also, all the Fit statistics were signifi-cant with the exception of AP40. For Fst, the situation was the same when an exactG-test, random mating within samples and 10,000 randomizations of alleles overallsamples (only AP40 was not significant) were used. On the other hand, there was nosignificant heterogeneity in AP40 and D8S165 when 10,000 randomizations, non-random mating and a log-likelihood G test were used.
18 Primate Report 73, July 2006
M. Ruiz-García et al.: Microsatellite DNA and craniometric data in Ateles

Table 6: Nei´s gene diversity analysis for five Microsatellite markers for all Ateles
taxa studied. Ho = Observed heterozygosity; Hs = Average expected heterozygositywithin species; Ht = Global expected heterozygosity for all the genera taken as at all.Dst = absolute genetic differentiation between the Ateles species studied. Gst = Rela-tive genetic differentiation between the Ateles species regard to the total gene diver-sity found at the genera. Ht
´, Dst´ and Gst´ are the same statistics corrected by sample
size. Gis = deviations from Hardy-Weinberg equilibrium within species.
Markers Ho Hs Ht Dst Dst’ Ht’ Gst Gst’ Gis
AP68 0.302 0.472 0.583 0.110 0.132 0.605 0.189 0.219 0.361
AP74 0.674 0.827 0.902 0.075 0.088 0.915 0.083 0.096 0.185
AP40 0.100 0.091 0.098 0.007 0.009 0.100 0.076 0.093 -0.103
D5S117 0.603 0.825 0.911 0.086 0.100 0.925 0.094 0.108 0.270
D8S165 0.657 0.804 0.880 0.076 0.095 0.899 0.087 0.106 0.294
Overall 0.449 0.604 0.675 0.071 0.085 0.689 0.105 0.123 0.256
Table 7a: Estimation of the Wright F-Statistics for each one of the microsatellitesanalyzed.1Assuming Random Mating within simples (G-test 10.000 randomisa-tions). 2Not assuming Random Mating (log-likelihood G-test). Except certain casesfor AP40, all other cases are significant.
Locus Fit P-value Fis P-value Fst P-value1
P-value2
AP68 0.235 0.0001 0.1450.0333
-0.02080.106 0.0001 0.0001
AP74 0.393 0.0001 0.332 0.0001 0.092 0.0001 0.0010
AP40 0.2370.0552
-0.0195-0.289 0.9999 0.408
0.0557
-0.0207
0.0181
-0.0143
D5S117 0.364 0.0001 0.302 0.0001 0.089 0.0001 0.0001
D8S165 0.253 0.0001 0.212 0.0001 0.052 0.0001 0.0174
Overall loci 0.317 0.0001 0.253 0.0001 0.085 0.00010 0.0001
Table 7b: Average F-statistics values by means of jackknifing over populations foreach marker.
Locus Fit Fis Fst
AP68 0.146 ± 0.233 0.054 ± 0.214 0.082 ± 0.065
AP74 0.397 ± 0.028 0.402 ± 0.113 0.024 ± 0.127
AP40 0.383 ± 0.297 -0.605 ± 0.234 0.759 ± 0.396
D5S117 0.370 ± 0.077 0.302 ± 0.085 0.098 ± 0.031
D8S165 0.191 ± 0.125 0.156 ± 0.123 0.039 ± 0.020
Primate Report 73, July 2006 19
M. Ruiz-García et al.: Microsatellite DNA and craniometric data in Ateles

Table 7c: Average F-statistics by means of jackknifing over loci and 99% confidenceinterval by means of bootstrapping.
Fit Fis Fst
Jakknifing over loci 0.318 ± 0.040 0.256 ± 0.039 0.084 ± 0.013
Bootstrapping over loci 99 %
confidence interval0.235 – 0.391 0.128 – 0.324 0.058 – 0.120
Recent bottlenecks, historical effective numbers and microsatellite mutation models
There was no evidence of a recent bottleneck for any of the species studied, atleast not for the small number of loci analyzed (Table 8). The Step-Wise mutationmodel did support the occurrence of an event for A. f. robustus that was the reverse ofa bottleneck (T2 = -2.5, P = 0.00621). This could indicate a recent population expan-sion, gene flow among different gene pools or Wahlund effect within the samplestudied of this species. Therefore, the analysis was repeated with the two A. f.
robustus populations separately. The findings for the first population (Chocó) wereunique because the analyses (the standardized differences test and the Wilcoxontest) of the infinite mutation allele and the step-wise mutation models’ results sup-ported that the population had experienced a recent bottleneck. In contrast, thestandardized differences test with the step-wise mutation model applied to secondA. f. robustus population supported an event opposite to a recent bottleneck. Thisalong with other results, provides evidence that this A. f. robustus population has ex-perienced gene flow with other Ateles taxa as will be discussed later.
Table 8: Recent bottleneck analysis employing the Cornuet and Luikart (1996) pro-cedure for all Ateles taxa studied. I. A. M = Infinite Allele Mutation Model. S. M. M =Step-Wise Mutation Model. Ko = Number of alleles found. He = Expected hetero-zygosity measured from allele frequencies. Heq = Expected heterozygosity from thenumber of alleles determined. S.D. = Standard Deviation for the last measure. Prob= Probability of significant differences among He and Heq. * Significant difference atP < 0.05 corresponding to a recent bottleneck event. ** Significant differences at P <0.05 corresponding to some event contrary to a recent bottleneck. Only A. fusciceps
robustus from Chocó showed some trends to cross a recent bottleneck. A, B, S, C, At =Population of Ateles fusciceps robustus from Antioquia, Bolivar, Sucre, Córdoba andAtlántico Departments of Colombia.
Under the I.A.M Under the S.M.M
Ko He Heq S.D. Prob Heq S.D. Prob
Ateles fusciceps robustus
AP68
AP74
AP40
D5S117
D8S165
5
17
1
7
11
0.552
0.850
---
0.739
0.857
0.492
0.846
---
0.614
0.755
0.167
0.052
---
0.138
0.091
0.4362
0.4270
---
0.1718
0.0556
0.638
0.911
---
0.752
0.855
0.099
0.015
---
0.064
0.031
0.1676
0.0040**
---
0.3280
0.4686
20 Primate Report 73, July 2006
M. Ruiz-García et al.: Microsatellite DNA and craniometric data in Ateles

Under the I.A.M Under the S.M.M
Ko He Heq S.D. Prob Heq S.D. Prob
SIGN TEST: I.A.M, P= 0.127; S.M.M, P= 0.195
STANDARDIZED DIFFERENCES TEST: I.A.M, T2= 1.236, P= 0.108; S.M.M, T2= -2.500,
P= 0.006**
WILCOXON TEST: I.A.M: Probability (one tail for H excess)= 0.031*; S.S.M: Probability
(one tail for H excess)= 0.968
NORMAL L-SHAPED DISTRIBUTION
Ateles fusciceps robustus (Chocó)
AP68
AP74
AP40
D5S117
D8S165
3
9
1
4
7
0.681
0.905
---
0.746
0.889
0.435
0.850
---
0.560
0.807
0.154
0.047
---
0.135
0.059
0.0212*
0.0470*
---
0.0270*
0.0136
0.494
0.881
---
0.632
0.844
0.138
0.026
---
0.100
0.036
0.0436*
0.1742
---
0.0800
0.0634
SIGN TEST: I.A.M, P= 0.120, S.M.M, P= 0.116
STANDARDIZED DIFFERENCES TEST: I.A.M, T2= 2.777, P= 0.002*, S.M.M, T2= 2.347,
P= 0.009*
WILCOXON TEST: I.A.M: Probability (one tail for H excess)= 0.031*, S.S.M: Probability
(one tail for H excess)= 0.031*
NORMAL L-SHAPED DISTRIBUTION
Ateles fusciceps robustus (A, B, S, C, At)
AP68
AP74
AP40
D5S117
D8S165
5
15
1
6
10
0.505
0.789
---
0.734
0.846
0.504
0.834
---
0.578
0.747
0.163
0.057
---
0.146
0.090
0.4226
0.1724
---
0.1144
0.0720
0.644
0.901
---
0.712
0.842
0.099
0.018
---
0.075
0.034
0.0900
0.0002**
---
0.4624
0.4692
SIGN TEST: I.A.M, P= 0.467; S.M.M, P= 0.540
STANDARDIZED DIFFERENCES TEST: I.A.M, T2= 0.685, P= 0.2466; S.M.M, T2= -3.650,
P= 0.0001**
WILCOXON TEST: I.A.M: Probability (one tail for H excess)= 0.093; S.S.M: Probability
(one tail for H excess)= 0.906
NORMAL L-SHAPED DISTRIBUTION
Ateles belzebuth belzebuth
AP68
AP74
AP40
D5S11
D8S165
3
7
1
6
4
0.307
0.825
---
0.850
0.758
0.473
0.824
---
0.775
0.666
0.142
0.052
---
0.069
0.094
0.2344
0.4296
---
0.1034
0.1824
0.525
0.854
---
0.813
0.706
0.130
0.035
---
0.046
0.077
0.1262
0.1804
---
0.2478
0.3204
SIGN TEST: I.A.M, P= 0.455; S.M.M, P= 0.518
STANDARDIZED DIFFERENCES TEST: I.A.M, T2= 0.452, P= 0.325; S.M.M, T2= -0.515,
P= 0.303
WILCOXON TEST: I.A.M: Probability (one tail for H excess)= 0.437; S.S.M: Probability
(one tail for H excess)= 0.906
NORMAL L-SHAPED DISTRIBUTION
Primate Report 73, July 2006 21
M. Ruiz-García et al.: Microsatellite DNA and craniometric data in Ateles

Under the I.A.M Under the S.M.M
Ko He Heq S.D. Prob Heq S.D. Prob
Ateles hybridus
AP68
AP74
AP40
D5S117
D8S165
4
3
1
6
7
0.458
0.384
---
0.858
0.853
0.540
0.414
---
0.774
0.779
0.140
0.161
---
0.069
0.071
0.2632
0.4146
---
0.0522
0.0940
0.619
0.474
---
0.814
0.825
0.104
0.144
---
0.046
0.043
0.0880
0.2650
---
0.1522
0.2938
SIGN TEST: I.A.M, P= 0.538; S.M.M, P= 0.538
STANDARDIZED DIFFERENCES TEST: I.A.M, T2= 0.743, P= 0.228; S.M.M, T2= -0.277,
P= 0.390
WILCOXON TEST: I.A.M: Probability (one tail for H excess)= 0.156; S.S.M: Probability
(one tail for H excess)= 0.562
NORMAL L-SHAPED DISTRIBUTION
Ateles chamek
AP68
AP74
AP40
D5S117
D8S165
3
6
2
8
9
0.579
0.864
0.333
0.852
0.874
0.394
0.827
0.436
0.789
0.850
0.167
0.048
0.112
0.068
0.046
0.1376
0.2908
1.0000
0.1448
0.3616
0.459
0.848
0.453
0.840
0.881
0.152
0.036
0.113
0.037
0.026
0.2394
0.4596
0.4608
0.4714
0.3400
SIGN TEST: I.A.M, P= 0.254; S.M.M, P= 0.643
STANDARDIZED DIFFERENCES TEST: I.A.M, T2= 1.072, P= 0.141; S.M.M, T2= 0.116,
P= 0.453
WILCOXON TEST: I.A.M: Probability (one tail for H excess)= 0.078; S.S.M: Probability
(one tail for H excess)= 0.406
NORMAL L-SHAPED DISTRIBUTION
Ateles geoffroyi vellerosus
AP68
AP74
AP40
D5S117
D8S165
3
6
0
4
2
0.588
0.835
---
0.867
0.500
0.429
0.796
---
0.835
0.546
0.156
0.061
---
0.033
0.075
0.1784
0.3802
---
0.5304
1.0000
0.487
0.827
---
0.840
0.553
0.142
0.044
---
0.033
0.077
0.2782
0.6198
---
0.6014
1.0000
SIGN TEST: I.A.M, P= 0.275; S.M.M, P= 0.362
STANDARDIZED DIFFERENCES TEST: I.A.M, T2= 0.988, P= 0.161; S.M.M, T2= 0.517,
P= 0.302
WILCOXON TEST: I.A.M: Probability (one tail for H excess)= 0.062; S.S.M: Probability
(one tail for H excess)= 0.093
NORMAL L-SHAPED DISTRIBUTION
A first simulation coalescence method was used to determine the likelihood �
value (= 4 Ne�) and to estimate long historical effective numbers. Two extreme muta-tion rates that were previously determined for dinucleotide microsatellites (5.6 x 10
-4
and 7 x 10⁻⁵, respectively) were used. The first A. f. robustus population had the high-
est effective number showing values that oscillated from 9,132 to 73,054 individuals
22 Primate Report 73, July 2006
M. Ruiz-García et al.: Microsatellite DNA and craniometric data in Ateles

(Fig. 1). The second A. f. robustus population (Chocó) presented lower effective num-bers than the first population (5,946-47,570 individuals). However, when both popu-lations were studied simultaneously, these values were incremented (11,887-95,097individuals), which supports that these two A. f. robustus populations have differentgene pool compositions. This finding is probably due to the second population havinga mixed influence. A. hybridus (3,310-26,481 individuals) and A. geoffroyi (3,560-28,480 individuals) had the lowest effective numbers while other Ateles speciesshowed intermediate values.
The second coalescence method was also used to determine the historical effec-tive numbers in the Ateles taxa studied (Table 9). The long effective numbers werevery similar to those obtained with the previous method except for the magnitude ofthe effective numbers in A. belzebuth. This second method offered effective numbersfor this species that were higher than the first method. The two species with the low-est effective numbers were again A. hybridus (2,642-21,137 individuals) and A.
geoffroyi (2,900-23,199 individuals). An advantage of the second method is that it
calculates � for a multi-step mutation model and determines the most precise andsignificant multiple mutation percentage for each microsatellite analyzed as well asdetermines significant differences among the mutation rates of the microsatellitesstudied.
Primate Report 73, July 2006 23
M. Ruiz-García et al.: Microsatellite DNA and craniometric data in Ateles
Ateles fusciceps (total population)
0.000
0.050
0.100
0.150
0.200
0.250
0.300
0.350
0.400
0.00 50.00 100.00 150.00 200.00 250.00 300.00
theta
likelih
oo
d AP68
AP74
D5S117
D8S165
Average effective
number
12.000-95.000
Fig. 1: Coalescence simulation to obtain the most likelihood � value for four DNAMicrosatellites in seven Ateles populations. Throughout the most likelihood values
of �, the average effective numbers were estimated using two probable mutationrates (5.6 x 10⁻⁴ and 7 x 10⁻⁵, respectively).

24 Primate Report 73, July 2006
M. Ruiz-García et al.: Microsatellite DNA and craniometric data in Ateles
Ateles fusciceps (Choco population)
0.000
0.050
0.100
0.150
0.200
0.250
0.300
0.350
0.400
0.450
0.0000 100.0000 200.0000 300.0000
theta
likelih
oo
d AP68
AP74
D5S117
D8S165
Average effective
number
6.000-47.000
Ateles fusciceps(Cordoba - Alto Sinu - Antioquia)
0.000
0.050
0.100
0.150
0.200
0.250
0.300
0.350
0.00 50.00 100.00 150.00 200.00 250.00 300.00
theta
likelih
oo
d AP68
AP74
D5S117
D8S165
Average effective
number
9.000-73.000
Ateles belzebuth
0.000
0.050
0.100
0.150
0.200
0.250
0.300
0.350
0.400
0.450
0.00 50.00 100.00 150.00 200.00 250.00 300.00
theta
likelih
oo
d AP68
AP74
D5S117
D8S165
Average effective
number
4.000-36.000

Primate Report 73, July 2006 25
M. Ruiz-García et al.: Microsatellite DNA and craniometric data in Ateles
Ateles hybridus
0.000
0.100
0.200
0.300
0.400
0.500
0.00 50.00 100.00 150.00 200.00 250.00 300.00
theta
likelih
oo
d AP68
AP74
D5S117
D8S165
Average effective
number
3.000-26.000
Ateles chamek
0.000
0.100
0.200
0.300
0.400
0.500
0.00 50.00 100.00 150.00 200.00 250.00 300.00
theta
likelih
oo
d AP68
AP74
D5S117
D8S165
Average effective
number
8.000-61.000
Ateles geoffroyi
0.000
0.100
0.200
0.300
0.400
0.500
0.600
0.00 200.00 400.00 600.00 800.00 1000.00
theta
likelih
oo
d AP68
AP74
D5S117
D8S165
Average effective
number
3.000-28.000

Table 9: Estimation of � (= 4 Ne�) for different mutation models (uni-step andmulti-step) affecting to the Microsatellite markers studied. Percentages of multiplemutations and their respective significances are shown. Also possible effective num-bers are shown for two possible mutation rates per generation (Ne1 = 5.6 x 10⁻⁴ andNe2 = 7 x 10⁻⁵). * Siginificant values at P < 0.05. A, B, S, C, At = The A. fusciceps
robustus population from Antioquia, Bolivar, Sucre, Córdoba and Atlántico Depart-ments from Colombia. Ateles hybridus and Ateles geoffroyi showed the lowest effec-tive numbers.
Markers UNI-STEP MODEL MULTI-STEP MODEL
�0 � ln likeli-
hood� ln likeli-
hood
multiple
mutation%�2
Ateles fusciceps robustus (Chocó)
AP86
AP74
D5S117
D8S165
8.507
19.030
1.181
13.758
10.619
± 7.618
2.5096
36.3478
1.8068
18.4360
14.775
± 16.303
-12.3055
-19.3931
-6.50539
-15.8981
Ne1=6.596
Ne2=52.768
1.7015
25.5006
1.8069
13.2078
10.5542
± 11.333
-12.2219
-21.6175
-6.5071
-16.8726
Ne1=4.712
Ne2=37.693
20
5
0
5
7.5
± 8.66
0.1670
4.4480*
0.0010
1.9489
Ateles fusciceps robustus (A, B, S, C, At)
AP86
AP74
D5S117
D8S165
1.504
96.789
2.615
7.643
27.1377
± 46.5109
3.30166
65.3327
4.24917
16.7767
22.4150
± 29.2634
-18.0948
-106.6797
-17.2144
-23.6038
Ne1=10.007
Ne2=80.053
3.1588
92.9177
4.00075
10.2418
27.5814
± 43.6718
-16.2754
-120.4659
-17.1448
-25.3913
Ne1=12.313
Ne2=98.505
0.075
0.075
0
0
3.75
± 4.33
3.6387
27.5723*
0.1391
3.5751
Ateles belzebuth
AP86
AP74
D5S117
D8S165
1.882
88.133
9.192
7.939
26.7865
± 41.0220
2.1647
76.2353
10.5704
4.6048
23.3938
± 35.4042
-9.6803
-31.6831
-12.2485
-10.0032
Ne1=10.444
Ne2=83.549
1.0918
51.1173
17.5561
4.6048
18.5925
± 22.809
-8.2923
-27.0697
-11.6891
-10.1035
Ne1=8.300
Ne2=66.402
0.35
0.10
0
0
11.25
± 16.52
2.7759
9.2267*
1.1187
0
Ateles hybridus
AP86
AP74
D5S117
D8S165
1.545
5.483
15.700
5.368
7.024
± 6.0665
3.0977
3.18
6.123
11.2727
5.9183
± 3.8369
-11.7281
-15.8055
-16.2723
-11.7853
Ne1=2.642
Ne2=21.137
1.4832
1.0966
9.1060
14.3325
6.5046
± 6.3902
-11.4878
-9.1562
-16.0074
-11.3314
Ne1=2.904
Ne2=23.230
0.225
0.45
0
0
16.875
± 0.21554
0.4805
13.2985
0.5297
0.9078
Ateles chamek
AP86
AP74
D5S117
D8S165
0.814
45.864
6.593
0.828
13.5247
± 21.730
1.4768
30.9580
8.2088
1.4236
10.5167
± 13.995
-7.2371
-16.5841
-12.5021
-6.5843
Ne1=4.695
Ne2=37.560
1.5541
44.0291
6.3297
1.4236
13.3341
± 20.590
-7.2289
-16.4725
-12.3658
-6.5876
Ne1=5.953
Ne2=47.622
0
0.025
0
0
0.625
± 1.25
0.0164
0.2232
0.2725
0.0065
26 Primate Report 73, July 2006
M. Ruiz-García et al.: Microsatellite DNA and craniometric data in Ateles

Markers UNI-STEP MODEL MULTI-STEP MODEL
�0 � ln likeli-
hood� ln likeli-
hood
multiple
mutation%�2
Ateles geoffroyi vellerosus
AP86
AP74
D5S117
D8S165
0.828
5.769
5.6
4.5
4.1743
± 2.3007
1.4236
11.5673
9.10
3.8925
6.4958
± 4.6550
-6.5843
-10.7442
-5.8580
-4.3529
Ne1=2.900
Ne2=23.199
1.4236
9.9231
9.632
4.32
6.3247
± 4.1604
-6.5876
-10.8019
-5.8704
-4.3748
Ne1=2.824
Ne2=22.588
0
0
0
0
0
0.0033
0.1154
0.0247
0.0439
A. geoffroyi and A. hybridus had the lowest (0 %) and highest (16.88 %) multiplemutation percentages respectively and no species had overall average values thatwere significantly different from the uni-step mutation model (0%). Only AP74 devi-ated from the uni-step mutation model in the two A. fusciceps robustus populations
(Chocó -5 % with �2
= 4.45, 1 df, P < 0.05, and Northern Atlantic -7.5 % with �2
=
27.572, 1 df, P < 0.001, respectively), in A. belzebuth (10 % with �2
= 9.23, 1 df, P <
0.01) and in A. hybridus (45 % with �2= 13.29, 1 df, P < 0.01). No other microsatellite
nor other Ateles species deviated from the uni-step mutation model. In fact, the aver-age q calculated with the uni-step mutation model for each Ateles species was verysimilar to the average q calculated with the multi-step mutation model. Therefore,no important differences in effective numbers were detected with a uni-step muta-tion model (easier to calculate compared to a multiple mutation model), at least notin Ateles with the microsatellites included in this study. Table 10 shows the differ-ences in mutation rates among microsatellite pairs in each one of the Ateles speciesstudied for the uni-step and the multi-step mutation models. These models had theexact same results for the A. f. robustus population of Chocó. All of the micro-satellites yielded significantly different mutation rates from each other. For theChocó population, the order of microsatellites that depicted decreasing mutationrates was AP74 > D8S165 > AP68 > D5S117. The results of the uni-step and for themulti-step mutation models were identical for the Northern Atlantic A. f. robustus
population (Antioquia, Sucre, Córdoba, Atlántico). There were some minor differ-ences between these two A. f. robustus populations. For example, the microsatellitemutation rate in decreasing order for the Northern Atlantic population was AP74 >D8S165 > D5S117 = AP68, with the last two values not statistically different. Theglobal A. f. robustus sample had the same trends as that of the Northern Atlantic A.
f. robustus population. For the A. belzebuth, there were no differences between theuni-step and the multi-step mutation models, as in the previous cases. The decreas-ing order of mutation rates for this species was: AP74 > D5S117 > D8S165 = AP68,with no significant difference between the two last markers. Therefore, several dy-namic differences in mutations were detected between A. fusciceps and A. belzebuth.Different mutation patterns were observed for A. hybridus compared to the previousspecies. For example, the mutation rates of microsatellites D5S117 and AP74 werenot significantly different with the uni-step model, but D5S117 was significantlygreater than AP74 with the multi-step mutation model. The mutation rate ranking(D8S165 > D5S117 > AP74 > AP68) was also different from the previous mentionedspecies. For A. chamek, similar results were obtained for both mutation models. The
Primate Report 73, July 2006 27
M. Ruiz-García et al.: Microsatellite DNA and craniometric data in Ateles

mutation ranking order was: AP74 > D5S117 > D8S165 > AP68, and was more simi-lar to A. belzebuth than to A. hybridus. Finally, for A. geoffroyi, the results for bothmutation models were similar. The mutation ranking order (AP74 > D5S117 >D8S165 = AP68) was identical to that discovered in A. belzebuth, relatively similarto that detected in A. fusciceps, but dissimilar to that found in A. hybridus. Perhapsthe mutation rate rankings provide phylogenetic signatures that can be used to dif-ferentiate among Ateles species, such as in this case, where A. hybridus is differentfrom the other Ateles species studied?
Table 10: �2 differences in the mutation rates per generation between the Ateles taxastudied for uni-step (1) and multi-step (2) mutation models for all possible micro-satellite pairs. *Significant Differences at P < 0.05. Most of the mutation rates com-parisons are significant. A, B, S, C, At = The A. fusciceps robustus population fromAntioquia, Bolivar, Sucre, Córdoba and Atlántico Departments from Colombia.
MARKERS
AP68 AP74 D5S117 D8S165
AP68
Ateles fusciceps robustusChocó
---1 14.17*2 18.79*
11.60*
11.42*
7.18*
9.30*
Ateles fusciceps robustus
(A, B, S, C, At)---
177.16*
208.38*
1.76
1.73
11.01*
18.23*
Ateles belzebuth ---44.00*
37.55*
5.13*
6.79*
0.64
3.62
Ateles hybridus ---8.15*
4.66*
9.08*
9.03*
0.11
0.31
Ateles chamek ---18.69*
18.48*
10.53*
10.27*
1.30
1.28
Ateles geoffroyi vellerosus ---8.31*
8.42*
4.46*
4.42*
1.45
1.43
AP74
Ateles fusciceps robustus
Chocó --- ---25.77*
30.22*
6.98*
9.48*
Ateles fusciceps robustus
(A, B, S, C, At) --- ---178.93
206.64*
166.15*
190.14*
Ateles belzebuth --- ---38.86*
30.76*
43.35*
33.93*
Ateles hybridus --- ---0.93
13.70*
8.04*
4.35*
Ateles chamek --- ---8.16
8.21*
19.65*
19.76*
Ateles geoffroyi vellerosus --- ---9.77*
9.86*
12.78*
12.85*
28 Primate Report 73, July 2006
M. Ruiz-García et al.: Microsatellite DNA and craniometric data in Ateles

MARKERS
AP68 AP74 D5S117 D8S165
D5S117
Ateles fusciceps robustus
Chocó--- --- ---
18.78*
20.73*
Ateles fusciceps robustus
(A, B, S, C, At)--- --- ---
12.77*
16.49*
Ateles belzebuth --- --- ---4.49*
3.17
Ateles hybridus --- --- ---8.97*
9.35*
Ateles chamek --- --- ---11.83*
11.55*
Ateles geoffroyi
vellerosus--- --- ---
3.01
2.99
Craniometric data
The first craniometric data collected were not standardized and the UPGMA al-gorithm was applied to the obtained correlation matrix. No species or sex associa-tions were displayed by the constructed phenogram. The Manhattan distance wasalso applied to the non-standardized data (Fig. 2a) resulting in the detection of twolarge clusters. In the first large cluster there were two A. f. robustus (both from thenorthern area of Colombia), two A. hybridus, one A. geoffroyi and one A. belzebuth.The second large cluster was comprised of one A. hybridus, 11 A. f. robustus (fromdifferent northern and Pacific Colombian areas), 7 A. belzebuth and two A. spp., withno apparent trend. A small cluster composed of three A. f. robustus females fromChocó region and a cluster of two A. spp. were also detected. No associations by sexwere determined.
Application of the UPGMA phenogram with the Manhattan distance to the stan-dardized data matrix, provided findings (Fig. 2b) that were similar to those obtainedfrom the non-standardized data matrix. This analysis presented the highest cophe-netic correlation coefficient (r = 0.837, t = 6.971, p = 0.0000, 1,000 permutations, onetail probability p [random z > observed z] = 0.001). A strict consensus phenogramwith correlation, variance-covariance and Manhattan distances applied to the stan-dardized data showed a large cluster comprised of several A. f. robustus individualsfrom different points, two A. hybridus and two A. belzebuth from the Meta Depart-ment (Eastern Llanos). A second cluster decomposed into seven different associa-tions resulting in only 3 significant associations. One association grouped four A. f.
robustus (three females and one male) from the Chocó area with one A. hybridus
from the Bolivar area. Another association clustered two A. f. robustus females fromthe Antioquia region while a third association was composed of two A. spp. The con-sensus coefficients of this phenogram were as follows: Colles index, c = 0.6; Micke-
vich index, m = 0.2189 and Schuh & Farris index, sf = 91.
Primate Report 73, July 2006 29
M. Ruiz-García et al.: Microsatellite DNA and craniometric data in Ateles

The minimum spanning tree with the correlation coefficient showed striking re-lationships among the following paired individuals: one A. belzebuth (Caquetá De-partment) and one A. f. robustus (Sucre); one A. hybridus female (Bolivar) and one A.
f. robustus female (Antioquia); two A. belzebuth (one from La Macarena and otherfrom Caquetá area), and two A. belzebuth (from the Caquetá and Meta Depart-ments).
A R Principal Component Analysis showed that the first component (size) ex-plained 50.62 % of the total variance, while the top three components explained70.74 % (size and shape) of the total variance (Fig. 3). The first component clearlydifferentiated six individuals from the remaining samples analyzed (one A. belze-
30 Primate Report 73, July 2006
M. Ruiz-García et al.: Microsatellite DNA and craniometric data in Ateles
hybridus Santander
fusciceps Antioquia
fusciceps Barranquilla
fusciceps Sucre
fusciceps Sucre
geoffroyi Barranquilla
hybridus Bolivar
hybridus Bolivar
Ateles sp.
Ateles sp.
belzebuth Amazonas
belzebuth Meta
belzebuth Meta
belzebuth Meta
belzebuth Caquetá
belzebuth Caquetá
belzebuth Caquetá
belzebuth Vcio
fusciceps Antioquia
fusciceps Antioquia
fusciceps Antioquia
fusciceps Choco
fusciceps Choco
fusciceps Choco
fusciceps Choco
fusciceps Choco
fusciceps Choco
0.73 0.67 0.61 0.55 0.49 0.43 0.37 0.31 0.25 0.19 0.13
Fig. 2a: UPGMA phenogram with the Manhattan distance applied to non-standard-ized data of 27 Ateles skulls by using 38 cranial, mandible and dental measure-ments.

buth from Amacayacu, Amazon; one A. f. robustus from Barranquilla, Atlántico De-partment; one A. hybridus from Santander Department, one A. hybridus from Boli-var, one A. f. robustus from Turbo, Antioquia and one A. geoffroyi from Barran-quilla). There were two examples in which the component shape clearly differenti-ated an individual from the remaining analyzed skulls (one A. belzebuth fromCaquetá Department and other A. belzebuth from Amacayacu in Amazon).
A Q Principal Component Analysis supported that the variables mainly influ-enced by size were maximum frontal width and minimum frontal width followed bybasal height, bigonion width, auricular height and maximum transversal braincasewidth. The influence of shape on the biometric variables studied (second and thirdcomponents) was dispersed among all the analyzed variables. The craniometric vari-ables more related with shape differences among the Ateles taxa were the lengths ofthe upper and lower first molars, the foramen magnum length and the symphisisheight. The first component explained only 20.19 % of the total variance, while thefirst three components together only explained 45.41 %. Therefore, there was no sin-gle or small group of biometric variable(s) that could explain a large fraction of theskull differences found in the diverse species and individuals of Ateles studied. Thissupports that the biometric variables studied did not present extreme differencesamong the Ateles taxa analyzed and therefore do not have the same power as DNAmicrosatellites to discriminate Ateles individuals belonging to different geograph-ical taxa.
Primate Report 73, July 2006 31
M. Ruiz-García et al.: Microsatellite DNA and craniometric data in Ateles
1,68 1,55 1,42 1,29 1,03 0,90 0,77
hibridus Santaderfusciceps Antioquiahibridus Bolívarfusciceps Barranquillageoffroyi Barranquillabelzebuth Amazonasbelzebuth Meta
belzebuth Metafusciceps Sucrebelzebuth Caquetábelzebuth Caquetábelzebuth Metabelzebuth Villa Vciofusciceps Antioquiafusciceps Chocófusciceps Chocó
fusciceps Antioquiafusciceps Sucrefusciceps Chocó
Ateles sp.hibridus Bolívarfusciceps Chocó
Ateles sp.fusciceps Antioquiabelzebuth Caquetáfusciceps Chocó
fusciceps Chocó
0,510,64 0,38
Fig. 2b: UPGMA phenogram with the Manhattan distance applied to standardizeddata of 27 Ateles skulls by using 38 cranial, mandible and dental measurements.

Discussion
Microsatellite genetic variability in Ateles and phylogenetics of this genus
One interesting result determined in this study was the detection of some privatealleles in the seven Ateles taxa analyzed. The AP68, AP74, D5S117 and D8S165markers showed these private alleles in most of the taxa that were exhaustivelysampled. This result has two important implications. First, many of the Ateles exhib-ited in zoos are from unknown origins and sometimes many animals are hybrids.The existence of private microsatellite alleles could be a valuable tool that wouldhelp to correctly discriminate the Ateles taxa and the hybrids that are usually lo-cated in zoos and other institutions. Second, the existence of private alleles could be
32 Primate Report 73, July 2006
M. Ruiz-García et al.: Microsatellite DNA and craniometric data in Ateles
1.5
1.3
1.0
0.8
0.5
0.3
-0.3
-0.5
-1.6 -1.2 -0.8 -0.4 0.4 0.8 1.2 1.6
A. belzebuth
(Amazon)
A. f. robustus(Antioquia)
A. geoffroyii(Atlántico)
A. hybridus(Bolivar)
A. hybridus(Santander)
A. f. robustus(Atlántico)
A. f. robustus(Sucre)
A. f. robustus(Chocó)
A. f. robustus(Chocó)
A. belzebuth(Caquetá)
A. f. robustus(Chocó)
A. f. robustus(Chocó)
A. belzebuth(Meta)
A. belzebuth(Caquetá)
A. f. robustus(Chocó)
A. belzebuth(Meta)
A. f. robustus(Chocó)
A. sp.
A. belzebuth(Caquetá)
A. hybridus(Bolivar)
A. belzebuth(Meta)A. f. robustus
(Sucre)
A. belzebuth(Meta)
A. sp.
A. f. robustus(Antioquia)
A. f. robustus(Chocó)
Fig. 3: R Principal Component Analysis with the standardized data of 27 Ateles skullsby using 38 cranial, mandible and dental measurements.

a determinant tool to reconstruct the phylogenetics relationships within the Ateles
genus. For example, AP74 showed a wide range of allele sizes. One species, A. hybri-
dus, basically only presented small sized alleles (130-132 pb), whereas A. belzebuth,A. chamek and the northern Atlantic A. f. robustus population yielded these same al-leles in addition to some larger sized alleles. However, other Ateles taxa only showedlarge sized alleles (A. f. fusciceps, A. paniscus, A. geoffroyi and the Chocó Pacific A. f.
robustus population). This supports that A. hybridus descended from one of the firstthree taxa but not from any of the latter four taxa.
The northern Atlantic A. f. robustus population presented the largest averagenumber of alleles per locus followed by A. chamek. However, the current estimatedpopulation size of the first population is considerably smaller (about 1,000 to 3,000individuals and about 0 to 4 refuges, following the CONSERVATION ASSESS-MENT AND MANAGEMENT PLAN, 1992; KONSTANT et al., 1985). This studyprovides the first evidence that the large number of alleles detected in A. f. robustus
is the result of natural hybridization of an original A. f. robustus population locatedat the left side of the Magdalena river occupying part of the Antioquia, Bolivar,Sucre, Córdoba and Atlántico Departments. In fact, this A. f. robustus populationpresented the largest number of alleles at three of the four polymorphic micro-satellite markers used (AP68, AP74 and D8S165). A. chamek had the largest num-ber of alleles for the remaining locus (D5S117). In agreement with other molecularmarker studies, A. geoffroyi, presented the lowest average number of alleles, al-though this value was not significantly different from other species. For instance,COLLINS and DUBACH (2000a) determined very low levels of intrapopulationalgenetic mitochondrial sequence variation for all the A. geoffroyi that they studied.
A. chamek and the second population of A. f. robustus showed the first and secondhighest expected levels of heterozygosity, while A. hybridus showed the lowest. Thislast finding agrees quite well with the fact that only 100 to 1,000 individuals of thisspecies still exist in the wild. If the northern Atlantic A. f. robustus population,which is probably mixed with A. hybridus, is excluded from the results, then A. cha-
mek has the highest gene diversity levels (expected heterozygosity and averagenumber of alleles). The estimated size of the wild population for this species isgreater than 10,000 animals and is considered to be in a safe status according to theCONSERVATION ASSESSMENT AND MANAGEMENT PLAN (1992). This is a re-markable result because this could be the origin of all other Ateles species studiedherein (COLLINS and DUBACH, 2000 a,b).
A. chamek was the species which presented the highest levels of gene sequencediversity at the mitochondrial DNA and at the aldolase A intron gene (COLLINSand DUBACH, 2000a,2001). This agrees quite well with the fact that A. chamek wasthe species with the highest microsatellite gene diversity, thus suggesting A. cha-
mek as the ancestral spider monkey clade. MEDEIROS et al. (1997) also concludedthat A. chamek could represent the ancestral karyotype for Ateles. The finding of the6b chromosome in A. chamek provided an important element to the identification ofthe population of this species as the ancestor within this genus. DUTRILLAUX et al.(1986) found that 6b corresponded to 2 chromosomes of Lagothrix and Brachyteles.Therefore, since the 6b form only occurs in A. chamek, Lagothrix and Brachyteles it isinterpreted as the ancestral form of Ateles. They speculated that a migration east-ward formed A. marginatus and a second migration leading north-westward to the
Primate Report 73, July 2006 33
M. Ruiz-García et al.: Microsatellite DNA and craniometric data in Ateles

Magdalena River valley formed A. hybridus. In regard to the second migration,microsatellite results support the possibility that A. chamek was the ancestral spe-cies and that A. belzebuth derived from it. In turn, A. belzebuth originated at theMagdalena River valley from the northern Atlantic A. f. robustus populations (this isconsistent with the 6d chromosome) which in turn originated the Chocó Pacific A. f.
robustus population which originated the Ecuadorian A. f. fusciceps population.There were no significant differences among A. f. fusciceps individuals, at least notin the few analyzed in the current study. A. hybridus could have originated directlyfrom A. belzebuth, or from the Magdalena River valley and Atlantic A. f. robustus
population. From a chromosome point of view, both origins are possible because A.
hybridus has 6a, 6c, 7b and 14b chromosomes, while 7b is found in A. f. robustus and6c is found in A. belzebuth.
The existence of private alleles and high levels of gene diversity support that A.
chamek is a full species as has been mentioned previously (ANDERSON, 1997 andSALAZAR-BRAVO et al., 2003). This was also supported with morphometric(FROEHLICH et al., 1991) and cytogenetic data (MEDEIROS et al., 1997) andtherefore A. chamek is not a subspecies of A. paniscus (A. paniscus chamek) as it wastraditionally claimed by KELLOG and GOLDMAN (1944). In addition, our micro-satellites results revealed a strong connection between A. chamek and A. belzebuth
belzebuth which is also supported by COLLINS and DUBACH’s (2000 a,b, 2001) mo-lecular results. They demonstrated a strong phylogenetic relationship among A.
chamek and several A. belzebuth subspecies. Therefore, A. chamek could also be theorigin of the A. b. belzebuth populations studied in Perú and Colombia.
Furthermore, COLLINS and DUBACH (2000a) supported the existence of fourAteles species based on mitochondrial DNA sequence variation in cytochrome coxidase subunit II (COII) and the mitochondrial control region. The first species, A.
belzebuth, had a distribution range from the western and southern Amazon Basinand from the Guyana Highlands to the Andes, part of the northern Amazon as wellas the south-eastern Llanos in Colombia and Venezuela. Our microsatellite dataconfirmed an important connection between A. chamek and A. belzebuth belzebuth,although Wahlund effect was detected as was mentioned previously. COLLINS andDUBACH (2001) studied DNA sequence variation of the aldolase A intron V nucleargenomic region and determined that one A. chamek sequence was associated with anA. belzebuth marginatus sequence and separated from other A. chamek sequences.Disappointingly, no A. b. marginatus were sampled and therefore DNA microsa-tellites were not applied to this taxon. However, the phylograms obtained by theseauthors with that nuclear gene were considerably less robust compared to those con-structed from the mitochondrial DNA genome due to a low sequence variation in thenuclear gene studied.
Nonetheless, the nuclear microsatellites studied in Ateles did not present a lowernuclear gene diversity than that obtained for other genera, such as Alouatta,
Lagothrix and Cebus (RUIZ-GARCÍA et al., 2004, 2006a, unpublished data), andthus are not in agreement with the low level of aldolase A intron V sequence varia-tion detected by COLLINS and DUBACH (2001). Recall that this nuclear gene onlyshowed 10% of the variation at mitochondrial COII gene and only 6% of the mito-chondrial control region. The second species, A. paniscus, was comprised of haplo-types from the northeastern area of the Amazon Basin in Surinam, Guiana and
34 Primate Report 73, July 2006
M. Ruiz-García et al.: Microsatellite DNA and craniometric data in Ateles

Brazil. The analysis of the aldolase A intron suggested that the A. paniscus haplo-types form a unresolved trichotomy with A. chamek and with the rest of the Ateles
haplotype at the base of the phylogenetic tree. In addition, A. paniscus representsthe basal clade for the mitochondrial phylogenies which complements the fact thatthis taxon among all of the Ateles species is the most similar to the Ateles ancestortype (COLLINS and DUBACH, 2000a). The small sample size of A. paniscus col-lected in the current study is insufficient to test this conclusion. The third species, A.
hybridus, was located along the right Magdalena River, the eastern bank of thelower Cauca river, the departments of Magdalena, Bolivar, Antioquia, Cesar andGuajira and at least to the northern departments of Caldas and Cundinamarca.There is an additional population in the Catatumbo River basin of North SantanderDepartment and a second population in the northeastern piedmont in Arauca De-partment and the diverse areas around Maracaibo Lake in northwestern Venezuela.In agreement with the mitochondrial data results, our nuclear DNA microsatellitedata support that this last population is possibly a full species.
It could be derived from A. belzebuth or from the second A. f. robustus populationby founder effect, although founder effect affects these kinds of markers less thanother markers such as isoenzymes or plasma proteins. However, the possibility thatthis population arose because of founder effect and genetic drift, does provide an ex-planation of why COLLINS and DUBACH (2000a) found different relationshipsamong the A. hybridus clade and the other Ateles clades. For instance, the parsi-mony analysis of the control region did not relate A. hybridus with any other clade,whereas the distance-based analysis clustered A. hybridus with A. geoffroyi/A. f. ro-
bustus with a bootstrap support of 65 %. In contrast, the combined mitochondrialgene neighbor-joining analysis placed A. hybridus next to the clades of A. b. cha-
mek/A. b. marginatus and A. geoffroyi/A. f. robustus. The differential relationshipof this species could be the result of genetic drift, just as the average number of al-leles per locus data showed. Although, only two A. paniscus samples were studied,they did not reveal any special relationship with A. hybridus. This finding is inagreement with the mitochondrial and the aldolase A gene results. Thus, micro-satellites provide some data that do not support the link among A. paniscus and A.
hybridus as was proposed by MEDEIROS et al. (1997) and based on chromosomalanalysis (both taxa shared the 7b chromosome). The similarities of chromosome pair7 between A. paniscus and other trans-Andean Ateles forms are not compatible withthe microsatellite results. However, this chromosome could be polymorphic in A.
belzebuth and in other Ateles individuals not yet studied and the apparent relation-ship among A. paniscus and the trans-Andean Ateles could be spurious. In fact, COL-LINS and DUBACH (2000a) showed that the haplotypes of A. hybridus did not ex-hibit the 25-base pair control region deletion that occurs in all haplotypes of A.
paniscus. Microsatellites did not reveal any evidence that connected A. hybridus andA. geoffroyi which agrees with the neighbor-joining cladogram for the aldolase Aintron studied by COLLINS and DUBACH (2001). On the other hand, KUNKEL etal. (1980) detected the same 6c and 7b chromosomes in A. geoffroyi and A. hybridus.COLLINS and DUBACH (2000 a,b) only found a small amount of evidence for the in-clusion of A. hybridus and A. geoffroyi in the same cluster when they used mitochon-drial genes as FROEHLICH et al. (1991) had revealed previously with morpho-metrics. Nevertheless, the maximal genetic distances between A. geoffroyi and A.
Primate Report 73, July 2006 35
M. Ruiz-García et al.: Microsatellite DNA and craniometric data in Ateles

hybridus were lower at the aldolase A gene than the distances between A. geoffroyi
and the Chocó populations of A. f. robustus (COLLINS and DUBACH, 2001).FROEHLICH et al. (1991) used morphometric analysis to support that A. hybridus
and A. fusciceps were conspecifics. Although the centroid distances between bothtaxa showed that they were related, there were also differences between them. Webelieve that, at least, the northern A. f. robustus population is related with A.
hybridus (due to the limited hybridization between them) but they could be two dif-ferent taxa such as karyotype analyses have revealed (KUNKEL et al., 1980). Thefourth species was A. geoffroyi. The mitochondrial results placed the two former spe-cies A. geoffroyi (Central America) and A. fusciceps, (Pacific Colombia and Ecuadorand northern Colombia) in the same group. The aldolase A gene region also clus-tered two A. geoffroyi yucatanensis haplotypes with two A. f. robustus haplotypes butwith a very low bootstrap support of 48 %. Therefore, the aldolase A gene providedminor support for the inclusion of both the Central America A. geoffroyi and theSouth American A. fusciceps as one species. FROEHLICH et al. (1991) concluded intheir morphological variation study that A. geoffroyi and A. fusciceps belonged to thesame species. The coat colors of the two taxa are distinct overall, with the generaltrend of the production of darker pelages at the extremes of the Central AmericanIsthmus (KONSTANT et al., 1985). Thus, it could be that the A. fusciceps individualsare completely dark. However, our microsatellite study revealed strong differencesespecially between A. geoffroyi and A. hybridus, but also between A. geoffroyi and A.
fusciceps robustus. Both of the A. f. robustus populations had significant divergencesfrom the A. geoffroyi sample analyzed. Therefore, microsatellite results supportedstatistical significant differences among A. f. robustus, A. geoffroyi and A. hybridus.The Chocó Pacific A. f. robustus population diverged clearly from the second A. f.
robustus population. However, the first population was practically identical to thefew A. f. fusciceps individuals studied from Ecuador as previously cited. Thus, theColombian and the Ecuadorian Pacific A. fusciceps populations that were previouslyclassified as two different subspecies now seem to make-up a single gene pool for themicrosatellite studied. The second A. f. robustus population was clearly more relatedwith A. hybridus, while this last population did not show specific resemblances withA. geoffroyi. On the other hand, either of the two Colombian A. f. robustus popula-tions could have originated A. geoffroyi. Some specific differences between mitochon-drial and microsatellite results could be due to the maternal mode of inheritance ofmitochondrial DNA. This (mitochondrial DNA) could be distributed in maternallyisolated lineages, although the populations could be related by male gene flow.Nonetheless, similar nuclear and mitochondrial phylogenies are expected with bothmolecular markers because spider monkeys are widely reported to show female dis-persal (MOORE, 1993). A congruity test (ILD test) indicated that the nuclear andthe mitochondrial trees obtained by COLLINS and DUBACH (2001) were congruent(P = 0.476). Perhaps the different mutation models that affect mitochondrial DNAand microsatellites provide an explanation for the different results obtained forthese two types of DNA.
Hardy-Weinberg equilibrium
Three out of five Ateles samples, where H-W E tests were performed, showed no-existence of this equilibrium. This was the case of A. f. robustus, A. belzebuth and A.
36 Primate Report 73, July 2006
M. Ruiz-García et al.: Microsatellite DNA and craniometric data in Ateles

chamek. In the first taxa, two different populations were sampled, one from the Pa-cific Colombian area of Chocó and the other from the Magdalena river valley and At-lantic coast of northern Colombia (Antioquia, Sucre, Bolivar, Córdoba and Atlán-tico). Both populations taken together showed a remarkable homozygous excesswhich was produced by Wahlund effect (= population subdivision). This means thateach one of these A. f. robustus populations represented a different gene pool. Wheneach population was tested separately, neither one deviated from H-W E. This re-veals that these populations were composed of animals of different gene pools, wheresome were mixed and others were not. Therefore, Wahlund effect is also inside of thenorthern A. f. robustus population and the western cordillera of the Andes and theCauca River were not barriers to gene flow between A. f. robustus and A. hybridus
such as was claimed by COLLINS and DUBACH (2000a).The deviation of A. belzebuth from H-W E could also be due to Wahlund effect be-
cause the samples studied covered a wide range of the distribution of this species inColombia and Perú. However, the individuals sampled were dispersed across bothcountries and the samples could not be associated to any singular population. There-fore, we could only affirm that there is genetic heterogeneity within the distributionrange of A. belzebuth in Colombia and Perú. COLLINS and DUBACH (2001) deter-mined that the maximal genetic distance for the aldolase A and mitochondrial geneswithin A. belzebuth was the highest they had encountered among all of the Ateles
taxa that they studied. They concluded that this was a very diverse species thatcould possibly harbor susbspecies that might be detected with more intensive sam-pling of individuals from a larger geographic area. COLLINS and DUBACH (2000b)commented that Pleistocene refugia could be an important element to produce ge-netic diversity among different geographical areas within the A. belzebuth distribu-tion but that it was insufficient to result in speciation for this species. A more thor-ough and intensive sampling across this area must occur in the future, in order to beable to determine the precise limits of these diverse and different gene pools withinA. belzebuth. Wahlund effect could also provide an explanation for the deviationfrom H W E by A. chamek, because the samples were obtained across different pointsof the Peruvian Amazon (Amazon, Napo and Ucayali rivers) as well as the BolivianAmazon (Mamoré and Beni rivers). The two species which did not present any evi-dence of deviations from H W E were A. hybridus and A. geoffroyi. The samples of thesecond species were collected from a specific geographical point but the samples ofthe first species were obtained across the species distribution range. DEFLER(2003) distinguished two possible subspecies of A. hybridus, A. h. hybridus, from themajor part of the geographical range of this species, and A. h. brunneus from alongthe lower Cauca and Magdalena Rivers in the departments of Bolivar, Antioquiaand Caldas. Animals of the second subspecies have different coat colors from those ofthe first subspecies. However, in the current study we did not find evidence of molec-ular differences between individuals of A. hybridus from both geographical areas.Therefore, at a molecular level we could not differentiate between these two possibleA. hybridus susbspecies.
Genetic heterogeneity
Of the five microsatellites that amplified nicely (in this study) for Ateles, AP40was the only one not useful in discriminating among different taxa or helpful in es-tablishing the genetic structure parameters of populations.
Primate Report 73, July 2006 37
M. Ruiz-García et al.: Microsatellite DNA and craniometric data in Ateles

The two A. f. robustus populations were highly divergent for all the polymorphicmarkers in this study. This reveals that these two populations of A. f. robustus pre-sented considerable genetic divergence and it could be interesting to analyze possi-ble taxonomic differences between these two populations. The three microsatelliteswhich showed the most outstanding divergence between these two populations wereAP68, AP74 and D8S165. It is interesting to note that for AP68, the Pacific popula-tion of A. f. robustus did not present differences with A. f. fusciceps but did show note-worthy differences with the other Ateles species. In contrast, the second A. f.
robustus did not present significant differences with A. belzebuth, A. hybridus orwith A. geoffroyi. The first A. f. robustus population also did not show significant dif-ferences with A. f. fusciceps nor with A. geoffroyi for AP74. Once more, the second A.
f. robustus population did not show significant differences with A. belzebuth and A.
hybridus but, it did show significant differences with A. geoffroyi. For D8S165, thefirst A. f. robustus population showed significant differences with A. hybridus, A.
geoffroyi and A. chamek, whereas the second population presented remarkable dif-ferences with A. hybridus but not with A. geoffroyi. Several ideas can be generatedfrom these results. First, the Pacific A. f. robustus population was very similar withthe A. f. fusciceps samples from Ecuador. Therefore, these two populations could rep-resent the same gene pool, or that the separation between the populations is ratherrecent.
Nevertheless, the Pacific A. f. robustus population was not only extremely diver-gent from the second A. f. robustus population, but it was also extremely divergentfrom A. belzebuth and A. hybridus. In contrast, the second A. f. robustus populationwas very similar with A. belzebuth and with A. hybridus populations. This could beinterpreted as follows. As it was discussed previously, A. chamek was the taxon thatpresented the highest level of expected heterozygosity and therefore it could be theancestral origin of some of the other Ateles taxa studied herein. When geographicalvicinity is considered, the descended species should be A. belzebuth. The current re-sults support that A. belzebuth crossed the eastern Andes cordillera and originatedthe second A. f. robustus (Antioquia, Sucre, Bolivar, Córdoba, Atlántico) population.We have evidence that A. belzebuth crossed the eastern Andes Cordillera. BrotherAPOLIMAR MARIA (1913) recorded a specimen from the Tolima Department in theupper Magdalena Valley which was practically identical to A. belzebuth individualsthat inhabited the eastern piedmont of the eastern Andes. We have even locatedAteles bones from the Huila Department in various Colombian museums on theother side of the eastern Andes Cordillera (RUIZ-GARCÍA, unpublished results).HERNÁNDEZ-CAMACHO and COOPER (1976) mentioned that a precedent ex-isted for a zoological passage from east of eastern Andes cordillera into the upperMagdalena valley. Several species of Primates such as Cebus apella, Lagothrix
lagotricha lugens and Saimiri sciureus cassiaquerensis, as well as other vertebratespecies, have crossed this passage. It is also possible that A. belzebuth originated A.
hybridus via a different route. As we had mentioned earlier our microsatellite datarevealed that A. hybridus was completely differentiated. However, there is evidenceof introgression of A. hybridus in the second A. f. robustus population, which isclearly visible at the allele composition of AP74. This introgression is probably re-cent and is only in one part of the current population’s (Antioquia, Sucre, Córdobaand Atlántico A. f. robustus) distribution and is compatible with the Wahlund effect
38 Primate Report 73, July 2006
M. Ruiz-García et al.: Microsatellite DNA and craniometric data in Ateles

described in the H-W E section. This A. f. robustus population provided the origin ofthe A. f. robustus in the Colombian Pacific. The Central American species, A. geoff-
royi, herein represented only by one subspecies, could have originated indistinctlyfrom either of the two A. f. robustus populations as previously claimed. For instance,AP68 and D8S165 revealed that there was similarity between the second A. f. robus-
tus and A. geoffroyi populations analyzed in this study. AP74 revealed extreme simi-larities among the Pacific Colombian A. f. robustus and A. geoffroyi populations. Incontrast, D5S117 differentiated both A. f. robustus populations from the A. geoffroyi
sample.The estimated value of gene flow among the different Ateles taxa was very small,
which provides strong support that the taxa studied are different reproductive units,even though two of the analyzed populations seem to share genetic characteristics(second A. f. robustus population and A. hybridus). Although there is evidence of hy-bridization among different Ateles populations as we reported in the introduction,the current Ateles distribution and its habitat restriction translate into a criticalneed for primary and terra firma forest. This fact could limit gene flow among Ateles
populations (ESTRADA and COATES-ESTRADA, 1988; AQUINO and ENCARNA-CION, 1994).
However, we can not discount the possibility that animals with different karyo-types produce fertile offspring (MEDEIROS et al., 1997). These authors suggestedthat A. geoffroyi and A. hybridus could interbreed and produce fertile offspring, al-though we have not found evidence of this occurrence with microsatellites. Al-though, KUNKEL et al. (1980) and MEDEIROS et al. (1997) speculated that A. f.
robustus could be reproductively isolated from A. geoffroyi and A. hybridus becauseof the differences in chromosome pairs (5 and 6), we have evidence of hybridizationbetween A. f. robustus and A. hybridus. ROSSAN and BAERG (1977), also deter-mined that there was hybridization between A. f. robustus and A. geoffroyi pana-
mensis and they noted the location of a hybridization zone. Also, recall that no riverhas formed a barrier among Ateles species with the exception of the lower Amazonand possibly some of the black-water rivers draining the Guianan highlands (COL-LINS and DUBACH, 2000b).
The genetic heterogeneity analysis revealed a global expected gene diversity of0.675. This value was slightly lower than that obtained in other neotropical primategenera, such as Alouatta, which showed a value of 0.727 with the same micro-satellites (RUIZ-GARCÍA et al., 2006b). The levels of genetic heterogeneity for theseven Ateles taxa were 0.105-0.123 for Gst, 0.084 for Fst and 0.251 for RST. These val-ues were considerably lower than those obtained for the same markers in Alouatta
(0.189-0.259 for Gst, 0.26 for Fst and 0.621 for RST) and in Cebus (0.197-0.311 for Gst,0.34 for Fst and 0.764 for RST) (RUIZ-GARCÍA et al., 2006b, and RUIZ-GARCÍA, un-published results). These findings could have two interpretations: 1) Temporal di-vergence among the Ateles taxa studied is considerable lower than in these othergenera. or 2) some selective or constriction mutation is acting upon a fraction of theDNA microsatellites studied in Ateles. RUIZ-GARCÍA et al. (2004, 2006a) had previ-ously detected selective and mutational constriction of some of these microsatellitesin other Neotropical primate species, but in no case was the constriction to the ex-tent as that detected in Ateles. GARZA et al. (1995) also detected constraints on al-lele size microsatellite evolution among humans and chimpanzees. Also, we suggest
Primate Report 73, July 2006 39
M. Ruiz-García et al.: Microsatellite DNA and craniometric data in Ateles

that a certain fraction of microsatellite loci mutations produce alleles with identicalsizes but with different internal structures (GARZA and FREIMER, 1996).
The divergence time between Ateles species was 3.59 Ma following COLLINS andDUBACH (2000 a,b). We assumed that this value was potentially correct and used itto estimate the average microsatellite mutation rate per generation for Ateles. Thefollowing equations by SLATKIN (1995) were used in the calculation:
tF = 4Ne (FST/(1 - FST)) and tR = 4Ne (RST/(1 - RST)), where t is the number of genera-tions elapsed from the separation of the taxa analyzed and Ne is the total effectivenumber. We obtained average FST and RST values for Ateles of 0.084 and 0.251. By us-ing FST and RST with a mutation rate of 5.6 x 10
-4(low extreme), the divergence times
obtained were clearly an underestimation of the divergence times with mtDNA(95,734-349,842 years, respectively, against 3.59 Ma, COLLINS and DUBACH,2000 a,b). Also, if both FST and RST were used with the mutation rate per generationof 7 x 10
-5(high extreme), the divergence times were still lower than that obtained
with mtDNA sequences (765,853 years ago and 2.8 Ma, respectively). These resultssupport that RST rather than FST based values are more similar to the expected diver-gence times obtained with other markers such as we determined for Alouatta
(RUIZ-GARCÍA et al., 2006a). Nevertheless, the average mutation rate per genera-tion in Alouatta is almost equal to 7 x 10
-5which corresponds to a divergence time of
6.6 Ma. This mutation rate value is much higher than that required for a divergencetime of 3.59 Ma in Ateles. To obtain mutation rates per generation with FST and RST
that are compatible with 3.59 Ma of separation, the average mutation rate per gen-eration in Ateles would need to be 2.49 x 10
-6and 9.09 x 10
-6respectively. Therefore,
as we previously claimed, the microsatellite mutation rates in Ateles are lower thanin Alouatta probably because of higher mutation or selective constriction occur-rences in Ateles.
Bottlenecks, coalescence effective numbers and mutation models
The bottleneck analysis of both A. f. robustus populations together, as a singlelarge population, detected a recent and significant deviation from equilibrium thatwas the opposite of a bottleneck. This supports inconsequential mutation-gene drift,Wahlund effect, expansions or partial gene flow regarding this population. Never-theless, when the A. f. robustus populations were analyzed separately, the Chocó Pa-cific population was shown to have crossed a recent bottleneck. However, this popu-lation seems extremely small with less than 500 individuals. An analysis of thenorthern Atlantic A. f. robustus population again showed significant negative re-sults agreeing quite well with the fact that a fraction of this population was probablyrecently mixed with A. hybridus, such as it was demonstrated in other analyses. It isinteresting to note that two of the most endangered Ateles taxa, such as A. hybridus
and A. geoffroyi did not present any evidence of recent bottlenecks. This could meanthat the number of DNA microsatellites used was insufficient to detect recent bottle-necks in these species or that their number has always been small since their origin
by founder effect.The different coalescence methods that were used provided very similar effective
numbers. Both methods showed that the second A. f. robustus population presentedthe highest effective numbers. Furthermore, the methods provide evidence of geneadmixture involving A. hybridus and therefore probably overestimate the real effec-
40 Primate Report 73, July 2006
M. Ruiz-García et al.: Microsatellite DNA and craniometric data in Ateles

tive number of this A. fusciceps robustus population. The estimated wild populationof this taxa is about 1,000-3,000 individuals, which is extremely low compared to theeffective number obtained. In addition, both coalescence methods revealed that A.
hybridus and A. geoffroyi were the species presenting the lowest historical effectivenumber. Uniquely, the discordance between the methods supported that the secondprocedure clearly showed that the numbers were higher than the first one for A.
belzebuth.Previously, RUIZ-GARCÍA (2003) using different theoretical models determined
possible effective numbers of some of these Ateles taxa with a smaller sample size.For instance, estimates of average heterozygosity with the infinite allele and thestep-wise mutation models showed values of 1,189 to 6,772 for A. belzebuth, from 997to 5,334 for A. hybridus and from 1,486 to 9,242 for A. f. robustus (total population).These values are within the lower limits for the coalescence estimates obtainedherein. The estimate ranges with the WERHARHN (1975)´s procedure on thesesame species were 25,882 to 92,436, 6,885 to 24,588 and 32,163 to 114,868, respec-tively. All of these values are relatively similar to those obtained in the currentstudy. Therefore, sufficient evidence exists in favor of the present historical effectivenumbers.
It should be noted that there are no important multiple mutation percentagesthat affect the microsatellite evolution studied herein. Only AP74 had a significantmultiple-step mutation model in several of the Ateles species including A.f robustus
(two populations), A. hybridus and A. belzebuth. The species A. hybridus showed thehighest multiple-step percentage (16.88 %) and the most differentiated microsa-tellite mutation rate order. The evidence that the founder effect could modify thesemutation evolution parameters at the microsatellite level during the formation ofthis species (A. hybridus) is important because it supports that it is a true species.Since the effective numbers obtained with the uni and multiple-step mutation mod-els were extremely similar, the selection of any one particular mutation model to beused in the estimation of effective numbers in Ateles is not important.
Craniometric data
The craniometric data were not clearly differentiable with or without standard-ized data of the 27 Colombian Ateles skulls analyzed by species, gender or by geo-graphical origin. Only a few, small clusters were maintained, such as 3 A. f. robustus
females from Chocó. The clear separation of the two A. f. robustus populations thatwas revealed with the microsatellite data was not similarly obtained with the bio-metric skull data. However, the unique Colombian A. geoffrensis skull studied wasclustered with some A. hybridus specimens and agrees with biometric skull resultsobtained by FROEHLICH et al. (1991). Nevertheless, this phylogenetic link was notsupported with the DNA microsatellites analyzed. The size of the skull was helpfulin the discrimination of some individuals from the remaining specimens studied, butthis variable was not helpful for the discrimination among species, gender or by geo-graphical origin. The variables with the greatest discrimination power by size weremaximum frontal width, minimum frontal width followed by basal height, bigonionwidth, auricular height and maximum transversal braincase width. Although thesewere the craniometric variables most efficient in the discrimination among Ateles in-dividuals they were not as effective as microsatellites. In contrast to these current
Primate Report 73, July 2006 41
M. Ruiz-García et al.: Microsatellite DNA and craniometric data in Ateles

results, other Neotropical primate cranial studies have clearly differentiated genderand species (DE FREITAS BURITY et al., 1997).
The current results could provide some insights for the conservation of Ateles, atleast, in the determination of how many evolutionary units exist in the wild. Recallthat Ateles along with Alouatta and Lagothrix, is one of the primary food sources formany indigenous tribes (MITTERMAIER et al., 1989; BODMER et al., 1994). Unfor-tunately, due to their slow reproductive rates, this genus could easily be eliminatedfrom extensive forested areas. Also, the reduced number of chromosome pairs inAteles could be related to its high degree of ecological specialization (CHU andBENDER, 1962). For instance, some molecular mutation traits of the microsatelliteevolution in A. hybridus are unique, but the critical situation of this taxon may re-sult in their disappearance at the species and genus (Ateles) levels. Recall, that ac-cording IUCN (RYLANDS et al., 1997), this taxon is considered to have a 20 %chance of extinction in the next 20 years.
The accurate determination of genetic relationships and biogeographical pat-terns is dependent on the collection of additional samples of different Ateles taxa anda greater incorporation of microsatellites types in studies. Current efforts for theconservation of Ateles could be hampered without further information regarding mo-lecular speciation mechanisms.
Acknowledgments
The first author emphatically thanks the Dean of the Faculty and Vicerectory ofthe Pontificia Universidad Javeriana for the use of facilities throughout the presentinvestigation. Thanks also go to the Instituto von Humboldt (IVH) at Villa de Leyvafor providing access to its Ateles collection. These acknowledgments are mainly di-rected to the curator of the mastozoologic collection, Miss. Yaneth MuZoz-Sabas andthe directors of IVH, Dr. Cristian Samper and Dr. Fernado Gaast. In addition, theauthors express their gratitude to Hugo Gálvez, Connie Stelle, Judith MargaritaVillavicencio, the Huitoto, Ticuna and Jaguas Indian communities throughout theColombian Amazon, the Movima, Moxeño, Sirionó, Canichana, Cayubaba and Cha-cobo Indian communities in Bolivia, the Ocaina, Shipigo-Comibo, Capanahua, Ango-teros, Orejón, Cocana, Kishuarana and Alamas Indian communities in Perú and allthe people that helped to collect the biological material studied here. Thanks also goto Julieta Vargas from the Colección Boliviana de Fauna (La Paz, Bolivia).
References
Anderson S (1997): Mammals of Bolivia: taxonomy and distribution. Bulletin of the
American Museum of Natural History 231:1-652.Aquino R, Encarnación F (1994): Primates of Perú. Primate Report 40: 1-127.Archie JW (1985): Statistical analysis of heterozygosity data: independent sample
comparisons. Evolution 39: 623-637.Barton NH, Slatkin M (1986): A quiasi-equilibrium theory of the distribution of rare
alleles in a subdivided population. Heredity 56: 409-416.
42 Primate Report 73, July 2006
M. Ruiz-García et al.: Microsatellite DNA and craniometric data in Ateles

Bodmer RE, Puertas PE, Fang TG (1994): The urgency of finding new directions forprimate conservation in western Amazonia. Neotropical Primates 2: 1-3.
Bruford MW, Wayne RK (1993): Microsatellites and their application to populationgenetics studies. Current Opinion in Genetics and Development 3: 939-943.
Chu EHY, Bender MA (1962): Cytogenetics and evolution of Primates. Annals of the
New York Academy of Sciences 102: 253-266.Collins AC (1999): Species status of the Colombian spider monkey, Ateles belzebuth
hybridus. Neotropical Primates 7: 39-41.Collins AC (2001): The importance of sampling for reliable assessment of phylo-
genetics and conservation among Neotropical Primates: a case study in spidermonkeys (Ateles). Primate Report 61: 9-30.
Collins AC, Dubach JM (2000 a): Phylogenetic relationships of spider monkeys(Ateles) based on mitochondrial DNA variation. International Journal of Pri-
matology 21: 381-420.Collins AC, Dubach JM (2000 b): Biogeographic and Ecological forces responsible for
speciation in Ateles. International Journal of Primatology 21: 421-444.Cornuet JM, Luikart G (1996): Description of power analysis of two tests for detect-
ing recent population bottlenecks from allele frequency data. Genetics 144:2001-2014.
De Freitas Burity CH, Mandarim-de-Lacerda CA, Pissinatti A (1997): Sexual dimor-phism in Leontopithecus Lesson, 1840 (Callitrichidae, Primates): Multivariateanalysis of the cranial measurements. Revista Brasilera de Biologia 57: 231-237.
Defler T (2003): Primates de Colombia. Conservación Internacional. Bogotá DC., Co-lombia: 1-543.
Dutrillaux B, Couturier J, Viegas-Pequinot E (1986): Evolution chromosomique desPlathyrriniens. Mammalia 50: 56-81.
Ellegren H (1995): Mutation rates at porcine microsatellite loci. Mammalian Ge-
nome 6: 376-377.Elliot DG (1913): A review of the primates. Vols. I and II. American Museum of Na-
tural History, New York.Estrada A, Coates-Estrada R (1988): Tropical rain forest conversion and perspec-
tives in the conservation of wild Primates (Alouatta and Ateles) in Mexico.American Journal of Primatology 4: 315-327.
Ewens WJ (1979): Mathematical Population Genetics.Vol. 9. Springer-Verlag, NewYork.
Froehlich JW, Supriatna J, Froehlich, PH (1991): Morphometric analysis of Ateles:Systematics and biogeographic implications. American Journal of Primatology
25: 1-22.García MM, Caballín MR, Aragones J, Goday C, Egozcue J (1975): Banding patterns
of the chromosomes of Ateles geoffroyi with description of two cases of peri-centric inversion. Journal of Medical Primatology 4: 108-113.
Garza JC, Freimer NB (1996): Homoplasy for size at microsatellite loci in Humansand Chimpanzees. Genome Research 6: 211-217.
Garza JC, Slatkin M, Freimer NB (1995) Microsatellite Allele frequencies in Humanand Chimpanzees, with implications for constraints on allele size. Molecular
Biology and Evolution 12: 594-603.Goudet J, Raymond M, Demeeus T, Rousset F (1996): Testing differentiation in dip-
loid populations. Genetics 144: 1933-1940.
Primate Report 73, July 2006 43
M. Ruiz-García et al.: Microsatellite DNA and craniometric data in Ateles

Gower JC, Ross GJS (1969): Minimum spanning trees and single cluster analysis.Applicative Statistics 18: 54-64.
Groves C (2001): Primate Taxonomy. Washington, Smithsonian Institution Press.Griffiths RC, Tavaré S (1994): Simulating probability distributions in the coales-
cent. Theoretical Population Biology 46: 131-159.Hernández-Camacho J, Cooper RW (1976): The non human Primates of Colombia.
In: Thorington RW, Heltheydes PG (eds.): Neotropical Primates: field studies
and conservation. National Academy of Sciences, Washington D.C.: 35-69.Hershkovitz P (1972): The recent mammals of the Neotropical region: A zoogeo-
graphic and ecological review. In: Keast AF, Erk C, Glass B (eds.): Evolution,
mammals and southern continents. Albany, State University of New York:311-431.
Jacobs SC, Larson A, Cheverud JM (1995): Phylogenetic relationships and ortho-genetic evolution of coat color among tamarins (genus Saguinus). Systematic
Biology 44: 515-532.Konstant W, Mittermeier RA, Nash SD (1985): Spider monkeys in captivity and in
the wild. Primate Conservation 5: 82-109.Kellog R, Goldman E.A (1944): Review of the spider monkeys. Proceedings of the
United States Natural Museum 96: 1-45.Kunkel LM, Heltne PG, Borgaonkar DS (1980): Chromosomal variation and zooge-
ography in Ateles. International Journal of Primatology 1: 223-232.Luikart G, Allendorf F, Sherwin B, Cornuet JM (1998): Distortion of allele frequency
distribution provides a test for recent population bottleneck. Journal of Hered-
ity 86: 319-322.Marcus LF (1990): Traditional Morphometrics. In: Rohlf FJ, Bookstein FL (eds.):
Proceedings of the Michigan Morphometrics Workshop. Special PublicationNumber 2. The University of Michigan Museum of Zoology: 77-122.
María Brother Appolinar (1913): Catálogo del Museo del Instituto de La Salle,Bogotá. Bol. Soc. Cienc. Nat. Inst. La Salle, Bogotá 1 (1).
Medeiros MA, Barros RMS, Pieczarka JC, Nagamachi CY, Ponsa M, Garcia M, Gar-cia F, Egozcue J (1997): Radiation and speciation of spider monkeys, genusAteles, from cytogenetic viewpoint. American Journal of Primatology 42: 167-178.
Michalakis Y, Excoffier L (1996): A generic estimation of population subdivision us-ing distances between alleles with special reference to Microsatellite loci. Ge-
netics 142: 1061-1064.Mittermaier RA (1977): Distribution, synecology and conservation of Surinam mon-
keys. Ph. D. diss. Harvard University.Mittermeier RA, Kinzey WG, Mast RB (1989): Neotropical Primate Conservation.
Journal of Human Evolution 18: 597-610.Moore J (1993): Inbreeding and outbreeding in primates: What´s wrong with "the
dispersing sex"?. In: Moore J (ed.): The Natural History of Inbreeding and Out-
breeding. University of Chicago Press, Chicago.Nei M (1973): Analysis of gene diversity in subdivided populations. Proceeding of the
National Academy of Sciences USA 70: 3321-3323.Nielsen R (1997): A likelihood approach to populations samples of Microsatellite al-
leles. Genetics 146: 711-716.
44 Primate Report 73, July 2006
M. Ruiz-García et al.: Microsatellite DNA and craniometric data in Ateles

Ohta T, Kimura M (1973): A model of mutation appropiate to estimate the number ofelectrophoretically detectable alleles in a finite population. Genetical Research
22: 201-204.Pieczarka JC, Nagamachi CY, Barros RMS (1989): The karyotype of Ateles paniscus
paniscus (Cebidae, Primates): 2n = 32. Revista Brasileira de Genética 12: 543-551.
Raymond M, Rousset F (1995): GENEPOP (version 1.2): population genetics soft-ware for exact tests and ecumenicism. Journal of Heredity 86: 248-249.
Robertson A, Hill WG (1984): Deviations from hardy-Weinberg proportions, sam-pling variances and use in estimation of inbreeding coefficients. Genetics 107:703-718.
Rohlf FJ (1970): Adaptive hierarchical clustering schemes. Systematic Zoology 19:145-153.
Rohlf FJ (1982): Consensus indices for comparing classifications. Mathematical Bio-
sciences 59: 131-144.Rosenberger AL, Strier WG (1989): Adaptative radiation of the atelinae primates.
Journal of Human Evolution 18: 717-750.Rossan PN, Baerg DC (1977): Laboratory and feral hybridization of Ateles geoffroyi
panamensis Kellogg and Goldman, 1944, in Panama. Primates 18: 235-237.Ruiz-García M (2003): Análisis genético conservacionista de los géneros Lagothrix y
Ateles (Atelidae, Primates) mediante loci microsatélites: Evidencia de un re-ciente cuello de botella en Lagothrix lagotricha y en Ateles paniscus chamek. In:Nassar F, Pereira V, Savage A (eds.): Primatología del Nuevo Mundo: Biología,Medicina, Manejo, Conservación. Chapter 11. Fundación Araguatos, BogotáDC: 272-285.
Ruiz-García M (2005): The use of several microsatellite loci applied to 13 NeotropicalPrimates revealed a strong recent bottleneck event in the Wolly monkey(Lagothrix lagotricha) in Colombia. Primate Report 71: 27-55.
Ruiz-García M, Castillo MI, Alvarez D (2004): Evolutionary trends of NeotropicalPrimates according to the AP68 and AP40 microsatellites. In: Mendes SL,Chiarello AG, (eds.): A Primatologia no Brasil - Volume 8. Museu de BiologiaProf. Mello Leitno, Santa Teresa, Espirito Santo, Brasil: 65-100
Ruiz-García M, Escobar-Armel P, Mudry M, Ascunce M, Gutierrez Espeleta G,Shostell J (2006a): Microsatellite DNA analyses of four Alouatta species (Ateli-
dae, Primates): Evolutionary Microsatellite dynamics. Journal of Heredity
(submitted).Ruiz-García M, Escobar-Armel P, Alvarez D, Mudry M, Ascunce M, Gutierrez-
Espeleta G, Shostell J (2006b): Genetic variability in four Alouatta species mea-sured by means of nine DNA microsatellite markers: Genetic structure and re-cent bottlenecks. Folia Primatologica (in press).
Rylands AB, Rodríguez-Luna E, Cortés-Ortiz L (1997): Neotropical Primate conser-vation – The species and the IUCN/SSC Primate specialist group network. Pri-
mate Conservation 17: 46-69.Salazar-Bravo J, Tarifa T, Aguirre LF, Yensen E, Yates TL (2003): Revised checklist
of Bolivian Mammals. Ocasional Papers. Museum of Texas Tech University 220:1-27.
Serikawa T (1992): Rat gene mapping using PCR-analyzed microsatellites. Genetics
131:701-721.
Primate Report 73, July 2006 45
M. Ruiz-García et al.: Microsatellite DNA and craniometric data in Ateles

Sheed DH, Macedonia JM (1991): Metachromism and its phylogenetic implicationsfor the genus Eulemur. Folia Primatologica 57: 221-231.
Slatkin M (1985): Rare alleles as indicators of gene flow. Evolution 39:53-65.Slatkin M (1995): A measure of population subdivision based on Microsatellite allele
frequencies. Genetics 139: 457-462.Sneath PH, Sokal RR (1973): Numerical Taxonomy. Freeman. San Francisco.Strier KB (1992): Atelinae adaptations: Behavioral strategies and Ecological con-
straints. American Journal of Physical Anthropology 88: 515-524.Van Roosmalen MGM (1980): Habitat Preferences, diet, feeding strategy, and social
organization of the black spider monkey (Ateles paniscus paniscus) in Surinam.PhD. Thesis, University of Wageningen, Netherlands.
Weber JL, Wong C (1993): Mutation of human short tandem repeats. Human Molec-
ular Genetics 2: 1123-1128.Wehrhahn C (1975): The evolution of selectively similar electrophoretically detect-
able alleles in finite natural populations. Genetics 80: 375-394.Weir BS, Cockerham CC (1984): Estimating F-statistics for the analysis of popula-
tion structure. Evolution 38: 1358-1370.Wright S (1951): The genetical structure of populations. Annals of Eugenics 15: 323-
354.
Appendix 1
Cranial mandible and dental measurements (38) analyzed in 27 Ateles skulls fromColombia.
1-Maximum Transversal Width2-Zygomatic Width3-Superior Facial Height4-Total Facial Height5-Nasal Width6-Bigonian Width7-Auricular Height8-Greatest Skull Length9-Nasal Height10-Minimum Postorbital Width11-Maximum Postorbital Width12-Lower Face Length13-Base Face Length14-Basal Height15-Palate Length16-Palate Width17-Foramen Magnum Length18-Foramen Magnum Width19-Symphisis Height20-Maximum Length of Mandible21-Mandibular body Height between P1 and P2
46 Primate Report 73, July 2006
M. Ruiz-García et al.: Microsatellite DNA and craniometric data in Ateles

22-Mandibular body Height between M1 and M2
23-Mandibular body Height between M2 and M3
24-Mandibular Branch Width25-Mandibular Branch Height26-Biauricular Breadth27-Upper Canine Length28-Lower Canine Length29-Upper Canine Breadth30-Lower Canine Breadth31-Upper Molar Length32-Lower Molar Length33-Upper Molar Breadth34-Lower Molar Breadth35-Maximum Biorbital Width36-Orbital Height37-Opistion-Nasal Spine-Opistion Distance (subnasal prognathisme)38-Ectoconion-Nasion-Ectoconion Distance
Authors´address
Ruiz-García M (for comments and correspondence), Parra A, Romero-Aleán N,
Escobar-Armel P: Unidad de Genética (Grupo de Genética de Poblaciones-Biología Evolutiva), Departamento de Biología, Facultad de Ciencias, Ponti-ficia Universidad Javeriana, Cra 7ª No 43-82, Bogotá DC, Colombia. E-mail:[email protected]
Shostell JM: Department of Biology, Penn State University, Uniontown, PA 15401,USA
Primate Report 73, July 2006 47
M. Ruiz-García et al.: Microsatellite DNA and craniometric data in Ateles

SOCIAL RELATIONSHIPS IN A FREE-RANGING GROUP OF BONNET MACA-QUES IN TAMIL NADU, INDIA.
Mehu M, Huynen M-C and Agoramoorthy G
Key words: Bonnet macaque, India, social behavior, grooming, sexual interactions
AbstractSocial relationships in bonnet macaques (Macaca radiata) are reflected by exten-
sive affiliative and agonistic interactions between all individuals of different age,sex, dominance rank, and kinship groups. Adult females form strong linear domi-nance hierarchies with their daughters occupying ranks just below their mothers,which is typical among various Cecopithecine species. A habituated group of bonnetmacaque (Macaca radiata diluata) in the village of Surakkadu near the town ofSirkali (Nagapattinam District, Tamil Nadu State, south India), was observed to re-cord data on social behaviour. Females mainly initiated more affiliative behavioursthan males. There were significant inter-sexual differences for grooming behaviour,grooming invitation and huddling and females involved more in those interactions.However, males displayed more homosexual behaviours such as touching genitalsand presentation while females seldom mounted each other.
IntroductionSocial relationships in bonnet macaques (Macaca radiata) are reflected by exten-
sive affiliative and agonistic interactions between all individuals of different age,sex, dominance rank, and kinship groups (SINHA, 2001). Adult females form stronglinear dominance hierarchies with their daughters occupying ranks just below theirmothers, which is typical among various Cecopithecine species. Interestingly, bon-net macaque females rarely form coalitions against more dominant individuals thatmight reflect the acceptance of a rigid dominance hierarchy among females (SINHA,2001). However, many individuals seem to be able to develop complex social strate-gies like tactical deception, and use them in various social contexts such as competi-tion for food, access to mate and allo-grooming (SINHA, 2003).
Grooming relationships among bonnet macaque females are relatively intense,and mothers with newborn infants usually attract more attention than those with-out infants (KOYAMA, 1973; ALI, 1981). Besides, the higher frequency of unrecipro-cated grooming of subordinate individuals by dominant females seems to be aunique feature of the bonnet macaque. Nonetheless, pattern of grooming between fe-males can vary according to different ecological or stressful conditions (SINHA,2001; RAM et al., 2003). Adult males also form linear dominance hierarchies and itappears to be more distinct and unstable than those amongst females. Male hierar-chies are maintained through direct aggression and therefore depend on individual’sage and body conditions (Fig. 1). Unrelated males often form coalitions against othermales, and sometimes use male infants as potential buffer against aggression fromother males (SIMONDS, 1965; SUGIYAMA, 1971). However bonnet macaque malesappear to show greater signs of tolerance towards other males, as evident in affili-
Primate Report 73, July 2006 49
M. Mehu et al.: Social relationships among bonnet macaques

ative rituals, which are believed to reduce tension and to peacefully display and rein-force dominance rank. Furthermore, males groom each other at rates comparable tothose of females (SIMONDS, 1965; ALI, 1981; SUGIYAMA,1971; SILK, 1994). Thisstudy focussed on a group of wild bonnet macaques in India to understand the socialrelationships.
MethodsTwo subspecies of Bonnet macaques have been morphologically recognized in In-
dia: the northern M. radiata radiata, and the southern M. r. diluta. Between Febru-ary and May 2001, a habituated group of bonnet macaque (Macaca radiata diluata)in the village of Surakkadu near the town of Sirkali (Nagapattinam District), whichis located 270 km south of Chennai city (Tamil Nadu State, south India), was ob-served to record data on social behaviour. The wildlife populations including bonnetmacaques have been monitored in the study site since 1995 (AGORAMOORTHYand HSU 2001, 2002a,b, 2005; AGORAMOORTHY et al., 2000). The habitat of thegroup was a mosaic of fields planted with crops such as rice and beans, swamps (dur-ing the rainy season), grassland and pastures. The area occupied by the macaquegroup was about 2 km² with a large river Uppanar crossing nearby (AGORA-MOORTHY et al., 2000). The group had a composition of 21 individuals including 4adult males, 6 adult females, 6 juvenile males, 2 juvenile females, and 3 infants. All
50 Primate Report 73, July 2006
M. Mehu et al.: Social relationships among bonnet macaques
Fig. 1: Display of sharp canines by an adult male leader of the study group (Photo: G.Agoramoorthy).

adults were identified based on physical characteristics, and juveniles were classi-fied in two categories depending on their estimated age (AGORAMOORTHY et al.,2000).
Data presented here account for 30 days of behavioural observation with a totalof 225 hours of observations. Sampling periods were distributed during the day from6.30 am to 6.00 pm, covering 7.5 hours of data collection each day. All occurrences ofsocial interactions were recorded using 30 min focal animal sampling technique(LEHNER, 1996). Monkeys were identified as initiator – if they actively performedthe behaviour or receiver – if they received it. Events such as playing, huddling andsocial grooming were considered to be finished when they were interrupted either bya 10 sec period or by an inter-specific interaction. For grooming, duration was re-corded in seconds by noting beginning and finishing time. Behaviours were recordedon observation sheets along with other information such as the identity of individu-als involved in the interactions, date, time of day, and weather conditions.
Affinity indexes were calculated for each pair based on the total of their encoun-ters. A status hierarchy was set up according to dominance index that was calcu-lated for each individual on the basis of agonistic and submissive interactions:
Dominance index = (% (agonistic initiated / agonistic received)) / (submissive initiated / submissive received).
For the analysis of relations between grooming and dominance, the status of eachmonkey was assessed in regards to the status of other monkey in the pair. The meanduration of a grooming bout for each pair was calculated by dividing the total timespent grooming by the total number of bouts for each pair. Independent sample Stu-dent t-tests as well as paired sample Student t-tests were used for analyses. Whenrequirements were not met for these tests, their non-parametric counterparts wereused –Wilcoxon rank test for matched and independent samples. Correlation analy-ses were performed through Kendall test. The p value was fixed at 0.05 for bilateraltests. Statistical analyses were performed using SAS software (2000).
Results and discussionA total of 3429 affiliative interactions were observed during this study. Females
initiated more affiliative behaviours than males (t= 2.31; p< 0.05). There were signif-icant inter-sexual differences for grooming behaviour (t= 5.58; p= 0.001), groominginvitation (t= 3.15; p< 0.02) and huddling (t= 3.87; p= 0.01) and females involvedmore in those interactions (Fig. 2). However, males displayed more homosexual be-haviours such as touching genitals (t= 7.18; p< 0.001 for received behaviours only)and presentation (t= 3.95; p< 0.01) while females seldom mounted each other (Fig.2). Females initiated more affiliative behaviours toward females than males (Ws= 0;p= 0.015). Males initiated affiliative interactions more frequently toward femalesthan vice versa (t= 3.8; p< 0.01). Besides, females initiated affiliative behavioursmore frequently toward infants than males (Ws= 10; p< 0.01; Fig. 3). In contrast,males initiated affiliative actions more frequently toward older juveniles (6 monthsto 3 years) than females (Ws= 11; p= 0.02; Fig. 3). Inter-sexual interactions throughaffinity scores revealed a significant correlation between sexual and affiliative inter-actions (T= 0.31; p= 0.03).
Involvement in sexual interactions varied in terms of dominance rank and therewas more variation within males than females. The F-max test for homogeneity of
Primate Report 73, July 2006 51
M. Mehu et al.: Social relationships among bonnet macaques

variance showed a significant difference between variances within sex categories(F=12.68 in males; > 7.76 in females). Analysis at the level of dyads gave interestingresults-mixed dominant dyads (dominant males with dominant females) were in-
52 Primate Report 73, July 2006
M. Mehu et al.: Social relationships among bonnet macaques
0
20
40
60
80
100
120
140
A B C D E F G H I J K
males
females
me
an
fre
qu
en
cy
Fig. 2: Affiliative behaviours displayed by adult bonnet macaques. (A) contact, (B)solicitation to grooming, (C) allo-grooming, (D) huddling, (E) hugging, (F) play, (G)presentation, (H) touching genitals, (I) homosexual mounting, (J) greeting, and (K)mouth sniffing.
0
10
20
30
40
50
60
70
80
90
males females
males
females
juv.1juv.2
me
an
fre
qu
en
cy
Fig. 3: Direction of affiliative behaviours displayed by adult bonnet macaques.

volved in more sexual interactions than any other type of dyad (dominant vs.crossed: t= 2.97; p< 0.01; dominant vs. subordinate: t= 2.31; p< 0.05; Fig. 4). Correla-tion analysis on mixed pairs showed a significant association between sexual andaffiliative affinity scores (T= 0.31; p= 0.03). The mean duration of grooming boutswas significantly longer when directed from subordinate to dominant individualsthan when directed from dominants to subordinates (t= 2.34; p= 0.03) and the trendwas more obvious in females (t= 2.05; p= 0.059) than in males (t= 1.46; p= 0.2).
Females engaged significantly more often than males in allo-grooming, and thedominance rank was relevant to grooming only in females. Grooming bouts ap-peared to be significantly longer when directed to the dominant individual of thepair. These findings support an earlier study where grooming among adult maleswas less common than females, and grooming in male bonnet macaques appeared tobe unrelated to rank (SUGIYAMA, 1971). As a matter of fact, female grooming wasrelated to rank and grooming relationships could play an important role in regulat-ing other aspects of females’ social life. For example, among captive bonnet ma-caques, low ranking females obtained temporary protection from aggression bygrooming high ranking females (SILK, 1982). Yet, it was not clear whether the riskof being harassed was also reduced outside the grooming context, so more data bothfrom the wild and in captivity are needed to address this issue.
The prevalence of particular behaviours in a given sex class suggests that malesand females differed in the way they lead affiliative relationships with individuals oftheir own sex class. Males did not groom as much as females and they were more in-
Primate Report 73, July 2006 53
M. Mehu et al.: Social relationships among bonnet macaques
0
5
10
15
20
25
30
35
dominant-dominant dominant-subordinate subordinate-subordinate
agonistic
affiliative
sexual
me
an
aff
init
ys
co
res
Fig. 4: Social relationships in different dyad types among bonnet macaques. Threetypes of dyad could be defined according to the status of the monkeys involved: domi-nant dyad (dominant-dominant), crossed dyads (dominant-subordinate) and subor-dinate dyads (subordinate-subordinate).

volved in homosexual behaviours. Indeed, homosexual behaviours lasted only for afew seconds whereas grooming or huddling sessions lasted more than half an hour.It follows that females of this group could be regarded as more closely associatedthrough affiliative interactions than males and it supports the hypothesis thataffiliative interactions between males could be used to peacefully maintain hierar-chical relationships rather than to establish long lasting bonds (SUGIYAMA, 1971;RASMUSSEN, 1983).
Our study also showed that relationships between opposite sex were mainlybased on sexual interactions. In addition, the correlation we observed between sex-ual and affiliative affinity indicates that pairs that showed more affiliative relation-ships were likely to involve in sexual interactions. Along with the general tendencythat males initiated more sexual interactions than females, we observed that malesalso initiated more affiliative behaviours toward females. Considering that the prox-imate outcome of affiliative interactions is a decrease in tension, our observationssuggest that males’ endeavour to gain access to mate is not only reflected by obvioussexual behaviours but also by efforts to preserve a context facilitating sexual inter-actions. Behaviour of pairs that associate in non-sexual contexts may achieve ahigher degree of coordination than others, thereby increasing the probability of ferti-lisation as suggested for the baboons (RASMUSSEN, 1983). Dominant females alsoshowed more participation in sexual interactions, but the variation between individ-uals of that class was significantly lower than variation within males. In addition,our study showed that dominant mixed pairs (a dominant male with a dominant fe-male) were involved more frequently in sexual relationships than any other type ofpair, which is similar to earlier studies of bonnet macaques (GLICK, 1980; SILK etal., 1981).
Acknowledgements
We would like to express our sincere thanks to the S. M. Govindasamy NayakkarMemorial Foundation for the hospitality and logistic help during the course of fieldwork. We acknowledge the CECODEL ULg and the Fondation Lefranc for their sup-port. We are grateful to Dr. A. C. Wegria, Dr. G. Thirupurasundari, and Mr. GoviNatarjan for their encouragement, support and assistance.
References
Agoramoorthy G, Hsu MJ (2001): Predatory attack on bats by barn owl (Tyto alba)and shikra (Accipiter badius) in Tamilnadu state, south India. Journal of Bom-
bay Natural History Society 98: 107-108.Agoramoorthy G, Hsu MJ (2002a): Biodiversity surveys are crucial for India. Cur-
rent Science 82: 244-245.Agoramoorthy G, Hsu MJ (2002b): Sighting of the smooth otter (Lutra perspicillata)
in Nagai district along the Bay of Bengal coast, Tamilnadu. Journal of Bombay
Natural History Society 99: 501-502.Agoramoorthy G, Smallegange I, Spruit I, Hsu MJ (2000): Swimming behaviour
among Bonnet macaques in Tamil Nadu. Folia Primatologica 71: 152-153.
54 Primate Report 73, July 2006
M. Mehu et al.: Social relationships among bonnet macaques

Agoramoorthy G, Hsu MJ (2005): Occurrence of short-nosed fruit bat, Cynopterus
spinx in villages of Tamilnadu State, India. Journal of Bombay Natural History
Society 101: 304-305.Ali R (1981): The ecology and social behaviour of the Agastyamalai bonnet macaque.
Ph.D. thesis, Bristol University, Bristol, U.K.Glick BB (1980): Ontogenic and psychobiological aspects of the mating activities of
male Macaca radiata. In: Lindburg DG (ed.): The macaques: Studies in ecology,behavior, and evolution. Van Nostrand Reinhold (1980), New York: 345-369.
Koyama N (1973): Dominance, grooming and clasped-sleeping relationships amongbonnet monkeys in India. Primates 14: 225-244.
Lehner P: Handbook of Ethological Methods. Cambridge University Press (1996).Ram S, Venkatachalam S, Sinha A (2003): Changing social strategies of wild female
bonnet macaques during natural foraging and on provisioning. Current Science
84: 780-790.Rasmussen KRL (1983): Influence of affiliative preferences upon the behavior of
male and female baboons during sexual consortships. In: Hinde RA (ed.): Pri-
mate relationships: An integrated approach. Sunderland, Massachusetts: Si-nauer Associates: 116-120.
SAS Institute (2000): SAS/ETS Software: changes and enhancements. Version 8.1,Cary.
Silk JB (1982): Altruism among female Macaca radiata: explanations and analysispatterns of grooming and coalition formation. Behaviour 79: 162-188.
Silk JB (1994): Social relationships of male bonnet macaques: male bonding in amatrilineal society. Behaviour 130: 271-291.
Silk JB, SamuelsA (1984): Triadic interactions among Macaca radiata: Passportsand buffers. American Journal of Primatology 6: 373-376.
Silk JB Samuels A, Rodman PS, Clark-Wheatley C.B (1981): Differential reproduc-tive success and facultative adjustment of sex ratios among captive female bon-net macaques (Macaca radiata). Animal Behavior 29: 1106-1120.
Simonds PE (1965): The bonnet macaque in South India. In: DeVore I (ed): Primate
Behavior – Field Studies of Monkeys and Apes. Holt, Rinehart and Winston,New York: 175-196.
Sinha A (2001): NIAS Report R2-01. National Institute of Advanced Studies, Ban-galore.
Sinha A (2003): A beautiful mind: Attribution and intentionality in wild bonnet ma-caques. Current Science 85: 1021-1030.
Sugiyama Y (1971): Characteristics of the social life of bonnet macaques (Macaca
radiata). Primates 12: 247-266.
Authors´address
Mehu, M: University of Liverpool, United KingdomHuynen M-C: Université de Liége, BelgiumAgoramoorthy, G (for comments and correspondence): Department of Pharmacy,
Tajen University, Yanpu, Pingtung 907, Taiwan; e-mail: [email protected]
Primate Report 73, July 2006 55
M. Mehu et al.: Social relationships among bonnet macaques

APPLIED PRIMATOLOGY IN ZOOS: HISTORY AND PROSPECTS IN THEFIELD OF WILDLIFE CONSERVATION, PUBLIC AWARENESS AND ANIMALWELFARE.
Gippoliti S
"Immediately I was struck by the physical magnificence of the huge jet-black bodies
blended against the green palette wash of the thick forest foliage"
Dian Fossey – Gorilla in the mist, 1983
"They didn’t look very attractive, with their squared-off muzzles, their dull hair, and
their red hindquarters. That hamadryas baboons can be beautiful I experienced only
later in Ethiopia when, after hesitating at length, a hundred of them descended from
their sleeping rock in the morning."
Hans Kummer – In Quest of the Sacred Baboon, 1995
Key words: zoological gardens, primates, animal welfare, conservation education
AbstractA short historical overview of primate keeping is offered showing how each gener-
ation of zoo managers tried to improve standards according to prevailing scientificknowledge. This historical approach to primate husbandry may help to identify ar-eas of concern about current management and husbandry techniques, often ob-scured by the current overenthusiastic rhetoric on modern zoo exhibits. Examplesare given of issues potentially of great welfare significance deserving more scientificinvestigation, such as behavioural properties of diets, indoor/outdoor housing, cli-matic factors, species-specific social structure, birth control and intraspecific com-munication. Given ambiguity in defining ‘animal welfare’, it is argued that zoosshould give priority to emphasizing the conservation message of their primate ex-hibits.
IntroductionIn recent years, there has been a growing tendency to consider the last two de-
cades as a new era in the management of zoo animals, and primates in particular(WALLIS, 1997). The great influx of scientific research into zoo primate manage-ment has been considered sufficient to coin the term ‘applied primatology’ to indicatethe developments in the sector beginning from the 1980s (MAPLE and FINLAY,1989). At the same time, a shift of zoos’ interest from public entertainment to wildlifeconservation has been universally reported (e.g. Rabb, 1994), reinforcing a clear-cutview of zoo history. A more thorough look at the specialised literature shows the ex-istence of several areas of concern, ranging from nutrition to breeding programmesand public response to new exhibit styles (e.g. KAUMANNS et al., 1998/1999;
Primate Report 73, July 2006 57
S. Gippoliti: History of Primates in Zoos

KAUMANNS et al., 2000; HYSON, 2000). Although it would be foolish to overlookthe somewhat drastic changes occurring in the exhibition criteria of the major zoosor the increasing success in captive breeding, self-originating claims by contempo-rary zoos to be ‘primate Edens’ seem quite exaggerated, or, at least, premature. Inparticular, there is often assumed to be a strong correlation between ‘naturalistic’(generally meaning ‘without bars’) enclosures and improved animal welfare (MELFIand FEISTNER, 2002). However, there is confusion between the public perception ofhow animals respond to ‘naturalistic’ habitats and the actual response of the ani-mals themselves (ROBINSON, 1999). Furthermore, neglecting the long history ofprimate keeping in zoos might cause the loss of precious knowledge of great utility infurthering current zoos’ goals and animal welfare. This is particularly important asscientific knowledge is translated into legislation about zoos and animal welfare, butmost studies on animal welfare and environmental enrichment originated in labora-tories whose living standards are, on average, lower than in zoos (cf BUCHANAN-SMITH et al., 2004).
The present paper is intended to briefly review the history of primates in zoos, tooutline the many fashions in primate-keeping and to identify those aspects in zooprimate exhibits and management that are crucial to achieve zoos’ multi-facetedgoals.
A short overview of primate zoo exhibit history
A comprehensive history of zoo primate-keeping has yet to be written. However,knowledge of the developments of some of the world’s major zoos might furnishenough information about the general trends in primate management history. Thefoundation of the Menagerie at the Jardin des Plantes of Paris in 1793 is usually con-sidered the birth date of scientifically-managed zoos, i.e. those directed by a scien-tific staff with the stated purpose of contributing to public education and acquiringknowledge of the animal world (HANCOCKS, 2001a). In 1828 the Menagerie of theZoological Society of London was founded. The great contribution to scientific knowl-edge achieved by these two early zoos is sharply in contrast with the recent introduc-tion of science in primate management advocated by MAPLE and FINLAY’S (1989)definition of ‘applied primatology’. Furthermore, a technical bulletin of the Germanzoo directors, Der Zoologische Garten, has been published ever since 1859, and tech-nical innovations have been continuously introduced during the long history of zoos.Glass panels to separate apes from visitors, for example, were introduced in Frank-furt as early as 1871 (RAWLINS, 1979). In Paris the original ‘singerie’ opened in1837 consisted of a big rounded outdoor cage connected to several smaller indoorcages. In the ‘singerie’ of the Royal Turin Zoological Garden, ten small indoor cageswere connected to the large, glass-covered outdoor cage (MASCHIETTI et al., 1990),thus greatly limiting the opportunities of outdoor access to all primates, but in De-cember 1871 hamadryas baboons were held outside in the carnivore section at -7°C(GIPPOLITI, 1997). In 1864 London Zoo opened a new glass-house style MonkeyHouse with only indoor accommodation for the animals, an approach which subse-quently became widespread in Europe at the time. The technical premise of such achoice was the unsuitability of the European climate for tropical animals, includingprimates. The deleterious effects of this kind of accommodation on the animals’ skel-
58 Primate Report 73, July 2006
S. Gippoliti: History of Primates in Zoos

etal growth were evidenced by Bland Sutton (1884). Peter Chalmers, from 1903 Sec-retary of the Zoological Society of London, wrote "The most fatal type of housing forany mammal or bird is confinement in the interior of a warmed house without freeaccess to open air… The first requisite is free access to open air, the next is light,space and cleanliness…. For all mammals and birds, steady exposure to an eventemperature is unnatural and unhealthy; change is a necessary condition for viabil-ity and longevity" (cited in HUXLEY, 1981). However, already in 1875 Munster Zoohad a monkey house in which the animals could move as they pleased from outside toinside all the year round through specially designed metal doors (Hancocks, 1971).On empirical grounds, the importance of the climatic factor was also challenged byCarl Hagenbeck, a unique figure of animal trader, trainer and zoo man. With theaim of reducing costs and exhibiting animals in more natural settings, Hagenbeckwas a strong supporter of the ‘acclimation’ of tropical animals to temperate climates.His monkey houses were simple, unheated buildings always provided with outdoorcages. In the period 1912-1913, Hagenbeck and his team created in Stellingen (Ham-burg) and in Rome the first naturalistic, bar-less exhibits for primates (Fig. 1). InRome Zoo’s original ‘Monkey Village’ (1912), Indian temples and living plants, in-cluding two hundred-year-old pine trees, were surrounded by a dry moat. The ma-caques, mainly Macaca mulatta, were kept outside year-round, and went to sleephigh in the trees at night (KNOTTNERUS-MEYER, 1925). Although this kind ofopen exhibit became widespread in zoos around the world, their use was restricted tothe more robust, terrestrial baboons and macaques. Their utilisation was oftenabandoned after problems encountered with diseases and social conflicts, such asthose described in the pioneering work of ZUCKERMAN (1932).
Primate Report 73, July 2006 59
S. Gippoliti: History of Primates in Zoos
Fig. 1: Macaques in the Monkey Village of Rome Zoo, realised in 1912.

The sanitary epoch
Knowledge of problems encountered in those years is essential to understandingthe rise of the modernistic-hygienist style in zoo architecture in the last Century. In1932, for instance, a family of chimpanzees, including the first captive-bred one to bereared successfully in Europe, was killed by TB at the Rome Zoo (D’ALESSANDROand GIPPOLITI, 1996). Hygienic developments were positively accepted by Hediger,the founder of zoo biology, who emphasized the need for functionality in cage designinstead of romantic attempts to recreate the wild (HEDIGER, 1950). Hediger greatlyopposed another development in zoo management after World War II, i.e. the prepa-ration of standard diets for zoo animals (HEDIGER, 1965). It is interesting to notethat, while zoo design has now universally condemned the barren hygienic cagestyle, much less attention seems devoted to the effects on welfare and physiology ofthe now widespread commercial zoo diets, despite a few cautionary papers on thesubject (STOLLER et al., 1989; SCHWITZER and KAUMANNS, 2001).
However, going back to exhibit design, "sanitary modernism" coupled with zoos’desire for "postage-stamp" style collections resulted often in highly restricted anddeprived habitats for primates in zoos. Particular attention was devoted to apes’ ac-commodation and care. Before World War II, they were often kept permanently in-doors, with no access to water, all food boiled and peeled, and no bedding materialwas provided for nesting (CRANDALL, 1964; STEMMLER-MORATH, 1968). YetDesmond Morris and Caroline Jarvis, while introducing a special section on GreatApes in the first volume of the International Zoo Yearbook in 1960 (a classical refer-ence on scientific zoo-husbandry for almost half a century now) say "Methods of ex-hibiting and caring for great apes in captivity have improved tremendously duringthe past twenty years". In fact, several modern monkey or great ape houses werebuilt in those years, often copying one another. New primate and ape houses made ofglass, concrete and steel, sometimes without outdoor accommodation, were firstopened in Philadelphia in 1958 and successively in Frankfurt, Berlin, Antwerp,Basle, Zurich etc. Apart from hygienic factors, there was often little improvementuntil the 1970s. Scientists made proposals to improve the situation of captive apes,particularly chimpanzees, as field work on these animals increased (KORTLAND,1961; REYNOLDS and REYNOLDS, 1965). In the 1950s outside enclosures withwater moats were created for great apes in continental-climate zoos, for instance atthe Bronx Zoological Park, where the male gorilla Makoko drowned in 1951. Thisevent inaugurated a list of tragedies still continuing in our days (PATEROK, 2004),highlighting the conflict between aesthetically pleasant open exhibits and animalwelfare. Chimpanzees generally achieved more success; in 1956 Chester moved itsgroup onto islands surrounded by a water moat (MOTTERSHEAD, 1960). In theArnhem Zoo, a large colony of chimpanzees was assembled and a complex outdoorhabitat, including living trees, created (VAN HOOFF, 1973). In the sixties specialhouses were created to exhibit, through an inversion of the day-night regime, activenocturnal animals including primates (MORRIS, 1965). Although these ‘nighthouses’ are now losing popularity, the high artificiality of this kind of captive habitatsuggests that more research should be directed toward the assessment of welfareamong primates in zoos’ night houses (SCHULZE, 1998). Interestingly, good resultshave been reported with owl monkeys of the genus Aotus kept in naturally lightedcages (WALTER and BROWN, 2004). Among the few early examples of more natu-
60 Primate Report 73, July 2006
S. Gippoliti: History of Primates in Zoos

ralistic habitats, gibbons were introduced to islands surrounded by water first by theFrench ornithologist Delacour in his own park at Clères in 1926 (DELACOUR, 1933)and later in 1934 at the new Paris Zoo in Vincennes and at Rome. For decades, how-ever, many improvements in primate keeping were introduced by practitioners run-ning their own private zoos, and thus far from the scientifically-managed collections.Foremost I would mention the late John Aspinall for having introduced so many cru-cial aspects in the management of zoo gorillas, mainly utilising available informa-tion from field studies and recognising the need to adopt an individualistic attitudein the care of these animals. His ‘gorillariums’ are nothing more than large cagesable to hold a large social group of gorillas, with deep litter of oat straw and a roofopen to the weather and cobwebbed with brachiating bars (ASPINALL, 1986). De-spite being one of the two most successful breeding colonies in the world, Aspinall’sfunctionalist model has been largely ignored by the zoo world, now launched uponthe landscape immersion architecture.
Landscape immersion
A number of criticisms have been made of the old zoo exhibits by zoologists, psy-chologists and landscape architects (MORRIS, 1964; SOMMER, 1972; COE, 1985).The rise of environmental issues in developed countries made still more evident thefact that, leaving apart objective welfare criteria for zoo animals, the message ofhard architecture in zoos was one of anthropocentrism and superiority of humansover wildlife (SOMMER, 1972). To reverse the situation, the landscape immersionapproach was used extensively in the Seattle Zoo master plan developed by HAN-COCKS, JONES and COE in 1976 (GOLD, 1997; HYSON, 2000). Later, a manifestofor a naturalistic way to present and manage animals in zoos appeared authored bythe Seattle team of biologists (HUTCHINS et al., 1984). It is interesting to note how-ever that one of the most excellent attempts to simulate a landscape immersion ex-perience with captive primates preceded this paper by many years. In the sixties, theMiami Monkey Jungle allowed the public access to a one and a half hectare tropicalrain forest including several species of South American primates, such as the deli-cate red uakari Cacajao calvus (FONTAINE and DUMOND, 1977). On the otherhand is a fact that several of the costly large indoor ‘tropical rain forest’ facilities de-veloped in the US since the eighties appear not substantially different from the oldbare cages of the past, as the naturalistic experience (i.e. living plants) is mostly lim-ited to the public pathway (HANCOCKS, 2001a,b). This may be due to the extremelyhigh construction costs of this kind of exhibit (RUSSELL and WEST, 1997) and lackof space. Furthermore, even when spacious and naturalistic outdoor exhibits areavailable, animals may spend most of the twenty-four-hour day in smaller indoorholding cages that are almost perfect replicas of the old barren cages (HANCOCKS,2001b), and this may lead to stressful situations (AURELI and DE WAAl, 1997). De-spite the importance of this aspect of the life of zoo animals, the issue does not ap-pear to attract much scientific interest. However, a number of European institu-tions, such as the zoos of Apenheul (NL), Jersey (GB) and Rheine (GER), have beenable to create fine outdoor naturalistic exhibits without the exaggerated costs of zoosin North America (MAGER and GRIEDE, 1986; REDSHAW and MALLINSON,1991; SALZERT, 1989).
Primate Report 73, July 2006 61
S. Gippoliti: History of Primates in Zoos

A look at the present without rhetoric: are we really approaching Eden in zoos?
While ‘animal welfare’ is becoming an autonomous and respectable issue, manycrucial aspects of the management of wild animals in zoos seem to receive scanty at-tention by researchers. Only recently, for instance, have the effects of high tempera-ture and insulation on gorilla behaviour received attention (STOINSKI et al., 2001)despite its known basic importance for animals. Coupled with the preference of peo-ple to visit zoos in the hottest part of the day and of the year, it is no surprise that vis-itors often lament seeing only inactive animals. Perhaps, it is necessary for zoos toincrease the opportunity to see animals when they are more active, for instance inlate afternoon, even changing their opening hours and daily husbandry regimes.
Furthermore, modern naturalistic exhibits are intrinsically more prone to es-capes and present more ‘dangers’ to the animals (e.g. water moats). This makes it ab-solutely necessary to lock animals in the indoor holding quarters for the night, sothat most animals spent only the hottest hours in the large, often inadequatelyshaded, naturalistic enclosures. Although there are no studies on this aspect, pri-mates seem to benefit from the free access to outside enclosures when climatic condi-tions allow it, even to the point of refusing food by not entering indoor cages in theevening during the good season (GIPPOLITI, pers. obs. on chimpanzees).
How functional are naturalistic exhibits? Recent studies on the western lowlandgorilla highlighted the importance of arboreality and frugivory for this species and ofswampy areas (bai) for feeding and social behaviour (DORAN and MCNEILAGE,1998; PARNELL and BUCHANAN-SMITH, 2001). All too often even the best ‘natu-ralistic’ enclosures lack these crucial features, including nest building opportunitiesfor apes (PRUETZ and MCGREW, 2001), that significantly reduce the educationalpotentialities of these exhibits. The functionality of the exhibit (for instance for arbo-real monkeys) may be enhanced through the inclusion of artificial structures (trees,lianas etc.) accurately inserted in an ‘ecologically representative’ habitat with natu-ral soil, real trunks and living plants, as has been done in Atlanta (CHANG et al.,1999). As stated by FORTHMAN QUICK (1984), hidden mechanical feeding appara-tus can encourage arboreal locomotion in primates without damaging the naturalis-tic impressions of these exhibits. Further, a compromise must be found between theneed to protect some living vegetation and the need of the animals to interact with it.However, especially in northern climates, the transformation of outdoor naturalisticexhibits to ‘living habitats’ will necessarily require a change in the strict routinesimposed on most captive primates, allowing longer access and greater functionality(feeding) of the outside area at least in the good season. Actually, it is not rare to seegorillas and orangutans not using outdoor areas, probably for a number of reasonssuch as lack of furnishings, stimuli such as feeding, shade etc. (GIPPOLITI, pers.obs.).
Another matter receiving little interest is the effects of ‘social impoverishment’on the activity of zoo animals. Even successful species in captivity, such as thethreatened lion-tailed macaque Macaca silenus, are known to be held in sub-optimalsocial conditions that can lead to negative consequences for the long-term survival ofthe species in captivity (KAUMANNS et al., 2001). More generally, the old tradi-tional primate houses allowed at least visual and acoustic contacts and communica-tion among several – closely related – species housed in rows of tiny and barrencages. This kind of ‘social enrichment’ (although probably sometimes quite stressful
62 Primate Report 73, July 2006
S. Gippoliti: History of Primates in Zoos

for the more delicate species) is today declining as fewer and fewer species are exhib-ited by a single zoo and each cage is visually and acoustically isolated from the next.In some modern exhibits this is counteracted by creating multi-species assemblagesresembling those polyspecific associations that occur in the wild (Hardie et al., 2003)or by allocating several enclosures to more than one social unit of the same species,as has been done with gorillas in Atlanta (MAPLE, 1993), geladas in New York(DOHERTY, 1991) and orang-utans in Apenheul (JENS, 2001).
If training through positive reinforcement represents a cognitive enrichment forcaptive primates (Shepherdson, 2003), its origin goes back to Hagenbeck and manyothers who recognized the importance of mental occupation especially for apes(HAGENBECK, 1909; STEMMLER-MORATH, 1968). Consequently, the value offormer chimpanzee ‘tea parties’ and similar shows should perhaps be reconsideredat least from the point of view of animal welfare, even if they are counterproductivefrom a conservation and educational perspective.
Closely related to social factors is the problem of birth control. An ever increasingnumber of primate species are subject to population management that requires birthcontrol through chemical or surgical methods. Not only may this be a problem in themanagement of captive populations of threatened species (DE VLEESCHOUWERet al., 2000), but, considering the importance of parental care in primates, it is inevi-table that breeding suppression should produce negative consequences on group sta-bility and on the typical expression of some behavioural patterns in captive primates(PRICE, 1997; De VLEESCHOUWER et al., 2003). Again, Hediger’s opinion on thismatter was very clear: "For the majority of surplus zoo animals, the best solutionwould be a kind of cropping, the humane selective elimination of those animals thatcan no longer be maintained. Of course, for the zoo biologist, who seeks to preservehealthy living species, this is a tragic way…. This method, however, is certainly pref-erable to surgical or medicinal castration, which would force the animal into an un-natural lifestyle" (HEDIGER, 1982). It is thus necessary that breeding control be im-plemented giving attention not only to population management factors but also toeach species’ social system.
While the nutritional value of food for captive animals has traditionally receivedgreat attention (RATCLIFFE, 1966; MANGILI, 1970; WACKERNAGEL, 1977), itsbehavioural properties have been greatly neglected (but see HEDIGER,1965 andADESSI et al., 2005). It should be noted, however, that old diet routines were morevaried than is usually thought. According to KNOTTNERUS-MEYER (1925) themacaques in Rome were fed three times a day. At 8.00 am they received tea withbread and milk, at 12.00 carobs, maize, rice and different kinds of leaves and gras-ses, plus figs, cherries and fennel seasonally. The last meal at 5.00 pm (6.00 in sum-mer) included onions, apples, potatoes and chestnuts, all whole and boiled. It isknown that food availability affects the sociality of the different primate species as ofmost other organisms (WRANGHAM, 1980), and that the same species can show adifferent social structure as a response to different environments and food availabil-ity. Therefore, a greater attention to food presentation to meet the particular needsof each species may be crucial to maintain its typical social organization and in-crease the educational relevance of the exhibit. The positive effect has been demon-strated of providing whole rather than chopped fruits to medium-sized primates(SMITH et al., 1989). Feeding schedules in zoos are often highly predictable. In a
Primate Report 73, July 2006 63
S. Gippoliti: History of Primates in Zoos

study on the effects of unpredictable feeding in a laboratory colony of Macaca arcto-
ides, WAITT and BUCHANAN-SMITH (2001) argued against the usefulness of add-ing such variables to the husbandry schedule. However, the fact that the studiedmacaques received only a piece of fruit in the morning may explain how delays in theafternoon meal could create a stressful situation due to severe hunger. Thus it islikely that in the more varied and appropriate zoo husbandry schedule, adding somelevels of unpredictability may be really advantageous for the animals. Much re-mains to be done concerning techniques such as scattering food like seeds in the sub-strate to increase foraging time (ANDERSON and CHAMOVE, 1984). This appearsa proper enrichment for semi-terrestrial species such as baboons Papio spp., manymacaques Macaca spp. and the green monkey Chlorocebus aethiops (the speciesmost commonly kept in laboratories), but it is completely inadequate for the manyarboreal species found in zoos. Habituation to move and forage on the ground hasnegative consequences on the survival of captive-bred reintroduced primates (CAS-TRO et al., 1998; BRITT et al., 2001). But even if they will never be released into thewild, zoo primates living mostly on the ground greatly reduce their educational po-tential and will possibly negatively affect visitors’ response to the exhibit and to theconservation message (GIPPOLITI, 2000). Contrary to public belief, arboreal pri-mates may be better suited to mesh enclosures that provide them more usable verti-cal space (GOLD, 1997). This issue certainly deserves more attention from research-ers and designers (e.g. ZIMMERMANN and FEISTNER, 1996). More traditionalcages may allow arboreal primates to be fed on the top mesh and exhibit proper loco-motion behaviour (BRITT, 1998), so it should be worthwhile to try to reconcile thefunctionality of a mesh roof with a naturalistic, fence-less exhibit.
Negative effects of visitors on the behaviour of zoo primates, particularly ontamarins (GLATSTON et al., 1984), may be linked to the small size and reducedheight of the cages in which these minuscule monkeys are usually kept (Fig. 2a,b).
64 Primate Report 73, July 2006
S. Gippoliti: History of Primates in Zoos
a
b
Fig. 2 a,b: Glass panels as barriers are no panaceafor housing zoo primates in optimal living condi-tions.

These negative effects can be easily counteracted by providing larger and highercages (WORMELL and BRAYSHAW, 2000). However, species of Cercopithecidaeand in particular of the genus Cercocebus may be highly susceptible to human audi-ences (MITCHELL et al., 1991), although the effects on fertility and social relation-ships are not well understood. It is important that zoo design recognize species-spe-cific responses to visitors and try to ameliorate such problems.
ConclusionsA critical review of zoo primate husbandry history does not allow the identifica-
tion of a clear-cut demarcation in philosophies and techniques around the 1980s, asis often argued. It is true, however, that at that time the environmental crisis and in-creasing attention to animal welfare in national legislations required greater in-volvement in these fields by zoos. Considering how little we still know about ‘animalwelfare’ and how to measure it (DAWKINS, 1998; CHANG et al., 1999; LITTLE andSOMMER, 2002; HOSEY, 2005), priority should be accorded to exhibit designs (Fig.3) and husbandry regimes which enhance the intuitive conservation message of zoos(LINDBURG and COE, 1995). This should be possible if zoo primates are given theopportunity to transmit the same wonderful experience primates in the wild are ableto send (see the two quotations from Diane Fossey and Hans Kummer printed at thebeginning of this article). While reintroduction to the wild appears a secondary goalfor zoos nowadays (HUTCHINS and CONWAY, 1995), the maintenance of appropri-ate behavioural repertoires and patterns in the captive populations (VAN HOFF,1986; RABIN, 2003) respond to the educational goals and conservation ethics ofwhat a modern zoo should be. Only recently has the importance of habitat size de-pendent factors in wildlife conservation begun to be fully appreciated (i.e. BAILLIEet al., 2000). Concurrently with their conservation mission, zoos should plan theirexhibits not only to satisfy animal needs but also to highlight the need for large ar-eas of undisturbed landscape if we really want to save biodiversity. In fact, well-keptand ‘happy’ primates in small zoo exhibits may lead visitors to overlook the impor-tance of area size for the conservation of biodiversity (GIPPOLITI and SPERANZA,2005). Popular exhibits such as those allowing a closer contact with primates (e.g.WEBSTER, 2000) should be critically reviewed in the light of the dangers posed bytourism (i.e. transmission of disease) to free-ranging primates (WALLIS and LEE,1999; WOODFORD et al., 2002). Actually, it is time for zoos to recognize that if theywant to serve as serious conservation organizations, they need to consider not onlyopportunities but also constraints imposed by this new role. While using twenty-first-century attitudes to judge zoo history is obviously inappropriate, knowledge ofthe historical developments in primate husbandry and an assessment of currenthusbandry routines is often overlooked. Research on environmental enrichment inlaboratories highlighted some issues (e.g. the effects of inanimate objects) whilesome basic aspects such as the effects of diet and feeding routines, outdoor housingand variable temperatures have been incredibly overlooked. In agreement with amore holistic natural history-based approach to animal welfare and environmentalenrichment proposed by NEWBERRY (1995) and MELLEN and MACPHEE (2001)more focused scientific investigations of zoos’ current husbandry may greatly benefitour understanding of animal welfare problems and how to overcome them.
Primate Report 73, July 2006 65
S. Gippoliti: History of Primates in Zoos
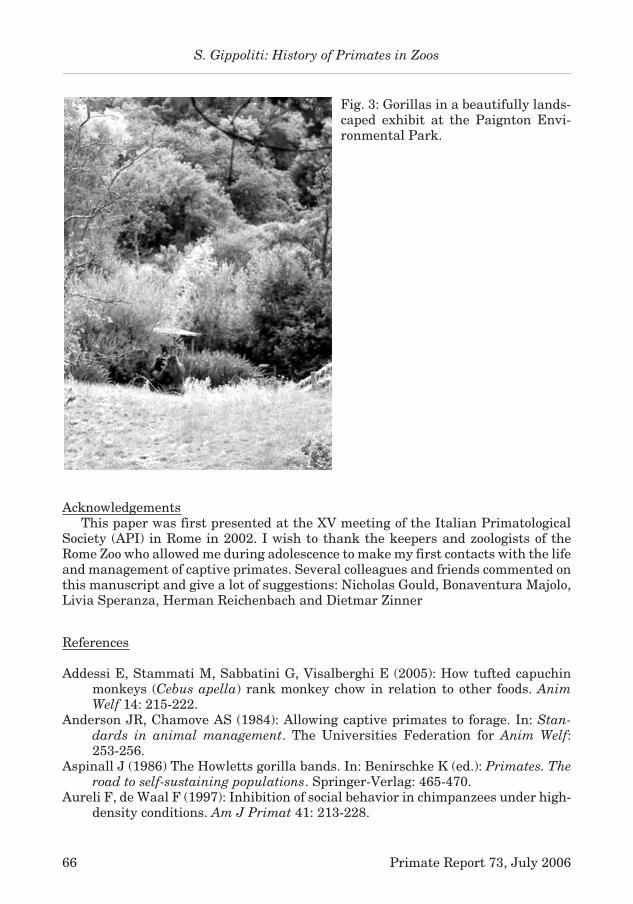
AcknowledgementsThis paper was first presented at the XV meeting of the Italian Primatological
Society (API) in Rome in 2002. I wish to thank the keepers and zoologists of theRome Zoo who allowed me during adolescence to make my first contacts with the lifeand management of captive primates. Several colleagues and friends commented onthis manuscript and give a lot of suggestions: Nicholas Gould, Bonaventura Majolo,Livia Speranza, Herman Reichenbach and Dietmar Zinner
References
Addessi E, Stammati M, Sabbatini G, Visalberghi E (2005): How tufted capuchinmonkeys (Cebus apella) rank monkey chow in relation to other foods. Anim
Welf 14: 215-222.Anderson JR, Chamove AS (1984): Allowing captive primates to forage. In: Stan-
dards in animal management. The Universities Federation for Anim Welf:253-256.
Aspinall J (1986) The Howletts gorilla bands. In: Benirschke K (ed.): Primates. The
road to self-sustaining populations. Springer-Verlag: 465-470.Aureli F, de Waal F (1997): Inhibition of social behavior in chimpanzees under high-
density conditions. Am J Primat 41: 213-228.
66 Primate Report 73, July 2006
S. Gippoliti: History of Primates in Zoos
Fig. 3: Gorillas in a beautifully lands-caped exhibit at the Paignton Envi-ronmental Park.

Baillie SR, Sutherland WJ, Freeman SN, Gregory RD, Paradis E (2000): Consequen-ces of large-scale processes for the conservation of bird populations. J Appl Ecol
37: 88-102.Bland Sutton JB, (1884): Observations on rickets in wild animals. J Anat Physiol 18:
363-397.Britt A (1998): Encouraging natural feeding in captive-bred black and white ruffed
lemurs (Varecia variegata variegata). Zoo Biol 17: 379-392.Britt A, Welch C, Katz A (2001): The impact of Cryptoprocta ferox on the Varecia v.
variegata reinforcement project at Betampona. Lemur News 6: 35-37.Buchanan-Smith HM, Prescott MJ, Cross NJ (2004): What factors should determine
cage sizes for primates in the laboratory? Anim Welf 13: S197-201.Castro MI, Beck BB, Kleiman DG, Ruiz-Miranda CR, Rosenberg AL (1998): Envi-
ronmental enrichment in a reintroduction program for golden lion tamarin(Leontopithecus rosalia). In: Shepherdson DJ, Mellen JD, Hutchins M (eds.):Second Nature Environmental enrichment for captive animals. Smithsonian:113-128.
Chang TR, Forthman DL, Maple TL (1999): Comparison of confined mandrill (Man-
drillus sphinx) behaviour in traditional and "ecologically representative" exhi-bits. Zoo Biol 18: 163-176.
Coe, JC (1985): Design and perception: making the zoo experience real. Zoo Biol 4:197-208.
Crandall LS (1964): The management of wild mammals in captivity. Chicago, TheUniversity of Chicago Press.
Dawkins MS (1998): Evolution and animal welfare. Quart Rev Biol 73: 305-328.D’Alessandro A, Gippoliti S (1996): Le scimmie antropomorfe del Giardino Zoologico
di Roma: storia e prospettive. Museol Sci 13: 23-37.Delacour J (1933): On the Indochinese gibbons (Hylobates concolor). J Mamm 14:
71-73.De Vleeschouwer K, Leus K, Van Elsaker L (2003): Stability of breeding and non-
breeding groups of golden-headed lion tamarins (Leontopithecus chrysomelas).Anim Welf 12: 251-268.
De Vleeschouwer K, Van Elsaker L, Heistermann M, Leus K (2000): An evaluationof the suitability of contraceptive methods in golden-headed lion tamarin(Leontopithecus chrysomelas), with emphasis on melengestrol acetate (MGA)implants: (II) Endocrinological and behavioural effects. Anim Welf 9: 251-271.
Doherty JG (1991): The exhibition and management of geladas in the Baboon Re-serve at the New York Zoological Park. Proc Ann Conf Am Assoc Zool Parks
Aquaria (1991): 599-605.Doran DM, McNeilage A (1998): Gorilla ecology and behavior. Evol Anthrop 6: 120-
131.Fontaine R, Dumond FV (1977): The red ouakari in a seminatural environment: po-
tentials for propagation and study. In: Prince Rainer III of Monaco, Bourne GA,(eds.): Primate Conservation. Academic Press: 167-236.
Forthman Quick DL, (1984): An integrative approach to environmental engineeringin zoos. Zoo Biol 3: 65-77.
Gippoliti S (1997): A contribution to the history of zoos in Italy up to the secondworld war. Int Zoo News 44: 458-465.
Primate Report 73, July 2006 67
S. Gippoliti: History of Primates in Zoos

Gippoliti S (2000): Orang-utans in zoos: husbandry, welfare and management in anatypical arboreal solitary mammal. Int Zoo News 47: 356-368.
Gippoliti S, Speranza L (2005): Incrementare la rilevanza biologica e di conserva-zione degli zoo: evoluzione dei criteri espositivi e gestione dei primati. Museol
Sci 20: 159-174.Glatston AR, Geilvoet-Soeteman E, Hora-Pecek E, van Hooff JARAM (1984): The in-
fluence of the zoo environment on social behavior of groups of cotton-toppedtamarins, Saguinus oedipus oedipus. Zoo Biol 3: 241-253.
Gold KC (1997): The conservation role of primate exhibits in the zoo. In: Wallis J(ed.): Primate conservation: the role of zoological parks. American Society of Pri-matologists: 43-61.
Hagenbeck C (1909): Beasts and man. Longman, London.Hancocks D (1971): Animals and architecture. Praeger, New York.Hancocks D (2001a): A different nature. The paradoxical world of zoos and their un-
certain future. Berkeley, University of California Press.Hancocks D (2001b): Is there a place in the world for zoos? In: State of the animals:
2001. Humane Society Press: 137-144.Hardie SM, Prescott MJ, Buchanan-Smith HM (2003): Ten years of tamarin mixed-
species troops at Belfast Zoological Gardens. Primate Report 65: 21-38.Hediger H (1950): Wild animals in captivity: An outline of the biology of zoological
gardens. London, Butterworth.Hediger H (1965): Diet of animals in captivity. Int Zoo Yb 5: 37-57.Hediger H (1982): Zoo biology; retrospect and prospect. Zoo Biol 1: 85-86.Hosey GR (2005): How does the zoo environment affect the behaviour of captive pri-
mates? Appl Anim Behav Sci 90: 107-129.Hutchins M, Conway W (1995): Beyond Noah’s Ark: the evolving role of modern zoo-
logical parks and aquariums in field conservation. Int Zoo Yb 34: 117-130.Hutchins M, Hancocks D, Crockett C (1984): Naturalistic solutions to the behavioral
problems of captive primates. Zoolog Garten 54: 28-42.Huxley E (1981): Whipsnade. Captive breeding for survival. London, Collins.Hyson J (2000): Jungles of Eden: the design of American zoos. In: Conan M (ed.): En-
vironmentalism in landscape architecture. Dumbarton Oaks Research Libraryand Collection: 23-44.
Jens W (2001) A new orangutan facility at Apenheul Primate Park: pop up the vol-ume! In: Proceedings Ape Conference. Chicago Zoological Society: 146-147.
Kaumanns W, Schwitzer C, Klumpe K, Schmid P (1998/1999): How are primatebreeding programmes doing? An overview and preliminary analysis. In: Riet-kerk F, Brouwer K, Hiddinga B, Smits S (eds.): EEP Yearbook 1998/1999.EAZA Executive Office: 448-460.
Kaumanns W, Hampe K, Schwitzer C, Stahl D (2000): Primate nutrition: towards anintegrated approach. In: Nijboer J, Hatt JM, Kaumanns W, Gansloßer U, Beiy-ner A (eds): Zoo animal nutrition. Filander: 91-106.
Kaumanns W, Schmid W, Schwitzer C, Husung A, Knogge C (2001): The Europeanpopulation of lion-tailed macaques (Macaca silenus): status and problems. Pri-
mate Report 59: 65-75.Knottnerus-Meyer T (1925): Nel Giardino Zoologico. Rome, Maglione e Strini.Kortland A, (1961): Can lessons from the wild improve the lot of captive chimpan-
zee? Int Zoo Yb 2: 76-80.
68 Primate Report 73, July 2006
S. Gippoliti: History of Primates in Zoos

Lindburg DG, Coe J (1995): Ark design update: primate needs and requirements. In:Gibbons EF, Durrant BS, Demarest J (eds.): Conservation of endangered spe-
cies in captivity. State University of New York: 553-570.Little KA, Sommer V (2002): Change of enclosure in langur monkey: implications for
the evaluation of environmental enrichment. Zoo Biol 21: 549-559.Mager WB, Griede T (1996): Using outside areas for tropical primates in the north-
ern hemisphere: Callithricidae, Saimiri and Gorilla. In: Benirschke K (ed.):Primates. The road to self-sustaining populations. Springer-Verlag: 471-477.
Mangili G (1970): Untersuchungen über die ernährung exotischer tiere mit pelletsaus abgestimmten nährstoffen. Zoolog. Garten 39: 174-182.
Maple TL (1993): Zoo man. Inside the zoo revolution. Atlanta, Longstreet.Maple TL, Finlay TW (1987): Post-Occupancy Evaluation in the zoo. Appl Anim
Behav Sci 18: 5-18.Maple TL, Finlay TW (1989): Applied primatology in the modern zoo. Zoo Biol Suppl
1: 101-116.Maschietti G, Muti M, Passerin D‘Entrèves P (1990): Giardini zoologici. Vicende
storico-politiche degli zoo torinesi (1851-1989). Turin, Umberto Allemandi & C.Melfi V, Feistner ATC (2002): A comparison of the activity budgets of wild and cap-
tive Sulawesi crested black macaques (Macaca nigra). Anim Welf 11: 213-222.Mellen J, Sevenich MacPhee M (2001): Philosophy of environmental enrichment:
past, present and future. Zoo Biol 20: 211-226.Mitchell G, Obradovich S, Herring F, Dowd B, Tromborg C (1991): Threats to observ-
ers, keepers, visitors, and others by zoo mangabeys (Cercocebus galeritus chry-
sogaster). Primates 32: 515-522.Morris D (1964): The response of animals to a restricted environment. Symp Zool
Soc Lond 13: 99-118.Morris D (1965): Experimental nocturnal house at London Zoo. Int Zoo Yb 5: 240-
242.Mottershead GS (1960): Experiments with a chimpanzee colony at Chester Zoo. Int
Zoo Yb 1: 18-20.Newberry RC (1995): Environmental enrichment: increasing the biological rele-
vance of captive environments. Appl Anim Behav Sci 44: 229-243.Paterok O (2004): Gorillas in Germany. A review on the last ten years and an outlook
to the future 31.12.1993-31.12.2003. Available at www.leszoosdanslemonde.com
Parnell RJ, Buchanan-Smith HM (2001): An unusual social display by gorillas. Na-
ture 412: 294.Price EC (1997): Group instability following cessation of breeding in marmosets and
tamarins. Dodo J Durrell Wildlife Conserv Trust 33: 157-158.Pruetz JDE, McGrew WC (2001): What does a chimpanzee need? Using natural be-
haviour to guide the care and management of captive populations. In: Brent L(ed.): The care and management of captive chimpanzees. American Society ofPrimatologists: 16-37.
Rabb GB (1994): The changing roles of zoological parks in conserving biological di-versity. Amer Zool 34: 159-164.
Rabin LA (2003): Maintaining behavioural diversity in captivity for conservation:natural behaviour management. Anim Welf 12: 85-94.
Ratcliffe HL (1966): Diets for zoological gardens: aids to conservation and diseasecontrol. Int Zoo Yb 6: 4-23.
Primate Report 73, July 2006 69
S. Gippoliti: History of Primates in Zoos

Rawlins C (1979): Frankfurt. In: Zuckerman L (ed.) Great zoos of the world. Weiden-feld & Nicolson: 75-82.
Redshaw ME, Mallinson JJC (1991): Learning from the wild: improving the well-be-ing of captive primates. Dodo J Durrell Wildlife Conserv Trust 27: 18-26.
Reynolds V, Reynolds F (1965): The natural environment and behaviour of chimpan-zees Pan troglodytes schweinfurthi and suggestions for their care in zoos. Int
Zoo Yb 5: 141-144.Robinson MH (1999): Enriching the lives of zoo animals, and their welfare: where re-
search can be fundamental. Anim Welf 7: 151-175.Russell RL, West R (1997): Rainforest exhibits. Int Zoo News 44: 208-210.Salzert W (1989): Affenfreigehege im Tierpark Rheine. Zeitschrift des Kölner Zoo 32:
39-46.Schulze H (1998): A ‘checklist’ of possible items for prosimian husbandry manuals
and research. Folia Primat. 69 (Suppl.1): 152-170.Schwitzer C, Kaumanns W (2001): Body weights of ruffed lemurs (Varecia varie-
gata) in European Zoos with reference to the problem of obesity. Zoo Biol 20:261-269.
Schwitzer C, Kaumanns W (2003): Foraging patterns of free-ranging and captiveprimates – implications for captive feeding regimes. In: Fidgett AL, Clauss M,Gansloßer U, Hatt J-M, Nijboer J (eds.): Zoo Animal Nutrition II. FilanderVerlag: 247-265.
Shephersdon DJ (2003): Environmental enrichment: past, present and future. Int
Zoo Yb 38: 118-124.Smith A, Lindburg DG, Vehrencamp S (1989): Effects of food preparation on feeding
behavior of lion-tailed macaques. Zoo Biol 8: 57-65.Sommer R (1972): What do we learn at the zoo? Nat Hist 81: 26-27, 86-87.Stemmler-Morath C (1968): Ultimate responsability rests with the keeper. In:
Kirchshofer R (ed.): The world of zoos. The Viking Press: 171-183.Stoinski TS, Hoff MP, Maple TL (2001): Habitat use and structural preferences of
captive western lowland gorillas (Gorilla gorilla gorilla): effects of environmen-tal and social variables. Int J Primat 22: 431-447.
Stoller NH, Ela KM, Calle PP, Slots J, Taichman NS (1989): Periodontal disease inthe orangutan (Pongo pygmaeus). J Zoo Wildlife Medic 20: 454-460.
Van Hoff JARAM (1973): The Arnhem Zoo chimpanzee consortium: an attempt tocreate an ecologically and social acceptable habitat. Int Zoo Yb 13: 195-205.
Van Hoff JARAM (1986): Behavior requirements for self-substaining primate popu-lations: some theoretical considerations and a closer look at social behaviour.In: Benirshke K (ed.): Primates: the road to self-substaining populations. Sprin-ger: 307-319.
Wackernagel H (1977): Feeding of apes and monkeys at Basle Zoo. Int Zoo Yb 17:189-194.
Waitt C, Buchanan-Smith HM (2001): What time is feeding? How delays and antici-pation of feeding schedules affect stump-tailed macaque behavior. Appl Anim
Behav Sci 75: 75-85.Wallis J (1997): From ancient expeditions to modern exhibitions: the evolution of
primate conservation in the zoo community. In: Wallis J (ed.): Primate conser-
vation: the role of zoological parks. American Society of Primatologists: 1-27.
70 Primate Report 73, July 2006
S. Gippoliti: History of Primates in Zoos

Wallis J, Lee DR (1999): Primate conservation: the prevention of disease transmis-sion. Int J Primat 20: 803-826.
Walter O, Brown C (2004): The one and only nocturnal monkey: Aotus. EAZA News
45: 26.Webster D (2000): The setting up of a public walk-through mixed lemur exhibit. Int
Zoo News 47: 483-491.Woodford MH, Butynski TM, Karesh WB (2002): Habituating the great apes: the
disease risks. Oryx 36: 153-160.Wormell D, Brayshaw M (2000): The design and redevelopment of New World pri-
mate accomodation at Jersey Zoo: a naturalistic approach. Dodo J Durrell
Wildlife Conserv Trust 36: 9-19.Wrangham RW (1980): An ecological model of female-bonded primate groups. Be-
haviour 75: 262-300.Zimmermann A, Feistner ATC (1996): Effects of feeding enrichment on ruffed le-
murs Varecia variegata variegata and Varecia v. rubra. Dodo J Durrell Wildlife
Conserv Trust 32: 67-75.Zuckerman S (1932): The social life of monkeys and apes. Routledge & Kegan, Lon-
don.
Author´s address:
Conservation Unit, Pistoia Zoological Garden, and Istituto Italiano di Antropologia,Roma. Address for correspondence: ISITA: Piazzale Aldo Moro 5, 00185 Roma,Italia. e-mail: [email protected]
Primate Report 73, July 2006 71
S. Gippoliti: History of Primates in Zoos

GUIDELINES FOR AUTHORS
In General: The Primate Report publishes original papers, abstracts and contributions from
the meetings of national and international primatological societies, from symposia as well as
book reviews. Special issues like surveys on primatological activities in habitat countries
and census of captive primates in the Old World countries complete the spectrum.
Original papers written in English can be accepted from any area of primatology, including
breeding and husbandry, behaviour, evolutionary biology, morphology, physiology and
palaeontology.
Arrangement
Title page: The first page of each paper should indicate the title (main title underlined), a
short title for use as running head, the authors’ names, and the name of the institute where
the work was conducted.
Full address: The postal address of the author to whom correspondence should be sent must
be given at the bottom of the page. Please also supply phone and fax and E-mail numbers.
Key words: For indexing purposes, a list of 6-10 key words in English is essential.
Abstract: Each paper needs an abstract of up to 10 lines in English, an additional one in
French, Spanish, Portugese or German is optional.
Tables and illustrations: Tables and illustrations (both numbered in Arabic numerals)
should be prepared on separate sheets. Tables require a heading and figures a legend, also
prepared on a separate sheet. On the back of each illustration, indicate its number, the au-
thor’s name, and ‘top’. Colour illustrations are reproduced only at special agreement.
References: The list of references in alphabetic order should include only those publications
which are cited in the text. Examples:
Papers published in periodicals: Birkebak TA, Wang NP, Weyrich J (1996): Uterine epi-
theloid leiomyosarcoma in a pig-tailed macaque. J Med Primatol 25: 367-369.
Monographs: Kappeler PM, Pereira ME (eds, 2003): Primate Life History and Socioecology.
Chicago, University Press.
Edited books: Charles-Dominique P (1974): Aggression and territoriality in nocturnal pro-
simians. In: Holloway RL (ed): Primate Aggression, Territoriality and Xenophobia: A Com-
parative Perspective. New York, Academic Press: 31-48.
Reprints: 20 sample copies of the contribution are free of charge to the first author.
Disk Submission: We welcome the submission of manuscripts, graphs and drawings on
disk. The preferred storage medium is a 3.5-inch disk in MS-DOS format. Macintosh is also
acceptable. The preferred word processing package is Microsoft Word. Other commonly used
PC text programs are also accepted, as well as ASCII format. Graphs and drawings can be
accepted as bitmap files (tif, pcx, bmp etc.), but vectorized data (cgm, wmf, eps, etc.) or cdr-
data files are preferred.
Publication data: The Primate Report is published 3 times annually, including the annual
scientific report of the German Primate Center (DPZ), which is free of charge for subscrib-
ers.
Editor’s address:
Dr. Dr. M.H. Schwibbe, German Primate Center, Kellnerweg 4, D-37077 Göttingen, Ger-
many; E-mail: [email protected] or [email protected]

Cover photo: Old female Macaca assamensis at the Rome Zoological Garden. Thisfemale lived for more than 31 years in a traditional zoo cage, establishing the recordlongevity for the species in captivity (S. Gippoliti).
Editor: Dr. Dr. Michael Schwibbe
Assistance: Heike Klensang
German Primate Center (DPZ)
Subscription price: € 10,00 / issue
ISSN 0343-3528
Printed in the Federal Republic of Germanyby Erich Goltze GmbH & Co KG, 37079 Göttingen, Germany

Contents
Genetic Characterization and Phylogenetic Relationships between theAteles Species (Atelidae, Primates) by Means of DNA MicrosatelliteMarkers and Craniometric Data
Ruiz-García M, Parra A, Romero-Aleán N, Escobar-Armel P andShostell JM . . . . . . . . . . . . . . . . . . . . . . . . . . . . . . . . . . . . . 3
Social Relationships in a Free-Ranging Group of Bonnet Macaques inTamil Nadu, India.
Mehu M, Huynen M-C and Agoramoorthy G . . . . . . . . . . . . . . . . . . . 49
Applied Primatology in Zoos: History and Prospects in the Field of WildlifeConservation, Public Awareness and Animal Welfare
Gippoliti S . . . . . . . . . . . . . . . . . . . . . . . . . . . . . . . . . . . . . 57
Primate Report 73, July 2006
Printed in the Federal Republic of Germanyby Erich Goltze GmbH & Co. KG, 37079 Göttingen, FRG
ISSN 0343-3528
Copyright © 2022 FDOKUMEN