Primary Recrystallization Behaviors of Hi-B Steel with Lower Initial ... - MDPI
14
metals Article Primary Recrystallization Behaviors of Hi-B Steel with Lower Initial Nitrogen Produced by the Thin Slab Casting and Rolling Process Bing Fu 1 , Li Xiang 2, *, Jia-Long Qiao 2 , Hai-Jun Wang 3 , Jing Liu 1 and Sheng-Tao Qiu 2 Citation: Fu, B.; Xiang, L.; Qiao, J.-L.; Wang, H.-J.; Liu, J.; Qiu, S.-T. Primary Recrystallization Behaviors of Hi-B Steel with Lower Initial Nitrogen Produced by the Thin Slab Casting and Rolling Process. Metals 2021, 11, 189. https://doi.org/10.3390/ met11020189 Academic Editor: Matjaž Godec Received: 16 December 2020 Accepted: 12 January 2021 Published: 21 January 2021 Publisher’s Note: MDPI stays neutral with regard to jurisdictional claims in published maps and institutional affil- iations. Copyright: © 2021 by the authors. Licensee MDPI, Basel, Switzerland. This article is an open access article distributed under the terms and conditions of the Creative Commons Attribution (CC BY) license (https:// creativecommons.org/licenses/by/ 4.0/). 1 State Key Laboratory of Refractories and Metallurgy, Wuhan University of Science and Technology, Wuhan 430081, China; [email protected] (B.F.); [email protected] (J.L.) 2 National Engineering Research Center of Continuous Casting Technology, China Iron and Steel Research Institute Group, Beijing 100081, China; [email protected] (J.-L.Q.); [email protected] (S.-T.Q.) 3 School of Metallurgical Engineering, Anhui University of Technology, Ma’anshan 243002, China; [email protected] * Correspondence: [email protected] Abstract: Based on low-temperature high-permeability grain-oriented silicon steel designed with an initial nitrogen content of 0.0055% and produced by the thin slab casting and rolling process, the effect of total nitrogen content and nitriding temperature on primary recrystallization microstructure and texture were studied by optical microscope, scanning electron microscope, transmission electron microscope, and electron backscatter diffraction. The nitriding temperature affects the primary recrystallization behaviors significantly, while the total nitrogen content has a small effect. As the nitriding temperature is 750–850 ◦ C, the average primary grain size and its inhomogeneity factor are about 26.58–26.67 μm and 0.568–0.572, respectively. Moreover, the texture factor is mostly between 0.15 and 0.40. Because of the relatively sufficient inhibition ability of inherent inhibitors in a decarburized sheet, the nitriding temperature (750–850 ◦ C) affects the primary recrystallization microstructure and texture slightly. However, as the nitriding temperature rises to 900–950 ◦ C, the average primary grain size and its inhomogeneity factor increase to 27.75–28.26 μm and 0.575–0.578, respectively. Furthermore, because of the great increase on the area fraction of {112} <110> grains, part of texture factor is increased sharply. Therefore, in order to obtain better primary grain size and homogeneity, better texture composition, and stability of the decarburized sheet, the optimal nitriding temperature is 750–850 ◦ C. Keywords: high permeability grain-oriented silicon steel; thin slab casting and rolling process; nitriding after decarburization; primary recrystallization; microstructure; texture 1. Introduction High-permeability grain-oriented silicon steel (Hi-B) is one of the most important functional materials in the development of the power industry and is widely used as a core material for transformers. At present, utilizing low-temperature slab reheating at 1100–1250 ◦ C with the acquired inhibitor method to produce Hi-B steel has become mainstream technology. The key process is to perform short-term gas nitriding treatment on the cold rolled strip after decarburization annealing [1–5]. Nippon Steel in Japan and Bao Steel, WISCO, and Shougang Group in China have adopted this method to achieve industrial production of low-temperature Hi-B steel using the traditional process with a thick slab [4,5]. Meanwhile, the nitrogen content in the casting slab is usually controlled between 0.008% and 0.009% and a small amount of the element Sn is added as the auxiliary inhibitor. In addition, the average size of primary grains after nitriding annealing is generally limited to 20–30 μm, with the nitriding temperature mainly between 700 and 800 ◦ C[6,7]. Metals 2021, 11, 189. https://doi.org/10.3390/met11020189 https://www.mdpi.com/journal/metals
-
Upload
khangminh22 -
Category
Documents
-
view
1 -
download
0
Transcript of Primary Recrystallization Behaviors of Hi-B Steel with Lower Initial ... - MDPI

metals
Article
Primary Recrystallization Behaviors of Hi-B Steel with LowerInitial Nitrogen Produced by the Thin Slab Casting andRolling Process
Bing Fu 1, Li Xiang 2,*, Jia-Long Qiao 2 , Hai-Jun Wang 3, Jing Liu 1 and Sheng-Tao Qiu 2
�����������������
Citation: Fu, B.; Xiang, L.; Qiao, J.-L.;
Wang, H.-J.; Liu, J.; Qiu, S.-T. Primary
Recrystallization Behaviors of Hi-B
Steel with Lower Initial Nitrogen
Produced by the Thin Slab Casting
and Rolling Process. Metals 2021, 11,
189. https://doi.org/10.3390/
met11020189
Academic Editor: Matjaž Godec
Received: 16 December 2020
Accepted: 12 January 2021
Published: 21 January 2021
Publisher’s Note: MDPI stays neutral
with regard to jurisdictional claims in
published maps and institutional affil-
iations.
Copyright: © 2021 by the authors.
Licensee MDPI, Basel, Switzerland.
This article is an open access article
distributed under the terms and
conditions of the Creative Commons
Attribution (CC BY) license (https://
creativecommons.org/licenses/by/
4.0/).
1 State Key Laboratory of Refractories and Metallurgy, Wuhan University of Science and Technology,Wuhan 430081, China; [email protected] (B.F.); [email protected] (J.L.)
2 National Engineering Research Center of Continuous Casting Technology, China Iron and Steel ResearchInstitute Group, Beijing 100081, China; [email protected] (J.-L.Q.); [email protected] (S.-T.Q.)
3 School of Metallurgical Engineering, Anhui University of Technology, Ma’anshan 243002, China;[email protected]
* Correspondence: [email protected]
Abstract: Based on low-temperature high-permeability grain-oriented silicon steel designed withan initial nitrogen content of 0.0055% and produced by the thin slab casting and rolling process, theeffect of total nitrogen content and nitriding temperature on primary recrystallization microstructureand texture were studied by optical microscope, scanning electron microscope, transmission electronmicroscope, and electron backscatter diffraction. The nitriding temperature affects the primaryrecrystallization behaviors significantly, while the total nitrogen content has a small effect. As thenitriding temperature is 750–850 ◦C, the average primary grain size and its inhomogeneity factorare about 26.58–26.67 µm and 0.568–0.572, respectively. Moreover, the texture factor is mostlybetween 0.15 and 0.40. Because of the relatively sufficient inhibition ability of inherent inhibitors ina decarburized sheet, the nitriding temperature (750–850 ◦C) affects the primary recrystallizationmicrostructure and texture slightly. However, as the nitriding temperature rises to 900–950 ◦C, theaverage primary grain size and its inhomogeneity factor increase to 27.75–28.26 µm and 0.575–0.578,respectively. Furthermore, because of the great increase on the area fraction of {112} <110> grains,part of texture factor is increased sharply. Therefore, in order to obtain better primary grain sizeand homogeneity, better texture composition, and stability of the decarburized sheet, the optimalnitriding temperature is 750–850 ◦C.
Keywords: high permeability grain-oriented silicon steel; thin slab casting and rolling process;nitriding after decarburization; primary recrystallization; microstructure; texture
1. Introduction
High-permeability grain-oriented silicon steel (Hi-B) is one of the most importantfunctional materials in the development of the power industry and is widely used asa core material for transformers. At present, utilizing low-temperature slab reheatingat 1100–1250 ◦C with the acquired inhibitor method to produce Hi-B steel has becomemainstream technology. The key process is to perform short-term gas nitriding treatmenton the cold rolled strip after decarburization annealing [1–5]. Nippon Steel in Japan andBao Steel, WISCO, and Shougang Group in China have adopted this method to achieveindustrial production of low-temperature Hi-B steel using the traditional process with athick slab [4,5]. Meanwhile, the nitrogen content in the casting slab is usually controlledbetween 0.008% and 0.009% and a small amount of the element Sn is added as the auxiliaryinhibitor. In addition, the average size of primary grains after nitriding annealing isgenerally limited to 20–30 µm, with the nitriding temperature mainly between 700 and800 ◦C [6,7].
Metals 2021, 11, 189. https://doi.org/10.3390/met11020189 https://www.mdpi.com/journal/metals
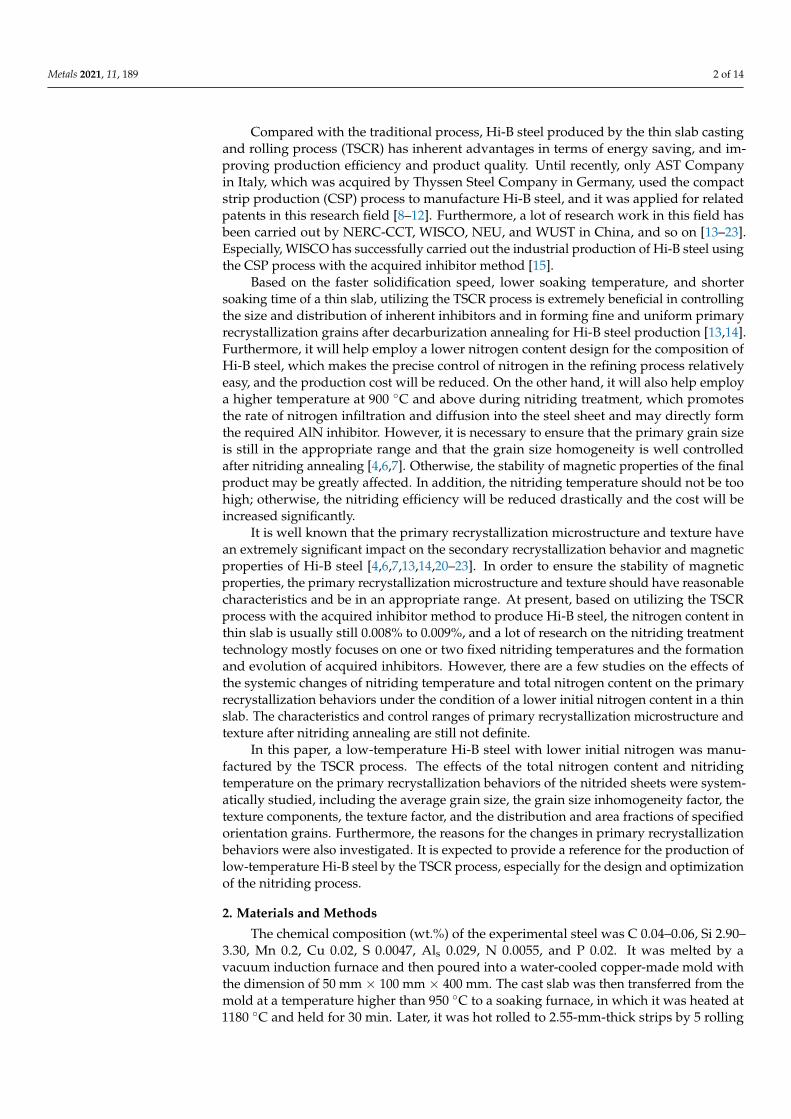
Metals 2021, 11, 189 2 of 14
Compared with the traditional process, Hi-B steel produced by the thin slab castingand rolling process (TSCR) has inherent advantages in terms of energy saving, and im-proving production efficiency and product quality. Until recently, only AST Companyin Italy, which was acquired by Thyssen Steel Company in Germany, used the compactstrip production (CSP) process to manufacture Hi-B steel, and it was applied for relatedpatents in this research field [8–12]. Furthermore, a lot of research work in this field hasbeen carried out by NERC-CCT, WISCO, NEU, and WUST in China, and so on [13–23].Especially, WISCO has successfully carried out the industrial production of Hi-B steel usingthe CSP process with the acquired inhibitor method [15].
Based on the faster solidification speed, lower soaking temperature, and shortersoaking time of a thin slab, utilizing the TSCR process is extremely beneficial in controllingthe size and distribution of inherent inhibitors and in forming fine and uniform primaryrecrystallization grains after decarburization annealing for Hi-B steel production [13,14].Furthermore, it will help employ a lower nitrogen content design for the composition ofHi-B steel, which makes the precise control of nitrogen in the refining process relativelyeasy, and the production cost will be reduced. On the other hand, it will also help employa higher temperature at 900 ◦C and above during nitriding treatment, which promotesthe rate of nitrogen infiltration and diffusion into the steel sheet and may directly formthe required AlN inhibitor. However, it is necessary to ensure that the primary grain sizeis still in the appropriate range and that the grain size homogeneity is well controlledafter nitriding annealing [4,6,7]. Otherwise, the stability of magnetic properties of the finalproduct may be greatly affected. In addition, the nitriding temperature should not be toohigh; otherwise, the nitriding efficiency will be reduced drastically and the cost will beincreased significantly.
It is well known that the primary recrystallization microstructure and texture havean extremely significant impact on the secondary recrystallization behavior and magneticproperties of Hi-B steel [4,6,7,13,14,20–23]. In order to ensure the stability of magneticproperties, the primary recrystallization microstructure and texture should have reasonablecharacteristics and be in an appropriate range. At present, based on utilizing the TSCRprocess with the acquired inhibitor method to produce Hi-B steel, the nitrogen content inthin slab is usually still 0.008% to 0.009%, and a lot of research on the nitriding treatmenttechnology mostly focuses on one or two fixed nitriding temperatures and the formationand evolution of acquired inhibitors. However, there are a few studies on the effects ofthe systemic changes of nitriding temperature and total nitrogen content on the primaryrecrystallization behaviors under the condition of a lower initial nitrogen content in a thinslab. The characteristics and control ranges of primary recrystallization microstructure andtexture after nitriding annealing are still not definite.
In this paper, a low-temperature Hi-B steel with lower initial nitrogen was manu-factured by the TSCR process. The effects of the total nitrogen content and nitridingtemperature on the primary recrystallization behaviors of the nitrided sheets were system-atically studied, including the average grain size, the grain size inhomogeneity factor, thetexture components, the texture factor, and the distribution and area fractions of specifiedorientation grains. Furthermore, the reasons for the changes in primary recrystallizationbehaviors were also investigated. It is expected to provide a reference for the production oflow-temperature Hi-B steel by the TSCR process, especially for the design and optimizationof the nitriding process.
2. Materials and Methods
The chemical composition (wt.%) of the experimental steel was C 0.04–0.06, Si 2.90–3.30, Mn 0.2, Cu 0.02, S 0.0047, Als 0.029, N 0.0055, and P 0.02. It was melted by avacuum induction furnace and then poured into a water-cooled copper-made mold withthe dimension of 50 mm × 100 mm × 400 mm. The cast slab was then transferred from themold at a temperature higher than 950 ◦C to a soaking furnace, in which it was heated at1180 ◦C and held for 30 min. Later, it was hot rolled to 2.55-mm-thick strips by 5 rolling

Metals 2021, 11, 189 3 of 14
passes; the initial and final rolling temperature were 1150 ◦C and 920 ◦C, respectively.Then the hot rolled strip was cold rolled to 0.27 mm by single-stage cold-rolling after two-step normalization. Subsequently, the samples cut from cold-rolled strips were subjectedto decarburization annealing at 835 ◦C for 3 min in a wet atmosphere of 25 vol.% H2 +75 vol.% N2, and the partial pressure ratio of water vapor to hydrogen was 0.339. Then,the samples were variously nitrided from 750 to 950 ◦C at every 50 ◦C for 1 min in themixture gas of NH3 + H2 + N2, in which NH3 was 4.8–40.3 vol.% and VH2/VN2 was 3/1, toachieve different N contents. After the annealing separator mainly consisting of MgO wascoated on the surfaces, the nitrided samples were subjected to secondary recrystallizationannealing, which was performed in a 50 vol.% N2 + 50 vol.% H2 atmosphere with aheating rate of 15 ◦C/h up to 1210 ◦C and maintained for 10 h at 1210 ◦C under a 100% H2atmosphere for purification. Finally, the magnetic properties of these annealed sampleswith the dimension of 30 mm × 100 mm were measured by a MATS-2010SA AC magneticmeasuring instrument. The magnetic induction (B800) was measured under a magneticfield of 800 A/m, and the iron loss (P1.7/50) was measured when the magnetic induction ofsample was 1.7 T under 50 Hz. By injecting the appropriate N contents at different nitridingtemperatures, the average measured values of the B800 and P1.7/50 magnetic propertiescould be higher than 1.90 T and less than 1.0 W/kg, respectively [6,15].
After decarburization and nitriding, the average C and N contents in the cold-rolledsheet were measured by a carbon–sulfur analyzer and an oxygen–nitrogen analyzer, re-spectively. The microstructure of the nitrided sheet through thickness was observed andcaptured by a ZEISS-Axio Scope A1 optical microscope at 100 magnification. According toline resection in the average grain determination (GB/T 6394-2002) of metal, the averagegrain size X of the microstructure of a nitrided sheet was measured. Three to four fieldswere randomly selected, and the number of cutoff points was about 500 in order to obtainthe reasonable and accurate average value. With the help of a field emission scanningelectron microscope, ZEISS SUPRA 55VP, equipped with EDAX OIM electron backscatterdiffraction (EBSD), the textures of the nitrided sheet through thickness were examined and2–4 regions in each sample were scanned with a step size of 3 µm. The software of texture,OIM analysis 6.1, was used to analyze the orientation distribution functions (ODFs), thedistribution and quantitative statistics of grains with specified orientation with a maximumdeviation angle of 10◦.
Based on previous research methods [24–26], the relative standard deviation of grainsize, that was the grain size inhomogeneity factor σ*, was defined to quantitatively charac-terize the inhomogeneity of primary recrystallization grain size in a nitrided sheet. Thelower the value of σ* is, the better the homogeneity of the grain size is. The texture factorAR (area ratio) was defined to quantitatively characterize the superiority–inferiority of thetextures after primary recrystallization of a nitrided sheet. AR is the ratio of the total areafractions of harmful texture to that of beneficial texture including {110} <001>. The lowerthe value of AR, the lower the proportion of disadvantaged texture in primary recrystal-lization texture and the higher the possibility of abnormal growth of a Goss-oriented grain.The calculation formulas are as follows [24–26]:
σ∗ = σ/µ (1)
σ =
√√√√ 1N
N
∑i=1
(Xi − µ)2 (2)
AR = ({hkl} <110> + {110} <112>)/({111} <112> + {554} <225> + {114} <481> + {110} <001>) (3)
where N is the quantity of grains, Xi is the size of a single grain in µm, and µ is the averagesize of all the grains in the total microstructure in µm. σ is the standard deviation of thegrain size and is a reflection of the deviation degree of the single grain size in the totalprimary grain microstructure away from µ. The values of µ and σ are obtained from thegrain size analysis using OIM analysis 6.1. {hkl} <110>, the α fiber texture, is the total area

Metals 2021, 11, 189 4 of 14
fractions of {001} <110>, {114} <110>, {112} <110>, {111} <110>, {111} <110>, and {110} <110>;{111} <uvw>, the γ fiber texture, is the total area fractions of {111} <110>, {111} <112>, and{554} <225> in this paper; and the last one is included since it is close to {111} <112>.
The sample for TEM was prepared by the carbon extraction replica method. Subse-quently, the morphologies of nano-precipitates in a decarburized sheet was observed by aJEOL JEM-2100F transmission electron microscope and the composition of precipitates wasanalyzed by energy dispersive spectrometer (EDS). Furthermore, the overall morphologiesand distribution of precipitates in the decarburized sheet after electropolishing were ob-served by ZEISS SUPRA 55VP, and the size and density distribution of precipitates werequantitatively analyzed by using IPP (Image-Pro Plus) software. In order to ensure theaccuracy of the statistical data, the sample was observed by FESEM at 20,000 magnification,and more than 30 views were collected randomly.
3. Results3.1. Effects of Total Nitrogen Content and Nitriding Temperature on Primary RecrystallizationMicrostructure
After decarburization at 835 ◦C and nitriding at 750–950 ◦C, the residual carboncontents of the cold rolled sheets decrease to 0.001–0.003%, and the microstructures areferrite grains. The typical primary recrystallization microstructures are shown in Table 1.
Table 1. Typical primary recrystallization microstructures of decarburized sheets after nitriding annealing at 750 ◦C and900 ◦C.
NitridingTemperature/◦C 750
Total Nitrogen Content/% 0.007 0.010 0.012 0.014 0.017 0.023
Microstructure
NitridingTemperature/◦C 900
Total Nitrogen Content/% 0.008 0.010 0.012 0.016 0.020 0.024
Microstructure
Metals 2021, 11, 189 5 of 14
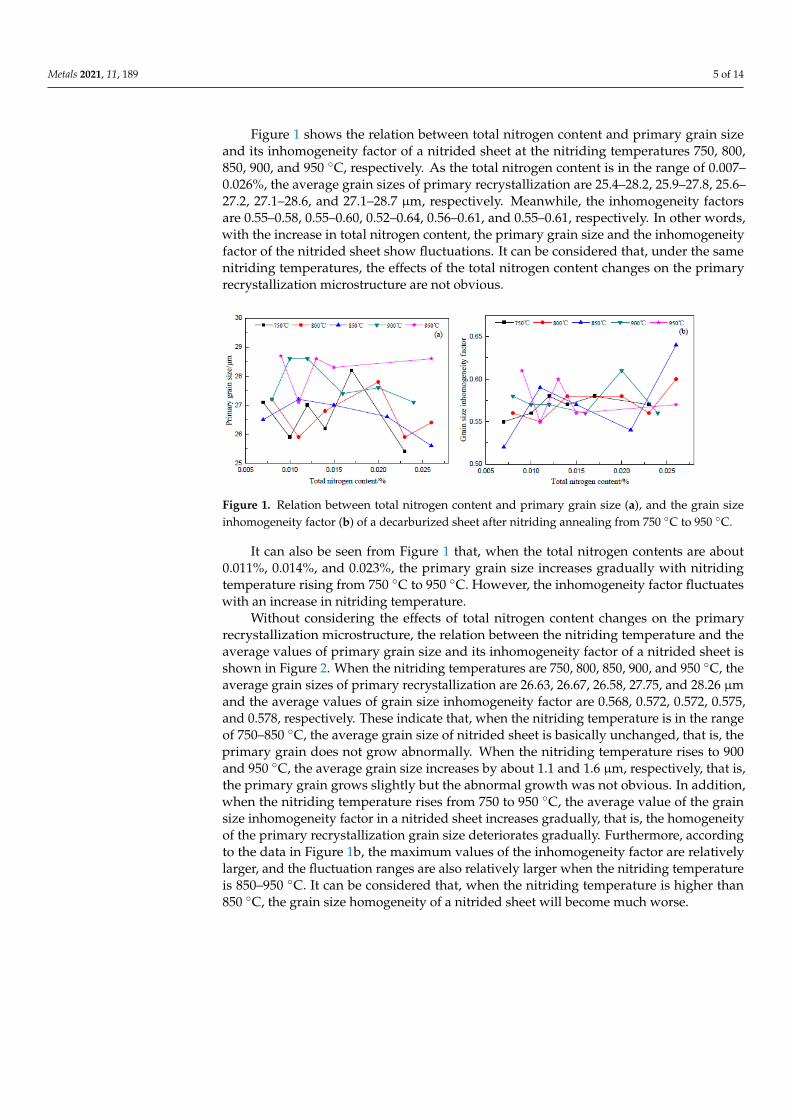
Figure 1 shows the relation between total nitrogen content and primary grain sizeand its inhomogeneity factor of a nitrided sheet at the nitriding temperatures 750, 800,850, 900, and 950 ◦C, respectively. As the total nitrogen content is in the range of 0.007–0.026%, the average grain sizes of primary recrystallization are 25.4–28.2, 25.9–27.8, 25.6–27.2, 27.1–28.6, and 27.1–28.7 µm, respectively. Meanwhile, the inhomogeneity factorsare 0.55–0.58, 0.55–0.60, 0.52–0.64, 0.56–0.61, and 0.55–0.61, respectively. In other words,with the increase in total nitrogen content, the primary grain size and the inhomogeneityfactor of the nitrided sheet show fluctuations. It can be considered that, under the samenitriding temperatures, the effects of the total nitrogen content changes on the primaryrecrystallization microstructure are not obvious.
Figure 1. Relation between total nitrogen content and primary grain size (a), and the grain sizeinhomogeneity factor (b) of a decarburized sheet after nitriding annealing from 750 ◦C to 950 ◦C.
It can also be seen from Figure 1 that, when the total nitrogen contents are about0.011%, 0.014%, and 0.023%, the primary grain size increases gradually with nitridingtemperature rising from 750 ◦C to 950 ◦C. However, the inhomogeneity factor fluctuateswith an increase in nitriding temperature.
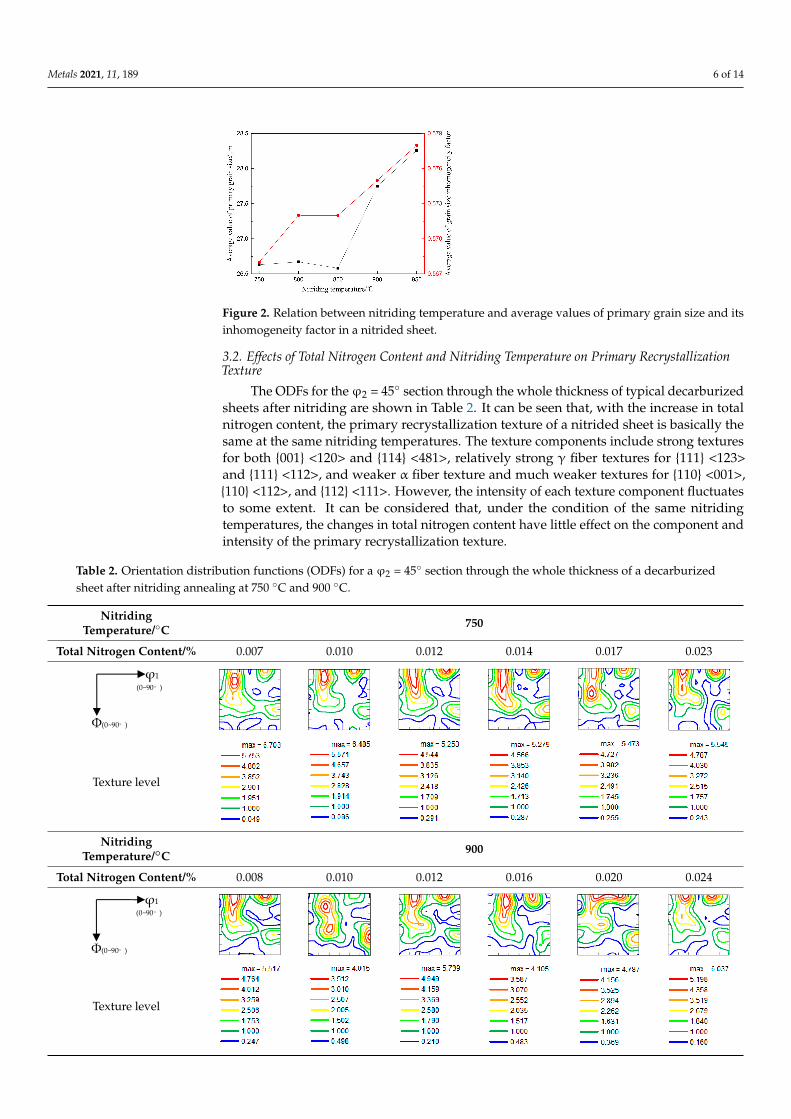
Without considering the effects of total nitrogen content changes on the primaryrecrystallization microstructure, the relation between the nitriding temperature and theaverage values of primary grain size and its inhomogeneity factor of a nitrided sheet isshown in Figure 2. When the nitriding temperatures are 750, 800, 850, 900, and 950 ◦C, theaverage grain sizes of primary recrystallization are 26.63, 26.67, 26.58, 27.75, and 28.26 µmand the average values of grain size inhomogeneity factor are 0.568, 0.572, 0.572, 0.575,and 0.578, respectively. These indicate that, when the nitriding temperature is in the rangeof 750–850 ◦C, the average grain size of nitrided sheet is basically unchanged, that is, theprimary grain does not grow abnormally. When the nitriding temperature rises to 900and 950 ◦C, the average grain size increases by about 1.1 and 1.6 µm, respectively, that is,the primary grain grows slightly but the abnormal growth was not obvious. In addition,when the nitriding temperature rises from 750 to 950 ◦C, the average value of the grainsize inhomogeneity factor in a nitrided sheet increases gradually, that is, the homogeneityof the primary recrystallization grain size deteriorates gradually. Furthermore, accordingto the data in Figure 1b, the maximum values of the inhomogeneity factor are relativelylarger, and the fluctuation ranges are also relatively larger when the nitriding temperatureis 850–950 ◦C. It can be considered that, when the nitriding temperature is higher than850 ◦C, the grain size homogeneity of a nitrided sheet will become much worse.
Metals 2021, 11, 189 6 of 14
Figure 2. Relation between nitriding temperature and average values of primary grain size and itsinhomogeneity factor in a nitrided sheet.
3.2. Effects of Total Nitrogen Content and Nitriding Temperature on Primary RecrystallizationTexture
The ODFs for theϕ2 = 45◦ section through the whole thickness of typical decarburizedsheets after nitriding are shown in Table 2. It can be seen that, with the increase in totalnitrogen content, the primary recrystallization texture of a nitrided sheet is basically thesame at the same nitriding temperatures. The texture components include strong texturesfor both {001} <120> and {114} <481>, relatively strong γ fiber textures for {111} <123>and {111} <112>, and weaker α fiber texture and much weaker textures for {110} <001>,{110} <112>, and {112} <111>. However, the intensity of each texture component fluctuatesto some extent. It can be considered that, under the condition of the same nitridingtemperatures, the changes in total nitrogen content have little effect on the component andintensity of the primary recrystallization texture.
Table 2. Orientation distribution functions (ODFs) for a ϕ2 = 45◦ section through the whole thickness of a decarburizedsheet after nitriding annealing at 750 ◦C and 900 ◦C.
NitridingTemperature/◦C 750
Total Nitrogen Content/% 0.007 0.010 0.012 0.014 0.017 0.023
Metals 2021, 11, x FOR PEER REVIEW 6 of 14
the data in Figure 1b, the maximum values of the inhomogeneity factor are relatively larger, and the fluctuation ranges are also relatively larger when the nitriding temperature is 850–950 °C. It can be considered that, when the nitriding temperature is higher than 850
°C, the grain size homogeneity of a nitrided sheet will become much worse.
Figure 2. Relation between nitriding temperature and average values of primary grain size and its inhomogeneity factor in a nitrided sheet.
3.2. Effects of Total Nitrogen Content and Nitriding Temperature on Primary Recrystallization
Texture
The ODFs for the φ2 = 45° section through the whole thickness of typical decarburized sheets after nitriding are shown in Table 2. It can be seen that, with the increase in total nitrogen content, the primary recrystallization texture of a nitrided sheet is basically the
same at the same nitriding temperatures. The texture components include strong textures for both {001} <120> and {114} <481>, relatively strong γ fiber textures for {111} <123> and
{111} <112>, and weaker α fiber texture and much weaker textures for {110} <001>, {110} <112>, and {112} <111>. However, the intensity of each texture component fluctuates to some extent. It can be considered that, under the condition of the same nitriding temper-
atures, the changes in total nitrogen content have little effect on the component and inten-sity of the primary recrystallization texture.
Table 2. Orientation distribution functions (ODFs) for a φ2 = 45° section through the whole thick-ness of a decarburized sheet after nitriding annealing at 750 °C and 900 °C.
Nitriding Tempera-
ture/°C 750
Total Nitrogen Con-
tent/% 0.007 0.010 0.012 0.014 0.017 0.023
Texture level
Nitriding Tempera-
ture/°C 900
Total nitrogen content/% 0.008 0.010 0.012 0.016 0.020 0.024
750 800 850 900 95026.5
27.0
27.5
28.0
28.5
Nitriding temperature/℃
Aver
age
val
ue
of
pri
mar
y g
rain
siz
e/μ
m
0.567
0.570
0.573
0.576
0.579
Aver
age
val
ue
of
gra
in s
ize
inhom
ogen
eity
fac
tor
Φ(0~90°)
φ1
(0~90°)
Texture level
NitridingTemperature/◦C 900
Total Nitrogen Content/% 0.008 0.010 0.012 0.016 0.020 0.024
Metals 2021, 11, x FOR PEER REVIEW 7 of 14
Texture level
The distribution of specified orientation grains through the whole thickness of typical
nitrided sheets is shown in Table 3. It can be seen that, with the increase in total nitrogen content, the specified orientation grains are located throughout the whole thickness of nitrided sheet at the same nitriding temperatures. That is, the distribution of specified
orientation grains has no obvious rule. Moreover, the grains around most of the specified orientation grains are relatively scattered. Only the grains around Goss ({110} <001>)
grains exhibit obvious orientation distribution, such as for {114} <481>, {554} <225>, and {111} <112>. It can be considered that the changes in total nitrogen content have no obvious effect on the distribution of specified orientation grains in a nitrided sheet.
Table 3. The distribution of specified orientation grains through the whole thickness of a decarbu-rized sheet after nitriding annealing at 750 °C, 850 °C, and 950 °C.
Nitriding
Tempera-
ture/°C
Total Nitro-
gen Con-
tent/%
Distribution of Specified Orientation Grains (the Misorientation
Angle is 10°)
750
0.007
0.010
0.012
0.014
0.017
0.023
850
0.0074
0.011
0.015
0.021
0.026
950 0.0092
Φ(0~90°)
φ1
(0~90°)
Texture level

Metals 2021, 11, 189 7 of 14
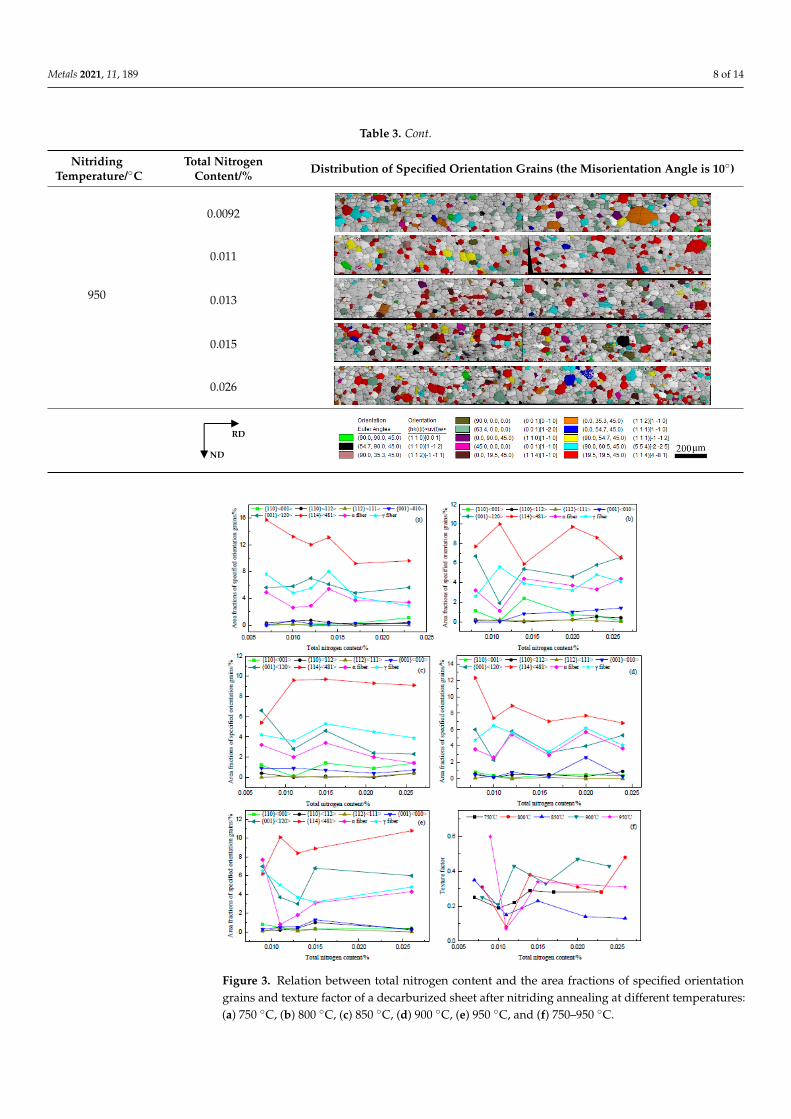
The distribution of specified orientation grains through the whole thickness of typicalnitrided sheets is shown in Table 3. It can be seen that, with the increase in total nitrogencontent, the specified orientation grains are located throughout the whole thickness ofnitrided sheet at the same nitriding temperatures. That is, the distribution of specifiedorientation grains has no obvious rule. Moreover, the grains around most of the specifiedorientation grains are relatively scattered. Only the grains around Goss ({110} <001>) grainsexhibit obvious orientation distribution, such as for {114} <481>, {554} <225>, and {111}<112>. It can be considered that the changes in total nitrogen content have no obviouseffect on the distribution of specified orientation grains in a nitrided sheet.
Figure 3 shows the relation between the total nitrogen content and the area fractions ofspecified orientation grains and texture factor of nitrided sheet at the nitriding temperatureof 750, 800, 850, 900, and 950 ◦C. It can be seen that the area fraction of the {114} <481>grain in the nitrided sheet is the highest, followed by {001} <120>, γ fiber, and α fibergrains, while the area fractions of {110} <001>, {110} <112>, and {112} <111> grains aresmall. Meanwhile, the texture factor of a nitrided sheet is mostly between 0.15 and 0.40.However, the area fractions of specified orientation grains and the texture factor of anitrided sheet show fluctuant changes with the increase in total nitrogen content at thesame nitriding temperatures. It can be considered that the changes in total nitrogen contenthave an insignificant influence on the area fractions of specified orientation grains and thetexture factor.
Table 3. The distribution of specified orientation grains through the whole thickness of a decarburized sheet after nitriding annealingat 750 ◦C, 850 ◦C, and 950 ◦C.
NitridingTemperature/◦C
Total NitrogenContent/% Distribution of Specified Orientation Grains (the Misorientation Angle is 10◦)
750
0.007
Metals 2021, 11, x FOR PEER REVIEW 7 of 15
Texture level
The distribution of specified orientation grains through the whole thickness of typical nitrided sheets is shown in Table 3. It can be seen that, with the increase in total nitrogen content, the specified orientation grains are located throughout the whole thickness of nitrided sheet at the same nitriding temperatures. That is, the distribution of specified orientation grains has no obvious rule. Moreover, the grains around most of the specified orientation grains are relatively scattered. Only the grains around Goss ({110} <001>) grains exhibit obvious orientation distribution, such as for {114} <481>, {554} <225>, and {111} <112>. It can be considered that the changes in total nitrogen content have no obvious effect on the distribution of specified orientation grains in a nitrided sheet.
Table 3. The distribution of specified orientation grains through the whole thickness of a decarburized sheet after nitriding annealing at 750 °C, 850 °C, and 950 °C.
Nitriding Temperature/°C
Total Nitrogen Content/% Distribution of Specified Orientation Grains (the Misorientation Angle is 10°)
750
0.007
0.010
0.012
0.014
0.017
0.023
850
0.0074
0.011
0.015
0.021
Φ(0~90°)
φ1 (0~90°)
0.010
Metals 2021, 11, x FOR PEER REVIEW 7 of 15
Texture level
The distribution of specified orientation grains through the whole thickness of typical nitrided sheets is shown in Table 3. It can be seen that, with the increase in total nitrogen content, the specified orientation grains are located throughout the whole thickness of nitrided sheet at the same nitriding temperatures. That is, the distribution of specified orientation grains has no obvious rule. Moreover, the grains around most of the specified orientation grains are relatively scattered. Only the grains around Goss ({110} <001>) grains exhibit obvious orientation distribution, such as for {114} <481>, {554} <225>, and {111} <112>. It can be considered that the changes in total nitrogen content have no obvious effect on the distribution of specified orientation grains in a nitrided sheet.
Table 3. The distribution of specified orientation grains through the whole thickness of a decarburized sheet after nitriding annealing at 750 °C, 850 °C, and 950 °C.
Nitriding Temperature/°C
Total Nitrogen Content/% Distribution of Specified Orientation Grains (the Misorientation Angle is 10°)
750
0.007
0.010
0.012
0.014
0.017
0.023
850
0.0074
0.011
0.015
0.021
Φ(0~90°)
φ1 (0~90°)
0.012
Metals 2021, 11, x FOR PEER REVIEW 7 of 15
Texture level
The distribution of specified orientation grains through the whole thickness of typical nitrided sheets is shown in Table 3. It can be seen that, with the increase in total nitrogen content, the specified orientation grains are located throughout the whole thickness of nitrided sheet at the same nitriding temperatures. That is, the distribution of specified orientation grains has no obvious rule. Moreover, the grains around most of the specified orientation grains are relatively scattered. Only the grains around Goss ({110} <001>) grains exhibit obvious orientation distribution, such as for {114} <481>, {554} <225>, and {111} <112>. It can be considered that the changes in total nitrogen content have no obvious effect on the distribution of specified orientation grains in a nitrided sheet.
Table 3. The distribution of specified orientation grains through the whole thickness of a decarburized sheet after nitriding annealing at 750 °C, 850 °C, and 950 °C.
Nitriding Temperature/°C
Total Nitrogen Content/% Distribution of Specified Orientation Grains (the Misorientation Angle is 10°)
750
0.007
0.010
0.012
0.014
0.017
0.023
850
0.0074
0.011
0.015
0.021
Φ(0~90°)
φ1 (0~90°)
0.014
Metals 2021, 11, x FOR PEER REVIEW 7 of 15
Texture level
The distribution of specified orientation grains through the whole thickness of typical nitrided sheets is shown in Table 3. It can be seen that, with the increase in total nitrogen content, the specified orientation grains are located throughout the whole thickness of nitrided sheet at the same nitriding temperatures. That is, the distribution of specified orientation grains has no obvious rule. Moreover, the grains around most of the specified orientation grains are relatively scattered. Only the grains around Goss ({110} <001>) grains exhibit obvious orientation distribution, such as for {114} <481>, {554} <225>, and {111} <112>. It can be considered that the changes in total nitrogen content have no obvious effect on the distribution of specified orientation grains in a nitrided sheet.
Table 3. The distribution of specified orientation grains through the whole thickness of a decarburized sheet after nitriding annealing at 750 °C, 850 °C, and 950 °C.
Nitriding Temperature/°C
Total Nitrogen Content/% Distribution of Specified Orientation Grains (the Misorientation Angle is 10°)
750
0.007
0.010
0.012
0.014
0.017
0.023
850
0.0074
0.011
0.015
0.021
Φ(0~90°)
φ1 (0~90°)
0.017
Metals 2021, 11, x FOR PEER REVIEW 7 of 15
Texture level
The distribution of specified orientation grains through the whole thickness of typical nitrided sheets is shown in Table 3. It can be seen that, with the increase in total nitrogen content, the specified orientation grains are located throughout the whole thickness of nitrided sheet at the same nitriding temperatures. That is, the distribution of specified orientation grains has no obvious rule. Moreover, the grains around most of the specified orientation grains are relatively scattered. Only the grains around Goss ({110} <001>) grains exhibit obvious orientation distribution, such as for {114} <481>, {554} <225>, and {111} <112>. It can be considered that the changes in total nitrogen content have no obvious effect on the distribution of specified orientation grains in a nitrided sheet.
Table 3. The distribution of specified orientation grains through the whole thickness of a decarburized sheet after nitriding annealing at 750 °C, 850 °C, and 950 °C.
Nitriding Temperature/°C
Total Nitrogen Content/% Distribution of Specified Orientation Grains (the Misorientation Angle is 10°)
750
0.007
0.010
0.012
0.014
0.017
0.023
850
0.0074
0.011
0.015
0.021
Φ(0~90°)
φ1 (0~90°)
0.023
Metals 2021, 11, x FOR PEER REVIEW 7 of 15
Texture level
The distribution of specified orientation grains through the whole thickness of typical nitrided sheets is shown in Table 3. It can be seen that, with the increase in total nitrogen content, the specified orientation grains are located throughout the whole thickness of nitrided sheet at the same nitriding temperatures. That is, the distribution of specified orientation grains has no obvious rule. Moreover, the grains around most of the specified orientation grains are relatively scattered. Only the grains around Goss ({110} <001>) grains exhibit obvious orientation distribution, such as for {114} <481>, {554} <225>, and {111} <112>. It can be considered that the changes in total nitrogen content have no obvious effect on the distribution of specified orientation grains in a nitrided sheet.
Table 3. The distribution of specified orientation grains through the whole thickness of a decarburized sheet after nitriding annealing at 750 °C, 850 °C, and 950 °C.
Nitriding Temperature/°C
Total Nitrogen Content/% Distribution of Specified Orientation Grains (the Misorientation Angle is 10°)
750
0.007
0.010
0.012
0.014
0.017
0.023
850
0.0074
0.011
0.015
0.021
Φ(0~90°)
φ1 (0~90°)
850
0.0074
Metals 2021, 11, x FOR PEER REVIEW 7 of 15
Texture level
The distribution of specified orientation grains through the whole thickness of typical nitrided sheets is shown in Table 3. It can be seen that, with the increase in total nitrogen content, the specified orientation grains are located throughout the whole thickness of nitrided sheet at the same nitriding temperatures. That is, the distribution of specified orientation grains has no obvious rule. Moreover, the grains around most of the specified orientation grains are relatively scattered. Only the grains around Goss ({110} <001>) grains exhibit obvious orientation distribution, such as for {114} <481>, {554} <225>, and {111} <112>. It can be considered that the changes in total nitrogen content have no obvious effect on the distribution of specified orientation grains in a nitrided sheet.
Table 3. The distribution of specified orientation grains through the whole thickness of a decarburized sheet after nitriding annealing at 750 °C, 850 °C, and 950 °C.
Nitriding Temperature/°C
Total Nitrogen Content/% Distribution of Specified Orientation Grains (the Misorientation Angle is 10°)
750
0.007
0.010
0.012
0.014
0.017
0.023
850
0.0074
0.011
0.015
0.021
Φ(0~90°)
φ1 (0~90°)
0.011
Metals 2021, 11, x FOR PEER REVIEW 7 of 15
Texture level
The distribution of specified orientation grains through the whole thickness of typical nitrided sheets is shown in Table 3. It can be seen that, with the increase in total nitrogen content, the specified orientation grains are located throughout the whole thickness of nitrided sheet at the same nitriding temperatures. That is, the distribution of specified orientation grains has no obvious rule. Moreover, the grains around most of the specified orientation grains are relatively scattered. Only the grains around Goss ({110} <001>) grains exhibit obvious orientation distribution, such as for {114} <481>, {554} <225>, and {111} <112>. It can be considered that the changes in total nitrogen content have no obvious effect on the distribution of specified orientation grains in a nitrided sheet.
Table 3. The distribution of specified orientation grains through the whole thickness of a decarburized sheet after nitriding annealing at 750 °C, 850 °C, and 950 °C.
Nitriding Temperature/°C
Total Nitrogen Content/% Distribution of Specified Orientation Grains (the Misorientation Angle is 10°)
750
0.007
0.010
0.012
0.014
0.017
0.023
850
0.0074
0.011
0.015
0.021
Φ(0~90°)
φ1 (0~90°)
0.015
Metals 2021, 11, x FOR PEER REVIEW 7 of 15
Texture level
The distribution of specified orientation grains through the whole thickness of typical nitrided sheets is shown in Table 3. It can be seen that, with the increase in total nitrogen content, the specified orientation grains are located throughout the whole thickness of nitrided sheet at the same nitriding temperatures. That is, the distribution of specified orientation grains has no obvious rule. Moreover, the grains around most of the specified orientation grains are relatively scattered. Only the grains around Goss ({110} <001>) grains exhibit obvious orientation distribution, such as for {114} <481>, {554} <225>, and {111} <112>. It can be considered that the changes in total nitrogen content have no obvious effect on the distribution of specified orientation grains in a nitrided sheet.
Table 3. The distribution of specified orientation grains through the whole thickness of a decarburized sheet after nitriding annealing at 750 °C, 850 °C, and 950 °C.
Nitriding Temperature/°C
Total Nitrogen Content/% Distribution of Specified Orientation Grains (the Misorientation Angle is 10°)
750
0.007
0.010
0.012
0.014
0.017
0.023
850
0.0074
0.011
0.015
0.021
Φ(0~90°)
φ1 (0~90°)
0.021
Metals 2021, 11, x FOR PEER REVIEW 7 of 15
Texture level
The distribution of specified orientation grains through the whole thickness of typical nitrided sheets is shown in Table 3. It can be seen that, with the increase in total nitrogen content, the specified orientation grains are located throughout the whole thickness of nitrided sheet at the same nitriding temperatures. That is, the distribution of specified orientation grains has no obvious rule. Moreover, the grains around most of the specified orientation grains are relatively scattered. Only the grains around Goss ({110} <001>) grains exhibit obvious orientation distribution, such as for {114} <481>, {554} <225>, and {111} <112>. It can be considered that the changes in total nitrogen content have no obvious effect on the distribution of specified orientation grains in a nitrided sheet.
Table 3. The distribution of specified orientation grains through the whole thickness of a decarburized sheet after nitriding annealing at 750 °C, 850 °C, and 950 °C.
Nitriding Temperature/°C
Total Nitrogen Content/% Distribution of Specified Orientation Grains (the Misorientation Angle is 10°)
750
0.007
0.010
0.012
0.014
0.017
0.023
850
0.0074
0.011
0.015
0.021
Φ(0~90°)
φ1 (0~90°)
0.026
Metals 2021, 11, x FOR PEER REVIEW 8 of 15
0.026
950
0.0092
0.011
0.013
0.015
0.026
Figure 3 shows the relation between the total nitrogen content and the area fractions of specified orientation grains and texture factor of nitrided sheet at the nitriding temper-ature of 750, 800, 850, 900, and 950 °C. It can be seen that the area fraction of the {114} <481> grain in the nitrided sheet is the highest, followed by {001} <120>, γ fiber, and α fiber grains, while the area fractions of {110} <001>, {110} <112>, and {112} <111> grains are small. Meanwhile, the texture factor of a nitrided sheet is mostly between 0.15 and 0.40. How-ever, the area fractions of specified orientation grains and the texture factor of a nitrided sheet show fluctuant changes with the increase in total nitrogen content at the same ni-triding temperatures. It can be considered that the changes in total nitrogen content have an insignificant influence on the area fractions of specified orientation grains and the tex-ture factor.
ND
RD
Metals 2021, 11, 189 8 of 14
Table 3. Cont.
NitridingTemperature/◦C
Total NitrogenContent/% Distribution of Specified Orientation Grains (the Misorientation Angle is 10◦)
950
0.0092
Metals 2021, 11, x FOR PEER REVIEW 8 of 15
0.026
950
0.0092
0.011
0.013
0.015
0.026
Figure 3 shows the relation between the total nitrogen content and the area fractions of specified orientation grains and texture factor of nitrided sheet at the nitriding temper-ature of 750, 800, 850, 900, and 950 °C. It can be seen that the area fraction of the {114} <481> grain in the nitrided sheet is the highest, followed by {001} <120>, γ fiber, and α fiber grains, while the area fractions of {110} <001>, {110} <112>, and {112} <111> grains are small. Meanwhile, the texture factor of a nitrided sheet is mostly between 0.15 and 0.40. How-ever, the area fractions of specified orientation grains and the texture factor of a nitrided sheet show fluctuant changes with the increase in total nitrogen content at the same ni-triding temperatures. It can be considered that the changes in total nitrogen content have an insignificant influence on the area fractions of specified orientation grains and the tex-ture factor.
ND
RD
0.011
Metals 2021, 11, x FOR PEER REVIEW 8 of 15
0.026
950
0.0092
0.011
0.013
0.015
0.026
Figure 3 shows the relation between the total nitrogen content and the area fractions of specified orientation grains and texture factor of nitrided sheet at the nitriding temper-ature of 750, 800, 850, 900, and 950 °C. It can be seen that the area fraction of the {114} <481> grain in the nitrided sheet is the highest, followed by {001} <120>, γ fiber, and α fiber grains, while the area fractions of {110} <001>, {110} <112>, and {112} <111> grains are small. Meanwhile, the texture factor of a nitrided sheet is mostly between 0.15 and 0.40. How-ever, the area fractions of specified orientation grains and the texture factor of a nitrided sheet show fluctuant changes with the increase in total nitrogen content at the same ni-triding temperatures. It can be considered that the changes in total nitrogen content have an insignificant influence on the area fractions of specified orientation grains and the tex-ture factor.
ND
RD
0.013
Metals 2021, 11, x FOR PEER REVIEW 8 of 15
0.026
950
0.0092
0.011
0.013
0.015
0.026
Figure 3 shows the relation between the total nitrogen content and the area fractions of specified orientation grains and texture factor of nitrided sheet at the nitriding temper-ature of 750, 800, 850, 900, and 950 °C. It can be seen that the area fraction of the {114} <481> grain in the nitrided sheet is the highest, followed by {001} <120>, γ fiber, and α fiber grains, while the area fractions of {110} <001>, {110} <112>, and {112} <111> grains are small. Meanwhile, the texture factor of a nitrided sheet is mostly between 0.15 and 0.40. How-ever, the area fractions of specified orientation grains and the texture factor of a nitrided sheet show fluctuant changes with the increase in total nitrogen content at the same ni-triding temperatures. It can be considered that the changes in total nitrogen content have an insignificant influence on the area fractions of specified orientation grains and the tex-ture factor.
ND
RD
0.015
Metals 2021, 11, x FOR PEER REVIEW 8 of 15
0.026
950
0.0092
0.011
0.013
0.015
0.026
Figure 3 shows the relation between the total nitrogen content and the area fractions of specified orientation grains and texture factor of nitrided sheet at the nitriding temper-ature of 750, 800, 850, 900, and 950 °C. It can be seen that the area fraction of the {114} <481> grain in the nitrided sheet is the highest, followed by {001} <120>, γ fiber, and α fiber grains, while the area fractions of {110} <001>, {110} <112>, and {112} <111> grains are small. Meanwhile, the texture factor of a nitrided sheet is mostly between 0.15 and 0.40. How-ever, the area fractions of specified orientation grains and the texture factor of a nitrided sheet show fluctuant changes with the increase in total nitrogen content at the same ni-triding temperatures. It can be considered that the changes in total nitrogen content have an insignificant influence on the area fractions of specified orientation grains and the tex-ture factor.
ND
RD
0.026
Metals 2021, 11, x FOR PEER REVIEW 8 of 15
0.026
950
0.0092
0.011
0.013
0.015
0.026
Figure 3 shows the relation between the total nitrogen content and the area fractions of specified orientation grains and texture factor of nitrided sheet at the nitriding temper-ature of 750, 800, 850, 900, and 950 °C. It can be seen that the area fraction of the {114} <481> grain in the nitrided sheet is the highest, followed by {001} <120>, γ fiber, and α fiber grains, while the area fractions of {110} <001>, {110} <112>, and {112} <111> grains are small. Meanwhile, the texture factor of a nitrided sheet is mostly between 0.15 and 0.40. How-ever, the area fractions of specified orientation grains and the texture factor of a nitrided sheet show fluctuant changes with the increase in total nitrogen content at the same ni-triding temperatures. It can be considered that the changes in total nitrogen content have an insignificant influence on the area fractions of specified orientation grains and the tex-ture factor.
ND
RD
Metals 2021, 11, x FOR PEER REVIEW 8 of 14
0.011
0.013
0.015
0.026
Figure 3 shows the relation between the total nitrogen content and the area fractions of specified orientation grains and texture factor of nitrided sheet at the nitriding temper-ature of 750, 800, 850, 900, and 950 °C. It can be seen that the area fraction of the {114}
<481> grain in the nitrided sheet is the highest, followed by {001} <120>, γ fiber, and α fiber grains, while the area fractions of {110} <001>, {110} <112>, and {112} <111> grains are small.
Meanwhile, the texture factor of a nitrided sheet is mostly between 0.15 and 0.40. How-ever, the area fractions of specified orientation grains and the texture factor of a nitrided sheet show fluctuant changes with the increase in total nitrogen content at the same ni-
triding temperatures. It can be considered that the changes in total nitrogen content have an insignificant influence on the area fractions of specified orientation grains and the tex-
ture factor.
Figure 3. Relation between total nitrogen content and the area fractions of specified orientation grains and texture factor of a decarburized sheet after nitriding annealing at different tempera-tures: (a) 750 °C, (b) 800 °C, (c) 850 °C, (d) 900 °C, (e) 950 °C, and (f) 750–950 °C.
ND
RD
Figure 3. Relation between total nitrogen content and the area fractions of specified orientationgrains and texture factor of a decarburized sheet after nitriding annealing at different temperatures:(a) 750 ◦C, (b) 800 ◦C, (c) 850 ◦C, (d) 900 ◦C, (e) 950 ◦C, and (f) 750–950 ◦C.
Metals 2021, 11, 189 9 of 14
Similarly, according to the data in Tables 2 and 3 and Figure 3, when the total nitrogencontent is about 0.011%, 0.014%, and 0.023%, respectively, with the nitriding temperaturerising from 750 to 950 ◦C, the changes in nitriding temperature have no obvious effect onthe component and intensity of the primary recrystallization texture, the distribution andarea fractions of specified orientation grains, and the texture factor of a nitrided sheet.
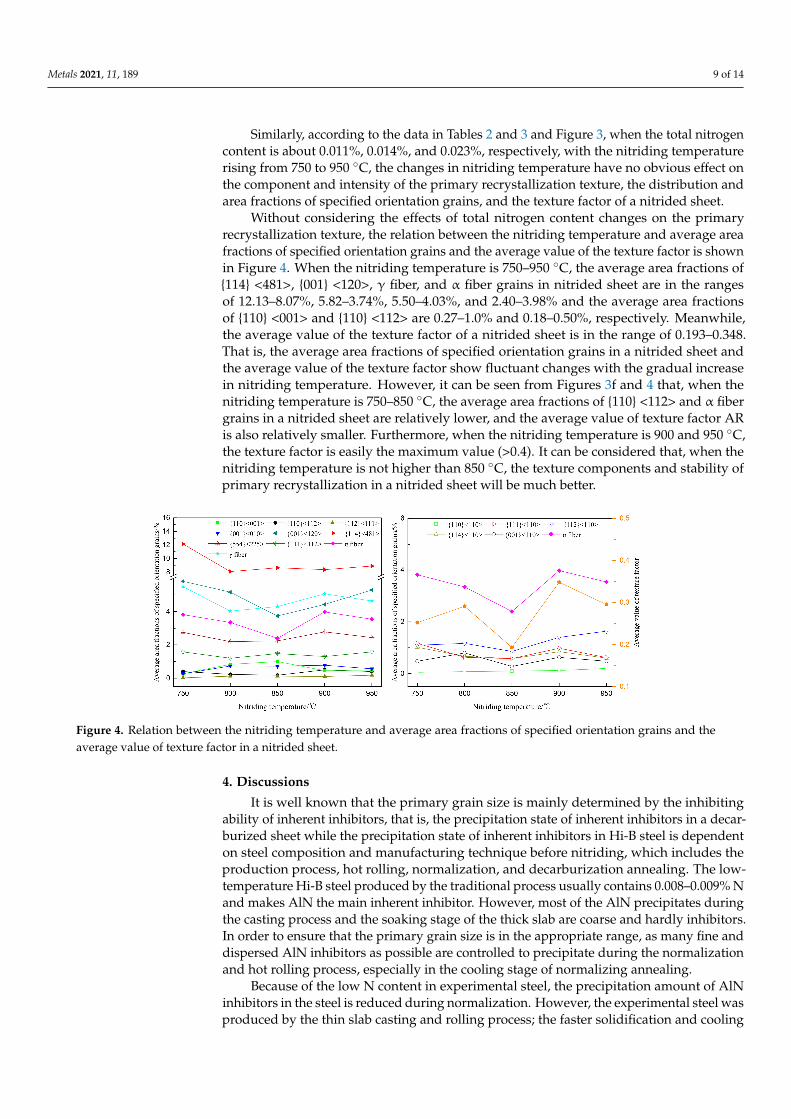
Without considering the effects of total nitrogen content changes on the primaryrecrystallization texture, the relation between the nitriding temperature and average areafractions of specified orientation grains and the average value of the texture factor is shownin Figure 4. When the nitriding temperature is 750–950 ◦C, the average area fractions of{114} <481>, {001} <120>, γ fiber, and α fiber grains in nitrided sheet are in the rangesof 12.13–8.07%, 5.82–3.74%, 5.50–4.03%, and 2.40–3.98% and the average area fractionsof {110} <001> and {110} <112> are 0.27–1.0% and 0.18–0.50%, respectively. Meanwhile,the average value of the texture factor of a nitrided sheet is in the range of 0.193–0.348.That is, the average area fractions of specified orientation grains in a nitrided sheet andthe average value of the texture factor show fluctuant changes with the gradual increasein nitriding temperature. However, it can be seen from Figures 3f and 4 that, when thenitriding temperature is 750–850 ◦C, the average area fractions of {110} <112> and α fibergrains in a nitrided sheet are relatively lower, and the average value of texture factor ARis also relatively smaller. Furthermore, when the nitriding temperature is 900 and 950 ◦C,the texture factor is easily the maximum value (>0.4). It can be considered that, when thenitriding temperature is not higher than 850 ◦C, the texture components and stability ofprimary recrystallization in a nitrided sheet will be much better.
Figure 4. Relation between the nitriding temperature and average area fractions of specified orientation grains and theaverage value of texture factor in a nitrided sheet.
4. Discussions
It is well known that the primary grain size is mainly determined by the inhibitingability of inherent inhibitors, that is, the precipitation state of inherent inhibitors in a decar-burized sheet while the precipitation state of inherent inhibitors in Hi-B steel is dependenton steel composition and manufacturing technique before nitriding, which includes theproduction process, hot rolling, normalization, and decarburization annealing. The low-temperature Hi-B steel produced by the traditional process usually contains 0.008–0.009% Nand makes AlN the main inherent inhibitor. However, most of the AlN precipitates duringthe casting process and the soaking stage of the thick slab are coarse and hardly inhibitors.In order to ensure that the primary grain size is in the appropriate range, as many fine anddispersed AlN inhibitors as possible are controlled to precipitate during the normalizationand hot rolling process, especially in the cooling stage of normalizing annealing.
Because of the low N content in experimental steel, the precipitation amount of AlNinhibitors in the steel is reduced during normalization. However, the experimental steel wasproduced by the thin slab casting and rolling process; the faster solidification and cooling

Metals 2021, 11, 189 10 of 14
rate, lower soaking temperature and shorter soaking time are helpful in effectively reducingthe precipitation and growth of coarse nitride and sulfide and in relatively increasing theprecipitation amount of fine and dispersed AlN and MnS in a thin slab [13,14]. Differentfrom the traditional process, these are beneficial for retaining a certain number of inherentinhibitors from the slab to the decarburized sheet, which can also restrain the normalgrowth of primary recrystallisation grains.
The observation results by FESEM of the precipitates in a decarburized sheet areshown in Figure 5. It can be seen that there are a considerable number of dispersedprecipitates in steel which precipitate in the grain interiors and grain boundaries. Thesize of the precipitates is generally in the range of 10–300 nm. In addition, combinedwith the observation results by TEM, it can be indicated that the precipitates in steel aremainly bulk nitrides and that the size is mostly 40–150 nm. The precipitation amount ofspherical or spindle-shaped sulfides is relatively small, and the size is mostly 20–80 nm.Furthermore, the nitride precipitates are mainly AlN precipitated separately and includea certain amount of AlN + MnS, AlN + CuxS composite precipitates and a very smallamount of TiN and (Al,Ti)N precipitates. The sulfide precipitates are mainly (Mn,Cu)Sand (Cu,Mn)S composite precipitates and include a certain amount of MnS precipitatedseparately and a very small amount of CuxS + AlN composite precipitates. The typicalmorphologies and EDS results of the nitride and sulfide precipitates in a decarburizedsheet are shown in Figure 6.
Figure 5. Distribution and morphologies of precipitates in a decarburized sheet observed by FESEM:(a,b) grain boundaries and grain interiors at 5000 magnification; (c) grain boundaries at 20,000 mag-nification; and (d) grain interiors at 20,000 magnification.

Metals 2021, 11, 189 11 of 14
Figure 6. Typical morphologies and EDS results of precipitates in a decarburized sheet observed by TEM: (a1,a2) AlN;(b1,b2) AlN + CuxS; and (c1,c2) (Mn,Cu)S.
The statistical and calculated results show that the distribution density of precipitatesin a decarburized sheet is 1.917 × 10⁸/cm2 and that the average size is about 98 nm.Meanwhile, the number of precipitates with a size distribution of 20–100 nm accountsfor 59.7% of the total number, as shown in Figure 7. The distribution density of theseprecipitates is 1.144 × 10⁸/cm2, and the average size is about 61 nm. Compared with thedecarburized sheet of low-temperature Hi-B steel containing 0.008–0.009% N producedby the traditional process [27,28], the size distributions of precipitates are more favorableunder our experimental conditions, and the distribution density and precipitation amountof precipitates, for which the size is less than 100 nm, are significantly higher. Moreover,the primary grain size of the decarburized sheet is about 26–27 µm, which is relativelylarger but still in the suitable range of 20–30 µm. These results indicate that the inhibitionability of inherent inhibitors in a decarburized sheet which can restrain the normal growthof primary recrystallisation grains may be sufficient before nitriding. Furthermore, theacquired nitride precipitates are mainly located on the surface of a decarburized sheetduring nitriding treatment at 660–950 ◦C with a short time. Additionally, with the increasein nitriding temperature and time, the acquired nitride precipitates may gradually expandto the subsurface layer [7,29,30]. These acquired nitride precipitates will also play a strongeffect in restraining the normal growth of primary recrystallisation grains during nitriding.
Figure 7. Size distributions of precipitates in a decarburized sheet.
When the decarburized sheet is nitrided at 750–850 ◦C for 60 s, the growth tendency ofprimary grains is slight during nitriding because the inhibiting ability of inherent inhibitorsis sufficient and the nitriding temperature is lower. Therefore, the changes in the averagevalue of the primary grain size and the inhomogeneity factor of a nitrided sheet are
Metals 2021, 11, 189 12 of 14
very small. When the decarburized sheet is nitrided at 900–950 ◦C for 60 s, the growthtendencies of primary grains in the center layer and subsurface layer are great, since thenitriding temperature is evidently higher than the decarburization temperature. However,because the total inhibition ability of inherent inhibitors and acquired nitride precipitatesis relatively strong and the nitriding time is short, the average value of the primary grainsize is slightly increased by 1.1–1.6 µm and the grain size homogeneity of nitrided sheet isdeteriorated gradually.
Under the experimental conditions, the components of primary recrystallizationtexture are mainly {001} <120>, {114} <481>, and γ fiber, which is consistent with theprimary recrystallization texture of low-temperature Hi-B steel produced by the traditionalprocess with the acquired inhibitor method [29–34], and the area fraction of {114} <481>grains is much higher than {001} <120> and γ fiber grains in a nitrided sheet, which isconsistent with the research result of Li, X. and Yasuda, M. but partly different fromthat of Liu, G.T. [30–32]. During the process of decarburization and nitriding annealing,the characteristics and changes in texture of the nitrided sheet are closely related to theformation and changes in its microstructure. It is generally believed that, during graingrowth after recrystallization is completed in the cold-rolled sheet, the α fiber texture willbe obviously gathered at the {114} <481> orientation, which makes the texture intensity andarea fraction of {114} <481> grains increase greatly. However, the texture intensity and areafraction of {111} <112> grains will be reduced obviously. Moreover, with the substantialincrease in annealing temperature or time during primary recrystallization, that is, withthe obvious growth in primary grain size, the texture intensity and area fraction of {114}<481> grains will also be increased significantly [31–34].
When the decarburized sheet is nitrided at 750–850 ◦C for 60 s, because the changesin the average value of primary grain size and the inhomogeneity factor of a nitridedsheet are very small, the main features of the primary recrystallization texture have notchanged. Both the average area fractions of specified orientation grains in a nitridedsheet and the average value of texture factor remain unchanged or have a certain rangeof fluctuations. When the decarburized sheet is nitrided at 900–950 ◦C for 60 s, becausethe average value of primary grain size and its inhomogeneity factor is only increased tosome extent, the textures intensity and area fractions of {114} <481>, {111} <112>, and {554}<225> grains in nitrided sheet are not increased significantly but only fluctuate in a certainrange at whole nitriding temperatures. However, since the area fraction of {112} <110>grains increased significantly from 0.86–1.17% to 1.40–1.64% and a small amount of thesegrains grew obviously, seen in Figure 4 and Table 3, the average value of the texture factorshows some increase and the texture factors of some nitrided sheets obtain maximumvalues. The growth mechanism of {112} <110> orientation grains and its influencing factorsduring nitriding at higher temperatures still need to be further studied. In summary, inorder to ensure that the decarburized sheet has better primary grain size and homogeneity,better texture composition, and stability, the nitriding temperature should be controlled at750–850 ◦C under our experimental conditions.
5. Conclusions
(1) After the decarburized sheet was nitrided at 750–950 ◦C, the average primary grainsize and its inhomogeneity factor were in the range of 26.58–28.26 µm and 0.568–0.578,respectively. The components of primary recrystallization texture were mainly {001}<120>, {114} <481>, and γ fiber texture. Meanwhile, the area fraction of {114} <481>grains in the nitrided sheet was the highest, followed by {001} <120>, γ fiber, and αfiber grains, and the texture factor was mostly between 0.15 and 0.40.
(2) At the same nitriding temperatures, the effects of the total nitrogen content on both theprimary grain size and the inhomogeneity factor of a nitrided sheet were not obvious.The effects of total nitrogen content on the component and intensity of primaryrecrystallization texture, the distribution and area fractions of specified orientationgrains, and the texture factor of nitrided sheet were also insignificant.

Metals 2021, 11, 189 13 of 14
(3) When the nitriding temperature was 750–850 ◦C, because the inhibition ability ofinherent inhibitors in a decarburized sheet was relatively sufficient, the changes innitriding temperature have little effect on the primary recrystallization microstructureand texture. When the nitriding temperature rose to 900–950 ◦C, the average valueof primary grain size increased by 1.1–1.6 µm and the inhomogeneity factor alsoincreased gradually. Moreover, some values of the texture factor increased sharplybecause of the area fraction of {112} <110> grains increased greatly in the nitridedsheet. In order to ensure that the decarburized sheet had better primary recrystalliza-tion microstructure and texture characteristics, the nitriding temperature should becontrolled between 750 and 850 ◦C.
Author Contributions: Conceptualization, B.F. and L.X.; methodology, B.F.; software, J.-L.Q.; valida-tion, B.F., L.X., and H.-J.W.; formal analysis, B.F.; investigation, B.F.; resources, B.F.; data curation, B.F.;writing—Original draft preparation, B.F.; writing—Review and editing, B.F. and J.L.; visualization,J.L.; supervision, L.X.; project administration, S.-T.Q.; funding acquisition, S.-T.Q. All authors haveread and agreed to the published version of the manuscript.
Funding: This work was financially supported by the National Key Research and DevelopmentProgram of China (2016YFB0300305).
Data Availability Statement: Data available in a publicly accessible repository.
Conflicts of Interest: The authors declare no conflict of interest.
References1. Takahashi, N.; Suga, Y.; Kobayashi, H. Recent developments in grain-oriented silicon steel. J. Magn. Magn. Mater. 1996, 160,
98–101. [CrossRef]2. Kubota, T.; Fujikura, M.; Ushigami, Y. Recent progress and future trend on grain-oriented silicon steel. J. Magn. Magn. Mater.
2000, 215–216, 69–73. [CrossRef]3. Xia, Z.S.; Kang, Y.L.; Wang, Q.L. Developments in the production of grain-oriented electrical steel. J. Magn. Magn. Mater. 2008,
320, 3229–3233. [CrossRef]4. Qiu, S.T.; Fu, B.; Xiang, L.; Cheng, G.G. Recent research trends and developments of production process and technology for high
magnetic induction grain-oriented silicon steel. Iron Steel. 2013, 48, 1–8.5. Li, X.H.; Meng, X.T.; Zhao, P.F.; He, X.G.; Yu, H.B.; Luo, H.W. Present status and future prospect of high permeability grain-
oriented silicon steel. China Metall. 2019, 29, 1–7.6. Fu, B.; Xiang, L.; Qiu, S.T.; Cheng, G.G. Research advances in inhibitors control of low-temperature high magnetic induction
grain-oriented silicon steel production with acquired inhibitor method. Chin. J. Process Eng. 2014, 14, 173–180.7. Luo, X.G.; Guo, X.L.; Gao, Y.; Chen, W.C.; Ding, Z. Effect of nitriding temperature on the inhibitor state of grain-oriented silicon
steel. J. Wuhan Univ. Sci. Technol. 2019, 42, 8–12.8. Fortunati, S.; Cicale, S.; Abbruzzese, G. Process for the Production of Grain Oriented Electrical Steel Strip Having High Magnetic
Characteristics, Starting from Thin Slabs. U.S. Patent 6,296,719B1, 2 October 2001.9. Cicale, S.; Fortunati, S.; Abbruzzese, G. Process for the Inhibition Control in the Production of Grain-Oriented Electrical Sheets.
U.S. Patent 6,361,620B1, 26 March 2002.10. Fortunati, S.; Cicale, S.; Abbruzzese, G. Process for the Inhibition Control in the Production of Grain-Oriented Electrical Sheets.
U.S. Patent 6,361,621B1, 26 March 2002.11. Fortunati, S.; Cicale, S.; Abbruzzese, G.; Matera, S. Process for the Treatment of Grain Oriented Silicon Steel. U.S. Patent
6,406,557B1, 18 June 2002.12. Günther, K.; Lahn, L.; Ploch, A.; Sowka, E. Method for Producing Grain Oriented Magnetic Steel Strip. U.S. Patent 8,088,229B2,
3 January 2012.13. Qiu, S.T.; Xiang, L.; Yue, E.B.; Zhao, P. Technology analysis of producing grain oriented silicon steel by thin slab casting and
rolling process. Iron Steel 2008, 43, 1–7.14. Fu, B.; Xiang, L.; Qiu, S.T.; Cheng, G.G. Research status and technological analysis of producing high magnetic induction
grain-oriented silicon steel by thin slab casting and rolling process. Mater. Rev. 2013, 27, 110–114.15. Xiang, L.; Chen, S.L.; Pei, Y.H.; Luo, Z.H.; Qiu, S.T. Domestic current status and research progress of producing electrical steel by
thin slab casting and rolling process. In Proceedings of the 11th China Steel Congress, Beijing, China, 21–22 November 2017;pp. 69–74.
16. Chen, S.L.; Fang, Z.M.; Luo, Z.H.; Wu, J.P.; Sun, L.; Wang, C.F.; Huang, B.; Guo, X.L.; Zhang, C.; Liang, Z.R.; et al. Method forProducing High Permeability Grain Oriented Silicon Steel by Thin Slab Casting and Rolling. China Patent CN102,517,429A,27 June 2012.

Metals 2021, 11, 189 14 of 14
17. Yu, Y.M.; Xu, Y.B.; Li, C.S.; Wang, G.D. Inhibitor precipitation of Fe-3% Si strip by thin slab casting and rolling. Trans. Mater. HeatTreat. 2010, 31, 21–25.
18. Li, C.S.; Yang, H.; Wang, Y.F.; Yu, Y.M. Texture of hot rolled strip for fe-3si steel produced by thin slab casting and rolling. J. IronSteel Res. Int. 2010, 17, 46–53. [CrossRef]
19. Bao, S.Q.; Xu, Y.; Zhao, G.; Huang, X.B.; Xiao, H.; Ye, C.L.; Song, N.N.; Chang, Q.M. Microstructure, texture and precipitates ofgrain-oriented silicon steel produced by thin slab casting and rolling process. J. Iron Steel Res. Int. 2017, 24, 91–96. [CrossRef]
20. Huang, F.Y.; Zhao, G.; Xu, Y.; Su, C.Q. Influence of inhibitors on primary recrystallization structure of Hi-B electrical steel. J. IronSteel Res. 2018, 30, 373–378.
21. Su, C.Q.; Zhao, G.; Xiao, H.; Lan, Y.Z.; Huang, F.Y. Abnormal grain growth of Hi-B steel in the secondary recrystallization.Metallogr. Microstruct. Anal. 2018, 7, 608–617. [CrossRef]
22. Bao, S.Q.; Liu, B.B.; Zhao, G.; Lan, Y.Z.; Huang, F.Y. Secondary recrystallisation behaviours of grain-orientated silicon steelproduced by TSCR process. Ironmak. Steelmak. 2018, 45, 924–928. [CrossRef]
23. Huang, F.Y.; Bao, S.Q.; Zhao, G.; Su, C.Q. Effect of different nitriding temperature on secondary recrystallization of Hi-B steelwith an element of Cu. Metallogr. Microstruct. Anal. 2019, 8, 12–22. [CrossRef]
24. Fu, B.; Xiang, L.; Wang, H.J.; Qiu, S.T. Effects of nitrogen content and nitriding temperature on primary recrystallization behaviorsof high magnetic induction grain-oriented silicon steel. In Proceedings of the Seminar Conference on Production Technology andApplication of Domestic High-performance Electrical Steel, Dalian, China, 25–26 August 2016; pp. 22–34.
25. Wang, H.J.; Fu, B.; Xiang, L.; Rong, Z.; Qiu, S.T. Effect of nitrogen content on primary recrystallization behavior and magneticproperty of Hi-B steel. J. Iron Steel Res. Int. 2016, 23, 1080–1085. [CrossRef]
26. Xiang, L.; Rong, Z.; Fu, B.; Wang, H.J.; Qiu, S.T. Characterizing microstructure and texture after recrystallization annealing of hi-bsteel with simutaneous decarburization and nitriding. J. Iron Steel Res. Int. 2017, 24, 1215–1222. [CrossRef]
27. Wu, Z.W.; Li, J.; Zhao, Y.; Li, B. Low-temperature heating technology oriented silicon steel decarburization and nitriding processand organization. In Proceedings of the 11th China Electrical Steel Professional Academic Annual Conference, Xiamen, China,9–12 December 2010; pp. 172–176.
28. Wu, Z.W.; Zhao, Y.; Li, J.; Li, B. Study on precipitates of grain-oriented silicon steel produced by acquired inhibitor method. J.Mater. Eng. 2012, 2, 55–58.
29. Wang, R.; Yang, P.; Liu, G.T. Effect of nitriding temperature on inhibitor precipitation and the annealed microstructure ofgrain-oriented silicon steel produced by acquired inhibitor method. Chin. J. Stereol. Image Anal. 2016, 21, 272–278.
30. Li, X.; Yang, P.; Jia, Z.W.; Zhang, H.L. Effects of normalizing process and nitriding process on the microstructure, texture, andmagnetic properties in low-temperature grain-oriented silicon steel. Chin. J. Eng. 2019, 41, 610–617.
31. Yasuda, M.; Kataoka, T.; Ushigami, Y.; Murakami, K.; Ushioda, K. texture evolution during recrystallization and grain growth inheavily cold-rolled fe-3%Si alloy. ISIJ Int. 2018, 58, 1893–1900. [CrossRef]
32. Liu, G.T.; Liu, Z.Q.; Yang, P.; Mao, W.M. Correlation between primary and secondary recrystallization texture components inlow-temperature reheated grain-oriented silicon steel. J. Iron Steel Res. Int. 2016, 23, 1234–1242. [CrossRef]
33. Liu, G.T.; Liu, Z.Q.; Yang, P.; Mao, W.M. Effect of primary recrystallized microstructure and nitriding on secondary recrystallizationin grain oriented silicon steel by low temperature slab reheating. J. Mater. Eng. 2018, 46, 16–24.
34. Liu, Z.Q.; Yang, P.; Mao, W.M.; Cui, F.E. Effect of {114} <418> texture on abnormal growth during secondary recrystallization ingrain-oriented steel. Acta Metall. Sin. 2015, 51, 769–776.