
БЕОГРАДСКА АСТРОНОМСКА ОПСЕРВАТОРИЈА У 1995; BELGRADE ASTRONOMICAL OBSERVATORY IN 1995
Upload
independentCategory
view
0download
0
Deep-Sea Research II 48 (2001) 1127}1172
Primary productivity and its regulation in theArabian Sea during 1995
Richard T. Barber��*, John Marra�, Robert C. Bidigare�,Louis A. Codispoti�, David Halpern�, Zackary Johnson�,
Mikel Latasa�, Ralf Goericke�, Sharon L. Smith�
�Duke University, Nicholas School of the Environment, Beaufort, NC 28516, USA�Lamont-Doherty Earth Observatory, Palisades, NY 10964, USA
�University of Hawaii, Honolulu, HI 96822, USA�University of Maryland, Horn Point Laboratory, Cambridge, MD 21613, USA
�Jet Propulsion Laboratory, California Institute of Technology, Pasadena, CA 91109, USA�Instituto de Ciencias del Mar, Barcelona, Spain
�Scripps Institution of Oceanography, La Jolla, CA 92093-0218, USA�University of Miami, Rosenstiel School of Marine and Atmospheric Science, Miami, FL 33149, USA
Received 23 June 1999; received in revised form 25 May 2000; accepted 7 July 2000
Abstract
The annual cycle of monsoon-driven variability in primary productivity was studied in 1995 during theArabian Sea Expedition as part of the United States Joint Global Ocean Flux Studies (US JGOFS). Thispaper describes the seasonal progression of productivity and its regulation on a section which ran from thecoast of Oman to about 1000 km o!shore in the central Arabian Sea at 653E. During the SW Monsoon(June}mid-September), the coolest water and highest nutrient concentrations were close to the coast,although they extended o!shore to about 800 km; during the January NE Monsoon, deep convective mixingprovided nutrients to the mixed layer in the region 400 } 1000 km o!shore. As expected, the SW Monsoonwas the most productive season (123$9 mmol C m��d��) along the southern US JGOFS section from thecoast to 1000 km o!shore, but productivity in the NE Monsoon was surprisingly high (112$7 mmolC m�� d��). There was no onshore/o!shore gradient in primary productivity from 150 to 1000 km o! theOmani coast in 1995, and there was no evidence of light limitation of either primary productivity orphotosynthetic performance (P�
�) from deep convective mixing during the NE Monsoon, deep wind mixing
during the SW Monsoon or o!shore Ekman downwelling during the SW Monsoon. Productivity during theSpring Intermonsoon (86$6 mmol C m�� d��) was much higher than in oligotrophic regions such as thetropical Paci"c Ocean (29$2 mmol C m�� d��) or the North Paci"c gyre region (32$8 mmol C m�� d��).
* Corresponding author. Fax: #1-252-504-7648.E-mail address: [email protected] (R.T. Barber).
0967-0645/01/$ - see front matter � 2001 Elsevier Science Ltd. All rights reserved.PII: S 0 9 6 7 - 0 6 4 5 ( 0 0 ) 0 0 1 3 4 - X
The 1995 annual mean productivity (111$11 mmol C m�� d��) along this section from the Omani coast tothe central Arabian Sea was about equal to the spring bloom maximum (107$23 mmol C m�� d��) duringthe 1989 North Atlantic Bloom Experiment (NABE) and the equatorial, 13N}13S wave guide maximum(95$6 mmol C m�� d��) in the Paci"c Ocean during the 1992 EqPac study. The 1995 SW Monsoonprimary productivity was similar to the mean value observed in the same region in 1994 by the ArabesqueExpedition (127$14 mmol C m�� d��) and in 1964 by the ANTON BRUUN Expedition (115$27 mmolC m�� d��). During the 1995 SW Monsoon, strong, narrow and meandering current "laments extended fromthe region of coastal upwelling to about 700 km o!shore; these "laments had levels of biomass, primaryproductivity, chlorophyll-speci"c productivity and diatom abundance that were elevated relative to otherlocations during the SW Monsoon. The SW Monsoon was the most productive period, but SW Monsoonprimary productivity values were lower than predicted because e$cient grazing by mesozooplankton keptdiatoms from accumulating the biomass necessary for achieving the high levels of primary productivitycharacteristic of other coastal upwelling regions. The high rates of chlorophyll-speci"c productivity(P�
�'10 mmol C mg Chl�� d��) observed in the 1995 SW Monsoon, together with the observed dust #ux
and iron concentrations, indicate that the Arabian Sea was more iron replete than the equatorial Paci"cOcean or the Southern Ocean. � 2001 Elsevier Science Ltd. All rights reserved.
1. Introduction
`There is no better place on earth to study the reaction of an ocean with the atmosphere than thenorthern Indian Ocean,a according to Dietrich (1973). However, as WuK st (1959) emphasized, toresolve the response of the ocean and its biota to the strong, seasonally reversing monsoonal wind,`a schematic grid system of sections with repeated observations in di!erent seasonsa is needed. TheUS JGOFS Arabian Sea Expedition followed the advice of WuK st (1959) in that repeated observa-tions were made at the same locations in the Arabian Sea in di!erent seasons throughout the year(Smith et al., 1998a). The goals of JGOFS are (1) to determine and understand processes controllingthe time-varying #uxes of carbon and associated biogenic elements; and (2) to predict the responseof marine biogeochemical processes to climate change. The primary productivity analyses carriedout during the Arabian Sea Expedition and described here contribute to the achievement of the"rst JGOFS goal.
The overall science plan of the US JGOFS Arabian Sea Expedition (Smith, 1991) and the speci"cplan of the primary productivity work were based on the conventional wisdom concerning physicaland biological variability of the Arabian Sea. De"ning characteristics of the Arabian Sea seasonalcycle of physical conditions are (1) strong wind stress during the SW Monsoon that results inwidespread upwelling and mixing in the boreal summer; (2) moderate strength, relatively cool anddry winds during the winter NE Monsoon that promote evaporative cooling, forcing strongconvective mixing in the o!shore region; and (3) during the Spring and Fall Intermonsoontransition periods, weak winds and surface layer heating that produce strong strati"cation, shallowmixed layers (MLs) and oligotrophy.
The regularity and strength of the monsoon wind and current reversals have been known sincethe 10th century. In particular, the SW (or summer) Monsoon, which begins in June and endsabruptly some time between the end of August and mid-September, has long held the attention ofsociety because it brings essential rains to the Indian subcontinent. Because of this societal link the
1128 R.T. Barber et al. / Deep-Sea Research II 48 (2001) 1127}1172

timing and strength of the SW Monsoon have been recorded for centuries. The SW Monsoon startsrapidly and regularly. In the Arabian Sea, it not only forces upwelling of nutrient-rich subsurfacewater, but also provides a high #ux of iron-rich eolian dust to a tropical ocean that receives intense(saturating) solar radiation. These favorable conditions are maintained throughout the 3- to3.5-month period of the SW Monsoon, resulting in a sustained high rate of primary productivitythat is exceptional in its magnitude among o!shore ocean regions (Ryther and Menzel, 1965;Zeitzschel, 1973; Yoder et al., 1993). The processes responsible for this sustained high primaryproductivity during the SW Monsoon are strong and continuous upwelling (Currie et al., 1973;Smith and Bottero, 1977; Brock et al., 1992), high subsurface nutrient concentrations (Ryther andMenzel, 1965; McGill, 1973), and high eolian iron supply through dust (Bauer et al., 1991; Smith,1991).
Upwelling and nutrient enrichment resulting from the strong SW Monsoon and the associatedhigh rates of primary productivity have been known for many years (Ryther and Menzel, 1965;Ryther et al., 1966; Kabanova, 1968; Aruga, 1973; Krey, 1973; Krey and Babenerd, 1976; Qasim,1977; Nair and Pillai, 1983). While there are no annual time series per se, there were enoughobservations for Longhurst (1998) to propose a conceptual model of the annual productivity cyclethat ranges from '250 mmol C m�� d�� during the SW Monsoon to +60 mmol C m�� d��
during the remainder of the year.The strong seasonal cycle in nutrient supply, alternating between highly eutrophic and moder-
ately oligotrophic conditions, was assumed to provide a temporal pattern that makes the ArabianSea uniquely valuable for testing hypotheses dealing with the onset, maintenance and decay of highproductivity and export of organic material to the deep sea (Nair et al., 1989). In addition, theArabian Sea was thought to have very strong spatial gradients in primary productivity during theSW Monsoon, with exceptionally eutrophic conditions in the Omani coastal region changing tooligotrophic conditions in the central portion of the Arabian Sea along 653E (Smith, 1991). Thetemporal and spatial patterns of primary productivity variability were assumed to result directlyfrom monsoonal forcing of the upper ocean (Bartolacci and Luther, 1999). The Arabian SeaProcess Study Science Plan (Smith, 1991) described the overriding hypothesis of the primaryproductivity e!ort as follows: **Does the regularity of monsoon reversals and strength of monsoonforcing create conditions in which the response of the region in terms of carbon xxation (primaryproduction) is immediate and massive and in which balances between carbon and nitrogen exchangesbetween the euphotic zone and the atmosphere and euphotic zone and depth are predictably time-varying signals of large magnitude?++ Therefore, the primary objective of this study was to test thehypothesis that monsoonal wind variability forces highly eutrophic conditions ('250mmolCm�2 d�1) during the SW Monsoon and moderately oligotrophic conditions (+60mmol Cm�2 d�1)during the remainder of the year.
In the Arabian Sea, seasonal variability in two properties } nutrients and ML depth } exceeds byseveral fold the range of variability found in other tropical regions; at the same time, the range ofvariation in two other properties that force productivity } solar radiation and sea-surface temper-ature } is similar to that found in other tropical regions (Longhurst, 1993, 1995). In most oceanicregions deep MLs are confounded by low incident solar radiation (E
�) and seasonally minimal
temperatures, so it is di$cult to assign causality to the speci"c physical process limiting photosyn-thetic productivity. In strong contrast, in the Arabian Sea deep MLs occur in combination withrelatively high sea-water temperatures and high E
�(Marra et al., 1998). This unique combination of
R.T. Barber et al. / Deep-Sea Research II 48 (2001) 1127}1172 1129

productivity forcing (high light and temperature with deep ML) creates a natural experiment on theregulation of primary productivity; therefore, the primary productivity work tested a secondhypothesis, that deep mixing, per se, limits primary productivity and photosynthetic performance inowshore regions of the Arabian Sea.
In addition to the strong seasonal variability of reversing monsoonal winds, the northernArabian Sea has a spatial wind pattern that exists in no other ocean (Smith and Bottero, 1977).During the SW Monsoon (from June to mid-September) there are, close to the Omani coast,alongshore winds that favor upwelling along the coast; seaward of the coast, winds intensify to anexceptionally strong o!shore maximum commonly called the `Findlater Jet.a (`Findlater Jeta is thename properly given to the high wind feature at 1 km altitude (Findlater, 1971), while the surfaceexpression of this unique wind feature is properly called the `Somali Jet.a Oceanographersfrequently, but incorrectly, use `Findlater Jeta to refer to the surface wind feature.) Seaward of thewind jet, decreasing southwesterly wind speeds cause negative wind-stress curl (Hastenrath andLamb, 1979; Halpern and Woiceshyn, 1999), which drives strong Ekman pumping that deepens thesurface ML considerably (Luther, 1987; Bauer et al., 1991; Brock et al., 1991; Brock and McClain,1992; McCreary et al., 1996). Fig. 1 shows the regions where these models predict dramatic MLdeepening forced by the negative wind-stress curl of the spatially constrained Findlater Jet.In observations, the jet continuously meanders northward and southward of the mean position(Fig. 1) at frequencies of a few days. This time-dependent spatial variability means that the ArabianSea region around the Findlater Jet is forced not with constant positive (or negative) curl, as in themodels, but with a positive (or negative) curl that reverses every few days. This apparent di!erencebetween model predictions and the actual Arabian Sea patterns heightened interest in looking forthe predicted Ekman-driven ML deepening and its biological consequences: light limitation andreduced photosynthetic performance (Sverdrup, 1953; Smetacek and Passow, 1990; Bartolacci andLuther, 1999).
The geographically distinct regions of upward and downward vertical velocities at the bottom ofthe Ekman layer, if present in the ocean, provide a setting for testing the connection between MLdepth and phytoplankton sinking (Smayda and Boleyn, 1965; Smayda, 1970; Smetacek, 1980). TheML depth/sinking connection is based on the hypothesis that when phytoplankton, especially largediatoms, are subjected to deep mixing, light limitation reduces photosynthetic performance tothe degree that the phytoplankton are not able to produce enough reducing power to fuel the activetransport necessary to move heavy ions out of the cell and maintain cellular buoyancy (Gross andZeuthen, 1948; Waite et al., 1992). In a region of Ekman pumping and ML deepening, phytoplan-kton would be expected to have reduced photosynthetic performance because of both light andnutrient limitation (Bauer et al., 1991; Banse and English, 2000). Thus, the primary productivitywork reported here tested a third hypothesis, that Ekman pumping, ML deepening and subsequentdecreased photosynthetic performance occur in the region south of the Findlater Jet, creating a strongspatial gradient of high productivity inshore of the jet and very low productivity owshore of it in thenegative-curl region.
The physical and chemical observations of the 1995 Arabian Sea Expedition have shown thatmonsoonal variability dominates the physical and chemical dynamics of the upper ocean. Inkeeping with the suggestion made by Dietrich (1973), this region is a good location to determinehow physical forces drive the biological response of the pelagic community. Despite documentedinterannual variation (Brock and McClain, 1992; Halpern and Woiceshyn, 1999), the SW
1130 R.T. Barber et al. / Deep-Sea Research II 48 (2001) 1127}1172

Fig. 1. Map of the study area showing the southern section of the US JGOFS cruise track (for the positionof the northern line and o!shore stations, see Smith et al., 1998). The distance from the coast to S11 was about 1000 km;the section was always run from S11 to S02. Open circles show the position of the long stations where both in situand on-deck primary productivity incubations were carried out; crosses show the position of the stations whereonly on-deck incubations were carried out. Also shown are the regions assumed to have positive and negative wind-stress curl, as delimited by Brock et al. (1991), and the 1995 observed mean position of the Findlater Jet (Smith et al.,1998).
Monsoon cycle is one of the world's most regular atmospheric phenomena (Fieux and Stommel,1977); but was 1995 a typical year in terms of wind stress and heat exchange? Monthly mean valuesindicate that 1994/1995 was typical in timing of the seasonal progression of wind stress and heatexchange (Halpern et al., 1998; Weller et al., 1998). At higher temporal resolution, however, the1995 SW Monsoon onset in 1995 was 7 } 10 days later than in the preceding and following years(Weller et al., 1998; Halpern and Woiceshyn, 2001). During July 1995, the strength of themonsoonal winds in the region of the southern section was 10% less than the 1988}1997climatology; during August, the di!erence was less than 10%; and during September, the windswere about equal to the climatological mean (Halpern and Woiceshyn, 2001). During the Marchand April 1995 Spring Intermonsoon, winds were moderate (+4.0 m s��), but this value was about40% higher than the 1911}1970 climatological Spring Intermonsoon mean (2.5 m s��) (Smith et al.,1998b).
R.T. Barber et al. / Deep-Sea Research II 48 (2001) 1127}1172 1131

The NE Monsoon period in the northern Arabian Sea in 1995 was a period of steady andmoderate winds, clear skies, low humidity and heat loss from the ocean to the atmosphere; incontrast, the SW Monsoon was a period of strong winds, more or less continuous cloud cover, highhumidity and heat gain by the ocean (Smith et al., 1998a). During the NE Monsoon evaporativecooling of the Arabian Sea both decreased the upper-layer seawater temperature and increased thesalinity; this produced dense water that was convectively mixed, resulting in deep MLs (Welleret al., 1998). The convective mixing eroded into the nutricline, bringing moderately high concentra-tions of nutrients to a large area of the o!shore region. The only portion of the study area notundergoing convective mixing during the NE Monsoon was the region adjacent to the coast ofOman (Morrison et al., 1998). During the Spring and Fall Intermonsoon periods the MLs werevery shallow, strati"cation was strong, and nutrient concentrations were low over the entire studyarea (Morrison et al., 1998).
During the SW Monsoon there was evidence of strong upwelling with cool, lower salinity,nutrient-rich water in the inshore region adjacent to Oman (Lee et al., 2000; Shi et al., 2000). Theinshore coastal upwelling region was similar in both hydrography and nutrients to the four othermajor coastal upwelling regions (Barber and Smith, 1981). As in other coastal upwelling regions,temperature increased and nutrients decreased along the US JGOFS southern section from inshoreto o!shore. However, the spatial domain over which nutrients were enriched was much larger inthe Arabian Sea. In the Peru coastal upwelling, high nutrient water reaches o!shore 100 km or less,while o! California and Northwest Africa the o!shore extent of upwelled water is 200 km or less(Barber and Smith, 1981). In contrast, the o!shore extent of high-nutrient water during the SWMonsoon was 500}700 km (Morrison et al., 1998). As is common in coastal upwelling systems, theArabian Sea during the SW Monsoon was also characterized by strong, narrow jet-like currentsthat ran in a generally o!shore direction from the zone of coastal upwelling to about 700 kmo!shore (Brink et al., 1996). In addition, there were numerous well-de"ned mesoscale eddies thatgenerated considerable variability in hydrographic properties (Flagg and Kim, 1998; Lee et al.,2000). Filaments and eddies dominated the velocity "eld in this region during the SW Monsoon.There was surprisingly little organized o!shore #ow despite evidence of strong onshore/o!shoregradients in hydrographic properties. Mean #ow in the region of the US JGOFS southern sectionwas to the southwest except for the coastal upwelling zone within 150 km of the coast where the#ow was to the northeast (Flagg and Kim, 1998).
The Arabian Sea Expedition combined six process cruises throughout the annual cycle, a "xedstation grid, interdisciplinary research teams, moorings and satellite coverage. Rarely has such anintense e!ort been focused on a single oceanic region. An overview of the program and papersdescribing its "ndings are given in Deep-Sea Research II Vol. 45, No. 10}11 (1998); Vol. 46, No. 8}9(1999); and Vol. 47, No. 7}8 (2000): all three edited by S. L. Smith (Smith, 1998, 1999, 2000).
2. Methods
2.1. Research plan
This paper presents observations from the six Arabian Sea Expedition process cruises (Table 1).While the expedition occupied two sections that extended o!shore about 1000 km, a collection of
1132 R.T. Barber et al. / Deep-Sea Research II 48 (2001) 1127}1172

Table 1US JGOFS 1995 Arabian Sea Expedition cruises and the individuals who carried out the primary productivityobservations
Cruise No. Cruise name Season Cruise duration Date at S07 Prim. prod.team
TN043 P1 NE Monsoon (Jan) 08 Jan}05 Feb 23}24 Jan John MarraCarol KnudsonSteve Lindley
TN045 P2 Spring Intermonsoon 07 Mar}04 Apr 30}31 Mar John MarraCarol KnudsonMike Hiscock
TN049 P4 SW Monsoon (mid) 17 Jul}15 Aug 03}04 Aug Richard BarberCarol KnudsonElaine Barber
TN050 P5 SW Monsoon (late) 18 Aug}15 Sep 04}05 Sep Richard BarberFei ChaiElaine Barber
TN053 P6 Fall Intermonsoon 29 Oct}26 Nov 15 Nov John MarraZackary Johnson
TN054 P7 NE Monsoon (Dec) 30 Nov}29 Dec 17}18 Dec Carol KnudsonZackary Johnson
nine o!shore stations and a few inshore stations on the Omani shelf, the in situ primaryproductivity stations were concentrated on the southern section of the US JGOFS cruise track(Fig. 1). Therefore, this paper is limited to results from stations along the 1000-km southern section(Stations S02}S11), from the coast of Oman to the center of the Arabian Sea at 653E. This southernsection crosses the western half of the Arabian Sea where the SW and NE Monsoons drivedramatic seasonal variability. In this portion of the Arabian Sea (Fig. 1), the US JGOFS cruisescarried out dense seasonal sampling of primary productivity (Table 2) and related atmospheric,physical, chemical and biological properties. O!shore stations along 653E from 203N}103N are notincluded in this analysis because of their location in a permanently oligotrophic region (Longhurst,1993, 1995, 1998; Smith et al., 1998a). The inshore station S01 was not included in this paperbecause in situ primary productivity observations were made there infrequently.
The six process cruises were scheduled throughout 1995 to resolve seasonal patterns. The 1995SW Monsoon was sampled by two consecutive cruises (TN049 and TN050). The NE Monsoon wassampled in two separate winters: TN043 took place during the 1994/1995 NE Monsoon in January1995; TN054 was carried out during the 1995/1996 NE Monsoon in December of 1995. Theresearch plan placed 10 stations along the 1000-km section to resolve onshore/o!shore gradients.The inshore end of the section (Station S02) was 150 km o! the coast of Oman; the o!shore end(Station S11) was in the central Arabian Sea. The stations occupied were of three di!erentdurations}short, intermediate and long (Smith et al., 1998a). The long stations were 2.5}3 days induration. At long stations (S02, S04, S07 and S11 in Fig. 1), both in situ and on-deck (simulated insitu) primary productivity incubations were carried out; at short and intermediate stations (Fig. 1)only on-deck incubations were carried out. The on-deck primary productivity incubations were`ground-trutheda with in situ results (Fig. 2) as described in Barber et al. (1997). At stations where
R.T. Barber et al. / Deep-Sea Research II 48 (2001) 1127}1172 1133

Table 2In situ (boldface) and on-deck (regular font) integrated primary productivity, surface chlorophyll and speci"c productiv-ity (P�
�) at each station on the southern transect from S02 to S11. P�
�is the highest water column productivity in a 24-h
on-deck incubation normalized by chlorophyll concentration at the depth of the highest water column productivity.Bracketed values at S10 are interpolated from neighboring stations of P5 (Late SW Monsoon). Values in parentheses arestandard errors of the annual mean calculated from the seasonal means
Station NE Monsoon Intermonsoon SW Monsoon NE MonsoonJan spring
Mid Late Dec Mean$SE
Primary Productivity (mmol C m�� d��)S02 121 71 81 92 76 88$9S03 150 87 135 93 87 111$13S04 85 101 118 72 78 91$8S05 201 65 99 99 83 109$24S06 123 105 132 119 121 120$4S07 100 80 134 147 85 109$13S08 145 79 183 181 89 135$22S09 202 92 158 70 79 120$26S10 154 112 184 [99] 90 128$18S11 84 71 129 127 96 101$12Mean$SE 137$13 86$5 135$10 110$11 88$4 111$11 (5)
Surface Chlorophyll a (mg m��)S02 0.78 0.16 0.35 0.56 0.51 0.47$0.10S03 1.06 0.17 0.56 0.47 0.41 0.54$0.15S04 0.29 0.23 0.39 0.57 0.47 0.39$0.06S05 0.28 0.13 0.44 0.84 0.68 0.47$0.13S06 0.40 0.20 0.74 0.61 0.49 0.49$0.09S07 0.38 0.19 0.44 0.51 0.43 0.39$0.05S08 0.39 0.09 0.65 1.31 0.47 0.58$0.20S09 0.44 0.13 0.6 0.47 0.33 0.39$0.08S10 0.5 0.09 1.08 [0.47] 0.35 0.50$0.16S11 0.28 0.08 0.52 0.48 0.36 0.34$0.08Mean$SE 0.48$0.08 0.15$0.02 0.58$0.07 0.63$0.08 0.45$0.03 0.46$0.08 (0.02)
Speci"c Productivity (P��
) (mmol C mg Chl�� d��)S02 8.24 7.49 12.20 7.75 5.78 8.29$1.06S03 10.54 9.58 14.10 7.00 6.29 9.50$1.39S04 9.58 10.80 11.55 15.57 6.45 10.79$1.48S05 8.23 6.32 10.70 7.41 8.11 8.15$0.72S06 17.79 6.14 10.01 7.37 6.14 9.49$2.19S07 9.05 10.13 10.47 16.39 11.44 11.50$1.28S08 10.58 12.40 15.13 14.72 9.37 12.44$1.13S09 16.32 11.56 15.28 8.34 10.20 12.34$1.51S10 9.76 20.81 14.68 [12.76] 12.16 14.03$1.87S11 8.65 10.06 7.89 17.18 7.54 10.26$1.78Mean$SE 10.87$1.07 10.53$1.32 12.20$0.79 11.45$1.34 8.35$.73 10.68$0.65 (0.60)
1134 R.T. Barber et al. / Deep-Sea Research II 48 (2001) 1127}1172

Fig. 2. P�
, the highest water column productivity in 24-h in situ (is) and 24-h on-deck (od) incubations, versus distanceo!shore on the southern section from S02 to S11 during three seasons.
both on-deck and in situ observations were made, results agree well (Fig. 3). On "ve of the cruises(TN043, TN045, TN049, TN050 and TN054) (Table 1) the same long, in situ stations and the sameshort and intermediate stations were occupied, with two exceptions: at Station S11 of TN050strong wind prevented deployment of the in situ incubation array, so only on-deck incubationswere carried out; at Station S10 of TN050 high winds prevented all over-the-side work. Primaryproductivity and chlorophyll a values for S10, therefore, were interpolated from the neighboringstations, S09 and S11.
R.T. Barber et al. / Deep-Sea Research II 48 (2001) 1127}1172 1135

Fig. 3. A scatter plot of P�
, the highest water column productivity in a 24-h incubation, showing in situ (is) versuson-deck (od) incubations, for six process cruises at the four long stations (S02, S04, S07 and S11) where both incubationswere carried out.
The Fall Intermonsoon cruise (TN053) had a di!erent scienti"c objective from the other "veprocess cruises, so it followed an opportunistic cruise track and did not always sample the standardstation locations (Smith et al., 1998a). The four standard locations on the southern section thatwere sampled on the Fall Intermonsoon cruise are included in the "gures; however, becausesampling of the southern section was so sparse, the Fall Intermonsoon values are not included incalculations of annual means.
2.2. Physical and chemical observations
Continuous wind, air and subsurface temperature, and upper-ocean current measurements weremade at a surface buoy moored at 15.53N, 61.53E (Weller et al., 1998). To obtain three-dimensionalresolution of the physical "elds in the vicinity of the US JGOFS southern section, a SeaSoartowed-array was employed on cruises carried out by the US O$ce of Naval Research (ONR)Forced Upper Ocean Dynamics project (Smith et al., 1998a; Lee et al., 2000).
Vertical pro"les of nutrients, salinity and temperature were recorded at each station (Morrisonet al., 1998; Gardener et al., 1999) using a dual sensor (temperature and salinity) Seabird CTDsystem equipped with a SeaBird carousel water sampler. Nutrient analyses were done as prescribedin the JGOFS Protocols (SCOR, 1996), which are available at http://www1.whoi.edu/jgofs.html.Since new nutrients (Dugdale and Goering, 1967) } nitrate, phosphate and silicic acid } usuallycovaried in this study, nitrate is used to represent all of the new nutrients. The only exception to this
1136 R.T. Barber et al. / Deep-Sea Research II 48 (2001) 1127}1172

rule occurred in the current "lament at Station S08 during the late SW Monsoon. Minorprocedural di!erences in the nutrient analyses are noted in the `Readmea "les attached to the USJGOFS nutrient data "les. Analysis of ammonium concentration was done with the Berthelotreaction using a slight modi"cation of the method described by Whitledge et al. (1981).
In this analysis, ML depth was de"ned as the depth at which subsurface ��
di!ered from surface��
by 0.013. The conductivity, temperature and depth (CTD) casts used to calculate ML depth weretaken at the same time as sampling for primary productivity determinations (between 2300 and0200). The equations of Stommel (1965) were used to calculate vertical velocity at the base of theEkman layer (W
�) from observations of wind-stress curl. Scatterometer measurements recorded
by the "rst European Remote-Sensing Satellite (ERS}1) were used to estimate wind-stress curl at13�13 intervals throughout the Arabian Sea (Halpern et al., 1998). The W
�calculation used
wind-stress curl averaged over 2}3 inertial periods.
2.3. Chlorophyll a and other pigments
Chlorophyll a was determined both #uorometrically and by high-performance liquidchromatography (HPLC) at all stations and all depths of each of the process cruises. Usinga Turner Designs Model 10}AU #uorometer, fresh samples were extracted in 90% acetone at!203C for 24}30 h (Venrick and Hayward, 1984). Other than this modi"cation of extractionprocedure, the method used was the conventional #uorometric procedure of Holm-Hansen et al.(1965) and Lorenzen (1966). Plant pigments, including chlorophyll a, for TN043, TN049 andTN054 were analyzed by HPLC following the procedures described in Goericke and Repeta (1993);for TN045, TN050 and TN053, procedures are described in Latasa and Bidigare (1998). Intercalib-rations show that these two HPLC procedures gave equivalent results.
As shown in Fig. 4, #uorometric and HPLC determinations of chlorophyll a usually agreed wellduring the Arabian Sea cruises, but they disagreed during the SW Monsoon period whensigni"cant quantities of non-photosynthetic chlorophyll were present. The #uorometrically deter-mined chlorophyll a concentrations at Stations S05 to S11 on the late SW Monsoon cruise (TN050)overestimated photosynthetically active chlorophyll a (Sathyendranath et al., 1999). This overes-timation resulted from the inability of the #uorometric method to distinguish between chlorophylla (monovinyl and divinyl chlorophyll a) and chlorophyllide a (dephytolated monovinyl chlorophylla, which is a monovinyl chlorophyll a degradation product). Chlorophyllide a is present insenescent diatoms because of the elevated chlorophyllase activity present in these photoautotrophs(Je!rey, 1974; Trees et al., 1985). The presence of senescent diatoms in the gelatinous matrix ofco-occurring Phaeocystis colonies at these stations was con"rmed by microscopic observations(Garrison et al., 1998). In this report, therefore, chlorophyll a concentrations determined by HPLCwere used for Stations S05 to S11 for the late SW Monsoon period.
Surface chlorophyll a (+ML chlorophyll a) rather than integrated euphotic zone chlorophylla is used as a diagnostic property in this analysis for several reasons. First, the integrated euphoticzone chlorophyll a concentration does not re#ect the concentration of active pigments when a deepchlorophyll maximum is present at the base of the euphotic zone where only a small percentof the total primary productivity takes place. Second, chlorophyll a concentration per unitvolume is a diagnostic that is interpretable per se; for example, a chlorophyll a concentration of1.5 mg m�� conveys information, while an integrated value of 15 mg m�� can be a high or low
R.T. Barber et al. / Deep-Sea Research II 48 (2001) 1127}1172 1137

Fig. 4. Chlorophyll a concentration by the #uorometric method (Holm-Hansen et al., 1965; Lorenzen, 1966) versus theHPLC method (Goericke and Repeta, 1993) on the TN043 cruise, with the mean and standard error for all stations.
concentration depending on the depth of the euphotic zone. Finally, the surface chlorophylla concentration is the property measured by satellite, and in the Arabian Sea most of theknowledge of seasonal and temporal patterns of phytoplankton abundance is based on satelliteobservations (Banse and English, 1994 and 2000).
2.4. Primary productivity
Odum (1971) de"nes primary productivity as `the rate at which energy is stored by the photosyn-thetic and chemosynthetic activity of producer organisms in the form of organic substances whichcan be used as food materials.a This de"nition is conceptually powerful, but as an operationalde"nition it is #awed because it is di$cult to measure in assemblages of natural plankton,particularly with tracer methods. A property that can be determined rapidly with considerableprecision using �C uptake is net daily community particulate primary productivity (Richardson,1991; Williams, 1993a, b). Disadvantages of this property (as determined by �C uptake) are that itis only one component of photosynthetic production because it does not measure dissolved organicproductivity (Williams, 1995; Hansell and Carlson, 1998) and it refers not to a single autotrophicprocess of phytoplankton, but to the net sum of a variety of autotrophic and heterotrophicprocesses carried out by a community of phytoplankton, bacteria and protozoans (Williams, 1981;Bender et al., 1987; Williams and Lefevre, 1996; Bender et al., 1999; Robinson and Williams, 1999;Laws et al., 2000; Dickson et al., 2001). Advantages of using net daily community particulate primaryproductivity (as determined by �C uptake) are that it has a widely accepted operational de"nition(Peterson, 1980; Williams, 1993b); it has a strong and causal correlation to a variety of biological,
1138 R.T. Barber et al. / Deep-Sea Research II 48 (2001) 1127}1172

chemical and geochemical processes of interest to oceanographers and geoscientists outside thesubdiscipline of phytoplankton physiology (Suess, 1980; Pace et al., 1987; Iverson, 1990; Wassman,1990; Bertrand and Lallier-Verges, 1993); and it covaries with the process captured in the Odum(1971) de"nition (Laws, 1991; Laws et al., 2000). In a symposium volume that discusses the issue ofmeasured properties versus conceptual de"nitions of primary productivity, Li and Maestrini (1993)recommended using the term primary productivity to denote that property which is measured by the�C uptake method; for the remainder of this report we use primary productivity as they recommen-ded.
Methods for determining daily in situ primary productivity have converged considerably in USJGOFS and other recent work. The in situ procedure used in the US JGOFS Arabian SeaExpedition is similar to those used by Karl et al. (1990) in the Hawaiian Ocean Time Series (HOT),Lohrenz et al. (1992) and Malone et al. (1993) in the Bermuda Time Series (BATS), Chipman et al.(1993) and Martin et al. (1994) in the North Atlantic Bloom Experiment (NABE), Welschmeyeret al. (1993) in the Subarctic Paci"c Ecosystem Research (SUPER) project, Barber et al. (1996) inthe Equatorial Paci"c Study (EqPac) and Smith et al. (in press) in the Antarctic Environment andSouthern Ocean Process Study (AESOPS).
In the Arabian Sea Expedition, a Moss Landing Marine Laboratories trace-metal clean (TMC)rosette with General Oceanics Go-Flo�� sample bottles and a Kevlar cable (Sanderson et al., 1995;Hunter et al., 1996) was used for water collection on all six process cruises with the exception of thesecond half of the July/August mid-SW Monsoon cruise (TN049). Due to the loss of the TMCrosette midway through the TN049 cruise, an epoxy-coated rosette was used for the remainder ofthe cruise; a replacement TMC rosette was obtained for the remaining cruises. Samples for in situand on-deck primary productivity determinations were collected between 0200 and 0300 hr fromlight depths corresponding to 93, 75, 55, 27, 15, 7, 4, 1 and 0.1% of the incident irradiance, E
�, as
determined by a submarine quantum sensor (Biospherical Instruments, Inc., Model QSP-200) onthe hydrographic cast made during the preceding afternoon at the same location (Morrison et al.,1998). For each depth sampled, six 280-ml polystyrene tissue culture #asks were "lled andinoculated; four of the #asks were incubated in situ two on deck.
For in situ incubation, #asks were mounted on clear Plexiglas�� racks and, using conventionalhydrowire clamps, each rack was attached to the array line at a position corresponding to theintended depth of incubation. The in situ primary production incubation array was launchedbefore dawn so that the inoculated samples were exposed to a full, uninterrupted daily light period.After dark the array was picked up, the 12-h samples were immediately "ltered and the remaining(24-h) samples were placed in on-deck incubators to complete their incubation through the darkperiod. The temperature regime of the on-deck incubators, cooled by surface sea water, wasapproximately the same as the in situ temperature pro"le because the MLs were relatively deep andbelow the ML the temperature gradient was relatively weak. During the daylight period the in situincubation array was suspended from two #oats, each with 30 kg of buoyancy, at the top of the100-m array line, while a 25-kg weight at the bottom kept the line vertical in the water. A 20-m tagline connected the array line to a spar buoy equipped with a radar re#ector, a #ag, a xenon #asherand a VHF radio transmitter. During recovery of the array, once the tag line was caught withgrapnel hooks, getting the array on deck took less than 30 min. The Plexiglas�� racks wereunclamped as the array line was retrieved through the main stern A-frame. A complete descriptionof the in situ procedure is given in Barber et al. (1996).
R.T. Barber et al. / Deep-Sea Research II 48 (2001) 1127}1172 1139
On-deck incubations were carried out in seawater-cooled, 40 cm�20 cm�30 cm Plexiglas��incubator boxes. Light in the incubators was attenuated to 93, 75, 55, 27, 15, 7, 4, 1 or 0.1% E
�by
means of neutral density screening and blue Plexiglas��. Water for samples incubated in both the93 and the 75% light level incubators was taken from the shallowest collection bottle.Autonomous recording thermometers monitored temperature in the incubators and incu-bator irradiance levels were checked weekly. Productivity values used in this paper are integratedto the 1% light depth, but both 1 and 0.1% light depth integration values are provided in the USJGOFS Data Management System. Integrations to the 0.1% light depth were onaverage only 3.5% higher than those integrated to the 1% light depth; more signi"cantly, theportion of the photosynthetic pro"le from the 1% light depth to the 0.1% light depth showsvery little spatial or temporal variation. Because this analysis focused on the factors forcingchanges in primary productivity, the 1% integrations were analyzed. See Barber et al. (1997) fora description of the method used to estimate depths used in integration of carbon "xation inon-deck incubations.
Anhydrous crystalline sodium carbonate labeled with �C was added to a solution of 0.3 g ofsodium carbonate in 1.0 l of Nanopure� water. The sodium �carbonate, obtained from NewEngland Nuclear, had a speci"c activity of 55 mCi mmol��; the designation of this compound isNEC-088 H. Stock isotope solution was made up at 1-week intervals and stored at 43C but allowedto come to ambient temperature before inoculation of the samples. The intended activity of the�C solution was 100 �Ci ml��; however, total added activity was determined for each pro"le, sovariations in added activity were adjusted in the calculation. Inoculation of 100 �l of �C solutionwas done with an Eppendorf disposable tip pipette. In addition to the two replicate samplesincubated with �C solution, a third bottle was "lled, inoculated with �C solution and immediate-ly "ltered to determine a time zero particulate �C blank as described by Huntsman and Barber(1977).
To determine the total added activity (DPM��
), upon retrieval of incubation bottles a 1-mlsubsample was taken from selected depths and added directly to scintillation vials containing0.1 ml of beta-phenylethylamine (Iverson et al., 1976) and 1 ml of scintillation #uid. The sampleswere "ltered through 25-mm Whatman GF/F "lters with a 200-mmHg vacuum. The "lters weresucked dry and placed #at in the bottom of a 20-ml scintillation vial, 0.5 ml of 0.5 N HCl was added,and the wetted "lters were placed under a hood. After 24 h, a 1-ml volume of scintillation #uid wasadded and the "lters were placed in the dark for a second 24-h period. The time zero particulateblanks, 24-h in situ samples and 1-ml subsamples for total activity were counted on the shipboardliquid scintillation counter. Counting e$ciency for "lters and total activity was determined by aninternal �C toluene standard. Particulate carbon productivity for each in situ depth was calculatedas follows:
PP"(DPM�
!DPM�)(1.05)(2000 mmol Cm��)(DPM
��) time)��,
where DPM�
"CPM�
) e$ciency of "lter counting��; CPM�
"counts collected on a GF/F"lter after 24-h in situ incubation; DPM
�"CPM
�) e$ciency of "lter counting��; CPM
�"
counts collected on a GF/F "lter when sample was "ltered immediately after the addition of�C carbonate solution; DPM
��"(CPM
� �) e$ciency of counting totals��) ) bottle volume in ml;
CPM� �"counts in 1 ml of sample; 1.05"factor for preferential uptake of ��C over �C;2000"molarity in mmol m� of inorganic carbon in seawater.
1140 R.T. Barber et al. / Deep-Sea Research II 48 (2001) 1127}1172
Carbon-uptake rate per unit area for the water column down to the 1 and 0.1% light levels wascalculated using a trapezoidal integration.
2.5. Photosynthetic performance
To characterize biomass-normalized photosynthetic performance this paper uses P��
, thehighest chlorophyll-normalized productivity value in a 24-h in situ or on-deck incubation. P�
�is
operationally distinct from P� ��
, which is the maximal, chlorophyll-normalized, productivity valuein a short (about 1-h) light-saturated, but not inhibited, incubation (Behrenfeld and Falkowski,1997). Unlike P�
��, P�
�may be light-limited, light-saturated or light-inhibited, depending on the in
situ light "eld during the 24-h period when the estimate was made. P��
is, more or less, anecological property of the water column and its phytoplankton community, while P�
��is an
inherent physiological property of the ambient phytoplankton.Primary productivity data for the Arabian Sea Expedition are available from the US JGOFS
Data Management System at the US JGOFS Home Page http://www1.whoi.edu/jgofs.html.
3. Results
3.1. Wind stress and Ekman upwelling
Wind stress was highest during the SW Monsoon with values '0.2 N m�� o!shore at StationsS07}S11. At the extreme o!shore station, S11 (1000 km o!shore), despite very high o!shore windstress and relatively deep mixing, the mixing was not deep enough to replace ML nutrients takenup by biological activity (Figs. 5 and 6). Both wind stress and ML depth were maximal at StationS11, but nitrate was reduced to the detection level.
The annual pattern of upwelling and downwelling at the bottom of the Ekman layer wascalculated from the ERS-1 scatterometer wind "elds (Halpern et al., 1998) for the four long in situstations along the southern section (Fig. 7). The inshore station, S02 (147 km from the Omanicoast), had signi"cant Ekman upwelling ('0.25 m d��) during June, July and August in 1995.Farther o!shore at Station S04, 359 km from the coast, there was no signi"cant Ekman upwellingduring the 1995 period of strong SW Monsoon winds, although temperature observations (Fig. 5)and nitrate concentrations (Fig. 6) indicate that the water at Station S04 had been recentlyupwelled or mixed from below. During the April/May 1995 period, just before onset of the SWMonsoon, there was Ekman downwelling across the southern section from Stations S02 to S07(Fig. 7). At Station S07, 630 km o! the coast, there was a downwelling pulse in May (early SWMonsoon) and a strong o!shore upwelling pulse in July (mid-SW Monsoon). The Ekmanupwelling estimates for June and July indicate that upwelling at Station S07 was spatiallydiscontinuous from S02 upwelling; that is, signi"cant Ekman upwelling was present at Station S07but not at Station S04 (Fig. 7). An o!shore source of ML nutrients that was discontinuous from thecoastal source was further indicated by a second o!shore peak in nitrate (Fig. 6) and other nutrients(Morrison et al., 1998). Station S07 was seaward of the mean axis of the Findlater Jet in 1995(Fig. 1), but the time series of ML depth, Ekman upwelling and nitrate concentration (Fig. 8) showno evidence of the putative downwelling (Luther, 1987; Bauer et al., 1991; Bartolacci and Luther,
R.T. Barber et al. / Deep-Sea Research II 48 (2001) 1127}1172 1141

Fig. 5. Surface temperature, mixed-layer (ML) depth and wind stress versus distance o!shore at the four longstations (S02, S04, S07 and S11) for three seasons. Mixed layer depth is de"ned as the depth at which subsurface��
di!ered from surface ��
by 0.013. The meteorological mooring (Weller et al., 1998) was recovered in October 1995, sothere are no wind stress estimates for the Fall Intermonsoon (TN053) or the December NE Monsoon (TN054). The S07station values for the Fall Intermonsoon cruise (TN053) are means of adjacent stations because the S07 location per sewas not occupied.
1999). Satellite temperature and acoustic Doppler current pro"les (ADCP) show that the S07region was the site of well-de"ned eddy and "lament activity during the SW Monsoon (Flagg andKim, 1998; Manghnani et al., 1998; Lee et al., 2000).
1142 R.T. Barber et al. / Deep-Sea Research II 48 (2001) 1127}1172

Fig. 6. Surface nitrate, primary productivity and surface chlorophyll a versus distance o!shore at the four in situ stations(S02 to S11) for three seasons. The S07 station values for the Fall Intermonsoon cruise (TN053) are means of adjacentstations because S07 location per se was not occupied.
3.2. Physical response
Sections of temperature, ML depth, wind stress and surface nitrate (Figs. 5 and 6) showwell-de"ned onshore/o!shore gradients and seasonal di!erences. During the two intermonsoonseasons and the December 1995 NE Monsoon, surface temperatures of about 263C inshoreincreased steadily o!shore over the 1000-km section to '283C at the o!shore location (StationS11). The January 1995 NE Monsoon had a similar gradient, but with an inshore value of 24.53C
R.T. Barber et al. / Deep-Sea Research II 48 (2001) 1127}1172 1143

Fig. 7. The annual cycle of monthly mean Ekman upwelling and downwelling (W�
) at the four in situ stations (S02}S11).(From Halpern et al., 1998).
and an o!shore value of 26.03C. During the SW Monsoon, values were 22.0}23.03C inshore and'273C o!shore.
During the Spring Intermonsoon, ML, de"ned as the depth at which subsurface ��
di!ered fromsurface �
�by 0.013, was very shallow ((20 m) with no o!shore gradient (Fig. 5). In each of the
other periods there was an onshore/o!shore gradient with ML depths of 12}34 m close to the coastand deepening o!shore; the deepest MLs for each period were found about 1000 km o!shore atStation S11. The o!shore ML depth was 94 m during the January NE Monsoon and 82 m duringthe December NE Monsoon when winds were moderate in strength (+4 m s��), but only 50 and72 m during the mid- and late SW Monsoon when winds were much stronger (+12 m s��) (Welleret al., 1998).
Low wind stress and increased seasonal heating during the Spring Intermonsoon produced theshallow ML depths during that period. During the January NE Monsoon, wind stress was higher
1144 R.T. Barber et al. / Deep-Sea Research II 48 (2001) 1127}1172

Fig. 8. Mixed-layer (ML) depth, Ekman upwelling and downwelling (W�
), surface nitrate, integrated primary productiv-ity and dissolved inorganic iron (Fe) observed when the "ve cruises were at S07. The station values for the FallIntermonsoon cruise (early November, TN053) are means of adjacent stations because the S07 location per se was notoccupied. The half saturation concentrations for nitrate (McCarthy et al., 1999) and iron (Coale et al., 1996a) are shownon their respective graphs by a dashed line. (W
�from Halpern et al., 1998; Fe data from Measures and Vink, 1999).
than during the Spring Intermonsoon, but still relatively moderate at 0.04}0.08 N m�� (Fig. 5). Thedeep January NE Monsoon MLs were accompanied by considerable seasonal cooling (Fig. 5) ofthe high-salinity o!shore waters (Morrison et al., 1998).
3.3. Primary productivity and chlorophyll a along the southern section
Integrated primary productivity and surface chlorophyll a as functions of distance o!shoreduring each cruise and each season are shown in Figs. 9 and 10. In contrast to temperature, MLdepth, wind stress or nutrient concentration patterns, there is no consistent onshore/o!shoregradient in either productivity or surface chlorophyll a during the SW Monsoon. Productivity andchlorophyll a patterns during the SW and NE Monsoons were characterized by a series of more or
R.T. Barber et al. / Deep-Sea Research II 48 (2001) 1127}1172 1145

Fig. 9. Primary productivity, integrated to the 1% light depth, along the southern section from S02 to S11. The FallIntermonsoon productivity (TN053, Table 1) is shown but not included in the mean in the bottom panel because onlya few stations were occupied on the southern section during that cruise.
less isolated maxima (Figs. 9 and 10) along the 1000-km section, with the productivity maximabeing almost three times the minima (202 versus 70 mmol C m�� d��) (Table 3). During the highlyproductive January NE Monsoon and both SW Monsoon cruises, the highest primary productiv-ity values were at stations on the o!shore portion of the southern section (S08, S09 and S10), whilethe lowest productivity values on these three cruises were spread along the entire section (S02, S09and S11) (Table 3).
Spring and Fall Intermonsoon periods had the lowest productivity and biomass (Figs. 9 and 10),but the mean Intermonsoon productivity values of 86 and 80 mmol C m�� d�� for Spring and Fall,respectively, were surprisingly high (Fig. 9). In contrast, the mean Spring Intermonsoon surfacechlorophyll a value of 0.15 mg Chl m�� was typical of oligotrophic oceanic regions. During theSpring and Fall Intermonsoons there was no onshore/o!shore gradient in productivity or chloro-phyll a from S02 to S11 (Figs. 9 and 10, Table 2).
1146 R.T. Barber et al. / Deep-Sea Research II 48 (2001) 1127}1172

Fig. 10. Surface chlorophyll a along the southern section from S02 to S11. The Fall Intermonsoon chlorophyll (TN053,Table 1) is shown but not included in the mean in the bottom panel because only a few stations were occupied on thesouthern section during that cruise.
The January 1995 NE Monsoon period was more productive than the December 1995 NEMonsoon period (137 versus 88 mmol C m�� d��) (Table 2) and productivity maxima in January1995 were midway along the section at about 450 km and 800 km o!shore (Fig. 9). In contrast,mean surface chlorophyll a concentrations during the two NE Monsoon periods were similar (0.48versus 0.45 mg Chl a m��) (Fig. 10, Table 2). The highest surface chlorophyll a value (1.06 mg Chla m��) during the January period was about 250 km o!shore; as in all other seasons, there was noonshore/o!shore gradient in productivity or chlorophyll a. The January 1995 NE Monsoon periodhad clear primary productivity maxima but no spatial gradient, while the December 1995 NEMonsoon had no clear maximum nor gradient. Minimal productivity values of about 85 mmolC m�� d�� were the same in the two NE Monsoon periods and were essentially the same as themean Intermonsoon productivity (80}86 mmol C m�� d��) (Fig. 9).
R.T. Barber et al. / Deep-Sea Research II 48 (2001) 1127}1172 1147

Table 3Maximum and minimum integrated primary productivity (mmol C m��d��), surface chlorophyll a (mg Chl m}�) andP��
(mmol C mg Chl}�d��) values and, in parentheses, their location on the US-JGOFS southern section. P��
is thehighest water column productivity in a 24-h on-deck incubation normalized by chlorophyll concentration at the depth ofthe highest water column productivity
NE Monsoon Intermonsoon SW Monsoon NE Monsoon Mean#SEJan spring Dec
Mid Late
Maximum valuesPP 202 (S09) 112 (S10) 184 (S10) 181 (S08) 121 (S06) 160$18Chl a (surf.) 1.06 (S03) 0.23 (S04) 1.08 (S10) 1.31 (S08) 0.68 (S05) 0.87$0.19P��
17.79 (S06) 20.81 (S10) 15.28 (S09) 17.18 (S11) 12.16 (S10) 16.64$1.43
Minimum valuesPP 84 (S11) 65 (S05) 81 (S02) 70 (S09) 76 (S02) 75$3Chl a (surf.) 0.28 (S11) 0.08 (S11) 0.35 (S02) 0.47 (S03/S09) 0.33 (S09) 0.30$0.06P��
8.23 (S05) 6.14 (S06) 7.89 (S11) 7.00 (S03) 5.78 (S02) 7.01$0.48
The SW Monsoon period was the most productive and had the highest values of surfacechlorophyll a. Interestingly, two of the three highest productivity values of the SW Monsoonoccurred at the same location (S08), about 700 km o!shore in the region of assumed negativecurl and Ekman downwelling (Table 2). These two productivity measurements were also verysimilar (183 versus 181 mmol C m�� d��). Surface chlorophyll a had a maximum of 1.08 mgChl a m�� during the mid-SW Monsoon at Station S10, about 900 km from the coast, and 1.31 mgChl a m�� during late SW Monsoon at Station S08 (Fig. 10).
3.4. Seasonal variability in in situ station proxles
When pro"les of biological properties are plotted for each of the "ve cruises that occupied thefour long in situ stations along the southern section, a consistent pattern of seasonal variabilityemerges (Fig. 11).
At the inshore station, S02, productivity was highest during the January NE Monsoon; itdecreased to one-"fth the January value during the Spring Intermonsoon. Productivity values atS02 during the two SW Monsoon cruises (mid and late) were very similar, about one-third theJanuary NE Monsoon value. The December NE Monsoon had a productivity level intermediatebetween the SW Monsoon values and the relatively low Spring Intermonsoon productivity.Surface chlorophyll a had a ranking more or less parallel with that of productivity; that is, NEMonsoon chlorophyll a was highest and Spring Intermonsoon was lowest with a "ve-fold range;the other seasons fell between these two extremes. Chlorophyll a, unlike productivity, hada well-developed subsurface maximum in every season except the mid-SW Monsoon.
At Station S04, 359 km o! the coast (Fig. 11), productivity was relatively low during the JanuaryNE Monsoon, but, as at Station S02, productivity in the upper three-fourths of the euphotic zonewas lowest during the Spring Intermonsoon when Station S04 had the `typical tropical pro"lea(Longhurst, 1998) of a well-strati"ed, oligotrophic oceanic region. Highest productivity values at
1148 R.T. Barber et al. / Deep-Sea Research II 48 (2001) 1127}1172

Fig. 11. Vertical pro"les of chlorophyll a, primary productivity and chlorophyll-speci"c productivity (P�) at S02, S04,S07 and S11 for "ve periods. P� is the primary productivity at a given depth in the water column normalized bychlorophyll a concentration at that depth.
Station S04 occurred during the mid-SW Monsoon and the December NE Monsoon, with the nexthighest during the late SW Monsoon. The annual range of surface productivity at Station S04 wasabout one-third or one-half the range at Stations S02, S07 and S11.
At S07, 630 km o!shore, productivity values (Fig. 11) had well-de"ned seasonal di!erences and"t the expected seasonal pattern. Late SW Monsoon was highest, followed in descending order bymid-SW Monsoon, January NE Monsoon, December NE Monsoon and Spring Intermonsoon,
R.T. Barber et al. / Deep-Sea Research II 48 (2001) 1127}1172 1149

which was the lowest, about one-fourth the late SW Monsoon level. The annual range of variabilityin surface chlorophyll a was extremely small, with all seasons except Spring Intermonsoon havingbetween 0.35 and 0.55 mg m��. Spring Intermonsoon chlorophyll a values were lowest, but, as atStation S04, there was a subsurface maximum at about 35 m.
At Station S11, about 1000 km o!shore (Fig. 11), the seasonal pattern was similar to that ofStation S07, with highest productivity during the late SW Monsoon and lowest during the SpringIntermonsoon. Variation in productivity at Station S11 was large, with a ten-fold di!erencebetween the highest values (late SW Monsoon) and the lowest (Spring Intermonsoon). Further-more, the seasonal maximum and minimum were higher and lower than at any other in situ station.During 1995 Station S11, about 1000 km o!shore, was more variable in terms of productivity thanany other in situ station on the southern section.
During the seasonal cycle, observations of biomass-normalized photosynthetic performance(P�
�) cluster between 8 and 12 mmol C mg Chl a�� d�� (Fig. 11). The lowest P�
�values in 1995
were during the December NE Monsoon at Stations S02, S07 and S11, with the annual minimumvalue (6 mmol C mg Chl a��) at S02. The highest P�
�values in the 1995 in situ station pro"les were
at the inshore stations, S02 and S04, during the mid-SW Monsoon and at the o!shore stations, S07and S11, during the late SW Monsoon (Fig. 11). As with primary productivity, P�
�values for the
entire year were highest at Station S11, approaching 20 mmol C mg Chl a��. Surface chlorophylla values varied four-fold at S02, two-fold at S04, two-fold at S07 and "ve-fold at S11. The inshore(S02, 147 km) and o!shore (S11, 997 km) stations of the southern section were the most variable inchlorophyll a. At all four stations the lowest surface chlorophyll a concentrations were during theSpring Intermonsoon.
3.5. Filament at S08
Acoustic Doppler current pro"ler (Flagg and Kim, 1998) and satellite (Manghnani et al., 1998)observations revealed the presence of a strong, narrow current "lament at Station S08 during thelate SW Monsoon. Also at Station S08, an intermediate length station 723 km o!shore, there werepeaks in integrated primary productivity (Fig. 9, Table 2), surface chlorophyll a (Fig. 10, Table 2)and maximal water-column productivity, P
�(Fig. 2). Surface productivity (Fig. 12) at Station S08
was about twice that of Station S07 and about four times that of Station S09.Vertical pro"les for Stations S07, S08 and S09 characterize the "lament in terms of its
vertical pro"le of properties (Fig. 12). These graphs indicate that Stations S07 and S09, thestations just inshore and o!shore of the "lament, were essentially identical in the upper 50 m intemperature, salinity, nitrate and chlorophyll a properties, while Station S08, which was close tothe center of the "lament, was distinct from its nearest neighbors in these properties. Temperatureand, more signi"cantly, salinity at Station S08 were lower than at both Station S07 andStation S09. Furthermore, the salinity values in the upper 50 m at Stations S07 and S09 areidentical. The lower salinity surface water of the "lament at Station S08 was underlain withhigher salinity water at 60}80 m. Nitrate in the "lament (+6 �M) was twice the concentration ofthat in the adjacent stations (+3 �M). Silicic acid in the "lament was not elevated in parallel withnitrate. Station S07 had ML silicic acid values of +1.5 �M, Station S08 had +2 �M and StationS09 had +3 �M. Relative to the nitrate concentration, silicic acid in Station S08 was signi"cantlydepleted.
1150 R.T. Barber et al. / Deep-Sea Research II 48 (2001) 1127}1172
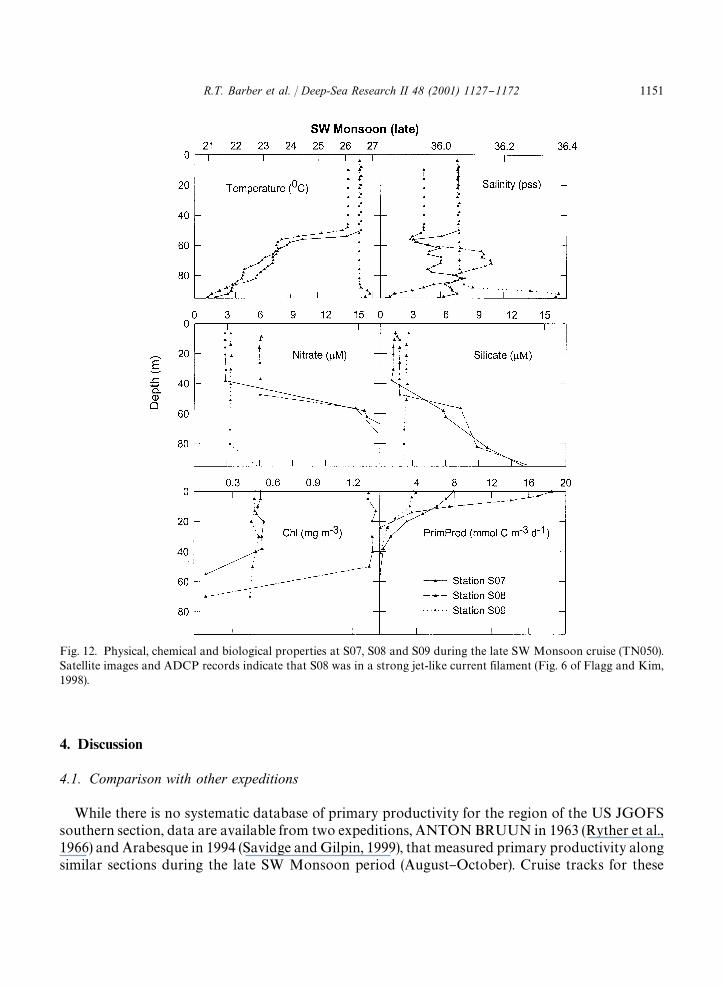
Fig. 12. Physical, chemical and biological properties at S07, S08 and S09 during the late SW Monsoon cruise (TN050).Satellite images and ADCP records indicate that S08 was in a strong jet-like current filament (Fig. 6 of Flagg and Kim,1998).
4. Discussion
4.1. Comparison with other expeditions
While there is no systematic database of primary productivity for the region of the US JGOFSsouthern section, data are available from two expeditions, ANTON BRUUN in 1963 (Ryther et al.,1966) and Arabesque in 1994 (Savidge and Gilpin, 1999), that measured primary productivity alongsimilar sections during the late SW Monsoon period (August}October). Cruise tracks for these
R.T. Barber et al. / Deep-Sea Research II 48 (2001) 1127}1172 1151
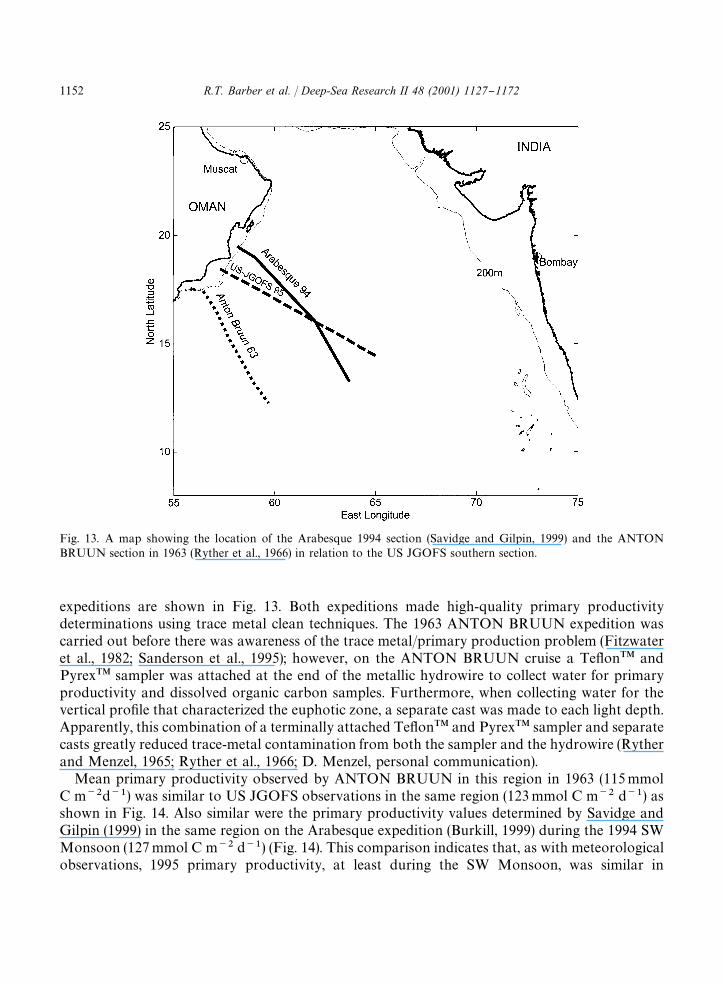
Fig. 13. A map showing the location of the Arabesque 1994 section (Savidge and Gilpin, 1999) and the ANTONBRUUN section in 1963 (Ryther et al., 1966) in relation to the US JGOFS southern section.
expeditions are shown in Fig. 13. Both expeditions made high-quality primary productivitydeterminations using trace metal clean techniques. The 1963 ANTON BRUUN expedition wascarried out before there was awareness of the trace metal/primary production problem (Fitzwateret al., 1982; Sanderson et al., 1995); however, on the ANTON BRUUN cruise a Te#on�� andPyrex�� sampler was attached at the end of the metallic hydrowire to collect water for primaryproductivity and dissolved organic carbon samples. Furthermore, when collecting water for thevertical pro"le that characterized the euphotic zone, a separate cast was made to each light depth.Apparently, this combination of a terminally attached Te#on�� and Pyrex�� sampler and separatecasts greatly reduced trace-metal contamination from both the sampler and the hydrowire (Rytherand Menzel, 1965; Ryther et al., 1966; D. Menzel, personal communication).
Mean primary productivity observed by ANTON BRUUN in this region in 1963 (115 mmolC m��d��) was similar to US JGOFS observations in the same region (123 mmol C m�� d��) asshown in Fig. 14. Also similar were the primary productivity values determined by Savidge andGilpin (1999) in the same region on the Arabesque expedition (Burkill, 1999) during the 1994 SWMonsoon (127 mmol C m�� d��) (Fig. 14). This comparison indicates that, as with meteorologicalobservations, 1995 primary productivity, at least during the SW Monsoon, was similar in
1152 R.T. Barber et al. / Deep-Sea Research II 48 (2001) 1127}1172

Fig. 14. A plot of integrated primary productivity versus distance o!shore for the ANTON BRUUN 1963, Arabesque1994, and US JGOFS 1995 cruises along the sections shown in Fig. 13. The symbols show values at each station along thesections; the horizontal lines show the mean primary productivity for each of the three expedition sections.
magnitude and pattern to previous years for which there are comparable primary productivityobservations.
Qasim (1982) synthesized primary productivity and chlorophyll observations from 21 cruisesthat worked in the Arabian Sea between 1959 and 1976, including the International Indian OceanExpedition (IIOE) results compiled by Krey and Babenerd (1976). Annual mean primary produc-tivity for the Arabian Sea presented by Qasim (1982) was about 70 mmol C m�� d��, which isconsiderably lower than the mean annual value for the southern section in 1995, 111$11 mmolC m�� d�� (Table 2). However, a preponderance of the stations averaged by Qasim (1982) werelocated in the oligotrophic waters of the central and eastern Arabian Sea, i.e., east of 653E. Theareas designated by Qasim (1982) as `Coastal Watersa provide a better spatial comparison with theUS JGOFS southern section. In coastal waters, Qasim (1982) reported a mean annual productivityof 110 mmol C m�� d��. Considering that these 1959}1976 productivity observations were col-lected before Fitzwater et al. (1982) alerted the community to the need for trace-metal-cleanprocedures, this synthesis of early observations was surprisingly similar to the mean annual valueobtained in this region in 1995 (111$11 mmol C m�� d��).
4.2. SW Monsoon primary productivity
High rates of primary productivity during the SW Monsoon have been well documented formany years (Ryther and Menzel, 1965; Ryther et al., 1966; Kabanova, 1968; Cushing, 1973; Krey,1973; Zeitzschel, 1973; Krey and Babenerd, 1976; Qasim, 1977). However, before the US JGOFSstudy there were no time-series of primary productivity based on observations. Longhurst (1995and 1998) presented a theoretical estimate of a SW Monsoon time-series of primary productivitywith a maximum value during August of 280 mmol C m�� d�� and a mean value for theJuly}September period of 171 mmol C m�� d��. In 1995, the observed SW Monsoon maximumproductivity was about 180 mmol C m�� d�� (Table 3) and the mean was 123 mmolC m�� d�� (Fig. 9), both values being considerably lower than Longhurst's (1998). During 1995,
R.T. Barber et al. / Deep-Sea Research II 48 (2001) 1127}1172 1153

values as high as 280 mmol C m�� d�� were observed, but only in shallow water on the continentalshelf close to the Omani coast (data available at http://www1.whoi.edu/jgofs.html.). Arabesque andearlier expeditions also observed values in that range ('280 mmol m�� d��) on the shelf (Rytheret al., 1966; Owens et al., 1993; Savidge and Gilpin, 1999).
In September/October 1986, Owens et al. (1993) observed productivity of 116 mmolC m�� d�� in the vicinity of the mid-southern section. In August 1987, Bauer et al. (1991) andOlson et al. (1993) observed a mean of 86$4 mmol C m�� d�� at three stations in the vicinity ofthe o!shore end of the southern section. A large number of early Soviet observations synthesizedby Kabanova (1968) gave a SW Monsoon mean of 91 mmol C m�� d�� for the region of thesouthern section. Cushing (1973) reanalyzed the Soviet data on a "ner spatial scale, showinga mean of 121 mmol C m�� d�� for the region equivalent to the inner half of the southern sectionand 104 mmol C m�� d�� for the outer portion of the section. These mean SW Monsoon primaryproductivity values, ranging from 86 to 121 mmol C m�� d��, are not very dissimilar from themean SW Monsoon value obtained during 1995 (123 mmol C m�� d��) (Fig. 9).
4.2.1. Spatial domainAn impressive feature of the biological response to the SW Monsoon observed in 1995 was the
large o!shore extent of the region with enhanced primary productivity. This observation wasforeshadowed by Smith (1984), who speculated that `we have no way of knowing the exact arealextent of the biological response of the northwestern Indian Ocean including both Somali coastalwaters and the Arabian Sea, but it is likely to exceed all other known areas of coastal upwelling.aWhy do the SW Monsoon winds enrich primary productivity over such a large area? There areseveral processes that might account for the large spatial extent: (1) so-called curl of the wind stress`o!shorea upwelling, (2) o!shore advection of nutrient-rich water by current "laments, (3) wind-driven mixing and (4) eddy-driven upwelling. Convective mixing, another process that enrichesa large area in the central Arabian Sea, occurs only in boreal winter during the NE Monsoon whenevaporative cooling dominates the heat #ux.
Smith and Bottero (1977) "rst proposed that o!shore upwelling occurs in the Arabian Sea, andSmith (1995) described how the process works in this particular upwelling system: a gradient (or`curla) in the alongshore wind causes an Ekman divergence (or convergence) with associatedupwelling (or downwelling) at the bottom of the Ekman layer. The seaward increase in wind stressthat characterizes coastal upwelling regions produces a gradient (positive wind-stress curl) thatextends the upwelling in#uence farther o!shore. However, Smith (1995) estimated that this positivecurl enhances coastal upwelling by only a few percent in the world's four major eastern boundarycurrent upwelling regions (Barber and Smith, 1981) because the o!shore gradient of increased windstress is relatively weak. In contrast, the Arabian Sea, during the SW Monsoon, is characterized bya very strong o!shore wind maximum with a strong wind-stress gradient. During the 1995 SWMonsoon the wind jet crossed the southern section between S06 and S07 (Fig. 1) (Weller et al.,1998), so a positive gradient (`curla) was present from the coast out to about 600 km.
Smith and Bottero (1977) and Smith (1995) estimated that o!shore Ekman upwelling extendedabout 200 km o!shore and upwelled a volume of water of about the same magnitude as waterupwelled by the coastal divergence. Fig. 5 shows that wind stress increased (i.e., the curl waspositive) from Stations S04 to S07 during both the mid- and late SW Monsoon. According to theexplanations of Smith (1995), the wind-stress gradient shown in Fig. 5 would force Ekman
1154 R.T. Barber et al. / Deep-Sea Research II 48 (2001) 1127}1172

upwelling farther o!shore than the 200 km estimated by Smith and Bottero (1977). On the basis ofwind stress observed in 1995, signi"cant o!shore Ekman upwelling (W
�) took place at Station S07
and inshore at Station S02, but not at Station S04 (Fig. 7). The mid-SW Monsoon nitrate maximaat Stations S02 and S07 with a relative minimum at Station S04 (Fig. 6) independently support thisinterpretation of two spatially separate source regions separated by a non-upwelling region.
The results reported here indicate that the SW Monsoon signi"cantly increases primaryproductivity over a large spatial domain that reaches from 150 to at least 1000 km o!shore. Thelarge area of positive wind-stress curl has been known for a long time (Hastenrath and Lamb, 1979)and its physical consequences have been estimated (Smith and Bottero, 1977), but these resultsspeci"cally con"rm the speculation of Smith (1984) that the biological response to the SWMonsoon takes place over at least half of the Arabian Sea basin.
4.2.2. Filaments and eddiesIn 1995 the Arabian Sea in the vicinity of the southern section was dominated by eddies and"laments (Brink et al., 1996; Flagg and Kim, 1998; Lee et al., 2000). The presence of a strongadvective "lament at Station S08 during TN050 was shown by Flagg and Kim (1998, Fig. 6b),whose ADCP results indicate there was a strong, narrow, alongshore "lament #owing northwardin the upper 100 m at 508 km o!shore; this narrow current was not present at Station S07 (630 kmo!shore) on TN050. Unfortunately, high winds and extreme sea-state conditions preventedcollection of ADCP data from Stations S11 to S09. As mentioned previously, Station S10 duringthe late SW Monsoon cruise (TN050) was the only station of the entire Arabian Sea Expeditionthat was cancelled due to extreme sea state. However, observations of the same "lament wereobtained on TN051, a Sea Soar cruise of the ONR Forced Upper Ocean Dynamics project (Smithet al., 1998a), which pro"led the Station S07 to S09 region about 3 weeks after the late SWMonsoon cruise (TN050). Flagg and Kim (1998) show that 3 weeks after the productivity work, theaxis of the current had precessed inshore to Station S07 and was absent from Station S09.
During the sequence from early August (TN049), through early September (TN050) to the end ofSeptember (TN051), the strong jet-like current "lament "rst precessed o!shore. Reaching itsmaximum o!shore extent during the late SW Monsoon cruise (TN050), the "lament then movedinshore slightly where ONR SeaSoar cruise TN051 pro"led it (Flagg and Kim, 1998). During early(TN053) and late (TN054) December 1995, the o!shore "lament was completely absent fromStation S08 and the southern section. The north- #owing "lament also was absent from Station S08and its environs a year earlier in late December 1994 and January 1995 during NE Monsoon cruiseTN043 (Flagg and Kim, 1998). Taken together, the ADCP observations show that the o!shore`S08 "lamenta was present continuously, crossing in the outer southern section, from aboutmid-July to mid-October.
Information on the biological character of "laments, given in Fig. 4 of Latasa and Bidigare(1998), shows depth distribution of chlorophyll a at Station S08 and the adjacent stations. Thechlorophyll a maximum is vertically uniform at about 1.30 mg Chl a m�� from the surface to 60 m.Fig. 5 of Latasa and Bidigare (1998) shows the presence of a strong fucoxanthin maximum atStation S08, indicating that Station S08 was dominated by diatoms. Cluster analysis (Latasa andBidigare, 1998) shows that Station S08 pigment properties cluster with Station N01, an inshorestation on the northern section where there was intense local upwelling during the late SWMonsoon period (TN050).
R.T. Barber et al. / Deep-Sea Research II 48 (2001) 1127}1172 1155

Nitrate was about 6 �M in the "lament compared to 3 �M at Stations S07 and S09 (Fig. 12), butsilicic acid, unlike other inorganic plant nutrients, was depleted in the "lament. Uptake of silicicacid by the abundant diatoms in the "lament, which were documented by Latasa and Bidigare(1998), would account for the atomic ratio de"ciency of Si relative to N. The Si:N ratio at StationS08 was a low 0.25 during the late SW Monsoon cruise (TN050). Chlorophyll a in the ML of the"lament was three times the concentration in the adjacent stations, while surface productivity inthe "lament was two times higher than at Station S07 and four times higher than at Station S09.
The dramatic biological richness discontinuity of the "lament at Station S08 is demonstrated bythe presence of the highest biomass and primary productivity observed during the lateSW Monsoon period (Table 2, Figs. 9 and 10). P�
�in the "lament was 14.72 mmol C mg
Chl a�� d�� (Table 2), a value considerably higher than those observed during EqPac (Barber etal., 1996), NABE (Chipman et al., 1993) or the Southern Ocean (Smith et al., in press). Clearly, the"lament supported both high speci"c rates and high biomass accumulation.
The Arabian Sea "laments are dynamically distinct from the well-studied "laments of theCalifornia Current o! northern California and Oregon (Chavez et al., 1991). The CaliforniaCurrent "laments do not extend nearly as far o!shore as the Arabian Sea "laments, but Brink et al.(1998) point out that when the length of the "lament is scaled by the square root of the Coriolisparameter (due to the di!erence in latitude) the "laments are similar in length. Despite thesimilarity when scaled, "laments in the coastal transition zone o! northern California are distinctbecause they did not have a maximum in nutrient or phytoplankton concentration within thedynamic feature (Chavez et al., 1991). With surface waters in their high-speed core having relativelylow concentrations and strong cross-jet gradients of nutrients and biomass, the California "la-ments were dynamic boundaries separating nutrient-rich inshore coastally upwelled water fromo!shore oligotrophic water. Fig. 8 of Chavez et al. (1991) is parallel to Fig. 12 of this report: both"gures plot pro"les from the "lament and just inshore and o!shore of it. Comparison of the two"gures shows nitrate and biomass maxima in the Arabian Sea "lament, while in the CaliforniaCurrent "lament concentrations are intermediate between the inshore maximum and o!shoreminimum.
Frequent ADCP pro"ling during the US JGOFS Arabian Sea cruises together with analysis ofhydrographic properties (Flagg and Kim, 1998) shows that these strong, narrow currents transportinshore water to the central Arabian Sea. While the current "lament was present and well de"ned723 km o!shore, at least a portion of the water in this "lament was upwelled adjacent to the Omanicoast, as indicated by the physical and chemical properties of water in the "lament (Arnone et al.,1996; Brink et al., 1996, 1998; Manghnani et al., 1998). The lower temperature of the "lamentindicates that the water was recently upwelled, but the low salinity in the upper 50 m and theslightly higher salinity at depth indicate that the cool, surface water of the "lament was not locallyupwelled (Fig. 12).
It is clear that Arabian Sea "laments advect a signi"cant amount of water rich in nutrients andphytoplankton o!shore about 700 km. We speculate that nutrients provided by "laments (andeddies) in the Arabian Sea contribute as much to the increased areal extent of the highly productiveregion as does o!shore upwelling, a suggestion made earlier on the basis of modeling by Young andKindle (1994) and Keen et al. (1997). Along with increasing the area of high productivity, the"laments also provide the speci"c physical, chemical and biological conditions required for theaccumulation of moderately high diatom biomass (Latasa and Bidigare, 1998). This accumulation
1156 R.T. Barber et al. / Deep-Sea Research II 48 (2001) 1127}1172

of diatom biomass sets the stage for high export rates. Honjo et al. (1999) suggest that the ArabianSea "laments are involved in or even primarily responsible for the high rates of o!shore carbonexport that characterize the region during the SW Monsoon (Nair et al., 1989; Buesseler et al., 1998;Lee et al., 1998). The primary productivity observations reported here from "laments support thesuggestion of Honjo et al. (1999).
In addition to the presence of "laments, the Arabian Sea region also was characterized by thepresence of numerous mesoscale eddies (Flagg and Kim, 1998). These eddies may play as largea role as "laments in the nutrient budget of the o!shore region; McGillicuddy and Robinson (1997)have established that such eddies can signi"cantly enrich surface waters. Future Arabian Sea workwill have to resolve eddy, as well as "lament, dynamics. Achieving a predictive understanding of therole of the Arabian Sea in global cycles will require investigation of the role played by "laments andeddies in increasing primary productivity, structuring the composition of the pelagic phytoplan-kton community, and regulating carbon export to deep waters.
4.2.3. Downwelling and deep mixingThe brief May 1995 downwelling pulse at Station S07 (Fig. 7) is the only evidence for the often
hypothesized and modeled Ekman downwelling that is assumed to occur along the southernsection in the o!shore negative-curl region (Fig. 1) (Luther, 1987; Bauer et al., 1991, 1992;Bartolacci and Luther, 1999). Unfortunately, no process cruises occupied the southern sectionduring May, so the US JGOFS team of chemical and biological investigators did not sample thisdownwelling pulse. The observed large-scale pattern of Ekman upwelling and downwelling duringthe 1995 SW Monsoon di!ered somewhat from the pattern that is hypothesized, on the basis ofmodels, to characterize this region (Brock et al., 1991). Large-scale, but weak, Ekman downwellingoccupied a large region (about half the area of the northern Arabian Sea in the western ArabianSea), but it was most intense south of 103N and east of 603E (Halpern et al., 1998; Lee et al., 2000).
Ekman downwelling intense enough to force light or nutrient limitation was simply never foundat any of the 1995 stations along the US JGOFS southern section. The SW Monsoon maxima forprimary productivity, chlorophyll a and P�
�were located at Stations S08, S09, S10 and S11 (Table
3), o!shore of the mean position of the Findlater Jet. Furthermore, high rates of P��
(ranging from7.89 to 17.18 mmol C mg Chl a�� d��) (Table 2) indicate no reduction of photosyntheticperformance by light or nutrient limitation. Taken together, these results convincingly con"rm thatthere was no reduction of primary productivity, biomass or photosynthetic performance in theputative negative curl region. The high vertical #ux rates in this region (Lee et al., 1998) were notforced by decreased photosynthetic performance that caused phytoplankton to lose the ability toregulate buoyancy (Waite et al., 1992).
A parallel argument can be made regarding wind-driven mixing during the SW Monsoon.Mixed-layer depths along the southern section deepen o!shore (Fig. 5), increasing from 10 to 15 mat Station S02 to a maximum of about 75 m at Station S11. Surprisingly, the ML nitrateconcentrations decrease over the o!shore gradient where the ML deepens. Wind-driven mixingduring both SW Monsoon periods was simply not deep enough to erode the nutricline and allowreplacement of nutrients taken up by the vigorous productivity on the o!shore half of the southernsection, Stations S07}S11 during the SW Monsoon. Similarly, the high productivity, biomass andspeci"c rates at these stations indicate that the wind-driven mixing was not deep enough to haveany detectable deleterious e!ect on photosynthetic activity.
R.T. Barber et al. / Deep-Sea Research II 48 (2001) 1127}1172 1157

4.3. Primary productivity during the non-SW Monsoon period
The comparison of 1995 primary productivity values with earlier observations is extremelyinteresting for the remaining (non-SW Monsoon) periods of the year because the US JGOFSobservations di!er markedly from earlier observations. Longhurst's (1998) conceptual modelestimates that productivity during the rest of the year is relatively constant at about 60 mmolC m�� d�� through the Spring and Fall Intermonsoons and the NE Monsoon. In agreement withLonghurst (1998), Radhakrishna et al. (1978), Nair and Pillai (1983) and Jochem et al. (1993) reportmean values around 60 mmol C m�� d�� for the NE Monsoon and Intermonsoon periods; and,while 60 mmol C m�� d�� is low compared to SW Monsoon primary productivity values, it is highrelative to other areas of the tropical and temperate ocean (Barber et al., 1996; Karl et al., 1996).For example, the tropical Paci"c Ocean in 1992 had mean values of 29 mmol C m�� d�� north andsouth of the equatorial zone, and even the enriched equatorial Paci"c zone of 103N } 103S hada mean of only 52$7 mmol C m�� d�� (Barber et al., 1996). Thus Longhurst's (1998) 60 mmolC m�� d�� prediction is a relatively high level of productivity for an o!shore region that wasconsidered to be oligotrophic for the non-SW Monsoon period of the year (Smith, 1991).
The estimate of 60 mmol C m�� d�� is considerably lower than the lowest seasonal valuesobserved in 1995, which were 86 mmol C m�� d�� during the Spring Intermonsoon and 80 mmolC m�� d�� during the Fall Intermonsoon (Fig. 9). The minimum primary productivity valuesobserved in each season in 1995 varied from 65 to 84 mmol C m�� d�� with a mean minimum of75 mmol C m�� d�� (Table 3), which is considerably higher than the non-SW Monsoon value of60 mmol C m�� d�� (Radhakrishna et al., 1978; Jochem et al., 1993) or the even lower mean valueof about 40 mmol C m�� d�� (Olson et al., 1993; Owens et al., 1993). The relatively large di!erencein non-SW Monsoon primary productivity between our 1995 values and those in the literature mayresult in part from sampling di!erent o!shore regions, with most of the earlier literature valuescoming from along or east of 653E and the 1995 observations coming mostly from west of 653E.The higher winds observed in the 1995 Spring Intermonsoon period relative to the typically lowclimatological mean Intermonsoon winds may have been another factor involved in the unex-pectedly high 1995 primary productivity. Understanding the source of this disagreement remainsan important Arabian Sea issue.
4.3.1. NE Monsoon primary productivityThe NE Monsoon period was a period of steady and moderate winds, clear skies, low humidity
and strong heat transfer from the ocean to the atmosphere (Weller et al., 1998). Meteorologicalobservations from 1994 and 1995 show that the cool, dry winds blowing out of central Asia duringthe NE Monsoon extracted heat (and water) from the surface layer in December 1994 and January1995 (Prasanna Kumar and Prasad, 1996; Weller et al., 1998). During the NE Monsoon evapor-ative cooling both decreased the ML temperature and increased ML salinity, producing densewater that convectively mixed (Weller et al., 1998). The only portion not undergoing convectivemixing during the NE Monsoon was the coastal region adjacent to the coast of Oman (Morrisonet al., 1998).
Morrison et al. (1998) show that the o!shore half of the southern section had surface salinity'36 pss during the January NE Monsoon cruise (TN043). Cooling of this high salinity surfacewater forced convective mixing deep enough to erode into the nutricline. The cooler and slightly
1158 R.T. Barber et al. / Deep-Sea Research II 48 (2001) 1127}1172

more saline surface water convectively mixed down to 90 or 100 m over the o!shore half of thesouthern section (Fig. 5) in January 1995. Because the nutricline is typically at 80 to 90 m(Conkright et al., 1994), this mixing entrained nutrients into the surface ML and produced MLnitrate concentrations of 3}5 �M (Fig. 6). O!shore convective mixing during the NE Monsoon was"rst suggested by Banse (1984) as a source of nutrients to support enhanced winter productivityrates such as those observed in the January 1995 NE Monsoon period when surface heat loss wastaking place. Banse and McClain (1986) proposed that there is signi"cant interannual variability ofwinter convective mixing; small di!erences in the surface heat exchange could enhance convectivemixing in one year and shut it o! in another. Fig. 9 shows that the 1994/1995 winter NE Monsoon(January) had two productivity maxima of about 200 mmol C m�� d��, while the 1995/1996Winter NE Monsoon (December) had no maxima and the mean productivity, 88 mmol C m�� d��,was about the same as that during the Spring Intermonsoon, 86 mmol C m�� d��. This variation inthe primary productivity in the NE Monsoons of two consecutive years may result because, in theDecember 1995 NE Monsoon, not enough cooling had taken place to force the convective mixingthat characterized the January 1995 NE Monsoon.
Madhupratap et al. (1996) were the "rst to show the connection between convective mixing,nutrient enrichment and productivity enhancement in the Arabian Sea. Their observations aremostly from a section on 643E from 103N}213N. This central Arabian Sea region is generally muchless productive than the western half of the basin (Longhurst, 1998), so it is not surprising that theirNE Monsoon values from the north}south section are lower than those observed by the USJGOFS Arabian Sea Study in the same year on the southern section in the western half of the basin.In Madhupratap et al. (1996), the maximum NE Monsoon value observed on the 643E section was50 mmol C m�� d��, about twice the maximum Spring Intermonsoon value (28 mmol C m�� d��).Similarly, along the southern section in 1995 the maximum NE Monsoon rate observed on the USJGOFS cruise (202 mmol C m�� d��) was about twice the maximum Spring Intermonsoon value(112 mmol C m�� d��). While the central Arabian Sea is less productive than the western ArabianSea in the region of the southern section, the proportional NE Monsoon productivity enhancementrelative to Intermonsoon productivity was about the same in both regions. The observations ofMadhupratap et al. (1996) together with the US JGOFS observations reported here show thata large spatial domain of the Arabian Sea is enriched by convective mixing.
During both the January and December NE Monsoons the deepest ML depths along thesouthern section were o!shore at Stations S07 and S11 (Fig. 5). Neither primary productivitynor P�
�at these o!shore stations was reduced by this 80}90 m mixing. During the January
NE Monsoon, Station S09, in the center of the deep convective mixing region, had the highestprimary productivity value observed along the southern section during the entire year(Tables 2 and 3, Fig. 9). The value, 202 mmol C m�� d��, was considerably higher than the meanSW Monsoon value of 123 mmol C m�� d��. The productivity values at adjacent stationswhere there were deep MLs (Fig. 5) in both the January and December NE Monsoons did nothave productivity values that were reduced relative to those on the inshore half of the sectionwhere MLs were much shallower (Table 2, Fig. 9). In addition, speci"c growth rates were close tomaximal values and were twice those of the Spring Intermonsoon (Caron and Dennett, 1999).Clearly, there was no Sverdrup (1953) critical depth limitation of productivity caused by deepconvective mixing during either of the NE Monsoon periods in 1995; the second hypothesis wasnot supported.
R.T. Barber et al. / Deep-Sea Research II 48 (2001) 1127}1172 1159

Table 4Primary productivity in four regions where the JGOFS protocols were used to determine productivity. Values expressedare the mean $ S.E. Values for the Arabian Sea are from the US JGOFS southern section only (Fig. 1)
Region Primary productivity Reference(mmol C m�� d��)
Arabian Sea (1995)NE Monsoon (Jan) 137$13 This reportSpring Intermonsoon 86$5 This reportSW Monsoon (mid) 135$10 This reportSW Monsoon (late) 110$10 This reportNE Monsoon (Dec) 88$4 This reportAnnual Mean 111$11
Equatorial Paci"c at 1403W (1992)13N to 13S 95$6 Barber et al., (1996)23N to 23S 86$4 Barber et al., (1996)53N to 53S 74$7 Barber et al., (1996)103N to 103S 52$7 Barber et al., (1996)'103N and '103S 29$2 Barber et al., (1996)
North Atlantic at 473N (1989)Spring bloom (April/May) 107$23 Chipman et al., (1993)Spring bloom (late May) 90$4 Martin et al., (1993)Mean spring bloom 99
Central North Paci"c at 243NHOT non-ENSO period 32$8 Karl et al., (1995)HOT ENSO period 45$9 Karl et al., (1995)Multi-annual mean 39
Ross Sea (Antarctica)Spring Bloom (Nov) 95$9 Smith et al., (in press)Summer Post Bloom (Jan/Feb) 49$5 Smith et al., (in press)
Antarctic Polar Frontal ZonePre Bloom (Nov) 33$6 Hiscock et al., (submitted)Spring Bloom (Dec) 69$6 Hiscock et al., (submitted)Post Bloom (Feb/Mar) 20$2 Hiscock et al., (submitted)
4.3.2. IntermonsoonsDuring the Spring and Fall Intermonsoon periods the MLs were very shallow and nutrient
concentrations were low over the entire study area (Figs. 5 and 6). The Intermonsoon periods in theArabian Sea are customarily referred to as oligotrophic periods, but their productivity values of86$5 mmol C m�� d�� (Spring) and 80$12 mmol C m�� d�� (Fall) (Fig. 9) are two to threetimes the o!-equator productivity in the tropical Paci"c Ocean (29 $ 2 mmol C m�� d��) (Barberet al., 1996) or the multi-annual mean at the central North Paci"c HOT site (39 mmol C m�� d��)(Karl et al., 1995) (Table 4).
Nitrate and other new nutrients (sensu Dugdale and Goering, 1967) were close to detection limitsalong the entire southern section during the Spring Intermonsoon and only slightly higher during
1160 R.T. Barber et al. / Deep-Sea Research II 48 (2001) 1127}1172

the Fall Intermonsoon (Fig. 6). Vertical pro"les of chlorophyll a and primary productivity arelowest during the Spring Intermonsoon (Fig. 11), showing the consequences of no upwelling(Fig. 7), shallow mixed layers (Fig. 5), and low nutrient concentrations (Fig. 6). However, the strongstrati"cation during this period produces subsurface maxima in chlorophyll a and productivityalong the entire section. In subsurface maxima at Station S04, chlorophyll a concentrationsreached about 1.0 mg m�� and productivity reached 4 mmol C m�� d��. Eddy di!usion of newnutrients across the steep Intermonsoon nutricline (Morrison et al., 1998) along with recycling ofregenerated nutrients provided nutrients adequate to develop the strong Intermonsoon subsurfacemaxima (McCarthy et al., 1999).
The annual time-series of properties at Station S07 (Fig. 8) shows the association during theIntermonsoons of shallow MLs, no Ekman upwelling, nitrate well below the K
�concentration and
low primary productivity. Iron decreases only slightly during the Intermonsoon periods (Fig. 8)and its concentration remains many times higher than the observed iron K
�value (Coale et al.,
1996a). During the Spring Intermonsoon, P��
values di!er from the low biomass and primaryproductivity values in that P�
�values are about equal to other periods in the Arabian Sea (Table 2,
Fig. 11) and high relative to other oceanic regions (Barber et al., 1996; Smith et al., in press). TheSpring Intermonsoon in 1995 was a period of minimal phytoplankton abundance and primaryproductivity, but also a period of e$cient photosynthetic performance. The phytoplankton there,although in low concentrations, were in good photophysiological health and were photosynthesiz-ing at high speci"c rates of productivity relative to those in other ocean regions (Marra et al., 2000).At the same time, their speci"c growth rates were lower than all of the other periods in 1995(Landry et al., 1998; Brown et al., 1999; Caron and Dennett, 1999).
4.4. Chlorophyll a variability
In contrast to primary productivity, there are several seasonal analyses of chlorophyll from shipand satellite observations (Banse, 1987; Yoder et al., 1993; Banse and English, 1994, 2000;Longhurst, 1998). Banse (1987) and Banse and English (2000) treat the various subregions asde"ned by Colborn (1975) on the basis of seasonal thermal structure. The Banse and English (2000)Box 3A includes the southern section from about Station S04 to Station S08, and Box 3Bapproximately covers the region from Station S09 to Station S11; their Table 1 presents monthlymean values for each year. Unfortunately, because of cloud cover, no images from the July/Augustperiod are available in this comprehensive reanalysis, so Banse and English (2000) used theSeptember images as surrogates for the SW Monsoon period. Satellite observations for Box 3Ashow September values from 0.39}2.57 mg Chl m�� in the 1978}1986 period. Farther o!shore, inBox 3B, the September values ranged from 0.42}1.70 mg Chl m��. In comparison, during the twoSW Monsoon cruises in 1995 we observed values of 0.39}1.31 mg Chl a m�� for the Box 3Astations and values of 0.47}1.08 mg Chl a m�� for the Box 3B stations (Table 2).
The 1995 US JGOFS Arabian Sea process cruises did not work in the region in April or Maywhen Banse and English (2000) record minimal values (ranging for Box 3A from 0.05}0.16 mg Chlm��; for Box 3B, from 0.07}0.13 mg Chl m��). For the Spring Intermonsoon, therefore, it isnecessary to compare values for March, the period covered by the process cruise. Banse andEnglish (2000) report March values for Box 3A of 0.16}0.34 mg Chl m�� and for Box 3B,0.17}0.32 mg Chl m��. The March cruise recorded values for Stations S04 to S08 (Box 3A) of
R.T. Barber et al. / Deep-Sea Research II 48 (2001) 1127}1172 1161

0.09}0.23 mg Chl a m�� and for Stations S09 to S10 (Box 3B) values of 0.08}0.13 mg Chla m�� (Table 2). In Banse and English (2000), the NE Monsoon (January) values in Box 3A rangedfrom 0.15 to 0.65 mg Chl m�� and in Box 3B, 0.22}0.64 mg Chl m�� during the 9 years of CZCSobservation. The 1995 NE Monsoon cruise values in the Box 3A stations ranged from 0.29 to0.38 mg Chl a m�� and in the Box 3B stations, 0.28}0.5 mg Chl a m�� (Table 2).
As expected, the range of values during the 9 years of CZCS observations is wider than the rangeof the 1995 observations, but, in general, there is agreement between the equivalent periods. Thisagreement gives considerable con"dence that the shipboard and satellite time-series of phytoplan-kton pigments in the o!shore regions are comparable, but it also serves to emphasize the need forrigorous reprocessing such as that done by Banse and English (2000).
While there is remarkably good agreement on the magnitude of seasonal variability in theo!shore region, the consensus concept also holds that there are strong spatial chlorophyll gradientsduring the SW Monsoon period with elevated inshore concentrations. The composite (1978}1986)CZCS images, such as in Longhurst (1998, Color Plates 1}4) or the seasonal images on the NASAEarth Observing System (EOS) website, http://daac.gsfc.nasa.gov/CAMPAIGN.DOCS/OCDST/clas-sic}scenes/04}classics}arabian.html, show strong gradients. The representative seasonal imagesare, of course, composites and therefore not equivalent to observations from any single cruise.Despite this di$culty, we note that in 1995 there were no observations of high inshore values ora spatial gradient in chlorophyll consistent with the CZCS composite image for the SW Monsoonperiod.
Using CZCS observations, Brock and McClain (1992) analyzed spatial variability during the SWMonsoon in three zones of vertical motion: inshore coastal upwelling, positive-curl o!shoreupwelling and negative-curl downwelling. They estimated that water upwelled in the coastaldomain extended to about 150 km o!shore. Within this coastal upwelling domain, their CZCSimages record relatively high pigment concentrations of '5.0 mg m��. It is interesting that Banseand English (2000), using more stringent reprocessing criteria, also report values from 1.50}5.53 mgChl m�� in the inshore region (Box 1A) during September. Our Station S02 is in the Omani Shelfcoastal upwelling as delimited by Brock and McClain (1992), yet no chlorophyll a values approach-ing 5.0 mg Chl m�� were observed there in 1995 (Fig. 6, Table 2). Low temperature (Fig. 5) and highnitrate values (15 �M) (Fig. 6) observed at Station S02 show the presence of recently upwelledwater. Furthermore, wind-stress calculations (Fig. 7) indicate that Station S02 was the site ofrelatively strong Ekman upwelling (about 1.4 m d��) during the SW Monsoon. Considering thewell-de"ned upwelling that was enriching Station S02 when the ship sampled there, it remainspuzzling why repeated sampling has never observed the high chlorophyll concentrations ('5 mgChl m��) shown in CZCS observations. The absence of onshore/o!shore gradients and very highinshore chlorophyll concentrations is a characteristic of the Arabian Sea about which shipboardobservations disagree not only with the consensus concept, but with theory and models (Luther,1987; Bauer et al., 1991; Brock et al., 1991; McCreary et al., 1996) as well as satellite climatology(Longhurst, 1998) and NASA website images.
4.5. Regulation of photosynthetic performance
The SW and NE Monsoons were periods when new nutrients were at or above the half-saturation concentration for uptake (Fig. 8) (McCarthy et al., 1999). The 13N}13S equatorial wave
1162 R.T. Barber et al. / Deep-Sea Research II 48 (2001) 1127}1172

Fig. 15. P��
, the highest water column productivity in a 24-h on-deck incubation normalized by chlorophyll a concen-tration at the depth of the highest water column productivity, as a function of nitrate concentration in the NE and SWMonsoon seasons. The dashed line and small crosses show the P�
�versus nitrate relationship from the equatorial Paci"c
Ocean HNLC region during Fall 1992 when cool, high-nutrient ENSO conditions were present on the equator (Barberet al., 1996).
guide in the equatorial Paci"c Ocean also had abundant macronutrients during the 1992 USJGOFS EqPac study (Barber et al., 1996), yet P�
�was signi"cantly lower than in the Arabian Sea
(Fig. 15). During the 1995 SW Monsoon the lowest P��
value, about 7 mmol C mg Chl a�� d��,was close to the maximum equatorial Paci"c Ocean value, about 8 mmol C mg Chl a�� d��. Giventhat macronutrient concentrations as well as light (E
�) and temperature in the two regions are
similar, the enhanced photosynthetic performance in the Arabian Sea must result from increasedavailability of a limiting micronutrient; clearly, iron is the best candidate for the micronutrientlimiting photosynthetic performance (P�
�) (Lindley et al., 1995; Lindley and Barber, 1998).
The source of iron in the Arabian Sea is iron-rich dust supplied by the SW Monsoon blowing o!Africa (Husar et al., 1997; Measures and Vink, 1999; Tindale and Pease, 1999). Fig. 15 providesevidence that the iron source (atmospheric fallout) was uncoupled from the macronutrient source(upwelling and mixing). If the micronutrient iron and the macronutrients were provided from thesame subsurface source, as they are in the equatorial Paci"c Ocean, the P�
�versus
nitrate relationship would have a positive slope. During the SW Monsoon the P��
versus
R.T. Barber et al. / Deep-Sea Research II 48 (2001) 1127}1172 1163

nitrate relationship had no slope and during the NE Monsoon there was only a very weaksuggestion of a positive slope.
From the high P��
values at very low nitrate values (Fig. 15), we also can infer that when ironwas abundant, recycled nitrogen, such as ammonia and urea (McCarthy et al., 1999), were su$cientfor maintaining the high photosynthetic performance we observed. Note also that the mean P�
�of
10.68$0.65 (Table 2) for all stations for the entire year was higher than the mean 1992 value forthe 13N}13S equatorial wave guide (about 8 mmol C mg Chl�� d��) (Barber et al., 1996),suggesting that the monsoonal eolian subsidies keep the Arabian Sea iron-enriched (relative to theequatorial Paci"c Ocean) throughout the year. Witter et al. (2000) found total ligand concentrationin the Arabian Sea was higher than concentrations in the western North Atlantic or Paci"c Oceans.This rich ligand background would keep iron delivered by dust deposition soluble in seawater forextended intervals.
Two consequences of micronutrient replete conditions are that fundamental photosyntheticproperties, such as quantum yield, are determined solely by photoadaption and the magnitude ofthese properties is in the range of values indicative of nutrient su$cient growth (Marra et al., 2000).
The 1995 Arabian Sea study was, in e!ect, a natural iron addition experiment that comp-lemented the IronEx experiments carried out in the iron-poor equatorial Paci"c HNLC waters in1993 and 1995 (Martin et al. 1994; Coale et al., 1996b). That the highest speci"c productivity rates(P�
�) were observed during the SW Monsoon when iron input and iron concentrations were
highest is consistent with the suggestion that iron availability directly regulates photosyntheticperformance when macronutrients are replete (Lindley et al., 1995; Lindley and Barber, 1998).
4.6. Regulation of primary productivity
Arabian Sea primary productivity has three salient characteristics:
1. Throughout the year and over a large spatial domain, it is high relative to other oceanic regionsand the mean annual value roughly equals maximum productivity values in other nutrient-rich,o!shore oceanic regions (Table 4),
2. While high, it is lower than expected during the intense SW Monsoon upwelling, given the highnutrients, micronutrients, and incident irradiance (E
�) as well as the absence of wind mixing or
downwelling deep enough to limit photosynthetic performance (P��
), and3. During the non-SW Monsoon portion of the year, especially during the Intermonsoon periods,
primary productivity is higher than expected, given the absence of any obvious physicalmechanism to supply nutrients to the euphotic zone.
The "rst characteristic is a consequence of physical and chemical conditions that supportenhanced rates of photosynthetic performance (P�
�), which in turn support moderately high
primary productivity. For example, the 1995 mean mid-SW Monsoon Arabian Sea productivity,averaged along the entire 1000 km southern section, (135 mmol C m�� d��) exceeded the 1992productivity maximum (95 mmol C m�� d��) in the 13N}13S equatorial wave guide at 1403W inthe Paci"c Ocean and the 1989 mean North Atlantic spring bloom productivity (99 C m�� d��)(Table 4).
Given high P��
rates, the reason primary productivity is less than expected during intenseupwelling is that biomass (chlorophyll) does not accumulate to very high levels. There is, of course,
1164 R.T. Barber et al. / Deep-Sea Research II 48 (2001) 1127}1172

no puzzle about how the pico- and nanophytoplankton are held to low concentrations despite highspeci"c growth rates. E$cient grazing by protozoan zooplankton keep growth and loss in`balancea as de"ned by Landry et al. (1997). The growth rate of micrograzers and, hence, thegrazing rate were coupled to the growth rate of the small phytoplankton during all seasons in theArabian Sea (Landry et al.,1998; Brown et al., 1999; Caron and Dennett, 1999). Growth rates wereaccompanied by grazing losses that prevented the accumulation of signi"cant biomass (Smith et al.,1998b; Landry et al., 1998; Brown et al., 1999; Roman et al., 2000) except in a few specialhydrographic situations, such as in "laments (Fig. 12) or eddies (Bidigare et al., 1997).
The puzzle is, given the favorable nutrient, micronutrient, irradiance (E�), N:Si ratio and rapid
onset of SW Monsoon upwelling, why didn't a diatom bloom of 5}10 mg Chl a m�� develop, ashappens in the Peruvian upwelling (Barber and Smith, 1981)? The convincing explanation given bySmith et al. (1998b) is that the large-bodied copepod Calanoides carinatus is present in largenumbers in the upwelling waters after having `over wintereda in deep water during the periodbetween SW Monsoons. The abundance of these hungry copepods in the initially upwelled watermeans that there is no reproductive lag in zooplankton abundance and, therefore, maximal grazingpressure is present as diatom speci"c growth rates begin to increase during onset of the SWMonsoon upwelling. The unique life cycle of Calanoides carinatus keeps the diatom/copepod gainand loss terms balanced just as the pico- and nanophytoplankton/micrograzer gain and loss termsare balanced.
5. Conclusions
(a) In 1995 along a 1000-km section from the Omani coast to the central Arabian Sea, the SWMonsoon had the highest productivity (123$9 mmol C m�� d��) and this productivity washigh relative to other oceanic regions; the NE Monsoon productivity (112$7 mmolC m�� d��) was nearly as high.
(b) Productivity during the Spring Intermonsoon (86$6 mmol C m�� d��) was much higher thanoligotrophic regions such as the tropical Paci"c Ocean (29$2 mmol C m�� d��) or the NorthPaci"c gyre region (32$8 mmol C m�� d��).
(c) The annual mean productivity (111$11 mmol C m�� d��) in 1995 along this section from theOmani coast to the central Arabian Sea was about equal to the spring bloom maximum(107$23 mmol C m�� d��) during the 1989 North Atlantic Bloom Experiment (NABE) andthe equatorial, 13N}13S wave guide maximum (95$6 mmol C m�� d��) in the Paci"c Oceanduring the 1992 EqPac study.
(d) There was little or no onshore/o!shore gradient in primary productivity from 150 to 1000 kmo! the Omani coast; there was, however, considerable mesoscale spatial variability along the1000-km section in 1995.
(e) The SW Monsoon primary productivity observed in 1995 (123$9 mmol C m�� d��) was verysimilar to that observed in the same region in 1994 by the Arabesque Expedition (127$14 mmolC m�� d��) and in 1964 by the ANTON BRUUN Expedition (115$27 mmol C m�� d��).
(f ) During the SW Monsoon, coastal upwelling, o!shore upwelling, wind-driven mixing, advec-tion in "laments and eddy upwelling provided new nutrients to a broad region of the ArabianSea that reached about 800 km o! the Omani coast.
R.T. Barber et al. / Deep-Sea Research II 48 (2001) 1127}1172 1165

(g) During the NE Monsoon, convective mixing was the major physical process providing newnutrients to a widespread region of the Arabian Sea.
(h) Energetic "laments extending o!shore to about 700 km supported growth and accumulation ofdiatoms which resulted in high productivity and biomass maxima.
(i) No evidence of light limitation of either primary productivity or photosynthetic performance(P�
�) from deep convective mixing during the NE Monsoon, deep wind mixing during the SW
Monsoon or o!shore Ekman downwelling during the SW Monsoon was observed at anylocation in 1995.
(j) High rates of photosynthetic performance (P��
'10 mmol C mg Chl a�� d��) relative toother oceanic regions indicate that the Arabian Sea during the SW Monsoon was more ironreplete than the equatorial Paci"c Ocean.
(k) Dissolved iron concentrations well above observed iron K�
concentrations and high iron ligandconcentrations kept iron recycling and accounted for the year-round high values of photosyn-thetic performance (P�
�).
(l) As hypothesized, the SW Monsoon was the most productive period, but the mean SWMonsoon primary productivity values were lower than expected because grazing by copepodsoverwintering in the upwelled water kept diatoms from accumulating the biomass ('5 mg Chla m��) characteristic of upwelling regions with high levels of primary productivity.
Acknowledgements
Major support for this research was provided by the Harvey W. Smith Endowment at DukeUniversity with ancillary support from the National Science Foundation as part of the US JGOFSArabian Sea Process Study. We especially thank the crew of the University of Washington's ableship, R/V THOMAS G. THOMPSON. We also thank members of the primary productivity teamwho are not co-authors: Elaine Barber, Lisa Borden, Fei Chai, Anna Hilting, Mike Hiscock, CarolKnudson and Steve Lindley. The research by DH was performed at the Jet Propulsion Laboratory,California Institute of Technology, under contract with the National Aeronautics and SpaceAdministration. This is US JGOFS Contribution 507.
References
Arnone, R.L., Macintosh, P., Kindle, J., Brink, K.H., Lee, C., 1996. Filaments structures along the Oman coast during theMonsoon. EOS, Transactions, American Geophysical Union 77 (46), F382.
Aruga, Y., 1973. Primary Production in the Indian Ocean II. In: Zeitschel, B. (Ed.), The Biology of the Indian Ocean.Springer, New York, pp. 127}130.
Banse, K., 1984. Overview of the hydrography and associated biological phenomena in the Arabian Sea, o! Pakistan. In:Haq, B.U., Milliman, J.D. (Eds.), Marine Geology and Oceanography of Arabian Sea and Coastal Pakistan. VonNostrand Reinhold, New York, pp. 271}303.
Banse, K., 1987. Seasonality of phytoplankton chlorophyll in the central and northern Arabian Sea. Deep-Sea ResearchI 34, 713}723.
Banse, K., English, D.C., 1994. Seasonality of coastal zone color scanner phytoplankton pigment in the o!shore oceans.Journal of Geophysical Research 99, 7323}7345.
1166 R.T. Barber et al. / Deep-Sea Research II 48 (2001) 1127}1172

Banse, K., English, D.C., 2000. Geographical di!erences in seasonality of CZCS-derived phytoplankton pigment in theArabian Sea for 1978}1986. Deep-Sea Research II 47, 1623}1677.
Banse, K., McClain, C.R., 1986. Winter blooms of phytoplankton in the Arabian Sea as observed by the coastal zonecolor scanner. Marine Ecology Progress Series 34, 201}211.
Barber, R.T., Borden, L., Johnson, Z., Marra, J., Knudson, C., Trees, C., 1997. Ground truthing modeled k��
and on deckprimary productivity incubations with in situ observations. Society of Photo-Optical Instrumentation Engineers2963, 834}839.
Barber, R.T., Sanderson, M.P., S.T. Lindley, F.C., Newton, J., Trees, C.C., Foley, D.G., Chavez, F. P., 1996. Primaryproductivity and its regulation in the equatorial Paci"c during and following the 1991-92 El Nin� o. Deep-Sea ResearchII 43, 933}969.
Barber, R.T., Smith, R.L., 1981. Coastal upwelling ecosystems. In: Longhurst, A. (Ed.), Analysis of Marine Ecosystems.Academic Press, New York, pp. 31}68.
Bartolacci, D.M., Luther, M.E., 1999. Patterns of co-variability between physical and biological parameters in theArabian Sea. Deep-Sea Research II 46, 1933}1964.
Bauer, S., Hitchcock, G.L., Olson, D.B., 1991. In#uence of monsoonally-forced Ekman dynamics upon surface layerdepth and plankton biomass distributions in the Arabian Sea. Deep-Sea Research I 38, 531}553.
Bauer, S., Hitchcock, G.L., Olson, D.B., 1992. Arabian Sea surface layer depth and biomass distribution as in#uenced byEkman dynamics. In: Desai, B.N. (Ed.), Proceedings of the International Symposium on the Oceanography of theIndian Ocean. Oxford & IBH Publishing Co Pvt Ltd., New Delhi, pp. 583}593.
Behrenfeld, M.J., Falkowski P, .G., 1997. Photosynthetic rates derived from satellite-based chlorophyll concentration.Limnology and Oceanography 42, 1}20.
Bender, M., Orchardo, J., Dickson, M.-L., Barber, R.T., Lindley, S., 1999. In vitro O�#uxes compared with �C
production and other rate terms during the JGOFS Equatorial Paci"c experiment. Deep-Sea Research I 46,637}654.
Bender, M.L., Grande, K., Johnson, K., Marra, J., Williams, P., Sieburth, J., Pilson, M., Langdon, C., Hitchcock, G.,Orchardo, J., Hunt, C., Donaghay, P., Heinemann, K., 1987. A comparison of four methods for the determination ofplanktonic community metabolism. Limnology and Oceanography 32, 1085}1098.
Bertrand, P., Lallier-Verges, E., 1993. Past sedimentary organic matter accumulation and degradation controlled byproductivity. Nature 364, 786}788.
Bidigare, R.R., Latasa, M., Johnson, Z., Barber, R.T., Trees, C.C., Balch, W.M., 1997. Observations of a Synechococcus-dominated cyclonic eddy in open-oceanic waters of the Arabian Sea. Ocean Optics XIII 2963, 260}265.
Brink, K.H., Arnone, R., Coble, P., Flagg, C., Jones, B., Kindle, J., Lee, C., Phinney, D., Wood, M., Yentsch, C., Young, D.,1998. Monsoons boost biological productivity in Arabian Sea. EOS, Transactions, American Geophysical Union 79,168}169.
Brink, K.H., Jones, B.H., Lee, C.M., Wood, M., 1996. A cool "lament o! Oman, June 1995; origins and fates of its water.EOS, Transactions, American Geophysical Union 77 (46), F382.
Brock, J.C., McClain, C.R., 1992. Interannual variability in phytoplankton blooms observed in the northwestern ArabianSea during the Southwest Monsoon. Journal of Geophysical Research 97, 733}750.
Brock, J.C., McClain, C.R., Hay, W.W., 1992. A southwest monsoon hydrographic climatology for the NorthwesternArabian. Journal of Geophysical Research 97, 9455}9465.
Brock, J.C., McClain, C.R., Luther, M.E., Hay, W.W., 1991. The phytoplankton bloom in the northwestern Arabian Seaduring the southwest monsoon of 1979. Journal of Geophysical Research 96, 20 623}20 642.
Brown, S.L., Landry, M.R., Barber, R.T., Campbell, L., Garrison, D.L., Gowing, M.M., 1999. Picophytoplanktondynamics and production in the Arabian Sea during the 1995 Southwest Monsoon. Deep-Sea Research II 46,1745}1768.
Buesseler, K., Ball, L., Andrews, J., Benitez-Nelson, C., Belastock, R., Chai, F., Chao, Y., 1998. Upper oceanexport of particulate organic carbon in the Arabian Sea derived from thorium-234. Deep-Sea Research II 42,2461}2488.
Burkill, P.H., 1999. ARABESQUE: An overview. Deep-Sea Research II 46, 529}547.Caron, D.A., Dennett, M.R., 1999. Phytoplankton growth and mortality during the 1995 Northeast Monsoon and Spring
Intermonsoon in the Arabian Sea. Deep-Sea Research II 46, 1665}1690.
R.T. Barber et al. / Deep-Sea Research II 48 (2001) 1127}1172 1167

Chavez, F.P., Barber, R.T., Kosro, P.M., Huyer, A., Ramp, S., Stanton, T., de Mendiola, B.R., 1991. Horizontal transportand the distribution of nutrients in the coastal transition zone o! northern California: e!ects on primary production,phytoplankton biomass and species composition. Journal of Geophysical Research 96, 14 833}14 848.
Chipman, D.W., Marra, J., Takahashi, T., 1993. Primary production at 47 degrees N and 20 degrees W in the NorthAtlantic Ocean: A comparison between the carbon-14 incubation method and the mixed layer carbon budget.Deep-Sea Research II 40, 151}169.
Coale, K.H., Fitzwater, S.E., Gordon, R.M., Johnson, K.S., Barber, R.T., 1996a. Control of community growth andexport production by upwelled iron in the equatorial Paci"c Ocean. Nature 379, 621}624.
Coale, K.H., Johnson, K.S., Fitzwater, S.E., Gordon, R.M., Tanner, S., Chavez, F.P., Ferioli, L., Sakamoto, C., Rogers, P.,Millero, F., Steinberg, P., Nightingale, P., Copper, D., Cochlan, W.P., Kudela, R., 1996b. A massive phytoplanktonbloom induced by an ecosystem-scale iron fertilization experiment in the equatorial Paci"c Ocean. Nature 383,495}501.
Colborn, J.G., 1975. The Thermal Structure of the Indian Ocean. University Press of Hawaii, Honolulu, 173pp.Conkright, M.E., Levitus, S., Boyer, T.P., Bartolacci, D.M., Luther, M.E., 1994. Atlas of the Northern Indian Ocean.
University of South Florida, St. Petersburg, FL, 150pp.Currie, R.I., Fisher, A.E., Hargreaves, P.M., 1973. Arabian Sea Upwelling. In: Zeitschel, B. (Ed.), The Biology of the
Indian Ocean. Springer, New York, pp. 37}52.Cushing, D.H., 1973. Production in the Indian Ocean and the Transfer from the Primary to the Secondary Level. In:
Zeitschel, B. (Ed.), The Biology of the Indian Ocean. Springer, New York, pp. 475}486.Dickson, M.-L., Orchardo, J., Barber, R.T., Marra, J., McCarthy, J.J., Sambrotto, R.N., 2001. Production and respiration
rates in the Arabian Sea during the 1995 Northeast and Southwest Monsoons. Deep-Sea Research II 48, 1199}1230.Dietrich, G., 1973. The Unique Situation in the Environment of the Indian Ocean. In: Zeitzschel, B. (Ed.), The Biology of
the Indian Ocean. Springer, New York, pp. 1}6.Dugdale, R.C., Goering, J.J., 1967. Uptake of new and regenerated forms of nitrogen in primary production. Limnology
and Oceanography 12, 196}206.Fieux, M., Stommel, H., 1977. Onset of the Southwest Monsoon over the Arabian Sea from marine reports of surface
winds. Monthly Weather Review 105, 231}236.Findlater, J., 1971. Mean monthly air #ow at low levels over the western Indian ocean. Geophysical Memoirs 115, 53 pp.
Her Majesty's Stationery O$ce, Norwich, England, UK.Fitzwater, S., Knauer, G.A., Martin, J.H., 1982. Metal contamination and its e!ect on primary production measurements.
Limnology and Oceanography 27, 544}551.Flagg, C.N., Kim, H.-S., 1998. Upper ocean currents in the northern Arabian Sea from shipboard ADCP measurements
collected during 1994}1996 the US JGOFS and ONR programs. Deep-Sea Research II 45, 1905}1915.Gardener, W.D., Gundersen, J.S., Richardson, M.J., Walsh, I.D., 1999. The role of seasonal and diel changes in
mixed-layer depth on carbon and chlorophyll distributions in the Arabian Sea. Deep-Sea Research II 46, 1833}1858.Garrison, D.L., Gowing, M.M., Hughes, M.P., 1998. Nano- and microplankton in the northern Arabian Sea during the
Southwest Monsoon August}September, 1995: a U.S. JGOFS study. Deep-Sea Research II 45, 2269}2299.Goericke, R., Repeta, D., 1993. Chlorophyll a and b and divinyl chlorophylls a and b in the open sub-tropical North
Atlantic Ocean. Marine Ecology Progress Series 101, 307}313.Gross, F., Zeuthen, E., 1948. The buoyancy of plankton diatoms: a problem of cell physiology. Proceedings of the Royal
Society B 135, 382.Halpern, D., Freilich, M.H., Weller, R.A., 1998. Arabian Sea surface winds and ocean transports determined from ERS-1
scatterometer. Journal of Geophysical Research } Oceans 103, 7799}7806.Halpern, D., Woiceshyn, P.M., 1999. Onset of the Somali Jet in the Arabian Sea during June 1997. Journal of
Geophysical Research } Oceans 104, 18 041}18 046.Halpern, D., Woiceshyn, P.M., 2001. Somali Jet in the Arabian Sea, El Nin� o and India rainfall. Journal of Climate, in
press.Hansell, D.A., Carlson, C.A., 1998. Net community production of dissolved organic carbon. Global Biogeochemical
Cycles 12, 443}453.Hastenrath, S., Lamb, P.J., 1979. Climatic Atlas of the Indian Ocean. University of Wisconsin Press, 19 pp.#97
charts.
1168 R.T. Barber et al. / Deep-Sea Research II 48 (2001) 1127}1172

Hiscock, M.R., Marra, J., Smith, W.O., Barber, R.T. On deck ground truthing using optical properties and in situreplicates. Deep-Sea Research II, submitted for publication.
Holm-Hansen, O., Lorenzen, C., Holmes, R., Strickland, J., 1965. Fluorometric determination of chlorophyll. Journal duConseil International pour l'Exploration de la Mer 30, 3}15.
Honjo, S., Dymond, J., Prell, W., Ittekkot, V., 1999. Monsoon-controlled export #uxes to the interior of the Arabian Sea;U.S. JGOFS 1994}1995 experiment. Deep-Sea Research II 46, 1859}1902.
Hunter, C.N., Gordon, R.M., Fitzwater, S.E., Coale, K.H., 1996. A rosette system for the collection of trace metal cleanseawater. Limnology and Oceanography 41, 1367}1372.
Huntsman, S.A., Barber, R.T., 1977. Primary production o! northwest Africa: the relationship to wind and nutrientconditions. Deep-Sea Research 24, 25}34.
Husar, R.B., Prospero, J.M., Stow, L.L., 1997. Characterization of tropospheric aerosols over the oceans with the NOAAadvanced very high resolution radiometer optical thickness operational product. Journal of Geophysical Research102, 16889}16909.
Iverson, R.L., 1990. Control of marine "sh production. Limnology and Oceanography 35, 1593}1604.Iverson, R.L., Bittaker, H.F., Myers, V.B., 1976. Loss of radiocarbon in direct use of Aquasol for liquid scintillation
counting of solutions containing �C-NaHCO�. Limnology and Oceanography 21, 756}758.
Je!rey, S.W., 1974. Pro"les of photosynthetic pigments in the ocean using thin-layer chromatography. Marine Biology26, 101}110.
Jochem, F.J., Pollehne, F., Zeitschel, B., 1993. Productivity regime and phytoplankton size structure in the Arabian Sea.Deep-Sea Research II 40, 711}735.
Kabanova, Y.G., 1968. Primary production of the northern part of the Indian Ocean. Oceanology 8, 214}225.Karl, D.M., Christian, J.R., Dore, J.E., Hebel, D.V., Letelier, R.M., Tupas, L.M., Winn, C.D., 1996. Seasonal and
interannual variability in primary production and particle #ux at Station ALOHA. Deep-Sea Research I 43, 539}568.Karl, D.M., Letelier, R., Hebel, D., Tupas, L., Dore, J., Christian, J., Winn, C., 1995. Ecosystem changes in the North
Paci"c subtropical gyre attributed to the 1991}1992 El Nin� o. Nature 373, 230}234.Karl, D.M., Winn, D.D., Hebel, D.V., Letelier, R., 1990. Hawaii Ocean Time series program: "eld and laboratory
protocols. University of Hawaii, 187pp.Keen, T.R., Kindle, J.C., Young, D.K., 1997. The interaction of southwest monsoon upwelling, advection and primary
production in the northwest Arabian Sea. Journal of Marine Systems 13, 61}82.Krey, J., 1973. Primary Production in the Indian Ocean I. In: Zeitschel, B. (Ed.), The Biology of the Indian Ocean.
Springer, New York, pp. 115}126.Krey, J., Babenerd, B., 1976. Phytoplankton production. In: Atlas of the International Indian Ocean Expedition.
Universitat Kiel, Institut fur Meereskunde, pp. 70 .Landry, M.R., Barber, R.T., Bidigare, R.R., Chai, F., Coale, K.H., Dam, H.G., Lewis, M.R., Lindley, S.T., McCarthy, J.J.,
Roman, M.R., Stoecker, D.K., Verity, P.G., White, J.R., 1997. Iron and grazing constraints on primary production inthe central equatorial Paci"c: an EqPac synthesis. Limnology and Oceanography 42, 405}418.
Landry, M.R., Brown, S.L., Campbell, L., Constantinou, J., Liu, H., 1998. Spatial patterns in phytoplankton growth andmicrozooplankton grazing in the Arabian Sea during monsoon forcing. Deep-Sea Research II 45, 2353}2368.
Latasa, M., Bidigare, R., 1998. A comparison of phytoplankton populations of the Arabian Sea during the SpringIntermonsoon and Southwest Monsoon of 1995 as described by HPLC-analyzed pigments. Deep-Sea Research II 45,2133}2170.
Laws, E.A., 1991. Photosynthetic quotients, new production and net community production in the open ocean. Deep-SeaResearch I 38, 143}167.
Laws, E.A., Landry, M.R., Barber, R.T., Campbell, L., Dickson, M.-L., Marra, J., 2000. Carbon cycling in primaryproduction bottle incubations: inferences from grazing experiments and photosynthetic studies using �C and � O inthe Arabian Sea. Deep-Sea Research II 47, 1339}1352.
Lee, C., Murray, D.W., Barber, R.T., Buesseler, K.O., Dymond, J., Hedges, J.I., Honjo, S., Manganini, S.J., Marra, J.,Peterson, M.L., Prell, W.L., Wakeham, S.G., 1998. Particulate organic carbon #uxes: Results from the US JGOFSArabian Sea Process Study. Deep-Sea Research II 45, 2489}2501.
Lee, C.M., Jones, B.H., Brink, K.H., Fischer, A.S., 2000. The upper-ocean response to monsoonal forcing in the ArabianSea: seasonal and spatial variability. Deep-Sea Research II 47, 1177}1226.
R.T. Barber et al. / Deep-Sea Research II 48 (2001) 1127}1172 1169

Li, W.K.W., Maestrini, S.Y. (Eds.), 1993. Measurement of Primary Production from the Molecular to the Global Scale.ICES Marine Science Symposium, 286pp.
Lindley, S.T., Barber, R.T., 1998. Phytoplankton response to natural and arti"cial iron addition. Deep-Sea Research II45, 1135}1150.
Lindley, S.T., Bidigare, R.R., Barber, R.T., 1995. Phytoplankton photosynthesis parameters along 1403W in theequatorial Paci"c. Deep-Sea Research II 42, 441}463.
Lohrenz, S.E., Wiesenburg, D.A., Rein, C.R., Arnone, R.A., Taylor, C.D., Knauer, G.A., Knap, A.H., 1992. A comparisonof in situ and simulated in situ methods for estimating oceanic primary production. Journal of Plankton Research 14,201}221.
Longhurst, A., 1998. Ecological Geography of the Sea. Academic Press, 398pp.Longhurst, A.R., 1993. Seasonal cooling and blooming in tropical oceans. Deep-Sea Research I 40, 2145}2165.Longhurst, A.R., 1995. Seasonal cycles of pelagic production and consumption. Progress in Oceanography 36, 77}167.Lorenzen, C.J., 1966. A method for continuous measurement of in vivo chlorophyll concentration. Deep-Sea Research 13,
223}227.Luther, M.E., 1987. Indian Ocean modelling. In: Katz, E., Witte, J. (Eds.), Further Progress in Equatorial Oceanography.
Nova University Press, Dania, FL, pp. 303}316.Madhupratap, M., Prasanna Kumar, S., Bhattathiri, P.M.A., Kumar, M.D., Raghukumar, S., Nair, K.K.C., Ramaiah, N.,
1996. Mechanism of the biological response to winter cooling in the northeastern Arabian Sea. Nature 384, 549}552.Malone, T.C., Pike, S.E., Conley, D.J., 1993. Transient variations in phytoplankton productivity at the JGOFS Bermuda
time series station. Deep-Sea Research I 40, 903}924.Manghnani, V., Morrison, J.M., Hopkins, T.S., Bohm, E., 1998. Advection of upwelled waters in the form of plumes o!
Oman during the Southwest Monsoon. Deep-Sea Research II 45, 2027}2052.Marra, J., Dickey, T.D., Ho, C., Kinkade, C.S., Sigurdson, D.E., Weller, R.A., Barber, R.T., 1998. Variability in primary
production as observed from moored sensors in the central Arabian Sea in 1995. Deep-Sea Research II 45, 2253}2267.Marra, J., Trees, C.C., Bidigare, R.R., Barber, R.T., 2000. Pigment absorption and quantum yields in the Arabian Sea.
Deep-Sea Research II 47, 1279}1299.Martin, J.H., et al., 1994. Testing the iron hypothesis in ecosystems of the equatorial Paci"c Ocean. Nature 371, 123}129.Martin, J.H., Fitzwater, S.E., Gordon, R.M., Hunter, C.N., Tanner, S.J., 1993. Iron, primary production and carbon-
nitrogen #ux studies during the JGOFS North Atlantic Bloom Experiment. Deep-Sea Research II 40, 115}134.McCarthy, J.J., Garside, C., Nevins, J.L., 1999. Nitrogen dynamic during the Arabian Sea Northeast Monsoon. Deep-Sea
Research II 46, 1623}1664.McCreary Jr., J.P., Kohler, K.E., Hood, R.R., Olson, D.B., 1996. A four-component ecosystem model of biological
activity in the Arabian Sea. Progress in Oceanography 37, 193}240.McGill, D.A., 1973. Light and Nutrients in the Indian Ocean. In: Zeitschel, B. (Ed.), The Biology of the Indian Ocean.
Springer, New York, pp. 53}102.McGillicuddy, D.J., Robinson, A.R., 1997. Eddy-induced nutrient supply and new production in the Sargasso Sea.
Deep-Sea Research I 44, 1427}1450.Measures, C.I., Vink, S., 1999. Seasonal variations in the distribution of Fe and Al in the surface waters of the Arabian
Sea. Deep-Sea Research II 46, 1597}1622.Morrison, J.M., Codispoti, L.A., Gaurin, S., Jones, B., Manghnani, V., Zheng, Z., 1998. Seasonal variation of
hydrographic and nutrient "elds during the U.S. JGOFS Arabian Sea Process Study. Deep-Sea Research II 45,2053}2101.
Nair, P.V.R., Pillai, V.K., 1983. Productivity of the Indian Seas. J. Mar. Biol. Assoc. India 25, 41}50.Nair, R.V., Ittekkot, V., Manganini, S.J., Ramaswamy, V., Haake, B., Degens, E.T., Desai, B.N., Honjo, S., 1989. Increased
particle #ux to the deep ocean related to monsoons. Nature 338, 749}751.Odum, E.P., 1971. Fundamentals of Ecology. Saunders, Philadelphia, 574pp.Olson, D.B., Hitchcock, G.L., Fine, R.A., Warren, B.A., 1993. Maintenance of the low-oxygen layer in the central Arabian
Sea. Deep-Sea Research II 40, 673}685.Owens, N.J.P., Burkill, P.H., Mantoura, R.F.C., Woodward, E.M.S., Bellan, I.E., Aiken, J., Howland, R.J.M., Llewellyn,
C.A., 1993. Size-fractionated primary production and nitrogen assimilation in the northwestern Indian Ocean.Deep-Sea Research II 40, 697}709.
1170 R.T. Barber et al. / Deep-Sea Research II 48 (2001) 1127}1172

Pace, M.L., Knauer, G.A., Karl, D.M., Martin, J.H., 1987. Primary production, new production and vertical #ux in theeastern Paci"c Ocean. Nature 325, 803}804.
Peterson, B.J., 1980. Aquatic primary productivity and the �C}CO�
method: a history of the productivity problem.Annual Reviews of Ecology and Systematics 11, 359}385.
Prasanna Kumar, S., Prasad, T.G., 1996. Winter cooling in the northern Arabian Sea. Current Science 71, 834}841.Qasim, S.Z., 1977. Biological productivity of the Indian Ocean. Indian Journal of Marine Sciences 6, 122}137.Qasim, S.Z., 1982. Oceanography of the northern Arabian Sea. Deep-Sea Research 29, 1041}1068.Radhakrishna, K., Devassy, V.P., Bhargava, R.M.S., Bhattathiri, P.M.A., 1978. Primary production in the Northern
Arabian Sea. Indian Journal of Marine Sciences 7, 271}275.Richardson, K., 1991. Comparison of �C primary production determinations made by di!erent laboratories. Marine
Ecology Progress Series 72, 189}201.Robinson, C., Williams, P.J.leB., 1999. Plankton net community production and dark respiration in the Arabian Sea
during September 1994. Deep-Sea Research II 46, 745}765.Roman, M., Smith, S., Wishner, K., Zhang, X., Gowing, M., 2000. Mesozooplankton production and grazing in the
Arabian Sea. Deep-Sea Research II 47, 1423}1450.Ryther, J., Menzel, D.W., 1965. On the production, composition, and distribution of organic matter in the Western
Arabian Sea. Deep-Sea Research 12, 199}209.Ryther, J.H., Hall, J.R., Pease, A.K., Bakun, A., Jones, M.M., 1966. Primary production in relation to the chemistry and
hydrography of the western Indian Ocean. Limnology and Oceanography 11, 371}380.Sanderson, M.P., Hunter, C.N., Fitzwater, S.E., Gordon, R.M., Barber, R.T., 1995. Primary productivity and trace metal
contamination measurements from a clean rosette system versus ultra clean Go-Flo bottles. Deep-Sea Research II 42,431}440.
Sathyendranath, S., Stuart, V., Irwin, B.D., Maass, H., Savidge, G., Gilpin, L., Platt, T., 1999. Seasonal variations inbio-optical properties of phytoplankton in the Arabian Sea. Deep-Sea Research II 46, 633}653.
Savidge, G., Gilpin, L., 1999. Seasonal in#uences on size fractionated chlorophyll a concentrations and primaryproduction in the north-west Indian Ocean. Deep-Sea Research II 46, 701}723.
SCOR, 1996. JGOFS Report No. 19: Protocols for the Joint Global Ocean Flux Study (JGOFS) Core Measurements.Scienti"c Committee on Oceanic Research, International Council of Scienti"c Unions, Bergen, 170pp.
Shi, W., Morrison, J.M., BoK hm, E., Manghnani, V., 2000. The Oman upwelling zone during 1993 , 1994 and 1995.Deep-Sea Research II 47, 1227}1248.
Smayda, T.J., 1970. The suspension and sinking of phytoplankton in the sea. Oceanography and Marine Biology AnnualReview 8, 353}414.
Smayda, T.J., Boleyn, B.J., 1965. Experimental observations on the #otation of marine diatoms. Limnology andOceanography 10, 499}509.
Smetacek, V., 1980. Annual cycle of sedimentation in relation to plankton ecology in western Kiel Bight. OpheliaSupliment 1, 65}76.
Smetacek, V.H., Passow, U., 1990. Spring bloom initiation and Sverdrup's critical depth model. Limnology andOceanography 35, 228}234.
Smith, R.L., 1995. The physical processes of coastal ocean upwelling systems. In: Summerhayes, C.P., Emeis, K.-C.,Angel, M.V., Smith, R.L., Zeitschel, B. (Eds.), Upwelling in the Ocean: Modern Processes and Ancient Records. Wiley,Chichester, pp. 39}64.
Smith, R.L., Bottero, J.S., 1977. On upwelling in the Arabian Sea. In: Angel, M. (Ed.), A Voyage of Discovery. PergamonPress, pp. 291}304.
Smith, S.L. (Ed.) 1991. U.S. JGOFS: Arabian Sea Process Study, U.S. JGOFS Planning Report No. 13. Woods HoleOceanographic Institution, Woods Hole, Massachusetts, 164 pp.
Smith, S.L. (Ed.) 1998. 1994}1996 Arabian Sea Expedition: Oceanic Response to Monsoonal Forcing, Part 1. Deep-SeaResearch 45, 1905}2501.
Smith, S.L. (Ed.) 1999. 1994}1996 Arabian Sea Expedition: Oceanic Response to Monsoonal Forcing, Part 2. Deep-SeaResearch 46, 1531}1964
Smith, S.L. (Ed.) 2000. 1994}1996 Arabian Sea Expedition: Oceanic Response to Monsoonal Forcing, Part 3. Deep-SeaResearch 47, 1177}1677.
R.T. Barber et al. / Deep-Sea Research II 48 (2001) 1127}1172 1171

Smith, S.L., 1984. Biological indications of active upwelling in the northeastern Indian Ocean and a comparison withPeru and northwest Africa. Deep-Sea Research 31, 951}967.
Smith, S.L., Codispoti, L.A., Morrison, J.M., Barber, R.T., 1998a. The 1994}1996 Arabian Sea Expedition: an integrated,interdisciplinary investigation of the response of the northwestern Indian Ocean to monsoonal forcing. Deep-SeaResearch II 45, 1905}1915.
Smith, S.L., Roman, M., Prusova, I., Wishner, K., Gowing, M., Codispoti, L.A., Barber, R.T., Marra, J., Flagg, C.N., 1998b.Seasonal response of zooplankton to monsoonal reversals in the Arabian Sea. Deep-Sea Research II 45, 2369}2403.
Smith, W.O., Jr., R.T. Barber, M.R. Hiscock, J. Marra. The seasonal cycle of phytoplankton biomass and primaryproductivity in the Ross Sea, Antarctica. Deep-Sea Research, in press.
Stommel, H. M., 1965. The Gulf Stream. University of California Press, Berkeley, 248 pp.Suess, E., 1980. Particulate organic carbon #ux in the oceans: Surface productivity and oxygen utilization. Nature 288, 260}263.Sverdrup, H.U., 1953. On conditions for the vernal blooming of phytoplankton. Journal du Conseil International pour
Exploration de la Mer 18, 287}295.Tindale, N.W., Pease, P.P., 1999. Aerosols over the Arabian Sea: Atmospheric transport pathways and concentrations of
dust and sea salt. Deep-Sea Research II 46, 1577}1595.Trees, C.C., Kenicutt, M.C., Brooks, J.M., 1985. Errors associated with the standard #uorometric determination of
chlorophylls and phaeopigments. Marine Chemistry 17, 1}12.Venrick, E.L., Hayward, T.L., 1984. Determining chlorophyll on the 1984 CalCOFI surveys. California Cooperative
Oceanic Fisheries Investigation Report 25, 74}79.Waite, A.M., Thompson, P.A., Harrison, P.J., 1992. Does energy control the sinking rates of marine diatoms? Limnology
and Oceanography 37, 468}477.Wassman, P., 1990. Relationships between primary and export production in the boreal coastal zone of the North
Atlantic. Limnology and Oceanography 35, 464}471.Weller, R.A., Baumgartner, M.F., Josey, S.A., Fischer, A.S., Kindle, J.C., 1998. Atmospheric forcing in the Arabian Sea
during 1994}1995: observations and comparisons with climatology and models. Deep-Sea Research II 45, 1961}1999.Welschmeyer, N.A., Strom, S., Goericke, R., DiTullio, G., Belvin, M., Peterson, W., 1993. Primary production in the
subarctic Paci"c Ocean: Project SUPER. Progress in Oceanography 32, 101}135.Whitledge, T.E., Malloy, S.C., Patton, C.J., Wirick, C.D., 1981. Automated nutrient analyses in seawater. Brookhaven
National Laboratory Report. BNL 51398, 216 pp.Williams, P.J.leB., 1981. Microbial contributions to overall marine plankton metabolism: direct measurements of
respiration. Oceanology Acta 4, 359}370.Williams, P.J.leB., 1993a. Chemical and tracer methods of measuring plankton production. ICES Marine Science
Symposia 197, 20}36.Williams, P.J.leB., 1993b. On the de"nition of plankton production terms. ICES Marine Science Symposium 197, 9}19.Williams, P.J.leB., 1995. Evidence for the seasonal accumulation of carbon-rich dissolved organic material, its scale in
comparison with changes in particulate material and the consequential e!ect on net C/N assimilation ratios. MarineChemistry 51, 17}29.
Williams, P.J.leB., Lefevre, D., 1996. Algal �C and total carbon metabolisms, 1 Models to account for the physiologicalprocesses of respiration and recycling. Journal of Plankton Research 18, 1941}1959.
Witter, A.E., Lewis, B.L., Luther, III, G.W., 2000. Iron speciation in the Arabian Sea. Deep-Sea Research II 47,1517}1540.
WuK st, G., 1959. Proposed International Indian Ocean Expedition. Deep-Sea Research 6, 245}249.Yoder, J.A., McClain, C.R., Geldman, G.C., Esaias, W.E., 1993. Annual cycles of phytoplankton chlorophyll concentra-
tions in the global ocean: a satellite view. Global Biogeochemical Cycles 7, 181}193.Young, D.K., Kindle, J.C., 1994. Physical processes a!ecting availability of dissolved silicate for diatom production in the
Arabian Sea. Journal of Geophysical Research 99, 22619}22632.Zeitzschel, B. (Ed.), 1973. The Biology of the Indian Ocean. Springer, New York, 549pp.
1172 R.T. Barber et al. / Deep-Sea Research II 48 (2001) 1127}1172
Copyright © 2022 FDOKUMEN