Prevalence of trypanosomes, salivary gland hypertrophy virus ...
14
RESEARCH Open Access Prevalence of trypanosomes, salivary gland hypertrophy virus and Wolbachia in wild populations of tsetse flies from West Africa Gisele M. S. Ouedraogo 1,2,3† , Güler Demirbas-Uzel 1† , Jean-Baptiste Rayaisse 4 , Geoffrey Gimonneau 4,5 , Astan C. Traore 1,6 , Antonios Avgoustinos 1 , Andrew G. Parker 1 , Issa Sidibe 7 , Anicet G. Ouedraogo 8 , Amadou Traore 9 , Bale Bayala 3 , Marc J. B. Vreysen 1 , Kostas Bourtzis 1 and Adly m. M. Abd-Alla 1* Abstract Background: Tsetse flies are vectors of African trypanosomes, protozoan parasites that cause sleeping sickness (or human African trypanosomosis) in humans and nagana (or animal African trypanosomosis) in livestock. In addition to trypanosomes, four symbiotic bacteria Wigglesworthia glossinidia, Sodalis glossinidius, Wolbachia, Spiroplasma and one pathogen, the salivary gland hypertrophy virus (SGHV), have been reported in different tsetse species. We evaluated the prevalence and coinfection dynamics between Wolbachia, trypanosomes, and SGHV in four tsetse species (Glossina palpalis gambiensis, G. tachinoides, G. morsitans submorsitans, and G. medicorum) that were collected between 2008 and 2015 from 46 geographical locations in West Africa, i.e. Burkina Faso, Mali, Ghana, Guinea, and Senegal. Results: The results indicated an overall low prevalence of SGHV and Wolbachia and a high prevalence of trypanosomes in the sampled wild tsetse populations. The prevalence of all three infections varied among tsetse species and sample origin. The highest trypanosome prevalence was found in Glossina tachinoides (61.1%) from Ghana and in Glossina palpalis gambiensis (43.7%) from Senegal. The trypanosome prevalence in the four species from Burkina Faso was lower, i.e. 39.6% in Glossina medicorum, 18.08%; in Glossina morsitans submorsitans, 16.8%; in Glossina tachinoides and 10.5% in Glossina palpalis gambiensis. The trypanosome prevalence in Glossina palpalis gambiensis was lowest in Mali (6.9%) and Guinea (2.2%). The prevalence of SGHV and Wolbachia was very low irrespective of location or tsetse species with an average of 1.7% for SGHV and 1.0% for Wolbachia. In some cases, mixed infections with different trypanosome species were detected. The highest prevalence of coinfection was Trypanosoma vivax and other Trypanosoma species (9.5%) followed by coinfection of T. congolense with other trypanosomes (7.5%). The prevalence of coinfection of T. vivax and T. congolense was (1.0%) and no mixed infection of trypanosomes, SGHV and Wolbachia was detected. Conclusion: The results indicated a high rate of trypanosome infection in tsetse wild populations in West African countries but lower infection rate of both Wolbachia and SGHV. Double or triple mixed trypanosome infections were found. In addition, mixed trypanosome and SGHV infections existed however no mixed infections of trypanosome and/or SGHV with Wolbachia were found. Keywords: Glossina spp., Trypanosoma spp., Wolbachia spp., SGHV, Microbe infection rate, Interactions * Correspondence: [email protected] † Gisele M S Ouedraogo and Güler Demirbas-Uzel contributed equally to this work. 1 Insect Pest Control Laboratory, Joint FAO/IAEA Programme of Nuclear Techniques in Food and Agriculture, International Atomic Energy Agency, P.O. Box 100, A-1400 Vienna, Austria Full list of author information is available at the end of the article © International Atomic Energy Agency; licensee BioMed Central Ltd. 2018 This is an open access article distributed under the terms of the Creative Commons Attribution IGO License https://creativecommons.org/licenses/by/3.0/igo/) which permits unrestricted use, distribution, and reproduction in any medium, provided appropriate credit to the original author(s) and the source is given. Ouedraogo et al. BMC Microbiology 2018, 18(Suppl 1):153 https://doi.org/10.1186/s12866-018-1287-4
-
Upload
khangminh22 -
Category
Documents
-
view
1 -
download
0
Transcript of Prevalence of trypanosomes, salivary gland hypertrophy virus ...

RESEARCH Open Access
Prevalence of trypanosomes, salivary glandhypertrophy virus and Wolbachia in wildpopulations of tsetse flies from West AfricaGisele M. S. Ouedraogo1,2,3†, Güler Demirbas-Uzel1†, Jean-Baptiste Rayaisse4, Geoffrey Gimonneau4,5,Astan C. Traore1,6, Antonios Avgoustinos1, Andrew G. Parker1, Issa Sidibe7, Anicet G. Ouedraogo8, Amadou Traore9,Bale Bayala3, Marc J. B. Vreysen1, Kostas Bourtzis1 and Adly m. M. Abd-Alla1*
Abstract
Background: Tsetse flies are vectors of African trypanosomes, protozoan parasites that cause sleeping sickness(or human African trypanosomosis) in humans and nagana (or animal African trypanosomosis) in livestock. In additionto trypanosomes, four symbiotic bacteria Wigglesworthia glossinidia, Sodalis glossinidius, Wolbachia, Spiroplasma andone pathogen, the salivary gland hypertrophy virus (SGHV), have been reported in different tsetse species.We evaluated the prevalence and coinfection dynamics between Wolbachia, trypanosomes, and SGHV in four tsetsespecies (Glossina palpalis gambiensis, G. tachinoides, G. morsitans submorsitans, and G. medicorum) that were collectedbetween 2008 and 2015 from 46 geographical locations in West Africa, i.e. Burkina Faso, Mali, Ghana, Guinea, and Senegal.
Results: The results indicated an overall low prevalence of SGHV and Wolbachia and a high prevalence of trypanosomesin the sampled wild tsetse populations. The prevalence of all three infections varied among tsetse species and sampleorigin. The highest trypanosome prevalence was found in Glossina tachinoides (61.1%) from Ghana and in Glossina palpalisgambiensis (43.7%) from Senegal. The trypanosome prevalence in the four species from Burkina Faso was lower, i.e. 39.6%in Glossina medicorum, 18.08%; in Glossina morsitans submorsitans, 16.8%; in Glossina tachinoides and 10.5% in Glossinapalpalis gambiensis. The trypanosome prevalence in Glossina palpalis gambiensis was lowest in Mali (6.9%) and Guinea(2.2%). The prevalence of SGHV and Wolbachia was very low irrespective of location or tsetse species with an average of1.7% for SGHV and 1.0% for Wolbachia. In some cases, mixed infections with different trypanosome species weredetected. The highest prevalence of coinfection was Trypanosoma vivax and other Trypanosoma species (9.5%)followed by coinfection of T. congolense with other trypanosomes (7.5%). The prevalence of coinfection of T. vivaxand T. congolense was (1.0%) and no mixed infection of trypanosomes, SGHV and Wolbachia was detected.
Conclusion: The results indicated a high rate of trypanosome infection in tsetse wild populations in West Africancountries but lower infection rate of both Wolbachia and SGHV. Double or triple mixed trypanosome infectionswere found. In addition, mixed trypanosome and SGHV infections existed however no mixed infections of trypanosomeand/or SGHV with Wolbachia were found.
Keywords: Glossina spp., Trypanosoma spp., Wolbachia spp., SGHV, Microbe infection rate, Interactions
* Correspondence: [email protected]†Gisele M S Ouedraogo and Güler Demirbas-Uzel contributed equally to this work.1Insect Pest Control Laboratory, Joint FAO/IAEA Programme of NuclearTechniques in Food and Agriculture, International Atomic Energy Agency,P.O. Box 100, A-1400 Vienna, AustriaFull list of author information is available at the end of the article
© International Atomic Energy Agency; licensee BioMed Central Ltd. 2018 This is an open access article distributed under theterms of the Creative Commons Attribution IGO License https://creativecommons.org/licenses/by/3.0/igo/) which permitsunrestricted use, distribution, and reproduction in any medium, provided appropriate credit to the original author(s) and thesource is given.
Ouedraogo et al. BMC Microbiology 2018, 18(Suppl 1):153https://doi.org/10.1186/s12866-018-1287-4

BackgroundTsetse flies (Glossina sp.) are obligate blood feedinginsects that transmit protozoan parasites (Trypanosomaspp.), the etiological agents of African trypanosomosis thatcause sleeping sickness or human African trypanosomosis,(HAT) and nagana or animal African trypanosomosis,(AAT) in livestock [1, 2]. Both diseases cause many directand indirect losses, which represent a major obstacle forsustainable development in endemic countries [3].Trypanosomosis is enzootic in an area covering ca. 10
million km2 in sub-Saharan Africa and is transmitted bydifferent species of tsetse flies that vary in their vectorialcapacity for the different Trypanosoma species [2]. InWest Africa, HAT is caused by Trypanosoma bruceigambiense, that accounts for over 90% of the globallyreported HAT cases [4] and is mainly transmitted by tse-tse flies from the palpalis group (Glossina tachinoides,G. palpalis gambiensis and G. p. palpalis) [5]. The AATcausative agents (Trypanosoma vivax, T. congolense, T.brucei brucei and T. evansi) are transmitted by a broaderrange of tsetse fly species which include, in addition tothe above-mentioned palpalis group, also flies from themorsitans group (G. morsitans submorsitans and G.longipalpis) [6, 7]. There are 11 different pathogenictrypanosomes that can be characterized by molecularmethods using specific or common primers [6–8].Due to the lack of effective vaccines and inexpensive
drugs for HAT and also the development of resistance ofthe AAT parasites against available trypanocidal drugs [9],vector control remains the most efficient strategy for thesustainable management of these diseases [10]. The sterileinsect technique (SIT) is one control tactic that may beused as part of an area-wide integrated pest management(AW-IPM) program against tsetse fly populations [11, 12].The SIT was successfully used as part of an AW-IPM
strategy to sustainably eradicate a population of G. aus-teni from the Island of Unguja, Zanzibar in the 1990’s[13] and allowed the eradication of tsetse flies from theagro-pastoral land in Sidéradougou, Burkina Faso and inJos, Nigeria [14, 15]. The latter two programmes werehowever not sustainable, as they were not implementedfollowing AW-IPM principles, and hence suffered fromre-invasion of wild flies from neighbouring areas.The integration of the SIT in AW-IPM strategies to
manage populations of tsetse flies requires the produc-tion of large numbers of high quality sterile males thatare released in the target area to compete with wildmales for matings with wild females of the targetedspecies. The mass production of the required males willdepend on the successful establishment and mainten-ance of a large, healthy colony of the targeted species inlarge production facilities. In some tsetse species such asGlossina pallidipes, colonies that are infected with ahytrosavirus, the salivary gland hypertrophy virus
(SGHV), suffer from low male and female fertility whichmakes the maintenance of these colonies very difficult oreven impossible [16–18]. This obviously hampers the im-plementation of AW-IPM programmes that have an SITcomponent. Tsetse colonies of species that are susceptibleto the negative effects of the SGHV require the implemen-tation of some measurements to manage the virus infec-tion to enable colony maintenance and growth [19, 20].The successful establishment of a large colony of G.
pallidipes will not only depend on the virus infectionbut can also be affected by the tsetse associated symbi-otic bacteria. Tsetse flies harbour four main symbioticbacteria: (i) Wigglesworthia glossinidia, an obligate sym-biotic bacterium that is present in all tsetse species. Itsremoval from a tsetse fly using antibiotic supplements inthe tsetse’s diet results in the loss of fertility [21–23], (ii)The commensal Sodalis glossinidius, present in allindividuals of laboratory-maintained tsetse lines but notabundant in natural populations. It has been detected inthe haemolymph, salivary glands and milk gland of thetsetse fly but also in the midgut where it lives in closeproximity with trypanosomes [24–26], (iii) Wolbachia,which is an obligate intracellular and maternally transmit-ted alpha-proteobacterium that infects many arthropodand filarial nematode species [27, 28]. Wolbachia is re-sponsible for the induction of a number of reproductivealterations and cytoplasmic incompatibility (CI) [27, 28].Wolbachia infections occur in some tsetse fly species,both in the laboratory and in nature. Available data indi-cate that Wolbachia infections were heterogeneous in thefield, ranging from 0 to 100% in natural populations of G.austeni and G. brevipalpis and from 9.5 to 100% in naturalpopulations of G. m. morsitans [29]. It has been reportedthat the presence of Wolbachia is associated with reducedprevalence of infections with pathogenic viruses and Plas-modium [30–40]. Therefore, the presence of Wolbachia intsetse species might also reduce trypanosome and SGHVinfections and transmission, and (iv) Spiroplasma that wasrecently detected in G. fuscipes and G. tachnoides but itsimpact on tsetse fly performance remains unclear [41].In support of the potential development of sustainable
AW-IPM strategies that might include an SIT componentagainst tsetse species in West Africa, we assessed the preva-lence of trypanosomes, SGHV and Wolbachia in a largenumber of wild specimens from five countries as well asthe potential interactions among these three microbes.
MethodsSampling tsetseAdult tsetse flies of G. palpalis gambiensis, G.tachinoides, G. morsitans submorsitans, and G.medicorum were collected between 2008 and 2015 in 46geographical locations from five countries in WestAfrica (Burkina Faso, Guinea, Ghana, Mali, Senegal)
Ouedraogo et al. BMC Microbiology 2018, 18(Suppl 1):153 Page 94 of 292

(Tables 1 and 2). The flies were collected using the biconi-cal Challier-Laveissière trap [42] and the monoconicalVavoua trap [43, 44] set as previously described [45]. Onaverage, 20 traps were deployed per location to collect aminimum of 10 adult flies per location that were sorted byspecies and sex [46]. Collected flies were preserved in 95%ethanol, labeled and shipped to the FAO/IAEA Insect PestControl Laboratory (IPCL) in Seibersdorf, Austria wherethey were stored at − 20 °C until further use. Species sta-tus was confirmed using molecular identification tools in-cluding internal transcribed spacers (ITS), mitochondrialDNA cytochrome oxidase subunit 1 and microsatellites(Augustinos 2018 this special issue).
DNA extractionThe flies were removed from ethanol and rehydrated indistilled water. The wings and legs were removed forother studies. The total DNA was extracted from theremaining fly body using the DNeasy tissue kit (QIA-GEN Inc., Valencia, CA) following the supplier’s instruc-tions and was eluted in 200 μl elution buffer. All theextracted DNA samples from these locations were testedfor a tsetse-specific sequence to confirm the quality.
PCR amplification and prevalence analysisSGHV prevalencePolymerase chain reactions (PCR) were used to amplifythe partial coding regions of two conserved putativeORFs, odv-e66 and dnapol (GenBank accession numbers:EF568108) using Glossina pallidipes Salivary HypertrophyVirus (GpSGHV)-specific primers [47]. These primerswere used in a multiplex PCR, and all the samplesincluded a set of specific primers amplifying the G.pallidipes microsatellite GpCAG133 sequence to controlthe quality of the extracted DNA [48]. For all PCR amplifi-cations, 22.5 μl of 1.1× Pre-Aliquoted PCR Master Mix(ABgene, UK) was used. A final volume of 25 μl of thismix contained: 0.625 units Thermoprime Plus DNAPolymerase, 75 mM Tris–HCl (pH 8.8 at 25 °C), 20 mM(NH4)2SO4, 2.0 mM MgCl2, 0.01% (v/v) Tween-20 and
0.2 mM each of the dNTPs. To the mix, 1.5 μl of templateDNA plus forward and reverse primers were added to afinal concentration of 0.2 mM per primer. Samples wereconsidered virus-infected if any of the expected viral PCRproduct amplicons were detected. Data were acceptedonly if the control gene GpCAG133 sequence wasamplified.
Trypanosome prevalence and genotypingFor trypanosome detection, PCR was used according toNjiru et al., [8], using trypanosome specific primers toamplify the internal transcribed spacer 1 (ITS-1). PCRconditions were: 25 μl volume containing 12.5 μl of TaqPCR Master Mix kit (Qiagen) (with 0.8 Units of TaqDNA polymerase, 1.5 mM MgCl2, 200 μM dNTP),0.8 μM each of the ITS-1 forward (5’-CCGGAAGTTCACCGATATTG-3′) and reverse (5’-TGCTGC GTTCTTCAACGAA- 3′) primers (VBC, Biotech, Austria),9 μl of sterile water and 2.5 μl of genomic DNA. Cyclingconditions were: 94 °C for 15 min, 94 °C for 30 s, 60 °Cfor 30s, 72 °C for 30s, 40 cycles following by 72 °C for5 min; PCR products were detected by agarose (2%) gelelectrophoresis and ethidium bromide staining. Thesample was considered infected with trypanosome bydetecting single, double or triple bands ranging from200 bp to 700 bp (see below). DNA from T. congolensesavannah was used as positive control which gives aPCR amplicon of 650 bp.To have better specific and sub-specific identification
of the detected trypanosomes, positive samples from thefirst screen were amplified with ITS-1 forward (5’-TGTAGGTGAACCTGCAGCTGGATC-3′) and ITS-1 reverse(5’-CCAAGTCATCCATCGCGACACGTT- 3′) primersfollowing Fikru et al. [49]. The detection of different try-panosomes was based on the length of the amplicon, i.e.,T. vivax (200 bp), T. equiperdum, T. evansi and T. brucei(350 bp), T. theileri (450 bp) and T. congolense savannahtype (650 bp). DNA from T. congolense savannah type, T.vivax, T. theileri, T. brucei gambiense, T. brucei rhodesiense,T. brucei brucei, T. evansi and T. equiperdum provided byDr. Stijn Deborggraeve were used as positive control.
Wolbachia prevalencePCR reaction with Wolbachia specific primers was usedto screen the DNA of the wild tsetse flies for the presenceof Wolbachia. The detection was based on the Wolbachia16S rRNA gene and results in the amplification of a 438base-pair long DNA fragment with the Wolbachia specificprimers wspecF and wspecR [29]. The PCR conditionsused were as described above for the trypanosomedetection and the cycling conditions were: 94 °C for2 min, 94 °C for 30 s, 55 °C for 30s, 72 °C for 30s, 36 cyclesfollowing by 72 °C for 5 min. As a positive control forWolbachia, DNA extracted from the Mediterranean fruit
Table 1 List of collections of tsetse adults that were analyzed toestablish the prevalence of Trypanosomes, Wolbachia and Salivarygland hypertrophy virus (SGHV) in wild tsetse populations in WestAfrican countries
Country No. oflocations
No. ofcollected flies
Collection year
Burkina Faso 10 2062 2008, 2010, 2013, 2015
Mali 10 364 2008, 2010, 2011, 2012, 2013
Senegal 7 128 2008
Ghana 11 234 2008
Guinea 8 314 2008, 2009
Total 46 3102
Ouedraogo et al. BMC Microbiology 2018, 18(Suppl 1):153 Page 95 of 292

Table 2 Geographic coordinates of tsetse collected samples
Glossina species Country (area) Longitude Latitude
G. tachinoides Burkina Faso (Folonzo) − 4.60801757 9.92967851
Burkina Faso (Sissili) −2.098178 11.09447
Burkina Faso (Comoe) − 4.58976269 9.89106718
Burkina Faso (Arly) −1.289104 11.612917
Ghana (Bougouhiba) −0,719,172,226 10,23,885,694
Ghana (Walewale) −0.79846 10.351613
Ghana (Mortani) −0,714,119,074 10,23,479,058
Ghana (Fumbissi) −1,386,834,989 10,47,282,856
Ghana (Sissili Bridge) −1,319,208,122 10,33,035,865
Ghana (Grogro) −1.883133222 10.08224767
Ghana(Kumpole) −1,270,183,374 10,25,432,141
Ghana (Nabogo) −0,979,001,606 9,692,628,234
Ghana (Psikpé) −1,081506423 10,44,471,897
G. palpalis gambiensis Burkina Faso (Kénédougou) −4.80305222 10.98166737
Burkina Faso (Moussodougou) −4.95 10.833333
Burkina Faso (Folonzo) −4.60801757 9.92967851
Burkina Faso (Comoé) −4.58976269 9.89106718
Burkina Faso (Kartasso) −5.253033 11.141786
Burkina Faso (Bama) −4.4 12.033333
Sénégal (Tambacounda) −13.667222 13.7768889
Sénégal (Fleuve Gambi) −13,23,552,282 13,02433926
Sénégal (Mako) −13,27,338,336 12,85,430,818
Sénégal (Niokolo) −13,16,964,933 13,06555831
Sénégal (Fleuève Gambi) −12,35,811,122 12,84,670,702
Sénégal (Diaguiri) −12,09137828 12,62,932,251
Sénégal (Moussalla) −17,37,981,432 12,9,297,035
Mali (Baoule) −8.62 12.88
Mali (Banko) −6.516667 12.1
Mali (Siby) −8.32664 12.377685
Mali (Système Sénégal) −11.103663 13.416551
Mali (Système Niger) −4.201945 14.466284
Mali (Bani) −4,202,017 14,466,353
Mali (Bougouni) −7.483333 11.416667
Mali (Sikasso) −5.666667 11.316667
Mali (Kita) −9.484723 13.04114
Mali (Baguineda) −7.776667 12.615278”
Guinea (Kangoliya) −13.65584 9.96084
Guinea (Dekonkore) −10.016667 9.85
Guinea (Bafing) −7.524724 8.325205
Guinea (Lemonako) −11.566667 11.733333
Guinea (Kerfala) −9.461194 11.343966
Guinea (Mimi) −9.053083 10.400434
Ouedraogo et al. BMC Microbiology 2018, 18(Suppl 1):153 Page 96 of 292
fly, Ceratitis capitata strain S 10.3 was used. This strain istransinfected with the wCer4 Wolbachia strain of Rhagole-tis cerasi [50].
Data analysisThe data were analyzed with the software package R,using a generalized linear model (GLM) with the pack-age stat [51]. Trypanosome, virus and Wolbachia preva-lence in tsetse were respectively considered as responsevariables, while tsetse species, sex, countries and theirinteractions were used as explicative variables. The bestmodel was selected on the basis of the lowest correctedAkaike information criterion (AICc), and the significanceof fixed effects was tested using the likelihood test ratio[52, 53]. Then, for each country, GLM were used to as-sess differences in trypanosome, virus and Wolbachiaprevalence between localities and species. Trypanosomeprevalence was compared between species by a pairwisecomparison of proportions with a Bonferroni correction(package stats). Correlations between the prevalence oftrypanosome species, salivary gland hypertrophy virus andWolbachia were tested using the “rcorr” function of theHmisc (Harrel miscellaneous package version 4.03, 2017).
ResultsGlobal trypanosome prevalenceThe trypanosome prevalence varied significantly fromone country to another and from one species to another.Overall, 18.4% of the examined tsetse flies (n = 3102)were positive for trypanosomes, irrespective of tsetse
species or country (Table 3). Trypanosomes weredetected in G. tachinoides in Burkina Faso and Ghana;G. p. gambiensis in Burkina Faso, Guinea, Mali, andSenegal; G. m. submorsitans and G. medicorum in theComoé forest in the south of Burkina Faso at the borderwith Côte d’Ivoire. The best model (lowest AICc) se-lected for the overall trypanosome prevalence retainedthe tsetse species and countries as variables that fittedwell the data with no interaction. For tsetse species, G.medicorum (only caught in Folonzo village, and a pro-tected area belonging to the village in Southern BurkinaFaso) had the highest mean infection rate of 39.6%(Fig. 1A), which was significantly higher than the meaninfection rate in G. p. gambiensis (P < 0.001). The meantrypanosome infection rate in G. tachinoides was alsosignificantly higher as compared with G. m. submorsi-tans (P = 0.008; Fig. 1A; Additional file 1).Trypanosome prevalence by country was low in
Guinea (2.2%) and Mali (6.9%) but high in Senegal(43.7%) and Ghana (61.1%) (Table 3). The result showedno significant difference between the trypanosomeprevalence in Burkina Faso, Guinea and Mali but theprevalence of these three countries was significantly dif-ferent from that of Senegal and Ghana (P < 0.05) (Fig. 1Band Additional file 1). The sex effect was not retained inthe model highlighting no difference in the meanprevalence of male and female flies. All G. tachinoidesflies collected from Fumbissi (n = 15), Grogro (n = 11),Kumpole (n = 7), Psikpé (n = 2) and Sissili Bridge (n = 6)in Ghana were infected with trypanosomes, and theoverall prevalence in seven out of nine locations was
Table 2 Geographic coordinates of tsetse collected samples (Continued)
Glossina species Country (area) Longitude Latitude
G. morsitans submorsitans Burkina Faso (Folonzo) −4.60801757 9.92967851
Burkina Faso (Sissili) −2.098178 11.09447
Burkina Faso (Comoe) −4.58976269 9.89106718
G. medicorum Burkina Faso (Comoe) −4.58976269 9.89106718
Burkina Faso (Folonzo) −4.60801757 9.92967851
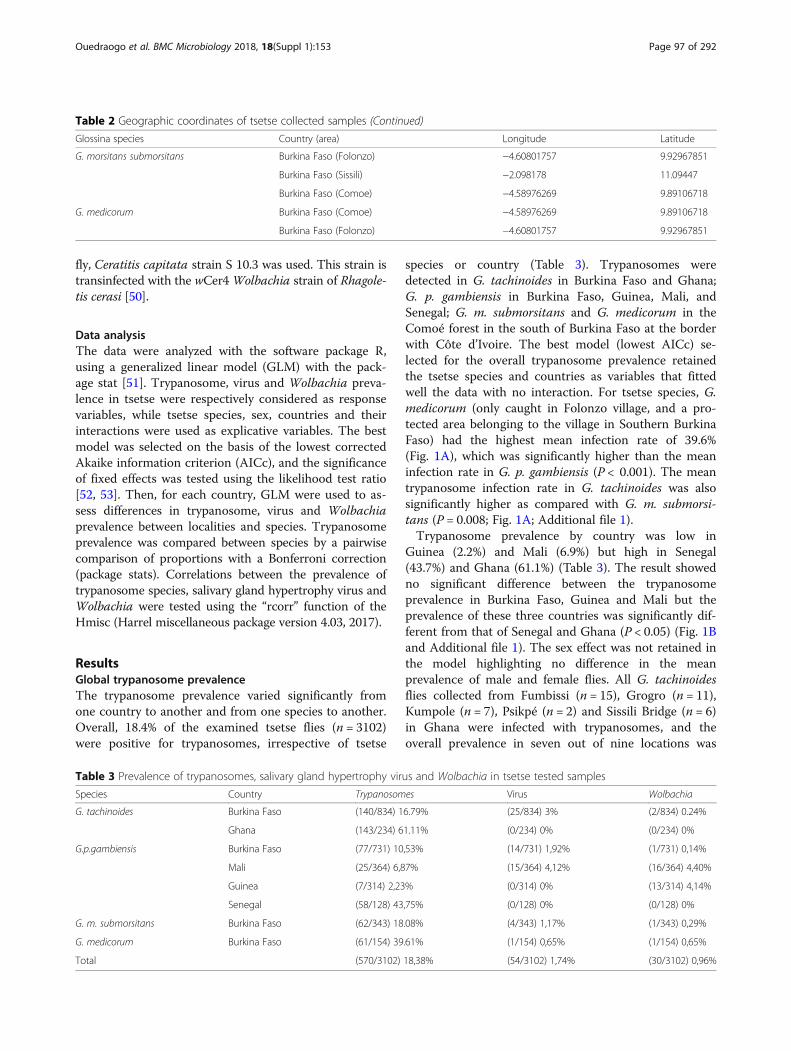
Table 3 Prevalence of trypanosomes, salivary gland hypertrophy virus and Wolbachia in tsetse tested samples
Species Country Trypanosomes Virus Wolbachia
G. tachinoides Burkina Faso (140/834) 16.79% (25/834) 3% (2/834) 0.24%
Ghana (143/234) 61.11% (0/234) 0% (0/234) 0%
G.p.gambiensis Burkina Faso (77/731) 10,53% (14/731) 1,92% (1/731) 0,14%
Mali (25/364) 6,87% (15/364) 4,12% (16/364) 4,40%
Guinea (7/314) 2,23% (0/314) 0% (13/314) 4,14%
Senegal (58/128) 43,75% (0/128) 0% (0/128) 0%
G. m. submorsitans Burkina Faso (62/343) 18.08% (4/343) 1,17% (1/343) 0,29%
G. medicorum Burkina Faso (61/154) 39.61% (1/154) 0,65% (1/154) 0,65%
Total (570/3102) 18,38% (54/3102) 1,74% (30/3102) 0,96%
Ouedraogo et al. BMC Microbiology 2018, 18(Suppl 1):153 Page 97 of 292

relatively > 53% (Table 4). Trypanosome prevalence inthe other tsetse species fluctuated greatly with location,i.e., from 0% in the G. p. gambiensis flies collected inComoé, Kenedougou and Bama to 34.5% in Moussodougouin Burkina Faso (Table 5). A similar trend was found in G.p. gambiensis flies collected in Mali and Guinea.
Prevalence of different trypanosome species in wildpopulations of tsetse in Western AfricaThe results indicate that tsetse flies in West Africa couldbe infected with different species of trypanosomes insingle or multiple infections. For T. vivax prevalence thebest model retained countries as variable that fitted wellthe data indicating that the prevalence of T. vivax alone,did not differ significantly among tsetse fly species and
Fig. 1 Global prevalence of trypanosomes according to tsetse species (A) and country (B). Boxes extend between the 25th and 75th percentile.A thick line denotes the median. The whiskers extend up to the most extreme values. Gmed: Glossina medicorum, Gmsm: G. morsitans submositans,Gpg: G. palpalis gambiensis and Gt: G. tachinoides. Different letters indicate significant difference. Different letters indicate significant difference
Table 4 Trypanosome prevalence in natural populations ofGlossina tachinoides collected from Ghana
Location Sample size Prevalence
Bougouhiya 19 (3/19) 15.78%
Fumbissi 15 (15/15) 100%
Grogro 11 (11/11) 100%
Kumpole 7 (7/7) 100%
Mortani 41 (22/41) 53.65%
Nabogo 2 (0/2) 0%
Psikpé 2 (2/2) 100%
Sissili Bridge 6 (6/6) 100%
Walewale 131 (77/131) 58.77%
Total 234 (143/234) 61.11%
Ouedraogo et al. BMC Microbiology 2018, 18(Suppl 1):153 Page 98 of 292

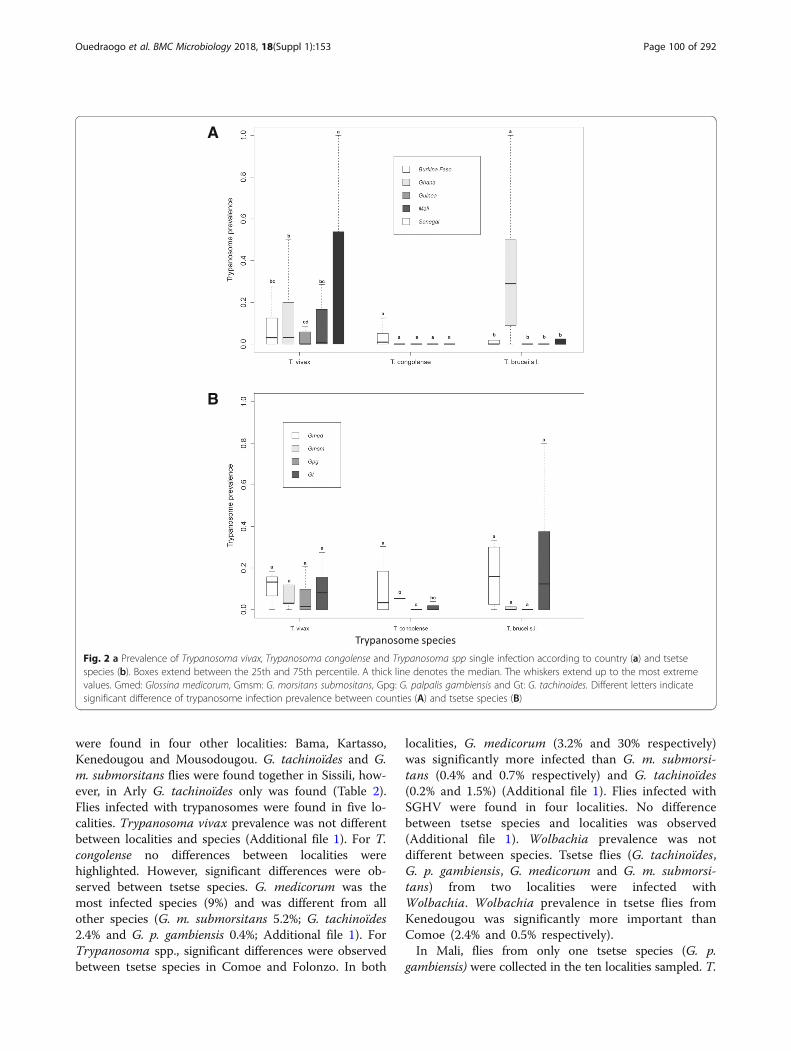
sex (Additional file 1) but the mean infection rate of T.vivax in Senegal was significantly higher as compared toother countries (P < 0.05), also the prevalence in Ghanawas significantly higher as compared to Guinea(P = 0.030; Fig. 2; Additional file 1).GLM results for single infections with T. congolense
selected for species as variable that fitted well the dataindicated that the prevalence of T. congolense alone did notdiffer significantly among countries and sex (Fig. 2).The T. congolense infection rate in G. medicorum wassignificantly higher as compared to G. tachinoides, G.p. gambiensis and G. m. submorsitans (P < 0.05);Additional file 1). T. congolense infection rate in G. p.gambiensis was significantly lower as compared to G.m. submorsitans (Fig. 2B; Additional file 1).Non-specific detection of Trypanosoma spp. (Tz)
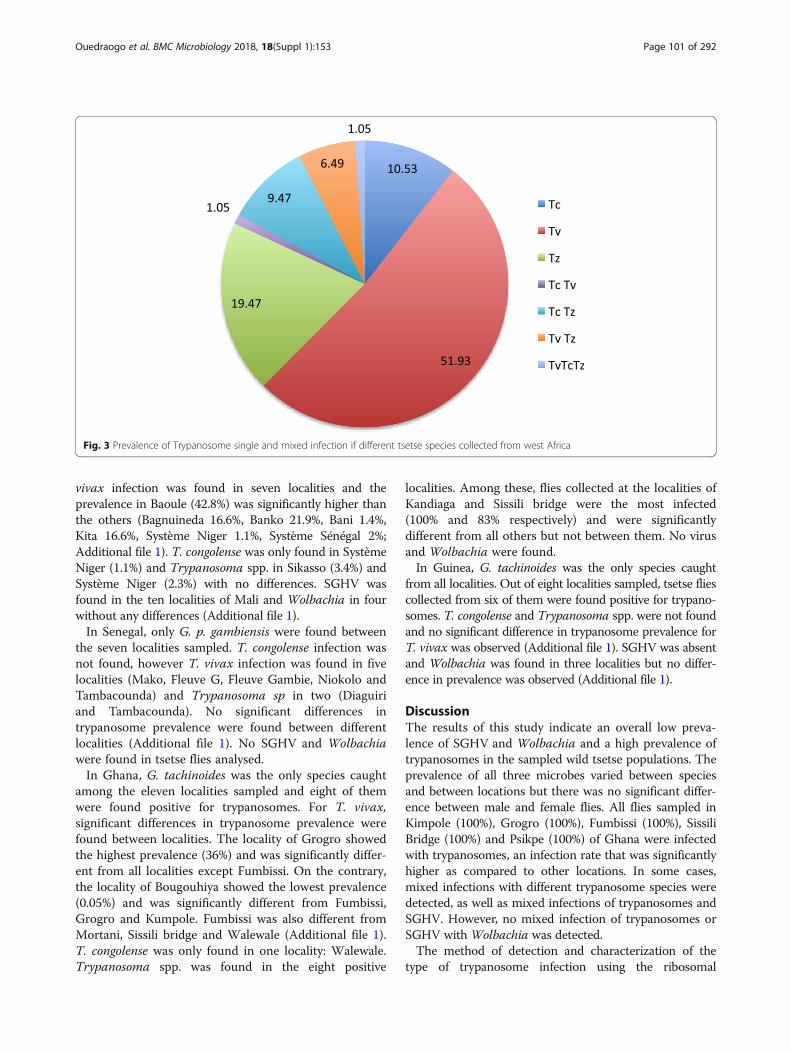
(including T. brucei, T. evansi, T. equiperdum and T.theileri) based on the primer detection was recordedin 19.4% of the samples (Fig. 3). Results modelselected for countries as variable that fitted well thedata indicating that the prevalence of Trypanosomaspp. did not differ significantly among countries andsex. The Trypanosoma spp. prevalence in Ghana wassignificantly higher than the other countries (P < 0.001;Fig. 4A; Additional file 1).Analysis of the data with the well fitted model indi-
cated that the coinfection of T. congolense with T. vivaxdid not differ between countries and sex. However, T.congolense and T. vivax coinfection was significantlyhigher in G. medicorum (1.1%) as compared with the othertsetse species (P = 0.001; Fig. 4B; Additional file 1). Thecoinfection rate of T. vivax and other Trypanosoma spp inGhana was significantly higher than all other countries(P < 0.01, Fig. 4A; Additional file 1). Analysis of coinfec-tion of T. congolense and other Trypanosoma spp (7.5%)indicated that the infection rate in Ghana was signifi-cantly higher than Burkina Faso (P < 0.01, Fig. 4A;Additional file 1).Analysis of triple infection of T. vivax, T. congolense
with other Trypanosoma spp selected for species asvariable that fitted well the data indicating that the
prevalence of Trypanosoma spp. did not differ signifi-cantly among countries and sex. The infection rate in G.medicorum (1.1%) was significantly higher than in theother tsetse species (0%) (P < 0.001; Additional file 1).
SGHV prevalenceBased on the PCR screen used in the present study, theaverage prevalence of SGHV in all collected flies was1.7% (n = 54) (Table 2). The prevalence varied from 0%in G. tachinoides samples from Ghana and G. p.gambiensis samples from Senegal and Guinea to 4.1% inG. p. gambiensis flies from Mali (Fig. 5). The resultindicated that the SGHV prevalence did not differsignificantly among species and sex. However, the virusprevalence was significantly higher in Mali comparedwith the other countries (P = 0.001; Additional file 1).
Prevalence of WolbachiaThe prevalence of Wolbachia was low in all testedspecies and averaged at 1.0% (Table 3). The prevalencedid not differ significantly among species and sex. TheWolbachia prevalence in Mali was significantly higher ascompared to Senegal, Ghana and Burkina Faso (P < 0.05;Additional file 1). No other significant difference wasobserved (Fig. 4).
Mixed infection of trypanosomes, SGHV and WolbachiaThe prevalence data indicate that the mean trypanosomeinfection rate was higher as compared with the preva-lence of the SGHV and Wolbachia. Most of the flies(99.94%) that were infected with trypanosomes werenegative for Wolbachia. In G. tachinoides and G. m.submorsitans, double infection with SGHV and trypano-somes was observed at a low prevalence, i. e. 0.5% and0.4% respectively. No double infection of SGHV andtrypanosome was detected in G. p. gambiensis. TheTrypanosoma spp. infection rate was significantlypositively correlated with that of the virus (P < 0.001),although the correlation was weak (r = 0.45). No sig-nificant correlation was observed between Wolbachiaand SGHV.
Impact of tsetse fly gender on trypanosomes, SGHV andWolbachia prevalenceThere was no significant difference between male andfemale infection by trypanosomes (P = 0.377), SGHV(P = 0.739) or Wolbachia (P = 0.362).
Trypanosomes, SGHV andWolbachia distribution per countriesBurkina Faso showed the highest species diversity withfour tsetse species collected: G. p. gambiensis, G. tachi-noïdes, G. m. submorsitans and G. medicorum. Amongthe ten localities sampled, these four species were foundtogether in Folonzo and Comoe. G. p. gambiensis flies
Table 5 Trypanosome prevalence in natural populations ofGlossina palpalis gambiensis collected from Burkina Faso
Location Sample size Prevalence
Bama 77 (0/77) 0%
Comoé 123 (3/123) 2.43%
Folonzo 237 (27/237) 11.39%
Kartasso 136 (0/136) 0%
Kenedougou 41 (0/41) 0%
Moussodougou 142 (49/142) 34.50%
Total 731 (77/731) 10.53%
Ouedraogo et al. BMC Microbiology 2018, 18(Suppl 1):153 Page 99 of 292
were found in four other localities: Bama, Kartasso,Kenedougou and Mousodougou. G. tachinoïdes and G.m. submorsitans flies were found together in Sissili, how-ever, in Arly G. tachinoïdes only was found (Table 2).Flies infected with trypanosomes were found in five lo-calities. Trypanosoma vivax prevalence was not differentbetween localities and species (Additional file 1). For T.congolense no differences between localities werehighlighted. However, significant differences were ob-served between tsetse species. G. medicorum was themost infected species (9%) and was different from allother species (G. m. submorsitans 5.2%; G. tachinoïdes2.4% and G. p. gambiensis 0.4%; Additional file 1). ForTrypanosoma spp., significant differences were observedbetween tsetse species in Comoe and Folonzo. In both
localities, G. medicorum (3.2% and 30% respectively)was significantly more infected than G. m. submorsi-tans (0.4% and 0.7% respectively) and G. tachinoïdes(0.2% and 1.5%) (Additional file 1). Flies infected withSGHV were found in four localities. No differencebetween tsetse species and localities was observed(Additional file 1). Wolbachia prevalence was notdifferent between species. Tsetse flies (G. tachinoïdes,G. p. gambiensis, G. medicorum and G. m. submorsi-tans) from two localities were infected withWolbachia. Wolbachia prevalence in tsetse flies fromKenedougou was significantly more important thanComoe (2.4% and 0.5% respectively).In Mali, flies from only one tsetse species (G. p.
gambiensis) were collected in the ten localities sampled. T.
A
B
Fig. 2 a Prevalence of Trypanosoma vivax, Trypanosoma congolense and Trypanosoma spp single infection according to country (a) and tsetsespecies (b). Boxes extend between the 25th and 75th percentile. A thick line denotes the median. The whiskers extend up to the most extremevalues. Gmed: Glossina medicorum, Gmsm: G. morsitans submositans, Gpg: G. palpalis gambiensis and Gt: G. tachinoides. Different letters indicatesignificant difference of trypanosome infection prevalence between counties (A) and tsetse species (B)
Ouedraogo et al. BMC Microbiology 2018, 18(Suppl 1):153 Page 100 of 292
vivax infection was found in seven localities and theprevalence in Baoule (42.8%) was significantly higher thanthe others (Bagnuineda 16.6%, Banko 21.9%, Bani 1.4%,Kita 16.6%, Système Niger 1.1%, Système Sénégal 2%;Additional file 1). T. congolense was only found in SystèmeNiger (1.1%) and Trypanosoma spp. in Sikasso (3.4%) andSystème Niger (2.3%) with no differences. SGHV wasfound in the ten localities of Mali and Wolbachia in fourwithout any differences (Additional file 1).In Senegal, only G. p. gambiensis were found between
the seven localities sampled. T. congolense infection wasnot found, however T. vivax infection was found in fivelocalities (Mako, Fleuve G, Fleuve Gambie, Niokolo andTambacounda) and Trypanosoma sp in two (Diaguiriand Tambacounda). No significant differences intrypanosome prevalence were found between differentlocalities (Additional file 1). No SGHV and Wolbachiawere found in tsetse flies analysed.In Ghana, G. tachinoides was the only species caught
among the eleven localities sampled and eight of themwere found positive for trypanosomes. For T. vivax,significant differences in trypanosome prevalence werefound between localities. The locality of Grogro showedthe highest prevalence (36%) and was significantly differ-ent from all localities except Fumbissi. On the contrary,the locality of Bougouhiya showed the lowest prevalence(0.05%) and was significantly different from Fumbissi,Grogro and Kumpole. Fumbissi was also different fromMortani, Sissili bridge and Walewale (Additional file 1).T. congolense was only found in one locality: Walewale.Trypanosoma spp. was found in the eight positive
localities. Among these, flies collected at the localities ofKandiaga and Sissili bridge were the most infected(100% and 83% respectively) and were significantlydifferent from all others but not between them. No virusand Wolbachia were found.In Guinea, G. tachinoides was the only species caught
from all localities. Out of eight localities sampled, tsetse fliescollected from six of them were found positive for trypano-somes. T. congolense and Trypanosoma spp. were not foundand no significant difference in trypanosome prevalence forT. vivax was observed (Additional file 1). SGHV was absentand Wolbachia was found in three localities but no differ-ence in prevalence was observed (Additional file 1).
DiscussionThe results of this study indicate an overall low preva-lence of SGHV and Wolbachia and a high prevalence oftrypanosomes in the sampled wild tsetse populations. Theprevalence of all three microbes varied between speciesand between locations but there was no significant differ-ence between male and female flies. All flies sampled inKimpole (100%), Grogro (100%), Fumbissi (100%), SissiliBridge (100%) and Psikpe (100%) of Ghana were infectedwith trypanosomes, an infection rate that was significantlyhigher as compared to other locations. In some cases,mixed infections with different trypanosome species weredetected, as well as mixed infections of trypanosomes andSGHV. However, no mixed infection of trypanosomes orSGHV with Wolbachia was detected.The method of detection and characterization of the
type of trypanosome infection using the ribosomal
Fig. 3 Prevalence of Trypanosome single and mixed infection if different tsetse species collected from west Africa
Ouedraogo et al. BMC Microbiology 2018, 18(Suppl 1):153 Page 101 of 292

internal transcribed spacer (ITS) is known to be sensitiveand it provides quick information about the trypanosometype circulating in the infected area. However, these iden-tified trypanosomes may not be the only ones circulatingwithin the different areas as was observed in Guinea.Other types of trypanosome species may also be circulat-ing but due to the lack of PCR primers cannot be identi-fied [54]. In addition, Pagabeleguem et al. [55] noted thatthe trypanosome infection rate in tsetse flies was alwayshigher by microscopy than PCR and suggested that almosthalf of the flies were infected by trypanosome speciesnon-pathogenic for cattle.
The relatively high frequency of pathogenic trypano-somes in tsetse was previously linked to high AAT preva-lence in cattle, especially in the locality of Folonzo inBurkina Faso [55]. It has therefore been suggested that thedetection of trypanosome infection in tsetse flies mightprovide indirect information about the AAT prevalence inlivestock in the selected area and hence the potential riskof uninfected animals to become infected. This may not beso relevant for HAT as the link between tsetse infectionand disease prevalence is considered to be weak. In Guinea,for example,T. brucei gambiense is the pathogenic trypano-some identified in humans, while no T. brucei gambiense
A
B
Fig. 4 Prevalence of Trypanosome coinfection according to the country (A) and tsetse species (B). Boxes extend between the 25th and 75thpercentile. A thick line denotes the median. The whiskers extend up to the most extreme values. Gmed: Glossina medicorum, Gmsm: G. morsitanssubmositans, Gpg: G. palpalis gambiensis and Gt: G. tachinoides. Tv: Trypanosoma vivax, Tc: Trypanosoma congolensis and Tz: Trypanosoma spp(T. brucei, T. evansi, T. equiperdum and T. theileri). Different letters indicate significant difference of trypanosome mixed infection prevalencebetween counties (A) and tsetse species (B)
Ouedraogo et al. BMC Microbiology 2018, 18(Suppl 1):153 Page 102 of 292

infection has been found in tsetse confirming the usualvery low (0.1%) mature infection rates of T. brucei gam-biense in tsetse, even in active sleeping sickness foci [56].The SGHV was reported in G. p. palpalis in Côte
d’Ivoire in 1978 at a very low prevalence (0.3%) [57].Although the prevalence of SGHV based on flydissection was generaly low in wild tsetse populations(0.5–5%) [58], the prevalence detected by PCR can bevery high (100%) [47]. These results clearly indicate thatthe SGHV prevalence in tsetse species in West Africa issignificantly lower than the SGHV prevalence in G.pallidipes in eastern and southern Africa previouslyreported [47], where the virus prevalence varied from 2to 100%, depending on the location. However, the lowvirus prevalence in West African tsetse populationsmight be underestimated due to the primer specificityand the sensitivity of the PCR, as all primers were basedon the nucleotide sequence of G. pallidipes SGHV. Adifferent virus sequence in other tsetse species in WestAfrica would then result in a lower detection rate. Toovercome this problem, it is suggested to have the entiregenome sequenced of each virus detected in each tsetsespecies to enable the selection of more specific andsensitive primers for virus detection.Wolbachia is known to be present in wild tsetse popula-
tions [29, 59], and using standard PCR assays, it wasdetected in G. m. morsitans, G. m. centralis and G. austenipopulations, but not in G. tachinoides. Using alternativeassays Wolbachia was also detected at low infection ratesin G. fuscipes and G. morsitans subspecies [59, 60]. Theprevalence of Wolbachia in G. p. gambiensis from BurkinaFaso was very low (~ 0.14%) In G. m. morsitans the
prevalence of Wolbachia was higher and varied between10 and 100% depending on the location [51]. In G. f. fus-cipes collected from Uganda, the prevalence of Wolbachiavaried between 26 and 55%, which is higher than theprevalence reported in this study [29]. It is important tonote that in the study of Alam and colleagues the detec-tion method used for screening the Wolbachia infectionwas the sequential PCR method (high sensitivity but lowspecificity). In this study and in the study of Doudoumisand colleagues, a traditional one step PCR was used forthe detection [29, 59] to avoid any non-specific detectionand to detect only high level Wolbachia infections thatmight interfere with the virus and trypanosome infection.We also tried to avoid detecting Wolbachia chromosomalinsertions by using primers specific for active Wolbachiain the cytoplasm [29, 61]. Presence of extensive Wolba-chia insertions was discovered in the genome of its hostG. m morsitans [61]. The low prevalence of Wolbachiadetected in wild tsetse populations in this study might bedue to (i) the absence of Wolbachia infection, (ii) the lowtiter of Wolbachia infection or (iii) the presence ofanother Wolbachia strain that cannot be detected withthe primers used in this study.Mixed infections of trypanosomes, SGHV and Wolba-
chia have been previously reported [59] and this wasalso the case in our study, although the correlation waslow (r = 0.45; P < 0.001). In the study of Alam et al. [59],the author mentioned the potential negative relationshipbetween Wolbachia and SGHV infection, which was alsoobserved in our study. Trypanosome infection wasfound in flies that were also infected with the SGHVbut no flies that were infected with Wolbachia
a
a
a
bbbbb
b
b
Fig. 5 Prevalence of Salivary gland hypertrophy virus (SGHV) and Wolbachia according to the country (A) and tsetse species (B). Boxes extendbetween the 25th and 75th percentile. A thick line denotes the median. The whiskers extend up to the most extreme values. Gmed: Glossinamedicorum, Gmsm: G. morsitans submositans, Gpg: G. palpalis gambiensis and Gt: G. tachinoides. Different letters indicate significant difference
Ouedraogo et al. BMC Microbiology 2018, 18(Suppl 1):153 Page 103 of 292

showed a trypanosome infection. This suggests thatthe presence of Wolbachia might mediate the presence ofdifferent pathogens and parasites, as previously described[36, 62, 63]. Due to the low prevalence of Wolbachia,no possible correlation between the Wolbachiainfection and the trypanosomes and/or SGHV couldbe found. On the other hand, a negative impact oftrypanosome infection on Wolbachia presence cannotbe excluded. However, these antagonistic relationshipsneed further investigation and statistical analysis. Ifthe assumption that Wolbachia might block trypano-some transmission is correct, these novel insightscould be useful for the development and implementationof sterile insect technique-based population control strat-egies, e.g. releasing Wolbachia-infected males that bothinduce cytoplasmic incompatibility when mated with wildWolbachia–free females and being refractory for trypano-some infection and transmission in a way similar to thatrecently developed for mosquitoes [64–67].
ConclusionThe results of this study indicate a high rate oftrypanosome infection in tsetse wild populations butlower infection rate of both Wolbachia and SGHV.Mixed infections with different trypanosome speciesor trypanosome with SGHV were found. The highrate of trypanosome infection in tsetse populationsmight be used as an indicator of the presence oftrypanosomiosis in both human and animal bydetermining the different trypanosomes circulation inthe targeted area. The low prevalence of Wolbachiain tsetse flies in West Africa and the lack of mixedinfection of Trypanosoma spp., and Wolbachia, whichmight indicate an antagonistic relationship, requirefurther investigation. The low prevalence of SGHV inthe field population is encouraging for SIT pro-grammes as it might exclude the SGHV outbreaks intsetse mass-rearing established from such low infectedpopulations; however, it encourages the implementa-tion of the virus management strategies to controlthe virus infection to avoid such problem.
Additional file
Additional file 1: Generalized linear model (GLM) fixed effect statisticalresults. (DOC 269 kb)
AbbreviationsAAT: Animal African trypanosomosis; AICc: Akaike information criterion; AW-IPC: Area-wide integrated pest management programs; GpSGHV: Glossinapallidipes salivary gland hypertrophy virus; HAT: Human African trypanosomosis;IPCL: Insect Pest Control Laboratory; ITS: Internal transcribed spacers;PBS: Phosphate Buffer Saline; qPCR: Quantitative polymerase chain reaction;SGHV: Salivary gland hypertrophy virus; SIT: Sterile Insect Technique;T: Trypanosoma
AcknowledgementsWe thank Dr. Stijn Deborggraeve and Dr. Jan van den Abbeele fromthe Institute of Tropical Medicine, Antwerp, Belgium for providingreference trypanosome DNA. We thank Abdul Hasim Mohammed,Edgardo Lapiz, Henry Adun and Carmen Marin for their technicalassistance, the field teams that helped in the tsetse sampling withinthe different countries.
FundingThis work and the publication fees were funded by the Joint FAO/IAEADivision of Nuclear Techniques in Food and Agriculture, IAEA (CRP No.:D4.20.15 and Technical cooperation Project (BKF 5070) fundingfellowship BKF 16016) Vienna, Austria.
Availability of data and materialsMaterials described in the manuscript, including all relevant raw data, areavailable in this link https://dataverse.harvard.edu/dataset.xhtml?persistentId=doi:10.7910/DVN/X38X5B.
About this supplementThis article has been published as part of BMC Microbiology Volume 18Supplement 1, 2018: Enhancing Vector Refractoriness to Trypanosome Infection.The full contents of the supplement are available online at https://bmcmicrobiol.biomedcentral.com/articles/supplements/volume-18-supplement-1.
Authors’ contributionsAMMA, AGP, BB, TA, SI, OAG: designed and supervised the research.OGMS, GDU, AA, AGP, AMMA: conducted the experiments. GG, OGMS,AGP, collected and analyzed data and prepared the figures. OGMS, ATC,PT, AGP, RJB: Provided live material for experiments. OGMS, GDU, AGP,MJBV, BK, RJB, GG, BB, TA, SI: participated in the writing of themanuscript. All authors have read and agreed to its content and thatthe manuscript conforms to the journal’s policies. All authors have readand agreed on the final version on the manuscript.
Ethics approval and consent to participateNot applicable.
Consent for publicationNot applicable.
Competing interestsThe authors declare that they have no competing interests.
Publisher’s NoteSpringer Nature remains neutral with regard to jurisdictional claims in publishedmaps and institutional affiliations.
Author details1Insect Pest Control Laboratory, Joint FAO/IAEA Programme of NuclearTechniques in Food and Agriculture, International Atomic Energy Agency,P.O. Box 100, A-1400 Vienna, Austria. 2Ecole National de l’Elevage et de laSanté Animale, 03 BP 7026, Ouagadougou 03, Burkina Faso. 3UniversitéOuaga 1 Professeur Joseph Ki-Zerbo, BP 7021, Ouagadougou 01, BurkinaFaso. 4Centre International de Recherche-Développement sur l’Elevage enzone Subhumide (CIRDES), 01 BP 454, Bobo-Dioulasso 01, Burkina Faso.5CIRAD, UMR INTERTRYP, F-34398 Montpellier, France. 6Pan African Tsetseand Trypanosomosis Eradication Campaign (PATTEC), Bamako, Mali. 7PanAfrican Tsetse and Trypanosomosis Eradication Campaign (PATTEC), Projet deCréation de Zones Libérées Durablement de Tsé-tsé et de Trypanosomoses(PCZLD), Bobo-Dioulasso, Burkina Faso. 8Institut du Développement Rural,Université Polytechnique de Bobo-Dioulasso, Bobo-Dioulasso, Burkina Faso.9Institut de l’Environnement et des Recherches Agricoles (INERA), BP 8635Ouagadougou 04, Burkina Faso.
Ouedraogo et al. BMC Microbiology 2018, 18(Suppl 1):153 Page 104 of 292
Published: 23 November 2018
References1. Steelman CD. Effects of external and internal arthropod parasites on
domestic livestock production. Annu Rev Entomol. 1976;21:155–78.2. WHO. Report of the Scientific Working Group meeting on African
trypanosomiasis, Geneva, 4–8 June, 2001. Geneva: World HealthOrganization; 2003.
3. Jordan AM. Trypanosomiasis control and African rural development.London: Longman; 1986.
4. Simarro PP, Jannin J, Cattand P. Eliminating human African trypanosomiasis:where do we stand and what comes next? PLoS Med. 2008;5:e55.
5. Solano P, Jamonneau V, N'guessan P, N'dri L, Dje NN, Miezan TW, Lejon V,Büscher P, Garcia A. Comparison of different DNA preparation protocols forPCR diagnosis of human African trypanosomosis in cote d'Ivoire. Acta Trop.2002;82:349–56.
6. Nakayima J, Nakao R, Alhassan A, Mahama C, Afakye K, Sugimoto C.Molecular epidemiological studies on animal trypanosomiases in Ghana.Parasit Vectors. 2012;5:217.
7. Takeet MI, Fagbemi BO, De DM, Yakubu A, Rodulfo HE, Peters SO, Wheto M,Imumorin IG. Molecular survey of pathogenic trypanosomes in naturallyinfected Nigerian cattle. Res Vet Sci. 2013;94:555–61.
8. Njiru ZK, Constantine CC, Guya S, Crowther J, Kiragu JM, Thompson RCA,Davila AMR. The use of ITS1 rDNA PCR in detecting pathogenic Africantrypanosomes. Parasitology. 2005;95:186–92.
9. Aksoy S, Rio RVM. Interactions among multiple genomes: tsetse, itssymbionts and trypanosomes. Insect Biochem Mol Biol. 2005;35:691–8.
10. Leak SGA. Tsetse biology and ecology: their role in the epidemiology andcontrol of trypanosomosis. Wallingford: CABI Publishing; 1998.
11. Klassen W, Curtis CF. History of the sterile insect technique. In: Dyck VA,Hendrichs J, Robinson AS, editors. Sterile Insect Technique: Principles andPractice in Area-Wide Integrated Pest Management. Dordrecht: Springer;2005. p. 1–34.
12. Vreysen MJB, Robinson AS, Hendrichs JP. Area-wide control of insect pests:from research to field implementation. Dordrecht: Springer; 2007.
13. Msangi AR, Saleh KM, Kiwia N, Malele II, Mussa WA, Mramba F, Juma KG, DyckVA, Vreysen MJB, Parker AG, Feldmann U, Zhu Z-R, Pan H. Success in Zanzibar:Eradication of tsetse. In: Tan K-H, editor. Area-wide Control of Fruit Flies andother Insect Pests. Penang: Penerbit Universiti Sains Malaysia; 2000. p. 57–66.
14. Cuisance D, Politzar H, Merot P, Tamboura I. Les lachers de males irradiesdans la campagne de lutte integree contre les glossines dans la zonepastorale de sideradougou (Burkina Faso). Rev Elev Med Vet Pays Trop.1984;37:449–67.
15. Oladunmade MA, Feldmann U, Takken W, Tenabe SO, Hamann HJ,Onah JA, Dengwat L, Van der Vloedt AMV, Gingrich RE. Eradication ofGlossina palpalis palpalis (Robineau-Desvoidy) (Diptera: Glossinidae) fromagropastoral land in Central Nigeria by means of the sterile insecttechnique. In: Sterile insect technique for tsetse control and eradication,STI/PUB/830. Vienna: International Atomic Energy Agency; 1990. p. 5–23.
16. Abd-Alla AMM, Vlak JM, Bergoin M, Maruniak JE, Parker AG, Burand JP, JehleJA, Boucias DG. Hytrosaviridae: a proposal for classification andnomenclature of a new insect virus family. Arch Virol. 2009;154:909–18.
17. Abd-Alla AMM, Parker AG, Vreysen MJB, Bergoin M. Tsetse salivary glandhypertrophy virus: Hope or hindrance for tsetse control? PLoS Negl TropDis. 2011;5:e1220.
18. Lietze VU, Abd-Alla AMM, Vreysen MJB, Geden CJ, Boucias DG. Salivarygland hypertrophy viruses: a novel group of insect pathogenic viruses.Annu Rev Entomol. 2010;56:63–80.
19. Abd-Alla AMM, Kariithi HM, Mohamed AH, Lapiz E, Parker AG, Vreysen MJB.Managing hytrosavirus infections in Glossina pallidipes colonies: feedingregime affects the prevalence of salivary gland hypertrophy syndrome.PLoS One. 2013;8:e61875.
20. Abd-Alla AMM, Marin C, Parker A, Vreysen M. Antiviral drug valacyclovirtreatment combined with a clean feeding system enhances the suppressionof salivary gland hypertrophy in laboratory colonies of Glossina pallidipes.Parasit Vectors. 2014;7:214.
21. Aksoy S. Tsetse- a haven for microorganisms. Parasitol Today. 2000;16:114–8.22. Nogge G. Sterility in tsetse flies (Glossina morsitans Westwood) caused by
loss of symbionts. Experientia. 1976;32:995–6.23. Pais R, Lohs C, Wu Y, Wang JW, Aksoy S. The obligate mutualist
Wigglesworthia glossinidia influences reproduction, digestion, and
immunity processes of its host, the tsetse fly. Appl Environ Microbiol.2008;74:5965–74.
24. Aksoy S, Chen X, Hypsa V. Phylogeny and potential transmission routes ofmidgut-associated endosymbionts of tsetse (Diptera: Glossinidae).Insect Mol Biol. 1997;6:183–90.
25. Cheng Q, Aksoy S. Tissue tropism, transmission and expression of foreigngenes in vivo in midgut symbionts of tsetse flies. Insect Mol Biol.1999;8:125–32.
26. Dale C, Maudlin I. Sodalis gen. nov. and Sodalis glossinidius sp. nov., amicroaerophilic secondary endosymbiont of the tsetse fly Glossinamorsitans morsitans. Int J Syst Bacteriol. 1999;49(Pt 1):267–75.
27. Saridaki A, Bourtzis K. Wolbachia: more than just a bug in insects' genitals.Curr Opin Microbiol. 2010;13:67–72.
28. Werren JH, Baldo L, Clark ME. Wolbachia: master manipulators ofinvertebrate biology. Nat Rev Microbiol. 2008;6:741–51.
29. Doudoumis V, Tsiamis G, Wamwiri F, Brelsfoard C, Alam U, Aksoy E,Dalaperas S, Abd-Alla A, Ouma J, Takac P, Aksoy S, Bourtzis K. Detection andcharacterization of Wolbachia infections in laboratory and naturalpopulations of different species of tsetse flies (genus Glossina).BMC Micobiology. 2012;12:S3.
30. Bian G, Xu Y, Lu P, Xie Y, Xi Z. The endosymbiotic bacterium Wolbachiainduces resistance to dengue virus in Aedes aegypti. PLoS Pathog.2010;6:e1000833.
31. Bian G, Joshi D, Dong Y, Lu P, Zhou G, Pan X, Xu Y, Dimopoulos G, Xi Z.Wolbachia invades Anopheles stephensi populations and inducesrefractoriness to plasmodium infection. Science. 2013;340:748–51.
32. Frentiu FD, Robinson J, Young PR, McGraw EA, O'Neill SL. Wolbachia-mediated resistance to dengue virus infection and death at the cellularlevel. PLoS One. 2010;5:e13398.
33. Glaser RL, Meola MA. The native Wolbachia endosymbionts of Drosophilamelanogaster and Culex quinquefasciatus increase host resistance toWest Nile virus infection. PLoS One. 2010;5:e11977.
34. Hedges LM, Brownlie JC, O'Neill SL, Johnson KN. Wolbachia and virusprotection in insects. Science. 2008;322:702.
35. Lu P, Bian G, Pan X, Xi Z. Wolbachia induces density-dependent inhibitionto dengue virus in mosquito cells. PLoS Negl Trop Dis. 2012;6:e1754.
36. Moreira LA, Iturbe-Ormaetxe I, Jeffery JA, Lu G, Pyke AT, Hedges LM, RochaBC, Hall-Mendelin S, Day A, Riegler M, Hugo LE, Johnson KN, Kay BH,McGraw EA, van den Hurk AF, Ryan PA, O'Neill SL. A Wolbachia symbiont inAedes aegypti limits infection with dengue, Chikunguya, and Plasmodium.Cell. 2009;139:1268–78.
37. Pan X, Zhou G, Wu J, Bian G, Lu P, Raikhel AS, Xi Z. Wolbachia inducesreactive oxygen species (ROS)-dependent activation of the toll pathway tocontrol dengue virus in the mosquito Aedes aegypti. Proc Natl Acad SciU S A. 2012;109:E23–31.
38. Tsai KH, Huang CG, Wu WJ, Chuang CK, Lin CC, Chen WJ. Parallel infectionof Japanese encephalitis virus and Wolbachia within cells of mosquitosalivary glands. J Med Entomol. 2006;43:752–6.
39. van den Hurk AF, Hall-Mendelin S, Pyke AT, Frentiu FD, McElroy K, Day A,Higgs S, O'Neill SL. Impact of Wolbachia on infection with chikungunya andyellow fever viruses in the mosquito vector Aedes aegypti. PLoS Negl TropDis. 2012;6:e1892.
40. Walker T, Johnson PH, Moreira LA, Iturbe-Ormaetxe I, Frentiu FD,McMeniman CJ, Leong YS, Dong Y, Axford J, Kriesner P, Lloyd AL, Ritchie SA,O'Neill SL, Hoffmann AA. The wMel Wolbachia strain blocks dengue andinvades caged Aedes aegypti populations. Nature. 2011;476:450–3.
41. Doudoumis V, Blow F, Saridaki A, Augustinos A, Dyer NA, Goodhead I,Solano P, Rayaisse JB, Takac P, Mekonnen S, Parker AG, Abd-Alla AMM,Darby A, Bourtzis K, Tsiamis G. Challenging the Wigglesworthia, Sodalis,Wolbachia symbiosis dogma in tsetse flies: Spiroplasma is present in bothlaboratory and natural populations. Sci Rep. 2017;7:4699.
42. Challier A, Laveissiere C: Un nouveau piege pour la capture des glossines(Glossina: Diptera, Muscidae): description et essais sur le terrain. CahORSTOM, Sér Ent Méd Parasitol 1973, XI:251–262.
43. Laveissiere C, Grébaut P. Recherches sur les pièges à glossines (Diptera:Glossinidae). Mise au point d' un modèle èconomique: Le piège >> Vavoua<<. Trop Med Parasitol. 1990;41:185–92.
44. Laveissiere C, Eouzan JP, Pascal G, Lemasson JJ. The control of riverinetsetse. Insect Sci Appl. 1990;11:427–41.
45. Rayaisse JB, Krober T, McMullin A, Solano P, Mihok S, Guerra CA.Standardizing visual control devices for tsetse flies: west African species
Ouedraogo et al. BMC Microbiology 2018, 18(Suppl 1):153 Page 105 of 292
Glossina tachinoides, G palpalis gambiensis and G morsitans submorsitans.PLoS Negl Trop Dis. 2012;6:e1491.
46. Potts WH. Glossinidae (tsetse-flies). In: Kenneth GV, KGV S, editors. Insectsand other arthropods of medical importance. London: The British Museum;1973. p. 209–49.
47. Kariithi HM, Ahmadi M, Parker AG, Franz G, Ros VID, Haq I, Elashry AM, VlakJM, Bergoin M, Vreysen MJB, Abd-Alla AMM. Prevalence and geneticvariation of salivary gland hypertrophy virus in wild populations of thetsetse fly Glossina pallidipes from southern and eastern Africa. J InvertebrPathol. 2013;112:S123–32.
48. Baker MD, Krafsur ES. Identification and properties of microsatellite markersin tsetse flies Glossina morsitans lato (Diptera: Glossinidae). Mol Ecol.2001;1:234–6.
49. Fikru R, Goddeeris BM, Delespaux V, Moti Y, Tadesse A, Bekana M, Claes F,De Deken R, Buscher P. Widespread occurrence of Trypanosoma vivax inbovines of tsetse- as well as non-tsetse-infested regions of Ethiopia: areason for concern? Vet Parasitol. 2012;190:355–61.
50. Zabalou S, Riegler M, Theodorakopoulou M, Stauffer C, Savakis C, Bourtzis K.Wolbachia-induced cytoplasmic incompatibility as a means for insect pestpopulation control. Proc Natl Acad Sci U S A. 2004;101:15042–5.
51. R Development Core Team. R: a language and environment for statisticalcomputing. Vienna: R Foundation for statistical Computing; 2010.
52. Burnham KP, Anderson DR. Model selection and multimodel inference: Apractical information-theoretic approach. 2nd ed. edition. New-York:Springer-Verlag; 2002.
53. Hurvich CM, Tsai CL. Model selection for extended quasi-likelihood modelsin small samples. Biometrics. 1995;51:1077–84.
54. Kagbadouno MS, Camara M, Rouamba J, Rayaisse JB, Traore IS, Camara O,Onikoyamou MF, Courtin F, Ravel S, De Meeûs T, Bucheton B, Jamonneau V,Solano P. Epidemiology of sleeping sickness in Boffa (Guinea): where arethe trypanosomes? PLoS Negl Trop Dis. 2012;6:e1949.
55. Pagabeleguem S, Sangare M, Bengaly Z, Akoudjin M, Belem AM, Bouyer J.Climate, cattle rearing systems and African animal Trypanosomosis risk inBurkina Faso. PLoS One. 2012;7:e49762.
56. Jamonneau V, Ravel S, Koffi M, Kaba D, Zeze DG, Ndri L, Sane B, Coulibaly B,Cuny G, Solano P. Mixed infections of trypanosomes in tsetse and pigs andtheir epidemiological significance in a sleeping sickness focus of coted'Ivoire. Parasitology. 2004;129:693–702.
57. Gouteux J-P. Prevalence of enlarged salivary glands in Glossina palpalis, G.pallicera, and G. nigrofusca (Diptera: Glossinidae) from the Vavoua area, IvoryCoast. J Med Entomol. 1987;24:268.
58. Otieno LH, Kokwaro ED, Chimtawi M, Onyango P. Prevalence of enlargedsalivary glands in wild populations of Glossina pallidipes in Kenya, with anote on the ultrastructure of the affected organ. J Invertebr Pathol.1980;36:113–8.
59. Alam U, Hyseni C, Symula RE, Brelsfoard C, Wu Y, Kruglov O, Wang J, Echodu R,Alioni V, Okedi LM, Caccone A, Aksoy S. Implications of microfauna-hostinteractions for trypanosome transmission dynamics in Glossina fuscipesfuscipes in Uganda. Appl Environ Microbiol. 2012;78:4627–37.
60. Schneider DI, Garschall KI, Parker AG, Abd-Alla AMM, Miller WJ. GlobalWolbachia prevalence, titer fluctuations and their potential of causingcytoplasmic incompatibilities in tsetse flies and hybrids of Glossina morsitanssubgroup species. J Invertebr Pathol. 2013;112:S104–15.
61. Brelsfoard C, Tsiamis G, Falchetto M, Gomulski LM, Telleria E, Alam U,Doudoumis V, Scolari F, Benoit JB, Swain M, Takac P, Malacrida AR, BourtzisK, Aksoy S. Presence of extensive Wolbachia symbiont insertions discoveredin the genome of its host Glossina morsitans morsitans. PLoS Negl Trop Dis.2014;8:e2728.
62. Kambris Z, Cook PE, Phuc HK, Sinkins SP. Immune activation by life-shortening Wolbachia and reduced filarial competence in mosquitoes.Science. 2009;326:134–6.
63. Kambris Z, Blagborough AM, Pinto SB, Blagrove MS, Godfray HC, Sinden RE,Sinkins SP. Wolbachia stimulates immune gene expression and inhibitsplasmodium development in Anopheles gambiae. PLoS Pathog. 2010;6:e1001143.
64. Zhang D, Zheng X, Xi Z, Bourtzis K, Gilles JRL. Combining the sterile insecttechnique with the incompatible insect technique: I-impact of Wolbachiainfection on the fitness of triple-and double-infected strains of Aedesalbopictus. PLoS One. 2015;10:e0121126.
65. Zhang D, Lees RS, Xi Z, Gilles JRL, Bourtzis K. Combining the sterile insecttechnique with Wolbachia-based approaches: II-A safer approach to Aedes
albopictus population suppression programmes, designed to minimize theconsequences of inadvertent female release. PLoS One. 2015;10:e0135194.
66. Zhang D, Lees RS, Xi Z, Bourtzis K, Gilles JRL. Combining the sterile insecttechnique with the incompatible insect technique: III-robust matingcompetitiveness of irradiated triple Wolbachia-infected Aedes albopictusmales under semi-field conditions. PLoS One. 2016;11:e0151864.
67. Bourtzis K, Lees RS, Hendrichs J, Vreysen MJB. More than one rabbit out ofthe hat: radiation, transgenic and symbiont-based approaches forsustainable management of mosquito and tsetse fly populations.Acta Trop. 2016;157:115–30.
Ouedraogo et al. BMC Microbiology 2018, 18(Suppl 1):153 Page 106 of 292